UNITED STATES
SECURITIES AND EXCHANGE COMMISSION
Washington, D.C. 20549
FORM N-CSR
CERTIFIED SHAREHOLDER REPORT OF REGISTERED
MANAGEMENT INVESTMENT COMPANIES
Investment Company Act file number | 811-04367 |
|
Columbia Funds Series Trust I |
(Exact name of registrant as specified in charter) |
|
225 Franklin Street, Boston, Massachusetts | | 02110 |
(Address of principal executive offices) | | (Zip code) |
|
Scott R. Plummer 5228 Ameriprise Financial Center Minneapolis, MN 55474 |
(Name and address of agent for service) |
|
Registrant’s telephone number, including area code: | 1-612-671-1947 | |
|
Date of fiscal year end: | July 31 | |
|
Date of reporting period: | July 31, 2012 | |
| | | | | | | | |
Form N-CSR is to be used by management investment companies to file reports with the Commission not later than 10 days after the transmission to stockholders of any report that is required to be transmitted to stockholders under Rule 30e-1 under the Investment Company Act of 1940 (17 CFR 270.30e-1). The Commission may use the information provided on Form N-CSR in its regulatory, disclosure review, inspection, and policymaking roles.
A registrant is required to disclose the information specified by Form N-CSR, and the Commission will make this information public. A registrant is not required to respond to the collection of information contained in Form N-CSR unless the Form displays a currently valid Office of Management and Budget (“OMB”) control number. Please direct comments concerning the accuracy of the information collection burden estimate and any suggestions for reducing the burden to Secretary, Securities and Exchange Commission, 450 Fifth Street, NW, Washington, DC 20549-0609. The OMB has reviewed this collection of information under the clearance requirements of 44 U.S.C. § 3507.
Item 1. Reports to Stockholders.
Annual Report
July 31, 2012

CMG Ultra Short Term Bond Fund
Not FDIC insured • No bank guarantee • May lose value
CMG Ultra Short Term Bond Fund
President's Message
 Dear Shareholders,
On the heels of solid gains for stocks during the first quarter, U.S. stock market averages fell in the second quarter as uncertainty mounted regarding the fate of the eurozone and other real concerns. On the last day of the quarter, an announcement that European leaders had agreed to relieve short-term funding pressure on Italy and Spain and to back a plan heading toward a banking union raised hopes that a longer term solution was achievable. The announcement lifted stocks around the world. However, it was a losing quarter for most stock markets as economic data disappointed in the United States and growth in Europe and emerging markets slowed. China, which has been a key driver of worldwide growth over the past decade, has experienced a significant slowdown, and its declining demand for raw materials has had a chilling effect on world commodity markets.
Against a backdrop of rising uncertainty and a declining stock market, bond investors turned cautious. U.S. Treasuries were the quarter's strongest performers. Total returns on long-dated Treasuries surged late last year, sank from mid-December to mid-March then soared through the end of the quarter. By contrast, European sovereign bonds lost value as interest rates rose and concerns about the eurozone's fiscal health mounted.
Despite these continued challenges, we see pockets of strength — and as a result, attractive opportunities — both here and abroad for 2012. We hope to help you capitalize on these opportunities with various articles in our 2012 Perspectives, which is available via the Market Insights tab at columbiamanagement.com. This publication showcases the strong research capabilities and experienced investment teams of Columbia Management and offers a diverse array of investment ideas based on our five key themes for 2012.
Other information and resources available at columbiamanagement.com include:
> detailed up-to-date fund performance and portfolio information
> economic analysis and market commentary
> quarterly fund commentaries
> Columbia Management Investor, our award-winning quarterly newsletter for shareholders
Thank you for your continued support of the Columbia Funds. We look forward to serving your investment needs for many years to come.
Best Regards,

J. Kevin Connaughton
President, Columbia Funds
Investors should consider the investment objectives, risks, charges and expenses of a mutual fund carefully before investing. For a free prospectus, which contains this and other important information about the funds, visit columbiamanagement.com. The prospectus should be read carefully before investing.
Columbia Funds are distributed by Columbia Management Investment Distributors, Inc., member FINRA, and managed by Columbia Management Investment Advisers, LLC.
© 2012 Columbia Management Investment Advisers, LLC. All rights reserved.
Annual Report 2012
CMG Ultra Short Term Bond Fund
Table of Contents
| Performance Overview | | | 2 | | |
|
| Manager Discussion of Fund Performance | | | 4 | | |
|
| Understanding Your Fund's Expenses | | | 6 | | |
|
| Portfolio of Investments | | | 7 | | |
|
| Statement of Assets and Liabilities | | | 20 | | |
|
| Statement of Operations | | | 21 | | |
|
| Statement of Changes in Net Assets | | | 22 | | |
|
| Financial Highlights | | | 24 | | |
|
| Notes to Financial Statements | | | 25 | | |
|
Report of Independent Registered
Public Accounting Firm | | | 31 | | |
|
| Trustees and Officers | | | 32 | | |
|
Board Consideration and Approval of
Advisory Agreement | | | 35 | | |
|
| Important Information About This Report | | | 41 | | |
|
Fund Investment Manager
Columbia Management Investment
Advisers, LLC
225 Franklin Street
Boston, MA 02110
Fund Distributor
Columbia Management Investment
Distributors, Inc.
225 Franklin Street
Boston, MA 02110
Fund Transfer Agent
Columbia Management Investment
Services Corp.
P.O. Box 8081
Boston, MA 02266-8081
For more information about any of the funds, please visit columbiamanagement.com or call 800.345.6611. Customer Service Representatives are available to answer your questions Monday through Friday from 8 a.m. to 8 p.m. Eastern time.
The views expressed in this report reflect the current views of the respective parties. These views are not guarantees of future performance and involve certain risks, uncertainties and assumptions that are difficult to predict, so actual outcomes and results may differ significantly from the views expressed. These views are subject to change at any time based upon economic, market or other conditions and the respective parties disclaim any responsibility to update such views. These views may not be relied on as investment advice and, because investment decisions for a Columbia Fund are based on numerous factors, may not be relied on as an indication of trading intent on behalf of any particular Columbia Fund. References to specific securities should not be construed as a recommendation or investment advice.
Annual Report 2012
CMG Ultra Short Term Bond Fund
Performance Overview
Performance Summary
> CMG Ultra Short Term Bond Fund (the Fund) returned 0.93% for the 12-month period that ended July 31, 2012.
> The Fund outperformed its benchmark, the Barclays U.S. Short-Term Government/Corporate Index, which returned 0.36% during the same period.
> The Fund also outperformed the Citigroup One-Year U.S. Treasury Bill Index, which returned 0.40% for the 12-month period.
> The Fund's relative performance was aided by its duration positioning as well as its diversification away from the U.S. Treasury market.
Average Annual Total Returns (%) (for period ended July 31, 2012)
| | | Inception | | 1 Year | | 5 Years | | Life | |
| CMG Ultra Short Term Bond Fund | | 03/08/04 | | | 0.93 | | | | 1.61 | | | | 2.17 | | |
| Barclays U.S. Short-Term Government/Corporate Index | | | | | 0.36 | | | | 1.76 | | | | 2.51 | * | |
| Citigroup One-Year U.S. Treasury Bill Index | | | | | 0.40 | | | | 1.96 | | | | 2.34 | | |
*From August 9, 2004
The Fund commenced operations on November 23, 2009. The returns shown for periods prior to November 23, 2009 are the returns of CMG Ultra Short Term Bond Fund, the predecessor to the Fund and a portfolio of Columbia Funds Institutional Trust. Performance results reflect the effect of any fee waivers or reimbursements of Fund expenses by Columbia Management Investment Advisers, LLC and/or any of its affiliates. Absent these fee waivers or expense reimbursement arrangements, performance results would have been lower. All results shown assume reinvestment of distributions. The table does not reflect the deduction of taxes that a shareholder may pay on fund distributions or on the redemption of shares.
The performance information shown represents past performance and is not a guarantee of future results. The investment return and principal value of your investment will fluctuate so that your shares, when redeemed, may be worth more or less than their original cost. Current performance may be lower or higher than the performance information shown. You may obtain performance information current to the most recent month-end by contacting your financial intermediary, visiting columbiamanagement.com or calling 800.345.6611.
On December 1, 2011 the Barclays U.S. Short-Term Government/Corporate Index, which is unavailable at the Fund's predecessor's inception in March 2004, replaced the Citigroup One-Year U.S. Treasury Bill Index as the Fund's benchmark. The Fund changed its benchmark because the Investment Manager believes it is more representative of the investment approach used to manage the Fund.
The Barclays U.S. Short-Term Government/Corporate Index tracks the performance of U.S. Government and corporate bonds rated investment grade or better, with maturities of less than one year.
The Citigroup One-Year U.S. Treasury Bill Index consists of a single one-year U.S. Treasury Bill whose return is tracked until its maturity.
Indices are not available for investment, are not professionally managed and do not reflect sales charges, fees, brokerage commissions, taxes or other expenses of investing. Securities in the Fund may not match those in an index.
Annual Report 2012
2
CMG Ultra Short Term Bond Fund
Performance Overview (continued)
Performance of a Hypothetical $3,000,000 Investment (March 8, 2004 – July 31, 2012)
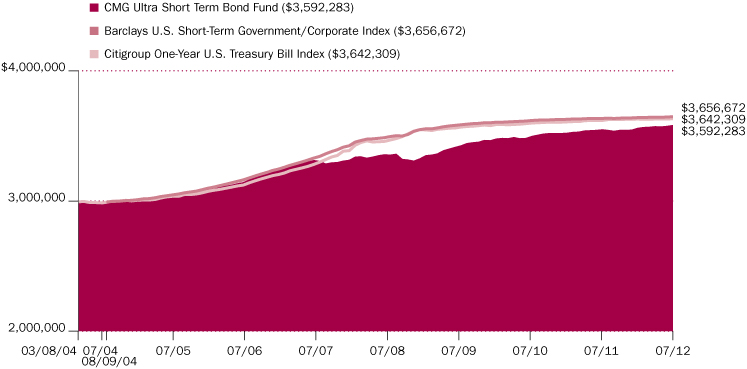
The chart above shows the change in value of a hypothetical $3,000,000 investment in CMG Ultra Short Term Bond Fund during the stated time period, and does not reflect the deduction of taxes that a shareholder may pay on Fund distributions or on the redemption of Fund shares.
A $3,000,000 investment in the Fund since 03/08/04 was equal to $2,999,581 on 08/09/04, the inception date of the Barclays U.S. Short-Term Government/Corporate Index. For comparison with the Barclays U.S. Short-Term Government/Corporate Index, the chart shows the index at the same value as of 08/09/04.
Annual Report 2012
3
CMG Ultra Short Term Bond Fund
Manager Discussion of Fund Performance
For the 12-month period that ended July 31, 2012, CMG Ultra Short Term Bond Fund returned 0.93%. The Fund outperformed its benchmark, the Barclays U.S. Short-Term Government/Corporate Index, which returned 0.36%. Although returns from the short-term debt markets were low throughout the period, the Fund's relative performance was aided by its duration positioning as well as its diversification away from the U.S. Treasury market.
A sluggish economy
Early in the 12-month period, Europe's debt problems and an uncertain economic outlook dominated world headlines. In the United States, the pace of economic growth slowed to 2.0% in the first quarter of 2012, as measured by gross domestic product, and the preliminary estimate of second quarter growth was just 1.5%. Job growth picked up, raising hopes that better employment prospects would lift consumer spending. However, three months of disappointingly low figures weighed on confidence. The housing market showed a glimmer of improvement, as year-over-year sales improved, inventories tightened and prices stabilized somewhat. However, manufacturing activity — the one consistent bright spot throughout this recovery — slipped near the end of the period. The Federal Reserve (the Fed) responded to this economic sluggishness by extending its commitment to keep short-term interest rates low.
Seeking yield in a low rate environment
The challenge for the Fund has been to find ways to augment yields in a low-yield environment. To that end, we extended the maturities of Fund investments to capture incremental yield along the positive-sloping yield curve. We increased Fund exposure to corporate securities, mortgages, asset-backed securities and other non-Treasury issues. These strategies were responsible for most of the excess return the Fund enjoyed versus its benchmark. In addition, the Fund's asset allocation decisions worked out well: A shift from asset-backed securities to commercial mortgage-backed securites produced incrementally higher returns.
Detractors from performance were few during the period. New purchases of corporate bonds emphasized industrial issuers at the expense of the finance sector, and finance outperformed for the period. In an effort to reduce the price volatility of the Fund, we eliminated holdings in European financial companies during the period. The more conservative management style helped to decrease volatility but at the cost of reducing performance. Because the Fund's assets experienced significant growth during the period, there were times when the Fund owned higher-than-target levels of low-yielding commercial paper prior to putting these assets to work in higher-yielding securities. The impact of this inflow of new money was temporary.
Looking ahead
We expect the economy to continue to exhibit steady but constrained growth. Mindful of the slowdowns in Europe and Asia, as well as the domestic uncertainties posed by the presidential election and the year-end expiration of certain tax benefits and introduction of automatic federal spending cuts, popularly known as the "fiscal cliff," we will continue to position the portfolio in a conservative fashion. We expect to maintain investments in commercial mortgage-backed securities, but will avoid the residential mortgage market because of an unacceptably high prepayment risk. Although Fund assets have
Portfolio Management
Guy Holbrook, IV, CFA
Mary Werler, CFA
Effective September 3, 2012, Leonard Aplet, CFA, replaced Guy Holbrook as Lead Manager of the Fund.
Quality Breakdown (%)
(at July 31, 2012) | |
| AAA rating | | | 39.1 | | |
| AA rating | | | 12.7 | | |
| A rating | | | 25.3 | | |
| BBB rating | | | 22.0 | | |
| Not rated | | | 0.9 | | |
| Total | | | 100.0 | | |
Percentages indicated are based upon total fixed income securities (excluding Money Market Funds and Investments of Cash Collateral Received for Securities on Loan).
Bond ratings apply to the underlying holdings of the Fund and not the Fund itself and are divided into categories ranging from AAA (highest) to D (lowest), and are subject to change. The ratings shown are determined by using the middle rating of Moody's, S&P, and Fitch after dropping the highest and lowest available ratings. When a rating from only two agencies is available, the lower rating is used. When a rating from only one agency is available, that rating is used. When a bond is not rated by one of these agencies, it is designated as Not rated. Credit ratings are subjective opinions and not statements of fact.
Annual Report 2012
4
CMG Ultra Short Term Bond Fund
Manager Discussion of Fund Performance (continued)
slightly longer maturities than the benchmark, we are comfortable with this positioning in light of the Fed's repeated assurances that a near-term increase in rates is unlikely.
Portfolio Breakdown (%)
(at July 31, 2012) | |
| Corporate Bonds & Notes | | | 44.6 | | |
Residential Mortgage-Backed
Securities — Agency | | | 0.8 | | |
Residential Mortgage-Backed
Securities — Non-Agency | | | 0.7 | | |
| Commercial Mortgage-Backed Securities — Agency | | | 1.1 | | |
| Commercial Mortgage-Backed Securities — Non-Agency | | | 10.8 | | |
Asset-Backed
Securities — Non-Agency | | | 16.0 | | |
| U.S. Treasury Obligations | | | 4.5 | | |
| Municipal Bonds | | | 4.4 | | |
| Commercial Paper | | | 17.1 | | |
| Other(a) | | | 0.0 | (b) | |
Percentages indicated are based upon total investments (excluding Investments of Cash Collateral Received for Securities on Loan). The Fund's portfolio composition is subject to change.
(a) Includes investments in Money Market Funds.
(b) Rounds to less than 0.1%.
Annual Report 2012
5
CMG Ultra Short Term Bond Fund
Understanding Your Fund's Expenses
(Unaudited)
As an investor, you incur ongoing costs, which generally include management fees, distribution and service (Rule 12b-1) fees, and other fund expenses. The following information is intended to help you understand your ongoing costs (in dollars) of investing in the Fund and to help you compare these costs with the ongoing costs of investing in other mutual funds.
Analyzing Your Fund's Expenses
To illustrate these ongoing costs, we have provided examples and calculated the expenses paid by investors in shares of the Fund during the period. The actual and hypothetical information in the table is based on an initial investment of $1,000 at the beginning of the period indicated and held for the entire period. Expense information is calculated two ways and each method provides you with different information. The amount listed in the "Actual" column is calculated using the Fund's actual operating expenses and total return for the period. You may use the Actual information, together with the amount invested, to estimate the expenses that you paid over the period. Simply divide your account value by $1,000 (for example, an $8,600 account value divided by $1,000 = 8.6), then multiply the results by the expenses paid during the period under the Actual column. The amount listed in the "Hypothetical" column assumes a 5% annual rate of return before expenses (which is not the Fund's actual return) and then applies the Fund's actual expense ratio for the period to the hypothetical return. You should not use the hypothetical account values and expenses to estimate either your actual account balance at the end of the period or the expenses you paid during the period. See "Compare With Other Funds" below for details on how to use the hypothetical data.
Compare With Other Funds
Since all mutual funds are required to include the same hypothetical calculations about expenses in shareholder reports, you can use this information to compare the ongoing cost of investing in the Fund with other funds. To do so, compare the hypothetical example with the 5% hypothetical examples that appear in the shareholder reports of other funds. As you compare hypothetical examples of other funds, it is important to note that hypothetical examples are meant to highlight the ongoing costs of investing in a fund only and do not reflect any transaction costs, such as sales charges, or redemption or exchange fees. Therefore, the hypothetical calculations are useful in comparing ongoing costs only, and will not help you determine the relative total costs of owning different funds. If transaction costs were included in these calculations, your costs would be higher.
February 1, 2012 – July 31, 2012
Account Value at the Beginning
of the Period ($) | | Account Value at the End of the
Period ($) | | Expenses Paid During the
Period ($) | | Fund's Annualized
Expense Ratio (%) | |
| Actual | | Hypothetical | | Actual | | Hypothetical | | Actual | | Hypothetical | | Actual | |
| | 1,000.00 | | | | 1,000.00 | | | | 1,005.80 | | | | 1,023.62 | | | | 1.25 | | | | 1.26 | | | | 0.25 | | |
Expenses paid during the period are equal to the annualized expense ratio of the Fund, multiplied by the average account value over the period and then multiplied by the number of days in the Fund's most recent fiscal half year and divided by 366.
Expenses do not include fees and expenses incurred indirectly by the Fund from the underlying funds in which the Fund may invest (also referred to as "acquired funds"), including affiliated and non-affiliated pooled investment vehicles (including mutual funds and exchange traded funds).
Had Columbia Management Investment Advisers, LLC and/or certain of its affiliates not waived/reimbursed certain fees and expenses, account value at the end of the period would have been reduced.
Annual Report 2012
6
CMG Ultra Short Term Bond Fund
Portfolio of Investments
July 31, 2012
(Percentages represent value of investments compared to net assets)
Corporate Bonds & Notes 45.3%
| Issuer | | Coupon
Rate | | Principal
Amount ($) | | Value ($) | |
| Aerospace & Defense 0.4% | |
Boeing Co. (The)
Senior Unsecured
11/20/12 | | | 1.875 | % | | | 5,000,000 | | | | 5,022,935 | | |
| Automotive 3.1% | |
American Honda Finance Corp.(a)
Senior Unsecured
03/18/13 | | | 2.375 | % | | | 4,000,000 | | | | 4,046,784 | | |
American Honda Finance Corp.(a)(b)
Senior Unsecured
06/18/14 | | | 0.861 | % | | | 10,000,000 | | | | 9,992,790 | | |
PACCAR Financial Corp.
Senior Unsecured
12/17/12 | | | 1.950 | % | | | 4,100,000 | | | | 4,123,514 | | |
| 06/05/15 | | | 1.050 | % | | | 4,000,000 | | | | 4,023,508 | | |
Toyota Motor Credit Corp.
Senior Unsecured
07/17/15 | | | 0.875 | % | | | 10,000,000 | | | | 10,045,240 | | |
Volkswagen International Finance NV(a)
08/12/13 | | | 1.625 | % | | | 5,000,000 | | | | 5,045,500 | | |
Volkswagen International Finance NV(a)(b)
04/01/14 | | | 1.071 | % | | | 5,000,000 | | | | 5,003,875 | | |
| Total | | | | | | | 42,281,211 | | |
| Banking 10.2% | |
American Express Centurion Bank
Senior Unsecured
10/17/12 | | | 5.550 | % | | | 6,000,000 | | | | 6,063,516 | | |
American Express Co.
Senior Unsecured
07/15/13 | | | 4.875 | % | | | 3,870,000 | | | | 4,024,069 | | |
BB&T Corp.
Senior Unsecured
04/30/14 | | | 5.700 | % | | | 2,061,000 | | | | 2,233,079 | | |
BB&T Corp.(b)
Senior Unsecured
04/28/14 | | | 1.147 | % | | | 5,000,000 | | | | 5,024,675 | | |
Canadian Imperial Bank of Commerce
Senior Unsecured
09/13/13 | | | 1.450 | % | | | 11,000,000 | | | | 11,122,327 | | |
Capital One Financial Corp.
Senior Unsecured
07/15/14 | | | 2.125 | % | | | 2,000,000 | | | | 2,027,828 | | |
Capital One Financial Corp.(b)
Senior Unsecured
07/15/14 | | | 1.605 | % | | | 5,000,000 | | | | 4,968,355 | | |
Citigroup, Inc.
Senior Unsecured(b)(c)
04/01/14 | | | 1.391 | % | | | 7,500,000 | | | | 7,428,592 | | |
Corporate Bonds & Notes (continued)
| Issuer | | Coupon
Rate | | Principal
Amount ($) | | Value ($) | |
Commonwealth Bank of Australia
Senior Unsecured(a)(b)
03/19/13 | | | 1.018 | % | | | 10,000,000 | | | | 10,030,150 | | |
Fifth Third Bank
Senior Unsecured(b)
05/17/13 | | | 0.576 | % | | | 5,500,000 | | | | 5,480,613 | | |
Goldman Sachs Group, Inc. (The)
Senior Unsecured(c)
04/01/13 | | | 5.250 | % | | | 7,500,000 | | | | 7,696,072 | | |
JPMorgan Chase & Co.
Senior Unsecured
06/01/14 | | | 4.650 | % | | | 7,500,000 | | | | 7,970,647 | | |
JPMorgan Chase & Co.(b)
09/30/13 | | | 1.211 | % | | | 7,500,000 | | | | 7,541,595 | | |
KeyCorp
Senior Unsecured
05/14/13 | | | 6.500 | % | | | 8,000,000 | | | | 8,337,160 | | |
Morgan Stanley
Senior Unsecured(b)
01/09/14 | | | 0.760 | % | | | 6,500,000 | | | | 6,280,300 | | |
National Australia Bank Ltd.
Senior Unsecured(a)(b)(c)
04/11/14 | | | 1.178 | % | | | 5,000,000 | | | | 5,006,905 | | |
National Bank of Canada
Bank Guaranteed
06/26/15 | | | 1.500 | % | | | 5,000,000 | | | | 5,070,122 | | |
Royal Bank of Canada
03/15/13 | | | 2.250 | % | | | 3,000,000 | | | | 3,038,082 | | |
Toronto-Dominion Bank (The)(b)
Senior Unsecured
07/14/14 | | | 0.755 | % | | | 2,000,000 | | | | 2,005,040 | | |
Toronto-Dominion Bank (The)(c)
Senior Unsecured
07/14/14 | | | 1.375 | % | | | 5,000,000 | | | | 5,085,745 | | |
U.S. Bancorp
Senior Notes
07/27/15 | | | 2.450 | % | | | 5,000,000 | | | | 5,249,917 | | |
Senior Unsecured
09/13/13 | | | 1.375 | % | | | 5,000,000 | | | | 5,051,810 | | |
Wachovia Corp.
Subordinated Notes
08/01/14 | | | 5.250 | % | | | 5,000,000 | | | | 5,365,115 | | |
Wachovia Corp.(b)
Senior Unsecured
05/01/13 | | | 2.215 | % | | | 5,000,000 | | | | 5,065,740 | | |
Westpac Banking Corp.
Senior Unsecured
11/19/12 | | | 2.250 | % | | | 2,000,000 | | | | 2,011,194 | | |
| Total | | | | | | | 139,178,648 | | |
The accompanying Notes to Financial Statements are an integral part of this statement.
Annual Report 2012
7
CMG Ultra Short Term Bond Fund
Portfolio of Investments (continued)
July 31, 2012
Corporate Bonds & Notes (continued)
| Issuer | | Coupon
Rate | | Principal
Amount ($) | | Value ($) | |
| Chemicals 0.4% | |
Dow Chemical Co. (The)
Senior Unsecured
05/15/14 | | | 7.600 | % | | | 5,000,000 | | | | 5,561,945 | | |
| Construction Machinery 0.9% | |
Caterpillar Financial Services Corp.
Senior Unsecured
04/01/14 | | | 1.650 | % | | | 5,000,000 | | | | 5,089,220 | | |
| 05/29/15 | | | 1.100 | % | | | 3,000,000 | | | | 3,041,064 | | |
John Deere Capital Corp.
Senior Unsecured
04/17/15 | | | 0.875 | % | | | 4,950,000 | | | | 4,978,482 | | |
| Total | | | | | | | 13,108,766 | | |
| Diversified Manufacturing 0.3% | |
United Technologies Corp.
Senior Unsecured(b)
06/01/15 | | | 0.967 | % | | | 3,810,000 | | | | 3,853,887 | | |
| Electric 4.3% | |
Consumers Energy Co.
1st Mortgage
02/15/14 | | | 6.000 | % | | | 3,000,000 | | | | 3,232,983 | | |
DTE Energy Co.
Senior Unsecured(b)
06/03/13 | | | 1.167 | % | | | 2,000,000 | | | | 2,005,723 | | |
Duke Energy Corp.
Senior Unsecured
02/01/14 | | | 6.300 | % | | | 6,675,000 | | | | 7,212,097 | | |
Exelon Generation Co. LLC
Senior Unsecured
01/15/14 | | | 5.350 | % | | | 7,500,000 | | | | 7,938,315 | | |
Georgia Power Co.
Senior Unsecured(b)
03/15/13 | | | 0.788 | % | | | 10,000,000 | | | | 10,000,760 | | |
Ohio Power Co.
Senior Unsecured
02/15/13 | | | 5.500 | % | | | 4,800,000 | | | | 4,921,954 | | |
PSEG Power LLC
04/15/13 | | | 2.500 | % | | | 10,000,000 | | | | 10,134,380 | | |
Peco Energy Co.
1st Mortgage
10/15/13 | | | 5.600 | % | | | 5,360,000 | | | | 5,685,325 | | |
Pennsylvania Electric Co.
Senior Unsecured
04/01/14 | | | 5.125 | % | | | 7,000,000 | | | | 7,448,147 | | |
| Total | | | | | | | 58,579,684 | | |
Corporate Bonds & Notes (continued)
| Issuer | | Coupon
Rate | | Principal
Amount ($) | | Value ($) | |
| Food and Beverage 4.4% | |
Anheuser-Busch InBev Worldwide, Inc.
07/14/14 | | | 1.500 | % | | | 6,000,000 | | | | 6,108,012 | | |
Anheuser-Busch InBev Worldwide, Inc.(b)
03/26/13 | | | 1.192 | % | | | 2,000,000 | | | | 2,009,514 | | |
Bacardi Ltd.(a)
04/01/14 | | | 7.450 | % | | | 5,000,000 | | | | 5,509,045 | | |
Campbell Soup Co.
Senior Unsecured(b)(d)
08/01/14 | | | 0.743 | % | | | 5,000,000 | | | | 5,009,900 | | |
Dr. Pepper Snapple Group, Inc.
12/21/12 | | | 2.350 | % | | | 3,500,000 | | | | 3,524,850 | | |
| 05/01/13 | | | 6.120 | % | | | 2,474,000 | | | | 2,574,726 | | |
General Mills, Inc.
Senior Unsecured
05/16/14 | | | 1.550 | % | | | 4,000,000 | | | | 4,066,036 | | |
General Mills, Inc.(b)
Senior Unsecured
05/16/14 | | | 0.816 | % | | | 4,000,000 | | | | 4,010,552 | | |
Kellogg Co.
Senior Unsecured
05/15/15 | | | 1.125 | % | | | 6,500,000 | | | | 6,559,813 | | |
Kraft Foods Group, Inc.(a)
06/04/15 | | | 1.625 | % | | | 3,000,000 | | | | 3,050,598 | | |
Kraft Foods, Inc.
Senior Unsecured(b)
07/10/13 | | | 1.333 | % | | | 5,000,000 | | | | 5,028,065 | | |
PepsiCo, Inc.
Senior Unsecured(b)
05/10/13 | | | 0.546 | % | | | 5,000,000 | | | | 5,009,990 | | |
SABMiller Holdings, Inc.(a)
01/15/15 | | | 1.850 | % | | | 6,000,000 | | | | 6,140,892 | | |
SABMiller PLC
Senior Unsecured(a)
01/15/14 | | | 5.700 | % | | | 2,000,000 | | | | 2,135,300 | | |
| Total | | | | | | | 60,737,293 | | |
| Gas Distributors 0.4% | |
Sempra Energy
Senior Unsecured(b)
03/15/14 | | | 1.228 | % | | | 5,000,000 | | | | 5,000,955 | | |
| Gas Pipelines 1.2% | |
Enterprise Products Operating LLC
02/01/13 | | | 6.125 | % | | | 5,000,000 | | | | 5,122,315 | | |
NiSource Finance Corp.
03/01/13 | | | 6.150 | % | | | 8,000,000 | | | | 8,254,968 | | |
The accompanying Notes to Financial Statements are an integral part of this statement.
Annual Report 2012
8
CMG Ultra Short Term Bond Fund
Portfolio of Investments (continued)
July 31, 2012
Corporate Bonds & Notes (continued)
| Issuer | | Coupon
Rate | | Principal
Amount ($) | | Value ($) | |
TransCanada PipeLines Ltd.
Senior Unsecured
03/02/15 | | | 0.875 | % | | | 3,650,000 | | | | 3,672,853 | | |
| Total | | | | | | | 17,050,136 | | |
| Health Care 0.6% | |
Express Scripts Holding Co.(a)
11/21/14 | | | 2.750 | % | | | 8,000,000 | | | | 8,247,376 | | |
| Independent Energy 0.7% | |
Canadian Natural Resources Ltd.
Senior Unsecured
10/01/12 | | | 5.450 | % | | | 4,000,000 | | | | 4,032,356 | | |
| 11/14/14 | | | 1.450 | % | | | 5,000,000 | | | | 5,071,528 | | |
| Total | | | | | | | 9,103,884 | | |
| Integrated Energy 0.6% | |
BP Capital Markets PLC
12/05/14 | | | 1.700 | % | | | 7,500,000 | | | | 7,652,730 | | |
| Life Insurance 2.6% | |
MetLife Institutional Funding II
Secured(a)(b)
04/04/14 | | | 1.361 | % | | | 7,500,000 | | | | 7,543,178 | | |
Metropolitan Life Global Funding I
Secured(a)
01/10/14 | | | 1.208 | % | | | 5,000,000 | | | | 5,016,470 | | |
New York Life Global Funding(a)(b)
06/18/14 | | | 0.588 | % | | | 8,000,000 | | | | 7,991,195 | | |
Principal Life Global Funding II(a)(b)
07/09/14 | | | 1.080 | % | | | 5,000,000 | | | | 4,999,629 | | |
Prudential Financial, Inc.
Senior Unsecured
09/17/12 | | | 3.625 | % | | | 2,400,000 | | | | 2,408,000 | | |
| 01/14/13 | | | 2.750 | % | | | 8,000,000 | | | | 8,074,384 | | |
| Total | | | | | | | 36,032,856 | | |
| Media Non-Cable 0.6% | |
Reed Elsevier Capital, Inc.
01/15/14 | | | 7.750 | % | | | 7,625,000 | | | | 8,315,306 | | |
| Metals 0.5% | |
Rio Tinto Finance USA PLC
03/20/15 | | | 1.125 | % | | | 7,000,000 | | | | 7,052,500 | | |
| Non-Captive Diversified 1.3% | |
General Electric Capital Corp.
Senior Unsecured
01/09/15 | | | 2.150 | % | | | 5,000,000 | | | | 5,126,915 | | |
Corporate Bonds & Notes (continued)
| Issuer | | Coupon
Rate | | Principal
Amount ($) | | Value ($) | |
General Electric Capital Corp.(b)
Senior Unsecured
04/07/14 | | | 1.090 | % | | | 5,000,000 | | | | 5,003,640 | | |
| 07/02/15 | | | 1.491 | % | | | 7,500,000 | | | | 7,528,386 | | |
| Total | | | | | | | 17,658,941 | | |
| Other Financial Institutions 0.4% | |
Teva Pharmaceutical Finance Co. BV(b)
11/08/13 | | | 1.366 | % | | | 5,000,000 | | | | 5,037,705 | | |
| Pharmaceuticals 1.2% | |
Novartis Capital Corp.
04/24/13 | | | 1.900 | % | | | 5,300,000 | | | | 5,362,328 | | |
Sanofi
Senior Unsecured
09/30/14 | | | 1.200 | % | | | 5,000,000 | | | | 5,078,400 | | |
Sanofi(b)
Senior Unsecured
03/28/14 | | | 0.771 | % | | | 5,000,000 | | | | 5,026,535 | | |
Teva Pharmaceutical Finance IV LLC
11/10/14 | | | 1.700 | % | | | 1,000,000 | | | | 1,019,700 | | |
| Total | | | | | | | 16,486,963 | | |
| Property & Casualty 1.6% | |
Allstate Life Global Funding Trusts
Senior Secured
04/30/13 | | | 5.375 | % | | | 4,005,000 | | | | 4,153,021 | | |
Berkshire Hathaway Finance Corp.(b)
01/10/14 | | | 0.788 | % | | | 4,600,000 | | | | 4,617,935 | | |
Berkshire Hathaway, Inc.
Senior Unsecured
08/15/14 | | | 1.167 | % | | | 10,000,000 | | | | 10,131,470 | | |
Liberty Mutual Group, Inc.(a)
09/01/12 | | | 7.250 | % | | | 3,225,000 | | | | 3,240,034 | | |
| Total | | | | | | | 22,142,460 | | |
| Railroads 0.7% | |
Union Pacific Corp.
Senior Unsecured
01/31/13 | | | 5.450 | % | | | 10,000,000 | | | | 10,240,100 | | |
| Refining 0.7% | |
Valero Energy Corp.
06/15/13 | | | 4.750 | % | | | 8,800,000 | | | | 9,086,370 | | |
| Retailers 1.3% | |
Best Buy Co., Inc.
Senior Unsecured
07/15/13 | | | 6.750 | % | | | 5,000,000 | | | | 5,199,000 | | |
The accompanying Notes to Financial Statements are an integral part of this statement.
Annual Report 2012
9
CMG Ultra Short Term Bond Fund
Portfolio of Investments (continued)
July 31, 2012
Corporate Bonds & Notes (continued)
| Issuer | | Coupon
Rate | | Principal
Amount ($) | | Value ($) | |
CVS Caremark Corp.
Senior Unsecured
09/15/14 | | | 4.875 | % | | | 8,000,000 | | | | 8,688,272 | | |
Target Corp.
Senior Unsecured
07/18/14 | | | 1.125 | % | | | 3,950,000 | | | | 3,996,578 | | |
| Total | | | | | | | 17,883,850 | | |
| Supermarkets 1.1% | |
Kroger Co. (The)
02/01/13 | | | 5.500 | % | | | 2,000,000 | | | | 2,047,310 | | |
| 04/15/13 | | | 5.000 | % | | | 5,000,000 | | | | 5,141,985 | | |
Safeway, Inc.
Senior Unsecured
03/15/14 | | | 6.250 | % | | | 6,974,000 | | | | 7,452,368 | | |
| Total | | | | | | | 14,641,663 | | |
| Technology 2.3% | |
Hewlett-Packard Co.
Senior Unsecured
05/30/14 | | | 1.550 | % | | | 3,000,000 | | | | 3,023,280 | | |
Hewlett-Packard Co.(b)
Senior Unsecured
09/19/14 | | | 2.018 | % | | | 5,000,000 | | | | 5,063,510 | | |
International Business Machines Corp.
Senior Unsecured
02/06/15 | | | 0.550 | % | | | 4,950,000 | | | | 4,954,930 | | |
International Business Machines Corp.(c)
Senior Unsecured
05/11/15 | | | 0.750 | % | | | 7,500,000 | | | | 7,545,338 | | |
Xerox Corp.
Senior Unsecured
09/13/13 | | | 1.868 | % | | | 7,950,000 | | | | 8,002,812 | | |
Xerox Corp.(b)
Senior Unsecured
05/16/14 | | | 1.286 | % | | | 3,000,000 | | | | 2,990,265 | | |
| Total | | | | | | | 31,580,135 | | |
| Transportation Services 0.5% | |
ERAC U.S.A. Finance LLC(a)
01/10/14 | | | 2.250 | % | | | 7,000,000 | | | | 7,072,387 | | |
| Wireless 0.6% | |
Cellco Partnership/Verizon Wireless Capital LLC
Senior Unsecured
02/01/14 | | | 5.550 | % | | | 7,500,000 | | | | 8,020,140 | | |
| Wirelines 2.4% | |
AT&T, Inc.
Senior Unsecured(c)
02/13/15 | | | 0.875 | % | | | 5,000,000 | | | | 5,040,735 | | |
Corporate Bonds & Notes (continued)
| Issuer | | Coupon
Rate | | Principal
Amount ($) | | Value ($) | |
BellSouth Corp.
Senior Unsecured
09/15/14 | | | 5.200 | % | | | 3,000,000 | | | | 3,271,890 | | |
British Telecommunications PLC
Senior Unsecured(b)
12/20/13 | | | 1.593 | % | | | 10,000,000 | | | | 10,037,970 | | |
Telefonica Emisiones SAU(b)
02/04/13 | | | 0.772 | % | | | 10,000,000 | | | | 9,855,210 | | |
Verizon Communications, Inc.
Senior Unsecured
03/28/14 | | | 1.950 | % | | | 1,000,000 | | | | 1,023,517 | | |
Verizon Communications, Inc.(b)
Senior Unsecured
03/28/14 | | | 1.071 | % | | | 3,000,000 | | | | 3,025,530 | | |
| Total | | | | | | | 32,254,852 | | |
Total Corporate Bonds & Notes
(Cost: $615,795,212) | | | | | | | 618,885,678 | | |
Residential Mortgage-Backed Securities — Agency 0.8%
Federal Home Loan Mortgage Corp.(b)(e)
02/01/36 | | | 2.380 | % | | | 416,693 | | | | 444,123 | | |
Federal Home Loan Mortgage Corp.(e)
CMO Series 2534 Class EC
05/15/22 | | | 5.000 | % | | | 18,664 | | | | 18,658 | | |
CMO Series 2843 Class BA
01/15/18 | | | 5.000 | % | | | 883,266 | | | | 884,119 | | |
CMO Series 2958 Class QC
09/15/18 | | | 4.500 | % | | | 647,969 | | | | 651,517 | | |
CMO Series 3241 Class DC
07/15/34 | | | 4.500 | % | | | 1,420,865 | | | | 1,436,438 | | |
Federal National Mortgage Association(b)(e)
03/01/34 | | | 3.042 | % | | | 373,252 | | | | 398,032 | | |
Federal National Mortgage Association(e)
CMO Series 2008-68 Class AE
07/25/35 | | | 5.250 | % | | | 375,441 | | | | 376,220 | | |
CMO Series 2011-18 Class EM
06/25/37 | | | 4.000 | % | | | 6,220,927 | | | | 6,388,170 | | |
Total Residential Mortgage-Backed
Securities — Agency
(Cost: $10,677,116) | | | | | | | 10,597,277 | | |
The accompanying Notes to Financial Statements are an integral part of this statement.
Annual Report 2012
10
CMG Ultra Short Term Bond Fund
Portfolio of Investments (continued)
July 31, 2012
Residential Mortgage-Backed Securities — Non-Agency 0.7%
| Issuer | | Coupon
Rate | | Principal
Amount ($) | | Value ($) | |
Credit Suisse Mortgage Capital Certificates
CMO Series 2010-1R Class 21A1(a)(e)
01/27/36 | | | 2.587 | % | | | 1,142,831 | | | | 1,123,964 | | |
JPMorgan Reremic
CMO Series 2010-1 Class 1A1(a)(e)
02/26/37 | | | 6.000 | % | | | 2,301,087 | | | | 2,374,575 | | |
Morgan Stanley Reremic Trust
CMO Series 2010-R4 Class 1A(a)(b)(e)
01/26/36 | | | 0.576 | % | | | 971,123 | | | | 967,719 | | |
RBSSP Resecuritization Trust
CMO Series 2012-2 Class 1A5(a)(b)(e)
05/26/47 | | | 0.388 | % | | | 5,400,000 | | | | 5,312,251 | | |
Total Residential Mortgage-Backed
Securities — Non-Agency
(Cost: $9,749,266) | | | | | | | 9,778,509 | | |
Commercial Mortgage-Backed Securities — Agency 1.2%
Government National Mortgage Association(e)
CMO Series 2010-102 Class AB
07/16/32 | | | 1.852 | % | | | 5,397,872 | | | | 5,443,987 | | |
CMO Series 2010-13 Class A
08/16/22 | | | 2.461 | % | | | 4,813,992 | | | | 4,848,302 | | |
CMO Series 2010-83 Class A
10/16/50 | | | 2.021 | % | | | 5,300,511 | | | | 5,361,483 | | |
Total Commercial Mortgage-Backed
Securities — Agency
(Cost: $15,687,027) | | | | | | | 15,653,772 | | |
Commercial Mortgage-Backed Securities — Non-Agency 11.0%
Banc of America Commercial Mortgage, Inc.
Series 2004-3 Class A5(b)(e)
06/10/39 | | | 5.549 | % | | | 9,177,993 | | | | 9,822,711 | | |
Bear Stearns Commercial Mortgage Securities
Series 2003-T12 Class A4(e)
08/13/39 | | | 4.680 | % | | | 5,780,000 | | | | 5,951,192 | | |
Citigroup Commercial Mortgage Trust
Series 2005-C3 Class ASB(e)
05/15/43 | | | 4.755 | % | | | 2,858,965 | | | | 2,962,834 | | |
Commercial Mortgage Pass-Through Certificates
Series 2004-LB3A Class A5(e)
07/10/37 | | | 5.358 | % | | | 15,295,000 | | | | 16,412,560 | | |
Credit Suisse First Boston Mortgage Securities Corp.(b)(e)
Series 2003-C4 Class A4
08/15/36 | | | 5.137 | % | | | 9,301,355 | | | | 9,567,941 | | |
Commercial Mortgage-Backed Securities — Non-Agency (continued)
| Issuer | | Coupon
Rate | | Principal
Amount ($) | | Value ($) | |
Credit Suisse First Boston Mortgage Securities Corp.(e)
Series 2002-CP5 Class A2
12/15/35 | | | 4.940 | % | | | 2,688,339 | | | | 2,699,890 | | |
GS Mortgage Securities Corp. II
Series 2004-GG2 Class A6(e)
08/10/38 | | | 5.396 | % | | | 6,850,000 | | | | 7,314,642 | | |
Greenwich Capital Commercial Funding Corp.
Series 2004-GG1 Class A7(e)
06/10/36 | | | 5.317 | % | | | 10,233,000 | | | | 10,829,891 | | |
JPMorgan Chase Commercial Mortgage Securities Corp.(e)
Series 2003-CB6 Class A2
07/12/37 | | | 5.255 | % | | | 3,900,000 | | | | 4,025,986 | | |
Series 2003-ML1A Class A2
03/12/39 | | | 4.767 | % | | | 8,953,000 | | | | 9,072,919 | | |
LB-UBS Commercial Mortgage Trust(e)
Series 2002-C4 Class A5
09/15/31 | | | 4.853 | % | | | 121,956 | | | | 121,969 | | |
Series 2004-C6 Class A6
08/15/29 | | | 5.020 | % | | | 6,780,000 | | | | 7,238,247 | | |
Merrill Lynch Mortgage Trust(b)(e)
Series 2004-BPC1 Class A5
10/12/41 | | | 4.855 | % | | | 6,395,000 | | | | 6,860,332 | | |
Merrill Lynch Mortgage Trust(e)
Series 2003-KEY1 Class A4
11/12/35 | | | 5.236 | % | | | 9,370,000 | | | | 9,780,443 | | |
Morgan Stanley Capital I, Inc.(e)
Series 2003-T11 Class A4
06/13/41 | | | 5.150 | % | | | 11,445,304 | | | | 11,774,837 | | |
Series 2004-T13 Class A4
09/13/45 | | | 4.660 | % | | | 4,434,000 | | | | 4,615,195 | | |
Morgan Stanley Dean Witter Capital I
Series 2002-IQ3 Class A4(e)
09/15/37 | | | 5.080 | % | | | 3,376,129 | | | | 3,395,362 | | |
Wachovia Bank Commercial Mortgage Trust(b)(e)
Series 2004-C14 Class A4
08/15/41 | | | 5.088 | % | | | 7,500,000 | | | | 8,026,628 | | |
Wachovia Bank Commercial Mortgage Trust(e)
Series 2003-C3 Class A2
02/15/35 | | | 4.867 | % | | | 8,414,400 | | | | 8,499,167 | | |
Series 2004-C10 Class A4
02/15/41 | | | 4.748 | % | | | 10,363,721 | | | | 10,872,455 | | |
Total Commercial Mortgage-Backed
Securities — Non-Agency
(Cost: $151,413,716) | | | | | | | 149,845,201 | | |
The accompanying Notes to Financial Statements are an integral part of this statement.
Annual Report 2012
11
CMG Ultra Short Term Bond Fund
Portfolio of Investments (continued)
July 31, 2012
Asset-Backed Securities — Non-Agency 16.3%
| Issuer | | Coupon
Rate | | Principal
Amount ($) | | Value ($) | |
Ally Auto Receivables Trust
Series 2010-1 Class A3
05/15/14 | | | 1.450 | % | | | 1,064,367 | | | | 1,067,616 | | |
Series 2012-3 Class A2
01/15/15 | | | 0.700 | % | | | 9,900,000 | | | | 9,917,199 | | |
Ally Master Owner Trust
Series 2011-4 Class A2
09/15/16 | | | 1.540 | % | | | 5,110,000 | | | | 5,159,363 | | |
AmeriCredit Automobile Receivables Trust
Series 2012-1 Class A2
10/08/15 | | | 0.910 | % | | | 2,000,000 | | | | 2,005,836 | | |
BMW Vehicle Lease Trust
Series 2010-1 Class A3
04/15/13 | | | 0.820 | % | | | 754,492 | | | | 754,729 | | |
BMW Vehicle Owner Trust
Series 2011-A Class A3
08/25/15 | | | 0.760 | % | | | 3,964,000 | | | | 3,977,799 | | |
CIT Education Loan Trust
Series 2005-1 Class A2(b)
03/15/22 | | | 0.558 | % | | | 2,871,651 | | | | 2,863,085 | | |
CNH Equipment Trust
Series 2009-B Class A4
10/15/14 | | | 5.170 | % | | | 3,046,899 | | | | 3,062,735 | | |
Series 2011-B Class A3
08/15/16 | | | 0.910 | % | | | 2,487,000 | | | | 2,497,394 | | |
Series 2012-B Class A2
10/15/15 | | | 0.650 | % | | | 5,000,000 | | | | 5,002,409 | | |
Capital Auto Receivables Asset Trust
Series 2008-A Class B(a)
01/15/15 | | | 6.890 | % | | | 7,000,000 | | | | 7,208,446 | | |
Capital One Multi-Asset Execution Trust
Series 2007-A8 Class A8(b)
10/15/15 | | | 0.768 | % | | | 10,000,000 | | | | 10,007,260 | | |
Chesapeake Funding LLC(a)(b)
Series 2009-2A Class A
09/15/21 | | | 1.999 | % | | | 4,196,723 | | | | 4,230,297 | | |
Series 2012-1A Class A
11/07/23 | | | 0.996 | % | | | 5,000,000 | | | | 4,999,999 | | |
Conn Funding II LP
CMO Series 2012-AA Class A(a)
04/15/16 | | | 4.133 | % | | | 4,044,164 | | | | 4,034,053 | | |
DT Auto Owner Trust(a)
Series 2011-2A Class C
02/16/16 | | | 3.050 | % | | | 3,000,000 | | | | 3,000,960 | | |
Series 2011-3A Class A
08/15/14 | | | 1.400 | % | | | 2,480,101 | | | | 2,488,504 | | |
Discover Card Master Trust
Series 2010-A1 Class A1(b)
09/15/15 | | | 0.899 | % | | | 8,500,000 | | | | 8,528,373 | | |
Enterprise Fleet Financing LLC
Series 2011-2 Class A2(a)
10/20/16 | | | 1.430 | % | | | 5,049,349 | | | | 5,065,343 | | |
Asset-Backed Securities — Non-Agency (continued)
| Issuer | | Coupon
Rate | | Principal
Amount ($) | | Value ($) | |
Ford Credit Auto Lease Trust
Series 2011-A Class A3
07/15/14 | | | 1.030 | % | | | 2,890,000 | | | | 2,901,661 | | |
Ford Credit Auto Lease Trust(a)
Series 2010-B Class A3
07/15/13 | | | 0.910 | % | | | 916,025 | | | | 916,280 | | |
Ford Credit Auto Owner Trust
Series 2012-C Class A2
04/15/15 | | | 0.470 | % | | | 4,000,000 | | | | 4,000,299 | | |
Ford Credit Floorplan Master Owner Trust
Series 2010-5 Class A1
09/15/15 | | | 1.500 | % | | | 8,175,000 | | | | 8,184,313 | | |
Ford Credit Floorplan Master Owner Trust(a)(b)
Series 2010-1 Class A
12/15/14 | | | 1.899 | % | | | 10,000,000 | | | | 10,053,212 | | |
GE Equipment Midticket LLC
Series 2011-1 Class A2
05/22/14 | | | 0.720 | % | | | 3,679,312 | | | | 3,679,058 | | |
GE Equipment Small Ticket LLC
Series 2012-1A Class A2(a)
11/21/14 | | | 0.850 | % | | | 6,000,000 | | | | 5,972,843 | | |
Great America Leasing Receivables
Series 2011-1 Class A2(a)
03/15/13 | | | 1.050 | % | | | 713,142 | | | | 713,257 | | |
Harley-Davidson Motorcycle Trust
Series 2012-1 Class A2
08/15/15 | | | 0.500 | % | | | 4,000,000 | | | | 4,000,553 | | |
Hyundai Auto Lease Securitization Trust
Series 2012-A Class A2(a)
01/15/15 | | | 0.680 | % | | | 4,500,000 | | | | 4,478,235 | | |
Hyundai Auto Receivables Trust
Series 2012-B Class A2
01/15/15 | | | 0.540 | % | | | 6,000,000 | | | | 6,000,718 | | |
Leaf II Receivables Funding LLC(a)
Series 2010-4 Class A
08/20/18 | | | 1.700 | % | | | 894,091 | | | | 891,408 | | |
Series 2011-1 Class A
12/20/18 | | | 1.700 | % | | | 2,204,737 | | | | 2,178,721 | | |
Louisiana Public Facilities Authority
Series 2011-A Class A1(b)
04/26/21 | | | 0.951 | % | | | 460,794 | | | | 461,043 | | |
Mercedes-Benz Auto Lease Trust
Series 2012-A Class A3
11/17/14 | | | 0.880 | % | | | 10,000,000 | | | | 10,043,238 | | |
Navistar Financial Dealer Note Master Trust
Series 2011-1 Class A(a)(b)
10/25/16 | | | 1.396 | % | | | 2,500,000 | | | | 2,518,568 | | |
New York City Tax Lien
Series 2011-AA Class A(a)
12/10/24 | | | 1.990 | % | | | 2,503,573 | | | | 2,503,956 | | |
The accompanying Notes to Financial Statements are an integral part of this statement.
Annual Report 2012
12
CMG Ultra Short Term Bond Fund
Portfolio of Investments (continued)
July 31, 2012
Asset-Backed Securities — Non-Agency (continued)
| Issuer | | Coupon
Rate | | Principal
Amount ($) | | Value ($) | |
Nissan Auto Receivables Owner Trust
Series 2012-B Class A2(d)
04/01/15 | | | 0.390 | % | | | 6,000,000 | | | | 5,999,554 | | |
Oncor Electric Delivery Transition Bond Co. LLC
Series 2004-1 Class A2
11/17/14 | | | 4.810 | % | | | 87,800 | | | | 88,902 | | |
Panhandle-Plains Higher Education Authority, Inc.
Series 2011-1 Class A1(b)
10/01/18 | | | 0.961 | % | | | 1,103,983 | | | | 1,105,418 | | |
SLM Student Loan Trust(a)(b)
Series 2011-A Class A1
10/15/24 | | | 1.249 | % | | | 1,946,672 | | | | 1,944,116 | | |
Series 2011-B Class A1
12/16/24 | | | 1.099 | % | | | 4,105,236 | | | | 4,088,515 | | |
Series 2012-B Class A1
12/15/21 | | | 1.349 | % | | | 1,776,103 | | | | 1,776,103 | | |
SMART Trust(a)
Series 2011-2USA Class A2A
11/14/13 | | | 1.220 | % | | | 3,463,200 | | | | 3,467,076 | | |
Series 2012-1USA Class A2A
09/14/14 | | | 1.040 | % | | | 4,000,000 | | | | 4,018,410 | | |
Santander Drive Auto Receivables Trust
Series 2010-2 Class A2
08/15/13 | | | 0.950 | % | | | 208,182 | | | | 208,234 | | |
Series 2012-1 Class A2
04/15/15 | | | 1.250 | % | | | 2,924,709 | | | | 2,936,201 | | |
Series 2012-2 Class A2
05/15/15 | | | 0.910 | % | | | 4,200,000 | | | | 4,210,049 | | |
Series 2012-3 Class A2
04/15/15 | | | 0.830 | % | | | 4,230,000 | | | | 4,236,101 | | |
Series 2012-4 Class A2
08/17/15 | | | 0.790 | % | | | 5,000,000 | | | | 4,978,776 | | |
Silverleaf Finance LLC
Series 2010-A Class A(a)
07/15/22 | | | 5.360 | % | | | 1,403,644 | | | | 1,421,300 | | |
Toyota Auto Receivables Owner Trust
Series 2012-A Class A2
10/15/14 | | | 0.570 | % | | | 7,500,000 | | | | 7,506,319 | | |
Utah State Board of Regents
Series 2011-1 Class A1(b)
05/01/23 | | | 0.945 | % | | | 8,441,175 | | | | 8,441,175 | | |
Volkswagen Auto Lease Trust
Series 2010-A Class A3
11/20/13 | | | 0.990 | % | | | 2,901,418 | | | | 2,906,745 | | |
Series 2012-A Class A2
11/20/14 | | | 0.660 | % | | | 8,000,000 | | | | 7,960,273 | | |
Total Asset-Backed Securities — Non-Agency
(Cost: $222,367,354) | | | | | | | 222,662,030 | | |
U.S. Treasury Obligations 4.5%
| Issue | | Coupon
Rate | | Principal
Amount ($) | | Value ($) | |
U.S. Treasury
03/15/15 | | | 0.375 | % | | | 12,000,000 | | | | 12,034,692 | | |
U.S. Treasury(c)
01/31/14 | | | 0.250 | % | | | 20,000,000 | | | | 20,010,940 | | |
| 02/28/14 | | | 0.250 | % | | | 30,000,000 | | | | 30,017,580 | | |
Total U.S. Treasury Obligations
(Cost: $61,864,453) | | | | | | | 62,063,212 | | |
Municipal Bonds 4.5%
Issue
Description | | Coupon
Rate | | Principal
Amount ($) | | Value ($) | |
Citizens Property Insurance Corp.(b)
Revenue Bonds
High Risk
Series 2010A3
06/01/13 | | | 1.890 | % | | | 5,000,000 | | | | 5,045,050 | | |
Personal & Commercial Lines
Series 2012
06/01/15 | | | 1.390 | % | | | 5,000,000 | | | | 5,001,200 | | |
City of Baton Rouge/Parish of East Baton Rouge
Refunding Revenue Bonds
Taxable
Series 2012
01/15/15 | | | 1.239 | % | | | 1,000,000 | | | | 1,006,360 | | |
County of Orange
Revenue Bonds
Series 2012A
08/01/12 | | | 0.750 | % | | | 3,500,000 | | | | 3,500,032 | | |
Florida Hurricane Catastrophe Fund Finance Corp.
Revenue Bonds
Series 2007A(b)
10/15/12 | | | 1.029 | % | | | 16,000,000 | | | | 16,000,160 | | |
Illinois Municipal Electric Agency
Taxable Revenue Bonds
Series 2009B
02/01/13 | | | 4.160 | % | | | 750,000 | | | | 757,905 | | |
Kentucky State Property & Building Commission
Revenue Bonds
Taxable Project No. 78
Series 2003 (NPFGC)
10/01/12 | | | 4.800 | % | | | 2,450,000 | | | | 2,466,880 | | |
New York State Energy Research & Development Authority
Revenue Bonds
Consolidated Edison Co., Inc. Project
Series 2010 AMT(f)
06/01/36 | | | 1.450 | % | | | 4,210,000 | | | | 4,220,567 | | |
The accompanying Notes to Financial Statements are an integral part of this statement.
Annual Report 2012
13
CMG Ultra Short Term Bond Fund
Portfolio of Investments (continued)
July 31, 2012
Municipal Bonds (continued)
Issue
Description | | Coupon
Rate | | Principal
Amount ($) | | Value ($) | |
State of Illinois
Unlimited General Obligation Bonds
Series 2004B
03/01/13 | | | 5.000 | % | | | 7,400,000 | | | | 7,595,952 | | |
Unlimited General Obligation Taxable Bonds
Series 2010
01/01/13 | | | 3.321 | % | | | 3,500,000 | | | | 3,538,220 | | |
State of New Jersey
Certificate of Participation
Equipment Lease Purchase
Series 2004A
06/15/14 | | | 5.000 | % | | | 5,000,000 | | | | 5,377,650 | | |
University of California
Revenue Bonds
Taxable
Series 2011Y-1(b)
07/01/41 | | | 0.826 | % | | | 5,000,000 | | | | 4,988,500 | | |
West Virginia Economic Development Authority
Revenue Bonds
Appalachian Power Co.-Amos Project
Series 2011A AMT(f)
01/01/41 | | | 2.250 | % | | | 2,000,000 | | | | 2,000,000 | | |
Total Municipal Bonds
(Cost: $61,269,798) | | | | | | | 61,498,476 | | |
Money Market Funds —%
| | | Shares | | Value ($) | |
Columbia Short-Term Cash Fund,
0.153%(g)(h) | | | 27,934 | | | | 27,934 | | |
Total Money Market Funds
(Cost: $27,934) | | | | | 27,934 | | |
Commercial Paper 17.4%
| Issuer | | Effective
Yield | | Principal
Amount ($) | | Value ($) | |
| Automotive 1.1% | |
Ford Motor Credit Co.(a)
08/29/12 | | | 1.150 | % | | | 15,000,000 | | | | 14,986,346 | | |
| Electric 6.0% | |
American Electric Power Co.(a)
08/08/12 | | | 0.390 | % | | | 15,000,000 | | | | 14,998,733 | | |
Duke Energy Corp.(a)
08/10/12 | | | 0.430 | % | | | 10,000,000 | | | | 9,998,834 | | |
| 08/15/12 | | | 0.490 | % | | | 19,100,000 | | | | 19,096,180 | | |
Commercial Paper (continued)
| Issuer | | Effective
Yield | | Principal
Amount ($) | | Value ($) | |
Pacific Gas & Electric Co.(a)
08/06/12 | | | 0.370 | % | | | 20,500,000 | | | | 20,498,770 | | |
| 08/07/12 | | | 0.470 | % | | | 10,000,000 | | | | 9,999,091 | | |
| 08/08/12 | | | 0.330 | % | | | 8,000,000 | | | | 7,999,413 | | |
| Total | | | | | | | 82,591,021 | | |
| Gas Distributors 2.8% | |
Michigan Consolidated Gas Co.
08/03/12 | | | 0.380 | % | | | 23,200,000 | | | | 23,199,285 | | |
| 08/06/12 | | | 0.390 | % | | | 4,300,000 | | | | 4,299,728 | | |
| 08/09/12 | | | 0.410 | % | | | 10,900,000 | | | | 10,898,910 | | |
| Total | | | | | | | 38,397,923 | | |
| Gas Pipelines 0.9% | |
Kinder Morgan Energy Partners LP(a)
08/02/12 | | | 0.350 | % | | | 12,700,000 | | | | 12,699,753 | | |
| Independent Energy 1.3% | |
Apache Corp.(a)
08/06/12 | | | 0.420 | % | | | 10,000,000 | | | | 9,999,317 | | |
Devon Energy Corp.(a)
08/13/12 | | | 0.340 | % | | | 7,100,000 | | | | 7,099,128 | | |
| Total | | | | | | | 17,098,445 | | |
| Integrated Energy 1.5% | |
Suncor Energy Inc.(a)
08/13/12 | | | 0.340 | % | | | 5,000,000 | | | | 4,999,386 | | |
| 08/16/12 | | | 0.330 | % | | | 15,000,000 | | | | 14,997,800 | | |
| Total | | | | | | | 19,997,186 | | |
| Media Non-Cable 1.6% | |
Reed Elsevier, Inc.(a)
08/02/12 | | | 0.430 | % | | | 15,000,000 | | | | 14,999,650 | | |
| 08/03/12 | | | 0.430 | % | | | 7,300,000 | | | | 7,299,745 | | |
| Total | | | | | | | 22,299,395 | | |
| Wirelines 2.2% | |
Verizon Communications, Inc.(a)
08/01/12 | | | 0.300 | % | | | 30,000,000 | | | | 29,999,750 | | |
Total Commercial Paper
(Cost: $238,072,843) | | | | | | | 238,069,819 | | |
The accompanying Notes to Financial Statements are an integral part of this statement.
Annual Report 2012
14
CMG Ultra Short Term Bond Fund
Portfolio of Investments (continued)
July 31, 2012
Investments of Cash Collateral Received for Securities on Loan 1.8%
| Issuer | | Effective
Yield | | Par ($)/
Principal ($)/
Shares | | Value ($) | |
| Repurchase Agreements 1.8% | |
Mizuho Securities USA, Inc.
dated 07/31/12,
matures 08/01/12,
repurchase price
$10,000,058(i) | | | 0.210 | % | | | 10,000,000 | | | | 10,000,000 | | |
Natixis Financial Products, Inc.
dated 07/31/12,
matures 08/01/12,
repurchase price
$1,000,006(i) | | | 0.200 | % | | | 1,000,000 | | | | 1,000,000 | | |
Nomura Securities
dated 07/31/12,
matures 08/01/12,
repurchase price
$5,000,028(i) | | | 0.200 | % | | | 5,000,000 | | | | 5,000,000 | | |
Royal Bank of Canada
dated 07/31/12,
matures 08/01/12,
repurchase price
$8,715,371(i) | | | 0.190 | % | | | 8,715,325 | | | | 8,715,325 | | |
| Total | | | | | | | 24,715,325 | | |
Total Investments of Cash Collateral
Received for Securities on Loan
(Cost: $24,715,325) | | | | | | | 24,715,325 | | |
Total Investments
(Cost: $1,411,640,044) | | | | | | | 1,413,797,233 | | |
| Other Assets & Liabilities, Net | | | | | | | (48,005,271 | ) | |
| Net Assets | | | | | | | 1,365,791,962 | | |
Notes to Portfolio of Investments
(a) Security exempt from registration pursuant to Rule 144A under the Securities Act of 1933. This security may be resold in transactions exempt from registration, normally to qualified institutional buyers. At July 31, 2012, the value of these securities amounted to $387,492,115 or 28.37% of net assets.
(b) Variable rate security. The interest rate shown reflects the rate as of July 31, 2012.
(c) At July 31, 2012, security was partially or fully on loan.
(d) Represents a security purchased on a when-issued or delayed delivery basis.
(e) The maturity dates shown represent the original maturity of the underlying obligation. Actual maturity may vary based upon prepayment activity on these obligations. Unless otherwise noted, the coupon rates presented are fixed rates.
(f) Income from this security may be subject to alternative minimum tax.
(g) The rate shown is the seven-day current annualized yield at July 31, 2012.
The accompanying Notes to Financial Statements are an integral part of this statement.
Annual Report 2012
15
CMG Ultra Short Term Bond Fund
Portfolio of Investments (continued)
July 31, 2012
Notes to Portfolio of Investments (continued)
(h) As defined in the Investment Company Act of 1940, an affiliated company is one in which the Fund owns 5% or more of its outstanding voting securities, or a company which is under common ownership or control with the Fund. Holdings and transactions in these affiliated companies during the year ended July 31, 2012, are as follows:
| Issuer | | Beginning
Cost ($) | | Purchase
Cost ($) | | Sales Cost/
Proceeds
from Sales ($) | | Realized
Gain/Loss ($) | | Ending
Cost ($) | | Dividends
or Interest
Income ($) | | Value ($) | |
Columbia
Short-Term
Cash Fund | | | — | | | | 33,617,869 | | | | (33,589,935 | ) | | | — | | | | 27,934 | | | | 310 | | | | 27,934 | | |
(i) The table below represents securities received as collateral for repurchase agreements. This collateral is deposited with the Fund's custodian and, pursuant to the terms of the repurchase agreement, must have an aggregate value greater than or equal to the repurchase price plus accrued interest at all times. The value of securities and/or cash held as collateral for repurchase agreements is monitored on a daily basis to ensure the proper level of collateral.
| Security Description | | Value ($) | |
| Mizuho Securities USA, Inc. (0.210%) | |
| Fannie Mae Pool | | | 4,615,872 | | |
| Freddie Mac Gold Pool | | | 66,141 | | |
| Freddie Mac Non Gold Pool | | | 437,748 | | |
| Freddie Mac REMICS | | | 798,596 | | |
| Ginnie Mae I Pool | | | 249,413 | | |
| Ginnie Mae II Pool | | | 4,032,230 | | |
| Total Market Value of Collateral Securities | | | 10,200,000 | | |
| Security Description | | Value ($) | |
| Natixis Financial Products, Inc. (0.200%) | |
| Ginnie Mae | | | 6,836 | | |
| Fannie Mae Pool | | | 152,577 | | |
| Fannie Mae REMICS | | | 317,638 | | |
| Federal National Mortgage Association | | | 34,605 | | |
| Freddie Mac Gold Pool | | | 11,209 | | |
| Freddie Mac Non Gold Pool | | | 32,055 | | |
| Freddie Mac REMICS | | | 226,636 | | |
| Government National Mortgage Association | | | 238,450 | | |
| Total Market Value of Collateral Securities | | | 1,020,006 | | |
| Security Description | | Value ($) | |
| Nomura Securities (0.200%) | |
| Ginnie Mae I Pool | | | 3,449,839 | | |
| Ginnie Mae II Pool | | | 1,650,161 | | |
| Total Market Value of Collateral Securities | | | 5,100,000 | | |
| Security Description | | Value ($) | |
| Royal Bank of Canada (0.190%) | |
| Fannie Mae Pool | | | 8,889,632 | | |
| Total Market Value of Collateral Securities | | | 8,889,632 | | |
The accompanying Notes to Financial Statements are an integral part of this statement.
Annual Report 2012
16
CMG Ultra Short Term Bond Fund
Portfolio of Investments (continued)
July 31, 2012
Abbreviation Legend
AMT Alternative Minimum Tax
CMO Collateralized Mortgage Obligation
NPFGC National Public Finance Guarantee Corporation
Fair Value Measurements
Generally accepted accounting principles (GAAP) require disclosure regarding the inputs and valuation techniques used to measure fair value and any changes in valuation inputs or techniques. In addition, investments shall be disclosed by major category.
The Fund categorizes its fair value measurements according to a three-level hierarchy that maximizes the use of observable inputs and minimizes the use of unobservable inputs by prioritizing that the most observable input be used when available. Observable inputs are those that market participants would use in pricing an investment based on market data obtained from sources independent of the reporting entity. Unobservable inputs are those that reflect the Fund's assumptions about the information market participants would use in pricing an investment. An investment's level within the fair value hierarchy is based on the lowest level of any input that is deemed significant to the asset or liability's fair value measurement. The input levels are not necessarily an indication of the risk or liquidity associated with investments at that level. For example, certain U.S. government securities are generally high quality and liquid, however, they are reflected as Level 2 because the inputs used to determine fair value may not always be quoted prices in an active market.
Fair value inputs are summarized in the three broad levels listed below:
> Level 1 — Valuations based on quoted prices for investments in active markets that the Fund has the ability to access at the measurement date (including NAV for open-end mutual funds). Valuation adjustments are not applied to Level 1 investments.
> Level 2 — Valuations based on other significant observable inputs (including quoted prices for similar securities, interest rates, prepayment speeds, credit risks, etc.).
> Level 3 — Valuations based on significant unobservable inputs (including the Fund's own assumptions and judgment in determining the fair value of investments).
Inputs that are used in determining fair value of an investment may include price information, credit data, volatility statistics, and other factors. These inputs can be either observable or unobservable. The availability of observable inputs can vary between investments, and is affected by various factors such as the type of investment, and the volume and level of activity for that investment or similar investments in the marketplace. The inputs will be considered by the Investment Manager, along with any other relevant factors in the calculation of an investment's fair value. The Fund uses prices and inputs that are current as of the measurement date, which may include periods of market dislocations. During these periods, the availability of prices and inputs may be reduced for many investments. This condition could cause an investment to be reclassified between the various levels within the hierarchy.
Investments falling into the Level 3 category are primarily supported by quoted prices from brokers and dealers participating in the market for those investments. However, these may be classified as Level 3 investments due to lack of market transparency and corroboration to support these quoted prices. Additionally, valuation models may be used as the pricing source for any remaining investments classified as Level 3. These models rely on one or more significant unobservable inputs and/or significant assumptions by the Investment Manager. Inputs used in valuations may include, but are not limited to, financial statement analysis, capital account balances, discount rates and estimated cash flows, and comparable company data.
Under the direction of the Fund's Board of Trustees (the Board), the Investment Manager's Valuation Committee (the Committee) is responsible for carrying out the valuation procedures approved by the Board. The Committee consists of voting and non-voting members from various groups within the Investment Manager's organization, including operations and accounting, trading and investments, compliance, risk management and legal.
The Committee meets at least monthly to review and approve valuation matters, which may include a description of specific valuation determinations, data regarding pricing information received from approved pricing vendors and brokers and the results of Board-approved valuation control policies and procedures (the Policies). The Policies address, among other things, instances when market quotations are readily available, including recommendations of third party pricing vendors and a determination of appropriate pricing methodologies; events that require specific valuation determinations and assessment of fair value techniques; securities with a potential for stale pricing, including those that are illiquid, restricted, or in default; and the effectiveness of third-party pricing vendors, including periodic reviews of vendors. The Committee meets more frequently, as needed, to discuss additional valuation matters, which may include the need to review back-testing results, review time-sensitive information or approve related valuation actions. The Committee reports to the Board, with members of the Committee meeting with the Board at each of its regularly scheduled meetings to discuss valuation matters and actions during the period, similar to those described earlier.
The accompanying Notes to Financial Statements are an integral part of this statement.
Annual Report 2012
17
CMG Ultra Short Term Bond Fund
Portfolio of Investments (continued)
July 31, 2012
Fair Value Measurements (continued)
For investments categorized as Level 3, the Committee monitors information similar to that described above, which may include: (i) data specific to the issuer or comparable issuers, (ii) general market or specific sector news and (iii) quoted prices and specific or similar security transactions. The Committee considers this data and any changes from prior periods in order to assess the reasonableness of observable and unobservable inputs, any assumptions or internal models used to value those securities and changes in fair value. This data is also used to corroborate, when available, information received from approved pricing vendors and brokers. Various factors impact the frequency of monitoring this information (which may occur as often as daily). However, the Committee may determine that changes to inputs, assumptions and models are not required as a result of the monitoring procedures performed.
The following table is a summary of the inputs used to value the Fund's investments at July 31, 2012:
| Description | | Level 1
Quoted Prices in
Active Markets for
Identical Assets ($) | | Level 2
Other Significant
Observable
Inputs ($) | | Level 3
Significant
Unobservable
Inputs ($) | | Total ($) | |
| Bonds | |
| Corporate Bonds & Notes | | | — | | | | 618,885,678 | | | | — | | | | 618,885,678 | | |
Residential Mortgage-Backed
Securities — Agency | | | — | | | | 10,597,277 | | | | — | | | | 10,597,277 | | |
Residential Mortgage-Backed
Securities — Non-Agency | | | — | | | | 4,466,258 | | | | 5,312,251 | | | | 9,778,509 | | |
Commercial Mortgage-Backed
Securities — Agency | | | — | | | | 15,653,772 | | | | — | | | | 15,653,772 | | |
Commercial Mortgage-Backed
Securities — Non-Agency | | | — | | | | 149,845,201 | | | | — | | | | 149,845,201 | | |
| Asset-Backed Securities — Non-Agency | | | — | | | | 215,557,847 | | | | 7,104,183 | | | | 222,662,030 | | |
| U.S. Treasury Obligations | | | 62,063,212 | | | | — | | | | — | | | | 62,063,212 | | |
| Municipal Bonds | | | — | | | | 61,498,476 | | | | — | | | | 61,498,476 | | |
| Total Bonds | | | 62,063,212 | | | | 1,076,504,509 | | | | 12,416,434 | | | | 1,150,984,155 | | |
| Short-Term Securities | |
| Commercial Paper | | | — | | | | 238,069,819 | | | | — | | | | 238,069,819 | | |
| Total Short-Term Securities | | | — | | | | 238,069,819 | | | | — | | | | 238,069,819 | | |
| Other | |
| Money Market Funds | | | 27,934 | | | | — | | | | — | | | | 27,934 | | |
Investments of Cash Collateral
Received for Securities on Loan | | | — | | | | 24,715,325 | | | | — | | | | 24,715,325 | | |
| Total Other | | | 27,934 | | | | 24,715,325 | | | | — | | | | 24,743,259 | | |
| Total | | | 62,091,146 | | | | 1,339,289,653 | | | | 12,416,434 | | | | 1,413,797,233 | | |
See the Portfolio of Investments for all investment classifications not indicated in the table.
The Fund's assets assigned to the Level 2 input category are generally valued using the market approach, in which a security's value is determined through reference to prices and information from market transactions for similar or identical assets.
There were no transfers of financial assets between Levels 1 and 2 during the period.
The accompanying Notes to Financial Statements are an integral part of this statement.
Annual Report 2012
18
CMG Ultra Short Term Bond Fund
Portfolio of Investments (continued)
July 31, 2012
Fair Value Measurements (continued)
The following table is a reconciliation of Level 3 assets for which significant observable and/or unobservable inputs were used to determine fair value.
| | | Residential
Mortgage-Backed
Securities —
Non-Agency ($) | | Asset-Backed
Securities —
Non-Agency ($) | | Total ($) | |
| Balance as of July 31, 2011 | | | — | | | | — | | | | — | | |
| Accrued discounts/premiums | | | — | | | | 192,833 | | | | 192,833 | | |
| Realized gain (loss) | | | 17,833 | | | | — | | | | 17,833 | | |
| Change in unrealized appreciation (depreciation)(a) | | | 20,250 | | | | (5,251 | ) | | | 14,999 | | |
| Sales | | | (891,629 | ) | | | (9,372,730 | ) | | | (10,264,359 | ) | |
| Purchases | | | 6,165,797 | | | | 4,034,053 | | | | 10,199,850 | | |
| Transfers into Level 3 | | | — | | | | 12,255,278 | | | | 12,255,278 | | |
| Transfers out of Level 3 | | | — | | | | — | | | | — | | |
| Balance as of July 31, 2012 | | | 5,312,251 | | | | 7,104,183 | | | | 12,416,434 | | |
(a) Change in unrealized appreciation (depreciation) relating to securities held at July 31, 2012 was $14,999.
The Fund does not hold any significant investments with unobservable inputs which are categorized as Level 3.
The Fund's assets assigned to the Level 3 category are valued utilizing the valuation technique deemed the most appropriate in the circumstances. Certain Residential Mortgage and Asset Backed Securities classified as Level 3 are valued using the market approach and utilize single market quotations from broker dealers which may have included, but not limited to, the distressed nature of the security and observable transactions for similar assets in the market. Significant increases (decreases) to any of these inputs would result in a significantly lower (higher) fair value measurement.
Financial Assets were transferred from Level 2 to Level 3 due to unavailable market inputs. As a result, as of period end, management determined to fair value the security under consistently applied procedures established by and under the general supervision of the Board of Trustees.
Transfers in and/or out of Level 3 are determined based on the fair value at the beginning of the period for security positions held throughout the period.
The accompanying Notes to Financial Statements are an integral part of this statement.
Annual Report 2012
19
CMG Ultra Short Term Bond Fund
Statement of Assets and Liabilities
July 31, 2012
| Assets | |
| Investments, at value* | |
| Unaffiliated issuers (identified cost $1,386,896,785) | | $ | 1,389,053,974 | | |
| Affiliated issuers (identified cost $27,934) | | | 27,934 | | |
| Investment of cash collateral received for securities on loan | |
| Repurchase agreements (identified cost $24,715,325) | | | 24,715,325 | | |
| Total investments (identified cost $1,411,640,044) | | | 1,413,797,233 | | |
| Receivable for: | |
| Investments sold | | | 1,182 | | |
| Capital shares sold | | | 1,863,965 | | |
| Dividends | | | 37 | | |
| Interest | | | 5,040,932 | | |
| Expense reimbursement due from Investment Manager | | | 693 | | |
| Trustees' deferred compensation plan | | | 27,781 | | |
| Total assets | | | 1,420,731,823 | | |
| Liabilities | |
| Disbursements in excess of cash | | | 208,370 | | |
| Due upon return of securities on loan | | | 24,715,325 | | |
| Payable for: | |
| Investments purchased | | | 14,227,034 | | |
| Investments purchased on a delayed delivery basis | | | 10,999,554 | | |
| Capital shares purchased | | | 3,568,256 | | |
| Dividend distributions to shareholders | | | 1,134,150 | | |
| Investment management fees | | | 9,347 | | |
| Compensation of board members | | | 1,072 | | |
| Other expenses | | | 48,972 | | |
| Trustees' deferred compensation plan | | | 27,781 | | |
| Total liabilities | | | 54,939,861 | | |
| Net assets applicable to outstanding capital stock | | $ | 1,365,791,962 | | |
| Represented by | |
| Paid-in capital | | $ | 1,393,033,805 | | |
| Excess of distributions over net investment income | | | (836,354 | ) | |
| Accumulated net realized loss | | | (28,562,678 | ) | |
| Unrealized appreciation (depreciation) on: | |
| Investments | | | 2,157,189 | | |
| Total — representing net assets applicable to outstanding capital stock | | $ | 1,365,791,962 | | |
| Shares outstanding | | | 151,547,812 | | |
| Net asset value per share | | $ | 9.01 | | |
| *Value of securities on loan | | $ | 73,788,378 | | |
The accompanying Notes to Financial Statements are an integral part of this statement.
Annual Report 2012
20
CMG Ultra Short Term Bond Fund
Statement of Operations
Year Ended July 31, 2012
| Net investment income | |
| Income: | |
| Interest | | $ | 12,900,981 | | |
| Dividends from affiliates | | | 310 | | |
| Income from securities lending — net | | | 25,856 | | |
| Total income | | | 12,927,147 | | |
| Expenses: | |
| Investment management fees | | | 2,729,842 | | |
| Compensation of board members | | | 47,830 | | |
| Professional fees | | | 95,611 | | |
| Total expenses | | | 2,873,283 | | |
| Fees waived or expenses reimbursed by Investment Manager and its affiliates | | | (146,116 | ) | |
| Total net expenses | | | 2,727,167 | | |
| Net investment income | | | 10,199,980 | | |
| Realized and unrealized gain (loss) — net | |
| Net realized gain (loss) on: | |
| Investments | | | (581,851 | ) | |
| Net realized loss | | | (581,851 | ) | |
| Net change in unrealized appreciation (depreciation) on: | |
| Investments | | | 943,137 | | |
| Net change in unrealized appreciation | | | 943,137 | | |
| Net realized and unrealized gain | | | 361,286 | | |
| Net increase in net assets resulting from operations | | $ | 10,561,266 | | |
The accompanying Notes to Financial Statements are an integral part of this statement.
Annual Report 2012
21
CMG Ultra Short Term Bond Fund
Statement of Changes in Net Assets
| | | Year Ended
July 31,
2012 | | Year Ended
July 31,
2011 | |
| Operations | |
| Net investment income | | $ | 10,199,980 | | | $ | 14,384,078 | | |
| Net realized loss | | | (581,851 | ) | | | (2,250,241 | ) | |
| Net change in unrealized appreciation | | | 943,137 | | | | 3,301,868 | | |
| Net increase in net assets resulting from operations | | | 10,561,266 | | | | 15,435,705 | | |
| Distributions to shareholders | |
| Net investment income | | | (11,245,979 | ) | | | (24,393,772 | ) | |
| Increase (decrease) in net assets from share transactions | | | 398,209,586 | | | | (228,247,601 | ) | |
| Total increase (decrease) in net assets | | | 397,524,873 | | | | (237,205,668 | ) | |
| Net assets at beginning of year | | | 968,267,089 | | | | 1,205,472,757 | | |
| Net assets at end of year | | $ | 1,365,791,962 | | | $ | 968,267,089 | | |
| Excess of distributions over net investment income | | $ | (836,354 | ) | | $ | (1,816,469 | ) | |
The accompanying Notes to Financial Statements are an integral part of this statement.
Annual Report 2012
22
CMG Ultra Short Term Bond Fund
Statement of Changes in Net Assets (continued)
| | | Year Ended July 31, 2012 | | Year Ended July 31, 2011 | |
| | | Shares | | Dollars ($) | | Shares | | Dollars ($) | |
| Capital stock activity | |
| Subscriptions | | | 134,688,205 | | | | 1,212,285,459 | | | | 78,759,694 | | | | 713,316,207 | | |
| Distributions reinvested | | | 55,826 | | | | 502,067 | | | | 145,602 | | | | 1,320,198 | | |
| Redemptions | | | (90,557,383 | ) | | | (814,577,940 | ) | | | (104,086,252 | ) | | | (942,884,006 | ) | |
| Total increase (decrease) | | | 44,186,648 | | | | 398,209,586 | | | | (25,180,956 | ) | | | (228,247,601 | ) | |
| Total net increase (decrease) | | | 44,186,648 | | | | 398,209,586 | | | | (25,180,956 | ) | | | (228,247,601 | ) | |
The accompanying Notes to Financial Statements are an integral part of this statement.
Annual Report 2012
23
CMG Ultra Short Term Bond Fund
Financial Highlights
The following table is intended to help you understand the Fund's financial performance. Per share net investment income (loss) amounts are calculated based on average shares outstanding during the period. Total returns assume reinvestment of all dividends and distributions. Total returns do not reflect payment of sales charges, if any, and are not annualized for periods of less than one year.
| | | Year Ended July 31, | |
| | | 2012 | | 2011 | | 2010 | | 2009 | | 2008 | |
| Per share data | |
| Net asset value, beginning of period | | $ | 9.02 | | | $ | 9.10 | | | $ | 9.16 | | | $ | 9.29 | | | $ | 9.59 | | |
| Income from investment operations | |
| Net investment income | | | 0.08 | | | | 0.13 | | | | 0.13 | | | | 0.26 | | | | 0.43 | | |
| Net realized and unrealized gain (loss) | | | 0.00 | (a) | | | 0.00 | (a) | | | 0.06 | | | | (0.07 | ) | | | (0.30 | ) | |
| Total from investment operations | | | 0.08 | | | | 0.13 | | | | 0.19 | | | | 0.19 | | | | 0.13 | | |
| Less distributions to shareholders: | |
| Net investment income | | | (0.09 | ) | | | (0.21 | ) | | | (0.25 | ) | | | (0.32 | ) | | | (0.43 | ) | |
| Net asset value, end of period | | $ | 9.01 | | | $ | 9.02 | | | $ | 9.10 | | | $ | 9.16 | | | $ | 9.29 | | |
| Total return | | | 0.93 | % | | | 1.45 | % | | | 2.10 | %(b) | | | 2.16 | % | | | 1.42 | % | |
| Ratios to average net assets(c) | |
Expenses prior to fees waived or expenses reimbursed
(including interest expense) | | | 0.26 | % | | | 0.26 | %(d) | | | 0.26 | %(d) | | | 0.29 | %(d) | | | 0.32 | % | |
Net expenses after fees waived or expenses reimbursed
(including interest expense)(e) | | | 0.25 | % | | | 0.25 | %(d) | | | 0.25 | %(d) | | | 0.25 | %(d) | | | 0.25 | % | |
Expenses prior to fees waived or expenses reimbursed
(excluding interest expense) | | | 0.26 | % | | | 0.26 | % | | | 0.26 | % | | | 0.29 | % | | | 0.32 | % | |
Net expenses after fees waiver or expenses reimbursed
(excluding interest expense)(e) | | | 0.25 | % | | | 0.25 | % | | | 0.25 | % | | | 0.25 | % | | | 0.25 | % | |
| Net investment income | | | 0.93 | % | | | 1.39 | % | | | 1.38 | % | | | 2.82 | % | | | 4.58 | % | |
| Supplemental data | |
| Net assets, end of period (in thousands) | | $ | 1,365,792 | | | $ | 968,267 | | | $ | 1,205,473 | | | $ | 338,239 | | | $ | 96,595 | | |
| Portfolio turnover | | | 66 | % | | | 51 | % | | | 90 | % | | | 103 | % | | | 69 | % | |
Notes to Financial Highlights
(a) Rounds to less than $0.01.
(b) Total return includes a reimbursement of a loss experienced by the Fund due to a compliance violation. The reimbursement increased total return and net asset value per share by less than 0.01% and less than $0.01, respectively.
(c) In addition to the fees and expenses which the Fund bears directly, the Fund indirectly bears a pro rata share of the fees and expenses of the acquired funds in which it invests. Such indirect expenses are not included in the reported expense ratios.
(d) Includes interest expense which rounds to less than 0.01%.
(e) The Investment Manager and certain of its affiliates agreed to waive/reimburse certain fees and expenses, if applicable.
The accompanying Notes to Financial Statements are an integral part of this statement.
Annual Report 2012
24
CMG Ultra Short Term Bond Fund
Notes to Financial Statements
July 31, 2012
Note 1. Organization
CMG Ultra Short Term Bond Fund (the Fund), a series of Columbia Funds Series Trust I (the Trust), is a diversified fund. The Trust is registered under the Investment Company Act of 1940, as amended (the 1940 Act), as an open-end management investment company organized as a Massachusetts business trust.
Shares of the Fund are available for purchase by institutional entities, including corporations, partnerships, trusts, foundations, endowments, affiliated funds, government entities or other similar organizations, and to certain qualifying advisory clients of Bank of America. Please see the Fund's prospectus for further datails, including applicable investment minimums.
Fund Shares
The Trust may issue an unlimited number of shares (without par value), which are offered continuously at net asset value.
Note 2. Summary of Significant Accounting Policies
Use of Estimates
The preparation of financial statements in accordance with U.S. generally accepted accounting principles (GAAP) requires management to make certain estimates and assumptions that affect the reported amounts of assets and liabilities, the disclosure of contingent assets and liabilities at the date of the financial statements and the reported amounts of revenue and expenses during the reporting period. Actual results could differ from those estimates.
The following is a summary of significant accounting policies consistently followed by the Fund in the preparation of its financial statements.
Security Valuation
Debt securities generally are valued by pricing services approved by the Board of Trustees (the Board) based upon market transactions for normal, institutional-size trading units of similar securities. The services may use various pricing techniques which take into account appropriate factors such as yield, quality, coupon rate, maturity, type of issue, trading characteristics and other data, as well as broker quotes. Debt securities for which quotations are readily available may also be valued based upon an over-the-counter or exchange bid quotation.
Asset-backed and mortgage-backed securities are generally valued by pricing services, which utilize pricing models that incorporate the securities' cash flow and loan performance data. These models also take into account available market data, including trades, market quotations, and benchmark yield curves for identical or similar securities. Factors used to identify similar securities may include, but are not limited to, issuer, collateral type, vintage, prepayment speeds, collateral performance, credit ratings, credit enhancement and expected life. Asset-backed securities for which quotations are readily available may also be valued based upon an over-the-counter or exchange bid quotation.
Short-term securities purchased within 60 days to maturity are valued at amortized cost, which approximates market value. The value of short-term securities originally purchased with maturities greater than 60 days is determined based on an amortized value to par upon reaching 60 days to maturity. Short-term securities maturing in more than 60 days from the valuation date are valued at the market price or approximate market value based on current interest rates.
Investments in other open-end investment companies, including money market funds, are valued at net asset value.
Investments for which market quotations are not readily available, or that have quotations which management believes are not reliable, are valued at fair value as determined in good faith under consistently applied procedures established by and under the general supervision of the Board. If a security or class of securities (such as foreign securities) is valued at fair value, such value is likely to be different from the last quoted market price for the security.
The determination of fair value often requires significant judgment. To determine fair value, management may use assumptions including but not limited to future cash flows and estimated risk premiums. Multiple inputs from various sources may be used to determine fair value.
Repurchase Agreements
The Fund may engage in repurchase agreement transactions with institutions that management has determined are creditworthy. The Fund, through the custodian, receives delivery of the underlying securities collateralizing a repurchase agreement. Management is responsible for determining that the collateral is at least equal, at all times, to the value of the repurchase obligation including interest. A repurchase agreement transaction involves certain risks in the event of default or insolvency of the counterparty. These risks include possible delays in or restrictions on a Fund's ability to dispose of the underlying securities and a possible decline in the value of the underlying securities during the period while the Fund seeks to assert its rights.
Delayed Delivery Securities
The Fund may trade securities on other than normal settlement terms, including securities purchased or sold on a
Annual Report 2012
25
CMG Ultra Short Term Bond Fund
Notes to Financial Statements (continued)
July 31, 2012
"when-issued" basis. This may increase the risk if the other party to the transaction fails to deliver and causes the Fund to subsequently invest at less advantageous prices. The Fund designates cash or liquid securities in an amount equal to the delayed delivery commitment.
Security Transactions
Security transactions are accounted for on the trade date. Cost is determined and gains (losses) are based upon the specific identification method for both financial statement and federal income tax purposes.
Income Recognition
Interest income is recorded on an accrual basis. Market premium and discount are amortized and accreted, respectively, on all debt securities, unless otherwise noted. Original issue discount is accreted to interest income over the life of the security with a corresponding increase in the cost basis, if any.
Expenses
General expenses of the Trust are allocated to the Fund and other funds of the Trust based upon relative net assets or other expense allocation methodologies determined by the nature of the expense. Expenses directly attributable to the Fund are charged to the Fund.
Federal Income Tax Status
The Fund intends to qualify each year as a regulated investment company under Subchapter M of the Internal Revenue Code, as amended, and will distribute substantially all of its tax exempt or taxable income (including net short-term capital gains), if any, for its tax year, and as such will not be subject to federal income taxes. In addition, the Fund intends to distribute in each calendar year substantially all of its net investment income, capital gains and certain other amounts, if any, such that the Fund should not be subject to federal excise tax. Therefore, no federal income or excise tax provision is recorded.
Distributions to Shareholders
Distributions from net investment income, if any, are declared daily and paid monthly. Net realized capital gains, if any, are distributed at least annually. Income distributions and capital gain distributions are determined in accordance with federal income tax regulations, which may differ from GAAP.
Guarantees and Indemnifications
Under the Trust's organizational documents and, in some cases, by contract, its officers and trustees are indemnified against certain liabilities arising out of the performance of their duties to the Trust or its funds. In addition, certain of the Fund's contracts with its service providers contain general indemnification clauses. The Fund's maximum exposure under these arrangements is unknown since the amount of any future claims that may be made against the Fund cannot be determined, and the Fund has no historical basis for predicting the likelihood of any such claims.
Recent Accounting Pronouncement
Disclosures about Offsetting Assets and Liabilities
In December 2011, the Financial Accounting Standards Board (FASB) issued ASU No. 2011-11, Disclosures about Offsetting Assets and Liabilities. The objective of the FASB is to enhance current disclosure requirements on offsetting of certain assets and liabilities and to enable financial statement users to compare financial statements prepared under GAAP and International Financial Reporting Standards.
Specifically, ASU No. 2011-11 requires an entity to disclose both gross and net information for derivatives and other financial instruments that are subject to a master netting arrangement or similar agreement. The standard requires disclosure of collateral received in connection with the master netting agreements or similar agreements. The effective date of ASU No. 2011-11 is for interim and annual periods beginning on or after January 1, 2013. At this time, management is evaluating the implications of this guidance and the impact it will have on the financial statement amounts and footnote disclosures, if any.
Note 3. Fees and Compensation Paid to Affiliates
Investment Management Fees
Under an Investment Management Services Agreement, Columbia Management Investment Advisers, LLC (the Investment Manager), a wholly-owned subsidiary of Ameriprise Financial, Inc. (Ameriprise Financial), determines which securities will be purchased, held or sold. The Fund's management fee is a unified fee. The Investment Manager, out of the unified fee it receives from the Fund, pays all operating costs and expenses of the Fund (other than the expenses described below or in the Fund's prospectus), including accounting expenses (other than audit fees), legal fees for the Fund, transfer agent and custodian fees, and other expenses. The Fund pays the following expenses: disinterested trustees fees and expenses, including their legal counsel, auditing expense, interest on borrowings by the Fund, if any, portfolio transaction expenses, taxes and extraordinary expenses of the Fund. The unified fee is paid monthly to the Investment Manager at the annual rate of 0.25% of the Fund's average net assets.
Annual Report 2012
26
CMG Ultra Short Term Bond Fund
Notes to Financial Statements (continued)
July 31, 2012
Administration Fees
Under an Administrative Services Agreement, the Investment Manager serves as the Fund Administrator. The Fund Administrator does not receive a fee for its administration and accounting services under the Administrative Services Agreement.
Pricing and Bookkeeping Fees
Prior to August 8, 2011, the Fund had entered into a Financial Reporting Services Agreement (the Financial Reporting Services Agreement) with State Street Bank and Trust Company (State Street) and the Investment Manager pursuant to which State Street provided financial reporting services to the Fund. The Fund also entered into an Accounting Services Agreement (collectively with the Financial Reporting Services Agreement, the State Street Agreements) with State Street and the Investment Manager pursuant to which State Street provided accounting services to the Fund. The pricing and bookkeeping fees for the Fund are paid by the Investment Manager. Effective August 8, 2011, these services are provided under the Administrative Services Agreement discussed above.
Compensation of Board Members
Board members are compensated for their services to the Fund as disclosed in the Statement of Operations. The Trust's eligible Trustees may participate in a Deferred Compensation Plan (the Plan) which may be terminated at any time. Obligations of the Plan will be paid solely out of the Fund's assets.
Compensation of Chief Compliance Officer
The Board has appointed a Chief Compliance Officer to the Fund in accordance with federal securities regulations. The Fund pays its pro-rata share of the expenses associated with the Chief Compliance Officer. The expenses of the Chief Compliance Officer charged to the Fund are payable by the Investment Manager.
Transfer Agent Fees
Under a Transfer and Dividend Disbursing Agent Agreement, Columbia Management Investment Services Corp. (the Transfer Agent), an affiliate of the Investment Manager and a wholly-owned subsidiary of Ameriprise Financial, is responsible for providing transfer agency services to the Fund. The Transfer Agent has contracted with Boston Financial Data Services (BFDS) to serve as sub-transfer agent. The Transfer Agent fees for the Fund are payable by the Investment Manager. The Transfer Agent pays the fees of BFDS for services as sub-transfer agent and is not entitled to reimbursement for such fees from the Fund.
Expenses Waived/Reimbursed by the Investment Manager and its Affiliates
The Investment Manager and certain of its affiliates have contractually agreed to waive fees and/or reimburse expenses (excluding certain fees and expenses described below), through November 30, 2012, unless sooner terminated at the sole discretion of the Board, so that the Fund's net operating expenses, after giving effect to fees waived/expenses reimbursed and/or overdraft charges from the Fund's custodian, do not exceed the annual rate of 0.25% of the Fund's average daily net assets.
Under the agreement, the following fees and expenses, are excluded from the waiver/reimbursement commitment, and therefore will be paid by the Fund, if applicable: taxes (including foreign transaction taxes), expenses associated with investments in affiliated and non-affiliated pooled investment vehicles (including mutual funds and exchange traded funds), transaction costs and brokerage commissions, costs related to any securities lending program, dividend expenses associated with securities sold short, inverse floater program fees and expenses, transaction charges and interest on borrowed money, interest, extraordinary expenses and any other expenses the exclusion of which is specifically approved by the Board. This agreement may be modified or amended only with approval from all parties.
Note 4. Federal Tax Information
The timing and character of income and capital gain distributions are determined in accordance with income tax regulations, which may differ from GAAP because of temporary or permanent book to tax differences.
At July 31, 2012, these differences are primarily due to differing treatment for Trustees' deferred compensation, distributions, expiring capital loss carryforwards, amortization of market premium, paydown reclassifications, and post-October capital losses. To the extent these differences are permanent, reclassifications are made among the components of the Fund's net assets in the Statement of Assets and Liabilities. Temporary differences do not require reclassifications. In the Statement of Assets and Liabilities the following reclassifications were made:
| Excess of distributions over net investment income | | $ | 2,026,114 | | |
| Accumulated net realized loss | | | (1,999,498 | ) | |
| Paid-in capital | | | (26,616 | ) | |
Net investment income and net realized gains (losses), as disclosed in the Statement of Operations and net assets were not affected by this reclassification.
Annual Report 2012
27
CMG Ultra Short Term Bond Fund
Notes to Financial Statements (continued)
July 31, 2012
The tax character of distributions paid during the years indicated was as follows:
| Year Ended July 31, | | 2012 | | 2011 | |
| Ordinary income | | $ | 11,245,979 | | | $ | 24,393,772 | | |
Short-term capital gain distributions, if any, are considered ordinary income distributions for tax purposes.
At July 31, 2012, the components of distributable earnings on a tax basis were as follows:
| Undistributed ordinary income | | $ | 639,657 | | |
| Unrealized appreciation | | | 1,843,110 | | |
At July 31, 2012, the cost of investments for federal income tax purposes was $1,411,954,123 and the aggregate gross unrealized appreciation and depreciation based on that cost was:
| Unrealized appreciation | | $ | 4,498,747 | | |
| Unrealized depreciation | | $ | (2,655,637 | ) | |
| Net unrealized appreciation | | $ | 1,843,110 | | |
The following capital loss carryforward, determined at July 31, 2012, may be available to reduce taxable income arising from future net realized gains on investments, if any, to the extent permitted by the Internal Revenue Code:
| Year of Expiration | | Amount ($) | |
| 2013 | | | 47,961 | | |
| 2014 | | | 627,248 | | |
| 2015 | | | 685,751 | | |
| 2016 | | | 213,699 | | |
| 2017 | | | 2,249,159 | | |
| 2018 | | | 1,023,617 | | |
| 2019 | | | 11,369,928 | | |
| Unlimited short-term | | | 4,966,232 | | |
| Unlimited long-term | | | 4,954,273 | | |
| Total | | | 26,137,868 | | |
For the year ended July 31, 2012, $29,640 of capital loss carryforward expired unused.
Under current tax rules, regulated investment companies can elect to treat certain late-year ordinary losses incurred and post-October capital losses (capital losses realized after October 31) as arising on the first day of the following taxable year. As of July 31, 2012, the Fund will elect to treat post-October capital losses of $2,424,810 as arising on August 1, 2012.
Management of the Fund has concluded that there are no significant uncertain tax positions that would require recognition in the financial statements. However, management's conclusion may be subject to review and adjustment at a later date based on factors including, but not limited to, new tax laws, regulations, and administrative interpretations (including relevant court decisions). Generally, the Fund's federal tax returns for the prior three fiscal years remain subject to examination by the Internal Revenue Service.
Note 5. Portfolio Information
The cost of purchases and proceeds from sales of securities, excluding short-term obligations, aggregated to $918,519,624 and $579,737,786, respectively, for the year ended July 31, 2012, of which $67,230,392 and $17,572,961, respectively, were U.S. government securities.
Note 6. Lending of Portfolio Securities
Effective August 8, 2011, the Fund has entered into a Master Securities Lending Agreement (the Agreement) with JPMorgan Chase Bank, N.A. (JPMorgan). The Agreement, which replaces the previous securities lending arrangement with State Street, authorizes JPMorgan as lending agent to lend securities to authorized borrowers in order to generate additional income on behalf of the Fund. Pursuant to the Agreement, the securities loaned are secured by cash or securities that either are issued or guaranteed as to principal and interest by the U.S. government, its agencies, authorities or instrumentalities with value equal to at least 100% of the market value of the loaned securities. Any additional collateral required to maintain those levels due to market fluctuations of the loaned securities is requested to be delivered the following business day. Cash collateral received is invested by the lending agent on behalf of the Fund into authorized investments pursuant to the Agreement. The investments made with the cash collateral are listed in the Portfolio of Investments. The values of such investments and any uninvested cash collateral are disclosed in the Statement of Assets and Liabilities along with the related obligation to return the collateral upon the return of the securities loaned.
Risks of delay in recovery of securities or even loss of rights in the securities may occur should the borrower of the securities fail financially. Risks may also arise to the extent that the value of the securities loaned increases above the value of the collateral received. JPMorgan will indemnify the Fund from losses resulting from a borrower's failure to return a loaned security when due. Such indemnification does not extend to losses associated with declines in the value of cash collateral investments. The Investment Manager is not responsible for any losses incurred by the Fund in connection with the securities lending program. Loans are subject to termination
Annual Report 2012
28
CMG Ultra Short Term Bond Fund
Notes to Financial Statements (continued)
July 31, 2012
by the Fund or the borrower at any time, and are, therefore, not considered to be illiquid investments.
Pursuant to the Agreement, the Fund receives income for lending its securities either in the form of fees or by earning interest on invested cash collateral, net of negotiated rebates paid to borrowers and fees paid to the lending agent for services provided and any other securities lending expenses. Net income earned from securities lending for the year ended July 31, 2012 is disclosed in the Statement of Operations. The Fund continues to earn and accrue interest and dividends on the securities loaned.
Prior to August 8, 2011, the Fund participated in a securities lending arrangement with State Street. Each security on loan was collateralized in an amount at least equal to the market value of the securities loaned plus accrued income from the investment of collateral. The income generated by the investment of the collateral, net of any fees remitted to State Street as the lending agent and borrower rebates, was paid to the Fund.
At July 31, 2012, securities valued at $73,788,378 were on loan, secured by U.S. government and agency securities valued at $50,325,372 and by cash collateral of $24,715,325 (which does not reflect calls for collateral made to borrowers by JPMorgan at period end) that is partially or fully invested in short-term securities or other cash equivalents.
Note 7. Affiliated Money Market Fund
Effective August 8, 2011, the Fund may invest its daily cash balances in Columbia Short-Term Cash Fund, an affiliated money market fund established for the exclusive use by the Fund and other affiliated funds. The income earned by the Fund from such investments is included as "Dividends from affiliates" in the Statement of Operations. As an investing fund, the Fund indirectly bears its proportionate share of the expenses of Columbia Short-Term Cash Fund.
Note 8. Shareholder Concentration
At July 31, 2012, one unaffiliated shareholder account owned 96.8% of the outstanding shares of the Fund. The Fund has no knowledge about whether any portion of those shares was owned beneficially by such account. Subscription and redemption activity by concentrated accounts may have a significant effect on the operations of the Fund.
Note 9. Line of Credit
The Fund has entered into a revolving credit facility with a syndicate of banks led by JPMorgan Chase Bank N.A. (the Administrative Agent) whereby the Fund may borrow for the temporary funding of shareholder redemptions or for other temporary or emergency purposes. The credit facility became effective on August 8, 2011, replacing a prior credit facility. The credit facility agreement, as amended, which is a collective agreement between the Fund and certain other funds managed by the Investment Manager, severally and not jointly, permits collective borrowings up to $500 million. Pursuant to a December 13, 2011 amendment to the credit facility agreement, interest is charged to each participating fund based on its borrowings at a rate equal to the higher of (i) the overnight federal funds rate plus 1.00% or (ii) the one-month LIBOR rate plus 1.00%. Each borrowing under the credit facility matures no later than 60 days after the date of borrowing. The Fund also pays a commitment fee equal to its pro rata share of the amount of the credit facility at a rate of 0.08% per annum. For the period August 8, 2011 through December 12, 2011, interest was charged to each participating fund based on its borrowings at a rate equal to the sum of the federal funds rate plus (i) 1.25% per annum plus (ii) if one-month LIBOR exceeds the federal funds rate, the amount of such excess. The Fund also paid a commitment fee equal to its pro rata share of the amount of the credit facility at a rate of 0.10% per annum.
Prior to August 8, 2011, the Fund and certain other funds managed by the Investment Manager participated in a $100 million committed, unsecured revolving credit facility provided by State Street. Interest was charged to each fund based on its borrowings at a rate equal to the greater of the (i) federal funds rate plus 1.25% per annum or (ii) the overnight LIBOR rate plus 1.25% per annum. The Fund also paid a commitment fee equal to its pro rata share of the amount of the credit facility at a rate of 0.15% per annum.
The Fund had no borrowings during the year ended July 31, 2012.
Note 10. Significant Risks
Asset-Backed Securities Risk
The value of asset-backed securities may be affected by, among other factors, changes in interest rates, the market's assessment of the quality of underlying assets, the creditworthiness of the servicer for the underlying assets, factors concerning the interests in and structure of the issuer or the originator of the underlying assets, or the creditworthiness or rating of the entities that provide any supporting letters of credit, surety bonds, derivative instruments, or other credit enhancement. The value of asset-backed securities also will be affected by the exhaustion, termination or expiration of any credit enhancement. Most asset-backed securities are subject to prepayment risk, which is the possibility that the underlying debt may be refinanced or
Annual Report 2012
29
CMG Ultra Short Term Bond Fund
Notes to Financial Statements (continued)
July 31, 2012
prepaid prior to maturity during periods of declining or low interest rates, causing the Fund to have to reinvest the money received in securities that have lower yields. In addition, the impact of prepayments on the value of asset-backed securities may be difficult to predict and may result in greater volatility.
Mortgage-Backed Securities Risk
The value of mortgage-backed securities may be affected by, among other things, changes in interest rates, factors concerning the interests in and structure of the issuer or the originator of the mortgages, the creditworthiness of the entities that provide any supporting letters of credit, surety bonds or other credit enhancements or the quality of underlying assets or the market's assessment thereof. Mortgage-backed securities are subject to prepayment risk, which is the possibility that the underlying mortgage may be refinanced or prepaid prior to maturity during periods of declining or low interest rates, causing the Fund to have to reinvest the money received in securities that have lower yields. In addition, the impact of prepayments on the value of mortgage-backed securities may be difficult to predict and may result in greater volatility.
Note 11. Subsequent Events
Management has evaluated the events and transactions that have occurred through the date the financial statements were issued and noted no items requiring adjustment of the financial statements or additional disclosure.
Note 12. Information Regarding Pending and Settled Legal Proceedings
In December 2005, without admitting or denying the allegations, American Express Financial Corporation (AEFC, which is now known as Ameriprise Financial, Inc. (Ameriprise Financial)) entered into settlement agreements with the Securities and Exchange Commission (SEC) and Minnesota Department of Commerce (MDOC) related to market timing activities. As a result, AEFC was censured and ordered to cease and desist from committing or causing any violations of certain provisions of the Investment Advisers Act of 1940, the Investment Company Act of 1940, and various Minnesota laws. AEFC agreed to pay disgorgement of $10 million and civil money penalties of $7 million. AEFC also agreed to retain an independent distribution consultant to assist in developing a plan for distribution of all disgorgement and civil penalties ordered by the SEC in accordance with various undertakings detailed at www.sec.gov/litigation/admin/ia-2451.pdf. Ameriprise Financial and its affiliates have cooperated with the SEC and the MDOC in these legal proceedings, and have made regular reports to the funds' Boards of Trustees.
Ameriprise Financial and certain of its affiliates have historically been involved in a number of legal, arbitration and regulatory proceedings, including routine litigation, class actions, and governmental actions, concerning matters arising in connection with the conduct of their business activities. Ameriprise Financial believes that the Funds are not currently the subject of, and that neither Ameriprise Financial nor any of its affiliates are the subject of, any pending legal, arbitration or regulatory proceedings that are likely to have a material adverse effect on the Funds or the ability of Ameriprise Financial or its affiliates to perform under their contracts with the Funds. Ameriprise Financial is required to make 10-Q, 10-K and, as necessary, 8-K filings with the Securities and Exchange Commission on legal and regulatory matters that relate to Ameriprise Financial and its affiliates. Copies of these filings may be obtained by accessing the SEC website at www.sec.gov.
There can be no assurance that these matters, or the adverse publicity associated with them, will not result in increased fund redemptions, reduced sale of fund shares or other adverse consequences to the Funds. Further, although we believe proceedings are not likely to have a material adverse effect on the Funds or the ability of Ameriprise Financial or its affiliates to perform under their contracts with the Funds, these proceedings are subject to uncertainties and, as such, we are unable to estimate the possible loss or range of loss that may result. An adverse outcome in one or more of these proceedings could result in adverse judgments, settlements, fines, penalties or other relief that could have a material adverse effect on the consolidated financial condition or results of operations of Ameriprise Financial.
Annual Report 2012
30
CMG Ultra Short Term Bond Fund
Report of Independent Registered Public Accounting Firm
To the Trustees of Columbia Funds Series Trust I and
the Shareholders of CMG Ultra Short Term Bond Fund
In our opinion, the accompanying statement of assets and liabilities, including the portfolio of investments, and the related statements of operations and of changes in net assets and the financial highlights present fairly, in all material respects, the financial position of CMG Ultra Short Term Bond Fund (the "Fund") (a series of Columbia Funds Series Trust I) at July 31, 2012, the results of its operations for the year then ended, the changes in its net assets for each of the two years in the period then ended and the financial highlights for each of the periods indicated, in conformity with accounting principles generally accepted in the United States of America. These financial statements and financial highlights (hereafter referred to as "financial statements") are the responsibility of the Fund's management. Our responsibility is to express an opinion on these financial statements based on our audits. We conducted our audits of these financial statements in accordance with the standards of the Public Company Accounting Oversight Board (United States). Those standards require that we plan and perform the audit to obtain reasonable assurance about whether the financial statements are free of material misstatement. An audit includes examining, on a test basis, evidence supporting the amounts and disclosures in the financial statements, assessing the accounting principles used and significant estimates made by management, and evaluating the overall financial statement presentation. We believe that our audits, which included confirmation of securities at July 31, 2012 by correspondence with the custodian, brokers, agent banks and transfer agent, provide a reasonable basis for our opinion.
PricewaterhouseCoopers LLP
Minneapolis, Minnesota
September 21, 2012
Annual Report 2012
31
CMG Ultra Short Term Bond Fund
Trustees and Officers
The Trustees serve terms of indefinite duration. The names, addresses and birth years of the Trustees and Officers of the Funds in Columbia Funds Series Trust I, the year each was first elected or appointed to office, their principal business occupations during at least the last five years, the number of Funds overseen by each Trustee and other directorships they hold are shown below. Each officer listed below serves as an officer of each Fund in Columbia Funds Series Trust I.
Independent Trustees
Name, Address and Year of Birth,
Position with Funds, Year First
Elected or Appointed to Office | | Principal Occupation(s) During Past Five Years, Number of Funds in Columbia
Funds Complex Overseen by Trustee, Other Directorships Held
| |
Rodman L. Drake (Born 1943)
c/o Columbia Management Investment Advisers, LLC
225 Franklin Street
Boston, MA 02110
Trustee (since 1994) and
Chairman of the Board (since 2009) | | Independent consultant since 2010; Co-Founder of Baringo Capital LLC (private equity) from 1997 to 2008; CEO of Crystal River Capital, Inc. (real estate investment trust) from 2003 to 2010; Oversees 52; Jackson Hewitt Tax Service Inc. (tax preparation services from 2004 to 2011); Celgene Corporation (global biotechnology company); Student Loan Corporation (student loan provider from 2005 to 2010); Celgene Corporation (global biotechnology company); The Helios Funds and Brookfield Funds (closed-end funds); Crystal River Capital, Inc. from 2005 to 2010; Parsons Brinckerhoff from 1995 to 2008; and Apex Silver Mines Ltd. from 2007 to 2009 | |
|
Douglas A. Hacker (Born 1955)
c/o Columbia Management Investment Advisers, LLC
225 Franklin Street
Boston, MA 02110
Trustee (since 1996) | | Independent business executive since May 2006; Executive Vice President — Strategy of United Airlines from December 2002 to May 2006; President of UAL Loyalty Services (airline marketing company) from September 2001 to December 2002; Executive Vice President and Chief Financial Officer of United Airlines from July 1999 to September 2001. Oversees 52; Nash Finch Company (food distributor); Aircastle Limited (aircraft leasing); and SeaCube Container Leasing Ltd. (container leasing) | |
|
Janet Langford Kelly (Born 1957)
c/o Columbia Management Investment Advisers, LLC
225 Franklin Street
Boston, MA 02110
Trustee (since 1996) | | Senior Vice President, General Counsel and Corporate Secretary, ConocoPhillips (integrated energy company) since September 2007; Deputy General Counsel — Corporate Legal Services, ConocoPhillips from August 2006 to August 2007; Partner, Zelle, Hofmann, Voelbel, Mason & Gette LLP (law firm) from March 2005 to July 2006; Adjunct Professor of Law, Northwestern University from September 2004 to June 2006; Director, UAL Corporation (airline) from February 2006 to July 2006; Chief Administrative Officer and Senior Vice President, Kmart Holding Corporation (consumer goods) from September 2003 to March 2004. Oversees 52; None | |
|
Nancy T. Lukitsh (Born 1956)
c/o Columbia Management Investment Advisers, LLC
225 Franklin Street
Boston, MA 02110
Trustee (since 2011) | | Senior Vice President, Partner and Director of Marketing, Wellington Management Company, LLP (investment adviser) from 1997 to 2010; Chair, Wellington Management Investment Portfolios (commingled non-U.S. investment pools) from 2007 to 2010; Director, Wellington Trust Company, NA and other Wellington affiliates from 1997 to 2010. Oversees 52; None | |
|
William E. Mayer (Born 1940)
c/o Columbia Management Investment Advisers, LLC
225 Franklin Street
Boston, MA 02110
Trustee (since 1994) | | Partner, Park Avenue Equity Partners (private equity) since February 1999; Dean and Professor, College of Business and Management, University of Maryland from 1992 to 1996. Oversees 52; DynaVox Inc. (speech creation); Lee Enterprises (print media); WR Hambrecht + Co. (financial service provider) from 2000 to 2012; BlackRock Kelso Capital Corporation (investment company) | |
|
David M. Moffett (Born 1952)
c/o Columbia Management Investment Advisers, LLC
225 Franklin Street
Boston, MA 02110
Trustee (since 2011) | | Retired. Chief Executive Officer, Federal Home Loan Mortgage Corporation, from 2008 to 2009; Senior Adviser, Global Financial Services Group, Carlyle Group, Inc., from 2007 to 2008; Vice Chairman and Chief Financial Officer, U.S. Bancorp, from 1993 to 2007. Oversees 52; CIT Group Inc. (commercial and consumer finance); eBay Inc. (online trading community); MBIA Inc. (financial service provider); E.W. Scripps Co. (print and television media), Building Materials Holding Corp. (building materials and construction services); and University of Oklahoma Foundation. | |
|
Charles R. Nelson (Born 1942)
c/o Columbia Management Investment Advisers, LLC
225 Franklin Street
Boston, MA 02110
Trustee (since 1981) | | Retired Professor Emeritus, University of Washington, since 2011; Professor of Economics, University of Washington from January 1976 to 2011; Ford and Louisa Van Voorhis Professor of Political Economy, University of Washington from 1993 to 2011; Adjunct Professor of Statistics, University of Washington from 1980 to 2011; Associate Editor, Journal of Money Credit and Banking from 1993 to 2008; consultant on econometric and statistical matters. Oversees 52; None | |
|
John J. Neuhauser (Born 1943)
c/o Columbia Management Investment Advisers, LLC
225 Franklin Street
Boston, MA 02110
Trustee (since 1984) | | President, Saint Michael's College, since August 2007; Director or Trustee of several non-profit organizations, including Fletcher Allen Health Care, Inc.; University Professor, Boston College from November 2005 to August 2007; Academic Vice President and Dean of Faculties, Boston College from August 1999 to October 2005. Oversees 52; Liberty All-Star Equity Fund and Liberty All-Star Growth Fund (closed-end funds) | |
|
Annual Report 2012
32
CMG Ultra Short Term Bond Fund
Trustees and Officers (continued)
Independent Trustees (continued)
Name, Address and Year of Birth,
Position with Funds, Year First
Elected or Appointed to Office | | Principal Occupation(s) During Past Five Years, Number of Funds in Columbia
Funds Complex Overseen by Trustee, Other Directorships Held
| |
Patrick J. Simpson (Born 1944)
c/o Columbia Management Investment Advisers, LLC
225 Franklin Street
Boston, MA 02110
Trustee (since 2000) | | Partner, Perkins Coie LLP (law firm). Oversees 52; None | |
|
Anne-Lee Verville (Born 1945)
c/o Columbia Management Investment Advisers, LLC
225 Franklin Street
Boston, MA 02110
Trustee (since 1998) | | Retired. General Manager — Global Education Industry from 1994 to 1997, President — Application Systems Division from 1991 to 1994, Chief Financial Officer — US Marketing & Services from 1988 to 1991, and Chief Information Officer from 1987 to 1988, IBM Corporation (computer and technology). Oversees 52; Enesco Group, Inc. (producer of giftware and home and garden decor products) from 2001 to 2006 | |
|
The Statement of Additional Information includes additional information about the Trustees of the Funds and is available, without charge, upon request by calling 1-800-345-6611.
Interested Trustee
Name, Address and Year of Birth,
Position with Funds, Year First
Elected or Appointed to Office | | Principal Occupation(s) During Past Five Years, Number of Funds in Columbia
Funds Complex Overseen by Trustee, Other Directorships Held
| |
William F. Truscott (born 1960)
53600 Ameriprise Financial Center
Minneapolis, MN 55474
Senior Vice President (since 2012) | | Chairman of the Board and President, Columbia Management Investment Advisers, LLC since May 2010 and February 2012, respectively (previously President, Chairman of the Board and Chief Investment Officer, from 2001 to April 2010); Chief Executive Officer, U.S. Asset Management & President, Annuities, Ameriprise Financial, Inc. since May 2010 (previously President — U.S. Asset Management and Chief Investment Officer from 2005 to April 2010, and Senior Vice President — Chief Investment Officer, from 2001 to 2005); Director, President and Chief Executive Officer, Ameriprise Certificate Company since 2006; Director and Chief Executive Officer, Columbia Management Investment Distributors, Inc. since May 2010 and February 2012, respectively (previously Chairman of the Board and Chief Executive Officer from 2008 to April 2010); Chairman of the Board and Chief Executive Officer, RiverSource Distributors, Inc. since 2006. Oversees 208; Columbia Funds Board. | |
|
Officers
| Name, Year of Birth and Address | | Principal Occupation(s) During the Past Five Years | |
J. Kevin Connaughton (Born 1964)
225 Franklin Street
Boston, MA 02110
President (since 2009) | | Senior Vice President and General Manager — Mutual Fund Products, Columbia Management Investment Advisers, LLC since May 2010; President, Columbia Funds, since 2009, and RiverSource Funds, since May 2010 (previously Senior Vice President and Chief Financial Officer, Columbia Funds, from June 2008 to January 2009, Treasurer, Columbia Funds, from October 2003 to May 2008, and senior officer of various other affiliated funds since 2000); Managing Director, Columbia Management Advisors, LLC from December 2004 to April 2010. | |
|
Michael G. Clarke (Born 1969)
225 Franklin Street
Boston, MA 02110
Treasurer (since 2011) and Chief Financial Officer (since 2009) | | Vice President, Columbia Management Investment Advisers, LLC since May 2010; Managing Director of Fund Administration, Columbia Management Advisors, LLC, from September 2004 to April 2010; senior officer of Columbia Funds and affiliated funds since 2002. | |
|
Scott R. Plummer (Born 1959)
5228 Ameriprise Financial Center
Minneapolis, MN 55474
Senior Vice President, Assistant Secretary and Chief Legal Officer (since 2010) | | Senior Vice President, Chief Legal Officer and Assistant Secretary, Columbia Management Investment Advisers, LLC since June 2005; Vice President and Lead Chief Counsel — Asset Management, Ameriprise Financial, Inc. since May 2010 (previously Vice President and Chief Counsel — Asset Management, from 2005 to April 2010); Vice President, Chief Counsel and Assistant Secretary, Columbia Management Investment Distributors, Inc. since 2008; Vice President, General Counsel and Secretary, Ameriprise Certificate Company since 2005; Chief Counsel, RiverSource Distributors, Inc. since 2006; Vice President, General Counsel and Secretary, RiverSource Funds since December 2006; Senior Vice President, Secretary and Chief Legal Officer, Columbia Funds, since May 2010. | |
|
Annual Report 2012
33
CMG Ultra Short Term Bond Fund
Trustees and Officers (continued)
Officers (continued)
| Name, Year of Birth and Address | | Principal Occupation(s) During the Past Five Years | |
William F. Truscott (Born 1960)
53600 Ameriprise Financial Center
Minneapolis, MN 55474
Senior Vice President (since 2010) | | Chairman of the Board and President, Columbia Management Investment Advisers, LLC since May 2010 and February 2012, respectively (previously President, Chairman of the Board and Chief Investment Officer, from 2001 to April 2010); Chief Executive Officer, U.S. Asset Management & President, Annuities, Ameriprise Financial, Inc. since May 2010 (previously President — U.S. Asset Management and Chief Investment Officer from 2005 to April 2010); Director, President and Chief Executive Officer, Ameriprise Certificate Company since 2006; Director and Chief Executive Officer, Columbia Management Investment Distributors, Inc. since May 2010 and February 2012, respectively (previously Chairman of the Board and Chief Executive Officer from 2008 to April 2010); Chairman of the Board and Chief Executive Officer, RiverSource Distributors, Inc. since 2006. | |
|
Thomas P. McGuire (Born 1972)
225 Franklin Street
Boston, MA 02110
Chief Compliance Officer (since 2012) | | Vice President — Asset Management Compliance, Columbia Management Investment Advisers, LLC since 2010; Chief Compliance Officer, Ameriprise Certificate Company, since September 2010; Compliance Executive, Bank of America, 2005-2010. | |
|
Colin Moore (Born 1958)
225 Franklin Street
Boston, MA 02110
Senior Vice President (since 2010) | | Director and Chief Investment Officer, Columbia Management Investment Advisers, LLC since May 2010; Manager, Managing Director and Chief Investment Officer of Columbia Management Advisors, LLC from 2007 to April 2010; Head of Equities, Columbia Management Advisors, LLC from 2002 to 2007. | |
|
Amy Johnson (Born 1965)
5228 Ameriprise Financial Center
Minneapolis, MN 55474
Vice President (since 2010) | | Senior Vice President and Chief Operating Officer, Columbia Management Investment Advisers, LLC since May 2010 (previously Chief Administrative Officer, from 2009 until April 2010, Vice President — Asset Management and Trust Company Services, from 2006 to 2009, and Vice President — Operations and Compliance from 2004 to 2006). | |
|
Joseph F. DiMaria (Born 1968)
225 Franklin Street
Boston, MA 02110
Vice President (since 2011) and Chief Accounting Officer (since 2008) | | Vice President, Mutual Fund Administration, Columbia Management Investment Advisers, LLC, since May 2010; Director of Fund Administration, Columbia Management Advisors, LLC from January 2006 to April 2010; Head of Tax/Compliance and Assistant Treasurer, Columbia Management Advisors, LLC, from November 2004 to December 2005. | |
|
Stephen T. Welsh (born 1957)
225 Franklin Street
Boston, MA 02110
Vice President (since 2006) | | President and Director, Columbia Management Investment Services Corp. since May 2010; President and Director, Columbia Management Services, Inc. from July 2004 to April 2010; Managing Director, Columbia Management Distributors, Inc. from August 2007 to April 2010. | |
|
Paul D. Pearson (born 1956)
10468 Ameriprise Financial Center
Minneapolis, MN 55474
Vice President and Assistant Treasurer (since 2011) | | Vice President, Investment Accounting, Columbia Management Investment Advisers, LLC, since May 2010; Vice President, Managed Assets, Investment Accounting, Ameriprise Financial Corporation. | |
|
Paul B. Goucher (born 1968)
5228 Ameriprise Financial Center
Minneapolis, MN 55474
Vice President and Assistant Secretary (since 2010) | | Vice President and Chief Counsel of Ameriprise Financial since January 2010 (formerly Vice President and Group Counsel from November 2008 to January 2010); Director, Managing Director and General Counsel of J. & W. Seligman & Co. Incorporated (Seligman) from July 2008 to November 2008 and Managing Director and Associate General Counsel of Seligman from January 2005 to July 2008. | |
|
Christopher O. Petersen (born 1970)
5228 Ameriprise Financial Center
Minneapolis, MN 55474
Vice President (since 2010) and Secretary (since 2011) | | Vice President and Chief Counsel, Ameriprise Financial since January 2010 (formerly Vice President and Group Counsel or Counsel from April 2004 to January 2010); Assistant Secretary of RiverSource Funds since January 2007; officer of Columbia Funds and affiliated funds since 2007. | |
|
Michael E. DeFao (born 1968)
225 Franklin Street
Boston, MA 02110
Vice President and Assistant Secretary (since 2011) | | Vice President and Chief Counsel, Ameriprise Financial since May 2010; Associate General Counsel, Bank of America from June 2005 to April 2010. | |
|
Annual Report 2012
34
CMG Ultra Short Term Bond Fund
Board Consideration and Approval of
Advisory Agreement
At meetings held on March 7, 2012 and June 6, 2012, respectively, the Board of Trustees (the "Board") and the Trustees who are not interested persons (as defined in the Investment Company Act of 1940) of the Trust (the "Independent Trustees") unanimously approved the continuation of the Investment Management Services Agreement (the "Advisory Agreement") with Columbia Management Investment Advisers, LLC (the "Investment Manager") with respect to CMG Ultra Short Term Bond Fund (the "Fund"), a series of the Trust. As detailed below, the Advisory Fees and Expenses Committee (the "Committee") and the Board met on multiple occasions to review and discuss, both among themselves and with the management team of the Investment Manager, materials provided by the Investment Manager before determining to approve each continuation of the Advisory Agreement.
In connection with their deliberations regarding each continuation of the Advisory Agreement, the Committee and the Board requested and evaluated materials from the Investment Manager regarding the Fund and the Advisory Agreement, and discussed these materials with representatives of the Investment Manager at Committee meetings held on March 6, 2012, April 25, 2012 and June 5, 2012, and at the Board meetings held on March 7, 2012 and June 6, 2012. In addition, the Board considers matters bearing on the Advisory Agreement at most of its other meetings throughout the year and meets regularly with senior management of the Funds and the Investment Manager. Through the Board's Investment Oversight Committees, Trustees also meet with selected Fund portfolio managers and other investment personnel at various times throughout the year. The Committee and the Board also consulted with Fund counsel and with the Independent Trustees' independent legal counsel, who advised on the legal standard for consideration by the Board and otherwise assisted the Board in its deliberations.
On March 6, 2012, the Committee recommended that the Board approve the continuation of the Advisory Agreement. On March 7, 2012, the Board, including the Independent Trustees, voting separately, unanimously approved the continuation of the Advisory Agreement for the Fund. The Committee and the Board met in June 2012 to consider the continuation of the Advisory Agreement for the one-year period ending June 30, 2013, so as to permit the annual consideration of the Advisory Agreement to be conducted each June. On June 5, 2012, the Committee recommended that the Board approve the continuation of the Advisory Agreement. On June 6, 2012, the Board, including the Independent Trustees, voting separately, unanimously approved the continuation of the Advisory Agreement.
The Committee and the Board considered all information that they, their legal counsel, or the Investment Manager believed reasonably necessary to evaluate and to determine whether to approve the continuation of the Advisory Agreement. In their deliberations, the Trustees did not identify any particular information that was all-important or controlling, and individual Trustees may have attributed different weights to the various factors. The information and factors considered by the Committee and the Board in recommending for approval or approving the continuation of the Advisory Agreement for the Fund included the following:
• Information on the investment performance of the Fund relative to the performance of the Fund's benchmarks and the performance of a group of comparable mutual funds, as determined by an independent third-party data provider;
• Information on the Fund's advisory fees and total expenses, including information comparing the Fund's expenses to those of a group of comparable mutual funds, as determined by an independent third-party data provider;
• The Investment Manager's agreement to contractually limit or cap total operating expenses for the Fund so that total operating expenses (excluding certain fees and expenses, such as transaction costs and certain other investment related expenses, interest, taxes, acquired fund fees and expenses, and extraordinary expenses) would not exceed the median expenses of a group of comparable funds (as determined from time to time, generally annually, by an independent third-party data provider);
• The terms and conditions of the Advisory Agreement, including that the advisory fee rates payable by the Fund would not change;
• The terms and conditions of other agreements and arrangements with affiliates of the Investment Manager relating to the operations of the Fund, including the Administrative Services Agreement, the Distribution Agreement and the Transfer and Dividend Disbursing Agent Agreement, noting in the case of the Transfer and Dividend Disbursing Agent Agreement certain proposed changes to the fee rates payable thereunder;
• Descriptions of various functions performed by the Investment Manager under the Advisory Agreement, including portfolio management and portfolio trading practices;
Annual Report 2012
35
CMG Ultra Short Term Bond Fund
Board Consideration and Approval of
Advisory Agreement (continued)
• Information regarding the management fees and investment performance of any comparable portfolios of other clients of the Investment Manager, including institutional separate accounts; and
• The profitability to the Investment Manager and its affiliates from their relationships with the Fund.
Nature, Extent and Quality of Services to be Provided under the Advisory Agreement
The Committee and the Board considered the nature, extent and quality of services provided to the Fund by the Investment Manager and its affiliates under the Advisory Agreement and under separate agreements for the provision of transfer agency and administrative services, and the resources dedicated to the Fund and the other Columbia Funds by the Investment Manager and its affiliates. The Committee and the Board considered, among other things, the Investment Manager's ability to attract, motivate and retain highly qualified research, advisory and supervisory investment professionals (including personnel and other resources, compensation programs for personnel involved in fund management, reputation and other attributes), the portfolio management services provided by those investment professionals, the quality of the Investment Manager's investment research capabilities and trade execution services, and the other resources that the Investment Manager devotes to the Fund. The Committee and the Board also considered the potential benefits to shareholders of investing in a mutual fund that is part of a fund complex offering exposure to a variety of asset classes and investment disciplines and providing a variety of fund and shareholder services.
The Committee and the Board also considered the professional experience and qualifications of the senior personnel of the Investment Manager. The Committee and the Board noted the compliance programs of and the compliance-related resources provided to the Fund by the Investment Manager and its affiliates, and considered the Investment Manager's ability to provide administrative services to the Fund pursuant to a separate administrative services agreement, including the Investment Manager's ability to coordinate the activities of the Fund's other service providers. After reviewing these and related factors, the Committee and the Board concluded, within the context of their overall conclusions, that the expected nature, extent and quality of the services to be provided to the Fund under the Advisory Agreement supported the continuation of such agreement.
Investment Performance
The Committee and the Board reviewed information about the performance of the Fund over various time periods, including performance information relative to benchmarks and information based on reports of an independent third-party data provider that compared the performance of the Fund to the performance of a group of comparable mutual funds. The Committee and the Board also reviewed a description of the third party's methodology for identifying the Fund's peer groups for purposes of performance and expense comparisons. In the case of each Fund whose performance lagged that of a relevant peer group for certain (although not necessarily all) periods, the Committee and the Board concluded that other factors relevant to performance were sufficient, in light of other considerations, to warrant continuation of the Fund's Advisory Agreement. Those factors varied from fund to fund, but included one or more of the following: (i) that the Fund's performance, although lagging in certain recent periods, was stronger over the longer term; (ii) that the underperformance was attributable, to a significant extent, to investment decisions that were reasonable and consistent with the Fund's investment strategy and policies and that the Fund was performing within a reasonable range of expectations, given those investment decisions, market conditions and the Fund's investment strategy; (iii) that the Fund's performance was competitive when compared to other relevant performance benchmarks or peer groups; and (iv) that the Investment Manager had taken or was taking steps designed to help improve the Fund's investment performance, including, but not limited to, replacing portfolio managers, enhancing the resources supporting the portfolio managers, or modifying investment strategies.
The Committee and the Board noted that, through December 31, 2011, the Fund's performance was in the twenty- sixth, forty-fifth and sixty-ninth percentiles (where the best performance would be in the first percentile) of its category selected by an independent third-party data provider for the purposes of performance comparisons for the one-, three- and five- year periods, respectively.
The Committee and the Board also considered the Investment Manager's performance and reputation generally, the Investment Manager's historical responsiveness to Board concerns about performance and the Investment Manager's willingness to take steps intended to improve performance. After reviewing these and related factors, the Committee and the Board concluded, within the context of their overall conclusions regarding the Advisory Agreement, that the performance of
Annual Report 2012
36
CMG Ultra Short Term Bond Fund
Board Consideration and Approval of
Advisory Agreement (continued)
the Fund and the Investment Manager was sufficient, in light of other considerations, to warrant the continuation of the Advisory Agreement.
Investment Advisory Fee Rates and Other Expenses
The Committee and the Board considered the advisory fees to be charged to the Fund under the Advisory Agreement as well as the total expenses to be incurred by the Fund. In assessing the reasonableness of the fees under the Advisory Agreement, the Committee and the Board considered, among other information, the Fund's advisory fee and its expected total expense ratio as a percentage of average daily net assets. The Committee and the Board noted that the Fund's actual management fee and total net expense ratio are ranked in the second and first quintiles, respectively, against the Fund's expense universe as determined by an independent third-party data provider for purposes of expense comparison. The Committee and the Board also took into account the fee waiver and expense limitation arrangements agreed to by the Investment Manager, as noted above.
The Committee and the Board also considered the fact that the advisory fee rates payable by the Fund to the Investment Manager under the Advisory Agreement were the same as those currently paid by the Fund to the Investment Manager.
The Committee and the Board also received and considered information about the advisory fees charged by the Investment Manager to institutional separate accounts. In considering the fees charged to those accounts, the Committee and the Board took into account, among other things, the Investment Manager's representations about the differences between managing mutual funds as compared to other types of accounts, including differences in the services provided, differences in the risk profile of such business for the Investment Manager and the additional resources required to manage mutual funds effectively. In evaluating the Fund's advisory fees, the Committee and the Board also took into account the demands, complexity and quality of the investment management of the Fund.
After reviewing these and related factors, the Committee and the Board concluded, within the context of their overall conclusions, that the advisory fee rates and expenses of the Fund supported the continuation of the Advisory Agreement.
Costs of Services to be Provided and Profitability
The Committee and the Board also took note of the costs of the services provided (both on an absolute and relative basis) and the profitability to the Investment Manager and its affiliates in connection with their relationships with the Fund. In evaluating these considerations, the Committee and the Board took note of the advisory fees charged by the Investment Manager to other clients, including fees charged by the Investment Manager to any institutional separate account clients with similar investment strategies to those of the Fund.
The Committee and the Board also considered the compensation directly or indirectly received by the Investment Manager's affiliates in connection with their relationships with the Fund. The Committee and the Board reviewed information provided by management as to the profitability of the Investment Manager and its affiliates of their relationships with the Fund, and information about the allocation of expenses used to calculate profitability. When reviewing profitability, the Committee and the Board also considered court cases in which adviser profitability was an issue in whole or in part, the performance of the fund, the expense ratio of the fund, and the implementation of expense limitations with respect to the fund. The Committee and the Board also considered information provided by the Investment Manager regarding its financial condition and comparing its profitability to that of other asset management firms that are, or are subsidiaries of, publicly traded companies.
After reviewing these and related factors, the Committee and the Board concluded, within the context of their overall conclusions, that the profitability to the Investment Manager and its affiliates from their relationships with the Fund supported the continuation of the Advisory Agreement.
Economies of Scale
The Committee and the Board considered the potential existence of economies of scale in the provision by the Investment Manager of services to the Fund, to groups of related funds, and to the Investment Manager's investment advisory clients as a whole, and whether those economies of scale were shared with the Fund through breakpoints in investment advisory fees or other means, such as expense limitation arrangements and additional investments by the Investment Manager in investment, trading and compliance resources. The Committee and the Board noted that the investment advisory fee schedules for the Fund contained breakpoints that would reduce the fee rate on assets above specified threshold levels.
Annual Report 2012
37
CMG Ultra Short Term Bond Fund
Board Consideration and Approval of
Advisory Agreement (continued)
In considering these issues, the Committee and the Board also considered the costs of the services provided (both on an absolute and relative basis) and the profitability to the Investment Manager and its affiliates from their relationships with the Fund, as discussed above. After reviewing these and related factors, the Committee and the Board concluded, within the context of their overall conclusions, that the extent to which economies of scale were expected to be shared with the Fund supported the continuation of the Advisory Agreement.
Other Benefits to the Investment Manager
The Committee and the Board received and considered information regarding "fall-out" or ancillary benefits received by the Investment Manager and its affiliates as a result of their relationships with the Fund, such as the engagement of the Investment Manager to provide administrative services to the Fund and the engagement of the Investment Manager's affiliates to provide distribution and transfer agency services to the Fund. The Committee and the Board considered that the Fund's distributor retains a portion of the distribution fees from the Fund and receives a portion of the sales charges on sales or redemptions of certain classes of shares of the Fund. The Committee and the Board also considered the benefits of research made available to the Investment Manager by reason of brokerage commissions generated by the Fund's securities transactions, and reviewed information about the Investment Manager's practices with respect to allocating portfolio brokerage for brokerage and research services. The Committee and the Board considered the possible conflicts of interest associated with certain fall-out or other ancillary benefits and the reporting, disclosure and other processes that would be in place to address such possible conflicts of interest. The Committee and the Board recognized that the Investment Manager's profitability would be somewhat lower without these benefits.
Conclusion
The Committee and the Board reviewed all of the above considerations in reaching their decisions to recommend or approve the continuation of the Advisory Agreement. No single item was identified as paramount or controlling, and individual Trustees may have attributed different weights to various factors. Based on their evaluation of all factors that they deemed to be material, including those factors described above, and assisted by the advice of independent legal counsel, the Board, including the Independent Trustees, voting separately, unanimously approved the continuation of the Advisory Agreement.
Annual Report 2012
38
This page intentionally left blank.
Annual Report 2012
39
This page intentionally left blank.
Annual Report 2012
40
CMG Ultra Short Term Bond Fund
Important Information About This Report
Each fund mails one shareholder report to each shareholder address. If you would like more than one report, please call shareholder services at 800.345.6611 and additional reports will be sent to you.
The policy of the Board is to vote the proxies of the companies in which each fund holds investments consistent with the procedures as stated in the Statement of Additional Information (SAI). You may obtain a copy of the SAI without charge by calling 800.345.6611; contacting your financial intermediary; visiting columbiamanagement.com; or searching the website of the Securities and Exchange Commission (SEC) at sec.gov. Information regarding how each fund voted proxies relating to portfolio securities is filed with the SEC by August 31 for the most recent 12-month period ending June 30 of that year, and is available without charge by visiting columbiamanagement.com; or searching the website of the SEC at sec.gov.
Each fund files a complete schedule of portfolio holdings with the SEC for the first and third quarters of each fiscal year on Form N-Q. Each fund's Form N-Q is available on the SEC's website at sec.gov and may be reviewed and copied at the SEC's Public Reference Room in Washington, D.C. Information on the operation of the Public Reference Room may be obtained by calling 800.SEC.0330. Each fund's complete schedule of portfolio holdings, as filed on Form N-Q, can also be obtained without charge, upon request, by calling 800.345.6611.
Annual Report 2012
41

CMG Ultra Short Term Bond Fund
P.O. Box 8081
Boston, MA 02266-8081
columbiamanagement.com
This information is for use with concurrent or prior delivery of a fund prospectus. Please read and consider the investment objectives, risks, charges and expenses for any fund carefully before investing. For a prospectus which contains this and other important information about the Fund go to columbiamanagement.com. The Fund is distributed by Columbia Management Investment Distributors, Inc., member FINRA, and managed by Columbia Management Investment Advisers, LLC.
© 2012 Columbia Management Investment Advisers, LLC. All rights reserved.
C-1366 D (9/12)
Annual Report
July 31, 2012

Columbia Large Cap Growth Fund
Not FDIC insured • No bank guarantee • May lose value
Columbia Large Cap Growth Fund
President's Message
 Dear Shareholders,
On the heels of solid gains for stocks during the first quarter, U.S. stock market averages fell in the second quarter as uncertainty mounted regarding the fate of the eurozone and other real concerns. On the last day of the quarter, an announcement that European leaders had agreed to relieve short-term funding pressure on Italy and Spain and to back a plan heading toward a banking union raised hopes that a longer term solution was achievable. The announcement lifted stocks around the world. However, it was a losing quarter for most stock markets as economic data disappointed in the United States and growth in Europe and emerging markets slowed. China, which has been a key driver of worldwide growth over the past decade, has experienced a significant slowdown, and its declining demand for raw materials has had a chilling effect on world commodity markets.
Against a backdrop of rising uncertainty and a declining stock market, bond investors turned cautious. U.S. Treasuries were the quarter's strongest performers. Total returns on long-dated Treasuries surged late last year, sank from mid-December to mid-March then soared through the end of the quarter. By contrast, European sovereign bonds lost value as interest rates rose and concerns about the eurozone's fiscal health mounted.
Despite these continued challenges, we see pockets of strength — and as a result, attractive opportunities — both here and abroad for 2012. We hope to help you capitalize on these opportunities with various articles in our 2012 Perspectives, which is available via the Market Insights tab at columbiamanagement.com. This publication showcases the strong research capabilities and experienced investment teams of Columbia Management and offers a diverse array of investment ideas based on our five key themes for 2012.
Other information and resources available at columbiamanagement.com include:
> detailed up-to-date fund performance and portfolio information
> economic analysis and market commentary
> quarterly fund commentaries
> Columbia Management Investor, our award-winning quarterly newsletter for shareholders
Thank you for your continued support of the Columbia Funds. We look forward to serving your investment needs for many years to come.
Best Regards,

J. Kevin Connaughton
President, Columbia Funds
Investors should consider the investment objectives, risks, charges and expenses of a mutual fund carefully before investing. For a free prospectus, which contains this and other important information about the funds, visit columbiamanagement.com. The prospectus should be read carefully before investing.
Columbia Funds are distributed by Columbia Management Investment Distributors, Inc., member FINRA, and managed by Columbia Management Investment Advisers, LLC.
© 2012 Columbia Management Investment Advisers, LLC. All rights reserved.
Annual Report 2012
Columbia Large Cap Growth Fund
Table of Contents
| Performance Overview | | | 2 | | |
|
| Manager Discussion of Fund Performance | | | 4 | | |
|
| Understanding Your Fund's Expenses | | | 6 | | |
|
| Portfolio of Investments | | | 7 | | |
|
| Statement of Assets and Liabilities | | | 14 | | |
|
| Statement of Operations | | | 16 | | |
|
| Statement of Changes in Net Assets | | | 18 | | |
|
| Financial Highlights | | | 21 | | |
|
| Notes to Financial Statements | | | 34 | | |
|
Report of Independent Registered
Public Accounting Firm | | | 44 | | |
|
| Federal Income Tax Information | | | 45 | | |
|
| Trustees and Officers | | | 46 | | |
|
| Board Consideration and Approval of Advisory Agreement | | | 49 | | |
|
| Important Information About This Report | | | 53 | | |
|
Fund Investment Manager
Columbia Management Investment
Advisers, LLC
225 Franklin Street
Boston, MA 02110
Fund Distributor
Columbia Management Investment
Distributors, Inc.
225 Franklin Street
Boston, MA 02110
Fund Transfer Agent
Columbia Management Investment
Services Corp.
P.O. Box 8081
Boston, MA 02266-8081
For more information about any of the funds, please visit columbiamanagement.com or call 800.345.6611. Customer Service Representatives are available to answer your questions Monday through Friday from 8 a.m. to 8 p.m. Eastern time.
The views expressed in this report reflect the current views of the respective parties. These views are not guarantees of future performance and involve certain risks, uncertainties and assumptions that are difficult to predict, so actual outcomes and results may differ significantly from the views expressed. These views are subject to change at any time based upon economic, market or other conditions and the respective parties disclaim any responsibility to update such views. These views may not be relied on as investment advice and, because investment decisions for a Columbia Fund are based on numerous factors, may not be relied on as an indication of trading intent on behalf of any particular Columbia Fund. References to specific securities should not be construed as a recommendation or investment advice.
Annual Report 2012
Columbia Large Cap Growth Fund
Performance Overview
Performance Summary
> Columbia Large Cap Growth Fund (the Fund) Class A shares returned 23.22% (excluding sales charges) for the 10-month period that ended July 31, 2012.
> The Fund slightly underperformed its benchmark, the Russell 1000 Growth Index, which returned 23.38% for the 10-month period.
> Security selection generally drove results versus the index: it helped in the consumer discretionary and industrials sectors and modestly detracted in the energy and financials sectors.
Average Annual Total Returns (%) (for period ended July 31, 2012)
| | | Inception | | 10 Months
cumulative | | 1 Year | | 5 Years | | 10 Years | |
| Class A | | 11/01/98 | | | | | | | | | | | | | | | | | |
| Excluding sales charges | | | | | | | 23.22 | | | | 5.42 | | | | 2.19 | | | | 5.49 | | |
| Including sales charges | | | | | | | 16.15 | | | | -0.66 | | | | 0.98 | | | | 4.87 | | |
| Class B | | 11/01/98 | | | | | | | | | | | | | | | | | |
| Excluding sales charges | | | | | | | 22.48 | | | | 4.62 | | | | 1.42 | | | | 4.70 | | |
| Including sales charges | | | | | | | 17.48 | | | | -0.38 | | | | 1.04 | | | | 4.70 | | |
| Class C* | | 11/18/02 | | | | | | | | | | | | | | | | | |
| Excluding sales charges | | | | | | | 22.46 | | | | 4.66 | | | | 1.43 | | | | 4.70 | | |
| Including sales charges | | | | | | | 21.46 | | | | 3.66 | | | | 1.43 | | | | 4.70 | | |
| Class E* | | 09/22/06 | | | | | | | | | | | | | | | | | |
| Excluding sales charges | | | | | | | 23.13 | | | | 5.39 | | | | 2.08 | | | | 5.39 | | |
| Including sales charges | | | | | | | 17.58 | | | | 0.63 | | | | 1.15 | | | | 4.91 | | |
| Class F* | | 09/22/06 | | | | | | | | | | | | | | | | | |
| Excluding sales charges | | | | | | | 22.48 | | | | 4.67 | | | | 1.43 | | | | 4.70 | | |
| Including sales charges | | | | | | | 17.48 | | | | -0.33 | | | | 1.05 | | | | 4.70 | | |
| Class I* | | 09/27/10 | | | 23.71 | | | | 5.96 | | | | 2.53 | | | | 5.80 | | |
| Class R* | | 09/27/10 | | | 22.95 | | | | 5.13 | | | | 1.90 | | | | 5.18 | | |
| Class R4* | | 03/07/11 | | | 23.38 | | | | 5.65 | | | | 2.34 | | | | 5.64 | | |
| Class R5* | | 03/07/11 | | | 23.70 | | | | 5.94 | | | | 2.50 | | | | 5.78 | | |
| Class T | | 12/14/90 | | | | | | | | | | | | | | | | | |
| Excluding sales charges | | | | | | | 23.20 | | | | 5.42 | | | | 2.14 | | | | 5.42 | | |
| Including sales charges | | | | | | | 16.13 | | | | -0.66 | | | | 0.93 | | | | 4.79 | | |
| Class W* | | 09/27/10 | | | 23.19 | | | | 5.44 | | | | 2.23 | | | | 5.54 | | |
| Class Y* | | 07/15/09 | | | 23.72 | | | | 5.96 | | | | 2.56 | | | | 5.81 | | |
| Class Z | | 12/14/90 | | | 23.52 | | | | 5.73 | | | | 2.45 | | | | 5.75 | | |
| Russell 1000 Growth Index | | | | | | | 23.38 | | | | 8.26 | | | | 3.46 | | | | 6.77 | | |
Returns for Class A and Class T are shown with and without the maximum initial sales charge of 5.75%. Returns for Class E are shown with and without the maximum initial sales charge of 4.50%. Returns for Class B and Class F are shown with and without the applicable contingent deferred sales charge (CDSC) of 5.00% in the first year, declining to 1.00% in the sixth year and eliminated thereafter. Returns for Class C are shown with and without the 1.00% CDSC for the first year only. The Fund's other classes are not subject to sales charges and have limited eligibility. Please see the Fund's prospectuses for details. Performance for different share classes will vary based on differences in sales charges and fees associated with each class. All results shown assume reinvestment of distributions during the period. Returns do not reflect the deduction of taxes that a shareholder may pay on Fund distributions or on the redemption of Fund shares. Performance results reflect the effect of any fee waivers or reimbursements of Fund expenses by Columbia Management Investment Advisers, LLC and/or any of its affiliates. Absent these fee waivers or expense reimbursement arrangements, performance results would have been lower.
The performance information shown represents past performance and is not a guarantee of future results. The investment return and principal value of your investment will fluctuate so that your shares, when redeemed, may be worth more or less than their original cost. Current performance may be lower or higher than the performance information shown. You may obtain performance information current to the most recent month-end by contacting your financial intermediary, visiting columbiamanagement.com or calling 800.345.6611.
*The returns shown for periods prior to the share class inception date (including returns since inception if shown, which are since Fund inception) include the returns of the Fund's oldest share class. Since the Fund launched more than one share class at its inception, Class Z shares were used. These returns are adjusted to reflect any higher class-related operating expenses of the newer share classes, as applicable. Please visit columbiamanagement.com/mutual-funds/appended-performance for more information.
The Russell 1000 Growth Index, an unmanaged index, measures the performance of those Russell 1000 Index companies with higher price-to-book ratios and higher forecasted growth values.
Indices are not available for investment, are not professionally managed and do not reflect sales charges, fees, brokerage commissions, taxes or other expenses of investing. Securities in the Fund may not match those in an index.
Annual Report 2012
2
Columbia Large Cap Growth Fund
Performance Overview (continued)
Performance of a Hypothetical $10,000 Investment (August 1, 2002 – July 31, 2012)
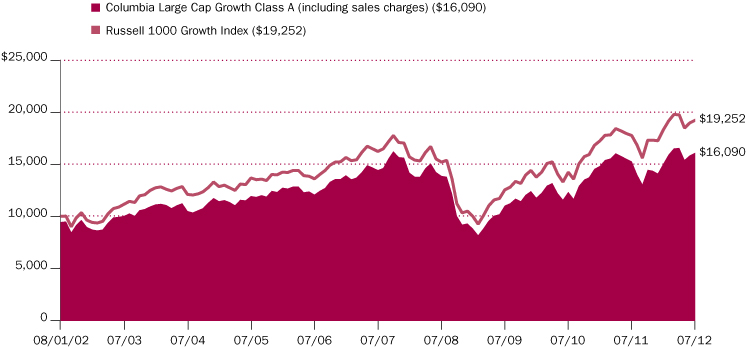
The chart above shows the change in value of a hypothetical $10,000 investment in Class A shares of Columbia Large Cap Growth Fund during the stated time period, and does not reflect the deduction of taxes that a shareholder may pay on Fund distributions or on the redemption of Fund shares.
Annual Report 2012
3
Columbia Large Cap Growth Fund
Manager Discussion of Fund Performance
The Board of Trustees for Columbia Large Cap Growth Fund has approved the change of the Fund's fiscal year end from September 30 to July 31. As a result, this report covers the 10-month period since the last annual report. The next report you receive will be for the six-month period from August 1, 2012 through January 31, 2013.
For the 10-month period that ended July 31, 2012, the Fund's Class A shares returned 23.22% without sales charge. The Fund slightly underperformed its benchmark, the Russell 1000 Growth Index, which returned 23.38% over the same period. Security selection helped relative performance, particularly in the consumer discretionary and industrials sectors. Stock picks in energy and financials modestly underperformed.
Strong market advance despite economic uncertainty
Europe's debt problems and an uncertain outlook for the global economy dominated world headlines over the past year. The pace of U.S. economic growth slowed to 2.0% in the first quarter of 2012, as measured by gross domestic product, and the preliminary estimate of second quarter growth was just 1.5%. Job growth was strong early in 2012, then disappointed in the spring. A July rebound in the number of new jobs added to the U.S. labor market raised hopes that the second half would be stronger than the first. However, manufacturing activity — the one consistent bright spot throughout this recovery — slipped in June and July. The housing market showed a glimmer of improvement, as year-over-year sales improved, inventories tightened and prices stabilized somewhat.
Against this backdrop, the U.S. stock market began the period on the upswing. Larger-cap, more defensive stocks led the rally, which broadened into 2012 on improved corporate earnings, a better housing market and growing investor confidence. Volatility increased in the spring as worries over the sovereign debt problems in Europe resurfaced. Stock prices fell sharply in the second quarter of 2012 before regaining ground in June and July.
Positive contributions from consumer discretionary and industrials
Within consumer discretionary, the Fund benefited the most from security selection in the internet and catalog retail segment and in media. Individual contributors included online travel site Expedia, whose shares climbed sharply as the growth of online booking helped boost sales and earnings. Shares of online auction site eBay rallied, thanks to solid revenue and earnings growth as well as increased investor appreciation for the value of its PayPal payment processing business. Cable provider Comcast was another standout, benefiting as its strong cash flow attracted investors. Industrial stock picks also helped, led by an investment in North American trucking and transportation logistics company JB Hunt Transport, whose shares rose, thanks to double-digit earnings growth, a dividend increase and improved trucking volumes. Consumer staples further aided results, led by an investment in low-cost retailing giant Wal-Mart Stores. Its stock benefited from an investor flight to safety, management's strong execution and the hunt by consumers for bargains. Elsewhere, an underweight in technology leader IBM contributed, as the stock's return lagged that of the index.
Portfolio Management
John T. Wilson, CFA
Peter R. Deininger, CFA, CAIA
Morningstar Style BoxTM

The Morningstar Style BoxTM is based on the fund's portfolio holdings. For equity funds, the vertical axis shows the market capitalization of the stocks owned, and the horizontal axis shows investment style (value, blend, or growth). Information shown is based on the most recent data provided by Morningstar.
©2012 Morningstar, Inc. All rights reserved. The Morningstar information contained herein: (1) is proprietary to Morningstar and/or its content providers; (2) may not be copied or distributed; and (3) is not warranted to be accurate, complete or timely. Neither Morningstar nor its content providers are responsible for any damages or losses arising from any use of this information.
Annual Report 2012
4
Columbia Large Cap Growth Fund
Manager Discussion of Fund Performance (continued)
Disappointments in energy and financial services
Energy stock picks detracted from results, with disappointing performance from oil-related exploration and production company Anadarko Petroleum and energy service provider Halliburton. The Fund's investment in Anadarko was hurt by declining oil prices and a pending lawsuit. Halliburton's shares also were pressured by low energy prices. In financial services, an underweight in real estate investment trusts (REITs) hampered results, as their attractive dividends helped fuel strong share price gains. Elsewhere, individual detractors included technology leader Oracle and Israeli software security firm Check Point Software. The Fund had an overweight in Oracle when disappointing software license growth, weaker-than-expected hardware sales and slowing revenue growth pressured the stock. We sold the position. Check Point's shares pulled back as revenue growth moderated and competition increased. In consumer discretionary, investments in online retailer Amazon.com and casino and gaming company Las Vegas Sands hurt relative performance. Amazon's return lagged that of the benchmark as the company reinvested in new fulfillment centers, while Las Vegas Sands' shares were hurt late in the period by slowing visitation at one of its key properties in Macau.
Looking ahead
Going forward, we currently expect uncertainty to weigh on the market's returns. Europe's sovereign debt problems remain unresolved, global economic growth remains slow and the United States faces the challenge of expiring tax breaks and mandated cost cuts at the end of the year. In this environment, we plan to manage risk while seeking to identify future market leaders among high quality companies whose stocks represent good value. During the 10-month period covered by this report, we reduced the Fund's total holdings to 80 from approximately 100 and increased exposure to stocks in which we have the highest conviction. At the end of the period, the Fund was positioned slightly more defensively than it was at the beginning of the period, with a larger stake in mega-cap names with track records of stable earnings growth. We maintained an overweight in health care and underweight in consumer staples, keeping other sector allocations in line with those in the index.
Top Ten Holdings (%)
(at July 31, 2012) | |
| Apple, Inc. | | | 7.4 | | |
| Google, Inc., Class A | | | 3.7 | | |
| QUALCOMM, Inc. | | | 3.2 | | |
| Wal-Mart Stores, Inc. | | | 2.9 | | |
| EMC Corp. | | | 2.6 | | |
| eBay, Inc. | | | 2.6 | | |
| Johnson & Johnson | | | 2.5 | | |
| Amazon.com, Inc. | | | 2.3 | | |
| Watson Pharmaceuticals, Inc. | | | 1.9 | | |
| Biogen Idec, Inc. | | | 1.9 | | |
Percentages indicated are based upon total investments (excluding Money Market Funds and Investments of Cash Collateral Received for Securities on Loan).
For further detail about these holdings, please refer to the section entitled "Portfolio of Investments."
Fund holdings are as of the date given, are subject to change at any time, and are not recommendations to buy or sell any security.
Portfolio Breakdown (%)
(at July 31, 2012) | |
| Common Stocks | | | 96.8 | | |
| Consumer Discretionary | | | 15.0 | | |
| Consumer Staples | | | 10.2 | | |
| Energy | | | 5.1 | | |
| Financials | | | 4.7 | | |
| Health Care | | | 15.8 | | |
| Industrials | | | 8.2 | | |
| Information Technology | | | 31.7 | | |
| Materials | | | 4.6 | | |
| Telecommunication Services | | | 1.5 | | |
| Convertible Preferred Stocks | | | 1.4 | | |
| Industrials | | | 1.4 | | |
| Other(a) | | | 1.8 | | |
Percentages indicated are based upon total investments (excluding Investments of Cash Collateral Received for Securities on Loan). The Fund's portfolio composition is subject to change.
(a) Includes investments in Money Market Funds.
Annual Report 2012
5
Columbia Large Cap Growth Fund
Understanding Your Fund's Expenses
(Unaudited)
As an investor, you incur two types of costs. There are transaction costs, which generally include sales charges on purchases and may include redemption fees. There are also ongoing costs, which generally include management fees, distribution and service (Rule 12b-1) fees, and other fund expenses. The following information is intended to help you understand your ongoing costs (in dollars) of investing in the Fund and to help you compare these costs with the ongoing costs of investing in other mutual funds.
Analyzing Your Fund's Expenses
To illustrate these ongoing costs, we have provided examples and calculated the expenses paid by investors in each share class of the Fund during the period. The actual and hypothetical information in the table is based on an initial investment of $1,000 at the beginning of the period indicated and held for the entire period. Expense information is calculated two ways and each method provides you with different information. The amount listed in the "Actual" column is calculated using the Fund's actual operating expenses and total return for the period. You may use the Actual information, together with the amount invested, to estimate the expenses that you paid over the period. Simply divide your account value by $1,000 (for example, an $8,600 account value divided by $1,000 = 8.6), then multiply the results by the expenses paid during the period under the Actual column. The amount listed in the "Hypothetical" column assumes a 5% annual rate of return before expenses (which is not the Fund's actual return) and then applies the Fund's actual expense ratio for the period to the hypothetical return. You should not use the hypothetical account values and expenses to estimate either your actual account balance at the end of the period or the expenses you paid during the period. See "Compare With Other Funds" below for details on how to use the hypothetical data.
Compare With Other Funds
Since all mutual funds are required to include the same hypothetical calculations about expenses in shareholder reports, you can use this information to compare the ongoing cost of investing in the Fund with other funds. To do so, compare the hypothetical example with the 5% hypothetical examples that appear in the shareholder reports of other funds. As you compare hypothetical examples of other funds, it is important to note that hypothetical examples are meant to highlight the ongoing costs of investing in a fund only and do not reflect any transaction costs, such as sales charges, or redemption or exchange fees. Therefore, the hypothetical calculations are useful in comparing ongoing costs only, and will not help you determine the relative total costs of owning different funds. If transaction costs were included in these calculations, your costs would be higher.
February 1, 2012 – July 31, 2012
| | | Account Value at the Beginning
of the Period ($) | | Account Value at the End of the
Period ($) | | Expenses Paid During the
Period ($) | | Fund's Annualized
Expense Ratio (%) | |
| | | Actual | | Hypothetical | | Actual | | Hypothetical | | Actual | | Hypothetical | | Actual | |
| Class A | | | 1,000.00 | | | | 1,000.00 | | | | 1,071.90 | | | | 1,019.00 | | | | 6.08 | | | | 5.92 | | | | 1.18 | | |
| Class B | | | 1,000.00 | | | | 1,000.00 | | | | 1,068.30 | | | | 1,015.42 | | | | 9.77 | | | | 9.52 | | | | 1.90 | | |
| Class C | | | 1,000.00 | | | | 1,000.00 | | | | 1,068.70 | | | | 1,015.37 | | | | 9.82 | | | | 9.57 | | | | 1.91 | | |
| Class E | | | 1,000.00 | | | | 1,000.00 | | | | 1,072.00 | | | | 1,018.80 | | | | 6.29 | | | | 6.12 | | | | 1.22 | | |
| Class F | | | 1,000.00 | | | | 1,000.00 | | | | 1,068.70 | | | | 1,015.56 | | | | 9.62 | | | | 9.37 | | | | 1.87 | | |
| Class I | | | 1,000.00 | | | | 1,000.00 | | | | 1,074.80 | | | | 1,021.28 | | | | 3.71 | | | | 3.62 | | | | 0.72 | | |
| Class R | | | 1,000.00 | | | | 1,000.00 | | | | 1,070.70 | | | | 1,017.70 | | | | 7.41 | | | | 7.22 | | | | 1.44 | | |
| Class R4 | | | 1,000.00 | | | | 1,000.00 | | | | 1,072.80 | | | | 1,019.99 | | | | 5.05 | | | | 4.92 | | | | 0.98 | | |
| Class R5 | | | 1,000.00 | | | | 1,000.00 | | | | 1,074.40 | | | | 1,021.23 | | | | 3.77 | | | | 3.67 | | | | 0.73 | | |
| Class T | | | 1,000.00 | | | | 1,000.00 | | | | 1,072.40 | | | | 1,019.05 | | | | 6.03 | | | | 5.87 | | | | 1.17 | | |
| Class W | | | 1,000.00 | | | | 1,000.00 | | | | 1,071.80 | | | | 1,018.80 | | | | 6.28 | | | | 6.12 | | | | 1.22 | | |
| Class Y | | | 1,000.00 | | | | 1,000.00 | | | | 1,074.80 | | | | 1,021.38 | | | | 3.61 | | | | 3.52 | | | | 0.70 | | |
| Class Z | | | 1,000.00 | | | | 1,000.00 | | | | 1,074.00 | | | | 1,020.59 | | | | 4.43 | | | | 4.32 | | | | 0.86 | | |
Expenses paid during the period are equal to the annualized expense ratio for each class as indicated above, multiplied by the average account value over the period and then multiplied by the number of days in the Fund's most recent fiscal half year and divided by 366.
Expenses do not include fees and expenses incurred indirectly by the Fund from the underlying funds in which the Fund may invest (also referred to as "acquired funds"), including affiliated and non-affiliated pooled investment vehicles (including mutual funds and exchange traded funds).
Annual Report 2012
6
Columbia Large Cap Growth Fund
Portfolio of Investments
July 31, 2012
(Percentages represent value of investments compared to net assets)
Common Stocks 96.4%
| Issuer | | Shares | | Value ($) | |
| Consumer Discretionary 15.0% | |
| Distributors 0.6% | |
| LKQ Corp.(a) | | | 436,600 | | | | 15,425,078 | | |
| Hotels, Restaurants & Leisure 2.6% | |
| Las Vegas Sands Corp. | | | 789,800 | | | | 28,764,516 | | |
| Starbucks Corp.(b) | | | 607,200 | | | | 27,494,016 | | |
| Yum! Brands, Inc.(b) | | | 149,500 | | | | 9,693,580 | | |
| Total | | | | | 65,952,112 | | |
| Internet & Catalog Retail 3.1% | |
| Amazon.com, Inc.(a) | | | 237,285 | | | | 55,358,590 | | |
| Expedia, Inc.(b) | | | 387,400 | | | | 22,077,926 | | |
| Total | | | | | 77,436,516 | | |
| Media 4.6% | |
| Comcast Corp., Class A(b) | | | 1,180,000 | | | | 38,409,000 | | |
Discovery Communications, Inc.,
Class A(a)(b) | | | 366,200 | | | | 18,540,706 | | |
| DISH Network Corp., Class A | | | 973,300 | | | | 29,938,708 | | |
| News Corp., Class A | | | 1,210,200 | | | | 27,858,804 | | |
| Total | | | | | 114,747,218 | | |
| Multiline Retail 1.4% | |
| Macy's, Inc. | | | 951,000 | | | | 34,083,840 | | |
| Specialty Retail 2.7% | |
| Home Depot, Inc. (The)(b) | | | 815,800 | | | | 42,568,444 | | |
| TJX Companies, Inc. | | | 582,800 | | | | 25,806,384 | | |
| Total | | | | | 68,374,828 | | |
| Total Consumer Discretionary | | | | | 376,019,592 | | |
| Consumer Staples 10.2% | |
| Beverages 1.5% | |
| Anheuser-Busch InBev NV, ADR | | | 469,500 | | | | 37,193,790 | | |
| Food & Staples Retailing 4.6% | |
| CVS Caremark Corp. | | | 949,300 | | | | 42,955,825 | | |
| Wal-Mart Stores, Inc.(b) | | | 963,300 | | | | 71,698,419 | | |
| Total | | | | | 114,654,244 | | |
| Food Products 2.0% | |
| Hershey Co. (The) | | | 352,400 | | | | 25,281,176 | | |
| Kraft Foods, Inc., Class A | | | 628,900 | | | | 24,973,619 | | |
| Total | | | | | 50,254,795 | | |
| Tobacco 2.1% | |
| Lorillard, Inc.(b) | | | 104,300 | | | | 13,417,152 | | |
Common Stocks (continued)
| Issuer | | Shares | | Value ($) | |
| Philip Morris International, Inc. | | | 438,905 | | | | 40,133,473 | | |
| Total | | | | | 53,550,625 | | |
| Total Consumer Staples | | | | | 255,653,454 | | |
| Energy 5.1% | |
| Energy Equipment & Services 1.6% | |
| National Oilwell Varco, Inc. | | | 541,900 | | | | 39,179,370 | | |
| Oil, Gas & Consumable Fuels 3.5% | |
| Anadarko Petroleum Corp. | | | 448,700 | | | | 31,157,728 | | |
| Chevron Corp. | | | 122,320 | | | | 13,403,825 | | |
| Continental Resources, Inc.(a)(b) | | | 205,420 | | | | 13,144,826 | | |
| Kinder Morgan Management LLC(c) | | | 42,621 | | | | 33 | | |
| Pioneer Natural Resources Co.(b) | | | 341,800 | | | | 30,293,734 | | |
| Total | | | | | 88,000,146 | | |
| Total Energy | | | | | 127,179,516 | | |
| Financials 4.6% | |
| Capital Markets 0.6% | |
| BlackRock, Inc. | �� | | 85,200 | | | | 14,506,152 | | |
| Commercial Banks 1.2% | |
| Fifth Third Bancorp | | | 1,569,100 | | | | 21,684,962 | | |
| Wells Fargo & Co. | | | 294,200 | | | | 9,946,902 | | |
| Total | | | | | 31,631,864 | | |
| Diversified Financial Services 1.0% | |
| IntercontinentalExchange, Inc.(a) | | | 202,100 | | | | 26,519,562 | | |
| Real Estate Investment Trusts (REITs) 1.8% | |
| Digital Realty Trust, Inc.(b) | | | 376,300 | | | | 29,377,741 | | |
| Simon Property Group, Inc.(b) | | | 92,600 | | | | 14,861,374 | | |
| Total | | | | | 44,239,115 | | |
| Total Financials | | | | | 116,896,693 | | |
| Health Care 15.7% | |
| Biotechnology 5.5% | |
| Amgen, Inc. | | | 525,000 | | | | 43,365,000 | | |
| Biogen Idec, Inc.(a) | | | 322,000 | | | | 46,957,260 | | |
| Onyx Pharmaceuticals, Inc.(a) | | | 146,800 | | | | 11,005,596 | | |
| Regeneron Pharmaceuticals, Inc.(a)(b) | | | 102,400 | | | | 13,788,160 | | |
| Vertex Pharmaceuticals, Inc.(a) | | | 467,900 | | | | 22,697,829 | | |
| Total | | | | | 137,813,845 | | |
| Health Care Equipment & Supplies 2.0% | |
| Covidien PLC | | | 310,000 | | | | 17,322,800 | | |
The accompanying Notes to Financial Statements are an integral part of this statement.
Annual Report 2012
7
Columbia Large Cap Growth Fund
Portfolio of Investments (continued)
July 31, 2012
Common Stocks (continued)
| Issuer | | Shares | | Value ($) | |
| Edwards Lifesciences Corp.(a) | | | 331,500 | | | | 33,547,800 | | |
| Total | | | | | 50,870,600 | | |
| Health Care Providers & Services 1.8% | |
| Express Scripts Holding Co.(a) | | | 798,740 | | | | 46,278,996 | | |
| Life Sciences Tools & Services 0.6% | |
| Thermo Fisher Scientific, Inc. | | | 273,600 | | | | 15,231,312 | | |
| Pharmaceuticals 5.8% | |
| Allergan, Inc. | | | 429,980 | | | | 35,288,458 | | |
| Johnson & Johnson(b) | | | 902,200 | | | | 62,450,284 | | |
| Watson Pharmaceuticals, Inc.(a)(b) | | | 607,200 | | | | 47,258,376 | | |
| Total | | | | | 144,997,118 | | |
| Total Health Care | | | | | 395,191,871 | | |
| Industrials 8.2% | |
| Construction & Engineering 0.6% | |
| KBR, Inc. | | | 564,300 | | | | 14,807,232 | | |
| Electrical Equipment 0.9% | |
| Rockwell Automation, Inc. | | | 353,000 | | | | 23,778,080 | | |
| Industrial Conglomerates 2.8% | |
| General Electric Co. | | | 1,371,000 | | | | 28,448,250 | | |
| Tyco International Ltd. | | | 762,500 | | | | 41,891,750 | | |
| Total | | | | | 70,340,000 | | |
| Machinery 1.0% | |
| Pall Corp.(b) | | | 488,600 | | | | 26,096,126 | | |
| Road & Rail 2.9% | |
| JB Hunt Transport Services, Inc.(b) | | | 399,000 | | | | 21,952,980 | | |
| Kansas City Southern | | | 340,000 | | | | 24,752,000 | | |
| Norfolk Southern Corp. | | | 339,500 | | | | 25,139,975 | | |
| Total | | | | | 71,844,955 | | |
| Total Industrials | | | | | 206,866,393 | | |
| Information Technology 31.6% | |
| Communications Equipment 3.1% | |
| QUALCOMM, Inc. | | | 1,307,980 | | | | 78,060,247 | | |
| Computers & Peripherals 11.3% | |
| Apple, Inc.(a) | | | 299,666 | | | | 183,024,006 | | |
| EMC Corp.(a) | | | 2,427,510 | | | | 63,625,037 | | |
| NCR Corp.(a) | | | 1,590,300 | | | | 37,085,796 | | |
| Total | | | | | 283,734,839 | | |
Common Stocks (continued)
| Issuer | | Shares | | Value ($) | |
| Internet Software & Services 6.8% | |
| eBay, Inc.(a) | | | 1,422,600 | | | | 63,021,180 | | |
| Google, Inc., Class A(a) | | | 144,455 | | | | 91,435,681 | | |
| LinkedIn Corp., Class A(a)(b) | | | 158,900 | | | | 16,311,085 | | |
| Total | | | | | 170,767,946 | | |
| IT Services 5.5% | |
| Accenture PLC, Class A | | | 561,100 | | | | 33,834,330 | | |
| Alliance Data Systems Corp.(a)(b) | | | 219,800 | | | | 28,574,000 | | |
| Mastercard, Inc., Class A | | | 97,400 | | | | 42,521,918 | | |
| Teradata Corp.(a)(b) | | | 514,640 | | | | 34,799,957 | | |
| Total | | | | | 139,730,205 | | |
| Semiconductors & Semiconductor Equipment 1.2% | |
| Avago Technologies Ltd. | | | 451,100 | | | | 16,690,700 | | |
| Lam Research Corp.(a) | | | 2 | | | | 69 | | |
| Skyworks Solutions, Inc.(a) | | | 466,600 | | | | 13,498,738 | | |
| Total | | | | | 30,189,507 | | |
| Software 3.7% | |
| Check Point Software Technologies Ltd.(a)(b) | | |
349,200 | | | | 16,960,644 | | |
| Citrix Systems, Inc.(a) | | | 534,093 | | | | 38,817,879 | | |
| Microsoft Corp. | | | 1,233,200 | | | | 36,342,404 | | |
| Total | | | | | 92,120,927 | | |
| Total Information Technology | | | | | 794,603,671 | | |
| Materials 4.5% | |
| Chemicals 4.5% | |
| Agrium, Inc. | | | 235,800 | | | | 22,391,568 | | |
| LyondellBasell Industries NV, Class A | | | 635,800 | | | | 28,312,174 | | |
| Monsanto Co. | | | 392,100 | | | | 33,571,602 | | |
| PPG Industries, Inc. | | | 275,300 | | | | 30,134,338 | | |
| Total | | | | | 114,409,682 | | |
| Total Materials | | | | | 114,409,682 | | |
| Telecommunication Services 1.5% | |
| Diversified Telecommunication Services 1.5% | |
| Verizon Communications, Inc.(b) | | | 834,800 | | | | 37,682,872 | | |
| Total Telecommunication Services | | | | | 37,682,872 | | |
Total Common Stocks
(Cost: $2,017,235,266) | | | | | 2,424,503,744 | | |
The accompanying Notes to Financial Statements are an integral part of this statement.
Annual Report 2012
8
Columbia Large Cap Growth Fund
Portfolio of Investments (continued)
July 31, 2012
Convertible Preferred Stocks 1.4%
| Issuer | | Shares | | Value ($) | |
| Industrials 1.4% | |
| Aerospace & Defense 1.4% | |
| United Technologies Corp., 7.50%(b) | | | 639,300 | | | | 33,723,075 | | |
| Total Industrials | | | | | 33,723,075 | | |
Total Convertible Preferred Stocks
(Cost: $33,519,240) | | | | | 33,723,075 | | |
| Money Market Funds 1.8% | |
Columbia Short-Term Cash Fund,
0.153%(d)(e) | | | 45,679,584 | | | | 45,679,584 | | |
Total Money Market Funds
(Cost: $45,679,584) | | | | | 45,679,584 | | |
Investments of Cash Collateral Received for Securities on Loan 17.9%
| Issuer | | Effective
Yield | | Par ($)/
Principal ($)/
Shares | | Value ($) | |
| Asset-Backed Commercial Paper 3.8% | |
Atlantis One
09/10/12 | | | 0.592 | % | | | 9,970,500 | | | | 9,970,500 | | |
| 10/11/12 | | | 0.541 | % | | | 4,986,275 | | | | 4,986,275 | | |
Barton Capital Corporation
08/06/12 | | | 0.250 | % | | | 4,999,757 | | | | 4,999,757 | | |
Cancara Asset Securitisation LLC
08/01/12 | | | 0.260 | % | | | 9,998,050 | | | | 9,998,050 | | |
Gotham Funding Corp.
09/12/12 | | | 0.240 | % | | | 4,998,200 | | | | 4,998,200 | | |
Kells Funding LLC
08/01/12 | | | 0.380 | % | | | 3,998,860 | | | | 3,998,860 | | |
| 08/28/12 | | | 0.420 | % | | | 6,993,058 | | | | 6,993,058 | | |
| 10/17/12 | | | 0.451 | % | | | 9,986,625 | | | | 9,986,625 | | |
Scaldis Capital LLC
08/13/12 | | | 0.440 | % | | | 14,994,133 | | | | 14,994,133 | | |
Sheffield Receivable Corp.
10/09/12 | | | 0.320 | % | | | 14,989,067 | | | | 14,989,067 | | |
Surrey Funding Corp.
08/02/12 | | | 0.300 | % | | | 4,996,167 | | | | 4,996,167 | | |
Working Capital Management Co., L.P.
08/20/12 | | | 0.230 | % | | | 4,999,233 | | | | 4,999,233 | | |
| Total | | | | | | | 95,909,925 | | |
Investments of Cash Collateral Received for Securities on Loan (continued)
| Issuer | | Effective
Yield | | Par ($)/
Principal ($)/
Shares | | Value ($) | |
| Certificates of Deposit 8.5% | |
ABM AMRO Bank N.V.
09/21/12 | | | 0.560 | % | | | 3,994,284 | | | | 3,994,284 | | |
Barclays Bank PLC
10/26/12 | | | 0.310 | % | | | 10,000,000 | | | | 10,000,000 | | |
Credit Suisse
11/08/12 | | | 0.406 | % | | | 5,000,000 | | | | 5,000,000 | | |
DZ Bank AG
09/07/12 | | | 0.330 | % | | | 5,000,000 | | | | 5,000,000 | | |
| 10/29/12 | | | 0.380 | % | | | 5,000,000 | | | | 5,000,000 | | |
Deutsche Bank AG
10/09/12 | | | 0.750 | % | | | 10,000,000 | | | | 10,000,000 | | |
Development Bank of Singapore Ltd.
08/20/12 | | | 0.250 | % | | | 10,000,000 | | | | 10,000,000 | | |
DnB NOR ASA
09/14/12 | | | 0.530 | % | | | 5,000,000 | | | | 5,000,000 | | |
Mizuho Corporate Bank Ltd.
10/25/12 | | | 0.340 | % | | | 10,000,000 | | | | 10,000,000 | | |
N.V. Bank Nederlandse Gemeenten
08/20/12 | | | 0.260 | % | | | 5,000,000 | | | | 5,000,000 | | |
National Australia Bank
08/16/12 | | | 0.349 | % | | | 7,000,000 | | | | 7,000,000 | | |
National Bank of Canada
11/09/12 | | | 0.306 | % | | | 5,000,000 | | | | 5,000,000 | | |
Nordea Bank AB
08/23/12 | | | 0.250 | % | | | 5,001,448 | | | | 5,001,448 | | |
| 08/23/12 | | | 0.290 | % | | | 5,000,000 | | | | 5,000,000 | | |
Norinchukin Bank
08/22/12 | | | 0.390 | % | | | 2,000,000 | | | | 2,000,000 | | |
| 10/31/12 | | | 0.560 | % | | | 8,000,000 | | | | 8,000,000 | | |
| 11/09/12 | | | 0.526 | % | | | 5,000,000 | | | | 5,000,000 | | |
Pohjola Bank PLC
08/20/12 | | | 0.390 | % | | | 10,000,000 | | | | 10,000,000 | | |
| 08/21/12 | | | 0.380 | % | | | 15,000,000 | | | | 15,000,000 | | |
Rabobank
09/17/12 | | | 0.310 | % | | | 10,021,008 | | | | 10,021,008 | | |
| 10/26/12 | | | 0.515 | % | | | 10,000,000 | | | | 10,000,000 | | |
Skandinaviska Enskilda Banken
10/31/12 | | | 0.350 | % | | | 10,000,000 | | | | 10,000,000 | | |
Standard Chartered Bank PLC
10/05/12 | | | 0.315 | % | | | 10,000,121 | | | | 10,000,121 | | |
| 10/05/12 | | | 0.630 | % | | | 4,984,038 | | | | 4,984,038 | | |
Sumitomo Mitsui Banking Corp.
09/05/12 | | | 0.350 | % | | | 5,000,000 | | | | 5,000,000 | | |
The accompanying Notes to Financial Statements are an integral part of this statement.
Annual Report 2012
9
Columbia Large Cap Growth Fund
Portfolio of Investments (continued)
July 31, 2012
Investments of Cash Collateral Received for Securities on Loan (continued)
| Issuer | | Effective
Yield | | Par ($)/
Principal ($)/
Shares | | Value ($) | |
Sumitomo Trust & Banking Co., Ltd.
08/29/12 | | | 0.350 | % | | | 10,000,000 | | | | 10,000,000 | | |
| 09/17/12 | | | 0.470 | % | | | 5,000,000 | | | | 5,000,000 | | |
Svenska Handelsbanken
08/30/12 | | | 0.580 | % | | | 3,000,000 | | | | 3,000,000 | | |
| 09/13/12 | | | 0.490 | % | | | 5,000,000 | | | | 5,000,000 | | |
Union Bank of Switzerland
10/23/12 | | | 0.330 | % | | | 10,000,000 | | | | 10,000,000 | | |
| Total | | | | | | | 214,000,899 | | |
| Commercial Paper 4.0% | |
Bank of New Zealand
11/02/12 | | | 0.366 | % | | | 7,000,000 | | | | 7,000,000 | | |
Caisse d'Amortissement de la Dette Sociale
09/19/12 | | | 0.300 | % | | | 9,992,250 | | | | 9,992,250 | | |
Caisse des Depots
08/31/12 | | | 0.360 | % | | | 4,995,400 | | | | 4,995,400 | | |
Credit Suisse
09/10/12 | | | 0.340 | % | | | 9,991,500 | | | | 9,991,500 | | |
DnB NOR
08/30/12 | | | 0.495 | % | | | 5,000,000 | | | | 5,000,000 | | |
Erste Abwicklungsanstalt
08/23/12 | | | 0.390 | % | | | 4,994,963 | | | | 4,994,963 | | |
| 08/28/12 | | | 0.390 | % | | | 4,994,800 | | | | 4,994,800 | | |
Macquarie Bank Ltd.
10/19/12 | | | 0.987 | % | | | 10,000,000 | | | | 10,000,000 | | |
Mitsubishi UFJ Trust and Banking Corp.
09/04/12 | | | 0.441 | % | | | 4,992,483 | | | | 4,992,483 | | |
PB Capital Corp.
09/05/12 | | | 0.761 | % | | | 3,994,849 | | | | 3,994,849 | | |
Suncorp Metway Ltd.
08/07/12 | | | 0.460 | % | | | 4,995,975 | | | | 4,995,975 | | |
| 08/13/12 | | | 0.450 | % | | | 4,996,125 | | | | 4,996,125 | | |
| 09/25/12 | | | 0.450 | % | | | 9,992,000 | | | | 9,992,000 | | |
The Commonwealth Bank of Australia
08/16/12 | | | 0.309 | % | | | 7,000,000 | | | | 7,000,000 | | |
Westpac Securities NZ Ltd.
08/27/12 | | | 0.491 | % | | | 6,984,279 | | | | 6,984,279 | | |
| Total | | | | | | | 99,924,624 | | |
| Repurchase Agreements 1.6% | |
Credit Suisse
Securities (USA) LLC
dated 07/31/12,
matures 08/01/12,
repurchase price
$9,259,662(f) | | | 0.160 | % | | | 9,259,621 | | | | 9,259,621 | | |
Investments of Cash Collateral Received for Securities on Loan (continued)
| Issuer | | Effective
Yield | | Par ($)/
Principal ($)/
Shares | | Value ($) | |
Mizuho Securities
USA, Inc.
dated 07/31/12,
matures 08/01/12,
repurchase price
$5,000,029(f) | | | 0.210 | % | | | 5,000,000 | | | | 5,000,000 | | |
Natixis Financial
Products, Inc.
dated 07/31/12,
matures 08/01/12,
repurchase price
$25,000,139(f) | | | 0.200 | % | | | 25,000,000 | | | | 25,000,000 | | |
| Total | | | | | | | 39,259,621 | | |
Total Investments of Cash Collateral
Received for Securities on Loan
(Cost: $449,095,069) | | | | | | | 449,095,069 | | |
Total Investments
(Cost: $2,545,529,159) | | | | | | | 2,953,001,472 | | |
| Other Assets & Liabilities, Net | | | | | | | (438,797,508 | ) | |
| Net Assets | | | | | | | 2,514,203,964 | | |
The accompanying Notes to Financial Statements are an integral part of this statement.
Annual Report 2012
10
Columbia Large Cap Growth Fund
Portfolio of Investments (continued)
July 31, 2012
Notes to Portfolio of Investments
(a) Non-income producing.
(b) At July 31, 2012, security was partially or fully on loan.
(c) Identifies issues considered to be illiquid as to their marketability. The aggregate value of such securities at July 31, 2012 was $33, representing 0.00% of net assets. Information concerning such security holdings at July 31, 2012 was as follows:
| Security Description | | Acquisition Dates | | Cost ($) | |
| Kinder Morgan Management LLC | | 12/18/02 - 01/18/05 | | | 10 | | |
(d) The rate shown is the seven-day current annualized yield at July 31, 2012.
(e) As defined in the Investment Company Act of 1940, an affiliated company is one in which the Fund owns 5% or more of its outstanding voting securities, or a company which is under common ownership or control with the Fund. Holdings and transactions in these affiliated companies during the year ended July 31, 2012, are as follows:
| Issuer | | Beginning
Cost ($) | | Purchase
Cost ($) | | Proceeds
from Sales ($) | | Realized
Gain/Loss ($) | | Ending
Cost ($) | | Dividends
or Interest
Income ($) | | Value ($) | |
Columbia
Short-Term
Cash Fund | | | 38,047,332 | | | | 696,168,846 | | | | (688,536,594 | ) | | | — | | | | 45,679,584 | | | | 67,056 | | | | 45,679,584 | | |
(f) The table below represents securities received as collateral for repurchase agreements. This collateral is deposited with the Fund's custodian and, pursuant to the terms of the repurchase agreement, must have an aggregate value greater than or equal to the repurchase price plus accrued interest at all times. The value of securities and/or cash held as collateral for repurchase agreements is monitored on a daily basis to ensure the proper level of collateral.
| Security Description | | Value ($) | |
| Credit Suisse Securities (USA) LLC (0.160%) | |
| Fannie Mae Interest Strip | | | 3,923,519 | | |
| Federal Home Loan Mortgage Corp | | | 2,507,531 | | |
| Freddie Mac Coupon Strips | | | 1,751,006 | | |
| Freddie Mac Strips | | | 1,262,768 | | |
| Total Market Value of Collateral Securities | | | 9,444,824 | | |
| Security Description | | Value ($) | |
| Mizuho Securities USA, Inc. (0.210%) | |
| Fannie Mae Pool | | | 2,307,935 | | |
| Freddie Mac Gold Pool | | | 33,071 | | |
| Freddie Mac Non Gold Pool | | | 218,874 | | |
| Freddie Mac REMICS | | | 399,298 | | |
| Ginnie Mae I Pool | | | 124,707 | | |
| Ginnie Mae II Pool | | | 2,016,115 | | |
| Total Market Value of Collateral Securities | | | 5,100,000 | | |
The accompanying Notes to Financial Statements are an integral part of this statement.
Annual Report 2012
11
Columbia Large Cap Growth Fund
Portfolio of Investments (continued)
July 31, 2012
Notes to Portfolio of Investments (continued)
| Security Description | | Value ($) | |
| Natixis Financial Products, Inc. (0.200%) | |
| Fannie Mae Pool | | | 3,814,410 | | |
| Fannie Mae REMICS | | | 7,940,959 | | |
| Federal National Mortgage Association | | | 865,126 | | |
| Freddie Mac Gold Pool | | | 280,232 | | |
| Freddie Mac Non Gold Pool | | | 801,370 | | |
| Freddie Mac REMICS | | | 5,665,900 | | |
| Government National Mortgage Association | | | 6,132,145 | | |
| Total Market Value of Collateral Securities | | | 25,500,142 | | |
Abbreviation Legend
ADR American Depositary Receipt
REMIC(S) Real Estate Mortgage Investment Conduit(s)
Fair Value Measurements
Generally accepted accounting principles (GAAP) require disclosure regarding the inputs and valuation techniques used to measure fair value and any changes in valuation inputs or techniques. In addition, investments shall be disclosed by major category.
The Fund categorizes its fair value measurements according to a three-level hierarchy that maximizes the use of observable inputs and minimizes the use of unobservable inputs by prioritizing that the most observable input be used when available. Observable inputs are those that market participants would use in pricing an investment based on market data obtained from sources independent of the reporting entity. Unobservable inputs are those that reflect the Fund's assumptions about the information market participants would use in pricing an investment. An investment's level within the fair value hierarchy is based on the lowest level of any input that is deemed significant to the asset or liability's fair value measurement. The input levels are not necessarily an indication of the risk or liquidity associated with investments at that level. For example, certain U.S. government securities are generally high quality and liquid, however, they are reflected as Level 2 because the inputs used to determine fair value may not always be quoted prices in an active market.
Fair value inputs are summarized in the three broad levels listed below:
> Level 1 — Valuations based on quoted prices for investments in active markets that the Fund has the ability to access at the measurement date (including NAV for open-end mutual funds). Valuation adjustments are not applied to Level 1 investments.
> Level 2 — Valuations based on other significant observable inputs (including quoted prices for similar securities, interest rates, prepayment speeds, credit risks, etc.).
> Level 3 — Valuations based on significant unobservable inputs (including the Fund's own assumptions and judgment in determining the fair value of investments).
Inputs that are used in determining fair value of an investment may include price information, credit data, volatility statistics, and other factors. These inputs can be either observable or unobservable. The availability of observable inputs can vary between investments, and is affected by various factors such as the type of investment, and the volume and level of activity for that investment or similar investments in the marketplace. The inputs will be considered by the Investment Manager, along with any other relevant factors in the calculation of an investment's fair value. The Fund uses prices and inputs that are current as of the measurement date, which may include periods of market dislocations. During these periods, the availability of prices and inputs may be reduced for many investments. This condition could cause an investment to be reclassified between the various levels within the hierarchy.
Investments falling into the Level 3 category are primarily supported by quoted prices from brokers and dealers participating in the market for those investments. However, these may be classified as Level 3 investments due to lack of market transparency and corroboration to support these quoted prices. Additionally, valuation models may be used as the pricing source for any remaining investments classified as Level 3. These models rely on one or more significant unobservable inputs and/or significant assumptions by the Investment Manager. Inputs used in valuations may include, but are not limited to, financial statement analysis, capital account balances, discount rates and estimated cash flows, and comparable company data.
The accompanying Notes to Financial Statements are an integral part of this statement.
Annual Report 2012
12
Columbia Large Cap Growth Fund
Portfolio of Investments (continued)
July 31, 2012
Fair Value Measurements (continued)
Under the direction of the Fund's Board of Trustees (the Board), the Investment Manager's Valuation Committee (the Committee) is responsible for carrying out the valuation procedures approved by the Board. The Committee consists of voting and non-voting members from various groups within the Investment Manager's organization, including operations and accounting, trading and investments, compliance, risk management and legal.
The Committee meets at least monthly to review and approve valuation matters, which may include a description of specific valuation determinations, data regarding pricing information received from approved pricing vendors and brokers and the results of Board-approved valuation control policies and procedures (the Policies). The Policies address, among other things, instances when market quotations are readily available, including recommendation of third party pricing vendors and a determination of appropriate pricing methodologies; events that require specific valuation determinations and assessment of fair value techniques; securities with a potential for stale pricing, including those that are illiquid, restricted, or in default; and the effectiveness of third-party pricing vendors, including periodic reviews of vendors. The Committee meets more frequently, as needed, to discuss additional valuation matters, which may include the need to review back-testing results, review time-sensitive information or approve related valuation actions. The Committee reports to the Board, with members of the Committee meeting with the Board at each of its regularly scheduled meetings to discuss valuation matters and actions during the period, similar to those described earlier.
For investments categorized as Level 3, the Committee monitors information similar to that described above, which may include: (i) data specific to the issuer or comparable issuers, (ii) general market or specific sector news and (iii) quoted prices and specific or similar security transactions. The Committee considers this data and any changes from prior periods in order to assess the reasonableness of observable and unobservable inputs, any assumptions or internal models used to value those securities and changes in fair value. This data is also used to corroborate, when available, information received from approved pricing vendors and brokers. Various factors impact the frequency of monitoring this information (which may occur as often as daily). However, the Committee may determine that changes to inputs, assumptions and models are not required as a result of the monitoring procedures performed.
The following table is a summary of the inputs used to value the Fund's investments at July 31, 2012:
| Description | | Level 1
Quoted Prices in Active
Markets for Identical
Assets ($) | | Level 2
Other Significant
Observable Inputs ($) | | Level 3
Significant
Unobservable Inputs ($) | | Total ($) | |
| Equity Securities | |
| Common Stocks | |
| Consumer Discretionary | | | 376,019,592 | | | | — | | | | — | | | | 376,019,592 | | |
| Consumer Staples | | | 255,653,454 | | | | — | | | | — | | | | 255,653,454 | | |
| Energy | | | 127,179,483 | | | | 33 | | | | — | | | | 127,179,516 | | |
| Financials | | | 116,896,693 | | | | — | | | | — | | | | 116,896,693 | | |
| Health Care | | | 395,191,871 | | | | — | | | | — | | | | 395,191,871 | | |
| Industrials | | | 206,866,393 | | | | — | | | | — | | | | 206,866,393 | | |
| Information Technology | | | 794,603,671 | | | | — | | | | — | | | | 794,603,671 | | |
| Materials | | | 114,409,682 | | | | — | | | | — | | | | 114,409,682 | | |
| Telecommunication Services | | | 37,682,872 | | | | — | | | | — | | | | 37,682,872 | | |
| Convertible Preferred Stocks | |
| Industrials | | | 33,723,075 | | | | — | | | | — | | | | 33,723,075 | | |
| Total Equity Securities | | | 2,458,226,786 | | | | 33 | | | | — | | | | 2,458,226,819 | | |
| Other | |
| Money Market Funds | | | 45,679,584 | | | | — | | | | — | | | | 45,679,584 | | |
Investments of Cash Collateral
Received for Securities on Loan | | | — | | | | 449,095,069 | | | | — | | | | 449,095,069 | | |
| Total Other | | | 45,679,584 | | | | 449,095,069 | | | | — | | | | 494,774,653 | | |
| Total | | | 2,503,906,370 | | | | 449,095,102 | | | | — | | | | 2,953,001,472 | | |
See the Portfolio of Investments for all investment classifications not indicated in the table.
The Fund's assets assigned to the Level 2 input category are generally valued using the market approach, in which a security's value is determined through reference to prices and information from market transactions for similar or identical assets.
There were no transfers of financial assets between Levels 1 and 2 during the period.
The accompanying Notes to Financial Statements are an integral part of this statement.
Annual Report 2012
13
Columbia Large Cap Growth Fund
Statement of Assets and Liabilities
July 31, 2012
| Assets | |
| Investments, at value* | |
| Unaffiliated issuers (identified cost $2,050,754,506) | | $ | 2,458,226,819 | | |
| Affiliated issuers (identified cost $45,679,584) | | | 45,679,584 | | |
| Investment of cash collateral received for securities on loan | |
| Short-term securities (identified cost $409,835,448) | | | 409,835,448 | | |
| Repurchase agreements (identified cost $39,259,621) | | | 39,259,621 | | |
| Total investments (identified cost $2,545,529,159) | | | 2,953,001,472 | | |
| Foreign currency (identified cost $48,263) | | | 48,641 | | |
| Receivable for: | |
| Investments sold | | | 16,065,861 | | |
| Capital shares sold | | | 799,655 | | |
| Dividends | | | 1,195,983 | | |
| Interest | | | 87,703 | | |
| Reclaims | | | 45,908 | | |
| Prepaid expenses | | | 21,297 | | |
| Trustees' deferred compensation plan | | | 184,029 | | |
| Other assets | | | 44,481 | | |
| Total assets | | | 2,971,495,030 | | |
| Liabilities | |
| Due upon return of securities on loan | | | 449,095,069 | | |
| Payable for: | |
| Investments purchased | | | 4,455,591 | | |
| Capital shares purchased | | | 2,908,959 | | |
| Investment management fees | | | 43,327 | | |
| Distribution and service fees | | | 12,583 | | |
| Transfer agent fees | | | 273,707 | | |
| Administration fees | | | 3,664 | | |
| Plan administration fees | | | 30 | | |
| Compensation of board members | | | 48,083 | | |
| Chief compliance officer expenses | | | 199 | | |
| Other expenses | | | 265,825 | | |
| Trustees' deferred compensation plan | | | 184,029 | | |
| Total liabilities | | | 457,291,066 | | |
| Net assets applicable to outstanding capital stock | | $ | 2,514,203,964 | | |
| Represented by | |
| Paid-in capital | | $ | 2,467,117,268 | | |
| Excess of distributions over net investment income | | | (230,946 | ) | |
| Accumulated net realized loss | | | (360,154,688 | ) | |
| Unrealized appreciation (depreciation) on: | |
| Investments | | | 407,472,313 | | |
| Foreign currency translations | | | 17 | | |
| Total — representing net assets applicable to outstanding capital stock | | $ | 2,514,203,964 | | |
| *Value of securities on loan | | $ | 437,292,423 | | |
The accompanying Notes to Financial Statements are an integral part of this statement.
Annual Report 2012
14
Columbia Large Cap Growth Fund
Statement of Assets and Liabilities (continued)
July 31, 2012
| Class A | |
| Net assets | | $ | 1,316,211,134 | | |
| Shares outstanding | | | 51,305,401 | | |
| Net asset value per share | | $ | 25.65 | | |
| Maximum offering price per share(a) | | $ | 27.21 | | |
| Class B | |
| Net assets | | $ | 39,046,382 | | |
| Shares outstanding | | | 1,674,298 | | |
| Net asset value per share | | $ | 23.32 | | |
| Class C | |
| Net assets | | $ | 39,541,969 | | |
| Shares outstanding | | | 1,694,396 | | |
| Net asset value per share | | $ | 23.34 | | |
| Class E | |
| Net assets | | $ | 13,437,057 | | |
| Shares outstanding | | | 524,713 | | |
| Net asset value per share | | $ | 25.61 | | |
| Maximum offering price per share(b) | | $ | 26.82 | | |
| Class F | |
| Net assets | | $ | 655,018 | | |
| Shares outstanding | | | 28,092 | | |
| Net asset value per share | | $ | 23.32 | | |
| Class I | |
| Net assets | | $ | 203,848,015 | | |
| Shares outstanding | | | 7,754,834 | | |
| Net asset value per share | | $ | 26.29 | | |
| Class R | |
| Net assets | | $ | 726,368 | | |
| Shares outstanding | | | 28,362 | | |
| Net asset value per share | | $ | 25.61 | | |
| Class R4 | |
| Net assets | | $ | 4,270,237 | | |
| Shares outstanding | | | 162,756 | | |
| Net asset value per share | | $ | 26.24 | | |
| Class R5 | |
| Net assets | | $ | 496,562 | | |
| Shares outstanding | | | 18,896 | | |
| Net asset value per share | | $ | 26.28 | | |
| Class T | |
| Net assets | | $ | 146,207,331 | | |
| Shares outstanding | | | 5,736,150 | | |
| Net asset value per share | | $ | 25.49 | | |
| Maximum offering price per share(a) | | $ | 27.05 | | |
| Class W | |
| Net assets | | $ | 3,105 | | |
| Shares outstanding | | | 121 | | |
| Net asset value per share | | $ | 25.66 | | |
| Class Y | |
| Net assets | | $ | 14,445,935 | | |
| Shares outstanding | | | 549,472 | | |
| Net asset value per share | | $ | 26.29 | | |
| Class Z | |
| Net assets | | $ | 735,314,851 | | |
| Shares outstanding | | | 27,981,977 | | |
| Net asset value per share | | $ | 26.28 | | |
(a) The maximum offering price per share is calculated by dividing the net asset value by 1.0 minus the maximum sales charge of 5.75%.
(b) The maximum offering price per share is calculated by dividing the net asset value by 1.0 minus the maximum sales charge of 4.50%.
The accompanying Notes to Financial Statements are an integral part of this statement.
Annual Report 2012
15
Columbia Large Cap Growth Fund
Statement of Operations
| | | Year Ended
July 31, 2012(a) | | Year Ended
September 30, 2011 | |
| Net investment income | |
| Income: | |
| Dividends | | $ | 25,701,917 | | | $ | 23,208,118 | | |
| Interest | | | — | | | | 3,811 | | |
| Dividends from affiliates | | | 67,056 | | | | 24,745 | | |
| Income from securities lending — net | | | 1,258,033 | | | | 277,019 | | |
| Foreign taxes withheld | | | (245,351 | ) | | | — | | |
| Total income | | | 26,781,655 | | | | 23,513,693 | | |
| Expenses: | |
| Investment management fees | | | 13,345,526 | | | | 12,427,666 | | |
| Distribution fees | |
| Class B | | | 316,979 | | | | 313,139 | | |
| Class C | | | 249,172 | | | | 224,218 | | |
| Class E | | | 11,030 | | | | 14,014 | | |
| Class F | | | 3,726 | | | | 3,945 | | |
| Class R | | | 5,164 | | | | 5,414 | | |
| Service fees | |
| Class A | | | 2,711,869 | | | | 1,875,799 | | |
| Class B | | | 105,660 | | | | 104,378 | | |
| Class C | | | 83,057 | | | | 74,740 | | |
| Class E | | | 27,576 | | | | 35,041 | | |
| Class F | | | 1,242 | | | | 1,315 | | |
| Class W | | | 6 | | | | 6 | | |
| Shareholder service fee — Class T | | | 361,400 | | | | 462,721 | | |
| Transfer agent fees | |
| Class A | | | 2,100,216 | | | | 1,522,592 | | |
| Class B | | | 81,831 | | | | 86,199 | | |
| Class C | | | 65,171 | | | | 57,191 | | |
| Class E | | | 21,510 | | | | 24,919 | | |
| Class F | | | 914 | | | | 940 | | |
| Class R | | | 1,928 | | | | 2,279 | | |
| Class R4 | | | 1,774 | | | | 63 | | |
| Class R5 | | | 25 | | | | 1 | | |
| Class T | | | 235,458 | | | | 272,975 | | |
| Class W | | | 6 | | | | 5 | | |
| Class Y | | | — | | | | 536 | | |
| Class Z | | | 1,198,553 | | | | 1,504,180 | | |
| Administration fees | | | 1,128,959 | | | | 1,099,242 | | |
| Plan administration fees | |
| Class R4 | | | 62,339 | | | | 61,658 | | |
| Compensation of board members | | | 95,654 | | | | 59,272 | | |
| Pricing and bookkeeping fees | | | — | | | | 68,328 | | |
| Custodian fees | | | 30,109 | | | | 48,709 | | |
| Printing and postage fees | | | 355,998 | | | | 408,797 | | |
| Registration fees | | | 151,185 | | | | 137,007 | | |
| Professional fees | | | 126,791 | | | | 109,406 | | |
| Interest expense | | | — | | | | 2,665 | | |
| Chief compliance officer expenses | | | 1,393 | | | | 2,253 | | |
| Other | | | 116,837 | | | | 75,211 | | |
| Total expenses | | | 22,999,058 | | | | 21,086,824 | | |
| Fees waived or expenses reimbursed by Investment Manager and its affiliates | | | — | | | | (1 | ) | |
| Expense reductions | | | (91,537 | ) | | | (130,442 | ) | |
| Total net expenses | | | 22,907,521 | | | | 20,956,381 | | |
| Net investment income | | | 3,874,134 | | | | 2,557,312 | | |
The accompanying Notes to Financial Statements are an integral part of this statement.
Annual Report 2012
16
Columbia Large Cap Growth Fund
Statement of Operations (continued)
| | | Year Ended
July 31, 2012(a) | | Year Ended
September 30, 2011 | |
| Realized and unrealized gain (loss) — net | |
| Net realized gain (loss) on: | |
| Investments | | $ | 189,952,014 | | | $ | 257,131,777 | | |
| Foreign currency translations | | | 1,962 | | | | — | | |
| Options contracts written | | | 37,431 | | | | — | | |
| Net realized gain | | | 189,991,407 | | | | 257,131,777 | | |
| Net change in unrealized appreciation (depreciation) on: | |
| Investments | | | 344,614,703 | | | | (470,476,967 | ) | |
| Foreign currency translations | | | (8,004 | ) | | | 8,021 | | |
| Net change in unrealized appreciation (depreciation) | | | 344,606,699 | | | | (470,468,946 | ) | |
| Net realized and unrealized gain (loss) | | | 534,598,106 | | | | (213,337,169 | ) | |
| Net change in net assets resulting from operations | | $ | 538,472,240 | | | $ | (210,779,857 | ) | |
(a) For the period from October 1, 2011 to July 31, 2012. During the period, the Fund's fiscal year end was changed from September 30 to July 31.
The accompanying Notes to Financial Statements are an integral part of this statement.
Annual Report 2012
17
Columbia Large Cap Growth Fund
Statement of Changes in Net Assets
| | | Year Ended
July 31, 2012(a) | | Year Ended
September 30,
2011(b) | | Year Ended
September 30,
2010(c) | |
| Operations | |
| Net investment income | | $ | 3,874,134 | | | $ | 2,557,312 | | | $ | 4,483,519 | | |
| Net realized gain | | | 189,991,407 | | | | 257,131,777 | | | | 132,553,843 | | |
| Net change in unrealized appreciation (depreciation) | | | 344,606,699 | | | | (470,468,946 | ) | | | (6,602,770 | ) | |
| Net increase (decrease) in net assets resulting from operations | | | 538,472,240 | | | | (210,779,857 | ) | | | 130,434,592 | | |
| Distributions to shareholders | |
| Net investment income | |
| Class A | | | (1,496,905 | ) | | | (311,186 | ) | | | (706,752 | ) | |
| Class E | | | — | | | | (14,099 | ) | | | (52,446 | ) | |
| Class I | | | (1,331,613 | ) | | | (877,728 | ) | | | — | | |
| Class R4 | | | (143,866 | ) | | | — | | | | — | | |
| Class R5 | | | (2,411 | ) | | | — | | | | — | | |
| Class T | | | — | | | | (228,135 | ) | | | (644,779 | ) | |
| Class W | | | (3 | ) | | | (5 | ) | | | — | | |
| Class Y | | | (86,293 | ) | | | (122,643 | ) | | | (144,925 | ) | |
| Class Z | | | (1,853,696 | ) | | | (3,736,650 | ) | | | (6,417,493 | ) | |
| Total distributions to shareholders | | | (4,914,787 | ) | | | (5,290,446 | ) | | | (7,966,395 | ) | |
| Increase (decrease) in net assets from share transactions | | | (463,576,461 | ) | | | 1,440,730,125 | | | | (207,285,552 | ) | |
| Proceeds from regulatory settlements (Note6) | | | 342,877 | | | | — | | | | 24,162 | | |
| Total increase (decrease) in net assets | | | 70,323,869 | | | | 1,224,659,822 | | | | (84,793,193 | ) | |
| Net assets at beginning of year | | | 2,443,880,095 | | | | 1,219,220,273 | | | | 1,304,013,466 | | |
| Net assets at end of year | | $ | 2,514,203,964 | | | $ | 2,443,880,095 | | | $ | 1,219,220,273 | | |
| Undistributed (excess of distributions over) net investment income | | $ | (230,946 | ) | | $ | 208,880 | | | $ | 2,996,957 | | |
(a) For the period from October 1, 2011 to July 31, 2012. During the period, the Fund's fiscal year end was changed from September 30 to July 31.
(b) Class R4 and Class R5 shares are for the period from March 7, 2011 (commencement of operations) to September 30, 2011.
(c) Class I, Class R and Class W shares are for the period from September 27, 2010 (commencement of operations) to September 30, 2010.
The accompanying Notes to Financial Statements are an integral part of this statement.
Annual Report 2012
18
Columbia Large Cap Growth Fund
Statement of Changes in Net Assets (continued)
| | | Year ended July 31,
2012(a) | | Year Ended September 30,
2011(b) | | Year Ended September 30,
2010(c) | |
| | | Shares | | Dollars ($) | | Shares | | Dollars ($) | | Shares | | Dollars ($) | |
| Capital stock activity | |
| Class A shares | |
| Subscriptions(d) | | | 1,943,514 | | | | 47,653,784 | | | | 2,313,786 | | | | 55,673,483 | | | | 805,686 | | | | 16,024,417 | | |
| Fund merger | | | — | | | | — | | | | 53,028,074 | | | | 1,311,851,037 | | | | — | | | | — | | |
| Distributions reinvested | | | 60,171 | | | | 1,385,141 | | | | 11,737 | | | | 267,376 | | | | 32,869 | | | | 640,942 | | |
| Redemptions | | | (7,687,336 | ) | | | (186,039,214 | ) | | | (5,558,459 | ) | | | (131,794,423 | ) | | | (1,414,921 | ) | | | (27,969,499 | ) | |
| Net increase (decrease) | | | (5,683,651 | ) | | | (137,000,289 | ) | | | 49,795,138 | | | | 1,235,997,473 | | | | (576,366 | ) | | | (11,304,140 | ) | |
| Class B shares | |
| Subscriptions | | | 29,835 | | | | 660,289 | | | | 40,478 | | | | 891,252 | | | | 20,276 | | | | 375,246 | | |
| Fund merger | | | — | | | | — | | | | 3,263,755 | | | | 73,976,373 | | | | — | | | | — | | |
| Redemptions(d) | | | (943,911 | ) | | | (21,142,995 | ) | | | (1,481,641 | ) | | | (32,997,626 | ) | | | (696,983 | ) | | | (12,816,473 | ) | |
| Net increase (decrease) | | | (914,076 | ) | | | (20,482,706 | ) | | | 1,822,592 | | | | 41,869,999 | | | | (676,707 | ) | | | (12,441,227 | ) | |
| Class C shares | |
| Subscriptions | | | 225,432 | | | | 4,931,317 | | | | 123,630 | | | | 2,680,451 | | | | 59,499 | | | | 1,084,006 | | |
| Fund merger | | | — | | | | — | | | | 1,277,699 | | | | 28,980,204 | | | | — | | | | — | | |
| Redemptions | | | (465,444 | ) | | | (10,087,759 | ) | | | (309,429 | ) | | | (6,672,856 | ) | | | (215,573 | ) | | | (3,928,733 | ) | |
| Net increase (decrease) | | | (240,012 | ) | | | (5,156,442 | ) | | | 1,091,900 | | | | 24,987,799 | | | | (156,074 | ) | | | (2,844,727 | ) | |
| Class E shares | |
| Subscriptions | | | 631 | | | | 14,828 | | | | 939 | | | | 22,476 | | | | 932 | | | | 18,418 | | |
| Distributions reinvested | | | — | | | | — | | | | 619 | | | | 14,084 | | | | 2,687 | | | | 52,351 | | |
| Redemptions | | | (42,545 | ) | | | (1,024,302 | ) | | | (56,363 | ) | | | (1,310,393 | ) | | | (83,767 | ) | | | (1,658,131 | ) | |
| Net decrease | | | (41,914 | ) | | | (1,009,474 | ) | | | (54,805 | ) | | | (1,273,833 | ) | | | (80,148 | ) | | | (1,587,362 | ) | |
| Class F shares | |
| Subscriptions | | | 2,660 | | | | 60,100 | | | | 3,005 | | | | 65,250 | | | | 6,919 | | | | 120,000 | | |
| Redemptions | | | — | | | | — | | | | — | | | | — | | | | (1,365 | ) | | | (25,254 | ) | |
| Net increase | | | 2,660 | | | | 60,100 | | | | 3,005 | | | | 65,250 | | | | 5,554 | | | | 94,746 | | |
| Class I shares | |
| Subscriptions | | | 251,689 | | | | 6,255,459 | | | | 10,666,365 | | | | 242,247,523 | | | | 118 | | | | 2,500 | | |
| Fund merger | | | — | | | | — | | | | 10,806,161 | | | | 273,675,545 | | | | — | | | | — | | |
| Distributions reinvested | | | 56,613 | | | | 1,331,541 | | | | 37,702 | | | | 877,713 | | | | — | | | | — | | |
| Redemptions | | | (5,633,011 | ) | | | (134,702,134 | ) | | | (8,430,803 | ) | | | (203,045,301 | ) | | | — | | | | — | | |
| Net increase (decrease) | | | (5,324,709 | ) | | | (127,115,134 | ) | | | 13,079,425 | | | | 313,755,480 | | | | 118 | | | | 2,500 | | |
| Class R shares | |
| Subscriptions | | | 7,719 | | | | 184,854 | | | | 13,585 | | | | 323,017 | | | | 121 | | | | 2,500 | | |
| Fund merger | | | — | | | | — | | | | 99,267 | | | | 2,457,836 | | | | — | | | | — | | |
| Redemptions | | | (75,428 | ) | | | (1,782,086 | ) | | | (16,902 | ) | | | (411,371 | ) | | | — | | | | — | | |
| Net increase (decrease) | | | (67,709 | ) | | | (1,597,232 | ) | | | 95,950 | | | | 2,369,482 | | | | 121 | | | | 2,500 | | |
The accompanying Notes to Financial Statements are an integral part of this statement.
Annual Report 2012
19
Columbia Large Cap Growth Fund
Statement of Changes in Net Assets (continued)
| | | Year ended July 31,
2012(a) | | Year Ended September 30,
2011(b) | | Year Ended September 30,
2010(c) | |
| | | Shares | | Dollars ($) | | Shares | | Dollars ($) | | Shares | | Dollars ($) | |
| Capital stock activity (continued) | |
| Class R4 shares | |
| Subscriptions | | | 252,102 | | | | 6,114,814 | | | | 255,555 | | | | 6,101,704 | | | | — | | | | — | | |
| Fund merger | | | — | | | | — | | | | 2,096,295 | | | | 52,967,855 | | | | — | | | | — | | |
| Distributions reinvested | | | 6,112 | | | | 143,821 | | | | — | | | | — | | | | — | | | | — | | |
| Redemptions | | | (2,284,808 | ) | | | (60,118,917 | ) | | | (162,500 | ) | | | (3,959,051 | ) | | | — | | | | — | | |
| Net increase (decrease) | | | (2,026,594 | ) | | | (53,860,282 | ) | | | 2,189,350 | | | | 55,110,508 | | | | — | | | | — | | |
| Class R5 shares | |
| Subscriptions | | | — | | | | — | | | | 101 | | | | 2,502 | | | | — | | | | — | | |
| Fund merger | | | — | | | | — | | | | 18,952 | | | | 479,425 | | | | — | | | | — | | |
| Distributions reinvested | | | 5 | | | | 127 | | | | — | | | | — | | | | — | | | | — | | |
| Redemptions | | | (162 | ) | | | (3,924 | ) | | | — | | | | — | | | | — | | | | — | | |
| Net increase (decrease) | | | (157 | ) | | | (3,797 | ) | | | 19,053 | | | | 481,927 | | | | — | | | | — | | |
| Class T shares | |
| Subscriptions | | | 34,752 | | | | 831,365 | | | | 64,181 | | | | 1,505,541 | | | | 82,332 | | | | 1,626,732 | | |
| Distributions reinvested | | | — | | | | — | | | | 7,267 | | | | 164,449 | | | | 32,478 | | | | 629,102 | | |
| Redemptions | | | (585,160 | ) | | | (14,067,972 | ) | | | (800,963 | ) | | | (18,656,781 | ) | | | (878,814 | ) | | | (17,268,207 | ) | |
| Net decrease | | | (550,408 | ) | | | (13,236,607 | ) | | | (729,515 | ) | | | (16,986,791 | ) | | | (764,004 | ) | | | (15,012,373 | ) | |
| Class W shares | |
| Subscriptions | | | — | | | | — | | | | 7 | | | | 149 | | | | 121 | | | | 2,500 | | |
| Redemptions | | | — | | | | — | | | | (7 | ) | | | (153 | ) | | | — | | | | — | | |
| Net increase | | | — | | | | — | | | | — | | | | (4 | ) | | | 121 | | | | 2,500 | | |
| Class Y shares | |
| Subscriptions | | | 9,284 | | | | 235,993 | | | | 6,003 | | | | 131,059 | | | | 241,185 | | | | 4,654,648 | | |
| Distributions reinvested | | | 3 | | | | 73 | | | | 3 | | | | 71 | | | | 5 | | | | 97 | | |
| Redemptions | | | (176,477 | ) | | | (4,397,670 | ) | | | (343,024 | ) | | | (8,075,378 | ) | | | (56,363 | ) | | | (1,164,873 | ) | |
| Net increase (decrease) | | | (167,190 | ) | | | (4,161,604 | ) | | | (337,018 | ) | | | (7,944,248 | ) | | | 184,827 | | | | 3,489,872 | | |
| Class Z shares | |
| Subscriptions | | | 1,292,265 | | | | 31,910,875 | | | | 1,562,376 | | | | 37,620,290 | | | | 3,131,342 | | | | 62,888,945 | | |
| Distributions reinvested | | | 47,428 | | | | 1,116,457 | | | | 92,637 | | | | 2,156,590 | | | | 184,404 | | | | 3,673,328 | | |
| Redemptions | | | (5,406,923 | ) | | | (133,040,326 | ) | | | (10,365,849 | ) | | | (247,479,797 | ) | | | (11,558,386 | ) | | | (234,250,114 | ) | |
| Net decrease | | | (4,067,230 | ) | | | (100,012,994 | ) | | | (8,710,836 | ) | | | (207,702,917 | ) | | | (8,242,640 | ) | | | (167,687,841 | ) | |
| Total net increase (decrease) | | | (19,080,990 | ) | | | (463,576,461 | ) | | | 58,264,239 | | | | 1,440,730,125 | | | | (10,305,198 | ) | | | (207,285,552 | ) | |
(a) For the period from October 1, 2011 to July 31, 2012. During the period, the Fund's fiscal year end was changed from September 30 to July 31.
(b) Class R4 and Class R5 shares are for the period from March 7, 2011 (commencement of operations) to September 30, 2011.
(c) Class I, Class R and Class W shares are for the period from September 27, 2010 (commencement of operations) to September 30, 2010.
(d) Includes conversions of Class B shares to Class A shares, if any.
The accompanying Notes to Financial Statements are an integral part of this statement.
Annual Report 2012
20
Columbia Large Cap Growth Fund
Financial Highlights
The following tables are intended to help you understand the Fund's financial performance. Certain information reflects financial results for a single share of a class held for the periods shown. Per share net investment income (loss) amounts are calculated based on average shares outstanding during the period. Total returns assume reinvestment of all dividends and distributions. Total returns do not reflect payment of sales charges, if any, and are not annualized for periods of less than one year.
| | | Year Ended
July 31, | |
Year Ended September 30, | |
| Class A | | 2012(a) | | 2011 | | 2010 | | 2009 | | 2008 | | 2007 | |
| Per share data | |
| Net asset value, beginning of period | | $ | 20.84 | | | $ | 20.64 | | | $ | 18.77 | | | $ | 19.57 | | | $ | 26.76 | | | $ | 22.27 | | |
| Income from investment operations: | |
| Net investment income (loss) | | | 0.02 | | | | (0.01 | ) | | | 0.04 | | | | 0.07 | | | | 0.01 | | | | 0.02 | | |
| Net realized and unrealized gain (loss) | | | 4.82 | | | | 0.25 | (b) | | | 1.92 | | | | (0.86 | ) | | | (5.40 | ) | | | 4.87 | | |
| Total from investment operations | | | 4.84 | | | | 0.24 | | | | 1.96 | | | | (0.79 | ) | | | (5.39 | ) | | | 4.89 | | |
| Less distributions to shareholders: | |
| Net investment income | | | (0.03 | ) | | | (0.04 | ) | | | (0.09 | ) | | | (0.02 | ) | | | — | | | | (0.03 | ) | |
| Net realized gains | | | — | | | | — | | | | — | | | | — | | | | (1.81 | ) | | | (0.37 | ) | |
| Total distributions to shareholders | | | (0.03 | ) | | | (0.04 | ) | | | (0.09 | ) | | | (0.02 | ) | | | (1.81 | ) | | | (0.40 | ) | |
| Proceeds from regulatory settlements | | | 0.00 | (c) | | | — | | | | 0.00 | (c) | | | 0.01 | | | | 0.01 | | | | — | | |
| Net asset value, end of period | | $ | 25.65 | | | $ | 20.84 | | | $ | 20.64 | | | $ | 18.77 | | | $ | 19.57 | | | $ | 26.76 | | |
| Total return | | | 23.22 | % | | | 1.16 | % | | | 10.48 | % | | | (3.97 | %) | | | (21.73 | %) | | | 22.19 | % | |
| Ratios to average net assets(d) | |
Expenses prior to fees waived or expenses
reimbursed (including interest expense) | | | 1.16 | %(e) | | | 1.15 | %(f) | | | 1.10 | %(f) | | | 1.13 | %(f) | | | 1.03 | % | | | 1.00 | %(f) | |
Net expenses after fees waived or expenses
reimbursed (including interest expense)(g) | | | 1.16 | %(e)(h) | | | 1.14 | %(f)(i) | | | 1.10 | %(f)(h) | | | 1.13 | %(f)(h) | | | 1.02 | %(i) | | | 1.00 | %(f)(h) | |
Expenses prior to fees waived or expenses
reimbursed (excluding interest expense) | | | 1.16 | %(e) | | | 1.15 | % | | | 1.10 | % | | | 1.13 | % | | | 1.03 | % | | | 1.00 | % | |
Net expenses after fees waived or expenses
reimbursed (excluding interest expense)(g) | | | 1.16 | %(e)(h) | | | 1.14 | %(i) | | | 1.10 | %(h) | | | 1.13 | %(h) | | | 1.02 | %(i) | | | 1.00 | %(h) | |
| Net investment income (loss) | | | 0.10 | %(e)(h) | | | (0.06 | %)(i) | | | 0.19 | %(h) | | | 0.43 | %(h) | | | 0.01 | %(i) | | | 0.07 | %(h) | |
| Supplemental data | |
| Net assets, end of period (in thousands) | | $ | 1,316,211 | | | $ | 1,187,715 | | | $ | 148,455 | | | $ | 145,825 | | | $ | 156,585 | | | $ | 167,408 | | |
| Portfolio turnover | | | 80 | % | | | 116 | % | | | 122 | % | | | 146 | % | | | 164 | % | | | 151 | % | |
Notes to Financial Highlights
(a) For the period from October 1, 2011 to July 31, 2012. During the period, the Fund's fiscal year end was changed from September 30 to July 31.
(b) The amount shown for a share outstanding does not correspond with the aggregate net loss on investments for the period due to timing of repurchases of Fund shares in relation to fluctuating market values of the investments of the Fund.
(c) Rounds to less than $0.01.
(d) In addition to the fees and expenses which the Fund bears directly, the Fund indirectly bears a pro rata share of the fees and expenses of the acquired funds in which it invests. Such indirect expenses are not included in the reported expense ratios.
(e) Annualized.
(f) Includes interest expense which rounds to less than 0.01%.
(g) The Investment Manager and certain of its affiliates agreed to waive/reimburse certain fees and expenses, if applicable.
(h) The benefits derived from expense reductions had an impact of less than 0.01%.
(i) The benefits derived from expense reductions had an impact of 0.01%.
The accompanying Notes to Financial Statements are an integral part of this statement.
Annual Report 2012
21
Columbia Large Cap Growth Fund
Financial Highlights (continued)
| | | Year Ended
July 31, | |
Year Ended September 30, | |
| Class B | | 2012(a) | | 2011 | | 2010 | | 2009 | | 2008 | | 2007 | |
| Per share data | |
| Net asset value, beginning of period | | $ | 19.04 | | | $ | 18.97 | | | $ | 17.30 | | | $ | 18.15 | | | $ | 25.12 | | | $ | 21.05 | | |
| Income from investment operations: | |
| Net investment loss | | | (0.12 | ) | | | (0.18 | ) | | | (0.10 | ) | | | (0.04 | ) | | | (0.17 | ) | | | (0.16 | ) | |
| Net realized and unrealized gain (loss) | | | 4.40 | | | | 0.25 | (b) | | | 1.77 | | | | (0.82 | ) | | | (5.00 | ) | | | 4.60 | | |
| Total from investment operations | | | 4.28 | | | | 0.07 | | | | 1.67 | | | | (0.86 | ) | | | (5.17 | ) | | | 4.44 | | |
| Less distributions to shareholders: | |
| Net realized gains | | | — | | | | — | | | | — | | | | — | | | | (1.81 | ) | | | (0.37 | ) | |
| Total distributions to shareholders | | | — | | | | — | | | | — | | | | — | | | | (1.81 | ) | | | (0.37 | ) | |
| Proceeds from regulatory settlements | | | 0.00 | (c) | | | — | | | | 0.00 | (c) | | | 0.01 | | | | 0.01 | | | | — | | |
| Net asset value, end of period | | $ | 23.32 | | | $ | 19.04 | | | $ | 18.97 | | | $ | 17.30 | | | $ | 18.15 | | | $ | 25.12 | | |
| Total return | | | 22.48 | % | | | 0.37 | % | | | 9.65 | % | | | (4.68 | %) | | | (22.31 | %) | | | 21.31 | % | |
| Ratios to average net assets(d) | |
Expenses prior to fees waived or expenses
reimbursed (including interest expense) | | | 1.91 | %(e) | | | 1.90 | %(f) | | | 1.85 | %(f) | | | 1.88 | %(f) | | | 1.78 | % | | | 1.75 | %(f) | |
Net expenses after fees waived or expenses
reimbursed (including interest expense)(g) | | | 1.91 | %(e)(h) | | | 1.89 | %(f)(i) | | | 1.85 | %(f)(h) | | | 1.88 | %(f)(h) | | | 1.77 | %(i) | | | 1.75 | %(f)(h) | |
Expenses prior to fees waived or expenses
reimbursed (excluding interest expense) | | | 1.91 | %(e) | | | 1.90 | % | | | 1.85 | % | | | 1.88 | % | | | 1.78 | % | | | 1.75 | % | |
Net expenses after fees waived or expenses
reimbursed (excluding interest expense)(g) | | | 1.91 | %(e)(h) | | | 1.89 | %(i) | | | 1.85 | %(h) | | | 1.88 | %(h) | | | 1.77 | %(i) | | | 1.75 | %(h) | |
| Net investment loss | | | (0.64 | %)(e)(h) | | | (0.82 | %)(i) | | | (0.56 | %)(h) | | | (0.30 | %)(h) | | | (0.77 | %)(i) | | | (0.69 | %)(h) | |
| Supplemental data | |
| Net assets, end of period (in thousands) | | $ | 39,046 | | | $ | 49,290 | | | $ | 14,527 | | | $ | 24,951 | | | $ | 58,609 | | | $ | 168,284 | | |
| Portfolio turnover | | | 80 | % | | | 116 | % | | | 122 | % | | | 146 | % | | | 164 | % | | | 151 | % | |
Notes to Financial Highlights
(a) For the period from October 1, 2011 to July 31, 2012. During the period, the Fund's fiscal year end was changed from September 30 to July 31.
(b) The amount shown for a share outstanding does not correspond with the aggregate net loss on investments for the period due to timing of repurchases of Fund shares in relation to fluctuating market values of the investments of the Fund.
(c) Rounds to less than $0.01.
(d) In addition to the fees and expenses which the Fund bears directly, the Fund indirectly bears a pro rata share of the fees and expenses of the acquired funds in which it invests. Such indirect expenses are not included in the reported expense ratios.
(e) Annualized.
(f) Includes interest expense which rounds to less than 0.01%.
(g) The Investment Manager and certain of its affiliates agreed to waive/reimburse certain fees and expenses, if applicable.
(h) The benefits derived from expense reductions had an impact of less than 0.01%.
(i) The benefits derived from expense reductions had an impact of 0.01%.
The accompanying Notes to Financial Statements are an integral part of this statement.
Annual Report 2012
22
Columbia Large Cap Growth Fund
Financial Highlights (continued)
| | | Year Ended
July 31, | |
Year Ended September 30, | |
| Class C | | 2012(a) | | 2011 | | 2010 | | 2009 | | 2008 | | 2007 | |
| Per share data | |
| Net asset value, beginning of period | | $ | 19.06 | | | $ | 18.98 | | | $ | 17.31 | | | $ | 18.16 | | | $ | 25.14 | | | $ | 21.06 | | |
| Income from investment operations: | |
| Net investment loss | | | (0.12 | ) | | | (0.17 | ) | | | (0.10 | ) | | | (0.05 | ) | | | (0.16 | ) | | | (0.16 | ) | |
| Net realized and unrealized gain (loss) | | | 4.40 | | | | 0.25 | (b) | | | 1.77 | | | | (0.81 | ) | | | (5.02 | ) | | | 4.61 | | |
| Total from investment operations | | | 4.28 | | | | 0.08 | | | | 1.67 | | | | (0.86 | ) | | | (5.18 | ) | | | 4.45 | | |
| Less distributions to shareholders: | |
| Net realized gains | | | — | | | | — | | | | — | | | | — | | | | (1.81 | ) | | | (0.37 | ) | |
| Total distributions to shareholders | | | — | | | | — | | | | — | | | | — | | | | (1.81 | ) | | | (0.37 | ) | |
| Proceeds from regulatory settlements | | | 0.00 | (c) | | | — | | | | 0.00 | (c) | | | 0.01 | | | | 0.01 | | | | — | | |
| Net asset value, end of period | | $ | 23.34 | | | $ | 19.06 | | | $ | 18.98 | | | $ | 17.31 | | | $ | 18.16 | | | $ | 25.14 | | |
| Total return | | | 22.46 | % | | | 0.42 | % | | | 9.65 | % | | | (4.68 | %) | | | (22.33 | %) | | | 21.34 | % | |
| Ratios to average net assets(d) | |
Expenses prior to fees waived or expenses
reimbursed (including interest expense) | | | 1.91 | %(e) | | | 1.88 | %(f) | | | 1.85 | %(f) | | | 1.88 | %(f) | | | 1.78 | % | | | 1.75 | %(f) | |
Net expenses after fees waived or expenses
reimbursed (including interest expense)(g) | | | 1.91 | %(e)(h) | | | 1.87 | %(f)(i) | | | 1.85 | %(f)(h) | | | 1.88 | %(f)(h) | | | 1.77 | %(i) | | | 1.75 | %(f)(h) | |
Expenses prior to fees waived or expenses
reimbursed (excluding interest expense) | | | 1.91 | %(e) | | | 1.88 | % | | | 1.85 | % | | | 1.88 | % | | | 1.78 | % | | | 1.75 | % | |
Net expenses after fees waived or expenses
reimbursed (excluding interest expense)(g) | | | 1.91 | %(e)(h) | | | 1.87 | %(i) | | | 1.85 | %(h) | | | 1.88 | %(h) | | | 1.77 | %(i) | | | 1.75 | %(h) | |
| Net investment loss | | | (0.65 | %)(e)(h) | | | (0.77 | %)(i) | | | (0.55 | %)(h) | | | (0.33 | %)(h) | | | (0.75 | %)(i) | | | (0.68 | %)(h) | |
| Supplemental data | |
| Net assets, end of period (in thousands) | | $ | 39,542 | | | $ | 36,860 | | | $ | 15,990 | | | $ | 17,283 | | | $ | 21,208 | | | $ | 31,834 | | |
| Portfolio turnover | | | 80 | % | | | 116 | % | | | 122 | % | | | 146 | % | | | 164 | % | | | 151 | % | |
Notes to Financial Highlights
(a) For the period from October 1, 2011 to July 31, 2012. During the period, the Fund's fiscal year end was changed from September 30 to July 31.
(b) The amount shown for a share outstanding does not correspond with the aggregate net loss on investments for the period due to timing of repurchases of Fund shares in relation to fluctuating market values of the investments of the Fund.
(c) Rounds to less than $0.01.
(d) In addition to the fees and expenses which the Fund bears directly, the Fund indirectly bears a pro rata share of the fees and expenses of the acquired funds in which it invests. Such indirect expenses are not included in the reported expense ratios.
(e) Annualized.
(f) Includes interest expense which rounds to less than 0.01%.
(g) The Investment Manager and certain of its affiliates agreed to waive/reimburse certain fees and expenses, if applicable.
(h) The benefits derived from expense reductions had an impact of less than 0.01%.
(i) The benefits derived from expense reductions had an impact of 0.01%.
The accompanying Notes to Financial Statements are an integral part of this statement.
Annual Report 2012
23
Columbia Large Cap Growth Fund
Financial Highlights (continued)
| | | Year Ended
July 31, | |
Year Ended September 30, | |
| Class E | | 2012(a) | | 2011 | | 2010 | | 2009 | | 2008 | | 2007 | |
| Per share data | |
| Net asset value, beginning of period | | $ | 20.80 | | | $ | 20.60 | | | $ | 18.73 | | | $ | 19.53 | | | $ | 26.74 | | | $ | 22.27 | | |
| Income from investment operations: | |
| Net investment income (loss) | | | (0.00 | )(b) | | | (0.02 | ) | | | 0.02 | | | | 0.05 | | | | (0.02 | ) | | | (0.01 | ) | |
| Net realized and unrealized gain (loss) | | | 4.81 | | | | 0.24 | (c) | | | 1.93 | | | | (0.86 | ) | | | (5.39 | ) | | | 4.87 | | |
| Total from investment operations | | | 4.81 | | | | 0.22 | | | | 1.95 | | | | (0.81 | ) | | | (5.41 | ) | | | 4.86 | | |
| Less distributions to shareholders: | |
| Net investment income | | | — | | | | (0.02 | ) | | | (0.08 | ) | | | (0.00 | )(b) | | | — | | | | (0.02 | ) | |
| Net realized gains | | | — | | | | — | | | | — | | | | — | | | | (1.81 | ) | | | (0.37 | ) | |
| Total distributions to shareholders | | | — | | | | (0.02 | ) | | | (0.08 | ) | | | (0.00 | )(b) | | | (1.81 | ) | | | (0.39 | ) | |
| Proceeds from regulatory settlements | | | 0.00 | (b) | | | — | | | | 0.00 | (b) | | | 0.01 | | | | 0.01 | | | | — | | |
| Net asset value, end of period | | $ | 25.61 | | | $ | 20.80 | | | $ | 20.60 | | | $ | 18.73 | | | $ | 19.53 | | | $ | 26.74 | | |
| Total return | | | 23.13 | % | | | 1.07 | % | | | 10.41 | % | | | (4.09 | %) | | | (21.82 | %) | | | 22.07 | % | |
| Ratios to average net assets(d) | |
Expenses prior to fees waived or expenses
reimbursed (including interest expense) | | | 1.26 | %(e) | | | 1.20 | %(f) | | | 1.20 | %(f) | | | 1.23 | %(f) | | | 1.13 | % | | | 1.10 | %(f) | |
Net expenses after fees waived or expenses
reimbursed (including interest expense)(g) | | | 1.26 | %(e)(h) | | | 1.19 | %(f)(i) | | | 1.20 | %(f)(h) | | | 1.23 | %(f)(h) | | | 1.12 | %(i) | | | 1.10 | %(f)(h) | |
Expenses prior to fees waived or expenses
reimbursed (excluding interest expense) | | | 1.26 | %(e) | | | 1.20 | % | | | 1.20 | % | | | 1.23 | % | | | 1.13 | % | | | 1.10 | % | |
Net expenses after fees waived or expenses
reimbursed (excluding interest expense)(g) | | | 1.26 | %(e)(h) | | | 1.19 | %(i) | | | 1.20 | %(h) | | | 1.23 | %(h) | | | 1.12 | %(i) | | | 1.10 | %(h) | |
| Net investment income (loss) | | | (0.00 | %)(e)(h)(j) | | | (0.08 | %)(i) | | | 0.10 | %(h) | | | 0.33 | %(h) | | | (0.09 | %)(i) | | | (0.03 | %)(h) | |
| Supplemental data | |
| Net assets, end of period (in thousands) | | $ | 13,437 | | | $ | 11,784 | | | $ | 12,800 | | | $ | 13,144 | | | $ | 14,782 | | | $ | 18,185 | | |
| Portfolio Turnover | | | 80 | % | | | 116 | % | | | 122 | % | | | 146 | % | | | 164 | % | | | 151 | % | |
Notes to Financial Highlights
(a) For the period from October 1, 2011 to July 31, 2012. During the period, the Fund's fiscal year end was changed from September 30 to July 31.
(b) Rounds to less than $0.01.
(c) The amount shown for a share outstanding does not correspond with the aggregate net loss on investments for the period due to timing of repurchases of Fund shares in relation to fluctuating market values of the investments of the Fund.
(d) In addition to the fees and expenses which the Fund bears directly, the Fund indirectly bears a pro rata share of the fees and expenses of the acquired funds in which it invests. Such indirect expenses are not included in the reported expense ratios.
(e) Annualized.
(f) Includes interest expense which rounds to less than 0.01%.
(g) The Investment Manager and certain of its affiliates agreed to waive/reimburse certain fees and expenses, if applicable.
(h) The benefits derived from expense reductions had an impact of less than 0.01%.
(i) The benefits derived from expense reductions had an impact of 0.01%.
(j) Rounds to less than 0.01%.
The accompanying Notes to Financial Statements are an integral part of this statement.
Annual Report 2012
24
Columbia Large Cap Growth Fund
Financial Highlights (continued)
| | | Year Ended
July 31, | |
Year Ended September 30, | |
| Class F | | 2012(a) | | 2011 | | 2010 | | 2009 | | 2008 | | 2007 | |
| Per share data | |
| Net asset value, beginning of period | | $ | 19.04 | | | $ | 18.96 | | | $ | 17.29 | | | $ | 18.14 | | | $ | 25.11 | | | $ | 21.05 | | |
| Income from investment operations: | |
| Net investment loss | | | (0.12 | ) | | | (0.16 | ) | | | (0.10 | ) | | | (0.05 | ) | | | (0.18 | ) | | | (0.16 | ) | |
| Net realized and unrealized gain (loss) | | | 4.40 | | | | 0.24 | (b) | | | 1.77 | | | | (0.81 | ) | | | (4.99 | ) | | | 4.59 | | |
| Total from investment operations | | | 4.28 | | | | 0.08 | | | | 1.67 | | | | (0.86 | ) | | | (5.17 | ) | | | 4.43 | | |
| Less distributions to shareholders: | |
| Net realized gains | | | — | | | | — | | | | — | | | | — | | | | (1.81 | ) | | | (0.37 | ) | |
| Total distributions to shareholders | | | — | | | | — | | | | — | | | | — | | | | (1.81 | ) | | | (0.37 | ) | |
| Proceeds from regulatory settlements | | | 0.00 | (c) | | | — | | | | 0.00 | (c) | | | 0.01 | | | | 0.01 | | | | — | | |
| Net asset value, end of period | | $ | 23.32 | | | $ | 19.04 | | | $ | 18.96 | | | $ | 17.29 | | | $ | 18.14 | | | $ | 25.11 | | |
| Total return | | | 22.48 | % | | | 0.42 | % | | | 9.66 | % | | | (4.69 | %) | | | (22.31 | %) | | | 21.26 | % | |
| Ratios to average net assets(d) | |
Expenses prior to fees waived or expenses
reimbursed (including interest expense) | | | 1.91 | %(e) | | | 1.85 | %(f) | | | 1.85 | %(f) | | | 1.88 | %(f) | | | 1.78 | % | | | 1.75 | %(f) | |
Net expenses after fees waived or expenses
reimbursed (including interest expense)(g) | | | 1.91 | %(e)(h) | | | 1.84 | %(f)(i) | | | 1.85 | %(f)(h) | | | 1.88 | %(f)(h) | | | 1.77 | %(i) | | | 1.75 | %(f)(h) | |
Expenses prior to fees waived or expenses
reimbursed (excluding interest expense) | | | 1.91 | %(e) | | | 1.85 | % | | | 1.85 | % | | | 1.88 | % | | | 1.78 | % | | | 1.75 | % | |
Net expenses after fees waived or expenses
reimbursed (excluding interest expense)(g) | | | 1.91 | %(e)(h) | | | 1.84 | %(i) | | | 1.85 | %(h) | | | 1.88 | %(h) | | | 1.77 | %(i) | | | 1.75 | %(h) | |
| Net investment loss | | | (0.65 | %)(e)(h) | | | (0.73 | %)(i) | | | (0.55 | %)(h) | | | (0.32 | %)(h) | | | (0.80 | %)(i) | | | (0.70 | %)(h) | |
| Supplemental data | |
| Net assets, end of period (in thousands) | | $ | 655 | | | $ | 484 | | | $ | 425 | | | $ | 292 | | | $ | 380 | | | $ | 2,915 | | |
| Portfolio turnover | | | 80 | % | | | 116 | % | | | 122 | % | | | 146 | % | | | 164 | % | | | 151 | % | |
Notes to Financial Highlights
(a) For the period from October 1, 2011 to July 31, 2012. During the period, the Fund's fiscal year end was changed from September 30 to July 31.
(b) The amount shown for a share outstanding does not correspond with the aggregate net loss on investments for the period due to timing of repurchases of Fund shares in relation to fluctuating market values of the investments of the Fund.
(c) Rounds to less than $0.01.
(d) In addition to the fees and expenses which the Fund bears directly, the Fund indirectly bears a pro rata share of the fees and expenses of the acquired funds in which it invests. Such indirect expenses are not included in the reported expense ratios.
(e) Annualized.
(f) Includes interest expense which rounds to less than 0.01%.
(g) The Investment Manager and certain of its affiliates agreed to waive/reimburse certain fees and expenses, if applicable.
(h) The benefits derived from expense reductions had an impact of less than 0.01%.
(i) The benefits derived from expense reductions had an impact of 0.01%.
The accompanying Notes to Financial Statements are an integral part of this statement.
Annual Report 2012
25
Columbia Large Cap Growth Fund
Financial Highlights (continued)
| | | Year Ended
July 31, | |
Year Ended September 30, | |
| Class I | | 2012(a) | | 2011 | | 2010(b) | |
| Per share data | |
| Net asset value, beginning of period | | $ | 21.37 | | | $ | 21.14 | | | $ | 21.18 | | |
| Income from investment operations: | |
| Net investment income | | | 0.11 | | | | 0.11 | | | | 0.00 | (c) | |
| Net realized and unrealized gain (loss) | | | 4.94 | | | | 0.24 | (d) | | | (0.04 | ) | |
| Total from investment operations | | | 5.05 | | | | 0.35 | | | | (0.04 | ) | |
| Less distributions to shareholders: | |
| Net investment income | | | (0.13 | ) | | | (0.12 | ) | | | — | | |
| Total distributions to shareholders | | | (0.13 | ) | | | (0.12 | ) | | | — | | |
| Proceeds from regulatory settlements | | | 0.00 | (c) | | | — | | | | — | | |
| Net asset value, end of period | | $ | 26.29 | | | $ | 21.37 | | | $ | 21.14 | | |
| Total return | | | 23.71 | % | | | 1.61 | % | | | (0.19 | %) | |
| Ratios to average net assets(e) | |
Expenses prior to fees waived or expenses reimbursed
(including interest expense) | | | 0.72 | %(f) | | | 0.68 | %(g) | | | 0.60 | %(f) | |
Net expenses after fees waived or expenses reimbursed
(including interest expense)(h) | | | 0.72 | %(f) | | | 0.68 | %(g)(i) | | | 0.60 | %(f)(i) | |
Expenses prior to fees waived or expenses reimbursed
(excluding interest expense) | | | 0.72 | %(f) | | | 0.68 | % | | | 0.60 | %(f) | |
Net expenses after fees waived or expenses reimbursed
(excluding interest expense)(h) | | | 0.72 | %(f) | | | 0.68 | %(i) | | | 0.60 | %(f)(i) | |
| Net investment income | | | 0.54 | %(f) | | | 0.46 | %(i) | | | 1.89 | %(f)(i) | |
| Supplemental data | |
| Net assets, end of period (in thousands) | | $ | 203,848 | | | $ | 279,510 | | | $ | 2 | | |
| Portfolio turnover | | | 80 | % | | | 116 | % | | | 122 | % | |
Notes to Financial Highlights
(a) For the period from October 1, 2011 to July 31, 2012. During the period, the Fund's fiscal year end was changed from September 30 to July 31.
(b) For the period from September 27, 2010 (commencement of operations) to September 30, 2010.
(c) Rounds to less than $0.01.
(d) The amount shown for a share outstanding does not correspond with the aggregate net loss on investments for the period due to timing of repurchases of Fund shares in relation to fluctuating market values of the investments of the Fund.
(e) In addition to the fees and expenses which the Fund bears directly, the Fund indirectly bears a pro rata share of the fees and expenses of the acquired funds in which it invests. Such indirect expenses are not included in the reported expense ratios.
(f) Annualized.
(g) Includes interest expense which rounds to less than 0.01%.
(h) The Investment Manager and certain of its affiliates agreed to waive/reimburse certain fees and expenses, if applicable.
(i) The benefits derived from expense reductions had an impact of less than 0.01%.
The accompanying Notes to Financial Statements are an integral part of this statement.
Annual Report 2012
26
Columbia Large Cap Growth Fund
Financial Highlights (continued)
| | | Year Ended
July 31, | |
Year Ended September 30, | |
| Class R | | 2012(a) | | 2011 | | 2010(b) | |
| Per share data | |
| Net asset value, beginning of period | | $ | 20.83 | | | $ | 20.64 | | | $ | 20.68 | | |
| Income from investment operations: | |
| Net investment income (loss) | | | (0.01 | ) | | | (0.07 | ) | | | 0.00 | (c) | |
| Net realized and unrealized gain (loss) | | | 4.79 | | | | 0.26 | (d) | | | (0.04 | ) | |
| Total from investment operations | | | 4.78 | | | | 0.19 | | | | (0.04 | ) | |
| Proceeds from regulatory settlements | | | 0.00 | (c) | | | — | | | | — | | |
| Net asset value, end of period | | $ | 25.61 | | | $ | 20.83 | | | $ | 20.64 | | |
| Total return | | | 22.95 | % | | | 0.92 | % | | | (0.19 | %) | |
| Ratios to average net assets(e) | |
Expenses prior to fees waived or expenses reimbursed
(including interest expense) | | | 1.40 | %(f) | | | 1.41 | %(g) | | | 1.21 | %(f) | |
Net expenses after fees waived or expenses reimbursed
(including interest expense)(h) | | | 1.40 | %(f)(i) | | | 1.40 | %(g)(j) | | | 1.21 | %(f)(i) | |
Expenses prior to fees waived or expenses reimbursed
(excluding interest expense) | | | 1.40 | %(f) | | | 1.41 | % | | | 1.21 | %(f) | |
Net expenses after fees waived or expenses reimbursed
(excluding interest expense)(h) | | | 1.40 | %(f)(i) | | | 1.40 | %(j) | | | 1.21 | %(f)(i) | |
| Net investment income (loss) | | | (0.07 | %)(f)(i) | | | (0.32 | %)(j) | | | 1.28 | %(f)(i) | |
| Supplemental data | |
| Net assets, end of period (in thousands) | | $ | 726 | | | $ | 2,002 | | | $ | 2 | | |
| Portfolio turnover | | | 80 | % | | | 116 | % | | | 122 | % | |
Notes to Financial Highlights
(a) For the period from October 1, 2011 to July 31, 2012. During the period, the Fund's fiscal year end was changed from September 30 to July 31.
(b) For the period from September 27, 2010 (commencement of operations) to September 30, 2010.
(c) Rounds to less than $0.01.
(d) The amount shown for a share outstanding does not correspond with the aggregate net loss on investments for the period due to timing of repurchases of Fund shares in relation to fluctuating market values of the investments of the Fund.
(e) In addition to the fees and expenses which the Fund bears directly, the Fund indirectly bears a pro rata share of the fees and expenses of the acquired funds in which it invests. Such indirect expenses are not included in the reported expense ratios.
(f) Annualized.
(g) Includes interest expense which rounds to less than 0.01%.
(h) The Investment Manager and certain of its affiliates agreed to waive/reimburse certain fees and expenses, if applicable.
(i) The benefits derived from expense reductions had an impact of less than 0.01%.
(j) The benefits derived from expense reductions had an impact of 0.01%.
The accompanying Notes to Financial Statements are an integral part of this statement.
Annual Report 2012
27
Columbia Large Cap Growth Fund
Financial Highlights (continued)
| Class R4 | | Year Ended
July 31,
2012(a) | | Year Ended
September 30,
2011(b) | |
| Per share data | |
| Net asset value, beginning of period | | $ | 21.33 | | | $ | 24.86 | | |
| Income from investment operations: | |
| Net investment income | | | 0.08 | | | | 0.02 | | |
| Net realized and unrealized gain (loss) | | | 4.90 | | | | (3.55 | ) | |
| Total from investment operations | | | 4.98 | | | | (3.53 | ) | |
| Less distributions to shareholders: | |
| Net investment income | | | (0.07 | ) | | | — | | |
| Total distributions to shareholders | | | (0.07 | ) | | | — | | |
| Proceeds from regulatory settlements | | | 0.00 | (c) | | | — | | |
| Net asset value, end of period | | $ | 26.24 | | | $ | 21.33 | | |
| Total return | | | 23.38 | % | | | (14.20 | %) | |
| Ratios to average net assets(d) | |
| Expenses prior to fees waived or expenses reimbursed (including interest expense) | | | 0.97 | %(e) | | | 0.95 | %(e)(f) | |
| Net expenses after fees waived or expenses reimbursed (including interest expense)(g) | | | 0.97 | %(e) | | | 0.95 | %(e)(f)(h) | |
| Expenses prior to fees waived or expenses reimbursed (excluding interest expense) | | | 0.97 | %(e) | | | 0.95 | %(e) | |
| Net expenses after fees waived or expenses reimbursed (excluding interest expense)(g) | | | 0.97 | %(e) | | | 0.95 | %(e)(h) | |
| Net investment income | | | 0.40 | %(e) | | | 0.12 | %(e)(h) | |
| Supplemental data | |
| Net assets, end of period (in thousands) | | $ | 4,270 | | | $ | 46,696 | | |
| Portfolio turnover | | | 80 | % | | | 116 | % | |
Notes to Financial Highlights
(a) For the period from October 1, 2011 to July 31, 2012. During the period, the Fund's fiscal year end was changed from September 30 to July 31.
(b) For the period from March 7, 2011 (commencement of operations) to September 30, 2011.
(c) Rounds to less than $0.01.
(d) In addition to the fees and expenses which the Fund bears directly, the Fund indirectly bears a pro rata share of the fees and expenses of the acquired funds in which it invests. Such indirect expenses are not included in the reported expense ratios.
(e) Annualized.
(f) Includes interest expense which rounds to less than 0.01%.
(g) The Investment Manager and certain of its affiliates agreed to waive/reimburse certain fees and expenses, if applicable.
(h) The benefits derived from expense reductions had an impact of less than 0.01%.
The accompanying Notes to Financial Statements are an integral part of this statement.
Annual Report 2012
28
Columbia Large Cap Growth Fund
Financial Highlights (continued)
| Class R5 | | Year Ended
July 31,
2012(a) | | Year Ended
September 30,
2011(b) | |
| Per share data | |
| Net asset value, beginning of period | | $ | 21.36 | | | $ | 24.86 | | |
| Income from investment operations: | |
| Net investment income | | | 0.11 | | | | 0.05 | | |
| Net realized and unrealized gain (loss) | | | 4.94 | | | | (3.55 | ) | |
| Total from investment operations | | | 5.05 | | | | (3.50 | ) | |
| Less distributions to shareholders: | |
| Net investment income | | | (0.13 | ) | | | — | | |
| Total distributions to shareholders | | | (0.13 | ) | | | — | | |
| Proceeds from regulatory settlements | | | 0.00 | (c) | | | — | | |
| Net asset value, end of period | | $ | 26.28 | | | $ | 21.36 | | |
| Total return | | | 23.70 | % | | | (14.08 | %) | |
| Ratios to average net assets(d) | |
| Expenses prior to fees waived or expenses reimbursed (including interest expense) | | | 0.73 | %(e) | | | 0.70 | %(e)(f) | |
| Net expenses after fees waived or expenses reimbursed (including interest expense)(g) | | | 0.73 | %(e) | | | 0.70 | %(e)(f)(h) | |
| Expenses prior to fees waived or expenses reimbursed (excluding interest expense) | | | 0.73 | %(e) | | | 0.70 | %(e) | |
| Net expenses after fees waived or expenses reimbursed (excluding interest expense)(g) | | | 0.73 | %(e) | | | 0.70 | %(e)(h) | |
| Net investment income | | | 0.53 | %(e) | | | 0.37 | %(e)(h) | |
| Supplemental data | |
| Net assets, end of period (in thousands) | | $ | 497 | | | $ | 407 | | |
| Portfolio turnover | | | 80 | % | | | 116 | % | |
Notes to Financial Highlights
(a) For the period from October 1, 2011 to July 31, 2012. During the period, the Fund's fiscal year end was changed from September 30 to July 31.
(b) For the period from March 7, 2011 (commencement of operations) to September 30, 2011.
(c) Rounds to less than $0.01.
(d) In addition to the fees and expenses which the Fund bears directly, the Fund indirectly bears a pro rata share of the fees and expenses of the acquired funds in which it invests. Such indirect expenses are not included in the reported expense ratios.
(e) Annualized.
(f) Includes interest expense which rounds to less than 0.01%.
(g) The Investment Manager and certain of its affiliates agreed to waive/reimburse certain fees and expenses, if applicable.
(h) The benefits derived from expense reductions had an impact of less than 0.01%.
The accompanying Notes to Financial Statements are an integral part of this statement.
Annual Report 2012
29
Columbia Large Cap Growth Fund
Financial Highlights (continued)
| | | Year Ended
July 31, | |
Year Ended September 30, | |
| Class T | | 2012(a) | | 2011 | | 2010 | | 2009 | | 2008 | | 2007 | |
| Per share data | |
| Net asset value, beginning of period | | $ | 20.69 | | | $ | 20.49 | | | $ | 18.64 | | | $ | 19.42 | | | $ | 26.58 | | | $ | 22.13 | | |
| Income from investment operations: | |
| Net investment income | | | 0.01 | | | | (0.01 | ) | | | 0.03 | | | | 0.06 | | | | (0.01 | ) | | | 0.01 | | |
| Net realized and unrealized gain (loss) | | | 4.79 | | | | 0.24 | (b) | | | 1.90 | | | | (0.85 | ) | | | (5.35 | ) | | | 4.84 | | |
| Total from investment operations | | | 4.80 | | | | 0.23 | | | | 1.93 | | | | (0.79 | ) | | | (5.36 | ) | | | 4.85 | | |
| Less distributions to shareholders: | |
| Net investment income | | | — | | | | (0.03 | ) | | | (0.08 | ) | | | — | | | | — | | | | (0.03 | ) | |
| Net realized gains | | | — | | | | — | | | | — | | | | — | | | | (1.81 | ) | | | (0.37 | ) | |
| Total distributions to shareholders | | | — | | | | (0.03 | ) | | | (0.08 | ) | | | — | | | | (1.81 | ) | | | (0.40 | ) | |
| Proceeds from regulatory settlements | | | 0.00 | (c) | | | — | | | | 0.00 | (c) | | | 0.01 | | | | 0.01 | | | | — | | |
| Net asset value, end of period | | $ | 25.49 | | | $ | 20.69 | | | $ | 20.49 | | | $ | 18.64 | | | $ | 19.42 | | | $ | 26.58 | | |
| Total return | | | 23.20 | % | | | 1.12 | % | | | 10.40 | % | | | (4.02 | %) | | | (21.76 | %) | | | 22.14 | % | |
| Ratios to average net assets(d) | |
Expenses prior to fees waived or expenses
reimbursed (including interest expense) | | | 1.21 | %(e) | | | 1.15 | %(f) | | | 1.15 | %(f) | | | 1.18 | %(f) | | | 1.08 | % | | | 1.05 | %(f) | |
Net expenses after fees waived or expenses
reimbursed (including interest expense)(g) | | | 1.21 | %(e)(h) | | | 1.14 | %(f)(i) | | | 1.15 | %(f)(h) | | | 1.18 | %(f)(h) | | | 1.07 | %(i) | | | 1.05 | %(f)(h) | |
Expenses prior to fees waived or expenses
reimbursed (excluding interest expense) | | | 1.21 | %(e) | | | 1.15 | % | | | 1.15 | % | | | 1.18 | % | | | 1.08 | % | | | 1.05 | % | |
Net expenses after fees waived or expenses
reimbursed (excluding interest expense)(g) | | | 1.21 | %(e)(h) | | | 1.14 | %(i) | | | 1.15 | %(h) | | | 1.18 | %(h) | | | 1.07 | %(i) | | | 1.05 | %(h) | |
| Net investment income | | | 0.05 | %(e)(h) | | | (0.03 | %)(i) | | | 0.15 | %(h) | | | 0.38 | %(h) | | | (0.05 | %)(i) | | | 0.02 | %(h) | |
| Supplemental data | |
| Net assets, end of period (in thousands) | | $ | 146,207 | | | $ | 130,081 | | | $ | 143,784 | | | $ | 145,011 | | | $ | 169,295 | | | $ | 244,901 | | |
| Portfolio turnover | | | 80 | % | | | 116 | % | | | 122 | % | | | 146 | % | | | 164 | % | | | 151 | % | |
Notes to Financial Highlights
(a) For the period from October 1, 2011 to July 31, 2012. During the period, the Fund's fiscal year end was changed from September 30 to July 31.
(b) The amount shown for a share outstanding does not correspond with the aggregate net loss on investments for the period due to timing of repurchases of Fund shares in relation to fluctuating market values of the investments of the Fund.
(c) Rounds to less than $0.01.
(d) In addition to the fees and expenses which the Fund bears directly, the Fund indirectly bears a pro rata share of the fees and expenses of the acquired funds in which it invests. Such indirect expenses are not included in the reported expense ratios.
(e) Annualized.
(f) Includes interest expense which rounds to less than 0.01%.
(g) The Investment Manager and certain of its affiliates agreed to waive/reimburse certain fees and expenses, if applicable.
(h) The benefits derived from expense reductions had an impact of less than 0.01%.
(i) The benefits derived from expense reductions had an impact of 0.01%.
The accompanying Notes to Financial Statements are an integral part of this statement.
Annual Report 2012
30
Columbia Large Cap Growth Fund
Financial Highlights (continued)
| | | Year Ended
July 31, | |
Year Ended September 30, | |
| Class W | | 2012(a) | | 2011 | | 2010(b) | |
| Per share data | |
| Net asset value, beginning of period | | $ | 20.85 | | | $ | 20.64 | | | $ | 20.68 | | |
| Income from investment operations: | |
| Net investment income | | | 0.01 | | | | 0.02 | | | | 0.00 | (c) | |
| Net realized and unrealized gain (loss) | | | 4.82 | | | | 0.23 | (d) | | | (0.04 | ) | |
| Total from investment operations | | | 4.83 | | | | 0.25 | | | | (0.04 | ) | |
| Less distributions to shareholders: | |
| Net investment income | | | (0.02 | ) | | | (0.04 | ) | | | — | | |
| Total distributions to shareholders | | | (0.02 | ) | | | (0.04 | ) | | | — | | |
| Proceeds from regulatory settlements | | | 0.00 | (c) | | | — | | | | — | | |
| Net asset value, end of period | | $ | 25.66 | | | $ | 20.85 | | | $ | 20.64 | | |
| Total return | | | 23.19 | % | | | 1.21 | % | | | (0.19 | %) | |
| Ratios to average net assets(e) | |
Expenses prior to fees waived or expenses reimbursed
(including interest expense) | | | 1.19 | %(f) | | | 1.05 | %(g) | | | 0.96 | %(f) | |
Net expenses after fees waived or expenses reimbursed
(including interest expense)(h) | | | 1.19 | %(f)(i) | | | 1.04 | %(g)(j) | | | 0.96 | %(f)(i) | |
Expenses prior to fees waived or expenses reimbursed
(excluding interest expense) | | | 1.19 | %(f) | | | 1.05 | % | | | 0.96 | %(f) | |
Net expenses after fees waived or expenses reimbursed
(excluding interest expense)(h) | | | 1.19 | %(f)(i) | | | 1.04 | %(j) | | | 0.96 | %(f)(i) | |
| Net investment income | | | 0.07 | %(f)(i) | | | 0.07 | %(j) | | | 1.52 | %(f)(i) | |
| Supplemental data | |
| Net assets, end of period (in thousands) | | $ | 3 | | | $ | 3 | | | $ | 2 | | |
| Portfolio turnover | | | 80 | % | | | 116 | % | | | 122 | % | |
Notes to Financial Highlights
(a) For the period from October 1, 2011 to July 31, 2012. During the period, the Fund's fiscal year end was changed from September 30 to July 31.
(b) For the period from September 27, 2010 (commencement of operations) to September 30, 2010.
(c) Rounds to less than $0.01.
(d) The amount shown for a share outstanding does not correspond with the aggregate net loss on investments for the period due to timing of repurchases of Fund shares in relation to fluctuating market values of the investments of the Fund.
(e) In addition to the fees and expenses which the Fund bears directly, the Fund indirectly bears a pro rata share of the fees and expenses of the acquired funds in which it invests. Such indirect expenses are not included in the reported expense ratios.
(f) Annualized.
(g) Includes interest expense which rounds to less than 0.01%.
(h) The Investment Manager and certain of its affiliates agreed to waive/reimburse certain fees and expenses, if applicable.
(i) The benefits derived from expense reductions had an impact of less than 0.01%.
(j) The benefits derived from expense reductions had an impact of 0.01%.
The accompanying Notes to Financial Statements are an integral part of this statement.
Annual Report 2012
31
Columbia Large Cap Growth Fund
Financial Highlights (continued)
| | | Year Ended | | | |
| | | July 31, | | Year Ended September 30, | |
| Class Y | | 2012(a) | | 2011 | | 2010 | | 2009(b) | |
| Per share data | |
| Net asset value, beginning of period | | $ | 21.36 | | | $ | 21.14 | | | $ | 19.20 | | | $ | 17.02 | | |
| Income from investment operations | |
| Net investment income | | | 0.11 | | | | 0.11 | | | | 0.13 | | | | 0.03 | | |
| Net realized and unrealized gain | | | 4.94 | | | | 0.23 | (c) | | | 1.97 | | | | 2.15 | | |
| Total from investment operations | | | 5.05 | | | | 0.34 | | | | 2.10 | | | | 2.18 | | |
| Less distributions to shareholders: | |
| Net investment income | | | (0.12 | ) | | | (0.12 | ) | | | (0.16 | ) | | | — | | |
| Total distributions to shareholders | | | (0.12 | ) | | | (0.12 | ) | | | (0.16 | ) | | | — | | |
| Proceeds from regulatory settlements | | | 0.00 | (d) | | | — | | | | 0.00 | (d) | | | — | | |
| Net asset value, end of period | | $ | 26.29 | | | $ | 21.36 | | | $ | 21.14 | | | $ | 19.20 | | |
| Total return | | | 23.72 | % | | | 1.56 | % | | | 11.01 | % | | | 12.81 | % | |
| Ratios to average net assets(e) | |
Expenses prior to fees waived or expenses reimbursed
(including interest expense) | | | 0.72 | %(f) | | | 0.67 | %(g) | | | 0.64 | %(g) | | | 0.63 | %(f)(g) | |
Net expenses after fees waived or expenses reimbursed
(including interest expense)(h) | | | 0.72 | %(f) | | | 0.67 | %(g)(i) | | | 0.64 | %(g)(i) | | | 0.63 | %(f)(g)(i) | |
Expenses prior to fees waived or expenses reimbursed
(excluding interest expense) | | | 0.72 | %(f) | | | 0.67 | % | | | 0.64 | % | | | 0.63 | %(f) | |
Net expenses after fees waived or expenses reimbursed
(excluding interest expense)(h) | | | 0.72 | %(f) | | | 0.67 | %(i) | | | 0.64 | %(i) | | | 0.63 | %(f)(i) | |
| Net investment income | | | 0.55 | %(f) | | | 0.48 | %(i) | | | 0.66 | %(i) | | | 0.78 | %(f)(i) | |
| Supplemental data | |
| Net assets, end of period (in thousands) | | $ | 14,446 | | | $ | 15,311 | | | $ | 22,272 | | | $ | 16,686 | | |
| Portfolio turnover | | | 80 | % | | | 116 | % | | | 122 | % | | | 146 | % | |
Notes to Financial Highlights
(a) For the period from October 1, 2011 to July 31, 2012. During the period, the Fund's fiscal year end was changed from September 30 to July 31.
(b) For the period from July 15, 2009 (commencement of operations) to September 30, 2009.
(c) The amount shown for a share outstanding does not correspond with the aggregate net loss on investments for the period due to timing of repurchases of Fund shares in relation to fluctuating market values of the investments of the Fund.
(d) Rounds to less than $0.01.
(e) In addition to the fees and expenses which the Fund bears directly, the Fund indirectly bears a pro rata share of the fees and expenses of the acquired funds in which it invests. Such indirect expenses are not included in the reported expense ratios.
(f) Annualized.
(g) Includes interest expense which rounds to less than 0.01%.
(h) The Investment Manager and certain of its affiliates agreed to waive/reimburse certain fees and expenses, if applicable.
(i) The benefits derived from expense reductions had an impact of less than 0.01%.
The accompanying Notes to Financial Statements are an integral part of this statement.
Annual Report 2012
32
Columbia Large Cap Growth Fund
Financial Highlights (continued)
| | | Year Ended
July 31, | |
Year Ended September 30, | |
| Class Z | | 2012(a) | | 2011 | | 2010 | | 2009 | | 2008 | | 2007 | |
| Per share data | |
| Net asset value, beginning of period | | $ | 21.33 | | | $ | 21.12 | | | $ | 19.20 | | | $ | 20.02 | | | $ | 27.32 | | | $ | 22.68 | | |
| Income from investment operations: | |
| Net investment income | | | 0.07 | | | | 0.07 | | | | 0.09 | | | | 0.11 | | | | 0.06 | | | | 0.08 | | |
| Net realized and unrealized gain (loss) | | | 4.94 | | | | 0.24 | (b) | | | 1.96 | | | | (0.88 | ) | | | (5.51 | ) | | | 4.97 | | |
| Total from investment operations | | | 5.01 | | | | 0.31 | | | | 2.05 | | | | (0.77 | ) | | | (5.45 | ) | | | 5.05 | | |
| Less distributions to shareholders: | |
| Net investment income | | | (0.06 | ) | | | (0.10 | ) | | | (0.13 | ) | | | (0.06 | ) | | | (0.05 | ) | | | (0.04 | ) | |
| Net realized gains | | | — | | | | — | | | | — | | | | — | | | | (1.81 | ) | | | (0.37 | ) | |
| Total distributions to shareholders | | | (0.06 | ) | | | (0.10 | ) | | | (0.13 | ) | | | (0.06 | ) | | | (1.86 | ) | | | (0.41 | ) | |
| Proceeds from regulatory settlements | | | 0.00 | (c) | | | — | | | | 0.00 | (c) | | | 0.01 | | | | 0.01 | | | | — | | |
| Net asset value, end of period | | $ | 26.28 | | | $ | 21.33 | | | $ | 21.12 | | | $ | 19.20 | | | $ | 20.02 | | | $ | 27.32 | | |
| Total return | | | 23.52 | % | | | 1.41 | % | | | 10.74 | % | | | (3.71 | %) | | | (21.55 | %) | | | 22.53 | % | |
| Ratios to average net assets(d) | |
Expenses prior to fees waived or expenses
reimbursed (including interest expense) | | | 0.91 | %(e) | | | 0.85 | %(f) | | | 0.85 | %(f) | | | 0.88 | %(f) | | | 0.78 | % | | | 0.75 | %(f) | |
Net expenses after fees waived or expenses
reimbursed (including interest expense)(g) | | | 0.91 | %(e)(h) | | | 0.84 | %(f)(i) | | | 0.85 | %(f)(h) | | | 0.88 | %(f)(h) | | | 0.77 | %(i) | | | 0.75 | %(f)(h) | |
Expenses prior to fees waived or expenses
reimbursed (excluding interest expense) | | | 0.91 | %(e) | | | 0.85 | % | | | 0.85 | % | | | 0.88 | % | | | 0.78 | % | | | 0.75 | % | |
Net expenses after fees waived or expenses
reimbursed (excluding interest expense)(g) | | | 0.91 | %(e)(h) | | | 0.84 | %(i) | | | 0.85 | %(h) | | | 0.88 | %(h) | | | 0.77 | %(i) | | | 0.75 | %(h) | |
| Net investment income | | | 0.35 | %(e)(h) | | | 0.28 | %(i) | | | 0.45 | %(h) | | | 0.67 | %(h) | | | 0.25 | %(i) | | | 0.32 | %(h) | |
| Supplemental data | |
| Net assets, end of period (in thousands) | | $ | 735,315 | | | $ | 683,738 | | | $ | 860,959 | | | $ | 940,823 | | | $ | 979,353 | | | $ | 1,302,932 | | |
| Portfolio turnover | | | 80 | % | | | 116 | % | | | 122 | % | | | 146 | % | | | 164 | % | | | 151 | % | |
Notes to Financial Highlights
(a) For the period from October 1, 2011 to July 31, 2012. During the period, the Fund's fiscal year end was changed from September 30 to July 31.
(b) The amount shown for a share outstanding does not correspond with the aggregate net loss on investments for the period due to timing of repurchases of Fund shares in relation to fluctuating market values of the investments of the Fund.
(c) Rounds to less than $0.01.
(d) In addition to the fees and expenses which the Fund bears directly, the Fund indirectly bears a pro rata share of the fees and expenses of the acquired funds in which it invests. Such indirect expenses are not included in the reported expense ratios.
(e) Annualized.
(f) Includes interest expense which rounds to less than 0.01%.
(g) The Investment Manager and certain of its affiliates agreed to waive/reimburse certain fees and expenses, if applicable.
(h) The benefits derived from expense reductions had an impact of less than 0.01%.
(i) The benefits derived from expense reductions had an impact of 0.01%.
The accompanying Notes to Financial Statements are an integral part of this statement.
Annual Report 2012
33
Columbia Large Cap Growth Fund
Notes to Financial Statements
July 31, 2012
Note 1. Organization
Columbia Large Cap Growth Fund (the Fund), a series of Columbia Funds Series Trust I (the Trust), is a diversified fund. The Trust is registered under the Investment Company Act of 1940, as amended (the 1940 Act), as an open-end management investment company organized as a Massachusetts business trust.
Fiscal Year End Change
During the period, the Fund changed its fiscal year end from September 30 to July 31.
Fund Shares
The Trust may issue an unlimited number of shares (without par value). The Fund offers Class A, Class B, Class C, Class E, Class F, Class I, Class R, Class R4, Class R5, Class T, Class W, Class Y and Class Z shares. All share classes have identical voting, dividend and liquidation rights. Each share class has its own expense structure and sales charges, as applicable.
Class A shares are subject to a maximum front-end sales charge of 5.75% based on the initial investment amount. Class A shares purchased without an initial sales charge in accounts aggregating $1 million to $50 million at the time of purchase are subject to a contingent deferred sales charge (CDSC) if the shares are sold within 18 months of purchase, charged as follows: 1.00% CDSC if redeemed within 12 months of purchase, and 0.50% CDSC if redeemed more than 12, but less than 18, months after purchase.
Class B shares may be subject to a maximum CDSC of 5.00% based upon the holding period after purchase. Class B shares will generally convert to Class A shares eight years after purchase. The Fund no longer accepts investments by new or existing investors in the Fund's Class B shares, except in connection with the reinvestment of any dividend and/or capital gain distributions in Class B shares of the Fund and exchanges by existing Class B shareholders of certain other funds within the Columbia Family of Funds.
Class C shares are subject to a 1.00% CDSC on shares redeemed within one year of purchase.
Class E shares are trust shares which are held in an irrevocable trust until the specified trust termination date. Class E shares are subject to a maximum front-end sales charge of 4.50% based on the investment amount. Class E shares purchased without an initial sales charge in accounts aggregating $1 million to $5 million at the time of purchase are subject to a 1.00% contingent deferred sales charge (CDSC) if the shares are sold within one year after purchase. Class E shares are closed to new investors and new accounts.
Class F shares are trust shares which are held in an irrevocable trust until the specified trust termination date. Class F shares are subject to a maximum CDSC of 5.00% based upon the holding period after purchase. Class F shares will generally convert to Class E shares eight years after purchase. Class F shares are closed to new investors and new accounts.
Class I shares are not subject to sales charges and are only available to the Columbia Family of Funds.
Class R shares are not subject to sales charges and are only available to qualifying institutional investors.
Class R4 shares are not subject to sales charges; however, this share class is closed to new investors.
Class R5 shares are not subject to sales charges; however, this share class is closed to new investors.
Class T shares are subject to a maximum front-end sales charge of 5.75% based on the investment amount. Class T shares purchased without an initial sales charge in accounts aggregating $1 million to $50 million at the time of purchase are subject to a contingent deferred sales charge (CDSC) if the shares are sold within 18 months of purchase, charged as follows: 1.00% CDSC if redeemed within 12 months of purchase, and 0.50% CDSC if redeemed more than 12, but less than 18, months after purchase. Class T shares are available only to investors who received (and who have continuously held) Class T shares in connection with the merger of certain Galaxy Funds into various Columbia Funds (formerly named Liberty Funds).
Class W shares are not subject to sales charges and are only available to investors purchasing through authorized investment programs managed by investment professionals, including discretionary managed account programs.
Class Y shares are not subject to sales charges and are only available to certain categories of investors which are subject to minimum initial investment requirements.
Class Z shares are not subject to sales charges, and are only available to certain investors, as described in the Fund's Class Z prospectus.
Note 2. Summary of Significant Accounting Policies
Use of Estimates
The preparation of financial statements in accordance with U.S. generally accepted accounting principles (GAAP) requires management to make certain estimates and assumptions that affect the reported amounts of assets and liabilities, the disclosure of contingent assets and liabilities at the date of the financial statements and the reported amounts
Annual Report 2012
34
Columbia Large Cap Growth Fund
Notes to Financial Statements (continued)
July 31, 2012
of revenue and expenses during the reporting period. Actual results could differ from those estimates.
The following is a summary of significant accounting policies consistently followed by the Fund in the preparation of its financial statements.
Security Valuation
All equity securities are valued at the close of business of the New York Stock Exchange (NYSE). Equity securities are valued at the last quoted sales price on the principal exchange or market on which they trade, except for securities traded on the NASDAQ Stock Market, which are valued at the NASDAQ official close price. Unlisted securities or listed securities for which there were no sales during the day are valued at the mean of the latest quoted bid and ask prices on such exchanges or markets.
Foreign securities are valued based on quotations from the principal market in which such securities are normally traded. If any foreign share prices are not readily available as a result of limited share activity the securities are valued at the mean of the latest quoted bid and ask prices on such exchanges or markets. Foreign currency exchange rates are generally determined at 4:00 p.m. Eastern (U.S.) time. However, many securities markets and exchanges outside the U.S. close prior to the close of the NYSE; therefore, the closing prices for securities in such markets or on such exchanges may not fully reflect events that occur after such close but before the close of the NYSE. In those situations, foreign securities will be fair valued pursuant to the policy adopted by the Board of Trustees (the Board), including utilizing a third party pricing service to determine these fair values. The third party pricing service takes into account multiple factors, including, but not limited to, movements in the U.S. securities markets, certain depositary receipts, futures contracts and foreign exchange rates that have occurred subsequent to the close of the foreign exchange or market, to determine a good faith estimate that reasonably reflects the current market conditions as of the close of the NYSE. The fair value of a security is likely to be different from the quoted or published price, if available.
Investments in other open-end investment companies, including money market funds, are valued at net asset value.
Short-term securities purchased within 60 days to maturity are valued at amortized cost, which approximates market value. The value of short-term securities originally purchased with maturities greater than 60 days is determined based on an amortized value to par upon reaching 60 days to maturity. Short-term securities maturing in more than 60 days from the valuation date are valued at the market price or approximate market value based on current interest rates.
Option contracts are valued at the mean of the latest quoted bid and asked prices on their primary exchanges. Option contracts, including over-the-counter (OTC) option contracts, with no readily available market value are valued using quotations obtained from independent brokers as of the close of the NYSE.
Investments for which market quotations are not readily available, or that have quotations which management believes are not reliable, are valued at fair value as determined in good faith under consistently applied procedures established by and under the general supervision of the Board. If a security or class of securities (such as foreign securities) is valued at fair value, such value is likely to be different from the last quoted market price for the security.
The determination of fair value often requires significant judgment. To determine fair value, management may use assumptions including but not limited to future cash flows and estimated risk premiums. Multiple inputs from various sources may be used to determine fair value.
Foreign Currency Transactions and Translations
The values of all assets and liabilities denominated in foreign currencies are translated into U.S. dollars at that day's exchange rates. Net realized and unrealized gains (losses) on foreign currency transactions and translations include gains (losses) arising from the fluctuation in exchange rates between trade and settlement dates on securities transactions, gains (losses) arising from the disposition of foreign currency and currency gains (losses) between the accrual and payment dates on dividends, interest income and foreign withholding taxes.
For financial statement purposes, the Fund does not distinguish that portion of gains (losses) on investments which is due to changes in foreign exchange rates from that which is due to changes in market prices of the investments. Such fluctuations are included with the net realized and unrealized gains (losses) on investments in the Statement of Operations.
Derivative Instruments
The Fund invests in certain derivative instruments as detailed below to meet its investment objectives. Derivatives are instruments whose values depend on, or are derived from, in whole or in part, the value of one or more other assets, such as securities, currencies, commodities or indices. Derivative instruments may be used to maintain cash reserves while maintaining exposure to certain other assets, to offset anticipated declines in values of investments, to facilitate trading, to reduce transaction costs and to pursue higher investment returns. The Fund may also use derivative instruments to mitigate certain investment risks, such as foreign currency exchange rate risk, interest rate risk and credit risk. Derivatives may involve various
Annual Report 2012
35
Columbia Large Cap Growth Fund
Notes to Financial Statements (continued)
July 31, 2012
risks, including the potential inability of the counterparty to fulfill its obligation under the terms of the contract, the potential for an illiquid secondary market and the potential for market movements which may expose the Fund to gains or losses in excess of the amount shown in the Statement of Assets and Liabilities.
The Fund and any counterparty are required to maintain an agreement that requires the Fund and that counterparty to monitor (on a daily basis) the net fair value of all derivatives entered into pursuant to the agreement between the Fund and such counterparty. If the net fair value of such derivatives between the Fund and that counterparty exceeds a certain threshold (as defined in the agreement), the Fund or the counterparty (as the case may be) is required to post cash and/or securities as collateral. Fair values of derivatives presented in the financial statements are not netted with the fair value of other derivatives or with any collateral amounts posted by the Fund or any counterparty.
Options
Options are contracts which entitle the holder to purchase or sell securities or other identified assets at a specified price, or in the case of index option contracts, to receive or pay the difference between the index value and the strike price of the index option contract. The Fund purchased and wrote option contracts to decrease the Fund's exposure to equity risk and to increase return on investments. Completion of transactions for option contracts traded in the OTC market depends upon the performance of the other party. Cash collateral may be collected or posted by the Fund to secure certain OTC option contract trades. Cash collateral held or posted by the Fund for such option contract trades must be returned to the counterparty or the Fund upon closure, exercise or expiration of the contract.
Option contracts purchased are recorded as investments and options contracts written are recorded as liabilities of the Fund. The Fund will realize a gain or loss when the option contract expires or is exercised. When option contracts on debt securities or futures are exercised, the Fund will realize a gain or loss. When other option contracts are exercised, the proceeds on sales for a written call or purchased put option contract, or the purchase cost for a written put or purchased call option contract, is adjusted by the amount of premium received or paid.
The risk in buying an option contract is that the Fund pays a premium whether or not the option contract is exercised. The Fund also has the additional risk of being unable to enter into a closing transaction if a liquid secondary market does not exist. The risk in writing a call option contract is that the Fund gives up the opportunity for profit if the market price of the security increases. The risk in writing a put option contract is that the Fund may incur a loss if the market price of the security decreases and the option contract is exercised. The Fund's maximum payout in the case of written put option contracts represents the maximum potential amount of future payments (undiscounted) that the Fund could be required to make under the contract. For OTC options contracts, the transaction is also subject to counterparty credit risk. The maximum payout amount may be offset by the subsequent sale, if any, of assets obtained upon the exercise of the put option contracts by holders of the option contracts or proceeds received upon entering into the contracts. Contracts and premiums associated with options contracts written for the year ended July 31, 2012 are as follows:
| | | Calls | |
| | | Contracts | | Premiums ($) | |
| Balance at September 30, 2011 | | | — | | | | — | | |
| Opened | | | 320 | | | | 37,431 | | |
| Expired | | | (320 | ) | | | (37,431 | ) | |
| Balance at July 31, 2012 | | | — | | | | — | | |
Effects of Derivative Transactions in the Financial Statements
The following tables are intended to provide additional information about the effect of derivatives on the financial statements of the Fund, including: the fair value of derivatives by risk category and the location of those fair values in the Statement of Assets and Liabilities; the impact of derivative transactions on the Fund's operations over the period including realized gains or losses and unrealized gains or losses. The derivative schedules following the Portfolio of Investments present additional information regarding derivative instruments outstanding at the end of the period, if any.
At July 31, 2012, the fund had no outstanding derivatives.
The effect of derivative instruments in the Statement of Operations for the period ended July 31, 2012:
| Amount of Realized Gain (Loss) on Derivatives Recognized in Income | |
Risk Exposure
Category | | Options Contracts
Written and
Purchased ($) | |
| Equity contracts | | | 37,431 | | |
The following table is a summary of the volume of derivative instruments for the six months ended June 30, 2012:
| Derivative Instrument | | Contracts Opened | |
| Options Contracts | | | (320 | ) | |
Repurchase Agreements
The Fund may engage in repurchase agreement transactions with institutions that management has determined are creditworthy. The Fund, through the custodian, receives
Annual Report 2012
36
Columbia Large Cap Growth Fund
Notes to Financial Statements (continued)
July 31, 2012
delivery of the underlying securities collateralizing a repurchase agreement. Management is responsible for determining that the collateral is at least equal, at all times, to the value of the repurchase obligation including interest. A repurchase agreement transaction involves certain risks in the event of default or insolvency of the counterparty. These risks include possible delays in or restrictions on a Fund's ability to dispose of the underlying securities and a possible decline in the value of the underlying securities during the period while the Fund seeks to assert its rights.
Security Transactions
Security transactions are accounted for on the trade date. Cost is determined and gains (losses) are based upon the specific identification method for both financial statement and federal income tax purposes.
Income Recognition
Corporate actions and dividend income are recorded net of any non-reclaimable tax withholdings, on the ex-dividend date or upon receipt of ex-dividend notification in the case of certain foreign securities.
Interest income is recorded on an accrual basis.
The Fund may receive distributions from holdings in business development companies (BDCs), exchange traded funds (ETFs) and real estate investment trusts (REITs), which report information on the character of their distributions annually. These distributions are allocated to dividend income, capital gain and return of capital based on estimates made by the Fund's management if actual information has not yet been reported. Return of capital is recorded as a reduction of the cost basis of securities held. Management's estimates are subsequently adjusted when the actual character of the distributions is disclosed by the BDCs, ETFs and REITs, which could result in a proportionate change in return of capital to shareholders.
Awards from class action litigation are recorded as a reduction of cost basis if the Fund still owns the applicable securities on the payment date. If the Fund no longer owns the applicable securities, the proceeds are recorded as realized gains.
Expenses
General expenses of the Trust are allocated to the Fund and other funds of the Trust based upon relative net assets or other expense allocation methodologies determined by the nature of the expense. Expenses directly attributable to the Fund are charged to the Fund. Expenses directly attributable to a specific class of shares are charged to that share class.
Determination of Class Net Asset Value
All income, expenses (other than class-specific expenses, which are charged to that share class, as shown in the Statement of Operations) and realized and unrealized gains (losses) are allocated to each class of the Fund on a daily basis, based on the relative net assets of each class, for purposes of determining the net asset value of each class.
Federal Income Tax Status
The Fund intends to qualify each year as a regulated investment company under Subchapter M of the Internal Revenue Code, as amended, and will distribute substantially all of its taxable income (including net short-term capital gains), if any, for its tax year, and as such will not be subject to federal income taxes. In addition, the Fund intends to distribute in each calendar year substantially all of its net investment income, capital gains and certain other amounts, if any, such that the Fund should not be subject to federal excise tax. Therefore, no federal income or excise tax provision is recorded.
Foreign Taxes
The Fund may be subject to foreign taxes on income, gains on investments or currency repatriation, a portion of which may be recoverable. The Fund will accrue such taxes and recoveries, as applicable, based upon its current interpretation of tax rules and regulations that exist in the markets in which it invests.
Realized gains in certain countries may be subject to foreign taxes at the Fund level, based on statutory rates. The Fund accrues for such foreign taxes on net realized and unrealized gains at the appropriate rate for each jurisdiction, as applicable. The amount, if any, is disclosed as a liability on the Statement of Assets and Liabilities.
Distributions to Shareholders
Distributions from net investment income, if any, are declared and paid annually. Net realized capital gains, if any, are distributed along with the income dividend. Income distributions and capital gain distributions are determined in accordance with federal income tax regulations, which may differ from GAAP.
Guarantees and Indemnifications
Under the Trust's organizational documents and, in some cases, by contract, its officers and trustees are indemnified against certain liabilities arising out of the performance of their duties to the Trust or its funds. In addition, certain of the Fund's contracts with its service providers contain general indemnification clauses. The Fund's maximum exposure under these arrangements is unknown since the amount of any future claims that may be made against the Fund cannot be determined, and the Fund has no historical basis for predicting the likelihood of any such claims.
Annual Report 2012
37
Columbia Large Cap Growth Fund
Notes to Financial Statements (continued)
July 31, 2012
Recent Accounting Pronouncement
Disclosures about Offsetting Assets and Liabilities
In December 2011, the Financial Accounting Standards Board (FASB) issued ASU No. 2011-11, Disclosures about Offsetting Assets and Liabilities. The objective of the FASB is to enhance current disclosure requirements on offsetting of certain assets and liabilities and to enable financial statement users to compare financial statements prepared under GAAP and International Financial Reporting Standards.
Specifically, ASU No. 2011-11 requires an entity to disclose both gross and net information for derivatives and other financial instruments that are subject to a master netting arrangement or similar agreement. The standard requires disclosure of collateral received in connection with the master netting agreements or similar agreements. The effective date of ASU No. 2011-11 is for interim and annual periods beginning on or after January 1, 2013. At this time, management is evaluating the implications of this guidance and the impact it will have on the financial statement amounts and footnote disclosures, if any.
Note 3. Fees and Compensation Paid to Affiliates
Investment Management Fees
Under an Investment Management Services Agreement, Columbia Management Investment Advisers, LLC (the Investment Manager), a wholly-owned subsidiary of Ameriprise Financial, Inc. (Ameriprise Financial), determines which securities will be purchased, held or sold. The management fee is an annual fee that is equal to a percentage of the Fund's average daily net assets that declines from 0.71% to 0.54% as the Fund's net assets increase. Prior to April 1, 2011, the management fee was equal to a percentage of the Fund's average daily net assets that declines from 0.70% to 0.45% as the Fund's net assets increase. The annualized effective management fee rate for the period ended July 31, 2012, and for the year ended September 30, 2011, was 0.63% and 0.58%, respectively, of the Fund's average daily net assets.
Administration Fees
Under an Administrative Services Agreement, the Investment Manager serves as the Fund Administrator. The Fund pays the Fund Administrator an annual fee for administration and accounting services equal to a percentage of the Fund's average daily net assets that declines from 0.06% to 0.03% as the Fund's net assets increase. Prior to April 1, 2011, the administration fee was equal to the annual rate of 0.05% of the Fund's average daily net assets. The annualized effective administration fee rate for the period ended July 31, 2012, and for the year ended September 30, 2011, was 0.05% and 0.05%, respectively, of the Fund's average daily net assets.
Pricing and Bookkeeping Fees
Prior to March 28, 2011, the Fund had entered into a Financial Reporting Services Agreement (the Financial Reporting Services Agreement) with State Street Bank and Trust Company (State Street) and the Investment Manager pursuant to which State Street provided financial reporting services to the Fund. The Fund also entered into an Accounting Services Agreement (collectively with the Financial Reporting Services Agreement, the State Street Agreements) with State Street and the Investment Manager pursuant to which State Street provided accounting services to the Fund. Under the State Street Agreements, the Fund paid State Street an annual fee of $38,000 paid monthly plus an additional monthly fee based on an annualized percentage rate of average daily net assets of the Fund for the month. The aggregate fee did not exceed $140,000 per year (exclusive of out-of-pocket expenses and charges). The Fund also reimbursed State Street for certain out-of-pocket expenses and charges. Effective March 28, 2011, these services are now provided under the Administrative Services Agreement discussed above.
Compensation of Board Members
Board members are compensated for their services to the Fund as disclosed in the Statement of Operations. The Trust's eligible Trustees may participate in a Deferred Compensation Plan (the Plan) which may be terminated at any time. Obligations of the Plan will be paid solely out of the Fund's assets.
Compensation of Chief Compliance Officer
The Board has appointed a Chief Compliance Officer to the Fund in accordance with federal securities regulations. The Fund pays its pro-rata share of the expenses associated with the Chief Compliance Officer. The Fund's expenses for the Chief Compliance Officer will not exceed $15,000 per year.
Transfer Agent Fees
Under a Transfer and Dividend Disbursing Agent Agreement, Columbia Management Investment Services Corp. (the Transfer Agent), an affiliate of the Investment Manager and a wholly-owned subsidiary of Ameriprise Financial, is responsible for providing transfer agency services to the Fund. The Transfer Agent has contracted with Boston Financial Data Services (BFDS) to serve as sub-transfer agent.
The Transfer Agent receives monthly account-based service fees based on the number of open accounts and is reimbursed by the Fund for the fees and expenses the Transfer Agent pays to financial intermediaries that maintain omnibus accounts with the Fund that is a percentage of the average aggregate value of the Fund's shares maintained in each such omnibus account (other than omnibus accounts for which American
Annual Report 2012
38
Columbia Large Cap Growth Fund
Notes to Financial Statements (continued)
July 31, 2012
Enterprise Investment Services Inc. is the broker of record or accounts where the beneficial shareholder is a customer of Ameriprise Financial Services, Inc., which are paid a per account fee). The Transfer Agent pays the fees of BFDS for services as sub-transfer agent and is not entitled to reimbursement for such fees from the Fund (with the exception of out-of-pocket fees).
The Transfer Agent also receives compensation from fees for various shareholder services and reimbursements for certain out-of-pocket expenses. Class I shares do not pay transfer agent fees. Total transfer agent fees for Class R4 and Class R5 shares are subject to an annual limitation of not more than 0.05% of the average daily net assets attributable to each share class.
For the period ended July 31, 2012, and for the year ended September 30, 2011, the Fund's annualized effective transfer agent fee rates as a percentage of average daily net assets of each class were as follows:
| | | Period Ended
July 31,
2012 | | Year Ended
September 30,
2011 | |
| Class A | | | 0.19 | % | | | 0.20 | % | |
| Class B | | | 0.19 | | | | 0.21 | | |
| Class C | | | 0.20 | | | | 0.19 | | |
| Class E | | | 0.20 | | | | 0.18 | | |
| Class F | | | 0.18 | | | | 0.18 | | |
| Class R | | | 0.19 | | | | 0.21 | | |
| Class R4 | | | 0.01 | | | | 0.00 | (a) | |
| Class R5 | | | 0.01 | | | | 0.00 | (a) | |
| Class T | | | 0.20 | | | | 0.18 | | |
| Class W | | | 0.23 | | | | 0.18 | | |
| Class Y | | | 0.00 | (a) | | | 0.00 | (a) | |
| Class Z | | | 0.20 | | | | 0.18 | | |
(a) Round to less than 0.01%
The Fund and certain other associated investment companies, have severally, but not jointly, guaranteed the performance and observance of all the terms and conditions of a lease entered into by Seligman Data Corp. (SDC), the former transfer agent, including the payment of rent by SDC (the Guaranty). The lease and the Guaranty expire in January 2019. At July 31, 2012, the Fund's total potential future obligation over the life of the Guaranty is $268,231. The liability remaining at July 31, 2012 for non-recurring charges associated with the lease amounted to $137,357 and is recorded as a part of payable for other expenses in the Statement of Assets and Liabilities. SDC is owned by six associated investment companies, including the Fund. The Fund's ownership interest in SDC at July 31, 2012 is recorded as a part of other assets in the Statement of Assets and Liabilities at a cost of $44,481.
An annual minimum account balance fee of $20 may apply to certain accounts with a value below the Fund's initial minimum investment requirements to reduce the impact of small accounts on transfer agent fees. These minimum account balance fees are recorded as part of expense reductions in the Statement of Operations. For the period ended July 31, 2012, these minimum account balance fees reduced total expenses by $91,537. For the year ended September 30, 2011, no minimum account balance fees were charged to accounts.
Plan Administration Fees
Under a Plan Administration Services Agreement with the Transfer Agent, the Fund pays an annual fee at a rate of 0.25% of the Fund's average daily net assets attributable to Class R4 shares for the provision of various administrative, recordkeeping, communication and educational services.
Distribution and Service Fees
The Fund has an agreement with Columbia Management Investment Distributors, Inc. (the Distributor), an affiliate of the Investment Manager and a wholly-owned subsidiary of Ameriprise Financial, for distribution and shareholder services. Pursuant to Rule 12b-1 under the 1940 Act, the Board has approved, and the Fund has adopted, distribution and shareholder service plans (the Plans) which set the distribution and service fees for the Fund. These fees are calculated daily and are intended to compensate the Distributor and/or eligible selling and/or servicing agents for selling shares of the Fund and providing services to investors.
The Plans require the payment of a monthly service fee to the Distributor at the maximum annual rate of 0.25% of the average daily net assets attributable to Class A, Class B, Class C, Class E, Class F and Class W shares of the Fund. The Plans also require the payment of a monthly distribution fee to the Distributor at the maximum annual rates of 0.10%, 0.75%, 0.75%, 0.10%, 0.75%, 0.50% and 0.25% of the average daily net assets attributable to Class A, Class B, Class C, Class E, Class F, Class R and Class W shares, respectively.
The Fund may pay distribution and service fees up to a maximum annual rate of 0.35% of the Fund's average daily net assets attributable to Class A shares (comprised of up to 0.10% for distribution services and up to 0.25% for shareholder liaison services), but currently limit such fees to an aggregate fee of not more than 0.25% of the Fund's average daily net assets attributable to Class A shares.
The Fund may pay a distribution fee of up to 0.25% of the Fund's average daily net assets attributable to Class W shares and a service fee of up to 0.25% of the Fund's average daily net assets attributable to Class W shares, provided, however, that the aggregate fee shall not exceed 0.25% of the Fund's average daily net assets attributable to Class W shares.
Annual Report 2012
39
Columbia Large Cap Growth Fund
Notes to Financial Statements (continued)
July 31, 2012
Shareholder Services Fees
The Fund has adopted a shareholder services plan that permits it to pay for certain services provided to Class T shareholders by their selling and/or servicing agents. The Fund may pay shareholder servicing fees up to an aggregate annual rate of 0.50% of the Fund's average daily net assets attributable to Class T shares (comprised of up to 0.25% for shareholder liaison services and up to 0.25% for administrative support services). These fees are currently limited to an aggregate annual rate of not more than 0.30% of the Fund's average daily net assets attributable to Class T shares. The annualized effective shareholder services fee rate for the period ended July 31, 2012 and for the year ended September 30, 2012, was 0.30% of the Fund's average daily net assets attributable to Class T shares.
Sales Charges
Sales charges, including front-end charges and CDSCs, received by the Distributor for distributing Fund shares were $558,200 for Class A, $29,752 for Class B, $2,515 for Class C, $554 for Class E and $18,316 for Class T shares for the period ended July 31, 2012 and $389,500 for Class A, $32,947 for Class B, $1,778 for Class C, $833 for Class E and $16,016 for Class T shares for the year ended September 30, 2011.
Expenses Waived/Reimbursed by the Investment Manager and its Affiliates
The Investment Manager and certain of its affiliates have contractually agreed to waive fees and/or reimburse expenses (excluding certain fees and expenses described below), through January 31, 2013, unless sooner terminated at the sole discretion of the Board, so that the Fund's net operating expenses, after giving effect to fees waived/expenses reimbursed and/or overdraft charges from the Fund's custodian, do not exceed the following annual rates as a percentage of the class' average daily net assets:
| Class A | | | 1.25 | % | |
| Class B | | | 2.00 | | |
| Class C | | | 2.00 | | |
| Class E | | | 1.35 | | |
| Class F | | | 2.00 | | |
| Class I | | | 0.85 | | |
| Class R | | | 1.50 | | |
| Class R4 | | | 1.15 | | |
| Class R5 | | | 0.90 | | |
| Class T | | | 1.30 | | |
| Class W | | | 1.25 | | |
| Class Y | | | 1.00 | | |
| Class Z | | | 1.00 | | |
Under the agreement, the following fees and expenses, are excluded from the waiver/reimbursement commitment, and therefore will be paid by the Fund, if applicable: taxes (including foreign transaction taxes), expenses associated with investments in affiliated and non-affiliated pooled investment vehicles (including mutual funds and exchange traded funds), transaction costs and brokerage commissions, costs related to any securities lending program, dividend expenses associated with securities sold short, inverse floater program fees and expenses, transaction charges and interest on borrowed money, interest, extraordinary expenses and any other expenses the exclusion of which is specifically approved by the Fund's Board. This agreement may be modified or amended only with approval from all parties.
Note 4. Federal Tax Information
The timing and character of income and capital gain distributions are determined in accordance with income tax regulations, which may differ from GAAP because of temporary or permanent book to tax differences.
At July 31, 2012, these differences are primarily due to differing treatment for deferral/reversal of wash sales losses, Trustees' deferred compensation, excess distributions, expiring capital loss carryforwards, foreign currency transactions and proceeds from regulatory settlements. To the extent these differences are permanent, reclassifications are made among the components of the Fund's net assets in the Statement of Assets and Liabilities. Temporary differences do not require reclassifications. In the Statement of Assets and Liabilities the following reclassifications were made:
| Excess of distributions over net investment income | | $ | 600,827 | | |
| Accumulated net realized loss | | | 84,894,097 | | |
| Paid-in capital | | | (85,494,924 | ) | |
Net investment income and net realized gains (losses), as disclosed in the Statement of Operations, and net assets were not affected by this reclassification.
The tax character of distributions paid during the periods indicated was as follows:
| | | Period Ended
July 31,
2012 | | Year Ended
September 30,
2011 | |
| Ordinary income | | $ | 4,914,787 | | | $ | 5,290,446 | | |
Short-term capital gain distributions, if any, are considered ordinary income distributions for tax purposes.
At July 31, 2012, the components of distributable earnings on a tax basis were as follows:
| Undistributed ordinary income | | $ | — | | |
| Undistributed accumulated long-term gain | | | — | | |
| Unrealized appreciation | | | 404,616,376 | | |
Annual Report 2012
40
Columbia Large Cap Growth Fund
Notes to Financial Statements (continued)
July 31, 2012
At July 31, 2012, the cost of investments for federal income tax purposes was $2,548,385,096 and the aggregate gross unrealized appreciation and depreciation based on that cost was:
| Unrealized appreciation | | $ | 443,147,846 | | |
| Unrealized depreciation | | | (38,531,470 | ) | |
| Net unrealized appreciation | | $ | 404,616,376 | | |
The following capital loss carryforward, determined at July 31, 2012, may be available to reduce taxable income arising from future net realized gains on investments, if any, to the extent permitted by the Internal Revenue Code:
| Year of Expiration | | Amount ($) | |
| 2015 | | | 269,836,779 | | |
| 2016 | | | 25,492,915 | | |
| 2018 | | | 61,969,057 | | |
| Total | | | 357,298,751 | | |
For the period ended July 31, 2012, $184,211,833 of capital loss carryforward was utilized. Due to limitations under the Internal Revenue Code $85,004,880 of capital loss carryforwards acquired from the prior year merger were permanently lost and expired as unused.
Management of the Fund has concluded that there are no significant uncertain tax positions that would require recognition in the financial statements. However, management's conclusion may be subject to review and adjustment at a later date based on factors including, but not limited to, new tax laws, regulations, and administrative interpretations (including relevant court decisions). Generally, the Fund's federal tax returns for the prior three fiscal years remain subject to examination by the Internal Revenue Service.
Note 5. Portfolio Information
The cost of purchases and proceeds from sales of securities, excluding short-term obligations, aggregated to $2,014,540,814 and $2,497,020,962, respectively, for the period ended July 31, 2012.
Note 6. Regulatory Settlements
During the period ended July 31, 2012 and the year ended September 30, 2011 and 2010, the Fund received $342,877, — and $24,162, respectively, as a result of a regulatory settlement proceeding brought by the Securities and Exchange Commission against an unaffiliated third party relating to market timing and/or late trading of mutual funds. This amount represented the Fund's portion of the proceeds from the settlement (the Fund was not a party to the proceeding). The payments have been included in "Proceeds from regulatory settlements" in the Statement of Changes in Net Assets.
Note 7. Lending of Portfolio Securities
Effective March 28, 2011, the Fund has entered into a Master Securities Lending Agreement (the Agreement) with JPMorgan Chase Bank, N.A. (JPMorgan). The Agreement, which replaces the previous securities lending arrangement with State Street, authorizes JPMorgan as lending agent to lend securities to authorized borrowers in order to generate additional income on behalf of the Fund. Pursuant to the Agreement, the securities loaned are secured by cash or securities that either are issued or guaranteed as to principal and interest by the U.S. government, its agencies, authorities or instrumentalities with value equal to at least 100% of the market value of the loaned securities. Any additional collateral required to maintain those levels due to market fluctuations of the loaned securities is requested to be delivered the following business day. Cash collateral received is invested by the lending agent on behalf of the Fund into authorized investments pursuant to the Agreement. The investments made with the cash collateral are listed in the Portfolio of Investments. The values of such investments and any uninvested cash collateral are disclosed in the Statement of Assets and Liabilities along with the related obligation to return the collateral upon the return of the securities loaned.
Risks of delay in recovery of securities or even loss of rights in the securities may occur should the borrower of the securities fail financially. Risks may also arise to the extent that the value of the securities loaned increases above the value of the collateral received. JPMorgan will indemnify the Fund from losses resulting from a borrower's failure to return a loaned security when due. Such indemnification does not extend to losses associated with declines in the value of cash collateral investments. The Investment Manager is not responsible for any losses incurred by the Fund in connection with the securities lending program. Loans are subject to termination by the Fund or the borrower at any time, and are, therefore, not considered to be illiquid investments.
Pursuant to the Agreement, the Fund receives income for lending its securities either in the form of fees or by earning interest on invested cash collateral, net of negotiated rebates paid to borrowers and fees paid to the lending agent for services provided and any other securities lending expenses. Net income earned from securities lending for the period ended July 31, 2012 is disclosed in the Statement of Operations. The Fund continues to earn and accrue interest and dividends on the securities loaned.
Prior to March 28, 2011, the Fund participated in a securities lending arrangement with State Street. Each security on loan was collateralized in an amount at least equal to the market value of the securities loaned plus accrued income from the investment of collateral. The income generated by the
Annual Report 2012
41
Columbia Large Cap Growth Fund
Notes to Financial Statements (continued)
July 31, 2012
investment of the collateral, net of any fees remitted to State Street as the lending agent and borrower rebates, was paid to the Fund.
At July 31, 2012, securities valued at $437,292,423 were on loan, secured by cash collateral of $449,095,069 (which does not reflect calls for collateral made to borrowers by JPMorgan at period end) that is partially or fully invested in short-term securities or other cash equivalents.
Note 8. Custody Credits
Prior to March 28, 2011, the Fund had an agreement with its custodian bank under which custody fees may have been reduced by balance credits. These credits are recorded as part of expense reductions on the Statement of Operations. The Fund could have invested a portion of the assets utilized in connection with the expense offset arrangement in an income-producing asset if they had not entered into such an agreement. Subsequent to this date, the Fund may invest its daily balance in an affiliated money market fund as detailed below. For the period October 1, 2010 through March 28, 2011, these credits reduced total expenses by $38.
Note 9. Affiliated Money Market Fund
The Fund may invest its daily cash balances in Columbia Short-Term Cash Fund, an affiliated money market fund established for the exclusive use by the Fund and other affiliated funds. The income earned by the Fund from such investments is included as "Dividends from affiliates" in the Statement of Operations. As an investing fund, the Fund indirectly bears its proportionate share of the expenses of Columbia Short-Term Cash Fund.
Note 10. Line of Credit
The Fund has entered into a revolving credit facility with a syndicate of banks led by JPMorgan Chase Bank N.A. (the Administrative Agent) whereby the Fund may borrow for the temporary funding of shareholder redemptions or for other temporary or emergency purposes. The credit facility became effective on March 28, 2011, replacing a prior credit facility. The credit facility agreement, as amended, which is a collective agreement between the Fund and certain other funds managed by the Investment Manager, severally and not jointly, permits collective borrowings up to $500 million. Pursuant to a December 13, 2011 amendment to the credit facility agreement, interest is charged to each participating fund based on its borrowings at a rate equal to the higher of (i) the overnight federal funds rate plus 1.00% or (ii) the one-month LIBOR rate plus 1.00%. Each borrowing under the credit facility matures no later than 60 days after the date of borrowing. The Fund also pays a commitment fee equal to its pro rata share of the amount of the credit facility at a rate of 0.08% per annum. For the period March 28, 2011 through December 13, 2011, interest was charged to each participating fund based on its borrowings at a rate equal to the sum of the federal funds rate plus (i) 1.25% per annum plus (ii) if one-month LIBOR exceeds the federal funds rate, the amount of such excess. The Fund also paid a commitment fee equal to its pro rata share of the amount of the credit facility at a rate of 0.10% per annum.
Prior to March 28, 2011, the Fund and certain other funds managed by the Investment Manager participated in a $280 million committed, unsecured revolving credit facility provided by State Street. Effective October 14, 2010, interest was charged to each fund based on its borrowings at a rate equal to the greater of the (i) federal funds rate plus 1.25% per annum or (ii) the overnight LIBOR rate plus 1.25% per annum. The Fund also paid a commitment fee equal to its pro rata share of the amount of the credit facility at a rate of 0.125% per annum. Prior to October 14, 2010, interest was charged to each participating fund at the same rates. In addition, a commitment fee of 0.15% per annum was accrued and apportioned among the participating funds pro rata based on their relative net assets.
The Fund had no borrowings during the period ended July 31, 2012.
For the year ended September 30, 2011, the average daily loan balance outstanding on days when borrowing existed was $3,389,474 at a weighted average interest rate of 1.49%.
Note 11. Shareholder Concentration
At July 31, 2012, one unaffiliated shareholder account owned 11.5% of the outstanding shares of the Fund. The Fund has no knowledge about whether any portion of those shares was owned beneficially by such account. Subscription and redemption activity by concentrated accounts may have a significant effect on the operations of the Fund.
Note 12. Fund Merger
At the close of business on April 8, 2011, the Fund acquired the assets and assumed the identified liabilities of Seligman Growth Fund, Inc. The reorganization was completed after shareholders approved the plan on February 15, 2011. The purpose of the transaction was to combine two funds managed by the Investment Manager with comparable investment objectives and strategies.
The aggregate net assets of the Fund immediately before the acquisition were $1,370,709,312 and the combined net assets immediately after the acquisition were $3,115,097,587.
Annual Report 2012
42
Columbia Large Cap Growth Fund
Notes to Financial Statements (continued)
July 31, 2012
The merger was accomplished by a tax-free exchange of 347,407,998 shares of Seligman Growth Fund, Inc. valued at $1,744,388,275 (including $317,686,293 of unrealized appreciation).
In exchange for Seligman Growth Fund, Inc. shares, the Fund issued the following number of shares:
| Shares | |
| Class A | | | 53,028,074 | | |
| Class B | | | 3,263,755 | | |
| Class C | | | 1,277,699 | | |
| Class I | | | 10,806,161 | | |
| Class R | | | 99,267 | | |
| Class R4 | | | 2,096,295 | | |
| Class R5 | | | 18,952 | | |
For financial reporting purposes, net assets received and shares issued by the Fund were recorded at fair value; however, Seligman Growth Fund Inc.'s cost of investments was carried forward.
The financial statements reflect the operations of the Fund for the period prior to the merger and the combined fund for the period subsequent to the merger. Because the combined investment portfolios have been managed as a single integrated portfolio since the merger was completed, it is not practicable to separate the amounts of revenue and earnings of Seligman Growth Fund Inc. that have been included in the combined Fund's Statement of Operations since the merger was completed.
Assuming the merger had been completed on October 1, 2010, the Fund's pro-forma net investment loss, net gain on investments, net change in unrealized depreciation and net increase in net assets from operations for the year ended September 30, 2011 would have been approximately $(0.7) million, $384.0 million, $(289.3) million and $94.0 million, respectively.
Note 13. Significant Risks
Technology and Technology-related Investment Risk
At July 31, 2012, the Fund invested a significant portion of its assets in technology and technology-related companies. The market prices of technology and technology-related stocks tend to exhibit a greater degree of market risk and price volatility than other types of investments.
Note 14. Subsequent Events
Management has evaluated the events and transactions that have occurred through the date the financial statements were issued and noted no items requiring adjustment of the financial statements or additional disclosure.
Note 15. Information Regarding Pending and Settled Legal Proceedings
In December 2005, without admitting or denying the allegations, American Express Financial Corporation (AEFC, which is now known as Ameriprise Financial, Inc. (Ameriprise Financial)) entered into settlement agreements with the Securities and Exchange Commission (SEC) and Minnesota Department of Commerce (MDOC) related to market timing activities. As a result, AEFC was censured and ordered to cease and desist from committing or causing any violations of certain provisions of the Investment Advisers Act of 1940, the Investment Company Act of 1940, and various Minnesota laws. AEFC agreed to pay disgorgement of $10 million and civil money penalties of $7 million. AEFC also agreed to retain an independent distribution consultant to assist in developing a plan for distribution of all disgorgement and civil penalties ordered by the SEC in accordance with various undertakings detailed at www.sec.gov/litigation/admin/ia-2451.pdf. Ameriprise Financial and its affiliates have cooperated with the SEC and the MDOC in these legal proceedings, and have made regular reports to the funds' Boards of Trustees.
Ameriprise Financial and certain of its affiliates have historically been involved in a number of legal, arbitration and regulatory proceedings, including routine litigation, class actions, and governmental actions, concerning matters arising in connection with the conduct of their business activities. Ameriprise Financial believes that the Funds are not currently the subject of, and that neither Ameriprise Financial nor any of its affiliates are the subject of, any pending legal, arbitration or regulatory proceedings that are likely to have a material adverse effect on the Funds or the ability of Ameriprise Financial or its affiliates to perform under their contracts with the Funds. Ameriprise Financial is required to make 10-Q, 10-K and, as necessary, 8-K filings with the Securities and Exchange Commission on legal and regulatory matters that relate to Ameriprise Financial and its affiliates. Copies of these filings may be obtained by accessing the SEC website at www.sec.gov.
There can be no assurance that these matters, or the adverse publicity associated with them, will not result in increased fund redemptions, reduced sale of fund shares or other adverse consequences to the Funds. Further, although we believe proceedings are not likely to have a material adverse effect on the Funds or the ability of Ameriprise Financial or its affiliates to perform under their contracts with the Funds, these proceedings are subject to uncertainties and, as such, we are unable to estimate the possible loss or range of loss that may result. An adverse outcome in one or more of these proceedings could result in adverse judgments, settlements, fines, penalties or other relief that could have a material adverse effect on the consolidated financial condition or results of operations of Ameriprise Financial.
Annual Report 2012
43
Columbia Large Cap Growth Fund
Report of Independent Registered Public Accounting Firm
To the Trustees of Columbia Funds Series Trust I and
the Shareholders of Columbia Large Cap Growth Fund
In our opinion, the accompanying statement of assets and liabilities, including the portfolio of investments, and the related statements of operations and of changes in net assets and the financial highlights present fairly, in all material respects, the financial position of Columbia Large Cap Growth Fund (the "Fund") (a series of Columbia Funds Series Trust I) at July 31, 2012, the results of its operations, the changes in its net assets and the financial highlights for each of the periods indicated, in conformity with accounting principles generally accepted in the United States of America. These financial statements and financial highlights (hereafter referred to as "financial statements") are the responsibility of the Fund's management. Our responsibility is to express an opinion on these financial statements based on our audits. We conducted our audits of these financial statements in accordance with the standards of the Public Company Accounting Oversight Board (United States). Those standards require that we plan and perform the audit to obtain reasonable assurance about whether the financial statements are free of material misstatement. An audit includes examining, on a test basis, evidence supporting the amounts and disclosures in the financial statements, assessing the accounting principles used and significant estimates made by management, and evaluating the overall financial statement presentation. We believe that our audits, which included confirmation of securities at July 31, 2012 by correspondence with the custodian, brokers, and transfer agent, provide a reasonable basis for our opinion.
PricewaterhouseCoopers LLP
Minneapolis, Minnesota
September 21, 2012
Annual Report 2012
44
Columbia Large Cap Growth Fund
Federal Income Tax Information
(Unaudited)
For non-corporate shareholders, 100.00% or the maximum amount allowable under the Jobs and Growth Tax Relief Reconciliation Act of 2003, of the ordinary income distributed by the Fund for the fiscal year ended July, 31, 2012 may represent qualified dividend income.
100.00% of the ordinary income distributed by the Fund for the fiscal year ended July, 31, 2012, qualifies for the corporate dividends received deduction.
The Fund will notify shareholders in January 2013 of amounts for use in preparing 2012 income tax returns.
Annual Report 2012
45
Columbia Large Cap Growth Fund
Trustees and Officers
The Trustees serve terms of indefinite duration. The names, addresses and birth years of the Trustees and Officers of the Funds in Columbia Funds Series Trust I, the year each was first elected or appointed to office, their principal business occupations during at least the last five years, the number of Funds overseen by each Trustee and other directorships they hold are shown below. Each officer listed below serves as an officer of each Fund in Columbia Funds Series Trust I.
Independent Trustees
Name, Address and Year of Birth,
Position with Funds, Year First
Elected or Appointed to Office | | Principal Occupation(s) During Past Five Years, Number of Funds in Columbia
Funds Complex Overseen by Trustee, Other Directorships Held
| |
Rodman L. Drake (Born 1943)
c/o Columbia Management Investment Advisers, LLC
225 Franklin Street
Boston, MA 02110
Trustee (since 1994) and
Chairman of the Board (since 2009) | | Independent consultant since 2010; Co-Founder of Baringo Capital LLC (private equity) from 1997 to 2008; CEO of Crystal River Capital, Inc. (real estate investment trust) from 2003 to 2010; Oversees 52; Jackson Hewitt Tax Service Inc. (tax preparation services from 2004 to 2011); Celgene Corporation (global biotechnology company); Student Loan Corporation (student loan provider from 2005 to 2010); Celgene Corporation (global biotechnology company); The Helios Funds and Brookfield Funds (closed-end funds); Crystal River Capital, Inc. from 2005 to 2010; Parsons Brinckerhoff from 1995 to 2008; and Apex Silver Mines Ltd. from 2007 to 2009 | |
|
Douglas A. Hacker (Born 1955)
c/o Columbia Management Investment Advisers, LLC
225 Franklin Street
Boston, MA 02110
Trustee (since 1996) | | Independent business executive since May 2006; Executive Vice President — Strategy of United Airlines from December 2002 to May 2006; President of UAL Loyalty Services (airline marketing company) from September 2001 to December 2002; Executive Vice President and Chief Financial Officer of United Airlines from July 1999 to September 2001. Oversees 52; Nash Finch Company (food distributor); Aircastle Limited (aircraft leasing); and SeaCube Container Leasing Ltd. (container leasing) | |
|
Janet Langford Kelly (Born 1957)
c/o Columbia Management Investment Advisers, LLC
225 Franklin Street
Boston, MA 02110
Trustee (since 1996) | | Senior Vice President, General Counsel and Corporate Secretary, ConocoPhillips (integrated energy company) since September 2007; Deputy General Counsel — Corporate Legal Services, ConocoPhillips from August 2006 to August 2007; Partner, Zelle, Hofmann, Voelbel, Mason & Gette LLP (law firm) from March 2005 to July 2006; Adjunct Professor of Law, Northwestern University from September 2004 to June 2006; Director, UAL Corporation (airline) from February 2006 to July 2006; Chief Administrative Officer and Senior Vice President, Kmart Holding Corporation (consumer goods) from September 2003 to March 2004. Oversees 52; None | |
|
Nancy T. Lukitsh (Born 1956)
c/o Columbia Management Investment Advisers, LLC
225 Franklin Street
Boston, MA 02110
Trustee (since 2011) | | Senior Vice President, Partner and Director of Marketing, Wellington Management Company, LLP (investment adviser) from 1997 to 2010; Chair, Wellington Management Investment Portfolios (commingled non-U.S. investment pools) from 2007 to 2010; Director, Wellington Trust Company, NA and other Wellington affiliates from 1997 to 2010. Oversees 52; None | |
|
William E. Mayer (Born 1940)
c/o Columbia Management Investment Advisers, LLC
225 Franklin Street
Boston, MA 02110
Trustee (since 1994) | | Partner, Park Avenue Equity Partners (private equity) since February 1999; Dean and Professor, College of Business and Management, University of Maryland from 1992 to 1996. Oversees 52; DynaVox Inc. (speech creation); Lee Enterprises (print media); WR Hambrecht + Co. (financial service provider) from 2000 to 2012; BlackRock Kelso Capital Corporation (investment company) | |
|
David M. Moffett (Born 1952)
c/o Columbia Management Investment Advisers, LLC
225 Franklin Street
Boston, MA 02110
Trustee (since 2011) | | Retired. Chief Executive Officer, Federal Home Loan Mortgage Corporation, from 2008 to 2009; Senior Adviser, Global Financial Services Group, Carlyle Group, Inc., from 2007 to 2008; Vice Chairman and Chief Financial Officer, U.S. Bancorp, from 1993 to 2007. Oversees 52; CIT Group Inc. (commercial and consumer finance); eBay Inc. (online trading community); MBIA Inc. (financial service provider); E.W. Scripps Co. (print and television media), Building Materials Holding Corp. (building materials and construction services); and University of Oklahoma Foundation. | |
|
Charles R. Nelson (Born 1942)
c/o Columbia Management Investment Advisers, LLC
225 Franklin Street
Boston, MA 02110
Trustee (since 1981) | | Retired Professor Emeritus, University of Washington, since 2011; Professor of Economics, University of Washington from January 1976 to 2011; Ford and Louisa Van Voorhis Professor of Political Economy, University of Washington from 1993 to 2011; Adjunct Professor of Statistics, University of Washington from 1980 to 2011; Associate Editor, Journal of Money Credit and Banking from 1993 to 2008; consultant on econometric and statistical matters. Oversees 52; None | |
|
John J. Neuhauser (Born 1943)
c/o Columbia Management Investment Advisers, LLC
225 Franklin Street
Boston, MA 02110
Trustee (since 1984) | | President, Saint Michael's College, since August 2007; Director or Trustee of several non-profit organizations, including Fletcher Allen Health Care, Inc.; University Professor, Boston College from November 2005 to August 2007; Academic Vice President and Dean of Faculties, Boston College from August 1999 to October 2005. Oversees 52; Liberty All-Star Equity Fund and Liberty All-Star Growth Fund (closed-end funds) | |
|
Annual Report 2012
46
Columbia Large Cap Growth Fund
Trustees and Officers (continued)
Independent Trustees (continued)
Name, Address and Year of Birth,
Position with Funds, Year First
Elected or Appointed to Office | | Principal Occupation(s) During Past Five Years, Number of Funds in Columbia
Funds Complex Overseen by Trustee, Other Directorships Held
| |
Patrick J. Simpson (Born 1944)
c/o Columbia Management Investment Advisers, LLC
225 Franklin Street
Boston, MA 02110
Trustee (since 2000) | | Partner, Perkins Coie LLP (law firm). Oversees 52; None | |
|
Anne-Lee Verville (Born 1945)
c/o Columbia Management Investment Advisers, LLC
225 Franklin Street
Boston, MA 02110
Trustee (since 1998) | | Retired. General Manager — Global Education Industry from 1994 to 1997, President — Application Systems Division from 1991 to 1994, Chief Financial Officer — US Marketing & Services from 1988 to 1991, and Chief Information Officer from 1987 to 1988, IBM Corporation (computer and technology). Oversees 52; Enesco Group, Inc. (producer of giftware and home and garden decor products) from 2001 to 2006 | |
|
The Statement of Additional Information includes additional information about the Trustees of the Funds and is available, without charge, upon request by calling 1-800-345-6611.
Interested Trustee
Name, Address and Year of Birth,
Position with Funds, Year First
Elected or Appointed to Office | | Principal Occupation(s) During Past Five Years, Number of Funds in Columbia
Funds Complex Overseen by Trustee, Other Directorships Held
| |
William F. Truscott (born 1960)
53600 Ameriprise Financial Center
Minneapolis, MN 55474
Senior Vice President (since 2012) | | Chairman of the Board and President, Columbia Management Investment Advisers, LLC since May 2010 and February 2012, respectively (previously President, Chairman of the Board and Chief Investment Officer, from 2001 to April 2010); Chief Executive Officer, U.S. Asset Management & President, Annuities, Ameriprise Financial, Inc. since May 2010 (previously President — U.S. Asset Management and Chief Investment Officer from 2005 to April 2010, and Senior Vice President — Chief Investment Officer, from 2001 to 2005); Director, President and Chief Executive Officer, Ameriprise Certificate Company since 2006; Director and Chief Executive Officer, Columbia Management Investment Distributors, Inc. since May 2010 and February 2012, respectively (previously Chairman of the Board and Chief Executive Officer from 2008 to April 2010); Chairman of the Board and Chief Executive Officer, RiverSource Distributors, Inc. since 2006. Oversees 208; Columbia Funds Board. | |
|
Officers
| Name, Year of Birth and Address | | Principal Occupation(s) During the Past Five Years | |
J. Kevin Connaughton (Born 1964)
225 Franklin Street
Boston, MA 02110
President (since 2009) | | Senior Vice President and General Manager — Mutual Fund Products, Columbia Management Investment Advisers, LLC since May 2010; President, Columbia Funds, since 2009, and RiverSource Funds, since May 2010 (previously Senior Vice President and Chief Financial Officer, Columbia Funds, from June 2008 to January 2009, Treasurer, Columbia Funds, from October 2003 to May 2008, and senior officer of various other affiliated funds since 2000); Managing Director, Columbia Management Advisors, LLC from December 2004 to April 2010. | |
|
Michael G. Clarke (Born 1969)
225 Franklin Street
Boston, MA 02110
Treasurer (since 2011) and Chief Financial Officer (since 2009) | | Vice President, Columbia Management Investment Advisers, LLC since May 2010; Managing Director of Fund Administration, Columbia Management Advisors, LLC, from September 2004 to April 2010; senior officer of Columbia Funds and affiliated funds since 2002. | |
|
Scott R. Plummer (Born 1959)
5228 Ameriprise Financial Center
Minneapolis, MN 55474
Senior Vice President, Assistant Secretary and Chief Legal Officer (since 2010) | | Senior Vice President, Chief Legal Officer and Assistant Secretary, Columbia Management Investment Advisers, LLC since June 2005; Vice President and Lead Chief Counsel — Asset Management, Ameriprise Financial, Inc. since May 2010 (previously Vice President and Chief Counsel — Asset Management, from 2005 to April 2010); Vice President, Chief Counsel and Assistant Secretary, Columbia Management Investment Distributors, Inc. since 2008; Vice President, General Counsel and Secretary, Ameriprise Certificate Company since 2005; Chief Counsel, RiverSource Distributors, Inc. since 2006; Vice President, General Counsel and Secretary, RiverSource Funds since December 2006; Senior Vice President, Secretary and Chief Legal Officer, Columbia Funds, since May 2010. | |
|
Annual Report 2012
47
Columbia Large Cap Growth Fund
Trustees and Officers (continued)
Officers (continued)
| Name, Year of Birth and Address | | Principal Occupation(s) During the Past Five Years | |
William F. Truscott (Born 1960)
53600 Ameriprise Financial Center
Minneapolis, MN 55474
Senior Vice President (since 2010) | | Chairman of the Board and President, Columbia Management Investment Advisers, LLC since May 2010 and February 2012, respectively (previously President, Chairman of the Board and Chief Investment Officer, from 2001 to April 2010); Chief Executive Officer, U.S. Asset Management & President, Annuities, Ameriprise Financial, Inc. since May 2010 (previously President — U.S. Asset Management and Chief Investment Officer from 2005 to April 2010); Director, President and Chief Executive Officer, Ameriprise Certificate Company since 2006; Director and Chief Executive Officer, Columbia Management Investment Distributors, Inc. since May 2010 and February 2012, respectively (previously Chairman of the Board and Chief Executive Officer from 2008 to April 2010); Chairman of the Board and Chief Executive Officer, RiverSource Distributors, Inc. since 2006. | |
|
Thomas P. McGuire (Born 1972)
225 Franklin Street
Boston, MA 02110
Chief Compliance Officer (since 2012) | | Vice President — Asset Management Compliance, Columbia Management Investment Advisers, LLC since 2010; Chief Compliance Officer, Ameriprise Certificate Company, since September 2010; Compliance Executive, Bank of America, 2005-2010. | |
|
Colin Moore (Born 1958)
225 Franklin Street
Boston, MA 02110
Senior Vice President (since 2010) | | Director and Chief Investment Officer, Columbia Management Investment Advisers, LLC since May 2010; Manager, Managing Director and Chief Investment Officer of Columbia Management Advisors, LLC from 2007 to April 2010; Head of Equities, Columbia Management Advisors, LLC from 2002 to 2007. | |
|
Amy Johnson (Born 1965)
5228 Ameriprise Financial Center
Minneapolis, MN 55474
Vice President (since 2010) | | Senior Vice President and Chief Operating Officer, Columbia Management Investment Advisers, LLC since May 2010 (previously Chief Administrative Officer, from 2009 until April 2010, Vice President — Asset Management and Trust Company Services, from 2006 to 2009, and Vice President — Operations and Compliance from 2004 to 2006). | |
|
Joseph F. DiMaria (Born 1968)
225 Franklin Street
Boston, MA 02110
Vice President (since 2011) and Chief Accounting Officer (since 2008) | | Vice President, Mutual Fund Administration, Columbia Management Investment Advisers, LLC, since May 2010; Director of Fund Administration, Columbia Management Advisors, LLC from January 2006 to April 2010; Head of Tax/Compliance and Assistant Treasurer, Columbia Management Advisors, LLC, from November 2004 to December 2005. | |
|
Stephen T. Welsh (born 1957)
225 Franklin Street
Boston, MA 02110
Vice President (since 2006) | | President and Director, Columbia Management Investment Services Corp. since May 2010; President and Director, Columbia Management Services, Inc. from July 2004 to April 2010; Managing Director, Columbia Management Distributors, Inc. from August 2007 to April 2010. | |
|
Paul D. Pearson (born 1956)
10468 Ameriprise Financial Center
Minneapolis, MN 55474
Vice President and Assistant Treasurer (since 2011) | | Vice President, Investment Accounting, Columbia Management Investment Advisers, LLC, since May 2010; Vice President, Managed Assets, Investment Accounting, Ameriprise Financial Corporation. | |
|
Paul B. Goucher (born 1968)
5228 Ameriprise Financial Center
Minneapolis, MN 55474
Vice President and Assistant Secretary (since 2010) | | Vice President and Chief Counsel of Ameriprise Financial since January 2010 (formerly Vice President and Group Counsel from November 2008 to January 2010); Director, Managing Director and General Counsel of J. & W. Seligman & Co. Incorporated (Seligman) from July 2008 to November 2008 and Managing Director and Associate General Counsel of Seligman from January 2005 to July 2008. | |
|
Christopher O. Petersen (born 1970)
5228 Ameriprise Financial Center
Minneapolis, MN 55474
Vice President (since 2010) and Secretary (since 2011) | | Vice President and Chief Counsel, Ameriprise Financial since January 2010 (formerly Vice President and Group Counsel or Counsel from April 2004 to January 2010); Assistant Secretary of RiverSource Funds since January 2007; officer of Columbia Funds and affiliated funds since 2007. | |
|
Michael E. DeFao (born 1968)
225 Franklin Street
Boston, MA 02110
Vice President and Assistant Secretary (since 2011) | | Vice President and Chief Counsel, Ameriprise Financial since May 2010; Associate General Counsel, Bank of America from June 2005 to April 2010. | |
|
Annual Report 2012
48
Columbia Large Cap Growth Fund
Board Consideration and Approval of
Advisory Agreement
On June 6, 2012, the Board of Trustees (the "Board") and the Trustees who are not interested persons (as defined in the Investment Company Act of 1940) of the Trust (the "Independent Trustees") unanimously approved the continuation of the Investment Management Services Agreement (the "Advisory Agreement") with Columbia Management Investment Advisers, LLC (the "Investment Manager") with respect to Large Cap Growth Fund (the "Fund"), a series of the Trust. As detailed below, the Advisory Fees and Expenses Committee (the "Committee") and the Board met on multiple occasions to review and discuss, both among themselves and with the management team of the Investment Manager, materials provided by the Investment Manager before determining to approve the continuation of the Advisory Agreement.
In connection with their deliberations regarding the continuation of the Advisory Agreement, the Committee and the Board requested and evaluated materials from the Investment Manager regarding the Fund and the Advisory Agreement, and discussed these materials with representatives of the Investment Manager at the Committee meeting held on June 5, 2012 and at the Board meeting held on June 6, 2012. In addition, the Board considers matters bearing on the Advisory Agreement at most of its other meetings throughout the year and meets regularly with senior management of the Funds and the Investment Manager. Through the Board's Investment Oversight Committees, Trustees also meet with selected Fund portfolio managers and other investment personnel at various times throughout the year. The Committee and the Board also consulted with Fund counsel and with the Independent Trustees' independent legal counsel, who advised on the legal standard for consideration by the Board and otherwise assisted the Board in its deliberations. On June 5, 2012, the Committee recommended that the Board approve the continuation of the Advisory Agreement. On June 6, 2012, the Board, including the Independent Trustees, voting separately, unanimously approved the continuation of the Advisory Agreement for the Fund.
The Committee and the Board considered all information that they, their legal counsel, or the Investment Manager believed reasonably necessary to evaluate and to determine whether to approve the continuation of the Advisory Agreement. In their deliberations, the Trustees did not identify any particular information that was all-important or controlling, and individual Trustees may have attributed different weights to the various factors. The information and factors considered by the Committee and the Board in recommending for approval or approving the continuation of the Advisory Agreement for the Fund included the following:
• Information on the investment performance of the Fund relative to the performance of the Fund's benchmarks and the performance of a group of comparable mutual funds, as determined by an independent third-party data provider;
• Information on the Fund's advisory fees and total expenses, including information comparing the Fund's expenses to those of a group of comparable mutual funds, as determined by an independent third-party data provider;
• The Investment Manager's agreement to contractually limit or cap total operating expenses for the Fund so that total operating expenses (excluding certain fees and expenses, such as transaction costs and certain other investment related expenses, interest, taxes, acquired fund fees and expenses, and extraordinary expenses) would not exceed the median expenses of a group of comparable funds (as determined from time to time, generally annually, by an independent third-party data provider);
• The terms and conditions of the Advisory Agreement, including that the advisory fee rates payable by the Fund would not change;
• The terms and conditions of other agreements and arrangements with affiliates of the Investment Manager relating to the operations of the Fund, including the Administrative Services Agreement, the Distribution Agreement and the Transfer and Dividend Disbursing Agent Agreement, noting in the case of the Transfer and Dividend Disbursing Agent Agreement certain proposed changes to the fee rates payable thereunder;
• Descriptions of various functions performed by the Investment Manager under the Advisory Agreement, including portfolio management and portfolio trading practices;
• Information regarding the management fees and investment performance of any comparable portfolios of other clients of the Investment Manager, including institutional separate accounts; and
• The profitability to the Investment Manager and its affiliates from their relationships with the Fund.
Annual Report 2012
49
Columbia Large Cap Growth Fund
Board Consideration and Approval of
Advisory Agreement (continued)
Nature, Extent and Quality of Services to be Provided under the Advisory Agreement
The Committee and the Board considered the nature, extent and quality of services provided to the Fund by the Investment Manager and its affiliates under the Advisory Agreement and under separate agreements for the provision of transfer agency and administrative services, and the resources dedicated to the Fund and the other Columbia Funds by the Investment Manager and its affiliates. The Committee and the Board considered, among other things, the Investment Manager's ability to attract, motivate and retain highly qualified research, advisory and supervisory investment professionals (including personnel and other resources, compensation programs for personnel involved in fund management, reputation and other attributes), the portfolio management services provided by those investment professionals, the quality of the Investment Manager's investment research capabilities and trade execution services, and the other resources that the Investment Manager devotes to the Fund. The Committee and the Board also considered the potential benefits to shareholders of investing in a mutual fund that is part of a fund complex offering exposure to a variety of asset classes and investment disciplines and providing a variety of fund and shareholder services.
The Committee and the Board also considered the professional experience and qualifications of the senior personnel of the Investment Manager. The Committee and the Board noted the compliance programs of and the compliance-related resources provided to the Fund by the Investment Manager and its affiliates, and considered the Investment Manager's ability to provide administrative services to the Fund pursuant to a separate administrative services agreement, including the Investment Manager's ability to coordinate the activities of the Fund's other service providers. After reviewing these and related factors, the Committee and the Board concluded, within the context of their overall conclusions, that the expected nature, extent and quality of the services to be provided to the Fund under the Advisory Agreement supported the continuation of such agreement.
Investment Performance
The Committee and the Board reviewed information about the performance of the Fund over various time periods, including performance information relative to benchmarks and information based on reports of an independent third-party data provider that compared the performance of the Fund to the performance of a group of comparable mutual funds. The Committee and the Board also reviewed a description of the third party's methodology for identifying the Fund's peer groups for purposes of performance and expense comparisons. In the case of each Fund whose performance lagged that of a relevant peer group for certain (although not necessarily all) periods, the Committee and the Board concluded that other factors relevant to performance were sufficient, in light of other considerations, to warrant continuation of the Fund's Advisory Agreement. Those factors varied from fund to fund, but included one or more of the following: (i) that the Fund's performance, although lagging in certain recent periods, was stronger over the longer term; (ii) that the underperformance was attributable, to a significant extent, to investment decisions that were reasonable and consistent with the Fund's investment strategy and policies and that the Fund was performing within a reasonable range of expectations, given those investment decisions, market conditions and the Fund's investment strategy; (iii) that the Fund's performance was competitive when compared to other relevant performance benchmarks or peer groups; and (iv) that the Investment Manager had taken or was taking steps designed to help improve the Fund's investment performance, including, but not limited to, replacing portfolio managers, enhancing the resources supporting the portfolio managers, or modifying investment strategies.
The Committee and the Board noted that, through December 31, 2011, the Fund's performance was in the sixty-third, fifty-second and fifty-second percentiles (where the best performance would be in the first percentile) of its category selected by an independent third-party data provider for the purposes of performance comparisons for the one-, three- and five-year periods, respectively.
The Committee and the Board also considered the Investment Manager's performance and reputation generally, the Investment Manager's historical responsiveness to Board concerns about performance and the Investment Manager's willingness to take steps intended to improve performance. After reviewing these and related factors, the Committee and the Board concluded, within the context of their overall conclusions regarding the Advisory Agreement, that the performance of the Fund and the Investment Manager was sufficient, in light of other considerations, to warrant the continuation of the Advisory Agreement.
Annual Report 2012
50
Columbia Large Cap Growth Fund
Board Consideration and Approval of
Advisory Agreement (continued)
Investment Advisory Fee Rates and Other Expenses
The Committee and the Board considered the advisory fees to be charged to the Fund under the Advisory Agreement as well as the total expenses to be incurred by the Fund. In assessing the reasonableness of the fees under the Advisory Agreement, the Committee and the Board considered, among other information, the Fund's advisory fee and its expected total expense ratio as a percentage of average daily net assets. The Committee and the Board noted that the Fund's actual management fee and total net expense ratio are ranked in the third and second quintiles, respectively, against the Fund's expense universe as determined by an independent third-party data provider for purposes of expense comparison. The Committee and the Board also took into account the fee waiver and expense limitation arrangements agreed to by the Investment Manager, as noted above.
The Committee and the Board also considered the fact that the advisory fee rates payable by the Fund to the Investment Manager under the Advisory Agreement were the same as those currently paid by the Fund to the Investment Manager.
The Committee and the Board also received and considered information about the advisory fees charged by the Investment Manager to institutional separate accounts. In considering the fees charged to those accounts, the Committee and the Board took into account, among other things, the Investment Manager's representations about the differences between managing mutual funds as compared to other types of accounts, including differences in the services provided, differences in the risk profile of such business for the Investment Manager and the additional resources required to manage mutual funds effectively. In evaluating the Fund's advisory fees, the Committee and the Board also took into account the demands, complexity and quality of the investment management of the Fund.
After reviewing these and related factors, the Committee and the Board concluded, within the context of their overall conclusions, that the advisory fee rates and expenses of the Fund supported the continuation of the Advisory Agreement.
Costs of Services to be Provided and Profitability
The Committee and the Board also took note of the costs of the services provided (both on an absolute and relative basis) and the profitability to the Investment Manager and its affiliates in connection with their relationships with the Fund. In evaluating these considerations, the Committee and the Board took note of the advisory fees charged by the Investment Manager to other clients, including fees charged by the Investment Manager to any institutional separate account clients with similar investment strategies to those of the Fund.
The Committee and the Board also considered the compensation directly or indirectly received by the Investment Manager's affiliates in connection with their relationships with the Fund. The Committee and the Board reviewed information provided by management as to the profitability of the Investment Manager and its affiliates of their relationships with the Fund, and information about the allocation of expenses used to calculate profitability. When reviewing profitability, the Committee and the Board also considered court cases in which adviser profitability was an issue in whole or in part, the performance of the fund, the expense ratio of the fund, and the implementation of expense limitations with respect to the fund. The Committee and the Board also considered information provided by the Investment Manager regarding its financial condition and comparing its profitability to that of other asset management firms that are, or are subsidiaries of, publicly traded companies.
After reviewing these and related factors, the Committee and the Board concluded, within the context of their overall conclusions, that the profitability to the Investment Manager and its affiliates from their relationships with the Fund supported the continuation of the Advisory Agreement.
Economies of Scale
The Committee and the Board considered the potential existence of economies of scale in the provision by the Investment Manager of services to the Fund, to groups of related funds, and to the Investment Manager's investment advisory clients as a whole, and whether those economies of scale were shared with the Fund through breakpoints in investment advisory fees or other means, such as expense limitation arrangements and additional investments by the Investment Manager in investment, trading and compliance resources. The Committee and the Board noted that the investment advisory fee schedules for the Fund contained breakpoints that would reduce the fee rate on assets above specified threshold levels.
Annual Report 2012
51
Columbia Large Cap Growth Fund
Board Consideration and Approval of
Advisory Agreement (continued)
In considering these issues, the Committee and the Board also considered the costs of the services provided (both on an absolute and relative basis) and the profitability to the Investment Manager and its affiliates from their relationships with the Fund, as discussed above. After reviewing these and related factors, the Committee and the Board concluded, within the context of their overall conclusions, that the extent to which economies of scale were expected to be shared with the Fund supported the continuation of the Advisory Agreement.
Other Benefits to the Investment Manager
The Committee and the Board received and considered information regarding "fall-out" or ancillary benefits received by the Investment Manager and its affiliates as a result of their relationships with the Fund, such as the engagement of the Investment Manager to provide administrative services to the Fund and the engagement of the Investment Manager's affiliates to provide distribution and transfer agency services to the Fund. The Committee and the Board considered that the Fund's distributor retains a portion of the distribution fees from the Fund and receives a portion of the sales charges on sales or redemptions of certain classes of shares of the Fund. The Committee and the Board also considered the benefits of research made available to the Investment Manager by reason of brokerage commissions generated by the Fund's securities transactions, and reviewed information about the Investment Manager's practices with respect to allocating portfolio brokerage for brokerage and research services. The Committee and the Board considered the possible conflicts of interest associated with certain fall-out or other ancillary benefits and the reporting, disclosure and other processes that would be in place to address such possible conflicts of interest. The Committee and the Board recognized that the Investment Manager's profitability would be somewhat lower without these benefits.
Conclusion
The Committee and the Board reviewed all of the above considerations in reaching their decisions to recommend or approve the continuation of the Advisory Agreement. No single item was identified as paramount or controlling, and individual Trustees may have attributed different weights to various factors. Based on their evaluation of all factors that they deemed to be material, including those factors described above, and assisted by the advice of independent legal counsel, the Board, including the Independent Trustees, voting separately, unanimously approved the continuation of the Advisory Agreement.
Annual Report 2012
52
Columbia Large Cap Growth Fund
Important Information About This Report
Each fund mails one shareholder report to each shareholder address. If you would like more than one report, please call shareholder services at 800.345.6611 and additional reports will be sent to you.
The policy of the Board is to vote the proxies of the companies in which each fund holds investments consistent with the procedures as stated in the Statement of Additional Information (SAI). You may obtain a copy of the SAI without charge by calling 800.345.6611; contacting your financial intermediary; visiting columbiamanagement.com; or searching the website of the Securities and Exchange Commission (SEC) at sec.gov. Information regarding how each fund voted proxies relating to portfolio securities is filed with the SEC by August 31 for the most recent 12-month period ending June 30 of that year, and is available without charge by visiting columbiamanagement.com; or searching the website of the SEC at sec.gov.
Each fund files a complete schedule of portfolio holdings with the SEC for the first and third quarters of each fiscal year on Form N-Q. Each fund's Form N-Q is available on the SEC's website at sec.gov and may be reviewed and copied at the SEC's Public Reference Room in Washington, D.C. Information on the operation of the Public Reference Room may be obtained by calling 800.SEC.0330. Each fund's complete schedule of portfolio holdings, as filed on Form N-Q, can also be obtained without charge, upon request, by calling 800.345.6611.
Annual Report 2012
53

Columbia Large Cap Growth Fund
P.O. Box 8081
Boston, MA 02266-8081
columbiamanagement.com
This information is for use with concurrent or prior delivery of a fund prospectus. Please read and consider the investment objectives, risks, charges and expenses for any fund carefully before investing. For a prospectus which contains this and other important information about the Fund go to columbiamanagement.com. The Fund is distributed by Columbia Management Investment Distributors, Inc., member FINRA, and managed by Columbia Management Investment Advisers, LLC.
© 2012 Columbia Management Investment Advisers, LLC. All rights reserved.
C-1716 D (9/12)
Annual Report
July 31, 2012

Columbia Oregon Intermediate Municipal Bond Fund
Not FDIC insured • No bank guarantee • May lose value
Columbia Oregon Intermediate Municipal Bond Fund
President's Message
 Dear Shareholders,
On the heels of solid gains for stocks during the first quarter, U.S. stock market averages fell in the second quarter as uncertainty mounted regarding the fate of the eurozone and other real concerns. On the last day of the quarter, an announcement that European leaders had agreed to relieve short-term funding pressure on Italy and Spain and to back a plan heading toward a banking union raised hopes that a longer term solution was achievable. The announcement lifted stocks around the world. However, it was a losing quarter for most stock markets as economic data disappointed in the United States and growth in Europe and emerging markets slowed. China, which has been a key driver of worldwide growth over the past decade, has experienced a significant slowdown, and its declining demand for raw materials has had a chilling effect on world commodity markets.
Against a backdrop of rising uncertainty and a declining stock market, bond investors turned cautious. U.S. Treasuries were the quarter's strongest performers. Total returns on long-dated Treasuries surged late last year, sank from mid-December to mid-March then soared through the end of the quarter. By contrast, European sovereign bonds lost value as interest rates rose and concerns about the eurozone's fiscal health mounted.
Despite these continued challenges, we see pockets of strength — and as a result, attractive opportunities — both here and abroad for 2012. We hope to help you capitalize on these opportunities with various articles in our 2012 Perspectives, which is available via the Market Insights tab at columbiamanagement.com. This publication showcases the strong research capabilities and experienced investment teams of Columbia Management and offers a diverse array of investment ideas based on our five key themes for 2012.
Other information and resources available at columbiamanagement.com include:
> detailed up-to-date fund performance and portfolio information
> economic analysis and market commentary
> quarterly fund commentaries
> Columbia Management Investor, our award-winning quarterly newsletter for shareholders
Thank you for your continued support of the Columbia Funds. We look forward to serving your investment needs for many years to come.
Best Regards,

J. Kevin Connaughton
President, Columbia Funds
Investors should consider the investment objectives, risks, charges and expenses of a mutual fund carefully before investing. For a free prospectus, which contains this and other important information about the funds, visit columbiamanagement.com. The prospectus should be read carefully before investing.
Columbia Funds are distributed by Columbia Management Investment Distributors, Inc., member FINRA, and managed by Columbia Management Investment Advisers, LLC.
© 2012 Columbia Management Investment Advisers, LLC. All rights reserved.
Annual Report 2012
Columbia Oregon Intermediate Municipal Bond Fund
Table of Contents
| Performance Overview | | | 2 | | |
|
| Manager Discussion of Fund Performance | | | 4 | | |
|
| Understanding Your Fund's Expenses | | | 6 | | |
|
| Portfolio of Investments | | | 7 | | |
|
| Statement of Assets and Liabilities | | | 16 | | |
|
| Statement of Operations | | | 18 | | |
|
| Statement of Changes in Net Assets | | | 19 | | |
|
| Financial Highlights | | | 21 | | |
|
| Notes to Financial Statements | | | 25 | | |
|
Report of Independent Registered
Public Accounting Firm | | | 31 | | |
|
| Federal Income Tax Information | | | 32 | | |
|
| Trustees and Officers | | | 33 | | |
|
Board Consideration and Approval of
Advisory Agreement | | | 36 | | |
|
| Important Information About This Report | | | 41 | | |
|
Fund Investment Manager
Columbia Management Investment
Advisers, LLC
225 Franklin Street
Boston, MA 02110
Fund Distributor
Columbia Management Investment
Distributors, Inc.
225 Franklin Street
Boston, MA 02110
Fund Transfer Agent
Columbia Management Investment
Services Corp.
P.O. Box 8081
Boston, MA 02266-8081
For more information about any of the funds, please visit columbiamanagement.com or call 800.345.6611. Customer Service Representatives are available to answer your questions Monday through Friday from 8 a.m. to 8 p.m. Eastern time.
The views expressed in this report reflect the current views of the respective parties. These views are not guarantees of future performance and involve certain risks, uncertainties and assumptions that are difficult to predict, so actual outcomes and results may differ significantly from the views expressed. These views are subject to change at any time based upon economic, market or other conditions and the respective parties disclaim any responsibility to update such views. These views may not be relied on as investment advice and, because investment decisions for a Columbia Fund are based on numerous factors, may not be relied on as an indication of trading intent on behalf of any particular Columbia Fund. References to specific securities should not be construed as a recommendation or investment advice.
Annual Report 2012
Columbia Oregon Intermediate Municipal Bond Fund
Performance Overview
Performance Summary
> Columbia Oregon Intermediate Municipal Bond Fund (the Fund) Class A shares returned 6.50% (excluding sales charges) for the 11-month period ended July 31, 2012.
> During the period, the Fund's return was slightly lower than the 6.82% return of its benchmark, the Barclays 3-15 Year Blend Municipal Bond Index.
> An overweight in bonds rated AA1 was a slight drag on performance, as the category lagged overall index returns. A longer duration aided results as yields declined, and the Fund's non-rated bonds generated strong returns.
Average Annual Total Returns (%) (for period ended July 31, 2012)
| | | Inception | | 11 Months
cumulative | | 1 Year | | 5 Years | | 10 Years | |
| Class A* | | 11/01/02 | | | | | | | | | | | | | | | | | |
| Excluding sales charges | | | | | | | 6.50 | | | | 7.99 | | | | 5.01 | | | | 4.30 | | |
| Including sales charges | | | | | | | 3.03 | | | | 4.52 | | | | 4.31 | | | | 3.80 | | |
| Class B* | | 11/01/02 | | | | | | | | | | | | | | | | | |
| Excluding sales charges | | | | | | | 5.77 | | | | 7.18 | | | | 4.23 | | | | 3.52 | | |
| Including sales charges | | | | | | | 2.77 | | | | 4.18 | | | | 4.23 | | | | 3.52 | | |
| Class C* | | 10/13/03 | | | | | | | | | | | | | | | | | |
| Excluding sales charges | | | | | | | 6.10 | | | | 7.55 | | | | 4.59 | | | | 3.90 | | |
| Including sales charges | | | | | | | 5.10 | | | | 6.55 | | | | 4.59 | | | | 3.90 | | |
| Class Z | | 07/02/84 | | | 6.73 | | | | 8.25 | | | | 5.27 | | | | 4.58 | | |
| Barclays 3-15 Year Blend Municipal Bond Index | | | | | | | 6.82 | | | | 8.64 | | | | 6.33 | | | | 5.13 | | |
Returns for Class A are shown with and without the maximum initial sales charge of 3.25%. The 10-year Class A average annual returns with sales charge as of July 31, 2012 include the previous sales charge of 4.75%. Class A 11 months, 1-year and 5-year annual returns with sales charge as of July 31, 2012 include the new sales charge of 3.25%. This change was effective beginning August 22, 2005. Returns for Class B are shown with and without the applicable contingent deferred sales charge (CDSC) of 3.00% in the first year, declining to 1.00% in the fourth year and eliminated thereafter. Returns for Class C are shown with and without the 1.00% CDSC for the first year only. The Fund's other classes are not subject to sales charges and have limited eligibility. Please see the Fund's prospectuses for details. Performance for different share classes will vary based on differences in sales charges and fees associated with each class. All results shown assume reinvestment of distributions during the period. Returns do not reflect the deduction of taxes that a shareholder may pay on Fund distributions or on the redemption of Fund shares. Performance results reflect the effect of any fee waivers or reimbursements of Fund expenses by Columbia Management Investment Advisers, LLC and/or any of its affiliates. Absent these fee waivers or expense reimbursement arrangements, performance results would have been lower.
The performance information shown represents past performance and is not a guarantee of future results. The investment return and principal value of your investment will fluctuate so that your shares, when redeemed, may be worth more or less than their original cost. Current performance may be lower or higher than the performance information shown. You may obtain performance information current to the most recent month-end by contacting your financial intermediary, visiting columbiamanagement.com or calling 800.345.6611.
*The returns shown for periods prior to the share class inception date (including returns since inception if shown, which are since Fund inception) include the returns of the Fund's oldest share class. These returns are adjusted to reflect any higher class-related operating expenses of the newer share classes, as applicable. Please visit columbiamanagement.com/mutual-funds/appended-performance for more information.
The Barclays 3-15 Year Blend Municipal Bond Index is an unmanaged index that tracks the performance of municipal bonds issued after December 31, 1990, with remaining maturities between 2 and 17 years and at least $7 million in principal amount outstanding.
Indices are not available for investment, are not professionally managed and do not reflect sales charges, fees, brokerage commissions, taxes or other expenses of investing. Securities in the Fund may not match those in an index.
Annual Report 2012
2
Columbia Oregon Intermediate Municipal Bond Fund
Performance Overview (continued)
Performance of a Hypothetical $10,000 Investment (August 1, 2002 – July 31, 2012)
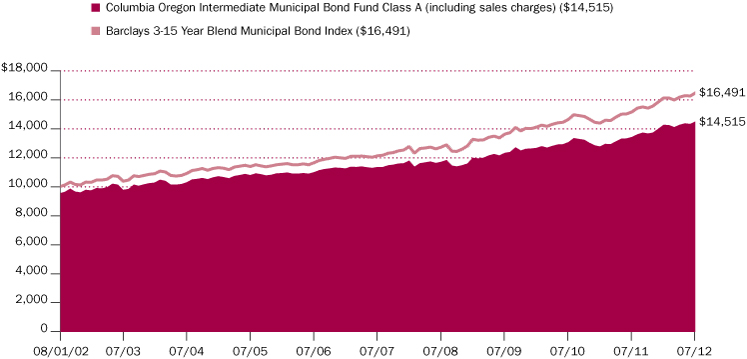
The chart above shows the change in value of a hypothetical $10,000 investment in Class A shares of Columbia Oregon Intermediate Municipal Bond Fund during the stated time period, and does not reflect the deduction of taxes that a shareholder may pay on Fund distributions or on the redemption of Fund shares.
Annual Report 2012
3
Columbia Oregon Intermediate Municipal Bond Fund
Manager Discussion of Fund Performance
The Board of Trustees for Columbia Oregon Intermediate Municipal Bond Fund has approved the change of the Fund's fiscal year end from August 31 to July 31. As a result, this report covers the 11-month period since the last annual report. The next report you receive will be for the six-month period from August 1, 2012 through January 31, 2013.
For the 11-month period that ended July 31, 2012, the Fund's Class A shares returned 6.50% without sales charge. The Fund's benchmark, the Barclays 3-15 Year Blend Municipal Bond Index, returned 6.82%. An overweight in bonds rated AA1 was a slight drag on performance, as the category lagged overall index returns. A longer duration aided returns as yields declined. Duration is a measure of interest rate sensitivity. The Fund's non-rated bonds also generated strong returns.
Slower economic growth provides a favorable environment for municipals
Throughout the 11-month period, Europe's debt problems and uncertainty about the strength of the U.S. economy weighed on the world's financial markets. Gross domestic product growth in the United States weakened over the period, expanding by 2.0% in the first quarter of 2012 and only 1.5% in the second quarter. Job growth picked up early in the year, slowed in the spring, then rebounded in July. Even though more than one million new jobs were added over the 11-month period, the spring setback raised questions anew about the sustainability of the current economic recovery. Manufacturing activity — the one consistent bright spot over the current economic cycle — weakened in June and July, as a key measure of manufacturing activity — the Institute of Supply Managers Purchasing Index — slipped below 50, the line between growth and contraction. However, the housing market showed a glimmer of improvement, as year-over-year sales improved, inventories tightened and prices stabilized somewhat.
Against a backdrop of slower growth and rising uncertainty, investors sought the safety of the U.S. Treasury market, where the yield on the benchmark 10-year Treasury dropped approximately 125 basis points. (A basis point is one hundredth of a percent. Yields and bond prices move in opposite directions.) Municipal yields followed Treasury yields lower, and municipal bonds as an asset class generated strong performance. The yield on five-year AAA rated bonds fell 70 basis points, while 15-year yields fell 90 basis points. In general, longer maturity municipal bonds performed the best. The difference in yield between higher and lower quality bonds narrowed, resulting in better returns for bonds rated A and BBB versus higher quality bonds rated AA and AAA. Bonds with longer call structures also performed well.
Strong demand, solid supply in municipal market
Flows into municipal bond mutual funds were strong through most of the period, despite more downgrades than upgrades, and defaults in the national market were few — notably Stockton, San Bernardino and Mammoth Lakes in California. Municipal supply picked up in 2012, as many issuers refinanced older, currently-callable debt to take advantage of very low rates. Refinancing helped municipalities decrease their debt service cost, which was a credit positive, and also aided the process of balancing budgets. However, refinancing hurt bond holders by removing higher-yielding debt, which cannot be replaced in the current environment. Most bonds that were refinanced were issued prior to 2002, when rates were more typically in the 4% to 6% range.
Portfolio Management
Brian M. McGreevy
Quality Breakdown (%)
(at July 31, 2012) | |
| AAA rating | | | 1.6 | | |
| AA rating | | | 64.5 | | |
| A rating | | | 21.6 | | |
| BBB rating | | | 7.0 | | |
| Not rated | | | 5.3 | | |
| Total | | | 100.0 | | |
Percentages indicated are based upon total fixed income securities (excluding Money Market Funds and Investments of Cash Collateral Received for Securities on Loan).
Bond ratings apply to the underlying holdings of the Fund and not the Fund itself and are divided into categories ranging from AAA (highest) to D (lowest), and are subject to change. The ratings shown are determined by using the middle rating of Moody's, S&P, and Fitch after dropping the highest and lowest available ratings. When a rating from only two agencies is available, the lower rating is used. When a rating from only one agency is available, that rating is used. When a bond is not rated by one of these agencies, it is designated as Not rated. Credit ratings are subjective opinions and not statements of fact.
Annual Report 2012
4
Columbia Oregon Intermediate Municipal Bond Fund
Manager Discussion of Fund Performance (continued)
Maturity positioning, call structure and credit quality aided Fund returns
The Fund's duration was slightly longer than the Barclays index over the period, which added to returns. An underweight in the two- to four-year maturity range helped offset the impact of the Fund's overweight in the very short end of the yield curve, which was a drag on performance. (The yield curve is a graphic depiction of Treasury yields, from short- to long-term.) Bonds with maturities of 10 years or more were approximately equal to index holdings and aided overall returns. An emphasis on bonds with calls in seven to nine years (versus two to five years) also aided results. When a bond is "called," bondholders are repaid. That can be a burden to the bondholder who then has to seek alternative investments, which yield far less in today's environment.
The Fund had more exposure than the index to bonds rated AA1 — mostly due to Oregon's qualified school bond program, which garners higher ratings than the individual localities would obtain on their own. These issues generated better returns than corresponding bonds in the index, but the rating category lagged overall index returns. Bonds rated A2 were the best performers for the Fund. They account for approximately 10% of the Fund's assets and generated returns of 10%+ for the period. Non-rated bonds also generated strong returns. Among sectors, the Fund's education and special tax bonds were the best performers. By contrast, local general obligation bonds were the weakest performers, generally because of their higher quality ratings. Higher quality bonds mostly underperformed lower quality for the period.
Portfolio changes reflect low yields and rising demand
Over the period, we decreased the Fund's cash holdings and sold shorter maturity or callable bonds with short call dates. We used the proceeds to purchase bonds that are mostly in the 10- to 17-year maturity range. We added to local general obligation bonds because the supply of new issues increased as localities built and improved school-system infrastructure. We also added water and sewer bonds as well as airport and transportation issues.
Looking ahead
The Oregon economy is recovering at a much slower pace than the rest of the Western region of the United States. State fiscal problems remain a threat. The state's revenue forecast has been lowered, forcing lawmakers to seek spending cuts in a budget that is already under pressure. However, there are signs that Oregon's economy could gain momentum in the year ahead. Hiring in the leisure/hospitality sector, as well as in technology, is expected to pick up. The housing market appears poised to turn the corner; and over the longer term, the state's energy resources, well-educated workforce and favorable migration trends should help the state become a solid performer once again. Against this backdrop, we believe the environment remains favorable for municipal bonds. Yields are low, demand is high and we expect an increase in supply to allow for better buying opportunities for the Fund. With the Federal Reserve committed to keep short-term interest rates at their current lows for an extended period of time, we do not expect significant changes in yields. However, the additional supply that is expected may generate the potential for higher returns from some sectors. We continue to rely on the large and experienced credit staff of Columbia Management to help monitor risk and identify opportunities for the Fund.
Annual Report 2012
5
Columbia Oregon Intermediate Municipal Bond Fund
Understanding Your Fund's Expenses
(Unaudited)
As an investor, you incur two types of costs. There are transaction costs, which generally include sales charges on purchases and may include redemption fees. There are also ongoing costs, which generally include management fees, distribution and service (Rule 12b-1) fees, and other fund expenses. The following information is intended to help you understand your ongoing costs (in dollars) of investing in the Fund and to help you compare these costs with the ongoing costs of investing in other mutual funds.
Analyzing Your Fund's Expenses
To illustrate these ongoing costs, we have provided examples and calculated the expenses paid by investors in each share class of the Fund during the period. The actual and hypothetical information in the table is based on an initial investment of $1,000 at the beginning of the period indicated and held for the entire period. Expense information is calculated two ways and each method provides you with different information. The amount listed in the "Actual" column is calculated using the Fund's actual operating expenses and total return for the period. You may use the Actual information, together with the amount invested, to estimate the expenses that you paid over the period. Simply divide your account value by $1,000 (for example, an $8,600 account value divided by $1,000 = 8.6), then multiply the results by the expenses paid during the period under the Actual column. The amount listed in the "Hypothetical" column assumes a 5% annual rate of return before expenses (which is not the Fund's actual return) and then applies the Fund's actual expense ratio for the period to the hypothetical return. You should not use the hypothetical account values and expenses to estimate either your actual account balance at the end of the period or the expenses you paid during the period. See "Compare With Other Funds" below for details on how to use the hypothetical data.
Compare With Other Funds
Since all mutual funds are required to include the same hypothetical calculations about expenses in shareholder reports, you can use this information to compare the ongoing cost of investing in the Fund with other funds. To do so, compare the hypothetical example with the 5% hypothetical examples that appear in the shareholder reports of other funds. As you compare hypothetical examples of other funds, it is important to note that hypothetical examples are meant to highlight the ongoing costs of investing in a fund only and do not reflect any transaction costs, such as sales charges, or redemption or exchange fees. Therefore, the hypothetical calculations are useful in comparing ongoing costs only, and will not help you determine the relative total costs of owning different funds. If transaction costs were included in these calculations, your costs would be higher.
February 1, 2012 – July 31, 2012
| | | Account Value at the Beginning
of the Period ($) | | Account Value at the End of the
Period ($) | | Expenses Paid During the
Period ($) | | Fund's Annualized
Expense Ratio (%) | |
| | | Actual | | Hypothetical | | Actual | | Hypothetical | | Actual | | Hypothetical | | Actual | |
| Class A | | | 1,000.00 | | | | 1,000.00 | | | | 1,036.60 | | | | 1,020.93 | | | | 4.00 | | | | 3.97 | | | | 0.79 | | |
| Class B | | | 1,000.00 | | | | 1,000.00 | | | | 1,032.10 | | | | 1,017.21 | | | | 7.78 | | | | 7.72 | | | | 1.54 | | |
| Class C | | | 1,000.00 | | | | 1,000.00 | | | | 1,034.20 | | | | 1,018.95 | | | | 6.02 | | | | 5.97 | | | | 1.19 | | |
| Class Z | | | 1,000.00 | | | | 1,000.00 | | | | 1,038.10 | | | | 1,022.18 | | | | 2.74 | | | | 2.72 | | | | 0.54 | | |
Expenses paid during the period are equal to the annualized expense ratio for each class as indicated above, multiplied by the average account value over the period and then multiplied by the number of days in the Fund's most recent fiscal half year and divided by 366.
Expenses do not include fees and expenses incurred indirectly by the Fund from the underlying funds in which the Fund may invest (also referred to as "acquired funds"), including affiliated and non-affiliated pooled investment vehicles (including mutual funds and exchange traded funds).
Had Columbia Management Investment Advisers, LLC and/or certain of its affiliates not waived/reimbursed certain fees and expenses, account value at the end of the period would have been reduced.
Annual Report 2012
6
Columbia Oregon Intermediate Municipal Bond Fund
Portfolio of Investments
July 31, 2012
(Percentages represent value of investments compared to net assets)
Municipal Bonds 96.4%
Issue
Description | | Coupon
Rate | | Principal
Amount ($) | | Value ($) | |
| Airport 1.6% | |
Port of Portland
Revenue Bonds
Passenger Facility Charge
Series 2011
07/01/27 | | | 5.500 | % | | | 6,635,000 | | | | 7,958,616 | | |
| Assisted Living 0.4% | |
Clackamas County Hospital Facility Authority
Refunding Revenue Bonds
Robinson Jewish Home
Series 2005
10/01/19 | | | 5.000 | % | | | 1,000,000 | | | | 1,014,840 | | |
| 10/01/24 | | | 5.125 | % | | | 1,000,000 | | | | 1,004,570 | | |
| Total | | | | | | | 2,019,410 | | |
| Higher Education 3.2% | |
City of Forest Grove
Revenue Bonds
Campus Improvement-Pacific University Project
Series 2009
05/01/30 | | | 6.000 | % | | | 1,500,000 | | | | 1,556,040 | | |
City of Portland
Refunding Revenue Bonds
Broadway Project
Series 2008A
04/01/23 | | | 6.250 | % | | | 3,250,000 | | | | 3,895,970 | | |
Oregon Health & Science University
Revenue Bonds
Series 2012A
07/01/18 | | | 5.000 | % | | | 1,000,000 | | | | 1,191,510 | | |
Oregon Health & Science University(a)
Revenue Bonds
Capital Appreciation-Independent School District
Series 1996A (NPFGC)
07/01/21 | | | 0.000 | % | | | 9,700,000 | | | | 7,276,552 | | |
Oregon State Facilities Authority
Revenue Bonds
Linfield College Project
Series 2005A
10/01/20 | | | 5.000 | % | | | 1,825,000 | | | | 1,957,659 | | |
| Total | | | | | | | 15,877,731 | | |
| Hospital 9.2% | |
Deschutes County Hospital Facilities Authority
Refunding Revenue Bonds
Cascade Health Services, Inc.
Series 2008
01/01/23 | | | 7.375 | % | | | 2,000,000 | | | | 2,511,200 | | |
Municipal Bonds (continued)
Issue
Description | | Coupon
Rate | | Principal
Amount ($) | | Value ($) | |
Multnomah County Hospital Facilities Authority
Revenue Bonds
Adventist Health West
Series 2009A
09/01/21 | | | 5.000 | % | | | 3,685,000 | | | | 4,245,194 | | |
Providence Health Systems
Series 2004
10/01/13 | | | 5.250 | % | | | 1,045,000 | | | | 1,103,677 | | |
| 10/01/16 | | | 5.250 | % | | | 2,970,000 | | | | 3,252,269 | | |
Oregon State Facilities Authority
Refunding Revenue Bonds
Legacy Health Project
Series 2011A
05/01/20 | | | 5.250 | % | | | 5,000,000 | | | | 6,079,800 | | |
Legacy Health Systems
Series 2010A
03/15/15 | | | 5.000 | % | | | 1,000,000 | | | | 1,094,580 | | |
| 03/15/16 | | | 5.000 | % | | | 1,500,000 | | | | 1,682,595 | | |
Peacehealth
Series 2009A
11/01/17 | | | 5.000 | % | | | 4,450,000 | | | | 5,294,833 | | |
| 11/01/19 | | | 5.000 | % | | | 3,695,000 | | | | 4,428,494 | | |
Samaritan Health Services
Series 2010A
10/01/22 | | | 5.000 | % | | | 3,450,000 | | | | 3,959,289 | | |
| 10/01/23 | | | 5.000 | % | | | 2,000,000 | | | | 2,271,000 | | |
Revenue Bonds
Providence Health Services
Series 2011C
10/01/14 | | | 4.000 | % | | | 1,625,000 | | | | 1,740,456 | | |
Salem Hospital Facility Authority
Revenue Bonds
Salem Hospital Project
Series 2006A
08/15/27 | | | 5.000 | % | | | 3,500,000 | | | | 3,736,040 | | |
Series 2008A
08/15/15 | | | 5.750 | % | | | 785,000 | | | | 886,995 | | |
| 08/15/18 | | | 5.250 | % | | | 2,500,000 | | | | 2,950,650 | | |
| Total | | | | | | | 45,237,072 | | |
| Independent Power 0.8% | |
Western Generation Agency
Revenue Bonds
Wauna Cogeneration Project
Series 2006A
01/01/20 | | | 5.000 | % | | | 1,000,000 | | | | 1,001,050 | | |
| 01/01/21 | | | 5.000 | % | | | 3,000,000 | | | | 2,986,830 | | |
| Total | | | | | | | 3,987,880 | | |
The accompanying Notes to Financial Statements are an integral part of this statement.
Annual Report 2012
7
Columbia Oregon Intermediate Municipal Bond Fund
Portfolio of Investments (continued)
July 31, 2012
Municipal Bonds (continued)
Issue
Description | | Coupon
Rate | | Principal
Amount ($) | | Value ($) | |
| Investor Owned 0.9% | |
Port of Morrow
Refunding Revenue Bonds
Portland General Electric
Series 1998A(b)
05/01/33 | | | 5.000 | % | | | 3,750,000 | | | | 4,220,775 | | |
| Local General Obligation 36.3% | |
Benton & Linn Counties Consolidated School District No. 509J & 509A
Unlimited General Obligation Refunding Bonds
Series 2007 (AGM)
06/15/20 | | | 5.000 | % | | | 5,000,000 | | | | 6,240,900 | | |
Canyonville South Umpqua Rural Fire Protection District
Unlimited General Obligation Bonds
Series 2001
07/01/31 | | | 5.400 | % | | | 610,000 | | | | 610,555 | | |
Central Oregon Community College District
Unlimited General Obligation Bonds
Series 2010
06/15/24 | | | 4.750 | % | | | 2,580,000 | | | | 3,102,063 | | |
City of Hillsboro
Limited General Obligation Refunding Bonds
Series 2012
06/01/24 | | | 4.000 | % | | | 1,875,000 | | | | 2,179,669 | | |
| 06/01/25 | | | 4.000 | % | | | 1,875,000 | | | | 2,153,681 | | |
City of Portland
Limited General Obligation Refunding Bonds
Arena
Series 2005B
06/01/16 | | | 5.000 | % | | | 3,075,000 | | | | 3,460,728 | | |
Limited Tax
Series 2011A
06/01/23 | | | 5.000 | % | | | 6,140,000 | | | | 7,630,731 | | |
City of Portland(a)
Limited Tax General Obligation Bonds
Series 2001B
06/01/16 | | | 0.000 | % | | | 3,500,000 | | | | 3,369,590 | | |
| 06/01/18 | | | 0.000 | % | | | 4,000,000 | | | | 3,630,600 | | |
| 06/01/19 | | | 0.000 | % | | | 4,000,000 | | | | 3,499,000 | | |
| 06/01/20 | | | 0.000 | % | | | 4,000,000 | | | | 3,395,120 | | |
City of Salem
Limited General Obligation Bonds
Series 2009
06/01/26 | | | 5.000 | % | | | 3,315,000 | | | | 3,867,842 | | |
Unlimited General Obligation Bonds
Series 2009
06/01/19 | | | 5.000 | % | | | 2,025,000 | | | | 2,509,765 | | |
| 06/01/20 | | | 5.000 | % | | | 880,000 | | | | 1,074,066 | | |
Municipal Bonds (continued)
Issue
Description | | Coupon
Rate | | Principal
Amount ($) | | Value ($) | |
Clackamas & Washington Counties School District No. 3
Unlimited General Obligation Bonds
West Linn-Wilsonville
Series 2009
06/15/24 | | | 5.000 | % | | | 4,150,000 | | | | 5,047,894 | | |
Clackamas & Washington Counties School District No. 3(a)
Unlimited General Obligation Bonds
Series 2003A (NPFGC/FGIC)
06/15/17 | | | 0.000 | % | | | 4,000,000 | | | | 3,759,280 | | |
Clackamas Community College District
Unrefunded Unlimited General Obligation Bonds
Series 2001 (NPFGC/FGIC)
06/15/15 | | | 5.250 | % | | | 110,000 | | | | 111,970 | | |
Clackamas County School District No. 108 Estacada
Unlimited General Obligation Refunding Bonds
Series 2005 (AGM)
06/15/25 | | | 5.500 | % | | | 2,485,000 | | | | 3,410,265 | | |
Clackamas County School District No. 115
Unlimited General Obligation Bonds
Series 2006A (NPFGC)(a)
06/15/25 | | | 0.000 | % | | | 2,250,000 | | | | 1,347,615 | | |
Clackamas County School District No. 12 North Clackamas
Unlimited General Obligation Bonds
Series 2007B (AGM)
06/15/22 | | | 5.000 | % | | | 4,000,000 | | | | 4,692,360 | | |
Clackamas County School District No. 46 Oregon Trail
Unlimited General Obligation Bonds
Series 2009A
06/15/25 | | | 5.000 | % | | | 4,350,000 | | | | 5,103,420 | | |
| 06/15/26 | | | 5.000 | % | | | 3,000,000 | | | | 3,502,740 | | |
Clackamas County School District No. 86
Unlimited General Obligation Refunding Bonds
Canby
Series 2012A
06/15/19 | | | 4.000 | % | | | 1,000,000 | | | | 1,182,790 | | |
Columbia County School District No. 502
Unlimited General Obligation Bonds
Series 1999 (NPFGC/FGIC)(a)
06/01/14 | | | 0.000 | % | | | 1,025,000 | | | | 1,010,793 | | |
Columbia Gorge Community College District
Unlimited General Obligation Refunding Bonds
Series 2012
06/15/18 | | | 3.000 | % | | | 810,000 | | | | 895,431 | | |
| 06/15/19 | | | 2.500 | % | | | 1,010,000 | | | | 1,084,669 | | |
| 06/15/20 | | | 3.000 | % | | | 805,000 | | | | 886,909 | | |
The accompanying Notes to Financial Statements are an integral part of this statement.
Annual Report 2012
8
Columbia Oregon Intermediate Municipal Bond Fund
Portfolio of Investments (continued)
July 31, 2012
Municipal Bonds (continued)
Issue
Description | | Coupon
Rate | | Principal
Amount ($) | | Value ($) | |
Columbia Multnomah & Washington Counties School District No. 1J
Unlimited General Obligation Bonds
Scappoose School District
Series 2009
06/15/23 | | | 5.000 | % | | | 1,000,000 | | | | 1,185,920 | | |
| 06/15/24 | | | 5.000 | % | | | 1,165,000 | | | | 1,374,572 | | |
| 06/15/25 | | | 5.000 | % | | | 1,275,000 | | | | 1,495,830 | | |
County of Clackamas
Limited General Obligation Bonds
Series 2007 (NPFGC)
06/01/27 | | | 4.125 | % | | | 2,000,000 | | | | 2,141,960 | | |
County of Lane
Limited General Obligation Bonds
Series 2009A
11/01/24 | | | 5.000 | % | | | 1,000,000 | | | | 1,201,350 | | |
| 11/01/25 | | | 5.000 | % | | | 1,140,000 | | | | 1,363,087 | | |
Deschutes & Jefferson Counties School District No. 2J Redmond
Unlimited General Obligation Bonds
Series 2004B (NPFGC/FGIC)(a)
06/15/22 | | | 0.000 | % | | | 2,335,000 | | | | 1,828,725 | | |
Deschutes County Administrative School District No. 1 Bend-La Pine
Unlimited General Obligation Bonds
Series 2007 (NPFGC/FGIC)
06/15/20 | | | 4.500 | % | | | 5,000,000 | | | | 5,704,700 | | |
Jackson County School District No. 549C Medford
Unlimited General Obligation Bonds
Series 2008
06/15/27 | | | 4.625 | % | | | 1,500,000 | | | | 1,690,950 | | |
| 06/15/28 | | | 4.625 | % | | | 1,660,000 | | | | 1,863,068 | | |
Jackson County School District No. 9 Eagle Point
Unlimited General Obligation Refunding Bonds
Series 2005 (NPFGC)
06/15/20 | | | 5.500 | % | | | 1,000,000 | | | | 1,285,660 | | |
| 06/15/21 | | | 5.500 | % | | | 1,410,000 | | | | 1,837,343 | | |
Jefferson County School District No. 509J
Unlimited General Obligation Bonds
Series 2002 (NPFGC/FGIC)
06/15/18 | | | 5.250 | % | | | 1,075,000 | | | | 1,079,139 | | |
Josephine County School District
Unlimited General Obligation Refunding Bonds
Series 2005 (NPFGC/FGIC)
12/15/15 | | | 5.000 | % | | | 1,000,000 | | | | 1,148,980 | | |
| 12/15/16 | | | 5.000 | % | | | 1,000,000 | | | | 1,186,920 | | |
Lane & Douglas Counties School District No. 45J3
Unlimited General Obligation Refunding Bonds
South Lane
Series 2012
06/15/19 | | | 3.000 | % | | | 1,410,000 | | | | 1,557,401 | | |
| 06/15/20 | | | 3.000 | % | | | 1,000,000 | | | | 1,101,750 | | |
| 06/15/21 | | | 3.000 | % | | | 1,610,000 | | | | 1,762,081 | | |
Municipal Bonds (continued)
Issue
Description | | Coupon
Rate | | Principal
Amount ($) | | Value ($) | |
Lane Community College
Unlimited General Obligation Bonds
Series 2009
06/15/17 | | | 4.250 | % | | | 2,195,000 | | | | 2,559,677 | | |
| 06/15/18 | | | 4.250 | % | | | 2,000,000 | | | | 2,359,280 | | |
Lane Community College(c)
Unlimited General Obligation Bonds
Series 2012
06/15/23 | | | 5.000 | % | | | 1,000,000 | | | | 1,260,170 | | |
Lane County School District No. 19 Springfield
Unlimited General Obligation Refunding Bonds
Series 1997 (NPFGC/FGIC)
10/15/12 | | | 6.000 | % | | | 1,740,000 | | | | 1,759,732 | | |
| 10/15/14 | | | 6.000 | % | | | 1,310,000 | | | | 1,455,711 | | |
Lane County School District No. 4J Eugene
Unlimited General Obligation Refunding Bonds
Series 2002
07/01/13 | | | 5.250 | % | | | 1,000,000 | | | | 1,045,940 | | |
Linn Benton Community College District
Unlimited General Obligation Bonds
Series 2001 (NPFGC/FGIC)(a)
06/15/13 | | | 0.000 | % | | | 1,000,000 | | | | 991,070 | | |
Linn County Community School District No. 9 Lebanon
Unrefunded Unlimited General Obligation Bonds
Series 2001 (NPFGC/FGIC)
06/15/15 | | | 5.250 | % | | | 305,000 | | | | 317,395 | | |
Madras Aquatic Center District
Unlimited General Obligation Bonds
Series 2005
06/01/22 | | | 5.000 | % | | | 1,695,000 | | | | 1,815,159 | | |
Portland Community College District
Unlimited General Obligation Refunding Bonds
Series 2005 (AGM)
06/15/16 | | | 5.000 | % | | | 4,750,000 | | | | 5,356,432 | | |
Salem-Keizer School District No. 24J
Unlimited General Obligation Bonds
Series 2009A
06/15/15 | | | 4.000 | % | | | 3,850,000 | | | | 4,229,610 | | |
| 06/15/16 | | | 5.000 | % | | | 2,500,000 | | | | 2,916,625 | | |
Unlimited General Obligation Refunding Bonds
Marion & Polk Counties
Series 2004
06/15/13 | | | 5.000 | % | | | 2,285,000 | | | | 2,379,576 | | |
Tri-County Metropolitan Transportation District
Refunding Revenue Bonds
Limited Tax Pledge
Series 2005A (AGM)
09/01/17 | | | 5.000 | % | | | 4,250,000 | | | | 4,809,640 | | |
Series 2003A
09/01/15 | | | 5.000 | % | | | 1,000,000 | | | | 1,025,270 | | |
Revenue Bonds
Series 2009A
09/01/18 | | | 4.000 | % | | | 1,000,000 | | | | 1,170,180 | | |
| 09/01/21 | | | 4.250 | % | | | 1,815,000 | | | | 2,112,079 | | |
The accompanying Notes to Financial Statements are an integral part of this statement.
Annual Report 2012
9
Columbia Oregon Intermediate Municipal Bond Fund
Portfolio of Investments (continued)
July 31, 2012
Municipal Bonds (continued)
Issue
Description | | Coupon
Rate | | Principal
Amount ($) | | Value ($) | |
Tualatin Hills Park & Recreation District
Unlimited General Obligation Refunding Bonds
Series 1998 (NPFGC/FGIC)
03/01/14 | | | 5.750 | % | | | 990,000 | | | | 1,074,170 | | |
Umatilla County School District No. 8R Hermiston
Unlimited General Obligation Bonds
Series 2010
06/15/29 | | | 4.500 | % | | | 2,360,000 | | | | 2,744,774 | | |
Washington & Clackamas Counties School District No. 23J Tigard-Tualatin
Unlimited General Obligation Refunding Bonds
Series 2005 (NPFGC)
06/15/19 | | | 5.000 | % | | | 850,000 | | | | 1,053,643 | | |
| 06/15/21 | | | 5.000 | % | | | 6,575,000 | | | | 8,317,046 | | |
Washington & Clackamas Counties School District No. 23J Tigard-Tualatin(a)
Limited General Obligation Bonds
Series 2000
06/15/18 | | | 0.000 | % | | | 2,700,000 | | | | 2,365,794 | | |
Washington Clackamas & Yamhill Counties School District No. 88J
Unlimited General Obligation Bonds
Sherwood
Series 2007B (NPFGC)
06/15/23 | | | 4.500 | % | | | 8,125,000 | | | | 9,034,594 | | |
Washington County School District No. 1 West Union
Unlimited General Obligation Refunding Bonds
Series 1998
11/01/13 | | | 5.000 | % | | | 1,100,000 | | | | 1,164,537 | | |
Washington County School District No. 1 West Union(a)
Unlimited General Obligation Bonds
Capital Appreciation-Hillsboro
Series 2006 (NPFGC)
06/15/25 | | | 0.000 | % | | | 4,065,000 | | | | 2,423,187 | | |
Washington County School District No. 15 Forest Grove
Unlimited General Obligation Bonds
Series 2012A
06/15/24 | | | 5.000 | % | | | 1,780,000 | | | | 2,220,408 | | |
Yamhill Clackamas & Washington Counties School District No. 29J Newberg
Unlimited General Obligation Refunding Bonds
Series 2005 (NPFGC/FGIC)
06/15/21 | | | 5.500 | % | | | 1,000,000 | | | | 1,290,270 | | |
| Total | | | | | | | 178,821,851 | | |
| Multi-Family 1.8% | |
City of Forest Grove
Revenue Bonds
Oak Tree Foundation Project
Series 2007
03/01/37 | | | 5.500 | % | | | 4,000,000 | | | | 4,072,640 | | |
Municipal Bonds (continued)
Issue
Description | | Coupon
Rate | | Principal
Amount ($) | | Value ($) | |
City of Portland
Revenue Bonds
Headwaters Apartments Project
Series 2005A
04/01/25 | | | 5.000 | % | | | 1,565,000 | | | | 1,668,744 | | |
Clackamas County Housing Authority
Revenue Bonds
Senior Lien-Easton Ridge
Series 1996A
12/01/16 | | | 5.800 | % | | | 1,160,000 | | | | 1,160,708 | | |
| 12/01/26 | | | 5.900 | % | | | 1,750,000 | | | | 1,750,927 | | |
| Total | | | | | | | 8,653,019 | | |
| Municipal Power 3.1% | |
City of Eugene
Refunding Revenue Bonds
Electric Utility System
Series 2011A
08/01/28 | | | 5.000 | % | | | 2,200,000 | | | | 2,644,752 | | |
| 08/01/29 | | | 5.000 | % | | | 3,410,000 | | | | 4,072,017 | | |
Emerald People's Utility District
Refunding Revenue Bonds
Series 1996 (NPFGC/FGIC)
11/01/12 | | | 7.350 | % | | | 2,490,000 | | | | 2,531,110 | | |
| 11/01/13 | | | 7.350 | % | | | 2,675,000 | | | | 2,886,994 | | |
Series 2003A (AGM)
11/01/20 | | | 5.250 | % | | | 605,000 | | | | 635,238 | | |
Puerto Rico Electric Power Authority
Refunding Revenue Bonds
Series 2010ZZ(d)
07/01/24 | | | 5.250 | % | | | 2,475,000 | | | | 2,745,963 | | |
| Total | | | | | | | 15,516,074 | | |
| Other Bond Issue 1.1% | |
Oregon State Facilities Authority
Revenue Bonds
Goodwill Industries Lane County
Series 1998A(e)(f)
11/15/22 | | | 6.650 | % | | | 2,770,000 | | | | 2,772,105 | | |
Puerto Rico Housing Finance Authority
Subordinated Revenue Bonds
Capital Fund Modernization
Series 2008(d)
12/01/13 | | | 5.000 | % | | | 2,455,000 | | | | 2,579,960 | | |
| Total | | | | | | | 5,352,065 | | |
The accompanying Notes to Financial Statements are an integral part of this statement.
Annual Report 2012
10
Columbia Oregon Intermediate Municipal Bond Fund
Portfolio of Investments (continued)
July 31, 2012
Municipal Bonds (continued)
Issue
Description | | Coupon
Rate | | Principal
Amount ($) | | Value ($) | |
| Ports 0.5% | |
Port of Morrow
Refunding Revenue Bonds
Series 2007
06/01/20 | | | 4.875 | % | | | 750,000 | | | | 750,278 | | |
| 06/01/25 | | | 5.000 | % | | | 1,000,000 | | | | 1,000,090 | | |
Port of St. Helen's
Revenue Bonds
Series 1999
08/01/14 | | | 5.600 | % | | | 135,000 | | | | 135,178 | | |
| 08/01/19 | | | 5.750 | % | | | 425,000 | | | | 425,310 | | |
| Total | | | | | | | 2,310,856 | | |
| Recreation 5.0% | |
Oregon State Department of Administrative Services
Revenue Bonds
Series 2008A
04/01/24 | | | 5.000 | % | | | 3,130,000 | | | | 3,672,742 | | |
Series 2009A
04/01/21 | | | 5.000 | % | | | 5,000,000 | | | | 6,084,250 | | |
| 04/01/22 | | | 5.000 | % | | | 5,000,000 | | | | 6,038,500 | | |
| 04/01/27 | | | 5.000 | % | | | 4,000,000 | | | | 4,695,720 | | |
Series 2012B
04/01/18 | | | 3.000 | % | | | 3,600,000 | | | | 3,987,900 | | |
Unrefunded Revenue Bonds
Series 2003A (AGM)
04/01/14 | | | 5.000 | % | | | 380,000 | | | | 400,900 | | |
| Total | | | | | | | 24,880,012 | | |
| Refunded / Escrowed 4.3% | |
Benton & Linn Counties Consolidated School District No. 509J & 509A
Prerefunded 06/01/13 Unlimited General Obligation Bonds
Series 2003 (AGM)
06/01/17 | | | 5.000 | % | | | 2,665,000 | | | | 2,770,534 | | |
Linn County Community School District No. 9 Lebanon
Prerefunded 06/15/13 Unlimited General Obligation Bonds
Series 2001 (FGIC)
06/15/15 | | | 5.250 | % | | | 255,000 | | | | 264,287 | | |
| 06/15/21 | | | 5.550 | % | | | 2,000,000 | | | | 2,093,440 | | |
North Clackamas Parks & Recreation District
Revenue Bonds
Recreational Facilities
Series 1993 Escrowed to Maturity
04/01/13 | | | 5.700 | % | | | 440,000 | | | | 455,748 | | |
Oregon Department of Transportation
Prerefunded 11/15/12 Revenue Bonds
Series 2002A
11/15/16 | | | 5.500 | % | | | 2,500,000 | | | | 2,538,425 | | |
Municipal Bonds (continued)
Issue
Description | | Coupon
Rate | | Principal
Amount ($) | | Value ($) | |
Oregon State Department of Administrative Services
Prerefunded 10/01/13 Revenue Bonds
Series 2003A (AGM)
04/01/14 | | | 5.000 | % | | | 1,450,000 | | | | 1,530,359 | | |
Prerefunded 11/01/12 Certificate of Participation
Series 2002E (AGM)
11/01/13 | | | 5.000 | % | | | 1,470,000 | | | | 1,487,640 | | |
Puerto Rico Public Finance Corp.
Unrefunded Revenue Bonds
Commonwealth Appropriations
Series 2002E Escrowed to Maturity(d)
08/01/26 | | | 6.000 | % | | | 5,000,000 | | | | 7,196,950 | | |
State of Oregon
Prerefunded 08/01/014 Unlimited General Obligation Refunding Bonds
Series 2004D
08/01/24 | | | 5.000 | % | | | 165,000 | | | | 180,314 | | |
Prerefunded 10/15/12 Unlimited General Obligation Bonds
Series 2002A
10/15/15 | | | 5.250 | % | | | 1,735,000 | | | | 1,753,061 | | |
Virgin Islands Public Finance Authority
Revenue Bonds
Series 1989A Escrowed to Maturity(d)
10/01/18 | | | 7.300 | % | | | 980,000 | | | | 1,190,278 | | |
| Total | | | | | | | 21,461,036 | | |
| Retirement Communities 0.4% | |
Albany Hospital Facility Authority
Refunding Revenue Bonds
Mennonite Home of Albany Project
Series 2004A
10/01/12 | | | 5.000 | % | | | 680,000 | | | | 681,680 | | |
Multnomah County Hospital Facilities Authority
Revenue Bonds
Terwilliger Plaza Project
Series 2006A
12/01/26 | | | 5.250 | % | | | 1,400,000 | | | | 1,452,542 | | |
| Total | | | | | | | 2,134,222 | | |
The accompanying Notes to Financial Statements are an integral part of this statement.
Annual Report 2012
11
Columbia Oregon Intermediate Municipal Bond Fund
Portfolio of Investments (continued)
July 31, 2012
Municipal Bonds (continued)
Issue
Description | | Coupon
Rate | | Principal
Amount ($) | | Value ($) | |
| Single Family 2.4% | |
Oregon State Housing & Community Services Department
Revenue Bonds
Single Family Mortgage
Series 2008G
07/01/28 | | | 5.200 | % | | | 4,265,000 | | | | 4,658,532 | | |
Single Family Mortgage Program
Series 2001Q
07/01/15 | | | 4.700 | % | | | 310,000 | | | | 310,818 | | |
| 07/01/17 | | | 4.900 | % | | | 310,000 | | | | 310,750 | | |
Series 2010A
07/01/27 | | | 5.250 | % | | | 810,000 | | | | 883,913 | | |
Series 2011A (FHLMC)
07/01/25 | | | 5.250 | % | | | 2,370,000 | | | | 2,725,216 | | |
Series 2011B
07/01/28 | | | 5.250 | % | | | 2,000,000 | | | | 2,212,040 | | |
Series 2011J
07/01/24 | | | 5.150 | % | | | 950,000 | | | | 951,586 | | |
| Total | | | | | | | 12,052,855 | | |
| Special Non Property Tax 6.4% | |
Oregon Department of Transportation
Refunding Revenue Bonds
Series 2012A
11/15/22 | | | 5.000 | % | | | 5,000,000 | | | | 6,513,450 | | |
Revenue Bonds
Senior Lien
Series 2007A
11/15/16 | | | 5.000 | % | | | 6,305,000 | | | | 7,479,306 | | |
Series 2009A
11/15/27 | | | 4.750 | % | | | 7,000,000 | | | | 8,111,600 | | |
Puerto Rico Highway & Transportation Authority
Refunding Revenue Bonds
Series 2003AA-1 (AGM)(d)
07/01/26 | | | 4.950 | % | | | 2,940,000 | | | | 3,200,631 | | |
Territory of Guam
Revenue Bonds
Series 2011A(d)
01/01/31 | | | 5.000 | % | | | 1,100,000 | | | | 1,235,124 | | |
Virgin Islands Public Finance Authority
Revenue Bonds
Senior Lien-Matching Fund Loan Note
Series 2010A(d)
10/01/25 | | | 5.000 | % | | | 4,410,000 | | | | 4,895,012 | | |
| Total | | | | | | | 31,435,123 | | |
Municipal Bonds (continued)
Issue
Description | | Coupon
Rate | | Principal
Amount ($) | | Value ($) | |
| Special Property Tax 6.2% | |
City of Keizer
Special Assessment Bonds
Keizer Station Area
Series 2008A
06/01/31 | | | 5.200 | % | | | 4,455,000 | | | | 4,899,119 | | |
City of Portland
Refunding Tax Allocation Bonds
2nd Lien-Downtown
Series 2011
06/15/18 | | | 5.000 | % | | | 3,095,000 | | | | 3,661,354 | | |
Senior Lien-Oregon Convention Center
Series 2011
06/15/20 | | | 5.000 | % | | | 4,305,000 | | | | 5,182,187 | | |
Revenue Bonds
Series 2003A (AMBAC)
06/15/17 | | | 5.000 | % | | | 1,500,000 | | | | 1,562,760 | | |
| 06/15/18 | | | 5.000 | % | | | 3,070,000 | | | | 3,198,449 | | |
| 06/15/20 | | | 5.000 | % | | | 2,000,000 | | | | 2,083,680 | | |
Tax Allocation Bonds
Central Eastside
Series 2011B
06/15/26 | | | 5.000 | % | | | 1,580,000 | | | | 1,757,071 | | |
| 06/15/27 | | | 5.000 | % | | | 1,370,000 | | | | 1,516,809 | | |
Lents Town Center
Series 2010B
06/15/25 | | | 5.000 | % | | | 1,550,000 | | | | 1,768,442 | | |
| 06/15/26 | | | 5.000 | % | | | 1,440,000 | | | | 1,632,571 | | |
Redmond Urban Renewal Agency
Tax Allocation Bonds
Downtown Urban Renewal Area
Series 1999B
06/01/13 | | | 5.650 | % | | | 190,000 | | | | 190,600 | | |
| 06/01/19 | | | 5.850 | % | | | 785,000 | | | | 786,986 | | |
Seaside Urban Renewal Agency
Tax Allocation Bonds
Greater Seaside Urban Renewal
Series 2001
06/01/15 | | | 5.250 | % | | | 635,000 | | | | 636,492 | | |
Veneta Urban Renewal Agency
Revenue Bonds
Urban Renewal
Series 2001
02/15/16 | | | 5.375 | % | | | 575,000 | | | | 576,363 | | |
| 02/15/21 | | | 5.625 | % | | | 1,100,000 | | | | 1,102,079 | | |
| Total | | | | | | | 30,554,962 | | |
The accompanying Notes to Financial Statements are an integral part of this statement.
Annual Report 2012
12
Columbia Oregon Intermediate Municipal Bond Fund
Portfolio of Investments (continued)
July 31, 2012
Municipal Bonds (continued)
Issue
Description | | Coupon
Rate | | Principal
Amount ($) | | Value ($) | |
| State Appropriated 3.9% | |
Oregon State Department of Administrative Services
Certificate of Participation
Series 2007A (NPFGC/FGIC)
05/01/24 | | | 5.000 | % | | | 2,630,000 | | | | 2,941,786 | | |
| 05/01/25 | | | 5.000 | % | | | 2,780,000 | | | | 3,093,306 | | |
| 05/01/26 | | | 5.000 | % | | | 2,800,000 | | | | 3,099,264 | | |
Series 2009A
05/01/23 | | | 5.000 | % | | | 3,100,000 | | | | 3,636,734 | | |
Refunding Certificate of Participation
Series 2012A
05/01/17 | | | 5.000 | % | | | 5,320,000 | | | | 6,353,038 | | |
| Total | | | | | | | 19,124,128 | | |
| State General Obligation 2.3% | |
State of Oregon
Unlimited General Obligation Refunding Bonds
Oregon University System
Series 2012A
08/01/19 | | | 5.000 | % | | | 5,000,000 | | | | 6,278,900 | | |
Unrefunded Unlimited General Obligation Refunding Bonds
Series 2004D
08/01/24 | | | 5.000 | % | | | 3,455,000 | | | | 3,741,972 | | |
State of Oregon(a)
Unlimited General Obligation Bonds
State Board of Higher Education
Series 2001A
08/01/17 | | | 0.000 | % | | | 1,050,000 | | | | 989,426 | | |
State Higher Board of Education
Series 1996A
08/01/14 | | | 0.000 | % | | | 490,000 | | | | 484,115 | | |
| Total | | | | | | | 11,494,413 | | |
| Transportation 1.2% | |
Tri-County Metropolitan Transportation District
Revenue Bonds
Capital Grant Receipt
Series 2011A
10/01/25 | | | 5.000 | % | | | 4,775,000 | | | | 5,773,500 | | |
| Water & Sewer 5.4% | |
City of Myrtle Point Water
Revenue Bonds
Series 2000
12/01/20 | | | 6.000 | % | | | 510,000 | | | | 511,163 | | |
City of Portland Sewer System
Refunding Revenue Bonds
1st Lien
Series 2008A
06/15/17 | | | 5.000 | % | | | 1,500,000 | | | | 1,803,390 | | |
Revenue Bonds
First Lien
Series 2004A (AGM)
10/01/21 | | | 4.250 | % | | | 2,500,000 | | | | 2,668,400 | | |
Municipal Bonds (continued)
Issue
Description | | Coupon
Rate | | Principal
Amount ($) | | Value ($) | |
City of Portland Water System
Refunding Revenue Bonds
1st Lien
Series 2006B
10/01/16 | | | 5.000 | % | | | 5,330,000 | | | | 6,308,108 | | |
Revenue Bonds
Series 2004B
10/01/13 | | | 5.000 | % | | | 730,000 | | | | 770,675 | | |
City of Sutherlin Water
Revenue Bonds
BAN Series 2012
11/15/13 | | | 1.400 | % | | | 1,230,000 | | | | 1,231,464 | | |
City of Woodburn
Refunding Revenue Bonds
Series 2011A
03/01/18 | | | 3.000 | % | | | 1,115,000 | | | | 1,192,805 | | |
| 03/01/19 | | | 5.000 | % | | | 3,490,000 | | | | 4,147,446 | | |
| 03/01/22 | | | 5.000 | % | | | 4,620,000 | | | | 5,597,453 | | |
Washington County Clean Water Services
Refunding Revenue Bonds
Senior Lien
Series 2004 (NPFGC)
10/01/13 | | | 5.000 | % | | | 2,310,000 | | | | 2,436,750 | | |
| Total | | | | | | | 26,667,654 | | |
Total Municipal Bonds
(Cost: $434,742,243) | | | | | | | 475,533,254 | | |
| | | | | Shares | | Value ($) | |
| Money Market Funds 3.0% | |
Dreyfus Tax-Exempt Cash Management Fund,
0.000%(g) | | | | | 7,509,036 | | | | 7,509,036 | | |
JPMorgan Tax Free Money Market Fund,
0.000%(g) | | | | | 7,377,862 | | | | 7,377,862 | | |
Total Money Market Funds
(Cost: $14,886,898) | | | | | | | 14,886,898 | | |
Total Investments
(Cost: $449,629,141) | | | | | | | 490,420,152 | | |
| Other Assets & Liabilities, Net | | | | | | | 2,716,884 | | |
| Total Net Assets | | | | | | | 493,137,036 | | |
The accompanying Notes to Financial Statements are an integral part of this statement.
Annual Report 2012
13
Columbia Oregon Intermediate Municipal Bond Fund
Portfolio of Investments (continued)
July 31, 2012
Notes to Portfolio of Investments
(a) Zero coupon bond.
(b) Variable rate security. The interest rate shown reflects the rate as of July 31, 2012.
(c) Represents a security purchased on a when-issued or delayed delivery basis.
(d) Municipal obligations include debt obligations issued by or on behalf of territories, possessions, or sovereign nations within the territorial boundaries of the United States. At July 31, 2012, the value of these securities amounted to $23,043,918 or 4.67% of net assets.
(e) Identifies issues considered to be illiquid as to their marketability. The aggregate value of such securities at July 31, 2012 was $2,772,105, representing 0.56% of net assets. Information concerning such security holdings at July 31, 2012 was as follows:
| Security Description | | Acquisition Dates | | Cost ($) | |
Oregon State Facilities Authority
Revenue Bonds
Goodwill Industries Lane County
Series 1998A
11/15/22 6.650% | | 06/17/98 | | | 2,770,000 | | |
(f) Security exempt from registration pursuant to Rule 144A under the Securities Act of 1933. This security may be resold in transactions exempt from registration, normally to qualified institutional buyers. At July 31, 2012, the value of these securities amounted to $2,772,105 or 0.56% of net assets.
(g) The rate shown is the seven-day current annualized yield at July 31, 2012.
Abbreviation Legend
AGM Assured Guaranty Municipal Corporation
AMBAC Ambac Assurance Corporation
BAN Bond Anticipation Note
FGIC Financial Guaranty Insurance Company
FHLMC Federal Home Loan Mortgage Corporation
NPFGC National Public Finance Guarantee Corporation
Fair Value Measurements
Generally accepted accounting principles (GAAP) require disclosure regarding the inputs and valuation techniques used to measure fair value and any changes in valuation inputs or techniques. In addition, investments shall be disclosed by major category.
The Fund categorizes its fair value measurements according to a three-level hierarchy that maximizes the use of observable inputs and minimizes the use of unobservable inputs by prioritizing that the most observable input be used when available. Observable inputs are those that market participants would use in pricing an investment based on market data obtained from sources independent of the reporting entity. Unobservable inputs are those that reflect the Fund's assumptions about the information market participants would use in pricing an investment. An investment's level within the fair value hierarchy is based on the lowest level of any input that is deemed significant to the asset or liability's fair value measurement. The input levels are not necessarily an indication of the risk or liquidity associated with investments at that level. For example, certain U.S. government securities are generally high quality and liquid, however, they are reflected as Level 2 because the inputs used to determine fair value may not always be quoted prices in an active market.
Fair value inputs are summarized in the three broad levels listed below:
> Level 1 — Valuations based on quoted prices for investments in active markets that the Fund has the ability to access at the measurement date (including NAV for open-end mutual funds). Valuation adjustments are not applied to Level 1 investments.
> Level 2 — Valuations based on other significant observable inputs (including quoted prices for similar securities, interest rates, prepayment speeds, credit risks, etc.).
> Level 3 — Valuations based on significant unobservable inputs (including the Fund's own assumptions and judgment in determining the fair value of investments).
Inputs that are used in determining fair value of an investment may include price information, credit data, volatility statistics, and other factors. These inputs can be either observable or unobservable. The availability of observable inputs can vary between investments, and is affected by various factors such as the type of investment, and the volume and level of activity for that investment or similar investments in
The accompanying Notes to Financial Statements are an integral part of this statement.
Annual Report 2012
14
Columbia Oregon Intermediate Municipal Bond Fund
Portfolio of Investments (continued)
July 31, 2012
Fair Value Measurements (continued)
the marketplace. The inputs will be considered by the Investment Manager, along with any other relevant factors in the calculation of an investment's fair value. The Fund uses prices and inputs that are current as of the measurement date, which may include periods of market dislocations. During these periods, the availability of prices and inputs may be reduced for many investments. This condition could cause an investment to be reclassified between the various levels within the hierarchy.
Investments falling into the Level 3 category are primarily supported by quoted prices from brokers and dealers participating in the market for those investments. However, these may be classified as Level 3 investments due to lack of market transparency and corroboration to support these quoted prices. Additionally, valuation models may be used as the pricing source for any remaining investments classified as Level 3. These models rely on one or more significant unobservable inputs and/or significant assumptions by the Investment Manager. Inputs used in valuations may include, but are not limited to, financial statement analysis, capital account balances, discount rates and estimated cash flows, and comparable company data.
Under the direction of the Fund's Board of Trustees (the Board), the Investment Manager's Valuation Committee (the Committee) is responsible for carrying out the valuation procedures approved by the Board. The Committee consists of voting and non-voting members from various groups within the Investment Manager's organization, including operations and accounting, trading and investments, compliance, risk management and legal.
The Committee meets at least monthly to review and approve valuation matters, which may include a description of specific valuation determinations, data regarding pricing information received from approved pricing vendors and brokers and the results of Board-approved valuation control policies and procedures (the Policies). The Policies address, among other things, instances when market quotations are readily available, including recommendations of third party pricing vendors and a determination of appropriate pricing methodologies; events that require specific valuation determinations and assessment of fair value techniques; securities with a potential for stale pricing, including those that are illiquid, restricted, or in default; and the effectiveness of third-party pricing vendors, including periodic reviews of vendors. The Committee meets more frequently, as needed, to discuss additional valuation matters, which may include the need to review back-testing results, review time-sensitive information or approve related valuation actions. The Committee reports to the Board, with members of the Committee meeting with the Board at each of its regularly scheduled meetings to discuss valuation matters and actions during the period, similar to those described earlier.
For investments categorized as Level 3, the Committee monitors information similar to that described above, which may include: (i) data specific to the issuer or comparable issuers, (ii) general market or specific sector news and (iii) quoted prices and specific or similar security transactions. The Committee considers this data and any changes from prior periods in order to assess the reasonableness of observable and unobservable inputs, any assumptions or internal models used to value those securities and changes in fair value. This data is also used to corroborate, when available, information received from approved pricing vendors and brokers. Various factors impact the frequency of monitoring this information (which may occur as often as daily). However, the Committee may determine that changes to inputs, assumptions and models are not required as a result of the monitoring procedures performed.
The following table is a summary of the inputs used to value the Fund's investments at July 31, 2012:
| Description | | Level 1
Quoted Prices in
Active Markets for
Identical Assets ($) | | Level 2
Other Significant
Observable
Inputs ($) | | Level 3
Significant
Unobservable
Inputs ($) | |
Total ($) | |
| Bonds | |
| Municipal Bonds | | | — | | | | 475,533,254 | | | | — | | | | 475,533,254 | | |
| Total Bonds | | | — | | | | 475,533,254 | | | | — | | | | 475,533,254 | | |
| Other | |
| Money Market Funds | | | 14,886,898 | | | | — | | | | — | | | | 14,886,898 | | |
| Total Other | | | 14,886,898 | | | | — | | | | — | | | | 14,886,898 | | |
| Total | | | 14,886,898 | | | | 475,533,254 | | | | — | | | | 490,420,152 | | |
See the Portfolio of Investments for all investment classifications not indicated in the table.
The Fund's assets assigned to the Level 2 input category are generally valued using the market approach, in which a security's value is determined through reference to prices and information from market transactions for similar or identical assets.
There were no transfers of financial assets between Levels 1 and 2 during the period.
The accompanying Notes to Financial Statements are an integral part of this statement.
Annual Report 2012
15
Columbia Oregon Intermediate Municipal Bond Fund
Statement of Assets and Liabilities
July 31, 2012
| Assets | |
| Investments, at value | |
| (identified cost $449,629,141) | | $ | 490,420,152 | | |
| Receivable for: | |
| Investments sold | | | 66,820 | | |
| Capital shares sold | | | 1,118,212 | | |
| Interest | | | 4,497,322 | | |
| Expense reimbursement due from Investment Manager | | | 1,459 | | |
| Prepaid expenses | | | 4,137 | | |
| Trustees' deferred compensation plan | | | 36,303 | | |
| Total assets | | | 496,144,405 | | |
| Liabilities | |
| Payable for: | |
| Investments purchased on a delayed delivery basis | | | 1,245,210 | | |
| Capital shares purchased | | | 387,641 | | |
| Dividend distributions to shareholders | | | 1,207,126 | | |
| Investment management fees | | | 5,382 | | |
| Distribution and service fees | | | 639 | | |
| Transfer agent fees | | | 57,149 | | |
| Administration fees | | | 909 | | |
| Chief compliance officer expenses | | | 154 | | |
| Other expenses | | | 66,856 | | |
| Trustees' deferred compensation plan | | | 36,303 | | |
| Total liabilities | | | 3,007,369 | | |
| Net assets applicable to outstanding capital stock | | $ | 493,137,036 | | |
The accompanying Notes to Financial Statements are an integral part of this statement.
Annual Report 2012
16
Columbia Oregon Intermediate Municipal Bond Fund
Statement of Assets and Liabilities (continued)
July 31, 2012
| Represented by | |
| Paid-in capital | | $ | 452,100,459 | | |
| Undistributed net investment income | | | 271,953 | | |
| Accumulated net realized loss | | | (26,387 | ) | |
| Unrealized appreciation (depreciation) on: | |
| Investments | | | 40,791,011 | | |
| Total — representing net assets applicable to outstanding capital stock | | $ | 493,137,036 | | |
| Class A | |
| Net assets | | $ | 31,483,896 | | |
| Shares outstanding | | | 2,431,049 | | |
| Net asset value per share | | $ | 12.95 | | |
| Maximum offering price per share(a) | | $ | 13.39 | | |
| Class B | |
| Net assets | | $ | 41,034 | | |
| Shares outstanding | | | 3,168 | | |
| Net asset value per share | | $ | 12.95 | | |
| Class C | |
| Net assets | | $ | 23,811,957 | | |
| Shares outstanding | | | 1,838,372 | | |
| Net asset value per share | | $ | 12.95 | | |
| Class Z | |
| Net assets | | $ | 437,800,149 | | |
| Shares outstanding | | | 33,799,122 | | |
| Net asset value per share | | $ | 12.95 | | |
(a) The maximum offering price per share is calculated by dividing the net asset value by 1.0 minus the maximum sales charge of 3.25%.
The accompanying Notes to Financial Statements are an integral part of this statement.
Annual Report 2012
17
Columbia Oregon Intermediate Municipal Bond Fund
Statement of Operations
Year Ended July 31, 2012
| | | Year Ended
July 31, 2012(a) | | Year Ended
August 31, 2011 | |
| Net investment income | |
| Income: | |
| Dividends | | $ | 1,825 | | | $ | — | | |
| Interest | | | 15,913,745 | | | | 18,569,060 | | |
| Dividends from affiliates | | | — | | | | 345 | | |
| Total income | | | 15,915,570 | | | | 18,569,405 | | |
| Expenses: | |
| Investment management fees | | | 1,715,839 | | | | 2,201,895 | | |
| Distribution fees | |
| Class B | | | 386 | | | | 1,751 | | |
| Class C | | | 141,880 | | | | 124,160 | | |
| Service fees | |
| Class A | | | 65,031 | | | | 63,916 | | |
| Class B | | | 129 | | | | 576 | | |
| Class C | | | 47,313 | | | | 41,436 | | |
| Transfer agent fees | |
| Class A | | | 23,842 | | | | 18,835 | | |
| Class B | | | 47 | | | | 179 | | |
| Class C | | | 17,398 | | | | 11,767 | | |
| Class Z | | | 351,166 | | | | 297,136 | | |
| Administration fees | | | 290,276 | | | | 51,335 | | |
| Compensation of board members | | | 23,861 | | | | 35,598 | | |
| Pricing and bookkeeping fees | | | — | | | | 100,389 | | |
| Custodian fees | | | 3,799 | | | | 19,456 | | |
| Printing and postage fees | | | 47,582 | | | | 33,080 | | |
| Registration fees | | | 60,266 | | | | 64,583 | | |
| Professional fees | | | 61,410 | | | | 69,416 | | |
| Chief compliance officer expenses | | | 467 | | | | 1,260 | | |
| Other | | | 15,842 | | | | 18,988 | | |
| Total expenses | | | 2,866,534 | | | | 3,155,756 | | |
| Fees waived or expenses reimbursed by Investment Manager and its affiliates | | | (295,895 | ) | | | (500,503 | ) | |
| Fees waived by Distributor — Class C | | | (66,179 | ) | | | — | | |
| Expense reductions | | | (1,900 | ) | | | (1 | ) | |
| Total net expenses | | | 2,502,560 | | | | 2,655,252 | | |
| Net investment income | | | 13,413,010 | | | | 15,914,153 | | |
| Realized and unrealized gain (loss) — net | |
| Net realized gain (loss) on: | |
| Investments | | | 535,433 | | | | (591,862 | ) | |
| Net realized gain (loss) | | | 535,433 | | | | (591,862 | ) | |
| Net change in unrealized appreciation (depreciation) on: | |
| Investments | | | 16,598,058 | | | | (7,035,023 | ) | |
| Net change in unrealized appreciation (depreciation) | | | 16,598,058 | | | | (7,035,023 | ) | |
| Net realized and unrealized gain (loss) | | | 17,133,491 | | | | (7,626,885 | ) | |
| Net increase in net assets resulting from operations | | $ | 30,546,501 | | | $ | 8,287,268 | | |
(a) For the period from September 1, 2011 to July 31, 2012. During the period, the Fund's fiscal year end was changed from August 31 to July 31.
The accompanying Notes to Financial Statements are an integral part of this statement.
Annual Report 2012
18
Columbia Oregon Intermediate Municipal Bond Fund
Statement of Changes in Net Assets
| | | Year Ended
July 31, 2012(a) | | Year Ended
August 31, 2011 | | Year Ended
August 31, 2010 | |
| Operations | |
| Net investment income | | $ | 13,413,010 | | | $ | 15,914,153 | | | $ | 16,671,499 | | |
| Net realized gain (loss) | | | 535,433 | | | | (591,862 | ) | | | 997,849 | | |
| Net change in unrealized appreciation (depreciation) | | | 16,598,058 | | | | (7,035,023 | ) | | | 18,044,173 | | |
| Net increase in net assets resulting from operations | | | 30,546,501 | | | | 8,287,268 | | | | 35,713,521 | | |
| Distributions to shareholders | |
| Net investment income | |
| Class A | | | (760,753 | ) | | | (842,891 | ) | | | (701,103 | ) | |
| Class B | | | (1,142 | ) | | | (5,973 | ) | | | (12,721 | ) | |
| Class C | | | (476,170 | ) | | | (478,141 | ) | | | (419,059 | ) | |
| Class Z | | | (12,184,086 | ) | | | (14,648,157 | ) | | | (15,520,849 | ) | |
| Net realized gains | |
| Class A | | | — | | | | (47,330 | ) | | | — | | |
| Class B | | | — | | | | (559 | ) | | | — | | |
| Class C | | | — | | | | (28,963 | ) | | | — | | |
| Class Z | | | — | | | | (729,539 | ) | | | — | | |
| Total distributions to shareholders | | | (13,422,151 | ) | | | (16,781,553 | ) | | | (16,653,732 | ) | |
| Increase (decrease) in net assets from share transactions | | | 30,473,981 | | | | (41,175,886 | ) | | | 32,393,745 | | |
| Total increase (decrease) in net assets | | | 47,598,331 | | | | (49,670,171 | ) | | | 51,453,534 | | |
| Net assets at beginning of year | | | 445,538,705 | | | | 495,208,876 | | | | 443,755,342 | | |
| Net assets at end of year | | $ | 493,137,036 | | | $ | 445,538,705 | | | $ | 495,208,876 | | |
| Undistributed net investment income | | $ | 271,953 | | | $ | 281,094 | | | $ | 464,202 | | |
(a) For the period from September 1, 2011 to July 31, 2012. During the period, the Fund's fiscal year end was changed from August 31 to July 31.
The accompanying Notes to Financial Statements are an integral part of this statement.
Annual Report 2012
19
Columbia Oregon Intermediate Municipal Bond Fund
Statement of Changes in Net Assets (continued)
| | | Year Ended July 31, 2012(a) | | Year Ended August 31, 2011 | | Year Ended August 31, 2010 | |
| | | Shares | | Dollars($) | | Shares | | Dollars($) | | Shares | | Dollars($) | |
| Capital stock activity | |
| Class A shares | |
| Subscriptions(b) | | | 949,623 | | | | 12,024,984 | | | | 890,521 | | | | 10,923,081 | | | | 1,365,372 | | | | 16,826,691 | | |
| Distributions reinvested | | | 50,873 | | | | 648,392 | | | | 40,010 | | | | 489,936 | | | | 35,415 | | | | 437,050 | | |
| Redemptions | | | (571,183 | ) | | | (7,265,228 | ) | | | (1,112,138 | ) | | | (13,574,198 | ) | | | (491,768 | ) | | | (6,052,905 | ) | |
| Net increase (decrease) | | | 429,313 | | | | 5,408,148 | | | | (181,607 | ) | | | (2,161,181 | ) | | | 909,019 | | | | 11,210,836 | | |
| Class B shares | |
| Subscriptions | | | 757 | | | | 9,697 | | | | 123 | | | | 1,506 | | | | 1,765 | | | | 21,655 | | |
| Distributions reinvested | | | 21 | | | | 268 | | | | 190 | | | | 2,323 | | | | 632 | | | | 7,786 | | |
| Redemptions(b) | | | (3,917 | ) | | | (50,234 | ) | | | (25,822 | ) | | | (314,324 | ) | | | (23,259 | ) | | | (285,419 | ) | |
| Net decrease | | | (3,139 | ) | | | (40,269 | ) | | | (25,509 | ) | | | (310,495 | ) | | | (20,862 | ) | | | (255,978 | ) | |
| Class C shares | |
| Subscriptions | | | 653,144 | | | | 8,312,504 | | | | 389,956 | | | | 4,799,963 | | | | 432,297 | | | | 5,330,213 | | |
| Distributions reinvested | | | 30,427 | | | | 387,885 | | | | 21,922 | | | | 268,239 | | | | 17,321 | | | | 213,880 | | |
| Redemptions | | | (291,973 | ) | | | (3,704,948 | ) | | | (285,063 | ) | | | (3,454,496 | ) | | | (60,819 | ) | | | (750,119 | ) | |
| Net increase | | | 391,598 | | | | 4,995,441 | | | | 126,815 | | | | 1,613,706 | | | | 388,799 | | | | 4,793,974 | | |
| Class Z shares | |
| Subscriptions | | | 3,845,855 | | | | 48,973,355 | | | | 2,186,882 | | | | 26,859,008 | | | | 4,601,517 | | | | 56,748,918 | | |
| Distributions reinvested | | | 690,470 | | | | 8,796,813 | | | | 915,596 | | | | 11,205,841 | | | | 919,244 | | | | 11,343,381 | | |
| Redemptions | | | (2,955,678 | ) | | | (37,659,507 | ) | | | (6,436,980 | ) | | | (78,382,765 | ) | | | (4,174,921 | ) | | | (51,447,386 | ) | |
| Net increase (decrease) | | | 1,580,647 | | | | 20,110,661 | | | | (3,334,502 | ) | | | (40,317,916 | ) | | | 1,345,840 | | | | 16,644,913 | | |
| Total net increase (decrease) | | | 2,398,419 | | | | 30,473,981 | | | | (3,414,803 | ) | | | (41,175,886 | ) | | | 2,622,796 | | | | 32,393,745 | | |
(a) For the period from September 1, 2011 to July 31, 2012. During the period, the Fund's fiscal year end was changed from August 31 to July 31.
(b) Includes conversions of Class B shares to Class A shares, if any.
The accompanying Notes to Financial Statements are an integral part of this statement.
Annual Report 2012
20
Columbia Oregon Intermediate Municipal Bond Fund
Financial Highlights
The following tables are intended to help you understand the Fund's financial performance. Certain information reflects financial results for a single share of a class held for the periods shown. Per share net investment income (loss) amounts are calculated based on average shares outstanding during the period. Total returns assume reinvestment of all dividends and distributions. Total returns do not reflect payment of sales charges, if any, and are not annualized for periods of less than one year.
| | | Year Ended
July 31, | |
Year Ended August 31, | |
| Class A | | 2012(a) | | 2011 | | 2010 | | 2009 | | 2008 | | 2007 | |
| Per share data | |
| Net asset value, beginning of period | | $ | 12.49 | | | $ | 12.67 | | | $ | 12.17 | | | $ | 12.07 | | | $ | 12.02 | | | $ | 12.24 | | |
| Income from investment operations: | |
| Net investment income | | | 0.34 | | | | 0.40 | | | | 0.41 | | | | 0.45 | | | | 0.46 | | | | 0.46 | | |
| Net realized and unrealized gain (loss) | | | 0.46 | | | | (0.15 | ) | | | 0.51 | | | | 0.09 | | | | 0.05 | | | | (0.23 | ) | |
| Total from investment operations | | | 0.80 | | | | 0.25 | | | | 0.92 | | | | 0.54 | | | | 0.51 | | | | 0.23 | | |
| Less distributions to shareholders: | |
| Net investment income | | | (0.34 | ) | | | (0.41 | ) | | | (0.42 | ) | | | (0.45 | ) | | | (0.46 | ) | | | (0.45 | ) | |
| Net realized gains | | | — | | | | (0.02 | ) | | | — | | | | — | | | | — | | | | — | | |
| Total distributions to shareholders | | | (0.34 | ) | | | (0.43 | ) | | | (0.42 | ) | | | (0.45 | ) | | | (0.46 | ) | | | (0.45 | ) | |
| Proceeds from regulatory settlements | | | — | | | | — | | | | — | | | | 0.01 | | | | — | | | | — | | |
| Net asset value, end of period | | $ | 12.95 | | | $ | 12.49 | | | $ | 12.67 | | | $ | 12.17 | | | $ | 12.07 | | | $ | 12.02 | | |
| Total return | | | 6.50 | % | | | 2.07 | % | | | 7.68 | % | | | 4.70 | % | | | 4.31 | % | | | 1.92 | % | |
| Ratios to average net assets(b) | |
Expenses prior to fees waived or expenses
reimbursed | | | 0.86 | %(c) | | | 0.89 | % | | | 0.89 | % | | | 0.89 | % | | | 0.87 | % | | | 0.88 | % | |
Net expenses after fees waived or expenses
reimbursed(d) | | | 0.79 | %(c)(e) | | | 0.80 | %(e) | | | 0.78 | %(e) | | | 0.75 | %(e) | | | 0.77 | %(e) | | | 0.88 | %(e) | |
| Net investment income | | | 2.92 | %(c)(e) | | | 3.28 | %(e) | | | 3.35 | %(e) | | | 3.74 | %(e) | | | 3.78 | %(e) | | | 3.73 | %(e) | |
| Supplemental data | |
| Net assets, end of period (in thousands) | | $ | 31,484 | | | $ | 24,998 | | | $ | 27,661 | | | $ | 15,507 | | | $ | 10,210 | | | $ | 5,519 | | |
| Portfolio turnover | | | 9 | % | | | 13 | % | | | 12 | % | | | 8 | % | | | 5 | % | | | 16 | % | |
Notes to Financial Highlights
(a) For the period from September 1, 2011 to July 31, 2012. During the period, the Fund's fiscal year end was changed from August 31 to July 31.
(b) In addition to the fees and expenses which the Fund bears directly, the Fund indirectly bears a pro rata share of the fees and expenses of the acquired funds in which it invests. Such indirect expenses are not included in the reported expense ratios.
(c) Annualized.
(d) The Investment Manager and certain of its affiliates agreed to waive/reimburse certain fees and expenses, if applicable.
(e) The benefits derived from expense reductions had an impact of less than 0.01%.
The accompanying Notes to Financial Statements are an integral part of this statement.
Annual Report 2012
21
Columbia Oregon Intermediate Municipal Bond Fund
Financial Highlights (continued)
| | | Year Ended
July 31, | |
Year Ended August 31, | |
| Class B | | 2012(a) | | 2011 | | 2010 | | 2009 | | 2008 | | 2007 | |
| Per share data | |
| Net asset value, beginning of period | | $ | 12.49 | | | $ | 12.67 | | | $ | 12.17 | | | $ | 12.07 | | | $ | 12.02 | | | $ | 12.24 | | |
| Income from investment operations: | |
| Net investment income | | | 0.26 | | | | 0.32 | | | | 0.33 | | | | 0.36 | | | | 0.37 | | | | 0.36 | | |
| Net realized and unrealized gain (loss) | | | 0.45 | | | | (0.17 | ) | | | 0.49 | | | | 0.09 | | | | 0.05 | | | | (0.22 | ) | |
| Total from investment operations | | | 0.71 | | | | 0.15 | | | | 0.82 | | | | 0.45 | | | | 0.42 | | | | 0.14 | | |
| Less distributions to shareholders: | |
| Net investment income | | | (0.25 | ) | | | (0.31 | ) | | | (0.32 | ) | | | (0.36 | ) | | | (0.37 | ) | | | (0.36 | ) | |
| Net realized gains | | | — | | | | (0.02 | ) | | | — | | | | — | | | | — | | | | — | | |
| Total distributions to shareholders | | | (0.25 | ) | | | (0.33 | ) | | | (0.32 | ) | | | (0.36 | ) | | | (0.37 | ) | | | (0.36 | ) | |
| Proceeds from regulatory settlements | | | — | | | | — | | | | — | | | | 0.01 | | | | — | | | | — | | |
| Net asset value, end of period | | $ | 12.95 | | | $ | 12.49 | | | $ | 12.67 | | | $ | 12.17 | | | $ | 12.07 | | | $ | 12.02 | | |
| Total return | | | 5.77 | % | | | 1.30 | % | | | 6.88 | % | | | 3.92 | % | | | 3.56 | % | | | 1.16 | % | |
| Ratios to average net assets(b) | |
Expenses prior to fees waived or expenses
reimbursed | | | 1.61 | %(c) | | | 1.66 | % | | | 1.64 | % | | | 1.64 | % | | | 1.62 | % | | | 1.63 | % | |
Net expenses after fees waived or expenses
reimbursed(d) | | | 1.54 | %(c)(e) | | | 1.55 | %(e) | | | 1.53 | %(e) | | | 1.50 | %(e) | | | 1.52 | %(e) | | | 1.63 | %(e) | |
| Net investment income | | | 2.22 | %(c)(e) | | | 2.57 | %(e) | | | 2.66 | %(e) | | | 3.02 | %(e) | | | 3.08 | %(e) | | | 2.98 | %(e) | |
| Supplemental data | |
| Net assets, end of period (in thousands) | | $ | 41 | | | $ | 79 | | | $ | 403 | | | $ | 641 | | | $ | 570 | | | $ | 842 | | |
| Portfolio turnover | | | 9 | % | | | 13 | % | | | 12 | % | | | 8 | % | | | 5 | % | | | 16 | % | |
Notes to Financial Highlights
(a) For the period from September 1, 2011 to July 31, 2012. During the period, the Fund's fiscal year end was changed from August 31 to July 31.
(b) In addition to the fees and expenses which the Fund bears directly, the Fund indirectly bears a pro rata share of the fees and expenses of the acquired funds in which it invests. Such indirect expenses are not included in the reported expense ratios.
(c) Annualized.
(d) The Investment Manager and certain of its affiliates agreed to waive/reimburse certain fees and expenses, if applicable.
(e) The benefits derived from expense reductions had an impact of less than 0.01%.
The accompanying Notes to Financial Statements are an integral part of this statement.
Annual Report 2012
22
Columbia Oregon Intermediate Municipal Bond Fund
Financial Highlights (continued)
| | | Year Ended
July 31, | |
Year Ended August 31, | |
| Class C | | 2012(a) | | 2011 | | 2010 | | 2009 | | 2008 | | 2007 | |
| Per share data | |
| Net asset value, beginning of period | | $ | 12.49 | | | $ | 12.67 | | | $ | 12.17 | | | $ | 12.07 | | | $ | 12.02 | | | $ | 12.24 | | |
| Income from investment operations: | |
| Net investment income | | | 0.29 | | | | 0.35 | | | | 0.37 | | | | 0.40 | | | | 0.41 | | | | 0.40 | | |
| Net realized and unrealized gain (loss) | | | 0.46 | | | | (0.15 | ) | | | 0.50 | | | | 0.09 | | | | 0.05 | | | | (0.21 | ) | |
| Total from investment operations | | | 0.75 | | | | 0.20 | | | | 0.87 | | | | 0.49 | | | | 0.46 | | | | 0.19 | | |
| Less distributions to shareholders: | |
| Net investment income | | | (0.29 | ) | | | (0.36 | ) | | | (0.37 | ) | | | (0.40 | ) | | | (0.41 | ) | | | (0.41 | ) | |
| Net realized gains | | | — | | | | (0.02 | ) | | | — | | | | — | | | | — | | | | — | | |
| Total distributions to shareholders | | | (0.29 | ) | | | (0.38 | ) | | | (0.37 | ) | | | (0.40 | ) | | | (0.41 | ) | | | (0.41 | ) | |
| Proceeds from regulatory settlements | | | — | | | | — | | | | — | | | | 0.01 | | | | — | | | | — | | |
| Net asset value, end of period | | $ | 12.95 | | | $ | 12.49 | | | $ | 12.67 | | | $ | 12.17 | | | $ | 12.07 | | | $ | 12.02 | | |
| Total return | | | 6.10 | % | | | 1.65 | % | | | 7.25 | % | | | 4.28 | % | | | 3.88 | % | | | 1.52 | % | |
| Ratios to average net assets(b) | |
Expenses prior to fees waived or expenses
reimbursed | | | 1.61 | %(c) | | | 1.64 | % | | | 1.64 | % | | | 1.64 | % | | | 1.62 | % | | | 1.63 | % | |
Net expenses after fees waived or expenses
reimbursed(d) | | | 1.19 | %(c)(e) | | | 1.19 | %(e) | | | 1.18 | %(e) | | | 1.15 | %(e) | | | 1.17 | %(e) | | | 1.28 | %(e) | |
| Net investment income | | | 2.51 | %(c)(e) | | | 2.88 | %(e) | | | 2.96 | %(e) | | | 3.34 | %(e) | | | 3.36 | %(e) | | | 3.33 | %(e) | |
| Supplemental data | |
| Net assets, end of period (in thousands) | | $ | 23,812 | | | $ | 18,069 | | | $ | 16,722 | | | $ | 11,332 | | | $ | 7,847 | | | $ | 1,097 | | |
| Portfolio turnover | | | 9 | % | | | 13 | % | | | 12 | % | | | 8 | % | | | 5 | % | | | 16 | % | |
Notes to Financial Highlights
(a) For the period from September 1, 2011 to July 31, 2012. During the period, the Fund's fiscal year end was changed from August 31 to July 31.
(b) In addition to the fees and expenses which the Fund bears directly, the Fund indirectly bears a pro rata share of the fees and expenses of the acquired funds in which it invests. Such indirect expenses are not included in the reported expense ratios.
(c) Annualized.
(d) The Investment Manager and certain of its affiliates agreed to waive/reimburse certain fees and expenses, if applicable.
(e) The benefits derived from expense reductions had an impact of less than 0.01%.
The accompanying Notes to Financial Statements are an integral part of this statement.
Annual Report 2012
23
Columbia Oregon Intermediate Municipal Bond Fund
Financial Highlights (continued)
| | | Year Ended
July 31, | |
Year Ended August 31, | |
| Class Z | | 2012(a) | | 2011 | | 2010 | | 2009 | | 2008 | | 2007 | |
| Per share data | |
| Net asset value, beginning of period | | $ | 12.49 | | | $ | 12.67 | | | $ | 12.17 | | | $ | 12.07 | | | $ | 12.02 | | | $ | 12.24 | | |
| Income from investment operations: | |
| Net investment income | | | 0.37 | | | | 0.43 | | | | 0.45 | | | | 0.48 | | | | 0.49 | | | | 0.49 | | |
| Net realized and unrealized gain (loss) | | | 0.46 | | | | (0.15 | ) | | | 0.50 | | | | 0.09 | | | | 0.05 | | | | (0.23 | ) | |
| Total from investment operations | | | 0.83 | | | | 0.28 | | | | 0.95 | | | | 0.57 | | | | 0.54 | | | | 0.26 | | |
| Less distributions to shareholders: | |
| Net investment income | | | (0.37 | ) | | | (0.44 | ) | | | (0.45 | ) | | | (0.48 | ) | | | (0.49 | ) | | | (0.48 | ) | |
| Net realized gains | | | — | | | | (0.02 | ) | | | — | | | | — | | | | — | | | | — | | |
| Total distributions to shareholders | | | (0.37 | ) | | | (0.46 | ) | | | (0.45 | ) | | | (0.48 | ) | | | (0.49 | ) | | | (0.48 | ) | |
| Proceeds from regulatory settlements | | | — | | | | — | | | | — | | | | 0.01 | | | | — | | | | — | | |
| Net asset value, end of period | | $ | 12.95 | | | $ | 12.49 | | | $ | 12.67 | | | $ | 12.17 | | | $ | 12.07 | | | $ | 12.02 | | |
| Total return | | | 6.73 | % | | | 2.31 | % | | | 7.95 | % | | | 4.96 | % | | | 4.59 | % | | | 2.18 | % | |
| Ratios to average net assets(b) | |
Expenses prior to fees waived or expenses
reimbursed | | | 0.61 | %(c) | | | 0.64 | % | | | 0.64 | % | | | 0.64 | % | | | 0.62 | % | | | 0.63 | % | |
Net expenses after fees waived or expenses
reimbursed(d) | | | 0.54 | %(c)(e) | | | 0.55 | %(e) | | | 0.53 | %(e) | | | 0.50 | %(e) | | | 0.52 | %(e) | | | 0.63 | %(e) | |
| Net investment income | | | 3.17 | %(c)(e) | | | 3.53 | %(e) | | | 3.63 | %(e) | | | 4.02 | %(e) | | | 4.07 | %(e) | | | 3.98 | %(e) | |
| Supplemental data | |
| Net assets, end of period (in thousands) | | $ | 437,800 | | | $ | 402,393 | | | $ | 450,422 | | | $ | 416,275 | | | $ | 381,162 | | | $ | 368,292 | | |
| Portfolio turnover | | | 9 | % | | | 13 | % | | | 12 | % | | | 8 | % | | | 5 | % | | | 16 | % | |
Notes to Financial Highlights
(a) For the period from September 1, 2011 to July 31, 2012. During the period, the Fund's fiscal year end was changed from August 31 to July 31.
(b) In addition to the fees and expenses which the Fund bears directly, the Fund indirectly bears a pro rata share of the fees and expenses of the acquired funds in which it invests. Such indirect expenses are not included in the reported expense ratios.
(c) Annualized.
(d) The Investment Manager and certain of its affiliates agreed to waive/reimburse certain fees and expenses, if applicable.
(e) The benefits derived from expense reductions had an impact of less than 0.01%.
The accompanying Notes to Financial Statements are an integral part of this statement.
Annual Report 2012
24
Columbia Oregon Intermediate Municipal Bond Fund
Notes to Financial Statements
July 31, 2012
Note 1. Organization
Columbia Oregon Intermediate Municipal Bond Fund (the Fund), a series of Columbia Funds Series Trust I (the Trust), is a diversified fund. The Trust is registered under the Investment Company Act of 1940, as amended (the 1940 Act), as an open-end management investment company organized as a Massachusetts business trust.
Fiscal Year End Change
During the period, the Fund changed its fiscal year end from August 31 to July 31.
Fund Shares
The Trust may issue an unlimited number of shares (without par value). The Fund offers Class A, Class B, Class C and Class Z shares. All share classes have identical voting, dividend and liquidation rights. Each share class has its own expense structure and sales charges, as applicable.
Class A shares are subject to a maximum front-end sales charge of 3.25% based on the initial investment amount. Class A shares purchased without an initial sales charge in accounts aggregating $1 million to $50 million at the time of purchase are subject to a contingent deferred sales charge (CDSC) if the shares are sold within 18 months of purchase, charged as follows: 1.00% CDSC if redeemed within 12 months of purchase, and 0.50% CDSC if redeemed more than 12, but less than 18, months after purchase.
Class B shares may be subject to a maximum CDSC of 3.00% based upon the holding period after purchase. Class B shares will generally convert to Class A shares eight years after purchase. The Fund no longer accepts investments by new or existing investors in the Fund's Class B shares, except in connection with the reinvestment of any dividend and/or capital gain distributions in Class B shares of the Fund and exchanges by existing Class B shareholders of certain other funds within the Columbia Family of Funds.
Class C shares are subject to a 1.00% CDSC on shares redeemed within one year of purchase.
Class Z shares are not subject to sales charges, and are only available to certain investors.
Note 2. Summary of Significant Accounting Policies
Use of Estimates
The preparation of financial statements in accordance with U.S. generally accepted accounting principles (GAAP) requires management to make certain estimates and assumptions that affect the reported amounts of assets and liabilities, the disclosure of contingent assets and liabilities at the date of the financial statements and the reported amounts of revenue and expenses during the reporting period. Actual results could differ from those estimates.
The following is a summary of significant accounting policies consistently followed by the Fund in the preparation of its financial statements.
Security Valuation
Debt securities generally are valued by pricing services approved by the Board of Trustees (the Board) based upon market transactions for normal, institutional-size trading units of similar securities. The services may use various pricing techniques which take into account appropriate factors such as yield, quality, coupon rate, maturity, type of issue, trading characteristics and other data, as well as broker quotes. Debt securities for which quotations are readily available may also be valued based upon an over-the-counter or exchange bid quotation.
Investments in other open-end investment companies, including money market funds, are valued at net asset value.
Investments for which market quotations are not readily available, or that have quotations which management believes are not reliable, are valued at fair value as determined in good faith under consistently applied procedures established by and under the general supervision of the Board. If a security or class of securities (such as foreign securities) is valued at fair value, such value is likely to be different from the last quoted market price for the security.
The determination of fair value often requires significant judgment. To determine fair value, management may use assumptions including but not limited to future cash flows and estimated risk premiums. Multiple inputs from various sources may be used to determine fair value.
Delayed Delivery Securities
The Fund may trade securities on other than normal settlement terms, including securities purchased or sold on a "when-issued" basis. This may increase the risk if the other party to the transaction fails to deliver and causes the Fund to subsequently invest at less advantageous prices. The Fund designates cash or liquid securities in an amount equal to the delayed delivery commitment.
Security Transactions
Security transactions are accounted for on the trade date. Cost is determined and gains (losses) are based upon the specific identification method for both financial statement and federal income tax purposes.
Annual Report 2012
25
Columbia Oregon Intermediate Municipal Bond Fund
Notes to Financial Statements (continued)
July 31, 2012
Income Recognition
Interest income is recorded on an accrual basis. Market premium and discount are amortized and accreted, respectively, on all debt securities, unless otherwise noted. Original issue discount is accreted to interest income over the life of the security with a corresponding increase in the cost basis, if any.
Expenses
General expenses of the Trust are allocated to the Fund and other funds of the Trust based upon relative net assets or other expense allocation methodologies determined by the nature of the expense. Expenses directly attributable to the Fund are charged to the Fund. Expenses directly attributable to a specific class of shares are charged to that share class.
Determination of Class Net Asset Value
All income, expenses (other than class-specific expenses, which are charged to that share class, as shown in the Statement of Operations) and realized and unrealized gains (losses) are allocated to each class of the Fund on a daily basis for purposes of determining the net asset value of each class. Income and expenses are allocated to each class based on the settled shares method, while realized and unrealized gains (losses) are allocated based on the relative net assets of each class.
Federal Income Tax Status
The Fund intends to qualify each year as a regulated investment company under Subchapter M of the Internal Revenue Code, as amended, and will distribute substantially all of its tax exempt income (including net short-term capital gains), if any, for its tax year, and as such will not be subject to federal income taxes. In addition, the Fund intends to distribute in each calendar year substantially all of its net investment income, capital gains and certain other amounts, if any, such that the Fund should not be subject to federal excise tax. Therefore, no federal income or excise tax provision is recorded.
Distributions to Shareholders
Distributions from net investment income, if any, are declared daily and paid monthly. Net realized capital gains, if any, are distributed at least annually. Income distributions and capital gain distributions are determined in accordance with federal income tax regulations, which may differ from GAAP.
Guarantees and Indemnifications
Under the Trust's organizational documents and, in some cases, by contract, its officers and trustees are indemnified against certain liabilities arising out of the performance of their duties to the Trust or its funds. In addition, certain of the Fund's contracts with its service providers contain general indemnification clauses. The Fund's maximum exposure under these arrangements is unknown since the amount of any future claims that may be made against the Fund cannot be determined, and the Fund has no historical basis for predicting the likelihood of any such claims.
Recent Accounting Pronouncement
Disclosures about Offsetting Assets and Liabilities
In December 2011, the Financial Accounting Standards Board (FASB) issued ASU No. 2011-11, Disclosures about Offsetting Assets and Liabilities. The objective of the FASB is to enhance current disclosure requirements on offsetting of certain assets and liabilities and to enable financial statement users to compare financial statements prepared under GAAP and International Financial Reporting Standards.
Specifically, ASU No. 2011-11 requires an entity to disclose both gross and net information for derivatives and other financial instruments that are subject to a master netting arrangement or similar agreement. The standard requires disclosure of collateral received in connection with the master netting agreements or similar agreements. The effective date of ASU No. 2011-11 is for interim and annual periods beginning on or after January 1, 2013. At this time, management is evaluating the implications of this guidance and the impact it will have on the financial statement amounts and footnote disclosures, if any.
Note 3. Fees and Compensation Paid to Affiliates
Investment Management Fees
Under an Investment Management Services Agreement, Columbia Management Investment Advisers, LLC (the Investment Manager), a wholly-owned subsidiary of Ameriprise Financial, Inc. (Ameriprise Financial), determines which securities will be purchased, held or sold. The management fee is an annual fee that is equal to a percentage of the Fund's average daily net assets that declines from 0.40% to 0.27% as the Fund's net assets increase. Prior to July 1, 2011, the management fee was equal to the annual rate of 0.50% of the Fund's average daily net assets. The annualized effective management fee rate for the period ended July 31, 2012, and for the year ended August 31, 2011, was 0.40% and 0.48%, respectively, of the Fund's average daily net assets.
Administration Fees
Under an Administrative Services Agreement, the Investment Manager serves as the Fund Administrator. The Fund pays the
Annual Report 2012
26
Columbia Oregon Intermediate Municipal Bond Fund
Notes to Financial Statements (continued)
July 31, 2012
Fund Administrator an annual fee for administration and accounting services equal to a percentage of the Fund's average daily net assets that declines from 0.07% to 0.04% as the Fund's net assets increase. Prior to July 1, 2011, the Investment Manager did not receive a fee for its services under the Administration Services Agreement. The annualized effective administration fee rate for the period ended July 31, 2012, and for the year ended August 31, 2011, was 0.07% and 0.01%, respectively, of the Fund's average daily net assets.
Pricing and Bookkeeping Fees
Prior to May 16, 2011, the Fund had entered into a Financial Reporting Services Agreement (the Financial Reporting Services Agreement) with State Street Bank and Trust Company (State Street) and the Investment Manager pursuant to which State Street provided financial reporting services to the Fund. The Fund also entered into an Accounting Services Agreement (collectively with the Financial Reporting Services Agreement, the State Street Agreements) with State Street and the Investment Manager pursuant to which State Street provided accounting services to the Fund. Under the State Street Agreements, the Fund paid State Street an annual fee of $38,000 paid monthly plus an additional monthly fee based on an annualized percentage rate of average daily net assets of the Fund for the month. The aggregate fee did not exceed $140,000 per year (exclusive of out-of-pocket expenses and charges). The Fund also reimbursed State Street for certain out-of-pocket expenses and charges. Effective May 16, 2011, these services are now provided under the Administrative Services Agreement discussed above.
Compensation of Board Members
Board members are compensated for their services to the Fund as disclosed in the Statement of Operations. The Trust's eligible Trustees may participate in a Deferred Compensation Plan (the Plan) which may be terminated at any time. Obligations of the Plan will be paid solely out of the Fund's assets.
Compensation of Chief Compliance Officer
The Board has appointed a Chief Compliance Officer to the Fund in accordance with federal securities regulations. The Fund pays its pro-rata share of the expenses associated with the Chief Compliance Officer. The Fund's expenses for the Chief Compliance Officer will not exceed $15,000 per year.
Transfer Agent Fees
Under a Transfer and Dividend Disbursing Agent Agreement, Columbia Management Investment Services Corp. (the Transfer Agent), an affiliate of the Investment Manager and a wholly-owned subsidiary of Ameriprise Financial, is responsible for providing transfer agency services to the Fund. The Transfer Agent has contracted with Boston Financial Data Services (BFDS) to serve as sub-transfer agent.
The Transfer Agent receives monthly account-based service fees based on the number of open accounts and is reimbursed by the Fund for the fees and expenses the Transfer Agent pays to financial intermediaries that maintain omnibus accounts with the Fund that is a percentage of the average aggregate value of the Fund's shares maintained in each such omnibus account (other than omnibus accounts for which American Enterprise Investment Services Inc. is the broker of record or accounts where the beneficial shareholder is a customer of Ameriprise Financial Services, Inc., which are paid a per account fee). The Transfer Agent pays the fees of BFDS for services as sub-transfer agent and is not entitled to reimbursement for such fees from the Fund (with the exception of out-of-pocket fees).
The Transfer Agent also receives compensation from fees for various shareholder services and reimbursements for certain out-of-pocket expenses.
For the period ended July 31, 2012 and for the year ended August 31, 2011, the Fund's annualized effective transfer agent fee rates as a percentage of average daily net assets of each class were as follows:
| | | Period ended
July 31, 2012 | | Year ended
August 31, 2011 | |
| Class A | | | 0.09 | % | | | 0.07 | % | |
| Class B | | | 0.09 | | | | 0.08 | | |
| Class C | | | 0.09 | | | | 0.07 | | |
| Class Z | | | 0.09 | | | | 0.07 | | |
An annual minimum account balance fee of $20 may apply to certain accounts with a value below the Fund's initial minimum investment requirements to reduce the impact of small accounts on transfer agent fees. These minimum account balance fees are recorded as part of expense reductions in the Statement of Operations. For the period ended July 31, 2012, these minimum account balance fees reduced total expenses by $1,900. For the year ended August 31, 2011, no minimum account balance fees were charged to accounts.
Distribution and Service Fees
The Fund has an agreement with Columbia Management Investment Distributors, Inc. (the Distributor), an affiliate of the Investment Manager and a wholly-owned subsidiary of Ameriprise Financial, for distribution and shareholder services. Pursuant to Rule 12b-1 under the 1940 Act, the Board has approved, and the Fund has adopted, distribution and shareholder service plans (the Plans) which set the distribution and service fees for the Fund. These fees are
Annual Report 2012
27
Columbia Oregon Intermediate Municipal Bond Fund
Notes to Financial Statements (continued)
July 31, 2012
calculated daily and are intended to compensate the Distributor and/or eligible selling and/or servicing agents for selling shares of the Fund and providing services to investors.
The Plans require the payment of a monthly service fee to the Distributor at the maximum annual rate of 0.25% of the average daily net assets attributable to Class A, Class B and Class C shares of the Fund. The Plans also require the payment of a monthly distribution fee to the Distributor at the maximum annual rates of 0.10%, 0.75% and 0.75% of the average daily net assets attributable to Class A, Class B and Class C shares, respectively.
Although the Fund may pay distribution and service fees up to a maximum annual rate of 0.35% of the Fund's average daily net assets attributable to Class A shares (comprised of up to 0.10% for distribution services and up to 0.25% for shareholder liaison services), the Fund currently limits such fees to an aggregate fee of not more than 0.25% of the Fund's average daily net assets attributable to Class A shares.
The Distributor has voluntarily agreed to waive a portion of the distribution fee for Class C shares so that the combined distribution and service fee does not exceed 0.65% annually of the average daily net assets attributable to Class C shares. This arrangement may be modified or terminated by the Distributor at any time.
Sales Charges
Sales charges, including front-end charges and CDSCs, received by the Distributor for distributing Fund shares were $66,766 for Class A and $2,299 for Class C shares for the period ended July 31, 2012 and $78,801 for Class A, $1,453 for Class B and $4,930 for Class C shares for the year ended August 31, 2011.
Expenses Waived/Reimbursed by the Investment Manager and its Affiliates
The Investment Manager and certain of its affiliates have contractually agreed to waive fees and/or reimburse expenses (excluding certain fees and expenses described below), through December 31, 2012, unless sooner terminated at the sole discretion of the Board, so that the Fund's net operating expenses, after giving effect to fees waived/expenses reimbursed and/or overdraft charges from the Fund's custodian, do not exceed the following annual rates as a percentage of the class' average daily net assets:
| Class A | | | 0.79 | % | |
| Class B | | | 1.54 | | |
| Class C | | | 1.54 | | |
| Class Z | | | 0.54 | | |
For the period September 27, 2010 through February 28, 2011, the Investment Manager and certain of its affiliates contractually agreed to waive fees and/or reimburse expenses (excluding certain fees and expenses described below), so that the Fund's net operating expenses, after giving effect to fees waived/expenses reimbursed and/or overdraft charges from the Fund's custodian, do not exceed the following annual rates as a percentage of the class' average daily net assets:
| Class A | | | 0.80 | % | |
| Class B | | | 1.55 | | |
| Class C | | | 1.55 | | |
| Class Z | | | 0.55 | | |
Under the agreements, the following fees and expenses are excluded from the waiver/reimbursement commitment, and therefore will be paid by the Fund, if applicable: taxes (including foreign transaction taxes), expenses associated with investments in affiliated and non-affiliated pooled investment vehicles (including mutual funds and exchange traded funds), transaction costs and brokerage commissions, costs related to any securities lending program, dividend expenses associated with securities sold short, inverse floater program fees and expenses, transaction charges and interest on borrowed money, interest, extraordinary expenses and any other expenses the exclusion of which is specifically approved by the Board. This agreement may be modified or amended only with approval from all parties. Class C distribution fees waived by the Distributor, as discussed above, are in addition to the waiver/reimbursement commitment under the agreement.
Prior to September 27, 2010, the Investment Manager voluntarily agreed to reimburse a portion of the Fund's expenses (excluding certain expenses, such as distribution and services fees, brokerage commissions, interest, taxes and extraordinary expenses, but including custodian charges relating to overdrafts, if any) so that the Fund's ordinary net operating expenses, after giving effect to fees waived/expenses reimbursed and any balance credits and/or overdraft charges from the Fund's custodian, did not exceed 0.55% of the Fund's average daily net assets on an annualized basis.
Note 4. Federal Tax Information
The timing and character of income and capital gain distributions are determined in accordance with income tax regulations, which may differ from GAAP because of temporary or permanent book to tax differences.
At July 31, 2012, these differences are primarily due to differing treatment for discount accretion/premium amortization on debt securities, capital loss carryforward, reversal of wash sales losses, Trustees' deferred compensation and current year income distributions payable. To the extent
Annual Report 2012
28
Columbia Oregon Intermediate Municipal Bond Fund
Notes to Financial Statements (continued)
July 31, 2012
these differences are permanent, reclassifications are made among the components of the Fund's net assets in the Statement of Assets and Liabilities. Temporary differences do not require reclassifications. The Fund did not have any permanent differences; therefore, no reclassifications were made to the Statement of Assets and Liabilities.
The tax character of distributions paid during the periods indicated was as follows:
| | | Period Ended
July 31,
2012 | | Year Ended
August 31,
2011 | | Year Ended
August 31,
2010 | |
| Tax-Exempt Income | | $ | 13,422,151 | | | $ | 15,996,772 | | | $ | 16,606,638 | | |
| Ordinary income | | | — | | | | — | | | | 47,094 | | |
| Long-term capital gains | | | — | | | | 784,781 | | | | — | | |
Short-term capital gain distributions, if any, are considered ordinary income distributions for tax purposes.
At July 31, 2012, the components of distributable earnings on a tax basis were as follows:
| Undistributed tax-exempt income | | $ | 1,503,576 | | |
| Undistributed accumulated long-term gain | | | — | | |
| Unrealized appreciation | | | 40,802,821 | | |
The following capital loss carryforward, determined at July 31, 2012, may be available to reduce taxable income arising from future net realized gains on investments, if any, to the extent permitted by the Internal Revenue Code:
| Year of Expiration | | Amount ($) | |
| 2019 | | | 7,376 | | |
| Unlimited short-term | | | 19,010 | | |
| Total | | | 26,386 | | |
Unlimited capital loss carryforwards are required to be utilized prior to any capital losses which carry an expiration date. As a result of this ordering rule, capital loss carryforwards which carry an expiration date may be more likely to expire unused.
At July 31, 2012, the cost of investments for federal income tax purposes was $449,617,331 and the aggregate gross unrealized appreciation and depreciation based on that cost was:
| Unrealized appreciation | | $ | 40,867,939 | | |
| Unrealized depreciation | | | (65,118 | ) | |
| Net unrealized appreciation | | $ | 40,802,821 | | |
Management of the Fund has concluded that there are no significant uncertain tax positions that would require recognition in the financial statements. However, management's conclusion may be subject to review and adjustment at a later date based on factors including, but not limited to, new tax laws, regulations, and administrative interpretations (including relevant court decisions). Generally, the Fund's federal tax returns for the prior three fiscal years remain subject to examination by the Internal Revenue Service.
Note 5. Portfolio Information
The cost of purchases and proceeds from sales of securities, excluding short-term obligations, aggregated to $74,450,474 and $38,908,456, respectively, for the period ended July 31, 2012.
Note 6. Custody Credits
Prior to May 16, 2011, the Fund had an agreement with its custodian bank under which custody fees may have been reduced by balance credits. These credits are recorded as part of expense reductions on the Statement of Operations. The Fund could have invested a portion of the assets utilized in connection with the expense offset arrangement in an income-producing asset if they had not entered into such an agreement. Subsequent to this date, the Fund may invest its daily balance in an affiliated money market fund as detailed below. For the period August 1, 2011 through May 15, 2011, these credits reduced total expenses by $1.
Note 7. Shareholder Concentration
At July 31, 2012, two unaffiliated shareholder accounts owned an aggregate of 25.0% of the outstanding shares of the Fund. The Fund has no knowledge about whether any portion of those shares was owned beneficially by such accounts. Subscription and redemption activity by concentrated accounts may have a significant effect on the operations of the Fund.
Note 8. Line of Credit
The Fund has entered into a revolving credit facility with a syndicate of banks led by JPMorgan Chase Bank N.A. (the Administrative Agent) whereby the Fund may borrow for the temporary funding of shareholder redemptions or for other temporary or emergency purposes. The credit facility became effective on May 16, 2011, replacing a prior credit facility. The credit facility agreement, as amended, which is a collective agreement between the Fund and certain other funds managed by the Investment Manager, severally and not jointly, permits collective borrowings up to $500 million. Pursuant to a December 13, 2011 amendment to the credit facility agreement, interest is charged to each participating fund based on its borrowings at a rate equal to the higher of (i) the overnight federal funds rate plus 1.00% or (ii) the one-month LIBOR rate plus 1.00%. Each borrowing under the credit facility matures no later than 60 days after the date of borrowing. The Fund also pays a commitment fee equal to its pro rata share of the amount of the credit facility at a rate of 0.08% per annum. For the period May 16, 2011 through December 13, 2011, interest was charged to each participating
Annual Report 2012
29
Columbia Oregon Intermediate Municipal Bond Fund
Notes to Financial Statements (continued)
July 31, 2012
fund based on its borrowings at a rate equal to the sum of the federal funds rate plus (i) 1.25% per annum plus (ii) if one-month LIBOR exceeds the federal funds rate, the amount of such excess. The Fund also paid a commitment fee equal to its pro rata share of the amount of the credit facility at a rate of 0.10% per annum.
For the period May 16, 2011 through June 26, 2011, the Fund and certain other funds managed by the Investment Manager participated in a $150,000,000 committed, unsecured revolving credit facility provided by State Street. For the period March 28, 2011 through May 15, 2011, the collective borrowing amount of the credit facility was $225,000,000. Prior to March 28, 2011, the collective borrowing amount of the credit facility was $280,000,000. Effective October 14, 2010, interest was charged to each fund based on its borrowings at a rate equal to the greater of the (i) federal funds rate plus 1.25% per annum or (ii) the overnight LIBOR rate plus 1.25% per annum. The Fund also paid a commitment fee equal to its pro rata share of the amount of the credit facility at a rate of 0.125% per annum. Prior to October 14, 2010, interest was charged to each participating fund at the same rates. In addition, a commitment fee of 0.15% per annum was accrued and apportioned among the participating funds pro rata based on their relative net assets.
The Fund had no borrowings during the period ended July 31, 2012 and the year ended August 31, 2011.
Note 9. Significant Risks
Geographic Concentration Risk
Because state-specific tax-exempt funds invest primarily in the municipal securities issued by the state and political sub-divisions of the state, the Fund will be particularly affected by political and economic conditions and developments in the state in which it invests. The Fund may, therefore, have a greater risk than that of a municipal bond fund which is more geographically diversified. The value of the municipal securities owned by the Fund also may be adversely affected by future changes in federal or state income tax laws.
Note 10. Subsequent Events
Management has evaluated the events and transactions that have occurred through the date the financial statements were issued and noted no items requiring adjustment of the financial statements or additional disclosure.
Note 11. Information Regarding Pending and Settled Legal Proceedings
In December 2005, without admitting or denying the allegations, American Express Financial Corporation (AEFC, which is now known as Ameriprise Financial, Inc. (Ameriprise Financial)) entered into settlement agreements with the Securities and Exchange Commission (SEC) and Minnesota Department of Commerce (MDOC) related to market timing activities. As a result, AEFC was censured and ordered to cease and desist from committing or causing any violations of certain provisions of the Investment Advisers Act of 1940, the Investment Company Act of 1940, and various Minnesota laws. AEFC agreed to pay disgorgement of $10 million and civil money penalties of $7 million. AEFC also agreed to retain an independent distribution consultant to assist in developing a plan for distribution of all disgorgement and civil penalties ordered by the SEC in accordance with various undertakings detailed at www.sec.gov/litigation/admin/ia-2451.pdf. Ameriprise Financial and its affiliates have cooperated with the SEC and the MDOC in these legal proceedings, and have made regular reports to the funds' Boards of Trustees.
Ameriprise Financial and certain of its affiliates have historically been involved in a number of legal, arbitration and regulatory proceedings, including routine litigation, class actions, and governmental actions, concerning matters arising in connection with the conduct of their business activities. Ameriprise Financial believes that the Funds are not currently the subject of, and that neither Ameriprise Financial nor any of its affiliates are the subject of, any pending legal, arbitration or regulatory proceedings that are likely to have a material adverse effect on the Funds or the ability of Ameriprise Financial or its affiliates to perform under their contracts with the Funds. Ameriprise Financial is required to make 10-Q, 10-K and, as necessary, 8-K filings with the Securities and Exchange Commission on legal and regulatory matters that relate to Ameriprise Financial and its affiliates. Copies of these filings may be obtained by accessing the SEC website at www.sec.gov.
There can be no assurance that these matters, or the adverse publicity associated with them, will not result in increased fund redemptions, reduced sale of fund shares or other adverse consequences to the Funds. Further, although we believe proceedings are not likely to have a material adverse effect on the Funds or the ability of Ameriprise Financial or its affiliates to perform under their contracts with the Funds, these proceedings are subject to uncertainties and, as such, we are unable to estimate the possible loss or range of loss that may result. An adverse outcome in one or more of these proceedings could result in adverse judgments, settlements, fines, penalties or other relief that could have a material adverse effect on the consolidated financial condition or results of operations of Ameriprise Financial.
Annual Report 2012
30
Columbia Oregon Intermediate Municipal Bond Fund
Report of Independent Registered Public Accounting Firm
To the Trustees of Columbia Funds Series Trust I and
the Shareholders of Columbia Oregon Intermediate Municipal Bond Fund
In our opinion, the accompanying statement of assets and liabilities, including the portfolio of investments, and the related statements of operations and of changes in net assets and the financial highlights present fairly, in all material respects, the financial position of Columbia Oregon Intermediate Municipal Bond Fund (the "Fund") (a series of Columbia Funds Series Trust I) at July 31, 2012, the results of its operations, the changes in its net assets and the financial highlights for each of the periods indicated, in conformity with accounting principles generally accepted in the United States of America. These financial statements and financial highlights (hereafter referred to as "financial statements") are the responsibility of the Fund's management. Our responsibility is to express an opinion on these financial statements based on our audits. We conducted our audits of these financial statements in accordance with the standards of the Public Company Accounting Oversight Board (United States). Those standards require that we plan and perform the audit to obtain reasonable assurance about whether the financial statements are free of material misstatement. An audit includes examining, on a test basis, evidence supporting the amounts and disclosures in the financial statements, assessing the accounting principles used and significant estimates made by management, and evaluating the overall financial statement presentation. We believe that our audits, which included confirmation of securities at July 31, 2012 by correspondence with the custodian and brokers, provide a reasonable basis for our opinion.
PricewaterhouseCoopers LLP
Minneapolis, Minnesota
September 21, 2012
Annual Report 2012
31
Columbia Oregon Intermediate Municipal Bond Fund
Federal Income Tax Information
(Unaudited)
100% of the distributions from net investment income will be treated as exempt income for federal income tax purposes.
The Fund will notify shareholders in January 2013 of amounts for use in preparing 2012 income tax returns.
Annual Report 2012
32
Columbia Oregon Intermediate Municipal Bond Fund
Trustees and Officers
The Trustees serve terms of indefinite duration. The names, addresses and birth years of the Trustees and Officers of the Funds in Columbia Funds Series Trust I, the year each was first elected or appointed to office, their principal business occupations during at least the last five years, the number of Funds overseen by each Trustee and other directorships they hold are shown below. Each officer listed below serves as an officer of each Fund in Columbia Funds Series Trust I.
Independent Trustees
Name, Address and Year of Birth,
Position with Funds, Year First
Elected or Appointed to Office | | Principal Occupation(s) During Past Five Years, Number of Funds in Columbia
Funds Complex Overseen by Trustee, Other Directorships Held
| |
Rodman L. Drake (Born 1943)
c/o Columbia Management Investment Advisers, LLC
225 Franklin Street
Boston, MA 02110
Trustee (since 1994) and
Chairman of the Board (since 2009) | | Independent consultant since 2010; Co-Founder of Baringo Capital LLC (private equity) from 1997 to 2008; CEO of Crystal River Capital, Inc. (real estate investment trust) from 2003 to 2010; Oversees 52; Jackson Hewitt Tax Service Inc. (tax preparation services from 2004 to 2011); Celgene Corporation (global biotechnology company); Student Loan Corporation (student loan provider from 2005 to 2010); Celgene Corporation (global biotechnology company); The Helios Funds and Brookfield Funds (closed-end funds); Crystal River Capital, Inc. from 2005 to 2010; Parsons Brinckerhoff from 1995 to 2008; and Apex Silver Mines Ltd. from 2007 to 2009 | |
|
Douglas A. Hacker (Born 1955)
c/o Columbia Management Investment Advisers, LLC
225 Franklin Street
Boston, MA 02110
Trustee (since 1996) | | Independent business executive since May 2006; Executive Vice President — Strategy of United Airlines from December 2002 to May 2006; President of UAL Loyalty Services (airline marketing company) from September 2001 to December 2002; Executive Vice President and Chief Financial Officer of United Airlines from July 1999 to September 2001. Oversees 52; Nash Finch Company (food distributor); Aircastle Limited (aircraft leasing); and SeaCube Container Leasing Ltd. (container leasing) | |
|
Janet Langford Kelly (Born 1957)
c/o Columbia Management Investment Advisers, LLC
225 Franklin Street
Boston, MA 02110
Trustee (since 1996) | | Senior Vice President, General Counsel and Corporate Secretary, ConocoPhillips (integrated energy company) since September 2007; Deputy General Counsel — Corporate Legal Services, ConocoPhillips from August 2006 to August 2007; Partner, Zelle, Hofmann, Voelbel, Mason & Gette LLP (law firm) from March 2005 to July 2006; Adjunct Professor of Law, Northwestern University from September 2004 to June 2006; Director, UAL Corporation (airline) from February 2006 to July 2006; Chief Administrative Officer and Senior Vice President, Kmart Holding Corporation (consumer goods) from September 2003 to March 2004. Oversees 52; None | |
|
Nancy T. Lukitsh (Born 1956)
c/o Columbia Management Investment Advisers, LLC
225 Franklin Street
Boston, MA 02110
Trustee (since 2011) | | Senior Vice President, Partner and Director of Marketing, Wellington Management Company, LLP (investment adviser) from 1997 to 2010; Chair, Wellington Management Investment Portfolios (commingled non-U.S. investment pools) from 2007 to 2010; Director, Wellington Trust Company, NA and other Wellington affiliates from 1997 to 2010. Oversees 52; None | |
|
William E. Mayer (Born 1940)
c/o Columbia Management Investment Advisers, LLC
225 Franklin Street
Boston, MA 02110
Trustee (since 1994) | | Partner, Park Avenue Equity Partners (private equity) since February 1999; Dean and Professor, College of Business and Management, University of Maryland from 1992 to 1996. Oversees 52; DynaVox Inc. (speech creation); Lee Enterprises (print media); WR Hambrecht + Co. (financial service provider) from 2000 to 2012; BlackRock Kelso Capital Corporation (investment company) | |
|
David M. Moffett (Born 1952)
c/o Columbia Management Investment Advisers, LLC
225 Franklin Street
Boston, MA 02110
Trustee (since 2011) | | Retired. Chief Executive Officer, Federal Home Loan Mortgage Corporation, from 2008 to 2009; Senior Adviser, Global Financial Services Group, Carlyle Group, Inc., from 2007 to 2008; Vice Chairman and Chief Financial Officer, U.S. Bancorp, from 1993 to 2007. Oversees 52; CIT Group Inc. (commercial and consumer finance); eBay Inc. (online trading community); MBIA Inc. (financial service provider); E.W. Scripps Co. (print and television media), Building Materials Holding Corp. (building materials and construction services); and University of Oklahoma Foundation. | |
|
Charles R. Nelson (Born 1942)
c/o Columbia Management Investment Advisers, LLC
225 Franklin Street
Boston, MA 02110
Trustee (since 1981) | | Retired Professor Emeritus, University of Washington, since 2011; Professor of Economics, University of Washington from January 1976 to 2011; Ford and Louisa Van Voorhis Professor of Political Economy, University of Washington from 1993 to 2011; Adjunct Professor of Statistics, University of Washington from 1980 to 2011; Associate Editor, Journal of Money Credit and Banking from 1993 to 2008; consultant on econometric and statistical matters. Oversees 52; None | |
|
John J. Neuhauser (Born 1943)
c/o Columbia Management Investment Advisers, LLC
225 Franklin Street
Boston, MA 02110
Trustee (since 1984) | | President, Saint Michael's College, since August 2007; Director or Trustee of several non-profit organizations, including Fletcher Allen Health Care, Inc.; University Professor, Boston College from November 2005 to August 2007; Academic Vice President and Dean of Faculties, Boston College from August 1999 to October 2005. Oversees 52; Liberty All-Star Equity Fund and Liberty All-Star Growth Fund (closed-end funds) | |
|
Annual Report 2012
33
Columbia Oregon Intermediate Municipal Bond Fund
Trustees and Officers (continued)
Independent Trustees (continued)
Name, Address and Year of Birth,
Position with Funds, Year First
Elected or Appointed to Office | | Principal Occupation(s) During Past Five Years, Number of Funds in Columbia
Funds Complex Overseen by Trustee, Other Directorships Held
| |
Patrick J. Simpson (Born 1944)
c/o Columbia Management Investment Advisers, LLC
225 Franklin Street
Boston, MA 02110
Trustee (since 2000) | | Partner, Perkins Coie LLP (law firm). Oversees 52; None | |
|
Anne-Lee Verville (Born 1945)
c/o Columbia Management Investment Advisers, LLC
225 Franklin Street
Boston, MA 02110
Trustee (since 1998) | | Retired. General Manager — Global Education Industry from 1994 to 1997, President — Application Systems Division from 1991 to 1994, Chief Financial Officer — US Marketing & Services from 1988 to 1991, and Chief Information Officer from 1987 to 1988, IBM Corporation (computer and technology). Oversees 52; Enesco Group, Inc. (producer of giftware and home and garden decor products) from 2001 to 2006 | |
|
The Statement of Additional Information includes additional information about the Trustees of the Funds and is available, without charge, upon request by calling 1-800-345-6611.
Interested Trustee
Name, Address and Year of Birth,
Position with Funds, Year First
Elected or Appointed to Office | | Principal Occupation(s) During Past Five Years, Number of Funds in Columbia
Funds Complex Overseen by Trustee, Other Directorships Held
| |
William F. Truscott (born 1960)
53600 Ameriprise Financial Center
Minneapolis, MN 55474
Senior Vice President (since 2012) | | Chairman of the Board and President, Columbia Management Investment Advisers, LLC since May 2010 and February 2012, respectively (previously President, Chairman of the Board and Chief Investment Officer, from 2001 to April 2010); Chief Executive Officer, U.S. Asset Management & President, Annuities, Ameriprise Financial, Inc. since May 2010 (previously President — U.S. Asset Management and Chief Investment Officer from 2005 to April 2010, and Senior Vice President — Chief Investment Officer, from 2001 to 2005); Director, President and Chief Executive Officer, Ameriprise Certificate Company since 2006; Director and Chief Executive Officer, Columbia Management Investment Distributors, Inc. since May 2010 and February 2012, respectively (previously Chairman of the Board and Chief Executive Officer from 2008 to April 2010); Chairman of the Board and Chief Executive Officer, RiverSource Distributors, Inc. since 2006. Oversees 208; Columbia Funds Board. | |
|
Officers
| Name, Year of Birth and Address | | Principal Occupation(s) During the Past Five Years | |
J. Kevin Connaughton (Born 1964)
225 Franklin Street
Boston, MA 02110
President (since 2009) | | Senior Vice President and General Manager — Mutual Fund Products, Columbia Management Investment Advisers, LLC since May 2010; President, Columbia Funds, since 2009, and RiverSource Funds, since May 2010 (previously Senior Vice President and Chief Financial Officer, Columbia Funds, from June 2008 to January 2009, Treasurer, Columbia Funds, from October 2003 to May 2008, and senior officer of various other affiliated funds since 2000); Managing Director, Columbia Management Advisors, LLC from December 2004 to April 2010. | |
|
Michael G. Clarke (Born 1969)
225 Franklin Street
Boston, MA 02110
Treasurer (since 2011) and Chief Financial Officer (since 2009) | | Vice President, Columbia Management Investment Advisers, LLC since May 2010; Managing Director of Fund Administration, Columbia Management Advisors, LLC, from September 2004 to April 2010; senior officer of Columbia Funds and affiliated funds since 2002. | |
|
Scott R. Plummer (Born 1959)
5228 Ameriprise Financial Center
Minneapolis, MN 55474
Senior Vice President, Assistant Secretary and Chief Legal Officer (since 2010) | | Senior Vice President, Chief Legal Officer and Assistant Secretary, Columbia Management Investment Advisers, LLC since June 2005; Vice President and Lead Chief Counsel — Asset Management, Ameriprise Financial, Inc. since May 2010 (previously Vice President and Chief Counsel — Asset Management, from 2005 to April 2010); Vice President, Chief Counsel and Assistant Secretary, Columbia Management Investment Distributors, Inc. since 2008; Vice President, General Counsel and Secretary, Ameriprise Certificate Company since 2005; Chief Counsel, RiverSource Distributors, Inc. since 2006; Vice President, General Counsel and Secretary, RiverSource Funds since December 2006; Senior Vice President, Secretary and Chief Legal Officer, Columbia Funds, since May 2010. | |
|
Annual Report 2012
34
Columbia Oregon Intermediate Municipal Bond Fund
Trustees and Officers (continued)
Officers (continued)
| Name, Year of Birth and Address | | Principal Occupation(s) During the Past Five Years | |
William F. Truscott (Born 1960)
53600 Ameriprise Financial Center
Minneapolis, MN 55474
Senior Vice President (since 2010) | | Chairman of the Board and President, Columbia Management Investment Advisers, LLC since May 2010 and February 2012, respectively (previously President, Chairman of the Board and Chief Investment Officer, from 2001 to April 2010); Chief Executive Officer, U.S. Asset Management & President, Annuities, Ameriprise Financial, Inc. since May 2010 (previously President — U.S. Asset Management and Chief Investment Officer from 2005 to April 2010); Director, President and Chief Executive Officer, Ameriprise Certificate Company since 2006; Director and Chief Executive Officer, Columbia Management Investment Distributors, Inc. since May 2010 and February 2012, respectively (previously Chairman of the Board and Chief Executive Officer from 2008 to April 2010); Chairman of the Board and Chief Executive Officer, RiverSource Distributors, Inc. since 2006. | |
|
Thomas P. McGuire (Born 1972)
225 Franklin Street
Boston, MA 02110
Chief Compliance Officer (since 2012) | | Vice President — Asset Management Compliance, Columbia Management Investment Advisers, LLC since 2010; Chief Compliance Officer, Ameriprise Certificate Company, since September 2010; Compliance Executive, Bank of America, 2005-2010. | |
|
Colin Moore (Born 1958)
225 Franklin Street
Boston, MA 02110
Senior Vice President (since 2010) | | Director and Chief Investment Officer, Columbia Management Investment Advisers, LLC since May 2010; Manager, Managing Director and Chief Investment Officer of Columbia Management Advisors, LLC from 2007 to April 2010; Head of Equities, Columbia Management Advisors, LLC from 2002 to 2007. | |
|
Amy Johnson (Born 1965)
5228 Ameriprise Financial Center
Minneapolis, MN 55474
Vice President (since 2010) | | Senior Vice President and Chief Operating Officer, Columbia Management Investment Advisers, LLC since May 2010 (previously Chief Administrative Officer, from 2009 until April 2010, Vice President — Asset Management and Trust Company Services, from 2006 to 2009, and Vice President — Operations and Compliance from 2004 to 2006). | |
|
Joseph F. DiMaria (Born 1968)
225 Franklin Street
Boston, MA 02110
Vice President (since 2011) and Chief Accounting Officer (since 2008) | | Vice President, Mutual Fund Administration, Columbia Management Investment Advisers, LLC, since May 2010; Director of Fund Administration, Columbia Management Advisors, LLC from January 2006 to April 2010; Head of Tax/Compliance and Assistant Treasurer, Columbia Management Advisors, LLC, from November 2004 to December 2005. | |
|
Stephen T. Welsh (born 1957)
225 Franklin Street
Boston, MA 02110
Vice President (since 2006) | | President and Director, Columbia Management Investment Services Corp. since May 2010; President and Director, Columbia Management Services, Inc. from July 2004 to April 2010; Managing Director, Columbia Management Distributors, Inc. from August 2007 to April 2010. | |
|
Paul D. Pearson (born 1956)
10468 Ameriprise Financial Center
Minneapolis, MN 55474
Vice President and Assistant Treasurer (since 2011) | | Vice President, Investment Accounting, Columbia Management Investment Advisers, LLC, since May 2010; Vice President, Managed Assets, Investment Accounting, Ameriprise Financial Corporation. | |
|
Paul B. Goucher (born 1968)
5228 Ameriprise Financial Center
Minneapolis, MN 55474
Vice President and Assistant Secretary (since 2010) | | Vice President and Chief Counsel of Ameriprise Financial since January 2010 (formerly Vice President and Group Counsel from November 2008 to January 2010); Director, Managing Director and General Counsel of J. & W. Seligman & Co. Incorporated (Seligman) from July 2008 to November 2008 and Managing Director and Associate General Counsel of Seligman from January 2005 to July 2008. | |
|
Christopher O. Petersen (born 1970)
5228 Ameriprise Financial Center
Minneapolis, MN 55474
Vice President (since 2010) and Secretary (since 2011) | | Vice President and Chief Counsel, Ameriprise Financial since January 2010 (formerly Vice President and Group Counsel or Counsel from April 2004 to January 2010); Assistant Secretary of RiverSource Funds since January 2007; officer of Columbia Funds and affiliated funds since 2007. | |
|
Michael E. DeFao (born 1968)
225 Franklin Street
Boston, MA 02110
Vice President and Assistant Secretary (since 2011) | | Vice President and Chief Counsel, Ameriprise Financial since May 2010; Associate General Counsel, Bank of America from June 2005 to April 2010. | |
|
Annual Report 2012
35
Columbia Oregon Intermediate Municipal Bond Fund
Board Consideration and Approval of
Advisory Agreement
At meetings held on March 7, 2012 and June 6, 2012, respectively, the Board of Trustees (the "Board") and the Trustees who are not interested persons (as defined in the Investment Company Act of 1940) of the Trust (the "Independent Trustees") unanimously approved the continuation of the Investment Management Services Agreement (the "Advisory Agreement") with Columbia Management Investment Advisers, LLC (the "Investment Manager") with respect to Columbia Oregon Intermediate Municipal Bond Fund (the "Fund"), a series of the Trust. As detailed below, the Advisory Fees and Expenses Committee (the "Committee") and the Board met on multiple occasions to review and discuss, both among themselves and with the management team of the Investment Manager, materials provided by the Investment Manager before determining to approve each continuation of the Advisory Agreement.
In connection with their deliberations regarding each continuation of the Advisory Agreement, the Committee and the Board requested and evaluated materials from the Investment Manager regarding the Fund and the Advisory Agreement, and discussed these materials with representatives of the Investment Manager at Committee meetings held on March 6, 2012, April 25, 2012 and June 5, 2012, and at the Board meetings held on March 7, 2012 and June 6, 2012. In addition, the Board considers matters bearing on the Advisory Agreement at most of its other meetings throughout the year and meets regularly with senior management of the Funds and the Investment Manager. Through the Board's Investment Oversight Committees, Trustees also meet with selected Fund portfolio managers and other investment personnel at various times throughout the year. The Committee and the Board also consulted with Fund counsel and with the Independent Trustees' independent legal counsel, who advised on the legal standard for consideration by the Board and otherwise assisted the Board in its deliberations.
On March 6, 2012, the Committee recommended that the Board approve the continuation of the Advisory Agreement. On March 7, 2012, the Board, including the Independent Trustees, voting separately, unanimously approved the continuation of the Advisory Agreement for the Fund. The Committee and the Board met in June 2012 to consider the continuation of the Advisory Agreement for the one-year period ending June 30, 2013, so as to permit the annual consideration of the Advisory Agreement to be conducted each June. On June 5, 2012, the Committee recommended that the Board approve the continuation of the Advisory Agreement. On June 6, 2012, the Board, including the Independent Trustees, voting separately, unanimously approved the continuation of the Advisory Agreement.
The Committee and the Board considered all information that they, their legal counsel, or the Investment Manager believed reasonably necessary to evaluate and to determine whether to approve the continuation of the Advisory Agreement. In their deliberations, the Trustees did not identify any particular information that was all-important or controlling, and individual Trustees may have attributed different weights to the various factors. The information and factors considered by the Committee and the Board in recommending for approval or approving the continuation of the Advisory Agreement for the Fund included the following:
• Information on the investment performance of the Fund relative to the performance of the Fund's benchmarks and the performance of a group of comparable mutual funds, as determined by an independent third-party data provider;
• Information on the Fund's advisory fees and total expenses, including information comparing the Fund's expenses to those of a group of comparable mutual funds, as determined by an independent third-party data provider;
• The Investment Manager's agreement to contractually limit or cap total operating expenses for the Fund so that total operating expenses (excluding certain fees and expenses, such as transaction costs and certain other investment related expenses, interest, taxes, acquired fund fees and expenses, and extraordinary expenses) would not exceed the median expenses of a group of comparable funds (as determined from time to time, generally annually, by an independent third-party data provider);
• The terms and conditions of the Advisory Agreement, including that the advisory fee rates payable by the Fund would not change;
• The terms and conditions of other agreements and arrangements with affiliates of the Investment Manager relating to the operations of the Fund, including the Administrative Services Agreement, the Distribution Agreement and the Transfer and Dividend Disbursing Agent Agreement, noting in the case of the Transfer and Dividend Disbursing Agent Agreement certain proposed changes to the fee rates payable thereunder;
• Descriptions of various functions performed by the Investment Manager under the Advisory Agreement, including portfolio management and portfolio trading practices;
Annual Report 2012
36
Columbia Oregon Intermediate Municipal Bond Fund
Board Consideration and Approval of
Advisory Agreement (continued)
• Information regarding the management fees and investment performance of any comparable portfolios of other clients of the Investment Manager, including institutional separate accounts; and
• The profitability to the Investment Manager and its affiliates from their relationships with the Fund.
Nature, Extent and Quality of Services to be Provided under the Advisory Agreement
The Committee and the Board considered the nature, extent and quality of services provided to the Fund by the Investment Manager and its affiliates under the Advisory Agreement and under separate agreements for the provision of transfer agency and administrative services, and the resources dedicated to the Fund and the other Columbia Funds by the Investment Manager and its affiliates. The Committee and the Board considered, among other things, the Investment Manager's ability to attract, motivate and retain highly qualified research, advisory and supervisory investment professionals (including personnel and other resources, compensation programs for personnel involved in fund management, reputation and other attributes), the portfolio management services provided by those investment professionals, the quality of the Investment Manager's investment research capabilities and trade execution services, and the other resources that the Investment Manager devotes to the Fund. The Committee and the Board also considered the potential benefits to shareholders of investing in a mutual fund that is part of a fund complex offering exposure to a variety of asset classes and investment disciplines and providing a variety of fund and shareholder services.
The Committee and the Board also considered the professional experience and qualifications of the senior personnel of the Investment Manager. The Committee and the Board noted the compliance programs of and the compliance-related resources provided to the Fund by the Investment Manager and its affiliates, and considered the Investment Manager's ability to provide administrative services to the Fund pursuant to a separate administrative services agreement, including the Investment Manager's ability to coordinate the activities of the Fund's other service providers. After reviewing these and related factors, the Committee and the Board concluded, within the context of their overall conclusions, that the expected nature, extent and quality of the services to be provided to the Fund under the Advisory Agreement supported the continuation of such agreement.
Investment Performance
The Committee and the Board reviewed information about the performance of the Fund over various time periods, including performance information relative to benchmarks and information based on reports of an independent third-party data provider that compared the performance of the Fund to the performance of a group of comparable mutual funds. The Committee and the Board also reviewed a description of the third party's methodology for identifying the Fund's peer groups for purposes of performance and expense comparisons. In the case of each Fund whose performance lagged that of a relevant peer group for certain (although not necessarily all) periods, the Committee and the Board concluded that other factors relevant to performance were sufficient, in light of other considerations, to warrant continuation of the Fund's Advisory Agreement. Those factors varied from fund to fund, but included one or more of the following: (i) that the Fund's performance, although lagging in certain recent periods, was stronger over the longer term; (ii) that the underperformance was attributable, to a significant extent, to investment decisions that were reasonable and consistent with the Fund's investment strategy and policies and that the Fund was performing within a reasonable range of expectations, given those investment decisions, market conditions and the Fund's investment strategy; (iii) that the Fund's performance was competitive when compared to other relevant performance benchmarks or peer groups; and (iv) that the Investment Manager had taken or was taking steps designed to help improve the Fund's investment performance, including, but not limited to, replacing portfolio managers, enhancing the resources supporting the portfolio managers, or modifying investment strategies.
The Committee and the Board noted that, through December 31, 2011, the Fund's performance was in the eighteenth, fifty-eighth and sixty-seventh percentiles (where the best performance would be in the first percentile) of its category selected by an independent third-party data provider for the purposes of performance comparisons for the one-, three- and five- year periods, respectively.
The Committee and the Board also considered the Investment Manager's performance and reputation generally, the Investment Manager's historical responsiveness to Board concerns about performance and the Investment Manager's willingness to take steps intended to improve performance. After reviewing these and related factors, the Committee and the Board concluded, within the context of their overall conclusions regarding the Advisory Agreement, that the performance of
Annual Report 2012
37
Columbia Oregon Intermediate Municipal Bond Fund
Board Consideration and Approval of
Advisory Agreement (continued)
the Fund and the Investment Manager was sufficient, in light of other considerations, to warrant the continuation of the Advisory Agreement.
Investment Advisory Fee Rates and Other Expenses
The Committee and the Board considered the advisory fees to be charged to the Fund under the Advisory Agreement as well as the total expenses to be incurred by the Fund. In assessing the reasonableness of the fees under the Advisory Agreement, the Committee and the Board considered, among other information, the Fund's advisory fee and its expected total expense ratio as a percentage of average daily net assets. The Committee and the Board noted that the Fund's actual management fee and total net expense ratio are ranked in the third and first quintiles, respectively, against the Fund's expense universe as determined by an independent third-party data provider for purposes of expense comparison. The Committee and the Board also took into account the fee waiver and expense limitation arrangements agreed to by the Investment Manager, as noted above.
The Committee and the Board also considered the fact that the advisory fee rates payable by the Fund to the Investment Manager under the Advisory Agreement were the same as those currently paid by the Fund to the Investment Manager.
The Committee and the Board also received and considered information about the advisory fees charged by the Investment Manager to institutional separate accounts. In considering the fees charged to those accounts, the Committee and the Board took into account, among other things, the Investment Manager's representations about the differences between managing mutual funds as compared to other types of accounts, including differences in the services provided, differences in the risk profile of such business for the Investment Manager and the additional resources required to manage mutual funds effectively. In evaluating the Fund's advisory fees, the Committee and the Board also took into account the demands, complexity and quality of the investment management of the Fund.
After reviewing these and related factors, the Committee and the Board concluded, within the context of their overall conclusions, that the advisory fee rates and expenses of the Fund supported the continuation of the Advisory Agreement.
Costs of Services to be Provided and Profitability
The Committee and the Board also took note of the costs of the services provided (both on an absolute and relative basis) and the profitability to the Investment Manager and its affiliates in connection with their relationships with the Fund. In evaluating these considerations, the Committee and the Board took note of the advisory fees charged by the Investment Manager to other clients, including fees charged by the Investment Manager to any institutional separate account clients with similar investment strategies to those of the Fund.
The Committee and the Board also considered the compensation directly or indirectly received by the Investment Manager's affiliates in connection with their relationships with the Fund. The Committee and the Board reviewed information provided by management as to the profitability of the Investment Manager and its affiliates of their relationships with the Fund, and information about the allocation of expenses used to calculate profitability. When reviewing profitability, the Committee and the Board also considered court cases in which adviser profitability was an issue in whole or in part, the performance of the fund, the expense ratio of the fund, and the implementation of expense limitations with respect to the fund. The Committee and the Board also considered information provided by the Investment Manager regarding its financial condition and comparing its profitability to that of other asset management firms that are, or are subsidiaries of, publicly traded companies.
After reviewing these and related factors, the Committee and the Board concluded, within the context of their overall conclusions, that the profitability to the Investment Manager and its affiliates from their relationships with the Fund supported the continuation of the Advisory Agreement.
Economies of Scale
The Committee and the Board considered the potential existence of economies of scale in the provision by the Investment Manager of services to the Fund, to groups of related funds, and to the Investment Manager's investment advisory clients as a whole, and whether those economies of scale were shared with the Fund through breakpoints in investment advisory fees or other means, such as expense limitation arrangements and additional investments by the Investment Manager in
Annual Report 2012
38
Columbia Oregon Intermediate Municipal Bond Fund
Board Consideration and Approval of
Advisory Agreement (continued)
investment, trading and compliance resources. The Committee and the Board noted that the investment advisory fee schedules for the Fund contained breakpoints that would reduce the fee rate on assets above specified threshold levels.
In considering these issues, the Committee and the Board also considered the costs of the services provided (both on an absolute and relative basis) and the profitability to the Investment Manager and its affiliates from their relationships with the Fund, as discussed above. After reviewing these and related factors, the Committee and the Board concluded, within the context of their overall conclusions, that the extent to which economies of scale were expected to be shared with the Fund supported the continuation of the Advisory Agreement.
Other Benefits to the Investment Manager
The Committee and the Board received and considered information regarding "fall-out" or ancillary benefits received by the Investment Manager and its affiliates as a result of their relationships with the Fund, such as the engagement of the Investment Manager to provide administrative services to the Fund and the engagement of the Investment Manager's affiliates to provide distribution and transfer agency services to the Fund. The Committee and the Board considered that the Fund's distributor retains a portion of the distribution fees from the Fund and receives a portion of the sales charges on sales or redemptions of certain classes of shares of the Fund. The Committee and the Board also considered the benefits of research made available to the Investment Manager by reason of brokerage commissions generated by the Fund's securities transactions, and reviewed information about the Investment Manager's practices with respect to allocating portfolio brokerage for brokerage and research services. The Committee and the Board considered the possible conflicts of interest associated with certain fall-out or other ancillary benefits and the reporting, disclosure and other processes that would be in place to address such possible conflicts of interest. The Committee and the Board recognized that the Investment Manager's profitability would be somewhat lower without these benefits.
Conclusion
The Committee and the Board reviewed all of the above considerations in reaching their decisions to recommend or approve the continuation of the Advisory Agreement. No single item was identified as paramount or controlling, and individual Trustees may have attributed different weights to various factors. Based on their evaluation of all factors that they deemed to be material, including those factors described above, and assisted by the advice of independent legal counsel, the Board, including the Independent Trustees, voting separately, unanimously approved the continuation of the Advisory Agreement.
Annual Report 2012
39
This page intentionally left blank.
Annual Report 2012
40
Columbia Oregon Intermediate Municipal Bond Fund
Important Information About This Report
Each fund mails one shareholder report to each shareholder address. If you would like more than one report, please call shareholder services at 800.345.6611 and additional reports will be sent to you.
The policy of the Board is to vote the proxies of the companies in which each fund holds investments consistent with the procedures as stated in the Statement of Additional Information (SAI). You may obtain a copy of the SAI without charge by calling 800.345.6611; contacting your financial intermediary; visiting columbiamanagement.com; or searching the website of the Securities and Exchange Commission (SEC) at sec.gov. Information regarding how each fund voted proxies relating to portfolio securities is filed with the SEC by August 31 for the most recent 12-month period ending June 30 of that year, and is available without charge by visiting columbiamanagement.com; or searching the website of the SEC at sec.gov.
Each fund files a complete schedule of portfolio holdings with the SEC for the first and third quarters of each fiscal year on Form N-Q. Each fund's Form N-Q is available on the SEC's website at sec.gov and may be reviewed and copied at the SEC's Public Reference Room in Washington, D.C. Information on the operation of the Public Reference Room may be obtained by calling 800.SEC.0330. Each fund's complete schedule of portfolio holdings, as filed on Form N-Q, can also be obtained without charge, upon request, by calling 800.345.6611.
Annual Report 2012
41

Columbia Oregon Intermediate Municipal Bond Fund
P.O. Box 8081
Boston, MA 02266-8081
columbiamanagement.com
This information is for use with concurrent or prior delivery of a fund prospectus. Please read and consider the investment objectives, risks, charges and expenses for any fund carefully before investing. For a prospectus which contains this and other important information about the Fund go to columbiamanagement.com. The Fund is distributed by Columbia Management Investment Distributors, Inc., member FINRA, and managed by Columbia Management Investment Advisers, LLC.
© 2012 Columbia Management Investment Advisers, LLC. All rights reserved.
C-1636 D (9/12)
Annual Report
July 31, 2012

Columbia Tax-Exempt Fund
Not FDIC insured • No bank guarantee • May lose value
Columbia Tax-Exempt Fund
President's Message
 Dear Shareholders,
On the heels of solid gains for stocks during the first quarter, U.S. stock market averages fell in the second quarter as uncertainty mounted regarding the fate of the eurozone and other real concerns. On the last day of the quarter, an announcement that European leaders had agreed to relieve short-term funding pressure on Italy and Spain and to back a plan heading toward a banking union raised hopes that a longer term solution was achievable. The announcement lifted stocks around the world. However, it was a losing quarter for most stock markets as economic data disappointed in the United States and growth in Europe and emerging markets slowed. China, which has been a key driver of worldwide growth over the past decade, has experienced a significant slowdown, and its declining demand for raw materials has had a chilling effect on world commodity markets.
Against a backdrop of rising uncertainty and a declining stock market, bond investors turned cautious. U.S. Treasuries were the quarter's strongest performers. Total returns on long-dated Treasuries surged late last year, sank from mid-December to mid-March then soared through the end of the quarter. By contrast, European sovereign bonds lost value as interest rates rose and concerns about the eurozone's fiscal health mounted.
Despite these continued challenges, we see pockets of strength — and as a result, attractive opportunities — both here and abroad for 2012. We hope to help you capitalize on these opportunities with various articles in our 2012 Perspectives, which is available via the Market Insights tab at columbiamanagement.com. This publication showcases the strong research capabilities and experienced investment teams of Columbia Management and offers a diverse array of investment ideas based on our five key themes for 2012.
Other information and resources available at columbiamanagement.com include:
> detailed up-to-date fund performance and portfolio information
> economic analysis and market commentary
> quarterly fund commentaries
> Columbia Management Investor, our award-winning quarterly newsletter for shareholders
Thank you for your continued support of the Columbia Funds. We look forward to serving your investment needs for many years to come.
Best Regards,

J. Kevin Connaughton
President, Columbia Funds
Investors should consider the investment objectives, risks, charges and expenses of a mutual fund carefully before investing. For a free prospectus, which contains this and other important information about the funds, visit columbiamanagement.com. The prospectus should be read carefully before investing.
Columbia Funds are distributed by Columbia Management Investment Distributors, Inc., member FINRA, and managed by Columbia Management Investment Advisers, LLC.
© 2012 Columbia Management Investment Advisers, LLC. All rights reserved.
Annual Report 2012
Columbia Tax-Exempt Fund
Table of Contents
| Performance Overview | | | 2 | | |
|
| Manager Discussion of Fund Performance | | | 4 | | |
|
| Understanding Your Fund's Expenses | | | 6 | | |
|
| Portfolio of Investments | | | 7 | | |
|
| Statement of Assets and Liabilities | | | 43 | | |
|
| Statement of Operations | | | 45 | | |
|
| Statement of Changes in Net Assets | | | 46 | | |
|
| Financial Highlights | | | 48 | | |
|
| Notes to Financial Statements | | | 52 | | |
|
Report of Independent Registered
Public Accounting Firm | | | 61 | | |
|
| Federal Income Tax Information | | | 62 | | |
|
| Trustees and Officers | | | 63 | | |
|
| Board Consideration and Approval of Advisory Agreement | | | 66 | | |
|
| Important Information About This Report | | | 73 | | |
|
Fund Investment Manager
Columbia Management Investment
Advisers, LLC
225 Franklin Street
Boston, MA 02110
Fund Distributor
Columbia Management Investment
Distributors, Inc.
225 Franklin Street
Boston, MA 02110
Fund Transfer Agent
Columbia Management Investment
Services Corp.
P.O. Box 8081
Boston, MA 02266-8081
For more information about any of the funds, please visit columbiamanagement.com or call 800.345.6611. Customer Service Representatives are available to answer your questions Monday through Friday from 8 a.m. to 8 p.m. Eastern time.
The views expressed in this report reflect the current views of the respective parties. These views are not guarantees of future performance and involve certain risks, uncertainties and assumptions that are difficult to predict, so actual outcomes and results may differ significantly from the views expressed. These views are subject to change at any time based upon economic, market or other conditions and the respective parties disclaim any responsibility to update such views. These views may not be relied on as investment advice and, because investment decisions for a Columbia Fund are based on numerous factors, may not be relied on as an indication of trading intent on behalf of any particular Columbia Fund. References to specific securities should not be construed as a recommendation or investment advice.
Annual Report 2012
Columbia Tax-Exempt Fund
Performance Overview
Performance Summary
> Columbia Tax-Exempt Fund (the Fund) Class A shares returned 9.18% (excluding sales charges) for the eight-month period that ended July 31, 2012.
> The Fund outperformed its benchmark, the Barclays Municipal Bond Index, which returned 7.31%, as well as the 9.08% average return of funds in its peer group, the Lipper General and Insured Municipal Debt Funds Classification, during the same eight-month period.
> Favorable maturity, credit quality and sector positioning aided the Fund's results relative to the benchmark.
Average Annual Total Returns (%) (for period ended July 31, 2012)
| | | Inception | | 8 Months
cumulative | | 1 Year | | 5 Years | | 10 Years | |
| Class A | | 11/21/78 | | | | | | | | | | | | | | | | | |
| Excluding sales charges | | | | | | | 9.18 | | | | 12.53 | | | | 5.79 | | | | 5.30 | | |
| Including sales charges | | | | | | | 3.99 | | | | 7.18 | | | | 4.77 | | | | 4.79 | | |
| Class B | | 05/05/92 | | | | | | | | | | | | | | | | | |
| Excluding sales charges | | | | | | | 8.68 | | | | 11.72 | | | | 4.99 | | | | 4.51 | | |
| Including sales charges | | | | | | | 3.68 | | | | 6.72 | | | | 4.66 | | | | 4.51 | | |
| Class C | | 08/01/97 | | | | | | | | | | | | | | | | | |
| Excluding sales charges | | | | | | | 8.70 | | | | 11.81 | | | | 5.14 | | | | 4.66 | | |
| Including sales charges | | | | | | | 7.70 | | | | 10.81 | | | | 5.14 | | | | 4.66 | | |
| Class Z* | | 09/16/05 | | | 9.32 | | | | 12.80 | | | | 5.99 | | | | 5.43 | | |
| Barclays Municipal Bond Index | | | | | | | 7.31 | | | | 10.51 | | | | 6.12 | | | | 5.31 | | |
| Lipper General and Insured Municipal Debt Funds Classification | | | | | | | 9.08 | | | | 12.14 | | | | 5.05 | | | | 4.51 | | |
Returns for Class A are shown with and without the maximum initial sales charge of 4.75%. Returns for Class B are shown with and without the applicable contingent deferred sales charge (CDSC) of 5.00% in the first year, declining to 1.00% in the sixth year and eliminated thereafter. Returns for Class C are shown with and without the 1.00% CDSC for the first year only. The Fund's other classes are not subject to sales charges and have limited eligibility. Please see the Fund's prospectuses for details. Performance for different share classes will vary based on differences in sales charges and fees associated with each class. All results shown assume reinvestment of distributions during the period. Returns do not reflect the deduction of taxes that a shareholder may pay on Fund distributions or on the redemption of Fund shares. Performance results reflect the effect of any fee waivers or reimbursements of Fund expenses by Columbia Management Investment Advisers, LLC and/or any of its affiliates. Absent these fee waivers or expense reimbursement arrangements, performance results would have been lower.
The performance information shown represents past performance and is not a guarantee of future results. The investment return and principal value of your investment will fluctuate so that your shares, when redeemed, may be worth more or less than their original cost. Current performance may be lower or higher than the performance information shown. You may obtain performance information current to the most recent month-end by contacting your financial intermediary, visiting columbiamanagement.com or calling 800.345.6611.
*The returns shown for periods prior to the share class inception date (including returns since inception if shown, which are since Fund inception) include the returns of the Fund's oldest share class. These returns are adjusted to reflect any higher class-related operating expenses of the newer share classes, as applicable. Please visit columbiamanagement.com/mutual-funds/appended-performance for more information.
The Barclays Municipal Bond Index is an unmanaged index considered representative of the broad market for investment-grade, tax-exempt bonds with a maturity of at least one year.
The Lipper General and Insured Municipal Debt Funds Classification calculates an average total return (assuming reinvestment of distributions) for mutual funds that either invest primarily in municipal debt issues rated in the top four credit ratings or invest primarily in municipal debt issues insured as to timely payment. The returns include net reinvested dividends.
Indices are not available for investment, are not professionally managed and do not reflect sales charges, fees, brokerage commissions, taxes or other expenses of investing. Securities in the Fund may not match those in an index.
Annual Report 2012
2
Columbia Tax-Exempt Fund
Performance Overview (continued)
Performance of a Hypothetical $10,000 Investment (August 1, 2002 – July 31, 2012)
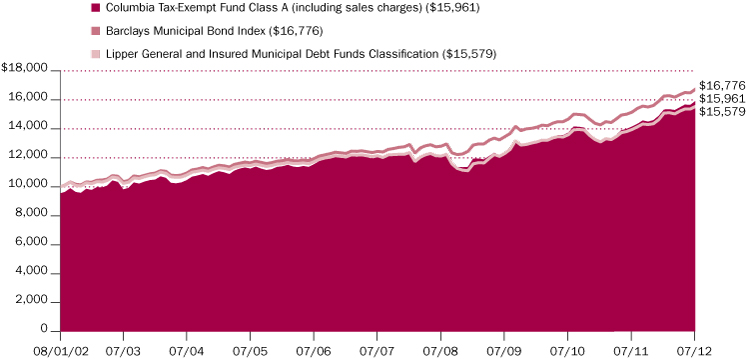
The chart above shows the change in value of a hypothetical $10,000 investment in Class A shares of Columbia Tax-Exempt Fund during the stated time period, and does not reflect the deduction of taxes that a shareholder may pay on Fund distributions or on the redemption of Fund shares.
Annual Report 2012
3
Columbia Tax-Exempt Fund
Manager Discussion of Fund Performance
The Board of Trustees for Columbia Tax-Exempt Fund has approved the change of the Fund's fiscal year end from November 30 to July 31. As a result, this report covers the 8-month period since the last annual report. The next report you receive will be for the six-month period from August 1, 2012 through January 31, 2013.
For the eight-month period that ended July 31, 2012, the Fund's Class A shares returned 9.18% without sales charge. The Fund beat the 7.31% return of its benchmark, the Barclays Municipal Bond Index as well as the 9.08% average return of funds in its peer group, the Lipper General and Insured Municipal Debt Funds Classification, during the same eight-month period. Favorable maturity, credit quality and sector positioning aided the Fund's results relative to the benchmark. Bottom-up credit research also helped drive positive issuer and security selection.
A favorable environment for municipals
Throughout the eight-month period, Europe's debt problems and uncertainty about the strength of the U.S. economy weighed on the world's financial markets. Gross domestic product growth in the United States weakened over the period, expanding by 2.0% in the first quarter of 2012 and only 1.5% in the second quarter. Job growth picked up early in the year, slowed in the spring, then rebounded in July. The spring setback raised questions anew about the sustainability of the current economic recovery. Manufacturing activity — the one consistent bright spot over the current economic cycle — weakened in June and July, as a key measure of manufacturing activity — the Institute of Supply Managers Purchasing Index — slipped below 50, the line between growth and contraction. However, the housing market showed a glimmer of improvement, as year-over-year sales improved, inventories tightened and prices stabilized somewhat.
Throughout the period, the Federal Reserve kept a key short-term borrowing rate, the federal funds rate, near zero and indicated it is likely to remain low into 2014. In response to the European financial crisis and domestic economic uncertainty, Treasury and municipal bond yields declined. The yield on the volatile 10-year U.S. Treasury hit an historic low and ended the period significantly lower than it started.
Against this backdrop, municipal bonds delivered solid gains, led by longer-maturity (25-year or more) and medium to lower quality (A rated and below) issues, whose yield advantage attracted investors. Yields declined — and bond prices rose — across all maturities, but the biggest moves were on bonds maturing in 25 years or more. The yield spread between two- and 30-year high-grade bonds narrowed from 284 basis points to 255 basis points. Yields fell on the short-term bonds by only three basis points while 30-year bonds declined by 32 basis points, from 3.16% to 2.84%. (A basis point is one hundredth of one percent.) Municipal bond returns also benefited from limited new issuance, as state and local governments worked to tighten their fiscal belts and bring their budgets into balance. Supply picked up in the spring as some issuers tried to take advantage of low rates and refund their outstanding debt. However, new supply tended to be focused in bonds with maturities of 20 years or less and was absorbed by rising demand from municipal bond funds experiencing strong inflows from retail investors. Even as mounting concerns over Europe's sovereign debt problems, the strength of the U.S. recovery and an economic slowdown in China fueled an investor flight to safety, demand for municipal bonds — particularly longer-maturity and A and BBB quality issues — remained strong through the end of the period.
Portfolio Management
Kimberly A. Campbell
Top Ten States (%)
(at July 31, 2012) | |
| California | | | 13.6 | | |
| Illinois | | | 9.1 | | |
| New York | | | 8.8 | | |
| Texas | | | 7.0 | | |
| Massachusetts | | | 6.1 | | |
| Minnesota | | | 3.7 | | |
| New Jersey | | | 3.4 | | |
| Wisconsin | | | 3.1 | | |
| Florida | | | 3.1 | | |
| Louisiana | | | 3.0 | | |
Percentages indicated are based upon total investments (excluding Money Market Funds).
Quality Breakdown (%)
(at July 31, 2012) | |
| AAA rating | | | 6.5 | | |
| AA rating | | | 26.8 | | |
| A rating | | | 33.0 | | |
| BBB rating | | | 23.0 | | |
| Non-investment grade | | | 3.0 | | |
| Not rated | | | 7.7 | | |
| Total | | | 100.0 | | |
Percentages indicated are based upon total fixed income securities (excluding Money Market Funds ).
Bond ratings apply to the underlying holdings of the Fund and not the Fund itself and are divided into categories ranging from AAA (highest) to D (lowest), and are subject to change. The ratings shown are determined by using the middle rating of Moody's, S&P, and Fitch after dropping the highest and lowest available ratings. When a rating from only two agencies is available, the lower rating is used. When a rating from only one agency is available, that rating is used. When a bond is not rated by one of these agencies, it is designated as Not rated. Credit ratings are subjective opinions and not statements of fact.
Annual Report 2012
4
Columbia Tax-Exempt Fund
Manager Discussion of Fund Performance (continued)
Gains from maturity and quality positioning
The yield difference between higher and lower quality bonds continued to narrow during the period, as investors sought additional yield from medium and lower quality bonds. The Fund benefited from overweights in BBB and A rated issues, which were the best performers within the investment-grade universe over the eight-month period. In addition, a roughly 10% out-of-index stake in below-investment-grade (below BBB) bonds helped, as they outperformed investment-grade issues. Above average exposure to issues with 15- to 30-year maturities also contributed to the Fund's favorable results. Over the period, we added to the Fund's stake in 20- to 30-year bonds, as we found good value there relative to other maturities. Underweights in bonds with maturities of 10 years or less and higher quality AA and AAA issues also aided relative performance.
Strong security selection and allocations across sectors
Investments in the hospital, state general obligation, education, electric revenue, industrial development revenue and pollution control revenue sectors outperformed those in the index. In addition, the Fund benefited from a significant overweight in the hospital sector, which was a strong performer within the index. The Fund's returns from the top-performing airline and tobacco sectors lagged those in the index, but had minimal impact because they represented such small parts of the index and Fund. However, underweights in certain states whose municipal bonds rallied nicely — including two of the largest issuers, California and New York — detracted. We added to California general obligation bonds over the period, taking advantage of good relative value and attractive yields.
Looking ahead
Going forward, we anticipate inflation to be muted and expect economic growth to be uneven and slow. The year-end expiration of certain tax benefits and the introduction of automatic federal spending cuts, which are popularly known as the "fiscal cliff," are likely to increase uncertainty if not addressed. Proposals to reduce or eliminate the tax-exempt status of newly issued municipal bonds also could weigh on the sector. Despite these concerns, we think the environment for municipal bonds remains strong. Low interest rates will likely entice more issuers to come to market, leading to reasonable supply. In this environment, we believe that our focus on security selection will be critical. Furthermore, we will rely on the research expertise of the Columbia Management municipal credit analysts for issuer recommendations.
At period end, the Fund remained heavily weighted in the 15- to 30-year maturity range, which we think offers good return potential as long as inflationary pressures remain muted and economic growth sluggish. The Fund also was biased toward A and BBB rated issues, with selective additions to bonds rated below investment grade. We believe these bonds are attractively priced, support the Fund's yield and offer a potential cushion as interest rates fluctuate. We continue to underweight local government obligation bonds because we believe that revenues could remain under pressure for some time. We continue to monitor the economic environment with diligence, performing credit surveillance, striving to manage credit risks appropriately and seeking to construct a diversified portfolio with an attractive yield and competitive long-term return potential.
Annual Report 2012
5
Columbia Tax-Exempt Fund
Understanding Your Fund's Expenses
(Unaudited)
As an investor, you incur two types of costs. There are transaction costs, which generally include sales charges on purchases and may include redemption fees. There are also ongoing costs, which generally include management fees, distribution and service (Rule 12b-1) fees, and other fund expenses. The following information is intended to help you understand your ongoing costs (in dollars) of investing in the Fund and to help you compare these costs with the ongoing costs of investing in other mutual funds.
Analyzing Your Fund's Expenses
To illustrate these ongoing costs, we have provided examples and calculated the expenses paid by investors in each share class of the Fund during the period. The actual and hypothetical information in the table is based on an initial investment of $1,000 at the beginning of the period indicated and held for the entire period. Expense information is calculated two ways and each method provides you with different information. The amount listed in the "Actual" column is calculated using the Fund's actual operating expenses and total return for the period. You may use the Actual information, together with the amount invested, to estimate the expenses that you paid over the period. Simply divide your account value by $1,000 (for example, an $8,600 account value divided by $1,000 = 8.6), then multiply the results by the expenses paid during the period under the Actual column. The amount listed in the "Hypothetical" column assumes a 5% annual rate of return before expenses (which is not the Fund's actual return) and then applies the Fund's actual expense ratio for the period to the hypothetical return. You should not use the hypothetical account values and expenses to estimate either your actual account balance at the end of the period or the expenses you paid during the period. See "Compare With Other Funds" below for details on how to use the hypothetical data.
Compare With Other Funds
Since all mutual funds are required to include the same hypothetical calculations about expenses in shareholder reports, you can use this information to compare the ongoing cost of investing in the Fund with other funds. To do so, compare the hypothetical example with the 5% hypothetical examples that appear in the shareholder reports of other funds. As you compare hypothetical examples of other funds, it is important to note that hypothetical examples are meant to highlight the ongoing costs of investing in a fund only and do not reflect any transaction costs, such as sales charges, or redemption or exchange fees. Therefore, the hypothetical calculations are useful in comparing ongoing costs only, and will not help you determine the relative total costs of owning different funds. If transaction costs were included in these calculations, your costs would be higher.
February 1, 2012 – July 31, 2012
| | | Account Value at the Beginning
of the Period ($) | | Account Value at the End of the
Period ($) | | Expenses Paid During the
Period ($) | | Fund's Annualized
Expense Ratio (%) | |
| | | Actual | | Hypothetical | | Actual | | Hypothetical | | Actual | | Hypothetical | | Actual | |
| Class A | | | 1,000.00 | | | | 1,000.00 | | | | 1,039.30 | | | | 1,020.93 | | | | 4.01 | | | | 3.97 | | | | 0.79 | | |
| Class B | | | 1,000.00 | | | | 1,000.00 | | | | 1,036.20 | | | | 1,017.21 | | | | 7.80 | | | | 7.72 | | | | 1.54 | | |
| Class C | | | 1,000.00 | | | | 1,000.00 | | | | 1,036.30 | | | | 1,017.95 | | | | 7.04 | | | | 6.97 | | | | 1.39 | | |
| Class Z | | | 1,000.00 | | | | 1,000.00 | | | | 1,040.40 | | | | 1,021.93 | | | | 2.99 | | | | 2.97 | | | | 0.59 | | |
Expenses paid during the period are equal to the annualized expense ratio for each class as indicated above, multiplied by the average account value over the period and then multiplied by the number of days in the Fund's most recent fiscal half year and divided by 366.
Expenses do not include fees and expenses incurred indirectly by the Fund from the underlying funds in which the Fund may invest (also referred to as "acquired funds"), including affiliated and non-affiliated pooled investment vehicles (including mutual funds and exchange traded funds).
Had Columbia Management Investment Advisers, LLC and/or certain of its affiliates not waived/reimbursed certain fees and expenses, account value at the end of the period would have been reduced.
Annual Report 2012
6
Columbia Tax-Exempt Fund
Portfolio of Investments
July 31, 2012
(Percentages represent value of investments compared to net assets)
Municipal Bonds 95.8%
Issue
Description | | Coupon
Rate | | Principal
Amount ($) | | Value ($) | |
| Alabama 0.3% | |
County of Jefferson
Refunding Revenue Bonds
Series 1997A (FGIC)
02/01/22 | | | 5.625 | % | | | 570,000 | | | | 365,889 | | |
Revenue Bonds
Series 2004A
01/01/19 | | | 5.250 | % | | | 2,790,000 | | | | 2,793,069 | | |
| 01/01/23 | | | 5.250 | % | | | 7,500,000 | | | | 7,500,150 | | |
Selma Industrial Development Board
Revenue Bonds
Gulf Opportunity Zone-International Paper
Series 2010
05/01/34 | | | 5.800 | % | | | 4,900,000 | | | | 5,447,967 | | |
| Total | | | | | | | 16,107,075 | | |
| Alaska 0.7% | |
Alaska Energy Authority
Refunding Revenue Bonds
Bradley Lake
3rd Series 1999 (AGM)
07/01/14 | | | 6.000 | % | | | 2,000,000 | | | | 2,184,340 | | |
4th Series 2000 (AGM)
07/01/20 | | | 6.000 | % | | | 4,145,000 | | | | 5,237,166 | | |
| 07/01/21 | | | 6.000 | % | | | 2,395,000 | | | | 3,062,319 | | |
City of Koyukuk
Revenue Bonds
Tanana Chiefs Conference Health Care
Series 2011
10/01/32 | | | 7.500 | % | | | 18,330,000 | | | | 19,999,496 | | |
| 10/01/41 | | | 7.750 | % | | | 4,350,000 | | | | 4,758,509 | | |
| Total | | | | | | | 35,241,830 | | |
| Arizona 1.4% | |
Arizona Health Facilities Authority
Revenue Bonds
Banner Health
Series 2008D
01/01/32 | | | 5.375 | % | | | 7,800,000 | | | | 8,736,156 | | |
Arizona Transportation Board
Revenue Bonds
Maricopa County Regional Area Road Fund
Series 2007
07/01/25 | | | 5.000 | % | | | 1,500,000 | | | | 1,731,750 | | |
Arizona Water Infrastructure Finance Authority
Revenue Bonds
Water Quality
Series 2008A
10/01/22 | | | 5.000 | % | | | 1,500,000 | | | | 1,781,835 | | |
City of Tucson
Unlimited General Obligation Bonds
Series 1984G (NPFGC/FGIC)
07/01/14 | | | 7.625 | % | | | 3,140,000 | | | | 3,548,922 | | |
Municipal Bonds (continued)
Issue
Description | | Coupon
Rate | | Principal
Amount ($) | | Value ($) | |
Glendale Industrial Development Authority
Revenue Bonds
Midwestern University
Series 2010
05/15/35 | | | 5.000 | % | | | 13,750,000 | | | | 14,661,625 | | |
Maricopa County Industrial Development Authority
Revenue Bonds
Catholic Healthcare West
Series 2004A
07/01/26 | | | 5.500 | % | | | 5,000,000 | | | | 5,242,950 | | |
Maricopa County Pollution Control Corp.
Refunding Revenue Bonds
Southern California Edison Co.
Series 2000B
06/01/35 | | | 5.000 | % | | | 9,775,000 | | | | 10,849,273 | | |
Pima County Industrial Development Authority
Revenue Bonds
GNMA Mortgage-Backed Securities
Series 1989 Escrowed to Maturity AMT(a)
09/01/21 | | | 8.200 | % | | | 10,665,000 | | | | 14,569,350 | | |
Salt Verde Financial Corp.
Revenue Bonds
Senior Series 2007
12/01/32 | | | 5.000 | % | | | 5,400,000 | | | | 5,617,512 | | |
| Total | | | | | | | 66,739,373 | | |
| California 13.3% | |
ABAG Finance Authority for Nonprofit Corps.
Refunding Revenue Bonds
Episcopal Senior Community
Series 2011
07/01/26 | | | 6.125 | % | | | 3,420,000 | | | | 3,869,969 | | |
| 07/01/41 | | | 6.125 | % | | | 7,015,000 | | | | 7,844,383 | | |
Revenue Bonds
San Diego Hospital Association
Series 2003C
03/01/20 | | | 5.375 | % | | | 1,320,000 | | | | 1,390,976 | | |
Sharp Healthcare
Series 2009
08/01/39 | | | 6.250 | % | | | 4,000,000 | | | | 4,756,960 | | |
Agua Caliente Band of Cahuilla Indians
Revenue Bonds
Series 2003(b)(c)
07/01/18 | | | 6.000 | % | | | 2,000,000 | | | | 1,964,060 | | |
Cabazon Band Mission Indians(b)(c)(d)(e)
Revenue Bonds
Series 2004
10/01/11 | | | 13.000 | % | | | 400,000 | | | | 240,000 | | |
| 10/01/15 | | | 8.375 | % | | | 1,740,000 | | | | 1,034,639 | | |
| 10/01/19 | | | 8.750 | % | | | 8,670,000 | | | | 5,102,555 | | |
Series 2010
10/01/20 | | | 8.375 | % | | | 1,415,000 | | | | 849,000 | | |
The accompanying Notes to Financial Statements are an integral part of this statement.
Annual Report 2012
7
Columbia Tax-Exempt Fund
Portfolio of Investments (continued)
July 31, 2012
Municipal Bonds (continued)
Issue
Description | | Coupon
Rate | | Principal
Amount ($) | | Value ($) | |
California Educational Facilities Authority
Revenue Bonds
Loyola Marymount University
Series 2001A (NPFGC)(f)
10/01/17 | | | 0.000 | % | | | 2,525,000 | | | | 2,239,599 | | |
California Health Facilities Financing Authority
Prerefunded 10/01/18 Revenue Bonds
Providence Health
Series 2008
10/01/38 | | | 6.500 | % | | | 110,000 | | | | 145,651 | | |
Revenue Bonds
Kaiser Permanente
Series 2006A
04/01/39 | | | 5.250 | % | | | 4,500,000 | | | | 4,746,375 | | |
Providence Health & Services
Series 2008C
10/01/28 | | | 6.250 | % | | | 2,000,000 | | | | 2,388,220 | | |
Unrefunded Revenue Bonds
Providence Health
Series 2008
10/01/38 | | | 6.500 | % | | | 7,890,000 | | | | 9,409,220 | | |
California Housing Finance Agency(a)
Revenue Bonds
Home Mortgage
Series 2006H (FGIC) AMT
08/01/30 | | | 5.750 | % | | | 3,310,000 | | | | 3,450,212 | | |
Series 2006K AMT
02/01/42 | | | 5.500 | % | | | 4,970,000 | | | | 5,144,497 | | |
California Municipal Finance Authority
Revenue Bonds
American Heritage Education Foundation Project
Series 2006A
06/01/36 | | | 5.250 | % | | | 1,750,000 | | | | 1,572,323 | | |
Biola University
Series 2008
10/01/34 | | | 5.875 | % | | | 4,000,000 | | | | 4,319,840 | | |
California Municipal Finance Authority(a)(b)(d)
Revenue Bonds
UTS Renewable Energy-Waste Water
Series 2011 AMT
12/01/15 | | | 3.950 | % | | | 1,415,000 | | | | 1,415,863 | | |
| 12/01/32 | | | 7.500 | % | | | 1,925,000 | | | | 2,031,838 | | |
California State Department of Veterans Affairs
Revenue Bonds
Series 2007A AMT(a)
12/01/22 | | | 4.850 | % | | | 1,700,000 | | | | 1,797,410 | | |
California State Public Works Board
Revenue Bonds
Various Capital Projects
Series 2012A
04/01/37 | | | 5.000 | % | | | 4,660,000 | | | | 5,038,066 | | |
Subordinated Series 2009I-1
11/01/29 | | | 6.125 | % | | | 6,000,000 | | | | 7,182,960 | | |
Municipal Bonds (continued)
Issue
Description | | Coupon
Rate | | Principal
Amount ($) | | Value ($) | |
California Statewide Communities Development Authority
Revenue Bonds
Aspire Public Schools
Series 2010
07/01/30 | | | 6.000 | % | | | 3,570,000 | | | | 3,682,705 | | |
John Muir Health
Series 2006A
08/15/32 | | | 5.000 | % | | | 1,000,000 | | | | 1,071,600 | | |
Kaiser Permanente
Series 2006B
03/01/45 | | | 5.250 | % | | | 13,000,000 | | | | 13,728,130 | | |
University of California Irvine East Campus Apartments
Series 2008
05/15/32 | | | 5.750 | % | | | 5,500,000 | | | | 5,904,470 | | |
California Statewide Communities Development Authority(b)
Revenue Bonds
Thomas Jefferson School of Law
Series 2008A
10/01/26 | | | 7.000 | % | | | 10,235,000 | | | | 10,913,580 | | |
| 10/01/38 | | | 7.250 | % | | | 3,295,000 | | | | 3,502,585 | | |
Castaic Lake Water Agency
Certificate of Participation
Capital Appreciation-Water System Improvement Project
Series 1999 (AMBAC)(f)
08/01/24 | | | 0.000 | % | | | 9,445,000 | | | | 6,145,956 | | |
City of Pomona
Refunding Revenue Bonds
Mortgage-Backed Securities
Series 1990A (GNMA/FNMA)
05/01/23 | | | 7.600 | % | | | 7,675,000 | | | | 10,251,958 | | |
City of San Jose
Revenue Bonds
Series 2001A (NPFGC/FGIC)
03/01/31 | | | 5.000 | % | | | 4,855,000 | | | | 4,868,837 | | |
City of San Jose(a)
Revenue Bonds
Series 2007A (AMBAC) AMT
03/01/15 | | | 5.000 | % | | | 3,000,000 | | | | 3,278,250 | | |
| 03/01/16 | | | 5.000 | % | | | 3,000,000 | | | | 3,335,400 | | |
City of Vernon
Revenue Bonds
Series 2009A
08/01/21 | | | 5.125 | % | | | 2,500,000 | | | | 2,814,700 | | |
County of Sacramento Airport System
Revenue Bonds
Senior Series 2009B
07/01/39 | | | 5.750 | % | | | 4,000,000 | | | | 4,559,600 | | |
Foothill-Eastern Transportation Corridor Agency
Refunding Revenue Bonds
Series 1999
01/15/40 | | | 5.750 | % | | | 4,100,000 | | | | 4,102,050 | | |
The accompanying Notes to Financial Statements are an integral part of this statement.
Annual Report 2012
8
Columbia Tax-Exempt Fund
Portfolio of Investments (continued)
July 31, 2012
Municipal Bonds (continued)
Issue
Description | | Coupon
Rate | | Principal
Amount ($) | | Value ($) | |
Foothill-Eastern Transportation Corridor Agency(f)
Revenue Bonds
Capital Appreciation-Senior Lien
Series 1995A Escrowed to Maturity
01/01/18 | | | 0.000 | % | | | 10,000,000 | | | | 9,372,500 | | |
Fremont Union High School District
Unlimited General Obligation Bonds
Election of 2008
Series 2008
08/01/30 | | | 4.750 | % | | | 3,925,000 | | | | 4,324,526 | | |
Huntington Beach Community Facilities District
Special Tax Bonds
Grand Coast Resort No. 2000-1
Series 2001
09/01/31 | | | 6.450 | % | | | 1,850,000 | | | | 1,870,424 | | |
Lakeside Union School District San Diego County
Unlimited General Obligation Bonds
Series 2009
08/01/33 | | | 5.000 | % | | | 5,000,000 | | | | 5,688,050 | | |
Lammersville School District Community Facilities District No. 2002
Special Tax Bonds
Mountain House
Series 2006
09/01/35 | | | 5.125 | % | | | 875,000 | | | | 875,123 | | |
Los Angeles County Schools Regionalized Business Services Corp.
Certificate of Participation
Capital Appreciation-Pooled Financing
Series 1999A (AMBAC)(f)
08/01/22 | | | 0.000 | % | | | 2,180,000 | | | | 1,279,900 | | |
Los Angeles Unified School District
Unlimited General Obligation Bonds
Series 2009I
07/01/29 | | | 5.000 | % | | | 4,800,000 | | | | 5,511,744 | | |
May Farms Community Facilities District
Special Tax Bonds
Series 1991-90-2 Escrowed to Maturity
10/01/21 | | | 8.750 | % | | | 6,165,000 | | | | 9,623,442 | | |
Norwalk-La Mirada Unified School District
Unlimited General Obligation Bonds
Capital Appreciation
Series 2005B (NPFGC/FGIC)(f)
08/01/23 | | | 0.000 | % | | | 9,790,000 | | | | 6,311,417 | | |
Orange Unified School District Community Facilities District No. 2005-2
Special Tax Bonds
Del Rio School Facilities
Series 2007
09/01/37 | | | 5.000 | % | | | 1,000,000 | | | | 974,840 | | |
Palmdale Community Redevelopment Agency
Revenue Bonds
Series 1986D Escrowed to Maturity (FHA) AMT(a)
04/01/16 | | | 8.000 | % | | | 7,000,000 | | | | 8,887,410 | | |
Municipal Bonds (continued)
Issue
Description | | Coupon
Rate | | Principal
Amount ($) | | Value ($) | |
Riverside County Public Financing Authority
Certificate of Participation
Series 1999
05/15/29 | | | 5.800 | % | | | 5,650,000 | | | | 2,996,421 | | |
San Diego Public Facilities Financing Authority Sewer
Revenue Bonds
Senior Series 2009A
05/15/34 | | | 5.250 | % | | | 4,500,000 | | | | 5,177,160 | | |
| 05/15/39 | | | 5.250 | % | | | 17,000,000 | | | | 19,411,280 | | |
San Francisco City & County Public Utilities Commission Water
Revenue Bonds
Series 2006A (AGM)
11/01/31 | | | 4.500 | % | | | 15,000,000 | | | | 15,956,250 | | |
San Francisco City & County Redevelopment Agency
Tax Allocation Bonds
Mission Bay South Redevelopment
Series 2009D
08/01/31 | | | 6.500 | % | | | 500,000 | | | | 548,785 | | |
| 08/01/39 | | | 6.625 | % | | | 1,500,000 | | | | 1,650,285 | | |
San Joaquin Hills Transportation Corridor Agency
Revenue Bonds
Senior Lien
Series 1993
01/01/33 | | | 5.000 | % | | | 1,500,000 | | | | 1,339,290 | | |
San Joaquin Hills Transportation Corridor Agency(f)
Refunding Revenue Bonds
Capital Appreciation
Series 1997A (NPFGC)
01/15/14 | | | 0.000 | % | | | 14,450,000 | | | | 13,756,111 | | |
San Juan Unified School District
Unlimited General Obligation Bonds
Capital Appreciation
Series 2001 (AGM)(f)
08/01/18 | | | 0.000 | % | | | 1,785,000 | | | | 1,508,753 | | |
Simi Valley School Financing Authority
Refunding Revenue Bonds
Simi Valley Unified School District
Series 2007 (AGM)
08/01/23 | | | 5.000 | % | | | 1,500,000 | | | | 1,760,940 | | |
State of California
Unlimited General Obligation Bonds
Series 2002 (AMBAC)
04/01/17 | | | 6.000 | % | | | 2,500,000 | | | | 3,064,150 | | |
Series 2003
02/01/21 | | | 5.000 | % | | | 4,625,000 | | | | 4,820,869 | | |
Series 2006
10/01/36 | | | 4.500 | % | | | 4,015,000 | | | | 4,148,780 | | |
Various Purpose
Series 2003
11/01/22 | | | 5.000 | % | | | 5,000,000 | | | | 5,258,800 | | |
| 11/01/24 | | | 5.125 | % | | | 8,000,000 | | | | 8,384,400 | | |
Series 2005
03/01/32 | | | 5.000 | % | | | 1,500,000 | | | | 1,609,620 | | |
| 06/01/35 | | | 4.750 | % | | | 2,500,000 | | | | 2,577,350 | | |
| 08/01/35 | | | 5.000 | % | | | 10,000,000 | | | | 10,622,900 | | |
The accompanying Notes to Financial Statements are an integral part of this statement.
Annual Report 2012
9
Columbia Tax-Exempt Fund
Portfolio of Investments (continued)
July 31, 2012
Municipal Bonds (continued)
Issue
Description | | Coupon
Rate | | Principal
Amount ($) | | Value ($) | |
Series 2007
12/01/32 | | | 5.000 | % | | | 8,000,000 | | | | 8,834,080 | | |
| 06/01/37 | | | 5.000 | % | | | 13,145,000 | | | | 14,068,436 | | |
| 11/01/37 | | | 5.000 | % | | | 18,000,000 | | | | 19,364,220 | | |
| 12/01/37 | | | 5.000 | % | | | 10,200,000 | | | | 10,984,278 | | |
Series 2008
03/01/27 | | | 5.500 | % | | | 1,000,000 | | | | 1,159,670 | | |
| 03/01/38 | | | 5.250 | % | | | 8,250,000 | | | | 9,037,545 | | |
Series 2009
04/01/31 | | | 5.750 | % | | | 32,500,000 | | | | 38,378,925 | | |
| 04/01/35 | | | 6.000 | % | | | 15,000,000 | | | | 17,950,350 | | |
| 04/01/38 | | | 6.000 | % | | | 22,500,000 | | | | 26,564,850 | | |
| 11/01/39 | | | 5.500 | % | | | 15,520,000 | | | | 17,737,032 | | |
Series 2010
03/01/30 | | | 5.250 | % | | | 3,000,000 | | | | 3,443,760 | | |
| 03/01/33 | | | 6.000 | % | | | 5,000,000 | | | | 6,159,200 | | |
| 03/01/40 | | | 5.500 | % | | | 17,200,000 | | | | 19,744,740 | | |
Series 2011
09/01/30 | | | 5.250 | % | | | 8,750,000 | | | | 10,124,100 | | |
Series 2012
04/01/35 | | | 5.250 | % | | | 19,275,000 | | | | 22,003,183 | | |
Unlimited General Obligation Refunding Bonds
Series 2007
08/01/30 | | | 4.500 | % | | | 34,950,000 | | | | 37,217,206 | | |
Series 2012
02/01/38 | | | 5.000 | % | | | 18,500,000 | | | | 20,287,470 | | |
Various Purpose
Series 2008
04/01/38 | | | 5.000 | % | | | 1,015,000 | | | | 1,095,307 | | |
Unrefunded Unlimited General Obligation Bonds
Series 2004
04/01/29 | | | 5.300 | % | | | 6,000 | | | | 6,330 | | |
Temecula Public Financing Authority(g)
Refunding Special Tax Bonds
Wolf Creek Community Facilities District
Series 2012 | |
| 09/01/27 | | | 5.000 | % | | | 1,275,000 | | | | 1,360,259 | | |
| 09/01/28 | | | 5.000 | % | | | 1,315,000 | | | | 1,396,267 | | |
| 09/01/29 | | | 5.000 | % | | | 1,405,000 | | | | 1,484,734 | | |
| 09/01/30 | | | 5.000 | % | | | 1,480,000 | | | | 1,556,560 | | |
| 09/01/31 | | | 5.000 | % | | | 1,555,000 | | | | 1,626,390 | | |
Turlock Irrigation District
Certificate of Participation
Series 2003A (NPFGC)
01/01/33 | | | 5.000 | % | | | 4,450,000 | | | | 4,469,402 | | |
University of California
Revenue Bonds
General Series 2009Q
05/15/34 | | | 5.000 | % | | | 5,750,000 | | | | 6,597,493 | | |
Walnut Energy Center Authority
Revenue Bonds
Series 2004A (AMBAC)
01/01/29 | | | 5.000 | % | | | 9,365,000 | | | | 9,631,902 | | |
Municipal Bonds (continued)
Issue
Description | | Coupon
Rate | | Principal
Amount ($) | | Value ($) | |
West Contra Costa Unified School District
Unlimited General Obligation Refunding Bonds
Series 2001B (NPFGC)
08/01/24 | | | 6.000 | % | | | 2,320,000 | | | | 2,836,339 | | |
Yuba City Unified School District
Unlimited General Obligation Bonds
Capital Appreciation
Series 2000 (NPFGC/FGIC)(f)
09/01/18 | | | 0.000 | % | | | 1,160,000 | | | | 945,864 | | |
| Total | | | | | | | 631,471,849 | | |
| Colorado 1.5% | |
Baptist Road Rural Transportation Authority
Revenue Bonds
Series 2007
12/01/17 | | | 4.800 | % | | | 740,000 | | | | 685,817 | | |
| 12/01/22 | | | 4.950 | % | | | 1,570,000 | | | | 1,285,673 | | |
| 12/01/26 | | | 5.000 | % | | | 1,575,000 | | | | 1,196,024 | | |
City & County of Denver
Unlimited General Obligation Bonds
Justice System Facilities & Zoo
Series 2005
08/01/25 | | | 5.000 | % | | | 1,000,000 | | | | 1,120,360 | | |
City & County of Denver(a)
Refunding Revenue Bonds
United Air Lines Project
Series 2007A AMT
10/01/32 | | | 5.250 | % | | | 5,000,000 | | | | 4,965,800 | | |
City of Westminster
Revenue Bonds
Post Project
Series 2007D (AGM)
12/01/23 | | | 5.000 | % | | | 1,240,000 | | | | 1,408,838 | | |
Colorado Educational & Cultural Facilities Authority
Refunding Revenue Bonds
Student Housing-Campus Village Apartment
Series 2008
06/01/33 | | | 5.500 | % | | | 2,000,000 | | | | 2,150,900 | | |
| 06/01/38 | | | 5.500 | % | | | 6,000,000 | | | | 6,419,760 | | |
Colorado Health Facilities Authority
Prerefunded 06/01/14 Revenue Bonds
Evangelical Lutheran
Series 2009A
06/01/38 | | | 6.125 | % | | | 3,250,000 | | | | 3,589,365 | | |
Refunding Revenue Bonds
Valley View Hospital Association
Series 2008
05/15/28 | | | 5.500 | % | | | 5,745,000 | | | | 6,143,129 | | |
Revenue Bonds
Evangelical Lutheran
Series 2005
06/01/23 | | | 5.250 | % | | | 1,200,000 | | | | 1,283,952 | | |
The accompanying Notes to Financial Statements are an integral part of this statement.
Annual Report 2012
10
Columbia Tax-Exempt Fund
Portfolio of Investments (continued)
July 31, 2012
Municipal Bonds (continued)
Issue
Description | | Coupon
Rate | | Principal
Amount ($) | | Value ($) | |
Colorado State Board of Governors
Revenue Bonds
Series 2008A (AGM)
03/01/27 | | | 5.000 | % | | | 1,250,000 | | | | 1,391,063 | | |
County of El Paso
Revenue Bonds
Series 1988A (GNMA) AMT(a)
03/25/19 | | | 8.375 | % | | | 28,388 | | | | 28,434 | | |
E-470 Public Highway Authority
Revenue Bonds
Series 2010C
09/01/26 | | | 5.375 | % | | | 5,000,000 | | | | 5,445,450 | | |
E-470 Public Highway Authority(f)
Revenue Bonds
Capital Appreciation
Senior Series 1997B (NPFGC)
09/01/22 | | | 0.000 | % | | | 6,515,000 | | | | 4,204,846 | | |
Senior Series 2000B (NPFGC)
09/01/18 | | | 0.000 | % | | | 18,600,000 | | | | 15,166,440 | | |
North Range Metropolitan District No. 2
Limited Tax General Obligation Bonds
Series 2007
12/15/27 | | | 5.500 | % | | | 2,765,000 | | | | 2,766,078 | | |
| 12/15/37 | | | 5.500 | % | | | 3,100,000 | | | | 3,000,986 | | |
Platte River Power Authority
Revenue Bonds
Series 2009HH
06/01/24 | | | 5.000 | % | | | 1,000,000 | | | | 1,184,590 | | |
Regional Transportation District
Refunding Revenue Bonds
Series 2007A
11/01/24 | | | 5.250 | % | | | 1,000,000 | | | | 1,321,120 | | |
University of Colorado Hospital Authority
Refunding Revenue Bonds
Series 2009A
11/15/29 | | | 6.000 | % | | | 5,000,000 | | | | 5,804,750 | | |
University of Colorado
Revenue Bonds
Series 2006A (AMBAC)
06/01/23 | | | 5.000 | % | | | 1,000,000 | | | | 1,170,760 | | |
| Total | | | | | | | 71,734,135 | | |
| Connecticut 0.2% | |
Harbor Point Infrastructure Improvement District
Tax Allocation Bonds
Harbor Point Project
Series 2010A
04/01/39 | | | 7.875 | % | | | 8,000,000 | | | | 9,126,320 | | |
Mashantucket Western Pequot Tribe
Revenue Bonds
Subordinated Series 2007A(b)(c)(e)
09/01/34 | | | 5.750 | % | | | 4,000,000 | | | | 1,574,280 | | |
| Total | | | | | | | 10,700,600 | | |
Municipal Bonds (continued)
Issue
Description | | Coupon
Rate | | Principal
Amount ($) | | Value ($) | |
| Delaware 0.2% | |
Delaware State Economic Development Authority
Refunding Revenue Bonds
Gas Facilities-Delmarva Power
Series 2010
02/01/31 | | | 5.400 | % | | | 5,000,000 | | | | 5,510,450 | | |
Revenue Bonds
Newark Charter School
Series 2012
09/01/32 | | | 4.625 | % | | | 2,000,000 | | | | 2,056,880 | | |
| 09/01/42 | | | 5.000 | % | | | 1,350,000 | | | | 1,400,220 | | |
| Total | | | | | | | 8,967,550 | | |
| District of Columbia 0.3% | |
District of Columbia
Refunding Revenue Bonds
2nd Series 2009B
12/01/23 | | | 5.000 | % | | | 2,000,000 | | | | 2,411,240 | | |
Metropolitan Washington Airports Authority
Refunding Revenue Bonds
Series 2007A (AMBAC) AMT(a)
10/01/22 | | | 4.750 | % | | | 4,250,000 | | | | 4,661,570 | | |
Resolution Trust Corp.
Pass-Through Certificates
Series 1993A(b)(d)
12/01/16 | | | 8.500 | % | | | 6,615,223 | | | | 6,463,866 | | |
| Total | | | | | | | 13,536,676 | | |
| Florida 3.0% | |
Brevard County Health Facilities Authority
Revenue Bonds
Health First, Inc. Project
Series 2005
04/01/24 | | | 5.000 | % | | | 1,800,000 | | | | 1,891,440 | | |
| 04/01/34 | | | 5.000 | % | | | 16,250,000 | | | | 16,803,800 | | |
Brevard County Housing Finance Authority
Revenue Bonds
Series 1985 (FGIC/MGIC)(f)
04/01/17 | | | 0.000 | % | | | 375,000 | | | | 236,280 | | |
Broward County Housing Finance Authority
Revenue Bonds
Chaves Lake Apartments Project
Series 2000A AMT(a)(d)
07/01/40 | | | 7.500 | % | | | 7,800,000 | | | | 7,807,410 | | |
Capital Trust Agency, Inc.
Revenue Bonds
Atlantic Housing Foundation
Subordinated Series 2008B(d)
07/15/32 | | | 7.000 | % | | | 1,895,000 | | | | 852,636 | | |
City of Ocala
Revenue Bonds
Series 2007A (NPFGC)
10/01/24 | | | 5.000 | % | | | 2,985,000 | | | | 3,318,484 | | |
The accompanying Notes to Financial Statements are an integral part of this statement.
Annual Report 2012
11
Columbia Tax-Exempt Fund
Portfolio of Investments (continued)
July 31, 2012
Municipal Bonds (continued)
Issue
Description | | Coupon
Rate | | Principal
Amount ($) | | Value ($) | |
County of Broward Airport System
Refunding Revenue Bonds
Series 2012P-1 AMT(a)
10/01/25 | | | 5.000 | % | | | 6,000,000 | | | | 6,819,060 | | |
County of Escambia
Revenue Bonds
Series 2003A AMT(a)
11/01/27 | | | 5.750 | % | | | 2,750,000 | | | | 2,884,283 | | |
County of Miami-Dade Aviation
Revenue Bonds
Miami International Airport
Series 2010A
10/01/35 | | | 5.375 | % | | | 11,000,000 | | | | 12,554,190 | | |
County of Polk
Improvement Refunding Revenue Bonds
Series 2006 (NPFGC)
12/01/20 | | | 5.000 | % | | | 1,040,000 | | | | 1,142,835 | | |
County of Seminole Water & Sewer
Revenue Bonds
Series 1992 Escrowed to Maturity (NPFGC)
10/01/19 | | | 6.000 | % | | | 1,030,000 | | | | 1,255,786 | | |
Unrefunded Revenue Bonds
Series 1992 (NPFGC)
10/01/19 | | | 6.000 | % | | | 470,000 | | | | 509,212 | | |
County of St. Johns
Revenue Bonds
Series 2006 (AMBAC)
10/01/26 | | | 5.000 | % | | | 1,000,000 | | | | 1,133,040 | | |
Double Branch Community Development District
Special Assessment Bonds
Series 2002A
05/01/34 | | | 6.700 | % | | | 1,245,000 | | | | 1,275,229 | | |
Florida State Board of Education
Unlimited General Obligation Bonds
Capital Outlay 2008
Series 2009B
06/01/26 | | | 5.000 | % | | | 5,525,000 | | | | 6,622,486 | | |
| 06/01/27 | | | 5.000 | % | | | 5,800,000 | | | | 6,926,302 | | |
Unlimited General Obligation Refunding Bonds
Capital Outlay
Series 2004B
06/01/24 | | | 5.000 | % | | | 5,500,000 | | | | 5,972,120 | | |
Highlands County Health Facilities Authority
Prerefunded 11/15/12 Revenue Bonds
Adventist Health
Series 2002B
11/15/23 | | | 5.250 | % | | | 10,300,000 | | | | 10,450,895 | | |
Prerefunded 11/15/16 Revenue Bonds
Adventist Health
Series 2006C
11/15/36 | | | 5.250 | % | | | 215,000 | | | | 256,944 | | |
Series 2006G
11/15/21 | | | 5.125 | % | | | 70,000 | | | | 83,287 | | |
| 11/15/32 | | | 5.125 | % | | | 465,000 | | | | 553,262 | | |
Municipal Bonds (continued)
Issue
Description | | Coupon
Rate | | Principal
Amount ($) | | Value ($) | |
Hillsborough County Industrial Development Authority
Refunding Revenue Bonds
Tampa General Hospital Project
Series 2003A
10/01/18 | | | 5.000 | % | | | 825,000 | | | | 861,960 | | |
Jacksonville Health Facilities Authority
Revenue Bonds
Brooks Health System
Series 2007
11/01/38 | | | 5.250 | % | | | 5,000,000 | | | | 5,227,950 | | |
Marion County Hospital District
Improvement Refunding Revenue Bonds
Munroe Regional Health System
Series 2007
10/01/29 | | | 5.000 | % | | | 1,000,000 | | | | 1,041,470 | | |
Mid-Bay Bridge Authority
Revenue Bonds
Series 1991A Escrowed to Maturity
10/01/22 | | | 6.875 | % | | | 2,000,000 | | | | 2,740,900 | | |
Series 2011A
10/01/40 | | | 7.250 | % | | | 7,000,000 | | | | 8,835,470 | | |
Orange County School Board
Certificate of Participation
Series 2005B (AMBAC)
08/01/25 | | | 5.000 | % | | | 2,440,000 | | | | 2,680,560 | | |
Sarasota County Health Facilities Authority
Refunding Revenue Bonds
Village on the Isle Project
Series 2007
01/01/14 | | | 5.000 | % | | | 645,000 | | | | 653,501 | | |
Sarasota County Public Hospital Board
Refunding Revenue Bonds
Sarasota Memorial Hospital
Series 1998B (NPFGC)
07/01/28 | | | 5.500 | % | | | 6,980,000 | | | | 8,249,104 | | |
Seminole Indian Tribe of Florida
Revenue Bonds
Series 2007A(b)(c)
10/01/27 | | | 5.250 | % | | | 9,750,000 | | | | 9,927,937 | | |
South Florida Water Management District
Certificate of Participation
Series 2006 (AMBAC)
10/01/26 | | | 5.000 | % | | | 1,400,000 | | | | 1,586,256 | | |
State of Florida
Revenue Bonds
Series 2007A (AMBAC)
07/01/18 | | | 5.000 | % | | | 2,000,000 | | | | 2,365,360 | | |
Unlimited General Obligation Bonds
Jacksonville Transportation Authority
Series 1985 Escrowed to Maturity
01/01/15 | | | 9.200 | % | | | 1,210,000 | | | | 1,348,013 | | |
Unrefunded Unlimited General Obligation Bonds
Series 1985
06/01/14 | | | 9.125 | % | | | 320,000 | | | | 342,774 | | |
The accompanying Notes to Financial Statements are an integral part of this statement.
Annual Report 2012
12
Columbia Tax-Exempt Fund
Portfolio of Investments (continued)
July 31, 2012
Municipal Bonds (continued)
Issue
Description | | Coupon
Rate | | Principal
Amount ($) | | Value ($) | |
Tampa Sports Authority
Sales Tax Revenue Bonds
Tampa Bay Arena Project
Series 1995 (NPFGC)
10/01/25 | | | 5.750 | % | | | 2,500,000 | | | | 2,819,300 | | |
Village Center Community Development District
Refunding Revenue Bonds
Series 1998A (NPFGC)
11/01/12 | | | 5.500 | % | | | 750,000 | | | | 756,765 | | |
Waterset North Community Development District
Special Assessment Bonds
Series 2007A
05/01/39 | | | 6.600 | % | | | 2,905,000 | | | | 2,406,705 | | |
Westchester Community Development District No. 1
Special Assessment Bonds
Community Infrastructure
Series 2003
05/01/23 | | | 6.000 | % | | | 1,865,000 | | | | 1,874,866 | | |
| Total | | | | | | | 143,067,872 | | |
| Georgia 2.7% | |
Barnesville-Lamar County Industrial Development Authority
Revenue Bonds
Gordon College Properties
Series 2004A
08/01/25 | | | 5.000 | % | | | 1,250,000 | | | | 1,289,825 | | |
Chatham County Hospital Authority
Revenue Bonds
Improvement-Memorial Health University
Series 2004A
01/01/34 | | | 5.500 | % | | | 2,500,000 | | | | 2,676,225 | | |
City of Atlanta
Revenue Bonds
Series 1999A (NPFGC/FGIC)
11/01/22 | | | 5.500 | % | | | 5,475,000 | | | | 6,656,177 | | |
Series 2004 (AGM)
11/01/25 | | | 5.750 | % | | | 1,000,000 | | | | 1,346,700 | | |
County of Fulton Water & Sewerage
Revenue Bonds
Series 1992 Escrowed to Maturity
01/01/14 | | | 6.375 | % | | | 6,215,000 | | | | 6,542,468 | | |
DeKalb County Hospital Authority
Revenue Bonds
DeKalb Medical Center, Inc. Project
Series 2010
09/01/40 | | | 6.125 | % | | | 6,250,000 | | | | 7,021,625 | | |
Gainesville & Hall County Hospital Authority
Revenue Bonds
Northeast Georgia Healthcare
Series 2010A
02/15/45 | | | 5.500 | % | | | 32,500,000 | | | | 36,114,325 | | |
Municipal Bonds (continued)
Issue
Description | | Coupon
Rate | | Principal
Amount ($) | | Value ($) | |
Georgia State Road & Tollway Authority
Refunding Revenue Bonds
Series 2011A
03/01/18 | | | 5.000 | % | | | 15,695,000 | | | | 19,199,850 | | |
Series 2011B
10/01/16 | | | 5.000 | % | | | 2,000,000 | | | | 2,370,640 | | |
Henry County Water & Sewerage Authority
Revenue Bonds
Series 1997 (AMBAC)
02/01/20 | | | 6.150 | % | | | 5,390,000 | | | | 6,937,685 | | |
Metropolitan Atlanta Rapid Transit Authority
Refunding Revenue Bonds
Rental-Mortgage
Series 1992N
07/01/18 | | | 6.250 | % | | | 400,000 | | | | 465,052 | | |
Series 1992P (AMBAC)
07/01/20 | | | 6.250 | % | | | 6,000,000 | | | | 7,089,480 | | |
Series 2007A (AMBAC/FGIC)
07/01/26 | | | 5.250 | % | | | 1,000,000 | | | | 1,292,140 | | |
Municipal Electric Authority of Georgia
Refunding Revenue Bonds
Series 1991V (NPFGC)
01/01/18 | | | 6.600 | % | | | 420,000 | | | | 459,656 | | |
Revenue Bonds
Series 1991V Escrowed to Maturity (NPFGC)
01/01/18 | | | 6.600 | % | | | 3,600,000 | | | | 4,212,900 | | |
Unrefunded Revenue Bonds
Series 1991V (NPFGC)
01/01/18 | | | 6.600 | % | | | 17,280,000 | | | | 19,752,250 | | |
Rockdale County Development Authority
Revenue Bonds
Visy Paper Project
Series 2007A AMT(a)
01/01/34 | | | 6.125 | % | | | 3,000,000 | | | | 3,132,120 | | |
Upper Oconee Basin Water Authority
Refunding Revenue Bonds
Series 2005 (NPFGC)
07/01/24 | | | 5.000 | % | | | 1,000,000 | | | | 1,107,670 | | |
| Total | | | | | | | 127,666,788 | | |
| Guam 0.1% | |
Territory of Guam
Revenue Bonds
Section 30
Series 2009A(c)
12/01/34 | | | 5.750 | % | | | 2,000,000 | | | | 2,246,100 | | |
| Hawaii 0.8% | |
Hawaii Pacific Health
Revenue Bonds
Series 2010A
07/01/40 | | | 5.500 | % | | | 6,500,000 | | | | 7,068,425 | | |
Series 2010B
07/01/30 | | | 5.625 | % | | | 1,220,000 | | | | 1,354,224 | | |
| 07/01/40 | | | 5.750 | % | | | 1,630,000 | | | | 1,817,189 | | |
The accompanying Notes to Financial Statements are an integral part of this statement.
Annual Report 2012
13
Columbia Tax-Exempt Fund
Portfolio of Investments (continued)
July 31, 2012
Municipal Bonds (continued)
Issue
Description | | Coupon
Rate | | Principal
Amount ($) | | Value ($) | |
Hawaii State Department of Budget & Finance
Revenue Bonds
15 Craigside Project
Series 2009A
11/15/29 | | | 8.750 | % | | | 1,000,000 | | | | 1,213,910 | | |
| 11/15/44 | | | 9.000 | % | | | 3,000,000 | | | | 3,641,250 | | |
Hawaiian Electric Co. Subsidiary
Series 2009
07/01/39 | | | 6.500 | % | | | 5,250,000 | | | | 6,143,130 | | |
Hawaii State Department of Budget & Finance(a)
Refunding Revenue Bonds
Electric Co. & Subsidiary Project
Series 2003B (XLCA) AMT
12/01/22 | | | 5.000 | % | | | 12,500,000 | | | | 12,658,750 | | |
Hawaii State Department of Budget & Finance(g)
Refunding Revenue Bonds
Special Purpose-Kahala Nui
Series 2012
11/15/21 | | | 5.000 | % | | | 1,000,000 | | | | 1,104,330 | | |
| 11/15/27 | | | 5.000 | % | | | 1,400,000 | | | | 1,484,406 | | |
| 11/15/32 | | | 5.125 | % | | | 1,300,000 | | | | 1,377,233 | | |
| 11/15/37 | | | 5.250 | % | | | 1,945,000 | | | | 2,037,816 | | |
| Total | | | | | | | 39,900,663 | | |
| Idaho 0.4% | |
Idaho Health Facilities Authority
Refunding Revenue Bonds
IHC Hospitals, Inc.
Series 1992 Escrowed to Maturity
02/15/21 | | | 6.650 | % | | | 6,000,000 | | | | 8,434,980 | | |
Revenue Bonds
Trinity Health Group
Series 2008B
12/01/23 | | | 6.000 | % | | | 1,000,000 | | | | 1,201,520 | | |
| 12/01/33 | | | 6.250 | % | | | 6,000,000 | | | | 7,201,140 | | |
| Total | | | | | | | 16,837,640 | | |
| Illinois 8.5% | |
Chicago Board of Education
Certificate of Participation
Lease Certificates
Series 1992A (NPFGC)
01/01/15 | | | 6.250 | % | | | 9,955,000 | | | | 10,561,060 | | |
| 01/01/16 | | | 6.000 | % | | | 5,000,000 | | | | 5,808,300 | | |
| 01/01/20 | | | 6.000 | % | | | 8,000,000 | | | | 9,446,000 | | |
Unlimited General Obligation Refunding Bonds
Series 2005A (AMBAC)
12/01/22 | | | 5.500 | % | | | 4,750,000 | | | | 5,892,232 | | |
Chicago Board of Education(f)
Unlimited General Obligation Bonds
Capital Appreciation-School Reform
Series 1998B-1 (NPFGC/FGIC)
12/01/21 | | | 0.000 | % | | | 8,000,000 | | | | 5,914,720 | | |
| 12/01/22 | | | 0.000 | % | | | 25,200,000 | | | | 17,745,336 | | |
Municipal Bonds (continued)
Issue
Description | | Coupon
Rate | | Principal
Amount ($) | | Value ($) | |
City of Chicago Wastewater Transmission
Refunding Revenue Bonds
Capital Appreciation
Series 1998A (NPFGC)(f)
01/01/20 | | | 0.000 | % | | | 7,275,000 | | | | 5,816,362 | | |
City of Chicago
Limited General Obligation Refunding Bonds
Emergency Telephone System
Series 1999 (NPFGC/FGIC)
01/01/23 | | | 5.500 | % | | | 9,750,000 | | | | 11,732,467 | | |
Revenue Bonds
Asphalt Operating Services-Recovery Zone Facility
Series 2010
12/01/18 | | | 6.125 | % | | | 5,070,000 | | | | 5,407,814 | | |
City of Chicago(f)
Unlimited General Obligation Refunding Bonds
Capital Appreciation
Series 2009C
01/01/23 | | | 0.000 | % | | | 4,900,000 | | | | 3,303,776 | | |
| 01/01/25 | | | 0.000 | % | | | 2,000,000 | | | | 1,214,200 | | |
| 01/01/27 | | | 0.000 | % | | | 3,000,000 | | | | 1,638,420 | | |
Cook County High School District No. 209 Proviso Township
Limited General Obligation Bonds
Capital Appreciation
Series 2004 (AGM)
12/01/15 | | | 5.000 | % | | | 1,750,000 | | | | 1,930,285 | | |
Cook County School District No. 102 La Grange
Unlimited General Obligation Bonds
Capital Appreciation
Series 2001 (NPFGC/FGIC)(f)
12/01/20 | | | 0.000 | % | | | 3,065,000 | | | | 2,360,448 | | |
County of Champaign
Unlimited General Obligation Bonds
Public Safety Sales Tax
Series 1999 (NPFGC/FGIC)
01/01/20 | | | 8.250 | % | | | 1,015,000 | | | | 1,436,489 | | |
| 01/01/23 | | | 8.250 | % | | | 1,420,000 | | | | 2,131,392 | | |
County of Du Page
Unlimited General Obligation Refunding Bonds
Jail Project
Series 1993
01/01/21 | | | 5.600 | % | | | 2,565,000 | | | | 3,082,284 | | |
DeKalb County Community Unit School District No. 424 Genoa-Kingston
Unlimited General Obligation Bonds
Capital Appreciation
Series 2001 (AMBAC)(f)
01/01/21 | | | 0.000 | % | | | 2,675,000 | | | | 2,037,601 | | |
Illinois Finance Authority
Refunding Revenue Bonds
Commonwealth Edison Co.
Series 1994 (AMBAC/TCRS)
01/15/14 | | | 5.850 | % | | | 4,500,000 | | | | 4,773,015 | | |
The accompanying Notes to Financial Statements are an integral part of this statement.
Annual Report 2012
14
Columbia Tax-Exempt Fund
Portfolio of Investments (continued)
July 31, 2012
Municipal Bonds (continued)
Issue
Description | | Coupon
Rate | | Principal
Amount ($) | | Value ($) | |
Swedish Covenant
Series 2010A
08/15/38 | | | 6.000 | % | | | 12,505,000 | | | | 14,153,409 | | |
Uno Charter School
Series 2011A
10/01/41 | | | 7.125 | % | | | 3,000,000 | | | | 3,368,370 | | |
Revenue Bonds
CHF-Normal LLC-Illinois State University
Series 2011
04/01/43 | | | 7.000 | % | | | 5,550,000 | | | | 6,428,232 | | |
Hoosier Care Project
Series 1999A
06/01/34 | | | 7.125 | % | | | 2,110,000 | | | | 2,110,802 | | |
Northwestern Memorial Hospital
Series 2009A
08/15/30 | | | 5.750 | % | | | 2,000,000 | | | | 2,345,260 | | |
Series 2009B
08/15/30 | | | 5.750 | % | | | 10,000,000 | | | | 11,643,500 | | |
Riverside Health System
Series 2009
11/15/35 | | | 6.250 | % | | | 8,200,000 | | | | 9,541,766 | | |
Rush University Medical Center
Series 2009C
11/01/39 | | | 6.625 | % | | | 8,000,000 | | | | 9,883,040 | | |
Sherman Health System
Series 2007A
08/01/37 | | | 5.500 | % | | | 19,550,000 | | | | 21,050,462 | | |
Silver Cross & Medical Centers
Series 2009
08/15/38 | | | 6.875 | % | | | 39,300,000 | | | | 46,875,468 | | |
South Suburban
Series 1992 Escrowed to Maturity
02/15/18 | | | 7.000 | % | | | 2,215,000 | | | | 2,623,535 | | |
Illinois Finance Authority(d)(e)
Revenue Bonds
Sedgebrook, Inc. Facility
Series 2007A
11/15/11 | | | 5.500 | % | | | 1,000,000 | | | | 10 | | |
Illinois Finance Authority(f)
Subordinated Revenue Bonds
Regency
Series 1990-RMK Escrowed to Maturity
04/15/20 | | | 0.000 | % | | | 68,000,000 | | | | 58,569,080 | | |
Illinois Sports Facilities Authority
Revenue Bonds
State Tax Supported-Capital Appreciation
Series 2001 (AMBAC)(f)
06/15/18 | | | 0.000 | % | | | 4,000,000 | | | | 3,377,200 | | |
Lake County School District No. 56 Gurnee
Unlimited General Obligation Bonds
Series 1997 (NPFGC/FGIC)
01/01/17 | | | 9.000 | % | | | 8,840,000 | | | | 11,662,966 | | |
Municipal Bonds (continued)
Issue
Description | | Coupon
Rate | | Principal
Amount ($) | | Value ($) | |
Metropolitan Pier & Exposition Authority
Refunding Revenue Bonds
McCormick
Series 2010B-2
06/15/50 | | | 5.000 | % | | | 6,625,000 | | | | 7,165,931 | | |
Metropolitan Pier & Exposition Authority(f)
Revenue Bonds
McCormick Place Project
Series 1993 Escrowed to Maturity (NPFGC/FGIC)
06/15/16 | | | 0.000 | % | | | 1,115,000 | | | | 1,069,620 | | |
Unrefunded Revenue Bonds
McCormick Place Project
Series 1993 (NPFGC/FGIC)
06/15/16 | | | 0.000 | % | | | 2,635,000 | | | | 2,437,691 | | |
Metropolitan Water Reclamation District of Greater Chicago
Limited General Obligation Refunding Bonds
Series 2007C
12/01/33 | | | 5.250 | % | | | 13,210,000 | | | | 17,397,306 | | |
Railsplitter Tobacco Settlement Authority
Revenue Bonds
Series 2010
06/01/28 | | | 6.000 | % | | | 15,000,000 | | | | 17,455,650 | | |
Regional Transportation Authority
Revenue Bonds
Series 1994C (NPFGC/FGIC)
06/01/20 | | | 7.750 | % | | | 5,000,000 | | | | 6,239,400 | | |
Series 2002A (NPFGC)
07/01/31 | | | 6.000 | % | | | 5,400,000 | | | | 7,229,142 | | |
State of Illinois
Revenue Bonds
1st Series 2002 (NPFGC/FGIC)
06/15/23 | | | 6.000 | % | | | 4,000,000 | | | | 5,342,600 | | |
Series 2005 (AGM)
06/15/28 | | | 5.000 | % | | | 2,000,000 | | | | 2,171,880 | | |
Unlimited General Obligation Bonds
1st Series 2001 (NPFGC/FGIC)
11/01/26 | | | 6.000 | % | | | 3,000,000 | | | | 3,687,720 | | |
Series 2004A
03/01/34 | | | 5.000 | % | | | 3,000,000 | | | | 3,051,390 | | |
Series 2006
01/01/31 | | | 5.500 | % | | | 7,985,000 | | | | 9,652,188 | | |
Series 2012
03/01/35 | | | 5.000 | % | | | 2,725,000 | | | | 2,951,339 | | |
| 03/01/36 | | | 5.000 | % | | | 2,000,000 | | | | 2,162,820 | | |
Unlimited General Obligation Refunding Bonds
Series 2012
08/01/25 | | | 5.000 | % | | | 3,100,000 | | | | 3,472,837 | | |
Village of Glendale Heights
Refunding Revenue Bonds
Glendale Heights Project
Series 1985B Escrowed to Maturity
12/01/15 | | | 7.100 | % | | | 770,000 | | | | 863,324 | | |
The accompanying Notes to Financial Statements are an integral part of this statement.
Annual Report 2012
15
Columbia Tax-Exempt Fund
Portfolio of Investments (continued)
July 31, 2012
Municipal Bonds (continued)
Issue
Description | | Coupon
Rate | | Principal
Amount ($) | | Value ($) | |
Will County Community Unit School District No. 365-Valley View
Unlimited General Obligation Bonds
Series 1997B Escrowed to Maturity (AGM)(f)
11/01/16 | | | 0.000 | % | | | 3,165,000 | | | | 3,043,021 | | |
| Total | | | | | | | 401,259,160 | | |
| Indiana 2.1% | |
County of Jasper
Refunding Revenue Bonds
Various-Northern Indiana Public Services
Series 1994C (NPFGC)
04/01/19 | | | 5.850 | % | | | 3,000,000 | | | | 3,543,000 | | |
Series 2003-RMKT (AMBAC)
07/01/17 | | | 5.700 | % | | | 2,000,000 | | | | 2,304,320 | | |
Crown Point Multi School Building Corp.
Revenue Bonds
First Mortgage
Series 2000 (NPFGC)(f)
01/15/19 | | | 0.000 | % | | | 8,165,000 | | | | 6,769,275 | | |
Indiana Finance Authority
Refunding Revenue Bonds
Series 2007A (NPFGC/FGIC)
06/01/29 | | | 4.500 | % | | | 10,000,000 | | | | 10,971,500 | | |
Sisters of St. Francis Health
Series 2008
11/01/32 | | | 5.375 | % | | | 4,000,000 | | | | 4,441,240 | | |
Revenue Bonds
1st Lien-CWA Authority
Series 2011A
10/01/31 | | | 5.250 | % | | | 8,335,000 | | | | 9,857,221 | | |
BHI Senior Living
Series 2011
11/15/31 | | | 5.500 | % | | | 1,175,000 | | | | 1,278,200 | | |
| 11/15/41 | | | 5.750 | % | | | 5,655,000 | | | | 6,195,392 | | |
Parkview Health System
Series 2009A
05/01/31 | | | 5.750 | % | | | 6,500,000 | | | | 7,485,920 | | |
State Revolving Fund Program
Series 2006A
02/01/25 | | | 5.000 | % | | | 8,000,000 | | | | 9,193,600 | | |
Indiana Health & Educational Facilities Financing Authority
Refunding Revenue Bonds
Clarian Health Obligation Group
Series 2006B
02/15/33 | | | 5.000 | % | | | 6,950,000 | | | | 7,398,900 | | |
Revenue Bonds
Clarian Health Obligation Group
Series 2006A
02/15/36 | | | 5.000 | % | | | 4,375,000 | | | | 4,607,969 | | |
Indiana Health Facility Financing Authority
Revenue Bonds
Hoosier Care Project
Series 1999A
06/01/34 | | | 7.125 | % | | | 10,940,000 | | | | 10,944,157 | | |
Municipal Bonds (continued)
Issue
Description | | Coupon
Rate | | Principal
Amount ($) | | Value ($) | |
Indiana State Office Building Commission
Revenue Bonds
Womens Prison
Series 1995B (AMBAC)
07/01/16 | | | 6.250 | % | | | 8,000,000 | | | | 8,891,360 | | |
Indianapolis Airport Authority
Revenue Bonds
Special Facilities-United Air Lines Project
Series 1995A AMT(a)(d)(e)
11/15/31 | | | 6.500 | % | | | 1,052,258 | | | | 13,143 | | |
Purdue University
Revenue Bonds
Student Fees
Series 2009X
07/01/23 | | | 5.250 | % | | | 1,000,000 | | | | 1,215,070 | | |
Vigo County Hospital Authority
Revenue Bonds
Union Hospital, Inc.
Series 2007(b)
09/01/37 | | | 5.700 | % | | | 3,950,000 | | | | 4,068,658 | | |
| Total | | | | | | | 99,178,925 | | |
| Iowa 0.7% | |
City of Ames
Revenue Bonds
Mary Greely Medical Center
Series 2011
06/15/36 | | | 5.250 | % | | | 6,000,000 | | | | 6,489,300 | | |
City of Marion
Refunding Revenue Bonds
1st Mortgage
Series 2003
01/01/29 | | | 8.000 | % | | | 152,000 | | | | 157,426 | | |
Iowa Finance Authority
Refunding Revenue Bonds
Correctional Facility Program
Series 2002 (NPFGC)
06/15/13 | | | 5.375 | % | | | 6,000,000 | | | | 6,262,080 | | |
Revenue Bonds
Care Initiatives Project
Series 1998B
07/01/28 | | | 5.750 | % | | | 4,500,000 | | | | 4,504,095 | | |
Iowa Student Loan Liquidity Corp.(a)
Senior Revenue Bonds
Series 2011A-2 AMT
12/01/26 | | | 5.600 | % | | | 8,000,000 | | | | 8,974,800 | | |
| 12/01/27 | | | 5.700 | % | | | 5,500,000 | | | | 6,174,850 | | |
| Total | | | | | | | 32,562,551 | | |
The accompanying Notes to Financial Statements are an integral part of this statement.
Annual Report 2012
16
Columbia Tax-Exempt Fund
Portfolio of Investments (continued)
July 31, 2012
Municipal Bonds (continued)
Issue
Description | | Coupon
Rate | | Principal
Amount ($) | | Value ($) | |
| Kansas 0.7% | |
Wichita Airport Authority
Special Revenue Bonds
Cessna Citation Service Center
Series 2002A AMT(a)
06/15/32 | | | 6.250 | % | | | 5,000,000 | | | | 5,019,200 | | |
Wyandotte County-Kansas City Unified Government
Revenue Bonds
Capital Appreciation Sales Tax Subordinated Lien
Series 2010(f)
06/01/21 | | | 0.000 | % | | | 41,525,000 | | | | 28,066,332 | | |
| Total | | | | | | | 33,085,532 | | |
| Kentucky 2.0% | |
County of Ohio
Refunding Revenue Bonds
Big Rivers Electric Corp. Project
Series 2010A
07/15/31 | | | 6.000 | % | | | 24,870,000 | | | | 28,632,582 | | |
Kentucky Economic Development Finance Authority
Refunding Revenue Bonds
Owensboro Medical Health
Series 2010B
03/01/40 | | | 6.375 | % | | | 5,800,000 | | | | 6,824,802 | | |
Revenue Bonds
Kings Daughters Medical
Series 2010
02/01/40 | | | 5.000 | % | | | 3,300,000 | | | | 3,523,014 | | |
Louisville Arena
Subordinated Series 2008A-1 (AGM)
12/01/33 | | | 6.000 | % | | | 3,200,000 | | | | 3,563,264 | | |
| 12/01/38 | | | 6.000 | % | | | 2,850,000 | | | | 3,145,317 | | |
Owensboro Medical Health System
Series 2010A
03/01/45 | | | 6.500 | % | | | 14,550,000 | | | | 17,243,205 | | |
Louisville/Jefferson County Metropolitan Government
Prerefunded 02/01/18 Revenue Bonds
Jewish Hospital St. Mary's Healthcare
Series 2008
02/01/27 | | | 5.750 | % | | | 24,000,000 | | | | 30,143,040 | | |
| Total | | | | | | | 93,075,224 | | |
| Louisiana 3.0% | |
City of New Orleans
Unlimited General Obligation Refunding Bonds
Capital Appreciation
Series 1991 (AMBAC)(f)
09/01/12 | | | 0.000 | % | | | 6,250,000 | | | | 6,242,164 | | |
East Baton Rouge Mortgage Finance Authority
Refunding Revenue Bonds
Series 1993B (GNMA/FNMA)
10/01/25 | | | 5.400 | % | | | 260,000 | | | | 260,471 | | |
Municipal Bonds (continued)
Issue
Description | | Coupon
Rate | | Principal
Amount ($) | | Value ($) | |
Jefferson Sales Tax District
Refunding Revenue Bonds
Series 2009B
12/01/22 | | | 4.500 | % | | | 1,000,000 | | | | 1,140,270 | | |
Revenue Bonds
Series 2007B (AMBAC)
12/01/20 | | | 5.250 | % | | | 1,000,000 | | | | 1,159,710 | | |
Lafayette Consolidated Government
Refunding Revenue Bonds
Series 2006C (AMBAC)
05/01/21 | | | 5.000 | % | | | 1,000,000 | | | | 1,110,780 | | |
Louisiana Housing Finance Agency
Revenue Bonds
Homeownership Program
Series 2008A (GNMA/FNMA/FHLMC)
12/01/23 | | | 4.875 | % | | | 685,000 | | | | 758,261 | | |
Louisiana Local Government Environmental Facilities & Community Development Authority
Revenue Bonds
Westlake Chemical Corp.
Series 2010A-2
11/01/35 | | | 6.500 | % | | | 6,250,000 | | | | 7,240,250 | | |
Louisiana Public Facilities Authority
Refunding Revenue Bonds
Tulane University Project
Series 2007A-1 (NPFGC)
02/15/26 | | | 5.000 | % | | | 1,000,000 | | | | 1,095,650 | | |
Revenue Bonds
Hurricane Recovery Program
Series 2007 (AMBAC)
06/01/20 | | | 5.000 | % | | | 1,000,000 | | | | 1,105,440 | | |
Louisiana State Citizens Property Insurance Corp.
Revenue Bonds
Series 2006B (AMBAC)
06/01/16 | | | 5.000 | % | | | 9,500,000 | | | | 10,676,100 | | |
Series 2009C-4
06/01/24 | | | 6.125 | % | | | 1,000,000 | | | | 1,048,530 | | |
New Orleans Aviation Board
Revenue Bonds
Consolidated Rental Car
Series 2009A
01/01/30 | | | 6.250 | % | | | 5,250,000 | | | | 5,871,548 | | |
| 01/01/40 | | | 6.500 | % | | | 20,400,000 | | | | 22,771,500 | | |
Parish of St. Charles
Revenue Bonds
Valero Energy Corp.
Series 2010
12/01/40 | | | 4.000 | % | | | 7,900,000 | | | | 8,357,489 | | |
Parish of St. John the Baptist
Revenue Bonds
Marathon Oil Corp.
Series 2007A
06/01/37 | | | 5.125 | % | | | 18,600,000 | | | | 19,753,758 | | |
The accompanying Notes to Financial Statements are an integral part of this statement.
Annual Report 2012
17
Columbia Tax-Exempt Fund
Portfolio of Investments (continued)
July 31, 2012
Municipal Bonds (continued)
Issue
Description | | Coupon
Rate | | Principal
Amount ($) | | Value ($) | |
Port New Orleans Board of Commissioners
Revenue Bonds
Series 2002 (NPFGC/FGIC) AMT(a)
04/01/32 | | | 5.000 | % | | | 1,250,000 | | | | 1,255,700 | | |
St. Tammany Parish Wide School District No. 12
Unlimited General Obligation Bonds
Series 2008
03/01/23 | | | 4.500 | % | | | 1,000,000 | | | | 1,122,950 | | |
Tobacco Settlement Financing Corp.
Asset-Backed Revenue Bonds
Series 2001B
05/15/30 | | | 5.500 | % | | | 17,555,000 | | | | 17,905,924 | �� | |
| 05/15/39 | | | 5.875 | % | | | 31,270,000 | | | | 31,895,087 | | |
| Total | | | | | | | 140,771,582 | | |
| Maine 0.1% | |
Maine State Housing Authority
Revenue Bonds
Series 2003A-2 AMT(a)
11/15/32 | | | 5.000 | % | | | 3,000,000 | | | | 3,003,300 | | |
| Maryland 0.7% | |
City of Brunswick
Special Tax Bonds
Brunswick Crossing Special Taxing
Series 2006
07/01/36 | | | 5.500 | % | | | 6,804,000 | | | | 5,976,021 | | |
County of Baltimore
Revenue Bonds
Oak Crest Village, Inc. Facility
Series 2007A
01/01/37 | | | 5.000 | % | | | 5,000,000 | | | | 5,141,300 | | |
Maryland Economic Development Corp.
Refunding Revenue Bonds
CNX Marine Terminals, Inc.
Series 2010
09/01/25 | | | 5.750 | % | | | 4,000,000 | | | | 4,329,880 | | |
Revenue Bonds
Salisbury University Project
Series 2012
06/01/30 | | | 5.000 | % | | | 400,000 | | | | 425,176 | | |
University of Maryland College Park Projects
Series 2008
06/01/33 | | | 5.750 | % | | | 1,600,000 | | | | 1,751,264 | | |
Senior Revenue Bonds
Towson University Project
Series 2012
07/01/29 | | | 5.000 | % | | | 650,000 | | | | 704,418 | | |
Maryland Health & Higher Educational Facilities Authority
Revenue Bonds
Anne Arundel Health System
Series 2009A
07/01/39 | | | 6.750 | % | | | 5,000,000 | | | | 6,051,950 | | |
Municipal Bonds (continued)
Issue
Description | | Coupon
Rate | | Principal
Amount ($) | | Value ($) | |
University of Maryland Medical System
Series 2005 (AMBAC)
07/01/28 | | | 5.250 | % | | | 3,000,000 | | | | 3,353,040 | | |
Washington County Hospital
Series 2008
01/01/33 | | | 5.750 | % | | | 3,495,000 | | | | 3,749,646 | | |
Morgan State University
Revenue Bonds
Series 2003A (NPFGC/FGIC)
07/01/32 | | | 5.000 | % | | | 450,000 | | | | 464,323 | | |
| Total | | | | | | | 31,947,018 | | |
| Massachusetts 5.6% | |
Boston Industrial Development Financing Authority
Revenue Bonds
Crosstown Center Project
Senior Series 2002 AMT(a)(d)
09/01/35 | | | 6.500 | % | | | 2,845,000 | | | | 2,216,312 | | |
Boston Water & Sewer Commission
Revenue Bonds
Senior Series 2004A
11/01/22 | | | 5.000 | % | | | 5,435,000 | | | | 5,998,283 | | |
City of Newton
Limited General Obligation Bonds
State Qualified School
Series 2009A
04/01/25 | | | 4.125 | % | | | 2,295,000 | | | | 2,583,114 | | |
Commonwealth of Massachusetts
Limited General Obligation Refunding Bonds
Series 2004B
08/01/28 | | | 5.250 | % | | | 3,000,000 | | | | 3,993,210 | | |
Refunding Revenue Bonds
Series 2005 (NPFGC/FGIC)
01/01/27 | | | 5.500 | % | | | 4,500,000 | | | | 5,675,760 | | |
| 01/01/28 | | | 5.500 | % | | | 7,500,000 | | | | 9,418,725 | | |
Martha's Vineyard Land Bank
Revenue Bonds
Series 2002 (AMBAC)
05/01/32 | | | 5.000 | % | | | 3,000,000 | | | | 3,081,930 | | |
Massachusetts Bay Transportation Authority
Refunding Revenue Bonds
General Transportation System
Series 1994C (AGM)
03/01/19 | | | 7.000 | % | | | 2,500,000 | | | | 3,017,500 | | |
Revenue Bonds
Senior Series 2005B (NPFGC)
07/01/26 | | | 5.500 | % | | | 1,500,000 | | | | 2,020,875 | | |
| 07/01/29 | | | 5.500 | % | | | 2,000,000 | | | | 2,723,620 | | |
Series 2005A
07/01/24 | | | 5.000 | % | | | 1,000,000 | | | | 1,284,220 | | |
The accompanying Notes to Financial Statements are an integral part of this statement.
Annual Report 2012
18
Columbia Tax-Exempt Fund
Portfolio of Investments (continued)
July 31, 2012
Municipal Bonds (continued)
Issue
Description | | Coupon
Rate | | Principal
Amount ($) | | Value ($) | |
Massachusetts Department of Transportation(f)
Revenue Bonds
Capital Appreciation
Senior Series 1997C (NPFGC)
01/01/18 | | | 0.000 | % | | | 4,700,000 | | | | 4,185,914 | | |
| 01/01/20 | | | 0.000 | % | | | 17,000,000 | | | | 13,974,510 | | |
Massachusetts Development Finance Agency
Revenue Bonds
Adventcare Project
Series 2007A
10/15/28 | | | 6.650 | % | | | 5,000,000 | | | | 5,291,650 | | |
Boston College
Series 2009Q-2
07/01/29 | | | 5.000 | % | | | 1,455,000 | | | | 1,697,767 | | |
Boston University
Series 1999P
05/15/59 | | | 6.000 | % | | | 2,325,000 | | | | 2,912,690 | | |
Linden Ponds, Inc. Facility
Series 2011A-1
11/15/13 | | | 6.250 | % | | | 837,195 | | | | 825,751 | | |
Series 2011A-2
11/15/46 | | | 5.500 | % | | | 41,404 | | | | 25,735 | | |
Massachusetts Development Finance Agency(d)
Revenue Bonds
Groves-Lincoln
Series 2009A
06/01/39 | | | 7.750 | % | | | 2,250,000 | | | | 1,174,837 | | |
Massachusetts Development Finance Agency(d)(f)
Revenue Bonds
Linden Ponds, Inc. Facility
Series 2011B
11/15/56 | | | 0.000 | % | | | 205,938 | | | | 1,071 | | |
Massachusetts Educational Financing Authority(a)
Revenue Bonds
Issue I
Series 2010B AMT
01/01/31 | | | 5.700 | % | | | 7,445,000 | | | | 7,944,783 | | |
Series 2008H (AGM) AMT
01/01/30 | | | 6.350 | % | | | 7,665,000 | | | | 8,565,791 | | |
Series 2012J AMT
07/01/25 | | | 4.625 | % | | | 15,000,000 | | | | 15,492,150 | | |
Massachusetts Health & Educational Facilities Authority
Revenue Bonds
Berklee College of Music
Series 2007A
10/01/21 | | | 5.000 | % | | | 1,500,000 | | | | 1,728,645 | | |
Boston College
Series 2008M-2
06/01/35 | | | 5.500 | % | | | 19,500,000 | | | | 26,920,530 | | |
Caregroup
Series 1998B-2 (NPFGC)
02/01/28 | | | 5.375 | % | | | 1,380,000 | | | | 1,548,277 | | |
Series 2008E-1
07/01/33 | | | 5.125 | % | | | 1,000,000 | | | | 1,059,260 | | |
Municipal Bonds (continued)
Issue
Description | | Coupon
Rate | | Principal
Amount ($) | | Value ($) | |
Harvard University
Series 1991N
04/01/20 | | | 6.250 | % | | | 2,000,000 | | | | 2,720,660 | | |
Massachusetts Institute of Technology
Series 2002K
07/01/22 | | | 5.500 | % | | | 8,000,000 | | | | 10,846,000 | | |
Series 2004M
07/01/25 | | | 5.250 | % | | | 500,000 | | | | 678,040 | | |
Series 2009O
07/01/26 | | | 5.000 | % | | | 11,500,000 | | | | 13,606,110 | | |
Milford Regional Medical
Series 2007E
07/15/22 | | | 5.000 | % | | | 1,250,000 | | | | 1,299,450 | | |
| 07/15/32 | | | 5.000 | % | | | 4,720,000 | | | | 4,752,804 | | |
| 07/15/37 | | | 5.000 | % | | | 500,000 | | | | 500,420 | | |
Partners Healthcare
Series 2010J-1
07/01/34 | | | 5.000 | % | | | 9,900,000 | | | | 10,945,836 | | |
Springfield College
Series 2010
10/15/40 | | | 5.625 | % | | | 4,500,000 | | | | 4,860,000 | | |
Tufts University
Series 2009M
02/15/28 | | | 5.500 | % | | | 1,000,000 | | | | 1,342,810 | | |
Unrefunded Revenue Bonds
South Shore
Series 1999F
07/01/29 | | | 5.750 | % | | | 1,845,000 | | | | 1,847,509 | | |
Massachusetts Housing Finance Agency
Revenue Bonds
Single Family
Series 2008-139
12/01/28 | | | 5.125 | % | | | 1,000,000 | | | | 1,095,800 | | |
Massachusetts Housing Finance Agency(a)
Revenue Bonds
Rental Housing
Series 2004A (AGM) AMT
07/01/25 | | | 5.250 | % | | | 10,000,000 | | | | 10,226,400 | | |
Series 2007D AMT
06/01/40 | | | 4.850 | % | | | 750,000 | | | | 769,455 | | |
Single Family
Series 2006-122 AMT
12/01/31 | | | 4.850 | % | | | 5,140,000 | | | | 5,249,585 | | |
Massachusetts School Building Authority
Revenue Bonds
Series 2005A (AGM)
08/15/23 | | | 5.000 | % | | | 6,000,000 | | | | 6,826,920 | | |
Massachusetts State College Building Authority
Refunding Revenue Bonds
Senior Series 1994A
05/01/14 | | | 7.500 | % | | | 2,420,000 | | | | 2,610,672 | | |
Massachusetts State College Building Authority(f)
Revenue Bonds
Capital Appreciation
Senior Series 1999A Escrowed to Maturity (NPFGC)
05/01/19 | | | 0.000 | % | | | 7,710,000 | | | | 6,900,990 | | |
The accompanying Notes to Financial Statements are an integral part of this statement.
Annual Report 2012
19
Columbia Tax-Exempt Fund
Portfolio of Investments (continued)
July 31, 2012
Municipal Bonds (continued)
Issue
Description | | Coupon
Rate | | Principal
Amount ($) | | Value ($) | |
Massachusetts State Water Pollution Abatement
Revenue Bonds
MWRA Program
Subordinated Series 1999A
08/01/17 | | | 6.000 | % | | | 10,000,000 | | | | 12,531,400 | | |
Unrefunded Revenue Bonds
Pool Program
Series 2004-10
08/01/34 | | | 5.000 | % | | | 145,000 | | | | 155,597 | | |
Massachusetts Water Resources Authority
Refunding Revenue Bonds
Series 2005A (NPFGC)
08/01/24 | | | 5.250 | % | | | 3,000,000 | | | | 3,554,610 | | |
Revenue Bonds
Series 1992A Escrowed to Maturity
07/15/19 | | | 6.500 | % | | | 3,500,000 | | | | 4,231,990 | | |
Series 1992A Escrowed to Maturity (FGIC)
07/15/19 | | | 6.500 | % | | | 7,000,000 | | | | 8,428,490 | | |
Series 2002J (AGM)
08/01/21 | | | 5.500 | % | | | 5,000,000 | | | | 6,539,500 | | |
Series 2006A (AMBAC)
08/01/24 | | | 5.000 | % | | | 2,170,000 | | | | 2,555,153 | | |
Town of Braintree
Limited General Obligation Bonds
Municipal Purpose Loan
Series 2009
05/15/27 | | | 5.000 | % | | | 2,000,000 | | | | 2,379,900 | | |
| Total | | | | | | | 262,819,011 | | |
| Michigan 1.8% | |
City of Detroit Water Supply System
Revenue Bonds
Senior Lien
Series 2003A (NPFGC)
07/01/34 | | | 5.000 | % | | | 1,375,000 | | | | 1,381,298 | | |
Series 2005A (NPFGC/FGIC)
07/01/27 | | | 5.000 | % | | | 1,290,000 | | | | 1,333,034 | | |
Detroit City School District
Unlimited General Obligation Refunding Bonds
School Building & Site Improvement
Series 2005A (AGM) (Qualified School Bond Loan Fund)
05/01/17 | | | 5.000 | % | | | 2,500,000 | | | | 2,726,600 | | |
| 05/01/30 | | | 5.250 | % | | | 10,000,000 | | | | 12,298,600 | | |
Detroit Water and Sewerage Department
Refunding Revenue Bonds
Senior Lien
Series 2012A
07/01/39 | | | 5.250 | % | | | 11,925,000 | | | | 12,575,032 | | |
Goodrich Area School District
Unrefunded Unlimited General Obligation Bonds
Series 2003B (Qualified School Bond Loan Fund)
05/01/27 | | | 5.000 | % | | | 495,000 | | | | 508,370 | | |
Municipal Bonds (continued)
Issue
Description | | Coupon
Rate | | Principal
Amount ($) | | Value ($) | |
Grand Traverse Academy
Refunding Revenue Bonds
Series 2007
11/01/17 | | | 5.000 | % | | | 390,000 | | | | 391,934 | | |
| 11/01/22 | | | 5.000 | % | | | 750,000 | | | | 721,875 | | |
| 11/01/32 | | | 4.750 | % | | | 1,170,000 | | | | 1,008,376 | | |
Kalamazoo Public Schools
Unlimited General Obligation Refunding Bonds
Building & Site
Series 2006 (AGM)
05/01/24 | | | 5.000 | % | | | 1,285,000 | | | | 1,450,431 | | |
Michigan Higher Education Facilities Authority
Prerefunded 12/01/17 Limited Obligation Revenue Bonds
Kalamazoo College Project
Series 2007
12/01/33 | | | 5.000 | % | | | 250,000 | | | | 304,420 | | |
Michigan Higher Education Student Loan Authority(a)
Revenue Bonds
Series 2006 XVII-Q (AMBAC) AMT
03/01/26 | | | 4.950 | % | | | 200,000 | | | | 206,280 | | |
| 03/01/31 | | | 5.000 | % | | | 5,850,000 | | | | 6,028,132 | | |
Michigan Municipal Bond Authority
Revenue Bonds
Drinking Water State Revolving Fund
Series 2004
10/01/22 | | | 5.000 | % | | | 3,850,000 | | | | 4,199,657 | | |
Michigan Strategic Fund
Refunding Revenue Bonds
Collateral Detroit Fund-Pollution
Series 1991BB (AMBAC)
05/01/21 | | | 7.000 | % | | | 2,505,000 | | | | 3,299,686 | | |
Michigan Sugar Co.-Caro Project
Series 1998B
11/01/25 | | | 6.450 | % | | | 3,500,000 | | | | 3,278,590 | | |
NSF International Project
Series 2004
08/01/26 | | | 5.250 | % | | | 600,000 | | | | 608,220 | | |
Michigan Strategic Fund(a)
Revenue Bonds
Republic Services
Series 2001 AMT
04/01/14 | | | 4.250 | % | | | 1,885,000 | | | | 1,935,820 | | |
Michigan Strategic Fund(a)(d)
Refunding Revenue Bonds
Michigan Sugar Co.-Carollton
Series 1998C AMT
11/01/25 | | | 6.550 | % | | | 4,250,000 | | | | 4,062,703 | | |
Paw Paw Public Schools
Unlimited General Obligation Refunding Bonds
Series 1998 (NPFGC/FGIC) (Qualified School Board Loan Fund)
05/01/25 | | | 5.000 | % | | | 1,020,000 | | | | 1,303,703 | | |
The accompanying Notes to Financial Statements are an integral part of this statement.
Annual Report 2012
20
Columbia Tax-Exempt Fund
Portfolio of Investments (continued)
July 31, 2012
Municipal Bonds (continued)
Issue
Description | | Coupon
Rate | | Principal
Amount ($) | | Value ($) | |
Roseville Community Schools
Unlimited General Obligation Refunding Bonds
School Building & Site
Series 2006 (AGM) (Qualified School Bond Loan Fund)
05/01/23 | | | 5.000 | % | | | 3,100,000 | | | | 3,397,445 | | |
St. Johns Public Schools
Unlimited General Obligation Refunding Bonds
Series 1998 (NPFGC/FGIC) (Qualified School Bond Loan Fund)
05/01/25 | | | 5.100 | % | | | 1,790,000 | | | | 2,202,201 | | |
State of Michigan
Refunding Revenue Bonds
Series 2005 (AGM)
05/15/22 | | | 5.250 | % | | | 2,000,000 | | | | 2,533,900 | | |
Series 2006 (AGM)
05/15/24 | | | 5.000 | % | | | 2,000,000 | | | | 2,271,720 | | |
State of Michigan(f)
Certificate of Participation
Series 2000 Escrowed to Maturity (AMBAC)
06/01/21 | | | 0.000 | % | | | 6,000,000 | | | | 4,988,520 | | |
Troy School District
Unlimited General Obligation Bonds
School Building & Site
Series 2006 (NPFGC) (Qualified School Board Loan Fund)
05/01/24 | | | 5.000 | % | | | 5,000,000 | | | | 5,516,500 | | |
Wayne County Airport Authority
Revenue Bonds
Detroit Metropolitan Airport
Series 2005 (NPFGC) AMT(a)
12/01/19 | | | 4.750 | % | | | 3,750,000 | | | | 4,015,275 | | |
Williamston Community School District
Unlimited General Obligation Bonds
Series 1996 (NPFGC) (Qualified School Bond Loan Fund)
05/01/25 | | | 5.500 | % | | | 1,000,000 | | | | 1,242,560 | | |
| Total | | | | | | | 85,790,882 | | |
| Minnesota 3.4% | |
City of Minneapolis MN/St Paul Housing & Redevelopment Authority
Revenue Bonds
Health Partners Obligation Group Project
Series 2003
12/01/17 | | | 6.000 | % | | | 1,650,000 | | | | 1,733,804 | | |
City of Minneapolis
Revenue Bonds
Fairview Health Services
Series 2008A
11/15/32 | | | 6.750 | % | | | 7,500,000 | | | | 8,967,600 | | |
City of St. Louis Park
Refunding Revenue Bonds
Park Nicollet Health Services
Series 2009
07/01/39 | | | 5.750 | % | | | 16,825,000 | | | | 18,912,309 | | |
Municipal Bonds (continued)
Issue
Description | | Coupon
Rate | | Principal
Amount ($) | | Value ($) | |
Revenue Bonds
Park Nicollet Health Services
Series 2008C
07/01/23 | | | 5.500 | % | | | 22,775,000 | | | | 25,649,433 | | |
| 07/01/30 | | | 5.750 | % | | | 3,200,000 | | | | 3,594,400 | | |
County of Meeker
Revenue Bonds
Memorial Hospital Project
Series 2007
11/01/37 | | | 5.750 | % | | | 1,750,000 | | | | 1,853,653 | | |
Perham Hospital District
Revenue Bonds
Perham Memorial Hospital & Home
Series 2010
03/01/35 | | | 6.350 | % | | | 4,000,000 | | | | 4,470,800 | | |
| 03/01/40 | | | 6.500 | % | | | 2,800,000 | | | | 3,123,932 | | |
Southern Minnesota Municipal Power Agency(f)
Revenue Bonds
Capital Appreciation
Series 1994A (NPFGC)
01/01/22 | | | 0.000 | % | | | 27,500,000 | | | | 20,911,000 | | |
| 01/01/23 | | | 0.000 | % | | | 26,500,000 | | | | 19,313,465 | | |
| 01/01/25 | | | 0.000 | % | | | 17,500,000 | | | | 11,627,175 | | |
St. Paul Housing & Redevelopment Authority
Revenue Bonds
HealthPartners Obligation Group Project
Series 2006
05/15/36 | | | 5.250 | % | | | 4,550,000 | | | | 4,735,412 | | |
Healtheast Project
Series 2005
11/15/25 | | | 6.000 | % | | | 3,500,000 | | | | 3,679,305 | | |
| 11/15/30 | | | 6.000 | % | | | 10,000,000 | | | | 10,465,500 | | |
| 11/15/35 | | | 6.000 | % | | | 11,500,000 | | | | 11,963,910 | | |
St. Paul Port Authority
Revenue Bonds
Office Building at Cedar Street
Series 2003-12
12/01/23 | | | 5.000 | % | | | 2,540,000 | | | | 2,684,526 | | |
Tobacco Securitization Authority
Refunding Revenue Bonds
Tobacco Settlement
Series 2011B
03/01/31 | | | 5.250 | % | | | 5,600,000 | | | | 6,299,608 | | |
University of Minnesota
Series 1996A Escrowed to Maturity
Revenue Bonds
07/01/21 | | | 5.500 | % | | | 1,000,000 | | | | 1,255,130 | | |
Western Minnesota Municipal Power Agency
Revenue Bonds
Series 1983 Escrowed to Maturity (NPFGC)
01/01/16 | | | 9.750 | % | | | 1,000,000 | | | | 1,254,920 | | |
| Total | | | | | | | 162,495,882 | | |
The accompanying Notes to Financial Statements are an integral part of this statement.
Annual Report 2012
21
Columbia Tax-Exempt Fund
Portfolio of Investments (continued)
July 31, 2012
Municipal Bonds (continued)
Issue
Description | | Coupon
Rate | | Principal
Amount ($) | | Value ($) | |
| Mississippi 0.5% | |
County of Lowndes
Refunding Revenue Bonds
Weyerhaeuser Co. Project
Series 1992A
04/01/22 | | | 6.800 | % | | | 2,470,000 | | | | 2,855,320 | | |
Harrison County Wastewater Management District
Refunding Revenue Bonds
Wastewater Treatment Facility
Series 1986 Escrowed to Maturity
02/01/15 | | | 5.000 | % | | | 4,250,000 | | | | 4,611,973 | | |
Medical Center Educational Building Corp.
Refunding Revenue Bonds
University of Mississippi Medical Center
Series 1998B (AMBAC)
12/01/23 | | | 5.500 | % | | | 5,300,000 | | | | 6,385,440 | | |
Mississippi Business Finance Corp.
Revenue Bonds
Series 2009A
05/01/24 | | | 4.700 | % | | | 6,640,000 | | | | 7,238,397 | | |
Rankin County Five Lakes Utility District
Series 1994(d)
07/15/37 | | | 7.000 | % | | | 465,000 | | | | 460,108 | | |
| Total | | | | | | | 21,551,238 | | |
| Missouri 1.2% | |
City of Manchester
Refunding Tax Allocation Bonds
Highway 141/Manchester Road Project
Series 2010
11/01/25 | | | 6.000 | % | | | 2,895,000 | | | | 3,116,902 | | |
| 11/01/39 | | | 6.875 | % | | | 1,500,000 | | | | 1,617,135 | | |
City of St Louis Airport
Refunding Revenue Bonds
Lambert International Airport
Series 2007A (AGM)
07/01/23 | | | 5.000 | % | | | 1,000,000 | | | | 1,085,530 | | |
County of Boone
Revenue Bonds
Boone Hospital Center
Series 2008
08/01/28 | | | 5.750 | % | | | 500,000 | | | | 554,135 | | |
Kansas City Metropolitan Community Colleges Building Corp.
Refunding Revenue Bonds
Junior College Improvement and Leasehold
Series 2006 (NPFGC/FGIC)
07/01/17 | | | 5.000 | % | | | 1,000,000 | | | | 1,147,640 | | |
Kirkwood Industrial Development Authority
Revenue Bonds
Aberdeen Heights
Series 2010A
05/15/39 | | | 8.250 | % | | | 12,000,000 | | | | 14,411,880 | | |
Municipal Bonds (continued)
Issue
Description | | Coupon
Rate | | Principal
Amount ($) | | Value ($) | |
Metropolitan St. Louis Sewer District
Revenue Bonds
Series 2004A (NPFGC)
05/01/24 | | | 5.000 | % | | | 2,800,000 | | | | 2,999,864 | | |
Missouri Development Finance Board
Revenue Bonds
Procter & Gamble Paper Products
Series 1999 AMT(a)
03/15/29 | | | 5.200 | % | | | 6,385,000 | | | | 7,945,941 | | |
Missouri Joint Municipal Electric Utility Commission
Revenue Bonds
Plum Point Project
Series 2006 (NPFGC)
01/01/20 | | | 5.000 | % | | | 1,500,000 | | | | 1,607,280 | | |
Missouri State Health & Educational Facilities Authority
Refunding Revenue Bonds
Lester E. Cox Medical Center
Series 1993I (NPFGC)
06/01/15 | | | 5.250 | % | | | 1,645,000 | | | | 1,716,130 | | |
Revenue Bonds
Lutheran Senior Services
Series 2011
02/01/31 | | | 5.750 | % | | | 1,730,000 | | | | 1,923,950 | | |
| 02/01/41 | | | 6.000 | % | | | 2,600,000 | | | | 2,911,922 | | |
Senior Living Facilities-Lutheran
Series 2010
02/01/42 | | | 5.500 | % | | | 2,000,000 | | | | 2,123,500 | | |
St. Louis Area Housing Finance Corp.
Wellington Arms III Project
Series 1979
01/01/21 | | | 7.375 | % | | | 1,151,045 | | | | 1,156,765 | | |
St. Louis County Industrial Development Authority
Revenue Bonds
St. Andrews Residence for Seniors
Series 2007A
12/01/41 | | | 6.375 | % | | | 7,000,000 | | | | 7,292,950 | | |
St. Louis Industrial Development Authority
Refunding Revenue Bonds
Anheuser-Busch Co. Project
Series 1991
05/01/16 | | | 6.650 | % | | | 2,650,000 | | | | 3,092,020 | | |
St. Louis Industrial Development Authority(f)
Revenue Bonds
Convention Center Hotel
Series 2000 (AMBAC)
07/15/18 | | | 0.000 | % | | | 2,000,000 | | | | 1,461,340 | | |
University of Missouri
Prerefunded 11/01/15 Revenue Bonds
System Facilities
Series 2006A
11/01/26 | | | 5.000 | % | | | 260,000 | | | | 298,150 | | |
The accompanying Notes to Financial Statements are an integral part of this statement.
Annual Report 2012
22
Columbia Tax-Exempt Fund
Portfolio of Investments (continued)
July 31, 2012
Municipal Bonds (continued)
Issue
Description | | Coupon
Rate | | Principal
Amount ($) | | Value ($) | |
Unrefunded Revenue Bonds
System Facilities
Series 2006A
11/01/26 | | | 5.000 | % | | | 740,000 | | | | 830,110 | | |
| Total | | | | | | | 57,293,144 | | |
| Nebraska 0.5% | |
Douglas County Hospital Authority No. 2
Revenue Bonds
Health Facilities-Immanuel Obligation Group
Series 2010
01/01/40 | | | 5.625 | % | | | 875,000 | | | | 974,348 | | |
Madison County Hospital Authority No. 1
Revenue Bonds
Faith Regional Health Services Project
Series 2008A-1
07/01/33 | | | 6.000 | % | | | 11,500,000 | | | | 12,798,810 | | |
Nebraska Elementary & Secondary School Finance Authority
Revenue Bonds
Boys Town Project
Series 2008
09/01/28 | | | 4.750 | % | | | 6,800,000 | | | | 7,492,852 | | |
Omaha Public Power District
Revenue Bonds
Series 1986A Escrowed to Maturity
02/01/15 | | | 6.000 | % | | | 1,370,000 | | | | 1,477,887 | | |
Series 1992B Escrowed to Maturity
02/01/17 | | | 6.200 | % | | | 1,600,000 | | | | 1,807,152 | | |
| Total | | | | | | | 24,551,049 | | |
| Nevada 1.2% | |
City of Henderson
Special Assessment Bonds
Series 2006T-18
09/01/35 | | | 5.300 | % | | | 10,670,000 | | | | 5,888,880 | | |
City of Sparks
Senior Sales Tax Anticipation Revenue Bonds
Series 2008A(b)
06/15/28 | | | 6.750 | % | | | 2,000,000 | | | | 2,013,240 | | |
Clark County Water Reclamation District
Limited General Obligation Bonds
Series 2009A
07/01/34 | | | 5.250 | % | | | 12,000,000 | | | | 14,471,400 | | |
County of Clark
Revenue Bonds
Las Vegas-McCarran International Airport
Series 2010A
07/01/34 | | | 5.125 | % | | | 18,750,000 | | | | 20,711,812 | | |
County of Clark(a)
Revenue Bonds
Southwest Gas Corp. Project
Series 2005A (AMBAC) AMT
10/01/35 | | | 4.850 | % | | | 5,000,000 | | | | 5,136,950 | | |
Municipal Bonds (continued)
Issue
Description | | Coupon
Rate | | Principal
Amount ($) | | Value ($) | |
Director of the State of Nevada Department of Business & Industry(a)(b)
Revenue Bonds
Republic Services, Inc.
Series 2003 AMT
12/01/26 | | | 5.625 | % | | | 2,000,000 | | | | 2,291,840 | | |
Director of the State of Nevada Department of Business & Industry(e)
Revenue Bonds
Las Vegas Monorail Project 2nd Tier
Series 2000
01/01/30 | | | 7.375 | % | | | 1,650,000 | | | | 17 | | |
| 01/01/40 | | | 7.375 | % | | | 3,750,000 | | | | 37 | | |
Las Vegas Valley Water District
Limited General Obligation Bonds
Water Improvement
Series 2006A (AGM)
06/01/24 | | | 5.000 | % | | | 4,095,000 | | | | 4,624,279 | | |
| Total | | | | | | | 55,138,455 | | |
| New Hampshire 0.1% | |
New Hampshire Business Finance Authority
Revenue Bonds
Public Service Co. of New Hampshire Project
Series 2006B (NPFGC) AMT(a)
05/01/21 | | | 4.750 | % | | | 4,500,000 | | | | 4,746,150 | | |
| New Jersey 3.3% | |
Middlesex County Improvement Authority(d)(e)
Revenue Bonds
Heldrich Center Hotel
Series 2005C
01/01/37 | | | 8.750 | % | | | 1,500,000 | | | | 112,485 | | |
Subordinated Revenue Bonds
Heldrich Center Hotel
Series 2005B
01/01/37 | | | 6.250 | % | | | 4,000,000 | | | | 299,960 | | |
New Jersey Economic Development Authority
Refunding Revenue Bonds
School Facilities Construction
Series 2005N-1 (AGM)
09/01/25 | | | 5.500 | % | | | 23,990,000 | | | | 30,628,753 | | |
Series 2005N-1 (NPFGC/FGIC)
09/01/27 | | | 5.500 | % | | | 5,000,000 | | | | 6,550,250 | | |
Seeing Eye, Inc. Project
Series 2005 (AMBAC)
12/01/24 | | | 5.000 | % | | | 1,000,000 | | | | 1,064,460 | | |
Revenue Bonds
MSU Student Housing Project-Provident
Series 2010
06/01/31 | | | 5.750 | % | | | 4,350,000 | | | | 4,860,429 | | |
MSU Student Housing Project-Provident
Series 2010
06/01/42 | | | 5.875 | % | | | 14,500,000 | | | | 16,065,275 | | |
The accompanying Notes to Financial Statements are an integral part of this statement.
Annual Report 2012
23
Columbia Tax-Exempt Fund
Portfolio of Investments (continued)
July 31, 2012
Municipal Bonds (continued)
Issue
Description | | Coupon
Rate | | Principal
Amount ($) | | Value ($) | |
New Jersey Economic Development Authority(a)
Refunding Revenue Bonds
Series 2006B AMT
01/01/37 | | | 6.875 | % | | | 7,000,000 | | | | 7,099,050 | | |
Revenue Bonds
Continental Airlines, Inc. Project
Series 1999 AMT
09/15/19 | | | 6.250 | % | | | 1,300,000 | | | | 1,305,187 | | |
| 09/15/23 | | | 6.400 | % | | | 4,000,000 | | | | 4,016,400 | | |
| 09/15/29 | | | 6.250 | % | | | 2,000,000 | | | | 2,007,980 | | |
United Water, Inc.
Series 1996C (AMBAC) AMT
11/01/25 | | | 4.875 | % | | | 7,000,000 | | | | 7,570,850 | | |
New Jersey Educational Facilities Authority
Refunding Revenue Bonds
Stevens Institute of Technology
Series 2007A
07/01/22 | | | 5.250 | % | | | 1,250,000 | | | | 1,375,250 | | |
Revenue Bonds
Princeton University
Series 2007E
07/01/28 | | | 5.000 | % | | | 1,250,000 | | | | 1,429,162 | | |
William Paterson University
Series 2008C
07/01/24 | | | 5.000 | % | | | 1,000,000 | | | | 1,125,840 | | |
New Jersey Environmental Infrastructure Trust
Prerefunded 09/01/16 Revenue Bonds
Environmental
Series 2007A
09/01/22 | | | 5.000 | % | | | 10,000 | | | | 11,790 | | |
Unrefunded Revenue Bonds
Environmental
Series 2007A
09/01/22 | | | 5.000 | % | | | 1,220,000 | | | | 1,407,990 | | |
New Jersey Health Care Facilities Financing Authority
Revenue Bonds
St. Josephs Healthcare Systems
Series 2008
07/01/38 | | | 6.625 | % | | | 4,000,000 | | | | 4,714,120 | | |
Virtua Health
Series 2009
07/01/33 | | | 5.750 | % | | | 750,000 | | | | 852,353 | | |
New Jersey Housing & Mortgage Finance Agency
Revenue Bonds
Series 2000E-1 (AGM)
05/01/25 | | | 5.750 | % | | | 200,000 | | | | 200,392 | | |
New Jersey Housing & Mortgage Finance Agency(a)
Revenue Bonds
Series 2000A-1 (AGM) AMT
11/01/31 | | | 6.350 | % | | | 1,500,000 | | | | 1,502,850 | | |
New Jersey State Turnpike Authority
Refunding Revenue Bonds
Series 2005A (AGM)
01/01/30 | | | 5.250 | % | | | 2,000,000 | | | | 2,603,740 | | |
Municipal Bonds (continued)
Issue
Description | | Coupon
Rate | | Principal
Amount ($) | | Value ($) | |
Revenue Bonds
Series 1991C (NPFGC) Escrowed to Maturity
01/01/16 | | | 6.500 | % | | | 8,480,000 | | | | 9,325,371 | | |
Series 2004C-2 (AMBAC)
01/01/25 | | | 5.500 | % | | | 2,500,000 | | | | 3,191,675 | | |
Unrefunded Revenue Bonds
Series 1991C (AGM)
01/01/16 | | | 6.500 | % | | | 1,415,000 | | | | 1,672,091 | | |
New Jersey Transportation Trust Fund Authority
Revenue Bonds
Series 1999A
06/15/18 | | | 5.750 | % | | | 5,000,000 | | | | 6,186,600 | | |
| 06/15/20 | | | 5.750 | % | | | 4,150,000 | | | | 5,058,103 | | |
Series 2006A
12/15/23 | | | 5.500 | % | | | 3,000,000 | | | | 3,845,880 | | |
Series 2011B
06/15/31 | | | 5.500 | % | | | 7,250,000 | | | | 8,608,940 | | |
Tobacco Settlement Financing Corp.
Revenue Bonds
Series 2007-1A
06/01/26 | | | 4.625 | % | | | 5,055,000 | | | | 4,584,481 | | |
Union County Utilities Authority
Refunding Revenue Bonds
Covanta Union
Series 2011 AMT(a)
12/01/31 | | | 5.250 | % | | | 15,000,000 | | | | 16,669,950 | | |
University of Medicine & Dentistry of New Jersey
Revenue Bonds
Series 2002A (AMBAC)
12/01/12 | | | 5.250 | % | | | 1,705,000 | | | | 1,725,920 | | |
| Total | | | | | | | 157,673,577 | | |
| New Mexico 0.4% | |
New Mexico Hospital Equipment Loan Council
Revenue Bonds
Presbyterian Healthcare
Series 2009
08/01/39 | | | 5.000 | % | | | 6,500,000 | | | | 7,062,835 | | |
Presbyterian Healthcare Services
Series 2008A
08/01/32 | | | 6.375 | % | | | 8,650,000 | | | | 10,362,873 | | |
| Total | | | | | | | 17,425,708 | | |
| New York 8.6% | |
Albany Industrial Development Agency
Revenue Bonds
St. Peters Hospital Project
Series 2008A
11/15/27 | | | 5.250 | % | | | 3,830,000 | | | | 4,158,729 | | |
Brooklyn Arena Local Development Corp.
Revenue Bonds
Barclays Center Project
Series 2009
07/15/30 | | | 6.000 | % | | | 6,500,000 | | | | 7,470,775 | | |
The accompanying Notes to Financial Statements are an integral part of this statement.
Annual Report 2012
24
Columbia Tax-Exempt Fund
Portfolio of Investments (continued)
July 31, 2012
Municipal Bonds (continued)
Issue
Description | | Coupon
Rate | | Principal
Amount ($) | | Value ($) | |
City of New York
Prerefunded 08/01/12 Unlimited General Obligation Bonds
Series 2002E (NPFGC/IBC)
08/01/15 | | | 5.625 | % | | | 45,000 | | | | 45,000 | | |
Unlimited General Obligation Bonds
Series 2005M
04/01/22 | | | 5.000 | % | | | 2,000,000 | | | | 2,217,800 | | |
Unrefunded Unlimited General Obligation Bonds
Series 2002E (NPFGC/IBC)
08/01/15 | | | 5.625 | % | | | 1,955,000 | | | | 1,963,563 | | |
Housing Development Corp.
Revenue Bonds
Capital Funding Program-New York City Housing Authority Program
Series 2005A (NPFGC/FGIC)
07/01/25 | | | 5.000 | % | | | 300,000 | | | | 320,745 | | |
Series 2005F-1
11/01/25 | | | 4.650 | % | | | 5,000,000 | | | | 5,260,250 | | |
Hudson Yards Infrastructure Corp.
Revenue Bonds
Series 2011A
02/15/47 | | | 5.750 | % | | | 15,500,000 | | | | 18,167,085 | | |
Long Island Power Authority
Revenue Bonds
Series 2008A
05/01/33 | | | 6.000 | % | | | 2,725,000 | | | | 3,296,950 | | |
Metropolitan Transportation Authority
Refunding Revenue Bonds
Series 2002A
11/15/32 | | | 5.750 | % | | | 5,855,000 | | | | 5,934,628 | | |
Revenue Bonds
Series 2002A (AGM)
11/15/26 | | | 5.500 | % | | | 2,000,000 | | | | 2,027,240 | | |
Series 2007A (AGM)
11/15/33 | | | 5.000 | % | | | 12,000,000 | | | | 13,042,680 | | |
Series 2007B
11/15/24 | | | 5.000 | % | | | 6,820,000 | | | | 7,847,570 | | |
Series 2009B
11/15/34 | | | 5.000 | % | | | 1,000,000 | | | | 1,128,630 | | |
New York City Industrial Development Agency
Revenue Bonds
Pilot-Yankee Stadium-Payment
Series 2006I (FGIC)
03/01/46 | | | 5.000 | % | | | 2,000,000 | | | | 2,062,420 | | |
Queens Baseball Stadium Pilot
Series 2006 (AMBAC)
01/01/24 | | | 5.000 | % | | | 3,000,000 | | | | 3,090,840 | | |
New York City Industrial Development Agency(a)
Revenue Bonds
Terminal One Group Association Project
Series 2005 AMT
01/01/21 | | | 5.500 | % | | | 6,940,000 | | | | 7,459,528 | | |
| 01/01/24 | | | 5.500 | % | | | 5,500,000 | | | | 5,813,005 | | |
Municipal Bonds (continued)
Issue
Description | | Coupon
Rate | | Principal
Amount ($) | | Value ($) | |
New York City Municipal Water Finance Authority
Revenue Bonds
Series 2005C (NPFGC)
06/15/27 | | | 5.000 | % | | | 8,000,000 | | | | 8,937,520 | | |
New York City Transitional Finance Authority Building Aid
Revenue Bonds
Fiscal 2009
Series 2009S-4
01/15/25 | | | 5.125 | % | | | 2,000,000 | | | | 2,383,140 | | |
New York City Transitional Finance Authority
Prerefunded 02/01/13 Revenue Bonds
Future Tax Secured
Series 2003
02/01/31 | | | 5.000 | % | | | 105,000 | | | | 107,539 | | |
Unrefunded Revenue Bonds
Future Tax Secured
Series 2003
02/01/31 | | | 5.000 | % | | | 3,895,000 | | | | 3,970,407 | | |
New York Local Government Assistance Corp.
Refunding Revenue Bonds
Series 1993E (AMBAC/TCRS)
04/01/16 | | | 5.250 | % | | | 10,000,000 | | | | 11,462,000 | | |
Series 1993E (NPFGC)
04/01/21 | | | 5.000 | % | | | 3,655,000 | | | | 4,551,791 | | |
New York Mortgage Agency(a)
Revenue Bonds
Series 2002-101 AMT
04/01/32 | | | 5.400 | % | | | 10,630,000 | | | | 10,641,268 | | |
Series 2007-140 AMT
10/01/21 | | | 4.600 | % | | | 3,625,000 | | | | 3,816,726 | | |
New York State Dormitory Authority
Refunding Revenue Bonds
Education
Series 2005B (AMBAC)
03/15/27 | | | 5.500 | % | | | 11,240,000 | | | | 15,252,455 | | |
| 03/15/29 | | | 5.500 | % | | | 2,030,000 | | | | 2,777,263 | | |
| 03/15/30 | | | 5.500 | % | | | 6,040,000 | | | | 8,275,585 | | |
Revenue Bonds
Consolidated City University System
2nd General Series 1993A
07/01/18 | | | 5.750 | % | | | 5,500,000 | | | | 6,461,400 | | |
Consolidated City University Systems 2nd Generation
Series 1993A
07/01/20 | | | 6.000 | % | | | 13,350,000 | | | | 16,819,131 | | |
Consolidated University 2nd Generation
Series 1993A (AGM)
07/01/20 | | | 6.000 | % | | | 6,140,000 | | | | 7,735,540 | | |
Education
Series 2005F
03/15/23 | | | 5.000 | % | | | 4,935,000 | | | | 5,457,074 | | |
Independent School District-Educational Housing Services
Series 2005 (AMBAC)
07/01/30 | | | 5.250 | % | | | 3,000,000 | | | | 3,539,910 | | |
Mount Sinai School of Medicine
Series 2009
07/01/39 | | | 5.125 | % | | | 15,000,000 | | | | 16,533,900 | | |
The accompanying Notes to Financial Statements are an integral part of this statement.
Annual Report 2012
25
Columbia Tax-Exempt Fund
Portfolio of Investments (continued)
July 31, 2012
Municipal Bonds (continued)
Issue
Description | | Coupon
Rate | | Principal
Amount ($) | | Value ($) | |
New York University
Series 2008A
07/01/29 | | | 5.000 | % | | | 3,845,000 | | | | 4,325,510 | | |
New York University Hospital Center
Series 2007B
07/01/24 | | | 5.250 | % | | | 420,000 | | | | 460,874 | | |
North Shore Long Island Jewish
Series 2009A
05/01/37 | | | 5.500 | % | | | 6,250,000 | | | | 7,108,000 | | |
Orange Regional Medical Center
Series 2008
12/01/29 | | | 6.125 | % | | | 2,250,000 | | | | 2,497,770 | | |
State University
Series 1993A (FGIC)
05/15/17 | | | 5.875 | % | | | 28,240,000 | | | | 33,025,551 | | |
State University Educational Facilities
Series 1993A
05/15/13 | | | 5.500 | % | | | 9,505,000 | | | | 9,879,212 | | |
Upstate Community-State Supported
Series 2005B (NPFGC/FGIC)
07/01/23 | | | 5.500 | % | | | 2,000,000 | | | | 2,604,580 | | |
New York State Energy Research & Development Authority
Revenue Bonds
Series 1993(h)
04/01/20 | | | 12.114 | % | | | 13,000,000 | | | | 13,080,340 | | |
New York State Environmental Facilities Corp.
Revenue Bonds
Revolving Funds New York City Municipal Water
Series 2008A
06/15/28 | | | 5.000 | % | | | 1,000,000 | | | | 1,163,610 | | |
Revolving Funds New York City Municipal Water Project
Series 2002K
06/15/28 | | | 5.000 | % | | | 9,000,000 | | | | 9,014,490 | | |
New York State Housing Finance Agency
Refunding Revenue Bonds
State University Construction
Series 1986A Escrowed to Maturity
05/01/13 | | | 6.500 | % | | | 1,820,000 | | | | 1,871,815 | | |
New York State Thruway Authority
Revenue Bonds
General Revenue
Series 2012I
01/01/42 | | | 5.000 | % | | | 12,500,000 | | | | 14,089,000 | | |
Series 2005G (AGM)
01/01/24 | | | 5.000 | % | | | 4,000,000 | | | | 4,428,280 | | |
Port Authority of New York & New Jersey
Revenue Bonds
Consolidated 144th
Series 2006
10/01/28 | | | 5.000 | % | | | 1,000,000 | | | | 1,135,200 | | |
JFK International Air Terminal
Series 2010
12/01/36 | | | 6.000 | % | | | 7,000,000 | | | | 7,954,170 | | |
Municipal Bonds (continued)
Issue
Description | | Coupon
Rate | | Principal
Amount ($) | | Value ($) | |
Port Authority of New York & New Jersey(a)
Revenue Bonds
5th Installment-Special Project
Series 1996-4 AMT
10/01/19 | | | 6.750 | % | | | 7,000,000 | | | | 6,999,860 | | |
Consolidated 146th
Series 2006 (AGM) AMT
12/01/23 | | | 4.500 | % | | | 7,500,000 | | | | 7,996,425 | | |
JFK International Air Terminal 4 Special Project
Series 1997 (NPFGC) AMT
12/01/22 | | | 5.750 | % | | | 6,500,000 | | | | 6,501,950 | | |
Suffolk County Industrial Development Agency
Revenue Bonds
Gurwin Jewish-Phase II
Series 2004
05/01/39 | | | 6.700 | % | | | 860,000 | | | | 895,707 | | |
Suffolk County Industrial Development Agency(a)
Revenue Bonds
Nissequogue Cogen Partners Facility
Series 1998 AMT
01/01/23 | | | 5.500 | % | | | 7,800,000 | | | | 7,800,000 | | |
Tobacco Settlement Financing Corp.
Asset-Backed Revenue Bonds
Series 2003A-1
06/01/19 | | | 5.500 | % | | | 5,000,000 | | | | 5,211,100 | | |
Triborough Bridge & Tunnel Authority
Refunding Revenue Bonds
Series 2002 (NFPGC)
11/15/20 | | | 5.500 | % | | | 6,800,000 | | | | 8,638,516 | | |
Revenue Bonds
General Purpose
Series 1992Y Escrowed to Maturity
01/01/21 | | | 6.125 | % | | | 7,000,000 | | | | 9,412,970 | | |
| 01/01/21 | | | 6.125 | % | | | 11,000,000 | | | | 14,791,810 | | |
Ulster County Industrial Development Agency
Revenue Bonds
Series 2007A
09/15/37 | | | 6.000 | % | | | 2,000,000 | | | | 1,417,700 | | |
| 09/15/42 | | | 6.000 | % | | | 7,000,000 | | | | 4,890,270 | | |
| Total | | | | | | | 407,224,797 | | |
| North Carolina 1.3% | |
City of Charlotte Water & Sewer System
Revenue Bonds
Water & Sewer
Series 2008
07/01/26 | | | 5.000 | % | | | 8,450,000 | | | | 10,134,254 | | |
City of High Point
Revenue Bonds
Series 2008 (AGM)
11/01/28 | | | 5.000 | % | | | 350,000 | | | | 405,594 | | |
The accompanying Notes to Financial Statements are an integral part of this statement.
Annual Report 2012
26
Columbia Tax-Exempt Fund
Portfolio of Investments (continued)
July 31, 2012
Municipal Bonds (continued)
Issue
Description | | Coupon
Rate | | Principal
Amount ($) | | Value ($) | |
Durham Housing Authority
Revenue Bonds
Series 2005 AMT(a)(b)(d)
02/01/38 | | | 5.650 | % | | | 3,191,281 | | | | 3,196,292 | | |
North Carolina Eastern Municipal Power Agency
Prerefunded 01/01/22 Revenue Bonds
Series 1987A
01/01/24 | | | 4.500 | % | | | 1,750,000 | | | | 2,176,422 | | |
Series 1988A
01/01/26 | | | 6.000 | % | | | 1,940,000 | | | | 2,650,894 | | |
Refunding Revenue Bonds
Series 1991A Escrowed to Maturity
01/01/21 | | | 5.000 | % | | | 8,735,000 | | | | 11,135,902 | | |
Revenue Bonds
Series 1986A Escrowed to Maturity
01/01/17 | | | 5.000 | % | | | 3,870,000 | | | | 4,441,367 | | |
Series 2009A
01/01/26 | | | 5.500 | % | | | 300,000 | | | | 349,947 | | |
Series 2009B
01/01/26 | | | 5.000 | % | | | 7,000,000 | | | | 7,916,160 | | |
Unrefunded Revenue Bonds
Series 1991A
01/01/18 | | | 6.500 | % | | | 2,185,000 | | | | 2,748,708 | | |
North Carolina Housing Finance Agency(a)
Revenue Bonds
Homeownership
Series 2000A-8 AMT
07/01/28 | | | 6.400 | % | | | 15,000 | | | | 15,000 | | |
Series 2006A-26 AMT
01/01/38 | | | 5.500 | % | | | 1,355,000 | | | | 1,369,702 | | |
North Carolina Medical Care Commission
Refunding Revenue Bonds
1st Mortgage-Givens Estates
Series 2007
07/01/33 | | | 5.000 | % | | | 5,000,000 | | | | 5,198,200 | | |
Revenue Bonds
1st Mortgage Deerfield
Series 2008A
11/01/33 | | | 6.000 | % | | | 4,060,000 | | | | 4,453,089 | | |
1st Mortgage-Presbyterian Homes
Series 2006
10/01/31 | | | 5.500 | % | | | 2,500,000 | | | | 2,555,725 | | |
Health Care Housing Arc Projects
Series 2004A
10/01/34 | | | 5.800 | % | | | 1,400,000 | | | | 1,482,558 | | |
North Carolina Medical Care Commission(f)
Refunding Revenue Bonds
Capital Appreciation-Wilson Memorial Hospital
Series 1997 (AMBAC)
11/01/14 | | | 0.000 | % | | | 1,380,000 | | | | 1,308,461 | | |
State of North Carolina
Revenue Bonds
Annual Appropriation
Series 2009A
05/01/27 | | | 5.000 | % | | | 305,000 | | | | 367,412 | | |
| Total | | | | | | | 61,905,687 | | |
Municipal Bonds (continued)
Issue
Description | | Coupon
Rate | | Principal
Amount ($) | | Value ($) | |
| North Dakota 0.3% | |
County of McLean
Revenue Bonds
Great River Energy
Series 2010B
07/01/40 | | | 5.150 | % | | | 7,900,000 | | | | 8,668,275 | | |
County of Ward
Revenue Bonds
Trinity Obligated Group
Series 2006
07/01/29 | | | 5.125 | % | | | 4,490,000 | | | | 4,583,123 | | |
| Total | | | | | | | 13,251,398 | | |
| Ohio 2.8% | |
Adams County/Ohio Valley Local School District
Unlimited General Obligation Bonds
Adams and Highland Counties
Series 1995 (NPFGC)
12/01/15 | | | 7.000 | % | | | 2,160,000 | | | | 2,361,290 | | |
American Municipal Power, Inc.
Revenue Bonds
AMP Fremont Energy Center Project
Series 2012
02/15/37 | | | 5.000 | % | | | 13,220,000 | | | | 14,793,444 | | |
Buckeye Tobacco Settlement Financing Authority
Asset-Backed Revenue Bonds
Senior Turbo Series 2007A-2
06/01/24 | | | 5.125 | % | | | 17,500,000 | | | | 14,638,575 | | |
City of Cleveland
Refunding Revenue Bonds
1st Mortgage
Series 1993G (NPFGC)
01/01/21 | | | 5.500 | % | | | 4,015,000 | | | | 5,073,675 | | |
Revenue Bonds
Series 2008B-1 (NPFGC)
11/15/28 | | | 5.000 | % | | | 500,000 | | | | 549,130 | | |
City of Columbus Sewerage
Revenue Bonds
Series 2008A
06/01/31 | | | 4.750 | % | | | 10,000,000 | | | | 10,990,700 | | |
Systems
Series 2008A
06/01/27 | | | 5.000 | % | | | 4,000,000 | | | | 4,693,160 | | |
City of Columbus
Prerefunded 12/15/16 Unlimited General Obligation Bonds
Various Purpose
Series 2006A
12/15/21 | | | 5.000 | % | | | 1,435,000 | | | | 1,711,582 | | |
City of Lakewood Water System
Revenue Bonds
Series 1995 (AMBAC)
07/01/20 | | | 5.850 | % | | | 1,545,000 | | | | 1,954,178 | | |
The accompanying Notes to Financial Statements are an integral part of this statement.
Annual Report 2012
27
Columbia Tax-Exempt Fund
Portfolio of Investments (continued)
July 31, 2012
Municipal Bonds (continued)
Issue
Description | | Coupon
Rate | | Principal
Amount ($) | | Value ($) | |
City of Middleburg Heights
Revenue Bonds
Southwest General Facilities
Series 2011
08/01/36 | | | 5.250 | % | | | 2,380,000 | | | | 2,616,215 | | |
| 08/01/41 | | | 5.250 | % | | | 6,900,000 | | | | 7,535,628 | | |
Cleveland Department of Public Utilities Division of Water
Revenue Bonds
Series 2007P
01/01/24 | | | 5.000 | % | | | 2,000,000 | | | | 2,304,320 | | |
Cleveland State University
Revenue Bonds
Series 2003A (NPFGC)
06/01/15 | | | 5.000 | % | | | 1,000,000 | | | | 1,029,290 | | |
County of Hamilton Sales Tax
Refunding Revenue Bonds
Series 2006A (AMBAC)
12/01/26 | | | 5.000 | % | | | 1,000,000 | | | | 1,097,380 | | |
County of Hamilton
Revenue Bonds
Improvement-Greater Cincinnati Metropolitan
Series 2007A
12/01/25 | | | 5.000 | % | | | 3,425,000 | | | | 3,883,231 | | |
Metropolitan Sewer District Improvement
Series 2006A (NPFGC)
12/01/26 | | | 5.000 | % | | | 1,000,000 | | | | 1,141,010 | | |
County of Montgomery
Unlimited General Obligation Improvement Refunding Bonds
Various Purpose
Series 2005 (NPFGC)
12/01/24 | | | 5.000 | % | | | 2,600,000 | | | | 2,849,054 | | |
Hickory Chase Community Authority
Revenue Bonds
Hickory Chase Project
Series 2008(d)(e)
12/01/27 | | | 6.750 | % | | | 5,644,000 | | | | 3,664,819 | | |
Kings Local School District
Unlimited General Obligation Bonds
Series 1995 (NPFGC/FGIC)
12/01/16 | | | 7.500 | % | | | 1,880,000 | | | | 2,165,252 | | |
Ohio Higher Educational Facility Commission
Revenue Bonds
Denison University 2007 Project
Series 2007
11/01/23 | | | 5.000 | % | | | 4,000,000 | | | | 4,544,240 | | |
University of Dayton Project
Series 2009
12/01/24 | | | 5.500 | % | | | 3,000,000 | | | | 3,480,750 | | |
Ohio Higher Educational Facility Commission
Revenue Bonds
University Hospital Health Systems
Series 2009A
01/15/39 | | | 6.750 | % | | | 7,700,000 | | | | 8,880,795 | | |
Municipal Bonds (continued)
Issue
Description | | Coupon
Rate | | Principal
Amount ($) | | Value ($) | |
Ohio Housing Finance Agency
Revenue Bonds
Mortgage-Backed Securities Program
Series 2008F (GNMA/FNMA/FHLMC)
09/01/28 | | | 5.250 | % | | | 560,000 | | | | 586,023 | | |
Ohio Municipal Electric Generation Agency
Refunding Revenue Bonds
Joint Venture 5
Series 2004 (AMBAC)
02/15/24 | | | 4.750 | % | | | 7,980,000 | | | | 8,355,938 | | |
Ohio State Turnpike Commission
Refunding Revenue Bonds
Series 1998A (NPFGC/FGIC)
02/15/26 | | | 5.500 | % | | | 3,000,000 | | | | 3,929,700 | | |
Ohio State University
Revenue Bonds
Series 2005A
06/01/25 | | | 5.000 | % | | | 3,000,000 | | | | 3,305,100 | | |
Ohio State Water Development Authority
Refunding Revenue Bonds
Drinking Water Fund
Series 2005
12/01/21 | | | 5.250 | % | | | 3,890,000 | | | | 5,006,158 | | |
| 12/01/22 | | | 5.250 | % | | | 2,625,000 | | | | 3,434,104 | | |
Unrefunded Revenue Bonds
Loan Fund
Series 2005B
06/01/25 | | | 4.750 | % | | | 920,000 | | | | 1,031,053 | | |
Toledo-Lucas County Port Authority
Refunding Revenue Bonds
CSX Transportation, Inc. Project
Series 1992
12/15/21 | | | 6.450 | % | | | 3,950,000 | | | | 4,996,908 | | |
Special Assessment Bonds
Town Square at Levi Commons
Series 2007
11/01/36 | | | 5.400 | % | | | 2,605,000 | | | | 1,440,122 | | |
| Total | | | | | | | 134,042,824 | | |
| Oklahoma 0.1% | |
Cleveland County Justice Authority
Revenue Bonds
Detention Facilities Project
Series 2009B
03/01/29 | | | 5.750 | % | | | 3,840,000 | | | | 4,131,648 | | |
Oklahoma County Finance Authority
Revenue Bonds
Sail Associates LLC
Series 2007 AMT (Bank of the West)(a)
12/01/41 | | | 5.250 | % | | | 1,475,000 | | | | 1,565,019 | | |
| Total | | | | | | | 5,696,667 | | |
The accompanying Notes to Financial Statements are an integral part of this statement.
Annual Report 2012
28
Columbia Tax-Exempt Fund
Portfolio of Investments (continued)
July 31, 2012
Municipal Bonds (continued)
Issue
Description | | Coupon
Rate | | Principal
Amount ($) | | Value ($) | |
| Oregon 0.4% | |
Benton County Hospital Facilities Authority
Unrefunded Revenue Bonds
Samaritan Health
Series 1998
10/01/28 | | | 5.125 | % | | | 655,000 | | | | 655,557 | | |
City of Salem
Limited General Obligation Bonds
Series 2009
06/01/27 | | | 4.375 | % | | | 1,000,000 | | | | 1,112,160 | | |
Clackamas County Service District No. 1
Revenue Bonds
Series 2009A
12/01/25 | | | 4.250 | % | | | 1,690,000 | | | | 1,878,097 | | |
Cow Creek Band of Umpqua Tribe of Indians
Revenue Bonds
Series 2006C(b)(c)
10/01/26 | | | 5.625 | % | | | 3,500,000 | | | | 3,207,365 | | |
Linn County Community School District No. 9 Lebanon
Unlimited General Obligation Refunding Bonds
Series 2005 (NPFGC/FGIC)
06/15/30 | | | 5.500 | % | | | 1,435,000 | | | | 1,989,197 | | |
Oregon Health & Science University
Revenue Bonds
Series 2009A
07/01/39 | | | 5.750 | % | | | 4,500,000 | | | | 5,203,800 | | |
Oregon State Facilities Authority
Revenue Bonds
Linfield College Project
Series 2005A
10/01/25 | | | 5.000 | % | | | 750,000 | | | | 791,242 | | |
Willamette University Projects
Series 2007A
10/01/27 | | | 5.000 | % | | | 1,500,000 | | | | 1,620,150 | | |
Oregon State Housing & Community Services Department
Revenue Bonds
Single Family Mortgage Program
Series 2005A
07/01/20 | | | 4.400 | % | | | 485,000 | | | | 502,455 | | |
Polk, Marion & Benton School District No. 13J
Unlimited General Obligation Bonds
Central School District
Series 2009A
06/15/29 | | | 4.375 | % | | | 1,300,000 | | | | 1,422,902 | | |
| Total | | | | | | | 18,382,925 | | |
| Pennsylvania 2.3% | |
Allegheny County Higher Education Building Authority
Revenue Bonds
Duquesne University
Series 2008
03/01/28 | | | 5.000 | % | | | 490,000 | | | | 528,000 | | |
Municipal Bonds (continued)
Issue
Description | | Coupon
Rate | | Principal
Amount ($) | | Value ($) | |
Berks County Municipal Authority
Revenue Bonds
Reading Hospital Medical Center Project
Series 1993 (NPFGC)
10/01/14 | | | 5.700 | % | | | 540,000 | | | | 561,238 | | |
Butler County Hospital Authority
Revenue Bonds
Butler Health Systems Project
Series 2009
07/01/39 | | | 7.250 | % | | | 7,000,000 | | | | 8,404,620 | | |
Chester County Industrial Development Authority
RHA/Pennsylvania Nursing Home-1st Mortgage
Series 2002(d)
05/01/32 | | | 8.500 | % | | | 5,910,000 | | | | 6,019,630 | | |
Commonwealth of Pennsylvania
Unlimited General Obligation Bonds
1st Series 2010A
02/15/19 | | | 5.000 | % | | | 10,000,000 | | | | 12,371,500 | | |
Dauphin County Industrial Development Authority
Revenue Bonds
Dauphin Consolidated Water Supply
Series 1992A AMT(a)
06/01/24 | | | 6.900 | % | | | 3,400,000 | | | | 4,422,958 | | |
Delaware County Industrial Development Authority
Revenue Bonds
Philadelphia Suburban Water Facilities
Series 2001 (AMBAC) AMT(a)
10/01/31 | | | 5.350 | % | | | 3,000,000 | | | | 3,009,450 | | |
Delaware Valley Regional Financial Authority
Revenue Bonds
Series 1997C (AMBAC)
07/01/27 | | | 7.750 | % | | | 1,000,000 | | | | 1,452,330 | | |
Montgomery County Industrial Development Authority
Revenue Bonds
Whitemarsh Continuing Care
Series 2005
02/01/28 | | | 6.125 | % | | | 2,000,000 | | | | 2,040,500 | | |
Northampton County General Purpose Authority
Revenue Bonds
Saint Luke's Hospital Project
Series 2008A
08/15/28 | | | 5.375 | % | | | 4,000,000 | | | | 4,259,280 | | |
Pennsylvania Convention Center Authority
Revenue Bonds
Series 1989A Escrowed to Maturity (FGIC)
09/01/19 | | | 6.000 | % | | | 14,010,000 | | | | 18,078,924 | | |
Pennsylvania Economic Development Financing Authority
Revenue Bonds
Allegheny Energy Supply Co.
Series 2009
07/15/39 | | | 7.000 | % | | | 13,000,000 | | | | 15,390,700 | | |
The accompanying Notes to Financial Statements are an integral part of this statement.
Annual Report 2012
29
Columbia Tax-Exempt Fund
Portfolio of Investments (continued)
July 31, 2012
Municipal Bonds (continued)
Issue
Description | | Coupon
Rate | | Principal
Amount ($) | | Value ($) | |
Philadelphia Biosolids Facility
Series 2009
01/01/32 | | | 6.250 | % | | | 5,325,000 | | | | 5,938,866 | | |
Pennsylvania Economic Development Financing Authority(a)
Revenue Bonds
Proctor & Gamble Paper Project
Series 2001 AMT
03/01/31 | | | 5.375 | % | | | 1,000,000 | | | | 1,264,030 | | |
Pennsylvania Higher Educational Facilities Authority
Revenue Bonds
Edinboro University
Series 2008
07/01/28 | | | 5.750 | % | | | 3,000,000 | | | | 3,269,130 | | |
Edinboro University Foundation
Series 2010
07/01/43 | | | 6.000 | % | | | 4,750,000 | | | | 5,323,990 | | |
Pennsylvania State University
Refunding Revenue Bonds
Series 2002
08/15/16 | | | 5.250 | % | | | 1,000,000 | | | | 1,181,010 | | |
Revenue Bonds
Series 2005
09/01/24 | | | 5.000 | % | | | 1,250,000 | | | | 1,386,525 | | |
Philadelphia Municipal Authority
Revenue Bonds
Lease
Series 2009
04/01/34 | | | 6.500 | % | | | 2,500,000 | | | | 2,906,850 | | |
Philadelphia Redevelopment Authority
Revenue Bonds
Subordinated Series 1986B Escrowed to Maturity (GNMA)
06/01/17 | | | 9.000 | % | | | 450,000 | | | | 622,269 | | |
Washington County Industrial Development Authority
Revenue Bonds
Washington Jefferson College
Series 2010
11/01/36 | | | 5.000 | % | | | 4,850,000 | | | | 5,281,408 | | |
Washington County Industrial Development Authority(d)
1st Mortgage
Central Project
Series 2003
01/01/29 | | | 8.500 | % | | | 2,004,000 | | | | 2,093,779 | | |
Westmoreland County Municipal Authority
Revenue Bonds
Capital Appreciation
Series 1999A (NPFGC)(f)
08/15/22 | | | 0.000 | % | | | 2,000,000 | | | | 1,488,220 | | |
| Total | | | | | | | 107,295,207 | | |
Municipal Bonds (continued)
Issue
Description | | Coupon
Rate | | Principal
Amount ($) | | Value ($) | |
| Puerto Rico 2.5% | |
Commonwealth of Puerto Rico
Unlimited General Obligation Refunding Bonds
Series 1996B (AMBAC/TCRS)(c)
07/01/15 | | | 6.500 | % | | | 2,650,000 | | | | 2,993,095 | | |
Puerto Rico Electric Power Authority(c)
Refunding Revenue Bonds
Series 2007UU (AGM)
07/01/23 | | | 5.000 | % | | | 1,000,000 | | | | 1,076,550 | | |
Series 2007VV (NPFGC/FGIC)
07/01/34 | | | 5.250 | % | | | 10,870,000 | | | | 11,941,999 | | |
Revenue Bonds
Series 2003NN (NPFGC)
07/01/21 | | | 5.250 | % | | | 3,500,000 | | | | 4,045,335 | | |
Series 2008WW
07/01/23 | | | 5.375 | % | | | 2,500,000 | | | | 2,835,575 | | |
Series 2010XX
07/01/40 | | | 5.250 | % | | | 14,500,000 | | | | 15,128,720 | | |
Puerto Rico Highway & Transportation Authority(c)
Refunding Revenue Bonds
Series 1996Z (AGM)
07/01/18 | | | 6.000 | % | | | 4,640,000 | | | | 5,532,133 | | |
Series 1996Z Escrowed to Maturity (AGM)
07/01/18 | | | 6.000 | % | | | 5,360,000 | | | | 6,666,500 | | |
Series 2003AA (NPFGC)
07/01/20 | | | 5.500 | % | | | 180,000 | | | | 207,049 | | |
Series 2003AA Escrowed to Maturity (NPFGC)
07/01/20 | | | 5.500 | % | | | 320,000 | | | | 415,485 | | |
Revenue Bonds
Series 2005K
07/01/20 | | | 5.000 | % | | | 11,130,000 | | | | 11,788,451 | | |
Puerto Rico Industrial Tourist Educational Medical & Environmental Central Facilities Finance Authority
Revenue Bonds
Intermediate American University
Series 1998A (NPFGC)(c)
10/01/22 | | | 5.000 | % | | | 2,500,000 | | | | 2,511,625 | | |
Puerto Rico Public Buildings Authority(c)
Prerefunded 07/01/14 Revenue Bonds
Government Facilities
Series 2004I
07/01/33 | | | 5.250 | % | | | 130,000 | | | | 141,947 | | |
Refunding Revenue Bonds
Government Facilities
Series 2002F
07/01/20 | | | 5.250 | % | | | 2,000,000 | | | | 2,225,500 | | |
Series 2007M
07/01/31 | | | 6.250 | % | | | 27,000,000 | | | | 33,130,620 | | |
Puerto Rico Public Finance Corp.(c)
Revenue Bonds
Commonwealth Appropriations
Series 1998A (AMBAC)
06/01/24 | | | 5.125 | % | | | 3,000,000 | | | | 3,688,530 | | |
The accompanying Notes to Financial Statements are an integral part of this statement.
Annual Report 2012
30
Columbia Tax-Exempt Fund
Portfolio of Investments (continued)
July 31, 2012
Municipal Bonds (continued)
Issue
Description | | Coupon
Rate | | Principal
Amount ($) | | Value ($) | |
Unrefunded Revenue Bonds
Commonwealth Appropriations
Series 2002E Escrowed to Maturity
08/01/26 | | | 6.000 | % | | | 2,470,000 | | | | 3,555,293 | | |
Puerto Rico Sales Tax Financing Corp.
1st Subordinated Revenue Bonds
Series 2010C(c)
08/01/41 | | | 5.250 | % | | | 10,000,000 | | | | 10,644,300 | | |
| Total | | | | | | | 118,528,707 | | |
| Rhode Island 0.1% | |
Rhode Island Student Loan Authority
Revenue Bonds
Series 2007-2 (AMBAC) AMT(a)
12/01/37 | | | 4.850 | % | | | 4,700,000 | | | | 4,756,964 | | |
| South Carolina 1.2% | |
Charleston Educational Excellence Finance Corp.
Revenue Bonds
Charleston County School District
Series 2005
12/01/30 | | | 5.250 | % | | | 5,500,000 | | | | 6,105,220 | | |
City of Myrtle Beach
Tax Allocation Bonds
Myrtle Beach Air Force Base
Series 2006A
10/01/26 | | | 5.250 | % | | | 1,870,000 | | | | 1,685,973 | | |
City of Rock Hill
Improvement Refunding Revenue Bonds
Series 2003A (AGM)
01/01/30 | | | 5.000 | % | | | 4,000,000 | | | | 4,079,920 | | |
County of Berkeley
Unrefunded Unlimited General Obligation Refunding & Improvement Bonds
Series 2003
09/01/28 | | | 5.000 | % | | | 735,000 | | | | 764,128 | | |
County of Georgetown
Refunding Revenue Bonds
International Paper Co. Project
Series 2000A
03/15/14 | | | 5.950 | % | | | 1,000,000 | | | | 1,074,810 | | |
County of Richland
Revenue Bonds
International Paper
Series 2003 AMT(a)
04/01/23 | | | 6.100 | % | | | 1,000,000 | | | | 1,037,670 | | |
Lexington County Health Services District, Inc.
Prerefunded 05/01/14 Revenue Bonds
Series 2004
05/01/32 | | | 5.500 | % | | | 4,685,000 | | | | 5,108,758 | | |
Municipal Bonds (continued)
Issue
Description | | Coupon
Rate | | Principal
Amount ($) | | Value ($) | |
Piedmont Municipal Power Agency
Refunding Revenue Bonds
Electric
Series 1991 (NPFGC/FGIC)
01/01/21 | | | 6.250 | % | | | 1,250,000 | | | | 1,614,763 | | |
Unrefunded Revenue Bonds
Series 1993 (NPFGC)
01/01/25 | | | 5.375 | % | | | 11,370,000 | | | | 14,340,640 | | |
Piedmont Municipal Power Agency(f)
Refunding Revenue Bonds
Capital Appreciation
Subordinated Series 2004A-2 (NPFGC/FGIC)
01/01/24 | | | 0.000 | % | | | 5,000,000 | | | | 3,282,600 | | |
Scago Educational Facilities Corp.
Revenue Bonds
School District No. 5 Spartanburg County
Series 2005 (AGM)
04/01/22 | | | 4.600 | % | | | 8,885,000 | | | | 9,795,713 | | |
South Carolina Jobs-Economic Development Authority
Refunding Revenue Bonds
The Woodlands at Furman Project
Series 2012
11/15/42 | | | 6.000 | % | | | 2,994,390 | | | | 2,156,859 | | |
Unrefunded Revenue Bonds
Bon Secours
Series 2002B
11/15/30 | | | 5.625 | % | | | 3,165,000 | | | | 3,204,309 | | |
South Carolina Jobs-Economic Development Authority(f)
Refunding Subordinated Revenue Bonds
The Woodlands at Furman Project
Series 2012
11/15/47 | | | 0.000 | % | | | 1,283,310 | | | | 6,314 | | |
South Carolina State Public Service Authority
Revenue Bonds
Santee Cooper
Series 2006A (NPFGC)
01/01/27 | | | 5.000 | % | | | 2,600,000 | | | | 2,898,272 | | |
Series 2008A
01/01/28 | | | 5.375 | % | | | 250,000 | | | | 302,915 | | |
| Total | | | | | | | 57,458,864 | | |
| South Dakota 0.5% | |
Heartland Consumers Power District
Revenue Bonds
Series 1992 Escrowed to Maturity (AGM)
01/01/17 | | | 6.000 | % | | | 4,965,000 | | | | 5,207,640 | | |
Unrefunded Revenue Bonds
Series 1992 (AGM)
01/01/17 | | | 6.000 | % | | | 8,635,000 | | | | 9,866,178 | | |
State of South Dakota
Revenue Bonds
Series 1993A (AGM)
09/01/17 | | | 6.700 | % | | | 7,260,000 | | | | 8,383,122 | | |
| Total | | | | | | | 23,456,940 | | |
The accompanying Notes to Financial Statements are an integral part of this statement.
Annual Report 2012
31
Columbia Tax-Exempt Fund
Portfolio of Investments (continued)
July 31, 2012
Municipal Bonds (continued)
Issue
Description | | Coupon
Rate | | Principal
Amount ($) | | Value ($) | |
| Tennessee 0.1% | |
Knox County Health Educational & Housing Facilities Board
Refunding Revenue Bonds
Fort Sanders Alliance
Series 1993 (NPFGC)
01/01/15 | | | 5.250 | % | | | 5,000,000 | | | | 5,487,150 | | |
Metropolitan Government Nashville & Davidson County Health & Educational Facilities Board
1st Mortgage-AHF Project
Series 2003(d)
01/01/29 | | | 8.500 | % | | | 401,000 | | | | 418,965 | | |
| Total | | | | | | | 5,906,115 | | |
| Texas 6.6% | |
Bexar County Health Facilities Development Corp.
Revenue Bonds
Army Retirement Residence Project
Series 2010
07/01/30 | | | 5.875 | % | | | 1,370,000 | | | | 1,526,070 | | |
| 07/01/45 | | | 6.200 | % | | | 7,200,000 | | | | 8,042,832 | | |
Capital Area Cultural Education Facilities Finance Corp.
Revenue Bonds
Roman Catholic Diocese
Series 2005B
04/01/45 | | | 6.125 | % | | | 13,450,000 | | | | 14,743,352 | | |
Central Texas Regional Mobility Authority
Revenue Bonds
Senior Lien
Series 2011
01/01/41 | | | 6.000 | % | | | 8,620,000 | | | | 9,974,805 | | |
Central Texas Regional Mobility Authority(f)
Revenue Bonds
Capital Appreciation
Series 2010
01/01/25 | | | 0.000 | % | | | 2,000,000 | | | | 1,145,380 | | |
City of Austin Electric Utility
Refunding Revenue Bonds
Series 2008A
11/15/35 | | | 5.250 | % | | | 8,000,000 | | | | 8,956,160 | | |
City of Dallas
Limited General Obligation Bonds
Series 2005
02/15/25 | | | 5.000 | % | | | 820,000 | | | | 873,259 | | |
City of Houston Airport System
Refunding Revenue Bonds
Senior Lien
Series 2009A
07/01/34 | | | 5.500 | % | | | 10,500,000 | | | | 11,870,565 | | |
City of Houston Airport System(a)
Refunding Revenue Bonds
Continental-Special Facilities
Series 2011A
07/15/30 | | | 6.500 | % | | | 5,555,000 | | | | 6,104,167 | | |
Municipal Bonds (continued)
Issue
Description | | Coupon
Rate | | Principal
Amount ($) | | Value ($) | |
Subordinated Lien
Series 2012A AMT
07/01/31 | | | 5.000 | % | | | 5,000,000 | | | | 5,552,850 | | |
City of Houston Utility System(f)
Refunding Revenue Bonds
Capital Appreciation
Series 1998A Escrowed to Maturity (AGM)
12/01/19 | | | 0.000 | % | | | 26,955,000 | | | | 23,742,503 | | |
Unrefunded Revenue Bonds
Capital Appreciation
Series 1998A (AGM)
12/01/19 | | | 0.000 | % | | | 9,545,000 | | | | 8,196,387 | | |
City of Houston
Revenue Bonds
Capital Appreciation-Convention
Series 2001B (AMBAC)(f)
09/01/17 | | | 0.000 | % | | | 2,000,000 | | | | 1,790,100 | | |
City of San Antonio
Revenue Bonds
Series 1997 Escrowed to Maturity
02/01/20 | | | 5.500 | % | | | 1,055,000 | | | | 1,318,645 | | |
Clifton Higher Education Finance Corp.
Revenue Bonds
Idea Public Schools
Series 2011
08/15/41 | | | 5.750 | % | | | 2,000,000 | | | | 2,212,100 | | |
Corpus Christi Business & Job Development Corp.
Improvement Refunding Revenue Bonds
Arena Project
Series 2002 (AMBAC)
09/01/25 | | | 5.000 | % | | | 3,550,000 | | | | 3,691,574 | | |
Dallas County Flood Control District No. 1
Unlimited General Obligation Refunding Bonds
Series 2002
04/01/32 | | | 7.250 | % | | | 7,500,000 | | | | 7,619,925 | | |
Dallas-Fort Worth International Airport Facilities Improvement Corp.
Refunding Revenue Bonds
Series 2012B
11/01/35 | | | 5.000 | % | | | 15,000,000 | | | | 16,667,550 | | |
Dallas-Fort Worth International Airport Facilities Improvement Corp.(a)
Revenue Bonds
Series 2000A (NPFGC/FGIC) AMT
11/01/30 | | | 5.750 | % | | | 1,840,000 | | | | 1,844,103 | | |
Deaf Smith County Hospital District
Limited General Obligation Bonds
Series 2010A
03/01/40 | | | 6.500 | % | | | 4,000,000 | | | | 4,417,080 | | |
Harris County Health Facilities Development Corp.
Refunding Revenue Bonds
Memorial Hermann Healthcare System
Series 2008B
12/01/35 | | | 7.250 | % | | | 8,800,000 | | | | 10,687,336 | | |
The accompanying Notes to Financial Statements are an integral part of this statement.
Annual Report 2012
32
Columbia Tax-Exempt Fund
Portfolio of Investments (continued)
July 31, 2012
Municipal Bonds (continued)
Issue
Description | | Coupon
Rate | | Principal
Amount ($) | | Value ($) | |
Revenue Bonds
St. Luke's Episcopal Hospital Project
Series 1991 Escrowed to Maturity
02/15/21 | | | 6.750 | % | | | 2,000,000 | | | | 2,426,680 | | |
Harris County-Houston Sports Authority(f)
Refunding Revenue Bonds
Capital Appreciation-Senior Lien
Series 2001A (NPFGC)
11/15/14 | | | 0.000 | % | | | 3,905,000 | | | | 3,483,729 | | |
| 11/15/15 | | | 0.000 | % | | | 3,975,000 | | | | 3,368,256 | | |
| 11/15/16 | | | 0.000 | % | | | 4,040,000 | | | | 3,241,615 | | |
Houston Higher Education Finance Corp.
Revenue Bonds
Cosmos Foundation, Inc.
Series 2011A
05/15/41 | | | 6.875 | % | | | 4,045,000 | | | | 4,990,559 | | |
La Vernia Higher Education Finance Corp.
Revenue Bonds
Kipp, Inc.
Series 2009A
08/15/44 | | | 6.375 | % | | | 7,500,000 | | | | 8,753,400 | | |
Matagorda County Navigation District No. 1
Refunding Revenue Bonds
Central Power & Light Co. Project
Series 2001A
11/01/29 | | | 6.300 | % | | | 2,800,000 | | | | 3,252,284 | | |
Mission Economic Development Corp
Revenue Bonds
Dallas Clean Energy McCommas
Series 2011 AMT(a)
12/01/24 | | | 6.875 | % | | | 15,000,000 | | | | 16,082,100 | | |
North East Independent School District
Unlimited General Obligation Refunding Bonds
Series 2007 (Permanent School Fund Guarantee)
02/01/31 | | | 5.250 | % | | | 10,000,000 | | | | 13,501,400 | | |
North Texas Tollway Authority
Refunding Revenue Bonds
1st Tier
Series 2009C
01/01/44 | | | 5.250 | % | | | 10,000,000 | | | | 10,860,000 | | |
Series 2011
01/01/38 | | | 5.000 | % | | | 5,500,000 | | | | 6,067,270 | | |
Toll 2nd Tier
Series 2008F
01/01/38 | | | 5.750 | % | | | 11,355,000 | | | | 12,470,175 | | |
North Texas Tollway Authority(g)
Refunding Revenue Bonds
First Tier
Series 2012B
01/01/42 | | | 5.000 | % | | | 12,845,000 | | | | 13,942,348 | | |
Permanent University Fund
Refunding Revenue Bonds
Series 2007B
07/01/23 | | | 5.250 | % | | | 1,000,000 | | | | 1,322,480 | | |
Municipal Bonds (continued)
Issue
Description | | Coupon
Rate | | Principal
Amount ($) | | Value ($) | |
Sam Rayburn Municipal Power Agency
Refunding Revenue Bonds
Series 2002
10/01/16 | | | 6.000 | % | | | 5,000,000 | | | | 5,033,550 | | |
San Juan Higher Education Finance Authority
Revenue Bonds
Idea Public Schools
Series 2010A
08/15/40 | | | 6.700 | % | | | 2,700,000 | | | | 3,089,070 | | |
Sanger Industrial Development Corp.
Revenue Bonds
Texas Pellets Project
Series 2012A AMT(a)
10/01/13 | | | 10.000 | % | | | 4,000,000 | | | | 3,999,920 | | |
Tarrant County Cultural Education Facilities Finance Corp.
Revenue Bonds
Air Force Obligation Group
Series 2007
05/15/27 | | | 5.125 | % | | | 2,000,000 | | | | 2,037,300 | | |
CC Young Memorial Home
Series 2009A
02/15/38 | | | 8.000 | % | | | 4,000,000 | | | | 4,408,000 | | |
Stayton at Museum Way
Series 2009A
11/15/44 | | | 8.250 | % | | | 12,000,000 | | | | 13,453,320 | | |
Texas City Industrial Development Corp.
Refunding Revenue Bonds
Arco Pipe Line Co. Project
Series 1990
10/01/20 | | | 7.375 | % | | | 2,000,000 | | | | 2,737,400 | | |
Texas State Turnpike Authority(f)
Revenue Bonds
Capital Appreciation 1st Tier
Series 2002A (AMBAC)
08/15/16 | | | 0.000 | % | | | 7,000,000 | | | | 6,311,480 | | |
| 08/15/18 | | | 0.000 | % | | | 10,000,000 | | | | 8,316,000 | | |
| 08/15/19 | | | 0.000 | % | | | 10,330,000 | | | | 8,206,049 | | |
Travis County Health Facilities Development Corp.
Revenue Bonds
Querencia Barton Creek Project
Series 2005
11/15/25 | | | 5.500 | % | | | 1,000,000 | | | | 1,015,210 | | |
Uptown Development Authority
Tax Allocation Bonds
Infrastructure Improvement Facilities
Series 2009
09/01/29 | | | 5.500 | % | | | 500,000 | | | | 547,460 | | |
| Total | | | | | | | 313,893,798 | | |
The accompanying Notes to Financial Statements are an integral part of this statement.
Annual Report 2012
33
Columbia Tax-Exempt Fund
Portfolio of Investments (continued)
July 31, 2012
Municipal Bonds (continued)
Issue
Description | | Coupon
Rate | | Principal
Amount ($) | | Value ($) | |
| Utah 0.5% | |
City of Eagle Mountain
Special Assessment Bonds
Special Improvement District No. 2000-1
Series 2006
02/01/21 | | | 8.250 | % | | | 2,008,000 | | | | 2,024,546 | | |
City of Provo Energy System
Revenue Bonds
Series 1980 Escrowed to Maturity
04/01/15 | | | 10.125 | % | | | 635,000 | | | | 732,580 | | |
Utah Housing Corp.
Revenue Bonds
Series 2003A-1 AMT(a)
07/01/24 | | | 5.125 | % | | | 825,000 | | | | 849,965 | | |
Utah State Building Ownership Authority
Refunding Revenue Bonds
State Facilities Master Lease Program
Series 1998C Escrowed to Maturity (AGM)
05/15/19 | | | 5.500 | % | | | 3,450,000 | | | | 4,069,827 | | |
Utah Transit Authority
Refunding Revenue Bonds
Series 2006C (AGM)
06/15/29 | | | 5.250 | % | | | 10,000,000 | | | | 13,518,500 | | |
Revenue Bonds
Series 2008A
06/15/25 | | | 5.000 | % | | | 2,000,000 | | | | 2,363,160 | | |
| Total | | | | | | | 23,558,578 | | |
| Virginia 1.3% | |
City of Hampton
Prerefunded 01/15/13 Revenue Bonds
Series 2002 (AMBAC)
01/15/28 | | | 5.125 | % | | | 5,350,000 | | | | 5,470,910 | | |
Fairfax County Industrial Development Authority
Refunding Revenue Bonds
Inova Health Systems Project
Series 1993
08/15/23 | | | 5.000 | % | | | 10,000,000 | | | | 12,347,400 | | |
Fairfax County Water Authority
Refunding Revenue Bonds
Subordinated Series 2005B
04/01/24 | | | 5.250 | % | | | 6,175,000 | | | | 8,282,836 | | |
Mosaic District Community Development Authority
Special Assessment Bonds
Series 2011A
03/01/26 | | | 6.625 | % | | | 2,145,000 | | | | 2,395,257 | | |
Richmond Metropolitan Authority
Refunding Revenue Bonds
Series 1998 (NPFGC/FGIC)
07/15/22 | | | 5.250 | % | | | 5,380,000 | | | | 6,403,222 | | |
Escrowed to Maturity
07/15/22 | | | 5.250 | % | | | 2,420,000 | | | | 2,903,589 | | |
Municipal Bonds (continued)
Issue
Description | | Coupon
Rate | | Principal
Amount ($) | | Value ($) | |
Tobacco Settlement Financing Corp.
Prerefunded 06/01/15 Asset-Backed Revenue Bonds
Series 2005
06/01/26 | | | 5.500 | % | | | 9,125,000 | | | | 9,971,983 | | |
| 06/01/37 | | | 5.625 | % | | | 5,500,000 | | | | 6,305,915 | | |
Virginia College Building Authority
Revenue Bonds
Washington & Lee University
Series 2001
01/01/21 | | | 5.375 | % | | | 5,000,000 | | | | 6,076,400 | | |
Virginia Resources Authority
Revenue Bonds
State Revolving Fund
Series 2009
10/01/26 | | | 5.000 | % | | | 1,500,000 | | | | 1,833,765 | | |
| Total | | | | | | | 61,991,277 | | |
| Washington 2.9% | |
Clark County School District No. 37 Vancouver
Unlimited General Obligation Bonds
Series 2001C (NPFGC/FGIC)(f)
12/01/16 | | | 0.000 | % | | | 3,000,000 | | | | 2,837,040 | | |
NJB Properties
Revenue Bonds
King County Washington Project
Series 2006A
12/01/25 | | | 5.000 | % | | | 6,445,000 | | | | 7,083,700 | | |
| 12/01/26 | | | 5.000 | % | | | 7,290,000 | | | | 7,977,666 | | |
Skagit County Public Hospital District No. 1
Revenue Bonds
Skagit Valley Hospital
Series 2005
12/01/30 | | | 5.500 | % | | | 1,235,000 | | | | 1,271,976 | | |
Series 2007
12/01/28 | | | 5.750 | % | | | 1,500,000 | | | | 1,597,425 | | |
| 12/01/32 | | | 5.750 | % | | | 2,000,000 | | | | 2,121,120 | | |
Snohomish County Public Utility District No. 1
Refunding Revenue Bonds
Generation System
Series 1986A Escrowed to Maturity
01/01/20 | | | 5.000 | % | | | 17,750,000 | | | | 22,364,645 | | |
Spokane Public Facilities District
Revenue Bonds
Series 2003 (NPFGC)
12/01/28 | | | 5.750 | % | | | 3,195,000 | | | | 3,353,792 | | |
State of Washington
Unlimited General Obligation Bonds
Series 2007D (AGM)
01/01/30 | | | 4.500 | % | | | 24,470,000 | | | | 26,945,385 | | |
Various Purpose
Series 2008A
07/01/27 | | | 5.000 | % | | | 9,730,000 | | | | 11,481,886 | | |
The accompanying Notes to Financial Statements are an integral part of this statement.
Annual Report 2012
34
Columbia Tax-Exempt Fund
Portfolio of Investments (continued)
July 31, 2012
Municipal Bonds (continued)
Issue
Description | | Coupon
Rate | | Principal
Amount ($) | | Value ($) | |
Washington Health Care Facilities Authority
Revenue Bonds
Overlake Hospital Medical Center
Series 2010
07/01/30 | | | 5.500 | % | | | 3,000,000 | | | | 3,300,540 | | |
Swedish Health Services
Series 2009A
11/15/33 | | | 6.500 | % | | | 11,800,000 | | | | 13,422,264 | | |
Washington Higher Education Facilities Authority
Refunding Revenue Bonds
Whitworth University Project
Series 2009
10/01/40 | | | 5.625 | % | | | 4,685,000 | | | | 5,088,144 | | |
Washington State Housing Finance Commission
Refunding Revenue Bonds
Skyline At First Hill Project
Series 2012
01/01/19 | | | 7.000 | % | | | 6,320,000 | | | | 6,966,157 | | |
Revenue Bonds
Skyline At First Hill Project
Series 2007A
01/01/27 | | | 5.625 | % | | | 2,500,000 | | | | 2,520,750 | | |
| 01/01/38 | | | 5.625 | % | | | 19,450,000 | | | | 19,460,308 | | |
| Total | | | | | | | 137,792,798 | | |
| West Virginia 0.5% | |
West Virginia Economic Development Authority
Refunding Revenue Bonds
Appalachian Power Amos
Series 2010A
12/01/38 | | | 5.375 | % | | | 3,850,000 | | | | 4,239,004 | | |
West Virginia Economic Development Authority(a)(g)
Revenue Bonds
Appalachian Power Co.-Amos Project
Series 2011A AMT
01/01/41 | | | 2.250 | % | | | 3,750,000 | | | | 3,750,000 | | |
West Virginia State Building Commission
Refunding Revenue Bonds
West Virginia Regional Jail
Series 1998A (AMBAC)
07/01/21 | | | 5.375 | % | | | 3,215,000 | | | | 3,616,843 | | |
West Virginia University
Revenue Bonds
University System Projects
Series 1998A (NFPGC)
04/01/28 | | | 5.250 | % | | | 5,000,000 | | | | 6,552,250 | | |
West Virginia University(f)
Revenue Bonds
University System Projects
Series 2000A (AMBAC)
04/01/16 | | | 0.000 | % | | | 3,300,000 | | | | 3,093,849 | | |
| Total | | | | | | | 21,251,946 | | |
Municipal Bonds (continued)
Issue
Description | | Coupon
Rate | | Principal
Amount ($) | | Value ($) | |
| Wisconsin 2.9% | |
City of La Crosse
Refunding Revenue Bonds
Northern States Power Co. Project
Series 1996 AMT(a)
11/01/21 | | | 6.000 | % | | | 6,000,000 | | | | 7,351,800 | | |
Monroe Redevelopment Authority
Revenue Bonds
Monroe Clinic, Inc.
Series 2009
02/15/39 | | | 5.875 | % | | | 5,000,000 | | | | 5,635,700 | | |
State of Wisconsin
Revenue Bonds
Series 2009A
05/01/33 | | | 5.750 | % | | | 17,700,000 | | | | 21,142,650 | | |
Wisconsin Health & Educational Facilities Authority
Refunding Revenue Bonds
Wheaton Healthcare
Series 2006B
08/15/24 | | | 5.125 | % | | | 15,910,000 | | | | 16,774,391 | | |
| 08/15/25 | | | 5.125 | % | | | 15,500,000 | | | | 16,273,295 | | |
Revenue Bonds
Aurora Health Care, Inc.
Series 2003
04/15/33 | | | 6.400 | % | | | 4,250,000 | | | | 4,336,360 | | |
Series 2010A
04/15/39 | | | 5.625 | % | | | 6,100,000 | | | | 6,764,168 | | |
Medical College of Wisconsin
Series 2008A
12/01/35 | | | 5.250 | % | | | 14,400,000 | | | | 15,539,472 | | |
ProHealth Care, Inc.
Series 2012
08/15/28 | | | 5.000 | % | | | 1,570,000 | | | | 1,738,288 | | |
Prohealth Care, Inc. Obligation Group
Series 2009
02/15/32 | | | 6.625 | % | | | 1,000,000 | | | | 1,096,200 | | |
| 02/15/39 | | | 6.625 | % | | | 25,150,000 | | | | 29,371,679 | | |
Riverview Hospital Association
Series 2008
04/01/33 | | | 5.750 | % | | | 6,000,000 | | | | 6,568,680 | | |
| 04/01/38 | | | 5.750 | % | | | 4,000,000 | | | | 4,349,440 | | |
St. John's Community, Inc.
Series 2009A
09/15/29 | | | 7.250 | % | | | 1,000,000 | | | | 1,149,490 | | |
| 09/15/39 | | | 7.625 | % | | | 1,000,000 | | | | 1,159,810 | | |
| Total | | | | | | | 139,251,423 | | |
| Wyoming 0.2% | |
County of Campbell
Revenue Bonds
Basin Electric Power Cooperative
Series 2009A
07/15/39 | | | 5.750 | % | | | 7,900,000 | | | | 9,062,327 | | |
Total Municipal Bonds
(Cost: $4,010,808,613) | | | | | | | 4,533,295,781 | | |
The accompanying Notes to Financial Statements are an integral part of this statement.
Annual Report 2012
35
Columbia Tax-Exempt Fund
Portfolio of Investments (continued)
July 31, 2012
Municipal Bonds Held in Trust 0.7%
Issue
Description | | Effective
Yield | | Amount
Payable at
Maturity ($) | | Value ($) | |
| Massachusetts 0.4% | |
Massachusetts Health & Educational Facilities Authority
Revenue Bonds
Harvard University
Series 2009A(b)(h)(i)
11/15/36 | | | 5.500 | % | | | 16,000,000 | | | | 19,462,240 | | |
| North Carolina 0.1% | |
North Carolina Housing Finance Agency
Revenue Bonds
Series 2002R-II-175 AMT(a)(b)(h)(i)
01/01/34 | | | 5.350 | % | | | 4,735,000 | | | | 4,735,000 | | |
| Texas 0.2% | |
Texas Department of Housing & Community Affairs(a)(b)(h)(i)
Revenue Bonds
Mortgage
Series 2002A (NPFGC) AMT
03/01/34 | | | 5.550 | % | | | 5,230,000 | | | | 5,236,391 | | |
Series 2002B (NPFGC) AMT
09/01/33 | | | 5.550 | % | | | 4,635,000 | | | | 4,640,584 | | |
| Total | | | | | | | 9,876,975 | | |
Total Municipal Bonds Held in Trust
(Cost: $31,816,797) | | | | | | | 34,074,215 | | |
Municipal Preferred Stocks 0.2%
Issue
Description | | Coupon
Rate | | Principal
Amount ($) | | Value ($) | |
| Maryland 0.2% | |
Munimae TE Bond Subsidiary LLC(a)(b)(d)
Series 2000B AMT
06/30/50 | | | 9.640 | % | | | 10,000,000 | | | | 8,999,900 | | |
Series 2005C-3 AMT
11/29/49 | | | 5.500 | % | | | 1,000,000 | | | | 649,990 | | |
| Total | | | | | | | 9,649,890 | | |
Total Municipal Preferred Stocks
(Cost: $11,000,000) | | | | | | | 9,649,890 | | |
Floating Rate Notes 1.4%
Issue
Description | | Effective
Yield | | Amount
Payable at
Maturity ($) | | Value ($) | |
| Colorado 0.2% | |
Colorado Educational & Cultural Facilities Authority(h)
Revenue Bonds
Series 2007 VRDN (U.S. Bank)
06/01/37 | | | 0.140 | % | | | 1,200,000 | | | | 1,200,000 | | |
UJA Federation of Northern New Jersey
VRDN Series 2007 (JPMorgan Chase Bank)
05/01/37 | | | 0.140 | % | | | 2,750,000 | | | | 2,750,000 | | |
Floating Rate Notes (continued)
Issue
Description | | Effective
Yield | | Amount
Payable at
Maturity ($) | | Value ($) | |
County of Pitkin
Refunding Revenue Bonds
Aspen Skiing Co.
VRDN Series 1994B (JP Morgan Chase Bank) AMT(a)(h)
04/01/14 | | | 0.160 | % | | | 5,000,000 | | | | 5,000,000 | | |
| Total | | | | | | | 8,950,000 | | |
| Florida —% | |
Orange County School Board
Certificate of Participation
Series 2008E VRDN (Wells Fargo Bank)(h)
08/01/22 | | | 0.130 | % | | | 800,000 | | | | 800,000 | | |
| Illinois 0.5% | |
City of Chicago
Unlimited General Obligation Bonds
Series 2003 (JPMorgan Chase Bank)(h)
01/01/34 | | | 0.140 | % | | | 21,530,000 | | | | 21,530,000 | | |
| Iowa 0.1% | |
Iowa Finance Authority
Revenue Bonds
Wahlert High School
VRDN Series 2006 (Wells Fargo Bank)(h)
03/01/36 | | | 0.130 | % | | | 1,000,000 | | | | 1,000,000 | | |
Iowa Higher Education Loan Authority(h)
Revenue Bonds
Des Moines University Osteopath
Series 2003 (U.S. Bank)
10/01/33 | | | 0.130 | % | | | 700,000 | | | | 700,000 | | |
Iowa Higher Education Loan Authority(j)
Revenue Bonds
Cornell College
Series 2008 VRDN (JPMorgan Chase Bank)
10/01/38 | | | 0.150 | % | | | 1,820,000 | | | | 1,820,000 | | |
| Total | | | | | | | 3,520,000 | | |
| Kentucky 0.1% | |
County of Christian
Revenue Bonds
Series 2007 VRDN (U.S. Bank)(h)
04/01/37 | | | 0.130 | % | | | 600,000 | | | | 600,000 | | |
County of Shelby
Revenue Bonds
VRDN Series 2004A (U.S. Bank)(h)
09/01/34 | | | 0.130 | % | | | 1,755,000 | | | | 1,755,000 | | |
Lexington-Fayette Urban County Airport Board
Revenue Bonds
VRDN Series 2009 (JP Morgan Chase Bank)(h)
07/01/38 | | | 0.130 | % | | | 2,500,000 | | | | 2,500,000 | | |
| Total | | | | | | | 4,855,000 | | |
The accompanying Notes to Financial Statements are an integral part of this statement.
Annual Report 2012
36
Columbia Tax-Exempt Fund
Portfolio of Investments (continued)
July 31, 2012
Floating Rate Notes (continued)
Issue
Description | | Effective
Yield | | Amount
Payable at
Maturity ($) | | Value ($) | |
| Minnesota 0.1% | |
City of Minneapolis/St. Paul Housing & Redevelopment Authority
Revenue Bonds
Allina Health Systems
VRDN Series 2009B-2 (JP Morgan Chase Bank)(h)
11/15/35 | | | 0.130 | % | | | 1,050,000 | | | | 1,050,000 | | |
Minnesota Higher Education Facilities Authority
Revenue Bonds
St. Olaf College
VRDN Series 2002 (Harris)(h)
10/01/20 | | | 0.130 | % | | | 6,200,000 | | | | 6,200,000 | | |
| Total | | | | | | | 7,250,000 | | |
| Missouri —% | |
Missouri Development Finance Board
Revenue Bonds
VRDN Series 2000C (U.S. Bank)(h)
12/01/20 | | | 0.130 | % | | | 1,000,000 | | | | 1,000,000 | | |
Missouri State Health & Educational Facilities Authority
Revenue Bonds
Bethesda Health Group, Inc.
Series 2009 (U.S. Bank)(h)
08/01/41 | | | 0.130 | % | | | 595,000 | | | | 595,000 | | |
| Total | | | | | | | 1,595,000 | | |
| New Hampshire 0.1% | |
New Hampshire Business Finance Authority
Revenue Bonds
Littleton Regional Hospital
VRDN Series 2007 (TD Banknorth)(h)
10/01/42 | | | 0.120 | % | | | 3,495,000 | | | | 3,495,000 | | |
| Texas 0.1% | |
Harris County Health Facilities Development Corp.
Revenue Bonds
Baylor College of Medicine
Series 2007 VRDN (Wells Fargo Bank)(h)
11/15/47 | | | 0.130 | % | | | 3,000,000 | | | | 3,000,000 | | |
Floating Rate Notes (continued)
Issue
Description | | Effective
Yield | | Amount
Payable at
Maturity ($) | | Value ($) | |
| Vermont 0.1% | |
Vermont Educational & Health Buildings Financing Agency(h)
Revenue Bonds
North Country Hospital & Health
VRDN Series 2007A (TD Banknorth)
10/01/34 | | | 0.130 | % | | | 1,300,000 | | | | 1,300,000 | | |
Northeastern VT Regional Hospital
VRDN Series 2004A (Banknorth)
10/01/29 | | | 0.130 | % | | | 1,500,000 | | | | 1,500,000 | | |
| Total | | | | | | | 2,800,000 | | |
| Wisconsin 0.1% | |
Wisconsin Health & Educational Facilities Authority(h)
Revenue Bonds
Fort Healthcare, Inc.
VRDN Series 2007A (JP Morgan Chase Bank)
05/01/37 | | | 0.150 | % | | | 3,600,000 | | | | 3,600,000 | | |
Meriter Hospital, Inc.
VRDN Series 2002 (JP Morgan Chase & Co.)
12/01/32 | | | 0.150 | % | | | 2,450,000 | | | | 2,450,000 | | |
| Total | | | | | | | 6,050,000 | | |
Total Floating Rate Notes
(Cost: $63,845,000) | | | | | | | 63,845,000 | | |
Money Market Funds 2.1%
| | | Shares | | Value ($) | |
Dreyfus Tax-Exempt Cash
Management Fund, 0.000%(k) | | | 35,716,806 | | | | 35,716,806 | | |
JPMorgan Municipal Money
Market Fund, 0.000%(k) | | | 64,224,432 | | | | 64,224,432 | | |
Total Money Market Funds
(Cost: $99,941,238) | | | | | 99,941,238 | | |
Total Investments
(Cost: $4,217,411,648) | | | | | 4,740,806,124 | | |
| Other Assets & Liabilities, Net | | | | | (8,888,834 | ) | |
| Total Net Assets | | | | | 4,731,917,290 | | |
Notes to Portfolio of Investments
(a) Income from this security may be subject to alternative minimum tax.
(b) Security exempt from registration pursuant to Rule 144A under the Securities Act of 1933. This security may be resold in transactions exempt from registration, normally to qualified institutional buyers. At July 31, 2012, the value of these securities amounted to $103,521,703 or 2.19% of net assets.
(c) Municipal obligations include debt obligations issued by or on behalf of territories, possessions, or sovereign nations within the territorial boundaries of the United States. At July 31, 2012, the value of these securities amounted to $144,674,643 or 3.06% of net assets.
The accompanying Notes to Financial Statements are an integral part of this statement.
Annual Report 2012
37
Columbia Tax-Exempt Fund
Portfolio of Investments (continued)
July 31, 2012
Notes to Portfolio of Investments (continued)
(d) Identifies issues considered to be illiquid as to their marketability. The aggregate value of such securities at July 31, 2012 was $59,181,811, representing 1.25% of net assets. Information concerning such security holdings at July 31, 2012 was as follows:
| Security Description | | Acquisition Dates | | Cost ($) | |
Boston Industrial Development Financing Authority
Revenue Bonds
Crosstown Center Project
Senior Series 2002 AMT
6.500% 09/01/35 | | 09/20/02 | | | 2,811,319 | | |
Broward County Housing Finance Authority
Revenue Bonds
Chaves Lake Apartments Project
Series 2000A AMT
7.500% 07/01/40 | | 03/07/00 | | | 7,780,719 | | |
Cabazon Band Mission Indians
Revenue Bonds
Series 2004
13.000% 06/01/12 | | 05/14/10 | | | 365,949 | | |
Cabazon Band Mission Indians
Revenue Bonds
Series 2004
8.375% 10/01/15 | | 10/04/04 - 05/14/10 | | | 1,691,224 | | |
Cabazon Band Mission Indians
Revenue Bonds
Series 2004
8.750% 10/01/19 | | 10/04/04 - 05/14/10 | | | 8,381,812 | | |
Cabazon Band Mission Indians
Revenue Bonds
Series 2010
8.375% 10/01/20 | | 05/14/10 | | | 1,415,000 | | |
California Municipal Finance Authority
Revenue Bonds
UTS Renewable Energy-Waste Water
Series 2011 AMT
3.950% 12/01/15 | | 12/22/11 | | | 1,415,000 | | |
California Municipal Finance Authority
Revenue Bonds
UTS Renewable Energy-Waste Water
Series 2011 AMT
7.500% 12/01/32 | | 12/22/11 | | | 1,925,000 | | |
Capital Trust Agency, Inc.
Revenue Bonds
Atlantic Housing Foundation
Subordinated Series 2008B
7.000% 07/15/32 | | 07/23/08 | | | 1,895,000 | | |
Chester County Industrial Development Authority
RHA/Pennsylvania Nursing Home-1st Mortgage
Series 2002
8.500% 05/01/32 | | 05/01/02 | | | 5,506,316 | | |
The accompanying Notes to Financial Statements are an integral part of this statement.
Annual Report 2012
38
Columbia Tax-Exempt Fund
Portfolio of Investments (continued)
July 31, 2012
Notes to Portfolio of Investments (continued)
| Security Description | | Acquisition Dates | | Cost ($) | |
Durham Housing Authority
Revenue Bonds
Series 2005 AMT
5.650% 02/01/38 | | 12/18/06 | | | 3,191,281 | | |
Hickory Chase Community Authority
Revenue Bonds
Hickory Chase Project
Series 2008
6.750% 12/01/27 | | 04/23/08 | | | 5,644,000 | | |
Illinois Finance Authority
Revenue Bonds
Sedgebrook, Inc. Facility
Series 2007A
0.000% 11/15/11 | | 08/17/07 | | | 713,670 | | |
Indianapolis Airport Authority
Revenue Bonds
Special Facilities-United Air Lines Project
Series 1995A AMT
6.500% 11/15/31 | | 10/17/95 | | | 803,250 | | |
Massachusetts Development Finance Agency
Revenue Bonds
Groves-Lincoln
Series 20009A
7.750% 06/01/39 | | 11/12/09 - 11/16/09 | | | 2,223,858 | | |
Massachusetts Development Finance Agency
Revenue Bonds
Linden Ponds, Inc. Facility
Series 2011B
0.000% 11/15/56 | | 06/04/11 | | | 1,530 | | |
Metropolitan Government Nashville & Davidson County
Health & Educational Facilities Board
1st Mortgage-AHF Project
Series 2003
8.500% 01/01/29 | | 12/30/03 | | | 378,917 | | |
Michigan Strategic Fund
Refunding Revenue Bonds
Michigan Sugar Co.-Carollton
Series 1998C AMT
6.550% 11/01/25 | | 11/24/98 | | | 4,250,000 | | |
Middlesex County Improvement Authority
Subordinated Revenue Bonds
Heldrich Center Hotel
Series 2005B
6.250% 01/01/37 | | 03/18/05 | | | 3,865,993 | | |
Middlesex County Improvement Authority
Revenue Bonds
Heldrich Center Hotel
Series 2005C
8.750% 01/01/37 | | 09/25/07 | | | 1,461,135 | | |
The accompanying Notes to Financial Statements are an integral part of this statement.
Annual Report 2012
39
Columbia Tax-Exempt Fund
Portfolio of Investments (continued)
July 31, 2012
Notes to Portfolio of Investments (continued)
| Security Description | | Acquisition Dates | | Cost ($) | |
Munimae TE Bond Subsidiary LLC
Series 2000B AMT
9.640% 06/30/50 | | 05/30/00 | | | 10,000,000 | | |
Munimae TE Bond Subsidiary LLC
Series 2005C-3 AMT
5.500% 11/29/49 | | 11/02/05 | | | 1,000,000 | | |
Rankin County Five Lakes Utility District
Series 1994
7.000% 07/15/37 | | 10/02/07 | | | 465,000 | | |
Resolution Trust Corp.
Pass-Through Certificates
Series 1993A
8.500% 12/01/16 | | 08/27/93 | | | 6,673,637 | | |
Washington County Industrial Development Authority
1st Mortgage
Central Project
Series 2003
8.500% 01/01/29 | | 12/30/03 | | | 1,893,640 | | |
(e) Represents securities that have defaulted on payment of interest. The Fund has stopped accruing interest on these securities. At July 31, 2012, the value of these securities amounted to $12,890,945, which represents 0.27% of net assets.
(f) Zero coupon bond.
(g) Represents a security purchased on a when-issued or delayed delivery basis.
(h) Variable rate security. The interest rate shown reflects the rate as of July 31, 2012.
(i) The Fund entered into transactions in which it transfers to trusts fixed rate municipal bonds in exchange for cash and residual interests in the trusts' assets and cash flows, which are in the form of inverse floating rate securities. The trust funds the purchases of the municipal bonds by issuing short-term floating rate notes to third parties, which are included as a liability in the Fund's Statement of Assets and Liabilities. The liability approximates fair value. The municipal bonds transferred to the trusts remain in the Fund's Portfolio of Investments.
(j) Interest rate varies either based on a predetermined schedule or to reflect current market conditions; rate shown is the effective rate on July 31, 2012. The maturity date disclosed represents the final maturity. For purposes of Rule 2a-7, maturity is the later of the next put or interest rate reset date.
(k) The rate shown is the seven-day current annualized yield at July 31, 2012.
The accompanying Notes to Financial Statements are an integral part of this statement.
Annual Report 2012
40
Columbia Tax-Exempt Fund
Portfolio of Investments (continued)
July 31, 2012
Notes to Portfolio of Investments (continued)
Abbreviation Legend
AGM Assured Guaranty Municipal Corporation
AMBAC Ambac Assurance Corporation
AMT Alternative Minimum Tax
CHF Collegiate Housing Foundation
FGIC Financial Guaranty Insurance Company
FHA Federal Housing Authority
FHLMC Federal Home Loan Mortgage Corporation
FNMA Federal National Mortgage Association
GNMA Government National Mortgage Association
MGIC Mortgage Guaranty Insurance Corporation
NPFGC National Public Finance Guarantee Corporation
TCRS Transferable Custodial Receipts
VRDN Variable Rate Demand Note
XLCA XL Capital Assurance
Currency Legend
USD US Dollar
Fair Value Measurements
Generally accepted accounting principles (GAAP) require disclosure regarding the inputs and valuation techniques used to measure fair value and any changes in valuation inputs or techniques. In addition, investments shall be disclosed by major category.
The Fund categorizes its fair value measurements according to a three-level hierarchy that maximizes the use of observable inputs and minimizes the use of unobservable inputs by prioritizing that the most observable input be used when available. Observable inputs are those that market participants would use in pricing an investment based on market data obtained from sources independent of the reporting entity. Unobservable inputs are those that reflect the Fund's assumptions about the information market participants would use in pricing an investment. An investment's level within the fair value hierarchy is based on the lowest level of any input that is deemed significant to the asset or liability's fair value measurement. The input levels are not necessarily an indication of the risk or liquidity associated with investments at that level. For example, certain U.S. government securities are generally high quality and liquid, however, they are reflected as Level 2 because the inputs used to determine fair value may not always be quoted prices in an active market.
Fair value inputs are summarized in the three broad levels listed below:
> Level 1 — Valuations based on quoted prices for investments in active markets that the Fund has the ability to access at the measurement date (including NAV for open-end mutual funds). Valuation adjustments are not applied to Level 1 investments.
> Level 2 — Valuations based on other significant observable inputs (including quoted prices for similar securities, interest rates, prepayment speeds, credit risks, etc.).
> Level 3 — Valuations based on significant unobservable inputs (including the Fund's own assumptions and judgment in determining the fair value of investments).
Inputs that are used in determining fair value of an investment may include price information, credit data, volatility statistics, and other factors. These inputs can be either observable or unobservable. The availability of observable inputs can vary between investments, and is affected by various factors such as the type of investment, and the volume and level of activity for that investment or similar investments in the marketplace. The inputs will be considered by the Investment Manager, along with any other relevant factors in the calculation of an investment's fair value. The Fund uses prices and inputs that are current as of the measurement date, which may include periods of market dislocations. During these periods, the availability of prices and inputs may be reduced for many investments. This condition could cause an investment to be reclassified between the various levels within the hierarchy.
The accompanying Notes to Financial Statements are an integral part of this statement.
Annual Report 2012
41
Columbia Tax-Exempt Fund
Portfolio of Investments (continued)
July 31, 2012
Fair Value Measurements (continued)
Investments falling into the Level 3 category are primarily supported by quoted prices from brokers and dealers participating in the market for those investments. However, these may be classified as Level 3 investments due to lack of market transparency and corroboration to support these quoted prices. Additionally, valuation models may be used as the pricing source for any remaining investments classified as Level 3. These models rely on one or more significant unobservable inputs and/or significant assumptions by the Investment Manager. Inputs used in valuations may include, but are not limited to, financial statement analysis, capital account balances, discount rates and estimated cash flows, and comparable company data.
Under the direction of the Fund's Board of Trustees (the Board), the Investment Manager's Valuation Committee (the Committee) is responsible for carrying out the valuation procedures approved by the Board. The Committee consists of voting and non-voting members from various groups within the Investment Manager's organization, including operations and accounting, trading and investments, compliance, risk management and legal.
The Committee meets at least monthly to review and approve valuation matters, which may include a description of specific valuation determinations, data regarding pricing information received from approved pricing vendors and brokers and the results of Board-approved valuation control policies and procedures (the Policies). The Policies address, among other things, instances when market quotations are readily available, including recommendation of third party pricing vendors and a determination of appropriate pricing methodologies; events that require specific valuation determinations and assessment of fair value techniques; securities with a potential for stale pricing, including those that are illiquid, restricted, or in default; and the effectiveness of third-party pricing vendors, including periodic reviews of vendors. The Committee meets more frequently, as needed, to discuss additional valuation matters, which may include the need to review back-testing results, review time-sensitive information or approve related valuation actions. The Committee reports to the Board, with members of the Committee meeting with the Board at each of its regularly scheduled meetings to discuss valuation matters and actions during the period, similar to those described earlier.
For investments categorized as Level 3, the Committee monitors information similar to that described above, which may include: (i) data specific to the issuer or comparable issuers, (ii) general market or specific sector news and (iii) quoted prices and specific or similar security transactions. The Committee considers this data and any changes from prior periods in order to assess the reasonableness of observable and unobservable inputs, any assumptions or internal models used to value those securities and changes in fair value. This data is also used to corroborate, when available, information received from approved pricing vendors and brokers. Various factors impact the frequency of monitoring this information (which may occur as often as daily). However, the Committee may determine that changes to inputs, assumptions and models are not required as a result of the monitoring procedures performed.
The following table is a summary of the inputs used to value the Fund's investments at July 31, 2012:
| Description | | Level 1
Quoted Prices in Active
Markets for Identical
Assets ($) | | Level 2
Other Significant
Observable Inputs ($) | | Level 3
Significant
Unobservable Inputs ($) | | Total ($) | |
| Equity Securities | |
| Municipal Preferred Stocks | | | | | 9,649,890 | | | | | | 9,649,890 | | |
| Total Equity Securities | | | — | | | | 9,649,890 | | | | — | | | | 9,649,890 | | |
| Bonds | |
| Municipal Bonds | | | — | | | | 4,533,295,781 | | | | — | | | | 4,533,295,781 | | |
| Municipal Bonds Held in Trust | | | — | | | | 34,074,215 | | | | — | | | | 34,074,215 | | |
| Total Bonds | | | — | | | | 4,567,369,996 | | | | — | | | | 4,567,369,996 | | |
| Short-Term Securities | |
| Floating Rate Notes | | | — | | | | 63,845,000 | | | | — | | | | 63,845,000 | | |
| Total Short-Term Securities | | | — | | | | 63,845,000 | | | | — | | | | 63,845,000 | | |
| Other | |
| Money Market Funds | | | 99,941,238 | | | | — | | | | — | | | | 99,941,238 | | |
| Total Other | | | 99,941,238 | | | | — | | | | — | | | | 99,941,238 | | |
| Total | | | 99,941,238 | | | | 4,640,864,886 | | | | — | | | | 4,740,806,124 | | |
See the Portfolio of Investments for all investment classifications not indicated in the table.
The Fund's assets assigned to the Level 2 input category are generally valued using the market approach, in which a security's value is determined through reference to prices and information from market transactions for similar or identical assets.
There were no transfers of financial assets between Levels 1 and 2 during the period.
The accompanying Notes to Financial Statements are an integral part of this statement.
Annual Report 2012
42
Columbia Tax-Exempt Fund
Statement of Assets and Liabilities
July 31, 2012
| Assets | |
| Investments, at value | |
| (identified cost $4,217,411,648) | | $ | 4,740,806,124 | | |
| Receivable for: | |
| Investments sold | | | 2,552,887 | | |
| Capital shares sold | | | 12,926,201 | | |
| Interest | | | 49,267,685 | | |
| Expense reimbursement due from Investment Manager | | | 11,840 | | |
| Prepaid expenses | | | 38,506 | | |
| Trustees' deferred compensation plan | | | 238,069 | | |
| Total assets | | | 4,805,841,312 | | |
| Liabilities | |
| Short-term floating rate notes outstanding | | | 20,700,000 | | |
| Payable for: | |
| Investments purchased on a delayed delivery basis | | | 30,974,648 | | |
| Capital shares purchased | | | 4,659,811 | | |
| Dividend distributions to shareholders | | | 16,001,826 | | |
| Investment management fees | | | 47,333 | | |
| Distribution and service fees | | | 23,254 | | |
| Transfer agent fees | | | 560,936 | | |
| Administration fees | | | 7,478 | | |
| Compensation of board members | | | 103,584 | | |
| Chief compliance officer expenses | | | 320 | | |
| Other expenses | | | 606,763 | | |
| Trustees' deferred compensation plan | | | 238,069 | | |
| Total liabilities | | | 73,924,022 | | |
| Net assets applicable to outstanding capital stock | | $ | 4,731,917,290 | | |
| Represented by | |
| Paid-in capital | | $ | 4,313,057,557 | | |
| Undistributed net investment income | | | 13,699,346 | | |
| Accumulated net realized loss | | | (118,234,089 | ) | |
| Unrealized appreciation (depreciation) on: | |
| Investments | | | 523,394,476 | | |
| Total — representing net assets applicable to outstanding capital stock | | $ | 4,731,917,290 | | |
The accompanying Notes to Financial Statements are an integral part of this statement.
Annual Report 2012
43
Columbia Tax-Exempt Fund
Statement of Assets and Liabilities (continued)
July 31, 2012
| Class A | |
| Net assets | | $ | 3,848,956,549 | | |
| Shares outstanding | | | 269,714,141 | | |
| Net asset value per share | | $ | 14.27 | | |
| Maximum offering price per share(a) | | $ | 14.98 | | |
| Class B | |
| Net assets | | $ | 9,007,766 | | |
| Shares outstanding | | | 631,855 | | |
| Net asset value per share | | $ | 14.26 | | |
| Class C | |
| Net assets | | $ | 93,116,924 | | |
| Shares outstanding | | | 6,528,011 | | |
| Net asset value per share | | $ | 14.26 | | |
| Class Z | |
| Net assets | | $ | 780,836,051 | | |
| Shares outstanding | | | 54,712,021 | | |
| Net asset value per share | | $ | 14.27 | | |
(a) The maximum offering price per share is calculated by dividing the net asset value by 1.0 minus the maximum sales charge of 4.75%.
The accompanying Notes to Financial Statements are an integral part of this statement.
Annual Report 2012
44
Columbia Tax-Exempt Fund
Statement of Operations
| | | Year Ended
July 31,
2012(a) | | Year Ended
November 30,
2011 | |
| Net investment income | |
| Income: | |
| Dividends | | $ | 14,896 | | | $ | 34,453 | | |
| Interest | | | 152,893,243 | | | | 167,146,343 | | |
| Total income | | | 152,908,139 | | | | 167,180,796 | | |
| Expenses: | |
| Investment management fees | | | 11,382,292 | | | | 12,644,779 | | |
| Distribution fees | |
| Class B | | | 60,702 | | | | 75,966 | | |
| Class C | | | 438,820 | | | | 424,507 | | |
| Service fees | |
| Class A | | | 5,058,836 | | | | 4,896,170 | | |
| Class B | | | 16,187 | | | | 20,268 | | |
| Class C | | | 117,056 | | | | 113,222 | | |
| Transfer agent fees | |
| Class A | | | 2,546,971 | | | | 2,566,476 | | |
| Class B | | | 7,993 | | | | 10,797 | | |
| Class C | | | 59,426 | | | | 62,708 | | |
| Class Z | | | 508,838 | | | | 797,084 | | |
| Administration fees | | | 1,799,630 | | | | 1,621,818 | | |
| Compensation of board members | | | 121,446 | | | | 57,097 | | |
| Pricing and bookkeeping fees | | | — | | | | 86,802 | | |
| Custodian fees | | | 26,969 | | | | 45,349 | | |
| Printing and postage fees | | | 277,630 | | | | 148,531 | | |
| Registration fees | | | 312,488 | | | | 72,992 | | |
| Professional fees | | | 242,583 | | | | 115,371 | | |
| Interest expense — inverse floating rate notes | | | 96,106 | | | | 79,499 | | |
| Interest expense — line of credit | | | — | | | | 148 | | |
| Chief compliance officer expenses | | | 2,562 | | | | 2,314 | | |
| Other | | | 74,168 | | | | 181,087 | | |
| Total expenses | | | 23,150,703 | | | | 24,022,985 | | |
| Fees waived or expenses reimbursed by Investment Manager and its affiliates | | | (37,429 | ) | | | (575,239 | ) | |
| Interest expense reimbursement by Investment Manager | | | — | | | | (148 | ) | |
| Fees waived by Distributor — Class C | | | (87,652 | ) | | | (84,839 | ) | |
| Expense reductions | | | (6,978 | ) | | | (8,094 | ) | |
| Total net expenses | | | 23,018,644 | | | | 23,354,665 | | |
| Net investment income | | | 129,889,495 | | | | 143,826,131 | | |
| Realized and unrealized gain (loss) — net | |
| Net realized gain (loss) on: | |
| Investments | | | (5,924,021 | ) | | | (8,172,164 | ) | |
| Futures contracts | | | — | | | | (1,646,050 | ) | |
| Net realized loss | | | (5,924,021 | ) | | | (9,818,214 | ) | |
| Net change in unrealized appreciation (depreciation) on: | |
| Investments | | | 283,886,630 | | | | 106,690,130 | | |
| Net change in unrealized appreciation | | | 283,886,630 | | | | 106,690,130 | | |
| Net realized and unrealized gain | | | 277,962,609 | | | | 96,871,916 | | |
| Net increase in net assets resulting from operations | | $ | 407,852,104 | | | $ | 240,698,047 | | |
(a) For the period December 1, 2011 to July 31, 2012. During the period, the Fund's fiscal year end was changed from November 30 to July 31.
The accompanying Notes to Financial Statements are an integral part of this statement.
Annual Report 2012
45
Columbia Tax-Exempt Fund
Statement of Changes in Net Assets
| | | Year Ended
July 31,
2012(a) | | Year Ended
November 30,
2011 | | Year Ended
November 30,
2010 | |
| Operations | |
| Net investment income | | $ | 129,889,495 | | | $ | 143,826,131 | | | $ | 100,380,903 | | |
| Net realized gain (loss) | | | (5,924,021 | ) | | | (9,818,214 | ) | | | 23,322,707 | | |
| Net change in unrealized appreciation (depreciation) | | | 283,886,630 | | | | 106,690,130 | | | | (8,982,008 | ) | |
| Net increase in net assets resulting from operations | | | 407,852,104 | | | | 240,698,047 | | | | 114,721,602 | | |
| Distributions to shareholders from | |
| Net investment income | |
| Class A | | | (103,615,875 | ) | | | (109,526,581 | ) | | | (59,546,856 | ) | |
| Class B | | | (274,672 | ) | | | (376,116 | ) | | | (351,849 | ) | |
| Class C | | | (2,071,509 | ) | | | (2,194,051 | ) | | | (1,387,776 | ) | |
| Class Z | | | (21,546,227 | ) | | | (33,366,448 | ) | | | (38,237,268 | ) | |
| Total distributions to shareholders | | | (127,508,283 | ) | | | (145,463,196 | ) | | | (99,523,749 | ) | |
| Increase (decrease) in net assets from share transactions | | | (68,386,578 | ) | | | 2,281,307,620 | | | | (115,047,540 | ) | |
| Proceeds from regulatory settlements (Note 6) | | | 1,263 | | | | — | | | | 19,753 | | |
| Total increase (decrease) in net assets | | | 211,958,506 | | | | 2,376,542,471 | | | | (99,829,934 | ) | |
| Net assets at beginning of year | | | 4,519,958,784 | | | | 2,143,416,313 | | | | 2,243,246,247 | | |
| Net assets at end of year | | $ | 4,731,917,290 | | | $ | 4,519,958,784 | | | $ | 2,143,416,313 | | |
| Undistributed net investment income | | $ | 13,699,346 | | | $ | 10,904,960 | | | $ | 8,356,194 | | |
(a) For the period December 1, 2011 to July 31, 2012. During the period, the Fund's fiscal year end was changed from November 30 to July 31.
The accompanying Notes to Financial Statements are an integral part of this statement.
Annual Report 2012
46
Columbia Tax-Exempt Fund
Statement of Changes in Net Assets (continued)
| | | Year Ended July 31, 2012(a) | | Year Ended November 30, 2011 | | Year Ended November 30, 2010 | |
| | | Shares | | Dollars($) | | Shares | | Dollars($) | | Shares | | Dollars($) | |
| Capital stock activity | |
| Class A shares | |
| Subscriptions(b) | | | 7,682,634 | | | | 107,162,181 | | | | 6,323,418 | | | | 83,458,835 | | | | 3,085,001 | | | | 41,173,657 | | |
| Fund merger | | | — | | | | — | | | | 190,123,507 | | | | 2,497,521,878 | | | | — | | | | — | | |
| Distributions reinvested | | | 5,692,109 | | | | 79,689,322 | | | | 6,053,123 | | | | 79,801,662 | | | | 3,170,799 | | | | 42,260,626 | | |
| Redemptions | | | (19,805,586 | ) | | | (275,674,737 | ) | | | (25,833,279 | ) | | | (338,087,704 | ) | | | (11,207,263 | ) | | | (149,201,003 | ) | |
| Net increase (decrease) | | | (6,430,843 | ) | | | (88,823,234 | ) | | | 176,666,769 | | | | 2,322,694,671 | | | | (4,951,463 | ) | | | (65,766,720 | ) | |
| Class B shares | |
| Subscriptions | | | 25,006 | | | | 349,550 | | | | 24,424 | | | | 324,482 | | | | 15,355 | | | | 204,468 | | |
| Fund merger | | | — | | | | — | | | | 1,348,328 | | | | 17,698,627 | | | | — | | | | — | | |
| Distributions reinvested | | | 15,940 | | | | 222,656 | | | | 19,494 | | | | 256,930 | | | | 14,784 | | | | 196,559 | | |
| Redemptions(b) | | | (350,098 | ) | | | (4,926,501 | ) | | | (970,488 | ) | | | (12,716,353 | ) | | | (489,987 | ) | | | (6,520,004 | ) | |
| Net increase (decrease) | | | (309,152 | ) | | | (4,354,295 | ) | | | 421,758 | | | | 5,563,686 | | | | (459,848 | ) | | | (6,118,977 | ) | |
| Class C shares | |
| Subscriptions | | | 943,493 | | | | 13,161,965 | | | | 641,064 | | | | 8,476,571 | | | | 641,984 | | | | 8,576,510 | | |
| Fund merger | | | — | | | | — | | | | 3,452,081 | | | | 45,338,027 | | | | — | | | | — | | |
| Distributions reinvested | | | 110,114 | | | | 1,541,112 | | | | 100,543 | | | | 1,325,678 | | | | 50,282 | | | | 670,608 | | |
| Redemptions | | | (612,772 | ) | | | (8,544,171 | ) | | | (953,671 | ) | | | (12,399,708 | ) | | | (457,045 | ) | | | (6,102,688 | ) | |
| Net increase | | | 440,835 | | | | 6,158,906 | | | | 3,240,017 | | | | 42,740,568 | | | | 235,221 | | | | 3,144,430 | | |
| Class Z shares | |
| Subscriptions | | | 4,868,436 | | | | 68,006,637 | | | | 4,272,588 | | | | 55,792,716 | | | | 5,904,278 | | | | 78,403,006 | | |
| Distributions reinvested | | | 414,083 | | | | 5,800,063 | | | | 632,731 | | | | 8,244,270 | | | | 666,949 | | | | 8,890,492 | | |
| Redemptions | | | (3,945,590 | ) | | | (55,174,655 | ) | | | (11,959,938 | ) | | | (153,728,291 | ) | | | (10,050,193 | ) | | | (133,599,771 | ) | |
| Net increase (decrease) | | | 1,336,929 | | | | 18,632,045 | | | | (7,054,619 | ) | | | (89,691,305 | ) | | | (3,478,966 | ) | | | (46,306,273 | ) | |
| Total net increase (decrease) | | | (4,962,231 | ) | | | (68,386,578 | ) | | | 173,273,925 | | | | 2,281,307,620 | | | | (8,655,056 | ) | | | (115,047,540 | ) | |
(a) For the period December 1, 2011 to July 31, 2012. During the period, the Fund's fiscal year end was changed from November 30 to July 31.
(b) Includes conversions of Class B shares to Class A shares, if any.
The accompanying Notes to Financial Statements are an integral part of this statement.
Annual Report 2012
47
Columbia Tax-Exempt Fund
Financial Highlights
The following tables are intended to help you understand the Fund's financial performance. Certain information reflects financial results for a single share of a class held for the periods shown. Per share net investment income (loss) amounts are calculated based on average shares outstanding during the period. Total returns assume reinvestment of all dividends and distributions. Total returns do not reflect payment of sales charges, if any, and are not annualized for periods of less than one year.
| | | Year Ended
July 31, | | Year Ended November 30, | |
| Class A | | 2012(a) | | 2011 | | 2010 | | 2009 | | 2008 | | 2007 | |
| Per share data | |
| Net asset value, beginning of period | | $ | 13.43 | | | $ | 13.13 | | | $ | 13.05 | | | $ | 11.95 | | | $ | 13.52 | | | $ | 13.88 | | |
| Income from investment operations: | |
| Net investment income | | | 0.39 | | | | 0.58 | | | | 0.59 | | | | 0.60 | | | | 0.59 | | | | 0.60 | | |
| Net realized and unrealized gain (loss) | | | 0.83 | | | | 0.31 | | | | 0.08 | | | | 1.09 | | | | (1.57 | ) | | | (0.37 | ) | |
| Total from investment operations | | | 1.22 | | | | 0.89 | | | | 0.67 | | | | 1.69 | | | | (0.98 | ) | | | 0.23 | | |
| Less distributions to shareholders: | |
| Net investment income | | | (0.38 | ) | | | (0.59 | ) | | | (0.59 | ) | | | (0.59 | ) | | | (0.59 | ) | | | (0.59 | ) | |
| Total distributions to shareholders | | | (0.38 | ) | | | (0.59 | ) | | | (0.59 | ) | | | (0.59 | ) | | | (0.59 | ) | | | (0.59 | ) | |
| Proceeds from regulatory settlements | | | 0.00 | (b) | | | — | | | | 0.00 | (b) | | | — | | | | — | | | | — | | |
| Net asset value, end of period | | $ | 14.27 | | | $ | 13.43 | | | $ | 13.13 | | | $ | 13.05 | | | $ | 11.95 | | | $ | 13.52 | | |
| Total return | | | 9.18 | % | | | 7.00 | % | | | 5.12 | % | | | 14.42 | % | | | (7.48 | %) | | | 1.74 | % | |
| Ratios to average net assets(c) | |
Expenses prior to fees waived or expenses
reimbursed (including interest expense)(d) | | | 0.76 | %(e) | | | 0.76 | % | | | 0.80 | % | | | 0.80 | % | | | 0.80 | % | | | 0.82 | % | |
Net expenses after fees waived or expenses
reimbursed (including interest expense)(d)(f) | | | 0.76 | %(e)(g) | | | 0.75 | %(g) | | | 0.80 | %(g) | | | 0.80 | %(g) | | | 0.80 | %(g) | | | 0.82 | %(g) | |
Expenses prior to fees waived or expenses
reimbursed (excluding interest expense) | | | 0.76 | %(e) | | | 0.76 | % | | | 0.80 | % | | | 0.80 | % | | | 0.78 | % | | | 0.78 | % | |
Net expenses after fees waived or expenses
reimbursed (excluding interest expense)(f) | | | 0.76 | %(e)(g) | | | 0.75 | %(g) | | | 0.80 | %(g) | | | 0.80 | %(g) | | | 0.78 | %(g) | | | 0.78 | %(g) | |
| Net investment income | | | 4.17 | %(e)(g) | | | 4.41 | %(g) | | | 4.43 | %(g) | | | 4.73 | %(g) | | | 4.56 | %(g) | | | 4.40 | %(g) | |
| Supplemental data | |
| Net assets, end of period (in thousands) | | $ | 3,848,957 | | | $ | 3,708,744 | | | $ | 1,305,921 | | | $ | 1,362,545 | | | $ | 1,296,698 | | | $ | 1,533,614 | | |
| Portfolio turnover | | | 5 | % | | | 11 | % | | | 11 | % | | | 12 | % | | | 14 | % | | | 13 | % | |
Notes to Financial Highlights
(a) For the period from December 1, 2011 to July 31, 2012. During the period, the Fund's fiscal year end was changed from November 30 to July 31.
(b) Rounds to less than $0.01.
(c) In addition to the fees and expenses which the Fund bears directly, the Fund indirectly bears a pro rata share of the fees and expenses of the acquired funds in which it invests. Such indirect expenses are not included in the reported expense ratios.
(d) Ratios include interest and fee expense related to the Fund's participation in certain inverse floater programs, if any. Due to an equal increase in interest income from fixed rate municipal bonds held in trust, there is no impact on the Fund's net assets, net asset value per share, total return or net investment income.
(e) Annualized.
(f) The Investment Manager and certain of its affiliates agreed to waive/reimburse certain fees and expenses, if applicable.
(g) The benefits derived from expense reductions had an impact of less than 0.01%.
The accompanying Notes to Financial Statements are an integral part of this statement.
Annual Report 2012
48
Columbia Tax-Exempt Fund
Financial Highlights (continued)
| | | Year Ended
July 31, | | Year Ended November 30, | |
| Class B | | 2012(a) | | 2011 | | 2010 | | 2009 | | 2008 | | 2007 | |
| Per share data | |
| Net asset value, beginning of period | | $ | 13.42 | | | $ | 13.13 | | | $ | 13.05 | | | $ | 11.95 | | | $ | 13.52 | | | $ | 13.88 | | |
| Income from investment operations: | |
| Net investment income | | | 0.32 | | | | 0.48 | | | | 0.49 | | | | 0.50 | | | | 0.50 | | | | 0.50 | | |
| Net realized and unrealized gain (loss) | | | 0.84 | | | | 0.30 | | | | 0.08 | | | | 1.10 | | | | (1.58 | ) | | | (0.37 | ) | |
| Total from investment operations | | | 1.16 | | | | 0.78 | | | | 0.57 | | | | 1.60 | | | | (1.08 | ) | | | 0.13 | | |
| Less distributions to shareholders: | |
| Net investment income | | | (0.32 | ) | | | (0.49 | ) | | | (0.49 | ) | | | (0.50 | ) | | | (0.49 | ) | | | (0.49 | ) | |
| Total distributions to shareholders | | | (0.32 | ) | | | (0.49 | ) | | | (0.49 | ) | | | (0.50 | ) | | | (0.49 | ) | | | (0.49 | ) | |
| Proceeds from regulatory settlements | | | 0.00 | (b) | | | — | | | | 0.00 | (b) | | | — | | | | — | | | | — | | |
| Net asset value, end of period | | $ | 14.26 | | | $ | 13.42 | | | $ | 13.13 | | | $ | 13.05 | | | $ | 11.95 | | | $ | 13.52 | | |
| Total return | | | 8.68 | % | | | 6.12 | % | | | 4.34 | % | | | 13.57 | % | | | (8.17 | %) | | | 0.98 | % | |
| Ratios to average net assets(c) | |
Expenses prior to fees waived or expenses
reimbursed (including interest expense)(d) | | | 1.51 | %(e) | | | 1.51 | % | | | 1.55 | % | | | 1.55 | % | | | 1.55 | % | | | 1.57 | % | |
Net expenses after fees waived or expenses
reimbursed (including interest expense)(d)(f) | | | 1.51 | %(e)(g) | | | 1.50 | %(g) | | | 1.55 | %(g) | | | 1.55 | %(g) | | | 1.55 | %(g) | | | 1.57 | %(g) | |
Expenses prior to fees waived or expenses
reimbursed (excluding interest expense) | | | 1.51 | %(e) | | | 1.51 | % | | | 1.55 | % | | | 1.55 | % | | | 1.53 | % | | | 1.53 | % | |
Net expenses after fees waived or expenses
reimbursed (excluding interest expense)(f) | | | 1.51 | %(e)(g) | | | 1.50 | %(g) | | | 1.55 | %(g) | | | 1.55 | %(g) | | | 1.53 | %(g) | | | 1.53 | %(g) | |
| Net investment income | | | 3.41 | %(e)(g) | | | 3.65 | %(g) | | | 3.69 | %(g) | | | 4.00 | %(g) | | | 3.81 | %(g) | | | 3.65 | %(g) | |
| Supplemental data | |
| Net assets, end of period (in thousands) | | $ | 9,008 | | | $ | 12,630 | | | $ | 6,817 | | | $ | 12,775 | | | $ | 17,816 | | | $ | 27,047 | | |
| Portfolio turnover | | | 5 | % | | | 11 | % | | | 11 | % | | | 12 | % | | | 14 | % | | | 13 | % | |
Notes to Financial Highlights
(a) For the period from December 1, 2011 to July 31, 2012. During the period, the Fund's fiscal year end was changed from November 30 to July 31.
(b) Rounds to less than $0.01.
(c) In addition to the fees and expenses which the Fund bears directly, the Fund indirectly bears a pro rata share of the fees and expenses of the acquired funds in which it invests. Such indirect expenses are not included in the reported expense ratios.
(d) Ratios include interest and fee expense related to the Fund's participation in certain inverse floater programs, if any. Due to an equal increase in interest income from fixed rate municipal bonds held in trust, there is no impact on the Fund's net assets, net asset value per share, total return or net investment income.
(e) Annualized.
(f) The Investment Manager and certain of its affiliates agreed to waive/reimburse certain fees and expenses, if applicable.
(g) The benefits derived from expense reductions had an impact of less than 0.01%.
The accompanying Notes to Financial Statements are an integral part of this statement.
Annual Report 2012
49
Columbia Tax-Exempt Fund
Financial Highlights (continued)
| | | Year Ended
July 31, | | Year Ended November 30, | |
| Class C | | 2012(a) | | 2011 | | 2010 | | 2009 | | 2008 | | 2007 | |
| Per share data | |
| Net asset value, beginning of period | | $ | 13.43 | | | $ | 13.13 | | | $ | 13.05 | | | $ | 11.95 | | | $ | 13.52 | | | $ | 13.88 | | |
| Income from investment operations: | |
| Net investment income | | | 0.33 | | | | 0.50 | | | | 0.51 | | | | 0.52 | | | | 0.51 | | | | 0.51 | | |
| Net realized and unrealized gain (loss) | | | 0.83 | | | | 0.31 | | | | 0.08 | | | | 1.09 | | | | (1.57 | ) | | | (0.36 | ) | |
| Total from investment operations | | | 1.16 | | | | 0.81 | | | | 0.59 | | | | 1.61 | | | | (1.06 | ) | | | 0.15 | | |
| Less distributions to shareholders: | |
| Net investment income | | | (0.33 | ) | | | (0.51 | ) | | | (0.51 | ) | | | (0.51 | ) | | | (0.51 | ) | | | (0.51 | ) | |
| Total distributions to shareholders | | | (0.33 | ) | | | (0.51 | ) | | | (0.51 | ) | | | (0.51 | ) | | | (0.51 | ) | | | (0.51 | ) | |
| Proceeds from regulatory settlements | | | 0.00 | (b) | | | — | | | | 0.00 | (b) | | | — | | | | — | | | | — | | |
| Net asset value, end of period | | $ | 14.26 | | | $ | 13.43 | | | $ | 13.13 | | | $ | 13.05 | | | $ | 11.95 | | | $ | 13.52 | | |
| Total return | | | 8.70 | % | | | 6.36 | % | | | 4.49 | % | | | 13.74 | % | | | (8.05 | %) | | | 1.13 | % | |
| Ratios to average net assets(c) | |
Expenses prior to fees waived or expenses
reimbursed (including interest expense)(d) | | | 1.51 | %(e) | | | 1.52 | % | | | 1.55 | % | | | 1.55 | % | | | 1.55 | % | | | 1.57 | % | |
Net expenses after fees waived or expenses
reimbursed (including interest expense)(d)(f) | | | 1.36 | %(e)(g) | | | 1.36 | %(g) | | | 1.40 | %(g) | | | 1.40 | %(g) | | | 1.40 | %(g) | | | 1.42 | %(g) | |
Expenses prior to fees waived or expenses
reimbursed (excluding interest expense) | | | 1.51 | %(e) | | | 1.52 | % | | | 1.55 | % | | | 1.55 | % | | | 1.53 | % | | | 1.53 | % | |
Net expenses after fees waived or expenses
reimbursed (excluding interest expense)(f) | | | 1.36 | %(e)(g) | | | 1.36 | %(g) | | | 1.40 | %(g) | | | 1.40 | %(g) | | | 1.38 | %(g) | | | 1.38 | %(g) | |
| Net investment income | | | 3.57 | %(e)(g) | | | 3.82 | %(g) | | | 3.83 | %(g) | | | 4.11 | %(g) | | | 3.95 | %(g) | | | 3.78 | %(g) | |
| Supplemental data | |
| Net assets, end of period (in thousands) | | $ | 93,117 | | | $ | 81,742 | | | $ | 37,377 | | | $ | 34,079 | | | $ | 25,023 | | | $ | 22,650 | | |
| Portfolio turnover | | | 5 | % | | | 11 | % | | | 11 | % | | | 12 | % | | | 14 | % | | | 13 | % | |
Notes to Financial Highlights
(a) For the period from December 1, 2011 to July 31, 2012. During the period, the Fund's fiscal year end was changed from November 30 to July 31.
(b) Rounds to less than $0.01.
(c) In addition to the fees and expenses which the Fund bears directly, the Fund indirectly bears a pro rata share of the fees and expenses of the acquired funds in which it invests. Such indirect expenses are not included in the reported expense ratios.
(d) Ratios include interest and fee expense related to the Fund's participation in certain inverse floater programs, if any. Due to an equal increase in interest income from fixed rate municipal bonds held in trust, there is no impact on the Fund's net assets, net asset value per share, total return or net investment income.
(e) Annualized.
(f) The Investment Manager and certain of its affiliates agreed to waive/reimburse certain fees and expenses, if applicable.
(g) The benefits derived from expense reductions had an impact of less than 0.01%.
The accompanying Notes to Financial Statements are an integral part of this statement.
Annual Report 2012
50
Columbia Tax-Exempt Fund
Financial Highlights (continued)
| | | Year Ended
July 31, | | Year Ended November 30, | |
| Class Z | | 2012(a) | | 2011 | | 2010 | | 2009 | | 2008 | | 2007 | |
| Per share data | |
| Net asset value, beginning of period | | $ | 13.43 | | | $ | 13.13 | | | $ | 13.05 | | | $ | 11.95 | | | $ | 13.52 | | | $ | 13.88 | | |
| Income from investment operations: | |
| Net investment income | | | 0.41 | | | | 0.61 | | | | 0.62 | | | | 0.62 | | | | 0.62 | | | | 0.62 | | |
| Net realized and unrealized gain (loss) | | | 0.83 | | | | 0.30 | | | | 0.07 | | | | 1.10 | | | | (1.58 | ) | | | (0.36 | ) | |
| Total from investment operations | | | 1.24 | | | | 0.91 | | | | 0.69 | | | | 1.72 | | | | (0.96 | ) | | | 0.26 | | |
| Less distributions to shareholders: | |
| Net investment income | | | (0.40 | ) | | | (0.61 | ) | | | (0.61 | ) | | | (0.62 | ) | | | (0.61 | ) | | | (0.62 | ) | |
| Total distributions to shareholders | | | (0.40 | ) | | | (0.61 | ) | | | (0.61 | ) | | | (0.62 | ) | | | (0.61 | ) | | | (0.62 | ) | |
| Proceeds from regulatory settlements | | | 0.00 | (b) | | | — | | | | 0.00 | (b) | | | — | | | | — | | | | — | | |
| Net asset value, end of period | | $ | 14.27 | | | $ | 13.43 | | | $ | 13.13 | | | $ | 13.05 | | | $ | 11.95 | | | $ | 13.52 | | |
| Total return | | | 9.32 | % | | | 7.16 | % | | | 5.33 | % | | | 14.64 | % | | | (7.30 | %) | | | 1.94 | % | |
| Ratios to average net assets(c) | |
Expenses prior to fees waived or expenses
reimbursed (including interest expense)(d) | | | 0.56 | %(e) | | | 0.59 | % | | | 0.60 | % | | | 0.60 | % | | | 0.60 | % | | | 0.62 | % | |
Net expenses after fees waived or expenses
reimbursed (including interest expense)(d)(f) | | | 0.56 | %(e)(g) | | | 0.56 | %(g) | | | 0.60 | %(g) | | | 0.60 | %(g) | | | 0.60 | %(g) | | | 0.62 | %(g) | |
Expenses prior to fees waived or expenses
reimbursed (excluding interest expense) | | | 0.56 | %(e) | | | 0.59 | % | | | 0.60 | % | | | 0.60 | % | | | 0.58 | % | | | 0.58 | % | |
Net expenses after fees waived or expenses
reimbursed (excluding interest expense)(f) | | | 0.56 | %(e)(g) | | | 0.56 | %(g) | | | 0.60 | %(g) | | | 0.60 | %(g) | | | 0.58 | %(g) | | | 0.58 | %(g) | |
| Net investment income | | | 4.37 | %(e)(g) | | | 4.68 | %(g) | | | 4.63 | %(g) | | | 4.93 | %(g) | | | 4.76 | %(g) | | | 4.59 | %(g) | |
| Supplemental data | |
| Net assets, end of period (in thousands) | | $ | 780,836 | | | $ | 716,844 | | | $ | 793,302 | | | $ | 833,847 | | | $ | 814,018 | | | $ | 884,741 | | |
| Portfolio turnover | | | 5 | % | | | 11 | % | | | 11 | % | | | 12 | % | | | 14 | % | | | 13 | % | |
Notes to Financial Highlights
(a) For the period from December 1, 2011 to July 31, 2012. During the period, the Fund's fiscal year end was changed from November 30 to July 31.
(b) Rounds to less than $0.01.
(c) In addition to the fees and expenses which the Fund bears directly, the Fund indirectly bears a pro rata share of the fees and expenses of the acquired funds in which it invests. Such indirect expenses are not included in the reported expense ratios.
(d) Ratios include interest and fee expense related to the Fund's participation in certain inverse floater programs, if any. Due to an equal increase in interest income from fixed rate municipal bonds held in trust, there is no impact on the Fund's net assets, net asset value per share, total return or net investment income.
(e) Annualized.
(f) The Investment Manager and certain of its affiliates agreed to waive/reimburse certain fees and expenses, if applicable.
(g) The benefits derived from expense reductions had an impact of less than 0.01%.
The accompanying Notes to Financial Statements are an integral part of this statement.
Annual Report 2012
51
Columbia Tax-Exempt Fund
Notes to Financial Statements
July 31, 2012
Note 1. Organization
Columbia Tax-Exempt Fund (the Fund), a series of Columbia Funds Series Trust I (the Trust), is a diversified fund. The Trust is registered under the Investment Company Act of 1940, as amended (the 1940 Act), as an open-end management investment company organized as a Massachusetts business trust.
Fiscal Year End Change
During the period, the Fund changed its fiscal year end from November 30 to July 31.
Fund Shares
The Trust may issue an unlimited number of shares (without par value). The Fund offers Class A, Class B, Class C and Class Z shares. All share classes have identical voting, dividend and liquidation rights. Each share class has its own expense structure and sales charges, as applicable.
Class A shares are subject to a maximum front-end sales charge of 4.75% based on the initial investment amount. Class A shares purchased without an initial sales charge in accounts aggregating $1 million to $50 million at the time of purchase are subject to a contingent deferred sales charge (CDSC) if the shares are sold within 18 months of purchase, charged as follows: 1.00% CDSC if redeemed within 12 months of purchase, and 0.50% CDSC if redeemed more than 12, but less than 18, months after purchase.
Class B shares may be subject to a maximum CDSC of 5.00% based upon the holding period after purchase. Class B shares will generally convert to Class A shares eight years after purchase. The Fund no longer accepts investments by new or existing investors in the Fund's Class B shares, except in connection with the reinvestment of any dividend and/or capital gain distributions in Class B shares of the Fund and exchanges by existing Class B shareholders of certain other funds within the Columbia Family of Funds.
Class C shares are subject to a 1.00% CDSC on shares redeemed within one year of purchase.
Class Z shares are not subject to sales charges, and are only available to certain investors, as described in the Fund's Class Z prospectus.
Note 2. Summary of Significant Accounting Policies
Use of Estimates
The preparation of financial statements in accordance with U.S. generally accepted accounting principles (GAAP) requires management to make certain estimates and assumptions that affect the reported amounts of assets and liabilities, the disclosure of contingent assets and liabilities at the date of the financial statements and the reported amounts of revenue and expenses during the reporting period. Actual results could differ from those estimates.
The following is a summary of significant accounting policies consistently followed by the Fund in the preparation of its financial statements.
Security Valuation
Debt securities generally are valued by pricing services approved by the Board of Trustees (the Board) based upon market transactions for normal, institutional-size trading units of similar securities. The services may use various pricing techniques which take into account appropriate factors such as yield, quality, coupon rate, maturity, type of issue, trading characteristics and other data, as well as broker quotes. Debt securities for which quotations are readily available may also be valued based upon an over-the-counter or exchange bid quotation.
Investments in other open-end investment companies, including money market funds, are valued at net asset value.
Short-term securities purchased within 60 days to maturity are valued at amortized cost, which approximates market value. The value of short-term securities originally purchased with maturities greater than 60 days is determined based on an amortized value to par upon reaching 60 days to maturity. Short-term securities maturing in more than 60 days from the valuation date are valued at the market price or approximate market value based on current interest rates.
Futures and options on futures contracts are valued based upon the settlement price established each day by the board of trade or exchange on which they are traded.
Investments for which market quotations are not readily available, or that have quotations which management believes are not reliable, are valued at fair value as determined in good faith under consistently applied procedures established by and under the general supervision of the Board. If a security or class of securities (such as foreign securities) is valued at fair value, such value is likely to be different from the last quoted market price for the security.
The determination of fair value often requires significant judgment. To determine fair value, management may use assumptions including but not limited to future cash flows and estimated risk premiums. Multiple inputs from various sources may be used to determine fair value.
Annual Report 2012
52
Columbia Tax-Exempt Fund
Notes to Financial Statements (continued)
July 31, 2012
Derivative Instruments
The Fund invests in certain derivative instruments, as detailed below, to meet its investment objectives. Derivatives are instruments whose values depend on, or are derived from, in whole or in part, the value of one or more other assets, such as securities, currencies, commodities or indices. Derivative instruments may be used to maintain cash reserves while maintaining exposure to certain other assets, to offset anticipated declines in values of investments, to facilitate trading, to reduce transaction costs and to pursue higher investment returns. The Fund may also use derivative instruments to mitigate certain investment risks, such as foreign currency exchange rate risk, interest rate risk and credit risk. Derivatives may involve various risks, including the potential inability of the counterparty to fulfill its obligation under the terms of the contract, the potential for an illiquid secondary market and the potential for market movements which may expose the Fund to gains or losses in excess of the amount shown in the Statement of Assets and Liabilities.
The Fund and any counterparty are required to maintain an agreement that requires the Fund and that counterparty to monitor (on a daily basis) the net fair value of all derivatives entered into pursuant to the agreement between the Fund and such counterparty. If the net fair value of such derivatives between the Fund and that counterparty exceeds a certain threshold (as defined in the agreement), the Fund or the counterparty (as the case may be) is required to post cash and/or securities as collateral. Fair values of derivatives presented in the financial statements are not netted with the fair value of other derivatives or with any collateral amounts posted by the Fund or any counterparty.
Futures Contracts
Futures contracts represent commitments for the future purchase or sale of an asset at a specified price on a specified date. The Fund bought and sold futures contracts to produce incremental earnings, manage the duration and yield curve exposure of the Fund versus the benchmark and manage exposure to movements in interest rates. Upon entering into futures contracts, the Fund bears risks which may include interest rates, exchange rates or securities prices moving unexpectedly, in which case, the Fund may not achieve the anticipated benefits of the futures contracts and may realize a loss. Additional risks include counterparty credit risk, the possibility of an illiquid market, and that a change in the value of the contract or option may not correlate with changes in the value of the underlying asset.
Upon entering into a futures contract, the Fund pledges cash or securities with the broker in an amount sufficient to meet the initial margin requirement. Subsequent payments (variation margin) are made or received by the Fund each day. The variation margin payments are equal to the daily change in the contract value and are recorded as variation margin receivable or payable and are offset in unrealized gains or losses. The Fund recognizes a realized gain or loss when the contract is closed or expires. Futures contracts involve, to varying degrees, risk of loss in excess of the variation margin disclosed in the Statement of Assets and Liabilities.
Effects of Derivative Transactions in the Financial Statements
The following tables are intended to provide additional information about the effect of derivatives on the financial statements of the Fund, including: the fair value of derivatives by risk category and the location of those fair values in the Statement of Assets and Liabilities; the impact of derivative transactions on the Fund's operations over the period including realized gains or losses and unrealized gains or losses. The derivative schedules following the Portfolio of Investments present additional information regarding derivative instruments outstanding at the end of the period, if any.
At July 31, 2012, the Fund had no outstanding derivatives.
The effect of derivative instruments in the Statement of Operations for the period ended July 31, 2012 and the year ended November 30, 2011:
| Amount of Realized Gain (Loss) on Derivatives Recognized in Income | |
| | | July 31, 2012 | | November 30, 2011 | |
Risk Exposure
Category | | Futures
Contracts ($) | | Futures
Contracts ($) | |
| Interest rate contracts | | | — | | | | (1,646,050 | ) | |
| Change in Unrealized Appreciation(Depreciation) on Derivatives Recognized in Income | |
| | | July 31, 2012 | | November 30, 2011 | |
Risk Exposure
Category | | Futures
Contracts ($) | | Futures
Contracts ($) | |
| Interest rate contracts | | | — | | | | — | | |
The following table is a summary of the volume of derivative instruments for the period ended July 31, 2012 and the year ended November 30, 2011:
| | | July 31, 2012 | | November 30, 2011 | |
| | | Contracts Opened | | Contracts Opened | |
| Futures Contracts | | | — | | | | 545 | | |
Delayed Delivery Securities
The Fund may trade securities on other than normal settlement terms, including securities purchased or sold on a "when-issued" basis. This may increase the risk if the other party to
Annual Report 2012
53
Columbia Tax-Exempt Fund
Notes to Financial Statements (continued)
July 31, 2012
the transaction fails to deliver and causes the Fund to subsequently invest at less advantageous prices. The Fund designates cash or liquid securities in an amount equal to the delayed delivery commitment.
Inverse Floater Program Transactions
The Fund may enter into transactions in which it transfers to trusts fixed rate municipal bonds in exchange for cash and residual interests in the trusts' assets and cash flows, which are in the form of inverse floating rate securities. The trusts fund the purchases of the municipal bonds by issuing short-term floating rate notes to third parties. The residual interests held by the Fund (inverse floating rate securities) include the right of the Fund (i) to cause the holders of the short-term floating rate notes to tender their notes at par, and (ii) to transfer the municipal bonds from the trusts to the Fund, thereby collapsing the trusts. The municipal bonds transferred to the trusts, if any, remain in the Fund's investments in securities and the related short-term floating rate notes are reflected as Fund liabilities under the caption "Short-term floating rate notes outstanding" in the Statement of Assets and Liabilities. The liability approximates the fair market value of the short-term notes. The notes issued by the trusts have interest rates that are multi-modal, which means that they can be reset to a new or different mode at the reset date (e.g., mode can be daily, weekly, monthly, or a fixed specific date) at the discretion of the holder of the inverse floating rate security. The floating rate note holders have the option to tender their notes to the trusts for redemption at par at each reset date. The income received by the inverse floating rate security holder varies inversely with the short-term rate paid to the floating rate note holders, and in most circumstances the inverse floating rate security holder bears substantially all of the underlying bond's downside investment risk and also benefits disproportionately from any potential appreciation of the underlying bond's value. The inverse floating rate security holder will be subject to greater interest rate risk than if they were to hold the underlying bond because the interest rate is dependent on both the fixed coupon rate of the underlying bond and the short-term interest rate paid on the floating rate notes. The inverse floating rate security holder is also subject to the credit risk, liquidity risk and market risk associated with the underlying bond. The bonds held by the trusts serve as collateral for the short-term floating rate notes outstanding. Contractual maturities and interest rates of the municipal bonds held in trusts, if any, at July 31, 2012 are presented in the Portfolio of Investments. Interest and fee expense related to the short-term floating rate notes, which is accrued daily, is presented in the Statement of Operations and corresponds to an equal increase in interest income from the fixed rate municipal bonds held in trust. For the period ended July 31, 2012, the average value of short-term floating rate notes outstanding was $20,852,060 and the annualized average interest rate and fees related to these short-term floating rate notes was 0.68%.
Security Transactions
Security transactions are accounted for on the trade date. Cost is determined and gains (losses) are based upon the specific identification method for both financial statement and federal income tax purposes.
Income Recognition
Interest income is recorded on an accrual basis. Market premium and discount are amortized and accreted, respectively, on all debt securities, unless otherwise noted. Original issue discount is accreted to interest income over the life of the security with a corresponding increase in the cost basis, if any.
Expenses
General expenses of the Trust are allocated to the Fund and other funds of the Trust based upon relative net assets or other expense allocation methodologies determined by the nature of the expense. Expenses directly attributable to the Fund are charged to the Fund. Expenses directly attributable to a specific class of shares are charged to that share class.
Determination of Class Net Asset Value
All income, expenses (other than class-specific expenses, which are charged to that share class, as shown in the Statement of Operations) and realized and unrealized gains (losses) are allocated to each class of the Fund on a daily basis for purposes of determining the net asset value of each class. Income and expenses are allocated to each class based on the settled shares method, while realized and unrealized gains (losses) are allocated based on the relative net assets of each class.
Federal Income Tax Status
The Fund intends to qualify each year as a regulated investment company under Subchapter M of the Internal Revenue Code, as amended, and will distribute substantially all of its tax exempt or taxable income (including net short-term capital gains), if any, for its tax year, and as such will not be subject to federal income taxes. In addition, the Fund intends to distribute in each calendar year substantially all of its net investment income, capital gains and certain other amounts, if any, such that the Fund should not be subject to federal excise tax. Therefore, no federal income or excise tax provision is recorded.
Annual Report 2012
54
Columbia Tax-Exempt Fund
Notes to Financial Statements (continued)
July 31, 2012
Distributions to Shareholders
Distributions from net investment income, if any, are declared daily and paid monthly. Net realized capital gains, if any, are distributed at least annually. Income distributions and capital gain distributions are determined in accordance with federal income tax regulations, which may differ from GAAP.
Guarantees and Indemnifications
Under the Trust's organizational documents and, in some cases, by contract, its officers and trustees are indemnified against certain liabilities arising out of the performance of their duties to the Trust or its funds. In addition, certain of the Fund's contracts with its service providers contain general indemnification clauses. The Fund's maximum exposure under these arrangements is unknown since the amount of any future claims that may be made against the Fund cannot be determined, and the Fund has no historical basis for predicting the likelihood of any such claims.
Recent Accounting Pronouncement
Disclosures about Offsetting Assets and Liabilities
In December 2011, the Financial Accounting Standards Board (FASB) issued ASU No. 2011-11, Disclosures about Offsetting Assets and Liabilities. The objective of the FASB is to enhance current disclosure requirements on offsetting of certain assets and liabilities and to enable financial statement users to compare financial statements prepared under GAAP and International Financial Reporting Standards.
Specifically, ASU No. 2011-11 requires an entity to disclose both gross and net information for derivatives and other financial instruments that are subject to a master netting arrangement or similar agreement. The standard requires disclosure of collateral received in connection with the master netting agreements or similar agreements. The effective date of ASU No. 2011-11 is for interim and annual periods beginning on or after January 1, 2013. At this time, management is evaluating the implications of this guidance and the impact it will have on the financial statement amounts and footnote disclosures, if any.
Note 3. Fees and Compensation Paid to Affiliates
Investment Management Fees
Under an Investment Management Services Agreement, Columbia Management Investment Advisers, LLC (the Investment Manager), a wholly-owned subsidiary of Ameriprise Financial, Inc. (Ameriprise Financial), determines which securities will be purchased, held or sold. The management fee is an annual fee that is equal to a percentage of the Fund's average daily net assets that declines from 0.41% to 0.25% as the Fund's net assets increase. Prior to March 1, 2011, the management fee was equal to a percentage of the Fund's average net daily net assets that declined from 0.55% to 0.42% as the Fund's net assets increased. The annualized effective management fee rate for the period ended July 31, 2012, and for the year ended November 30, 2011, was 0.37% and 0.39%, respectively, of the Fund's average daily net assets.
Administration Fees
Under an Administrative Services Agreement, the Investment Manager serves as the Fund Administrator. The Fund pays the Fund Administrator an annual fee for administration and accounting services equal to a percentage of the Fund's average daily net assets that declines from 0.07% to 0.04% as the Fund's net assets increase. Prior to March 1, 2011, the Investment Manager did not receive a fee for its services under the Administration Agreement. The annualized effective administration fee rate for the period ended July 31, 2012, and for the year ended November 30, 2011, was 0.06% and 0.05%, respectively, of the Fund's average daily net assets.
Pricing and Bookkeeping Fees
Prior to May 16, 2011, the Fund had entered into a Financial Reporting Services Agreement (the Financial Reporting Services Agreement) with State Street Bank and Trust Company (State Street) and the Investment Manager pursuant to which State Street provided financial reporting services to the Fund. The Fund also entered into an Accounting Services Agreement (collectively with the Financial Reporting Services Agreement, the State Street Agreements) with State Street and the Investment Manager pursuant to which State Street provided accounting services to the Fund. Under the State Street Agreements, the Fund paid State Street an annual fee of $38,000 paid monthly plus an additional monthly fee based on an annualized percentage rate of average daily net assets of the Fund for the month. The aggregate fee did not exceed $140,000 per year (exclusive of out-of-pocket expenses and charges). The Fund also reimbursed State Street for certain out-of-pocket expenses and charges. Effective May 16, 2011, these services are now provided under the Administrative Services Agreement discussed above.
Compensation of Board Members
Board members are compensated for their services to the Fund as disclosed in the Statement of Operations. The Trust's eligible Trustees may participate in a Deferred Compensation Plan (the Plan) which may be terminated at any time. Obligations of the Plan will be paid solely out of the Fund's assets.
Annual Report 2012
55
Columbia Tax-Exempt Fund
Notes to Financial Statements (continued)
July 31, 2012
Compensation of Chief Compliance Officer
The Board has appointed a Chief Compliance Officer to the Fund in accordance with federal securities regulations. The Fund pays its pro-rata share of the expenses associated with the Chief Compliance Officer. The Fund's expenses for the Chief Compliance Officer will not exceed $15,000 per year.
Transfer Agent Fees
Under a Transfer and Dividend Disbursing Agent Agreement, Columbia Management Investment Services Corp. (the Transfer Agent), an affiliate of the Investment Manager and a wholly-owned subsidiary of Ameriprise Financial, is responsible for providing transfer agency services to the Fund. The Transfer Agent has contracted with Boston Financial Data Services (BFDS) to serve as sub-transfer agent.
The Transfer Agent receives monthly account-based service fees based on the number of open accounts and is reimbursed by the Fund for the fees and expenses the Transfer Agent pays to financial intermediaries that maintain omnibus accounts with the Fund that is a percentage of the average aggregate value of the Fund's shares maintained in each such omnibus account (other than omnibus accounts for which American Enterprise Investment Services Inc. is the broker of record or accounts where the beneficial shareholder is a customer of Ameriprise Financial Services, Inc., which are paid a per account fee). The Transfer Agent pays the fees of BFDS for services as sub-transfer agent and is not entitled to reimbursement for such fees from the Fund (with the exception of out-of-pocket fees).
The Transfer Agent also receives compensation from fees for various shareholder services and reimbursements for certain out-of-pocket expenses.
For the period ended July 31, 2012 and for the year ended November 30, 2011, the Fund's annualized effective transfer agent fee rates as a percentage of average daily net assets of each class were as follows:
| | | Period ended
July 31, 2012 | | Year ended
November 30, 2011 | |
| Class A | | | 0.10 | % | | | 0.10 | % | |
| Class B | | | 0.10 | | | | 0.11 | | |
| Class C | | | 0.10 | | | | 0.11 | | |
| Class Z | | | 0.10 | | | | 0.11 | | |
The Fund and certain other associated investment companies, have severally, but not jointly, guaranteed the performance and observance of all the terms and conditions of a lease entered into by Seligman Data Corp. (SDC), the former transfer agent, including the payment of rent by SDC (the Guaranty). The lease and the Guaranty expire in January 2019. At July 31, 2012, the Fund's total potential future obligation over the life of the Guaranty is $736,376. The liability remaining at July 31, 2012 for non-recurring charges associated with the lease amounted to $388,226 and is recorded as a part of payable for other expenses in the Statement of Assets and Liabilities.
An annual minimum account balance fee of $20 may apply to certain accounts with a value below the Fund's initial minimum investment requirements to reduce the impact of small accounts on transfer agent fees. These minimum account balance fees are recorded as part of expense reductions in the Statement of Operations. For the period ended July 31, 2012 and for the year ended November 30, 2011, these minimum account balance fees reduced total expenses by $6,978 and $8,004, respectively.
Distribution and Service Fees
The Fund has an agreement with Columbia Management Investment Distributors, Inc. (the Distributor), an affiliate of the Investment Manager and a wholly-owned subsidiary of Ameriprise Financial, for distribution and shareholder services. Pursuant to Rule 12b-1 under the 1940 Act, the Board has approved, and the Fund has adopted, distribution and shareholder service plans (the Plans) which set the distribution and service fees for the Fund. These fees are calculated daily and are intended to compensate the Distributor and/or eligible selling and/or servicing agents for selling shares of the Fund and providing services to investors.
The Plans require the payment of a monthly service fee to the Distributor at the maximum annual rate of 0.20% of the average daily net assets attributable to Class A, Class B and Class C shares of the Fund. The Plans also require the payment of a monthly distribution fee to the Distributor at the maximum annual rate of 0.75% of the average daily net assets attributable to Class B and Class C shares only.
The Distributor has voluntarily agreed to waive a portion of the distribution fee for Class C shares so that the combined distribution and service fee does not exceed 0.80% annually of the average daily net assets attributable to Class C shares. This arrangement may be modified or terminated by the Distributor at any time.
Sales Charges
Sales charges, including front-end charges and CDSCs, received by the Distributor for distributing Fund shares were $1,656,814 for Class A, $2,671 for Class B and $2,804 for Class C shares for the period ended July 31, 2012 and $1,010,865 for Class A, $5,332 for Class B and $6,965 for Class C shares for the year ended November 30, 2011.
Annual Report 2012
56
Columbia Tax-Exempt Fund
Notes to Financial Statements (continued)
July 31, 2012
Expenses Waived/Reimbursed by the Investment Manager and its Affiliates
The Investment Manager and certain of its affiliates have contractually agreed to waive fees and/or reimburse expenses (excluding certain fees and expenses described below), through March 31, 2013, unless sooner terminated at the sole discretion of the Board, so that the Fund's net operating expenses, after giving effect to fees waived/expenses reimbursed and/or overdraft charges from the Fund's custodian, do not exceed the following annual rates as a percentage of the class' average daily net assets:
| Class A | | | 0.76 | % | |
| Class B | | | 1.51 | | |
| Class C | | | 1.51 | | |
| Class Z | | | 0.56 | | |
Under the agreement, the following fees and expenses are excluded from the waiver/reimbursement commitment, and therefore will be paid by the Fund, if applicable: taxes (including foreign transaction taxes), expenses associated with investments in affiliated and non-affiliated pooled investment vehicles (including mutual funds and exchange traded funds), transaction costs and brokerage commissions, costs related to any securities lending program, dividend expenses associated with securities sold short, inverse floater program fees and expenses, transaction charges and interest on borrowed money, interest, extraordinary expenses and any other expenses the exclusion of which is specifically approved by the Board. This agreement may be modified or amended only with approval from all parties. Class C distribution fees waived by the Distributor, as discussed above, are in addition to the waiver/reimbursement commitment under the agreement.
Prior to March 1, 2011, the Investment Manager voluntarily agreed to reimburse a portion of the Fund's expenses (excluding certain expenses, such as distribution and services fees, brokerage commissions, interest, taxes and extraordinary expenses, but including custodian charges relating to overdrafts, if any) so that the Fund's ordinary net operating expenses, after giving effect to fees waived/expenses reimbursed and any balance credits and/or overdraft charges from the Fund's custodian, did not exceed 0.60% of the Fund's average daily net assets on an annualized basis.
Note 4. Federal Tax Information
The timing and character of income and capital gain distributions are determined in accordance with income tax regulations, which may differ from GAAP because of temporary or permanent book to tax differences.
At July 31, 2012, these differences are primarily due to differing treatment for recognition of market discount, paydown reclassification, capital loss carryforwards, defaulted bonds, Trustees' deferred compensation, distributions and tax straddles. To the extent these differences are permanent, reclassifications are made among the components of the Fund's net assets in the Statement of Assets and Liabilities. Temporary differences do not require reclassifications. In the Statement of Assets and Liabilities the following reclassifications were made:
| Undistributed net investment income | | $ | 413,174 | | |
| Accumulated net realized loss | | | (249,852 | ) | |
| Paid-in capital | | | (163,322 | ) | |
Net investment income and net realized gains (losses), as disclosed in the Statement of Operations, and net assets were not affected by this reclassification.
The tax character of distributions paid during the periods indicated was as follows:
| | | Period Ended
July 31, 2012 | | Year Ended
November 30,
2011 | | Year Ended
November 30,
2010 | |
| Ordinary income | | $ | 333,845 | | | $ | 180,887 | | | $ | 877,056 | | |
| Tax-Exempt Income | | | 127,174,438 | | | | 145,282,309 | | | | 98,646,693 | | |
Short-term capital gain distributions, if any, are considered ordinary income distributions for tax purposes.
At July 31, 2012, the components of distributable earnings on a tax basis were as follows:
| Undistributed Tax-Exempt Income | | $ | 22,900,910 | | |
| Unrealized appreciation | | | 534,296,834 | | |
The following capital loss carryforward, determined at July 31, 2012, may be available to reduce taxable income arising from future net realized gains on investments, if any, to the extent permitted by the Internal Revenue Code:
| Year of Expiration | | Amount ($) | |
| 2015 | | $ | 13,239,272 | | |
| 2016 | | | 57,869,171 | | |
| 2017 | | | 1,455,576 | | |
| 2018 | | | 6,621,391 | | |
| 2019 | | | 14,381,427 | | |
| Unlimited capital loss carryforwards | | | | | |
| Long-term | | | 8,423,040 | | |
| Total | | | 101,989,877 | | |
Unlimited capital loss carryforwards are required to be utilized prior to any capital losses which carry an expiration date. As a result of this ordering rule, capital loss
Annual Report 2012
57
Columbia Tax-Exempt Fund
Notes to Financial Statements (continued)
July 31, 2012
carryforwards which carry an expiration date may be more likely to expire unused.
At July 31, 2012, the cost of investments for federal income tax purposes was $4,206,509,290 and the aggregate gross unrealized appreciation and depreciation based on that cost was:
| Unrealized appreciation | | $ | 573,867,714 | | |
| Unrealized depreciation | | | (39,570,880 | ) | |
| Net unrealized app/depreciation | | $ | 534,296,834 | | |
Management of the Fund has concluded that there are no significant uncertain tax positions that would require recognition in the financial statements. However, management's conclusion may be subject to review and adjustment at a later date based on factors including, but not limited to, new tax laws, regulations, and administrative interpretations (including relevant court decisions). Generally, the Fund's federal tax returns for the prior three fiscal years remain subject to examination by the Internal Revenue Service.
Note 5. Portfolio Information
The cost of purchases and proceeds from sales of securities, excluding short-term obligations, aggregated to $213,945,385 and $286,706,439, respectively, for the period ended July 31, 2012.
Note 6. Regulatory Settlements
During the period ended July 31, 2012 and the year ended November 30, 2010, the Fund received $1,263 and $19,753, respectively, as a result of a regulatory settlement of an administrative proceeding brought by the Securities and Exchange Commission against an unaffiliated third party relating to market timing and/or late trading of mutual funds. This amount represented the Fund's portion of the proceeds from the settlement (the Fund was not a party to the proceeding). The payments have been included in "Proceeds from regulatory settlements" in the Statement of Changes in Net Assets.
Note 7. Custody Credits
Prior to May 16, 2011, the Fund had an agreement with its custodian bank under which custody fees may have been reduced by balance credits. These credits are recorded as part of expense reductions on the Statement of Operations. The Fund could have invested a portion of the assets utilized in connection with the expense offset arrangement in an income-producing asset if they had not entered into such an agreement. For the period December 1, 2010 through May 15, 2011, these credits reduced total expenses by $90.
Note 8. Shareholder Concentration
At July 31, 2012, one unaffiliated shareholder account owned 10.6% of the outstanding shares of the Fund. The Fund has no knowledge about whether any portion of those shares was owned beneficially by such account. Subscription and redemption activity by concentrated accounts may have a significant effect on the operations of the Fund.
Note 9. Line of Credit
The Fund has entered into a revolving credit facility with a syndicate of banks led by JPMorgan Chase Bank N.A. (the Administrative Agent) whereby the Fund may borrow for the temporary funding of shareholder redemptions or for other temporary or emergency purposes. The credit facility became effective on May 16, 2011, replacing a prior credit facility. The credit facility agreement, as amended, which is a collective agreement between the Fund and certain other funds managed by the Investment Manager, severally and not jointly, permits collective borrowings up to $500 million. Pursuant to a December 13, 2011 amendment to the credit facility agreement, interest is charged to each participating fund based on its borrowings at a rate equal to the higher of (i) the overnight federal funds rate plus 1.00% or (ii) the one-month LIBOR rate plus 1.00%. Each borrowing under the credit facility matures no later than 60 days after the date of borrowing. The Fund also pays a commitment fee equal to its pro rata share of the amount of the credit facility at a rate of 0.08% per annum. For the period May 16, 2011 through December 13, 2011, interest was charged to each participating fund based on its borrowings at a rate equal to the sum of the federal funds rate plus (i) 1.25% per annum plus (ii) if one-month LIBOR exceeds the federal funds rate, the amount of such excess. The Fund also paid a commitment fee equal to its pro rata share of the amount of the credit facility at a rate of 0.10% per annum.
For the period March 28, 2011 through May 15, 2011, the Fund and certain other funds managed by the Investment Manager participated in a $225 million committed, unsecured revolving credit facility provided by State Street. Prior to March 28, 2011, the collective borrowing amount of the credit facility was $280 million. Interest was charged to each fund based on its borrowings at a rate equal to the greater of the (i) federal funds rate plus 1.25% per annum or (ii) the overnight LIBOR rate plus 1.25% per annum. The Fund also paid a commitment fee equal to its pro rata share of the amount of the credit facility at a rate of 0.125% per annum.
For the year ended November 30, 2011, the average daily loan balance outstanding on days when borrowing existed was $3,600,000 at a weighted average interest rate of 1.48%.
Annual Report 2012
58
Columbia Tax-Exempt Fund
Notes to Financial Statements (continued)
July 31, 2012
For the year ended November 30, 2011, the Investment Manager reimbursed the Fund $148 of interest expense.
The Fund had no borrowings for the period ended July 31, 2012.
Note 10. Fund Merger
At the close of business on June 3, 2011, the Fund acquired the assets and assumed the identified liabilities of Seligman National Municipal Fund, a series of Seligman Municipal Fund Series, Inc., and RiverSource Tax-Exempt High Income Fund, a series of RiverSource Tax-Exempt Income Series, Inc. The reorganization was completed after shareholders of Seligman National Municipal Fund and RiverSource Tax-Exempt High Income Fund approved the plan on February 15, 2011. The purpose of the transaction was to combine three funds managed by the Investment Manager with comparable investment objectives and strategies.
The aggregate net assets of the Fund immediately before the acquisitions were $1,964,927,197 and the combined net assets immediately after the acquisitions were $4,525,485,728.
The merger was accomplished by a tax-free exchange of 71,691,627 shares of Seligman National Municipal Fund valued at $549,162,443 (including $15,000,986 of unrealized appreciation ), and 480,872,682 shares of RiverSource Tax- Exempt High Income Fund valued at $2,011,396,088 (including $65,088,726 of unrealized appreciation).
In exchange for shares of Seligman National Municipal Fund and RiverSource Tax-Exempt High Income Fund, the Fund issued the following number of shares:
| | | Seligman
National
Municipal
Fund | | RiverSource
Tax-Exempt
High Income
Fund | |
| Class A | | | 39,704,790 | | | | 150,418,717 | | |
| Class B | | | N/A | | | | 1,348,328 | | |
| Class C | | | 2,130,946 | | | | 1,321,135 | | |
For financial reporting purposes, net assets received and shares issued by the Fund were recorded at fair value; however, Seligman National Municipal Fund and RiverSource Tax-Exempt High Income Fund's cost of investments was carried forward
The financial statements reflect the operations of the Fund for the period prior to the merger and the combined fund for the period subsequent to the merger. Because the combined investment portfolios have been managed as a single integrated portfolio since the merger was completed, it is not practicable to separate the amounts of revenue and earnings of Seligman National Municipal Fund and RiverSource Tax-Exempt High Income Fund that have been included in the combined Fund's Statement of Operations since the merger was completed.
Assuming the merger had been completed on December 1, 2010 the Fund's pro-forma net investment income (loss), net gain (loss) on investments, net change in unrealized appreciation (depreciation) and net increase in net assets from operations for the year ended November 30, 2011 would have been approximately $206.3 million, $(18.1) million, $89.5 million and $277.7 million, respectively.
Note 11. Significant Risks
Geographic Concentration Risk
Because state-specific tax-exempt funds invest primarily in the municipal securities issued by the state and political sub-divisions of the state, the Fund will be particularly affected by political and economic conditions and developments in the state in which it invests. The Fund may, therefore, have a greater risk than that of a municipal bond fund which is more geographically diversified. The value of the municipal securities owned by the Fund also may be adversely affected by future changes in federal or state income tax laws.
High Yield Securities Risk
Investing in high-yield fixed income securities may involve greater credit risk and considerations not typically associated with investing in U.S. Government bonds and other higher quality fixed income securities. These securities are non-investment grade securities, often referred to as "junk" bonds. Economic downturns may disrupt the high yield market and impair the ability of issuers to repay principal and interest. Also, an increase in interest rates would likely have an adverse impact on the value of such obligations. Moreover, high-yield securities may be less liquid to the extent that there is no established secondary market.
Note 12. Subsequent Events
Management has evaluated the events and transactions that have occurred through the date the financial statements were issued and noted no items requiring adjustment of the financial statements or additional disclosure.
Note 13. Information Regarding Pending and Settled Legal Proceedings
In December 2005, without admitting or denying the allegations, American Express Financial Corporation (AEFC, which is now known as Ameriprise Financial, Inc. (Ameriprise Financial)) entered into settlement agreements with the Securities and Exchange Commission (SEC) and Minnesota Department of Commerce (MDOC) related to market timing activities. As a result, AEFC was censured and ordered to cease
Annual Report 2012
59
Columbia Tax-Exempt Fund
Notes to Financial Statements (continued)
July 31, 2012
and desist from committing or causing any violations of certain provisions of the Investment Advisers Act of 1940, the Investment Company Act of 1940, and various Minnesota laws. AEFC agreed to pay disgorgement of $10 million and civil money penalties of $7 million. AEFC also agreed to retain an independent distribution consultant to assist in developing a plan for distribution of all disgorgement and civil penalties ordered by the SEC in accordance with various undertakings detailed at www.sec.gov/litigation/admin/ia-2451.pdf. Ameriprise Financial and its affiliates have cooperated with the SEC and the MDOC in these legal proceedings, and have made regular reports to the funds' Boards of Trustees.
Ameriprise Financial and certain of its affiliates have historically been involved in a number of legal, arbitration and regulatory proceedings, including routine litigation, class actions, and governmental actions, concerning matters arising in connection with the conduct of their business activities. Ameriprise Financial believes that the Funds are not currently the subject of, and that neither Ameriprise Financial nor any of its affiliates are the subject of, any pending legal, arbitration or regulatory proceedings that are likely to have a material adverse effect on the Funds or the ability of Ameriprise Financial or its affiliates to perform under their contracts with the Funds. Ameriprise Financial is required to make 10-Q, 10-K and, as necessary, 8-K filings with the Securities and Exchange Commission on legal and regulatory matters that relate to Ameriprise Financial and its affiliates. Copies of these filings may be obtained by accessing the SEC website at www.sec.gov.
There can be no assurance that these matters, or the adverse publicity associated with them, will not result in increased fund redemptions, reduced sale of fund shares or other adverse consequences to the Funds. Further, although we believe proceedings are not likely to have a material adverse effect on the Funds or the ability of Ameriprise Financial or its affiliates to perform under their contracts with the Funds, these proceedings are subject to uncertainties and, as such, we are unable to estimate the possible loss or range of loss that may result. An adverse outcome in one or more of these proceedings could result in adverse judgments, settlements, fines, penalties or other relief that could have a material adverse effect on the consolidated financial condition or results of operations of Ameriprise Financial.
Annual Report 2012
60
Columbia Tax-Exempt Fund
Report of Independent Registered Public Accounting Firm
To the Trustees of Columbia Funds Series Trust I and
the Shareholders of Columbia Tax-Exempt Fund
In our opinion, the accompanying statement of assets and liabilities, including the portfolio of investments, and the related statements of operations and of changes in net assets and the financial highlights present fairly, in all material respects, the financial position of Columbia Tax-Exempt Fund (the "Fund") (a series of Columbia Funds Series Trust I) at July 31, 2012, the results of its operations, the changes in its net assets and the financial highlights for each of the periods indicated, in conformity with accounting principles generally accepted in the United States of America. These financial statements and financial highlights (hereafter referred to as "financial statements") are the responsibility of the Fund's management. Our responsibility is to express an opinion on these financial statements based on our audits. We conducted our audits of these financial statements in accordance with the standards of the Public Company Accounting Oversight Board (United States). Those standards require that we plan and perform the audit to obtain reasonable assurance about whether the financial statements are free of material misstatement. An audit includes examining, on a test basis, evidence supporting the amounts and disclosures in the financial statements, assessing the accounting principles used and significant estimates made by management, and evaluating the overall financial statement presentation. We believe that our audits, which included confirmation of securities at July 31, 2012 by correspondence with the custodian and brokers, provide a reasonable basis for our opinion.
PricewaterhouseCoopers LLP
Minneapolis, Minnesota
September 21, 2012
Annual Report 2012
61
Columbia Tax-Exempt Fund
Federal Income Tax Information
(Unaudited)
For the fiscal year ended July 31, 2012, 99.74% of the distributions from net investment income of the Fund qualifies as exempt interest dividends for federal income tax purposes. A portion of the income may be subject to federal alternative minimum tax.
The Fund will notify shareholders in January 2013 of amounts for use in preparing 2012 income tax returns.
Annual Report 2012
62
Columbia Tax-Exempt Fund
Trustees and Officers
The Trustees serve terms of indefinite duration. The names, addresses and birth years of the Trustees and Officers of the Funds in Columbia Funds Series Trust I, the year each was first elected or appointed to office, their principal business occupations during at least the last five years, the number of Funds overseen by each Trustee and other directorships they hold are shown below. Each officer listed below serves as an officer of each Fund in Columbia Funds Series Trust I.
Independent Trustees
Name, Address and Year of Birth,
Position with Funds, Year First
Elected or Appointed to Office | | Principal Occupation(s) During Past Five Years, Number of Funds in Columbia
Funds Complex Overseen by Trustee, Other Directorships Held
| |
Rodman L. Drake (Born 1943)
c/o Columbia Management Investment Advisers, LLC
225 Franklin Street
Boston, MA 02110
Trustee (since 1994) and
Chairman of the Board (since 2009) | | Independent consultant since 2010; Co-Founder of Baringo Capital LLC (private equity) from 1997 to 2008; CEO of Crystal River Capital, Inc. (real estate investment trust) from 2003 to 2010; Oversees 52; Jackson Hewitt Tax Service Inc. (tax preparation services from 2004 to 2011); Celgene Corporation (global biotechnology company); Student Loan Corporation (student loan provider from 2005 to 2010); Celgene Corporation (global biotechnology company); The Helios Funds and Brookfield Funds (closed-end funds); Crystal River Capital, Inc. from 2005 to 2010; Parsons Brinckerhoff from 1995 to 2008; and Apex Silver Mines Ltd. from 2007 to 2009 | |
|
Douglas A. Hacker (Born 1955)
c/o Columbia Management Investment Advisers, LLC
225 Franklin Street
Boston, MA 02110
Trustee (since 1996) | | Independent business executive since May 2006; Executive Vice President — Strategy of United Airlines from December 2002 to May 2006; President of UAL Loyalty Services (airline marketing company) from September 2001 to December 2002; Executive Vice President and Chief Financial Officer of United Airlines from July 1999 to September 2001. Oversees 52; Nash Finch Company (food distributor); Aircastle Limited (aircraft leasing); and SeaCube Container Leasing Ltd. (container leasing) | |
|
Janet Langford Kelly (Born 1957)
c/o Columbia Management Investment Advisers, LLC
225 Franklin Street
Boston, MA 02110
Trustee (since 1996) | | Senior Vice President, General Counsel and Corporate Secretary, ConocoPhillips (integrated energy company) since September 2007; Deputy General Counsel — Corporate Legal Services, ConocoPhillips from August 2006 to August 2007; Partner, Zelle, Hofmann, Voelbel, Mason & Gette LLP (law firm) from March 2005 to July 2006; Adjunct Professor of Law, Northwestern University from September 2004 to June 2006; Director, UAL Corporation (airline) from February 2006 to July 2006; Chief Administrative Officer and Senior Vice President, Kmart Holding Corporation (consumer goods) from September 2003 to March 2004. Oversees 52; None | |
|
Nancy T. Lukitsh (Born 1956)
c/o Columbia Management Investment Advisers, LLC
225 Franklin Street
Boston, MA 02110
Trustee (since 2011) | | Senior Vice President, Partner and Director of Marketing, Wellington Management Company, LLP (investment adviser) from 1997 to 2010; Chair, Wellington Management Investment Portfolios (commingled non-U.S. investment pools) from 2007 to 2010; Director, Wellington Trust Company, NA and other Wellington affiliates from 1997 to 2010. Oversees 52; None | |
|
William E. Mayer (Born 1940)
c/o Columbia Management Investment Advisers, LLC
225 Franklin Street
Boston, MA 02110
Trustee (since 1994) | | Partner, Park Avenue Equity Partners (private equity) since February 1999; Dean and Professor, College of Business and Management, University of Maryland from 1992 to 1996. Oversees 52; DynaVox Inc. (speech creation); Lee Enterprises (print media); WR Hambrecht + Co. (financial service provider) from 2000 to 2012; BlackRock Kelso Capital Corporation (investment company) | |
|
David M. Moffett (Born 1952)
c/o Columbia Management Investment Advisers, LLC
225 Franklin Street
Boston, MA 02110
Trustee (since 2011) | | Retired. Chief Executive Officer, Federal Home Loan Mortgage Corporation, from 2008 to 2009; Senior Adviser, Global Financial Services Group, Carlyle Group, Inc., from 2007 to 2008; Vice Chairman and Chief Financial Officer, U.S. Bancorp, from 1993 to 2007. Oversees 52; CIT Group Inc. (commercial and consumer finance); eBay Inc. (online trading community); MBIA Inc. (financial service provider); E.W. Scripps Co. (print and television media), Building Materials Holding Corp. (building materials and construction services); and University of Oklahoma Foundation. | |
|
Charles R. Nelson (Born 1942)
c/o Columbia Management Investment Advisers, LLC
225 Franklin Street
Boston, MA 02110
Trustee (since 1981) | | Retired Professor Emeritus, University of Washington, since 2011; Professor of Economics, University of Washington from January 1976 to 2011; Ford and Louisa Van Voorhis Professor of Political Economy, University of Washington from 1993 to 2011; Adjunct Professor of Statistics, University of Washington from 1980 to 2011; Associate Editor, Journal of Money Credit and Banking from 1993 to 2008; consultant on econometric and statistical matters. Oversees 52; None | |
|
John J. Neuhauser (Born 1943)
c/o Columbia Management Investment Advisers, LLC
225 Franklin Street
Boston, MA 02110
Trustee (since 1984) | | President, Saint Michael's College, since August 2007; Director or Trustee of several non-profit organizations, including Fletcher Allen Health Care, Inc.; University Professor, Boston College from November 2005 to August 2007; Academic Vice President and Dean of Faculties, Boston College from August 1999 to October 2005. Oversees 52; Liberty All-Star Equity Fund and Liberty All-Star Growth Fund (closed-end funds) | |
|
Annual Report 2012
63
Columbia Tax-Exempt Fund
Trustees and Officers (continued)
Independent Trustees (continued)
Name, Address and Year of Birth,
Position with Funds, Year First
Elected or Appointed to Office | | Principal Occupation(s) During Past Five Years, Number of Funds in Columbia
Funds Complex Overseen by Trustee, Other Directorships Held
| |
Patrick J. Simpson (Born 1944)
c/o Columbia Management Investment Advisers, LLC
225 Franklin Street
Boston, MA 02110
Trustee (since 2000) | | Partner, Perkins Coie LLP (law firm). Oversees 52; None | |
|
Anne-Lee Verville (Born 1945)
c/o Columbia Management Investment Advisers, LLC
225 Franklin Street
Boston, MA 02110
Trustee (since 1998) | | Retired. General Manager — Global Education Industry from 1994 to 1997, President — Application Systems Division from 1991 to 1994, Chief Financial Officer — US Marketing & Services from 1988 to 1991, and Chief Information Officer from 1987 to 1988, IBM Corporation (computer and technology). Oversees 52; Enesco Group, Inc. (producer of giftware and home and garden decor products) from 2001 to 2006 | |
|
The Statement of Additional Information includes additional information about the Trustees of the Funds and is available, without charge, upon request by calling 1-800-345-6611.
Interested Trustee
Name, Address and Year of Birth,
Position with Funds, Year First
Elected or Appointed to Office | | Principal Occupation(s) During Past Five Years, Number of Funds in Columbia
Funds Complex Overseen by Trustee, Other Directorships Held
| |
William F. Truscott (born 1960)
53600 Ameriprise Financial Center
Minneapolis, MN 55474
Senior Vice President (since 2012) | | Chairman of the Board and President, Columbia Management Investment Advisers, LLC since May 2010 and February 2012, respectively (previously President, Chairman of the Board and Chief Investment Officer, from 2001 to April 2010); Chief Executive Officer, U.S. Asset Management & President, Annuities, Ameriprise Financial, Inc. since May 2010 (previously President — U.S. Asset Management and Chief Investment Officer from 2005 to April 2010, and Senior Vice President — Chief Investment Officer, from 2001 to 2005); Director, President and Chief Executive Officer, Ameriprise Certificate Company since 2006; Director and Chief Executive Officer, Columbia Management Investment Distributors, Inc. since May 2010 and February 2012, respectively (previously Chairman of the Board and Chief Executive Officer from 2008 to April 2010); Chairman of the Board and Chief Executive Officer, RiverSource Distributors, Inc. since 2006. Oversees 208; Columbia Funds Board. | |
|
Officers
| Name, Year of Birth and Address | | Principal Occupation(s) During the Past Five Years | |
J. Kevin Connaughton (Born 1964)
225 Franklin Street
Boston, MA 02110
President (since 2009) | | Senior Vice President and General Manager — Mutual Fund Products, Columbia Management Investment Advisers, LLC since May 2010; President, Columbia Funds, since 2009, and RiverSource Funds, since May 2010 (previously Senior Vice President and Chief Financial Officer, Columbia Funds, from June 2008 to January 2009, Treasurer, Columbia Funds, from October 2003 to May 2008, and senior officer of various other affiliated funds since 2000); Managing Director, Columbia Management Advisors, LLC from December 2004 to April 2010. | |
|
Michael G. Clarke (Born 1969)
225 Franklin Street
Boston, MA 02110
Treasurer (since 2011) and Chief Financial Officer (since 2009) | | Vice President, Columbia Management Investment Advisers, LLC since May 2010; Managing Director of Fund Administration, Columbia Management Advisors, LLC, from September 2004 to April 2010; senior officer of Columbia Funds and affiliated funds since 2002. | |
|
Scott R. Plummer (Born 1959)
5228 Ameriprise Financial Center
Minneapolis, MN 55474
Senior Vice President, Assistant Secretary and Chief Legal Officer (since 2010) | | Senior Vice President, Chief Legal Officer and Assistant Secretary, Columbia Management Investment Advisers, LLC since June 2005; Vice President and Lead Chief Counsel — Asset Management, Ameriprise Financial, Inc. since May 2010 (previously Vice President and Chief Counsel — Asset Management, from 2005 to April 2010); Vice President, Chief Counsel and Assistant Secretary, Columbia Management Investment Distributors, Inc. since 2008; Vice President, General Counsel and Secretary, Ameriprise Certificate Company since 2005; Chief Counsel, RiverSource Distributors, Inc. since 2006; Vice President, General Counsel and Secretary, RiverSource Funds since December 2006; Senior Vice President, Secretary and Chief Legal Officer, Columbia Funds, since May 2010. | |
|
Annual Report 2012
64
Columbia Tax-Exempt Fund
Trustees and Officers (continued)
Officers (continued)
| Name, Year of Birth and Address | | Principal Occupation(s) During the Past Five Years | |
William F. Truscott (Born 1960)
53600 Ameriprise Financial Center
Minneapolis, MN 55474
Senior Vice President (since 2010) | | Chairman of the Board and President, Columbia Management Investment Advisers, LLC since May 2010 and February 2012, respectively (previously President, Chairman of the Board and Chief Investment Officer, from 2001 to April 2010); Chief Executive Officer, U.S. Asset Management & President, Annuities, Ameriprise Financial, Inc. since May 2010 (previously President — U.S. Asset Management and Chief Investment Officer from 2005 to April 2010); Director, President and Chief Executive Officer, Ameriprise Certificate Company since 2006; Director and Chief Executive Officer, Columbia Management Investment Distributors, Inc. since May 2010 and February 2012, respectively (previously Chairman of the Board and Chief Executive Officer from 2008 to April 2010); Chairman of the Board and Chief Executive Officer, RiverSource Distributors, Inc. since 2006. | |
|
Thomas P. McGuire (Born 1972)
225 Franklin Street
Boston, MA 02110
Chief Compliance Officer (since 2012) | | Vice President — Asset Management Compliance, Columbia Management Investment Advisers, LLC since 2010; Chief Compliance Officer, Ameriprise Certificate Company, since September 2010; Compliance Executive, Bank of America, 2005-2010. | |
|
Colin Moore (Born 1958)
225 Franklin Street
Boston, MA 02110
Senior Vice President (since 2010) | | Director and Chief Investment Officer, Columbia Management Investment Advisers, LLC since May 2010; Manager, Managing Director and Chief Investment Officer of Columbia Management Advisors, LLC from 2007 to April 2010; Head of Equities, Columbia Management Advisors, LLC from 2002 to 2007. | |
|
Amy Johnson (Born 1965)
5228 Ameriprise Financial Center
Minneapolis, MN 55474
Vice President (since 2010) | | Senior Vice President and Chief Operating Officer, Columbia Management Investment Advisers, LLC since May 2010 (previously Chief Administrative Officer, from 2009 until April 2010, Vice President — Asset Management and Trust Company Services, from 2006 to 2009, and Vice President — Operations and Compliance from 2004 to 2006). | |
|
Joseph F. DiMaria (Born 1968)
225 Franklin Street
Boston, MA 02110
Vice President (since 2011) and Chief Accounting Officer (since 2008) | | Vice President, Mutual Fund Administration, Columbia Management Investment Advisers, LLC, since May 2010; Director of Fund Administration, Columbia Management Advisors, LLC from January 2006 to April 2010; Head of Tax/Compliance and Assistant Treasurer, Columbia Management Advisors, LLC, from November 2004 to December 2005. | |
|
Stephen T. Welsh (born 1957)
225 Franklin Street
Boston, MA 02110
Vice President (since 2006) | | President and Director, Columbia Management Investment Services Corp. since May 2010; President and Director, Columbia Management Services, Inc. from July 2004 to April 2010; Managing Director, Columbia Management Distributors, Inc. from August 2007 to April 2010. | |
|
Paul D. Pearson (born 1956)
10468 Ameriprise Financial Center
Minneapolis, MN 55474
Vice President and Assistant Treasurer (since 2011) | | Vice President, Investment Accounting, Columbia Management Investment Advisers, LLC, since May 2010; Vice President, Managed Assets, Investment Accounting, Ameriprise Financial Corporation. | |
|
Paul B. Goucher (born 1968)
5228 Ameriprise Financial Center
Minneapolis, MN 55474
Vice President and Assistant Secretary (since 2010) | | Vice President and Chief Counsel of Ameriprise Financial since January 2010 (formerly Vice President and Group Counsel from November 2008 to January 2010); Director, Managing Director and General Counsel of J. & W. Seligman & Co. Incorporated (Seligman) from July 2008 to November 2008 and Managing Director and Associate General Counsel of Seligman from January 2005 to July 2008. | |
|
Christopher O. Petersen (born 1970)
5228 Ameriprise Financial Center
Minneapolis, MN 55474
Vice President (since 2010) and Secretary (since 2011) | | Vice President and Chief Counsel, Ameriprise Financial since January 2010 (formerly Vice President and Group Counsel or Counsel from April 2004 to January 2010); Assistant Secretary of RiverSource Funds since January 2007; officer of Columbia Funds and affiliated funds since 2007. | |
|
Michael E. DeFao (born 1968)
225 Franklin Street
Boston, MA 02110
Vice President and Assistant Secretary (since 2011) | | Vice President and Chief Counsel, Ameriprise Financial since May 2010; Associate General Counsel, Bank of America from June 2005 to April 2010. | |
|
Annual Report 2012
65
Columbia Tax-Exempt Fund
Board Consideration and Approval of
Advisory Agreement
On June 6, 2012, the Board of Trustees (the "Board") and the Trustees who are not interested persons (as defined in the Investment Company Act of 1940) of the Trust (the "Independent Trustees") unanimously approved the continuation of the Investment Management Services Agreement (the "Advisory Agreement") with Columbia Management Investment Advisers, LLC (the "Investment Manager") with respect to Columbia Tax-Exempt Fund (the "Fund"), a series of the Trust. As detailed below, the Advisory Fees and Expenses Committee (the "Committee") and the Board met on multiple occasions to review and discuss, both among themselves and with the management team of the Investment Manager, materials provided by the Investment Manager before determining to approve the continuation of the Advisory Agreement.
In connection with their deliberations regarding the continuation of the Advisory Agreement, the Committee and the Board requested and evaluated materials from the Investment Manager regarding the Fund and the Advisory Agreement, and discussed these materials with representatives of the Investment Manager at the Committee meeting held on June 5, 2012 and at the Board meeting held on June 6, 2012. In addition, the Board considers matters bearing on the Advisory Agreement at most of its other meetings throughout the year and meets regularly with senior management of the Funds and the Investment Manager. Through the Board's Investment Oversight Committees, Trustees also meet with selected Fund portfolio managers and other investment personnel at various times throughout the year. The Committee and the Board also consulted with Fund counsel and with the Independent Trustees' independent legal counsel, who advised on the legal standard for consideration by the Board and otherwise assisted the Board in its deliberations. On June 5, 2012, the Committee recommended that the Board approve the continuation of the Advisory Agreement. On June 6, 2012, the Board, including the Independent Trustees, voting separately, unanimously approved the continuation of the Advisory Agreement for the Fund.
The Committee and the Board considered all information that they, their legal counsel, or the Investment Manager believed reasonably necessary to evaluate and to determine whether to approve the continuation of the Advisory Agreement. In their deliberations, the Trustees did not identify any particular information that was all-important or controlling, and individual Trustees may have attributed different weights to the various factors. The information and factors considered by the Committee and the Board in recommending for approval or approving the continuation of the Advisory Agreement for the Fund included the following:
• Information on the investment performance of the Fund relative to the performance of the Fund's benchmarks and the performance of a group of comparable mutual funds, as determined by an independent third-party data provider;
• Information on the Fund's advisory fees and total expenses, including information comparing the Fund's expenses to those of a group of comparable mutual funds, as determined by an independent third-party data provider;
• The Investment Manager's agreement to contractually limit or cap total operating expenses for the Fund so that total operating expenses (excluding certain fees and expenses, such as transaction costs and certain other investment related expenses, interest, taxes, acquired fund fees and expenses, and extraordinary expenses) would not exceed the median expenses of a group of comparable funds (as determined from time to time, generally annually, by an independent third-party data provider);
• The terms and conditions of the Advisory Agreement, including that the advisory fee rates payable by the Fund would not change;
• The terms and conditions of other agreements and arrangements with affiliates of the Investment Manager relating to the operations of the Fund, including the Administrative Services Agreement, the Distribution Agreement and the Transfer and Dividend Disbursing Agent Agreement, noting in the case of the Transfer and Dividend Disbursing Agent Agreement certain proposed changes to the fee rates payable thereunder;
• Descriptions of various functions performed by the Investment Manager under the Advisory Agreement, including portfolio management and portfolio trading practices;
• Information regarding the management fees and investment performance of any comparable portfolios of other clients of the Investment Manager, including institutional separate accounts; and
• The profitability to the Investment Manager and its affiliates from their relationships with the Fund.
Annual Report 2012
66
Columbia Tax-Exempt Fund
Board Consideration and Approval of
Advisory Agreement (continued)
Nature, Extent and Quality of Services to be Provided under the Advisory Agreement
The Committee and the Board considered the nature, extent and quality of services provided to the Fund by the Investment Manager and its affiliates under the Advisory Agreement and under separate agreements for the provision of transfer agency and administrative services, and the resources dedicated to the Fund and the other Columbia Funds by the Investment Manager and its affiliates. The Committee and the Board considered, among other things, the Investment Manager's ability to attract, motivate and retain highly qualified research, advisory and supervisory investment professionals (including personnel and other resources, compensation programs for personnel involved in fund management, reputation and other attributes), the portfolio management services provided by those investment professionals, the quality of the Investment Manager's investment research capabilities and trade execution services, and the other resources that the Investment Manager devotes to the Fund. The Committee and the Board also considered the potential benefits to shareholders of investing in a mutual fund that is part of a fund complex offering exposure to a variety of asset classes and investment disciplines and providing a variety of fund and shareholder services.
The Committee and the Board also considered the professional experience and qualifications of the senior personnel of the Investment Manager. The Committee and the Board noted the compliance programs of and the compliance-related resources provided to the Fund by the Investment Manager and its affiliates, and considered the Investment Manager's ability to provide administrative services to the Fund pursuant to a separate administrative services agreement, including the Investment Manager's ability to coordinate the activities of the Fund's other service providers. After reviewing these and related factors, the Committee and the Board concluded, within the context of their overall conclusions, that the expected nature, extent and quality of the services to be provided to the Fund under the Advisory Agreement supported the continuation of such agreement.
Investment Performance
The Committee and the Board reviewed information about the performance of the Fund over various time periods, including performance information relative to benchmarks and information based on reports of an independent third-party data provider that compared the performance of the Fund to the performance of a group of comparable mutual funds. The Committee and the Board also reviewed a description of the third party's methodology for identifying the Fund's peer groups for purposes of performance and expense comparisons. In the case of each Fund whose performance lagged that of a relevant peer group for certain (although not necessarily all) periods, the Committee and the Board concluded that other factors relevant to performance were sufficient, in light of other considerations, to warrant continuation of the Fund's Advisory Agreement. Those factors varied from fund to fund, but included one or more of the following: (i) that the Fund's performance, although lagging in certain recent periods, was stronger over the longer term; (ii) that the underperformance was attributable, to a significant extent, to investment decisions that were reasonable and consistent with the Fund's investment strategy and policies and that the Fund was performing within a reasonable range of expectations, given those investment decisions, market conditions and the Fund's investment strategy; (iii) that the Fund's performance was competitive when compared to other relevant performance benchmarks or peer groups; and (iv) that the Investment Manager had taken or was taking steps designed to help improve the Fund's investment performance, including, but not limited to, replacing portfolio managers, enhancing the resources supporting the portfolio managers, or modifying investment strategies.
The Committee and the Board noted that, through December 31, 2011, the Fund's performance was in the fourteenth, forty-fifth and forty-third percentiles (where the best performance would be in the first percentile) of its category selected by an independent third-party data provider for the purposes of performance comparisons for the one-, three- and five- year periods, respectively.
The Committee and the Board also considered the Investment Manager's performance and reputation generally, the Investment Manager's historical responsiveness to Board concerns about performance and the Investment Manager's willingness to take steps intended to improve performance. After reviewing these and related factors, the Committee and the Board concluded, within the context of their overall conclusions regarding the Advisory Agreement, that the performance of the Fund and the Investment Manager was sufficient, in light of other considerations, to warrant the continuation of the Advisory Agreement.
Annual Report 2012
67
Columbia Tax-Exempt Fund
Board Consideration and Approval of
Advisory Agreement (continued)
Investment Advisory Fee Rates and Other Expenses
The Committee and the Board considered the advisory fees to be charged to the Fund under the Advisory Agreement as well as the total expenses to be incurred by the Fund. In assessing the reasonableness of the fees under the Advisory Agreement, the Committee and the Board considered, among other information, the Fund's advisory fee and its expected total expense ratio as a percentage of average daily net assets. The Committee and the Board noted that the Fund's actual management fee and total net expense ratio are ranked in the second and first quintiles, respectively, against the Fund's expense universe as determined by an independent third-party data provider for purposes of expense comparison. The Committee and the Board also took into account the fee waiver and expense limitation arrangements agreed to by the Investment Manager, as noted above.
The Committee and the Board also considered the fact that the advisory fee rates payable by the Fund to the Investment Manager under the Advisory Agreement were the same as those currently paid by the Fund to the Investment Manager.
The Committee and the Board also received and considered information about the advisory fees charged by the Investment Manager to institutional separate accounts. In considering the fees charged to those accounts, the Committee and the Board took into account, among other things, the Investment Manager's representations about the differences between managing mutual funds as compared to other types of accounts, including differences in the services provided, differences in the risk profile of such business for the Investment Manager and the additional resources required to manage mutual funds effectively. In evaluating the Fund's advisory fees, the Committee and the Board also took into account the demands, complexity and quality of the investment management of the Fund.
After reviewing these and related factors, the Committee and the Board concluded, within the context of their overall conclusions, that the advisory fee rates and expenses of the Fund supported the continuation of the Advisory Agreement.
Costs of Services to be Provided and Profitability
The Committee and the Board also took note of the costs of the services provided (both on an absolute and relative basis) and the profitability to the Investment Manager and its affiliates in connection with their relationships with the Fund. In evaluating these considerations, the Committee and the Board took note of the advisory fees charged by the Investment Manager to other clients, including fees charged by the Investment Manager to any institutional separate account clients with similar investment strategies to those of the Fund.
The Committee and the Board also considered the compensation directly or indirectly received by the Investment Manager's affiliates in connection with their relationships with the Fund. The Committee and the Board reviewed information provided by management as to the profitability of the Investment Manager and its affiliates of their relationships with the Fund, and information about the allocation of expenses used to calculate profitability. When reviewing profitability, the Committee and the Board also considered court cases in which adviser profitability was an issue in whole or in part, the performance of the fund, the expense ratio of the fund, and the implementation of expense limitations with respect to the fund. The Committee and the Board also considered information provided by the Investment Manager regarding its financial condition and comparing its profitability to that of other asset management firms that are, or are subsidiaries of, publicly traded companies.
After reviewing these and related factors, the Committee and the Board concluded, within the context of their overall conclusions, that the profitability to the Investment Manager and its affiliates from their relationships with the Fund supported the continuation of the Advisory Agreement.
Economies of Scale
The Committee and the Board considered the potential existence of economies of scale in the provision by the Investment Manager of services to the Fund, to groups of related funds, and to the Investment Manager's investment advisory clients as a whole, and whether those economies of scale were shared with the Fund through breakpoints in investment advisory fees or other means, such as expense limitation arrangements and additional investments by the Investment Manager in investment, trading and compliance resources. The Committee and the Board noted that the investment advisory fee schedules for the Fund contained breakpoints that would reduce the fee rate on assets above specified threshold levels.
Annual Report 2012
68
Columbia Tax-Exempt Fund
Board Consideration and Approval of
Advisory Agreement (continued)
In considering these issues, the Committee and the Board also considered the costs of the services provided (both on an absolute and relative basis) and the profitability to the Investment Manager and its affiliates from their relationships with the Fund, as discussed above. After reviewing these and related factors, the Committee and the Board concluded, within the context of their overall conclusions, that the extent to which economies of scale were expected to be shared with the Fund supported the continuation of the Advisory Agreement.
Other Benefits to the Investment Manager
The Committee and the Board received and considered information regarding "fall-out" or ancillary benefits received by the Investment Manager and its affiliates as a result of their relationships with the Fund, such as the engagement of the Investment Manager to provide administrative services to the Fund and the engagement of the Investment Manager's affiliates to provide distribution and transfer agency services to the Fund. The Committee and the Board considered that the Fund's distributor retains a portion of the distribution fees from the Fund and receives a portion of the sales charges on sales or redemptions of certain classes of shares of the Fund. The Committee and the Board also considered the benefits of research made available to the Investment Manager by reason of brokerage commissions generated by the Fund's securities transactions, and reviewed information about the Investment Manager's practices with respect to allocating portfolio brokerage for brokerage and research services. The Committee and the Board considered the possible conflicts of interest associated with certain fall-out or other ancillary benefits and the reporting, disclosure and other processes that would be in place to address such possible conflicts of interest. The Committee and the Board recognized that the Investment Manager's profitability would be somewhat lower without these benefits.
Conclusion
The Committee and the Board reviewed all of the above considerations in reaching their decisions to recommend or approve the continuation of the Advisory Agreement. No single item was identified as paramount or controlling, and individual Trustees may have attributed different weights to various factors. Based on their evaluation of all factors that they deemed to be material, including those factors described above, and assisted by the advice of independent legal counsel, the Board, including the Independent Trustees, voting separately, unanimously approved the continuation of the Advisory Agreement.
Annual Report 2012
69
This page intentionally left blank.
Annual Report 2012
70
This page intentionally left blank.
Annual Report 2012
71
This page intentionally left blank.
Annual Report 2012
72
Columbia Tax-Exempt Fund
Important Information About This Report
Each fund mails one shareholder report to each shareholder address. If you would like more than one report, please call shareholder services at 800.345.6611 and additional reports will be sent to you.
The policy of the Board is to vote the proxies of the companies in which each fund holds investments consistent with the procedures as stated in the Statement of Additional Information (SAI). You may obtain a copy of the SAI without charge by calling 800.345.6611; contacting your financial intermediary; visiting columbiamanagement.com; or searching the website of the Securities and Exchange Commission (SEC) at sec.gov. Information regarding how each fund voted proxies relating to portfolio securities is filed with the SEC by August 31 for the most recent 12-month period ending June 30 of that year, and is available without charge by visiting columbiamanagement.com; or searching the website of the SEC at sec.gov.
Each fund files a complete schedule of portfolio holdings with the SEC for the first and third quarters of each fiscal year on Form N-Q. Each fund's Form N-Q is available on the SEC's website at sec.gov and may be reviewed and copied at the SEC's Public Reference Room in Washington, D.C. Information on the operation of the Public Reference Room may be obtained by calling 800.SEC.0330. Each fund's complete schedule of portfolio holdings, as filed on Form N-Q, can also be obtained without charge, upon request, by calling 800.345.6611.
Annual Report 2012
73

Columbia Tax-Exempt Fund
P.O. Box 8081
Boston, MA 02266-8081
columbiamanagement.com
This information is for use with concurrent or prior delivery of a fund prospectus. Please read and consider the investment objectives, risks, charges and expenses for any fund carefully before investing. For a prospectus which contains this and other important information about the Fund go to columbiamanagement.com. The Fund is distributed by Columbia Management Investment Distributors, Inc., member FINRA, and managed by Columbia Management Investment Advisers, LLC.
© 2012 Columbia Management Investment Advisers, LLC. All rights reserved.
C-1051 D (9/12)
Item 2. Code of Ethics.
(a) The registrant has adopted a code of ethics that applies to the registrant’s principal executive officer, principal financial officer, principal accounting officer or controller, or persons performing similar functions, regardless of whether these individuals are employed by the registrant or a third party.
(b) During the period covered by this report, there were not any amendments to a provision of the code of ethics adopted in 2(a) above.
(c) During the period covered by this report, there were no waivers, including any implicit waivers, from a provision of the code of ethics described in 2(a) above that relates to one or more of the items set forth in paragraph (b) of this item’s instructions.
Item 3. Audit Committee Financial Expert.
The registrant’s Board of Trustees has determined that Douglas A. Hacker, David M. Moffett and Anne-Lee Verville, each of whom are members of the registrant’s Board of Trustees and Audit Committee, each qualify as an audit committee financial expert. Mr. Hacker, Mr. Moffett and Ms. Verville are each independent trustees, as defined in paragraph (a)(2) of this item’s instructions.
Item 4. Principal Accountant Fees and Services.
Fee information below is disclosed for the four series of the registrant whose report to stockholders is included in this annual filing. Three series changed their fiscal year end during the period effective July 31, 2012, one from August 31, one from September 30 and one from November 30. The fees presented for 2012 represent the fiscal year ended July 31, 2012 for one series, the eleven month period ended July 31, 2012 for one series, the ten month period ended July 31, 2012 for one series and the eight month period ended July 31, 2012 for one series. The fees presented for 2011 include information for the fiscal year ended July 31, 2011 for one series, August 31, 2011 for one series, September 30, 2011 for one series and November 30, 2011 for one series.
(a) Audit Fees. Aggregate Audit Fees billed by the principal accountant for professional services rendered during the period ended July 31, 2012 and the indicated 2011 fiscal years are approximately as follows:
2012 | | July 31,2011
(for one series) | | August 31, 2011
(for one series) | | September 30, 2011
(for one series) | | November 30, 2011
(for one series) | |
$ | 132,800 | | $ | 29,300 | | $ | 35,400 | | $ | 30,300 | | $ | 53,700 | |
| | | | | | | | | | | | | | |
Audit Fees include amounts related to the audit of the registrant’s annual financial statements or services that are normally provided by the accountant in connection with statutory and regulatory filings or engagements for those fiscal years. The 2011 fiscal years also include audit fees for the review and provision of consent in connection with filing Form N-1A for new share classes.
(b) Audit-Related Fees. Aggregate Audit-Related Fees billed to the registrant by the principal accountant for professional services rendered during the period ended July 31, 2012 and the indicated 2011 fiscal years are approximately as follows:
2012 | | July 31,2011
(for one series) | | August 31, 2011
(for one series) | | September 30, 2011
(for one series) | | November 30, 2011
(for one series) | |
$ | 5,700 | | $ | 4,100 | | $ | 7,100 | | $ | 14,100 | | $ | 14,100 | |
| | | | | | | | | | | | | | |
Audit-Related Fees include amounts for assurance and related services by the principal accountant that are reasonably related to the performance of the audit of the registrant’s financial statements and are not reported in Audit Fees above. In both fiscal period 2012 and the 2011 fiscal years, Audit-Related Fees consist of agreed-upon procedures performed for semi-annual shareholder reports and fund accounting and custody conversions. The 2011 fiscal years also includes Audit-Related Fees for agreed-upon procedures related to fund mergers.
During the period ended July 31, 2012 and the indicated 2011 fiscal years, there were no Audit-Related Fees billed by the registrant’s principal accountant to the registrant’s investment adviser (not including any sub-adviser whose role is primarily portfolio management and is subcontracted with or overseen by another investment adviser) and any entity controlling, controlled by, or under common control with the adviser that provides ongoing services to the registrant for an engagement that related directly to the operations and financial reporting of the registrant.
(c) Tax Fees. Aggregate Tax Fees billed by the principal accountant to the registrant for professional services rendered during the period ended July 31, 2012 and the indicated 2011 fiscal years are approximately as follows:
2012 | | July 31,2011
(for one series) | | August 31, 2011
(for one series) | | September 30, 2011
(for one series) | | November 30, 2011
(for one series) | |
$ | 15,100 | | $ | 4,300 | | $ | 8,700 | | $ | 3,900 | | $ | 9,700 | |
| | | | | | | | | | | | | | |
Tax Fees include amounts for the review of annual tax returns, the review of required shareholder distribution calculations and typically include amounts for professional services by the principal accountant for tax compliance, tax advice and tax planning.
During the period ended July 31, 2012 and the indicated 2011 fiscal years, there were no Tax Fees billed by the registrant’s principal accountant to the registrant’s investment adviser (not including any sub-adviser whose role is primarily portfolio management and is subcontracted with or overseen by another investment adviser) and any entity controlling, controlled by, or under common control with the adviser that provides ongoing services to the registrant for an engagement that related directly to the operations and financial reporting of the registrant.
(d) All Other Fees. Aggregate All Other Fees billed by the principal accountant to the registrant for professional services rendered during the period ended July 31, 2012 and the indicated 2011 fiscal years are approximately as follows:
2012 | | July 31,2011
(for one series) | | August 31, 2011
(for one series) | | September 30, 2011
(for one series) | | November 30, 2011
(for one series) | |
$ | 0 | | $ | 0 | | $ | 0 | | $ | 0 | | $ | 0 | |
| | | | | | | | | | | | | | |
All Other Fees include amounts for products and services provided by the principal accountant, other than the services reported in paragraphs (a) through (c) above.
Aggregate All Other Fees billed by the registrant’s principal accountant to the registrant’s investment adviser (not including any sub-adviser whose role is primarily portfolio management and is subcontracted with or overseen by another investment adviser) and any entity controlling, controlled by, or under common control with the adviser that provides ongoing services to the registrant for an engagement that related directly to the operations and financial reporting of the registrant during the period ended July 31, 2012 and the indicated 2011fiscal years are approximately as follows:
2012 | | July 31,2011
(for one series) | | August 31, 2011
(for one series) | | September 30, 2011
(for one series) | | November 30, 2011
(for one series) | |
$ | 395,800 | | $ | 395,300 | | $ | 395,300 | | $ | 395,300 | | $ | 485,300 | |
| | | | | | | | | | | | | | |
In both fiscal period 2012 and the 2011 fiscal years, All Other Fees consist of fees billed for internal control examinations of the registrant’s transfer agent and investment advisor.
(e)(1) Audit Committee Pre-Approval Policies and Procedures
The registrant’s Audit Committee is required to pre-approve the engagement of the registrant’s independent accountants to provide audit and non-audit services to the registrant and non-audit services to its investment adviser (not including any sub-adviser whose role is primarily portfolio management and is subcontracted with or overseen by another investment adviser) or any entity controlling, controlled by or under common control with such investment adviser that provides ongoing services to the registrant (“Adviser Affiliates”), if the engagement relates directly to the operations and financial reporting of the registrant.
The Audit Committee has adopted a Policy for Engagement of Independent Accountants for Audit and Non-Audit Services (“Policy”). The Policy sets forth the understanding of the Audit Committee regarding the engagement of the registrant’s independent accountants to provide (i) audit and permissible audit-related, tax and other services to the registrant (collectively “Fund Services”); (ii) non-audit services to the registrant’s investment adviser (not including any sub-adviser whose role is primarily portfolio management and is subcontracted with or overseen by another investment adviser) and Adviser Affiliates, if the engagement relates directly to the operations or financial reporting of a Fund (collectively “Fund-related Adviser Services”); and (iii) certain other audit and non-audit services to the registrant’s investment adviser (not including any sub-adviser whose role is primarily portfolio management and is subcontracted with or overseen by another investment adviser) and Adviser Affiliates. As set forth in this Fund Policy, a service will require specific pre-approval by the Audit Committee if it is to be provided by the Fund’s independent auditor; provided, however, that pre-approval of non-audit services to the Fund, the Adviser or Control Affiliates may be waived if certain de minimis requirements set forth in the SEC’s rules are met.
Under the Policy, the Audit Committee may delegate pre-approval authority to any pre-designated member or members who are Independent Trustees/Directors. The member(s) to whom such authority is delegated must report, for informational purposes only, any pre-approval decisions to the Audit Committee at its next regular meeting. The Audit Committee’s responsibilities with respect to the pre-approval of services performed by the independent accountants may not be delegated to management.
On an annual basis, at a regularly scheduled Audit Committee meeting, the Fund’s Treasurer or other Fund Officer shall submit to the Audit Committee a schedule of the types of Fund Services and Fund-related Adviser Services that are subject to specific pre-approval.
This schedule will provide a description of each type of service that is subject to specific pre-approval, along with total projected fees for each service. The pre-approval will generally cover a one-year period. The Audit Committee will review and approve the types of services and the projected fees for the next one-year period and may add to, or subtract from, the list of pre-approved services from time to time, based on subsequent determinations. This specific approval acknowledges that the Audit Committee is in agreement with the types of services that the independent accountants will be permitted to perform.
The Fund’s Treasurer or other Fund Officer shall report to the Audit Committee at each of its regular meetings regarding all Fund Services or Fund-related Adviser Services initiated since the last such report was rendered, including a general description of the services with forecasted fees for the annual period, proposed changes requiring specific pre-approval and a description of services provided by the independent auditor with actual fees during the current reporting period.
*****
(e)(2) The percentage of services described in paragraphs (b) through (d) of this Item approved pursuant to the “de minimis” exception under paragraph (c)(7)(i)(C) of Rule 2-01 of Regulation S-X during the period ended July 31, 2012 and the indicated 2011 fiscal years was zero.
(f) Not applicable.
(g) The aggregate non-audit fees billed by the registrant’s accountant for services rendered to the registrant, and rendered to the registrant’s investment adviser (not including any sub-adviser whose role is primarily portfolio management and is subcontracted with or overseen by another investment adviser), and any entity controlling, controlled by, or under common control with the adviser that provides ongoing services to the registrant for the period ended July 31, 2012 and the indicated 2011 fiscal years are approximately as follows:
2012 | | July 31,2011
(for one series) | | August 31, 2011
(for one series) | | September 30, 2011
(for one series) | | November 30, 2011
(for one series) | |
$ | 416,600 | | $ | 403,700 | | $ | 411,100 | | $ | 413,300 | | $ | 509,100 | |
| | | | | | | | | | | | | | |
(h) The registrant’s Audit Committee of the Board of Directors has considered whether the provision of non-audit services that were rendered to the registrant’s adviser (not including any sub-adviser whose role is primarily portfolio management and is subcontracted with or overseen by another investment adviser), and any entity controlling, controlled by, or under common control with the investment adviser that provides ongoing services to the registrant that were not pre-approved pursuant to paragraph (c)(7)(ii) of Rule 2-01 of Regulation S-X, is compatible with maintaining the principal accountant’s independence.
Item 5. Audit Committee of Listed Registrants.
Not applicable.
Item 6. Investments
(a) The registrant’s “Schedule I — Investments in securities of unaffiliated issuers” (as set forth in 17 CFR 210.12-12) is included in Item 1 of this Form N-CSR.
(b) Not applicable.
Item 7. Disclosure of Proxy Voting Policies and Procedures for Closed-End Management Investment Companies.
Not applicable.
Item 8. Portfolio Managers of Closed-End Management Investment Companies.
Not applicable.
Item 9. Purchases of Equity Securities by Closed-End Management Investment Company and Affiliated Purchasers.
Not applicable.
Item 10. Submission of Matters to a Vote of Security Holders.
There were no material changes to the procedures by which shareholders may recommend nominees to the registrant’s board of directors.
Item 11. Controls and Procedures.
(a) The registrant’s principal executive officer and principal financial officers, based on their evaluation of the registrant’s disclosure controls and procedures as of a date within 90 days of the filing of this report, have concluded that such controls and procedures are adequately designed to ensure that material information required to be disclosed by the registrant in Form N-CSR is accumulated and communicated to the registrant’s management, including the principal executive officer and principal financial officer, or persons performing similar functions, as appropriate to allow timely decisions regarding required disclosure.
(b) There was no change in the registrant’s internal control over financial reporting that occurred during the registrant’s second fiscal quarter of the period covered by this report that has materially affected, or is reasonably likely to materially affect, the registrant’s internal control over financial reporting.
Item 12. Exhibits.
(a)(1) Code of ethics required to be disclosed under Item 2 of Form N-CSR attached hereto as Exhibit 99.CODE ETH.
(a)(2) Certifications pursuant to Rule 30a-2(a) under the Investment Company Act of 1940 (17 CFR 270.30a-2(a)) attached hereto as Exhibit 99.CERT.
(a)(3) Not applicable.
(b) Certification pursuant to Rule 30a-2(b) under the Investment Company Act of 1940 (17 CFR 270.30a-2(b)) attached hereto as Exhibit 99.906CERT.
SIGNATURES
Pursuant to the requirements of the Securities Exchange Act of 1934 and the Investment Company Act of 1940, the registrant has duly caused this report to be signed on its behalf by the undersigned, thereunto duly authorized.
(registrant) | | Columbia Funds Series Trust I | |
| | |
| | | |
By (Signature and Title) | | /s/ J. Kevin Connaughton | |
| | J. Kevin Connaughton, President and Principal Executive Officer | |
| | |
| | |
Date | | September 24, 2012 | |
| | | | | |
Pursuant to the requirements of the Securities Exchange Act of 1934 and the Investment Company Act of 1940, this report has been signed below by the following persons on behalf of the registrant and in the capacities and on the dates indicated.
By (Signature and Title) | | /s/ J. Kevin Connaughton | |
| J. Kevin Connaughton, President and Principal Executive Officer | |
| | |
| | |
Date | | September 24, 2012 | |
| | |
| | | |
By (Signature and Title) | | /s/ Michael G. Clarke | |
| Michael G. Clarke, Treasurer and Chief Financial Officer | |
| | |
| | |
Date | | September 24, 2012 | |
| | | | |