UNITED STATES
SECURITIES AND EXCHANGE COMMISSION
Washington, D.C. 20549
FORM N-CSR
CERTIFIED SHAREHOLDER REPORT OF REGISTERED
MANAGEMENT INVESTMENT COMPANIES
Investment Company Act file number | 811-04367 |
|
Columbia Funds Series Trust I |
(Exact name of registrant as specified in charter) |
|
225 Franklin Street, Boston, Massachusetts | | 02110 |
(Address of principal executive offices) | | (Zip code) |
|
Scott R. Plummer 5228 Ameriprise Financial Center Minneapolis, MN 55474 |
(Name and address of agent for service) |
|
Registrant’s telephone number, including area code: | 1-612-671-1947 | |
|
Date of fiscal year end: | May 31 | |
|
Date of reporting period: | May 31, 2012 | |
| | | | | | | | |
Form N-CSR is to be used by management investment companies to file reports with the Commission not later than 10 days after the transmission to stockholders of any report that is required to be transmitted to stockholders under Rule 30e-1 under the Investment Company Act of 1940 (17 CFR 270.30e-1). The Commission may use the information provided on Form N-CSR in its regulatory, disclosure review, inspection, and policymaking roles.
A registrant is required to disclose the information specified by Form N-CSR, and the Commission will make this information public. A registrant is not required to respond to the collection of information contained in Form N-CSR unless the Form displays a currently valid Office of Management and Budget ("OMB") control number. Please direct comments concerning the accuracy of the information collection burden estimate and any suggestions for reducing the burden to Secretary, Securities and Exchange Commission, 450 Fifth Street, NW, Washington, DC 20549-0609. The OMB has reviewed this collection of information under the clearance requirements of 44 U.S.C. § 3507.
Item 1. Reports to Stockholders.
Annual Report
May 31, 2012

Columbia Dividend Income Fund
Not FDIC insured • No bank guarantee • May lose value
Columbia Dividend Income Fund
President's Message
 Dear Shareholders,
A stock market rally that commenced in the fourth quarter of 2011 continued into 2012 in the United States and around the world, as all major market regions generated double-digit returns for the three-month period ended March 31, 2012. Volatility declined sharply as European debt fears quieted somewhat and sentiment improved. Returns in developed countries were buoyed by strong results in Germany, Belgium, Austria and the Nordic markets of Denmark, Finland, Norway and Sweden. Under the cloud of its own mounting debt problem, Spain was the only eurozone country to deliver a negative return during the three-month period. Solid economic growth and accommodative monetary policy helped boost gains in emerging markets. The rally in U.S. equities was largely driven by an expansion in "multiples" — an increase in stock prices relative to their earnings. By the end of the first quarter of 2012, stocks no longer appeared as cheap as they were late in 2011. Bonds lagged stocks during the first quarter as investors responded to signs of an improved environment with a greater appetite for risk.
Concerns around the health of the global economy were centered in news headlines focusing on Washington D.C., Europe, China and the Middle East. In the United States, economic indicators remained mixed but generally indicated support for slow, sustainable economic growth. European policymakers have made progress in containing the eurozone debt crisis, though they still have not solved the issue of long-term solvency. The European Central Bank has lowered interest rates and flooded the financial system with liquidity that may provide breathing space for a restructuring of fiscal balance sheets. These massive infusions of liquidity may whet the appetite for risk from investors around the world. However, they have delayed a true reckoning with the European financial situation, as concerns about Greece, Spain and Portugal continue to cloud the outlook. The structural challenges that persist in the developed world, and slower growth in emerging market economies, leave the global economy in a fragile state. Domestic demand, combined with slowing inflationary trends, has also helped to shore up emerging market economies. Joblessness remains relatively low and monetary conditions remain easy.
Despite the challenges and surprises of 2011, we see pockets of strength — and as a result, attractive opportunities — both here and abroad for 2012. We hope to help you capitalize on these opportunities with various articles in our 2012 Perspectives, which is available via the Market Insights tab at columbiamanagement.com. This publication showcases the strong research capabilities and experienced investment teams of Columbia Management and offers a diverse array of investment ideas based on our five key themes for 2012.
Other information and resources available at columbiamanagement.com include:
> detailed up-to-date fund performance and portfolio information
> economic analysis and market commentary
> quarterly fund commentaries
> Columbia Management Investor, our award-winning quarterly newsletter for shareholders
Thank you for your continued support of the Columbia Funds. We look forward to serving your investment needs for many years to come.
Best Regards,

J. Kevin Connaughton
President, Columbia Funds
Investors should consider the investment objectives, risks, charges and expenses of a mutual fund carefully before investing. For a free prospectus, which contains this and other important information about the funds, visit columbiamanagement.com. The prospectus should be read carefully before investing.
Columbia Funds are distributed by Columbia Management Investment Distributors, Inc., member FINRA, and managed by Columbia Management Investment Advisers, LLC.
© 2012 Columbia Management Investment Advisers, LLC. All rights reserved.
Annual Report 2012
Columbia Dividend Income Fund
Table of Contents
| Performance Overview | | | 2 | | |
|
| Manager Discussion of Fund Performance | | | 4 | | |
|
| Understanding Your Fund's Expenses | | | 6 | | |
|
| Portfolio of Investments | | | 7 | | |
|
| Statement of Assets and Liabilities | | | 16 | | |
|
| Statement of Operations | | | 18 | | |
|
| Statement of Changes in Net Assets | | | 19 | | |
|
| Financial Highlights | | | 22 | | |
|
| Notes to Financial Statements | | | 30 | | |
|
Report of Independent Registered
Public Accounting Firm | | | 38 | | |
|
| Federal Income Tax Information | | | 39 | | |
|
| Board Members and Officers | | | 40 | | |
|
| Important Information About This Report | | | 45 | | |
|
Fund Investment Manager
Columbia Management Investment
Advisers, LLC
225 Franklin Street
Boston, MA 02110
Fund Distributor
Columbia Management Investment
Distributors, Inc.
225 Franklin Street
Boston, MA 02110
Fund Transfer Agent
Columbia Management Investment
Services Corp.
P.O. Box 8081
Boston, MA 02266-8081
For more information about any of the funds, please visit columbiamanagement.com or call 800.345.6611. Customer Service Representatives are available to answer your questions Monday through Friday from 8 a.m. to 8 p.m. Eastern time.
The views expressed in this report reflect the current views of the respective parties. These views are not guarantees of future performance and involve certain risks, uncertainties and assumptions that are difficult to predict, so actual outcomes and results may differ significantly from the views expressed. These views are subject to change at any time based upon economic, market or other conditions and the respective parties disclaim any responsibility to update such views. These views may not be relied on as investment advice and, because investment decisions for a Columbia Fund are based on numerous factors, may not be relied on as an indication of trading intent on behalf of any particular Columbia Fund. References to specific securities should not be construed as a recommendation or investment advice.
Annual Report 2012
Columbia Dividend Income Fund
Performance Overview
Performance Summary
> For the eight-month period that ended May 31, 2012, Columbia Dividend Income Fund (the fund) Class A shares returned 16.26% excluding sales charge.
> The fund's benchmark, the Russell 1000 Index, returned 17.83% for the same period.
> The fund reaped more than 90% of the market gains in a strong rally. Lack of exposure to two of the benchmark's strongest performers generally accounted for its modest underperformance.
Average Annual Total Returns (%) (for period ended May 31, 2012)
| | | Inception | | 8 Months
cumulative | | 1 Year | | 5 Years | | 10 Years | |
| Class A* | | 11/25/02 | | | | | | | | | | | | | | | | | |
| Excluding sales charges | | | | | | | 16.26 | | | | 2.39 | | | | 0.61 | | | | 4.89 | | |
| Including sales charges | | | | | | | 9.59 | | | | -3.49 | | | | -0.57 | | | | 4.27 | | |
| Class B* | | 11/25/02 | | | | | | | | | | | | | | | | | |
| Excluding sales charges | | | | | | | 15.69 | | | | 1.65 | | | | -0.14 | | | | 4.12 | | |
| Including sales charges | | | | | | | 10.69 | | | | -3.35 | | | | -0.51 | | | | 4.12 | | |
| Class C* | | 11/25/02 | | | | | | | | | | | | | | | | | |
| Excluding sales charges | | | | | | | 15.71 | | | | 1.66 | | | | -0.14 | | | | 4.11 | | |
| Including sales charges | | | | | | | 14.71 | | | | 0.66 | | | | -0.14 | | | | 4.11 | | |
| Class I* | | 09/27/10 | | | 16.53 | | | | 2.77 | | | | 0.93 | | | | 5.21 | | |
| Class R* | | 03/28/08 | | | 16.03 | | | | 2.13 | | | | 0.38 | | | | 4.66 | | |
| Class T | | 03/04/98 | | | | | | | | | | | | | | | | | |
| Excluding sales charges | | | | | | | 16.14 | | | | 2.34 | | | | 0.56 | | | | 4.82 | | |
| Including sales charges | | | | | | | 9.48 | | | | -3.54 | | | | -0.62 | | | | 4.20 | | |
| Class W* | | 09/27/10 | | | 16.27 | | | | 2.40 | | | | 0.66 | | | | 4.96 | | |
| Class Z | | 03/04/98 | | | 16.39 | | | | 2.65 | | | | 0.87 | | | | 5.18 | | |
| Russell 1000 Index | | | | | | | 17.83 | | | | -1.23 | | | | -0.75 | | | | 4.52 | | |
Returns for Class A and Class T are shown with and without the maximum initial sales charge of 5.75%. Returns for Class B are shown with and without the applicable contingent deferred sales charge (CDSC) of 5.00% in the first year, declining to 1.00% in the sixth year and eliminated thereafter. Returns for Class C are shown with and without the 1.00% CDSC for the first year only. The fund's other classes are not subject to sales charges and have limited eligibility. Please see the fund's prospectuses for details. Performance for different share classes will vary based on differences in sales charges and fees associated with each class. All results shown assume reinvestment of distributions during the period. Returns do not reflect the deduction of taxes that a shareholder may pay on fund distributions or on the redemption of fund shares. Performance results reflect the effect of any fee waivers or reimbursements of fund expenses by Columbia Management Investment Advisers, LLC and/or any of its affiliates. Absent these fee waivers or expense reimbursement arrangements, performance results would have been lower.
The performance information shown represents past performance and is not a guarantee of future results. The investment return and principal value of your investment will fluctuate so that your shares, when redeemed, may be worth more or less than their original cost. Current performance may be lower or higher than the performance information shown. You may obtain performance information current to the most recent month-end by contacting your financial intermediary, visiting columbiamanagement.com or calling 800.345.6611.
*The returns shown for periods prior to the share class inception date (including returns since inception if shown, which are since fund inception) include the returns of the fund's oldest share class. Since the fund launched more than one share class at its inception, Class Z shares were used. These returns are adjusted to reflect any higher class-related operating expenses of the newer share classes, as applicable. Please visit columbiamanagement.com/mutual-funds/appended-performance for more information.
The Russell 1000 Index, an unmanaged index, measures the performance of 1,000 of the largest U.S. companies, based on market capitalization.
Indices are not available for investment, are not professionally managed and do not reflect sales charges, fees, brokerage commissions, taxes or other expenses of investing. Securities in the fund may not match those in an index.
Annual Report 2012
2
Columbia Dividend Income Fund
Performance Overview (continued)
Performance of a Hypothetical $10,000 Investment (June 1, 2002 – May 31, 2012)
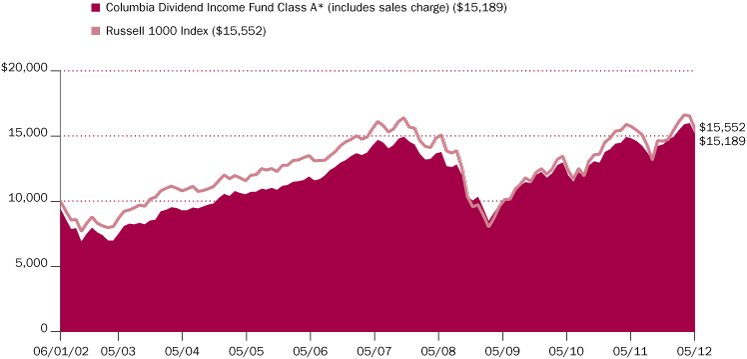
The chart above shows the change in value of a hypothetical $10,000 investment in Class A shares of Columbia Dividend Income Fund during the stated time period, and does not reflect the deduction of taxes that a shareholder may pay on fund distributions or on the redemption of fund shares.
Annual Report 2012
3
Columbia Dividend Income Fund
Manager Discussion of Fund Performance
The Board of Trustees for Columbia Dividend Income Fund has approved the change of the fund's fiscal year end from September 30 to May 31. As a result, this report covers the 8-month period since the last annual report. The next report you receive will be for the six-month period from June 1, 2012 through November 30, 2012.
For the eight-month period that ended May 31, 2012, the fund's Class A shares returned 16.26% without sales charge. The fund's benchmark, the Russell 1000 Index, returned 17.83% for the same period. The fund reaped more than 90% of the market's gains in a strong rally, despite its conservative positioning and emphasis on dividend-paying stocks. Lack of exposure to two of the benchmark's strongest performers generally accounted for the modest underperformance.
Economic Growth Loses Momentum
Although Europe's debt problems and political stalemate in Washington on the federal budget and the national debt clouded the economic outlook, U.S. economic news was generally upbeat in the first six months of the period. The combination of the announcement of Long Term Refinancing Operation and stronger job data led a robust rally in stocks in the first quarter of 2012. However, debt problems flared up again in Europe and the domestic economic news turned disappointing in April, as the pace of job growth slowed markedly. Economic growth, as measured by gross domestic product, slipped to 1.9% in the first quarter, and expectations for second quarter growth are no higher. Manufacturing activity continued to expand — the one consistent bright spot throughout this recovery. And the housing market showed a glimmer of improvement, as year-over-year sales improved, inventories tightened and prices stabilized somewhat.
Investors Favored Financially Strong Companies
The fund maintained a consistent strategic stance throughout the period, focusing on companies considered to be stable, financially healthy and able to generate substantial free cash flow and shared their wealth with investors through stock dividends. While these companies are viewed as generally conservative, the fund's investments nevertheless captured most of the gains in a strong market rally. The fund's positions in the consumer staples and materials sectors contributed most to relative performance. One consumer staples holding, Philip Morris International, the tobacco products company marketing outside the United States, was the fund's top individual contributor. Another notable performer among staples investments was Diageo, the London-based international marketer of a variety of spirits, wines and beer brands. The top-performing position in materials was paint company Sherwin-Williams. It benefited from improving trends in home repair and remodeling that helped propel another solid performer, retailer Home Depot. Other leading performers that supported the fund's relative results included AT&T, the telecommunications services provider, diversified pharmaceutical company Pfizer and retailer Wal-Mart.
Portfolio Management
Richard E. Dahlberg, CFA
Scott L. Davis
David L. King, CFA
Michael Barclay, CFA
Morningstar Style BoxTM

The Morningstar Style BoxTM is based on the fund's portfolio holdings. For equity funds, the vertical axis shows the market capitalization of the stocks owned, and the horizontal axis shows investment style (value, blend, or growth). Information shown is based on the most recent data provided by Morningstar.
© 2012 Morningstar, Inc. All rights reserved. The Morningstar information contained herein: (1) is proprietary to Morningstar and/or its content providers; (2) may not be copied or distributed; and (3) is not warranted to be accurate, complete or timely. Neither Morningstar nor its content providers are responsible for any damages or losses arising from any use of this information.
Annual Report 2012
4
Columbia Dividend Income Fund
Manager Discussion of Fund Performance (continued)
Lack of Exposure to Top Performers Hurt Relative Results
The fund did not own two of the benchmark's leading performers, which detracted from results. One was a technology company that did not, until recently, pay a dividend to shareholders. Out of benchmark positions in Transocean and Canon also hampered relative returns somewhat. Transocean, an offshore oil and gas drilling company, was sold during the period. Japanese camera company Canon was hurt when the yen appreciated against the U.S. dollar. Another disappointment was National Fuel Gas, whose operations include natural gas production and pipeline services as well as gas utilities. Its results were affected by the decline in natural gas prices.
Looking Ahead
We remain confident in our long-term strategy. We believe our emphasis on quality companies with strong balance sheets and the ability to pay generous dividends gives the fund excellent potential to perform well through full market cycles. In the near term, we think market volatility is likely to continue as long as political leaders in the United States and Europe are unable to agree on solutions to their long-term fiscal problems. We are concerned about the amount of debt owed by countries, families and some corporations, and we believe this worldwide leverage problem will contribute to a prolonged period of slow growth in the global economy. Given this view, we think it makes even more sense to focus on the stocks of individual companies that have limited debt burdens. We intend to continue to emphasize those corporations that we believe are able to self-finance their operations and that can generate strong and sustainable free cash flow to pay healthy and increasing dividends to shareholders.
Top Ten Holdings (%)
(at May 31, 2012) | |
| Philip Morris International, Inc. | | | 3.5 | | |
| Verizon Communications, Inc. | | | 3.4 | | |
International Business
Machines Corp. | | | 3.1 | | |
| Microsoft Corp. | | | 3.0 | | |
| Intel Corp. | | | 2.9 | | |
| AT&T, Inc. | | | 2.9 | | |
| Exxon Mobil Corp. | | | 2.8 | | |
| Pfizer, Inc. | | | 2.6 | | |
| Bristol-Myers Squibb Co. | | | 2.5 | | |
| Merck & Co., Inc. | | | 2.3 | | |
Percentages indicated are based upon total investments (excluding Investments of Cash Collateral Received for Securities on Loan and money market funds).
For further detail about these holdings, please refer to the section entitled "Portfolio of Investments."
Fund holdings are of the date given, are subject to change at any time, and are not recommendations to buy or sell any security.
Portfolio Breakdown (%)
(at May 31, 2012) | |
| Consumer Discretionary | | | 8.5 | | |
| Consumer Staples | | | 12.0 | | |
| Energy | | | 10.2 | | |
| Financials | | | 14.0 | | |
| Health Care | | | 13.7 | | |
| Industrials | | | 7.9 | | |
| Information Technology | | | 12.1 | | |
| Materials | | | 5.2 | | |
| Telecommunication Services | | | 6.3 | | |
| Utilities | | | 5.0 | | |
| Exchange-Traded Funds | | | 1.6 | | |
| Other(a) | | | 3.5 | | |
Sectors can be comprised of several industries. Please refer to the section entitled "Portfolio of Investments" for a complete listing.
Percentages indicated are based upon total investments (excluding Investments of Cash Collateral Received for Securities on Loan). The Fund's composition is subject to change.
(a) Includes investments in money market funds.
Annual Report 2012
5
Columbia Dividend Income Fund
Understanding Your Fund's Expenses
(Unaudited)
As an investor, you incur two types of costs. There are transaction costs, which generally include sales charges on purchases and may include redemption fees. There are also ongoing costs, which generally include management fees, distribution and service (Rule 12b-1) fees, and other fund expenses. The following information is intended to help you understand your ongoing costs (in dollars) of investing in the Fund and to help you compare these costs with the ongoing costs of investing in other mutual funds.
Analyzing Your Fund's Expenses
To illustrate these ongoing costs, we have provided examples and calculated the expenses paid by investors in each share class of the Fund during the period. The actual and hypothetical information in the table is based on an initial investment of $1,000 at the beginning of the period indicated and held for the entire period. Expense information is calculated two ways and each method provides you with different information. The amount listed in the "Actual" column is calculated using the Fund's actual operating expenses and total return for the period. You may use the Actual information, together with the amount invested, to estimate the expenses that you paid over the period. Simply divide your account value by $1,000 (for example, an $8,600 account value divided by $1,000 = 8.6), then multiply the results by the expenses paid during the period under the Actual column. The amount listed in the "Hypothetical" column assumes a 5% annual rate of return before expenses (which is not the Fund's actual return) and then applies the Fund's actual expense ratio for the period to the hypothetical return. You should not use the hypothetical account values and expenses to estimate either your actual account balance at the end of the period or the expenses you paid during the period. See "Compare With Other Funds" below for details on how to use the hypothetical data.
Compare With Other Funds
Since all mutual funds are required to include the same hypothetical calculations about expenses in shareholder reports, you can use this information to compare the ongoing cost of investing in the Fund with other funds. To do so, compare the hypothetical example with the 5% hypothetical examples that appear in the shareholder reports of other funds. As you compare hypothetical examples of other funds, it is important to note that hypothetical examples are meant to highlight the ongoing costs of investing in a fund only and do not reflect any transaction costs, such as sales charges, or redemption or exchange fees. Therefore, the hypothetical calculations are useful in comparing ongoing costs only, and will not help you determine the relative total costs of owning different funds. If transaction costs were included in these calculations, your costs would be higher.
December 1, 2011 – May 31, 2012
| | | Account Value at the Beginning
of the Period ($) | | Account Value at the End of the
Period ($) | | Expenses Paid During the
Period ($) | | Fund's Annualized
Expense Ratio (%) | |
| | | Actual | | Hypothetical | | Actual | | Hypothetical | | Actual | | Hypothetical | | Actual | |
| Class A | | | 1,000.00 | | | | 1,000.00 | | | | 1,057.40 | | | | 1,020.00 | | | | 5.14 | | | | 5.05 | | | | 1.00 | | |
| Class B | | | 1,000.00 | | | | 1,000.00 | | | | 1,053.30 | | | | 1,016.25 | | | | 8.98 | | | | 8.82 | | | | 1.75 | | |
| Class C | | | 1,000.00 | | | | 1,000.00 | | | | 1,053.30 | | | | 1,016.25 | | | | 8.98 | | | | 8.82 | | | | 1.75 | | |
| Class I | | | 1,000.00 | | | | 1,000.00 | | | | 1,060.00 | | | | 1,021.85 | | | | 3.24 | | | | 3.18 | | | | 0.63 | | |
| Class R | | | 1,000.00 | | | | 1,000.00 | | | | 1,056.10 | | | | 1,018.75 | | | | 6.43 | | | | 6.31 | | | | 1.25 | | |
| Class T | | | 1,000.00 | | | | 1,000.00 | | | | 1,057.10 | | | | 1,019.75 | | | | 5.40 | | | | 5.30 | | | | 1.05 | | |
| Class W | | | 1,000.00 | | | | 1,000.00 | | | | 1,057.50 | | | | 1,020.00 | | | | 5.14 | | | | 5.05 | | | | 1.00 | | |
| Class Z | | | 1,000.00 | | | | 1,000.00 | | | | 1,058.70 | | | | 1,021.25 | | | | 3.86 | | | | 3.79 | | | | 0.75 | | |
Expenses paid during the period are equal to the annualized expense ratio for each class as indicated above, multiplied by the average account value over the period and then multiplied by the number of days in the Fund's most recent fiscal half year and divided by 366.
Expenses do not include fees and expenses incurred indirectly by the Fund from the underlying funds in which the Fund may invest (also referred to as "acquired funds"), including affiliated and non-affiliated pooled investment vehicles (including mutual funds and exchange traded funds).
Had Columbia Management Investment Advisers, LLC and/or certain of its affiliates not waived/reimbursed certain fees and expenses, account value at the end of the period would have been reduced.
Annual Report 2012
6
Columbia Dividend Income Fund
Portfolio of Investments
May 31, 2012
(Percentages represent value of investments compared to net assets)
Common Stocks 94.1%
| Issuer | | Shares | | Value ($) | |
| Consumer Discretionary 8.5% | |
| Hotels, Restaurants & Leisure 1.7% | |
| McDonald's Corp. | | | 1,100,000 | | | | 98,274,000 | | |
| Leisure Equipment & Products 0.6% | |
| Mattel, Inc.(a) | | | 1,154,400 | | | | 35,936,472 | | |
| Media 2.1% | |
| McGraw-Hill Companies, Inc. (The) | | | 760,150 | | | | 32,975,307 | | |
| Meredith Corp.(a) | | | 971,575 | | | | 28,748,904 | | |
| Regal Entertainment Group, Class A | | | 70,000 | | | | 962,500 | | |
| Time Warner, Inc.(a) | | | 1,714,550 | | | | 59,100,539 | | |
| Total | | | | | 121,787,250 | | |
| Multiline Retail 1.0% | |
| Macy's, Inc. | | | 752,550 | | | | 28,634,528 | | |
| Nordstrom, Inc. | | | 689,350 | | | | 32,654,509 | | |
| Total | | | | | 61,289,037 | | |
| Specialty Retail 3.1% | |
| Home Depot, Inc. (The)(a) | | | 2,076,950 | | | | 102,476,713 | | |
| Limited Brands, Inc.(a) | | | 789,825 | | | | 35,036,637 | | |
| TJX Companies, Inc. | | | 965,700 | | | | 41,003,622 | | |
| Total | | | | | 178,516,972 | | |
| Total Consumer Discretionary | | | | | 495,803,731 | | |
| Consumer Staples 12.0% | |
| Beverages 2.1% | |
| Coca-Cola Co. (The)(a) | | | 760,150 | | | | 56,806,010 | | |
| Diageo PLC, ADR | | | 695,383 | | | | 66,297,815 | | |
| Total | | | | | 123,103,825 | | |
| Food & Staples Retailing 1.0% | |
| Wal-Mart Stores, Inc.(a) | | | 855,025 | | | | 56,277,746 | | |
| Food Products 1.9% | |
| General Mills, Inc. | | | 965,900 | | | | 36,974,652 | | |
| HJ Heinz Co.(a) | | | 1,423,100 | | | | 75,538,148 | | |
| Total | | | | | 112,512,800 | | |
| Household Products 2.3% | |
| Kimberly-Clark Corp. | | | 752,500 | | | | 59,710,875 | | |
| Procter & Gamble Co. (The) | | | 1,245,900 | | | | 77,607,111 | | |
| Total | | | | | 137,317,986 | | |
Common Stocks (continued)
| Issuer | | Shares | | Value ($) | |
| Tobacco 4.7% | |
| Altria Group, Inc. | | | 2,342,300 | | | | 75,398,637 | | |
| Philip Morris International, Inc. | | | 2,331,750 | | | | 197,056,192 | | |
| Total | | | | | 272,454,829 | | |
| Total Consumer Staples | | | | | 701,667,186 | | |
| Energy 10.1% | |
| Energy Equipment & Services 0.5% | |
| Schlumberger Ltd. | | | 512,050 | | | | 32,387,162 | | |
| Oil, Gas & Consumable Fuels 9.6% | |
| Chevron Corp. | | | 1,174,750 | | | | 115,489,673 | | |
| ConocoPhillips | | | 765,825 | | | | 39,945,432 | | |
| Exxon Mobil Corp. | | | 1,999,400 | | | | 157,212,822 | | |
| Kinder Morgan, Inc. | | | 1,840,175 | | | | 62,915,583 | | |
| Occidental Petroleum Corp. | | | 787,775 | | | | 62,446,924 | | |
| Penn West Petroleum Ltd. | | | 1,005,825 | | | | 13,377,473 | | |
| Phillips 66(b) | | | 382,887 | | | | 11,498,097 | | |
| Royal Dutch Shell PLC, ADR(a) | | | 1,549,130 | | | | 96,324,903 | | |
| Total | | | | | 559,210,907 | | |
| Total Energy | | | | | 591,598,069 | | |
| Financials 13.5% | |
| Capital Markets 2.1% | |
| BlackRock, Inc. | | | 345,450 | | | | 59,002,860 | | |
| Northern Trust Corp. | | | 859,600 | | | | 37,117,528 | | |
| T Rowe Price Group, Inc.(a) | | | 492,150 | | | | 28,342,918 | | |
| Total | | | | | 124,463,306 | | |
| Commercial Banks 3.4% | |
| PNC Financial Services Group, Inc. | | | 851,575 | | | | 52,303,736 | | |
| U.S. Bancorp(a) | | | 1,977,025 | | | | 61,505,248 | | |
| Wells Fargo & Co. | | | 2,613,075 | | | | 83,749,054 | | |
| Total | | | | | 197,558,038 | | |
| Consumer Finance 1.1% | |
| American Express Co. | | | 1,152,125 | | | | 64,323,139 | | |
| Diversified Financial Services 2.3% | |
| CME Group, Inc.(a) | | | 151,575 | | | | 39,041,173 | | |
| JPMorgan Chase & Co. | | | 2,832,900 | | | | 93,910,635 | | |
| Total | | | | | 132,951,808 | | |
The accompanying Notes to Financial Statements are an integral part of this statement.
Annual Report 2012
7
Columbia Dividend Income Fund
Portfolio of Investments (continued)
May 31, 2012
Common Stocks (continued)
| Issuer | | Shares | | Value ($) | |
| Insurance 2.9% | |
| Arthur J Gallagher & Co.(a) | | | 1,294,375 | | | | 44,966,587 | | |
| Chubb Corp. (The) | | | 569,825 | | | | 41,067,288 | | |
| MetLife, Inc. | | | 771,225 | | | | 22,527,482 | | |
| Old Republic International Corp. | | | 55,000 | | | | 542,850 | | |
| Progressive Corp. (The)(a) | | | 974,950 | | | | 21,185,664 | | |
| RenaissanceRe Holdings Ltd.(a) | | | 192,900 | | | | 14,866,803 | | |
| Unum Group | | | 1,274,450 | | | | 25,425,277 | | |
| Total | | | | | 170,581,951 | | |
| Real Estate Investment Trusts (REITs) 1.3% | |
| Digital Realty Trust, Inc.(a) | | | 540,425 | | | | 38,245,877 | | |
| Public Storage | | | 273,000 | | | | 36,437,310 | | |
| Total | | | | | 74,683,187 | | |
| Thrifts & Mortgage Finance 0.4% | |
| People's United Financial, Inc.(a) | | | 2,240,925 | | | | 26,061,958 | | |
| Total Financials | | | | | 790,623,387 | | |
| Health Care 13.6% | |
| Biotechnology 1.0% | |
| Amgen, Inc.(a) | | | 856,975 | | | | 59,576,902 | | |
| Pharmaceuticals 12.6% | |
| Abbott Laboratories(a) | | | 1,771,675 | | | | 109,471,798 | | |
| Bristol-Myers Squibb Co. | | | 4,304,950 | | | | 143,527,033 | | |
| GlaxoSmithKline PLC, ADR(a) | | | 2,630,100 | | | | 116,013,711 | | |
| Johnson & Johnson(a) | | | 1,520,175 | | | | 94,904,525 | | |
| Merck & Co., Inc. | | | 3,428,975 | | | | 128,860,881 | | |
| Pfizer, Inc. | | | 6,658,025 | | | | 145,611,007 | | |
| Total | | | | | 738,388,955 | | |
| Total Health Care | | | | | 797,965,857 | | |
| Industrials 7.9% | |
| Aerospace & Defense 3.9% | |
| Boeing Co. (The) | | | 384,100 | | | | 26,737,201 | | |
| Honeywell International, Inc. | | | 1,328,275 | | | | 73,931,786 | | |
| Raytheon Co.(a) | | | 954,425 | | | | 48,026,666 | | |
| United Technologies Corp. | | | 1,110,375 | | | | 82,289,891 | | |
| Total | | | | | 230,985,544 | | |
| Commercial Services & Supplies 0.6% | |
| Waste Management, Inc.(a) | | | 1,088,700 | | | | 35,317,428 | | |
Common Stocks (continued)
| Issuer | | Shares | | Value ($) | |
| Electrical Equipment 0.5% | |
| Emerson Electric Co. | | | 627,275 | | | | 29,337,652 | | |
| Machinery 2.3% | |
| Deere & Co.(a) | | | 374,600 | | | | 27,671,702 | | |
| Dover Corp. | | | 714,200 | | | | 40,395,152 | | |
| Illinois Tool Works, Inc. | | | 467,525 | | | | 26,251,529 | | |
| Parker Hannifin Corp.(a) | | | 493,900 | | | | 40,371,386 | | |
| Total | | | | | 134,689,769 | | |
| Road & Rail 0.6% | |
| Norfolk Southern Corp. | | | 495,425 | | | | 32,460,246 | | |
| Total Industrials | | | | | 462,790,639 | | |
| Information Technology 12.0% | |
| IT Services 5.3% | |
| Accenture PLC, Class A | | | 1,452,800 | | | | 82,954,880 | | |
| Automatic Data Processing, Inc. | | | 989,100 | | | | 51,581,565 | | |
International Business
Machines Corp.(a) | | | 899,925 | | | | 173,595,533 | | |
| Total | | | | | 308,131,978 | | |
| Office Electronics 0.4% | |
| Canon, Inc., ADR | | | 640,100 | | | | 25,559,193 | | |
| Semiconductors & Semiconductor Equipment 3.4% | |
| Intel Corp. | | | 6,290,950 | | | | 162,558,148 | | |
| Texas Instruments, Inc.(a) | | | 1,338,950 | | | | 38,133,296 | | |
| Total | | | | | 200,691,444 | | |
| Software 2.9% | |
| Microsoft Corp. | | | 5,779,775 | | | | 168,711,632 | | |
| Total Information Technology | | | | | 703,094,247 | | |
| Materials 5.2% | |
| Chemicals 3.8% | |
| EI du Pont de Nemours & Co.(a) | | | 1,352,800 | | | | 65,286,128 | | |
| RPM International, Inc.(a) | | | 1,141,065 | | | | 30,078,474 | | |
| Sherwin-Williams Co. (The) | | | 959,600 | | | | 124,402,544 | | |
| Total | | | | | 219,767,146 | | |
| Containers & Packaging 0.5% | |
| Sonoco Products Co.(a) | | | 943,425 | | | | 29,029,187 | | |
The accompanying Notes to Financial Statements are an integral part of this statement.
Annual Report 2012
8
Columbia Dividend Income Fund
Portfolio of Investments (continued)
May 31, 2012
Common Stocks (continued)
| Issuer | | Shares | | Value ($) | |
| Metals & Mining 0.9% | |
| BHP Billiton Ltd., ADR | | | 346,275 | | | | 21,306,301 | | |
| Nucor Corp.(a) | | | 913,340 | | | | 32,661,038 | | |
| Total | | | | | 53,967,339 | | |
| Total Materials | | | | | 302,763,672 | | |
| Telecommunication Services 6.3% | |
| Diversified Telecommunication Services 6.3% | |
| AT&T, Inc.(a) | | | 4,750,850 | | | | 162,336,544 | | |
| CenturyLink, Inc. | | | 100,000 | | | | 3,922,000 | | |
| Verizon Communications, Inc.(a) | | | 4,581,150 | | | | 190,759,086 | | |
| Windstream Corp.(a) | | | 960,100 | | | | 8,986,536 | | |
| Total | | | | | 366,004,166 | | |
| Total Telecommunication Services | | | | | 366,004,166 | | |
| Utilities 5.0% | |
| Electric Utilities 2.1% | |
| American Electric Power Co., Inc. | | | 1,015,150 | | | | 39,093,426 | | |
| NextEra Energy, Inc. | | | 430,000 | | | | 28,096,200 | | |
| Northeast Utilities | | | 860,000 | | | | 30,968,600 | | |
| NV Energy, Inc. | | | 75,000 | | | | 1,297,500 | | |
| Westar Energy, Inc. | | | 868,498 | | | | 24,856,413 | | |
| Total | | | | | 124,312,139 | | |
| Gas Utilities 0.4% | |
| National Fuel Gas Co.(a) | | | 570,325 | | | | 24,655,150 | | |
| Multi-Utilities 2.5% | |
| CMS Energy Corp.(a) | | | 1,316,950 | | | | 30,684,935 | | |
| Dominion Resources, Inc.(a) | | | 580,000 | | | | 30,194,800 | | |
| Public Service Enterprise Group, Inc.(a) | | | 197,327 | | | | 6,154,629 | | |
| Sempra Energy | | | 691,500 | | | | 44,954,415 | | |
| Wisconsin Energy Corp.(a) | | | 828,075 | | | | 31,334,358 | | |
| Total | | | | | 143,323,137 | | |
| Total Utilities | | | | | 292,290,426 | | |
Total Common Stocks
(Cost: $4,837,646,906) | | | | | 5,504,601,380 | | |
Convertible Preferred Stocks 0.6%
| Issuer | | Shares | | Value ($) | |
| Energy 0.1% | |
| Oil, Gas & Consumable Fuels 0.1% | |
| Apache Corp., 6.000%(a) | | | 109,725 | | | | 5,259,942 | | |
| Total Energy | | | | | 5,259,942 | | |
| Financials 0.5% | |
| Commercial Banks 0.5% | |
| Fifth Third Bancorp, 8.500%(a) | | | 200,000 | | | | 27,225,000 | | |
| Total Financials | | | | | 27,225,000 | | |
Total Convertible Preferred Stocks
(Cost: $36,022,370) | | | | | 32,484,942 | | |
| Exchange-Traded Funds 1.6% | |
| SPDR S&P 500 ETF Trust(a) | | | 725,000 | | | | 95,330,250 | | |
Total Exchange-Traded Funds
(Cost: $99,837,441) | | | | | 95,330,250 | | |
| Money Market Funds 3.4% | |
| | Shares | | Value ($) | |
Columbia Short-Term Cash
Fund, 0.161%(c)(d) | | | 201,123,460 | | | | 201,123,460 | | |
Total Money Market Funds
(Cost: $201,123,460) | | | | | 201,123,460 | | |
The accompanying Notes to Financial Statements are an integral part of this statement.
Annual Report 2012
9
Columbia Dividend Income Fund
Portfolio of Investments (continued)
May 31, 2012
Investments of Cash Collateral Received for Securities on Loan 14.9%
| Issuer | | Effective
Yield | | Par ($)/
Principal ($)/
Shares | | Value ($) | |
| Asset-Backed Commercial Paper 1.1% | |
Atlantis One
08/01/12 | | | 0.662 | % | | | 11,959,960 | | | | 11,959,960 | | |
| 09/10/12 | | | 0.592 | % | | | 5,982,300 | | | | 5,982,300 | | |
| 10/11/12 | | | 0.541 | % | | | 4,986,275 | | | | 4,986,275 | | |
Gemini Securitization Corporation (FKA Twin Towers)
08/31/12 | | | 0.501 | % | | | 4,992,014 | | | | 4,992,014 | | |
Kells Funding LLC
06/04/12 | | | 0.501 | % | | | 1,997,361 | | | | 1,997,361 | | |
| 07/02/12 | | | 0.601 | % | | | 4,989,250 | | | | 4,989,250 | | |
| 10/12/12 | | | 0.612 | % | | | 9,969,161 | | | | 9,969,161 | | |
Rheingold Securitization
06/25/12 | | | 0.550 | % | | | 7,996,700 | | | | 7,996,700 | | |
Royal Park Investments
Funding Corp.
06/21/12 | | | 0.720 | % | | | 9,994,000 | | | | 9,994,000 | | |
| Total | | | | | | | 62,867,021 | | |
| Certificates of Deposit 6.5% | |
ABM AMRO Bank N.V.
06/21/12 | | | 0.400 | % | | | 9,989,788 | | | | 9,989,788 | | |
| 08/07/12 | | | 0.450 | % | | | 6,992,134 | | | | 6,992,134 | | |
| 08/08/12 | | | 0.460 | % | | | 11,985,910 | | | | 11,985,910 | | |
Barclays Bank PLC
07/18/12 | | | 0.280 | % | | | 10,000,000 | | | | 10,000,000 | | |
Credit Suisse
08/30/12 | | | 0.300 | % | | | 10,000,000 | | | | 10,000,000 | | |
| 11/08/12 | | | 0.399 | % | | | 15,000,000 | | | | 15,000,000 | | |
DZ Bank AG
07/27/12 | | | 0.320 | % | | | 10,000,000 | | | | 10,000,000 | | |
Deutsche Bank AG
07/27/12 | | | 0.340 | % | | | 10,000,000 | | | | 10,000,000 | | |
| 10/09/12 | | | 0.750 | % | | | 10,000,000 | | | | 10,000,000 | | |
| 11/02/12 | | | 0.729 | % | | | 10,000,000 | | | | 10,000,000 | | |
DnB NOR ASA
09/14/12 | | | 0.530 | % | | | 5,000,000 | | | | 5,000,000 | | |
FMS Wertmanagement Anstalt Des Oeffentlichen Rechts
06/29/12 | | | 0.240 | % | | | 15,000,000 | | | | 15,000,000 | | |
Hong Kong Shanghai Bank Corp., Ltd.
06/25/12 | | | 0.240 | % | | | 15,000,000 | | | | 15,000,000 | | |
Mitsubishi UFJ Trust and Banking Corp.
10/12/12 | | | 0.530 | % | | | 5,000,000 | | | | 5,000,000 | | |
Mizuho Corporate Bank Ltd.
06/01/12 | | | 0.370 | % | | | 20,000,000 | | | | 20,000,000 | | |
| 08/14/12 | | | 0.400 | % | | | 10,000,000 | | | | 10,000,000 | | |
N.V. Bank Nederlandse
Gemeenten
06/29/12 | | | 0.260 | % | | | 10,000,000 | | | | 10,000,000 | | |
Investments of Cash Collateral Received for Securities on Loan (continued)
| Issuer | | Effective
Yield | | Par ($)/
Principal ($)/
Shares | | Value ($) | |
National Australia Bank
08/16/12 | | | 0.339 | % | | | 10,000,000 | | | | 10,000,000 | | |
| 10/29/12 | | | 0.298 | % | | | 9,999,600 | | | | 9,999,600 | | |
National Bank of Canada
11/09/12 | | | 0.299 | % | | | 10,000,000 | | | | 10,000,000 | | |
Nordea Bank AB
08/23/12 | | | 0.290 | % | | | 20,000,000 | | | | 20,000,000 | | |
Norinchukin Bank
08/21/12 | | | 0.390 | % | | | 10,000,000 | | | | 10,000,000 | | |
| 08/22/12 | | | 0.390 | % | | | 10,000,000 | | | | 10,000,000 | | |
| 10/31/12 | | | 0.560 | % | | | 10,000,000 | | | | 10,000,000 | | |
| 11/09/12 | | | 0.519 | % | | | 10,000,000 | | | | 10,000,000 | | |
Rabobank
10/26/12 | | | 0.515 | % | | | 10,000,000 | | | | 10,000,000 | | |
Standard Chartered Bank PLC
10/05/12 | | | 0.630 | % | | | 13,955,308 | | | | 13,955,308 | | |
Sumitomo Mitsui Banking Corp.
06/04/12 | | | 0.375 | % | | | 10,000,000 | | | | 10,000,000 | | |
| 10/11/12 | | | 0.500 | % | | | 10,000,000 | | | | 10,000,000 | | |
| 11/02/12 | | | 0.479 | % | | | 5,000,000 | | | | 5,000,000 | | |
Sumitomo Trust & Banking Co., Ltd.
08/29/12 | | | 0.350 | % | | | 20,000,000 | | | | 20,000,000 | | |
| 11/01/12 | | | 0.479 | % | | | 12,000,000 | | | | 12,000,000 | | |
Svenska Handelsbanken
08/27/12 | | | 0.270 | % | | | 10,000,130 | | | | 10,000,130 | | |
| 08/30/12 | | | 0.580 | % | | | 10,000,000 | | | | 10,000,000 | | |
| 09/13/12 | | | 0.490 | % | | | 5,000,000 | | | | 5,000,000 | | |
| Total | | | | | | | 379,922,870 | | |
| Commercial Paper 3.2% | |
BTM Capital
06/08/12 | | | 0.340 | % | | | 9,997,733 | | | | 9,997,733 | | |
Caisse d'Amortissement de la Dette Sociale
07/19/12 | | | 0.471 | % | | | 4,992,167 | | | | 4,992,167 | | |
Caisse des Depots
08/31/12 | | | 0.360 | % | | | 9,990,800 | | | | 9,990,800 | | |
| 10/05/12 | | | 0.562 | % | | | 2,991,460 | | | | 2,991,460 | | |
Development Bank of Singapore Ltd.
08/02/12 | | | 0.551 | % | | | 9,973,417 | | | | 9,973,417 | | |
DnB NOR
08/30/12 | | | 0.489 | % | | | 3,000,000 | | | | 3,000,000 | | |
| 10/10/12 | | | 0.511 | % | | | 9,974,075 | | | | 9,974,075 | | |
Erste Abwicklungsanstalt
08/22/12 | | | 0.390 | % | | | 19,980,067 | | | | 19,980,067 | | |
| 08/27/12 | | | 0.380 | % | | | 9,989,972 | | | | 9,989,972 | | |
Mitsubishi UFJ Trust and Banking Corp.
09/04/12 | | | 0.441 | % | | | 9,984,967 | | | | 9,984,967 | | |
The accompanying Notes to Financial Statements are an integral part of this statement.
Annual Report 2012
10
Columbia Dividend Income Fund
Portfolio of Investments (continued)
May 31, 2012
Investments of Cash Collateral Received for Securities on Loan (continued)
| Issuer | | Effective
Yield | | Par ($)/
Principal ($)/
Shares | | Value ($) | |
Nordea Bank AB
07/24/12 | | | 0.627 | % | | | 6,977,882 | | | | 6,977,882 | | |
| 08/14/12 | | | 0.592 | % | | | 4,985,168 | | | | 4,985,168 | | |
Skandinaviska Enskilda Banken AB
06/15/12 | | | 0.330 | % | | | 9,994,500 | | | | 9,994,500 | | |
| 07/03/12 | | | 0.315 | % | | | 9,994,662 | | | | 9,994,662 | | |
| 07/17/12 | | | 0.300 | % | | | 9,994,667 | | | | 9,994,667 | | |
Suncorp Metway Ltd.
06/04/12 | | | 0.450 | % | | | 4,996,062 | | | | 4,996,062 | | |
| 06/05/12 | | | 0.460 | % | | | 3,996,882 | | | | 3,996,882 | | |
| 06/12/12 | | | 0.460 | % | | | 9,991,950 | | | | 9,991,950 | | |
| 06/13/12 | | | 0.450 | % | | | 4,996,063 | | | | 4,996,063 | | |
| 07/23/12 | | | 0.460 | % | | | 14,987,925 | | | | 14,987,925 | | |
The Commonwealth Bank of Australia
08/16/12 | | | 0.299 | % | | | 10,000,000 | | | | 10,000,000 | | |
Westpac Securities NZ Ltd.
08/27/12 | | | 0.491 | % | | | 6,984,279 | | | | 6,984,279 | | |
| Total | | | | | | | 188,774,698 | | |
| Repurchase Agreements 4.1% | |
Citigroup Global Markets, Inc.
dated 05/31/12,
matures 06/01/12,
repurchase price
$5,000,031(e) | | | 0.220 | % | | | 5,000,000 | | | | 5,000,000 | | |
Deutsche Bank AG
dated 05/29/12,
matures 06/05/12,
repurchase price
$25,000,875(e) | | | 0.180 | % | | | 25,000,000 | | | | 25,000,000 | | |
Goldman Sachs & Co.
dated 05/31/12,
matures 06/01/12,
repurchase price
$10,000,058(e) | | | 0.210 | % | | | 10,000,000 | | | | 10,000,000 | | |
Mizuho Securities USA, Inc.
dated 05/31/12,
matures 06/01/12,
repurchase price
$23,400,163(e) | | | 0.250 | % | | | 23,400,000 | | | | 23,400,000 | | |
Natixis Financial
Products, Inc.
dated 05/31/12,
matures 06/01/12,
repurchase price
$86,000,573(e) | | | 0.240 | % | | | 86,000,000 | | | | 86,000,000 | | |
Nomura Securities
dated 05/31/12,
matures 06/01/12,
repurchase price
$63,000,140(e) | | | 0.230 | % | | | 62,999,738 | | | | 62,999,738 | | |
Investments of Cash Collateral Received for Securities on Loan (continued)
| Issuer | | Effective
Yield | | Par ($)/
Principal ($)/
Shares | | Value ($) | |
Societe Generale
dated 05/31/12,
matures 06/01/12,
repurchase price
$25,000,146(e) | | | 0.210 | % | | | 25,000,000 | | | | 25,000,000 | | |
UBS Securities LLC
dated 05/31/12,
matures 06/01/12,
repurchase price
$2,675,335(e) | | | 0.210 | % | | | 2,675,319 | | | | 2,675,319 | | |
| Total | | | | | | | 240,075,057 | | |
Total Investments of Cash Collateral Received for Securities on Loan
(Cost: $871,639,646) | | | | | | | 871,639,646 | | |
Total Investments
(Cost: $6,046,269,823) | | | | | | | 6,705,179,678 | | |
| Other Assets & Liabilities, Net | | | | | | | (856,338,388 | ) | |
| Net Assets | | | | | | | 5,848,841,290 | | |
The accompanying Notes to Financial Statements are an integral part of this statement.
Annual Report 2012
11
Columbia Dividend Income Fund
Portfolio of Investments (continued)
May 31, 2012
Notes to Portfolio of Investments
(a) At May 31, 2012, security was partially or fully on loan.
(b) Non-income producing.
(c) The rate shown is the seven-day current annualized yield at May 31, 2012.
(d) Investments in affiliates during the period ended May 31, 2012:
| Issuer | | Beginning
Cost ($) | | Purchase
Cost ($) | | Sales Cost/
Proceeds
From Sales ($) | | Realized
Gain/Loss ($) | | Ending
Cost ($) | | Dividends
or Interest
Income ($) | | Value ($) | |
Columbia Short-Term
Cash Fund | | | 123,514,676 | | | | 1,193,764,310 | | �� | | (1,116,155,526 | ) | | | — | | | | 201,123,460 | | | | 170,160 | | | | 201,123,460 | | |
(e) The table below represents securities received as collateral for repurchase agreements. This collateral is deposited with the Fund's custodian and, pursuant to the terms of the repurchase agreement, must have an aggregate market value greater than or equal to the repurchase price plus accrued interest at all times. The value of securities and/or cash held as collateral for repurchase agreements is monitored on a daily basis to ensure the proper level of collateral.
| Security Description | | Value ($) | |
| Citigroup Global Markets, Inc. (0.220%) | |
| Fannie Mae Benchmark REMIC | | | 25,133 | | |
| Fannie Mae REMICS | | | 1,979,305 | | |
| Fannie Mae-Aces | | | 41,059 | | |
| Freddie Mac Reference REMIC | | | 11,036 | | |
| Freddie Mac REMICS | | | 2,518,595 | | |
| Government National Mortgage Association | | | 524,872 | | |
| Total Market Value of Collateral Securities | | | 5,100,000 | | |
| Security Description | | Value ($) | |
| Deutsche Bank AG (0.180%) | |
| Fannie Mae REMICS | | | 4,136,938 | | |
| Government National Mortgage Association | | | 21,372,615 | | |
| Total Market Value of Collateral Securities | | | 25,509,553 | | |
| Security Description | | Value ($) | |
| Goldman Sachs & Co. (0.210%) | |
| Ginnie Mae I Pool | | | 8,107,002 | | |
| Ginnie Mae II Pool | | | 2,092,998 | | |
| Total Market Value of Collateral Securities | | | 10,200,000 | | |
The accompanying Notes to Financial Statements are an integral part of this statement.
Annual Report 2012
12
Columbia Dividend Income Fund
Portfolio of Investments (continued)
May 31, 2012
Notes to Portfolio of Investments (continued)
| Security Description | | Value ($) | |
| Mizuho Securities USA, Inc. (0.250%) | |
| Fannie Mae Grantor Trust | | | 710,631 | | |
| Fannie Mae Pool | | | 54,909 | | |
| Fannie Mae REMICS | | | 12,028,491 | | |
| Fannie Mae Whole Loan | | | 829,593 | | |
| FHLMC Structured Pass Through Securities | | | 378,857 | | |
| Freddie Mac Non Gold Pool | | | 1,659,616 | | |
| Freddie Mac REMICS | | | 1,577,540 | | |
| Ginnie Mae II Pool | | | 6,628,363 | | |
| Total Market Value of Collateral Securities | | | 23,868,000 | | |
| Security Description | | Value ($) | |
| Natixis Financial Products, Inc. (0.240%) | |
| Fannie Mae Pool | | | 7,262,678 | | |
| Fannie Mae REMICS | | | 23,394,532 | | |
| Fannie Mae-Aces | | | 283,803 | | |
| Freddie Mac Gold Pool | | | 9,860,612 | | |
| Freddie Mac REMICS | | | 19,265,132 | | |
| Government National Mortgage Association | | | 19,195,098 | | |
| United States Treasury Note/Bond | | | 8,458,733 | | |
| Total Market Value of Collateral Securities | | | 87,720,588 | | |
| Security Description | | Value ($) | |
| Nomura Securities (0.230%) | |
| Fannie Mae Pool | | | 27,450,209 | | |
| Freddie Mac Gold Pool | | | 14,271,257 | | |
| Ginnie Mae II Pool | | | 22,538,266 | | |
| Total Market Value of Collateral Securities | | | 64,259,732 | | |
| Security Description | | Value ($) | |
| Societe Generale (0.210%) | |
| Fannie Mae Pool | | | 14,039,392 | | |
| Freddie Mac Gold Pool | | | 11,460,608 | | |
| Total Market Value of Collateral Securities | | | 25,500,000 | | |
| Security Description | | Value ($) | |
| UBS Securities LLC (0.210%) | |
| Ginnie Mae I Pool | | | 1,671,413 | | |
| Ginnie Mae II Pool | | | 1,057,413 | | |
| Total Market Value of Collateral Securities | | | 2,728,826 | | |
Abbreviation Legend
ADR American Depositary Receipt
The accompanying Notes to Financial Statements are an integral part of this statement.
Annual Report 2012
13
Columbia Dividend Income Fund
Portfolio of Investments (continued)
May 31, 2012
Fair Value Measurements
Generally accepted accounting principles (GAAP) require disclosure regarding the inputs and valuation techniques used to measure fair value and any changes in valuation inputs or techniques. In addition, investments shall be disclosed by major category.
The Fund categorizes its fair value measurements according to a three-level hierarchy that maximizes the use of observable inputs and minimizes the use of unobservable inputs by prioritizing that the most observable input be used when available. Observable inputs are those that market participants would use in pricing an investment based on market data obtained from sources independent of the reporting entity. Unobservable inputs are those that reflect the Fund's assumptions about the information market participants would use in pricing an investment. An investment's level within the fair value hierarchy is based on the lowest level of any input that is deemed significant to the asset or liability's fair value measurement. The input levels are not necessarily an indication of the risk or liquidity associated with investments at that level. For example, certain U.S. government securities are generally high quality and liquid, however, they are reflected as Level 2 because the inputs used to determine fair value may not always be quoted prices in an active market.
Fair value inputs are summarized in the three broad levels listed below:
> Level 1 — Valuations based on quoted prices for investments in active markets that the Fund has the ability to access at the measurement date (including NAV for open-end mutual funds). Valuation adjustments are not applied to Level 1 investments.
> Level 2 — Valuations based on other significant observable inputs (including quoted prices for similar securities, interest rates, prepayment speeds, credit risks, etc.).
> Level 3 — Valuations based on significant unobservable inputs (including the Fund's own assumptions and judgment in determining the fair value of investments).
Inputs that are used in determining fair value of an investment may include price information, credit data, volatility statistics, and other factors. These inputs can be either observable or unobservable. The availability of observable inputs can vary between investments, and is affected by various factors such as the type of investment, and the volume and level of activity for that investment or similar investments in the marketplace. The inputs will be considered by the Investment Manager, along with any other relevant factors in the calculation of an investment's fair value. The Fund uses prices and inputs that are current as of the measurement date, which may include periods of market dislocations. During these periods, the availability of prices and inputs may be reduced for many investments. This condition could cause an investment to be reclassified between the various levels within the hierarchy.
Investments falling into the Level 3 category are primarily supported by quoted prices from brokers and dealers participating in the market for those investments. However, these may be classified as Level 3 investments due to lack of market transparency and corroboration to support these quoted prices. Additionally, valuation models may be used as the pricing source for any remaining investments classified as Level 3. These models rely on one or more significant unobservable inputs and/or significant assumptions by the Investment Manager. Inputs used in valuations may include, but are not limited to, financial statement analysis, capital account balances, discount rates and estimated cash flows, and comparable company data.
The accompanying Notes to Financial Statements are an integral part of this statement.
Annual Report 2012
14
Columbia Dividend Income Fund
Portfolio of Investments (continued)
May 31, 2012
Fair Value Measurements (continued)
The following table is a summary of the inputs used to value the Fund's investments at May 31, 2012:
| Description | | Level 1
Quoted Prices in Active
Markets for Identical
Assets ($) | |
Level 2
Other Significant
Observable Inputs ($) | |
Level 3
Significant
Unobservable Inputs ($) | |
Total ($) | |
| Equity Securities | |
| Common Stocks | |
| Consumer Discretionary | | | 495,803,731 | | | | — | | | | — | | | | 495,803,731 | | |
| Consumer Staples | | | 701,667,186 | | | | — | | | | — | | | | 701,667,186 | | |
| Energy | | | 591,598,069 | | | | — | | | | — | | | | 591,598,069 | | |
| Financials | | | 790,623,387 | | | | — | | | | — | | | | 790,623,387 | | |
| Health Care | | | 797,965,857 | | | | — | | | | — | | | | 797,965,857 | | |
| Industrials | | | 462,790,639 | | | | — | | | | — | | | | 462,790,639 | | |
| Information Technology | | | 703,094,247 | | | | — | | | | — | | | | 703,094,247 | | |
| Materials | | | 302,763,672 | | | | — | | | | — | | | | 302,763,672 | | |
| Telecommunication Services | | | 366,004,166 | | | | — | | | | — | | | | 366,004,166 | | |
| Utilities | | | 292,290,426 | | | | — | | | | — | | | | 292,290,426 | | |
| Convertible Preferred Stocks | |
| Energy | | | 5,259,942 | | | | — | | | | — | | | | 5,259,942 | | |
| Financials | | | 27,225,000 | | | | — | | | | — | | | | 27,225,000 | | |
| Exchange-Traded Funds | | | 95,330,250 | | | | — | | | | — | | | | 95,330,250 | | |
| Total Equity Securities | | | 5,632,416,572 | | | | — | | | | — | | | | 5,632,416,572 | | |
| Other | |
| Money Market Funds | | | 201,123,460 | | | | — | | | | — | | | | 201,123,460 | | |
Investments of Cash Collateral
Received for Securities on Loan | | | — | | | | 871,639,646 | | | | — | | | | 871,639,646 | | |
| Total Other | | | 201,123,460 | | | | 871,639,646 | | | | — | | | | 1,072,763,106 | | |
| Total | | | 5,833,540,032 | | | | 871,639,646 | | | | — | | | | 6,705,179,678 | | |
See the Portfolio of Investments for all investment classifications not indicated in the table.
The Fund's assets assigned to the Level 2 input category are generally valued using the market approach, in which a security's value is determined through reference to prices and information from market transactions for similar or identical assets.
Financial assets were transferred from Level 2 to Level 1 as the market for these assets was deemed to be active during the period and fair values were consequently obtained using quoted prices for identical assets rather than being based upon other observable market inputs as of period end, May 31, 2012.
The following table shows transfers between Level 1 and Level 2 of the fair value hierarchy:
| Transfers In | | Transfers Out | |
| Level 1 | | Level 2 | | Level 1 | | Level 2 | |
| $ | 26,020,953 | | | $ | — | | | $ | — | | | $ | 26,020,953 | | |
Transfers between Level 1 and Level 2 are determined based on the fair value at the beginning of the period for security positions held throughout the period.
The accompanying Notes to Financial Statements are an integral part of this statement.
Annual Report 2012
15
Columbia Dividend Income Fund
Statement of Assets and Liabilities
May 31, 2012
| Assets | |
| Investments, at value* | |
| Unaffiliated issuers (identified cost $4,973,506,717) | | $ | 5,632,416,572 | | |
| Affiliated issuers (identified cost $201,123,460) | | | 201,123,460 | | |
| Investment of cash collateral received for securities on loan | |
| Short-term securities (identified cost $631,564,589) | | | 631,564,589 | | |
| Repurchase agreements (identified cost $240,075,057) | | | 240,075,057 | | |
| Total investments (identified cost $6,046,269,823) | | | 6,705,179,678 | | |
| Receivable for: | |
| Investments sold | | | 47,426,496 | | |
| Capital shares sold | | | 8,494,125 | | |
| Dividends | | | 20,128,790 | | |
| Interest | | | 1,571,819 | | |
| Expense reimbursement due from Investment Manager | | | 8,507 | | |
| Trustees' deferred compensation plan | | | 122,249 | | |
| Total assets | | | 6,782,931,664 | | |
| Liabilities | |
| Due upon return of securities on loan | | | 871,639,646 | | |
| Payable for: | |
| Investments purchased | | | 56,817,841 | | |
| Capital shares purchased | | | 4,408,240 | | |
| Investment management fees | | | 86,205 | | |
| Distribution and service fees | | | 21,227 | | |
| Transfer agent fees | | | 913,882 | | |
| Administration fees | | | 7,416 | | |
| Compensation of board members | | | 5,180 | | |
| Chief compliance officer expenses | | | 640 | | |
| Other expenses | | | 67,848 | | |
| Trustees' deferred compensation plan | | | 122,249 | | |
| Total liabilities | | | 934,090,374 | | |
| Net assets applicable to outstanding capital stock | | $ | 5,848,841,290 | | |
| Represented by | |
| Paid-in capital | | $ | 5,227,549,204 | | |
| Undistributed net investment income | | | 28,231,804 | | |
| Accumulated net realized loss | | | (65,849,573 | ) | |
| Unrealized appreciation (depreciation) on: | |
| Investments | | | 658,909,855 | | |
| Total — representing net assets applicable to outstanding capital stock | | $ | 5,848,841,290 | | |
| *Value of securities on loan | | $ | 850,240,144 | | |
The accompanying Notes to Financial Statements are an integral part of this statement.
Annual Report 2012
16
Columbia Dividend Income Fund
Statement of Assets and Liabilities (continued)
May 31, 2012
| Class A | |
| Net assets | | $ | 1,729,495,110 | | |
| Shares outstanding | | | 123,864,845 | | |
| Net asset value per share | | $ | 13.96 | | |
| Maximum offering price per share(a) | | $ | 14.81 | | |
| Class B | |
| Net assets | | $ | 15,095,292 | | |
| Shares outstanding | | | 1,107,598 | | |
| Net asset value per share | | $ | 13.63 | | |
| Class C | |
| Net assets | | $ | 279,092,932 | | |
| Shares outstanding | | | 20,491,359 | | |
| Net asset value per share | | $ | 13.62 | | |
| Class I | |
| Net assets | | $ | 271,693,881 | | |
| Shares outstanding | | | 19,426,368 | | |
| Net asset value per share | | $ | 13.99 | | |
| Class R | |
| Net assets | | $ | 32,182,998 | | |
| Shares outstanding | | | 2,304,697 | | |
| Net asset value per share | | $ | 13.96 | | |
| Class T | |
| Net assets | | $ | 77,344,325 | | |
| Shares outstanding | | | 5,539,104 | | |
| Net asset value per share | | $ | 13.96 | | |
| Maximum offering price per share(a) | | $ | 14.81 | | |
| Class W | |
| Net assets | | $ | 47,647,086 | | |
| Shares outstanding | | | 3,412,483 | | |
| Net asset value per share | | $ | 13.96 | | |
| Class Z | |
| Net assets | | $ | 3,396,289,666 | | |
| Shares outstanding | | | 243,045,184 | | |
| Net asset value per share | | $ | 13.97 | | |
(a) The maximum offering price per share is calculated by dividing the net asset value by 1.0 minus the maximum sales charge of 5.75%.
The accompanying Notes to Financial Statements are an integral part of this statement.
Annual Report 2012
17
Columbia Dividend Income Fund
Statement of Operations
| | | Year Ended
May 31,
2012(a) | | Year Ended
September 30,
2011 | |
| Net investment income | |
| Income: | |
| Dividends | | $ | 120,060,174 | | | $ | 113,036,547 | | |
| Interest | | | — | | | | 51,726 | | |
| Dividends from affiliates | | | 170,160 | | | | 37,160 | | |
| Income from securities lending — net | | | 6,504,197 | | | | 77,258 | | |
| Foreign taxes withheld | | | (416,409 | ) | | | (712,700 | ) | |
| Total income | | | 126,318,122 | | | | 112,489,991 | | |
| Expenses: | |
| Investment management fees | | | 18,535,458 | | | | 20,026,109 | | |
| Distribution fees | |
| Class B | | | 81,704 | | | | 146,783 | | |
| Class C | | | 1,210,003 | | | | 1,164,658 | | |
| Class R | | | 76,739 | | | | 62,372 | | |
| Service fees | |
| Class A | | | 2,454,192 | | | | 2,530,486 | | |
| Class B | | | 27,234 | | | | 48,928 | | |
| Class C | | | 403,334 | | | | 388,219 | | |
| Class W | | | 80,221 | | | | 75,979 | | |
| Shareholder service fee — Class T | | | 158,657 | | | | 247,391 | | |
| Transfer agent fees | |
| Class A | | | 1,762,486 | | | | 1,717,159 | | |
| Class B | | | 20,531 | | | | 33,068 | | |
| Class C | | | 288,340 | | | | 261,871 | | |
| Class R | | | 26,997 | | | | 20,120 | | |
| Class T | | | 97,886 | | | | 138,140 | | |
| Class W | | | 56,999 | | | | 48,902 | | |
| Class Z | | | 3,496,086 | | | | 3,385,803 | | |
| Administration fees | | | 1,613,728 | | | | 2,133,693 | | |
| Compensation of board members | | | 86,606 | | | | 118,135 | | |
| Pricing and bookkeeping fees | | | — | | | | 108,964 | | |
| Custodian fees | | | 88,902 | | | | 90,644 | | |
| Printing and postage fees | | | 302,036 | | | | 300,001 | | |
| Registration fees | | | 470,674 | | | | 202,000 | | |
| Professional fees | | | 135,698 | | | | 179,437 | | |
| Chief compliance officer expenses | | | 1,066 | | | | 3,661 | | |
| Other | | | 115,787 | | | | 81,646 | | |
| Total expenses | | | 31,591,364 | | | | 33,514,169 | | |
| Fees waived or expenses reimbursed by Investment Manager and its affiliates | | | (1,781,743 | ) | | | (1,966,047 | ) | |
| Expense reductions | | | — | | | | (12,184 | ) | |
| Total net expenses | | | 29,809,621 | | | | 31,535,938 | | |
| Net investment income | | | 96,508,501 | | | | 80,954,053 | | |
| Realized and unrealized gain (loss) — net | |
| Net realized gain (loss) on: | |
| Investments | | | 16,301,149 | | | | 16,568,991 | | |
| Foreign currency translations | | | 2,231 | | | | 1,298 | | |
| Net realized gain | | | 16,303,380 | | | | 16,570,289 | | |
| Net change in unrealized appreciation (depreciation) on: | |
| Investments | | | 546,816,691 | | | | (125,200,605 | ) | |
| Foreign currency translations | | | 2,620 | | | | (2,620 | ) | |
| Net change in unrealized appreciation (depreciation) | | | 546,819,311 | | | | (125,203,225 | ) | |
| Net realized and unrealized gain (loss) | | | 563,122,691 | | | | (108,632,936 | ) | |
| Net change in net assets resulting from operations | | $ | 659,631,192 | | | $ | (27,678,883 | ) | |
(a) For the period from October 1, 2011 to May 31, 2012. During the period, the Fund's fiscal year end was changed from September 30 to May 31.
The accompanying Notes to Financial Statements are an integral part of this statement.
Annual Report 2012
18
Columbia Dividend Income Fund
Statement of Changes in Net Assets
| | | Year Ended
May 31,
2012(a) | | Year Ended
September 30,
2011 | | Year Ended
September 30,
2010(b) | |
| Operations | |
| Net investment income | | $ | 96,508,501 | | | $ | 80,954,053 | | | $ | 53,954,403 | | |
| Net realized gain | | | 16,303,380 | | | | 16,570,289 | | | | 43,830,633 | | |
| Net change in unrealized appreciation (depreciation) | | | 546,819,311 | | | | (125,203,225 | ) | | | 114,609,413 | | |
| Net increase (decrease) in net assets resulting from operations | | | 659,631,192 | | | | (27,678,883 | ) | | | 212,394,449 | | |
| Distributions to shareholders | |
| Net investment income | |
| Class A | | | (18,711,324 | ) | | | (22,582,632 | ) | | | (15,010,735 | ) | |
| Class B | | | (149,656 | ) | | | (274,525 | ) | | | (408,584 | ) | |
| Class C | | | (2,239,333 | ) | | | (2,356,214 | ) | | | (1,243,004 | ) | |
| Class I | | | (3,932,492 | ) | | | (3,517,020 | ) | | | — | | |
| Class R | | | (259,671 | ) | | | (247,636 | ) | | | (90,437 | ) | |
| Class T | | | (987,754 | ) | | | (1,721,136 | ) | | | (1,868,788 | ) | |
| Class W | | | (606,798 | ) | | | (740,376 | ) | | | — | | |
| Class Z | | | (41,629,351 | ) | | | (49,919,726 | ) | | | (36,042,620 | ) | |
| Total distributions to shareholders | | | (68,516,379 | ) | | | (81,359,265 | ) | | | (54,664,168 | ) | |
| Increase in net assets from share transactions | | | 1,350,220,709 | | | | 1,492,699,841 | | | | 671,056,299 | | |
| Total increase in net assets | | | 1,941,335,522 | | | | 1,383,661,693 | | | | 828,786,580 | | |
| Net assets at beginning of year | | | 3,907,505,768 | | | | 2,523,844,075 | | | | 1,695,057,495 | | |
| Net assets at end of year | | $ | 5,848,841,290 | | | $ | 3,907,505,768 | | | $ | 2,523,844,075 | | |
| Undistributed net investment income | | $ | 28,231,804 | | | $ | 244,845 | | | $ | 648,759 | | |
(a) For the period from October 1, 2011 to May 31, 2012. During the period, the Fund's fiscal year end was changed from September 30 to May 31.
(b) Class I and Class W shares are for the period from September 27, 2010 (commencement of operations) to September 30, 2010.
The accompanying Notes to Financial Statements are an integral part of this statement.
Annual Report 2012
19
Columbia Dividend Income Fund
Statement of Changes in Net Assets (continued)
| | | Year Ended May 31, 2012(a) | | Year Ended September 30, 2011(b) | | Year Ended September 30, 2010 | |
| | | Shares | | Dollars($) | | Shares | | Dollars($) | | Shares | | Dollars($) | |
| Capital stock activity | |
| Class A shares | |
| Subscriptions(c) | | | 48,546,597 | | | | 672,368,710 | | | | 48,175,528 | | | | 634,891,354 | | | | 27,619,891 | | | | 326,418,937 | | |
| Distributions reinvested | | | 1,151,653 | | | | 16,100,090 | | | | 1,446,142 | | | | 18,598,042 | | | | 1,091,127 | | | | 12,956,124 | | |
| Redemptions | | | (16,542,347 | ) | | | (228,949,914 | ) | | | (18,973,244 | ) | | | (248,181,551 | ) | | | (11,936,159 | ) | | | (140,954,594 | ) | |
| Net increase | | | 33,155,903 | | | | 459,518,886 | | | | 30,648,426 | | | | 405,307,845 | | | | 16,774,859 | | | | 198,420,467 | | |
| Class B shares | |
| Subscriptions | | | 193,082 | | | | 2,583,203 | | | | 342,782 | | | | 4,373,503 | | | | 287,214 | | | | 3,327,780 | | |
| Distributions reinvested | | | 8,376 | | | | 113,803 | | | | 15,508 | | | | 195,603 | | | | 28,145 | | | | 326,729 | | |
| Redemptions(c) | | | (410,573 | ) | | | (5,513,011 | ) | | | (823,282 | ) | | | (10,545,800 | ) | | | (1,094,271 | ) | | | (12,733,090 | ) | |
| Net decrease | | | (209,115 | ) | | | (2,816,005 | ) | | | (464,992 | ) | | | (5,976,694 | ) | | | (778,912 | ) | | | (9,078,581 | ) | |
| Class C shares | |
| Subscriptions | | | 6,603,537 | | | | 89,285,490 | | | | 9,101,453 | | | | 116,817,556 | | | | 4,345,783 | | | | 50,314,346 | | |
| Distributions reinvested | | | 126,063 | | | | 1,717,923 | | | | 132,150 | | | | 1,655,855 | | | | 78,265 | | | | 908,798 | | |
| Redemptions | | | (1,542,136 | ) | | | (20,780,156 | ) | | | (1,871,114 | ) | | | (23,806,169 | ) | | | (914,304 | ) | | | (10,483,246 | ) | |
| Net increase | | | 5,187,464 | | | | 70,223,257 | | | | 7,362,489 | | | | 94,667,242 | | | | 3,509,744 | | | | 40,739,898 | | |
| Class I shares | |
| Subscriptions | | | 5,520,881 | | | | 75,970,455 | | | | 24,078,342 | | | | 320,170,838 | | | | 206 | | | | 2,500 | | |
| Distributions reinvested | | | 282,493 | | | | 3,932,450 | | | | 276,223 | | | | 3,516,952 | | | | — | | | | — | | |
| Redemptions | | | (6,890,933 | ) | | | (93,486,923 | ) | | | (3,840,844 | ) | | | (50,294,066 | ) | | | — | | | | — | | |
| Net increase (decrease) | | | (1,087,559 | ) | | | (13,584,018 | ) | | | 20,513,721 | | | | 273,393,724 | | | | 206 | | | | 2,500 | | |
| Class R shares | |
| Subscriptions | | | 1,511,426 | | | | 21,095,800 | | | | 742,217 | | | | 9,640,024 | | | | 758,691 | | | | 9,240,343 | | |
| Distributions reinvested | | | 14,515 | | | | 203,218 | | | | 15,585 | | | | 200,423 | | | | 6,868 | | | | 81,266 | | |
| Redemptions | | | (297,634 | ) | | | (4,166,692 | ) | | | (388,469 | ) | | | (5,161,722 | ) | | | (117,253 | ) | | | (1,359,907 | ) | |
| Net increase | | | 1,228,307 | | | | 17,132,326 | | | | 369,333 | | | | 4,678,725 | | | | 648,306 | | | | 7,961,702 | | |
| Class T shares | |
| Subscriptions | | | 55,561 | | | | 761,410 | | | | 150,886 | | | | 1,961,263 | | | | 784,478 | | | | 9,235,572 | | |
| Distributions reinvested | | | 58,440 | | | | 812,871 | | | | 109,642 | | | | 1,414,376 | | | | 146,661 | | | | 1,740,293 | | |
| Redemptions | | | (527,656 | ) | | | (7,286,576 | ) | | | (938,084 | ) | | | (12,332,826 | ) | | | (898,540 | ) | | | (10,598,500 | ) | |
| Net increase (decrease) | | | (413,655 | ) | | | (5,712,295 | ) | | | (677,556 | ) | | | (8,957,187 | ) | | | 32,599 | | | | 377,365 | | |
| Class W shares | |
| Subscriptions | | | 746,557 | | | | 10,264,661 | | | | 4,878,494 | | | | 64,001,093 | | | | 206 | | | | 2,500 | | |
| Distributions reinvested | | | 43,651 | | | | 606,762 | | | | 58,168 | | | | 740,317 | | | | — | | | | — | | |
| Redemptions | | | (955,633 | ) | | | (13,161,521 | ) | | | (1,358,960 | ) | | | (17,428,109 | ) | | | — | | | | — | | |
| Net increase (decrease) | | | (165,425 | ) | | | (2,290,098 | ) | | | 3,577,702 | | | | 47,313,301 | | | | 206 | | | | 2,500 | | |
The accompanying Notes to Financial Statements are an integral part of this statement.
Annual Report 2012
20
Columbia Dividend Income Fund
Statement of Changes in Net Assets (continued)
| | | Year Ended May 31, 2012(a) | | Year Ended September 30, 2011(b) | | Year Ended September 30, 2010 | |
| | | Shares | | Dollars ($) | | Shares | | Dollars ($) | | Shares | | Dollars ($) | |
| Capital stock activity (continued) | |
| Class Z shares | |
| Subscriptions | | | 89,060,506 | | | | 1,229,645,133 | | | | 86,848,555 | | | | 1,140,726,956 | | | | 62,622,462 | | | | 742,481,198 | | |
| Distributions reinvested | | | 1,312,934 | | | | 18,342,883 | | | | 1,553,333 | | | | 19,960,237 | | | | 971,154 | | | | 11,539,013 | | |
| Redemptions | | | (30,405,107 | ) | | | (420,239,360 | ) | | | (36,526,580 | ) | | | (478,414,308 | ) | | | (27,195,653 | ) | | | (321,389,763 | ) | |
| Net increase | | | 59,968,333 | | | | 827,748,656 | | | | 51,875,308 | | | | 682,272,885 | | | | 36,397,963 | | | | 432,630,448 | | |
| Total net increase | | | 97,664,253 | | | | 1,350,220,709 | | | | 113,204,431 | | | | 1,492,699,841 | | | | 56,584,971 | | | | 671,056,299 | | |
(a) For the period from October 1, 2011 to May 31, 2012. During the period, the Fund's fiscal year end was changed from September 30 to May 31.
(b) Class I and Class W shares are for the period from September 27, 2010 (commencement of operations) to September 30, 2010.
(c) Includes conversions of Class B shares to Class A shares, if any.
The accompanying Notes to Financial Statements are an integral part of this statement.
Annual Report 2012
21
Columbia Dividend Income Fund
Financial Highlights
The following tables are intended to help you understand the Fund's financial performance. Certain information reflects financial results for a single share of a class held for the periods shown. Per share net investment income (loss) amounts are calculated based on average shares outstanding during the period. Total returns assume reinvestment of all dividends and distributions. Total returns do not reflect payment of sales charges, if any, and are not annualized for periods of less than one year.
| | | Year Ended
May 31, | |
Year Ended September 30, | |
| Class A | | 2012(a) | | 2011 | | 2010 | | 2009 | | 2008 | | 2007 | |
| Per share data | |
| Net asset value, beginning of period | | $ | 12.16 | | | $ | 12.12 | | | $ | 11.18 | | | $ | 12.01 | | | $ | 15.35 | | | $ | 13.45 | | |
| Income from investment operations: | |
| Net investment income | | | 0.25 | | | | 0.29 | | | | 0.28 | | | | 0.29 | | | | 0.31 | | | | 0.28 | | |
| Net realized and unrealized gain (loss) | | | 1.73 | | | | 0.03 | (b) | | | 0.94 | | | | (0.86 | ) | | | (3.18 | ) | | | 2.02 | | |
| Total from investment operations | | | 1.98 | | | | 0.32 | | | | 1.22 | | | | (0.57 | ) | | | (2.87 | ) | | | 2.30 | | |
| Less distributions to shareholders: | |
| Net investment income | | | (0.18 | ) | | | (0.28 | ) | | | (0.28 | ) | | | (0.27 | ) | | | (0.31 | ) | | | (0.27 | ) | |
| Net realized gains | | | — | | | | — | | | | — | | | | — | | | | (0.16 | ) | | | (0.13 | ) | |
| Total distributions to shareholders | | | (0.18 | ) | | | (0.28 | ) | | | (0.28 | ) | | | (0.27 | ) | | | (0.47 | ) | | | (0.40 | ) | |
| Proceeds from regulatory settlements | | | — | | | | — | | | | — | | | | 0.01 | | | | — | | | | — | | |
| Net asset value, end of period | | $ | 13.96 | | | $ | 12.16 | | | $ | 12.12 | | | $ | 11.18 | | | $ | 12.01 | | | $ | 15.35 | | |
| Total return | | | 16.26 | % | | | 2.56 | % | | | 11.02 | % | | | (4.33 | %) | | | (19.06 | %) | | | 17.31 | % | |
| Ratios to average net assets(c) | |
Expenses prior to fees waived or expenses
reimbursed | | | 1.06 | %(d) | | | 1.09 | % | | | 1.07 | % | | | 1.11 | % | | | 1.11 | % | | | 1.12 | % | |
Net expenses after fees waived or expenses
reimbursed(e) | | | 1.00 | %(d) | | | 1.03 | %(f) | | | 1.05 | %(f) | | | 1.05 | %(f) | | | 1.05 | %(f) | | | 1.05 | %(f) | |
| Net investment income | | | 2.71 | %(d) | | | 2.23 | %(f) | | | 2.41 | %(f) | | | 2.88 | %(f) | | | 2.24 | %(f) | | | 1.90 | %(f) | |
| Supplemental data | |
| Net assets, end of period (in thousands) | | $ | 1,729,495 | | | $ | 1,103,389 | | | $ | 728,219 | | | $ | 483,916 | | | $ | 278,122 | | | $ | 370,358 | | |
| Portfolio turnover | | | 23 | % | | | 20 | % | | | 17 | % | | | 23 | % | | | 16 | % | | | 21 | % | |
Notes to Financial Highlights
(a) For the period from October 1, 2011 to May 31, 2012. During the period, the Fund's fiscal year end was changed from September 30 to May 31.
(b) Calculation of the net gain/loss per share (both realized and unrealized) does not correlate to the aggregate realized and unrealized gain/loss presented in the Statement of Operations due to the timing of sales and repurchases of Fund shares in relation to fluctuations in the market value of the portfolio.
(c) In addition to the fees and expenses which the Fund bears directly, the Fund indirectly bears a pro rata share of the fees and expenses of the acquired funds in which it invests. Such indirect expenses are not included in the reported expense ratios.
(d) Annualized.
(e) The Investment Manager and certain of its affiliates agreed to waive/reimburse certain fees and expenses, if applicable.
(f) The benefits derived from expense reductions had an impact of less than 0.01%.
The accompanying Notes to Financial Statements are an integral part of this statement.
Annual Report 2012
22
Columbia Dividend Income Fund
Financial Highlights (continued)
| | | Year Ended
May 31, | |
Year Ended September 30, | |
| Class B | | 2012(a) | | 2011 | | 2010 | | 2009 | | 2008 | | 2007 | |
| Per share data | |
| Net asset value, beginning of period | | $ | 11.89 | | | $ | 11.86 | | | $ | 10.94 | | | $ | 11.75 | | | $ | 15.03 | | | $ | 13.17 | | |
| Income from investment operations: | |
| Net investment income | | | 0.18 | | | | 0.19 | | | | 0.19 | | | | 0.21 | | | | 0.20 | | | | 0.16 | | |
| Net realized and unrealized gain (loss) | | | 1.69 | | | | 0.03 | (b) | | | 0.93 | | | | (0.82 | ) | | | (3.11 | ) | | | 1.99 | | |
| Total from investment operations | | | 1.87 | | | | 0.22 | | | | 1.12 | | | | (0.61 | ) | | | (2.91 | ) | | | 2.15 | | |
| Less distributions to shareholders: | |
| Net investment income | | | (0.13 | ) | | | (0.19 | ) | | | (0.20 | ) | | | (0.20 | ) | | | (0.21 | ) | | | (0.16 | ) | |
| Net realized gains | | | — | | | | — | | | | — | | | | — | | | | (0.16 | ) | | | (0.13 | ) | |
| Total distributions to shareholders | | | (0.13 | ) | | | (0.19 | ) | | | (0.20 | ) | | | (0.20 | ) | | | (0.37 | ) | | | (0.29 | ) | |
| Proceeds from regulatory settlements | | | — | | | | — | | | | — | | | | 0.00 | (c) | | | — | | | | — | | |
| Net asset value, end of period | | $ | 13.63 | | | $ | 11.89 | | | $ | 11.86 | | | $ | 10.94 | | | $ | 11.75 | | | $ | 15.03 | | |
| Total return | | | 15.69 | % | | | 1.74 | % | | | 10.24 | % | | | (4.97 | %) | | | (19.71 | %) | | | 16.49 | % | |
| Ratios to average net assets(d) | |
Expenses prior to fees waived or expenses
reimbursed | | | 1.81 | %(e) | | | 1.85 | % | | | 1.82 | % | | | 1.86 | % | | | 1.86 | % | | | 1.87 | % | |
Net expenses after fees waived or expenses
reimbursed(f) | | | 1.75 | %(e) | | | 1.79 | %(g) | | | 1.80 | %(g) | | | 1.80 | %(g) | | | 1.80 | %(g) | | | 1.80 | %(g) | |
| Net investment income | | | 1.96 | %(e) | | | 1.48 | %(g) | | | 1.67 | %(g) | | | 2.18 | %(g) | | | 1.48 | %(g) | | | 1.16 | %(g) | |
| Supplemental data | |
| Net assets, end of period (in thousands) | | $ | 15,095 | | | $ | 15,659 | | | $ | 21,126 | | | $ | 28,006 | | | $ | 31,307 | | | $ | 52,937 | | |
| Portfolio turnover | | | 23 | % | | | 20 | % | | | 17 | % | | | 23 | % | | | 16 | % | | | 21 | % | |
Notes to Financial Highlights
(a) For the period from October 1, 2011 to May 31, 2012. During the period, the Fund's fiscal year end was changed from September 30 to May 31.
(b) Calculation of the net gain/loss per share (both realized and unrealized) does not correlate to the aggregate realized and unrealized gain/loss presented in the Statement of Operations due to the timing of sales and repurchases of Fund shares in relation to fluctuations in the market value of the portfolio.
(c) Rounds to less than $0.01.
(d) In addition to the fees and expenses which the Fund bears directly, the Fund indirectly bears a pro rata share of the fees and expenses of the acquired funds in which it invests. Such indirect expenses are not included in the reported expense ratios.
(e) Annualized.
(f) The Investment Manager and certain of its affiliates agreed to waive/reimburse certain fees and expenses, if applicable.
(g) The benefits derived from expense reductions had an impact of less than 0.01%.
The accompanying Notes to Financial Statements are an integral part of this statement.
Annual Report 2012
23
Columbia Dividend Income Fund
Financial Highlights (continued)
| | | Year Ended
May 31, | |
Year Ended September 30, | |
| Class C | | 2012(a) | | 2011 | | 2010 | | 2009 | | 2008 | | 2007 | |
| Per share data | |
| Net asset value, beginning of period | | $ | 11.88 | | | $ | 11.85 | | | $ | 10.93 | | | $ | 11.74 | | | $ | 15.02 | | | $ | 13.17 | | |
| Income from investment operations: | |
| Net investment income | | | 0.18 | | | | 0.19 | | | | 0.19 | | | | 0.20 | | | | 0.20 | | | | 0.16 | | |
| Net realized and unrealized gain (loss) | | | 1.69 | | | | 0.03 | (b) | | | 0.93 | | | | (0.82 | ) | | | (3.11 | ) | | | 1.98 | | |
| Total from investment operations | | | 1.87 | | | | 0.22 | | | | 1.12 | | | | (0.62 | ) | | | (2.91 | ) | | | 2.14 | | |
| Less distributions to shareholders: | |
| Net investment income | | | (0.13 | ) | | | (0.19 | ) | | | (0.20 | ) | | | (0.20 | ) | | | (0.21 | ) | | | (0.16 | ) | |
| Net realized gains | | | — | | | | — | | | | — | | | | — | | | | (0.16 | ) | | | (0.13 | ) | |
| Total distributions to shareholders | | | (0.13 | ) | | | (0.19 | ) | | | (0.20 | ) | | | (0.20 | ) | | | (0.37 | ) | | | (0.29 | ) | |
| Proceeds from regulatory settlements | | | — | | | | — | | | | — | | | | 0.01 | | | | — | | | | — | | |
| Net asset value, end of period | | $ | 13.62 | | | $ | 11.88 | | | $ | 11.85 | | | $ | 10.93 | | | $ | 11.74 | | | $ | 15.02 | | |
| Total return | | | 15.71 | % | | | 1.74 | % | | | 10.25 | % | | | (4.98 | %) | | | (19.72 | %) | | | 16.42 | % | |
| Ratios to average net assets(c) | |
Expenses prior to fees waived or expenses
reimbursed | | | 1.81 | %(d) | | | 1.84 | % | | | 1.82 | % | | | 1.86 | % | | | 1.86 | % | | | 1.87 | % | |
Net expenses after fees waived or expenses
reimbursed(e) | | | 1.75 | %(d) | | | 1.78 | %(f) | | | 1.80 | %(f) | | | 1.80 | %(f) | | | 1.80 | %(f) | | | 1.80 | %(f) | |
| Net investment income | | | 1.96 | %(d) | | | 1.49 | %(f) | | | 1.66 | %(f) | | | 2.08 | %(f) | | | 1.48 | %(f) | | | 1.14 | %(f) | |
| Supplemental data | |
| Net assets, end of period (in thousands) | | $ | 279,093 | | | $ | 181,875 | | | $ | 94,091 | | | $ | 48,438 | | | $ | 12,635 | | | $ | 20,622 | | |
| Portfolio turnover | | | 23 | % | | | 20 | % | | | 17 | % | | | 23 | % | | | 16 | % | | | 21 | % | |
Notes to Financial Highlights
(a) For the period from October 1, 2011 to May 31, 2012. During the period, the Fund's fiscal year end was changed from September 30 to May 31.
(b) Calculation of the net gain/loss per share (both realized and unrealized) does not correlate to the aggregate realized and unrealized gain/loss presented in the Statement of Operations due to the timing of sales and repurchases of Fund shares in relation to fluctuations in the market value of the portfolio.
(c) In addition to the fees and expenses which the Fund bears directly, the Fund indirectly bears a pro rata share of the fees and expenses of the acquired funds in which it invests. Such indirect expenses are not included in the reported expense ratios.
(d) Annualized.
(e) The Investment Manager and certain of its affiliates agreed to waive/reimburse certain fees and expenses, if applicable.
(f) The benefits derived from expense reductions had an impact of less than 0.01%.
The accompanying Notes to Financial Statements are an integral part of this statement.
Annual Report 2012
24
Columbia Dividend Income Fund
Financial Highlights (continued)
| | | Year Ended
May 31, | |
Year Ended September 30, | |
| Class I | | 2012(a) | | 2011 | | 2010(b) | |
| Per share data | |
| Net asset value, beginning of period | | $ | 12.18 | | | $ | 12.13 | | | $ | 12.14 | | |
| Income from investment operations: | |
| Net investment income | | | 0.28 | | | | 0.35 | | | | 0.01 | | |
| Net realized and unrealized gain (loss) | | | 1.73 | | | | 0.03 | (c) | | | (0.02 | ) | |
| Total from investment operations | | | 2.01 | | | | 0.38 | | | | (0.01 | ) | |
| Less distributions to shareholders: | |
| Net investment income | | | (0.20 | ) | | | (0.33 | ) | | | — | | |
| Total distributions to shareholders | | | (0.20 | ) | | | (0.33 | ) | | | — | | |
| Net asset value, end of period | | $ | 13.99 | | | $ | 12.18 | | | $ | 12.13 | | |
| Total return | | | 16.53 | % | | | 3.02 | % | | | (0.08 | %) | |
| Ratios to average net assets(d) | |
| Expenses prior to fees waived or expenses reimbursed | | | 0.63 | %(e) | | | 0.67 | % | | | 0.71 | %(e) | |
| Net expenses after fees waived or expenses reimbursed(f) | | | 0.63 | %(e) | | | 0.67 | %(g) | | | 0.71 | %(e)(g) | |
| Net investment income | | | 3.08 | %(e) | | | 2.62 | %(g) | | | 8.17 | %(e)(g) | |
| Supplemental data | |
| Net assets, end of period (in thousands) | | $ | 271,694 | | | $ | 249,778 | | | $ | 2 | | |
| Portfolio turnover | | | 23 | % | | | 20 | % | | | 17 | % | |
Notes to Financial Highlights
(a) For the period from October 1, 2011 to May 31, 2012. During the period, the Fund's fiscal year end was changed from September 30 to May 31.
(b) For the period from September 27, 2010 (commencement of operations) to September 30, 2010.
(c) Calculation of the net gain/loss per share (both realized and unrealized) does not correlate to the aggregate realized and unrealized gain/loss presented in the Statement of Operations due to the timing of sales and repurchases of Fund shares in relation to fluctuations in the market value of the portfolio.
(d) In addition to the fees and expenses which the Fund bears directly, the Fund indirectly bears a pro rata share of the fees and expenses of the acquired funds in which it invests. Such indirect expenses are not included in the reported expense ratios.
(e) Annualized.
(f) The Investment Manager and certain of its affiliates agreed to waive/reimburse certain fees and expenses, if applicable.
(g) The benefits derived from expense reductions had an impact of less than 0.01%.
The accompanying Notes to Financial Statements are an integral part of this statement.
Annual Report 2012
25
Columbia Dividend Income Fund
Financial Highlights (continued)
| | | Year Ended
May 31, | |
Year Ended September 30, | |
| Class R | | 2012(a) | | 2011 | | 2010 | | 2009 | | 2008(b) | |
| Per share data | |
| Net asset value, beginning of period | | $ | 12.17 | | | $ | 12.13 | | | $ | 11.18 | | | $ | 12.01 | | | $ | 13.39 | | |
| Income from investment operations: | |
| Net investment income | | | 0.23 | | | | 0.26 | | | | 0.27 | | | | 0.28 | | | | 0.14 | | |
| Net realized and unrealized gain (loss) | | | 1.72 | | | | 0.03 | (c) | | | 0.93 | | | | (0.86 | ) | | | (1.38 | ) | |
| Total from investment operations | | | 1.95 | | | | 0.29 | | | | 1.20 | | | | (0.58 | ) | | | (1.24 | ) | |
| Less distributions to shareholders: | |
| Net investment income | | | (0.16 | ) | | | (0.25 | ) | | | (0.25 | ) | | | (0.25 | ) | | | (0.14 | ) | |
| Total distributions to shareholders | | | (0.16 | ) | | | (0.25 | ) | | | (0.25 | ) | | | (0.25 | ) | | | (0.14 | ) | |
| Proceeds from regulatory settlements | | | — | | | | — | | | | — | | | | 0.00 | (d) | | | — | | |
| Net asset value, end of period | | $ | 13.96 | | | $ | 12.17 | | | $ | 12.13 | | | $ | 11.18 | | | $ | 12.01 | | |
| Total return | | | 16.03 | % | | | 2.30 | % | | | 10.84 | % | | | (4.57 | %) | | | (9.28 | %) | |
| Ratios to average net assets(e) | |
| Expenses prior to fees waived or expenses reimbursed | | | 1.31 | %(f) | | | 1.34 | % | | | 1.32 | % | | | 1.36 | % | | | 1.36 | %(f) | |
| Net expenses after fees waived or expenses reimbursed(g) | | | 1.25 | %(f) | | | 1.28 | %(h) | | | 1.30 | %(h) | | | 1.30 | %(h) | | | 1.30 | %(f)(h) | |
| Net investment income | | | 2.46 | %(f) | | | 1.98 | %(h) | | | 2.27 | %(h) | | | 2.59 | %(h) | | | 2.10 | %(f)(h) | |
| Supplemental data | |
| Net assets, end of period (in thousands) | | $ | 32,183 | | | $ | 13,101 | | | $ | 8,577 | | | $ | 657 | | | $ | 11 | | |
| Portfolio turnover | | | 23 | % | | | 20 | % | | | 17 | % | | | 23 | % | | | 16 | % | |
Notes to Financial Highlights
(a) For the period from October 1, 2011 to May 31, 2012. During the period, the Fund's fiscal year end was changed from September 30 to May 31.
(b) For the period from March 28, 2008 (commencement of operations) to September 30, 2008.
(c) Calculation of the net gain/loss per share (both realized and unrealized) does not correlate to the aggregate realized and unrealized gain/loss presented in the Statement of Operations due to the timing of sales and repurchases of Fund shares in relation to fluctuations in the market value of the portfolio.
(d) Rounds to less than $0.01.
(e) In addition to the fees and expenses which the Fund bears directly, the Fund indirectly bears a pro rata share of the fees and expenses of the acquired funds in which it invests. Such indirect expenses are not included in the reported expense ratios.
(f) Annualized.
(g) The Investment Manager and certain of its affiliates agreed to waive/reimburse certain fees and expenses, if applicable.
(h) The benefits derived from expense reductions had an impact of less than 0.01%.
The accompanying Notes to Financial Statements are an integral part of this statement.
Annual Report 2012
26
Columbia Dividend Income Fund
Financial Highlights (continued)
| | | Year Ended
May 31, | |
Year Ended September 30, | |
| Class T | | 2012(a) | | 2011 | | 2010 | | 2009 | | 2008 | | 2007 | |
| Per share data | |
| Net asset value, beginning of period | | $ | 12.17 | | | $ | 12.13 | | | $ | 11.18 | | | $ | 12.01 | | | $ | 15.35 | | | $ | 13.45 | | |
| Income from investment operations: | |
| Net investment income | | | 0.24 | | | | 0.29 | | | | 0.28 | | | | 0.29 | | | | 0.30 | | | | 0.27 | | |
| Net realized and unrealized gain (loss) | | | 1.72 | | | | 0.03 | (b) | | | 0.95 | | | | (0.85 | ) | | | (3.18 | ) | | | 2.02 | | |
| Total from investment operations | | | 1.96 | | | | 0.32 | | | | 1.23 | | | | (0.56 | ) | | | (2.88 | ) | | | 2.29 | | |
| Less distributions to shareholders: | |
| Net investment income | | | (0.17 | ) | | | (0.28 | ) | | | (0.28 | ) | | | (0.27 | ) | | | (0.30 | ) | | | (0.26 | ) | |
| Net realized gains | | | — | | | | — | | | | — | | | | — | | | | (0.16 | ) | | | (0.13 | ) | |
| Total distributions to shareholders | | | (0.17 | ) | | | (0.28 | ) | | | (0.28 | ) | | | (0.27 | ) | | | (0.46 | ) | | | (0.39 | ) | |
| Proceeds from regulatory settlements | | | — | | | | — | | | | — | | | | 0.00 | (c) | | | — | | | | — | | |
| Net asset value, end of period | | $ | 13.96 | | | $ | 12.17 | | | $ | 12.13 | | | $ | 11.18 | | | $ | 12.01 | | | $ | 15.35 | | |
| Total return | | | 16.14 | % | | | 2.51 | % | | | 11.06 | % | | | (4.38 | %) | | | (19.10 | %) | | | 17.25 | % | |
| Ratios to average net assets(d) | |
Expenses prior to fees waived or expenses
reimbursed | | | 1.11 | %(e) | | | 1.15 | % | | | 1.12 | % | | | 1.16 | % | | | 1.16 | % | | | 1.17 | % | |
Net expenses after fees waived or expenses
reimbursed(f) | | | 1.05 | %(e) | | | 1.09 | %(g) | | | 1.10 | %(g) | | | 1.10 | %(g) | | | 1.10 | %(g) | | | 1.10 | %(g) | |
| Net investment income | | | 2.65 | %(e) | | | 2.18 | %(g) | | | 2.36 | %(g) | | | 2.87 | %(g) | | | 2.19 | %(g) | | | 1.85 | %(g) | |
| Supplemental data | |
| Net assets, end of period (in thousands) | | $ | 77,344 | | | $ | 72,421 | | | $ | 80,405 | | | $ | 73,773 | | | $ | 72,213 | | | $ | 100,932 | | |
| Portfolio turnover | | | 23 | % | | | 20 | % | | | 17 | % | | | 23 | % | | | 16 | % | | | 21 | % | |
Notes to Financial Highlights
(a) For the period from October 1, 2011 to May 31, 2012. During the period, the Fund's fiscal year end was changed from September 30 to May 31.
(b) Calculation of the net gain/loss per share (both realized and unrealized) does not correlate to the aggregate realized and unrealized gain/loss presented in the Statement of Operations due to the timing of sales and repurchases of Fund shares in relation to fluctuations in the market value of the portfolio.
(c) Rounds to less than $0.01.
(d) In addition to the fees and expenses which the Fund bears directly, the Fund indirectly bears a pro rata share of the fees and expenses of the acquired funds in which it invests. Such indirect expenses are not included in the reported expense ratios.
(e) Annualized.
(f) The Investment Manager and certain of its affiliates agreed to waive/reimburse certain fees and expenses, if applicable.
(g) The benefits derived from expense reductions had an impact of less than 0.01%.
The accompanying Notes to Financial Statements are an integral part of this statement.
Annual Report 2012
27
Columbia Dividend Income Fund
Financial Highlights (continued)
| | | Year Ended
May 31, | |
Year Ended September 30, | |
| Class W | | 2012(a) | | 2011 | | 2010(b) | |
| Per share data | |
| Net asset value, beginning of period | | $ | 12.16 | | | $ | 12.12 | | | $ | 12.13 | | |
| Income from investment operations: | |
| Net investment income | | | 0.25 | | | | 0.30 | | | | 0.01 | | |
| Net realized and unrealized gain (loss) | | | 1.73 | | | | 0.02 | (c) | | | (0.02 | ) | |
| Total from investment operations | | | 1.98 | | | | 0.32 | | | | (0.01 | ) | |
| Less distributions to shareholders: | |
| Net investment income | | | (0.18 | ) | | | (0.28 | ) | | | — | | |
| Total distributions to shareholders | | | (0.18 | ) | | | (0.28 | ) | | | — | | |
| Net asset value, end of period | | $ | 13.96 | | | $ | 12.16 | | | $ | 12.12 | | |
| Total return | | | 16.27 | % | | | 2.57 | % | | | (0.08 | %) | |
| Ratios to average net assets(d) | |
| Expenses prior to fees waived or expenses reimbursed | | | 1.05 | %(e) | | | 1.08 | % | | | 1.06 | %(e) | |
| Net expenses after fees waived or expenses reimbursed(f) | | | 1.00 | %(e) | | | 1.00 | %(g) | | | 1.05 | %(e)(g) | |
| Net investment income | | | 2.71 | %(e) | | | 2.28 | %(g) | | | 7.83 | %(e)(g) | |
| Supplemental data | |
| Net assets, end of period (in thousands) | | $ | 47,647 | | | $ | 43,525 | | | $ | 2 | | |
| Portfolio turnover | | | 23 | % | | | 20 | % | | | 17 | % | |
Notes to Financial Highlights
(a) For the period from October 1, 2011 to May 31, 2012. During the period, the Fund's fiscal year end was changed from September 30 to May 31.
(b) For the period from September 27, 2010 (commencement of operations) to September 30, 2010.
(c) Calculation of the net gain/loss per share (both realized and unrealized) does not correlate to the aggregate realized and unrealized gain/loss presented in the Statement of Operations due to the timing of sales and repurchases of Fund shares in relation to fluctuations in the market value of the portfolio.
(d) In addition to the fees and expenses which the Fund bears directly, the Fund indirectly bears a pro rata share of the fees and expenses of the acquired funds in which it invests. Such indirect expenses are not included in the reported expense ratios.
(e) Annualized.
(f) The Investment Manager and certain of its affiliates agreed to waive/reimburse certain fees and expenses, if applicable.
(g) The benefits derived from expense reductions had an impact of less than 0.01%.
The accompanying Notes to Financial Statements are an integral part of this statement.
Annual Report 2012
28
Columbia Dividend Income Fund
Financial Highlights (continued)
| | | Year Ended
May 31, | |
Year Ended September 30, | |
| Class Z | | 2012(a) | | 2011 | | 2010 | | 2009 | | 2008 | | 2007 | |
| Per share data | |
| Net asset value, beginning of period | | $ | 12.17 | | | $ | 12.13 | | | $ | 11.18 | | | $ | 12.01 | | | $ | 15.36 | | | $ | 13.45 | | |
| Income from investment operations: | |
| Net investment income | | | 0.27 | | | | 0.33 | | | | 0.31 | | | | 0.31 | | | | 0.34 | | | | 0.31 | | |
| Net realized and unrealized gain (loss) | | | 1.72 | | | | 0.03 | (b) | | | 0.95 | | | | (0.85 | ) | | | (3.19 | ) | | | 2.04 | | |
| Total from investment operations | | | 1.99 | | | | 0.36 | | | | 1.26 | | | | (0.54 | ) | | | (2.85 | ) | | | 2.35 | | |
| Less distributions to shareholders: | |
| Net investment income | | | (0.19 | ) | | | (0.32 | ) | | | (0.31 | ) | | | (0.30 | ) | | | (0.34 | ) | | | (0.31 | ) | |
| Net realized gains | | | — | | | | — | | | | — | | | | — | | | | (0.16 | ) | | | (0.13 | ) | |
| Total distributions to shareholders | | | (0.19 | ) | | | (0.32 | ) | | | (0.31 | ) | | | (0.30 | ) | | | (0.50 | ) | | | (0.44 | ) | |
| Proceeds from regulatory settlements | | | — | | | | — | | | | — | | | | 0.01 | | | | — | | | | — | | |
| Net asset value, end of period | | $ | 13.97 | | | $ | 12.17 | | | $ | 12.13 | | | $ | 11.18 | | | $ | 12.01 | | | $ | 15.36 | | |
| Total return | | | 16.39 | % | | | 2.82 | % | | | 11.38 | % | | | (4.10 | %) | | | (18.90 | %) | | | 17.67 | % | |
| Ratios to average net assets(c) | |
Expenses prior to fees waived or expenses
reimbursed | | | 0.80 | %(d) | | | 0.84 | % | | | 0.82 | % | | | 0.86 | % | | | 0.86 | % | | | 0.87 | % | |
Net expenses after fees waived or expenses
reimbursed(e) | | | 0.75 | %(d) | | | 0.79 | %(f) | | | 0.80 | %(f) | | | 0.80 | %(f) | | | 0.80 | %(f) | | | 0.80 | %(f) | |
| Net investment income | | | 2.96 | %(d) | | | 2.48 | %(f) | | | 2.66 | %(f) | | | 3.15 | %(f) | | | 2.51 | %(f) | | | 2.15 | %(f) | |
| Supplemental data | |
| Net assets, end of period (in thousands) | | $ | 3,396,290 | | | $ | 2,227,757 | | | $ | 1,591,420 | | | $ | 1,060,268 | | | $ | 671,700 | | | $ | 594,859 | | |
| Portfolio turnover | | | 23 | % | | | 20 | % | | | 17 | % | | | 23 | % | | | 16 | % | | | 21 | % | |
Notes to Financial Highlights
(a) For the period from October 1, 2011 to May 31, 2012. During the period, the Fund's fiscal year end was changed from September 30 to May 31.
(b) Calculation of the net gain/loss per share (both realized and unrealized) does not correlate to the aggregate realized and unrealized gain/loss presented in the Statement of Operations due to the timing of sales and repurchases of Fund shares in relation to fluctuations in the market value of the portfolio.
(c) In addition to the fees and expenses which the Fund bears directly, the Fund indirectly bears a pro rata share of the fees and expenses of the acquired funds in which it invests. Such indirect expenses are not included in the reported expense ratios.
(d) Annualized.
(e) The Investment Manager and certain of its affiliates agreed to waive/reimburse certain fees and expenses, if applicable.
(f) The benefits derived from expense reductions had an impact of less than 0.01%.
The accompanying Notes to Financial Statements are an integral part of this statement.
Annual Report 2012
29
Columbia Dividend Income Fund
Notes to Financial Statements
May 31, 2012
Note 1. Organization
Columbia Dividend Income Fund (the Fund), a series of Columbia Funds Series Trust I (the Trust), is a diversified fund. The Trust is registered under the Investment Company Act of 1940, as amended (the 1940 Act), as an open-end management investment company organized as a Massachusetts business trust.
Fiscal Year End Change
During the period, the Fund changed its fiscal year end from September 30 to May 31.
Fund Shares
The Trust may issue an unlimited number of shares (without par value). The Fund offers Class A, Class B, Class C, Class I, Class R, Class T, Class W and Class Z shares. All share classes have identical voting, dividend and liquidation rights. Each share class has its own expense structure and sales charges, as applicable.
Class A shares are subject to a maximum front-end sales charge of 5.75% based on the initial investment amount. Class A shares purchased without an initial sales charge in accounts aggregating $1 million to $50 million at the time of purchase are subject to a contingent deferred sales charge (CDSC) if the shares are sold within 18 months of purchase, charged as follows: 1.00% CDSC if redeemed within 12 months of purchase, and 0.50% CDSC if redeemed more than 12, but less than 18, months after purchase.
Class B shares may be subject to a maximum CDSC of 5.00% based upon the holding period after purchase. Class B shares will generally convert to Class A shares eight years after purchase. The Fund no longer accepts investments by new or existing investors in the Fund's Class B shares, except in connection with the reinvestment of any dividend and/or capital gain distributions in Class B shares of the Fund and exchanges by existing Class B shareholders of certain other funds within the Columbia Family of Funds.
Class C shares are subject to a 1.00% CDSC on shares redeemed within one year of purchase.
Class I shares are not subject to sales charges and are only available to the Columbia Family of Funds.
Class R shares are not subject to sales charges and are only available to qualifying institutional investors.
Class T shares are subject to a maximum front-end sales charge of 5.75% based on the investment amount. Class T shares purchased without an initial sales charge in accounts aggregating $1 million to $50 million at the time of purchase are subject to a contingent deferred sales charge (CDSC) if the shares are sold within 18 months of purchase, charged as follows: 1.00% CDSC if redeemed within 12 months of purchase, and 0.50% CDSC if redeemed more than 12, but less than 18, months after purchase. Class T shares are available only to investors who received (and who have continuously held) Class T shares in connection with the merger of certain Galaxy Funds into various Columbia Funds (formerly named Liberty Funds).
Class W shares are not subject to sales charges and are only available to investors purchasing through authorized investment programs managed by investment professionals, including discretionary managed account programs.
Class Z shares are not subject to sales charges, and are only available to certain investors, as described in the Fund's Class Z prospectus.
Note 2. Summary of Significant Accounting Policies
Use of Estimates
The preparation of financial statements in accordance with U.S. generally accepted accounting principles (GAAP) requires management to make certain estimates and assumptions that affect the reported amounts of assets and liabilities, the disclosure of contingent assets and liabilities at the date of the financial statements and the reported amounts of revenue and expenses during the reporting period. Actual results could differ from those estimates.
The following is a summary of significant accounting policies consistently followed by the Fund in the preparation of its financial statements.
Security Valuation
All equity securities are valued at the close of business of the New York Stock Exchange (NYSE). Equity securities are valued at the last quoted sales price on the principal exchange or market on which they trade, except for securities traded on the NASDAQ Stock Market, which are valued at the NASDAQ official close price. Unlisted securities or listed securities for which there were no sales during the day are valued at the mean of the latest quoted bid and ask prices on such exchanges or markets.
Investments in other open-end investment companies, including money market funds, are valued at net asset value.
Short-term securities purchased within 60 days to maturity are valued at amortized cost, which approximates market value. The value of short-term securities originally purchased with maturities greater than 60 days is determined based on an amortized value to par upon reaching 60 days to maturity.
Annual Report 2012
30
Columbia Dividend Income Fund
Notes to Financial Statements (continued)
May 31, 2012
Short-term securities maturing in more than 60 days from the valuation date are valued at the market price or approximate market value based on current interest rates.
Investments for which market quotations are not readily available, or that have quotations which management believes are not reliable, are valued at fair value as determined in good faith under consistently applied procedures established by and under the general supervision of the Board of Trustees (the Board). If a security or class of securities (such as foreign securities) is valued at fair value, such value is likely to be different from the last quoted market price for the security.
The determination of fair value often requires significant judgment. To determine fair value, management may use assumptions including but not limited to future cash flows and estimated risk premiums. Multiple inputs from various sources may be used to determine fair value.
Foreign Currency Transactions and Translation
The values of all assets and liabilities denominated in foreign currencies are translated into U.S. dollars at that day's exchange rates. Net realized and unrealized gains (losses) on foreign currency transactions and translations include gains (losses) arising from the fluctuation in exchange rates between trade and settlement dates on securities transactions, gains (losses) arising from the disposition of foreign currency and currency gains (losses) between the accrual and payment dates on dividends, interest income and foreign withholding taxes.
For financial statement purposes, the Fund does not distinguish that portion of gains (losses) on investments which is due to changes in foreign exchange rates from that which is due to changes in market prices of the investments. Such fluctuations are included with the net realized and unrealized gains (losses) on investments in the Statement of Operations.
Repurchase Agreements
The Fund may engage in repurchase agreement transactions with institutions that management has determined are creditworthy. The Fund, through the custodian, receives delivery of the underlying securities collateralizing a repurchase agreement. Management is responsible for determining that the collateral is at least equal, at all times, to the value of the repurchase obligation including interest. A repurchase agreement transaction involves certain risks in the event of default or insolvency of the counterparty. These risks include possible delays in or restrictions on a Fund's ability to dispose of the underlying securities and a possible decline in the value of the underlying securities during the period while the Fund seeks to assert its rights.
Security Transactions
Security transactions are accounted for on the trade date. Cost is determined and gains (losses) are based upon the specific identification method for both financial statement and federal income tax purposes.
Income Recognition
Corporate actions and dividend income are recorded on the ex-dividend date.
Interest income is recorded on an accrual basis.
The Fund may receive distributions from holdings in business development companies (BDCs), exchange traded funds (ETFs) and real estate investment trusts (REITs), which report information on the character of their distributions annually. These distributions are allocated to dividend income, capital gain and return of capital based on estimates made by the Fund's management if actual information has not yet been reported. Return of capital is recorded as a reduction of the cost basis of securities held. Management's estimates are subsequently adjusted when the actual character of the distributions is disclosed by the BDCs, ETFs and REITs, which could result in a proportionate change in return of capital to shareholders.
Awards from class action litigation are recorded as a reduction of cost basis if the Fund still owns the applicable securities on the payment date. If the Fund no longer owns the applicable securities, the proceeds are recorded as realized gains.
Expenses
General expenses of the Trust are allocated to the Fund and other funds of the Trust based upon relative net assets or other expense allocation methodologies determined by the nature of the expense. Expenses directly attributable to the Fund are charged to the Fund. Expenses directly attributable to a specific class of shares are charged to that share class.
Determination of Class Net Asset Value
All income, expenses (other than class-specific expenses, which are charged to that share class, as shown in the Statement of Operations) and realized and unrealized gains (losses) are allocated to each class of the Fund on a daily basis, based on the relative net assets of each class, for purposes of determining the net asset value of each class.
Federal Income Tax Status
The Fund intends to qualify each year as a regulated investment company under Subchapter M of the Internal Revenue Code, as amended, and will distribute substantially all of its taxable income (including net short-term capital gains), if any, for its tax year, and as such will not be subject to
Annual Report 2012
31
Columbia Dividend Income Fund
Notes to Financial Statements (continued)
May 31, 2012
federal income taxes. In addition, the Fund intends to distribute in each calendar year substantially all of its net investment income, capital gains and certain other amounts, if any, such that the Fund should not be subject to federal excise tax. Therefore, no federal income or excise tax provision is recorded.
Foreign Taxes
The Fund may be subject to foreign taxes on income, gains on investments or currency repatriation, a portion of which may be recoverable. The Fund will accrue such taxes and recoveries, as applicable, based upon its current interpretation of tax rules and regulations that exist in the markets in which it invests.
Realized gains in certain countries may be subject to foreign taxes at the Fund level, based on statutory rates. The Fund accrues for such foreign taxes on net realized and unrealized gains at the appropriate rate for each jurisdiction, as applicable.
Distributions to Shareholders
Distributions from net investment income, if any, are declared and paid each calendar quarter. Net realized capital gains, if any, are distributed along with the income dividend. Income distributions and capital gain distributions are determined in accordance with federal income tax regulations, which may differ from GAAP.
Guarantees and Indemnifications
Under the Trust's organizational documents and, in some cases, by contract, its officers and trustees are indemnified against certain liabilities arising out of the performance of their duties to the Trust or its funds. In addition, certain of the Fund's contracts with its service providers contain general indemnification clauses. The Fund's maximum exposure under these arrangements is unknown since the amount of any future claims that may be made against the Fund cannot be determined, and the Fund has no historical basis for predicting the likelihood of any such claims.
Recent Accounting Pronouncement
Fair Value Measurements
In May 2011, the Financial Accounting Standards Board (FASB) issued ASU No. 2011-04 modifying Topic 820, Fair Value Measurements. At the same time, the International Accounting Standards Board (IASB) issued International Financial Reporting Standard 13, Fair Value Measurement. The objective of the FASB and IASB is the convergence of their guidance on fair value measurements and disclosures.
Specifically, ASU No. 2011-04 requires reporting entities to disclose: i) the amounts of any transfers between Level 1 and Level 2, and the reasons for the transfers, ii) for Level 3 fair value measurements, a) quantitative information about significant unobservable inputs used, b) a description of the valuation processes used by the reporting entity and c) a narrative description of the sensitivity of the fair value measurement to changes in unobservable inputs if a change in those inputs might result in a significantly higher or lower fair value measurement. The effective date of ASU No. 2011-04 is for interim and annual periods beginning after December 15, 2011. At this time, management is evaluating the implications of this guidance and the impact it will have on the financial statement amounts and footnote disclosures, if any.
Note 3. Fees and Compensation Paid to Affiliates
Investment Management Fees
Under an Investment Management Services Agreement, Columbia Management Investment Advisers, LLC (the Investment Manager), a wholly-owned subsidiary of Ameriprise Financial, Inc. (Ameriprise Financial), determines which securities will be purchased, held or sold. Effective July 1, 2011, the management fee is an annual fee that is equal to a percentage of the Fund's average daily net assets that declines from 0.66% to 0.49% as the Fund's net assets increase. Prior to July 1, 2011, the management fee was equal to a percentage of the Fund's average daily net assets that declined from 0.70% to 0.51% as the Fund's net assets increased. The annualized effective management fee rate for the period ended May 31, 2012 and for the year ended September 30, 2011 was 0.54% and 0.58%, respectively, of the Fund's average daily net assets.
Administration Fees
Under an Administrative Services Agreement, the Investment Manager serves as the Fund Administrator. Effective July 1, 2011, the Fund pays the Fund Administrator an annual fee for administration and accounting services equal to a percentage of the Fund's average daily net assets that declines from 0.06% to 0.03% as the Fund's net assets increase. Prior to July 1, 2011, the administration fee was equal to the annual rate of 0.067% of the Fund's average daily net assets. The annualized effective administrative fee rate for the period ended May 31, 2012 and for the year ended September 30, 2011 was 0.05% and 0.06%, respectively, of the Fund's average daily net assets.
Pricing and Bookkeeping Fees
Prior to July 11, 2011, the Fund had entered into a Financial Reporting Services Agreement (the Financial Reporting
Annual Report 2012
32
Columbia Dividend Income Fund
Notes to Financial Statements (continued)
May 31, 2012
Services Agreement) with State Street Bank and Trust Company (State Street) and the Investment Manager pursuant to which State Street provided financial reporting services to the Fund. The Fund also entered into an Accounting Services Agreement (collectively with the Financial Reporting Services Agreement, the State Street Agreements) with State Street and the Investment Manager pursuant to which State Street provided accounting services to the Fund. Under the State Street Agreements, the Fund paid State Street an annual fee of $38,000 paid monthly plus an additional monthly fee based on an annualized percentage rate of average daily net assets of the Fund for the month. The aggregate fee did not exceed $140,000 per year (exclusive of out-of-pocket expenses and charges). The Fund also reimbursed State Street for certain out-of-pocket expenses and charges. Effective July 11, 2011, these services are now provided under the Administrative Services Agreement discussed above.
Compensation of Board Members
Board members are compensated for their services to the Fund as disclosed in the Statement of Operations. The Trust's eligible Trustees may participate in a Deferred Compensation Plan (the Plan) which may be terminated at any time. Obligations of the Plan will be paid solely out of the Fund's assets.
Compensation of Chief Compliance Officer
The Board has appointed a Chief Compliance Officer to the Fund in accordance with federal securities regulations. The Fund pays its pro-rata share of the expenses associated with the Chief Compliance Officer. The Fund's expenses for the Chief Compliance Officer will not exceed $15,000 per year.
Transfer Agent Fees
Under a Transfer and Dividend Disbursing Agent Agreement, Columbia Management Investment Services Corp. (the Transfer Agent), an affiliate of the Investment Manager and a wholly-owned subsidiary of Ameriprise Financial, is responsible for providing transfer agency services to the Fund. The Transfer Agent has contracted with Boston Financial Data Services (BFDS) to serve as sub-transfer agent.
The Transfer Agent receives monthly account-based service fees based on the number of open accounts and is reimbursed by the Fund for the fees and expenses the Transfer Agent pays to financial intermediaries that maintain omnibus accounts with the Fund that is a percentage of the average aggregate value of the Fund's shares maintained in each such omnibus account (other than omnibus accounts for which American Enterprise Investment Services Inc. is the broker of record or accounts where the beneficial shareholder is a customer of Ameriprise Financial Services, Inc., which are paid a per account fee). The Transfer Agent pays the fees of BFDS for services as sub-transfer agent and is not entitled to reimbursement for such fees from the Fund (with the exception of out-of-pocket fees).
The Transfer Agent also receives compensation from fees for various shareholder services and reimbursements for certain out-of-pocket fees. Class I shares do not pay transfer agent fees.
The Fund's annualized effective transfer agent fee rates as a percentage of average daily net assets of each class were as follows:
| | | Period Ended
May 31, 2012 | | Year Ended
September 30, 2011 | |
| Class A | | | 0.18 | % | | | 0.17 | % | |
| Class B | | | 0.19 | | | | 0.17 | | |
| Class C | | | 0.18 | | | | 0.17 | | |
| Class R | | | 0.18 | | | | 0.16 | | |
| Class T | | | 0.19 | | | | 0.17 | | |
| Class W | | | 0.18 | | | | 0.16 | | |
| Class Z | | | 0.18 | | | | 0.17 | | |
An annual minimum account balance fee of $20 may apply to certain accounts with a value below the Fund's initial minimum investment requirements to reduce the impact of small accounts on transfer agent fees. These minimum account balance fees are recorded as part of expense reductions in the Statement of Operations. For the period ended May 31, 2012, no minimum account balance fees were charged to accounts and for the year ended September 30, 2011, these minimum account balance fees reduced total expenses by $12,069.
Distribution and Service Fees
The Fund has an agreement with Columbia Management Investment Distributors, Inc. (the Distributor), an affiliate of the Investment Manager and a wholly-owned subsidiary of Ameriprise Financial, for distribution and shareholder services. Pursuant to Rule 12b-1 under the 1940 Act, the Board has approved, and the Fund has adopted, distribution and shareholder service plans (the Plans) which set the distribution and service fees for the Fund. These fees are calculated daily and are intended to compensate the Distributor and/or eligible selling and/or servicing agents for selling shares of the Fund and providing services to investors.
The Plans require the payment of a monthly service fee to the Distributor at the maximum annual rate of 0.25% of the average daily net assets attributable to Class A, Class B, Class C and Class W shares of the Fund. The Plans also require the payment of a monthly distribution fee to the Distributor at the maximum annual rates of 0.10%, 0.75%,
Annual Report 2012
33
Columbia Dividend Income Fund
Notes to Financial Statements (continued)
May 31, 2012
0.75%, 0.50% and 0.25% of the average daily net assets attributable to Class A, Class B, Class C, Class R and Class W shares, respectively.
The Fund may pay distribution and service fees up to a maximum annual rate of 0.35% of the Fund's average daily net assets attributable to Class A shares (comprised of up to 0.10% for distribution services and up to 0.25% for shareholder liaison services), but currently limit such fees to an aggregate fee of not more than 0.25% of the Fund's average daily net assets attributable to Class A shares.
The Fund may pay a distribution fee of up to 0.25% of the Fund's average daily net assets attributable to Class W shares and a service fee of up to 0.25% of the Fund's average daily net assets attributable to Class W shares, provided, however, that the aggregate fee shall not exceed 0.25% of the Fund's average daily net assets attributable to Class W shares.
Shareholder Services Fees
The Fund has adopted a shareholder services plan that permits it to pay for certain services provided to Class T shareholders by their selling and/or servicing agents. The Fund may pay shareholder servicing fees up to an aggregate annual rate of 0.50% of the Fund's average daily net assets attributable to Class T shares (comprised of up to 0.25% for shareholder liaison services and up to 0.25% for administrative support services). These fees are currently limited to an aggregate annual rate of not more than 0.30% of the Fund's average daily net assets attributable to Class T shares. For the period ended May 31, 2012 and the year ended September 30, 2011, the annualized effective shareholder services fee rate was 0.30% of the Fund's average daily net assets.
Sales Charges
Sales charges, including front-end charges and CDSCs, received by the Distributor for distributing Fund shares were $1,566,770 for Class A, $9,536 for Class B, $23,106 for Class C and $2,396 for Class T shares for the period ended May 31, 2012, and $2,060,727 for Class A, $33,302 for Class B, $19,863 for Class C and $1,671 for Class T shares for the year ended September 30, 2011.
Expenses Waived/Reimbursed by the Investment Manager and its Affiliates
Effective July 1, 2011, the Investment Manager and certain of its affiliates have contractually agreed to waive fees and/or reimburse expenses (excluding certain fees and expenses described below), through January 31, 2013, unless sooner terminated at the sole discretion of the Board, so that the Fund's net operating expenses, after giving effect to fees waived/expenses reimbursed and/or overdraft charges from the Fund's custodian, do not exceed the following annual rates as a percentage of the class' average daily net assets:
| Class A | | | 1.00 | % | |
| Class B | | | 1.75 | | |
| Class C | | | 1.75 | | |
| Class I | | | 0.67 | | |
| Class R | | | 1.25 | | |
| Class T | | | 1.05 | | |
| Class W | | | 1.00 | | |
| Class Z | | | 0.75 | | |
Prior to July 1, 2011, the Investment Manager and its affiliates contractually agreed to waive fees and/or reimburse expenses (excluding certain fees and expenses described below), so that the Fund's net operating expenses, after giving effect to fees waived/expenses reimbursed and any balance credits and/or overdraft charges from the Fund's custodian, did not exceed the following annual rates as a percentage of the class' average daily net assets:
| Class A | | | 1.05 | % | |
| Class B | | | 1.80 | | |
| Class C | | | 1.80 | | |
| Class I | | | 0.74 | | |
| Class R | | | 1.30 | | |
| Class T | | | 1.10 | | |
| Class W | | | 1.05 | | |
| Class Z | | | 0.80 | | |
Under the agreement, the following fees and expenses are excluded from the waiver/reimbursement commitment, and therefore will be paid by the Fund, if applicable: taxes (including foreign transaction taxes), expenses associated with investments in affiliated and non-affiliated pooled investment vehicles (including mutual funds and exchange traded funds), transaction costs and brokerage commissions, costs related to any securities lending program, dividend expenses associated with securities sold short, inverse floater program fees and expenses, transaction charges and interest on borrowed money, interest, extraordinary expenses and any other expenses the exclusion of which is specifically approved by the Board. This agreement may be modified or amended only with approval from all parties.
Annual Report 2012
34
Columbia Dividend Income Fund
Notes to Financial Statements (continued)
May 31, 2012
Note 4. Federal Tax Information
The timing and character of income and capital gain distributions are determined in accordance with income tax regulations, which may differ from GAAP because of temporary or permanent book to tax differences.
At May 31, 2012, these differences are primarily due to differing treatment for deferral/reversal of wash sale losses, Trustees' deferred compensation, capital loss carryforwards, foreign currency transactions and adjustments on certain convertible preferred securities. To the extent these differences are permanent, reclassifications are made among the components of the Fund's net assets in the Statement of Assets and Liabilities. Temporary differences do not require reclassifications. In the Statement of Assets and Liabilities the following reclassifications were made:
| Undistributed net investment income | | $ | (5,163 | ) | |
| Accumulated net realized loss | | | 427,200 | | |
| Paid-in capital | | | (422,037 | ) | |
Net investment income and net realized gains (losses), as disclosed in the Statement of Operations, and net assets were not affected by this reclassification.
The tax character of distributions paid during the periods indicated was as follows:
| | | Period Ended
May 31, 2012 | | Year Ended
September 30,
2011 | | Year Ended
September 30,
2010 | |
| Ordinary income | | $ | 68,516,379 | | | $ | 81,359,265 | | | $ | 54,664,168 | | |
Long-term capital
gains | | | — | | | | — | | | | — | | |
Short-term capital gain distributions, if any, are considered ordinary income distributions for tax purposes.
At May 31, 2012, the components of distributable earnings on a tax basis were as follows:
| Undistributed ordinary income | | $ | 28,354,054 | | |
| Undistributed accumulated long-term gain | | | — | | |
| Unrealized appreciation | | | 658,506,129 | | |
At May 31, 2012, the cost of investments for federal income tax purposes was $6,046,673,549 and the aggregate gross unrealized appreciation and depreciation based on that cost was:
| Unrealized appreciation | | $ | 851,421,475 | | |
| Unrealized depreciation | | | (192,915,346 | ) | |
| Net unrealized appreciation | | $ | 658,506,129 | | |
The following capital loss carryforward, determined at May 31, 2012, may be available to reduce taxable income arising from future net realized gains on investments, if any, to the extent permitted by the Internal Revenue Code:
| Year of Expiration | | Amount | |
| 2014 | | $ | 2,532,220 | | |
| 2017 | | | 37,045,347 | | |
| 2018 | | | 25,868,280 | | |
| Total | | $ | 65,445,847 | | |
For the period ended May 31, 2012, $16,216,375 of capital loss carryforward was utilized.
Management of the Fund has concluded that there are no significant uncertain tax positions that would require recognition in the financial statements. However, management's conclusion may be subject to review and adjustment at a later date based on factors including, but not limited to, new tax laws, regulations, and administrative interpretations (including relevant court decisions). Generally, the Fund's federal tax returns for the prior three fiscal years remain subject to examination by the Internal Revenue Service.
Note 5. Portfolio Information
The cost of purchases and proceeds from sales of securities, excluding short-term obligations, aggregated to $2,409,913,945 and $1,111,553,124, respectively, for the period ended May 31, 2012.
Note 6. Lending of Portfolio Securities
Effective July 11, 2011, the Fund has entered into a Master Securities Lending Agreement (the Agreement) with JPMorgan Chase Bank, N.A. (JPMorgan). The Agreement, which replaces the previous securities lending arrangement with State Street, authorizes JPMorgan as lending agent to lend securities to authorized borrowers in order to generate additional income on behalf of the Fund. Pursuant to the Agreement, the securities loaned are secured by cash or U.S. government securities equal to at least 100% of the market value of the loaned securities. Any additional collateral required to maintain those levels due to market fluctuations of the loaned securities is requested to be delivered the following business day. Cash collateral received is invested by the lending agent on behalf of the Fund into authorized investments pursuant to the Agreement. The investments made with the cash collateral are listed in the Portfolio of Investments. The values of such investments and any uninvested cash collateral are disclosed in the Statement of Assets and Liabilities along with the related obligation to return the collateral upon the return of the securities loaned.
Risks of delay in recovery of securities or even loss of rights in the securities may occur should the borrower of the securities fail financially. Risks may also arise to the extent that the
Annual Report 2012
35
Columbia Dividend Income Fund
Notes to Financial Statements (continued)
May 31, 2012
value of the securities loaned increases above the value of the collateral received. JPMorgan will indemnify the Fund from losses resulting from a borrower's failure to return a loaned security when due. Such indemnification does not extend to losses associated with declines in the value of cash collateral investments. The Investment Manager is not responsible for any losses incurred by the Fund in connection with the securities lending program. Loans are subject to termination by the Fund or the borrower at any time, and are, therefore, not considered to be illiquid investments.
Pursuant to the Agreement, the Fund receives income for lending its securities either in the form of fees or by earning interest on invested cash collateral, net of negotiated rebates paid to borrowers and fees paid to the lending agent for services provided and any other securities lending expenses. Net income earned from securities lending for the period ended May 31, 2012 and the year ended June 30, 2011 is disclosed in the Statement of Operations. The Fund continues to earn and accrue interest and dividends on the securities loaned.
Prior to July 11, 2011, the Fund participated in a securities lending arrangement with State Street. Each security on loan was collateralized in an amount at least equal to the market value of the securities loaned plus accrued income from the investment of collateral. The income generated by the investment of the collateral, net of any fees remitted to State Street as the lending agent and borrower rebates, was paid to the Fund.
At May 31, 2012, securities valued at $850,240,144 were on loan, secured by cash collateral of $871,639,646 (which does not reflect calls for collateral made to borrowers by JPMorgan at period end) that is partially or fully invested in short-term securities or other cash equivalents.
Note 7. Custody Credits
Prior to July 11, 2011, the Fund had an agreement with its custodian bank under which custody fees may have been reduced by balance credits. These credits are recorded as part of expense reductions on the Statement of Operations. The Fund could have invested a portion of the assets utilized in connection with the expense offset arrangement in an income-producing asset if they had not entered into such an agreement. Subsequent to this date, the Fund may invest its daily balance in an affiliated money market fund as detailed below. For the period October 1, 2010 through July 11, 2011, these credits reduced total expenses by $115.
Note 8. Affiliated Money Market Fund
Effective July 11, 2011, the Fund may invest its daily cash balances in Columbia Short-Term Cash Fund, an affiliated money market fund established for the exclusive use by the Fund and other affiliated funds. The income earned by the Fund from such investments is included as "Dividends from affiliates" in the Statement of Operations. As an investing fund, the Fund indirectly bears its proportionate share of the expenses of Columbia Short-Term Cash Fund.
Note 9. Shareholder Concentration
At May 31, 2012, two unaffiliated shareholder accounts owned an aggregate of 43.5% of the outstanding shares of the Fund. The Fund has no knowledge about whether any portion of those shares was owned beneficially by such accounts. Subscription and redemption activity by concentrated accounts may have a significant effect on the operations of the Fund.
Note 10. Line of Credit
The Fund has entered into a revolving credit facility with a syndicate of banks led by JPMorgan whereby the Fund may borrow for the temporary funding of shareholder redemptions or for other temporary or emergency purposes. The credit facility agreement, as amended, which is a collective agreement between the Fund and certain other funds managed by the Investment Manager, severally and not jointly, permits collective borrowings up to $500 million. Pursuant to a December 13, 2011 amendment to the credit facility agreement, interest is charged to each participating fund based on its borrowings at a rate equal to the higher of (i) the overnight federal funds rate plus 1.00% or (ii) the one-month LIBOR rate plus 1.00%. Each borrowing under the credit facility matures no later than 60 days after the date of borrowing. The Fund also pays a commitment fee equal to its pro rata share of the amount of the credit facility at a rate of 0.08% per annum.
Prior to December 13, 2011, interest was charged to each participating fund based on its borrowings at a rate equal to the sum of the federal funds rate plus (i) 1.25% per annum plus (ii) if one-month LIBOR exceeds the federal funds rate, the amount of such excess. The Fund also paid a commitment fee equal to its pro rata share of the amount of the credit facility at a rate of 0.10% per annum.
The Fund had no borrowings during the period ended May 31, 2012 and the year ended September 30, 2011.
Note 11. Subsequent Events
Management has evaluated the events and transactions that have occurred through the date the financial statements were issued and noted no items requiring adjustment of the financial statements or additional disclosure.
Annual Report 2012
36
Columbia Dividend Income Fund
Notes to Financial Statements (continued)
May 31, 2012
Note 12. Information Regarding Pending and Settled Legal Proceedings
In December 2005, without admitting or denying the allegations, American Express Financial Corporation (AEFC, which is now known as Ameriprise Financial, Inc. (Ameriprise Financial)) entered into settlement agreements with the Securities and Exchange Commission (SEC) and Minnesota Department of Commerce (MDOC) related to market timing activities. As a result, AEFC was censured and ordered to cease and desist from committing or causing any violations of certain provisions of the Investment Advisers Act of 1940, the Investment Company Act of 1940, and various Minnesota laws. AEFC agreed to pay disgorgement of $10 million and civil money penalties of $7 million. AEFC also agreed to retain an independent distribution consultant to assist in developing a plan for distribution of all disgorgement and civil penalties ordered by the SEC in accordance with various undertakings detailed at www.sec.gov/litigation/admin/ia-2451.pdf. Ameriprise Financial and its affiliates have cooperated with the SEC and the MDOC in these legal proceedings, and have made regular reports to the funds' Boards of Trustees.
Ameriprise Financial and certain of its affiliates have historically been involved in a number of legal, arbitration and regulatory proceedings, including routine litigation, class actions, and governmental actions, concerning matters arising in connection with the conduct of their business activities. Ameriprise Financial believes that the Funds are not currently the subject of, and that neither Ameriprise Financial nor any of its affiliates are the subject of, any pending legal, arbitration or regulatory proceedings that are likely to have a material adverse effect on the Funds or the ability of Ameriprise Financial or its affiliates to perform under their contracts with the Funds. Ameriprise Financial is required to make 10-Q, 10-K and, as necessary, 8-K filings with the Securities and Exchange Commission on legal and regulatory matters that relate to Ameriprise Financial and its affiliates. Copies of these filings may be obtained by accessing the SEC website at www.sec.gov.
There can be no assurance that these matters, or the adverse publicity associated with them, will not result in increased fund redemptions, reduced sale of fund shares or other adverse consequences to the Funds. Further, although we believe proceedings are not likely to have a material adverse effect on the Funds or the ability of Ameriprise Financial or its affiliates to perform under their contracts with the Funds, these proceedings are subject to uncertainties and, as such, we are unable to estimate the possible loss or range of loss that may result. An adverse outcome in one or more of these proceedings could result in adverse judgments, settlements, fines, penalties or other relief that could have a material adverse effect on the consolidated financial condition or results of operations of Ameriprise Financial.
Annual Report 2012
37
Columbia Dividend Income Fund
Report of Independent Registered Public Accounting Firm
To the Trustees of Columbia Funds Series Trust I and
the Shareholders of Columbia Dividend Income Fund
In our opinion, the accompanying statement of assets and liabilities, including the portfolio of investments, and the related statements of operations and of changes in net assets and the financial highlights present fairly, in all material respects, the financial position of Columbia Dividend Income Fund (the "Fund") (a series of Columbia Funds Series Trust I) at May 31, 2012, the results of its operations, the changes in its net assets and the financial highlights for each of the periods indicated, in conformity with accounting principles generally accepted in the United States of America. These financial statements and financial highlights (hereafter referred to as "financial statements") are the responsibility of the Fund's management. Our responsibility is to express an opinion on these financial statements based on our audits. We conducted our audits of these financial statements in accordance with the standards of the Public Company Accounting Oversight Board (United States). Those standards require that we plan and perform the audit to obtain reasonable assurance about whether the financial statements are free of material misstatement. An audit includes examining, on a test basis, evidence supporting the amounts and disclosures in the financial statements, assessing the accounting principles used and significant estimates made by management, and evaluating the overall financial statement presentation. We believe that our audits, which included confirmation of securities at May 31, 2012 by correspondence with the custodian, brokers and transfer agent, provide a reasonable basis for our opinion.
PricewaterhouseCoopers LLP
Minneapolis, Minnesota
July 20, 2012
Annual Report 2012
38
Columbia Dividend Income Fund
Federal Income Tax Information
(Unaudited)
For non-corporate shareholders, 98.78%, or the maximum amount allowable under the Jobs and Growth Tax Relief Reconciliation Act of 2003, of the ordinary income distributed by the Fund for the fiscal year ended May 31, 2012 may represent qualified dividend income.
89.97% of the ordinary income distributed by the Fund for the fiscal year ended May 31, 2012, qualifies for the corporate dividends received deduction.
The Fund will notify shareholders in January 2013 of amounts for use in preparing 2012 income tax returns.
Annual Report 2012
39
Columbia Dividend Income Fund
Board Members and Officers
The Trustees serve terms of indefinite duration. The names, addresses and birth years of the Trustees and Officers of the Funds in Columbia Funds Series Trust I, the year each was first elected or appointed to office, their principal business occupations during at least the last five years, the number of Funds overseen by each Trustee and other directorships they hold are shown below. Each officer listed below serves as an officer of each Fund in Columbia Funds Series Trust I.
Independent Trustees
Name, Address and Year of Birth,
Position with Funds, Year First
Elected or Appointed to Office | | Principal Occupation(s) During Past Five Years, Number of Funds in Columbia
Funds Complex Overseen by Trustee, Other Directorships Held
| |
Rodman L. Drake (Born 1943)
c/o Columbia Management Investment Advisers, LLC
225 Franklin Street
Boston, MA 02110
Trustee (since 1994) and
Chairman of the Board (since 2009) | | Independent consultant since 2010; Co-Founder of Baringo Capital LLC (private equity) from 1997 to 2008; CEO of Crystal River Capital, Inc. (real estate investment trust) from 2003 to 2010; Oversees 52; Jackson Hewitt Tax Service Inc. (tax preparation services from 2004 to 2011); Celgene Corporation (global biotechnology company); Student Loan Corporation (student loan provider from 2005 to 2010); Celgene Corporation (global biotechnology company); The Helios Funds and Brookfield Funds (closed-end funds); Crystal River Capital, Inc. from 2005 to 2010; Parsons Brinckerhoff from 1995 to 2008; and Apex Silver Mines Ltd. from 2007 to 2009 | |
|
Douglas A. Hacker (Born 1955)
c/o Columbia Management Investment Advisers, LLC
225 Franklin Street
Boston, MA 02110
Trustee (since 1996) | | Independent business executive since May 2006; Executive Vice President — Strategy of United Airlines from December 2002 to May 2006; President of UAL Loyalty Services (airline marketing company) from September 2001 to December 2002; Executive Vice President and Chief Financial Officer of United Airlines from July 1999 to September 2001. Oversees 52; Nash Finch Company (food distributor); Aircastle Limited (aircraft leasing); and SeaCube Container Leasing Ltd. (container leasing) | |
|
Janet Langford Kelly (Born 1957)
c/o Columbia Management Investment Advisers, LLC
225 Franklin Street
Boston, MA 02110
Trustee (since 1996) | | Senior Vice President, General Counsel and Corporate Secretary, ConocoPhillips (integrated energy company) since September 2007; Deputy General Counsel — Corporate Legal Services, ConocoPhillips from August 2006 to August 2007; Partner, Zelle, Hofmann, Voelbel, Mason & Gette LLP (law firm) from March 2005 to July 2006; Adjunct Professor of Law, Northwestern University from September 2004 to June 2006; Director, UAL Corporation (airline) from February 2006 to July 2006; Chief Administrative Officer and Senior Vice President, Kmart Holding Corporation (consumer goods) from September 2003 to March 2004. Oversees 52; None | |
|
Nancy T. Lukitsh (Born 1956)
c/o Columbia Management Investment Advisers, LLC
225 Franklin Street
Boston, MA 02110
Trustee (since 2011) | | Senior Vice President, Partner and Director of Marketing, Wellington Management Company, LLP (investment adviser) from 1997 to 2010; Chair, Wellington Management Investment Portfolios (commingled non-U.S. investment pools) from 2007 to 2010; Director, Wellington Trust Company, NA and other Wellington affiliates from 1997 to 2010. Oversees 52; None | |
|
William E. Mayer (Born 1940)
c/o Columbia Management Investment Advisers, LLC
225 Franklin Street
Boston, MA 02110
Trustee (since 1994) | | Partner, Park Avenue Equity Partners (private equity) since February 1999; Dean and Professor, College of Business and Management, University of Maryland from 1992 to 1996. Oversees 52; DynaVox Inc. (speech creation); Lee Enterprises (print media); WR Hambrecht + Co. (financial service provider) from 2000 to 2012; BlackRock Kelso Capital Corporation (investment company) | |
|
David M. Moffett (Born 1952)
c/o Columbia Management Investment Advisers, LLC
225 Franklin Street
Boston, MA 02110
Trustee (since 2011) | | Retired. Chief Executive Officer, Federal Home Loan Mortgage Corporation, from 2008 to 2009; Senior Adviser, Global Financial Services Group, Carlyle Group, Inc., from 2007 to 2008; Vice Chairman and Chief Financial Officer, U.S. Bancorp, from 1993 to 2007. Oversees 52; CIT Group Inc. (commercial and consumer finance); eBay Inc. (online trading community); MBIA Inc. (financial service provider); E.W. Scripps Co. (print and television media), Building Materials Holding Corp. (building materials and construction services); and University of Oklahoma Foundation. | |
|
Charles R. Nelson (Born 1942)
c/o Columbia Management Investment Advisers, LLC
225 Franklin Street
Boston, MA 02110
Trustee (since 1981) | | Retired Professor Emeritus, University of Washington, since 2011; Professor of Economics, University of Washington from January 1976 to 2011; Ford and Louisa Van Voorhis Professor of Political Economy, University of Washington from 1993 to 2011; Adjunct Professor of Statistics, University of Washington from 1980 to 2011; Associate Editor, Journal of Money Credit and Banking from 1993 to 2008; consultant on econometric and statistical matters. Oversees 52; None | |
|
John J. Neuhauser (Born 1943)
c/o Columbia Management Investment Advisers, LLC
225 Franklin Street
Boston, MA 02110
Trustee (since 1984) | | President, Saint Michael's College, since August 2007; Director or Trustee of several non-profit organizations, including Fletcher Allen Health Care, Inc.; University Professor, Boston College from November 2005 to August 2007; Academic Vice President and Dean of Faculties, Boston College from August 1999 to October 2005. Oversees 52; Liberty All-Star Equity Fund and Liberty All-Star Growth Fund (closed-end funds) | |
|
Annual Report 2012
40
Columbia Dividend Income Fund
Board Members and Officers (continued)
Independent Trustees (continued)
Name, Address and Year of Birth,
Position with Funds, Year First
Elected or Appointed to Office | | Principal Occupation(s) During Past Five Years, Number of Funds in Columbia
Funds Complex Overseen by Trustee, Other Directorships Held
| |
Patrick J. Simpson (Born 1944)
c/o Columbia Management Investment Advisers, LLC
225 Franklin Street
Boston, MA 02110
Trustee (since 2000) | | Partner, Perkins Coie LLP (law firm). Oversees 52; None | |
|
Anne-Lee Verville (Born 1945)
c/o Columbia Management Investment Advisers, LLC
225 Franklin Street
Boston, MA 02110
Trustee (since 1998) | | Retired. General Manager — Global Education Industry from 1994 to 1997, President — Application Systems Division from 1991 to 1994, Chief Financial Officer — US Marketing & Services from 1988 to 1991, and Chief Information Officer from 1987 to 1988, IBM Corporation (computer and technology). Oversees 52; Enesco Group, Inc. (producer of giftware and home and garden decor products) from 2001 to 2006 | |
|
The Statement of Additional Information includes additional information about the Trustees of the Funds and is available, without charge, upon request by calling 1-800-345-6611.
Interested Trustee
Name, Address and Year of Birth,
Position with Funds, Year First
Elected or Appointed to Office | | Principal Occupation(s) During Past Five Years, Number of Funds in Columbia
Funds Complex Overseen by Trustee, Other Directorships Held
| |
William F. Truscott (born 1960)
53600 Ameriprise Financial Center
Minneapolis, MN 55474
Senior Vice President (since 2012) | | Chairman of the Board and President, Columbia Management Investment Advisers, LLC since May 2010 and February 2012, respectively (previously President, Chairman of the Board and Chief Investment Officer, from 2001 to April 2010); Chief Executive Officer, U.S. Asset Management & President, Annuities, Ameriprise Financial, Inc. since May 2010 (previously President — U.S. Asset Management and Chief Investment Officer from 2005 to April 2010, and Senior Vice President — Chief Investment Officer, from 2001 to 2005); Director, President and Chief Executive Officer, Ameriprise Certificate Company since 2006; Director and Chief Executive Officer, Columbia Management Investment Distributors, Inc. since May 2010 and February 2012, respectively (previously Chairman of the Board and Chief Executive Officer from 2008 to April 2010); Chairman of the Board and Chief Executive Officer, RiverSource Distributors, Inc. since 2006. Oversees 208; Columbia Funds Board. | |
|
Officers
| Name, Year of Birth and Address | | Principal Occupation(s) During the Past Five Years | |
J. Kevin Connaughton (Born 1964)
225 Franklin Street
Boston, MA 02110
President (since 2009) | | Senior Vice President and General Manager — Mutual Fund Products, Columbia Management Investment Advisers, LLC since May 2010; President, Columbia Funds, since 2009, and RiverSource Funds, since May 2010 (previously Senior Vice President and Chief Financial Officer, Columbia Funds, from June 2008 to January 2009, Treasurer, Columbia Funds, from October 2003 to May 2008, and senior officer of various other affiliated funds since 2000); Managing Director, Columbia Management Advisors, LLC from December 2004 to April 2010. | |
|
Michael G. Clarke (Born 1969)
225 Franklin Street
Boston, MA 02110
Treasurer (since 2011) and Chief Financial Officer (since 2009) | | Vice President, Columbia Management Investment Advisers, LLC since May 2010; Managing Director of Fund Administration, Columbia Management Advisors, LLC, from September 2004 to April 2010; senior officer of Columbia Funds and affiliated funds since 2002. | |
|
Scott R. Plummer (Born 1959)
5228 Ameriprise Financial Center
Minneapolis, MN 55474
Senior Vice President, Assistant Secretary and Chief Legal Officer (since 2010) | | Senior Vice President, Chief Legal Officer and Assistant Secretary, Columbia Management Investment Advisers, LLC since June 2005; Vice President and Lead Chief Counsel — Asset Management, Ameriprise Financial, Inc. since May 2010 (previously Vice President and Chief Counsel — Asset Management, from 2005 to April 2010); Vice President, Chief Counsel and Assistant Secretary, Columbia Management Investment Distributors, Inc. since 2008; Vice President, General Counsel and Secretary, Ameriprise Certificate Company since 2005; Chief Counsel, RiverSource Distributors, Inc. since 2006; Vice President, General Counsel and Secretary, RiverSource Funds since December 2006; Senior Vice President, Secretary and Chief Legal Officer, Columbia Funds, since May 2010. | |
|
Annual Report 2012
41
Columbia Dividend Income Fund
Board Members and Officers (continued)
Officers (continued)
| Name, Year of Birth and Address | | Principal Occupation(s) During the Past Five Years | |
William F. Truscott (Born 1960)
53600 Ameriprise Financial Center
Minneapolis, MN 55474
Senior Vice President (since 2010) | | Chairman of the Board and President, Columbia Management Investment Advisers, LLC since May 2010 and February 2012, respectively (previously President, Chairman of the Board and Chief Investment Officer, from 2001 to April 2010); Chief Executive Officer, U.S. Asset Management & President, Annuities, Ameriprise Financial, Inc. since May 2010 (previously President — U.S. Asset Management and Chief Investment Officer from 2005 to April 2010); Director, President and Chief Executive Officer, Ameriprise Certificate Company since 2006; Director and Chief Executive Officer, Columbia Management Investment Distributors, Inc. since May 2010 and February 2012, respectively (previously Chairman of the Board and Chief Executive Officer from 2008 to April 2010); Chairman of the Board and Chief Executive Officer, RiverSource Distributors, Inc. since 2006. | |
|
Thomas P. McGuire (Born 1972)
225 Franklin Street
Boston, MA 02110
Chief Compliance Officer (since 2012) | | Vice President — Asset Management Compliance, Columbia Management Investment Advisers, LLC since 2010; Chief Compliance Officer, Ameriprise Certificate Company, since September 2010; Compliance Executive, Bank of America, 2005-2010. | |
|
Colin Moore (Born 1958)
225 Franklin Street
Boston, MA 02110
Senior Vice President (since 2010) | | Director and Chief Investment Officer, Columbia Management Investment Advisers, LLC since May 2010; Manager, Managing Director and Chief Investment Officer of Columbia Management Advisors, LLC from 2007 to April 2010; Head of Equities, Columbia Management Advisors, LLC from 2002 to 2007. | |
|
Amy Johnson (Born 1965)
5228 Ameriprise Financial Center
Minneapolis, MN 55474
Vice President (since 2010) | | Senior Vice President and Chief Operating Officer, Columbia Management Investment Advisers, LLC since May 2010 (previously Chief Administrative Officer, from 2009 until April 2010, Vice President — Asset Management and Trust Company Services, from 2006 to 2009, and Vice President — Operations and Compliance from 2004 to 2006). | |
|
Joseph F. DiMaria (Born 1968)
225 Franklin Street
Boston, MA 02110
Vice President (since 2011) and Chief Accounting Officer (since 2008) | | Vice President, Mutual Fund Administration, Columbia Management Investment Advisers, LLC, since May 2010; Director of Fund Administration, Columbia Management Advisors, LLC from January 2006 to April 2010; Head of Tax/Compliance and Assistant Treasurer, Columbia Management Advisors, LLC, from November 2004 to December 2005. | |
|
Stephen T. Welsh (born 1957)
225 Franklin Street
Boston, MA 02110
Vice President (since 2006) | | President and Director, Columbia Management Investment Services Corp. since May 2010; President and Director, Columbia Management Services, Inc. from July 2004 to April 2010; Managing Director, Columbia Management Distributors, Inc. from August 2007 to April 2010. | |
|
Paul D. Pearson (born 1956)
10468 Ameriprise Financial Center
Minneapolis, MN 55474
Vice President and Assistant Treasurer (since 2011) | | Vice President, Investment Accounting, Columbia Management Investment Advisers, LLC, since May 2010; Vice President, Managed Assets, Investment Accounting, Ameriprise Financial Corporation. | |
|
Paul B. Goucher (born 1968)
5228 Ameriprise Financial Center
Minneapolis, MN 55474
Vice President and Assistant Secretary (since 2010) | | Vice President and Chief Counsel of Ameriprise Financial since January 2010 (formerly Vice President and Group Counsel from November 2008 to January 2010); Director, Managing Director and General Counsel of J. & W. Seligman & Co. Incorporated (Seligman) from July 2008 to November 2008 and Managing Director and Associate General Counsel of Seligman from January 2005 to July 2008. | |
|
Christopher O. Petersen (born 1970)
5228 Ameriprise Financial Center
Minneapolis, MN 55474
Vice President (since 2010) and Secretary (since 2011) | | Vice President and Chief Counsel, Ameriprise Financial since January 2010 (formerly Vice President and Group Counsel or Counsel from April 2004 to January 2010); Assistant Secretary of RiverSource Funds since January 2007; officer of Columbia Funds and affiliated funds since 2007. | |
|
Michael E. DeFao (born 1968)
225 Franklin Street
Boston, MA 02110
Vice President and Assistant Secretary (since 2011) | | Vice President and Chief Counsel, Ameriprise Financial since May 2010; Associate General Counsel, Bank of America from June 2005 to April 2010. | |
|
Annual Report 2012
42
This page intentionally left blank.
Annual Report 2012
43
This page intentionally left blank.
Annual Report 2012
44
Columbia Dividend Income Fund
Important Information About This Report
Each fund mails one shareholder report to each shareholder address. If you would like more than one report, please call shareholder services at 800.345.6611 and additional reports will be sent to you.
The policy of the Board is to vote the proxies of the companies in which each fund holds investments consistent with the procedures as stated in the Statement of Additional Information (SAI). You may obtain a copy of the SAI without charge by calling 800.345.6611; contacting your financial intermediary; visiting columbiamanagement.com; or searching the website of the Securities and Exchange Commission (SEC) at http://www.sec.gov. Information regarding how each fund voted proxies relating to portfolio securities is filed with the SEC by August 31 for the most recent 12-month period ending June 30 of that year, and is available without charge by visiting columbiamanagement.com; or searching the website of the SEC at sec.gov.
Each fund files a complete schedule of portfolio holdings with the SEC for the first and third quarters of each fiscal year on Form N-Q. Each fund's Form N-Q is available on the SEC's website at sec.gov and may be reviewed and copied at the SEC's Public Reference Room in Washington, D.C. Information on the operation of the Public Reference Room may be obtained by calling 800.SEC.0330. Each fund's complete schedule of portfolio holdings, as filed on Form N-Q, can also be obtained without charge, upon request, by calling 800.345.6611.
Annual Report 2012
45

Columbia Dividend Income Fund
P.O. Box 8081
Boston, MA 02266-8081
columbiamanagement.com
This information is for use with concurrent or prior delivery of a fund prospectus. Please read and consider the investment objectives, risks, charges and expenses for any fund carefully before investing. For a prospectus which contains this and other important information about the fund go to columbiamanagement.com. The fund is distributed by Columbia Management Investment Distributors, Inc., member FINRA, and managed by Columbia Management Investment Advisers, LLC.
© 2012 Columbia Management Investment Advisers, LLC. All rights reserved.
C-1391 D (7/12)
Annual Report
May 31, 2012

Columbia High Yield Municipal Fund
Not FDIC insured • No bank guarantee • May lose value
Columbia High Yield Municipal Fund
President's Message
 Dear Shareholders,
A stock market rally that commenced in the fourth quarter of 2011 continued into 2012 in the United States and around the world, as all major market regions generated double-digit returns for the three-month period ended March 31, 2012. Volatility declined sharply as European debt fears quieted somewhat and public sentiment improved. Returns in developed countries were buoyed by strong results in Germany, Belgium, Austria and the Nordic markets of Denmark, Finland, Norway and Sweden. Under the cloud of its own mounting debt problem, Spain was the only eurozone country to deliver a negative return during the three-month period. Solid economic growth and accommodative monetary policy helped boost gains in emerging markets. The rally in U.S. equities was largely driven by an expansion in "multiples" — an increase in stock prices relative to their earnings. By the end of the first quarter of 2012, stocks no longer appeared as cheap as they were late in 2011. Bonds lagged stocks during the first quarter as investors responded to signs of an improved environment with a greater appetite for risk.
Concerns around the health of the global economy were centered in news headlines focusing on Washington D.C., Europe, China and the Middle East. In the United States, economic indicators remained mixed but generally indicated support for slow, sustainable economic growth. European policymakers have made progress in containing the eurozone debt crisis, though they still have not solved the issue of long-term solvency. The European Central Bank has lowered interest rates and flooded the financial system with liquidity that may provide breathing space for a restructuring of fiscal balance sheets. These massive infusions of liquidity may whet the appetite for risk from investors around the world. However, they have delayed a true reckoning with the European financial situation, as concerns about Greece, Spain and Portugal continue to cloud the outlook. The structural challenges that persist in the developed world, and slower growth in emerging market economies, leave the global economy in a fragile state. Domestic demand, combined with slowing inflationary trends, has also helped to shore up emerging market economies. Joblessness remains relatively low and monetary conditions remain easy.
Despite the challenges and surprises of 2011, we see pockets of strength — and as a result, attractive opportunities — both here and abroad for 2012. We hope to help you capitalize on these opportunities with various articles in our 2012 Perspectives, which is available via the Market Insights tab at columbiamanagement.com. This publication showcases the strong research capabilities and experienced investment teams of Columbia Management and offers a diverse array of investment ideas based on our five key themes for 2012.
Other information and resources available at columbiamanagement.com include:
> detailed up-to-date fund performance and portfolio information
> economic analysis and market commentary
> quarterly fund commentaries
> Columbia Management Investor, our award-winning quarterly newsletter for shareholders
Thank you for your continued support of the Columbia Funds. We look forward to serving your investment needs for many years to come.
Best Regards,

J. Kevin Connaughton
President, Columbia Funds
Investors should consider the investment objectives, risks, charges and expenses of a mutual fund carefully before investing. For a free prospectus, which contains this and other important information about the funds, visit columbiamanagement.com. The prospectus should be read carefully before investing.
Columbia Funds are distributed by Columbia Management Investment Distributors, Inc., member FINRA, and managed by Columbia Management Investment Advisers, LLC.
© 2012 Columbia Management Investment Advisers, LLC. All rights reserved.
Annual Report 2012
Columbia High Yield Municipal Fund
Table of Contents
| Performance Overview | | | 2 | | |
|
| Manager Discussion of Fund Performance | | | 4 | | |
|
| Understanding Your Fund's Expenses | | | 6 | | |
|
| Portfolio of Investments | | | 7 | | |
|
| Statement of Assets and Liabilities | | | 29 | | |
|
| Statement of Operations | | | 31 | | |
|
| Statement of Changes in Net Assets | | | 32 | | |
|
| Financial Highlights | | | 34 | | |
|
| Notes to Financial Statements | | | 38 | | |
|
Report of Independent Registered
Public Accounting Firm | | | 45 | | |
|
| Federal Income Tax Information | | | 46 | | |
|
| Board Members and Officers | | | 47 | | |
|
Board Consideration and Approval of
Advisory Agreement | | | 50 | | |
|
| Important Information About This Report | | | 57 | | |
|
Fund Investment Manager
Columbia Management Investment
Advisers, LLC
225 Franklin Street
Boston, MA 02110
Fund Distributor
Columbia Management Investment
Distributors, Inc.
225 Franklin Street
Boston, MA 02110
Fund Transfer Agent
Columbia Management Investment
Services Corp.
P.O. Box 8081
Boston, MA 02266-8081
For more information about any of the funds, please visit columbiamanagement.com or call 800.345.6611. Customer Service Representatives are available to answer your questions Monday through Friday from 8 a.m. to 8 p.m. Eastern time.
The views expressed in this report reflect the current views of the respective parties. These views are not guarantees of future performance and involve certain risks, uncertainties and assumptions that are difficult to predict, so actual outcomes and results may differ significantly from the views expressed. These views are subject to change at any time based upon economic, market or other conditions and the respective parties disclaim any responsibility to update such views. These views may not be relied on as investment advice and, because investment decisions for a Columbia Fund are based on numerous factors, may not be relied on as an indication of trading intent on behalf of any particular Columbia Fund. References to specific securities should not be construed as a recommendation or investment advice.
Annual Report 2012
Columbia High Yield Municipal Fund
Performance Overview
Performance Summary
> For the 11-month period that ended May 31, 2012, Columbia High Yield Municipal Fund (the fund) Class A shares returned 14.19% excluding sales charge.
> The fund beat its primary benchmark, the Barclays High Yield Municipal Bond Index, and its blended benchmark (60% Barclays High Yield Municipal Bond Index, 40% Barclays Municipal Bond Index), which returned 13.30% and 11.99% respectively.
> Positive security selection and sector allocations contributed to the fund's relative outperformance.
Average Annual Total Returns (%) (for period ended May 31, 2012)
| | | Inception | | 11 Months
cumulative | | 1 Year | | 5 Years | | 10 Years | |
| Class A | | 07/31/00 | | | | | | | | | | | | | | | | | |
| Excluding Sales Charges | | | | | | | 14.19 | | | | 15.55 | | | | 3.59 | | | | 4.56 | | |
| Including Sales Charges | | | | | | | 8.75 | | | | 10.01 | | | | 2.59 | | | | 4.05 | | |
| Class B* | | 07/15/02 | | | | | | | | | | | | | | | | | |
| Excluding Sales Charges | | | | | | | 13.41 | | | | 14.68 | | | | 2.82 | | | | 3.78 | | |
| Including Sales Charges | | | | | | | 8.41 | | | | 9.68 | | | | 2.49 | | | | 3.78 | | |
| Class C* | | 07/15/02 | | | | | | | | | | | | | | | | | |
| Excluding Sales Charges | | | | | | | 13.56 | | | | 14.86 | | | | 2.98 | | | | 3.94 | | |
| Including Sales Charges | | | | | | | 12.56 | | | | 13.86 | | | | 2.98 | | | | 3.94 | | |
| Class Z | | 03/05/84 | | | 14.39 | | | | 15.77 | | | | 3.80 | | | | 4.78 | | |
| Barclays High Yield Municipal Bond Index | | | | | | | 13.30 | | | | 15.42 | | | | 3.51 | | | | 6.38 | ** | |
| Blended Benchmark | | | | | | | 11.99 | | | | 13.40 | | | | 4.53 | | | | 5.82 | ** | |
Returns for Class A are shown with and without the maximum initial sales charge of 4.75%. Returns for Class B are shown with and without the applicable contingent deferred sales charge (CDSC) of 5.00% in the first year, declining to 1.00% in the sixth year and eliminated thereafter. Returns for Class C are shown with and without the 1.00% CDSC for the first year only. The fund's other classes are not subject to sales charges and have limited eligibility. Please see the fund's prospectuses for details. Performance for different share classes will vary based on differences in sales charges and fees associated with each class. All results shown assume reinvestment of distributions during the period. Returns do not reflect the deduction of taxes that a shareholder may pay on fund distributions or on the redemption of fund shares. Performance results reflect the effect of any fee waivers or reimbursements of fund expenses by Columbia Management Investment Advisers, LLC and/or any of its affiliates. Absent these fee waivers or expense reimbursement arrangements, performance results would have been lower.
The performance information shown represents past performance and is not a guarantee of future results. The investment return and principal value of your investment will fluctuate so that your shares, when redeemed, may be worth more or less than their original cost. Current performance may be lower or higher than the performance information shown. You may obtain performance information current to the most recent month-end by contacting your financial intermediary, visiting columbiamanagement.com or calling 800.345.6611.
* The returns shown for periods prior to the share class inception date (including returns since inception if shown, which are since fund inception) include the returns of the fund's oldest share class. These returns are adjusted to reflect any higher class-related operating expenses of the newer share classes, as applicable. Please visit columbiamanagement.com/mutual-funds/appended-performance for more information.
** Inception date of the Barclays High Yield Municipal Bond Index and the Blended Benchmark is 05/30/03. 10 Years data is as of that date.
The Barclays High Yield Municipal Bond Index is comprised of bonds with maturities greater than one-year, having a par value of at least $3 million issued as part of a transaction size greater than $20 million, and rated no higher than "BB+" or equivalent by any of the three principal rating agencies.
The Blended Benchmark is a custom composite established by the Advisor, consisting of a 60% weighting of the Barclays High Yield Municipal Bond Index and a 40% weighting of the Barclays Municipal Bond Index. The Barclays Municipal Bond Index is considered representative of the broad market for investment-grade, tax-exempt bonds with a maturity of at least one year.
Indices are not available for investment, are not professionally managed and do not reflect sales charges, fees, brokerage commissions, taxes or other expenses of investing. Securities in the fund may not match those in an index.
Annual Report 2012
2
Columbia High Yield Municipal Fund
Performance Overview (continued)
Performance of a Hypothetical $10,000 Investment (June 1, 2002 – May 31, 2012)
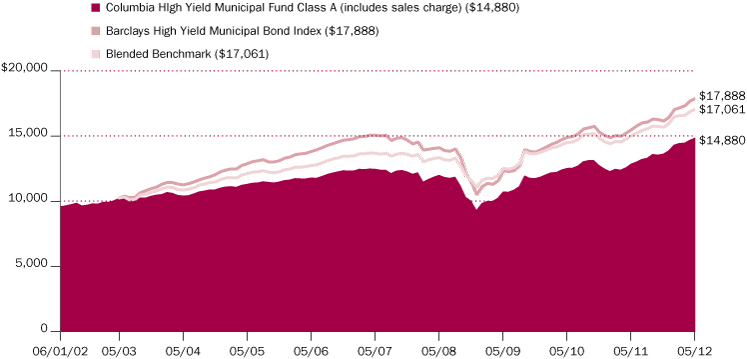
The chart above shows the change in value of a hypothetical $10,000 investment in Class A shares of Columbia High Yield Municipal Fund during the stated time period, and does not reflect the deduction of taxes that a shareholder may pay on fund distributions or on the redemption of fund shares. A $10,000 investment in the fund since 06/01/02 appreciated to $10,252 on 05/30/03, the inception date of the Barclays High Yield Municipal Bond Index and the Blended Benchmark. For comparison with these indices, the chart shows them at the same value as the fund at the indices' inception date.
Annual Report 2012
3
Columbia High Yield Municipal Fund
Manager Discussion of Fund Performance
The Board of Trustees for Columbia High Yield Municipal Fund has approved the change of the fund's fiscal year end from June 30 to May 31. As a result, this report covers the 11-month period since the last annual report. The next report you receive will be for the six-month period from June 1, 2012 through November 30, 2012.
For the 11-month period that ended May 31, 2012, the fund's Class A shares returned 14.19% without sales charge. It outperformed both its primary benchmark, the Barclays High Yield Municipal Bond Index, and its blended benchmark (60% Barclays High Yield Municipal Bond Index, 40% Barclays Municipal Bond Index), which returned 13.30% and 11.99% respectively. Positive security selection and sector allocations contributed to the fund's outperformance.
Mixed Economic Backdrop
Early in the period, Europe's debt problems and wrangling in Washington over the federal budget and national debt dominated world headlines. U.S. economic news was lackluster, and job numbers were disappointing. Both economic and job growth picked up late in 2011 but disappointed again in the final months of the period. First-quarter economic growth, as measured by gross domestic product, slipped to 1.9% and expectations for second-quarter growth were no higher. On a positive note, manufacturing activity continued to expand and the housing outlook brightened, as year-over-year sales picked up, inventories tightened and prices stabilized somewhat.
Favorable Environment for Municipal Bonds
Concerns about defaults eased over the year, benefiting municipal bonds. In addition, municipal bond rates fell along with Treasury yields, as Europe's mounting sovereign debt problems and slowing economic growth in the United States triggered an investor flight to safety. As yields fell, bond prices rallied. Further bolstering returns, demand for municipal bonds outstripped supply, which remained tight, especially on the high-yield side. Municipal bond yields exceeded those on Treasuries, attracting investors searching for additional yield. Government proposals to remove tax-exempt provisions for municipal bonds may have also attracted investors who hoped the tax benefits would be grandfathered. Against this backdrop, the best municipal bond performers were long-maturity and low quality issues.
Gains from Sector and Maturity Positioning
The fund benefited versus both benchmarks from its sector allocations. An underweight — along with positive security selection — in the airline sector, which declined 18% within the Barclays High Yield Municipal Index, was especially helpful. More specifically, an underweight in American Airlines bonds aided results, as the company's 2011 bankruptcy filing hurt the issues' returns. An overweight and strong security selection in the hospital and education sectors also helped, as the sectors climbed between 15% and 17% within the Barclays index. Having a sizable overweight — over 50% of assets — in bonds with maturities of 22 years or more provided an added boost, as longer-term bonds outperformed shorter-maturity issues by a sizable margin. Among the best individual contributors was a 30-year, single A rated zero coupon sales tax bond issued by Miami/Dade County.
Portfolio Management
Chad Farrington, CFA
Quality Breakdown (%)
(at May 31, 2012) | |
| AAA | | | 0.6 | | |
| AA | | | 6.7 | | |
| A | | | 17.4 | | |
| BBB | | | 30.4 | | |
| BB | | | 7.3 | | |
| B | | | 7.4 | | |
| CCC | | | 0.1 | | |
| Not rated | | | 30.1 | | |
Percentages indicated are based upon total fixed income securities (excluding money market funds).
Bond ratings apply to the underlying holdings of the Fund and not the Fund itself and are divided into categories ranging from AAA (highest) to D (lowest), and are subject to change. The ratings shown are determined by using the middle rating of Moody's, S&P, and Fitch after dropping the highest and lowest available ratings. When a rating from only two agencies is available, the lower rating is used. When a rating from only one agency is available, that rating is used. When a bond is not rated by one of these agencies, it is designated as Not rated. Credit ratings are subjective opinions and not statements of fact.
Annual Report 2012
4
Columbia High Yield Municipal Fund
Manager Discussion of Fund Performance (continued)
Strong Security Selection within BBB Sector
The fund maintained a relatively high quality bias with close to 30% of assets in BBB rated issues. BBB rated bonds are not included in the Barclays High Yield Municipal Index and account for just under 4% in the blended index. Strong security selection resulted in returns of 16% to 18%, which beat the 14% advance of the BBB bonds in the blended index. The fund's BBB gains also outpaced those of the high-yield and non-rated paper in both the fund and blended index.
Disappointments from Tobacco and Cash Allocations
A sizable underweight in the tobacco sector hampered relative results, as the sector led the Barclays High Yield Municipal Index with a 21% return. Tobacco bonds reached about 20% of the index by period end, but remained a modest position within the fund. The fund's tobacco sector returns also lagged those in the index. A cash position that exceeded 10% at times during the period further detracted from relative performance. Some individual securities hindered performance, including bonds issued by Tolomato Community Development District, a real estate development in Florida that defaulted during the period, and Linden Ponds, a Continuing Care Retirement Community (CCRC), which went through a restructuring. The Tolomato bonds were sold.
Cautious Outlook and Positioning
Given expectations for slow but steady economic growth and continued low interest rates, we think credit fundamentals in the high-yield municipal bond market will likely remain stable. However, with interest rates near historical lows, we remain cautious. At period end, the fund was somewhat defensively positioned with over 9% of assets in cash and lower duration (less sensitivity to interest rate changes) than the Barclays High Yield Municipal Index. Over the year, we put some cash to work in short-maturity (nine- to 11- years), high quality bonds and added modestly to the tobacco sector. Going forward, we plan to continue looking selectively for opportunities to add yield.
Top Ten States (%)
(at May 31, 2012) | |
| California | | | 13.6 | | |
| Illinois | | | 10.0 | | |
| Florida | | | 9.5 | | |
| Texas | | | 7.6 | | |
| Pennsylvania | | | 4.3 | | |
| Missouri | | | 4.1 | | |
| Michigan | | | 3.5 | | |
| Massachusetts | | | 3.3 | | |
| Georgia | | | 3.0 | | |
| Kansas | | | 2.9 | | |
Percentages indicated are based upon total investments (excluding Money Market Funds).
Annual Report 2012
5
Columbia High Yield Municipal Fund
Understanding Your Fund's Expenses
(Unaudited)
As an investor, you incur two types of costs. There are transaction costs, which generally include sales charges on purchases and may include redemption fees. There are also ongoing costs, which generally include management fees, distribution and service (Rule 12b-1) fees, and other fund expenses. The following information is intended to help you understand your ongoing costs (in dollars) of investing in the Fund and to help you compare these costs with the ongoing costs of investing in other mutual funds.
Analyzing Your Fund's Expenses
To illustrate these ongoing costs, we have provided examples and calculated the expenses paid by investors in each share class of the Fund during the period. The actual and hypothetical information in the table is based on an initial investment of $1,000 at the beginning of the period indicated and held for the entire period. Expense information is calculated two ways and each method provides you with different information. The amount listed in the "Actual" column is calculated using the Fund's actual operating expenses and total return for the period. You may use the Actual information, together with the amount invested, to estimate the expenses that you paid over the period. Simply divide your account value by $1,000 (for example, an $8,600 account value divided by $1,000 = 8.6), then multiply the results by the expenses paid during the period under the Actual column. The amount listed in the "Hypothetical" column assumes a 5% annual rate of return before expenses (which is not the Fund's actual return) and then applies the Fund's actual expense ratio for the period to the hypothetical return. You should not use the hypothetical account values and expenses to estimate either your actual account balance at the end of the period or the expenses you paid during the period. See "Compare With Other Funds" below for details on how to use the hypothetical data.
Compare With Other Funds
Since all mutual funds are required to include the same hypothetical calculations about expenses in shareholder reports, you can use this information to compare the ongoing cost of investing in the Fund with other funds. To do so, compare the hypothetical example with the 5% hypothetical examples that appear in the shareholder reports of other funds. As you compare hypothetical examples of other funds, it is important to note that hypothetical examples are meant to highlight the ongoing costs of investing in a fund only and do not reflect any transaction costs, such as sales charges, or redemption or exchange fees. Therefore, the hypothetical calculations are useful in comparing ongoing costs only, and will not help you determine the relative total costs of owning different funds. If transaction costs were included in these calculations, your costs would be higher.
December 1, 2011 – May 31, 2012
| | | Account Value at the Beginning
of the Period ($) | | Account Value at the End of the
Period ($) | | Expenses Paid During the
Period ($) | | Fund's Annualized
Expense Ratio (%) | |
| | | Actual | | Hypothetical | | Actual | | Hypothetical | | Actual | | Hypothetical | | Actual | |
| Class A | | | 1,000.00 | | | | 1,000.00 | | | | 1,091.60 | | | | 1,020.90 | | | | 4.29 | | | | 4.14 | | | | 0.82 | | |
| Class B | | | 1,000.00 | | | | 1,000.00 | | | | 1,087.70 | | | | 1,017.25 | | | | 8.09 | | | | 7.82 | | | | 1.55 | | |
| Class C | | | 1,000.00 | | | | 1,000.00 | | | | 1,088.50 | | | | 1,018.00 | | | | 7.31 | | | | 7.06 | | | | 1.40 | | |
| Class Z | | | 1,000.00 | | | | 1,000.00 | | | | 1,092.80 | | | | 1,022.00 | | | | 3.14 | | | | 3.03 | | | | 0.60 | | |
Expenses paid during the period are equal to the annualized expense ratio for each class as indicated above, multiplied by the average account value over the period and then multiplied by the number of days in the Fund's most recent fiscal half year and divided by 366.
Expenses do not include fees and expenses incurred indirectly by the Fund from the underlying funds in which the Fund may invest (also referred to as "acquired funds"), including affiliated and non-affiliated pooled investment vehicles (including mutual funds and exchange traded funds).
Had Columbia Management Investment Advisers, LLC and/or certain of its affiliates not waived/reimbursed certain fees and expenses, account value at the end of the period would have been reduced.
Annual Report 2012
6
Columbia High Yield Municipal Fund
Portfolio of Investments
May 31, 2012
(Percentages represent value of investments compared to net assets)
Municipal Bonds 88.5%
Issue
Description | | Coupon
Rate | | Principal
Amount ($) | | Value ($) | |
| Alabama 0.4% | |
Camden Industrial Development Board
Prerefunded 12/01/13 Revenue Bonds
Weyerhaeuser Co.
Series 2003B AMT(a)
12/01/24 | | | 6.375 | % | | | 275,000 | | | | 300,072 | | |
Courtland Industrial Development Board(a)
Refunding Revenue Bonds
International Paper Co. Projects
Series 2003B AMT
08/01/25 | | | 6.250 | % | | | 2,000,000 | | | | 2,098,180 | | |
Series 2005A AMT
06/01/25 | | | 5.200 | % | | | 1,000,000 | | | | 1,028,760 | | |
| Total | | | | | | | 3,427,012 | | |
| Alaska 0.7% | |
City of Koyukuk
Revenue Bonds
Tanana Chiefs Conference Health Care
Series 2011(b)
10/01/41 | | | 7.750 | % | | | 5,000,000 | | | | 5,359,350 | | |
Northern Tobacco Securitization Corp.
Asset Backed Revenue Bonds
Series 2006A
06/01/46 | | | 5.000 | % | | | 1,000,000 | | | | 751,030 | | |
| Total | | | | | | | 6,110,380 | | |
| Arizona 1.4% | |
Arizona Health Facilities Authority
Refunding Revenue Bonds
Phoenix Memorial Hospital
Series 1991(c)(d)
06/01/12 | | | 8.125 | % | | | 1,803,743 | | | | 18 | | |
Maricopa County Pollution Control Corp.
Revenue Bonds
El Paso Electric Co. Project
Series 2009B
04/01/40 | | | 7.250 | % | | | 3,600,000 | | | | 4,295,628 | | |
Pima County Industrial Development Authority
Revenue Bonds
American Charter Schools Foundation
Series 2007A
07/01/38 | | | 5.625 | % | | | 3,840,000 | | | | 3,451,277 | | |
Surprise Municipal Property Corp.
Revenue Bonds
Series 2007
04/01/32 | | | 4.900 | % | | | 2,000,000 | | | | 2,030,640 | | |
Yavapai County Industrial Development Authority
Revenue Bonds
Yavapai Regional Medical Center
Series 2008B
08/01/37 | | | 5.625 | % | | | 3,500,000 | | | | 3,595,900 | | |
| Total | | | | | | | 13,373,463 | | |
Municipal Bonds (continued)
Issue
Description | | Coupon
Rate | | Principal
Amount ($) | | Value ($) | |
| Arkansas 0.1% | |
City of Camden
Refunding Revenue Bonds
International Paper Co. Project
Series 2004A AMT(a)
11/01/18 | | | 5.000 | % | | | 250,000 | | | | 266,625 | | |
City of Fort Smith
Refunding Revenue Bonds
Sales & Use Tax
Series 2012
05/01/26 | | | 3.600 | % | | | 955,000 | | | | 974,501 | | |
| Total | | | | | | | 1,241,126 | | |
| California 12.3% | |
Agua Caliente Band of Cahuilla Indians
Revenue Bonds
Series 2003(b)(e)
07/01/18 | | | 6.000 | % | | | 2,000,000 | | | | 1,947,060 | | |
Cabazon Band Mission Indians(b)(c)(d)
Revenue Bonds
Series 2004
06/30/12 | | | 13.000 | % | | | 405,000 | | | | 243,000 | | |
| 10/01/15 | | | 8.375 | % | | | 560,000 | | | | 351,165 | | |
| 10/01/19 | | | 8.750 | % | | | 2,785,000 | | | | 1,702,860 | | |
Series 2010
10/01/20 | | | 8.375 | % | | | 1,420,000 | | | | 1,464,446 | | |
California Housing Finance Agency(a)
Revenue Bonds
Home Mortgage
Series 2006K AMT
08/01/26 | | | 4.625 | % | | | 5,000,000 | | | | 4,956,150 | | |
Series 2008K AMT
08/01/33 | | | 5.550 | % | | | 2,545,000 | | | | 2,623,844 | | |
California Infrastructure & Economic Development Bank
Revenue Bonds
Broad Museum Project
Series 2011A
06/01/21 | | | 5.000 | % | | | 5,000,000 | | | | 6,224,750 | | |
California Municipal Finance Authority(a)(c)
Revenue Bonds
UTS Renewable Energy-Waste Water
Series 2011 AMT
12/01/15 | | | 3.950 | % | | | 1,415,000 | | | | 1,415,637 | | |
| 12/01/32 | | | 7.500 | % | | | 1,925,000 | | | | 2,007,371 | | |
California State Department of Veterans Affairs
Revenue Bonds
Series 2012A
12/01/25 | | | 3.500 | % | | | 5,000,000 | | | | 5,071,100 | | |
California State Public Works Board
Revenue Bonds
Various Capital Projects
Subordinated Series 2009I-1
11/01/34 | | | 6.375 | % | | | 5,000,000 | | | | 5,987,650 | | |
The accompanying Notes to Financial Statements are an integral part of this statement.
Annual Report 2012
7
Columbia High Yield Municipal Fund
Portfolio of Investments (continued)
May 31, 2012
Municipal Bonds (continued)
Issue
Description | | Coupon
Rate | | Principal
Amount ($) | | Value ($) | |
California Statewide Communities Development Authority
Revenue Bonds
American Baptist Homes West
Series 2010
10/01/39 | | | 6.250 | % | | | 2,750,000 | | | | 2,939,502 | | |
Aspire Public Schools
Series 2010
07/01/46 | | | 6.125 | % | | | 5,000,000 | | | | 5,346,650 | | |
California Statewide Communities Development Authority(c)
Revenue Bonds
San Francisco Art Institute
Series 2002
04/01/32 | | | 7.375 | % | | | 250,000 | | | | 235,258 | | |
City of Carson
Special Assessment Bonds
District No. 92-1
Series 1992
09/02/22 | | | 7.375 | % | | | 100,000 | | | | 100,448 | | |
City of Lincoln
Prerefunded 09/01/13 Special Tax Bonds
Community Facilities District
Series 2004-1
09/01/20 | | | 5.750 | % | | | 450,000 | | | | 488,327 | | |
| 09/01/24 | | | 5.900 | % | | | 445,000 | | | | 483,728 | | |
City of Upland
Certificate of Participation
San Antonio Community Hospital
Series 2011
01/01/41 | | | 6.500 | % | | | 5,000,000 | | | | 5,743,650 | | |
County of Sacramento
Revenue Bonds
Subordinated Series 2009D
07/01/35 | | | 6.000 | % | | | 2,500,000 | | | | 2,867,725 | | |
Empire Union School District
Special Tax Bonds
Communities Facilities District No. 1987-1
Series 2002A (AMBAC)(f)
10/01/21 | | | 0.000 | % | | | 1,665,000 | | | | 1,069,230 | | |
Foothill-Eastern Transportation Corridor Agency
Refunding Revenue Bonds
Series 1999
01/15/40 | | | 5.750 | % | | | 3,000,000 | | | | 3,000,480 | | |
Foothill-Eastern Transportation Corridor Agency(f)
Refunding Revenue Bonds
Capital Appreciation
Series 1999
01/15/30 | | | 0.000 | % | | | 11,520,000 | | | | 4,029,696 | | |
Golden State Tobacco Securitization Corp.
Asset-Backed Revenue Bonds
Senior Series 2007A-1
06/01/47 | | | 5.125 | % | | | 5,000,000 | | | | 3,597,900 | | |
Prerefunded 06/01/13 Revenue Bonds
Series 2003A-1
06/01/39 | | | 6.750 | % | | | 200,000 | | | | 212,808 | | |
Municipal Bonds (continued)
Issue
Description | | Coupon
Rate | | Principal
Amount ($) | | Value ($) | |
Hesperia Public Financing Authority
Tax Allocation Bonds
Redevelopment & Housing Projects
Series 2007A
09/01/27 | | | 5.500 | % | | | 5,430,000 | | | | 4,957,970 | | |
Huntington Beach Community Facilities District
Special Tax Bonds
Grand Coast Resort No. 2000-1
Series 2001
09/01/31 | | | 6.450 | % | | | 1,250,000 | | | | 1,265,875 | | |
Los Angeles Department of Water & Power
Revenue Bonds
Power System
Series 2011A
07/01/19 | | | 5.000 | % | | | 2,000,000 | | | | 2,486,180 | | |
Los Angeles Municipal Improvement Corp.
Refunding Revenue Bonds
Real Property
Series 2012C
03/01/24 | | | 5.000 | % | | | 2,225,000 | | | | 2,558,461 | | |
M-S-R Energy Authority
Revenue Bonds
Series 2009B
11/01/39 | | | 6.500 | % | | | 5,000,000 | | | | 6,191,200 | | |
Northern California Power Agency
Refunding Revenue Bonds
Hydroelectric Project No.1 SE
Series 2012
07/01/28 | | | 5.000 | % | | | 2,000,000 | | | | 2,295,120 | | |
Oakdale Public Financing Authority
Tax Allocation Bonds
Central City Redevelopment Project
Series 2004
06/01/33 | | | 5.375 | % | | | 2,000,000 | | | | 1,890,600 | | |
Palomar Pomerado Health
Certificate of Participation
Series 2010
11/01/41 | | | 6.000 | % | | | 4,500,000 | | | | 4,730,130 | | |
Richmond Joint Powers Financing Authority
Refunding Revenue Bonds
Lease-Civic Center Project
Series 2009 (AGM)
08/01/37 | | | 5.875 | % | | | 3,500,000 | | | | 3,939,985 | | |
Riverside County Public Financing Authority
Certificate of Participation
Series 1999
05/15/29 | | | 5.800 | % | | | 5,650,000 | | | | 2,965,233 | | |
San Francisco City & County Redevelopment Agency
Tax Allocation Bonds
Mission Bay South Redevelopment
Series 2009D
08/01/39 | | | 6.625 | % | | | 1,500,000 | | | | 1,636,125 | | |
The accompanying Notes to Financial Statements are an integral part of this statement.
Annual Report 2012
8
Columbia High Yield Municipal Fund
Portfolio of Investments (continued)
May 31, 2012
Municipal Bonds (continued)
Issue
Description | | Coupon
Rate | | Principal
Amount ($) | | Value ($) | |
San Joaquin Hills Transportation Corridor Agency
Revenue Bonds
Senior Lien
Series 1993
01/01/33 | | | 5.000 | % | | | 5,000,000 | | | | 4,359,850 | | |
State of California
Unlimited General Obligation Bonds
Various Purpose
Series 2007
11/01/37 | | | 5.000 | % | | | 2,475,000 | | | | 2,634,043 | | |
Series 2012
04/01/42 | | | 5.000 | % | | | 3,000,000 | | | | 3,226,590 | | |
Unlimited General Obligation Refunding Bonds
Series 2012
02/01/27 | | | 5.000 | % | | | 5,000,000 | | | | 5,741,700 | | |
| Total | | | | | | | 114,989,497 | | |
| Colorado 2.5% | |
Anthem West Metropolitan District
Limited Tax General Obligation Bonds
Series 2005
12/01/35 | | | 6.250 | % | | | 2,000,000 | | | | 1,905,560 | | |
Colorado Educational & Cultural Facilities Authority
Refunding Revenue Bonds
Student Housing-Campus Village Apartment
Series 2008
06/01/38 | | | 5.500 | % | | | 5,000,000 | | | | 5,277,350 | | |
Colorado Health Facilities Authority
Prerefunded 06/01/14 Revenue Bonds
Evangelical Lutheran
Series 2009A
06/01/38 | | | 6.125 | % | | | 5,750,000 | | | | 6,399,807 | | |
Revenue Bonds
Covenant Retirement Communities, Inc.
Series 2002B
12/01/33 | | | 6.125 | % | | | 1,000,000 | | | | 1,031,460 | | |
E-470 Public Highway Authority(f)
Revenue Bonds
Capital Appreciation
Senior Series 2000B (NPFGC)
09/01/18 | | | 0.000 | % | | | 4,000,000 | | | | 3,296,280 | | |
Senior Capital Appreciation
Series 1997B (NPFGC)
09/01/16 | | | 0.000 | % | | | 5,000,000 | | | | 4,495,200 | | |
Red Sky Ranch Metropolitan District
Limited General Obligation Bonds
Series 2003
12/01/33 | | | 6.050 | % | | | 1,000,000 | | | | 1,008,390 | | |
| Total | | | | | | | 23,414,047 | | |
Municipal Bonds (continued)
Issue
Description | | Coupon
Rate | | Principal
Amount ($) | | Value ($) | |
| Connecticut 1.5% | |
Connecticut State Development Authority
Revenue Bonds
Alzheimer's Resource Center Project
Series 2007
08/15/21 | | | 5.400 | % | | | 1,080,000 | | | | 1,124,183 | | |
| 08/15/27 | | | 5.500 | % | | | 1,000,000 | | | | 1,030,440 | | |
Harbor Point Infrastructure Improvement District
Tax Allocation Bonds
Harbor Point Project
Series 2010A
04/01/39 | | | 7.875 | % | | | 5,000,000 | | | | 5,645,150 | | |
Mashantucket Western Pequot Tribe
Revenue Bonds
Subordinated Series 1999B(b)(d)(e)(f)
09/01/15 | | | 0.000 | % | | | 2,000,000 | | | | 550,180 | | |
Mohegan Tribe of Indians of Connecticut(b)(e)
Revenue Bonds
Public Improvement-Priority Distribution
Series 2001
01/01/31 | | | 6.250 | % | | | 5,475,000 | | | | 5,088,848 | | |
Series 2003
01/01/33 | | | 5.250 | % | | | 1,000,000 | | | | 807,810 | | |
| Total | | | | | | | 14,246,611 | | |
| Delaware 0.2% | |
Centerline Equity Issuer Trust(a)(e)
05/15/19 | | | 6.300 | % | | | 1,000,000 | | | | 1,191,170 | | |
City of Wilmington
Revenue Bonds
Housing-Electra Arms Senior Associates Project
Series 1998 AMT(a)(c)
06/01/28 | | | 6.250 | % | | | 755,000 | | | | 720,534 | | |
| Total | | | | | | | 1,911,704 | | |
| District of Columbia 0.1% | |
Resolution Trust Corp.
Pass-Through Certificates
Series 1993A(c)
12/01/16 | | | 8.500 | % | | | 455,481 | | | | 442,892 | | |
| Florida 8.5% | |
Brandy Creek Community Development District
Special Assessment Bonds
Series 2003A
05/01/34 | | | 6.350 | % | | | 935,000 | | | | 961,423 | | |
Broward County Housing Finance Authority
Revenue Bonds
Chaves Lake Apartments Project
Series 2000A AMT(a)(c)
07/01/40 | | | 7.500 | % | | | 1,500,000 | | | | 1,501,140 | | |
The accompanying Notes to Financial Statements are an integral part of this statement.
Annual Report 2012
9
Columbia High Yield Municipal Fund
Portfolio of Investments (continued)
May 31, 2012
Municipal Bonds (continued)
Issue
Description | | Coupon
Rate | | Principal
Amount ($) | | Value ($) | |
Capital Trust Agency, Inc.(a)(c)
Revenue Bonds
Orlando Project
Series 2003 AMT
01/01/32 | | | 6.750 | % | | | 650,000 | | | | 611,390 | | |
Capital Trust Agency, Inc.(c)
Revenue Bonds
Atlantic Housing Foundation
Subordinated Series 2008B
07/15/32 | | | 7.000 | % | | | 1,425,000 | | | | 641,193 | | |
Celebration Community Development District
Special Assessment Bonds
Series 2003A
05/01/34 | | | 6.400 | % | | | 885,000 | | | | 895,248 | | |
Channing Park Community Development District
Special Assessment Bonds
Series 2007
05/01/38 | | | 5.300 | % | | | 560,000 | | | | 560,454 | | |
Citizens Property Insurance Corp.
Revenue Bonds
High Risk
Series 2010A3(g)
06/01/13 | | | 1.930 | % | | | 5,000,000 | | | | 5,036,750 | | |
City of Lakeland(e)
Refunding Revenue Bonds
1st Mortgage-Carpenters Accident Investor
Series 2008
01/01/28 | | | 6.250 | % | | | 675,000 | | | | 700,346 | | |
| 01/01/43 | | | 6.375 | % | | | 2,250,000 | | | | 2,293,965 | | |
Colonial Country Club Community Development District
Special Assessment Bonds
Series 2003
05/01/33 | | | 6.400 | % | | | 660,000 | | | | 693,832 | | |
County of Broward Airport System
Refunding Revenue Bonds
Series 2012P-1 AMT(a)
10/01/23 | | | 5.000 | % | | | 5,000,000 | | | | 5,653,300 | | |
County of Lee Solid Waste System
Revenue Bonds
Series 2006A (AMBAC) AMT(a)
10/01/17 | | | 5.000 | % | | | 2,010,000 | | | | 2,147,665 | | |
County of Miami-Dade
Subordinated Revenue Bonds
Capital Appreciation
Series 2009B(f)
10/01/41 | | | 0.000 | % | | | 30,000,000 | | | | 5,710,500 | | |
Double Branch Community Development District
Special Assessment Bonds
Series 2002A
05/01/34 | | | 6.700 | % | | | 625,000 | | | | 641,138 | | |
Municipal Bonds (continued)
Issue
Description | | Coupon
Rate | | Principal
Amount ($) | | Value ($) | |
Florida Development Finance Corp.
Revenue Bonds
Renaissance Charter School
Series 2010A
09/15/40 | | | 6.000 | % | | | 3,750,000 | | | | 3,900,937 | | |
Islands at Doral Southwest Community Development District
Special Assessment Bonds
Series 2003
05/01/35 | | | 6.375 | % | | | 725,000 | | | | 767,231 | | |
Lee County Industrial Development Authority
Refunding Revenue Bonds
Shell PT/Alliance Community Project
Series 2007
11/15/29 | | | 5.000 | % | | | 4,000,000 | | | | 3,851,120 | | |
Mid-Bay Bridge Authority
Revenue Bonds
Series 2011A
10/01/40 | | | 7.250 | % | | | 4,000,000 | | | | 4,690,440 | | |
Middle Village Community Development District
Special Assessment Bonds
Series 2004A
05/01/35 | | | 6.000 | % | | | 2,000,000 | | | | 1,837,060 | | |
North Brevard County Hospital District
Refunding Revenue Bonds
Parrish Medical Center Project
Series 2008
10/01/38 | | | 5.750 | % | | | 4,000,000 | | | | 4,369,280 | | |
Oakmont Grove Community Development District(c)(d)
Special Assessment Bonds
Series 2007A
05/01/38 | | | 5.400 | % | | | 1,200,000 | | | | 420,384 | | |
Series 2007B
05/01/12 | | | 5.250 | % | | | 1,000,000 | | | | 350,080 | | |
Orange County Health Facilities Authority
Refunding Revenue Bonds
Health Care-Orlando Lutheran
Series 2005
07/01/26 | | | 5.700 | % | | | 2,000,000 | | | | 2,022,720 | | |
Mayflower Retirement Center
Series 2012
06/01/42 | | | 5.125 | % | | | 750,000 | | | | 755,648 | | |
Revenue Bonds
1st Mortgage-Orlando Lutheran Tower
Series 2007
07/01/32 | | | 5.500 | % | | | 350,000 | | | | 344,964 | | |
| 07/01/38 | | | 5.500 | % | | | 1,750,000 | | | | 1,702,680 | | |
Sarasota County Health Facilities Authority
Refunding Revenue Bonds
Village on the Isle Project
Series 2007
01/01/32 | | | 5.500 | % | | | 4,000,000 | | | | 4,096,200 | | |
The accompanying Notes to Financial Statements are an integral part of this statement.
Annual Report 2012
10
Columbia High Yield Municipal Fund
Portfolio of Investments (continued)
May 31, 2012
Municipal Bonds (continued)
Issue
Description | | Coupon
Rate | | Principal
Amount ($) | | Value ($) | |
Seminole Indian Tribe of Florida
Revenue Bonds
Series 2007A(b)(e)
10/01/24 | | | 5.500 | % | | | 2,000,000 | | | | 2,087,500 | | |
Seven Oaks Community Development District II
Special Assessment Bonds
Series 2004A
05/01/35 | | | 5.875 | % | | | 435,000 | | | | 325,702 | | |
Series 2004B
05/01/16 | | | 7.500 | % | | | 2,290,000 | | | | 2,183,904 | | |
South Lake County Hospital District
Revenue Bonds
South Lake Hospital, Inc.
Series 2003
10/01/28 | | | 6.375 | % | | | 750,000 | | | | 769,508 | | |
| 10/01/34 | | | 6.375 | % | | | 500,000 | | | | 516,620 | | |
Series 2010A
04/01/39 | | | 6.250 | % | | | 2,000,000 | | | | 2,187,800 | | |
St. Johns County Industrial Development Authority
Refunding Revenue Bonds
Bayview Project
Series 2007A
10/01/41 | | | 5.250 | % | | | 3,725,000 | | | | 3,059,640 | | |
Vicars Landing Project
Series 2007
02/15/27 | | | 5.000 | % | | | 2,500,000 | | | | 2,532,100 | | |
Revenue Bonds
Glenmoor Project
Series 2006A
01/01/40 | | | 5.375 | % | | | 4,275,000 | | | | 3,605,065 | | |
Sweetwater Creek Community Development District
Special Assessment Bonds
Series 2007A(c)(d)
05/01/38 | | | 5.500 | % | | | 3,805,000 | | | | 1,333,272 | | |
Waterset North Community Development District
Special Assessment Bonds
Series 2007A
05/01/39 | | | 6.600 | % | | | 1,935,000 | | | | 1,572,555 | | |
West Villages Improvement District
Special Assessment Bonds
Unit of Development No. 3
Series 2006(c)
05/01/37 | | | 5.500 | % | | | 1,645,000 | | | | 735,693 | | |
Westchester Community Development District No. 1
Special Assessment Bonds
Community Infrastructure
Series 2003
05/01/35 | | | 6.125 | % | | | 800,000 | | | | 795,560 | | |
Westridge Community Development District
Special Assessment Bonds
Series 2005(c)(d)
05/01/37 | | | 5.800 | % | | | 2,650,000 | | | | 1,009,252 | | |
| Total | | | | | | | 79,871,259 | | |
Municipal Bonds (continued)
Issue
Description | | Coupon
Rate | | Principal
Amount ($) | | Value ($) | |
| Georgia 2.7% | |
Columbus Housing Authority
Revenue Bonds
Gardens at Calvary Project
Series 1999
11/15/29 | | | 7.000 | % | | | 2,000,000 | | | | 2,000,160 | | |
County of Fulton Water & Sewerage
Refunding Revenue Bonds
Series 2011
01/01/21 | | | 5.000 | % | | | 3,500,000 | | | | 4,324,320 | | |
DeKalb County Hospital Authority
Revenue Bonds
DeKalb Medical Center, Inc. Project
Series 2010
09/01/40 | | | 6.125 | % | | | 4,500,000 | | | | 4,976,100 | | |
Fulton County Residential Care Facilities for the Elderly Authority
Revenue Bonds
1st Mortgage-Lenbrook Project
Series 2006A
07/01/17 | | | 5.000 | % | | | 2,000,000 | | | | 1,973,480 | | |
| 07/01/29 | | | 5.000 | % | | | 3,000,000 | | | | 2,589,690 | | |
Municipal Electric Authority of Georgia
Revenue Bonds
Series 1991V
01/01/18 | | | 6.600 | % | | | 75,000 | | | | 82,717 | | |
Series 1991V Escrowed to Maturity
01/01/18 | | | 6.600 | % | | | 690,000 | | | | 810,750 | | |
Rockdale County Development Authority
Revenue Bonds
Visy Paper Project
Series 2007A AMT(a)
01/01/34 | | | 6.125 | % | | | 5,000,000 | | | | 5,180,000 | | |
Savannah Economic Development Authority
Revenue Bonds
1st Mortgage-Marshes of Skidaway
Series 2003A
01/01/24 | | | 7.400 | % | | | 500,000 | | | | 511,105 | | |
| 01/01/34 | | | 7.400 | % | | | 3,000,000 | | | | 3,049,500 | | |
| Total | | | | | | | 25,497,822 | | |
| Guam 0.6% | |
Guam Department of Education
Certificate of Participation
John F. Kennedy High School
Series 2010A(b)
12/01/40 | | | 6.875 | % | | | 4,750,000 | | | | 5,120,880 | | |
| Hawaii 0.5% | |
Hawaii State Department of Budget & Finance
Revenue Bonds
15 Craigside Project
Series 2009A
11/15/44 | | | 9.000 | % | | | 2,375,000 | | | | 2,831,237 | | |
The accompanying Notes to Financial Statements are an integral part of this statement.
Annual Report 2012
11
Columbia High Yield Municipal Fund
Portfolio of Investments (continued)
May 31, 2012
Municipal Bonds (continued)
Issue
Description | | Coupon
Rate | | Principal
Amount ($) | | Value ($) | |
Hawaiian Electric Co. Subsidiary
Series 2009
07/01/39 | | | 6.500 | % | | | 1,750,000 | | | | 2,026,833 | | |
| Total | | | | | | | 4,858,070 | | |
| Illinois 9.0% | |
City of Chicago
Revenue Bonds
Asphalt Operating Services- Recovery Zone Facility
Series 2010
12/01/18 | | | 6.125 | % | | | 5,000,000 | | | | 5,322,500 | | |
Tax Allocation Bonds
Pilsen Redevelopment
Series 2004B
06/01/22 | | | 6.750 | % | | | 1,225,000 | | | | 1,281,448 | | |
County of Cook
Unlimited General Obligation Refunding Bonds
Series 2011A
11/15/19 | | | 5.000 | % | | | 5,000,000 | | | | 5,961,950 | | |
Du Page County Special Service Area No. 31
Special Tax Bonds
Monarch Landing Project
Series 2006
03/01/36 | | | 5.625 | % | | | 750,000 | | | | 719,138 | | |
Illinois Finance Authority
Refunding Revenue Bonds
Chicago Charter School Project
Series 2007
12/01/36 | | | 5.000 | % | | | 1,750,000 | | | | 1,753,500 | | |
Uno Charter School Network, Inc. Project
Series 2011A
10/01/31 | | | 6.875 | % | | | 2,500,000 | | | | 2,743,675 | | |
Revenue Bonds
CHF-Normal LLC-Illinois State University
Series 2011
04/01/43 | | | 7.000 | % | | | 3,450,000 | | | | 3,882,457 | | |
Columbia College
Series 2007 (NPFGC)
12/01/37 | | | 5.000 | % | | | 5,000,000 | | | | 5,067,150 | | |
Hoosier Care Project
Series 1999A
06/01/34 | | | 7.125 | % | | | 1,300,000 | | | | 1,300,052 | | |
Provena Health
Series 2009A
08/15/34 | | | 7.750 | % | | | 4,000,000 | | | | 5,088,760 | | |
Riverside Health System
Series 2009
11/15/35 | | | 6.250 | % | | | 3,000,000 | | | | 3,439,710 | | |
Series 2003A
11/15/32 | | | 7.000 | % | | | 1,000,000 | | | | 1,008,580 | | |
Series 2009
08/15/44 | | | 7.000 | % | | | 5,000,000 | | | | 5,601,550 | | |
Smith Village Project
Series 2005A
11/15/35 | | | 6.250 | % | | | 2,750,000 | | | | 2,675,777 | | |
Municipal Bonds (continued)
Issue
Description | | Coupon
Rate | | Principal
Amount ($) | | Value ($) | |
Illinois Finance Authority(a)
Revenue Bonds
People's Gas Light & Coke Co.
Series 2003 (AMBAC) AMT
11/01/38 | | | 4.875 | % | | | 2,500,000 | | | | 2,590,925 | | |
Illinois Finance Authority(c)
Revenue Bonds
Leafs Hockey Club Project
Series 2007A
03/01/37 | | | 6.000 | % | | | 1,000,000 | | | | 329,890 | | |
Illinois Finance Authority(c)(d)
Revenue Bonds
Monarch Landing, Inc. Facility
Series 2007A
12/01/27 | | | 7.000 | % | | | 1,383,250 | | | | 14 | | |
Sedgebrook, Inc. Facility
Series 2007A
11/15/37 | | | 6.000 | % | | | 3,806,608 | | | | 38 | | |
| 11/15/42 | | | 6.000 | % | | | 1,522,643 | | | | 15 | | |
Metropolitan Pier & Exposition Authority
Refunding Revenue Bonds
McCormick
Series 2010B-2
06/15/50 | | | 5.000 | % | | | 5,000,000 | | | | 5,266,950 | | |
Plano Special Service Area No. 4
Special Tax Bonds
Lakewood Springs Project Unit 5
Series 2005 B
03/01/35 | | | 6.000 | % | | | 2,922,000 | | | | 2,972,288 | | |
Railsplitter Tobacco Settlement Authority
Revenue Bonds
Series 2010
06/01/28 | | | 6.000 | % | | | 5,000,000 | | | | 5,737,400 | | |
Southwestern Illinois Development Authority
Revenue Bonds
Anderson Hospital
Series 2006
08/15/26 | | | 5.125 | % | | | 1,245,000 | | | | 1,253,852 | | |
State of Illinois
Unlimited General Obligation Bonds
Series 2012
03/01/20 | | | 5.000 | % | | | 1,250,000 | | | | 1,410,150 | | |
Unlimited General Obligation Refunding Bonds
Series 2010
01/01/20 | | | 5.000 | % | | | 2,650,000 | | | | 2,987,875 | | |
Series 2012
08/01/21 | | | 5.000 | % | | | 2,500,000 | | | | 2,811,400 | | |
Village of Annawan
Tax Allocation Bonds
Patriot Renewable Fuels LLC Project
Series 2007
01/01/18 | | | 5.625 | % | | | 3,905,000 | | | | 3,544,334 | | |
The accompanying Notes to Financial Statements are an integral part of this statement.
Annual Report 2012
12
Columbia High Yield Municipal Fund
Portfolio of Investments (continued)
May 31, 2012
Municipal Bonds (continued)
Issue
Description | | Coupon
Rate | | Principal
Amount ($) | | Value ($) | |
Village of Bolingbrook
Sales Tax Revenue Bonds
Series 2005(c)
01/01/24 | | | 6.250 | % | | | 1,500,000 | | | | 1,037,955 | | |
Village of Hillside
Tax Allocation Bonds
Senior Lien-Mannheim Redevelopment Project
Series 2008
01/01/28 | | | 7.000 | % | | | 2,500,000 | | | | 2,467,200 | | |
Village of Lincolnshire
Special Tax Bonds
Sedgebrook Project
Series 2004
03/01/34 | | | 6.250 | % | | | 731,000 | | | | 732,287 | | |
Village of Rosemont
Tax Allocation Bonds
River Road Hotel Partners Project
Series 2007
12/30/23 | | | 5.100 | % | | | 2,700,000 | | | | 2,330,100 | | |
Volo Village Special Service Area No. 3
Special Tax Bonds
Symphony Meadows Project
Series 2006-1
03/01/36 | | | 6.000 | % | | | 3,713,000 | | | | 3,168,043 | | |
| Total | | | | | | | 84,486,963 | | |
| Indiana 0.9% | |
City of Portage
Tax Allocation Bonds
Ameriplex Project
Series 2006
07/15/23 | | | 5.000 | % | | | 700,000 | | | | 729,568 | | |
Indiana Finance Authority
Revenue Bonds
Republic Services, Inc. Project
Series 2010A AMT(a)
05/01/34 | | | 0.600 | % | | | 4,000,000 | | | | 4,000,000 | | |
Indiana Health & Educational Facilities Financing Authority
Revenue Bonds
Baptist Homes of Indiana
Series 2005
11/15/35 | | | 5.250 | % | | | 2,750,000 | | | | 2,817,925 | | |
Indiana Health Facility Financing Authority
Revenue Bonds
Hoosier Care Project
Series 1999A
06/01/34 | | | 7.125 | % | | | 1,065,000 | | | | 1,065,043 | | |
| Total | | | | | | | 8,612,536 | | |
Municipal Bonds (continued)
Issue
Description | | Coupon
Rate | | Principal
Amount ($) | | Value ($) | |
| Iowa 0.9% | |
City of Marion
Refunding Revenue Bonds
1st Mortgage
Series 2003
01/01/29 | | | 8.000 | % | | | 229,000 | | | | 233,145 | | |
Iowa Finance Authority
Revenue Bonds
Care Initiatives Project
Series 1998B
07/01/18 | | | 5.750 | % | | | 505,000 | | | | 505,505 | | |
| 07/01/28 | | | 5.750 | % | | | 1,475,000 | | | | 1,475,192 | | |
Deerfield Retirement Community, Inc.
Series 2007A
11/15/15 | | | 5.000 | % | | | 2,210,000 | | | | 2,119,302 | | |
| 11/15/27 | | | 5.500 | % | | | 1,135,000 | | | | 962,412 | | |
| 11/15/37 | | | 5.500 | % | | | 750,000 | | | | 593,407 | | |
Iowa Student Loan Liquidity Corp.
Revenue Bonds
Senior Series 2011A-2 AMT(a)
12/01/30 | | | 5.850 | % | | | 2,500,000 | | | | 2,772,300 | | |
| Total | | | | | | | 8,661,263 | | |
| Kansas 2.6% | |
City of Lenexa
Revenue Bonds
Lakeview Village, Inc. Project
Series 2009
05/15/29 | | | 7.125 | % | | | 500,000 | | | | 550,965 | | |
| 05/15/39 | | | 7.250 | % | | | 1,500,000 | | | | 1,638,210 | | |
City of Manhattan
Revenue Bonds
Meadowlark Hills Retirement
Series 2007A
05/15/24 | | | 5.000 | % | | | 3,000,000 | | | | 3,009,060 | | |
| 05/15/29 | | | 5.000 | % | | | 2,680,000 | | | | 2,617,074 | | |
Wichita Airport Authority
Special Revenue Bonds
Cessna Citation Service Center
Series 2002A AMT(a)
06/15/32 | | | 6.250 | % | | | 1,875,000 | | | | 1,880,962 | | |
Wyandotte County-Kansas City Unified Government
Refunding Revenue Bonds
Sales Tax-2nd Lien-Area B
Series 2005
12/01/20 | | | 5.000 | % | | | 1,165,000 | | | | 1,234,306 | | |
Revenue Bonds
Legends Village West Project
Series 2006
10/01/28 | | | 4.875 | % | | | 6,245,000 | | | | 5,947,051 | | |
The accompanying Notes to Financial Statements are an integral part of this statement.
Annual Report 2012
13
Columbia High Yield Municipal Fund
Portfolio of Investments (continued)
May 31, 2012
Municipal Bonds (continued)
Issue
Description | | Coupon
Rate | | Principal
Amount ($) | | Value ($) | |
Wyandotte County-Kansas City Unified Government(f)
Revenue Bonds
Capital Appreciation Sales Tax Subordinated Lien
Series 2010
06/01/21 | | | 0.000 | % | | | 11,475,000 | | | | 7,907,078 | | |
| Total | | | | | | | 24,784,706 | | |
| Kentucky 0.2% | |
Kentucky Economic Development Finance Authority
Refunding Revenue Bonds
1st Mortgage-AHF/KY-IA, Inc. Project
Series 2003
01/01/29 | | | 8.000 | % | | | 718,000 | | | | 730,996 | | |
Revenue Bonds
Louisville Arena
Subordinated Series 2008A-1 (AGM)
12/01/38 | | | 6.000 | % | | | 1,150,000 | | | | 1,253,695 | | |
| Total | | | | | | | 1,984,691 | | |
| Louisiana 2.1% | |
Louisiana Local Government Environmental Facilities & Community Development Authority
Revenue Bonds
Westlake Chemical Corp.
Series 2010A-2
11/01/35 | | | 6.500 | % | | | 5,000,000 | | | | 5,692,100 | | |
Louisiana Public Facilities Authority
Revenue Bonds
Progressive Healthcare
Series 1998(c)
10/01/28 | | | 6.375 | % | | | 2,000,000 | | | | 1,858,140 | | |
New Orleans Aviation Board
Revenue Bonds
Consolidated Rental Car
Series 2009A
01/01/40 | | | 6.500 | % | | | 5,000,000 | | | | 5,507,250 | | |
Parish of St. Charles
Revenue Bonds
Valero Energy Corp.
Series 2010(h)
12/01/40 | | | 4.000 | % | | | 1,400,000 | | | | 1,400,000 | | |
Parish of St. John the Baptist
Revenue Bonds
Marathon Oil Corp.
Series 2007A
06/01/37 | | | 5.125 | % | | | 5,000,000 | | | | 5,206,200 | | |
| Total | | | | | | | 19,663,690 | | |
Municipal Bonds (continued)
Issue
Description | | Coupon
Rate | | Principal
Amount ($) | | Value ($) | |
| Maryland 0.7% | |
City of Westminster
Revenue Bonds
Carroll Lutheran Village
Series 2004A
05/01/34 | | | 6.250 | % | | | 1,750,000 | | | | 1,746,780 | | |
Maryland Economic Development Corp.
Refunding Revenue Bonds
CNX Marine Terminals, Inc.
Series 2010
09/01/25 | | | 5.750 | % | | | 1,000,000 | | | | 1,061,560 | | |
Revenue Bonds
University of Maryland-College Park Projects
Series 2008
06/01/43 | | | 5.875 | % | | | 2,735,000 | | | | 2,924,891 | | |
Munimae TE Bond Subsidiary LLC(a)(c)(e)
06/30/49 | | | 5.800 | % | | | 1,000,000 | | | | 690,010 | | |
| Total | | | | | | | 6,423,241 | | |
| Massachusetts 2.9% | |
Massachusetts Development Finance Agency
Refunding Revenue Bonds
1st Mortgage-VOA Concord
Series 2007
11/01/41 | | | 5.200 | % | | | 1,000,000 | | | | 880,310 | | |
Revenue Bonds
Foxborough Regional Charter School
Series 2010A
07/01/42 | | | 7.000 | % | | | 4,200,000 | | | | 4,821,894 | | |
Linden Ponds, Inc. Facility
Series 2011A-1
11/15/31 | | | 6.250 | % | | | 2,112,442 | | | | 1,640,691 | | |
| 11/15/39 | | | 6.250 | % | | | 634,649 | | | | 468,510 | | |
| 11/15/46 | | | 6.250 | % | | | 2,502,917 | | | | 1,806,680 | | |
Series 2011A-2
11/15/46 | | | 5.500 | % | | | 279,667 | | | | 172,440 | | |
Massachusetts Development Finance Agency(a)
Revenue Bonds
Ogden Haverhill
Series 1999A AMT
12/01/14 | | | 6.700 | % | | | 85,000 | | | | 85,829 | | |
Massachusetts Development Finance Agency(c)
Revenue Bonds
Groves-Lincoln
Series 2009A
06/01/44 | | | 7.875 | % | | | 1,500,000 | | | | 1,126,110 | | |
Health Care Facility-Alliance
Series 1999A
07/01/32 | | | 7.100 | % | | | 2,035,000 | | | | 1,893,405 | | |
Series 2009B-1
06/01/16 | | | 7.250 | % | | | 3,500,000 | | | | 2,976,645 | | |
The accompanying Notes to Financial Statements are an integral part of this statement.
Annual Report 2012
14
Columbia High Yield Municipal Fund
Portfolio of Investments (continued)
May 31, 2012
Municipal Bonds (continued)
Issue
Description | | Coupon
Rate | | Principal
Amount ($) | | Value ($) | |
Massachusetts Development Finance Agency(c)(f)
Revenue Bonds
Linden Ponds, Inc. Facility
Series 2011B
11/15/56 | | | 0.000 | % | | | 1,391,019 | | | | 7,178 | | |
Massachusetts Educational Financing Authority
Revenue Bonds
Series 2008H (AGM) AMT(a)
01/01/30 | | | 6.350 | % | | | 2,940,000 | | | | 3,257,726 | | |
Massachusetts Health & Educational Facilities Authority
Prerefunded 12/15/12 Revenue Bonds
Civic Investments
Series 2002A
12/15/15 | | | 9.000 | % | | | 900,000 | | | | 954,261 | | |
Revenue Bonds
Boston Medical Center Project
Series 2008
07/01/38 | | | 5.250 | % | | | 5,000,000 | | | | 5,088,250 | | |
Milford Regional Medical
Series 2007E
07/15/32 | | | 5.000 | % | | | 1,250,000 | | | | 1,238,975 | | |
Massachusetts Industrial Finance Agency
Refunding Revenue Bonds
Ogden Haverhill Project
Series 1998A AMT(a)
12/01/19 | | | 5.600 | % | | | 1,000,000 | | | | 1,003,730 | | |
| Total | | | | | | | 27,422,634 | | |
| Michigan 3.1% | |
County of Wayne
Limited General Obligation Bonds
Building Improvement
Series 2009A
11/01/39 | | | 6.750 | % | | | 4,880,000 | | | | 5,545,827 | | |
Michigan Finance Authority
Revenue Bonds
School District
Series 2012
06/01/20 | | | 5.000 | % | | | 1,400,000 | | | | 1,572,424 | | |
Michigan State Hospital Finance Authority
Refunding Revenue Bonds
Henry Ford Health System
Series 2006A
11/15/46 | | | 5.250 | % | | | 3,000,000 | | | | 3,119,070 | | |
Oakwood Obligation Group
Series 2007A
07/15/37 | | | 5.000 | % | | | 5,000,000 | | | | 5,147,550 | | |
Revenue Bonds
McLaren Health Care
Series 2005C
08/01/35 | | | 5.000 | % | | | 2,500,000 | | | | 2,686,050 | | |
Municipal Bonds (continued)
Issue
Description | | Coupon
Rate | | Principal
Amount ($) | | Value ($) | |
Michigan Strategic Fund
Refunding Revenue Bonds
Michigan Sugar Co.-Carollton
Series 1998C AMT(a)(c)
11/01/25 | | | 6.550 | % | | | 1,500,000 | | | | 1,405,140 | | |
Michigan Tobacco Settlement Finance Authority
Revenue Bonds
Senior Series 2007A
06/01/34 | | | 6.000 | % | | | 1,000,000 | | | | 805,870 | | |
| 06/01/48 | | | 6.000 | % | | | 11,000,000 | | | | 8,464,830 | | |
Summit Academy North
Refunding Revenue Bonds
Series 2005
11/01/35 | | | 5.500 | % | | | 750,000 | | | | 641,970 | | |
| Total | | | | | | | 29,388,731 | | |
| Minnesota 2.1% | |
City of Anoka
Revenue Bonds
Homestead Anoka, Inc. Project
Series 2011A
11/01/46 | | | 7.000 | % | | | 4,070,000 | | | | 4,246,597 | | |
City of Columbia Heights
Refunding Revenue Bonds
Crest View Corp. Projects
Series 2007A
07/01/27 | | | 5.550 | % | | | 1,000,000 | | | | 806,980 | | |
| 07/01/42 | | | 5.700 | % | | | 2,000,000 | | | | 1,472,100 | | |
City of Eveleth
Refunding Revenue Bonds
Arrowhead Senior Living Community
Series 2007
10/01/27 | | | 5.200 | % | | | 2,375,000 | | | | 2,162,081 | | |
City of Minneapolis
Revenue Bonds
Riverton Community Housing Project
Series 2006A
08/01/40 | | | 5.700 | % | | | 1,600,000 | | | | 1,590,976 | | |
City of Sartell
Revenue Bonds
Foundation for Healthcare Project
Series 1999A
09/01/29 | | | 6.625 | % | | | 2,000,000 | | | | 2,001,920 | | |
Series 2001A
09/01/30 | | | 8.000 | % | | | 935,000 | | | | 955,477 | | |
Minneapolis & St Paul Housing & Redevelopment Authority
Revenue Bonds
HealthPartners Obligation Group Project
Series 2003
12/01/29 | | | 5.875 | % | | | 400,000 | | | | 412,524 | | |
The accompanying Notes to Financial Statements are an integral part of this statement.
Annual Report 2012
15
Columbia High Yield Municipal Fund
Portfolio of Investments (continued)
May 31, 2012
Municipal Bonds (continued)
Issue
Description | | Coupon
Rate | | Principal
Amount ($) | | Value ($) | |
Minneapolis/St Paul Housing Finance Board
Revenue Bonds
Mortgage-Backed Securities Program-Cityliving
Series 2006A-2 (GNMA/FNMA) AMT(a)
12/01/38 | | | 5.000 | % | | | 60,559 | | | | 62,036 | | |
St. Paul Housing & Redevelopment Authority
Revenue Bonds
Healtheast Project
Series 2005
11/15/30 | | | 6.000 | % | | | 4,000,000 | | | | 4,151,080 | | |
| 11/15/35 | | | 6.000 | % | | | 2,000,000 | | | | 2,062,700 | | |
| Total | | | | | | | 19,924,471 | | |
| Mississippi 0.5% | |
County of Lowndes
Refunding Revenue Bonds
Weyerhaeuser Co. Project
Series 1992A
04/01/22 | | | 6.800 | % | | | 1,995,000 | | | | 2,271,766 | | |
Series 1992B
04/01/22 | | | 6.700 | % | | | 230,000 | | | | 259,318 | | |
County of Warren
Revenue Bonds
International Paper Co.
Series 2008A
09/01/32 | | | 6.500 | % | | | 2,000,000 | | | | 2,241,660 | | |
Rankin County Five Lakes Utility District
Series 1994(c)
07/15/37 | | | 7.000 | % | | | 250,000 | | | | 241,398 | | |
| Total | | | | | | | 5,014,142 | | |
| Missouri 3.7% | |
Cape Girardeau County Industrial Development Authority
Revenue Bonds
Southeast Missouri Hospital Association
Series 2007
06/01/27 | | | 5.000 | % | | | 1,800,000 | | | | 1,829,898 | | |
City of Fenton
Refunding Tax Allocation Bonds
Gravois Bluffs Redevelopment Project
Series 2006
04/01/21 | | | 4.500 | % | | | 170,000 | | | | 174,442 | | |
City of Kansas City
Tax Allocation Bonds
Kansas City-Maincor Project
Series 2007A
03/01/18 | | | 5.250 | % | | | 1,000,000 | | | | 1,041,670 | | |
Shoal Creek Parkway Project
Series 2011
06/01/25 | | | 6.500 | % | | | 3,100,000 | | | | 3,205,462 | | |
Municipal Bonds (continued)
Issue
Description | | Coupon
Rate | | Principal
Amount ($) | | Value ($) | |
City of Manchester
Refunding Tax Allocation Bonds
Highway 141/Manchester Road Project
Series 2010
11/01/39 | | | 6.875 | % | | | 5,000,000 | | | | 5,332,350 | | |
City of Riverside
Tax Allocation Bonds
L-385 Levee Project
Series 2004
05/01/20 | | | 5.250 | % | | | 1,275,000 | | | | 1,345,737 | | |
Grundy County Industrial Development Authority
Revenue Bonds
Wright Memorial Hospital
Series 2009
09/01/34 | | | 6.750 | % | | | 2,250,000 | | | | 2,498,310 | | |
Kirkwood Industrial Development Authority
Revenue Bonds
Aberdeen Heights
Series 2010A
05/15/45 | | | 8.250 | % | | | 4,500,000 | | | | 5,253,840 | | |
Saline County Industrial Development Authority
Revenue Bonds
John Fitzgibbon Memorial Hospital, Inc.
Series 2005
12/01/35 | | | 5.625 | % | | | 5,485,000 | | | | 5,460,208 | | |
St. Louis County Industrial Development Authority
Refunding Revenue Bonds
Ranken Jordan Project
Series 2007
11/15/35 | | | 5.000 | % | | | 1,300,000 | | | | 1,239,576 | | |
Revenue Bonds
St. Andrews Residence for Seniors
Series 2007A
12/01/26 | | | 6.250 | % | | | 2,000,000 | | | | 2,076,120 | | |
| 12/01/41 | | | 6.375 | % | | | 3,000,000 | | | | 3,073,440 | | |
St. Louis Industrial Development Authority
Revenue Bonds
Convention Center Hotel
Series 2000 (AMBAC)(f)
07/15/18 | | | 0.000 | % | | | 3,000,000 | | | | 2,148,360 | | |
| Total | | | | | | | 34,679,413 | | |
| Montana 0.1% | |
Montana Facility Finance Authority
Revenue Bonds
Senior Living-St. John's Lutheran
Series 2006A
05/15/36 | | | 6.125 | % | | | 1,000,000 | | | | 1,017,550 | | |
The accompanying Notes to Financial Statements are an integral part of this statement.
Annual Report 2012
16
Columbia High Yield Municipal Fund
Portfolio of Investments (continued)
May 31, 2012
Municipal Bonds (continued)
Issue
Description | | Coupon
Rate | | Principal
Amount ($) | | Value ($) | |
| Nebraska 0.6% | |
Central Plains Energy Project
Revenue Bonds
Project #3
Series 2012
09/01/42 | | | 5.000 | % | | | 5,000,000 | | | | 5,108,350 | | |
| Nevada 0.5% | |
City of Sparks
Senior Sales Tax Anticipation Revenue Bonds
Series 2008A(e)
06/15/28 | | | 6.750 | % | | | 5,000,000 | | | | 4,922,950 | | |
| New Hampshire —% | |
New Hampshire Business Finance Authority
Revenue Bonds
Pennichuck Water Works, Inc. Project
Series 1988 Escrowed to Maturity AMT(a)
07/01/18 | | | 7.500 | % | | | 210,000 | | | | 246,674 | | |
| New Jersey 2.3% | |
Middlesex County Improvement Authority(c)(d)
Revenue Bonds
Heldrich Center Hotel
Series 2005C
01/01/37 | | | 8.750 | % | | | 1,250,000 | | | | 111,113 | | |
Subordinated Revenue Bonds
Heldrich Center Hotel
Series 2005B
01/01/25 | | | 6.125 | % | | | 2,750,000 | | | | 244,447 | | |
| 01/01/37 | | | 6.250 | % | | | 6,450,000 | | | | 573,340 | | |
New Jersey Economic Development Authority
Prerefunded 06/15/14 Revenue Bonds
Cigarette Tax
Series 2004
06/15/29 | | | 5.750 | % | | | 1,000,000 | | | | 1,109,260 | | |
Refunding Revenue Bonds
Seabrook Village, Inc. Facility
Series 2006
11/15/36 | | | 5.250 | % | | | 2,250,000 | | | | 2,192,490 | | |
Revenue Bonds
1st Mortgage-Seashore Gardens Project
Series 2006
11/01/26 | | | 5.300 | % | | | 500,000 | | | | 458,650 | | |
New Jersey Economic Development Authority(a)
Refunding Revenue Bonds
Series 2006B AMT
01/01/37 | | | 6.875 | % | | | 4,000,000 | | | | 4,029,880 | | |
Revenue Bonds
Continental Airlines, Inc. Project
Series 1999 AMT
09/15/19 | | | 6.250 | % | | | 1,000,000 | | | | 1,004,010 | | |
| 09/15/29 | | | 6.250 | % | | | 2,500,000 | | | | 2,510,025 | | |
Series 2003 AMT
06/01/33 | | | 9.000 | % | | | 1,000,000 | | | | 1,066,740 | | |
Municipal Bonds (continued)
Issue
Description | | Coupon
Rate | | Principal
Amount ($) | | Value ($) | |
New Jersey Health Care Facilities Financing Authority
Revenue Bonds
St. Josephs Healthcare System
Series 2008
07/01/18 | | | 6.000 | % | | | 2,000,000 | | | | 2,322,860 | | |
St. Josephs Healthcare Systems
Series 2008
07/01/38 | | | 6.625 | % | | | 3,000,000 | | | | 3,479,280 | | |
Tobacco Settlement Financing Corp.
Prerefunded 06/01/13 Revenue Bonds
Series 2003
06/01/39 | | | 6.750 | % | | | 2,000,000 | | | | 2,129,540 | | |
Tobacco Settlement Financing Corp.(f)
Revenue Bonds
Capital Appreciation
Series 2007-1C
06/01/41 | | | 0.000 | % | | | 7,500,000 | | | | 467,025 | | |
| Total | | | | | | | 21,698,660 | | |
| New York 2.5% | |
Broome County Industrial Development Agency
Revenue Bonds
Good Shepard Village
Series 2008A
07/01/40 | | | 6.875 | % | | | 4,000,000 | | | | 4,140,960 | | |
County of Rockland
General Obligation Limited Notes
BAN Series 2012B(h)
06/06/13 | | | 4.000 | % | | | 1,250,000 | | | | 1,257,388 | | |
Huntington Housing Authority
Revenue Bonds
Gurwin Jewish Senior Residences
Series 1999A
05/01/19 | | | 5.875 | % | | | 1,435,000 | | | | 1,436,507 | | |
| 05/01/29 | | | 6.000 | % | | | 625,000 | | | | 625,331 | | |
Nassau County Tobacco Settlement Corp.
Asset-Backed Revenue Bonds
Capital Appreciation
Third Series 2006D(f)
06/01/60 | | | 0.000 | % | | | 25,000,000 | | | | 147,750 | | |
New York Liberty Development Corp.
Revenue Bonds
National Sports Museum Project
Series 2006A(c)(d)(e)
02/15/19 | | | 6.125 | % | | | 1,979,996 | | | | 20 | | |
New York State Dormitory Authority
Revenue Bonds
NYU Hospital Center
Series 2007B
07/01/37 | | | 5.625 | % | | | 2,000,000 | | | | 2,160,500 | | |
Series 2011A
07/01/40 | | | 6.000 | % | | | 1,000,000 | | | | 1,155,610 | | |
The accompanying Notes to Financial Statements are an integral part of this statement.
Annual Report 2012
17
Columbia High Yield Municipal Fund
Portfolio of Investments (continued)
May 31, 2012
Municipal Bonds (continued)
Issue
Description | | Coupon
Rate | | Principal
Amount ($) | | Value ($) | |
The New School
Series 2010
07/01/50 | | | 6.000 | % | | | 5,000,000 | | | | 5,751,750 | | |
Port Authority of New York & New Jersey
Revenue Bonds
JFK International Air Terminal
Series 2010
12/01/42 | | | 6.000 | % | | | 1,350,000 | | | | 1,498,162 | | |
Port Authority of New York & New Jersey(a)
Revenue Bonds
5th Installment-Special Project
Series 1996-4 AMT
10/01/19 | | | 6.750 | % | | | 120,000 | | | | 119,982 | | |
Seneca County Industrial Development Agency
Revenue Bonds
Seneca Meadows, Inc. Project
Series 2005 AMT(a)(e)
10/01/35 | | | 6.625 | % | | | 5,000,000 | | | | 5,063,900 | | |
Suffolk County Industrial Development Agency
Revenue Bonds
Gurwin Jewish-Phase II
Series 2004
05/01/39 | | | 6.700 | % | | | 475,000 | | | | 491,706 | | |
| Total | | | | | | | 23,849,566 | �� | |
| North Carolina 1.6% | |
Charlotte-Mecklenburg Hospital Authority
Refunding Revenue Bonds
Carolinas HealthCare System Group
Series 2008A
01/15/24 | | | 5.250 | % | | | 5,000,000 | | | | 5,663,600 | | |
Durham Housing Authority
Revenue Bonds
Series 2005 AMT(a)(c)(e)
02/01/38 | | | 5.650 | % | | | 3,195,750 | | | | 3,005,635 | | |
North Carolina Eastern Municipal Power Agency
Revenue Bonds
Series 1991A Escrowed to Maturity
01/01/18 | | | 6.500 | % | | | 3,320,000 | | | | 4,309,128 | | |
North Carolina Medical Care Commission
Revenue Bonds
Health Care Housing Arc Projects
Series 2004A
10/01/34 | | | 5.800 | % | | | 1,550,000 | | | | 1,639,481 | | |
| Total | | | | | | | 14,617,844 | | |
| North Dakota 0.3% | |
City of Fargo
Revenue Bonds
Sanford
Series 2011
11/01/31 | | | 6.250 | % | | | 2,500,000 | | | | 2,998,500 | | |
Municipal Bonds (continued)
Issue
Description | | Coupon
Rate | | Principal
Amount ($) | | Value ($) | |
| Ohio 1.5% | |
Buckeye Tobacco Settlement Financing Authority
Asset-Backed Revenue Bonds
Senior Turbo Series 2007A-2
06/01/24 | | | 5.125 | % | | | 7,000,000 | | | | 5,604,550 | | |
Cleveland-Cuyahoga County Port Authority
Revenue Bonds
Fairmount Montessori Association
Series 2005B (Fifth Third Bank)
05/15/25 | | | 5.125 | % | | | 630,000 | | | | 635,179 | | |
County of Lucas
Improvement Refunding Revenue Bonds
Lutheran Homes
Series 2010A
11/01/45 | | | 7.000 | % | | | 5,000,000 | | | | 5,478,450 | | |
Hickory Chase Community Authority
Revenue Bonds
Hickory Chase Project
Series 2008(c)
12/01/38 | | | 7.000 | % | | | 2,300,000 | | | | 1,493,597 | | |
Summit County Port Authority
Revenue Bonds
Seville Projects
Series 2005A
05/15/25 | | | 5.100 | % | | | 395,000 | | | | 379,741 | | |
| Total | | | | | | | 13,591,517 | | |
| Oklahoma 0.5% | |
Oklahoma County Finance Authority
Revenue Bonds
Sail Associates LLC
Series 2007 AMT (Bank of the West)(a)
12/01/41 | | | 5.250 | % | | | 1,475,000 | | | | 1,551,921 | | |
Oklahoma Development Finance Authority
Refunding Revenue Bonds
Inverness Village Community
Series 2012
01/01/32 | | | 6.000 | % | | | 3,000,000 | | | | 3,139,980 | | |
| Total | | | | | | | 4,691,901 | | |
| Oregon 1.2% | |
City of Forest Grove
Revenue Bonds
Campus Improvement-Pacific University Project
Series 2009
05/01/39 | | | 6.375 | % | | | 2,000,000 | | | | 2,098,040 | | |
Oak Tree Foundation Project
Series 2007
03/01/37 | | | 5.500 | % | | | 2,900,000 | | | | 2,925,027 | | |
Cow Creek Band of Umpqua Tribe of Indians
Revenue Bonds
Series 2006C(b)(e)
10/01/26 | | | 5.625 | % | | | 1,700,000 | | | | 1,506,200 | | |
The accompanying Notes to Financial Statements are an integral part of this statement.
Annual Report 2012
18
Columbia High Yield Municipal Fund
Portfolio of Investments (continued)
May 31, 2012
Municipal Bonds (continued)
Issue
Description | | Coupon
Rate | | Principal
Amount ($) | | Value ($) | |
Warm Springs Reservation Confederated Tribe
Revenue Bonds
Pelton Round Butte Tribal
Series 2009B(b)
11/01/33 | | | 6.375 | % | | | 2,410,000 | | | | 2,522,089 | | |
Western Generation Agency
Revenue Bonds
Wauna Cogeneration Project
Series 2006A
01/01/20 | | | 5.000 | % | | | 2,235,000 | | | | 2,207,867 | | |
| Total | | | | | | | 11,259,223 | | |
| Pennsylvania 3.8% | |
Allegheny County Hospital Development Authority
Revenue Bonds
Health System-West Pennsylvania
Series 2007A
11/15/40 | | | 5.375 | % | | | 6,000,000 | | | | 4,981,980 | | |
Bucks County Industrial Development Authority
Revenue Bonds
Ann's Choice, Inc. Facility
Series 2005A
01/01/35 | | | 6.250 | % | | | 1,750,000 | | | | 1,762,302 | | |
Chartiers Valley Industrial & Commercial Development Authority
Refunding Revenue Bonds
Asbury Health Center
12/01/24 | | | 6.375 | % | | | 750,000 | | | | 750,735 | | |
Chester County Industrial Development Authority
RHA/Pennsylvania Nursing Home-1st Mortgage
Series 2002(c)
05/01/32 | | | 8.500 | % | | | 355,000 | | | | 357,581 | | |
Dauphin County Industrial Development Authority
Revenue Bonds
Dauphin Consolidated Water Supply
Series 1992A AMT(a)
06/01/24 | | | 6.900 | % | | | 3,200,000 | | | | 4,100,928 | | |
Montgomery County Industrial Development Authority
Revenue Bonds
Whitemarsh Community Project
Series 2008
02/01/36 | | | 7.000 | % | | | 2,000,000 | | | | 2,101,500 | | |
Whitemarsh Continuing Care
Series 2005
02/01/28 | | | 6.125 | % | | | 1,400,000 | | | | 1,416,814 | | |
| 02/01/35 | | | 6.250 | % | | | 1,350,000 | | | | 1,362,029 | | |
Pennsylvania Economic Development Financing Authority
Revenue Bonds
Allegheny Energy Supply Co.
Series 2009
07/15/39 | | | 7.000 | % | | | 4,000,000 | | | | 4,668,280 | | |
Philadelphia Biosolids Facility
Series 2009
01/01/32 | | | 6.250 | % | | | 3,375,000 | | | | 3,730,219 | | |
Municipal Bonds (continued)
Issue
Description | | Coupon
Rate | | Principal
Amount ($) | | Value ($) | |
Pennsylvania Higher Educational Facilities Authority
Revenue Bonds
Edinboro University Foundation
Series 2010
07/01/30 | | | 5.800 | % | | | 2,500,000 | | | | 2,735,800 | | |
Shippensburg University
Series 2011
10/01/43 | | | 6.250 | % | | | 2,000,000 | | | | 2,200,140 | | |
Pennsylvania Industrial Development Authority
Prerefunded 07/01/18 Revenue Bonds
Economic Development
Series 2008
07/01/23 | | | 5.500 | % | | | 295,000 | | | | 372,561 | | |
Refunding Revenue Bonds
Economic Development
Series 2008
07/01/23 | | | 5.500 | % | | | 2,060,000 | | | | 2,396,604 | | |
Philadelphia Authority for Industrial Development
Revenue Bonds
Facilities Aero Philadelphia LLC
Series 1999 AMT(a)(c)
01/01/24 | | | 5.500 | % | | | 800,000 | | | | 628,976 | | |
Philadelphia Redevelopment Authority
Revenue Bonds
Transformation Initiative
Series 2012
04/15/21 | | | 5.000 | % | | | 2,000,000 | | | | 2,354,320 | | |
| Total | | | | | | | 35,920,769 | | |
| Puerto Rico 0.4% | |
Puerto Rico Industrial Tourist Educational, Medical & Environmental Control Facilities Financing Authority
Revenue Bonds
AES Puerto Rico Project
Series 2000 AMT(a)(b)
06/01/26 | | | 6.625 | % | | | 3,820,000 | | | | 3,834,478 | | |
| South Carolina 1.4% | |
Laurens County School District No. 055
Revenue Bonds
Series 2005
12/01/30 | | | 5.250 | % | | | 1,300,000 | | | | 1,357,330 | | |
South Carolina Jobs-Economic Development Authority
Refunding Revenue Bonds
1st Mortgage-Lutheran Homes
Series 2007
05/01/21 | | | 5.375 | % | | | 1,000,000 | | | | 1,016,120 | | |
| 05/01/28 | | | 5.500 | % | | | 2,300,000 | | | | 2,302,829 | | |
1st Mortgage-Wesley Commons
Series 2006
10/01/36 | | | 5.300 | % | | | 3,000,000 | | | | 2,749,980 | | |
Revenue Bonds
Kershaw County Medical Center Project
Series 2008
09/15/38 | | | 6.000 | % | | | 5,050,000 | | | | 5,521,216 | | |
| Total | | | | | | | 12,947,475 | | |
The accompanying Notes to Financial Statements are an integral part of this statement.
Annual Report 2012
19
Columbia High Yield Municipal Fund
Portfolio of Investments (continued)
May 31, 2012
Municipal Bonds (continued)
Issue
Description | | Coupon
Rate | | Principal
Amount ($) | | Value ($) | |
| South Dakota 0.2% | |
South Dakota Economic Development Finance Authority
Revenue Bonds
Pooled Loan Program-Davis Family
Series 2004-4A AMT(a)
04/01/29 | | | 6.000 | % | | | 1,400,000 | | | | 1,449,434 | | |
South Dakota Health & Educational Facilities Authority
Revenue Bonds
Avera Health
Series 2012A
07/01/42 | | | 5.000 | % | | | 600,000 | | | | 642,468 | | |
| Total | | | | | | | 2,091,902 | | |
| Tennessee 0.1% | |
Shelby County Health Educational & Housing Facilities Board
Revenue Bonds
Germantown Village
Series 2003A
12/01/34 | | | 7.250 | % | | | 675,000 | | | | 678,220 | | |
Series 2006
12/01/34 | | | 6.250 | % | | | 475,000 | | | | 441,764 | | |
| Total | | | | | | | 1,119,984 | | |
| Texas 6.9% | |
Abilene Health Facilities Development Corp.
Revenue Bonds
Sears Methodist Retirement System
Series 1998A
11/15/25 | | | 5.900 | % | | | 1,300,000 | | | | 988,286 | | |
Series 2003A
11/15/33 | | | 7.000 | % | | | 800,000 | | | | 632,696 | | |
Capital Area Cultural Education Facilities Finance Corp.
Revenue Bonds
Roman Catholic Diocese
Series 2005B
04/01/45 | | | 6.125 | % | | | 5,000,000 | | | | 5,427,950 | | |
Central Texas Regional Mobility Authority
Revenue Bonds
Subordinated Lien
Series 2011
01/01/41 | | | 6.750 | % | | | 5,000,000 | | | | 5,567,450 | | |
City of Houston Airport System(a)
Refunding Revenue Bonds
Special Facilities Continental
Series 2011A AMT
07/15/38 | | | 6.625 | % | | | 4,000,000 | | | | 4,352,000 | | |
Subordinate Lien
Series 2012A AMT
07/01/25 | | | 5.000 | % | | | 5,000,000 | | | | 5,650,600 | | |
Dallas County Flood Control District No. 1
Unlimited General Obligation Refunding Bonds
Series 2002
04/01/32 | | | 7.250 | % | | | 1,000,000 | | | | 1,018,210 | | |
Municipal Bonds (continued)
Issue
Description | | Coupon
Rate | | Principal
Amount ($) | | Value ($) | |
Deaf Smith County Hospital District
Limited General Obligation Bonds
Series 2010A
03/01/40 | | | 6.500 | % | | | 4,000,000 | | | | 4,375,840 | | |
El Paso County Housing Finance Corp.(c)
Subordinated Revenue Bonds
American Village Communities Projects
Series 2000C
12/01/32 | | | 8.000 | % | | | 535,000 | | | | 536,642 | | |
Series 2000D
12/01/32 | | | 10.000 | % | | | 645,000 | | | | 647,058 | | |
Gulf Coast Industrial Development Authority
Revenue Bonds
Citgo Petroleum Project
Series 1998 AMT(a)
04/01/28 | | | 8.000 | % | | | 875,000 | | | | 876,286 | | |
HFDC of Central Texas, Inc.
Revenue Bonds
Sears Tyler Methodist
Series 2009A
11/15/44 | | | 7.750 | % | | | 4,000,000 | | | | 3,364,440 | | |
Series 2006A
11/01/36 | | | 5.750 | % | | | 5,000,000 | | | | 4,791,200 | | |
Houston Health Facilities Development Corp.
Revenue Bonds
Buckingham Senior Living Community
Series 2004A
02/15/34 | | | 7.125 | % | | | 1,000,000 | | | | 1,123,200 | | |
La Vernia Higher Education Finance Corp.
Revenue Bonds
Kipp, Inc.
Series 2009A
08/15/29 | | | 6.000 | % | | | 1,000,000 | | | | 1,112,810 | | |
| 08/15/39 | | | 6.250 | % | | | 1,500,000 | | | | 1,690,365 | | |
Mission Economic Development Corp
Revenue Bonds
Dallas Clean Energy McCommas
Series 2011 AMT(a)
12/01/24 | | | 6.875 | % | | | 5,000,000 | | | | 5,314,000 | | |
North Texas Tollway Authority
Refunding Revenue Bonds
Toll 2nd Tier
Series 2008F
01/01/38 | | | 5.750 | % | | | 2,645,000 | | | | 2,875,856 | | |
Revenue Bonds
1st Tier
Series 2009A
01/01/39 | | | 6.250 | % | | | 1,500,000 | | | | 1,709,415 | | |
Pharr Higher Education Finance Authority
Revenue Bonds
Idea Public Schools
Series 2009A
08/15/39 | | | 6.500 | % | | | 3,000,000 | | | | 3,298,500 | | |
The accompanying Notes to Financial Statements are an integral part of this statement.
Annual Report 2012
20
Columbia High Yield Municipal Fund
Portfolio of Investments (continued)
May 31, 2012
Municipal Bonds (continued)
Issue
Description | | Coupon
Rate | | Principal
Amount ($) | | Value ($) | |
Tarrant County Cultural Education Facilities Finance Corp.
Revenue Bonds
Air Force Village
Series 2009
11/15/44 | | | 6.375 | % | | | 4,250,000 | | | | 4,615,372 | | |
CC Young Memorial Home
Series 2009A
02/15/38 | | | 8.000 | % | | | 4,000,000 | | | | 4,313,400 | | |
| Total | | | | | | | 64,281,576 | | |
| Vermont 0.1% | |
Vermont Educational & Health Buildings Financing Agency
Prerefunded 01/01/14 Revenue Bonds
Vermont Law School Project
Series 2003A
01/01/33 | | | 5.500 | % | | | 500,000 | | | | 540,120 | | |
| Virgin Islands 0.5% | |
Virgin Islands Water & Power Authority
Refunding Revenue Bonds
Series 2012A
07/01/21 | | | 4.000 | % | | | 5,000,000 | | | | 4,975,400 | | |
| Virginia 2.0% | |
Mosaic District Community Development Authority
Special Assessment Bonds
Series 2011A
03/01/36 | | | 6.875 | % | | | 2,500,000 | | | | 2,756,000 | | |
Tobacco Settlement Financing Corp.
Revenue Bonds
Senior Series 2007-B1
06/01/47 | | | 5.000 | % | | | 19,000,000 | | | | 12,540,760 | | |
Virginia Small Business Financing Authority
Revenue Bonds
Hampton Roads Proton
Series 2009B
07/01/19 | | | 8.000 | % | | | 2,895,000 | | | | 3,127,063 | | |
| Total | | | | | | | 18,423,823 | | |
| Washington 0.1% | |
Seattle Housing Authority
Revenue Bonds
Capital Fund Program-High Rise Rehab
Series 2005I (AGM) AMT(a)
11/01/25 | | | 5.000 | % | | | 1,000,000 | | | | 1,043,290 | | |
| Wisconsin 1.3% | |
Wisconsin Health & Educational Facilities Authority
Refunding Revenue Bonds
Clement Manor, Inc.
Series 1998
08/15/24 | | | 5.750 | % | | | 2,152,000 | | | | 2,152,344 | | |
Municipal Bonds (continued)
Issue
Description | | Coupon
Rate | | Principal
Amount ($) | | Value ($) | |
Revenue Bonds
Fort Healthcare, Inc. Project
Series 2004
05/01/34 | | | 6.100 | % | | | 1,965,000 | | | | 2,093,098 | | |
Medical College of Wisconsin
Series 2008A
12/01/35 | | | 5.250 | % | | | 5,000,000 | | | | 5,336,950 | | |
St. John's Community, Inc.
Series 2009A
09/15/39 | | | 7.625 | % | | | 1,750,000 | | | | 1,992,585 | | |
St. Johns Communities, Inc.
Series 2009C-1
09/15/15 | | | 6.400 | % | | | 335,000 | | | | 335,704 | | |
| Total | | | | | | | 11,910,681 | | |
| Wyoming 0.4% | |
County of Campbell
Pollution Control Refunding Revenue Bonds
Black Hills Power, Inc. Project
Series 2004
10/01/24 | | | 5.350 | % | | | 3,250,000 | | | | 3,379,513 | | |
Total Municipal Bonds
(Cost: $801,991,457) | | | | | | | 830,022,990 | | |
Floating Rate Notes 0.5%
Issue
Description | | Effective
Yield | | Amount Payable
at Maturity ($) | | Value ($) | |
| Nevada 0.5% | |
Las Vegas Valley Water District
Limited General Obligation Bonds
Water Improvement
VRDN Series 2006C (Dexia Credit Local)(i)
06/01/36 | | | 0.430 | % | | | 5,000,000 | | | | 5,000,000 | | |
Total Floating Rate Notes
(Cost: $5,000,000) | | | | | | | 5,000,000 | | |
Municipal Short Term 0.9%
Issue
Description | | Coupon
Rate | | Principal
Amount ($) | | Value ($) | |
| New Jersey 0.4% | |
City of Newark
Unlimited General Obligation Notes
TAN Series 2012A
02/20/13 | | | 2.400 | % | | | 3,500,000 | | | | 3,506,685 | | |
The accompanying Notes to Financial Statements are an integral part of this statement.
Annual Report 2012
21
Columbia High Yield Municipal Fund
Portfolio of Investments (continued)
May 31, 2012
Municipal Short Term (continued)
Issue
Description | | Coupon
Rate | | Principal
Amount ($) | | Value ($) | |
| New York 0.5% | |
County of Rockland
Limited General Obligation Notes
Series 2012 (TAN)
03/06/13 | | | 2.500 | % | | | 5,000,000 | | | | 5,030,650 | | |
Total Municipal Short Term
(Cost: $8,538,917) | | | | | | | 8,537,335 | | |
Money Market Funds 8.8%
| | | Shares | | Value ($) | |
Dreyfus Tax-Exempt Cash
Management Fund, 0.000%(j) | | | 33,683,533 | | | | 33,683,533 | | |
JPMorgan Municipal Money
Market Fund, 0.000%(j) | | | 49,020,318 | | | | 49,020,318 | | |
Total Money Market Funds
(Cost: $82,703,851) | | | | | 82,703,851 | | |
Total Investments
(Cost: $898,234,225) | | | | | 926,264,176 | | |
| Other Assets & Liabilities, Net | | | | | 11,982,544 | | |
| Total Net Assets | | | | | 938,246,720 | | |
Notes to Portfolio of Investments
(a) At May 31, 2012, the value of securities subject to alternative minimum tax was $95,299,255, representing 10.16% of net assets.
(b) Municipal obligations include debt obligations issued by or on behalf of territories, possessions, or sovereign nations within the territorial boundaries of the United States. At May 31, 2012, the value of these securities amounted to $32,585,866 or 3.47% of net assets.
(c) Identifies issues considered to be illiquid as to their marketability. The aggregate value of such securities at May 31, 2012 was $34,349,932, representing 3.66% of net assets. Information concerning such security holdings at May 31, 2012 was as follows:
| Security Description | | Acquisition Dates | | Cost ($) | |
Arizona Health Facilities Authority
Refunding Revenue Bonds
Phoenix Memorial Hospital
Series 1991
06/01/12 8.125% | | 05/23/91 | | | 1,783,069 | | |
Broward County Housing Finance Authority
Revenue Bonds
Chaves Lake Apartments Project
Series 2000A AMT
07/01/40 7.500% | | 03/07/00 - 05/21/07 | | | 1,497,078 | | |
Cabazon Band Mission Indians
Revenue Bonds
Series 2004
06/01/12 13.000% | | 05/14/10 | | | 370,523 | | |
Cabazon Band Mission Indians
Revenue Bonds
Series 2004
10/01/15 8.375% | | 10/04/04 - 05/14/10 | | | 510,005 | | |
The accompanying Notes to Financial Statements are an integral part of this statement.
Annual Report 2012
22
Columbia High Yield Municipal Fund
Portfolio of Investments (continued)
May 31, 2012
Notes to Portfolio of Investments (continued)
| Security Description | | Acquisition Dates | | Cost ($) | |
Cabazon Band Mission Indians
Revenue Bonds
Series 2004
10/01/19 8.750% | | 10/04/04 - 05/14/10 | | | 2,498,267 | | |
Cabazon Band Mission Indians
Revenue Bonds
Series 2010
10/01/20 8.375% | | 05/14/10 | | | 1,420,000 | | |
California Municipal Finance Authority
Revenue Bonds
UTS Renewable Energy-Waste Water
Series 2011 AMT
12/01/15 3.950% | | 12/22/11 | | | 1,415,000 | | |
California Municipal Finance Authority
Revenue Bonds
UTS Renewable Energy-Waste Water
Series 2011 AMT
12/01/32 7.500% | | 12/22/11 | | | 1,925,000 | | |
California Statewide Communities Development Authority
Revenue Bonds
San Francisco Art Institute
Series 2002
04/01/32 7.375% | | 07/05/02 | | | 250,000 | | |
Capital Trust Agency, Inc.
Revenue Bonds
Orlando Project
Series 2003 AMT
01/01/32 6.750% | | 06/05/03 | | | 632,767 | | |
Capital Trust Agency, Inc.
Revenue Bonds
Atlantic Housing Foundation
Subordinated Series 2008B
07/15/32 7.000% | | 07/23/08 | | | 1,425,000 | | |
Chester County Industrial Development Authority
RHA/Pennsylvania Nursing Home-1st Mortgage
Series 2002
05/01/32 8.500% | | 05/01/02 | | | 330,710 | | |
City of Wilmington
Revenue Bonds
Housing-Electra Arms Senior Associates Project
Series 1998 AMT
06/01/28 6.250% | | 10/08/98 | | | 743,716 | | |
Durham Housing Authority
Revenue Bonds
Series 2005 AMT
02/01/38 5.650% | | 12/18/06 | | | 3,195,750 | | |
El Paso County Housing Finance Corp.
Subordinated Revenue Bonds
American Village Communities Projects
Series 2000C
12/01/32 8.000% | | 12/18/00 | | | 535,000 | | |
The accompanying Notes to Financial Statements are an integral part of this statement.
Annual Report 2012
23
Columbia High Yield Municipal Fund
Portfolio of Investments (continued)
May 31, 2012
Notes to Portfolio of Investments (continued)
| Security Description | | Acquisition Dates | | Cost ($) | |
El Paso County Housing Finance Corp.
Subordinated Revenue Bonds
American Village Communities Projects
Series 2000D
12/01/32 10.000% | | 12/18/00 | | | 645,000 | | |
Hickory Chase Community Authority
Revenue Bonds
Hickory Chase Project
Series 2008
12/01/38 7.000% | | 04/23/08 | | | 2,300,000 | | |
Illinois Finance Authority
Revenue Bonds
Leafs Hockey Club Project
Series 2007A
03/01/37 6.000% | | 09/09/10 | | | 973,488 | | |
Illinois Finance Authority
Revenue Bonds
Monarch Landing, Inc. Facility
Series 2007A
12/01/27 7.000% | | 03/27/09 | | | 872,028 | | |
Illinois Finance Authority
Revenue Bonds
Sedgebrook, Inc. Facility
Series 2007A
11/15/37 6.000% | | 08/09/07 | | | 3,645,830 | | |
Illinois Finance Authority
Revenue Bonds
Sedgebrook, Inc. Facility
Series 2007A
11/15/42 6.000% | | 03/26/09 | | | 708,598 | | |
Louisiana Public Facilities Authority
Revenue Bonds
Progressive Healthcare
Series 1998
10/01/28 6.375% | | 10/16/98 | | | 1,970,713 | | |
Massachusetts Development Finance Agency
Revenue Bonds
Groves-Lincoln
Series 2009A
06/01/44 7.875% | | 11/12/09 | | | 1,478,457 | | |
Massachusetts Development Finance Agency
Revenue Bonds
Health Care Facility-Alliance
Series 1999A
07/01/32 7.100% | | 09/02/99 | | | 2,023,942 | | |
Massachusetts Development Finance Agency
Revenue Bonds
Linden Ponds, Inc. Facility
Series 2011B
11/15/56 0.000% | | 12/10/07 - 02/24/10 | | | 14,895 | | |
Massachusetts Development Finance Agency
Revenue Bonds
Series 2009B-1
06/01/16 7.250% | | 11/12/09 | | | 3,500,000 | | |
The accompanying Notes to Financial Statements are an integral part of this statement.
Annual Report 2012
24
Columbia High Yield Municipal Fund
Portfolio of Investments (continued)
May 31, 2012
Notes to Portfolio of Investments (continued)
| Security Description | | Acquisition Dates | | Cost ($) | |
Michigan Strategic Fund
Refunding Revenue Bonds
Michigan Sugar Co.-Carollton
Series 1998C AMT
11/01/25 6.550% | | 11/24/98 | | | 1,500,000 | | |
Middlesex County Improvement Authority
Revenue Bonds
Heldrich Center Hotel
Series 2005C
01/01/37 8.750% | | 06/28/06 | | | 1,228,125 | | |
Middlesex County Improvement Authority
Subordinated Revenue Bonds
Heldrich Center Hotel
Series 2005B
01/01/25 6.125% | | 10/01/09 | | | 508,750 | | |
Middlesex County Improvement Authority
Subordinated Revenue Bonds
Heldrich Center Hotel
Series 2005B
01/01/37 6.250% | | 03/18/05 - 10/01/09 | | | 4,614,875 | | |
Munimae TE Bond Subsidiary LLC
06/30/49 5.800% | | 10/14/04 | | | 1,000,000 | | |
New York Liberty Development Corp.
Revenue Bonds
National Sports Museum Project
Series 2006A
02/15/19 6.125% | | 08/07/06 - 05/28/08 | | | 1,985,478 | | |
Oakmont Grove Community Development District
Special Assessment Bonds
Series 2007A
05/01/38 5.400% | | 02/21/07 | | | 1,194,000 | | |
Oakmont Grove Community Development District
Special Assessment Bonds
Series 2007B
05/01/12 5.250% | | 02/21/07 | | | 1,000,000 | | |
Philadelphia Authority for Industrial Development
Revenue Bonds
Facilities Aero Philadelphia LLC
Series 1999 AMT
01/01/24 5.500% | | 04/14/99 | | | 776,568 | | |
Rankin County Five Lakes Utility District
Series 1994
07/15/37 7.000% | | 10/02/07 | | | 250,000 | | |
Resolution Trust Corp.
Pass-Through Certificates
Series 1993A
12/01/16 8.500% | | 11/12/93 | | | 459,061 | | |
Sweetwater Creek Community Development District
Special Assessment Bonds
Series 2007A
05/01/38 5.500% | | 04/26/07 - 05/12/09 | | | 2,795,798 | | |
The accompanying Notes to Financial Statements are an integral part of this statement.
Annual Report 2012
25
Columbia High Yield Municipal Fund
Portfolio of Investments (continued)
May 31, 2012
Notes to Portfolio of Investments (continued)
| Security Description | | Acquisition Dates | | Cost ($) | |
Village of Bolingbrook
Sales Tax Revenue Bonds
Series 2005
01/01/24 6.2500% | | 12/14/05 | | | 1,362,574 | | |
West Villages Improvement District
Special Assessment Bonds
Unit of Development No. 3
Series 2006
05/01/37 0.000% | | 04/19/06 - 05/18/06 | | | 1,646,024 | | |
Westridge Community Development District
Special Assessment Bonds
Series 2005
05/01/37 5.500% | | 12/22/05 | | | 2,650,000 | | |
(d) Represents securities that have defaulted on payment of interest. The Fund has stopped accruing interest on these securities. At May 31, 2012, the value of these securities amounted to $8,353,644, which represents 0.89% of net assets.
(e) Security exempt from registration pursuant to Rule 144A under the Securities Act of 1933. This security may be resold in transactions exempt from registration, normally to qualified institutional buyers. At May 31, 2012, the value of these securities amounted to $29,855,594 or 3.18% of net assets.
(f) Zero coupon bond.
(g) Variable rate security. The interest rate shown reflects the rate as of May 31, 2012.
(h) Represents a security purchased on a when-issued or delayed delivery basis.
(i) The Fund is entitled to receive principal and interest from the party, if indicated in parentheses, after a day or a week's notice or upon maturity. The maturity date disclosed represents the final maturity. Interest rate varies to reflect current market conditions, rate shown is the effective rate on May 31, 2012.
(j) The rate shown is the seven-day current annualized yield at May 31, 2012.
Abbreviation Legend
AGM Assured Guaranty Municipal Corporation
AMBAC Ambac Assurance Corporation
AMT Alternative Minimum Tax
BAN Bond Anticipation Note
FNMA Federal National Mortgage Association
GNMA Government National Mortgage Association
NPFGC National Public Finance Guarantee Corporation
TAN Tax Anticipation Note
VRDN Variable Rate Demand Note
The accompanying Notes to Financial Statements are an integral part of this statement.
Annual Report 2012
26
Columbia High Yield Municipal Fund
Portfolio of Investments (continued)
May 31, 2012
Fair Value Measurements
Generally accepted accounting principles (GAAP) require disclosure regarding the inputs and valuation techniques used to measure fair value and any changes in valuation inputs or techniques. In addition, investments shall be disclosed by major category.
The Fund categorizes its fair value measurements according to a three-level hierarchy that maximizes the use of observable inputs and minimizes the use of unobservable inputs by prioritizing that the most observable input be used when available. Observable inputs are those that market participants would use in pricing an investment based on market data obtained from sources independent of the reporting entity. Unobservable inputs are those that reflect the Fund's assumptions about the information market participants would use in pricing an investment. An investment's level within the fair value hierarchy is based on the lowest level of any input that is deemed significant to the asset or liability's fair value measurement. The input levels are not necessarily an indication of the risk or liquidity associated with investments at that level. For example, certain U.S. government securities are generally high quality and liquid, however, they are reflected as Level 2 because the inputs used to determine fair value may not always be quoted prices in an active market.
Fair value inputs are summarized in the three broad levels listed below:
> Level 1 — Valuations based on quoted prices for investments in active markets that the Fund has the ability to access at the measurement date (including NAV for open-end mutual funds). Valuation adjustments are not applied to Level 1 investments.
> Level 2 — Valuations based on other significant observable inputs (including quoted prices for similar securities, interest rates, prepayment speeds, credit risks, etc.).
> Level 3 — Valuations based on significant unobservable inputs (including the Fund's own assumptions and judgment in determining the fair value of investments).
Inputs that are used in determining fair value of an investment may include price information, credit data, volatility statistics, and other factors. These inputs can be either observable or unobservable. The availability of observable inputs can vary between investments, and is affected by various factors such as the type of investment, and the volume and level of activity for that investment or similar investments in the marketplace. The inputs will be considered by the Investment Manager, along with any other relevant factors in the calculation of an investment's fair value. The Fund uses prices and inputs that are current as of the measurement date, which may include periods of market dislocations. During these periods, the availability of prices and inputs may be reduced for many investments. This condition could cause an investment to be reclassified between the various levels within the hierarchy.
Investments falling into the Level 3 category are primarily supported by quoted prices from brokers and dealers participating in the market for those investments. However, these may be classified as Level 3 investments due to lack of market transparency and corroboration to support these quoted prices. Additionally, valuation models may be used as the pricing source for any remaining investments classified as Level 3. These models rely on one or more significant unobservable inputs and/or significant assumptions by the Investment Manager. Inputs used in valuations may include, but are not limited to, financial statement analysis, capital account balances, discount rates and estimated cash flows, and comparable company data.
The accompanying Notes to Financial Statements are an integral part of this statement.
Annual Report 2012
27
Columbia High Yield Municipal Fund
Portfolio of Investments (continued)
May 31, 2012
The following table is a summary of the inputs used to value the Fund's investments at May 31, 2012:
| Description | | Level 1
Quoted Prices in Active
Markets for Identical
Assets ($) | | Level 2
Other Significant
Observable Inputs ($) | | Level 3
Significant
Unobservable Inputs ($) | | Total ($) | |
| Bonds | |
| Municipal Bonds | | | — | | | | 830,022,990 | | | | — | | | | 830,022,990 | | |
| Total Bonds | | | — | | | | 830,022,990 | | | | — | | | | 830,022,990 | | |
| Short-Term Securities | |
| Floating Rate Notes | | | — | | | | 5,000,000 | | | | — | | | | 5,000,000 | | |
| Municipal Short Term | | | — | | | | 8,537,335 | | | | — | | | | 8,537,335 | | |
| Total Short-Term Securities | | | — | | | | 13,537,335 | | | | — | | | | 13,537,335 | | |
| Other | |
| Money Market Funds | | | 82,703,851 | | | | — | | | | — | | | | 82,703,851 | | |
| Total Other | | | 82,703,851 | | | | — | | | | — | | | | 82,703,851 | | |
| Total | | | 82,703,851 | | | | 843,560,325 | | | | — | | | | 926,264,176 | | |
See the Portfolio of Investments for all investment classifications not indicated in the table.
The Fund's assets assigned to the Level 2 input category are generally valued using the market approach, in which a security's value is determined through reference to prices and information from market transactions for similar or identical assets.
There were no transfers of financial assets between Levels 1 and 2 during the period.
The accompanying Notes to Financial Statements are an integral part of this statement.
Annual Report 2012
28
Columbia High Yield Municipal Fund
Statement of Assets and Liabilities
May 31, 2012
| Assets | |
| Investments, at value (identified cost $898,234,225) | | $ | 926,264,176 | | |
| Receivable for: | |
| Investments sold | | | 3,421,219 | | |
| Capital shares sold | | | 1,978,502 | | |
| Interest | | | 13,660,472 | | |
| Expense reimbursement due from Investment Manager | | | 4,893 | | |
| Trustees' deferred compensation plan | | | 62,368 | | |
| Total assets | | | 945,391,630 | | |
| Liabilities | |
| Payable for: | |
| Investments purchased on a delayed delivery basis | | | 2,657,250 | | |
| Capital shares purchased | | | 710,337 | | |
| Dividend distributions to shareholders | | | 3,528,976 | | |
| Investment management fees | | | 12,020 | | |
| Distribution and service fees | | | 836 | | |
| Transfer agent fees | | | 115,694 | | |
| Administration fees | | | 1,731 | | |
| Compensation of board members | | | 672 | | |
| Chief compliance officer expenses | | | 124 | | |
| Other expenses | | | 54,902 | | |
| Trustees' deferred compensation plan | | | 62,368 | | |
| Total liabilities | | | 7,144,910 | | |
| Net assets applicable to outstanding capital stock | | $ | 938,246,720 | | |
| Represented by | |
| Paid-in capital | | $ | 988,034,997 | | |
| Undistributed net investment income | | | 4,144,228 | | |
| Accumulated net realized loss | | | (81,962,456 | ) | |
| Unrealized appreciation (depreciation) on: | |
| Investments | | | 28,029,951 | | |
| Total — representing net assets applicable to outstanding capital stock | | $ | 938,246,720 | | |
The accompanying Notes to Financial Statements are an integral part of this statement.
Annual Report 2012
29
Columbia High Yield Municipal Fund
Statement of Assets and Liabilities (continued)
May 31, 2012
| Class A | |
| Net assets | | $ | 93,456,083 | | |
| Shares outstanding | | | 8,907,571 | | |
| Net asset value per share | | $ | 10.49 | | |
| Maximum offering price per share(a) | | $ | 11.01 | | |
| Class B | |
| Net assets | | $ | 2,141,597 | | |
| Shares outstanding | | | 204,132 | | |
| Net asset value per share | | $ | 10.49 | | |
| Class C | |
| Net assets | | $ | 12,525,441 | | |
| Shares outstanding | | | 1,193,902 | | |
| Net asset value per share | | $ | 10.49 | | |
| Class Z | |
| Net assets | | $ | 830,123,599 | | |
| Shares outstanding | | | 79,114,184 | | |
| Net asset value per share | | $ | 10.49 | | |
(a) The maximum offering price per share is calculated by dividing the net asset value by 1.0 minus the maximum sales charge of 4.75%.
The accompanying Notes to Financial Statements are an integral part of this statement.
Annual Report 2012
30
Columbia High Yield Municipal Fund
Statement of Operations
Year ended May 31, 2012
| | | Year Ended
May 31,
2012(a) | | Year Ended
June 30,
2011 | |
| Net investment income | |
| Income: | |
| Dividends | | $ | 15,055 | | | $ | 16,779 | | |
| Interest | | | 41,766,543 | | | | 47,452,058 | | |
| Total income | | | 41,781,598 | | | | 47,468,837 | | |
| Expenses: | |
| Investment management fees | | | 3,435,899 | | | | 3,084,968 | | |
| Distribution fees | |
| Class B | | | 17,123 | | | | 35,374 | | |
| Class C | | | 68,464 | | | | 69,938 | | |
| Service fees | |
| Class A | | | 140,644 | | | | 142,778 | | |
| Class B | | | 4,566 | | | | 9,433 | | |
| Class C | | | 18,262 | | | | 18,652 | | |
| Transfer agent fees | |
| Class A | | | 121,801 | | | | 81,748 | | |
| Class B | | | 4,287 | | | | 5,058 | | |
| Class C | | | 15,661 | | | | 11,171 | | |
| Class Z | | | 1,126,981 | | | | 798,789 | | |
| Administration fees | | | 498,162 | | | | 827,759 | | |
| Compensation of board members | | | 34,672 | | | | 45,953 | | |
| Pricing and bookkeeping fees | | | — | | | | 166,025 | | |
| Custodian fees | | | 13,397 | | | | 25,453 | | |
| Printing and postage fees | | | 48,573 | | | | 76,906 | | |
| Registration fees | | | 68,916 | | | | 67,374 | | |
| Professional fees | | | 72,144 | | | | 102,511 | | |
| Chief compliance officer expenses | | | 453 | | | | 2,014 | | |
| Line of credit interest expense | | | — | | | | 119 | | |
| Other | | | 129,106 | | | | 27,970 | | |
| Total expenses | | | 5,819,111 | | | | 5,599,993 | | |
| Fees waived or expenses reimbursed by Investment Manager and its affiliates | | | (1,189,180 | ) | | | (448,081 | ) | |
| Fees waived by Distributor — Class C | | | (13,678 | ) | | | (13,980 | ) | |
| Interest expense reimbursement by Investment Manager | | | — | | | | (119 | ) | |
| Expense reductions | | | (1,001 | ) | | | (76 | ) | |
| Total net expenses | | | 4,615,252 | | | | 5,137,737 | | |
| Net investment income | | | 37,166,346 | | | | 42,331,100 | | |
| Realized and unrealized gain (loss) — net | |
| Net realized gain (loss) on: | |
| Investments | | | (4,840,201 | ) | | | (7,614,866 | ) | |
| Net realized loss | | | (4,840,201 | ) | | | (7,614,866 | ) | |
| Net change in unrealized appreciation (depreciation) on: | |
| Investments | | | 74,277,418 | | | | (9,701,549 | ) | |
| Net change in unrealized appreciation (depreciation) | | | 74,277,418 | | | | (9,701,549 | ) | |
| Net realized and unrealized gain (loss) | | | 69,437,217 | | | | (17,316,415 | ) | |
| Net increase in net assets resulting from operations | | $ | 106,603,563 | | | $ | 25,014,685 | | |
(a) For the period from July 1, 2011 to May 31, 2012. During the period, the Fund's fiscal year end was changed from June 30 to May 31.
The accompanying Notes to Financial Statements are an integral part of this statement.
Annual Report 2012
31
Columbia High Yield Municipal Fund
Statement of Changes in Net Assets
| | | Year Ended
May 31,
2012(a) | | Year Ended
June 30,
2011 | | Year Ended
June 30,
2010 | |
| Operations | |
| Net investment income | | $ | 37,166,346 | | | $ | 42,331,100 | | | $ | 39,411,035 | | |
| Net realized loss | | | (4,840,201 | ) | | | (7,614,866 | ) | | | (2,150,911 | ) | |
| Net change in unrealized appreciation (depreciation) | | | 74,277,418 | | | | (9,701,549 | ) | | | 71,014,028 | | |
| Net increase in net assets resulting from operations | | | 106,603,563 | | | | 25,014,685 | | | | 108,274,152 | | |
| Distributions to shareholders: | |
| Net investment income | |
| Class A | | | (3,362,006 | ) | | | (3,762,746 | ) | | | (3,738,375 | ) | |
| Class B | | | (93,334 | ) | | | (213,473 | ) | | | (336,155 | ) | |
| Class C | | | (380,756 | ) | | | (440,310 | ) | | | (429,275 | ) | |
| Class Z | | | (32,363,711 | ) | | | (36,635,531 | ) | | | (34,347,738 | ) | |
| Total distributions to shareholders | | | (36,199,807 | ) | | | (41,052,060 | ) | | | (38,851,543 | ) | |
| Increase (decrease) in net assets from share transactions | | | 151,225,492 | | | | (32,194,792 | ) | | | 120,771,323 | | |
| Total increase (decrease) in net assets | | | 221,629,248 | | | | (48,232,167 | ) | | | 190,193,932 | | |
| Net assets at beginning of year | | | 716,617,472 | | | | 764,849,639 | | | | 574,655,707 | | |
| Net assets at end of year | | $ | 938,246,720 | | | $ | 716,617,472 | | | $ | 764,849,639 | | |
| Undistributed net investment income | | $ | 4,144,228 | | | $ | 3,211,890 | | | $ | 1,728,108 | | |
(a) For the period from July 1, 2011 to May 31, 2012. During the period, the Fund's fiscal year end was changed from June 30 to May 31.
The accompanying Notes to Financial Statements are an integral part of this statement.
Annual Report 2012
32
Columbia High Yield Municipal Fund
Statement of Changes in Net Assets (continued)
| | | Year Ended May 31, 2012(a) | | Year Ended June 30, 2011 | | Year Ended June 30, 2010 | |
| | | Shares | | Dollars($) | | Shares | | Dollars($) | | Shares | | Dollars($) | |
| Capital stock activity | |
| Class A shares | |
| Subscriptions(b) | | | 3,421,975 | | | | 34,610,259 | | | | 1,137,035 | | | | 11,028,366 | | | | 2,724,407 | | | | 25,945,561 | | |
| Distributions reinvested | | | 206,541 | | | | 2,083,885 | | | | 187,768 | | | | 1,805,692 | | | | 204,643 | | | | 1,945,394 | | |
| Redemptions | | | (1,351,141 | ) | | | (13,709,963 | ) | | | (2,956,583 | ) | | | (28,527,441 | ) | | | (1,403,983 | ) | | | (13,328,513 | ) | |
| Net increase (decrease) | | | 2,277,375 | | | | 22,984,181 | | | | (1,631,780 | ) | | | (15,693,383 | ) | | | 1,525,067 | | | | 14,562,442 | | |
| Class B shares | |
| Subscriptions | | | 11,671 | | | | 116,434 | | | | 16,363 | | | | 164,369 | | | | 21,015 | | | | 200,054 | | |
| Distributions reinvested | | | 4,199 | | | | 42,087 | | | | 8,469 | | | | 81,838 | | | | 15,765 | | | | 149,362 | | |
| Redemptions(b) | | | (129,615 | ) | | | (1,285,280 | ) | | | (320,806 | ) | | | (3,058,590 | ) | | | (378,136 | ) | | | (3,574,031 | ) | |
| Net decrease | | | (113,745 | ) | | | (1,126,759 | ) | | | (295,974 | ) | | | (2,812,383 | ) | | | (341,356 | ) | | | (3,224,615 | ) | |
| Class C shares | |
| Subscriptions | | | 422,422 | | | | 4,279,116 | | | | 252,510 | | | | 2,460,215 | | | | 231,532 | | | | 2,197,355 | | |
| Distributions reinvested | | | 19,728 | | | | 199,180 | | | | 20,046 | | | | 193,009 | | | | 19,728 | | | | 187,674 | | |
| Redemptions | | | (134,415 | ) | | | (1,351,969 | ) | | | (337,433 | ) | | | (3,210,904 | ) | | | (249,583 | ) | | | (2,374,418 | ) | |
| Net increase (decrease) | | | 307,735 | | | | 3,126,327 | | | | (64,877 | ) | | | (557,680 | ) | | | 1,677 | | | | 10,611 | | |
| Class Z shares | |
| Subscriptions | | | 25,571,720 | | | | 259,607,470 | | | | 17,348,274 | | | | 168,309,034 | | | | 24,496,505 | | | | 231,051,837 | | |
| Distributions reinvested | | | 439,402 | | | | 4,424,413 | | | | 492,648 | | | | 4,744,603 | | | | 518,686 | | | | 4,928,209 | | |
| Redemptions | | | (13,684,041 | ) | | | (137,790,140 | ) | | | (19,542,118 | ) | | | (186,184,983 | ) | | | (13,292,723 | ) | | | (126,557,161 | ) | |
| Net increase (decrease) | | | 12,327,081 | | | | 126,241,743 | | | | (1,701,196 | ) | | | (13,131,346 | ) | | | 11,722,468 | | | | 109,422,885 | | |
| Total net increase (decrease) | | | 14,798,446 | | | | 151,225,492 | | | | (3,693,827 | ) | | | (32,194,792 | ) | | | 12,907,856 | | | | 120,771,323 | | |
(a) For the period from July 1, 2011 to May 31, 2012. During the period, the Fund's fiscal year end was changed from June 30 to May 31.
(b) Includes conversions of Class B shares to Class A shares, if any.
The accompanying Notes to Financial Statements are an integral part of this statement.
Annual Report 2012
33
Columbia High Yield Municipal Fund
Financial Highlights
The following tables are intended to help you understand the Fund's financial performance. Certain information reflects financial results for a single share of a class held for the periods shown. Per share net investment income (loss) amounts are calculated based on average shares outstanding during the period. Total returns assume reinvestment of all dividends and distributions. Total returns do not reflect payment of sales charges, if any, and are not annualized for periods of less than one year.
| | | Year Ended
May 31, | | Year Ended June 30, | |
| Class A | | 2012(a) | | 2011 | | 2010 | | 2009 | | 2008 | | 2007 | |
| Per share data | |
| Net asset value, beginning of period | | $ | 9.60 | | | $ | 9.77 | | | $ | 8.79 | | | $ | 10.32 | | | $ | 11.33 | | | $ | 11.25 | | |
| Income from investment operations: | |
| Net investment income | | | 0.45 | | | | 0.53 | | | | 0.52 | | | | 0.53 | | | | 0.52 | | | | 0.51 | | |
| Net realized and unrealized gain (loss) | | | 0.88 | | | | (0.19 | ) | | | 0.97 | | | | (1.53 | ) | | | (1.01 | ) | | | 0.08 | | |
| Total from investment operations | | | 1.33 | | | | 0.34 | | | | 1.49 | | | | (1.00 | ) | | | (0.49 | ) | | | 0.59 | | |
| Less distributions to shareholders: | |
| Net investment income | | | (0.44 | ) | | | (0.51 | ) | | | (0.51 | ) | | | (0.53 | ) | | | (0.52 | ) | | | (0.51 | ) | |
| Total distributions to shareholders | | | (0.44 | ) | | | (0.51 | ) | | | (0.51 | ) | | | (0.53 | ) | | | (0.52 | ) | | | (0.51 | ) | |
| Net asset value, end of period | | $ | 10.49 | | | $ | 9.60 | | | $ | 9.77 | | | $ | 8.79 | | | $ | 10.32 | | | $ | 11.33 | | |
| Total return | | | 14.19 | % | | | 3.63 | % | | | 17.25 | % | | | (9.60 | %) | | | (4.39 | %) | | | 5.23 | % | |
| Ratios to average net assets(b) | |
Expenses prior to fees waived or expenses
reimbursed (including interest expense) | | | 0.96 | %(c) | | | 0.91 | % | | | 0.85 | % | | | 0.90 | % | | | 0.95 | %(d) | | | 0.95 | %(d) | |
Net expenses after fees waived or expenses
reimbursed (including interest expense)(e) | | | 0.80 | %(c)(f) | | | 0.85 | %(f) | | | 0.85 | %(f) | | | 0.90 | %(f) | | | 0.95 | %(d)(f) | | | 0.95 | %(d)(f) | |
Expenses prior to fees waived or expenses
reimbursed (excluding interest expense) | | | 0.96 | %(c) | | | 0.91 | % | | | 0.85 | % | | | 0.90 | % | | | 0.90 | % | | | 0.88 | % | |
Net expenses after fees waived or expenses
reimbursed (excluding interest expense)(e) | | | 0.80 | %(c)(f) | | | 0.85 | %(f) | | | 0.85 | %(f) | | | 0.90 | %(f) | | | 0.90 | %(f) | | | 0.88 | %(f) | |
| Net investment income | | | 4.92 | %(c)(f) | | | 5.46 | %(f) | | | 5.44 | %(f) | | | 5.90 | %(f) | | | 4.84 | %(f) | | | 4.43 | %(f) | |
| Supplemental data | |
| Net assets, end of period (in thousands) | | $ | 93,456 | | | $ | 63,669 | | | $ | 80,691 | | | $ | 59,189 | | | $ | 74,593 | | | $ | 89,977 | | |
| Portfolio turnover | | | 9 | % | | | 23 | % | | | 18 | % | | | 26 | % | | | 32 | % | | | 27 | % | |
Notes to Financial Highlights
(a) For the period from July 1, 2011 to May 31, 2012. During the period, the Fund's fiscal year end was changed from June 30 to May 31.
(b) In addition to the fees and expenses which the Fund bears directly, the Fund indirectly bears a pro rata share of the fees and expenses of the acquired funds in which it invests. Such indirect expenses are not included in the reported expense ratios.
(c) Annualized.
(d) Ratios include interest and fee expense related to the Fund's participation in certain inverse floater programs, if any. Due to an equal increase in interest income from fixed rate municipal bonds held in trust, there is no impact on the Fund's net assets, net asset value per share, total return or net investment income.
(e) The Investment Manager and certain of its affiliates agreed to waive/reimburse certain fees and expenses, if applicable.
(f) The benefits derived from expense reductions had an impact of less than 0.01%.
The accompanying Notes to Financial Statements are an integral part of this statement.
Annual Report 2012
34
Columbia High Yield Municipal Fund
Financial Highlights (continued)
| | | Year Ended
May 31, | | Year Ended June 30, | |
| Class B | | 2012(a) | | 2011 | | 2010 | | 2009 | | 2008 | | 2007 | |
| Per share data | |
| Net asset value, beginning of period | | $ | 9.60 | | | $ | 9.77 | | | $ | 8.79 | | | $ | 10.32 | | | $ | 11.33 | | | $ | 11.25 | | |
| Income from investment operations: | |
| Net investment income | | | 0.39 | | | | 0.46 | | | | 0.45 | | | | 0.46 | | | | 0.44 | | | | 0.42 | | |
| Net realized and unrealized gain (loss) | | | 0.87 | | | | (0.19 | ) | | | 0.97 | | | | (1.53 | ) | | | (1.01 | ) | | | 0.08 | | |
| Total from investment operations | | | 1.26 | | | | 0.27 | | | | 1.42 | | | | (1.07 | ) | | | (0.57 | ) | | | 0.50 | | |
| Less distributions to shareholders: | |
| Net investment income | | | (0.37 | ) | | | (0.44 | ) | | | (0.44 | ) | | | (0.46 | ) | | | (0.44 | ) | | | (0.42 | ) | |
| Total distributions to shareholders | | | (0.37 | ) | | | (0.44 | ) | | | (0.44 | ) | | | (0.46 | ) | | | (0.44 | ) | | | (0.42 | ) | |
| Net asset value, end of period | | $ | 10.49 | | | $ | 9.60 | | | $ | 9.77 | | | $ | 8.79 | | | $ | 10.32 | | | $ | 11.33 | | |
| Total return | �� | | 13.41 | % | | | 2.85 | % | | | 16.39 | % | | | (10.27 | %) | | | (5.10 | %) | | | 4.45 | % | |
| Ratios to average net assets(b) | |
Expenses prior to fees waived or expenses
reimbursed (including interest expense) | | | 1.72 | %(c) | | | 1.65 | % | | | 1.60 | % | | | 1.65 | % | | | 1.70 | %(d) | | | 1.70 | %(d) | |
Net expenses after fees waived or expenses
reimbursed (including interest expense)(e) | | | 1.55 | %(c)(f) | | | 1.60 | %(f) | | | 1.60 | %(f) | | | 1.65 | %(f) | | | 1.70 | %(d)(f) | | | 1.70 | %(d)(f) | |
Expenses prior to fees waived or expenses
reimbursed (excluding interest expense) | | | 1.72 | %(c) | | | 1.65 | % | | | 1.60 | % | | | 1.65 | % | | | 1.65 | % | | | 1.63 | % | |
Net expenses after fees waived or expenses
reimbursed (excluding interest expense)(e) | | | 1.55 | %(c)(f) | | | 1.60 | %(f) | | | 1.60 | %(f) | | | 1.65 | %(f) | | | 1.65 | %(f) | | | 1.63 | %(f) | |
| Net investment income | | | 4.24 | %(c)(f) | | | 4.69 | %(f) | | | 4.72 | %(f) | | | 5.13 | %(f) | | | 4.09 | %(f) | | | 3.68 | %(f) | |
| Supplemental data | |
| Net assets, end of period (in thousands) | | $ | 2,142 | | | $ | 3,052 | | | $ | 5,995 | | | $ | 8,392 | | | $ | 11,945 | | | $ | 17,407 | | |
| Portfolio turnover | | | 9 | % | | | 23 | % | | | 18 | % | | | 26 | % | | | 32 | % | | | 27 | % | |
Notes to Financial Highlights
(a) For the period from July 1, 2011 to May 31, 2012. During the period, the Fund's fiscal year end was changed from June 30 to May 31.
(b) In addition to the fees and expenses which the Fund bears directly, the Fund indirectly bears a pro rata share of the fees and expenses of the acquired funds in which it invests. Such indirect expenses are not included in the reported expense ratios.
(c) Annualized.
(d) Ratios include interest and fee expense related to the Fund's participation in certain inverse floater programs, if any. Due to an equal increase in interest income from fixed rate municipal bonds held in trust, there is no impact on the Fund's net assets, net asset value per share, total return or net investment income.
(e) The Investment Manager and certain of its affiliates agreed to waive/reimburse certain fees and expenses, if applicable.
(f) The benefits derived from expense reductions had an impact of less than 0.01%.
The accompanying Notes to Financial Statements are an integral part of this statement.
Annual Report 2012
35
Columbia High Yield Municipal Fund
Financial Highlights (continued)
| | | Year Ended
May 31, | | Year Ended June 30, | |
| Class C | | 2012(a) | | 2011 | | 2010 | | 2009 | | 2008 | | 2007 | |
| Per share data | |
| Net asset value, beginning of period | | $ | 9.60 | | | $ | 9.77 | | | $ | 8.79 | | | $ | 10.32 | | | $ | 11.33 | | | $ | 11.25 | | |
| Income from investment operations: | |
| Net investment income | | | 0.40 | | | | 0.48 | | | | 0.46 | | | | 0.48 | | | | 0.46 | | | | 0.44 | | |
| Net realized and unrealized gain (loss) | | | 0.88 | | | | (0.20 | ) | | | 0.97 | | | | (1.54 | ) | | | (1.01 | ) | | | 0.08 | | |
| Total from investment operations | | | 1.28 | | | | 0.28 | | | | 1.43 | | | | (1.06 | ) | | | (0.55 | ) | | | 0.52 | | |
| Less distributions to shareholders: | |
| Net investment income | | | (0.39 | ) | | | (0.45 | ) | | | (0.45 | ) | | | (0.47 | ) | | | (0.46 | ) | | | (0.44 | ) | |
| Total distributions to shareholders | | | (0.39 | ) | | | (0.45 | ) | | | (0.45 | ) | | | (0.47 | ) | | | (0.46 | ) | | | (0.44 | ) | |
| Net asset value, end of period | | $ | 10.49 | | | $ | 9.60 | | | $ | 9.77 | | | $ | 8.79 | | | $ | 10.32 | | | $ | 11.33 | | |
| Total return | | | 13.56 | % | | | 3.01 | % | | | 16.55 | % | | | (10.14 | %) | | | (4.96 | %) | | | 4.61 | % | |
| Ratios to average net assets(b) | |
Expenses prior to fees waived or expenses
reimbursed (including interest expense) | | | 1.71 | %(c) | | | 1.66 | % | | | 1.60 | % | | | 1.65 | % | | | 1.70 | %(d) | | | 1.70 | %(d) | |
Net expenses after fees waived or expenses
reimbursed (including interest expense)(e) | | | 1.40 | %(c)(f) | | | 1.45 | %(f) | | | 1.45 | %(f) | | | 1.50 | %(f) | | | 1.55 | %(d)(f) | | | 1.55 | %(d)(f) | |
Expenses prior to fees waived or expenses
reimbursed (excluding interest expense) | | | 1.71 | %(c) | | | 1.66 | % | | | 1.60 | % | | | 1.65 | % | | | 1.65 | % | | | 1.63 | % | |
Net expenses after fees waived or expenses
reimbursed (excluding interest expense)(e) | | | 1.40 | %(c)(f) | | | 1.45 | %(f) | | | 1.45 | %(f) | | | 1.50 | %(f) | | | 1.50 | %(f) | | | 1.48 | %(f) | |
| Net investment income | | | 4.30 | %(c)(f) | | | 4.88 | %(f) | | | 4.85 | %(f) | | | 5.29 | %(f) | | | 4.24 | %(f) | | | 3.82 | %(f) | |
| Supplemental data | |
| Net assets, end of period (in thousands) | | $ | 12,525 | | | $ | 8,509 | | | $ | 9,288 | | | $ | 8,341 | | | $ | 11,090 | | | $ | 14,134 | | |
| Portfolio turnover | | | 9 | % | | | 23 | % | | | 18 | % | | | 26 | % | | | 32 | % | | | 27 | % | |
Notes to Financial Highlights
(a) For the period from July 1, 2011 to May 31, 2012. During the period, the Fund's fiscal year end was changed from June 30 to May 31.
(b) In addition to the fees and expenses which the Fund bears directly, the Fund indirectly bears a pro rata share of the fees and expenses of the acquired funds in which it invests. Such indirect expenses are not included in the reported expense ratios.
(c) Annualized.
(d) Ratios include interest and fee expense related to the Fund's participation in certain inverse floater programs, if any. Due to an equal increase in interest income from fixed rate municipal bonds held in trust, there is no impact on the Fund's net assets, net asset value per share, total return or net investment income.
(e) The Investment Manager and certain of its affiliates agreed to waive/reimburse certain fees and expenses, if applicable.
(f) The benefits derived from expense reductions had an impact of less than 0.01%.
The accompanying Notes to Financial Statements are an integral part of this statement.
Annual Report 2012
36
Columbia High Yield Municipal Fund
Financial Highlights (continued)
| | | Year Ended
May 31, | | Year Ended June 30, | |
| Class Z | | 2012(a) | | 2011 | | 2010 | | 2009 | | 2008 | | 2007 | |
| Per share data | |
| Net asset value, beginning of period | | $ | 9.60 | | | $ | 9.77 | | | $ | 8.79 | | | $ | 10.32 | | | $ | 11.33 | | | $ | 11.25 | | |
| Income from investment operations: | |
| Net investment income | | | 0.47 | | | | 0.55 | | | | 0.54 | | | | 0.55 | | | | 0.54 | | | | 0.53 | | |
| Net realized and unrealized gain (loss) | | | 0.88 | | | | (0.19 | ) | | | 0.97 | | | | (1.54 | ) | | | (1.01 | ) | | | 0.08 | | |
| Total from investment operations | | | 1.35 | | | | 0.36 | | | | 1.51 | | | | (0.99 | ) | | | (0.47 | ) | | | 0.61 | | |
| Less distributions to shareholders: | |
| Net investment income | | | (0.46 | ) | | | (0.53 | ) | | | (0.53 | ) | | | (0.54 | ) | | | (0.54 | ) | | | (0.53 | ) | |
| Total distributions to shareholders | | | (0.46 | ) | | | (0.53 | ) | | | (0.53 | ) | | | (0.54 | ) | | | (0.54 | ) | | | (0.53 | ) | |
| Net asset value, end of period | | $ | 10.49 | | | $ | 9.60 | | | $ | 9.77 | | | $ | 8.79 | | | $ | 10.32 | | | $ | 11.33 | | |
| Total return | | | 14.39 | % | | | 3.82 | % | | | 17.48 | % | | | (9.42 | %) | | | (4.20 | %) | | | 5.44 | % | |
| Ratios to average net assets(b) | |
Expenses prior to fees waived or expenses
reimbursed (including interest expense) | | | 0.76 | %(c) | | | 0.71 | % | | | 0.65 | % | | | 0.70 | % | | | 0.75 | %(d) | | | 0.75 | %(d) | |
Net expenses after fees waived or expenses
reimbursed (including interest expense)(e) | | | 0.60 | %(c)(f) | | | 0.65 | %(f) | | | 0.65 | %(f) | | | 0.70 | %(f) | | | 0.75 | %(d)(f) | | | 0.75 | %(d)(f) | |
Expenses prior to fees waived or expenses
reimbursed (excluding interest expense) | | | 0.76 | %(c) | | | 0.71 | % | | | 0.65 | % | | | 0.70 | % | | | 0.70 | % | | | 0.68 | % | |
Net expenses after fees waived or expenses
reimbursed (excluding interest expense)(e) | | | 0.60 | %(c)(f) | | | 0.65 | %(f) | | | 0.65 | %(f) | | | 0.70 | %(f) | | | 0.70 | %(f) | | | 0.68 | %(f) | |
| Net investment income | | | 5.12 | %(c)(f) | | | 5.68 | %(f) | | | 5.64 | %(f) | | | 6.07 | %(f) | | | 5.03 | %(f) | | | 4.63 | %(f) | |
| Supplemental data | |
| Net assets, end of period (in thousands) | | $ | 830,124 | | | $ | 641,387 | | | $ | 668,875 | | | $ | 498,734 | | | $ | 629,219 | | | $ | 698,454 | | |
| Portfolio turnover | | | 9 | % | | | 23 | % | | | 18 | % | | | 26 | % | | | 32 | % | | | 27 | % | |
Notes to Financial Highlights
(a) For the period from July 1, 2011 to May 31, 2012. During the period, the Fund's fiscal year end was changed from June 30 to May 31.
(b) In addition to the fees and expenses which the Fund bears directly, the Fund indirectly bears a pro rata share of the fees and expenses of the acquired funds in which it invests. Such indirect expenses are not included in the reported expense ratios.
(c) Annualized.
(d) Ratios include interest and fee expense related to the Fund's participation in certain inverse floater programs, if any. Due to an equal increase in interest income from fixed rate municipal bonds held in trust, there is no impact on the Fund's net assets, net asset value per share, total return or net investment income.
(e) The Investment Manager and certain of its affiliates agreed to waive/reimburse certain fees and expenses, if applicable.
(f) The benefits derived from expense reductions had an impact of less than 0.01%.
The accompanying Notes to Financial Statements are an integral part of this statement.
Annual Report 2012
37
Columbia High Yield Municipal Fund
Notes to Financial Statements
May 31, 2012
Note 1. Organization
Columbia High Yield Municipal Fund (the Fund), a series of Columbia Funds Series Trust I (the Trust), is a diversified fund. The Trust is registered under the Investment Company Act of 1940, as amended (the 1940 Act), as an open-end management investment company organized as a Massachusetts business trust.
Fiscal Year End Change
During the period, the Fund changed its fiscal year end from June 30 to May 31.
Fund Shares
The Trust may issue an unlimited number of shares (without par value). The Fund offers Class A, Class B, Class C and Class Z shares. All share classes have identical voting, dividend and liquidation rights. Each share class has its own expense structure and sales charges, as applicable.
Class A shares are subject to a maximum front-end sales charge of 4.75% based on the initial investment amount. Class A shares purchased without an initial sales charge in accounts aggregating $1 million to $50 million at the time of purchase are subject to a contingent deferred sales charge (CDSC) if the shares are sold within 18 months of purchase, charged as follows: 1.00% CDSC if redeemed within 12 months of purchase, and 0.50% CDSC if redeemed more than 12, but less than 18, months after purchase.
Class B shares may be subject to a maximum CDSC of 5.00% based upon the holding period after purchase. Class B shares will generally convert to Class A shares eight years after purchase. The Fund no longer accepts investments by new or existing investors in the Fund's Class B shares, except in connection with the reinvestment of any dividend and/or capital gain distributions in Class B shares of the Fund and exchanges by existing Class B shareholders of certain other funds within the Columbia Family of Funds.
Class C shares are subject to a 1.00% CDSC on shares redeemed within one year of purchase.
Class Z shares are not subject to sales charges, and are only available to certain investors, as described in the Fund's Class Z prospectus.
Note 2. Summary of Significant Accounting Policies
Use of Estimates
The preparation of financial statements in accordance with U.S. generally accepted accounting principles (GAAP) requires management to make certain estimates and assumptions that affect the reported amounts of assets and liabilities, the disclosure of contingent assets and liabilities at the date of the financial statements and the reported amounts of revenue and expenses during the reporting period. Actual results could differ from those estimates.
The following is a summary of significant accounting policies consistently followed by the Fund in the preparation of its financial statements.
Security Valuation
Debt securities generally are valued by pricing services approved by the Board of Trustees (the Board) based upon market transactions for normal, institutional-size trading units of similar securities. The services may use various pricing techniques which take into account appropriate factors such as yield, quality, coupon rate, maturity, type of issue, trading characteristics and other data, as well as broker quotes. Debt securities for which quotations are readily available may also be valued based upon an over-the-counter or exchange bid quotation.
All equity securities are valued at the close of business of the New York Stock Exchange (NYSE). Equity securities are valued at the last quoted sales price on the principal exchange or market on which they trade, except for securities traded on the NASDAQ Stock Market, which are valued at the NASDAQ official close price. Unlisted securities or listed securities for which there were no sales during the day are valued at the mean of the latest quoted bid and ask prices on such exchanges or markets.
Investments in other open-end investment companies, including money market funds, are valued at net asset value.
Short-term securities purchased within 60 days to maturity are valued at amortized cost, which approximates market value. The value of short-term securities originally purchased with maturities greater than 60 days is determined based on an amortized value to par upon reaching 60 days to maturity. Short-term securities maturing in more than 60 days from the valuation date are valued at the market price or approximate market value based on current interest rates.
Investments for which market quotations are not readily available, or that have quotations which management believes are not reliable, are valued at fair value as determined in good faith under consistently applied procedures established by and under the general supervision of the Board. If a security or class of securities (such as foreign securities) is valued at fair value, such value is likely to be different from the last quoted market price for the security.
The determination of fair value often requires significant judgment. To determine fair value, management may use
Annual Report 2012
38
Columbia High Yield Municipal Fund
Notes to Financial Statements (continued)
May 31, 2012
assumptions including but not limited to future cash flows and estimated risk premiums. Multiple inputs from various sources may be used to determine fair value.
Delayed Delivery Securities and Forward Sale Commitments
The Fund may trade securities on other than normal settlement terms, including securities purchased or sold on a "when-issued" basis. This may increase the risk if the other party to the transaction fails to deliver and causes the Fund to subsequently invest at less advantageous prices. The Fund designates cash or liquid securities in an amount equal to the delayed delivery commitment.
The Fund may enter into forward sale commitments to hedge its portfolio positions or to sell mortgage-backed securities it owns under delayed delivery arrangements. Proceeds of forward sale commitments are not received until the contractual settlement date. While a forward sale commitment is outstanding, equivalent deliverable securities or an offsetting forward purchase commitment deliverable on or before the sale commitment date, are used to satisfy the commitment.
Unsettled forward sale commitments are valued at the current market value of the underlying securities, generally according to the procedures described under "Security Valuation" above. The forward sale commitment is "marked-to-market" daily and the change in market value is recorded by the Fund as an unrealized gain or loss. If the forward sale commitment is closed through the acquisition of an offsetting purchase commitment, the Fund realizes a gain or loss. If the Fund delivers securities under the commitment, the Fund realizes a gain or a loss from the sale of the securities based upon the market price established at the date the commitment was entered into.
Restricted Securities
Restricted securities are securities that may only be resold upon registration under federal securities laws or in transactions exempt from registration. In some cases, the issuer of restricted securities has agreed to register such securities for resale at the issuer's expense either upon demand by the Fund or in connection with another registered offering of the securities. Many restricted securities may be resold in the secondary market in transactions exempt from registration. Such restricted securities may be determined to be liquid under criteria established by the Board. The Fund will not incur any registration costs upon such resale.
Security Transactions
Security transactions are accounted for on the trade date. Cost is determined and gains (losses) are based upon the specific identification method for both financial statement and federal income tax purposes.
Income Recognition
Interest income is recorded on an accrual basis. Market premium and discount are amortized and accreted, respectively, on all debt securities, unless otherwise noted. Original issue discount is accreted to interest income over the life of the security with a corresponding increase in the cost basis, if any.
Dividend income is recorded on the ex-dividend date.
Expenses
General expenses of the Trust are allocated to the Fund and other funds of the Trust based upon relative net assets or other expense allocation methodologies determined by the nature of the expense. Expenses directly attributable to the Fund are charged to the Fund. Expenses directly attributable to a specific class of shares are charged to that share class.
Determination of Class Net Asset Value
All income, expenses (other than class-specific expenses, which are charged to that share class, as shown in the Statement of Operations) and realized and unrealized gains (losses) are allocated to each class of the Fund on a daily basis, based on the relative net assets of each class, for purposes of determining the net asset value of each class.
Federal Income Tax Status
The Fund intends to qualify each year as a regulated investment company under Subchapter M of the Internal Revenue Code, as amended, and will distribute substantially all of its tax exempt or taxable income (including net short-term capital gains), if any, for its tax year, and as such will not be subject to federal income taxes. In addition, the Fund intends to distribute in each calendar year substantially all of its net investment income, capital gains and certain other amounts, if any, such that the Fund should not be subject to federal excise tax. Therefore, no federal income or excise tax provision is recorded.
Distributions to Shareholders
Distributions from net investment income, if any, are declared and paid monthly. Net realized capital gains, if any, are distributed along with the income dividend. Income distributions and capital gain distributions are determined in accordance with federal income tax regulations, which may differ from GAAP.
Annual Report 2012
39
Columbia High Yield Municipal Fund
Notes to Financial Statements (continued)
May 31, 2012
Guarantees and Indemnifications
Under the Trust's organizational documents and, in some cases, by contract, its officers and trustees are indemnified against certain liabilities arising out of the performance of their duties to the Trust or its funds. In addition, certain of the Fund's contracts with its service providers contain general indemnification clauses. The Fund's maximum exposure under these arrangements is unknown since the amount of any future claims that may be made against the Fund cannot be determined, and the Fund has no historical basis for predicting the likelihood of any such claims.
Recent Accounting Pronouncement
Fair Value Measurements and Disclosures
In May 2011, the Financial Accounting Standards Board (FASB) issued ASU No. 2011-04 modifying Topic 820, Fair Value Measurements and Disclosures. At the same time, the International Accounting Standards Board (IASB) issued International Financial Reporting Standard 13, Fair Value Measurement. The objective of the FASB and IASB is the convergence of their guidance on fair value measurements and disclosures.
Specifically, ASU No. 2011-04 requires reporting entities to disclose i) the amounts of any transfers between Level 1 and Level 2, and the reasons for the transfers, ii) for Level 3 fair value measurements, a) quantitative information about significant unobservable inputs used, b) a description of the valuation processes used by the reporting entity and c) a narrative description of the sensitivity of the fair value measurement to changes in unobservable inputs if a change in those inputs might result in a significantly higher or lower fair value measurement. The effective date of ASU No. 2011-04 is for interim and annual periods beginning after December 15, 2011. At this time, management is evaluating the implications of this guidance and the impact it will have on the financial statement amounts and footnote disclosures, if any.
Note 3. Fees and Compensation Paid to Affiliates
Investment Management Fees
Under an Investment Management Services Agreement (IMSA), Columbia Management Investment Advisers, LLC (the Investment Manager), a wholly-owned subsidiary of Ameriprise Financial, Inc. (Ameriprise Financial), determines which securities will be purchased, held or sold. Effective July 1, 2011, the management fee is an annual fee that is equal to a percentage of the Fund's average daily net assets that declines from 0.47% to 0.30% as the Fund's net assets increase. Prior to July 1, 2011, the management fee was equal to a percentage of the Fund's average daily net assets that declined from 0.45% to 0.40% as the Fund's net assets increased. The annualized effective management fee rate for the period ended May 31, 2012, and for the year ended June 30, 2011, was 0.47% and 0.41%, respectively, of the Fund's average daily net assets.
Administration Fees
Under an Administrative Services Agreement, the Investment Manager serves as the Fund Administrator. Effective July 1, 2011, the Fund pays the Fund Administrator an annual fee for administration and accounting services equal to a percentage of the Fund's average daily net assets that declines from 0.07% to 0.04% as the Fund's net assets increase. Prior to July 1, 2011, the administration fee was equal to a percentage of the Fund's average daily net assets that declined from 0.15% to 0.10% as the Fund's net assets increased. The annualized effective administration fee rate for the period ended May 31, 2012, and for the year ended June 30, 2011, was 0.07% and 0.11%, respectively, of the Fund's average daily net assets.
Pricing and Bookkeeping Fees
Prior to May 16, 2011, the Fund had entered into a Financial Reporting Services Agreement (the Financial Reporting Services Agreement) with State Street Bank and Trust Company (State Street) and the Investment Manager pursuant to which State Street provided financial reporting services to the Fund. The Fund also entered into an Accounting Services Agreement (collectively with the Financial Reporting Services Agreement, the State Street Agreements) with State Street and the Investment Manager pursuant to which State Street provided accounting services to the Fund. Under the State Street Agreements, the Fund paid State Street an annual fee of $38,000 paid monthly plus an additional monthly fee based on an annualized percentage rate of average daily net assets of the Fund for the month. The aggregate fee did not exceed $140,000 per year (exclusive of out-of-pocket expenses and charges). The Fund also reimbursed State Street for certain out-of-pocket expenses and charges. Effective May 16, 2011, these services are now provided under the Administrative Services Agreement discussed above.
Compensation of Board Members
Board members are compensated for their services to the Fund as disclosed in the Statement of Operations. The Trust's eligible Trustees may participate in a Deferred Compensation Plan (the Plan) which may be terminated at any time. Obligations of the Plan will be paid solely out of the Fund's assets.
Annual Report 2012
40
Columbia High Yield Municipal Fund
Notes to Financial Statements (continued)
May 31, 2012
Compensation of Chief Compliance Officer
The Board has appointed a Chief Compliance Officer to the Fund in accordance with federal securities regulations. The Fund pays its pro-rata share of the expenses associated with the Chief Compliance Officer. The Fund's expenses for the Chief Compliance Officer will not exceed $15,000 per year.
Transfer Agent Fees
Under a Transfer and Dividend Disbursing Agent Agreement, Columbia Management Investment Services Corp. (the Transfer Agent), an affiliate of the Investment Manager and a wholly-owned subsidiary of Ameriprise Financial, is responsible for providing transfer agency services to the Fund. The Transfer Agent has contracted with Boston Financial Data Services (BFDS) to serve as sub-transfer agent.
The Transfer Agent receives monthly account-based service fees based on the number of open accounts and is reimbursed by the Fund for the fees and expenses the Transfer Agent pays to financial intermediaries that maintain omnibus accounts with the Fund that is a percentage of the average aggregate value of the Fund's shares maintained in each such omnibus account (other than omnibus accounts for which American Enterprise Investment Services Inc. is the broker of record or accounts where the beneficial shareholder is a customer of Ameriprise Financial Services, Inc., which are paid a per account fee). The Transfer Agent pays the fees of BFDS for services as sub-transfer agent and is not entitled to reimbursement for such fees from the Fund (with the exception of out-of-pocket fees).
The Transfer Agent also receives compensation from fees for various shareholder services and reimbursements for certain out-of-pocket fees.
The Fund's annualized effective transfer agent fee rates as a percentage of average daily net assets of each class were as follows:
| | | Period Ended
May 31, 2012 | | Year Ended
June 30, 2011 | |
| Class A | | | 0.17 | % | | | 0.12 | % | |
| Class B | | | 0.19 | | | | 0.11 | | |
| Class C | | | 0.17 | | | | 0.12 | | |
| Class Z | | | 0.17 | | | | 0.12 | | |
An annual minimum account balance fee of $20 may apply to certain accounts with a value below the Fund's initial minimum investment requirements to reduce the impact of small accounts on transfer agent fees. These minimum account balance fees are recorded as part of expense reductions in the Statement of Operations. For the period ended May 31, 2012, these minimum account balance fees reduced total expenses by $1,001.
Distribution and Service Fees
The Fund has an agreement with Columbia Management Investment Distributors, Inc. (the Distributor), an affiliate of the Investment Manager and a wholly-owned subsidiary of Ameriprise Financial, for distribution and shareholder services. Pursuant to Rule 12b-1 under the 1940 Act, the Board has approved, and the Fund has adopted, distribution and shareholder service plans (the Plans) which set the distribution and service fees for the Fund. These fees are calculated daily and are intended to compensate the Distributor and/or eligible selling and/or servicing agents for selling shares of the Fund and providing services to investors.
The Plans require the payment of a monthly service fee to the Distributor at the maximum annual rate of 0.20% of the average daily net assets attributable to Class A, Class B and Class C shares of the Fund. The Plans also require the payment of a monthly distribution fee to the Distributor at the maximum annual rates of 0.75% of the average daily net assets attributable to Class B and Class C shares only.
The Distributor has voluntarily agreed to waive a portion of the distribution fee for Class C shares so that the combined distribution and service fee does not exceed 0.80% annually of the average daily net assets attributable to Class C shares. This arrangement may be modified or terminated by the Distributor at any time.
Sales Charges
Sales charges, including front-end charges and CDSCs, received by the Distributor for distributing Fund shares were $187,563 for Class A, $470 for Class B and $1,292 for Class C shares for the period ended May 31, 2012, and $86,418 for Class A, $5,146 for Class B and $2,768 for Class C shares for the year ended June 30, 2011.
Expenses Waived/Reimbursed by the Investment Manager and its Affiliates
Effective July 1, 2011, the Investment Manager and certain of its affiliates have contractually agreed to waive fees and/or reimburse expenses (excluding certain fees and expenses described below), through October 31, 2012, unless sooner terminated at the sole discretion of the Board, so that the Fund's net operating expenses, after giving effect to fees waived/expenses reimbursed and any balance credits and/or overdraft charges from the Fund's custodian, do not exceed the
Annual Report 2012
41
Columbia High Yield Municipal Fund
Notes to Financial Statements (continued)
May 31, 2012
following annual rates as a percentage of the class' average daily net assets:
| Class A | | | 0.80 | % | |
| Class B | | | 1.55 | | |
| Class C | | | 1.55 | | |
| Class Z | | | 0.60 | | |
Under the agreement, the following fees and expenses are excluded from the waiver/reimbursement commitment, and therefore will be paid by the Fund, if applicable: taxes (including foreign transaction taxes), expenses associated with investments in affiliated and non-affiliated pooled investment vehicles (including mutual funds and exchange traded funds), transaction costs and brokerage commissions, costs related to any securities lending program, dividend expenses associated with securities sold short, inverse floater program fees and expenses, transaction charges and interest on borrowed money, interest, extraordinary expenses and any other expenses the exclusion of which is specifically approved by the Board. This agreement may be modified or amended only with approval from all parties. Class C distribution fees waived by the Distributor, as discussed above, are in addition to the waiver/reimbursement commitment under the agreement.
Prior to July 1, 2011, the Investment Manager voluntarily agreed to reimburse a portion of the Fund's expenses (excluding certain expenses, such as distribution and services fees, brokerage commissions, interest, taxes and extraordinary expenses, but including custodian charges relating to overdrafts, if any) so that the Fund's ordinary net operating expenses, after giving effect to fees waived/expenses reimbursed and any balance credits and/or overdraft charges from the Fund's custodian, did not exceed 0.65% of the Fund's average daily net assets on an annualized basis.
Note 4. Federal Tax Information
The timing and character of income and capital gain distributions are determined in accordance with income tax regulations, which may differ from GAAP because of temporary or permanent book to tax differences.
At May 31, 2012, these differences are primarily due to differing treatment for defaulted bonds, Trustees' deferred compensation, distributions, capital loss carryforwards, market discount, post-October capital losses and tax straddles. To the extent these differences are permanent, reclassifications are made among the components of the Fund's net assets in the Statement of Assets and Liabilities. Temporary differences do not require reclassifications. In the Statement of Assets and Liabilities the following reclassifications were made:
| Undistributed net investment income | | $ | (34,201 | ) | |
| Accumulated net realized loss | | | 1,637,640 | | |
| Paid-in capital | | | (1,603,439 | ) | |
Net investment income and net realized gains (losses), as disclosed in the Statement of Operations, and net assets were not affected by this reclassification.
The tax character of distributions paid during the periods indicated was as follows:
| | | Period Ended
May 31, 2012 | | Year Ended
June 30, 2011 | | Year Ended
June 30, 2010 | |
| Tax-Exempt Income | | $ | 36,072,556 | | | $ | 40,757,181 | | | $ | 38,819,554 | | |
| Ordinary income | | | 127,251 | | | | 294,879 | | | | 31,988 | | |
Short-term capital gain distributions, if any, are considered ordinary income distributions for tax purposes.
At May 31, 2012, the components of distributable earnings on a tax basis were as follows:
| Undistributed tax-exempt income | | $ | 9,728,340 | | |
| Undistributed accumulated long-term gain | | | — | | |
| Unrealized appreciation | | | 29,955,647 | | |
At May 31, 2012, the cost of investments for federal income tax purposes was $896,308,529 and the aggregate gross unrealized appreciation and depreciation based on that cost was:
| Unrealized appreciation | | $ | 66,241,215 | | |
| Unrealized depreciation | | $ | (36,285,568 | ) | |
| Net unrealized appreciation | | $ | 29,955,647 | | |
The following capital loss carryforward, determined at May 31, 2012, may be available to reduce taxable income arising from future net realized gains on investments, if any, to the extent permitted by the Internal Revenue Code:
| Year of Expiration | | Amount | |
| 2013 | | $ | 5,621,572 | | |
| 2014 | | | 466,991 | | |
| 2015 | | | 1,471,699 | | |
| 2016 | | | 5,694,295 | | |
| 2017 | | | 17,741,445 | | |
| 2018 | | | 35,721,468 | | |
| 2019 | | | 4,244,605 | | |
| Unlimited capital loss carryforwards | | | | | |
| Short term | | | 513,665 | | |
| Long term | | | 5,807,142 | | |
| Total | | $ | 77,282,882 | | |
Annual Report 2012
42
Columbia High Yield Municipal Fund
Notes to Financial Statements (continued)
May 31, 2012
Unlimited capital loss carryforwards are required to be utilized prior to any capital losses which carry an expiration date. As a result of this ordering rule, capital loss carryforwards which carry an expiration date may be more likely to expire unused.
On December 22, 2010, the Regulated Investment Company Modernization Act of 2010 (the Act) was enacted, which changed various technical rules governing the tax treatment of regulated investment companies. The changes are generally effective for taxable years beginning after the date of enactment. Under the Act, the Fund will be permitted to carry forward capital losses incurred in taxable years beginning after the date of enactment for an unlimited period. However, any losses incurred during those future taxable years will be required to be utilized prior to the losses incurred in preenactment taxable years, which carry an expiration date. As a result of this ordering rule, pre-enactment capital loss carryforwards may be more likely to expire unused.
For the period ended May 31, 2012, $1,587,432 of capital loss carryforward was expired.
Under current tax rules, regulated investment companies can elect to treat certain late-year ordinary losses incurred and post-October capital losses (capital losses realized after October 31) as arising on the first day of the following taxable year. As of May 31, 2012, the Fund will elect to treat post-October capital losses of $4,440,350 as arising on June 1, 2012.
Management of the Fund has concluded that there are no significant uncertain tax positions that would require recognition in the financial statements. However, management's conclusion may be subject to review and adjustment at a later date based on factors including, but not limited to, new tax laws, regulations, and administrative interpretations (including relevant court decisions). Generally, the Fund's federal tax returns for the prior three fiscal years remain subject to examination by the Internal Revenue Service.
Note 5. Portfolio Information
The cost of purchases and proceeds from sales of securities, excluding short-term obligations, aggregated to $148,229,587 and $68,230,544, respectively, for the period ended May 31, 2012.
Note 6. Shareholder Concentration
At May 31, 2012, one unaffiliated shareholder account owned 74.2% of the outstanding shares of the Fund. The Fund has no knowledge about whether any portion of those shares was owned beneficially by such account. Subscription and redemption activity by concentrated accounts may have a significant effect on the operations of the Fund.
Note 7. Line of Credit
The Fund has entered into a revolving credit facility with a syndicate of banks led by JPMorgan whereby the Fund may borrow for the temporary funding of shareholder redemptions or for other temporary or emergency purposes. The credit facility agreement, as amended, which is a collective agreement between the Fund and certain other funds managed by the Investment Manager, severally and not jointly, permits collective borrowings up to $500 million. Pursuant to a December 13, 2011 amendment to the credit facility agreement, interest is charged to each participating fund based on its borrowings at a rate equal to the higher of (i) the overnight federal funds rate plus 1.00% or (ii) the one-month LIBOR rate plus 1.00%. Each borrowing under the credit facility matures no later than 60 days after the date of borrowing. The Fund also pays a commitment fee equal to its pro rata share of the amount of the credit facility at a rate of 0.08% per annum.
Prior to December 13, 2011, interest was charged to each participating fund based on its borrowings at a rate equal to the sum of the federal funds rate plus (i) 1.25% per annum plus (ii) if one-month LIBOR exceeds the federal funds rate, the amount of such excess. The Fund also paid a commitment fee equal to its pro rata share of the amount of the credit facility at a rate of 0.10% per annum.
For the year ended June 30, 2011, the average daily loan balance outstanding on days when borrowing existed was $2,900,000 at a weighted average interest rate of 1.48%. For the year ended June 30, 2011, the Investment Manager reimbursed the Fund $119 of interest expense.
The Fund had no borrowings during the period ended May 31, 2012.
Note 8. Significant Risks
High Yield Securities Risk
Investing in high-yield fixed income securities may involve greater credit risk and considerations not typically associated with investing in U.S. Government bonds and other higher quality fixed income securities. These securities are non-investment grade securities, often referred to as "junk" bonds. Economic downturns may disrupt the high yield market and impair the ability of issuers to repay principal and interest. Also, an increase in interest rates would likely have an adverse impact on the value of such obligations. Moreover, high-yield securities may be less liquid to the extent that there is no established secondary market.
Annual Report 2012
43
Columbia High Yield Municipal Fund
Notes to Financial Statements (continued)
May 31, 2012
Geographic Concentration Risk
Because state-specific tax-exempt funds invest primarily in the municipal securities issued by the state and political sub-divisions of the state, the Fund will be particularly affected by political and economic conditions and developments in the state in which it invests. The Fund may, therefore, have a greater risk than that of a municipal bond fund which is more geographically diversified. The value of the municipal securities owned by the Fund also may be adversely affected by future changes in federal or state income tax laws.
Note 9. Subsequent Events
Management has evaluated the events and transactions that have occurred through the date the financial statements were issued and noted no items requiring adjustment of the financial statements or additional disclosure.
Note 10. Information Regarding Pending and Settled Legal Proceedings
In December 2005, without admitting or denying the allegations, American Express Financial Corporation (AEFC, which is now known as Ameriprise Financial, Inc. (Ameriprise Financial)) entered into settlement agreements with the Securities and Exchange Commission (SEC) and Minnesota Department of Commerce (MDOC) related to market timing activities. As a result, AEFC was censured and ordered to cease and desist from committing or causing any violations of certain provisions of the Investment Advisers Act of 1940, the Investment Company Act of 1940, and various Minnesota laws. AEFC agreed to pay disgorgement of $10 million and civil money penalties of $7 million. AEFC also agreed to retain an independent distribution consultant to assist in developing a plan for distribution of all disgorgement and civil penalties ordered by the SEC in accordance with various undertakings detailed at www.sec.gov/litigation/admin/ia-2451.pdf. Ameriprise Financial and its affiliates have cooperated with the SEC and the MDOC in these legal proceedings, and have made regular reports to the funds' Boards of Trustees.
Ameriprise Financial and certain of its affiliates have historically been involved in a number of legal, arbitration and regulatory proceedings, including routine litigation, class actions, and governmental actions, concerning matters arising in connection with the conduct of their business activities. Ameriprise Financial believes that the Funds are not currently the subject of, and that neither Ameriprise Financial nor any of its affiliates are the subject of, any pending legal, arbitration or regulatory proceedings that are likely to have a material adverse effect on the Funds or the ability of Ameriprise Financial or its affiliates to perform under their contracts with the Funds. Ameriprise Financial is required to make 10-Q, 10-K and, as necessary, 8-K filings with the Securities and Exchange Commission on legal and regulatory matters that relate to Ameriprise Financial and its affiliates. Copies of these filings may be obtained by accessing the SEC website at www.sec.gov.
There can be no assurance that these matters, or the adverse publicity associated with them, will not result in increased fund redemptions, reduced sale of fund shares or other adverse consequences to the Funds. Further, although we believe proceedings are not likely to have a material adverse effect on the Funds or the ability of Ameriprise Financial or its affiliates to perform under their contracts with the Funds, these proceedings are subject to uncertainties and, as such, we are unable to estimate the possible loss or range of loss that may result. An adverse outcome in one or more of these proceedings could result in adverse judgments, settlements, fines, penalties or other relief that could have a material adverse effect on the consolidated financial condition or results of operations of Ameriprise Financial.
Annual Report 2012
44
Columbia High Yield Municipal Fund
Report of Independent Registered Public Accounting Firm
To the Trustees of Columbia Funds Series Trust I and
the Shareholders of Columbia High Yield Municipal Fund
In our opinion, the accompanying statement of assets and liabilities, including the portfolio of investments, and the related statements of operations and of changes in net assets and the financial highlights present fairly, in all material respects, the financial position of Columbia High Yield Municipal Fund (the "Fund") (a series of Columbia Funds Series Trust I) at May 31, 2012, the results of its operations, the changes in its net assets and the financial highlights for each of the periods indicated, in conformity with accounting principles generally accepted in the United States of America. These financial statements and financial highlights (hereafter referred to as "financial statements") are the responsibility of the Fund's management. Our responsibility is to express an opinion on these financial statements based on our audits. We conducted our audits of these financial statements in accordance with the standards of the Public Company Accounting Oversight Board (United States). Those standards require that we plan and perform the audit to obtain reasonable assurance about whether the financial statements are free of material misstatement. An audit includes examining, on a test basis, evidence supporting the amounts and disclosures in the financial statements, assessing the accounting principles used and significant estimates made by management, and evaluating the overall financial statement presentation. We believe that our audits, which included confirmation of securities at May 31, 2012 by correspondence with the custodian, brokers and transfer agent, provide a reasonable basis for our opinion.
PricewaterhouseCoopers LLP
Minneapolis, Minnesota
July 20, 2012
Annual Report 2012
45
Columbia High Yield Municipal Fund
Federal Income Tax Information
For the fiscal year ended May 31, 2012, 99.65% of the distributions from net investments income of the Fund qualified as exempt interest dividends for federal income tax purposes. A portion of income may be subject to federal alternative minimum tax. The Fund will notify shareholders in January 2013 of amounts for use in preparing 2012 income tax returns.
Annual Report 2012
46
Columbia High Yield Municipal Fund
Board Members and Officers
The Trustees serve terms of indefinite duration. The names, addresses and birth years of the Trustees and Officers of the Funds in Columbia Funds Series Trust I, the year each was first elected or appointed to office, their principal business occupations during at least the last five years, the number of Funds overseen by each Trustee and other directorships they hold are shown below. Each officer listed below serves as an officer of each Fund in Columbia Funds Series Trust I.
Independent Trustees
Name, Address and Year of Birth,
Position with Funds, Year First
Elected or Appointed to Office | | Principal Occupation(s) During Past Five Years, Number of Funds in Columbia
Funds Complex Overseen by Trustee, Other Directorships Held
| |
Rodman L. Drake (Born 1943)
c/o Columbia Management Investment Advisers, LLC
225 Franklin Street
Boston, MA 02110
Trustee (since 1994) and
Chairman of the Board (since 2009) | | Independent consultant since 2010; Co-Founder of Baringo Capital LLC (private equity) from 1997 to 2008; CEO of Crystal River Capital, Inc. (real estate investment trust) from 2003 to 2010; Oversees 52; Jackson Hewitt Tax Service Inc. (tax preparation services from 2004 to 2011); Celgene Corporation (global biotechnology company); Student Loan Corporation (student loan provider from 2005 to 2010); Celgene Corporation (global biotechnology company); The Helios Funds and Brookfield Funds (closed-end funds); Crystal River Capital, Inc. from 2005 to 2010; Parsons Brinckerhoff from 1995 to 2008; and Apex Silver Mines Ltd. from 2007 to 2009 | |
|
Douglas A. Hacker (Born 1955)
c/o Columbia Management Investment Advisers, LLC
225 Franklin Street
Boston, MA 02110
Trustee (since 1996) | | Independent business executive since May 2006; Executive Vice President — Strategy of United Airlines from December 2002 to May 2006; President of UAL Loyalty Services (airline marketing company) from September 2001 to December 2002; Executive Vice President and Chief Financial Officer of United Airlines from July 1999 to September 2001. Oversees 52; Nash Finch Company (food distributor); Aircastle Limited (aircraft leasing); and SeaCube Container Leasing Ltd. (container leasing) | |
|
Janet Langford Kelly (Born 1957)
c/o Columbia Management Investment Advisers, LLC
225 Franklin Street
Boston, MA 02110
Trustee (since 1996) | | Senior Vice President, General Counsel and Corporate Secretary, ConocoPhillips (integrated energy company) since September 2007; Deputy General Counsel — Corporate Legal Services, ConocoPhillips from August 2006 to August 2007; Partner, Zelle, Hofmann, Voelbel, Mason & Gette LLP (law firm) from March 2005 to July 2006; Adjunct Professor of Law, Northwestern University from September 2004 to June 2006; Director, UAL Corporation (airline) from February 2006 to July 2006; Chief Administrative Officer and Senior Vice President, Kmart Holding Corporation (consumer goods) from September 2003 to March 2004. Oversees 52; None | |
|
Nancy T. Lukitsh (Born 1956)
c/o Columbia Management Investment Advisers, LLC
225 Franklin Street
Boston, MA 02110
Trustee (since 2011) | | Senior Vice President, Partner and Director of Marketing, Wellington Management Company, LLP (investment adviser) from 1997 to 2010; Chair, Wellington Management Investment Portfolios (commingled non-U.S. investment pools) from 2007 to 2010; Director, Wellington Trust Company, NA and other Wellington affiliates from 1997 to 2010. Oversees 52; None | |
|
William E. Mayer (Born 1940)
c/o Columbia Management Investment Advisers, LLC
225 Franklin Street
Boston, MA 02110
Trustee (since 1994) | | Partner, Park Avenue Equity Partners (private equity) since February 1999; Dean and Professor, College of Business and Management, University of Maryland from 1992 to 1996. Oversees 52; DynaVox Inc. (speech creation); Lee Enterprises (print media); WR Hambrecht + Co. (financial service provider) from 2000 to 2012; BlackRock Kelso Capital Corporation (investment company) | |
|
David M. Moffett (Born 1952)
c/o Columbia Management Investment Advisers, LLC
225 Franklin Street
Boston, MA 02110
Trustee (since 2011) | | Retired. Chief Executive Officer, Federal Home Loan Mortgage Corporation, from 2008 to 2009; Senior Adviser, Global Financial Services Group, Carlyle Group, Inc., from 2007 to 2008; Vice Chairman and Chief Financial Officer, U.S. Bancorp, from 1993 to 2007. Oversees 52; CIT Group Inc. (commercial and consumer finance); eBay Inc. (online trading community); MBIA Inc. (financial service provider); E.W. Scripps Co. (print and television media), Building Materials Holding Corp. (building materials and construction services); and University of Oklahoma Foundation. | |
|
Charles R. Nelson (Born 1942)
c/o Columbia Management Investment Advisers, LLC
225 Franklin Street
Boston, MA 02110
Trustee (since 1981) | | Retired Professor Emeritus, University of Washington, since 2011; Professor of Economics, University of Washington from January 1976 to 2011; Ford and Louisa Van Voorhis Professor of Political Economy, University of Washington from 1993 to 2011; Adjunct Professor of Statistics, University of Washington from 1980 to 2011; Associate Editor, Journal of Money Credit and Banking from 1993 to 2008; consultant on econometric and statistical matters. Oversees 52; None | |
|
John J. Neuhauser (Born 1943)
c/o Columbia Management Investment Advisers, LLC
225 Franklin Street
Boston, MA 02110
Trustee (since 1984) | | President, Saint Michael's College, since August 2007; Director or Trustee of several non-profit organizations, including Fletcher Allen Health Care, Inc.; University Professor, Boston College from November 2005 to August 2007; Academic Vice President and Dean of Faculties, Boston College from August 1999 to October 2005. Oversees 52; Liberty All-Star Equity Fund and Liberty All-Star Growth Fund (closed-end funds) | |
|
Annual Report 2012
47
Columbia High Yield Municipal Fund
Board Members and Officers (continued)
Independent Trustees (continued)
Name, Address and Year of Birth,
Position with Funds, Year First
Elected or Appointed to Office | | Principal Occupation(s) During Past Five Years, Number of Funds in Columbia
Funds Complex Overseen by Trustee, Other Directorships Held
| |
Patrick J. Simpson (Born 1944)
c/o Columbia Management Investment Advisers, LLC
225 Franklin Street
Boston, MA 02110
Trustee (since 2000) | | Partner, Perkins Coie LLP (law firm). Oversees 52; None | |
|
Anne-Lee Verville (Born 1945)
c/o Columbia Management Investment Advisers, LLC
225 Franklin Street
Boston, MA 02110
Trustee (since 1998) | | Retired. General Manager — Global Education Industry from 1994 to 1997, President — Application Systems Division from 1991 to 1994, Chief Financial Officer — US Marketing & Services from 1988 to 1991, and Chief Information Officer from 1987 to 1988, IBM Corporation (computer and technology). Oversees 52; Enesco Group, Inc. (producer of giftware and home and garden decor products) from 2001 to 2006 | |
|
The Statement of Additional Information includes additional information about the Trustees of the Funds and is available, without charge, upon request by calling 1-800-345-6611.
Interested Trustee
Name, Address and Year of Birth,
Position with Funds, Year First
Elected or Appointed to Office | | Principal Occupation(s) During Past Five Years, Number of Funds in Columbia
Funds Complex Overseen by Trustee, Other Directorships Held
| |
William F. Truscott (born 1960)
53600 Ameriprise Financial Center
Minneapolis, MN 55474
Senior Vice President (since 2012) | | Chairman of the Board and President, Columbia Management Investment Advisers, LLC since May 2010 and February 2012, respectively (previously President, Chairman of the Board and Chief Investment Officer, from 2001 to April 2010); Chief Executive Officer, U.S. Asset Management & President, Annuities, Ameriprise Financial, Inc. since May 2010 (previously President — U.S. Asset Management and Chief Investment Officer from 2005 to April 2010, and Senior Vice President — Chief Investment Officer, from 2001 to 2005); Director, President and Chief Executive Officer, Ameriprise Certificate Company since 2006; Director and Chief Executive Officer, Columbia Management Investment Distributors, Inc. since May 2010 and February 2012, respectively (previously Chairman of the Board and Chief Executive Officer from 2008 to April 2010); Chairman of the Board and Chief Executive Officer, RiverSource Distributors, Inc. since 2006. Oversees 208; Columbia Funds Board. | |
|
Officers
| Name, Year of Birth and Address | | Principal Occupation(s) During the Past Five Years | |
J. Kevin Connaughton (Born 1964)
225 Franklin Street
Boston, MA 02110
President (since 2009) | | Senior Vice President and General Manager — Mutual Fund Products, Columbia Management Investment Advisers, LLC since May 2010; President, Columbia Funds, since 2009, and RiverSource Funds, since May 2010 (previously Senior Vice President and Chief Financial Officer, Columbia Funds, from June 2008 to January 2009, Treasurer, Columbia Funds, from October 2003 to May 2008, and senior officer of various other affiliated funds since 2000); Managing Director, Columbia Management Advisors, LLC from December 2004 to April 2010. | |
|
Michael G. Clarke (Born 1969)
225 Franklin Street
Boston, MA 02110
Treasurer (since 2011) and Chief Financial Officer (since 2009) | | Vice President, Columbia Management Investment Advisers, LLC since May 2010; Managing Director of Fund Administration, Columbia Management Advisors, LLC, from September 2004 to April 2010; senior officer of Columbia Funds and affiliated funds since 2002. | |
|
Scott R. Plummer (Born 1959)
5228 Ameriprise Financial Center
Minneapolis, MN 55474
Senior Vice President, Assistant Secretary and Chief Legal Officer (since 2010) | | Senior Vice President, Chief Legal Officer and Assistant Secretary, Columbia Management Investment Advisers, LLC since June 2005; Vice President and Lead Chief Counsel — Asset Management, Ameriprise Financial, Inc. since May 2010 (previously Vice President and Chief Counsel — Asset Management, from 2005 to April 2010); Vice President, Chief Counsel and Assistant Secretary, Columbia Management Investment Distributors, Inc. since 2008; Vice President, General Counsel and Secretary, Ameriprise Certificate Company since 2005; Chief Counsel, RiverSource Distributors, Inc. since 2006; Vice President, General Counsel and Secretary, RiverSource Funds since December 2006; Senior Vice President, Secretary and Chief Legal Officer, Columbia Funds, since May 2010. | |
|
Annual Report 2012
48
Columbia High Yield Municipal Fund
Board Members and Officers (continued)
Officers (continued)
| Name, Year of Birth and Address | | Principal Occupation(s) During the Past Five Years | |
William F. Truscott (Born 1960)
53600 Ameriprise Financial Center
Minneapolis, MN 55474
Senior Vice President (since 2010) | | Chairman of the Board and President, Columbia Management Investment Advisers, LLC since May 2010 and February 2012, respectively (previously President, Chairman of the Board and Chief Investment Officer, from 2001 to April 2010); Chief Executive Officer, U.S. Asset Management & President, Annuities, Ameriprise Financial, Inc. since May 2010 (previously President — U.S. Asset Management and Chief Investment Officer from 2005 to April 2010); Director, President and Chief Executive Officer, Ameriprise Certificate Company since 2006; Director and Chief Executive Officer, Columbia Management Investment Distributors, Inc. since May 2010 and February 2012, respectively (previously Chairman of the Board and Chief Executive Officer from 2008 to April 2010); Chairman of the Board and Chief Executive Officer, RiverSource Distributors, Inc. since 2006. | |
|
Thomas P. McGuire (Born 1972)
225 Franklin Street
Boston, MA 02110
Chief Compliance Officer (since 2012) | | Vice President — Asset Management Compliance, Columbia Management Investment Advisers, LLC since 2010; Chief Compliance Officer, Ameriprise Certificate Company, since September 2010; Compliance Executive, Bank of America, 2005-2010. | |
|
Colin Moore (Born 1958)
225 Franklin Street
Boston, MA 02110
Senior Vice President (since 2010) | | Director and Chief Investment Officer, Columbia Management Investment Advisers, LLC since May 2010; Manager, Managing Director and Chief Investment Officer of Columbia Management Advisors, LLC from 2007 to April 2010; Head of Equities, Columbia Management Advisors, LLC from 2002 to 2007. | |
|
Amy Johnson (Born 1965)
5228 Ameriprise Financial Center
Minneapolis, MN 55474
Vice President (since 2010) | | Senior Vice President and Chief Operating Officer, Columbia Management Investment Advisers, LLC since May 2010 (previously Chief Administrative Officer, from 2009 until April 2010, Vice President — Asset Management and Trust Company Services, from 2006 to 2009, and Vice President — Operations and Compliance from 2004 to 2006). | |
|
Joseph F. DiMaria (Born 1968)
225 Franklin Street
Boston, MA 02110
Vice President (since 2011) and Chief Accounting Officer (since 2008) | | Vice President, Mutual Fund Administration, Columbia Management Investment Advisers, LLC, since May 2010; Director of Fund Administration, Columbia Management Advisors, LLC from January 2006 to April 2010; Head of Tax/Compliance and Assistant Treasurer, Columbia Management Advisors, LLC, from November 2004 to December 2005. | |
|
Stephen T. Welsh (born 1957)
225 Franklin Street
Boston, MA 02110
Vice President (since 2006) | | President and Director, Columbia Management Investment Services Corp. since May 2010; President and Director, Columbia Management Services, Inc. from July 2004 to April 2010; Managing Director, Columbia Management Distributors, Inc. from August 2007 to April 2010. | |
|
Paul D. Pearson (born 1956)
10468 Ameriprise Financial Center
Minneapolis, MN 55474
Vice President and Assistant Treasurer (since 2011) | | Vice President, Investment Accounting, Columbia Management Investment Advisers, LLC, since May 2010; Vice President, Managed Assets, Investment Accounting, Ameriprise Financial Corporation. | |
|
Paul B. Goucher (born 1968)
5228 Ameriprise Financial Center
Minneapolis, MN 55474
Vice President and Assistant Secretary (since 2010) | | Vice President and Chief Counsel of Ameriprise Financial since January 2010 (formerly Vice President and Group Counsel from November 2008 to January 2010); Director, Managing Director and General Counsel of J. & W. Seligman & Co. Incorporated (Seligman) from July 2008 to November 2008 and Managing Director and Associate General Counsel of Seligman from January 2005 to July 2008. | |
|
Christopher O. Petersen (born 1970)
5228 Ameriprise Financial Center
Minneapolis, MN 55474
Vice President (since 2010) and Secretary (since 2011) | | Vice President and Chief Counsel, Ameriprise Financial since January 2010 (formerly Vice President and Group Counsel or Counsel from April 2004 to January 2010); Assistant Secretary of RiverSource Funds since January 2007; officer of Columbia Funds and affiliated funds since 2007. | |
|
Michael E. DeFao (born 1968)
225 Franklin Street
Boston, MA 02110
Vice President and Assistant Secretary (since 2011) | | Vice President and Chief Counsel, Ameriprise Financial since May 2010; Associate General Counsel, Bank of America from June 2005 to April 2010. | |
|
Annual Report 2012
49
Columbia High Yield Municipal Fund
Board Consideration and Approval of
Advisory Agreement
On March 7, 2012, the Board of Trustees (the "Board") and the Trustees who are not interested persons (as defined in the Investment Company Act of 1940) of the Trust (the "Independent Trustees") unanimously approved the continuation of the Investment Management Services Agreement (the "Advisory Agreement") with Columbia Management Investment Advisers, LLC (the "Investment Manager") with respect to Columbia High Yield Opportunity Fund (the "Fund"), a series of the Trust. As detailed below, the Advisory Fees and Expenses Committee (the "Committee") and the Board met on multiple occasions to review and discuss, both among themselves and with the management team of the Investment Manager, materials provided by the Investment Manager before determining to approve the continuation of the Advisory Agreement.
In connection with their deliberations regarding the continuation of the Advisory Agreement, the Committee and the Board requested and evaluated materials from the Investment Manager regarding the Fund and the Advisory Agreement, and discussed these materials with representatives of the Investment Manager at the Committee meeting held on March 6, 2012 and at the Board meeting held on March 7, 2012. In addition, the Board considers matters bearing on the Agreement at most of its other meetings throughout the year and meets regularly with senior management of the Funds and the Investment Manager. Through the Board's Investment Oversight Committees, Trustees also meet with selected Fund portfolio managers and other investment personnel at various times throughout the year. The Committee and the Board also consulted with Fund counsel and with the Independent Trustees' independent legal counsel, who advised on the legal standard for consideration by the Board and otherwise assisted the Board in its deliberations. On March 6, 2012, the Committee recommended that the Board approve the continuation of the Advisory Agreement. On March 7, 2012, the Board, including the Independent Trustees, voting separately, unanimously approved the continuation of the Advisory Agreement for the Fund.
The Committee and the Board considered all information that they, their legal counsel, or the Investment Manager believed reasonably necessary to evaluate and to determine whether to approve the continuation of the Advisory Agreement. In their deliberations, the Trustees did not identify any particular information that was all-important or controlling, and individual Trustees may have attributed different weights to the various factors. The information and factors considered by the Committee and the Board in recommending for approval or approving the continuation of the Advisory Agreement for the Fund included the following:
• Information on the investment performance of the Fund relative to the performance of the Fund's benchmarks and the performance of a group of comparable mutual funds, as determined by an independent third-party data provider;
• Information on the Fund's advisory fees and total expenses, including information comparing the Fund's expenses to those of a group of comparable mutual funds, as determined by an independent third-party data provider;
• [To be tailored for each Fund] [The Investment Manager's agreement to contractually limit or cap total operating expenses for the Fund so that total operating expenses (excluding certain fees and expenses, such as transaction costs and certain other investment related expenses, interest, taxes, acquired fund fees and expenses, and extraordinary expenses) would not exceed the median expenses of a group of comparable funds (as determined from time to time, generally annually, by an independent third-party data provider);
• The terms and conditions of the Advisory Agreement, including that the advisory fee rates payable by the Fund would not change;
• The terms and conditions of other agreements and arrangements with affiliates of the Investment Manager relating to the operations of the Fund, including the Administrative Services Agreement, the Distribution Agreement and the Transfer and Dividend Disbursing Agent Agreement, noting in the case of the Transfer and Dividend Disbursing Agent Agreement certain proposed changes to the fee rates payable thereunder;
• Descriptions of various functions performed by the Investment Manager under the Advisory Agreement, including portfolio management and portfolio trading practices;
• Information regarding the management fees and investment performance of any comparable portfolios of other clients of the Investment Manager, including institutional separate accounts; and
• The profitability to the Investment Manager and its affiliates from their relationships with the Fund.
Annual Report 2012
50
Columbia High Yield Municipal Fund
Board Consideration and Approval of
Advisory Agreement (continued)
Nature, Extent and Quality of Services to be Provided under the Advisory Agreement
The Committee and the Board considered the nature, extent and quality of services provided to the Fund by the Investment Manager and its affiliates under the Advisory Agreement and under separate agreements for the provision of transfer agency and administrative services, and the resources dedicated to the Fund and the other Columbia Funds by the Investment Manager and its affiliates. The Committee and the Board considered, among other things, the Investment Manager's ability to attract, motivate and retain highly qualified research, advisory and supervisory investment professionals (including personnel and other resources, compensation programs for personnel involved in fund management, reputation and other attributes), the portfolio management services provided by those investment professionals, the quality of the Investment Manager's investment research capabilities and trade execution services, and the other resources that the Investment Manager devotes to the Fund. The Committee and the Board also considered the potential benefits to shareholders of investing in a mutual fund that is part of a fund complex offering exposure to a variety of asset classes and investment disciplines and providing a variety of fund and shareholder services.
The Committee and the Board also considered the professional experience and qualifications of the senior personnel of the Investment Manager. The Committee and the Board noted the compliance programs of and the compliance-related resources provided to the Fund by the Investment Manager and its affiliates, and considered the Investment Manager's ability to provide administrative services to the Fund pursuant to a separate administrative services agreement, including the Investment Manager's ability to coordinate the activities of the Fund's other service providers. After reviewing these and related factors, the Committee and the Board concluded, within the context of their overall conclusions, that the expected nature, extent and quality of the services to be provided to the Fund under the Advisory Agreement supported the continuation of such agreement.
Investment Performance
The Committee and the Board reviewed information about the performance of the Fund over various time periods, including performance information relative to benchmarks and information based on reports of an independent third-party data provider that compared the performance of the Fund to the performance of a group of comparable mutual funds. The Committee and the Board also reviewed a description of the third party's methodology for identifying the Fund's peer groups for purposes of performance and expense comparisons. In the case of each Fund whose performance lagged that of a relevant peer group for certain (although not necessarily all) periods, the Committee and the Board concluded that other factors relevant to performance were sufficient, in light of other considerations, to warrant continuation of the Fund's Advisory Agreement. Those factors varied from fund to fund, but included one or more of the following: (i) that the Fund's performance, although lagging in certain recent periods, was stronger over the longer term; (ii) that the underperformance was attributable, to a significant extent, to investment decisions that were reasonable and consistent with the Fund's investment strategy and policies and that the Fund was performing within a reasonable range of expectations, given those investment decisions, market conditions and the Fund's investment strategy; (iii) that the Fund's performance was competitive when compared to other relevant performance benchmarks or peer groups; and (iv) that the Investment Manager had taken or was taking steps designed to help improve the Fund's investment performance, including, but not limited to, replacing portfolio managers, enhancing the resources supporting the portfolio managers, or modifying investment strategies.
The Committee and the Board noted that, through December 31, 2011, [to be tailored for each Fund]'s performance was in the forty-first, forty-eighth and fiftieth percentile (where the best performance would be in the first percentile) of its category selected by an independent third-party data provider for the purposes of performance comparisons for the one-, three- and five- year periods, respectively.
The Committee and the Board also considered the Investment Manager's performance and reputation generally, the Investment Manager's historical responsiveness to Board concerns about performance and the Investment Manager's willingness to take steps intended to improve performance. After reviewing these and related factors, the Committee and the Board concluded, within the context of their overall conclusions regarding the Advisory Agreement, that the performance of the Fund and the Investment Manager was sufficient, in light of other considerations, to warrant the continuation of the Advisory Agreement.
Annual Report 2012
51
Columbia High Yield Municipal Fund
Board Consideration and Approval of
Advisory Agreement (continued)
Investment Advisory Fee Rates and Other Expenses
The Committee and the Board considered the advisory fees to be charged to the Fund under the Advisory Agreement as well as the total expenses to be incurred by the Fund. In assessing the reasonableness of the fees under the Advisory Agreement, the Committee and the Board considered, among other information, the Fund's advisory fee and its expected total expense ratio as a percentage of average daily net assets. The Committee and the Board noted that [to be tailored for each Fund]'s actual management fee and total net expense ratio are both ranked in the first quintile against the Fund's expense universe as determined by an independent third-party data provider for purposes of expense comparison. The Committee and the Board also took into account the fee waiver and expense limitation arrangements agreed to by the Investment Manager, as noted above.
The Committee and the Board also considered the fact that the advisory fee rates payable by the Fund to the Investment Manager under the Advisory Agreement were the same as those currently paid by the Fund to the Investment Manager.
The Committee and the Board also received and considered information about the advisory fees charged by the Investment Manager to institutional separate accounts. In considering the fees charged to those accounts, the Committee and the Board took into account, among other things, the Investment Manager's representations about the differences between managing mutual funds as compared to other types of accounts, including differences in the services provided, differences in the risk profile of such business for the Investment Manager and the additional resources required to manage mutual funds effectively. In evaluating the Fund's advisory fees, the Committee and the Board also took into account the demands, complexity and quality of the investment management of the Fund.
After reviewing these and related factors, the Committee and the Board concluded, within the context of their overall conclusions, that the advisory fee rates and expenses of the Fund supported the continuation of the Advisory Agreement.
Costs of Services to be Provided and Profitability
The Committee and the Board also took note of the costs of the services provided (both on an absolute and relative basis) and the profitability to the Investment Manager and its affiliates in connection with their relationships with the Fund. In evaluating these considerations, the Committee and the Board took note of the advisory fees charged by the Investment Manager to other clients, including fees charged by the Investment Manager to any institutional separate account clients with similar investment strategies to those of the Fund.
The Committee and the Board also considered the compensation directly or indirectly received by the Investment Manager's affiliates in connection with their relationships with the Fund. The Committee and the Board reviewed information provided by management as to the profitability of the Investment Manager and its affiliates of their relationships with the Fund, and information about the allocation of expenses used to calculate profitability. When reviewing profitability, the Committee and the Board also considered court cases in which adviser profitability was an issue in whole or in part, the performance of the fund, the expense ratio of the fund, and the implementation of expense limitations with respect to the fund. The Committee and the Board also considered information provided by the Investment Manager regarding its financial condition and comparing its profitability to that of other asset management firms that are, or are subsidiaries of, publicly traded companies.
After reviewing these and related factors, the Committee and the Board concluded, within the context of their overall conclusions, that the profitability to the Investment Manager and its affiliates from their relationships with the Fund supported the continuation of the Advisory Agreement.
Economies of Scale
The Committee and the Board considered the potential existence of economies of scale in the provision by the Investment Manager of services to the Fund, to groups of related funds, and to the Investment Manager's investment advisory clients as a whole, and whether those economies of scale were shared with the Fund through breakpoints in investment advisory fees or other means, such as expense limitation arrangements and additional investments by the Investment Manager in investment, trading and compliance resources. The Committee and the Board noted that the investment advisory fee schedules for the Fund contained breakpoints that would reduce the fee rate on assets above specified threshold levels.
Annual Report 2012
52
Columbia High Yield Municipal Fund
Board Consideration and Approval of
Advisory Agreement (continued)
In considering these issues, the Committee and the Board also considered the costs of the services provided (both on an absolute and relative basis) and the profitability to the Investment Manager and its affiliates from their relationships with the Fund, as discussed above. After reviewing these and related factors, the Committee and the Board concluded, within the context of their overall conclusions, that the extent to which economies of scale were expected to be shared with the Fund supported the continuation of the Advisory Agreement.
Other Benefits to the Investment Manager
The Committee and the Board received and considered information regarding "fall-out" or ancillary benefits received by the Investment Manager and its affiliates as a result of their relationships with the Fund, such as the engagement of the Investment Manager to provide administrative services to the Fund and the engagement of the Investment Manager's affiliates to provide distribution and transfer agency services to the Fund. The Committee and the Board considered that the Fund's distributor retains a portion of the distribution fees from the Fund and receives a portion of the sales charges on sales or redemptions of certain classes of shares of the Fund. The Committee and the Board also considered the benefits of research made available to the Investment Manager by reason of brokerage commissions generated by the Fund's securities transactions, and reviewed information about the Investment Manager's practices with respect to allocating portfolio brokerage for brokerage and research services. The Committee and the Board considered the possible conflicts of interest associated with certain fall-out or other ancillary benefits and the reporting, disclosure and other processes that would be in place to address such possible conflicts of interest. The Committee and the Board recognized that the Investment Manager's profitability would be somewhat lower without these benefits.
Conclusion
The Committee and the Board reviewed all of the above considerations in reaching their decisions to recommend or approve the continuation of the Advisory Agreement. No single item was identified as paramount or controlling, and individual Trustees may have attributed different weights to various factors. Based on their evaluation of all factors that they deemed to be material, including those factors described above, and assisted by the advice of independent legal counsel, the Board, including the Independent Trustees, voting separately, unanimously approved the continuation of the Advisory Agreement.
Annual Report 2012
53
This page intentionally left blank.
Annual Report 2012
54
This page intentionally left blank.
Annual Report 2012
55
This page intentionally left blank.
Annual Report 2012
56
Columbia High Yield Municipal Fund
Important Information About This Report
Each fund mails one shareholder report to each shareholder address. If you would like more than one report, please call shareholder services at 800.345.6611 and additional reports will be sent to you.
The policy of the Board is to vote the proxies of the companies in which each fund holds investments consistent with the procedures as stated in the Statement of Additional Information (SAI). You may obtain a copy of the SAI without charge by calling 800.345.6611; contacting your financial intermediary; visiting columbiamanagement.com; or searching the website of the Securities and Exchange Commission (SEC) at http://www.sec.gov. Information regarding how each fund voted proxies relating to portfolio securities is filed with the SEC by August 31 for the most recent 12-month period ending June 30 of that year, and is available without charge by visiting columbiamanagement.com; or searching the website of the SEC at sec.gov.
Each fund files a complete schedule of portfolio holdings with the SEC for the first and third quarters of each fiscal year on Form N-Q. Each fund's Form N-Q is available on the SEC's website at sec.gov and may be reviewed and copied at the SEC's Public Reference Room in Washington, D.C. Information on the operation of the Public Reference Room may be obtained by calling 800.SEC.0330. Each fund's complete schedule of portfolio holdings, as filed on Form N-Q, can also be obtained without charge, upon request, by calling 800.345.6611.
Annual Report 2012
57

Columbia High Yield Municipal Fund
P.O. Box 8081
Boston, MA 02266-8081
columbiamanagement.com
This information is for use with concurrent or prior delivery of a fund prospectus. Please read and consider the investment objectives, risks, charges and expenses for any fund carefully before investing. For a prospectus which contains this and other important information about the fund go to columbiamanagement.com. The fund is distributed by Columbia Management Investment Distributors, Inc., member FINRA, and managed by Columbia Management Investment Advisers, LLC.
© 2012 Columbia Management Investment Advisers, LLC. All rights reserved.
C-1356 D (7/12)
Annual Report
May 31, 2012

Columbia High Yield Opportunity Fund
Not FDIC insured • No bank guarantee • May lose value
Columbia High Yield Opportunity Fund
President's Message
 Dear Shareholders,
A stock market rally that commenced in the fourth quarter of 2011 continued into 2012 in the United States and around the world, as all major market regions generated double-digit returns for the three-month period ended March 31, 2012. Volatility declined sharply as European debt fears quieted somewhat and sentiment improved. Returns in developed countries were buoyed by strong results in Germany, Belgium, Austria and the Nordic markets of Denmark, Finland, Norway and Sweden. Under the cloud of its own mounting debt problem, Spain was the only eurozone country to deliver a negative return during the three-month period. Solid economic growth and accommodative monetary policy helped boost gains in emerging markets. The rally in U.S. equities was largely driven by an expansion in "multiples" — an increase in stock prices relative to their earnings. By the end of the first quarter of 2012, stocks no longer appeared as cheap as they were late in 2011. Bonds lagged stocks during the first quarter as investors responded to signs of an improved environment with a greater appetite for risk.
Concerns around the health of the global economy were centered in news headlines focusing on Washington D.C., Europe, China and the Middle East. In the United States, economic indicators remained mixed but generally indicated support for slow, sustainable economic growth. European policymakers have made progress in containing the eurozone debt crisis, though they still have not solved the issue of long-term solvency. The European Central Bank has lowered interest rates and flooded the financial system with liquidity that may provide breathing space for a restructuring of fiscal balance sheets. These massive infusions of liquidity may whet the appetite for risk from investors around the world. However, they have delayed a true reckoning with the European financial situation, as concerns about Greece, Spain and Portugal continue to cloud the outlook. The structural challenges that persist in the developed world, and slower growth in emerging market economies, leave the global economy in a fragile state. Domestic demand, combined with slowing inflationary trends, has also helped to shore up emerging market economies. Joblessness remains relatively low and monetary conditions remain easy.
Despite the challenges and surprises of 2011, we see pockets of strength — and as a result, attractive opportunities — both here and abroad for 2012. We hope to help you capitalize on these opportunities with various articles in our 2012 Perspectives, which is available via the Market Insights tab at columbiamanagement.com. This publication showcases the strong research capabilities and experienced investment teams of Columbia Management and offers a diverse array of investment ideas based on our five key themes for 2012.
Other information and resources available at columbiamanagement.com include:
> detailed up-to-date fund performance and portfolio information
> economic analysis and market commentary
> quarterly fund commentaries
> Columbia Management Investor, our award-winning quarterly newsletter for shareholders
Thank you for your continued support of the Columbia Funds. We look forward to serving your investment needs for many years to come.
Best Regards,

J. Kevin Connaughton
President, Columbia Funds
Investors should consider the investment objectives, risks, charges and expenses of a mutual fund carefully before investing. For a free prospectus, which contains this and other important information about the funds, visit columbiamanagement.com. The prospectus should be read carefully before investing.
Columbia Funds are distributed by Columbia Management Investment Distributors, Inc., member FINRA, and managed by Columbia Management Investment Advisers, LLC.
© 2012 Columbia Management Investment Advisers, LLC. All rights reserved.
Annual Report 2012
Columbia High Yield Opportunity Fund
Table of Contents
| Performance Overview | | | 2 | | |
|
| Manager Discussion of Fund Performance | | | 4 | | |
|
| Understanding Your Fund's Expenses | | | 6 | | |
|
| Portfolio of Investments | | | 7 | | |
|
| Statement of Assets and Liabilities | | | 21 | | |
|
| Statement of Operations | | | 23 | | |
|
| Statement of Changes in Net Assets | | | 24 | | |
|
| Financial Highlights | | | 26 | | |
|
| Notes to Financial Statements | | | 30 | | |
|
Report of Independent Registered
Public Accounting Firm | | | 40 | | |
|
| Board Members and Officers | | | 41 | | |
|
| Board Consideration and Approval of Advisory Agreement | | | 44 | | |
|
| Important Information About This Report | | | 49 | | |
|
Fund Investment Manager
Columbia Management Investment
Advisers, LLC
225 Franklin Street
Boston, MA 02110
Fund Distributor
Columbia Management Investment
Distributors, Inc.
225 Franklin Street
Boston, MA 02110
Fund Transfer Agent
Columbia Management Investment
Services Corp.
P.O. Box 8081
Boston, MA 02266-8081
For more information about any of the funds, please visit columbiamanagement.com or call 800.345.6611. Customer Service Representatives are available to answer your questions Monday through Friday from 8 a.m. to 8 p.m. Eastern time.
The views expressed in this report reflect the current views of the respective parties. These views are not guarantees of future performance and involve certain risks, uncertainties and assumptions that are difficult to predict, so actual outcomes and results may differ significantly from the views expressed. These views are subject to change at any time based upon economic, market or other conditions and the respective parties disclaim any responsibility to update such views. These views may not be relied on as investment advice and, because investment decisions for a Columbia Fund are based on numerous factors, may not be relied on as an indication of trading intent on behalf of any particular Columbia Fund. References to specific securities should not be construed as a recommendation or investment advice.
Annual Report 2012
Columbia High Yield Opportunity Fund
Performance Overview
Performance Summary
> For the 12-month period that ended May 31, 2012, Columbia High Yield Opportunity Fund (the fund) Class A shares returned 5.14% excluding sales charge.
> The fund outperformed its new primary benchmark, the BofA Merrill Lynch US High Yield Cash Pay Constrained Index, which returned 3.43%, as well as its former primary benchmarks, the JPMorgan Global High Yield Index and the Credit Suisse High Yield Index, which returned 4.84% and 4.52%, respectively, for the same period.
> Security selection gave the fund an edge versus its benchmark.
Average Annual Total Returns (%) (for period ended May 31, 2012)
| | | Inception | | 1 Year | | 5 Years | | 10 Years | |
| Class A | | 10/21/71 | | | | | | | | | | | | | |
| Excluding sales charges | | | | | | | 5.14 | | | | 5.09 | | | | 7.27 | | |
| Including sales charges | | | | | | | 0.06 | | | | 4.05 | | | | 6.76 | | |
| Class B | | 06/08/92 | | | | | | | | | | | | | |
| Excluding sales charges | | | | | | | 4.11 | | | | 4.26 | | | | 6.45 | | |
| Including sales charges | | | | | | | -0.81 | | | | 3.97 | | | | 6.45 | | |
| Class C | | 01/15/96 | | | | | | | | | | | | | |
| Excluding sales charges | | | | | | | 4.52 | | | | 4.46 | | | | 6.64 | | |
| Including sales charges | | | | | | | 3.53 | | | | 4.46 | | | | 6.64 | | |
| Class Z | | 01/08/99 | | | 5.40 | | | | 5.35 | | | | 7.54 | | |
| BofA Merrill Lynch US High Yield Cash Pay Constrained Index | | | | | | | 3.43 | | | | 7.43 | | | | 8.85 | | |
| Credit Suisse High Yield Index | | | | | | | 4.52 | | | | 7.00 | | | | 9.17 | | |
| JPMorgan Global High Yield Index | | | | | | | 4.84 | | | | 7.80 | | | | 9.48 | | |
Returns for Class A are shown with and without the maximum initial sales charge of 4.75%. Returns for Class B are shown with and without the applicable contingent deferred sales charge (CDSC) of 5.00% in the first year, declining to 1.00% in the sixth year and eliminated thereafter. Returns for Class C are shown with and without the 1.00% CDSC for the first year only. The fund's other classes are not subject to sales charges and have limited eligibility. Please see the fund's prospectuses for details. Performance for different share classes will vary based on differences in sales charges and fees associated with each class. All results shown assume reinvestment of distributions during the period. Returns do not reflect the deduction of taxes that a shareholder may pay on fund distributions or on the redemption of fund shares. Performance results reflect the effect of any fee waivers or reimbursements of fund expenses by Columbia Management Investment Advisers, LLC and/or any of its affiliates. Absent these fee waivers or expense reimbursement arrangements, performance results would have been lower.
The performance information shown represents past performance and is not a guarantee of future results. The investment return and principal value of your investment will fluctuate so that your shares, when redeemed, may be worth more or less than their original cost. Current performance may be lower or higher than the performance information shown. You may obtain performance information current to the most recent month-end by contacting your financial intermediary, visiting columbiamanagement.com or calling 800.345.6611.
The BofA Merrill Lynch US High Yield Cash Pay Constrained Index tracks the performance of U.S. dollar-denominated below investment grade corporate debt, currently in a coupon paying period, that is publicly issued in the U.S. domestic market.
The Credit Suisse High Yield Index is a broad-based index that tracks the performance of high-yield bonds.
The JPMorgan Global High Yield Index is designed to mirror the investable universe of the U.S. dollar global high yield corporate debt market, including domestic and international issues.
Indices are not available for investment, are not professionally managed and do not reflect sales charges, fees, brokerage commissions, taxes or other expenses of investing. Securities in the fund may not match those in an index.
Annual Report 2012
2
Columbia High Yield Opportunity Fund
Performance Overview (continued)
Performance of a Hypothetical $10,000 Investment (June 1, 2002 – May 31, 2012)
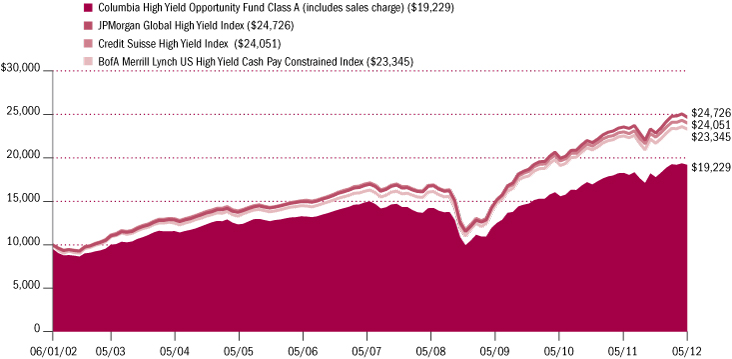
The chart above shows the change in value of a hypothetical $10,000 investment in Class A shares of Columbia High Yield Opportunity Fund during the stated time period, and does not reflect the deduction of taxes that a shareholder may pay on fund distributions or on the redemption of fund shares.
Annual Report 2012
3
Columbia High Yield Opportunity Fund
Manager Discussion of Fund Performance
On April 1, 2012, the fund adopted a new primary benchmark, the BofA Merrill Lynch US High Yield Cash Pay Constrained Index. We believe the new benchmark better reflects how the fund is managed.
For the 12-month period that ended May 31, 2012, the fund's Class A shares returned 5.14% without sales charge. The fund's new primary benchmark, the BofA Merrill Lynch US High Yield Cash Pay Constrained Index, returned 3.43%. Its former primary benchmarks, the JPMorgan Global High Yield Index, and the Credit Suisse High Yield Index, returned 4.84% and 4.52%, respectively. Security selection was the primary source of the fund's outperformance. Industry allocations also aided results.
Shifting Economic Conditions
Early in the 12-month period, Europe's debt problems and wrangling in Washington over the federal budget and the national debt dominated world headlines. U.S. economic news was lackluster and job growth was disappointing. The pace of both economic and job growth picked up early in 2012, but disappointed again as the period wore on. Even though approximately 1.4 million new jobs were added to the labor markets during the 12-month period, the pace of job growth slowed markedly in April and May. Economic growth, as measured by gross domestic product, slipped to 1.9% in the first quarter and expectations for second quarter growth are no higher. Manufacturing activity continued to expand — the one consistent bright spot throughout this recovery. And the housing market showed a glimmer of improvement, as year-over-year sales improved, inventories tightened and prices stabilized somewhat.
Security Selection Drove Results
Against this economic backdrop, the high-yield market experienced volatility, especially in the late summer and early fall of 2011, when the European sovereign crisis and a series of weak domestic economic reports caused investors to make a pronounced move away from riskier assets. In this environment, the fund's relatively conservative orientation was helpful, and relative performance was also aided by the following specific investments across different industry groups. Casino developer ROC Finance, CenturyLink and Ally Financial, the successor company to GMAC, all performed well during the period. The fund's investments in energy exploration and production, integrated telecommunications and broadcast media also produced incrementally positive returns.
Investments in wireless telecom, oil field equipment and service and paper and forest products were a drag on returns. Specific securities that detracted from relative performance included Verso Paper (position eliminated), Aquilix Holdings (position eliminated) and Wind Acquisition.
During the course of the 12-month period, we increased the fund's exposure to basic industry, consumer cyclical companies and food and drug retailers. Each of these sectors had been underweighted at the outset of the period. We also increased existing overweights to sectors such as integrated telecom, healthcare facilities and media services. The fund remains underweight in financials, utilities, technology and building and construction. We reduced the fund's underweight in BB rated securities by adding to the sector.
Portfolio Management
Brian Lavin, CFA
Jennifer Ponce de Leon
Annual Report 2012
4
Columbia High Yield Opportunity Fund
Manager Discussion of Fund Performance (continued)
Looking Ahead
We remain positive on the high-yield market despite a wide array of macroeconomic challenges and the volatility that comes with them. Overseas, it appears unlikely to us that the ongoing European debt crisis will be solved in the near term, and growth rates in developing countries, particularly China, have come under pressure. Domestically, the overhang of high unemployment and a weak housing market suggest that growth will be muted and vulnerable to outside shocks. Despite these negatives, we currently expect corporate earnings to grow in the year ahead, although the rate of growth may not rise to the level of the past year, and we currently expect default rates to remain relatively low. The latter is especially important because we believe that macro related risks are providing additional compensation relative to our view of default rates. We continue to believe that bottom-up credit selection will be a key driver of relative performance in 2012 just as it was in 2011. Determining which issuers and industries are less vulnerable to macroeconomic headwinds will again be of paramount importance, but we believe there are still solid risk-adjusted values in the marketplace and will look to invest incremental dollars in the mid to higher quality segments of the market.
Portfolio Breakdown (%)
(at May 31, 2012) | |
| Corporate Bonds & Notes | | | 94.4 | | |
| Municipal Bonds | | | 0.6 | | |
| Senior Loans | | | 2.9 | | |
| Common Stocks | | | 0.0 | (a) | |
| Warrants | | | 0.0 | (a) | |
| Other(b) | | | 2.1 | | |
Percentages indicated are based upon total investments (excluding Investments of Cash Collateral Received for Securities on Loan). The Fund's composition is subject to change.
(a) Rounds to less than 0.1%.
(b) Includes investments in money market funds.
Quality Breakdown (%)
(at May 31, 2012) | |
| B rating | | | 45.4 | | |
| BB rating | | | 39.4 | | |
| BBB rating | | | 2.0 | | |
| CCC rating | | | 12.4 | | |
| Not rated | | | 0.8 | | |
Percentages indicated are based upon total fixed income securities (excluding Investments of Cash Collateral Received for Securities on Loan and money market funds).
Bond ratings apply to the underlying holdings of the Fund and not the Fund itself and are divided into categories ranging from AAA (highest) to D (lowest), and are subject to change. The ratings shown are determined by using the average of the ratings from Moody's, S&P, and Fitch. When a rating from only two agencies is available, the average of the two is used. When a rating from only one agency is available, that rating is used. When a bond is not rated by any of these agencies, it is designated as Not rated. Credit ratings are subjective opinions and not statements of fact.
Annual Report 2012
5
Columbia High Yield Opportunity Fund
Understanding Your Fund's Expenses
(Unaudited)
As an investor, you incur two types of costs. There are transaction costs, which generally include sales charges on purchases and may include redemption fees. There are also ongoing costs, which generally include management fees, distribution and service (Rule 12b-1) fees, and other fund expenses. The following information is intended to help you understand your ongoing costs (in dollars) of investing in the Fund and to help you compare these costs with the ongoing costs of investing in other mutual funds.
Analyzing Your Fund's Expenses
To illustrate these ongoing costs, we have provided examples and calculated the expenses paid by investors in each share class of the Fund during the period. The actual and hypothetical information in the table is based on an initial investment of $1,000 at the beginning of the period indicated and held for the entire period. Expense information is calculated two ways and each method provides you with different information. The amount listed in the "Actual" column is calculated using the Fund's actual operating expenses and total return for the period. You may use the Actual information, together with the amount invested, to estimate the expenses that you paid over the period. Simply divide your account value by $1,000 (for example, an $8,600 account value divided by $1,000 = 8.6), then multiply the results by the expenses paid during the period under the Actual column. The amount listed in the "Hypothetical" column assumes a 5% annual rate of return before expenses (which is not the Fund's actual return) and then applies the Fund's actual expense ratio for the period to the hypothetical return. You should not use the hypothetical account values and expenses to estimate either your actual account balance at the end of the period or the expenses you paid during the period. See "Compare With Other Funds" below for details on how to use the hypothetical data.
Compare With Other Funds
Since all mutual funds are required to include the same hypothetical calculations about expenses in shareholder reports, you can use this information to compare the ongoing cost of investing in the Fund with other funds. To do so, compare the hypothetical example with the 5% hypothetical examples that appear in the shareholder reports of other funds. As you compare hypothetical examples of other funds, it is important to note that hypothetical examples are meant to highlight the ongoing costs of investing in a fund only and do not reflect any transaction costs, such as sales charges, or redemption or exchange fees. Therefore, the hypothetical calculations are useful in comparing ongoing costs only, and will not help you determine the relative total costs of owning different funds. If transaction costs were included in these calculations, your costs would be higher.
December 1, 2011 – May 31, 2012
| | | Account Value at the Beginning
of the Period ($) | | Account Value at the End of the
Period ($) | | Expenses Paid During the
Period ($) | | Fund's Annualized
Expense Ratio (%) | |
| | | Actual | | Hypothetical | | Actual | | Hypothetical | | Actual | | Hypothetical | | Actual | |
| Class A | | | 1,000.00 | | | | 1,000.00 | | | | 1,079.50 | | | | 1,019.40 | | | | 5.82 | | | | 5.65 | | | | 1.12 | | |
| Class B | | | 1,000.00 | | | | 1,000.00 | | | | 1,075.60 | | | | 1,015.70 | | | | 9.65 | | | | 9.37 | | | | 1.86 | | |
| Class C | | | 1,000.00 | | | | 1,000.00 | | | | 1,076.30 | | | | 1,016.40 | | | | 8.93 | | | | 8.67 | | | | 1.72 | | |
| Class Z | | | 1,000.00 | | | | 1,000.00 | | | | 1,080.80 | | | | 1,020.65 | | | | 4.53 | | | | 4.39 | | | | 0.87 | | |
Expenses paid during the period are equal to the annualized expense ratio for each class as indicated above, multiplied by the average account value over the period and then multiplied by the number of days in the Fund's most recent fiscal half year and divided by 366.
Expenses do not include fees and expenses incurred indirectly by the Fund from the underlying funds in which the Fund may invest (also referred to as "acquired funds"), including affiliated and non-affiliated pooled investment vehicles (including mutual funds and exchange traded funds).
Had the Columbia Management Investment Advisers, LLC and/or certain of its affiliates not waived/reimbursed certain fees and expenses, account value at the end of the period would have been reduced.
Annual Report 2012
6
Columbia High Yield Opportunity Fund
Portfolio of Investments
May 31, 2012
(Percentages represent value of investments compared to net assets)
Corporate Bonds & Notes 92.4%
Issuer | | Coupon
Rate | | Principal
Amount ($) | |
Value ($) | |
| Aerospace & Defense 3.0% | |
ADS Tactical, Inc.
Senior Secured(a)
04/01/18 | | | 11.000 | % | | | 2,133,000 | | | | 2,138,332 | | |
Huntington Ingalls Industries, Inc.
03/15/18 | | | 6.875 | % | | | 981,000 | | | | 1,015,335 | | |
| 03/15/21 | | | 7.125 | % | | | 1,370,000 | | | | 1,421,375 | | |
Kratos Defense & Security Solutions, Inc.
Senior Secured
06/01/17 | | | 10.000 | % | | | 3,191,000 | | | | 3,382,460 | | |
Oshkosh Corp.
03/01/17 | | | 8.250 | % | | | 488,000 | | | | 536,190 | | |
| 03/01/20 | | | 8.500 | % | | | 1,443,000 | | | | 1,583,693 | | |
| Total | | | | | | | 10,077,385 | | |
| Automotive 3.2% | |
Allison Transmission, Inc.(a)
05/15/19 | | | 7.125 | % | | | 585,000 | | | | 609,862 | | |
Chrysler Group LLC/Co-Issuer, Inc.
Secured
06/15/21 | | | 8.250 | % | | | 1,553,000 | | | | 1,556,882 | | |
Chrysler Group LLC/Co-Issuer, Inc.(b)
Secured
06/15/19 | | | 8.000 | % | | | 403,000 | | | | 404,008 | | |
Dana Holding Corp.
Senior Unsecured
02/15/21 | | | 6.750 | % | | | 377,000 | | | | 402,448 | | |
Delphi Corp.
05/15/21 | | | 6.125 | % | | | 278,000 | | | | 296,070 | | |
Delphi Corp.(b)
05/15/19 | | | 5.875 | % | | | 417,000 | | | | 436,808 | | |
Ford Motor Credit Co. LLC
Senior Unsecured
02/01/21 | | | 5.750 | % | | | 1,841,000 | | | | 2,095,627 | | |
Lear Corp.
03/15/18 | | | 7.875 | % | | | 1,325,000 | | | | 1,450,875 | | |
| 03/15/20 | | | 8.125 | % | | | 531,000 | | | | 593,392 | | |
Schaeffler Finance BV(a)
Senior Secured
02/15/17 | | | 7.750 | % | | | 476,000 | | | | 492,660 | | |
| 02/15/19 | | | 8.500 | % | | | 640,000 | | | | 675,200 | | |
Visteon Corp.
04/15/19 | | | 6.750 | % | | | 1,563,000 | | | | 1,557,139 | | |
| Total | | | | | | | 10,570,971 | | |
Corporate Bonds & Notes (continued)
Issuer | | Coupon
Rate | | Principal
Amount ($) | |
Value ($) | |
| Banking 0.4% | |
Lloyds Banking Group PLC(a)(c)
11/29/49 | | | 6.267 | % | | | 1,173,000 | | | | 662,745 | | |
Synovus Financial Corp.
Senior Unsecured
02/15/19 | | | 7.875 | % | | | 636,000 | | | | 666,210 | | |
| Total | | | | | | | 1,328,955 | | |
| Brokerage 1.6% | |
E*Trade Financial Corp.
Senior Unsecured
12/01/15 | | | 7.875 | % | | | 870,000 | | | | 883,050 | | |
| 11/30/17 | | | 12.500 | % | | | 2,757,000 | | | | 3,163,657 | | |
Neuberger Berman Group LLC/Finance Corp.(a)
Senior Unsecured
03/15/20 | | | 5.625 | % | | | 424,000 | | | | 433,540 | | |
| 03/15/22 | | | 5.875 | % | | | 636,000 | | | | 651,900 | | |
| Total | | | | | | | 5,132,147 | | |
| Building Materials 1.5% | |
Building Materials Corp. of America
Senior Notes(a)
05/01/21 | | | 6.750 | % | | | 2,155,000 | | | | 2,203,487 | | |
Gibraltar Industries, Inc.
12/01/15 | | | 8.000 | % | | | 960,000 | | | | 976,800 | | |
Interface, Inc.
12/01/18 | | | 7.625 | % | | | 265,000 | | | | 284,213 | | |
Norcraft Companies LP/Finance Corp.
Secured
12/15/15 | | | 10.500 | % | | | 1,056,000 | | | | 1,008,480 | | |
Nortek, Inc.
12/01/18 | | | 10.000 | % | | | 103,000 | | | | 108,665 | | |
| 04/15/21 | | | 8.500 | % | | | 424,000 | | | | 411,280 | | |
| Total | | | | | | | 4,992,925 | | |
| Chemicals 4.2% | |
Celanese U.S. Holdings LLC
06/15/21 | | | 5.875 | % | | | 244,000 | | | | 254,370 | | |
Hexion US Finance Corp.
Senior Unsecured(a)
04/15/20 | | | 6.625 | % | | | 1,304,000 | | | | 1,317,040 | | |
Huntsman International LLC
03/15/21 | | | 8.625 | % | | | 383,000 | | | | 428,960 | | |
Ineos Finance PLC(a)
Senior Secured
05/15/15 | | | 9.000 | % | | | 1,983,000 | | | | 2,082,150 | | |
| 02/15/19 | | | 8.375 | % | | | 783,000 | | | | 804,532 | | |
| 05/01/20 | | | 7.500 | % | | | 182,000 | | | | 180,180 | | |
The accompanying Notes to Financial Statements are an integral part of this statement.
Annual Report 2012
7
Columbia High Yield Opportunity Fund
Portfolio of Investments (continued)
May 31, 2012
Corporate Bonds & Notes (continued)
Issuer | | Coupon
Rate | | Principal
Amount ($) | |
Value ($) | |
JM Huber Corp.
Senior Unsecured(a)
11/01/19 | | | 9.875 | % | | | 785,000 | | | | 816,400 | | |
LyondellBasell Industries NV(a)
11/15/21 | | | 6.000 | % | | | 4,265,000 | | | | 4,563,550 | | |
Senior Notes
04/15/24 | | | 5.750 | % | | | 1,218,000 | | | | 1,248,450 | | |
MacDermid, Inc.(a)
04/15/17 | | | 9.500 | % | | | 580,000 | | | | 603,200 | | |
Momentive Performance Materials, Inc.
Secured
06/15/14 | | | 12.500 | % | | | 505,000 | | | | 528,988 | | |
Polypore International, Inc.
11/15/17 | | | 7.500 | % | | | 920,000 | | | | 961,400 | | |
| Total | | | | | | | 13,789,220 | | |
| Construction Machinery 3.5% | |
CNH Capital LLC(a)
11/01/16 | | | 6.250 | % | | | 1,201,000 | | | | 1,252,042 | | |
Case New Holland, Inc.
12/01/17 | | | 7.875 | % | | | 1,947,000 | | | | 2,219,580 | | |
Columbus McKinnon Corp.
02/01/19 | | | 7.875 | % | | | 319,000 | | | | 336,545 | | |
Manitowoc Co., Inc. (The)(b)
11/01/20 | | | 8.500 | % | | | 795,000 | | | | 852,637 | | |
Neff Rental LLC/Finance Corp.
Secured(a)
05/15/16 | | | 9.625 | % | | | 1,210,000 | | | | 1,200,925 | | |
UR Merger Sub Corp.
12/15/19 | | | 9.250 | % | | | 1,400,000 | | | | 1,543,500 | | |
Senior Unsecured
02/01/21 | | | 8.250 | % | | | 485,000 | | | | 512,888 | | |
UR Merger Sub Corp.(a)
05/15/20 | | | 7.375 | % | | | 616,000 | | | | 629,860 | | |
| 04/15/22 | | | 7.625 | % | | | 1,540,000 | | | | 1,574,650 | | |
Secured
07/15/18 | | | 5.750 | % | | | 744,000 | | | | 753,300 | | |
Xerium Technologies, Inc.
06/15/18 | | | 8.875 | % | | | 715,000 | | | | 539,825 | | |
| Total | | | | | | | 11,415,752 | | |
| Consumer Cyclical Services 0.4% | |
Goodman Networks, Inc.
Senior Secured(a)
07/01/18 | | | 12.125 | % | | | 803,000 | | | | 812,034 | | |
Realogy Corp.
Senior Secured(a)
01/15/20 | | | 9.000 | % | | | 668,000 | | | | 668,000 | | |
| Total | | | | | | | 1,480,034 | | |
Corporate Bonds & Notes (continued)
Issuer | | Coupon
Rate | | Principal
Amount ($) | |
Value ($) | |
| Consumer Products 0.6% | |
Libbey Glass, Inc.(a)
05/15/20 | | | 6.875 | % | | | 367,000 | | | | 369,753 | | |
Mead Products LLC/ACCO Brands Corp.(a)
04/30/20 | | | 6.750 | % | | | 361,000 | | | | 370,927 | | |
Sealy Mattress Co.(b)
06/15/14 | | | 8.250 | % | | | 949,000 | | | | 918,157 | | |
Spectrum Brands, Inc.
Senior Unsecured(a)(b)
03/15/20 | | | 6.750 | % | | | 256,000 | | | | 259,200 | | |
| Total | | | | | | | 1,918,037 | | |
| Diversified Manufacturing 1.1% | |
Actuant Corp.(a)
06/15/22 | | | 5.625 | % | | | 504,000 | | | | 515,340 | | |
Amsted Industries, Inc.
Senior Notes(a)
03/15/18 | | | 8.125 | % | | | 1,000,000 | | | | 1,057,500 | | |
CPM Holdings, Inc.
Senior Secured
09/01/14 | | | 10.625 | % | | | 902,000 | | | | 956,120 | | |
Tomkins LLC/Inc.
Secured
10/01/18 | | | 9.000 | % | | | 332,000 | | | | 364,785 | | |
WireCo WorldGroup, Inc.
05/15/17 | | | 9.500 | % | | | 622,000 | | | | 646,880 | | |
| Total | | | | | | | 3,540,625 | | |
| Electric 1.5% | |
AES Corp. (The)
Senior Unsecured
10/15/17 | | | 8.000 | % | | | 331,000 | | | | 367,410 | | |
AES Corp. (The)(a)
Senior Unsecured
07/01/21 | | | 7.375 | % | | | 1,764,000 | | | | 1,905,120 | | |
CMS Energy Corp.
Senior Unsecured
03/15/22 | | | 5.050 | % | | | 263,000 | | | | 272,450 | | |
Calpine Corp.
Senior Secured(a)
02/15/21 | | | 7.500 | % | | | 790,000 | | | | 825,550 | | |
GenOn Energy, Inc.
Senior Unsecured
10/15/18 | | | 9.500 | % | | | 673,000 | | | | 625,890 | | |
Ipalco Enterprises, Inc.
Senior Secured(a)
04/01/16 | | | 7.250 | % | | | 1,025,000 | | | | 1,114,688 | | |
| Total | | | | | | | 5,111,108 | | |
The accompanying Notes to Financial Statements are an integral part of this statement.
Annual Report 2012
8
Columbia High Yield Opportunity Fund
Portfolio of Investments (continued)
May 31, 2012
Corporate Bonds & Notes (continued)
Issuer | | Coupon
Rate | | Principal
Amount ($) | |
Value ($) | |
| Entertainment 0.3% | |
AMC Entertainment, Inc.
12/01/20 | | | 9.750 | % | | | 664,000 | | | | 713,800 | | |
Six Flags, Inc.(a)(d)(e)(f)
06/01/14 | | | 9.625 | % | | | 950,000 | | | | — | | |
Speedway Motorsports, Inc.(b)
02/01/19 | | | 6.750 | % | | | 121,000 | | | | 124,327 | | |
Vail Resorts, Inc.
05/01/19 | | | 6.500 | % | | | 228,000 | | | | 238,830 | | |
| Total | | | | | | | 1,076,957 | | |
| Food and Beverage 0.7% | |
Cott Beverages, Inc.
11/15/17 | | | 8.375 | % | | | 1,439,000 | | | | 1,550,522 | | |
| 09/01/18 | | | 8.125 | % | | | 435,000 | | | | 468,713 | | |
Del Monte Corp.
02/15/19 | | | 7.625 | % | | | 222,000 | | | | 215,340 | | |
| Total | | | | | | | 2,234,575 | | |
| Gaming 3.7% | |
Caesars Entertainment Operating Co., Inc.
Secured
04/15/18 | | | 12.750 | % | | | 745,000 | | | | 588,550 | | |
Caesars Entertainment Operating Co., Inc.(a)(b)
Senior Secured
02/15/20 | | | 8.500 | % | | | 2,771,000 | | | | 2,760,609 | | |
Chester Downs & Marina LLC
Senior Secured(a)
02/01/20 | | | 9.250 | % | | | 593,000 | | | | 610,790 | | |
MGM Resorts International
03/01/18 | | | 11.375 | % | | | 636,000 | | | | 732,990 | | |
Senior Secured
03/15/20 | | | 9.000 | % | | | 993,000 | | | | 1,087,335 | | |
MGM Resorts International(b)
07/15/15 | | | 6.625 | % | | | 195,000 | | | | 200,241 | | |
| 06/01/16 | | | 7.500 | % | | | 470,000 | | | | 480,575 | | |
ROC Finance LLC/Corp.
Secured(a)
09/01/18 | | | 12.125 | % | | | 1,920,000 | | | | 2,145,600 | | |
Seminole Indian Tribe of Florida(a)
10/01/20 | | | 7.804 | % | | | 1,660,000 | | | | 1,641,690 | | |
Senior Secured
10/01/20 | | | 6.535 | % | | | 310,000 | | | | 310,719 | | |
Seneca Gaming Corp.(a)
12/01/18 | | | 8.250 | % | | | 845,000 | | | | 856,619 | | |
Tunica-Biloxi Gaming Authority
Senior Unsecured(a)
11/15/15 | | | 9.000 | % | | | 832,000 | | | | 802,880 | | |
| Total | | | | | | | 12,218,598 | | |
Corporate Bonds & Notes (continued)
Issuer | | Coupon
Rate | | Principal
Amount ($) | |
Value ($) | |
| Gas Pipelines 3.4% | |
El Paso LLC
Senior Unsecured
06/15/14 | | | 6.875 | % | | | 171,000 | | | | 182,838 | | |
| 09/15/20 | | | 6.500 | % | | | 2,899,000 | | | | 3,174,405 | | |
| 01/15/32 | | | 7.750 | % | | | 2,520,000 | | | | 2,876,179 | | |
MarkWest Energy Partners LP/Finance Corp.
06/15/22 | | | 6.250 | % | | | 1,150,000 | | | | 1,178,750 | | |
Regency Energy Partners LP/Finance Corp.
06/01/16 | | | 9.375 | % | | | 311,000 | | | | 340,545 | | |
| 12/01/18 | | | 6.875 | % | | | 525,000 | | | | 551,250 | | |
| 07/15/21 | | | 6.500 | % | | | 1,889,000 | | | | 1,945,670 | | |
Southern Star Central Corp.
Senior Unsecured
03/01/16 | | | 6.750 | % | | | 1,070,000 | | | | 1,086,050 | | |
| Total | | | | | | | 11,335,687 | | |
| Health Care 7.1% | |
American Renal Associates Holdings, Inc.
Senior Unsecured PIK
03/01/16 | | | 9.750 | % | | | 232,435 | | | | 241,732 | | |
American Renal Holdings, Inc.
Senior Secured
05/15/18 | | | 8.375 | % | | | 409,000 | | | | 429,450 | | |
CHS/Community Health Systems, Inc.(b)
11/15/19 | | | 8.000 | % | | | 910,000 | | | | 929,337 | | |
ConvaTec Healthcare E SA
Senior Unsecured(a)
12/15/18 | | | 10.500 | % | | | 1,494,000 | | | | 1,471,590 | | |
Emdeon, Inc.(a)
12/31/19 | | | 11.000 | % | | | 880,000 | | | | 976,800 | | |
Fresenius Medical Care U.S. Finance II, Inc.(a)
07/31/19 | | | 5.625 | % | | | 281,000 | | | | 278,893 | | |
| 01/31/22 | | | 5.875 | % | | | 662,000 | | | | 658,690 | | |
Fresenius Medical Care U.S. Finance, Inc.(a)
09/15/18 | | | 6.500 | % | | | 222,000 | | | | 231,435 | | |
HCA, Inc.
02/15/22 | | | 7.500 | % | | | 1,544,000 | | | | 1,618,305 | | |
Senior Secured
02/15/20 | | | 6.500 | % | | | 1,581,000 | | | | 1,669,931 | | |
| 09/15/20 | | | 7.250 | % | | | 3,627,000 | | | | 3,953,430 | | |
Health Management Associates, Inc.
Senior Unsecured(a)
01/15/20 | | | 7.375 | % | | | 615,000 | | | | 630,375 | | |
IASIS Healthcare LLC/Capital Corp.
05/15/19 | | | 8.375 | % | | | 690,000 | | | | 648,600 | | |
Kinetic Concepts, Inc./KCI U.S.A., Inc.(a)
11/01/18 | | | 10.500 | % | | | 853,000 | | | | 861,530 | | |
| 11/01/19 | | | 12.500 | % | | | 667,000 | | | | 595,298 | | |
The accompanying Notes to Financial Statements are an integral part of this statement.
Annual Report 2012
9
Columbia High Yield Opportunity Fund
Portfolio of Investments (continued)
May 31, 2012
Corporate Bonds & Notes (continued)
Issuer | | Coupon
Rate | | Principal
Amount ($) | |
Value ($) | |
LifePoint Hospitals, Inc.
10/01/20 | | | 6.625 | % | | | 401,000 | | | | 420,048 | | |
Multiplan, Inc.(a)
09/01/18 | | | 9.875 | % | | | 1,593,000 | | | | 1,688,580 | | |
PSS World Medical, Inc.(a)
03/01/22 | | | 6.375 | % | | | 141,000 | | | | 142,410 | | |
Physio-Control International, Inc.
Senior Secured(a)
01/15/19 | | | 9.875 | % | | | 730,000 | | | | 773,800 | | |
Radnet Management, Inc.
04/01/18 | | | 10.375 | % | | | 340,000 | | | | 336,600 | | |
Rural/Metro Corp.
Senior Unsecured(a)
07/15/19 | | | 10.125 | % | | | 623,000 | | | | 591,850 | | |
STHI Holding Corp.
Secured(a)
03/15/18 | | | 8.000 | % | | | 325,000 | | | | 341,250 | | |
United Surgical Partners International, Inc.
Senior Unsecured(a)
04/01/20 | | | 9.000 | % | | | 564,000 | | | | 585,150 | | |
Vanguard Health Holding Co. II LLC/Inc.
02/01/18 | | | 8.000 | % | | | 1,940,000 | | | | 1,901,200 | | |
Vanguard Health Holding Co. II LLC/Inc.(a)
02/01/19 | | | 7.750 | % | | | 142,000 | | | | 137,740 | | |
Vanguard Health Holding Co. II LLC/Inc.(b)
02/01/19 | | | 7.750 | % | | | 1,090,000 | | | | 1,068,200 | | |
Wolverine Healthcare Analytics
Senior Unsecured(a)(g)
06/01/20 | | | 10.625 | % | | | 474,000 | | | | 476,370 | | |
| Total | | | | | | | 23,658,594 | | |
| Healthcare Insurance 0.1% | |
AMERIGROUP Corp.
Senior Unsecured
11/15/19 | | | 7.500 | % | | | 443,000 | | | | 474,010 | | |
| Home Construction 0.7% | |
KB Home(b)
03/15/20 | | | 8.000 | % | | | 362,000 | | | | 350,235 | | |
Meritage Homes Corp.(a)
04/01/22 | | | 7.000 | % | | | 383,000 | | | | 388,745 | | |
Shea Homes LP/Funding Corp.
Senior Secured
05/15/19 | | | 8.625 | % | | | 552,000 | | | | 575,460 | | |
Taylor Morrison Communities, Inc./Monarch(a)
04/15/20 | | | 7.750 | % | | | 812,000 | | | | 836,360 | | |
| Total | | | | | | | 2,150,800 | | |
Corporate Bonds & Notes (continued)
Issuer | | Coupon
Rate | | Principal
Amount ($) | |
Value ($) | |
| Independent Energy 10.4% | |
Antero Resources Finance Corp.
12/01/17 | | | 9.375 | % | | | 53,000 | | | | 57,240 | | |
Antero Resources Finance Corp.(a)
08/01/19 | | | 7.250 | % | | | 208,000 | | | | 210,600 | | |
Berry Petroleum Co.
Senior Unsecured
11/01/20 | | | 6.750 | % | | | 305,000 | | | | 315,675 | | |
Carrizo Oil & Gas, Inc.
10/15/18 | | | 8.625 | % | | | 1,526,000 | | | | 1,594,670 | | |
Chaparral Energy, Inc.
10/01/20 | | | 9.875 | % | | | 367,000 | | | | 408,288 | | |
| 09/01/21 | | | 8.250 | % | | | 987,000 | | | | 1,046,220 | | |
Chaparral Energy, Inc.(a)
11/15/22 | | | 7.625 | % | | | 875,000 | | | | 894,687 | | |
Chesapeake Energy Corp.(b)
08/15/20 | | | 6.625 | % | | | 3,035,000 | | | | 2,883,250 | | |
| 02/15/21 | | | 6.125 | % | | | 1,424,000 | | | | 1,338,560 | | |
Cimarex Energy Co.
05/01/22 | | | 5.875 | % | | | 1,159,000 | | | | 1,187,975 | | |
Comstock Resources, Inc.(g)
06/15/20 | | | 9.500 | % | | | 1,473,000 | | | | 1,403,828 | | |
Concho Resources, Inc.
10/01/17 | | | 8.625 | % | | | 537,000 | | | | 585,330 | | |
| 01/15/21 | | | 7.000 | % | | | 1,003,000 | | | | 1,075,717 | | |
| 01/15/22 | | | 6.500 | % | | | 156,000 | | | | 163,020 | | |
Continental Resources, Inc.
10/01/19 | | | 8.250 | % | | | 111,000 | | | | 123,210 | | |
| 10/01/20 | | | 7.375 | % | | | 4,000 | | | | 4,400 | | |
| 04/01/21 | | | 7.125 | % | | | 860,000 | | | | 946,000 | | |
Continental Resources, Inc.(a)
09/15/22 | | | 5.000 | % | | | 2,175,000 | | | | 2,153,250 | | |
Everest Acquisition LLC/Finance, Inc.(a)
Senior Secured
05/01/19 | | | 6.875 | % | | | 878,000 | | | | 899,950 | | |
Everest Acquisition LLC/Finance, Inc.(a)(b)
Senior Unsecured
05/01/20 | | | 9.375 | % | | | 1,258,000 | | | | 1,289,450 | | |
Goodrich Petroleum Corp.
03/15/19 | | | 8.875 | % | | | 531,000 | | | | 504,450 | | |
Kodiak Oil & Gas Corp.(a)
12/01/19 | | | 8.125 | % | | | 2,760,000 | | | | 2,842,800 | | |
Laredo Petroleum, Inc.
02/15/19 | | | 9.500 | % | | | 2,316,000 | | | | 2,570,760 | | |
Laredo Petroleum, Inc.(a)
05/01/22 | | | 7.375 | % | | | 332,000 | | | | 335,320 | | |
MEG Energy Corp.(a)
03/15/21 | | | 6.500 | % | | | 1,445,000 | | | | 1,473,900 | | |
The accompanying Notes to Financial Statements are an integral part of this statement.
Annual Report 2012
10
Columbia High Yield Opportunity Fund
Portfolio of Investments (continued)
May 31, 2012
Corporate Bonds & Notes (continued)
Issuer | | Coupon
Rate | | Principal
Amount ($) | |
Value ($) | |
Oasis Petroleum, Inc.
02/01/19 | | | 7.250 | % | | | 1,344,000 | | | | 1,384,320 | | |
| 11/01/21 | | | 6.500 | % | | | 1,247,000 | | | | 1,247,000 | | |
QEP Resources, Inc.
Senior Unsecured
03/01/21 | | | 6.875 | % | | | 1,105,000 | | | | 1,196,162 | | |
| 10/01/22 | | | 5.375 | % | | | 1,014,000 | | | | 993,720 | | |
Range Resources Corp.
05/01/18 | | | 7.250 | % | | | 13,000 | | | | 13,683 | | |
| 05/15/19 | | | 8.000 | % | | | 480,000 | | | | 523,200 | | |
| 08/01/20 | | | 6.750 | % | | | 945,000 | | | | 1,018,237 | | |
| 06/01/21 | | | 5.750 | % | | | 712,000 | | | | 733,360 | | |
| 08/15/22 | | | 5.000 | % | | | 92,000 | | | | 88,320 | | |
SM Energy Co.
Senior Unsecured
11/15/21 | | | 6.500 | % | | | 453,000 | | | | 463,193 | | |
WPX Energy, Inc.
Senior Unsecured(a)
01/15/22 | | | 6.000 | % | | | 281,000 | | | | 270,463 | | |
Whiting Petroleum Corp.
10/01/18 | | | 6.500 | % | | | 54,000 | | | | 56,430 | | |
| Total | | | | | | | 34,296,638 | | |
| Media Cable 3.1% | |
CCO Holdings LLC/Capital Corp.
01/15/19 | | | 7.000 | % | | | 2,110,000 | | | | 2,220,775 | | |
| 04/30/20 | | | 8.125 | % | | | 1,289,000 | | | | 1,421,123 | | |
CSC Holdings LLC
Senior Unsecured(a)
11/15/21 | | | 6.750 | % | | | 1,447,000 | | | | 1,465,087 | | |
Cablevision Systems Corp.
Senior Unsecured(b)
04/15/20 | | | 8.000 | % | | | 375,000 | | | | 390,938 | | |
DISH DBS Corp.
09/01/19 | | | 7.875 | % | | | 734,000 | | | | 816,575 | | |
| 06/01/21 | | | 6.750 | % | | | 2,343,000 | | | | 2,419,147 | | |
DISH DBS Corp.(a)
07/15/22 | | | 5.875 | % | | | 345,000 | | | | 334,650 | | |
UPCB Finance VI Ltd.
Senior Secured(a)
01/15/22 | | | 6.875 | % | | | 329,000 | | | | 324,164 | | |
Videotron Ltee(a)
07/15/22 | | | 5.000 | % | | | 782,000 | | | | 762,450 | | |
| Total | | | | | | | 10,154,909 | | |
| Media Non-Cable 6.7% | |
AMC Networks, Inc.(a)
07/15/21 | | | 7.750 | % | | | 3,184,000 | | | | 3,534,240 | | |
Clear Channel Worldwide Holdings, Inc.
12/15/17 | | | 9.250 | % | | | 1,021,000 | | | | 1,097,575 | | |
Corporate Bonds & Notes (continued)
Issuer | | Coupon
Rate | | Principal
Amount ($) | |
Value ($) | |
Clear Channel Worldwide Holdings, Inc.(a)
03/15/20 | | | 7.625 | % | | | 298,000 | | | | 280,120 | | |
| 03/15/20 | | | 7.625 | % | | | 2,261,000 | | | | 2,159,255 | | |
Hughes Satellite Systems Corp.
06/15/21 | | | 7.625 | % | | | 1,925,000 | | | | 1,992,375 | | |
Intelsat Jackson Holdings SA
04/01/21 | | | 7.500 | % | | | 1,150,000 | | | | 1,150,000 | | |
Intelsat Luxembourg SA
PIK
02/04/17 | | | 11.500 | % | | | 1,012,000 | | | | 994,290 | | |
Intelsat Luxembourg SA(a)
PIK
02/04/17 | | | 11.500 | % | | | 712,000 | | | | 692,420 | | |
Lamar Media Corp.(a)
02/01/22 | | | 5.875 | % | | | 2,219,000 | | | | 2,232,869 | | |
National CineMedia LLC
Senior Unsecured
07/15/21 | | | 7.875 | % | | | 636,000 | | | | 664,620 | | |
National CineMedia LLC(a)
Senior Secured
04/15/22 | | | 6.000 | % | | | 793,000 | | | | 791,018 | | |
Nielsen Finance LLC/Co.
10/15/18 | | | 7.750 | % | | | 1,471,000 | | | | 1,581,325 | | |
Salem Communications Corp.
Secured
12/15/16 | | | 9.625 | % | | | 1,241,000 | | | | 1,358,895 | | |
Univision Communications, Inc.(a)
05/15/21 | | | 8.500 | % | | | 1,005,000 | | | | 967,312 | | |
Senior Secured
05/15/19 | | | 6.875 | % | | | 760,000 | | | | 741,000 | | |
| 11/01/20 | | | 7.875 | % | | | 1,923,000 | | | | 1,966,267 | | |
| Total | | | | | | | 22,203,581 | | |
| Metals 4.5% | |
Alpha Natural Resources, Inc.(b)
06/01/19 | | | 6.000 | % | | | 563,000 | | | | 505,293 | | |
| 06/01/21 | | | 6.250 | % | | | 514,000 | | | | 461,315 | | |
Arch Coal, Inc.(a)(b)
06/15/19 | | | 7.000 | % | | | 899,000 | | | | 770,893 | | |
| 06/15/21 | | | 7.250 | % | | | 127,000 | | | | 108,585 | | |
CONSOL Energy, Inc.
04/01/17 | | | 8.000 | % | | | 880,000 | | | | 882,200 | | |
| 04/01/20 | | | 8.250 | % | | | 695,000 | | | | 695,000 | | |
Calcipar SA
Senior Secured(a)
05/01/18 | | | 6.875 | % | | | 1,370,000 | | | | 1,373,425 | | |
FMG Resources August 2006 Proprietary Ltd.(a)
02/01/18 | | | 6.875 | % | | | 451,000 | | | | 443,108 | | |
| 11/01/19 | | | 8.250 | % | | | 1,321,000 | | | | 1,380,445 | | |
The accompanying Notes to Financial Statements are an integral part of this statement.
Annual Report 2012
11
Columbia High Yield Opportunity Fund
Portfolio of Investments (continued)
May 31, 2012
Corporate Bonds & Notes (continued)
Issuer | | Coupon
Rate | | Principal
Amount ($) | |
Value ($) | |
FMG Resources August 2006 Proprietary Ltd.(a)(b)
02/01/16 | | | 6.375 | % | | | 622,000 | | | | 608,005 | | |
Senior Unsecured
04/01/22 | | | 6.875 | % | | | 1,375,000 | | | | 1,323,437 | | |
Inmet Mining Corp.
Senior Notes(a)
06/01/20 | | | 8.750 | % | | | 2,014,000 | | | | 1,963,650 | | |
JMC Steel Group
Senior Notes(a)
03/15/18 | | | 8.250 | % | | | 1,496,000 | | | | 1,510,960 | | |
Peabody Energy Corp.(a)
11/15/18 | | | 6.000 | % | | | 951,000 | | | | 948,622 | | |
Peabody Energy Corp.(a)(b)
11/15/21 | | | 6.250 | % | | | 762,000 | | | | 760,095 | | |
Rain CII Carbon LLC/Corp.
Senior Secured(a)
12/01/18 | | | 8.000 | % | | | 1,071,000 | | | | 1,121,872 | | |
| Total | | | | | | | 14,856,905 | | |
| Non-Captive Consumer 1.3% | |
SLM Corp.
Senior Notes
01/25/16 | | | 6.250 | % | | | 820,000 | | | | 830,250 | | |
Senior Unsecured
03/25/20 | | | 8.000 | % | | | 1,321,000 | | | | 1,352,074 | | |
| 01/25/22 | | | 7.250 | % | | | 853,000 | | | | 834,903 | | |
Springleaf Finance Corp.
Senior Unsecured
12/15/17 | | | 6.900 | % | | | 1,531,000 | | | | 1,201,835 | | |
| Total | | | | | | | 4,219,062 | | |
| Non-Captive Diversified 5.8% | |
Ally Financial, Inc.
02/15/17 | | | 5.500 | % | | | 321,000 | | | | 321,289 | | |
| 03/15/20 | | | 8.000 | % | | | 5,550,000 | | | | 6,257,625 | | |
| 09/15/20 | | | 7.500 | % | | | 1,246,000 | | | | 1,367,485 | | |
CIT Group, Inc.
Senior Unsecured
03/15/18 | | | 5.250 | % | | | 1,083,000 | | | | 1,066,755 | | |
| 05/15/20 | | | 5.375 | % | | | 733,000 | | | | 703,680 | | |
CIT Group, Inc.(a)
Senior Unsecured
02/15/15 | | | 4.750 | % | | | 798,000 | | | | 794,010 | | |
| 02/15/19 | | | 5.500 | % | | | 2,971,000 | | | | 2,896,725 | | |
CIT Group, Inc.(a)(b)
Senior Secured
04/01/18 | | | 6.625 | % | | | 1,135,000 | | | | 1,177,563 | | |
International Lease Finance Corp.
Senior Unsecured
09/01/17 | | | 8.875 | % | | | 1,670,000 | | | | 1,870,400 | | |
| 04/01/19 | | | 5.875 | % | | | 297,000 | | | | 291,737 | | |
| 05/15/19 | | | 6.250 | % | | | 810,000 | | | | 810,000 | | |
Corporate Bonds & Notes (continued)
Issuer | | Coupon
Rate | | Principal
Amount ($) | |
Value ($) | |
International Lease Finance Corp.(b)
Senior Unsecured
12/15/20 | | | 8.250 | % | | | 785,000 | | | | 875,275 | | |
| 01/15/22 | | | 8.625 | % | | | 719,000 | | | | 819,660 | | |
| Total | | | | | | | 19,252,204 | | |
| Oil Field Services 2.3% | |
Atwood Oceanics, Inc.
Senior Unsecured
02/01/20 | | | 6.500 | % | | | 2,621,000 | | | | 2,712,735 | | |
Green Field Energy Services, Inc.
Senior Secured(a)
11/15/16 | | | 13.000 | % | | | 1,358,000 | | | | 1,330,840 | | |
Offshore Group Investments Ltd.
Senior Secured
08/01/15 | | | 11.500 | % | | | 2,323,000 | | | | 2,473,995 | | |
Offshore Group Investments Ltd.(a)
Senior Secured
08/01/15 | | | 11.500 | % | | | 941,000 | | | | 1,002,165 | | |
| Total | | | | | | | 7,519,735 | | |
| Other Industry 0.1% | |
Interline Brands, Inc.
11/15/18 | | | 7.000 | % | | | 448,000 | | | | 461,440 | | |
| Packaging 2.2% | |
Ardagh Packaging Finance PLC/MP Holdings U.S.A., Inc.
Senior Unsecured(a)
10/15/20 | | | 9.125 | % | | | 567,000 | | | | 584,010 | | |
Ardagh Packaging Finance PLC(a)
Senior Secured
10/15/17 | | | 7.375 | % | | | 613,000 | | | | 652,845 | | |
Ardagh Packaging Finance PLC(a)(b)
10/15/20 | | | 9.125 | % | | | 750,000 | | | | 780,000 | | |
Berry Plastics Corp.
Secured
01/15/21 | | | 9.750 | % | | | 532,000 | | | | 553,280 | | |
Reynolds Group Issuer, Inc./LLC(a)
Senior Secured
04/15/19 | | | 7.125 | % | | | 1,083,000 | | | | 1,112,783 | | |
| 08/15/19 | | | 7.875 | % | | | 976,000 | | | | 1,032,120 | | |
Senior Unsecured
08/15/19 | | | 9.875 | % | | | 1,315,000 | | | | 1,311,712 | | |
| 08/15/19 | | | 9.875 | % | | | 1,353,000 | | | | 1,349,617 | | |
| Total | | | | | | | 7,376,367 | | |
| Paper 0.3% | |
Cascades, Inc.
12/15/17 | | | 7.750 | % | | | 870,000 | | | | 865,650 | | |
The accompanying Notes to Financial Statements are an integral part of this statement.
Annual Report 2012
12
Columbia High Yield Opportunity Fund
Portfolio of Investments (continued)
May 31, 2012
Corporate Bonds & Notes (continued)
Issuer | | Coupon
Rate | | Principal
Amount ($) | |
Value ($) | |
| Pharmaceuticals 1.1% | |
Endo Health Solutions, Inc.
01/15/22 | | | 7.250 | % | | | 424,000 | | | | 443,080 | | |
Grifols, Inc.
02/01/18 | | | 8.250 | % | | | 971,000 | | | | 1,032,901 | | |
Mylan, Inc.(a)
11/15/18 | | | 6.000 | % | | | 1,134,000 | | | | 1,170,855 | | |
Pharmaceutical Product Development, Inc.
Senior Unsecured(a)
12/01/19 | | | 9.500 | % | | | 318,000 | | | | 338,670 | | |
Warner Chilcott Co. LLC/Finance
09/15/18 | | | 7.750 | % | | | 535,000 | | | | 564,425 | | |
| Total | | | | | | | 3,549,931 | | |
| Retailers 3.5% | |
99 Cents Only Stores(a)
12/15/19 | | | 11.000 | % | | | 446,000 | | | | 476,105 | | |
AutoNation, Inc.
02/01/20 | | | 5.500 | % | | | 64,000 | | | | 64,480 | | |
Burlington Coat Factory Warehouse Corp.(b)
02/15/19 | | | 10.000 | % | | | 1,571,000 | | | | 1,622,057 | | |
Jo-Ann Stores, Inc.
Senior Unsecured(a)
03/15/19 | | | 8.125 | % | | | 1,067,000 | | | | 1,042,992 | | |
Limited Brands, Inc.
04/01/21 | | | 6.625 | % | | | 605,000 | | | | 648,863 | | |
| 02/15/22 | | | 5.625 | % | | | 2,030,000 | | | | 2,045,225 | | |
Rite Aid Corp.
Senior Unsecured
02/15/27 | | | 7.700 | % | | | 1,453,000 | | | | 1,184,195 | | |
Rite Aid Corp.(a)
03/15/20 | | | 9.250 | % | | | 575,000 | | | | 550,563 | | |
Rite Aid Corp.(a)(b)
03/15/20 | | | 9.250 | % | | | 1,095,000 | | | | 1,051,200 | | |
Rite Aid Corp.(b)
06/15/17 | | | 9.500 | % | | | 825,000 | | | | 792,000 | | |
Senior Secured
08/15/20 | | | 8.000 | % | | | 1,400,000 | | | | 1,531,250 | | |
Sally Holdings LLC/Capital, Inc.
06/01/22 | | | 5.750 | % | | | 296,000 | | | | 299,330 | | |
Sally Holdings LLC/Capital, Inc.(a)(b)
11/15/19 | | | 6.875 | % | | | 310,000 | | | | 329,375 | | |
| Total | | | | | | | 11,637,635 | | |
| Technology 4.2% | |
Alliance Data Systems Corp.(a)(b)
04/01/20 | | | 6.375 | % | | | 442,000 | | | | 439,790 | | |
Corporate Bonds & Notes (continued)
Issuer | | Coupon
Rate | | Principal
Amount ($) | |
Value ($) | |
Amkor Technology, Inc.
Senior Unsecured(b)
06/01/21 | | | 6.625 | % | | | 1,363,000 | | | | 1,281,220 | | |
Anixter, Inc.
05/01/19 | | | 5.625 | % | | | 245,000 | | | | 249,288 | | |
Brocade Communications Systems, Inc.
Senior Secured
01/15/20 | | | 6.875 | % | | | 510,000 | | | | 555,900 | | |
CDW LLC/Finance Corp.
04/01/19 | | | 8.500 | % | | | 1,535,000 | | | | 1,577,212 | | |
Senior Secured
12/15/18 | | | 8.000 | % | | | 325,000 | | | | 344,500 | | |
CDW LLC/Finance Corp.(a)
04/01/19 | | | 8.500 | % | | | 240,000 | | | | 246,300 | | |
Cardtronics, Inc.
09/01/18 | | | 8.250 | % | | | 970,000 | | | | 1,069,425 | | |
CommScope, Inc.(a)
01/15/19 | | | 8.250 | % | | | 176,000 | | | | 181,060 | | |
Equinix, Inc.
Senior Unsecured
07/15/21 | | | 7.000 | % | | | 385,000 | | | | 411,950 | | |
First Data Corp.
01/15/21 | | | 12.625 | % | | | 1,602,000 | | | | 1,509,885 | | |
First Data Corp.(a)
Senior Secured
06/15/19 | | | 7.375 | % | | | 1,562,000 | | | | 1,562,000 | | |
| 08/15/20 | | | 8.875 | % | | | 555,000 | | | | 592,463 | | |
Interactive Data Corp.
08/01/18 | | | 10.250 | % | | | 1,505,000 | | | | 1,666,787 | | |
NXP BV/Funding LLC
Senior Secured(a)
08/01/18 | | | 9.750 | % | | | 2,016,000 | | | | 2,288,160 | | |
| Total | | | | | | | 13,975,940 | | |
| Transportation Services 0.6% | |
Avis Budget Car Rental LLC/Finance, Inc.
01/15/19 | | | 8.250 | % | | | 657,000 | | | | 679,995 | | |
| 03/15/20 | | | 9.750 | % | | | 477,000 | | | | 522,315 | | |
Hertz Corp. (The)
01/15/21 | | | 7.375 | % | | | 808,000 | | | | 847,390 | | |
| Total | | | | | | | 2,049,700 | | |
| Wireless 4.4% | |
Cricket Communications, Inc.
10/15/20 | | | 7.750 | % | | | 573,000 | | | | 524,295 | | |
Senior Secured
05/15/16 | | | 7.750 | % | | | 1,901,000 | | | | 2,005,555 | | |
MetroPCS Wireless, Inc.
11/15/20 | | | 6.625 | % | | | 224,000 | | | | 216,720 | | |
The accompanying Notes to Financial Statements are an integral part of this statement.
Annual Report 2012
13
Columbia High Yield Opportunity Fund
Portfolio of Investments (continued)
May 31, 2012
Corporate Bonds & Notes (continued)
Issuer | | Coupon
Rate | | Principal
Amount ($) | |
Value ($) | |
MetroPCS Wireless, Inc.(b)
09/01/18 | | | 7.875 | % | | | 740,000 | | | | 751,100 | | |
NII Capital Corp.
04/01/21 | | | 7.625 | % | | | 941,000 | | | | 792,793 | | |
Sprint Capital Corp.
11/15/28 | | | 6.875 | % | | | 4,607,000 | | | | 3,420,697 | | |
Sprint Nextel Corp.(a)
11/15/18 | | | 9.000 | % | | | 2,890,000 | | | | 3,121,200 | | |
| 03/01/20 | | | 7.000 | % | | | 438,000 | | | | 441,285 | | |
Senior Unsecured
03/01/17 | | | 9.125 | % | | | 344,000 | | | | 341,420 | | |
Wind Acquisition Finance SA
Senior Secured(a)
02/15/18 | | | 7.250 | % | | | 3,549,000 | | | | 3,052,140 | | |
| Total | | | | | | | 14,667,205 | | |
| Wirelines 4.9% | |
CenturyLink, Inc.
Senior Unsecured
06/15/21 | | | 6.450 | % | | | 2,063,000 | | | | 2,137,111 | | |
| 03/15/22 | | | 5.800 | % | | | 3,404,000 | | | | 3,358,744 | | |
Frontier Communications Corp.(b)
Senior Unsecured
04/15/20 | | | 8.500 | % | | | 1,291,000 | | | | 1,294,227 | | |
| 07/01/21 | | | 9.250 | % | | | 571,000 | | | | 590,985 | | |
| 04/15/22 | | | 8.750 | % | | | 330,000 | | | | 332,475 | | |
Integra Telecom Holdings, Inc.
Senior Secured(a)
04/15/16 | | | 10.750 | % | | | 401,000 | | | | 384,960 | | |
Level 3 Communications, Inc.
Senior Unsecured(b)
02/01/19 | | | 11.875 | % | | | 982,000 | | | | 1,053,195 | | |
Level 3 Financing, Inc.
02/15/17 | | | 8.750 | % | | | 389,000 | | | | 401,643 | | |
| 02/01/18 | | | 10.000 | % | | | 807,000 | | | | 869,543 | | |
| 04/01/19 | | | 9.375 | % | | | 416,000 | | | | 442,000 | | |
| 07/01/19 | | | 8.125 | % | | | 974,000 | | | | 974,000 | | |
Level 3 Financing, Inc.(a)
07/15/20 | | | 8.625 | % | | | 750,000 | | | | 765,000 | | |
PAETEC Holding Corp.
12/01/18 | | | 9.875 | % | | | 955,000 | | | | 1,048,112 | | |
Senior Secured
06/30/17 | | | 8.875 | % | | | 785,000 | | | | 843,875 | | |
Qwest Corp.
Senior Unsecured
12/01/21 | | | 6.750 | % | | | 982,000 | | | | 1,096,421 | | |
Windstream Corp.
09/01/18 | | | 8.125 | % | | | 630,000 | | | | 653,625 | | |
| Total | | | | | | | 16,245,916 | | |
Total Corporate Bonds & Notes
(Cost: $301,183,820) | | | | | | | 305,839,198 | | |
Municipal Bonds 0.6%
Issuer | | Coupon
Rate | | Principal
Amount ($) | |
Value ($) | |
Cabazon Band Mission Indians
Revenue Bonds
Series 2004(a)(e)(h)(i)
06/01/12 | | | 13.000 | % | | | 3,250,000 | | | | 1,950,000 | | |
Total Municipal Bonds
(Cost: $3,250,000) | | | | | | | 1,950,000 | | |
Senior Loans 2.8%
Borrower | | Weighted
Average Coupon | | Principal
Amount ($) | |
Value ($) | |
| Automotive 0.1% | |
Schaeffler AG
Tranche C2 Term Loan(c)(j)
01/27/17 | | | 6.000 | % | | | 360,000 | | | | 358,200 | | |
| Brokerage 0.2% | |
Nuveen Investments, Inc.
2nd Lien Term Loan(c)(j)
02/28/19 | | | 8.250 | % | | | 711,000 | | | | 715,223 | | |
| Gaming 1.0% | |
Caesars Octavius LLC
Tranche B Term Loan(c)(j)
04/25/17 | | | 9.250 | % | | | 2,827,000 | | | | 2,812,865 | | |
ROC Finance LLC
Tranche B Term Loan(c)(j)
08/19/17 | | | 8.500 | % | | | 392,000 | | | | 394,450 | | |
| Total | | | | | | | 3,207,315 | | |
| Media Non-Cable 1.0% | |
Cumulus Media Holdings, Inc.
2nd Lien Term Loan(c)(j)
03/18/19 | | | 7.500 | % | | | 3,283,000 | | | | 3,287,925 | | |
| Property & Casualty 0.5% | |
Lonestar Intermediate Super Holdings LLC
Term Loan(c)(j)
09/02/19 | | | 11.000 | % | | | 1,732,000 | | | | 1,759,071 | | |
Total Senior Loans
(Cost: $9,146,227) | | | | | | | 9,327,734 | | |
The accompanying Notes to Financial Statements are an integral part of this statement.
Annual Report 2012
14
Columbia High Yield Opportunity Fund
Portfolio of Investments (continued)
May 31, 2012
Common Stocks —%
| Issuer | | Shares | | Value ($) | |
| Financials —% | |
| Diversified Financial Services —% | |
| Leucadia National Corp. | | | 2,168 | | | | 44,054 | | |
| Real Estate Investment Trusts (REITs) —% | |
| Fairlane Management Corp.(d)(f)(k) | | | 50,004 | | | | — | | |
| Total Financials | | | | | 44,054 | | |
Total Common Stocks
(Cost: $—) | | | | | 44,054 | | |
Warrants —%
| Energy —% | |
| Energy Equipment & Services —% | |
| Green Field Energy Services, Inc.(k) | | | 1,358 | | | | 82,837 | | |
| Information Technology —% | |
| Communications Equipment —% | |
| CMP Susquehanna Corp.(a)(e)(f)(k) | | | 29,954 | | | | 300 | | |
| Total Information Technology | | | | | 300 | | |
Total Warrants
(Cost: $55,212) | | | | | 83,137 | | |
Money Market Funds 2.0%
| | | Shares | | Value ($) | |
Columbia Short-Term Cash
Fund, 0.161%(l)(m) | | | 6,654,252 | | | | 6,654,252 | | |
Total Money Market Funds
(Cost: $6,654,252) | | | | | 6,654,252 | | |
Investments of Cash Collateral Received for Securities on Loan 7.5%
Issuer | |
Effective
Yield | | Par ($)/
Principal ($)/
Shares | |
Value ($) | |
| Money Market Fund 0.2% | |
JP Morgan Prime Money
Market Fund, 0.010%(l) | | | | | | | 517,826 | | | | 517,826 | | |
| Repurchase Agreements 7.3% | |
Barclays Capital, Inc.
dated 05/31/12,
matures 06/01/12,
repurchase price
$2,208,593(n) | | | 0.180 | % | | | 2,208,582 | | | | 2,208,582 | | |
Citibank NA
dated 05/31/12,
matures 06/01/12,
repurchase price
$5,000,029(n) | | | 0.210 | % | | | 5,000,000 | | | | 5,000,000 | | |
Nomura Securities
dated 05/31/12,
matures 06/01/12,
repurchase price
$15,000,096(n) | | | 0.230 | % | | | 15,000,000 | | | | 15,000,000 | | |
Pershing LLC
dated 05/31/12,
matures 06/01/12,
repurchase price
$2,000,019(n) | | | 0.340 | % | | | 2,000,000 | | | | 2,000,000 | | |
| Total | | | | | | | 24,208,582 | | |
Total Investments of Cash Collateral
Received for Securities on Loan
(Cost: $24,726,408) | | | | | | | 24,726,408 | | |
Total Investments
(Cost: $345,015,919) | | | | | | | 348,624,783 | | |
| Other Assets & Liabilities, Net | | | | | | | (17,441,260 | ) | |
| Net Assets | | | | | | | 331,183,523 | | |
The accompanying Notes to Financial Statements are an integral part of this statement.
Annual Report 2012
15
Columbia High Yield Opportunity Fund
Portfolio of Investments (continued)
May 31, 2012
Notes to Portfolio of Investments
(a) Security exempt from registration pursuant to Rule 144A under the Securities Act of 1933. This security may be resold in transactions exempt from registration, normally to qualified institutional buyers. At May 31, 2012, the value of these securities amounted to $126,872,487 or 38.31% of net assets.
(b) At May 31, 2012, security was partially or fully on loan.
(c) Variable rate security. The interest rate shown reflects the rate as of May 31, 2012.
(d) Negligible market value.
(e) Identifies issues considered to be illiquid as to their marketability. The aggregate value of such securities at May 31, 2012 was $1,950,300, representing 0.59% of net assets. Information concerning such security holdings at May 31, 2012 was as follows:
| Security Description | | Acquisition Dates | | Cost ($) | |
Cabazon Band Mission Indians
Revenue Bonds
Series 2004
13.000% 06/01/12 | | 10/04/04 | | | 3,250,000 | | |
| CMP Susquehanna Corp. | | 03/26/09 | | | 300 | | |
Six Flags, Inc.
9.625% 06/01/14 | | 05/07/10 | | | — | | |
(f) Represents fair value as determined in good faith under procedures approved by the Board of Trustees. At May 31, 2012, the value of these securities amounted to $300, which represents less than 0.01% of net assets.
(g) Represents a security purchased on a when-issued or delayed delivery basis.
(h) Municipal obligations include debt obligations issued by or on behalf of territories, possessions, or sovereign nations within the territorial boundaries of the United States. At May 31, 2012, the value of these securities amounted to $1,950,000 or 0.59% of net assets.
(i) Represents securities that have defaulted on payment of interest. The Fund has stopped accruing interest on these securities. At May 31, 2012, the value of these securities amounted to $1,950,000, which represents 0.59% of net assets.
(j) Senior loans have rates of interest that float periodically based primarily on the London Interbank Offered Rate ("LIBOR") and other short-term rates. The interest rate shown reflects the weighted average coupon as of May 31, 2012. The interest rate shown for senior loans purchased on a when-issued or delayed delivery basis, if any, reflects an estimated average coupon. Remaining maturities of senior loans may be less than the stated maturities shown as a result of contractual or optional prepayments by the borrower. Such prepayments cannot be predicted with certainty.
(k) Non-income producing.
(l) The rate shown is the seven-day current annualized yield at May 31, 2012.
(m) Investments in affiliates during the year ended May 31, 2012:
| Issuer | | Beginning
Cost ($) | | Purchase
Cost ($) | | Sales Cost/
Proceeds
From Sales ($) | | Realized
Gain/Loss ($) | | Ending
Cost ($) | | Dividends
or Interest
Income ($) | | Value ($) | |
Columbia Short-Term
Cash Fund | | | — | | | | 171,835,160 | | | | (165,180,908 | ) | | | — | | | | 6,654,252 | | | | 12,225 | | | | 6,654,252 | | |
The accompanying Notes to Financial Statements are an integral part of this statement.
Annual Report 2012
16
Columbia High Yield Opportunity Fund
Portfolio of Investments (continued)
May 31, 2012
Notes to Portfolio of Investments (continued)
(n) The table below represents securities received as collateral for repurchase agreements. This collateral is deposited with the Fund's custodian and, pursuant to the terms of the repurchase agreement, must have an aggregate market value greater than or equal to the repurchase price plus accrued interest at all times. The value of securities and/or cash held as collateral for repurchase agreements is monitored on a daily basis to ensure the proper level of collateral.
| Security Description | | Value ($) | |
| Barclays Capital, Inc. (0.180%) | |
| United States Treasury Note/Bond | | | 2,252,754 | | |
| Total market value of collateral securities | | | 2,252,754 | | |
| Security Description | | Value ($) | |
| Citibank NA (0.210%) | |
| Fannie Mae Pool | | | 2,501,403 | | |
| Fannie Mae REMICS | | | 1,181,631 | | |
| Ginnie Mae I Pool | | | 1,416,966 | | |
| Total market value of collateral securities | | | 5,100,000 | | |
| Security Description | | Value ($) | |
| Nomura Securities (0.230%) | |
| Fannie Mae Pool | | | 6,535,791 | | |
| Freddie Mac Gold Pool | | | 3,397,933 | | |
| Ginnie Mae II Pool | | | 5,366,276 | | |
| Total market value of collateral securities | | | 15,300,000 | | |
| Security Description | | Value ($) | |
| Pershing LLC (0.340%) | |
| Fannie Mae REMICS | | | 572,950 | | |
| Fannie Mae-Aces | | | 55,996 | | |
| Freddie Mac Reference REMIC | | | 135,335 | | |
| Freddie Mac REMICS | | | 442,029 | | |
| Government National Mortgage Association | | | 738,685 | | |
| United States Treasury Note/Bond | | | 95,006 | | |
| Total market value of collateral securities | | | 2,040,001 | | |
Abbreviation Legend
PIK Payment-in-Kind
The accompanying Notes to Financial Statements are an integral part of this statement.
Annual Report 2012
17
Columbia High Yield Opportunity Fund
Portfolio of Investments (continued)
May 31, 2012
Fair Value Measurements
Generally accepted accounting principles (GAAP) require disclosure regarding the inputs and valuation techniques used to measure fair value and any changes in valuation inputs or techniques. In addition, investments shall be disclosed by major category.
The Fund categorizes its fair value measurements according to a three-level hierarchy that maximizes the use of observable inputs and minimizes the use of unobservable inputs by prioritizing that the most observable input be used when available. Observable inputs are those that market participants would use in pricing an investment based on market data obtained from sources independent of the reporting entity. Unobservable inputs are those that reflect the Fund's assumptions about the information market participants would use in pricing an investment. An investment's level within the fair value hierarchy is based on the lowest level of any input that is deemed significant to the asset or liability's fair value measurement. The input levels are not necessarily an indication of the risk or liquidity associated with investments at that level. For example, certain U.S. government securities are generally high quality and liquid, however, they are reflected as Level 2 because the inputs used to determine fair value may not always be quoted prices in an active market.
Fair value inputs are summarized in the three broad levels listed below:
> Level 1 — Valuations based on quoted prices for investments in active markets that the Fund has the ability to access at the measurement date (including NAV for open-end mutual funds). Valuation adjustments are not applied to Level 1 investments.
> Level 2 — Valuations based on other significant observable inputs (including quoted prices for similar securities, interest rates, prepayment speeds, credit risks, etc.).
> Level 3 — Valuations based on significant unobservable inputs (including the Fund's own assumptions and judgment in determining the fair value of investments).
Inputs that are used in determining fair value of an investment may include price information, credit data, volatility statistics, and other factors. These inputs can be either observable or unobservable. The availability of observable inputs can vary between investments, and is affected by various factors such as the type of investment, and the volume and level of activity for that investment or similar investments in the marketplace. The inputs will be considered by the Investment Manager, along with any other relevant factors in the calculation of an investment's fair value. The Fund uses prices and inputs that are current as of the measurement date, which may include periods of market dislocations. During these periods, the availability of prices and inputs may be reduced for many investments. This condition could cause an investment to be reclassified between the various levels within the hierarchy.
Investments falling into the Level 3 category are primarily supported by quoted prices from brokers and dealers participating in the market for those investments. However, these may be classified as Level 3 investments due to lack of market transparency and corroboration to support these quoted prices. Additionally, valuation models may be used as the pricing source for any remaining investments classified as Level 3. These models rely on one or more significant unobservable inputs and/or significant assumptions by the Investment Manager. Inputs used in valuations may include, but are not limited to, financial statement analysis, capital account balances, discount rates and estimated cash flows, and comparable company data.
The accompanying Notes to Financial Statements are an integral part of this statement.
Annual Report 2012
18
Columbia High Yield Opportunity Fund
Portfolio of Investments (continued)
May 31, 2012
Fair Value Measurements (continued)
The following table is a summary of the inputs used to value the Fund's investments at May 31, 2012:
| Description | | Level 1
Quoted Prices in Active
Markets for Identical
Assets ($) | | Level 2
Other Significant
Observable Inputs ($) | | Level 3
Significant
Unobservable Inputs ($) | | Total ($) | |
| Bonds | |
| Corporate Bonds & Notes | | | — | | | | 305,839,198 | | | | — | | | | 305,839,198 | | |
| Municipal Bonds | | | — | | | | 1,950,000 | | | | — | | | | 1,950,000 | | |
| Total Bonds | | | — | | | | 307,789,198 | | | | — | | | | 307,789,198 | | |
| Senior Loans | |
| Senior Loans | | | — | | | | 9,327,734 | | | | — | | | | 9,327,734 | | |
| Total Senior Loans | | | — | | | | 9,327,734 | | | | — | | | | 9,327,734 | | |
| Equity Securities | |
| Common Stocks | |
| Financials | | | 44,054 | | | | — | | | | — | | | | 44,054 | | |
| Warrants | |
| Energy | | | — | | | | 82,837 | | | | — | | | | 82,837 | | |
| Information Technology | | | — | | | | — | | | | 300 | | | | 300 | | |
| Total Equity Securities | | | 44,054 | | | | 82,837 | | | | 300 | | | | 127,191 | | |
| Other | |
| Money Market Funds | | | 6,654,252 | | | | — | | | | — | | | | 6,654,252 | | |
Investments of Cash Collateral
Received for Securities on Loan | | | 517,826 | | | | 24,208,582 | | | | — | | | | 24,726,408 | | |
| Total Other | | | 7,172,078 | | | | 24,208,582 | | | | — | | | | 31,380,660 | | |
| Total | | | 7,216,132 | | | | 341,408,351 | | | | 300 | | | | 348,624,783 | | |
See the Portfolio of Investments for all investment classifications not indicated in the table.
The Fund's assets assigned to the Level 2 input category are generally valued using the market approach, in which a security's value is determined through reference to prices and information from market transactions for similar or identical assets.
The Fund's assets assigned to the Level 3 category are valued utilizing the valuation technique deemed the most appropriate in the circumstances. Certain Warrants classified as Level 3 are valued using a market approach. To determine fair value for these securities, management considered various factors which may have included, but were not limited to, trades of similar securities, market multiples derived from a set of comparable companies, and the position of the security within the respective company's capital structure.
There were no transfers of financial assets between Levels 1 and 2 during the period.
The accompanying Notes to Financial Statements are an integral part of this statement.
Annual Report 2012
19
Columbia High Yield Opportunity Fund
Portfolio of Investments (continued)
May 31, 2012
Fair Value Measurements (continued)
The following table is a reconciliation of level 3 assets for which significant unobservable inputs were used to determine fair value.
| | | Corporate
Bonds & Notes ($) | | Senior
Loans ($) | | Preferred
Stocks ($) | | Warrants ($) | | Total ($) | |
| Balance as of May 31, 2011 | | | 103,040 | | | | 4,807 | | | | 262 | | | | 300 | | | | 108,409 | | |
| Accrued discounts/premiums | | | — | | | | 1,682,268 | | | | — | | | | — | | | | 1,682,268 | | |
| Realized gain (loss) | | | — | | | | (1,687,075 | ) | | | 261,868 | | | | — | | | | (1,425,207 | ) | |
Change in unrealized appreciation
(depreciation)(a) | | | — | | | | — | | | | — | | | | — | | | | — | | |
| Sales | | | — | | | | — | | | | (262,130 | ) | | | — | | | | (262,130 | ) | |
| Purchases | | | — | | | | — | | | | — | | | | — | | | | — | | |
| Transfers into Level 3 | | | — | | | | — | | | | — | | | | — | | | | — | | |
| Transfers out of Level 3 | | | (103,040 | ) | | | — | | | | — | | | | — | | | | (103,040 | ) | |
| Balance as of May 31, 2012 | | | — | | | | — | | | | — | | | | 300 | | | | 300 | | |
(a) Change in unrealized appreciation (depreciation) relating to securities held at May 31, 2012 was $0.
Financial assets were transferred from Level 3 to Level 2 as observable market inputs were utilized and management's determination that there was sufficient, reliable and observable market data to value these assets as of period end.
Transfers in and/or out of Level 3 are determined based on the fair value at the beginning of the period for security positions held throughout the period.
The accompanying Notes to Financial Statements are an integral part of this statement.
Annual Report 2012
20
Columbia High Yield Opportunity Fund
Statement of Assets and Liabilities
May 31, 2012
| Assets | |
| Investments, at value* | |
| Unaffiliated issuers (identified cost $313,635,259) | | $ | 317,244,123 | | |
| Affiliated issuers (identified cost $6,654,252) | | | 6,654,252 | | |
| Investment of cash collateral received for securities on loan | |
| Short-term securities (identified cost $517,826) | | | 517,826 | | |
| Repurchase agreements (identified cost $24,208,582) | | | 24,208,582 | | |
| Total investments (identified cost $345,015,919) | | | 348,624,783 | | |
| Cash | | | 1,773 | | |
| Receivable for: | |
| Investments sold | | | 5,638,802 | | |
| Capital shares sold | | | 1,137,970 | | |
| Dividends | | | 872 | | |
| Interest | | | 6,056,300 | | |
| Reclaims | | | 8,817 | | |
| Litigation payments | | | 1,430,507 | | |
| Expense reimbursement due from Investment Manager | | | 871 | | |
| Prepaid expense | | | 730 | | |
| Trustees' deferred compensation plan | | | 71,684 | | |
| Total assets | | | 362,973,109 | | |
| Liabilities | |
| Due upon return of securities on loan | | | 24,726,408 | | |
| Payable for: | |
| Investments purchased | | | 2,325,573 | | |
| Investments purchased on a delayed delivery basis | | | 1,874,723 | | |
| Capital shares purchased | | | 796,797 | | |
| Dividend distributions to shareholders | | | 1,823,898 | | |
| Investment management fees | | | 5,300 | | |
| Distribution and service fees | | | 1,620 | | |
| Transfer agent fees | | | 48,281 | | |
| Administration fees | | | 633 | | |
| Compensation of board members | | | 5,681 | | |
| Chief compliance officer expenses | | | 292 | | |
| Other expenses | | | 108,696 | | |
| Trustees' deferred compensation plan | | | 71,684 | | |
| Total liabilities | | | 31,789,586 | | |
| Net assets applicable to outstanding capital stock | | $ | 331,183,523 | | |
| Represented by | |
| Paid-in capital | | $ | 418,376,158 | | |
| Excess of distributions over net investment income | | | (1,710,715 | ) | |
| Accumulated net realized loss | | | (89,090,784 | ) | |
| Unrealized appreciation (depreciation) on: | |
| Investments | | | 3,608,864 | | |
| Total — representing net assets applicable to outstanding capital stock | | $ | 331,183,523 | | |
| *Value of securities on loan | | $ | 24,228,308 | | |
The accompanying Notes to Financial Statements are an integral part of this statement.
Annual Report 2012
21
Columbia High Yield Opportunity Fund
Statement of Assets and Liabilities (continued)
May 31, 2012
| Class A | |
| Net assets | | $ | 182,776,940 | | |
| Shares outstanding | | | 44,841,107 | | |
| Net asset value per share | | $ | 4.08 | | |
| Maximum offering price per share(a) | | $ | 4.28 | | |
| Class B | |
| Net assets | | $ | 4,273,299 | | |
| Shares outstanding | | | 1,048,963 | | |
| Net asset value per share | | $ | 4.07 | | |
| Class C | |
| Net assets | | $ | 11,166,794 | | |
| Shares outstanding | | | 2,739,605 | | |
| Net asset value per share | | $ | 4.08 | | |
| Class Z | |
| Net assets | | $ | 132,966,490 | | |
| Shares outstanding | | | 32,623,125 | | |
| Net asset value per share | | $ | 4.08 | | |
(a) The maximum offering price per share is calculated by dividing the net asset value by 1.0 minus the maximum sales charge of 4.75%.
The accompanying Notes to Financial Statements are an integral part of this statement.
Annual Report 2012
22
Columbia High Yield Opportunity Fund
Statement of Operations
Year ended May 31, 2012
| Net investment income | |
| Income: | |
| Dividends | | $ | 72,367 | | |
| Interest | | | 23,549,012 | | |
| Dividends from affiliates | | | 12,225 | | |
| Income from securities lending — net | | | 60,792 | | |
| Foreign taxes withheld | | | (16,350 | ) | |
| Total income | | | 23,678,046 | | |
| Expenses: | |
| Investment management fees | | | 1,853,474 | | |
| Distribution fees | |
| Class B | | | 42,771 | | |
| Class C | | | 85,776 | | |
| Service fees | |
| Class A | | | 466,258 | | |
| Class B | | | 14,257 | | |
| Class C | | | 28,632 | | |
| Transfer agent fees | |
| Class A | | | 311,069 | | |
| Class B | | | 9,761 | | |
| Class C | | | 19,030 | | |
| Class Z | | | 185,812 | | |
| Administration fees | | | 202,606 | | |
| Compensation of board members | | | 32,925 | | |
| Pricing and bookkeeping fees | | | 7,332 | | |
| Custodian fees | | | 19,870 | | |
| Printing and postage fees | | | 69,823 | | |
| Registration fees | | | 75,980 | | |
| Professional fees | | | 72,548 | | |
| Chief compliance officer expenses | | | 697 | | |
| Other | | | 16,697 | | |
| Total expenses | | | 3,515,318 | | |
| Fees waived or expenses reimbursed by Investment Manager and its affiliates | | | (160,526 | ) | |
| Fees waived by Distributor — Class C | | | (17,058 | ) | |
| Expense reductions | | | (4,388 | ) | |
| Total net expenses | | | 3,333,346 | | |
| Net investment income | | | 20,344,700 | | |
| Realized and unrealized gain (loss) — net | |
| Net realized gain (loss) on: | |
| Investments | | | 2,902,153 | | |
| Swap contracts | | | 42,361 | | |
| Net realized gain | | | 2,944,514 | | |
| Net change in unrealized appreciation (depreciation) on: | |
| Investments | | | (8,834,459 | ) | |
| Net change in unrealized depreciation | | | (8,834,459 | ) | |
| Net realized and unrealized loss | | | (5,889,945 | ) | |
| Net increase in net assets resulting from operations | | $ | 14,454,755 | | |
The accompanying Notes to Financial Statements are an integral part of this statement.
Annual Report 2012
23
Columbia High Yield Opportunity Fund
Statement of Changes in Net Assets
| | | Year Ended
May 31,
2012 | | Year Ended
May 31,
2011 | |
| Operations | |
| Net investment income | | $ | 20,344,700 | | | $ | 22,717,643 | | |
| Net realized gain | | | 2,944,514 | | | | 10,386,960 | | |
| Net change in unrealized appreciation (depreciation) | | | (8,834,459 | ) | | | 19,054,355 | | |
| Net increase in net assets resulting from operations | | | 14,454,755 | | | | 52,158,958 | | |
| Distributions to shareholders | |
| Net investment income | |
| Class A | | | (12,098,979 | ) | | | (13,614,354 | ) | |
| Class B | | | (328,912 | ) | | | (791,063 | ) | |
| Class C | | | (675,469 | ) | | | (837,050 | ) | |
| Class Z | | | (7,476,311 | ) | | | (7,944,339 | ) | |
| Total distributions to shareholders | | | (20,579,671 | ) | | | (23,186,806 | ) | |
| Increase (decrease) in net assets from share transactions | | | 13,575,200 | | | | (26,520,862 | ) | |
| Proceeds from regulatory settlements (Note 6) | | | — | | | | 17,121 | | |
| Total increase in net assets | | | 7,450,284 | | | | 2,468,411 | | |
| Net assets at beginning of year | | | 323,733,239 | | | | 321,264,828 | | |
| Net assets at end of year | | $ | 331,183,523 | | | $ | 323,733,239 | | |
| Excess of distributions over net investment income | | $ | (1,710,715 | ) | | $ | (1,613,184 | ) | |
The accompanying Notes to Financial Statements are an integral part of this statement.
Annual Report 2012
24
Columbia High Yield Opportunity Fund
Statement of Changes in Net Assets (continued)
| | | Year Ended May 31, 2012 | | Year Ended May 31, 2011 | |
| | | Shares | | Dollars ($) | | Shares | | Dollars ($) | |
| Capital stock activity | |
| Class A shares | |
| Subscriptions(a) | | | 11,543,920 | | | | 46,123,001 | | | | 3,955,095 | | | | 15,833,710 | | |
| Distributions reinvested | | | 2,016,855 | | | | 8,131,198 | | | | 1,895,314 | | | | 7,612,707 | | |
| Redemptions | | | (15,437,170 | ) | | | (61,739,441 | ) | | | (7,770,032 | ) | | | (31,253,032 | ) | |
| Net decrease | | | (1,876,395 | ) | | | (7,485,242 | ) | | | (1,919,623 | ) | | | (7,806,615 | ) | |
| Class B shares | |
| Subscriptions | | | 30,465 | | | | 121,017 | | | | 99,478 | | | | 398,681 | | |
| Distributions reinvested | | | 51,928 | | | | 208,676 | | | | 105,284 | | | | 420,348 | | |
| Redemptions(a) | | | (1,034,427 | ) | | | (4,139,983 | ) | | | (2,466,393 | ) | | | (9,887,582 | ) | |
| Net decrease | | | (952,034 | ) | | | (3,810,290 | ) | | | (2,261,631 | ) | | | (9,068,553 | ) | |
| Class C shares | |
| Subscriptions | | | 408,144 | | | | 1,659,082 | | | | 259,490 | | | | 1,041,748 | | |
| Distributions reinvested | | | 113,344 | | | | 456,487 | | | | 124,951 | | | | 501,709 | | |
| Redemptions | | | (807,178 | ) | | | (3,251,318 | ) | | | (730,026 | ) | | | (2,927,483 | ) | |
| Net decrease | | | (285,690 | ) | | | (1,135,749 | ) | | | (345,585 | ) | | | (1,384,026 | ) | |
| Class Z shares | |
| Subscriptions | | | 20,145,835 | | | | 82,145,423 | | | | 6,939,307 | | | | 27,789,426 | | |
| Distributions reinvested | | | 374,763 | | | | 1,514,859 | | | | 363,491 | | | | 1,462,635 | | |
| Redemptions | | | (14,349,584 | ) | | | (57,653,801 | ) | | | (9,384,416 | ) | | | (37,513,729 | ) | |
| Net increase (decrease) | | | 6,171,014 | | | | 26,006,481 | | | | (2,081,618 | ) | | | (8,261,668 | ) | |
| Total net increase (decrease) | | | 3,056,895 | | | | 13,575,200 | | | | (6,608,457 | ) | | | (26,520,862 | ) | |
(a) Includes conversions of Class B shares to Class A shares, if any.
The accompanying Notes to Financial Statements are an integral part of this statement.
Annual Report 2012
25
Columbia High Yield Opportunity Fund
Financial Highlights
The following tables are intended to help you understand the Fund's financial performance. Certain information reflects financial results for a single share of a class held for the periods shown. Per share net investment income (loss) amounts are calculated based on average shares outstanding during the period. Total returns assume reinvestment of all dividends and distributions. Total returns do not reflect payment of sales charges, if any, and are not annualized for periods of less than one year.
| | | Year Ended May 31, | |
| Class A | | 2012 | | 2011 | | 2010 | | 2009 | | 2008 | |
| Per share data | |
| Net asset value, beginning of period | | $ | 4.14 | | | $ | 3.79 | | | $ | 3.33 | | | $ | 4.17 | | | $ | 4.72 | | |
| Income from investment operations: | |
| Net investment income | | | 0.26 | | | | 0.28 | | | | 0.27 | | | | 0.30 | | | | 0.31 | | |
| Net realized and unrealized gain (loss) | | | (0.06 | ) | | | 0.35 | | | | 0.53 | | | | (0.83 | ) | | | (0.55 | ) | |
| Total from investment operations | | | 0.20 | | | | 0.63 | | | | 0.80 | | | | (0.53 | ) | | | (0.24 | ) | |
| Less distributions to shareholders: | |
| Net investment income | | | (0.26 | ) | | | (0.28 | ) | | | (0.34 | ) | | | (0.32 | ) | | | (0.31 | ) | |
| Total distributions to shareholders | | | (0.26 | ) | | | (0.28 | ) | | | (0.34 | ) | | | (0.32 | ) | | | (0.31 | ) | |
| Proceeds from regulatory settlement | | | — | | | | 0.00 | (a) | | | 0.00 | (a) | | | 0.01 | | | | — | | |
| Net asset value, end of period | | $ | 4.08 | | | $ | 4.14 | | | $ | 3.79 | | | $ | 3.33 | | | $ | 4.17 | | |
| Total return | | | 5.14 | % | | | 17.21 | % | | | 24.50 | % | | | (12.04 | %) | | | (5.03 | %) | |
| Ratios to average net assets(b) | |
Expenses prior to fees waived or expenses reimbursed
(including interest expense) | | | 1.16 | % | | | 1.13 | % | | | 1.12 | %(c) | | | 1.10 | % | | | 1.14 | %(c) | |
Net expenses after fees waived or expenses reimbursed
(including interest expense)(d) | | | 1.11 | %(e) | | | 1.05 | %(e) | | | 1.08 | %(c)(e) | | | 1.10 | %(e) | | | 1.13 | %(c)(e) | |
Expenses prior to fees waived or expenses reimbursed
(excluding interest expense) | | | 1.16 | % | | | 1.13 | % | | | 1.12 | % | | | 1.10 | % | | | 1.14 | % | |
Net expenses after fees waived or expenses reimbursed
(excluding interest expense)(d) | | | 1.11 | %(e) | | | 1.05 | %(e) | | | 1.08 | %(e) | | | 1.10 | %(e) | | | 1.13 | %(e) | |
| Net investment income | | | 6.42 | %(e) | | | 6.94 | %(e) | | | 7.23 | %(e) | | | 9.08 | %(e) | | | 7.23 | %(e) | |
| Supplemental data | |
| Net assets, end of period (in thousands) | | $ | 182,777 | | | $ | 193,413 | | | $ | 184,253 | | | $ | 170,321 | | | $ | 205,330 | | |
| Portfolio turnover | | | 79 | % | | | 109 | % | | | 60 | % | | | 44 | % | | | 50 | % | |
Notes to Financial Highlights
(a) Rounds to less than $0.01.
(b) In addition to the fees and expenses which the Fund bears directly, the Fund indirectly bears a pro rata share of the fees and expenses of the acquired funds in which it invests. Such indirect expenses are not included in the reported expense ratios.
(c) Includes interest expense which rounds to less than 0.01%.
(d) The Investment Manager and certain of its affiliates agreed to waive/reimburse certain fees and expenses, if applicable.
(e) The benefits derived from expense reductions had an impact of less than 0.01%.
The accompanying Notes to Financial Statements are an integral part of this statement.
Annual Report 2012
26
Columbia High Yield Opportunity Fund
Financial Highlights (continued)
| | | Year Ended May 31, | |
| Class B | | 2012 | | 2011 | | 2010 | | 2009 | | 2008 | |
| Per share data | |
| Net asset value, beginning of period | | $ | 4.14 | | | $ | 3.79 | | | $ | 3.33 | | | $ | 4.17 | | | $ | 4.72 | | |
| Income from investment operations: | |
| Net investment income | | | 0.23 | | | | 0.25 | | | | 0.24 | | | | 0.28 | | | | 0.28 | | |
| Net realized and unrealized gain (loss) | | | (0.07 | ) | | | 0.35 | | | | 0.53 | | | | (0.84 | ) | | | (0.55 | ) | |
| Total from investment operations | | | 0.16 | | | | 0.60 | | | | 0.77 | | | | (0.56 | ) | | | (0.27 | ) | |
| Less distributions to shareholders: | |
| Net investment income | | | (0.23 | ) | | | (0.25 | ) | | | (0.31 | ) | | | (0.29 | ) | | | (0.28 | ) | |
| Total distributions to shareholders | | | (0.23 | ) | | | (0.25 | ) | | | (0.31 | ) | | | (0.29 | ) | | | (0.28 | ) | |
| Proceeds from regulatory settlement | | | — | | | | 0.00 | (a) | | | 0.00 | (a) | | | 0.01 | | | | — | | |
| Net asset value, end of period | | $ | 4.07 | | | $ | 4.14 | | | $ | 3.79 | | | $ | 3.33 | | | $ | 4.17 | | |
| Total return | | | 4.11 | % | | | 16.34 | % | | | 23.59 | % | | | (12.69 | %) | | | (5.73 | %) | |
| Ratios to average net assets(b) | |
Expenses prior to fees waived or expenses reimbursed
(including interest expense) | | | 1.92 | % | | | 1.88 | % | | | 1.87 | %(c) | | | 1.85 | % | | | 1.89 | %(c) | |
Net expenses after fees waived or expenses reimbursed
(including interest expense)(d) | | | 1.86 | %(e) | | | 1.80 | %(e) | | | 1.83 | %(c)(e) | | | 1.85 | %(e) | | | 1.88 | %(c)(e) | |
Expenses prior to fees waived or expenses reimbursed
(excluding interest expense) | | | 1.92 | % | | | 1.88 | % | | | 1.87 | % | | | 1.85 | % | | | 1.89 | % | |
Net expenses after fees waived or expenses reimbursed
(excluding interest expense)(d) | | | 1.86 | %(e) | | | 1.80 | %(e) | | | 1.83 | %(e) | | | 1.85 | %(e) | | | 1.88 | %(e) | |
| Net investment income | | | 5.69 | %(e) | | | 6.27 | %(e) | | | 6.50 | %(e) | | | 8.35 | %(e) | | | 6.47 | %(e) | |
| Supplemental data | |
| Net assets, end of period (in thousands) | | $ | 4,273 | | | $ | 8,283 | | | $ | 16,149 | | | $ | 23,665 | | | $ | 46,732 | | |
| Portfolio turnover | | | 79 | % | | | 109 | % | | | 60 | % | | | 44 | % | | | 50 | % | |
Notes to Financial Highlights
(a) Rounds to less than $0.01.
(b) In addition to the fees and expenses which the Fund bears directly, the Fund indirectly bears a pro rata share of the fees and expenses of the acquired funds in which it invests. Such indirect expenses are not included in the reported expense ratios.
(c) Includes interest expense which rounds to less than 0.01%.
(d) The Investment Manager and certain of its affiliates agreed to waive/reimburse certain fees and expenses, if applicable.
(e) The benefits derived from expense reductions had an impact of less than 0.01%.
The accompanying Notes to Financial Statements are an integral part of this statement.
Annual Report 2012
27
Columbia High Yield Opportunity Fund
Financial Highlights (continued)
| | | Year Ended May 31, | |
| Class C | | 2012 | | 2011 | | 2010 | | 2009 | | 2008 | |
| Per share data | |
| Net asset value, beginning of period | | $ | 4.14 | | | $ | 3.79 | | | $ | 3.33 | | | $ | 4.17 | | | $ | 4.72 | | |
| Income from investment operations: | |
| Net investment income | | | 0.23 | | | | 0.25 | | | | 0.25 | | | | 0.28 | | | | 0.29 | | |
| Net realized and unrealized gain (loss) | | | (0.05 | ) | | | 0.36 | | | | 0.52 | | | | (0.83 | ) | | | (0.55 | ) | |
| Total from investment operations | | | 0.18 | | | | 0.61 | | | | 0.77 | | | | (0.55 | ) | | | (0.26 | ) | |
| Less distributions to shareholders: | |
| Net investment income | | | (0.24 | ) | | | (0.26 | ) | | | (0.31 | ) | | | (0.30 | ) | | | (0.29 | ) | |
| Total distributions to shareholders | | | (0.24 | ) | | | (0.26 | ) | | | (0.31 | ) | | | (0.30 | ) | | | (0.29 | ) | |
| Proceeds from regulatory settlement | | | — | | | | 0.00 | (a) | | | 0.00 | (a) | | | 0.01 | | | | — | | |
| Net asset value, end of period | | $ | 4.08 | | | $ | 4.14 | | | $ | 3.79 | | | $ | 3.33 | | | $ | 4.17 | | |
| Total return | | | 4.52 | % | | | 16.52 | % | | | 23.76 | % | | | (12.57 | %) | | | (5.59 | %) | |
| Ratios to average net assets(b) | |
Expenses prior to fees waived or expenses reimbursed
(including interest expense) | | | 1.91 | % | | | 1.88 | % | | | 1.87 | %(c) | | | 1.85 | % | | | 1.89 | %(c) | |
Net expenses after fees waived or expenses reimbursed
(including interest expense)(d) | | | 1.71 | %(e) | | | 1.65 | %(e) | | | 1.68 | %(c)(e) | | | 1.70 | %(e) | | | 1.73 | %(c)(e) | |
Expenses prior to fees waived or expenses reimbursed
(excluding interest expense) | | | 1.91 | % | | | 1.88 | % | | | 1.87 | % | | | 1.85 | % | | | 1.89 | % | |
Net expenses after fees waived or expenses reimbursed
(excluding interest expense)(d) | | | 1.71 | %(e) | | | 1.65 | %(e) | | | 1.68 | %(e) | | | 1.70 | %(e) | | | 1.73 | %(e) | |
| Net investment income | | | 5.83 | %(e) | | | 6.35 | %(e) | | | 6.63 | %(e) | | | 8.49 | %(e) | | | 6.63 | %(e) | |
| Supplemental data | |
| Net assets, end of period (in thousands) | | $ | 11,167 | | | $ | 12,525 | | | $ | 12,769 | | | $ | 11,658 | | | $ | 15,202 | | |
| Portfolio turnover | | | 79 | % | | | 109 | % | | | 60 | % | | | 44 | % | | | 50 | % | |
Notes to Financial Highlights
(a) Rounds to less than $0.01.
(b) In addition to the fees and expenses which the Fund bears directly, the Fund indirectly bears a pro rata share of the fees and expenses of the acquired funds in which it invests. Such indirect expenses are not included in the reported expense ratios.
(c) Includes interest expense which rounds to less than 0.01%.
(d) The Investment Manager and certain of its affiliates agreed to waive/reimburse certain fees and expenses, if applicable.
(e) The benefits derived from expense reductions had an impact of less than 0.01%.
The accompanying Notes to Financial Statements are an integral part of this statement.
Annual Report 2012
28
Columbia High Yield Opportunity Fund
Financial Highlights (continued)
| | | Year Ended May 31, | |
| Class Z | | 2012 | | 2011 | | 2010 | | 2009 | | 2008 | |
| Per share data | |
| Net asset value, beginning of period | | $ | 4.14 | | | $ | 3.79 | | | $ | 3.33 | | | $ | 4.17 | | | $ | 4.72 | | |
| Income from investment operations: | |
| Net investment income | | | 0.27 | | | | 0.29 | | | | 0.28 | | | | 0.31 | | | | 0.31 | | |
| Net realized and unrealized gain (loss) | | | (0.06 | ) | | | 0.35 | | | | 0.53 | | | | (0.83 | ) | | | (0.54 | ) | |
| Total from investment operations | | | 0.21 | | | | 0.64 | | | | 0.81 | | | | (0.52 | ) | | | (0.23 | ) | |
| Less distributions to shareholders: | |
| Net investment income | | | (0.27 | ) | | | (0.29 | ) | | | (0.35 | ) | | | (0.33 | ) | | | (0.32 | ) | |
| Total distributions to shareholders | | | (0.27 | ) | | | (0.29 | ) | | | (0.35 | ) | | | (0.33 | ) | | | (0.32 | ) | |
| Proceeds from regulatory settlement | | | — | | | | 0.00 | (a) | | | 0.00 | (a) | | | 0.01 | | | | — | | |
| Net asset value, end of period | | $ | 4.08 | | | $ | 4.14 | | | $ | 3.79 | | | $ | 3.33 | | | $ | 4.17 | | |
| Total return | | | 5.40 | % | | | 17.50 | % | | | 24.80 | % | | | (11.83 | %) | | | (4.79 | %) | |
| Ratios to average net assets(b) | |
Expenses prior to fees waived or expenses reimbursed
(including interest expense) | | | 0.91 | % | | | 0.88 | % | | | 0.87 | %(c) | | | 0.85 | % | | | 0.89 | %(c) | |
Net expenses after fees waived or expenses reimbursed
(including interest expense)(d) | | | 0.86 | %(e) | | | 0.80 | %(e) | | | 0.83 | %(c)(e) | | | 0.85 | %(e) | | | 0.88 | %(c)(e) | |
Expenses prior to fees waived or expenses reimbursed
(excluding interest expense) | | | 0.91 | % | | | 0.88 | % | | | 0.87 | % | | | 0.85 | % | | | 0.89 | % | |
Net expenses after fees waived or expenses reimbursed
(excluding interest expense)(d) | | | 0.86 | %(e) | | | 0.80 | %(e) | | | 0.83 | %(e) | | | 0.85 | %(e) | | | 0.88 | %(e) | |
| Net investment income | | | 6.64 | %(e) | | | 7.19 | %(e) | | | 7.48 | %(e) | | | 9.39 | %(e) | | | 7.47 | %(e) | |
| Supplemental data | |
| Net assets, end of period (in thousands) | | $ | 132,966 | | | $ | 109,512 | | | $ | 108,094 | | | $ | 112,037 | | | $ | 122,766 | | |
| Portfolio turnover | | | 79 | % | | | 109 | % | | | 60 | % | | | 44 | % | | | 50 | % | |
Notes to Financial Highlights
(a) Rounds to less than $0.01.
(b) In addition to the fees and expenses which the Fund bears directly, the Fund indirectly bears a pro rata share of the fees and expenses of the acquired funds in which it invests. Such indirect expenses are not included in the reported expense ratios.
(c) Includes interest expense which rounds to less than 0.01%.
(d) The Investment Manager and certain of its affiliates agreed to waive/reimburse certain fees and expenses, if applicable.
(e) The benefits derived from expense reductions had an impact of less than 0.01%.
The accompanying Notes to Financial Statements are an integral part of this statement.
Annual Report 2012
29
Columbia High Yield Opportunity Fund
Notes to Financial Statements
May 31, 2012
Note 1. Organization
Columbia High Yield Opportunity Fund (the Fund), a series of Columbia Funds Series Trust I (the Trust), is a diversified fund. The Trust is registered under the Investment Company Act of 1940, as amended (the 1940 Act), as an open-end management investment company organized as a Massachusetts business trust.
Fund Shares
The Trust may issue an unlimited number of shares (without par value). The Fund offers Class A, Class B, Class C and Class Z shares. All share classes have identical voting, dividend and liquidation rights. Each share class has its own expense structure and sales charges, as applicable.
Class A shares are subject to a maximum front-end sales charge of 4.75% based on the initial investment amount. Class A shares purchased without an initial sales charge in accounts aggregating $1 million to $50 million at the time of purchase are subject to a contingent deferred sales charge (CDSC) if the shares are sold within 18 months of purchase, charged as follows: 1.00% CDSC if redeemed within 12 months of purchase, and 0.50% CDSC if redeemed more than 12, but less than 18, months after purchase.
Class B shares may be subject to a maximum CDSC of 5.00% based upon the holding period after purchase. Class B shares will generally convert to Class A shares eight years after purchase. The Fund no longer accepts investments by new or existing investors in the Fund's Class B shares, except in connection with the reinvestment of any dividend and/or capital gain distributions in Class B shares of the Fund and exchanges by existing Class B shareholders of certain other funds within the Columbia Family of Funds.
Class C shares are subject to a 1.00% CDSC on shares redeemed within one year of purchase.
Class Z shares are not subject to sales charges, and are only available to certain investors, as described in the Fund's Class Z prospectus.
Note 2. Summary of Significant Accounting Policies
Use of Estimates
The preparation of financial statements in accordance with U.S. generally accepted accounting principles (GAAP) requires management to make certain estimates and assumptions that affect the reported amounts of assets and liabilities, the disclosure of contingent assets and liabilities at the date of the financial statements and the reported amounts of revenue and expenses during the reporting period. Actual results could differ from those estimates.
The following is a summary of significant accounting policies consistently followed by the Fund in the preparation of its financial statements.
Security Valuation
Debt securities generally are valued by pricing services approved by the Board of Trustees (the Board) based upon market transactions for normal, institutional-size trading units of similar securities. The services may use various pricing techniques which take into account appropriate factors such as yield, quality, coupon rate, maturity, type of issue, trading characteristics and other data, as well as broker quotes. Debt securities for which quotations are readily available may also be valued based upon an over-the-counter or exchange bid quotation.
All equity securities are valued at the close of business of the New York Stock Exchange (NYSE). Equity securities are valued at the last quoted sales price on the principal exchange or market on which they trade, except for securities traded on the NASDAQ Stock Market, which are valued at the NASDAQ official close price. Unlisted securities or listed securities for which there were no sales during the day are valued at the mean of the latest quoted bid and ask prices on such exchanges or markets.
Foreign securities are valued based on quotations from the principal market in which such securities are normally traded. If any foreign share prices are not readily available as a result of limited share activity the securities are valued at the mean of the latest quoted bid and ask prices on such exchanges or markets. Foreign currency exchange rates are generally determined at 4:00 p.m. Eastern (U.S.) time. However, many securities markets and exchanges outside the U.S. close prior to the close of the NYSE; therefore, the closing prices for securities in such markets or on such exchanges may not fully reflect events that occur after such close but before the close of the NYSE. In those situations, foreign securities will be fair valued pursuant to the policy adopted by the Board, including utilizing a third party pricing service to determine these fair values. The third party pricing service takes into account multiple factors, including, but not limited to, movements in the U.S. securities markets, certain depositary receipts, futures contracts and foreign exchange rates that have occurred subsequent to the close of the foreign exchange or market, to determine a good faith estimate that reasonably reflects the current market conditions as of the close of the NYSE. The fair value of a security is likely to be different from the quoted or published price, if available.
Annual Report 2012
30
Columbia High Yield Opportunity Fund
Notes to Financial Statements (continued)
May 31, 2012
Investments in other open-end investment companies, including money market funds, are valued at net asset value.
Short-term securities purchased within 60 days to maturity are valued at amortized cost, which approximates market value. The value of short-term securities originally purchased with maturities greater than 60 days is determined based on an amortized value to par upon reaching 60 days to maturity. Short-term securities maturing in more than 60 days from the valuation date are valued at the market price or approximate market value based on current interest rates.
Swap transactions are valued through an independent pricing service or broker, or if neither is available, through an internal model based upon observable inputs.
Investments for which market quotations are not readily available, or that have quotations which management believes are not reliable, are valued at fair value as determined in good faith under consistently applied procedures established by and under the general supervision of the Board. If a security or class of securities (such as foreign securities) is valued at fair value, such value is likely to be different from the last quoted market price for the security.
The determination of fair value often requires significant judgment. To determine fair value, management may use assumptions including but not limited to future cash flows and estimated risk premiums. Multiple inputs from various sources may be used to determine fair value.
Foreign Currency Transactions and Translation
The values of all assets and liabilities denominated in foreign currencies are translated into U.S. dollars at that day's exchange rates. Net realized and unrealized gains (losses) on foreign currency transactions and translations include gains (losses) arising from the fluctuation in exchange rates between trade and settlement dates on securities transactions, gains (losses) arising from the disposition of foreign currency and currency gains (losses) between the accrual and payment dates on dividends, interest income and foreign withholding taxes.
For financial statement purposes, the Fund does not distinguish that portion of gains (losses) on investments which is due to changes in foreign exchange rates from that which is due to changes in market prices of the investments. Such fluctuations are included with the net realized and unrealized gains (losses) on investments in the Statement of Operations.
Derivative Instruments
The Fund invests in certain derivative instruments, as detailed below, to meet its investment objectives. Derivatives are instruments whose values depend on, or are derived from, in whole or in part, the value of one or more other assets, such as securities, currencies, commodities or indices. Derivative instruments may be used to maintain cash reserves while maintaining exposure to certain other assets, to offset anticipated declines in values of investments, to facilitate trading, to reduce transaction costs and to pursue higher investment returns. The Fund may also use derivative instruments to mitigate certain investment risks, such as foreign currency exchange rate risk, interest rate risk and credit risk. Derivatives may involve various risks, including the potential inability of the counterparty to fulfill its obligation under the terms of the contract, the potential for an illiquid secondary market and the potential for market movements which may expose the Fund to gains or losses in excess of the amount shown in the Statement of Assets and Liabilities.
The Fund and any counterparty are required to maintain an agreement that requires the Fund and that counterparty to monitor (on a daily basis) the net fair value of all derivatives entered into pursuant to the agreement between the Fund and such counterparty. If the net fair value of such derivatives between the Fund and that counterparty exceeds a certain threshold (as defined in the agreement), the Fund or the counterparty (as the case may be) is required to post cash and/or securities as collateral. Fair values of derivatives presented in the financial statements are not netted with the fair value of other derivatives or with any collateral amounts posted by the Fund or any counterparty.
Credit Default Swap Contracts
Credit default swap contracts are agreements in which one party pays fixed periodic payments to a counterparty in consideration for a guarantee from the counterparty to make a specific payment should a specified negative credit event(s) take place. The Fund entered into credit default swap contracts to increase or decrease its credit exposure to an index.
As the purchaser of a credit default swap contract, the Fund purchases protection by paying a periodic interest rate on the notional amount to the counterparty. The interest amount is accrued daily as a component of unrealized appreciation (depreciation) and is recorded as a realized loss upon payment. If a credit event as specified in the contract occurs, the Fund may have the option either to deliver the reference obligation to the seller in exchange for a cash payment of its par amount, or to receive a net cash settlement equal to the par amount less an agreed-upon value of the reference obligation as of the date of the credit event. The difference between the value of the obligation or cash delivered and the notional amount received will be recorded as a realized gain (loss).
Annual Report 2012
31
Columbia High Yield Opportunity Fund
Notes to Financial Statements (continued)
May 31, 2012
As the seller of a credit default swap contract, the Fund sells protection to a buyer and will generally receive a periodic interest rate on the notional amount. The interest amount is accrued daily as a component of unrealized appreciation (depreciation) and is recorded as a realized gain upon receipt of the payment. If a credit event as specified in the contract occurs, the Fund may either be required to accept the reference obligation from the buyer in exchange for a cash payment of its notional amount, or to pay the buyer a net cash settlement equal to the notional amount less an agreed-upon value of the reference obligation as of the date of the credit event. The difference between the value of the obligation or cash received and the notional amount paid will be recorded as a realized gain (loss). The maximum potential amount of undiscounted future payments the Fund could be required to make as the seller of protection under a credit default swap contract is equal to the notional amount of the reference obligation. Notional amounts of all credit default swap contracts outstanding for which the Fund is the seller of protection, if any, are disclosed in the Credit Default Swap Contracts Outstanding schedule following the Portfolio of Investments. These potential amounts may be partially offset by any recovery values of the respective reference obligations or premiums received upon entering into the agreement.
As a protection seller, the Fund bears the risk of loss from the credit events specified in the contract. Although specified events are contract specific, credit events are generally defined as bankruptcy, failure to pay, restructuring, obligation acceleration, obligation default, or repudiation/moratorium. For credit default swap contracts on credit indices, quoted market prices and resulting market values serve as an indicator of the current status of the payment/performance risk. Increasing market values, in absolute terms when compared to the notional amount of the swap, represent a deterioration of the reference entity's credit soundness and a greater likelihood or risk of default or other credit event occurring as defined under the terms of the contract. Market values for credit default swap contracts in which the Fund is the seller of protection, if any, are disclosed in the Credit Default Swap Contracts Outstanding schedule following the Portfolio of Investments.
The notional amounts and market values of credit default swap contracts are not recorded in the financial statements. Any premium paid or received by the Fund upon entering into a credit default swap contract is recorded as an asset or liability, respectively, and amortized daily as a component of realized gain (loss) in the Statement of Operations. Credit default swap contracts are valued daily, and the change in value is recorded as unrealized appreciation (depreciation) until the termination of the swap, at which time a realized gain (loss) is recorded.
Credit default swap contracts can involve greater risks than if a fund had invested in the reference obligation directly since, in addition to general market risks, credit default swaps are subject to counterparty credit risk, leverage risk, hedging risk, correlation risk and liquidity risk. The Fund will enter into credit default swap transactions only with counterparties that meet certain standards of creditworthiness.
Effects of Derivative Transactions in the Financial Statements
The following tables are intended to provide additional information about the effect of derivatives on the financial statements of the Fund, including: the fair value of derivatives by risk category and the location of those fair values in the Statement of Assets and Liabilities; the impact of derivative transactions on the Fund's operations over the period including realized gains or losses and unrealized gains or losses. The derivative schedules following the Portfolio of Investments present additional information regarding derivative instruments outstanding at the end of the period, if any.
Fair Values of Derivative Instruments at May 31, 2012
At May 31, 2012, the fund had no outstanding derivatives.
The effect of derivative instruments in the Statement of Operations for the year ended May 31, 2012:
| Amount of Realized Gain (Loss) on Derivatives Recognized in Income | |
| Risk Exposure Category | | Swap Contracts ($) | | Total ($) | |
| Credit contracts | | | 42,361 | | | | 42,361 | | |
| Change in Unrealized Appreciation (Depreciation) on Derivatives Recognized in Income | |
| Risk Exposure Category | | Swap Contracts ($) | | Total ($) | |
| Credit contracts | | | — | | | | — | | |
The following table is a summary of the volume of derivative instruments for the year ended May 31, 2012:
| Derivative Instrument | | Aggregate
Notional Opened ($) | |
| Credit default swap contracts — sell protection | | | 10,000,000 | | |
Repurchase Agreements
The Fund may engage in repurchase agreement transactions with institutions that management has determined are creditworthy. The Fund, through the custodian, receives delivery of the underlying securities collateralizing a repurchase agreement. Management is responsible for determining that the collateral is at least equal, at all times, to the value of the repurchase obligation including interest. A repurchase agreement transaction involves certain risks in the event of default or insolvency of the counterparty. These risks
Annual Report 2012
32
Columbia High Yield Opportunity Fund
Notes to Financial Statements (continued)
May 31, 2012
include possible delays in or restrictions on a Fund's ability to dispose of the underlying securities and a possible decline in the value of the underlying securities during the period while the Fund seeks to assert its rights.
Delayed Delivery Securities
The Fund may trade securities on other than normal settlement terms, including securities purchased or sold on a "when-issued" basis. This may increase the risk if the other party to the transaction fails to deliver and causes the Fund to subsequently invest at less advantageous prices. The Fund designates cash or liquid securities in an amount equal to the delayed delivery commitment.
Loan Participations and Commitments
The Fund may invest in loan participations. When the Fund purchases a loan participation, the Fund typically enters into a contractual relationship with the lender or third party selling such participation (Selling Participant), but not the borrower. However, the Fund assumes the credit risk of the borrower, Selling Participant and any other persons interpositioned between the Fund and the borrower. The Fund may not directly benefit from the collateral supporting the senior loan which it has purchased from the Selling Participant.
Security Transactions
Security transactions are accounted for on the trade date. Cost is determined and gains (losses) are based upon the specific identification method for both financial statement and federal income tax purposes.
Income Recognition
Interest income is recorded on an accrual basis. Market premium and discount are amortized and accreted, respectively, on all debt securities, unless otherwise noted. Original issue discount is accreted to interest income over the life of the security with a corresponding increase in the cost basis, if any.
Corporate actions and dividend income are recorded on the ex-dividend date.
The value of additional securities received as an income payment is recorded as income and increases the cost basis of such securities.
Expenses
General expenses of the Trust are allocated to the Fund and other funds of the Trust based upon relative net assets or other expense allocation methodologies determined by the nature of the expense. Expenses directly attributable to the Fund are charged to the Fund. Expenses directly attributable to a specific class of shares are charged to that share class.
Determination of Class Net Asset Value
All income, expenses (other than class-specific expenses, which are charged to that share class, as shown in the Statement of Operations) and realized and unrealized gains (losses) are allocated to each class of the Fund on a daily basis for purposes of determining the net asset value of each class. Income and expenses are allocated to each class based on the settled shares method, while realized and unrealized gains (losses) are allocated based on the relative net assets of each class.
Federal Income Tax Status
The Fund intends to qualify each year as a regulated investment company under Subchapter M of the Internal Revenue Code, as amended, and will distribute substantially all of its taxable income (including net short-term capital gains), if any, for its tax year, and as such will not be subject to federal income taxes. In addition, the Fund intends to distribute in each calendar year substantially all of its net investment income, capital gains and certain other amounts, if any, such that the Fund should not be subject to federal excise tax. Therefore, no federal income or excise tax provision is recorded.
Foreign Taxes
The Fund may be subject to foreign taxes on income, gains on investments or currency repatriation, a portion of which may be recoverable. The Fund will accrue such taxes and recoveries, as applicable, based upon its current interpretation of tax rules and regulations that exist in the markets in which it invests.
Realized gains in certain countries may be subject to foreign taxes at the Fund level, based on statutory rates. The Fund accrues for such foreign taxes on net realized and unrealized gains at the appropriate rate for each jurisdiction, as applicable.
Distributions to Shareholders
Distributions from net investment income, if any, are declared daily and paid monthly. Net realized capital gains, if any, are distributed at least annually. Income distributions and capital gain distributions are determined in accordance with federal income tax regulations, which may differ from GAAP.
Guarantees and Indemnifications
Under the Trust's organizational documents and, in some cases, by contract, its officers and trustees are indemnified against certain liabilities arising out of the performance of their duties to the Trust or its funds. In addition, certain of the Fund's contracts with its service providers contain general indemnification clauses. The Fund's maximum exposure under
Annual Report 2012
33
Columbia High Yield Opportunity Fund
Notes to Financial Statements (continued)
May 31, 2012
these arrangements is unknown since the amount of any future claims that may be made against the Fund cannot be determined, and the Fund has no historical basis for predicting the likelihood of any such claims.
Recent Accounting Pronouncement
Fair Value Measurements
In May 2011, the Financial Accounting Standards Board (FASB) issued ASU No. 2011-04 modifying Topic 820, Fair Value Measurements. At the same time, the International Accounting Standards Board (IASB) issued International Financial Reporting Standard 13, Fair Value Measurement. The objective of the FASB and IASB is the convergence of their guidance on fair value measurements and disclosures.
Specifically, ASU No. 2011-04 requires reporting entities to disclose: i) the amounts of any transfers between Level 1 and Level 2, and the reasons for the transfers, ii) for Level 3 fair value measurements, a) quantitative information about significant unobservable inputs used, b) a description of the valuation processes used by the reporting entity and c) a narrative description of the sensitivity of the fair value measurement to changes in unobservable inputs if a change in those inputs might result in a significantly higher or lower fair value measurement. The effective date of ASU No. 2011-04 is for interim and annual periods beginning after December 15, 2011. At this time, management is evaluating the implications of this guidance and the impact it will have on the financial statement amounts and footnote disclosures, if any.
Note 3. Fees and Compensation Paid to Affiliates
Investment Management Fees
Under an Investment Management Services Agreement, Columbia Management Investment Advisers, LLC (the Investment Manager), a wholly-owned subsidiary of Ameriprise Financial, Inc. (Ameriprise Financial), determines which securities will be purchased, held or sold. Effective July 1, 2011, the management fee is an annual fee that is equal to a percentage of the Fund's average daily net assets that declines from 0.59% to 0.36% as the Fund's net assets increase. Prior to July 1, 2011, the management fee was equal to a percentage of the Fund's average daily net assets that declined from 0.60% to 0.49% as the Fund's net assets increased. The effective management fee rate for the year ended May 31, 2012 was 0.59% of the Fund's average daily net assets.
Administration Fees
Under an Administrative Services Agreement, the Investment Manager serves as the Fund Administrator. Effective July 1, 2011, the Fund pays the Fund Administrator an annual fee for administration and accounting services equal to a percentage of the Fund's average daily net assets that declines from 0.07% to 0.04% as the Fund's net assets increase. Prior to July 1, 2011, the Investment Manager did not receive a fee for its services under the Administration Services Agreement. The effective administration fee rate for the year ended May 31, 2012 was 0.06% of the Fund's average daily net assets.
Pricing and Bookkeeping Fees
Prior to June 27, 2011, the Fund had entered into a Financial Reporting Services Agreement (the Financial Reporting Services Agreement) with State Street Bank and Trust Company (State Street) and the Investment Manager pursuant to which State Street provided financial reporting services to the Fund. The Fund also entered into an Accounting Services Agreement (collectively with the Financial Reporting Services Agreement, the State Street Agreements) with State Street and the Investment Manager pursuant to which State Street provided accounting services to the Fund. Under the State Street Agreements, the Fund paid State Street an annual fee of $38,000 paid monthly plus an additional monthly fee based on an annualized percentage rate of average daily net assets of the Fund for the month. The aggregate fee did not exceed $140,000 per year (exclusive of out-of-pocket expenses and charges). The Fund also reimbursed State Street for certain out-of-pocket expenses and charges. Effective June 27, 2011, these services are now provided under the Administrative Services Agreement discussed above.
Compensation of Board Members
Board members are compensated for their services to the Fund as disclosed in the Statement of Operations. The Trust's eligible Trustees may participate in a Deferred Compensation Plan (the Plan) which may be terminated at any time. Obligations of the Plan will be paid solely out of the Fund's assets.
Compensation of Chief Compliance Officer
The Board has appointed a Chief Compliance Officer to the Fund in accordance with federal securities regulations. The Fund pays its pro-rata share of the expenses associated with the Chief Compliance Officer. The Fund's expenses for the Chief Compliance Officer will not exceed $15,000 per year.
Transfer Agent Fees
Under a Transfer and Dividend Disbursing Agent Agreement, Columbia Management Investment Services Corp. (the Transfer Agent), an affiliate of the Investment Manager and a wholly-owned subsidiary of Ameriprise Financial, is responsible for providing transfer agency services to the Fund.
Annual Report 2012
34
Columbia High Yield Opportunity Fund
Notes to Financial Statements (continued)
May 31, 2012
The Transfer Agent has contracted with Boston Financial Data Services (BFDS) to serve as sub-transfer agent.
The Transfer Agent receives monthly account-based service fees based on the number of open accounts and is reimbursed by the Fund for the fees and expenses the Transfer Agent pays to financial intermediaries that maintain omnibus accounts with the Fund that is a percentage of the average aggregate value of the Fund's shares maintained in each such omnibus account (other than omnibus accounts for which American Enterprise Investment Services Inc. is the broker of record or accounts where the beneficial shareholder is a customer of Ameriprise Financial Services, Inc., which are paid a per account fee). The Transfer Agent pays the fees of BFDS for services as sub-transfer agent and is not entitled to reimbursement for such fees from the Fund (with the exception of out-of-pocket fees).
The Transfer Agent also receives compensation from fees for various shareholder services and reimbursements for certain out-of -pocket fees.
For the year ended May 31, 2012, the Fund's effective transfer agent fee rates as a percentage of average daily net assets of each class were as follows:
| Class A | | | 0.17 | % | |
| Class B | | | 0.17 | | |
| Class C | | | 0.17 | | |
| Class Z | | | 0.17 | | |
An annual minimum account balance fee of $20 may apply to certain accounts with a value below the Fund's initial minimum investment requirements to reduce the impact of small accounts on transfer agent fees. These minimum account balance fees are recorded as part of expense reductions in the Statement of Operations. For the year ended May 31, 2012, these minimum account balance fees reduced total expenses by $4,385.
Distribution and Service Fees
The Fund has an agreement with Columbia Management Investment Distributors, Inc. (the Distributor), an affiliate of the Investment Manager and a wholly-owned subsidiary of Ameriprise Financial, for distribution and shareholder services. Pursuant to Rule 12b-1 under the 1940 Act, the Board has approved, and the Fund has adopted, distribution and shareholder service plans (the Plans) which set the distribution and service fees for the Fund. These fees are calculated daily and are intended to compensate the Distributor and/or eligible selling and/or servicing agents for selling shares of the Fund and providing services to investors.
The Plans require the payment of a monthly service fee to the Distributor at the maximum annual rate of 0.25% of the average daily net assets attributable to Class A, Class B and Class C shares of the Fund. The Plans also require the payment of a monthly distribution fee to the Distributor at the maximum annual rate of 0.75% of the average daily net assets attributable to Class B and Class C shares, only.
The Distributor has voluntarily agreed to waive a portion of the distribution fee for Class C shares so that the combined distribution and service fee does not exceed 0.85% annually of the average daily net assets attributable to Class C shares. This arrangement may be modified or terminated by the Distributor at any time.
Sales Charges
Sales charges, including front-end charges and CDSCs, received by the Distributor for distributing Fund shares were $72,939 for Class A, $5,889 for Class B and $433 for Class C shares for the year ended May 31, 2012.
Expenses Waived/Reimbursed by the Investment Manager and its Affiliates
Effective July 1, 2011, the Investment Manager and certain of its affiliates have contractually agreed to waive fees and/or reimburse expenses (excluding certain fees and expenses described below), through September 30, 2012, unless sooner terminated at the sole discretion of the Board, so that the Fund's net operating expenses, after giving effect to fees waived/expenses reimbursed and any balance credits and/or overdraft charges from the Fund's custodian, do not exceed the following annual rates as a percentage of the class' average daily net assets:
| Class A | | | 1.12 | % | |
| Class B | | | 1.87 | | |
| Class C | | | 1.87 | | |
| Class Z | | | 0.87 | | |
Under the agreement, the following fees and expenses are excluded from the waiver/reimbursement commitment, and therefore will be paid by the Fund, if applicable: taxes (including foreign transaction taxes), expenses associated with investments in affiliated and non-affiliated pooled investment vehicles (including mutual funds and exchange traded funds), transaction costs and brokerage commissions, costs related to any securities lending program, dividend expenses associated with securities sold short, inverse floater program fees and expenses, transaction charges and interest on borrowed money, interest, extraordinary expenses and any other expenses the exclusion of which is specifically approved by the Board. This agreement may be modified or amended only with approval
Annual Report 2012
35
Columbia High Yield Opportunity Fund
Notes to Financial Statements (continued)
May 31, 2012
from all parties. Class C distribution fees waived by the Distributor, as discussed above, are in addition to the waiver/reimbursement commitment under the agreement.
Prior to July 1, 2011, the Investment Manager voluntarily agreed to reimburse a portion of the Fund's expenses (excluding certain expenses, such as distribution and services fees, brokerage commissions, interest, taxes and extraordinary expenses, but including custodian charges relating to overdrafts, if any) so that the Fund's ordinary net operating expenses, after giving effect to fees waived/expenses reimbursed and any balance credits from the Fund's custodian, did not exceed 0.80% of the Fund's average daily net assets on an annualized basis.
Note 4. Federal Tax Information
The timing and character of income and capital gain distributions are determined in accordance with income tax regulations, which may differ from GAAP because of temporary or permanent book to tax differences.
At May 31, 2012, these differences are primarily due to differing treatment for capital loss carryforwards, deferral/reversal of wash sale losses, Trustees' deferred compensation, defaulted bonds, swap transactions, distributions payable and market discount/premium. To the extent these differences are permanent, reclassifications are made among the components of the Fund's net assets in the Statement of Assets and Liabilities. Temporary differences do not require reclassifications. In the Statement of Assets and Liabilities the following reclassifications were made:
| Excess of distributions over net investment income | | $ | 137,440 | | |
| Accumulated net realized loss | | | (214,224 | ) | |
| Paid-in capital | | | 76,784 | | |
Net investment income and net realized gains (losses), as disclosed in the Statement of Operations, and net assets were not affected by this reclassification.
The tax character of distributions paid during the years indicated was as follows:
| Year Ended May 31, | | 2012 | | 2011 | |
| Ordinary income | | $ | 20,579,671 | | | $ | 23,186,806 | | |
| Long-term capital gains | | | — | | | | — | | |
Short-term capital gain distributions, if any, are considered ordinary income distributions for tax purposes.
At May 31, 2012, the components of distributable earnings on a tax basis were as follows:
| Undistributed ordinary income | | $ | 716,233 | | |
| Undistributed accumulated long-term gain | | | — | | |
| Unrealized appreciation | | | 3,456,854 | | |
At May 31, 2012, the cost of investments for federal income tax purposes was $345,167,929 and the aggregate gross unrealized appreciation and depreciation based on that cost was:
| Unrealized appreciation | | $ | 8,817,236 | | |
| Unrealized depreciation | | | (5,360,382 | ) | |
| Net unrealized appreciation | | $ | 3,456,854 | | |
The following capital loss carryforward, determined at May 31, 2012, may be available to reduce taxable income arising from future net realized gains on investments, if any, to the extent permitted by the Internal Revenue Code:
| Year of Expiration | | Amount | |
| 2013 | | $ | 4,740,585 | | |
| 2014 | | | 7,033,993 | | |
| 2015 | | | 6,703,180 | | |
| 2016 | | | 378,711 | | |
| 2017 | | | 25,681,397 | | |
| 2018 | | | 44,544,886 | | |
| Total | | $ | 89,082,752 | | |
For the year ended May 31, 2012, $2,737,850 of capital loss carryforward was utilized.
Management of the Fund has concluded that there are no significant uncertain tax positions that would require recognition in the financial statements. However, management's conclusion may be subject to review and adjustment at a later date based on factors including, but not limited to, new tax laws, regulations, and administrative interpretations (including relevant court decisions). Generally, the Fund's federal tax returns for the prior three fiscal years remain subject to examination by the Internal Revenue Service.
Note 5. Portfolio Information
The cost of purchases and proceeds from sales of securities, excluding short-term obligations, aggregated to $249,123,137 and $241,786,898, respectively, for the year ended May 31, 2012.
Note 6. Regulatory Settlements
During the year ended May 31, 2011, the Fund received payments of $17,121 resulting from certain regulatory settlements with third parties. The payments have been
Annual Report 2012
36
Columbia High Yield Opportunity Fund
Notes to Financial Statements (continued)
May 31, 2012
included in "Proceeds from regulatory settlements" in the Statement of Changes in Net Assets.
Note 7. Lending of Portfolio Securities
Effective June 27, 2011, the Fund has entered into a Master Securities Lending Agreement (the Agreement) with JPMorgan Chase Bank, N.A. (JPMorgan). The Agreement, which replaces the previous securities lending arrangement with State Street, authorizes JPMorgan as lending agent to lend securities to authorized borrowers in order to generate additional income on behalf of the Fund. Pursuant to the Agreement, the securities loaned are secured by cash or securities that either are issued or guaranteed as to principal and interest by the U.S. government, its agencies, authorities or instrumentalities with value equal to at least 100% of the market value of the loaned securities. Any additional collateral required to maintain those levels due to market fluctuations of the loaned securities is requested to be delivered the following business day. Cash collateral received is invested by the lending agent on behalf of the Fund into authorized investments pursuant to the Agreement. The investments made with the cash collateral are listed in the Portfolio of Investments. The values of such investments and any uninvested cash collateral are disclosed in the Statement of Assets and Liabilities along with the related obligation to return the collateral upon the return of the securities loaned.
Risks of delay in recovery of securities or even loss of rights in the securities may occur should the borrower of the securities fail financially. Risks may also arise to the extent that the value of the securities loaned increases above the value of the collateral received. JPMorgan will indemnify the Fund from losses resulting from a borrower's failure to return a loaned security when due. Such indemnification does not extend to losses associated with declines in the value of cash collateral investments. The Investment Manager is not responsible for any losses incurred by the Fund in connection with the securities lending program. Loans are subject to termination by the Fund or the borrower at any time, and are, therefore, not considered to be illiquid investments.
Pursuant to the Agreement, the Fund receives income for lending its securities either in the form of fees or by earning interest on invested cash collateral, net of negotiated rebates paid to borrowers and fees paid to the lending agent for services provided and any other securities lending expenses. Net income earned from securities lending for the year ended May 31, 2012 is disclosed in the Statement of Operations. The Fund continues to earn and accrue interest and dividends on the securities loaned.
Prior to June 27, 2011, the Fund participated in a securities lending arrangement with State Street. Each security on loan was collateralized in an amount at least equal to the market value of the securities loaned plus accrued income from the investment of collateral. The income generated by the investment of the collateral, net of any fees remitted to State Street as the lending agent and borrower rebates, was paid to the Fund.
At May 31, 2012, securities valued at $24,228,308 were on loan, secured by cash collateral of $24,726,408 (which does not reflect calls for collateral made to borrowers by JPMorgan at period end) that is partially or fully invested in short-term securities or other cash equivalents.
Note 8. Custody Credits
Prior to June 27, 2011, the Fund had an agreement with its custodian bank under which custody fees may have been reduced by balance credits. These credits are recorded as part of expense reductions on the Statement of Operations. The Fund could have invested a portion of the assets utilized in connection with the expense offset arrangement in an income-producing asset if they had not entered into such an agreement. Subsequent to this date, the Fund may invest its daily balance in an affiliated money market fund as detailed below. For the period June 1, 2011 through June 26, 2011, these credits reduced total expenses by $3.
Note 9. Affiliated Money Market Fund
Effective June 27, 2011, the Fund may invest its daily cash balances in Columbia Short-Term Cash Fund, an affiliated money market fund established for the exclusive use by the Fund and other affiliated funds. The income earned by the Fund from such investments is included as "Dividends from affiliates" in the Statement of Operations. As an investing fund, the Fund indirectly bears its proportionate share of the expenses of Columbia Short-Term Cash Fund.
Note 10. Shareholder Concentration
At May 31, 2012, one unaffiliated shareholder account owned 36.3% of the outstanding shares of the Fund. The Fund has no knowledge about whether any portion of those shares was owned beneficially by such account. Subscription and redemption activity by concentrated accounts may have a significant effect on the operations of the Fund.
Note 11. Line of Credit
The Fund has entered into a revolving credit facility with a syndicate of banks led by JPMorgan whereby the Fund may borrow for the temporary funding of shareholder redemptions or for other temporary or emergency purposes. The credit facility became effective on June 27, 2011, replacing a prior credit facility. The credit facility agreement, as amended,
Annual Report 2012
37
Columbia High Yield Opportunity Fund
Notes to Financial Statements (continued)
May 31, 2012
which is a collective agreement between the Fund and certain other funds managed by the Investment Manager, severally and not jointly, permits collective borrowings up to $500 million. Pursuant to a December 13, 2011 amendment to the credit facility agreement, interest is charged to each participating fund based on its borrowings at a rate equal to the higher of (i) the overnight federal funds rate plus 1.00% or (ii) the one-month LIBOR rate plus 1.00%. Each borrowing under the credit facility matures no later than 60 days after the date of borrowing. The Fund also pays a commitment fee equal to its pro rata share of the amount of the credit facility at a rate of 0.08% per annum. For the period June 27, 2011 through December 12, 2011, interest was charged to each participating fund based on its borrowings at a rate equal to the sum of the federal funds rate plus (i) 1.25% per annum plus (ii) if one-month LIBOR exceeds the federal funds rate, the amount of such excess. The Fund also paid a commitment fee equal to its pro rata share of the amount of the credit facility at a rate of 0.10% per annum.
Prior to June 27, 2011, the Fund and certain other funds managed by the Investment Manager participated in a $150 million committed, unsecured revolving credit facility provided by State Street. Interest was charged to each fund based on its borrowings at a rate equal to the greater of the (i) federal funds rate plus 1.25% per annum or (ii) the overnight LIBOR rate plus 1.25% per annum. The Fund also paid a commitment fee equal to its pro rata share of the amount of the credit facility at a rate of 0.125% per annum.
The Fund had no borrowings during the year ended May 31, 2012.
Note 12. Significant Risks
High Yield Securities Risk
Investing in high-yield fixed income securities may involve greater credit risk and considerations not typically associated with investing in U.S. Government bonds and other higher quality fixed income securities. These securities are non-investment grade securities, often referred to as "junk" bonds. Economic downturns may disrupt the high yield market and impair the ability of issuers to repay principal and interest. Also, an increase in interest rates would likely have an adverse impact on the value of such obligations. Moreover, high-yield securities may be less liquid to the extent that there is no established secondary market.
Foreign Securities Risk
Investing in foreign securities may include certain risks and considerations not typically associated with investing in U.S. securities, such as fluctuating currency values and changing local and regional economic, political and social conditions, which may result in greater market volatility. In addition, certain foreign securities may not be as liquid as U.S. securities.
Note 13. Subsequent Events
Management has evaluated the events and transactions that have occurred through the date the financial statements were issued and noted no items requiring adjustment of the financial statements or additional disclosure.
Note 14. Information Regarding Pending and Settled Legal Proceedings
In December 2005, without admitting or denying the allegations, American Express Financial Corporation (AEFC, which is now known as Ameriprise Financial, Inc. (Ameriprise Financial)) entered into settlement agreements with the Securities and Exchange Commission (SEC) and Minnesota Department of Commerce (MDOC) related to market timing activities. As a result, AEFC was censured and ordered to cease and desist from committing or causing any violations of certain provisions of the Investment Advisers Act of 1940, the Investment Company Act of 1940, and various Minnesota laws. AEFC agreed to pay disgorgement of $10 million and civil money penalties of $7 million. AEFC also agreed to retain an independent distribution consultant to assist in developing a plan for distribution of all disgorgement and civil penalties ordered by the SEC in accordance with various undertakings detailed at www.sec.gov/litigation/admin/ia-2451.pdf. Ameriprise Financial and its affiliates have cooperated with the SEC and the MDOC in these legal proceedings, and have made regular reports to the funds' Boards of Trustees.
Ameriprise Financial and certain of its affiliates have historically been involved in a number of legal, arbitration and regulatory proceedings, including routine litigation, class actions, and governmental actions, concerning matters arising in connection with the conduct of their business activities. Ameriprise Financial believes that the Funds are not currently the subject of, and that neither Ameriprise Financial nor any of its affiliates are the subject of, any pending legal, arbitration or regulatory proceedings that are likely to have a material adverse effect on the Funds or the ability of Ameriprise Financial or its affiliates to perform under their contracts with the Funds. Ameriprise Financial is required to make 10-Q, 10-K and, as necessary, 8-K filings with the Securities and Exchange Commission on legal and regulatory matters that relate to Ameriprise Financial and its affiliates. Copies of these filings may be obtained by accessing the SEC website at www.sec.gov.
There can be no assurance that these matters, or the adverse publicity associated with them, will not result in increased
Annual Report 2012
38
Columbia High Yield Opportunity Fund
Notes to Financial Statements (continued)
May 31, 2012
fund redemptions, reduced sale of fund shares or other adverse consequences to the Funds. Further, although we believe proceedings are not likely to have a material adverse effect on the Funds or the ability of Ameriprise Financial or its affiliates to perform under their contracts with the Funds, these proceedings are subject to uncertainties and, as such, we are unable to estimate the possible loss or range of loss that may result. An adverse outcome in one or more of these proceedings could result in adverse judgments, settlements, fines, penalties or other relief that could have a material adverse effect on the consolidated financial condition or results of operations of Ameriprise Financial.
Annual Report 2012
39
Columbia High Yield Opportunity Fund
Report of Independent Registered Public Accounting Firm
To the Trustees of Columbia Funds Series Trust I and
the Shareholders of Columbia High Yield Opportunity Fund
In our opinion, the accompanying statement of assets and liabilities, including the portfolio of investments, and the related statements of operations and of changes in net assets and the financial highlights present fairly, in all material respects, the financial position of Columbia High Yield Opportunity Fund (the "Fund") (a series of Columbia Funds Series Trust I) at May 31, 2012, the results of its operations for the year then ended, the changes in its net assets for each of the two years in the period then ended and the financial highlights for each of the periods indicated, in conformity with accounting principles generally accepted in the United States of America. These financial statements and financial highlights (hereafter referred to as "financial statements") are the responsibility of the Fund's management. Our responsibility is to express an opinion on these financial statements based on our audits. We conducted our audits of these financial statements in accordance with the standards of the Public Company Accounting Oversight Board (United States). Those standards require that we plan and perform the audit to obtain reasonable assurance about whether the financial statements are free of material misstatement. An audit includes examining, on a test basis, evidence supporting the amounts and disclosures in the financial statements, assessing the accounting principles used and significant estimates made by management, and evaluating the overall financial statement presentation. We believe that our audits, which included confirmation of securities at May 31, 2012 by correspondence with the custodian, brokers, agent banks and transfer agent, provide a reasonable basis for our opinion.
PricewaterhouseCoopers LLP
Minneapolis, Minnesota
July 20, 2012
Annual Report 2012
40
Columbia High Yield Opportunity Fund
Board Members and Officers
The Trustees serve terms of indefinite duration. The names, addresses and birth years of the Trustees and Officers of the Funds in Columbia Funds Series Trust I, the year each was first elected or appointed to office, their principal business occupations during at least the last five years, the number of Funds overseen by each Trustee and other directorships they hold are shown below. Each officer listed below serves as an officer of each Fund in Columbia Funds Series Trust I.
Independent Trustees
Name, Address and Year of Birth,
Position with Funds, Year First
Elected or Appointed to Office | | Principal Occupation(s) During Past Five Years, Number of Funds in Columbia
Funds Complex Overseen by Trustee, Other Directorships Held
| |
Rodman L. Drake (Born 1943)
c/o Columbia Management Investment Advisers, LLC
225 Franklin Street
Boston, MA 02110
Trustee (since 1994) and
Chairman of the Board (since 2009) | | Independent consultant since 2010; Co-Founder of Baringo Capital LLC (private equity) from 1997 to 2008; CEO of Crystal River Capital, Inc. (real estate investment trust) from 2003 to 2010; Oversees 52; Jackson Hewitt Tax Service Inc. (tax preparation services from 2004 to 2011); Celgene Corporation (global biotechnology company); Student Loan Corporation (student loan provider from 2005 to 2010); Celgene Corporation (global biotechnology company); The Helios Funds and Brookfield Funds (closed-end funds); Crystal River Capital, Inc. from 2005 to 2010; Parsons Brinckerhoff from 1995 to 2008; and Apex Silver Mines Ltd. from 2007 to 2009 | |
|
Douglas A. Hacker (Born 1955)
c/o Columbia Management Investment Advisers, LLC
225 Franklin Street
Boston, MA 02110
Trustee (since 1996) | | Independent business executive since May 2006; Executive Vice President — Strategy of United Airlines from December 2002 to May 2006; President of UAL Loyalty Services (airline marketing company) from September 2001 to December 2002; Executive Vice President and Chief Financial Officer of United Airlines from July 1999 to September 2001. Oversees 52; Nash Finch Company (food distributor); Aircastle Limited (aircraft leasing); and SeaCube Container Leasing Ltd. (container leasing) | |
|
Janet Langford Kelly (Born 1957)
c/o Columbia Management Investment Advisers, LLC
225 Franklin Street
Boston, MA 02110
Trustee (since 1996) | | Senior Vice President, General Counsel and Corporate Secretary, ConocoPhillips (integrated energy company) since September 2007; Deputy General Counsel — Corporate Legal Services, ConocoPhillips from August 2006 to August 2007; Partner, Zelle, Hofmann, Voelbel, Mason & Gette LLP (law firm) from March 2005 to July 2006; Adjunct Professor of Law, Northwestern University from September 2004 to June 2006; Director, UAL Corporation (airline) from February 2006 to July 2006; Chief Administrative Officer and Senior Vice President, Kmart Holding Corporation (consumer goods) from September 2003 to March 2004. Oversees 52; None | |
|
Nancy T. Lukitsh (Born 1956)
c/o Columbia Management Investment Advisers, LLC
225 Franklin Street
Boston, MA 02110
Trustee (since 2011) | | Senior Vice President, Partner and Director of Marketing, Wellington Management Company, LLP (investment adviser) from 1997 to 2010; Chair, Wellington Management Investment Portfolios (commingled non-U.S. investment pools) from 2007 to 2010; Director, Wellington Trust Company, NA and other Wellington affiliates from 1997 to 2010. Oversees 52; None | |
|
William E. Mayer (Born 1940)
c/o Columbia Management Investment Advisers, LLC
225 Franklin Street
Boston, MA 02110
Trustee (since 1994) | | Partner, Park Avenue Equity Partners (private equity) since February 1999; Dean and Professor, College of Business and Management, University of Maryland from 1992 to 1996. Oversees 52; DynaVox Inc. (speech creation); Lee Enterprises (print media); WR Hambrecht + Co. (financial service provider) from 2000 to 2012; BlackRock Kelso Capital Corporation (investment company) | |
|
David M. Moffett (Born 1952)
c/o Columbia Management Investment Advisers, LLC
225 Franklin Street
Boston, MA 02110
Trustee (since 2011) | | Retired. Chief Executive Officer, Federal Home Loan Mortgage Corporation, from 2008 to 2009; Senior Adviser, Global Financial Services Group, Carlyle Group, Inc., from 2007 to 2008; Vice Chairman and Chief Financial Officer, U.S. Bancorp, from 1993 to 2007. Oversees 52; CIT Group Inc. (commercial and consumer finance); eBay Inc. (online trading community); MBIA Inc. (financial service provider); E.W. Scripps Co. (print and television media), Building Materials Holding Corp. (building materials and construction services); and University of Oklahoma Foundation. | |
|
Charles R. Nelson (Born 1942)
c/o Columbia Management Investment Advisers, LLC
225 Franklin Street
Boston, MA 02110
Trustee (since 1981) | | Retired Professor Emeritus, University of Washington, since 2011; Professor of Economics, University of Washington from January 1976 to 2011; Ford and Louisa Van Voorhis Professor of Political Economy, University of Washington from 1993 to 2011; Adjunct Professor of Statistics, University of Washington from 1980 to 2011; Associate Editor, Journal of Money Credit and Banking from 1993 to 2008; consultant on econometric and statistical matters. Oversees 52; None | |
|
John J. Neuhauser (Born 1943)
c/o Columbia Management Investment Advisers, LLC
225 Franklin Street
Boston, MA 02110
Trustee (since 1984) | | President, Saint Michael's College, since August 2007; Director or Trustee of several non-profit organizations, including Fletcher Allen Health Care, Inc.; University Professor, Boston College from November 2005 to August 2007; Academic Vice President and Dean of Faculties, Boston College from August 1999 to October 2005. Oversees 52; Liberty All-Star Equity Fund and Liberty All-Star Growth Fund (closed-end funds) | |
|
Annual Report 2012
41
Columbia High Yield Opportunity Fund
Board Members and Officers (continued)
Independent Trustees (continued)
Name, Address and Year of Birth,
Position with Funds, Year First
Elected or Appointed to Office | | Principal Occupation(s) During Past Five Years, Number of Funds in Columbia
Funds Complex Overseen by Trustee, Other Directorships Held
| |
Patrick J. Simpson (Born 1944)
c/o Columbia Management Investment Advisers, LLC
225 Franklin Street
Boston, MA 02110
Trustee (since 2000) | | Partner, Perkins Coie LLP (law firm). Oversees 52; None | |
|
Anne-Lee Verville (Born 1945)
c/o Columbia Management Investment Advisers, LLC
225 Franklin Street
Boston, MA 02110
Trustee (since 1998) | | Retired. General Manager — Global Education Industry from 1994 to 1997, President — Application Systems Division from 1991 to 1994, Chief Financial Officer — US Marketing & Services from 1988 to 1991, and Chief Information Officer from 1987 to 1988, IBM Corporation (computer and technology). Oversees 52; Enesco Group, Inc. (producer of giftware and home and garden decor products) from 2001 to 2006 | |
|
The Statement of Additional Information includes additional information about the Trustees of the Funds and is available, without charge, upon request by calling 1-800-345-6611.
Interested Trustee
Name, Address and Year of Birth,
Position with Funds, Year First
Elected or Appointed to Office | | Principal Occupation(s) During Past Five Years, Number of Funds in Columbia
Funds Complex Overseen by Trustee, Other Directorships Held
| |
William F. Truscott (born 1960)
53600 Ameriprise Financial Center
Minneapolis, MN 55474
Senior Vice President (since 2012) | | Chairman of the Board and President, Columbia Management Investment Advisers, LLC since May 2010 and February 2012, respectively (previously President, Chairman of the Board and Chief Investment Officer, from 2001 to April 2010); Chief Executive Officer, U.S. Asset Management & President, Annuities, Ameriprise Financial, Inc. since May 2010 (previously President — U.S. Asset Management and Chief Investment Officer from 2005 to April 2010, and Senior Vice President — Chief Investment Officer, from 2001 to 2005); Director, President and Chief Executive Officer, Ameriprise Certificate Company since 2006; Director and Chief Executive Officer, Columbia Management Investment Distributors, Inc. since May 2010 and February 2012, respectively (previously Chairman of the Board and Chief Executive Officer from 2008 to April 2010); Chairman of the Board and Chief Executive Officer, RiverSource Distributors, Inc. since 2006. Oversees 208; Columbia Funds Board. | |
|
Officers
| Name, Year of Birth and Address | | Principal Occupation(s) During the Past Five Years | |
J. Kevin Connaughton (Born 1964)
225 Franklin Street
Boston, MA 02110
President (since 2009) | | Senior Vice President and General Manager — Mutual Fund Products, Columbia Management Investment Advisers, LLC since May 2010; President, Columbia Funds, since 2009, and RiverSource Funds, since May 2010 (previously Senior Vice President and Chief Financial Officer, Columbia Funds, from June 2008 to January 2009, Treasurer, Columbia Funds, from October 2003 to May 2008, and senior officer of various other affiliated funds since 2000); Managing Director, Columbia Management Advisors, LLC from December 2004 to April 2010. | |
|
Michael G. Clarke (Born 1969)
225 Franklin Street
Boston, MA 02110
Treasurer (since 2011) and Chief Financial Officer (since 2009) | | Vice President, Columbia Management Investment Advisers, LLC since May 2010; Managing Director of Fund Administration, Columbia Management Advisors, LLC, from September 2004 to April 2010; senior officer of Columbia Funds and affiliated funds since 2002. | |
|
Scott R. Plummer (Born 1959)
5228 Ameriprise Financial Center
Minneapolis, MN 55474
Senior Vice President, Assistant Secretary and Chief Legal Officer (since 2010) | | Senior Vice President, Chief Legal Officer and Assistant Secretary, Columbia Management Investment Advisers, LLC since June 2005; Vice President and Lead Chief Counsel — Asset Management, Ameriprise Financial, Inc. since May 2010 (previously Vice President and Chief Counsel — Asset Management, from 2005 to April 2010); Vice President, Chief Counsel and Assistant Secretary, Columbia Management Investment Distributors, Inc. since 2008; Vice President, General Counsel and Secretary, Ameriprise Certificate Company since 2005; Chief Counsel, RiverSource Distributors, Inc. since 2006; Vice President, General Counsel and Secretary, RiverSource Funds since December 2006; Senior Vice President, Secretary and Chief Legal Officer, Columbia Funds, since May 2010. | |
|
Annual Report 2012
42
Columbia High Yield Opportunity Fund
Board Members and Officers (continued)
Officers (continued)
| Name, Year of Birth and Address | | Principal Occupation(s) During the Past Five Years | |
William F. Truscott (Born 1960)
53600 Ameriprise Financial Center
Minneapolis, MN 55474
Senior Vice President (since 2010) | | Chairman of the Board and President, Columbia Management Investment Advisers, LLC since May 2010 and February 2012, respectively (previously President, Chairman of the Board and Chief Investment Officer, from 2001 to April 2010); Chief Executive Officer, U.S. Asset Management & President, Annuities, Ameriprise Financial, Inc. since May 2010 (previously President — U.S. Asset Management and Chief Investment Officer from 2005 to April 2010); Director, President and Chief Executive Officer, Ameriprise Certificate Company since 2006; Director and Chief Executive Officer, Columbia Management Investment Distributors, Inc. since May 2010 and February 2012, respectively (previously Chairman of the Board and Chief Executive Officer from 2008 to April 2010); Chairman of the Board and Chief Executive Officer, RiverSource Distributors, Inc. since 2006. | |
|
Thomas P. McGuire (Born 1972)
225 Franklin Street
Boston, MA 02110
Chief Compliance Officer (since 2012) | | Vice President — Asset Management Compliance, Columbia Management Investment Advisers, LLC since 2010; Chief Compliance Officer, Ameriprise Certificate Company, since September 2010; Compliance Executive, Bank of America, 2005-2010. | |
|
Colin Moore (Born 1958)
225 Franklin Street
Boston, MA 02110
Senior Vice President (since 2010) | | Director and Chief Investment Officer, Columbia Management Investment Advisers, LLC since May 2010; Manager, Managing Director and Chief Investment Officer of Columbia Management Advisors, LLC from 2007 to April 2010; Head of Equities, Columbia Management Advisors, LLC from 2002 to 2007. | |
|
Amy Johnson (Born 1965)
5228 Ameriprise Financial Center
Minneapolis, MN 55474
Vice President (since 2010) | | Senior Vice President and Chief Operating Officer, Columbia Management Investment Advisers, LLC since May 2010 (previously Chief Administrative Officer, from 2009 until April 2010, Vice President — Asset Management and Trust Company Services, from 2006 to 2009, and Vice President — Operations and Compliance from 2004 to 2006). | |
|
Joseph F. DiMaria (Born 1968)
225 Franklin Street
Boston, MA 02110
Vice President (since 2011) and Chief Accounting Officer (since 2008) | | Vice President, Mutual Fund Administration, Columbia Management Investment Advisers, LLC, since May 2010; Director of Fund Administration, Columbia Management Advisors, LLC from January 2006 to April 2010; Head of Tax/Compliance and Assistant Treasurer, Columbia Management Advisors, LLC, from November 2004 to December 2005. | |
|
Stephen T. Welsh (born 1957)
225 Franklin Street
Boston, MA 02110
Vice President (since 2006) | | President and Director, Columbia Management Investment Services Corp. since May 2010; President and Director, Columbia Management Services, Inc. from July 2004 to April 2010; Managing Director, Columbia Management Distributors, Inc. from August 2007 to April 2010. | |
|
Paul D. Pearson (born 1956)
10468 Ameriprise Financial Center
Minneapolis, MN 55474
Vice President and Assistant Treasurer (since 2011) | | Vice President, Investment Accounting, Columbia Management Investment Advisers, LLC, since May 2010; Vice President, Managed Assets, Investment Accounting, Ameriprise Financial Corporation. | |
|
Paul B. Goucher (born 1968)
5228 Ameriprise Financial Center
Minneapolis, MN 55474
Vice President and Assistant Secretary (since 2010) | | Vice President and Chief Counsel of Ameriprise Financial since January 2010 (formerly Vice President and Group Counsel from November 2008 to January 2010); Director, Managing Director and General Counsel of J. & W. Seligman & Co. Incorporated (Seligman) from July 2008 to November 2008 and Managing Director and Associate General Counsel of Seligman from January 2005 to July 2008. | |
|
Christopher O. Petersen (born 1970)
5228 Ameriprise Financial Center
Minneapolis, MN 55474
Vice President (since 2010) and Secretary (since 2011) | | Vice President and Chief Counsel, Ameriprise Financial since January 2010 (formerly Vice President and Group Counsel or Counsel from April 2004 to January 2010); Assistant Secretary of RiverSource Funds since January 2007; officer of Columbia Funds and affiliated funds since 2007. | |
|
Michael E. DeFao (born 1968)
225 Franklin Street
Boston, MA 02110
Vice President and Assistant Secretary (since 2011) | | Vice President and Chief Counsel, Ameriprise Financial since May 2010; Associate General Counsel, Bank of America from June 2005 to April 2010. | |
|
Annual Report 2012
43
Columbia High Yield Opportunity Fund
Board Consideration and Approval of
Advisory Agreement
On March 7, 2012, the Board of Trustees (the "Board") and the Trustees who are not interested persons (as defined in the Investment Company Act of 1940) of the Trust (the "Independent Trustees") unanimously approved the continuation of the Investment Management Services Agreement (the "Advisory Agreement") with Columbia Management Investment Advisers, LLC (the "Investment Manager") with respect to Columbia High Yield Opportunity Fund (the "Fund"), a series of the Trust. As detailed below, the Advisory Fees and Expenses Committee (the "Committee") and the Board met on multiple occasions to review and discuss, both among themselves and with the management team of the Investment Manager, materials provided by the Investment Manager before determining to approve the continuation of the Advisory Agreement.
In connection with their deliberations regarding the continuation of the Advisory Agreement, the Committee and the Board requested and evaluated materials from the Investment Manager regarding the Fund and the Advisory Agreement, and discussed these materials with representatives of the Investment Manager at the Committee meeting held on March 6, 2012 and at the Board meeting held on March 7, 2012. In addition, the Board considers matters bearing on the Agreement at most of its other meetings throughout the year and meets regularly with senior management of the Funds and the Investment Manager. Through the Board's Investment Oversight Committees, Trustees also meet with selected Fund portfolio managers and other investment personnel at various times throughout the year. The Committee and the Board also consulted with Fund counsel and with the Independent Trustees' independent legal counsel, who advised on the legal standard for consideration by the Board and otherwise assisted the Board in its deliberations. On March 6, 2012, the Committee recommended that the Board approve the continuation of the Advisory Agreement. On March 7, 2012, the Board, including the Independent Trustees, voting separately, unanimously approved the continuation of the Advisory Agreement for the Fund.
The Committee and the Board considered all information that they, their legal counsel, or the Investment Manager believed reasonably necessary to evaluate and to determine whether to approve the continuation of the Advisory Agreement. In their deliberations, the Trustees did not identify any particular information that was all-important or controlling, and individual Trustees may have attributed different weights to the various factors. The information and factors considered by the Committee and the Board in recommending for approval or approving the continuation of the Advisory Agreement for the Fund included the following:
• Information on the investment performance of the Fund relative to the performance of the Fund's benchmarks and the performance of a group of comparable mutual funds, as determined by an independent third-party data provider;
• Information on the Fund's advisory fees and total expenses, including information comparing the Fund's expenses to those of a group of comparable mutual funds, as determined by an independent third-party data provider;
• The Investment Manager's agreement to contractually limit or cap total operating expenses for the Fund so that total operating expenses (excluding certain fees and expenses, such as transaction costs and certain other investment related expenses, interest, taxes, acquired fund fees and expenses, and extraordinary expenses) would not exceed the median expenses of a group of comparable funds (as determined from time to time, generally annually, by an independent third-party data provider);
• The terms and conditions of the Advisory Agreement, including that the advisory fee rates payable by the Fund would not change;
• The terms and conditions of other agreements and arrangements with affiliates of the Investment Manager relating to the operations of the Fund, including the Administrative Services Agreement, the Distribution Agreement and the Transfer and Dividend Disbursing Agent Agreement, noting in the case of the Transfer and Dividend Disbursing Agent Agreement certain proposed changes to the fee rates payable thereunder;
• Descriptions of various functions performed by the Investment Manager under the Advisory Agreement, including portfolio management and portfolio trading practices;
• Information regarding the management fees and investment performance of any comparable portfolios of other clients of the Investment Manager, including institutional separate accounts; and
• The profitability to the Investment Manager and its affiliates from their relationships with the Fund.
Annual Report 2012
44
Columbia High Yield Opportunity Fund
Board Consideration and Approval of
Advisory Agreement (continued)
Nature, Extent and Quality of Services to be Provided under the Advisory Agreement
The Committee and the Board considered the nature, extent and quality of services provided to the Fund by the Investment Manager and its affiliates under the Advisory Agreement and under separate agreements for the provision of transfer agency and administrative services, and the resources dedicated to the Fund and the other Columbia Funds by the Investment Manager and its affiliates. The Committee and the Board considered, among other things, the Investment Manager's ability to attract, motivate and retain highly qualified research, advisory and supervisory investment professionals (including personnel and other resources, compensation programs for personnel involved in fund management, reputation and other attributes), the portfolio management services provided by those investment professionals, the quality of the Investment Manager's investment research capabilities and trade execution services, and the other resources that the Investment Manager devotes to the Fund. The Committee and the Board also considered the potential benefits to shareholders of investing in a mutual fund that is part of a fund complex offering exposure to a variety of asset classes and investment disciplines and providing a variety of fund and shareholder services.
The Committee and the Board also considered the professional experience and qualifications of the senior personnel of the Investment Manager. The Committee and the Board noted the compliance programs of and the compliance-related resources provided to the Fund by the Investment Manager and its affiliates, and considered the Investment Manager's ability to provide administrative services to the Fund pursuant to a separate administrative services agreement, including the Investment Manager's ability to coordinate the activities of the Fund's other service providers. After reviewing these and related factors, the Committee and the Board concluded, within the context of their overall conclusions, that the expected nature, extent and quality of the services to be provided to the Fund under the Advisory Agreement supported the continuation of such agreement.
Investment Performance
The Committee and the Board reviewed information about the performance of the Fund over various time periods, including performance information relative to benchmarks and information based on reports of an independent third-party data provider that compared the performance of the Fund to the performance of a group of comparable mutual funds. The Committee and the Board also reviewed a description of the third party's methodology for identifying the Fund's peer groups for purposes of performance and expense comparisons. In the case of each Fund whose performance lagged that of a relevant peer group for certain (although not necessarily all) periods, the Committee and the Board concluded that other factors relevant to performance were sufficient, in light of other considerations, to warrant continuation of the Fund's Advisory Agreement. Those factors varied from fund to fund, but included one or more of the following: (i) that the Fund's performance, although lagging in certain recent periods, was stronger over the longer term; (ii) that the underperformance was attributable, to a significant extent, to investment decisions that were reasonable and consistent with the Fund's investment strategy and policies and that the Fund was performing within a reasonable range of expectations, given those investment decisions, market conditions and the Fund's investment strategy; (iii) that the Fund's performance was competitive when compared to other relevant performance benchmarks or peer groups; and (iv) that the Investment Manager had taken or was taking steps designed to help improve the Fund's investment performance, including, but not limited to, replacing portfolio managers, enhancing the resources supporting the portfolio managers, or modifying investment strategies.
The Committee and the Board noted that, through December 31, 2011, the Fund's performance was in the third, forty-sixth and sixty-sixth percentiles (where the best performance would be in the first percentile) of its category selected by an independent third-party data provider for the purposes of performance comparisons for the one-, three- and five- year periods, respectively.
The Committee and the Board also considered the Investment Manager's performance and reputation generally, the Investment Manager's historical responsiveness to Board concerns about performance and the Investment Manager's willingness to take steps intended to improve performance. After reviewing these and related factors, the Committee and the Board concluded, within the context of their overall conclusions regarding the Advisory Agreement, that the performance of the Fund and the Investment Manager was sufficient, in light of other considerations, to warrant the continuation of the Advisory Agreement.
Annual Report 2012
45
Columbia High Yield Opportunity Fund
Board Consideration and Approval of
Advisory Agreement (continued)
Investment Advisory Fee Rates and Other Expenses
The Committee and the Board considered the advisory fees to be charged to the Fund under the Advisory Agreement as well as the total expenses to be incurred by the Fund. In assessing the reasonableness of the fees under the Advisory Agreement, the Committee and the Board considered, among other information, the Fund's advisory fee and its expected total expense ratio as a percentage of average daily net assets. The Committee and the Board noted that the Fund's actual management fee and total net expense ratio are ranked in the third and fourth-quintiles, respectively, against the Fund's expense universe as determined by an independent third-party data provider for purposes of expense comparison. The Committee and the Board also took into account the fee waiver and expense limitation arrangements agreed to by the Investment Manager, as noted above.
The Committee and the Board also considered the fact that the advisory fee rates payable by the Fund to the Investment Manager under the Advisory Agreement were the same as those currently paid by the Fund to the Investment Manager.
The Committee and the Board also received and considered information about the advisory fees charged by the Investment Manager to institutional separate accounts. In considering the fees charged to those accounts, the Committee and the Board took into account, among other things, the Investment Manager's representations about the differences between managing mutual funds as compared to other types of accounts, including differences in the services provided, differences in the risk profile of such business for the Investment Manager and the additional resources required to manage mutual funds effectively. In evaluating the Fund's advisory fees, the Committee and the Board also took into account the demands, complexity and quality of the investment management of the Fund.
After reviewing these and related factors, the Committee and the Board concluded, within the context of their overall conclusions, that the advisory fee rates and expenses of the Fund supported the continuation of the Advisory Agreement.
Costs of Services to be Provided and Profitability
The Committee and the Board also took note of the costs of the services provided (both on an absolute and relative basis) and the profitability to the Investment Manager and its affiliates in connection with their relationships with the Fund. In evaluating these considerations, the Committee and the Board took note of the advisory fees charged by the Investment Manager to other clients, including fees charged by the Investment Manager to any institutional separate account clients with similar investment strategies to those of the Fund.
The Committee and the Board also considered the compensation directly or indirectly received by the Investment Manager's affiliates in connection with their relationships with the Fund. The Committee and the Board reviewed information provided by management as to the profitability of the Investment Manager and its affiliates of their relationships with the Fund, and information about the allocation of expenses used to calculate profitability. When reviewing profitability, the Committee and the Board also considered court cases in which adviser profitability was an issue in whole or in part, the performance of the fund, the expense ratio of the fund, and the implementation of expense limitations with respect to the fund. The Committee and the Board also considered information provided by the Investment Manager regarding its financial condition and comparing its profitability to that of other asset management firms that are, or are subsidiaries of, publicly traded companies.
After reviewing these and related factors, the Committee and the Board concluded, within the context of their overall conclusions, that the profitability to the Investment Manager and its affiliates from their relationships with the Fund supported the continuation of the Advisory Agreement.
Economies of Scale
The Committee and the Board considered the potential existence of economies of scale in the provision by the Investment Manager of services to the Fund, to groups of related funds, and to the Investment Manager's investment advisory clients as a whole, and whether those economies of scale were shared with the Fund through breakpoints in investment advisory fees or other means, such as expense limitation arrangements and additional investments by the Investment Manager in investment, trading and compliance resources. The Committee and the Board noted that the investment advisory fee schedules for the Fund contained breakpoints that would reduce the fee rate on assets above specified threshold levels.
Annual Report 2012
46
Columbia High Yield Opportunity Fund
Board Consideration and Approval of
Advisory Agreement (continued)
In considering these issues, the Committee and the Board also considered the costs of the services provided (both on an absolute and relative basis) and the profitability to the Investment Manager and its affiliates from their relationships with the Fund, as discussed above. After reviewing these and related factors, the Committee and the Board concluded, within the context of their overall conclusions, that the extent to which economies of scale were expected to be shared with the Fund supported the continuation of the Advisory Agreement.
Other Benefits to the Investment Manager
The Committee and the Board received and considered information regarding "fall-out" or ancillary benefits received by the Investment Manager and its affiliates as a result of their relationships with the Fund, such as the engagement of the Investment Manager to provide administrative services to the Fund and the engagement of the Investment Manager's affiliates to provide distribution and transfer agency services to the Fund. The Committee and the Board considered that the Fund's distributor retains a portion of the distribution fees from the Fund and receives a portion of the sales charges on sales or redemptions of certain classes of shares of the Fund. The Committee and the Board also considered the benefits of research made available to the Investment Manager by reason of brokerage commissions generated by the Fund's securities transactions, and reviewed information about the Investment Manager's practices with respect to allocating portfolio brokerage for brokerage and research services. The Committee and the Board considered the possible conflicts of interest associated with certain fall-out or other ancillary benefits and the reporting, disclosure and other processes that would be in place to address such possible conflicts of interest. The Committee and the Board recognized that the Investment Manager's profitability would be somewhat lower without these benefits.
Conclusion
The Committee and the Board reviewed all of the above considerations in reaching their decisions to recommend or approve the continuation of the Advisory Agreement. No single item was identified as paramount or controlling, and individual Trustees may have attributed different weights to various factors. Based on their evaluation of all factors that they deemed to be material, including those factors described above, and assisted by the advice of independent legal counsel, the Board, including the Independent Trustees, voting separately, unanimously approved the continuation of the Advisory Agreement.
Annual Report 2012
47
This page intentionally left blank.
Annual Report 2012
48
Columbia High Yield Opportunity Fund
Important Information About This Report
Each fund mails one shareholder report to each shareholder address. If you would like more than one report, please call shareholder services at 800.345.6611 and additional reports will be sent to you.
The policy of the Board is to vote the proxies of the companies in which each fund holds investments consistent with the procedures as stated in the Statement of Additional Information (SAI). You may obtain a copy of the SAI without charge by calling 800.345.6611; contacting your financial intermediary; visiting columbiamanagement.com; or searching the website of the Securities and Exchange Commission (SEC) at http://www.sec.gov. Information regarding how each fund voted proxies relating to portfolio securities is filed with the SEC by August 31 for the most recent 12-month period ending June 30 of that year, and is available without charge by visiting columbiamanagement.com; or searching the website of the SEC at sec.gov.
Each fund files a complete schedule of portfolio holdings with the SEC for the first and third quarters of each fiscal year on Form N-Q. Each fund's Form N-Q is available on the SEC's website at sec.gov and may be reviewed and copied at the SEC's Public Reference Room in Washington, D.C. Information on the operation of the Public Reference Room may be obtained by calling 800.SEC.0330. Each fund's complete schedule of portfolio holdings, as filed on Form N-Q, can also be obtained without charge, upon request, by calling 800.345.6611.
Annual Report 2012
49

Columbia High Yield Opportunity Fund
P.O. Box 8081
Boston, MA 02266-8081
columbiamanagement.com
This information is for use with concurrent or prior delivery of a fund prospectus. Please read and consider the investment objectives, risks, charges and expenses for any fund carefully before investing. For a prospectus which contains this and other important information about the fund go to columbiamanagement.com. The fund is distributed by Columbia Management Investment Distributors, Inc., member FINRA, and managed by Columbia Management Investment Advisers, LLC.
© 2012 Columbia Management Investment Advisers, LLC. All rights reserved.
C-1041 D (7/12)
Annual Report
May 31, 2012

Columbia International Bond Fund
Not FDIC insured • No bank guarantee • May lose value
Columbia International Bond Fund
President's Message
 Dear Shareholders,
A stock market rally that commenced in the fourth quarter of 2011 continued into 2012 in the United States and around the world, as all major market regions generated double-digit returns for the three-month period ended March 31, 2012. Volatility declined sharply as European debt fears quieted somewhat and sentiment improved. Returns in developed countries were buoyed by strong results in Germany, Belgium, Austria and the Nordic markets of Denmark, Finland, Norway and Sweden. Under the cloud of its own mounting debt problem, Spain was the only eurozone country to deliver a negative return during the three-month period. Solid economic growth and accommodative monetary policy helped boost gains in emerging markets. The rally in U.S. equities was largely driven by an expansion in "multiples" — an increase in stock prices relative to their earnings. By the end of the first quarter of 2012, stocks no longer appeared as cheap as they were late in 2011. Bonds lagged stocks during the first quarter as investors responded to signs of an improved environment with a greater appetite for risk.
Concerns around the health of the global economy were centered in news headlines focusing on Washington D.C., Europe, China and the Middle East. In the United States, economic indicators remained mixed but generally indicated support for slow, sustainable economic growth. European policymakers have made progress in containing the eurozone debt crisis, though they still have not solved the issue of long-term solvency. The European Central Bank has lowered interest rates and flooded the financial system with liquidity that may provide breathing space for a restructuring of fiscal balance sheets. These massive infusions of liquidity may whet the appetite for risk from investors around the world. However, they have delayed a true reckoning with the European financial situation, as concerns about Greece, Spain and Portugal continue to cloud the outlook. The structural challenges that persist in the developed world, and slower growth in emerging market economies, leave the global economy in a fragile state. Domestic demand, combined with slowing inflationary trends, has also helped to shore up emerging market economies. Joblessness remains relatively low and monetary conditions remain easy.
Despite the challenges and surprises of 2011, we see pockets of strength — and as a result, attractive opportunities — both here and abroad for 2012. We hope to help you capitalize on these opportunities with various articles in our 2012 Perspectives, which is available via the Market Insights tab at columbiamanagement.com. This publication showcases the strong research capabilities and experienced investment teams of Columbia Management and offers a diverse array of investment ideas based on our five key themes for 2012.
Other information and resources available at columbiamanagement.com include:
> detailed up-to-date fund performance and portfolio information
> economic analysis and market commentary
> quarterly fund commentaries
> Columbia Management Investor, our award-winning quarterly newsletter for shareholders
Thank you for your continued support of the Columbia Funds. We look forward to serving your investment needs for many years to come.
Best Regards,

J. Kevin Connaughton
President, Columbia Funds
Investors should consider the investment objectives, risks, charges and expenses of a mutual fund carefully before investing. For a free prospectus, which contains this and other important information about the funds, visit columbiamanagement.com. The prospectus should be read carefully before investing.
Columbia Funds are distributed by Columbia Management Investment Distributors, Inc., member FINRA, and managed by Columbia Management Investment Advisers, LLC.
© 2012 Columbia Management Investment Advisers, LLC. All rights reserved.
Annual Report 2012
Columbia International Bond Fund
Table of Contents
| Performance Overview | | | 2 | | |
|
| Manager Discussion of Fund Performance | | | 4 | | |
|
| Understanding Your Fund's Expenses | | | 6 | | |
|
| Portfolio of Investments | | | 7 | | |
|
| Statement of Assets and Liabilities | | | 14 | | |
|
| Statement of Operations | | | 16 | | |
|
| Statement of Changes in Net Assets | | | 17 | | |
|
| Financial Highlights | | | 19 | | |
|
| Notes to Financial Statements | | | 23 | | |
|
Report of Independent Registered
Public Accounting Firm | | | 32 | | |
|
| Board Members and Officers | | | 33 | | |
|
Board Consideration and Approval of
Advisory Agreement | | | 36 | | |
|
| Important Information About This Report | | | 41 | | |
|
Fund Investment Manager
Columbia Management Investment
Advisers, LLC
225 Franklin Street
Boston, MA 02110
Fund Distributor
Columbia Management Investment
Distributors, Inc.
225 Franklin Street
Boston, MA 02110
Fund Transfer Agent
Columbia Management Investment
Services Corp.
P.O. Box 8081
Boston, MA 02266-8081
For more information about any of the funds, please visit columbiamanagement.com or call 800.345.6611. Customer Service Representatives are available to answer your questions Monday through Friday from 8 a.m. to 8 p.m. Eastern time.
The views expressed in this report reflect the current views of the respective parties. These views are not guarantees of future performance and involve certain risks, uncertainties and assumptions that are difficult to predict, so actual outcomes and results may differ significantly from the views expressed. These views are subject to change at any time based upon economic, market or other conditions and the respective parties disclaim any responsibility to update such views. These views may not be relied on as investment advice and, because investment decisions for a Columbia Fund are based on numerous factors, may not be relied on as an indication of trading intent on behalf of any particular Columbia Fund. References to specific securities should not be construed as a recommendation or investment advice.
Annual Report 2012
Columbia International Bond Fund
Performance Overview
Performance Summary
> For the 12-month period that ended May 31, 2012, Columbia International Bond Fund (the fund) Class A shares returned -1.40% excluding sales charges.
> The fund's benchmark, the Citigroup Non-U.S. Dollar World Government Bond Index returned 0.62% for the same period.
> Currency positioning generally accounted for the shortfall relative to the index.
Average Annual Total Returns (%) (for period ended May 31, 2012)
| | | Inception | | 1 Year | | Life | |
| Class A | | 12/01/08 | | | | | | | | | |
| Excluding sales charges | | | | | | | -1.40 | | | | 5.47 | | |
| Including sales charges | | | | | | | -6.05 | | | | 4.01 | | |
| Class C | | 12/01/08 | | | | | | | | | |
| Excluding sales charges | | | | | | | -2.10 | | | | 4.67 | | |
| Including sales charges | | | | | | | -3.06 | | | | 4.67 | | |
| Class I* | | 09/27/10 | | | -0.95 | | | | 5.61 | | |
| Class Z | | 12/01/08 | | | -1.06 | | | | 5.74 | | |
| Citigroup Non-U.S. Dollar World Government Bond Index | | | | | | | 0.62 | | | | 6.40 | ** | |
Returns for Class A are shown with and without the maximum initial sales charge of 4.75%. Returns for Class C are shown with and without the applicable contingent deferred sales charge (CDSC) of 1.00% for the first year only. The fund's other classes are not subject to sales charges and have limited eligibility. Please see the fund's prospectuses for details. Performance for different share classes will vary based on differences in sales charges and fees associated with each class. All results shown assume reinvestment of distributions during the period. Returns do not reflect the deduction of taxes that a shareholder may pay on fund distributions or on the redemption of fund shares. Performance results reflect the effect of any fee waivers or reimbursements of fund expenses by Columbia Management Investment Advisers, LLC and/or any of its affiliates. Absent these fee waivers or expense reimbursement arrangements, performance results would have been lower.
The performance information shown represents past performance and is not a guarantee of future results. The investment return and principal value of your investment will fluctuate so that your shares, when redeemed, may be worth more or less than their original cost. Current performance may be lower or higher than the performance information shown. You may obtain performance information current to the most recent month-end by contacting your financial intermediary, visiting columbiamanagement.com or calling 800.345.6611.
* The returns shown for periods prior to the share class inception date (including returns since inception if shown, which are since fund inception) include the returns of the fund's oldest share class. Since the fund launched more than one share class at its inception, Class A shares were used. These returns are adjusted to reflect any higher class-related operating expenses of the newer share classes, as applicable. Please visit columbiamanagement.com/mutual-funds/appended-performance for more information.
**From 12/01/08, which is the life of the fund, not the index.
The Citigroup Non-U.S. Dollar World Government Bond Index is calculated on a market-weighted basis and includes investment-grade, fixed-rate bonds, issued by governments outside of the United States, with a remaining maturity of one year or longer and with amounts outstanding of at least the equivalent of U.S. $25 million. The index excludes floating or variable rate bonds, securities aimed principally at non-institutional investors and private placement-type securities. The number of countries will fluctuate depending on whether a country is meeting the inclusion criteria — market size, credit and lack of barriers-to-entry.
Indices are not available for investment, are not professionally managed and do not reflect sales charges, fees, brokerage commissions, taxes or other expenses of investing. Securities in the fund may not match those in an index.
Annual Report 2012
2
Columbia International Bond Fund
Performance Overview (continued)
Performance of a Hypothetical $10,000 Investment (December 1, 2008 – May 31, 2012)
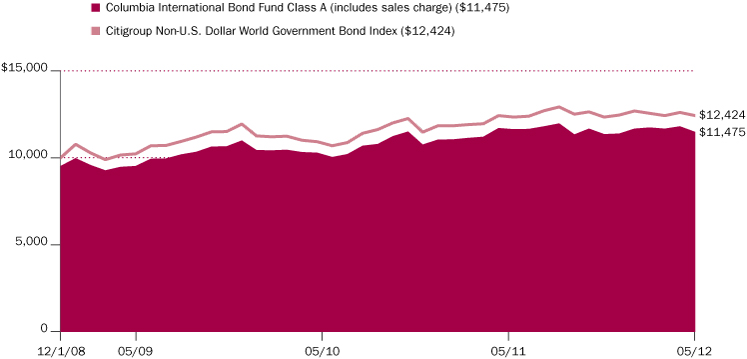
The chart above shows the change in value of a hypothetical $10,000 investment in Class A shares of Columbia International Bond Fund during the stated time period, and does not reflect the deduction of taxes that a shareholder may pay on fund distributions or on the redemption of fund shares.
Annual Report 2012
3
Columbia International Bond Fund
Manager Discussion of Fund Performance
For the 12-month period that ended May 31, 2012, the fund's Class A shares returned -1.40% without sales charge. The fund underperformed its benchmark, the Citigroup Non-U.S. Dollar World Government Bond Index, which returned 0.62% over the same period. Currency positioning generally accounted for the fund's shortfall relative to the index. The fund benefited from its higher-than-index yield and its underweight in eurozone peripheral bond markets, given a renewed market focus on the fiscal challenges in southern Europe and political uncertainty in Greece.
Global Economy Loses Momentum
Economic data over the past three months appears to show a softening trend in global economic activity, largely reversing the improvement seen over the prior six months. On balance, key indicators suggest the global economy is still expanding, but at a much slower pace than seen late last year and early this year. For the third year running, the global economy appears to be falling into a mid-year lull.
While the eurozone is finally taking more concrete steps toward resolving its debt crisis, helping to attempt to stabilize confidence in the region, the countries with larger or more mature economies ultimately need to execute on their austerity plans in order to restore investor confidence fully. Moreover, the challenges facing southern Europe are not just about reining in budget deficits — a hard enough task in an environment of weak growth — but also about restoring the competitiveness lost through years of wage growth outpacing productivity gains. Solving the competitiveness problem requires restraining nominal wage growth while embarking on supply side reforms to help boost economic efficiency. On both fronts, success will be measured over a period of years, not just a few months, and the likelihood of set-backs and slippage along the way is high.
Against this backdrop, we expect markets to remain choppy along the way. While the broad trajectory of global growth may be muted, short-run patterns of activity remain more volatile. Indeed, the vagaries of weather, geopolitical risk, commodity price swings and policy shocks can all exert an outsize influence over short-term fiscal periods.
Solid Returns from International Government Bond Markets
International government bonds posted positive returns amid a sell-off in riskier assets, with the Citigroup Non-U.S. Dollar World Government Bond Index gaining 6.7%, as measured in local currencies. Benchmark yields in the main "flight-to-safety" markets reached record lows across some points of the curve, and the German two-year yield fell to zero at the end of May. In contrast, eurozone peripheral government bonds performed more poorly than expected, reflecting a renewed focus on the region's fiscal challenges, which pushed yields and spreads (the yield difference between eurozone government bonds and German bunds of similar maturities; German bunds serve as the benchmark for all euro issuance) higher. In any event, the U.S. dollar's relative strength over the last twelve months had a negative impact on dollar-based international bond investors due to negative currency returns on non-dollar denominated bonds.
Portfolio Management
Nicholas Pifer, CFA
C. Michael Ng, CFA
Quality Breakdown (%)
(at May 31, 2012) | |
| A rating | | | 9.9 | | |
| AA rating | | | 14.5 | | |
| AAA rating | | | 59.3 | | |
| BBB rating | | | 11.3 | | |
| Non-investment grade | | | 5.0 | | |
Percentages indicated are based upon total fixed income securities.
Bond ratings apply to the underlying holdings of the Fund and not the Fund itself and are divided into categories ranging from AAA (highest) to D (lowest), and are subject to change. The ratings shown are determined by using the middle rating of Moody's, S&P, and Fitch after dropping the highest and lowest available ratings. When a rating from only two agencies is available, the lower rating is used. When a rating from only one agency is available, that rating is used. When a bond is not rated by one of these agencies, it is designated as Not rated. Credit ratings are subjective opinions and not statements of fact.
Annual Report 2012
4
Columbia International Bond Fund
Manager Discussion of Fund Performance (continued)
Country Allocations Aided Performance
During the 12-month period ended May 31, 2012, the fund's country positioning was favorable. Near the end of 2011, bond weights in Italy, Spain, and Ireland were cut to zero. Currently, the fund has no exposure in southern Europe. Meanwhile, on a duration-to-contribution basis, the fund had more bond exposure than that of the index in Australia, Canada, Sweden, Norway and Mexico, all of which recorded positive returns, measured in local currencies. The fund also benefited from its exposure to emerging market bonds, which accounted for approximately 10% of the fund's assets.
Looking Ahead
Over the next year, we expect the U.K. and eurozone economies to remain largely stagnant as austerity efforts restrain business and consumer confidence. We expect the U.S. economy to expand at a pace of 2.0% to 2.25% and Japan by an above-trend — and largely unsustainable — pace of 2.0% plus. Japan's growth reflects reconstruction spending related to the 2011 tsunami and nuclear disaster.With expectations that emerging market economies will expand at a trend-like pace, we see the global economy expanding at 3.0% to 3.5% in the year ahead.
We expect the U.S. dollar to trade within a narrow range through 2012 and much of 2013. With the Federal Reserve Board now talking about keeping rates exceptionally low through 2014, the dollar-supportive environment appears to remain a long way off. But the U.S. dollar is already cheap by historical standards, especially against the major currencies of economies with more accommodative monetary policy. Occasional bouts of U.S. dollar strength during periods of "risk-off" behavior remain likely as long as we continue to grind through this muddled global economic environment.
Country Breakdown (%)
(at May 31, 2012) | |
| Argentina | | | 0.4 | | |
| Australia | | | 5.5 | | |
| Austria | | | 0.4 | | |
| Belgium | | | 0.2 | | |
| Brazil | | | 0.6 | | |
| Bulgaria | | | 0.1 | | |
| Canada | | | 9.2 | | |
| China | | | 0.1 | | |
| Colombia | | | 0.9 | | |
| Denmark | | | 0.2 | | |
| Dominican Republic | | | 0.3 | | |
| Finland | | | 0.3 | | |
| France | | | 10.6 | | |
| Germany | | | 13.9 | | |
| Hungary | | | 0.1 | | |
| Indonesia | | | 1.4 | | |
| Japan | | | 11.9 | | |
| Kazakhstan | | | 0.4 | | |
| Lithuania | | | 0.2 | | |
| Mexico | | | 5.5 | | |
| Netherlands | | | 4.1 | | |
| New Zealand | | | 1.0 | | |
| Norway | | | 5.9 | | |
| Panama | | | 0.1 | | |
| Peru | | | 0.6 | | |
| Philippines | | | 0.2 | | |
| Poland | | | 4.8 | | |
| Russian Federation | | | 1.9 | | |
| South Africa | | | 0.3 | | |
| Supra-National | | | 3.7 | | |
| Sweden | | | 4.1 | | |
| Turkey | | | 0.7 | | |
| Ukraine | | | 0.2 | | |
| United Kingdom | | | 9.1 | | |
| Uruguay | | | 0.3 | | |
| Venezuela | | | 0.8 | | |
Percentages indicated are based upon total investments. The Fund's portfolio composition is subject to change.
Annual Report 2012
5
Columbia International Bond Fund
Understanding Your Fund's Expenses
(Unaudited)
As an investor, you incur two types of costs. There are transaction costs, which generally include sales charges on purchases and may include redemption fees. There are also ongoing costs, which generally include management fees, distribution and service (Rule 12b-1) fees, and other fund expenses. The following information is intended to help you understand your ongoing costs (in dollars) of investing in the Fund and to help you compare these costs with the ongoing costs of investing in other mutual funds.
Analyzing Your Fund's Expenses
To illustrate these ongoing costs, we have provided examples and calculated the expenses paid by investors in each share class of the Fund during the period. The actual and hypothetical information in the table is based on an initial investment of $1,000 at the beginning of the period indicated and held for the entire period. Expense information is calculated two ways and each method provides you with different information. The amount listed in the "Actual" column is calculated using the Fund's actual operating expenses and total return for the period. You may use the Actual information, together with the amount invested, to estimate the expenses that you paid over the period. Simply divide your account value by $1,000 (for example, an $8,600 account value divided by $1,000 = 8.6), then multiply the results by the expenses paid during the period under the Actual column. The amount listed in the "Hypothetical" column assumes a 5% annual rate of return before expenses (which is not the Fund's actual return) and then applies the Fund's actual expense ratio for the period to the hypothetical return. You should not use the hypothetical account values and expenses to estimate either your actual account balance at the end of the period or the expenses you paid during the period. See "Compare With Other Funds" below for details on how to use the hypothetical data.
Compare With Other Funds
Since all mutual funds are required to include the same hypothetical calculations about expenses in shareholder reports, you can use this information to compare the ongoing cost of investing in the Fund with other funds. To do so, compare the hypothetical example with the 5% hypothetical examples that appear in the shareholder reports of other funds. As you compare hypothetical examples of other funds, it is important to note that hypothetical examples are meant to highlight the ongoing costs of investing in a fund only and do not reflect any transaction costs, such as sales charges, or redemption or exchange fees. Therefore, the hypothetical calculations are useful in comparing ongoing costs only, and will not help you determine the relative total costs of owning different funds. If transaction costs were included in these calculations, your costs would be higher.
December 1, 2011 – May 31, 2012
| | | Account Value at the Beginning
of the Period ($) | | Account Value at the End of the
Period ($) | | Expenses Paid During the
Period ($) | | Fund's Annualized
Expense Ratio (%) | |
| | | Actual | | Hypothetical | | Actual | | Hypothetical | | Actual | | Hypothetical | | Actual | |
| Class A | | | 1,000.00 | | | | 1,000.00 | | | | 1,010.00 | | | | 1,019.35 | | | | 5.68 | | | | 5.70 | | | | 1.13 | | |
| Class C | | | 1,000.00 | | | | 1,000.00 | | | | 1,006.60 | | | | 1,015.80 | | | | 9.23 | | | | 9.27 | | | | 1.84 | | |
| Class I | | | 1,000.00 | | | | 1,000.00 | | | | 1,012.30 | | | | 1,020.95 | | | | 4.07 | | | | 4.09 | | | | 0.81 | | |
| Class Z | | | 1,000.00 | | | | 1,000.00 | | | | 1,012.20 | | | | 1,020.75 | | | | 4.28 | | | | 4.29 | | | | 0.85 | | |
Expenses paid during the period are equal to the annualized expense ratio for each class as indicated above, multiplied by the average account value over the period and then multiplied by the number of days in the Fund's most recent fiscal half year and divided by 366.
Expenses do not include fees and expenses incurred indirectly by the Fund from the underlying funds in which the Fund may invest (also referred to as "acquired funds"), including affiliated and non-affiliated pooled investment vehicles (including mutual funds and exchange traded funds).
Had Columbia Management Investment Advisers, LLC and/or certain of its affiliates not waived/reimbursed certain fees and expenses, account value at the end of the period would have been reduced.
Annual Report 2012
6
Columbia International Bond Fund
Portfolio of Investments
May 31, 2012
(Percentages represent value of investments compared to net assets)
Corporate Bonds & Notes(a) 3.7%
| Issuer | | Coupon
Rate | | Principal
Amount | | Value ($) | |
| Supra-National 3.6% | |
Asian Development Bank
Senior Unsecured
06/21/27 | | | 2.350 | % | | JPY | 50,000,000 | | | | 727,376 | | |
Eurofima
Senior Unsecured
10/21/19 | | | 4.375 | % | | EUR | 100,000 | | | | 143,147 | | |
European Investment Bank
Senior Unsecured
06/20/17 | | | 1.400 | % | | JPY | 49,000,000 | | | | 658,475 | | |
Nordic Investment Bank
Senior Unsecured
04/27/17 | | | 1.700 | % | | JPY | 50,000,000 | | | | 688,466 | | |
| Total | | | | | | | 2,217,464 | | |
| Ukraine 0.1% | |
MHP SA(b)
04/29/15 | | | 10.250 | % | | | 100,000 | | | | 97,557 | | |
Total Corporate Bonds & Notes
(Cost: $1,878,706) | | | | | | | 2,315,021 | | |
Inflation-Indexed Bonds(a) 0.2%
| Uruguay 0.2% | |
Uruguay Government International Bond
04/05/27 | | | 4.250 | % | | UYU | 1,300,000 | | | | 94,975 | | |
Total Inflation-Indexed Bonds
(Cost: $109,132) | | | | | | | 94,975 | | |
Foreign Government Obligations(a) 92.6%
| Argentina 0.4% | |
Argentina Boden Bonds
Senior Unsecured
10/03/15 | | | 7.000 | % | | | 100,000 | | | | 75,750 | | |
Argentina Bonar Bonds
Senior Unsecured
04/17/17 | | | 7.000 | % | | | 220,000 | | | | 146,300 | | |
Argentine Republic Government International Bond
Senior Unsecured
12/31/33 | | | 8.280 | % | | | 53,353 | | | | 31,478 | | |
| Total | | | | | | | 253,528 | | |
| Australia 5.3% | |
Treasury Corp. of Victoria
11/15/18 | | | 5.500 | % | | AUD | 1,500,000 | | | | 1,616,251 | | |
Local Government Guaranteed
11/15/16 | | | 5.750 | % | | AUD | 795,000 | | | | 853,360 | | |
| 06/15/20 | | | 6.000 | % | | AUD | 720,000 | | | | 803,076 | | |
| Total | | | | | | | 3,272,687 | | |
Foreign Government Obligations(a) (continued)
| Issuer | | Coupon
Rate | | Principal
Amount | | Value ($) | |
| Austria 0.4% | |
Austria Government Bond
Senior Unsecured(b)
09/15/17 | | | 4.300 | % | | EUR | 170,000 | | | | 241,105 | | |
| Belgium 0.2% | |
Belgium Government Bond
03/28/15 | | | 3.500 | % | | EUR | 75,000 | | | | 98,404 | | |
| Brazil 0.6% | |
Brazilian Government International Bond
01/20/34 | | | 8.250 | % | | | 70,000 | | | | 106,575 | | |
Senior Unsecured
02/03/15 | | | 7.375 | % | | EUR | 30,000 | | | | 42,711 | | |
| 03/07/15 | | | 7.875 | % | | | 50,000 | | | | 58,625 | | |
Petrobras International Finance Co.
01/27/21 | | | 5.375 | % | | | 150,000 | | | | 160,557 | | |
| Total | | | | | | | 368,468 | | |
| Bulgaria 0.1% | |
Bulgaria Government International Bond
Senior Unsecured
01/15/15 | | | 8.250 | % | | | 60,000 | | | | 67,350 | | |
| Canada 8.9% | |
Canadian Government Bond
08/01/14 | | | 2.250 | % | | CAD | 1,600,000 | | | | 1,587,917 | | |
Province of Ontario
06/02/19 | | | 4.400 | % | | CAD | 2,800,000 | | | | 3,063,341 | | |
Province of Quebec
12/01/17 | | | 4.500 | % | | CAD | 700,000 | | | | 761,952 | | |
Senior Unsecured
04/29/19 | | | 5.000 | % | | EUR | 50,000 | | | | 75,303 | | |
| Total | | | | | | | 5,488,513 | | |
| China 0.1% | |
China Government International Bond
Senior Unsecured
10/29/13 | | | 4.750 | % | | | 50,000 | | | | 52,481 | | |
| Colombia 0.9% | |
Colombia Government International Bond
Senior Unsecured
07/12/21 | | | 4.375 | % | | | 200,000 | | | | 218,200 | | |
| 05/21/24 | | | 8.125 | % | | | 50,000 | | | | 70,500 | | |
Ecopetrol SA
Senior Unsecured
07/23/19 | | | 7.625 | % | | | 45,000 | | | | 55,575 | | |
The accompanying Notes to Financial Statements are an integral part of this statement.
Annual Report 2012
7
Columbia International Bond Fund
Portfolio of Investments (continued)
May 31, 2012
Foreign Government Obligations(a) (continued)
| Issuer | | Coupon
Rate | | Principal
Amount | | Value ($) | |
Empresas Publicas de Medellin ESP
Senior Unsecured(b)
02/01/21 | | | 8.375 | % | | COP | 340,000,000 | | | | 198,104 | | |
| Total | | | | | | | 542,379 | | |
| Denmark 0.2% | |
Denmark Government Bond
11/15/13 | | | 5.000 | % | | DKK | 695,000 | | | | 124,105 | | |
| Dominican Republic 0.2% | |
Dominican Republic International Bond
Senior Unsecured(b)
05/06/21 | | | 7.500 | % | | | 150,000 | | | | 156,771 | | |
| Finland 0.3% | |
Finland Government Bon
Senior Unsecured
07/04/15 | | | 4.250 | % | | EUR | 145,000 | | | | 200,675 | | |
| France 10.2% | |
France Government Bond OAT
04/25/17 | | | 3.750 | % | | EUR | 350,000 | | | | 483,843 | | |
| 10/25/18 | | | 4.250 | % | | EUR | 770,000 | | | | 1,100,539 | | |
| 04/25/19 | | | 4.250 | % | | EUR | 228,000 | | | | 326,913 | | |
| 10/25/20 | | | 2.500 | % | | EUR | 1,500,000 | | | | 1,908,538 | | |
| 04/25/29 | | | 5.500 | % | | EUR | 420,000 | | | | 688,891 | | |
French Treasury Note BTAN
02/25/16 | | | 2.250 | % | | EUR | 1,400,000 | | | | 1,817,656 | | |
| Total | | | | | | | 6,326,380 | | |
| Germany 13.4% | |
Bundesobligation
04/08/16 | | | 2.750 | % | | EUR | 1,600,000 | | | | 2,174,583 | | |
Bundesrepublik Deutschland
07/04/14 | | | 4.250 | % | | EUR | 200,000 | | | | 269,088 | | |
| 07/04/17 | | | 4.250 | % | | EUR | 555,000 | | | | 819,530 | | |
| 01/04/19 | | | 3.750 | % | | EUR | 640,000 | | | | 948,760 | | |
| 07/04/21 | | | 3.250 | % | | EUR | 1,600,000 | | | | 2,356,669 | | |
| 07/04/28 | | | 4.750 | % | | EUR | 700,000 | | | | 1,224,326 | | |
| 07/04/42 | | | 3.250 | % | | EUR | 300,000 | | | | 498,970 | | |
| Total | | | | | | | 8,291,926 | | |
| Hungary 0.1% | |
Hungary Government International Bond
Senior Unsecured
07/18/16 | | | 3.500 | % | | EUR | 40,000 | | | | 41,898 | | |
| Indonesia 1.4% | |
Indonesia Government International Bond
Senior Unsecured
04/20/15 | | | 7.250 | % | | | 38,000 | | | | 42,275 | | |
Foreign Government Obligations(a) (continued)
| Issuer | | Coupon
Rate | | Principal
Amount | | Value ($) | |
Indonesia Government International Bond(b)
Senior Unsecured
04/20/15 | | | 7.250 | % | | | 80,000 | | | | 89,000 | | |
Indonesia Treasury Bond
Senior Unsecured
09/15/25 | | | 11.000 | % | | IDR | 1,330,000,000 | | | | 190,044 | | |
Majapahit Holding BV(b)
08/07/19 | | | 8.000 | % | | | 450,000 | | | | 518,625 | | |
| Total | | | | | | | 839,944 | | |
| Japan 11.4% | |
Development Bank of Japan
Government Guaranteed
03/17/17 | | | 1.750 | % | | JPY | 10,000,000 | | | | 136,777 | | |
Japan Government 10-Year Bond
Senior Unsecured
09/20/18 | | | 1.500 | % | | JPY | 5,900,000 | | | | 80,463 | | |
| 12/20/18 | | | 1.400 | % | | JPY | 105,000,000 | | | | 1,424,283 | | |
| 06/20/20 | | | 1.100 | % | | JPY | 150,500,000 | | | | 1,996,652 | | |
Japan Government 20-Year Bond
Senior Unsecured
12/20/22 | | | 1.400 | % | | JPY | 70,000,000 | | | | 937,014 | | |
| 09/20/23 | | | 1.900 | % | | JPY | 29,000,000 | | | | 406,043 | | |
| 06/20/25 | | | 1.900 | % | | JPY | 50,000,000 | | | | 693,985 | | |
| 09/20/29 | | | 2.100 | % | | JPY | 80,000,000 | | | | 1,114,381 | | |
Japan Government 30-Year Bond
Senior Unsecured
09/20/40 | | | 2.000 | % | | JPY | 20,000,000 | | | | 267,169 | | |
| Total | | | | | | | 7,056,767 | | |
| Kazakhstan 0.3% | |
KazMunayGas National Co.
Senior Unsecured(b)
05/05/20 | | | 7.000 | % | | | 200,000 | | | | 219,149 | | |
| Lithuania 0.2% | |
Lithuania Government International Bond
Senior Unsecured(b)
03/09/21 | | | 6.125 | % | | | 120,000 | | | | 126,092 | | |
| Mexico 5.3% | |
Comision Federal de Electricidad
Senior Unsecured(b)
05/26/21 | | | 4.875 | % | | | 200,000 | | | | 209,500 | | |
Mexican Bonos
12/13/18 | | | 8.500 | % | | MXN | 720,500 | | | | 588,104 | | |
| 06/11/20 | | | 8.000 | % | | MXN | 600,000 | | | | 476,947 | | |
| 05/31/29 | | | 8.500 | % | | MXN | 1,900,000 | | | | 1,520,984 | | |
The accompanying Notes to Financial Statements are an integral part of this statement.
Annual Report 2012
8
Columbia International Bond Fund
Portfolio of Investments (continued)
May 31, 2012
Foreign Government Obligations(a) (continued)
| Issuer | | Coupon
Rate | | Principal
Amount | | Value ($) | |
Mexico Government International Bond
Senior Unsecured
01/15/17 | | | 5.625 | % | | | 90,000 | | | | 103,050 | | |
| 01/11/40 | | | 6.050 | % | | | 40,000 | | | | 48,700 | | |
Pemex Project Funding Master Trust
01/21/21 | | | 5.500 | % | | | 300,000 | | | | 330,000 | | |
| 02/24/25 | | | 5.500 | % | | EUR | 20,000 | | | | 25,919 | | |
| Total | | | | | | | 3,303,204 | | |
| Netherlands 4.0% | |
Bank Nederlandse Gemeenten
Senior Unsecured
11/07/16 | | | 1.850 | % | | JPY | 18,000,000 | | | | 241,868 | | |
Netherlands Government Bond
07/15/16 | | | 4.000 | % | | EUR | 240,000 | | | | 336,704 | | |
| 07/15/18 | | | 4.000 | % | | EUR | 800,000 | | | | 1,157,187 | | |
| 07/15/20 | | | 3.500 | % | | EUR | 500,000 | | | | 718,326 | | |
| Total | | | | | | | 2,454,085 | | |
| New Zealand 1.0% | |
New Zealand Government Bond
Senior Unsecured
04/15/13 | | | 6.500 | % | | NZD | 55,000 | | | | 42,948 | | |
| 12/15/17 | | | 6.000 | % | | NZD | 500,000 | | | | 438,494 | | |
| 05/15/21 | | | 6.000 | % | | NZD | 150,000 | | | | 136,392 | | |
| Total | | | | | | | 617,834 | | |
| Norway 5.7% | |
Eksportfinans ASA
03/20/14 | | | 1.600 | % | | JPY | 65,000,000 | | | | 762,034 | | |
Norway Government Bond
05/15/15 | | | 5.000 | % | | NOK | 2,300,000 | | | | 415,137 | | |
| 05/19/17 | | | 4.250 | % | | NOK | 5,240,000 | | | | 970,316 | | |
| 05/22/19 | | | 4.500 | % | | NOK | 7,000,000 | | | | 1,354,348 | | |
| Total | | | | | | | 3,501,835 | | |
| Panama 0.1% | |
Panama Government International Bond
Senior Unsecured
01/26/36 | | | 6.700 | % | | | 65,000 | | | | 84,013 | | |
| Peru 0.6% | |
Peruvian Government International Bond
Senior Unsecured
07/21/25 | | | 7.350 | % | | | 200,000 | | | | 274,500 | | |
| 11/21/33 | | | 8.750 | % | | | 27,000 | | | | 42,660 | | |
| 03/14/37 | | | 6.550 | % | | | 45,000 | | | | 58,500 | | |
| Total | | | | | | | 375,660 | | |
Foreign Government Obligations(a) (continued)
| Issuer | | Coupon
Rate | | Principal
Amount | | Value ($) | |
| Philippines 0.2% | |
Philippine Government International Bond
Senior Unsecured
03/17/15 | | | 8.875 | % | | | 105,000 | | | | 123,637 | | |
| Poland 4.6% | |
Poland Government Bond
10/24/15 | | | 6.250 | % | | PLN | 2,300,000 | | | | 675,841 | | |
| 10/25/19 | | | 5.500 | % | | PLN | 7,300,000 | | | | 2,087,420 | | |
Poland Government International Bond
Senior Unsecured
10/19/15 | | | 5.000 | % | | | 50,000 | | | | 53,729 | | |
| Total | | | | | | | 2,816,990 | | |
| Russian Federation 1.8% | |
Gazprom OAO Via Gaz Capital SA(b)
Senior Unsecured
04/11/18 | | | 8.146 | % | | | 200,000 | | | | 234,552 | | |
| 03/07/22 | | | 6.510 | % | | | 400,000 | | | | 431,916 | | |
Gazprom OAO Via Gazprom International SA
Senior Unsecured
02/01/20 | | | 7.201 | % | | | 15,514 | | | | 16,911 | | |
Russian Foreign Bond - Eurobond(b)
Senior Unsecured
04/29/20 | | | 5.000 | % | | | 100,000 | | | | 106,625 | | |
Russian Foreign Bond - Eurobond(b)(c)
Senior Unsecured
03/31/30 | | | 7.500 | % | | | 161,000 | | | | 189,376 | | |
Russian Foreign Bond - Eurobond(c)
Senior Unsecured
03/31/30 | | | 7.500 | % | | | 114,310 | | | | 134,457 | | |
| Total | | | | | | | 1,113,837 | | |
| South Africa 0.3% | |
South Africa Government International Bond
05/16/13 | | | 5.250 | % | | EUR | 50,000 | | | | 64,020 | | |
Senior Unsecured
03/08/41 | | | 6.250 | % | | | 120,000 | | | | 140,550 | | |
| Total | | | | | | | 204,570 | | |
| Sweden 4.0% | |
Sweden Government Bond
10/08/12 | | | 5.500 | % | | SEK | 2,775,000 | | | | 387,374 | | |
| 08/12/17 | | | 3.750 | % | | SEK | 13,180,000 | | | | 2,064,676 | | |
| Total | | | | | | | 2,452,050 | | |
The accompanying Notes to Financial Statements are an integral part of this statement.
Annual Report 2012
9
Columbia International Bond Fund
Portfolio of Investments (continued)
May 31, 2012
Foreign Government Obligations(a) (continued)
| Issuer | | Coupon
Rate | | Principal
Amount | | Value ($) | |
| Turkey 0.7% | |
Turkey Government International Bond
Senior Unsecured
03/30/21 | | | 5.625 | % | | | 250,000 | | | | 261,250 | | |
| 02/05/25 | | | 7.375 | % | | | 140,000 | | | | 163,590 | | |
| Total | | | | | | | 424,840 | | |
| United Kingdom 8.8% | |
Network Rail Infrastructure Finance PLC
Government Guaranteed
12/09/30 | | | 4.375 | % | | GBP | 60,000 | | | | 110,670 | | |
United Kingdom Gilt
03/07/19 | | | 4.500 | % | | GBP | 1,540,000 | | | | 2,921,435 | | |
| 09/07/20 | | | 3.750 | % | | GBP | 450,000 | | | | 824,342 | | |
| 09/07/21 | | | 3.750 | % | | GBP | 250,000 | | | | 460,472 | | |
| 03/07/25 | | | 5.000 | % | | GBP | 253,000 | | | | 525,621 | | |
| 03/07/36 | | | 4.250 | % | | GBP | 300,000 | | | | 577,349 | | |
| Total | | | | | | | 5,419,889 | | |
| Uruguay 0.1% | |
Uruguay Government International Bond
Senior Unsecured PIK
01/15/33 | | | 7.875 | % | | | 40,000 | | | | 55,200 | | |
| Venezuela 0.8% | |
Petroleos de Venezuela SA
11/02/17 | | | 8.500 | % | | | 500,000 | | | | 395,000 | | |
Venezuela Government International Bond
Senior Unsecured
08/23/22 | | | 12.750 | % | | | 84,000 | | | | 78,750 | | |
| Total | | | | | | | 473,750 | | |
Total Foreign Government Obligations
(Cost: $57,236,973) | | | | | | | 57,190,016 | | |
Total Investments
(Cost: $59,224,811) | | | | | | | 59,600,012 | | |
| Other Assets & Liabilities, Net | | | | | | | 2,164,798 | | |
| Net Assets | | | | | | | 61,764,810 | | |
The accompanying Notes to Financial Statements are an integral part of this statement.
Annual Report 2012
10
Columbia International Bond Fund
Portfolio of Investments (continued)
May 31, 2012
Investments in Derivatives
At May 31, 2012, $7,425 was held in a margin deposit account as collateral to cover initial margin requirements on open futures contracts.
Futures Contracts Outstanding at May 31, 2012
| Contract Description | | Number of
Contracts
Long (Short) | | Notional
Market
Value ($) | | Expiration
Date | | Unrealized
Appreciation ($) | | Unrealized
Depreciation ($) | |
| U.S. Treasury Note, 2-year | | | (7 | ) | | | (1,542,844 | ) | | October 2012 | | | — | | | | (1,214 | ) | |
| U.S. Treasury Note, 10-year | | | (5 | ) | | | (669,688 | ) | | September 2012 | | | — | | | | (4,656 | ) | |
| Total | | | | | | | | | | | | | | | — | | | | (5,870 | ) | |
Forward Foreign Currency Exchange Contracts Open at May 31, 2012
| Counterparty | | Exchange Date | | Currency to be
Delivered | | Currency to be
Received | | Unrealized
Appreciation ($) | | Unrealized
Depreciation ($) | |
| J.P. Morgan Securities, Inc. | | June 8, 2012 | | | 1,244,935
(USD) | | | | 100,000,000
(JPY) | | | | 31,279
— | | | | —
— | | |
| Morgan Stanley | | June 14, 2012 | | | 130,803
(USD) | | | | 900,000
(SEK) | | | | —
— | | | | (6,962
— | ) | |
| State Street Bank & Trust Company | | June 18, 2012 | | | 900,000
(EUR) | | | | 1,164,879
(USD) | | | | 51,957
— | | | | —
— | | |
| J.P. Morgan Securities, Inc. | | June 19, 2012 | | | 2,000,000
(PLN) | | | | 593,472
(USD) | | | | 30,525
— | | | | —
— | | |
| Total | | | | | | | | | | | | | | | 113,761 | | | | (6,962 | ) | |
Notes to Portfolio of Investments
(a) Principal amounts are denominated in United States Dollars unless otherwise noted.
(b) Security exempt from registration pursuant to Rule 144A under the Securities Act of 1933. This security may be resold in transactions exempt from registration, normally to qualified institutional buyers. At May 31, 2012, the value of these securities amounted to $2,818,372 or 4.56% of net assets.
(c) Variable rate security. The interest rate shown reflects the rate as of May 31, 2012.
| Issuer | | Beginning
Cost ($) | | Purchase
Cost ($) | | Sales Cost/
Proceeds
from Sales ($) | | Realized
Gain/Loss ($) | | Ending
Cost ($) | | Dividends
or Interest
Income ($) | | Value ($) | |
Columbia
Short-Term
Cash Fund | | | — | | | | 23,547,634 | | | | (23,547,634 | ) | | | — | | | | — | | | | 1,246 | | | | — | | |
Abbreviation Legend
PIK Payment-in-Kind
The accompanying Notes to Financial Statements are an integral part of this statement.
Annual Report 2012
11
Columbia International Bond Fund
Portfolio of Investments (continued)
May 31, 2012
Currency Legend
AUD Australian Dollar
CAD Canadian Dollar
COP Colombian Peso
DKK Danish Krone
EUR Euro
GBP British Pound
IDR Indonesian Rupiah
JPY Japanese Yen
MXN Mexican Peso
NOK Norwegian Krone
NZD New Zealand Dollar
PLN Polish Zloty
SEK Swedish Krona
USD US Dollar
UYU Uruguay Pesos
Fair Value Measurements
Generally accepted accounting principles (GAAP) require disclosure regarding the inputs and valuation techniques used to measure fair value and any changes in valuation inputs or techniques. In addition, investments shall be disclosed by major category.
The Fund categorizes its fair value measurements according to a three-level hierarchy that maximizes the use of observable inputs and minimizes the use of unobservable inputs by prioritizing that the most observable input be used when available. Observable inputs are those that market participants would use in pricing an investment based on market data obtained from sources independent of the reporting entity. Unobservable inputs are those that reflect the Fund's assumptions about the information market participants would use in pricing an investment. An investment's level within the fair value hierarchy is based on the lowest level of any input that is deemed significant to the asset or liability's fair value measurement. The input levels are not necessarily an indication of the risk or liquidity associated with investments at that level. For example, certain U.S. government securities are generally high quality and liquid, however, they are reflected as Level 2 because the inputs used to determine fair value may not always be quoted prices in an active market.
Fair value inputs are summarized in the three broad levels listed below:
> Level 1 — Valuations based on quoted prices for investments in active markets that the Fund has the ability to access at the measurement date (including NAV for open-end mutual funds). Valuation adjustments are not applied to Level 1 investments.
> Level 2 — Valuations based on other significant observable inputs (including quoted prices for similar securities, interest rates, prepayment speeds, credit risks, etc.).
> Level 3 — Valuations based on significant unobservable inputs (including the Fund's own assumptions and judgment in determining the fair value of investments).
Inputs that are used in determining fair value of an investment may include price information, credit data, volatility statistics, and other factors. These inputs can be either observable or unobservable. The availability of observable inputs can vary between investments, and is affected by various factors such as the type of investment, and the volume and level of activity for that investment or similar investments in the marketplace. The inputs will be considered by the Investment Manager, along with any other relevant factors in the calculation of an investment's fair value. The Fund uses prices and inputs that are current as of the measurement date, which may include periods of market dislocations. During these periods, the availability of prices and inputs may be reduced for many investments. This condition could cause an investment to be reclassified between the various levels within the hierarchy.
Investments falling into the Level 3 category are primarily supported by quoted prices from brokers and dealers participating in the market for those investments. However, these may be classified as Level 3 investments due to lack of market transparency and corroboration to support these quoted prices. Additionally, valuation models may be used as the pricing source for any remaining investments classified as Level 3. These models rely on one or more significant unobservable inputs and/or significant assumptions by the Investment Manager. Inputs used in valuations may include, but are not limited to, financial statement analysis, capital account balances, discount rates and estimated cash flows, and comparable company data.
The accompanying Notes to Financial Statements are an integral part of this statement.
Annual Report 2012
12
Columbia International Bond Fund
Portfolio of Investments (continued)
May 31, 2012
The following table is a summary of the inputs used to value the Fund's investments at May 31, 2012:
| Description | | Level 1
Quoted Prices in Active
Markets for Identical
Assets ($) | | Level 2
Other Significant
Observable Inputs ($) | | Level 3
Significant
Unobservable Inputs ($) | | Total ($) | |
| Bonds | |
| Corporate Bonds & Notes | | | — | | | | 2,315,021 | | | | — | | | | 2,315,021 | | |
| Inflation-Indexed Bonds | | | — | | | | 94,975 | | | | — | | | | 94,975 | | |
| Foreign Government Obligations | | | — | | | | 57,190,016 | | | | — | | | | 57,190,016 | | |
| Total Bonds | | | — | | | | 59,600,012 | | | | — | | | | 59,600,012 | | |
| Investments in Securities | | | — | | | | 59,600,012 | | | | — | | | | 59,600,012 | | |
| Derivatives | |
| Assets | |
| Futures Contracts | | | — | | | | — | | | | — | | | | — | | |
| Forward Foreign Currency Exchange Contracts | | | — | | | | 113,761 | | | | — | | | | 113,761 | | |
| Liabilities | |
| Futures Contracts | | | (5,870 | ) | | | — | | | | — | | | | (5,870 | ) | |
| Forward Foreign Currency Exchange Contracts | | | — | | | | (6,962 | ) | | | — | | | | (6,962 | ) | |
| Total | | | (5,870 | ) | | | 59,706,811 | | | | — | | | | 59,700,941 | | |
See the Portfolio of Investments for all investment classifications not indicated in the table.
The Fund's assets assigned to the Level 2 input category are generally valued using the market approach, in which a security's value is determined through reference to prices and information from market transactions for similar or identical assets.
There were no transfers of financial assets between Levels 1 and 2 during the period.
The accompanying Notes to Financial Statements are an integral part of this statement.
Annual Report 2012
13
Columbia International Bond Fund
Statement of Assets and Liabilities
May 31, 2012
| Assets | |
| Investments, at value (identified cost $59,224,811) | | $ | 59,600,012 | | |
| Foreign currency (identified cost $1,417,054) | | | 1,401,168 | | |
| Margin deposits on futures contracts | | | 7,425 | | |
| Unrealized appreciation on forward foreign currency exchange contracts | | | 113,761 | | |
| Receivable for: | |
| Capital shares sold | | | 1,782 | | |
| Dividends | | | 22 | | |
| Interest | | | 864,670 | | |
| Reclaims | | | 20,827 | | |
| Expense reimbursement due from Investment Manager | | | 671 | | |
| Trustees' deferred compensation plan | | | 6,448 | | |
| Total assets | | | 62,016,786 | | |
| Liabilities | |
| Disbursements in excess of cash | | | 150,753 | | |
| Unrealized depreciation on forward foreign currency exchange contracts | | | 6,962 | | |
| Payable for: | |
| Capital shares purchased | | | 24,751 | | |
| Variation margin on futures contracts | | | 1,500 | | |
| Foreign capital gains taxes deferred | | | 233 | | |
| Investment management fees | | | 961 | | |
| Distribution and service fees | | | 19 | | |
| Transfer agent fees | | | 2,007 | | |
| Administration fees | | | 135 | | |
| Compensation of board members | | | 2,114 | | |
| Chief compliance officer expenses | | | 265 | | |
| Other expenses | | | 55,828 | | |
| Trustees' deferred compensation plan | | | 6,448 | | |
| Total liabilities | | | 251,976 | | |
| Net assets applicable to outstanding capital stock | | $ | 61,764,810 | | |
| Represented by | |
| Paid-in capital | | $ | 61,749,120 | | |
| Undistributed net investment income | | | 103,482 | | |
| Accumulated net realized loss | | | (493,408 | ) | |
| Unrealized appreciation (depreciation) on: | |
| Investments | | | 375,201 | | |
| Foreign currency translations | | | (70,281 | ) | |
| Forward foreign currency exchange contracts | | | 106,799 | | |
| Futures contracts | | | (5,870 | ) | |
| Foreign capital gains tax | | | (233 | ) | |
| Total — representing net assets applicable to outstanding capital stock | | $ | 61,764,810 | | |
The accompanying Notes to Financial Statements are an integral part of this statement.
Annual Report 2012
14
Columbia International Bond Fund
Statement of Assets and Liabilities (continued)
May 31, 2012
| Class A | |
| Net assets | | $ | 1,902,508 | | |
| Shares outstanding | | | 172,025 | | |
| Net asset value per share | | $ | 11.06 | | |
| Maximum offering price per share(a) | | $ | 11.61 | | |
| Class C | |
| Net assets | | $ | 240,176 | | |
| Shares outstanding | | | 21,740 | | |
| Net asset value per share | | $ | 11.05 | | |
| Class I | |
| Net assets | | $ | 44,311,091 | | |
| Shares outstanding | | | 4,007,543 | | |
| Net asset value per share | | $ | 11.06 | | |
| Class Z | |
| Net assets | | $ | 15,311,035 | | |
| Shares outstanding | | | 1,384,703 | | |
| Net asset value per share | | $ | 11.06 | | |
(a) The maximum offering price per share is calculated by dividing the net asset value by 1.0 minus the maximum sales charge of 4.75%.
The accompanying Notes to Financial Statements are an integral part of this statement.
Annual Report 2012
15
Columbia International Bond Fund
Statement of Operations
Year Ended May 31, 2012
| Net investment income | |
| Income: | |
| Interest | | $ | 2,009,798 | | |
| Dividends from affiliates | | | 1,246 | | |
| Foreign taxes withheld | | | (3,856 | ) | |
| Total income | | | 2,007,188 | | |
| Expenses: | |
| Investment management fees | | | 336,309 | | |
| Distribution fees | |
| Class C | | | 2,606 | | |
| Service fees | |
| Class A | | | 4,913 | | |
| Class C | | | 869 | | |
| Transfer agent fees | |
| Class A | | | 2,792 | | |
| Class C | | | 485 | | |
| Class Z | | | 21,829 | | |
| Administration fees | | | 46,151 | | |
| Compensation of board members | | | 21,508 | | |
| Pricing and bookkeeping fees | | | 3,373 | | |
| Custodian fees | | | 25,018 | | |
| Printing and postage fees | | | 26,439 | | |
| Registration fees | | | 56,749 | | |
| Professional fees | | | 49,624 | | |
| Chief compliance officer expenses | | | 588 | | |
| Other | | | 5,400 | | |
| Total expenses | | | 604,653 | | |
| Fees waived or expenses reimbursed by Investment Manager and its affiliates | | | (111,603 | ) | |
| Total net expenses | | | 493,050 | | |
| Net investment income | | | 1,514,138 | | |
| Realized and unrealized gain (loss) — net | |
| Net realized gain (loss) on: | |
| Investments | | | (556,478 | ) | |
| Foreign currency translations | | | (61,096 | ) | |
| Forward foreign currency exchange contracts | | | 259,877 | | |
| Futures contracts | | | (79,047 | ) | |
| Net realized loss | | | (436,744 | ) | |
| Net change in unrealized appreciation (depreciation) on: | |
| Investments | | | (1,912,193 | ) | |
| Foreign currency translations | | | (87,301 | ) | |
| Forward foreign currency exchange contracts | | | 109,626 | | |
| Futures contracts | | | (5,372 | ) | |
| Foreign capital gains tax | | | (233 | ) | |
| Net change in unrealized depreciation | | | (1,895,473 | ) | |
| Net realized and unrealized loss | | | (2,332,217 | ) | |
| Net decrease in net assets resulting from operations | | $ | (818,079 | ) | |
The accompanying Notes to Financial Statements are an integral part of this statement.
Annual Report 2012
16
Columbia International Bond Fund
Statement of Changes in Net Assets
| | | Year Ended
May 31,
2012 | | Year Ended
May 31,
2011(a) | |
| Operations | |
| Net investment income | | $ | 1,514,138 | | | $ | 478,590 | | |
| Net realized gain (loss) | | | (436,744 | ) | | | 297,946 | | |
| Net change in unrealized appreciation (depreciation) | | | (1,895,473 | ) | | | 2,691,503 | | |
| Net increase (decrease) in net assets resulting from operations | | | (818,079 | ) | | | 3,468,039 | | |
| Distributions to shareholders | |
| Net investment income | |
| Class A | | | (51,907 | ) | | | (40,571 | ) | |
| Class C | | | (6,446 | ) | | | (11,080 | ) | |
| Class I | | | (1,107,171 | ) | | | (94,773 | ) | |
| Class Z | | | (435,429 | ) | | | (535,996 | ) | |
| Net realized gains | |
| Class A | | | — | | | | (2,451 | ) | |
| Class C | | | — | | | | (862 | ) | |
| Class I | | | — | | | | (5 | ) | |
| Class Z | | | — | | | | (29,528 | ) | |
| Total distributions to shareholders | | | (1,600,953 | ) | | | (715,266 | ) | |
| Increase (decrease) in net assets from share transactions | | | 16,897,307 | | | | 28,627,049 | | |
| Total increase in net assets | | | 14,478,275 | | | | 31,379,822 | | |
| Net assets at beginning of year | | | 47,286,535 | | | | 15,906,713 | | |
| Net assets at end of year | | $ | 61,764,810 | | | $ | 47,286,535 | | |
| Undistributed net investment income | | $ | 103,482 | | | $ | 179,889 | | |
(a) Class I shares are for the period from September 27, 2010 (commencement of operations) to May 31, 2011.
The accompanying Notes to Financial Statements are an integral part of this statement.
Annual Report 2012
17
Columbia International Bond Fund
Statement of Changes in Net Assets (continued)
| | | Year Ended May 31, 2012 | | Year Ended May 31, 2011(a) | |
| | | Shares | | Dollars ($) | | Shares | | Dollars ($) | |
| Capital stock activity | |
| Class A shares | |
| Subscriptions | | | 142,437 | | | | 1,631,986 | | | | 113,078 | | | | 1,250,049 | | |
| Distributions reinvested | | | 4,271 | | | | 47,730 | | | | 3,656 | | | | 39,797 | | |
| Redemptions | | | (83,747 | ) | | | (948,460 | ) | | | (104,010 | ) | | | (1,168,412 | ) | |
| Net increase | | | 62,961 | | | | 731,256 | | | | 12,724 | | | | 121,434 | | |
| Class C shares | |
| Subscriptions | | | 4,948 | | | | 56,340 | | | | 9,393 | | | | 102,727 | | |
| Distributions reinvested | | | 488 | | | | 5,442 | | | | 880 | | | | 9,533 | | |
| Redemptions | | | (20,105 | ) | | | (225,327 | ) | | | (8,389 | ) | | | (93,288 | ) | |
| Net increase (decrease) | | | (14,669 | ) | | | (163,545 | ) | | | 1,884 | | | | 18,972 | | |
| Class I shares | |
| Subscriptions | | | 1,943,469 | | | | 22,284,538 | | | | 2,653,291 | | | | 29,563,477 | | |
| Distributions reinvested | | | 98,887 | | | | 1,107,102 | | | | 8,366 | | | | 94,707 | | |
| Redemptions | | | (635,599 | ) | | | (7,329,871 | ) | | | (60,871 | ) | | | (687,724 | ) | |
| Net increase | | | 1,406,757 | | | | 16,061,769 | | | | 2,600,786 | | | | 28,970,460 | | |
| Class Z shares | |
| Subscriptions | | | 322,962 | | | | 3,720,761 | | | | 712,564 | | | | 8,201,837 | | |
| Distributions reinvested | | | 1,351 | | | | 15,120 | | | | 5,500 | | | | 60,356 | | |
| Redemptions | | | (309,422 | ) | | | (3,468,054 | ) | | | (765,179 | ) | | | (8,746,010 | ) | |
| Net increase (decrease) | | | 14,891 | | | | 267,827 | | | | (47,115 | ) | | | (483,817 | ) | |
| Total net increase | | | 1,469,940 | | | | 16,897,307 | | | | 2,568,279 | | | | 28,627,049 | | |
(a) Class I shares are for the period from September 27, 2010 (commencement of operations) to May 31, 2011.
The accompanying Notes to Financial Statements are an integral part of this statement.
Annual Report 2012
18
Columbia International Bond Fund
Financial Highlights
The following tables are intended to help you understand the Fund's financial performance. Certain information reflects financial results for a single share of a class held for the periods shown. Per share net investment income (loss) amounts are calculated based on average shares outstanding during the period. Total returns assume reinvestment of all dividends and distributions. Total returns do not reflect payment of sales charges, if any, and are not annualized for periods of less than one year.
| | | Year Ended May 31, | |
| Class A | | 2012 | | 2011 | | 2010 | | 2009(a) | |
| Per share data | |
| Net asset value, beginning of period | | $ | 11.50 | | | $ | 10.28 | | | $ | 10.39 | | | $ | 10.00 | | |
| Income from investment operations: | |
| Net investment income | | | 0.26 | | | | 0.21 | | | | 0.19 | | | | 0.07 | | |
| Net realized and unrealized gain (loss) | | | (0.42 | ) | | | 1.39 | | | | (0.07 | ) | | | 0.36 | | |
| Total from investment operations | | | (0.16 | ) | | | 1.60 | | | | 0.12 | | | | 0.43 | | |
| Less distributions to shareholders: | |
| Net investment income | | | (0.28 | ) | | | (0.36 | ) | | | (0.22 | ) | | | (0.04 | ) | |
| Net realized gains | | | — | | | | (0.02 | ) | | | (0.01 | ) | | | — | | |
| Total distributions to shareholders | | | (0.28 | ) | | | (0.38 | ) | | | (0.23 | ) | | | (0.04 | ) | |
| Redemption fees: | |
| Redemption fees added to paid-in-capital | | | — | | | | — | | | | 0.00 | (b) | | | 0.00 | (b) | |
| Net asset value, end of period | | $ | 11.06 | | | $ | 11.50 | | | $ | 10.28 | | | $ | 10.39 | | |
| Total return | | | (1.40 | %) | | | 15.86 | % | | | 1.07 | % | | | 4.35 | % | |
| Ratios to average net assets(c) | |
| Expenses prior to fees waived or expenses reimbursed | | | 1.36 | % | | | 2.09 | % | | | 2.12 | % | | | 4.87 | %(d) | |
| Net expenses after fees waived or expenses reimbursed(e) | | | 1.10 | % | | | 1.07 | %(f) | | | 1.05 | %(f) | | | 1.05 | %(d)(f) | |
| Net investment income | | | 2.29 | % | | | 1.90 | %(f) | | | 1.78 | %(f) | | | 1.41 | %(d)(f) | |
| Supplemental data | |
| Net assets, end of period (in thousands) | | $ | 1,903 | | | $ | 1,254 | | | $ | 990 | | | $ | 131 | | |
| Portfolio turnover | | | 20 | % | | | 31 | % | | | 30 | % | | | 4 | % | |
Notes to Financial Highlights
(a) For the period from December 1, 2008 (commencement of operations) to May 31, 2009.
(b) Rounds to less than $0.01.
(c) In addition to the fees and expenses which the Fund bears directly, the Fund indirectly bears a pro rata share of the fees and expenses of the acquired funds in which it invests. Such indirect expenses are not included in the reported expense ratios.
(d) Annualized.
(e) The Investment Manager and certain of its affiliates agreed to waive/reimburse certain fees and expenses, if applicable.
(f) The benefits derived from expense reductions had an impact of less than 0.01%.
The accompanying Notes to Financial Statements are an integral part of this statement.
Annual Report 2012
19
Columbia International Bond Fund
Financial Highlights (continued)
| | | Year Ended May 31, | |
| Class C | | 2012 | | 2011 | | 2010 | | 2009(a) | |
| Per share data | |
| Net asset value, beginning of period | | $ | 11.49 | | | $ | 10.27 | | | $ | 10.39 | | | $ | 10.00 | | |
| Income from investment operations: | |
| Net investment income | | | 0.18 | | | | 0.12 | | | | 0.11 | | | | 0.03 | | |
| Net realized and unrealized gain (loss) | | | (0.42 | ) | | | 1.40 | | | | (0.08 | ) | | | 0.37 | | |
| Total from investment operations | | | (0.24 | ) | | | 1.52 | | | | 0.03 | | | | 0.40 | | |
| Less distributions to shareholders: | |
| Net investment income | | | (0.20 | ) | | | (0.28 | ) | | | (0.14 | ) | | | (0.01 | ) | |
| Net realized gains | | | — | | | | (0.02 | ) | | | (0.01 | ) | | | — | | |
| Total distributions to shareholders | | | (0.20 | ) | | | (0.30 | ) | | | (0.15 | ) | | | (0.01 | ) | |
| Redemption fees: | |
| Redemption fees added to paid-in-capital | | | — | | | | — | | | | 0.00 | (b) | | | 0.00 | (b) | |
| Net asset value, end of period | | $ | 11.05 | | | $ | 11.49 | | | $ | 10.27 | | | $ | 10.39 | | |
| Total return | | | (2.10 | %) | | | 15.01 | % | | | 0.21 | % | | | 3.97 | % | |
| Ratios to average net assets(c) | |
| Expenses prior to fees waived or expenses reimbursed | | | 2.10 | % | | | 2.85 | % | | | 2.87 | % | | | 5.62 | %(d) | |
| Net expenses after fees waived or expenses reimbursed(e) | | | 1.85 | % | | | 1.83 | %(f) | | | 1.80 | %(f) | | | 1.80 | %(d)(f) | |
| Net investment income | | | 1.58 | % | | | 1.10 | %(f) | | | 1.06 | %(f) | | | 0.59 | %(d)(f) | |
| Supplemental data | |
| Net assets, end of period (in thousands) | | $ | 240 | | | $ | 418 | | | $ | 355 | | | $ | 32 | | |
| Portfolio turnover | | | 20 | % | | | 31 | % | | | 30 | % | | | 4 | % | |
Notes to Financial Highlights
(a) For the period from December 1, 2008 (commencement of operations) to May 31, 2009.
(b) Rounds to less than $0.01.
(c) In addition to the fees and expenses which the Fund bears directly, the Fund indirectly bears a pro rata share of the fees and expenses of the acquired funds in which it invests. Such indirect expenses are not included in the reported expense ratios.
(d) Annualized.
(e) The Investment Manager and certain of its affiliates agreed to waive/reimburse certain fees and expenses, if applicable.
(f) The benefits derived from expense reductions had an impact of less than 0.01%.
The accompanying Notes to Financial Statements are an integral part of this statement.
Annual Report 2012
20
Columbia International Bond Fund
Financial Highlights (continued)
| | | Year Ended May 31, | |
| Class I | | 2012 | | 2011(a) | |
| Per share data | |
| Net asset value, beginning of period | | $ | 11.48 | | | $ | 11.34 | | |
| Income from investment operations: | |
| Net investment income | | | 0.29 | | | | 0.23 | | |
| Net realized and unrealized gain (loss) | | | (0.40 | ) | | | 0.25 | | |
| Total from investment operations | | | (0.11 | ) | | | 0.48 | | |
| Less distributions to shareholders: | |
| Net investment income | | | (0.31 | ) | | | (0.32 | ) | |
| Net realized gains | | | — | | | | (0.02 | ) | |
| Total distributions to shareholders | | | (0.31 | ) | | | (0.34 | ) | |
| Net asset value, end of period | | $ | 11.06 | | | $ | 11.48 | | |
| Total return | | | (0.95 | %) | | | 4.44 | % | |
| Ratios to average net assets(b) | |
| Expenses prior to fees waived or expenses reimbursed | | | 0.97 | % | | | 1.33 | %(c) | |
| Net expenses after fees waived or expenses reimbursed(d) | | | 0.81 | % | | | 0.84 | %(c)(e) | |
| Net investment income | | | 2.59 | % | | | 2.96 | %(c)(e) | |
| Supplemental data | |
| Net assets, end of period (in thousands) | | $ | 44,311 | | | $ | 29,870 | | |
| Portfolio turnover | | | 20 | % | | | 31 | % | |
Notes to Financial Highlights
(a) For the period from September 27, 2010 (commencement of operations) to May 31, 2011.
(b) In addition to the fees and expenses which the Fund bears directly, the Fund indirectly bears a pro rata share of the fees and expenses of the acquired funds in which it invests. Such indirect expenses are not included in the reported expense ratios.
(c) Annualized.
(d) The Investment Manager and certain of its affiliates agreed to waive/reimburse certain fees and expenses, if applicable.
(e) The benefits derived from expense reductions had an impact of less than 0.01%.
The accompanying Notes to Financial Statements are an integral part of this statement.
Annual Report 2012
21
Columbia International Bond Fund
Financial Highlights (continued)
| | | Year Ended May 31, | |
| Class Z | | 2012 | | 2011 | | 2010 | | 2009(a) | |
| Per share data | |
| Net asset value, beginning of period | | $ | 11.49 | | | $ | 10.28 | | | $ | 10.39 | | | $ | 10.00 | | |
| Income from investment operations: | |
| Net investment income | | | 0.29 | | | | 0.23 | | | | 0.21 | | | | 0.07 | | |
| Net realized and unrealized gain (loss) | | | (0.41 | ) | | | 1.39 | | | | (0.06 | ) | | | 0.38 | | |
| Total from investment operations | | | (0.12 | ) | | | 1.62 | | | | 0.15 | | | | 0.45 | | |
| Less distributions to shareholders: | |
| Net investment income | | | (0.31 | ) | | | (0.39 | ) | | | (0.25 | ) | | | (0.06 | ) | |
| Net realized gains | | | — | | | | (0.02 | ) | | | (0.01 | ) | | | — | | |
| Total distributions to shareholders | | | (0.31 | ) | | | (0.41 | ) | | | (0.26 | ) | | | (0.06 | ) | |
| Redemption fees: | |
| Redemption fees added to paid-in-capital | | | — | | | | — | | | | 0.00 | (b) | | | 0.00 | (b) | |
| Net asset value, end of period | | $ | 11.06 | | | $ | 11.49 | | | $ | 10.28 | | | $ | 10.39 | | |
| Total return | | | (1.06 | %) | | | 16.05 | % | | | 1.31 | % | | | 4.48 | % | |
| Ratios to average net assets(c) | |
| Expenses prior to fees waived or expenses reimbursed | | | 1.10 | % | | | 1.85 | % | | | 1.87 | % | | | 4.62 | %(d) | |
| Net expenses after fees waived or expenses reimbursed(e) | | | 0.85 | % | | | 0.83 | %(f) | | | 0.80 | %(f) | | | 0.80 | %(d)(f) | |
| Net investment income | | | 2.56 | % | | | 2.11 | %(f) | | | 1.98 | %(f) | | | 1.50 | %(d)(f) | |
| Supplemental data | |
| Net assets, end of period (in thousands) | | $ | 15,311 | | | $ | 15,745 | | | $ | 14,562 | | | $ | 8,790 | | |
| Portfolio turnover | | | 20 | % | | | 31 | % | | | 30 | % | | | 4 | % | |
Notes to Financial Highlights
(a) For the period from December 1, 2008 (commencement of operations) to May 31, 2009.
(b) Rounds to less than $0.01.
(c) In addition to the fees and expenses which the Fund bears directly, the Fund indirectly bears a pro rata share of the fees and expenses of the acquired funds in which it invests. Such indirect expenses are not included in the reported expense ratios.
(d) Annualized.
(e) The Investment Manager and certain of its affiliates agreed to waive/reimburse certain fees and expenses, if applicable.
(f) The benefits derived from expense reductions had an impact of less than 0.01%.
The accompanying Notes to Financial Statements are an integral part of this statement.
Annual Report 2012
22
Columbia International Bond Fund
Notes to Financial Statements
May 31, 2012
Note 1. Organization
Columbia International Bond Fund (the Fund), a series of Columbia Funds Series Trust I (the Trust), is a non-diversified fund. The Trust is registered under the Investment Company Act of 1940, as amended (the 1940 Act), as an open-end management investment company organized as a Massachusetts business trust.
Fund Shares
The Trust may issue an unlimited number of shares (without par value). The Fund offers Class A, Class C, Class I and Class Z shares. All share classes have identical voting, dividend and liquidation rights. Each share class has its own expense structure and sales charges, as applicable.
Class A shares are subject to a maximum front-end sales charge of 4.75% based on the initial investment amount. Class A shares purchased without an initial sales charge in accounts aggregating $1 million to $50 million at the time of purchase are subject to a contingent deferred sales charge (CDSC) if the shares are sold within 18 months of purchase, charged as follows: 1.00% CDSC if redeemed within 12 months of purchase, and 0.50% CDSC if redeemed more than 12, but less than 18, months after purchase.
Class C shares are subject to a 1.00% CDSC on shares redeemed within one year of purchase.
Class I shares are not subject to sales charges and are only available to the Columbia Family of Funds.
Class Z shares are not subject to sales charges, and are only available to certain investors, as described in the Fund's Class Z prospectus.
Note 2. Summary of Significant Accounting Policies
Use of Estimates
The preparation of financial statements in accordance with U.S. generally accepted accounting principles (GAAP) requires management to make certain estimates and assumptions that affect the reported amounts of assets and liabilities, the disclosure of contingent assets and liabilities at the date of the financial statements and the reported amounts of revenue and expenses during the reporting period. Actual results could differ from those estimates.
The following is a summary of significant accounting policies consistently followed by the Fund in the preparation of its financial statements.
Security Valuation
Debt securities generally are valued by pricing services approved by the Board of Trustees (the Board) based upon market transactions for normal, institutional-size trading units of similar securities. The services may use various pricing techniques which take into account appropriate factors such as yield, quality, coupon rate, maturity, type of issue, trading characteristics and other data, as well as broker quotes. Debt securities for which quotations are readily available may also be valued based upon an over-the-counter or exchange bid quotation.
Foreign securities are valued based on quotations from the principal market in which such securities are normally traded. If any foreign share prices are not readily available as a result of limited share activity the securities are valued at the mean of the latest quoted bid and ask prices on such exchanges or markets. Foreign currency exchange rates are generally determined at 4:00 p.m. Eastern (U.S.) time. However, many securities markets and exchanges outside the U.S. close prior to the close of the NYSE; therefore, the closing prices for securities in such markets or on such exchanges may not fully reflect events that occur after such close but before the close of the NYSE. In those situations, foreign securities will be fair valued pursuant to the policy adopted by the Board, including utilizing a third party pricing service to determine these fair values. The third party pricing service takes into account multiple factors, including, but not limited to, movements in the U.S. securities markets, certain depositary receipts, futures contracts and foreign exchange rates that have occurred subsequent to the close of the foreign exchange or market, to determine a good faith estimate that reasonably reflects the current market conditions as of the close of the NYSE. The fair value of a security is likely to be different from the quoted or published price, if available.
Investments in other open-end investment companies, including money market funds, are valued at net asset value.
Short-term securities purchased within 60 days to maturity are valued at amortized cost, which approximates market value. The value of short-term securities originally purchased with maturities greater than 60 days is determined based on an amortized value to par upon reaching 60 days to maturity. Short-term securities maturing in more than 60 days from the valuation date are valued at the market price or approximate market value based on current interest rates.
Forward foreign currency exchange contracts are marked-to-market based upon foreign currency exchange rates provided by a pricing service.
Annual Report 2012
23
Columbia International Bond Fund
Notes to Financial Statements (continued)
May 31, 2012
Futures and options on futures contracts are valued based upon the settlement price established each day by the board of trade or exchange on which they are traded.
Investments for which market quotations are not readily available, or that have quotations which management believes are not reliable, are valued at fair value as determined in good faith under consistently applied procedures established by and under the general supervision of the Board. If a security or class of securities (such as foreign securities) is valued at fair value, such value is likely to be different from the last quoted market price for the security. The determination of fair value often requires significant judgment. To determine fair value, management may use assumptions including but not limited to future cash flows and estimated risk premiums. Multiple inputs from various sources may be used to determine fair value.
Foreign Currency Transactions and Translation
The values of all assets and liabilities denominated in foreign currencies are translated into U.S. dollars at that day's exchange rates. Net realized and unrealized gains (losses) on foreign currency transactions and translations include gains (losses) arising from the fluctuation in exchange rates between trade and settlement dates on securities transactions, gains (losses) arising from the disposition of foreign currency and currency gains (losses) between the accrual and payment dates on dividends, interest income and foreign withholding taxes.
For financial statement purposes, the Fund does not distinguish that portion of gains (losses) on investments which is due to changes in foreign exchange rates from that which is due to changes in market prices of the investments. Such fluctuations are included with the net realized and unrealized gains (losses) on investments in the Statement of Operations.
Derivative Instruments
The Fund invests in certain derivative instruments as detailed below to meet its investment objectives. Derivatives are instruments whose values depend on, or are derived from, in whole or in part, the value of one or more other assets, such as securities, currencies, commodities or indices. Derivative instruments may be used to maintain cash reserves while maintaining exposure to certain other assets, to offset anticipated declines in values of investments, to facilitate trading, to reduce transaction costs and to pursue higher investment returns. The Fund may also use derivative instruments to mitigate certain investment risks, such as foreign currency exchange rate risk, interest rate risk and credit risk. Derivatives may involve various risks, including the potential inability of the counterparty to fulfill its obligation under the terms of the contract, the potential for an illiquid secondary market and the potential for market movements which may expose the Fund to gains or losses in excess of the amount shown in the Statement of Assets and Liabilities.
The Fund and any counterparty are required to maintain an agreement that requires the Fund and that counterparty to monitor (on a daily basis) the net fair value of all derivatives entered into pursuant to the agreement between the Fund and such counterparty. If the net fair value of such derivatives between the Fund and that counterparty exceeds a certain threshold (as defined in the agreement), the Fund or the counterparty (as the case may be) is required to post cash and/or securities as collateral. Fair values of derivatives presented in the financial statements are not netted with the fair value of other derivatives or with any collateral amounts posted by the Fund or any counterparty.
Forward Foreign Currency Exchange Contracts
Forward foreign currency exchange contracts are agreements between two parties to buy and sell a currency at a set price on a future date. These contracts are intended to be used to minimize the exposure to foreign exchange rate fluctuations during the period between the trade and settlement dates of the contract. The Fund utilized forward foreign currency exchange contracts to hedge the currency exposure associated with some or all of the Fund's securities, to shift foreign currency exposure back to U.S. dollars, to shift investment exposure from one currency to another, and to shift U.S. dollar exposure to achieve a representative weighted mix of major currencies in its benchmark, and/or to recover an underweight country exposure in its portfolio.
The values of forward foreign currency exchange contracts fluctuate with changes in foreign currency exchange rates. The Fund will record a realized gain or loss when the forward foreign currency exchange contract is closed.
The use of forward foreign currency exchange contracts does not eliminate fluctuations in the prices of the Fund's portfolio securities. The risks of forward foreign currency exchange contracts include movement in the values of the foreign currencies relative to the U.S. dollar (or other foreign currencies) and the possibility that counterparties will not complete their contractual obligations, which may be in excess of the amount reflected, if any, in the Statement of Assets and Liabilities.
Futures Contracts
Futures contracts represent commitments for the future purchase or sale of an asset at a specified price on a specified date. The Fund bought and sold futures contracts to manage the duration and yield curve exposure of the Fund versus the benchmark and manage exposure to movements in interest
Annual Report 2012
24
Columbia International Bond Fund
Notes to Financial Statements (continued)
May 31, 2012
rates. Upon entering into futures contracts, the Fund bears risks which may include interest rates, exchange rates or securities prices moving unexpectedly, in which case, the Fund may not achieve the anticipated benefits of the futures contracts and may realize a loss. Additional risks include counterparty credit risk, the possibility of an illiquid market, and that a change in the value of the contract or option may not correlate with changes in the value of the underlying asset.
Upon entering into a futures contract, the Fund pledges cash or securities with the broker in an amount sufficient to meet the initial margin requirement. Subsequent payments (variation margin) are made or received by the Fund each day. The variation margin payments are equal to the daily change in the contract value and are recorded as variation margin receivable or payable and are offset in unrealized gains or losses. The Fund recognizes a realized gain or loss when the contract is closed or expires. Futures contracts involve, to varying degrees, risk of loss in excess of the variation margin disclosed in the Statement of Assets and Liabilities.
Effects of Derivative Transactions in the Financial Statements
The following tables are intended to provide additional information about the effect of derivatives on the financial statements of the Fund, including: the fair value of derivatives by risk category and the location of those fair values in the Statement of Assets and Liabilities; the impact of derivative transactions on the Fund's operations over the period including realized gains or losses and unrealized gains or losses. The derivative schedules following the Portfolio of Investments present additional information regarding derivative instruments outstanding at the end of the period, if any.
The following table is a summary of the fair value of derivative instruments at May 31, 2012:
| | | Asset Derivatives | |
| Risk Exposure Category | | Statement of Assets and
Liabilities Location | | Fair Value ($) | |
Foreign exchange
contracts | | Unrealized appreciation on
forward foreign currency
exchange contracts | | | 113,761 | | |
| Total | | | | | 113,761 | | |
| | | Liability Derivatives | |
| Risk Exposure Category | | Statement of Assets and
Liabilities Location | | Fair Value ($) | |
Foreign exchange
contracts | | Unrealized depreciation on
forward foreign currency
exchange contracts | | | 6,962 | | |
Interest rate
contracts | | Net assets — unrealized
depreciation on futures
contracts | | | 5,870 | * | |
| Total | | | | | 12,832 | | |
*Includes cumulative appreciation (depreciation) of futures contracts as reported in the Futures Contracts Outstanding table following the Portfolio of Investments. Only the current day's variation margin is reported in receivables or payables in the Statement of Assets and Liabilities.
The effect of derivative instruments in the Statement of Operations for the year ended May 31, 2012:
| Amount of Realized Gain (Loss) on Derivatives Recognized in Income | |
Risk Exposure
Category | | Forward Foreign
Currency Exchange
Contracts ($) | | Futures
Contracts ($) | | Total ($) | |
Foreign exchange
contracts | | | 259,877 | | | | — | | | | 259,877 | | |
Interest rate
contracts | | | — | | | | (79,047 | ) | | | (79,047 | ) | |
| Total | | | 259,877 | | | | (79,047 | ) | | | 180,830 | | |
| Change in Unrealized Appreciation (Depreciation) on Derivatives Recognized in Income | |
Risk Exposure
Category | | Forward Foreign
Currency Exchange
Contracts ($) | | Futures
Contracts ($) | | Total ($) | |
Foreign exchange
contracts | | | 109,626 | | | | — | | | | 109,626 | | |
Interest rate
contracts | | | — | | | | (5,372 | ) | | | (5,372 | ) | |
| Total | | | 109,626 | | | | (5,372 | ) | | | 104,254 | | |
The following table is a summary of the volume of derivative instruments for the year ended May 31, 2012:
| Derivative Instrument | | Contracts Opened | |
| Forward Foreign Currency Exchange Contracts | | | 66 | | |
| Futures Contracts | | | 65 | | |
Repurchase Agreements
The Fund may engage in repurchase agreement transactions with institutions that management has determined are creditworthy. The Fund, through the custodian, receives delivery of the underlying securities collateralizing a repurchase agreement. Management is responsible for determining that the collateral is at least equal, at all times, to the value of the repurchase obligation including interest. A repurchase agreement transaction involves certain risks in the
Annual Report 2012
25
Columbia International Bond Fund
Notes to Financial Statements (continued)
May 31, 2012
event of default or insolvency of the counterparty. These risks include possible delays in or restrictions on a Fund's ability to dispose of the underlying securities and a possible decline in the value of the underlying securities during the period while the Fund seeks to assert its rights.
Treasury Inflation Protected Securities
The Fund may invest in treasury inflation protected securities (TIPS). The principal amount of TIPS is adjusted periodically and is increased for inflation or decreased for deflation based on a monthly published index. Interest payments are based on the adjusted principal at the time the interest is paid. These adjustments are recorded as interest income in the Statement of Operations.
Security Transactions
Security transactions are accounted for on the trade date. Cost is determined and gains (losses) are based upon the specific identification method for both financial statement and federal income tax purposes.
Income Recognition
Interest income is recorded on an accrual basis. Market premium and discount are amortized and accreted, respectively, on all debt securities, unless otherwise noted. Original issue discount is accreted to interest income over the life of the security with a corresponding increase in the cost basis, if any.
Dividend income is recorded on the ex-dividend date.
Expenses
General expenses of the Trust are allocated to the Fund and other funds of the Trust based upon relative net assets or other expense allocation methodologies determined by the nature of the expense. Expenses directly attributable to the Fund are charged to the Fund. Expenses directly attributable to a specific class of shares are charged to that share class.
Determination of Class Net Asset Value
All income, expenses (other than class-specific expenses, which are charged to that share class, as shown in the Statement of Operations) and realized and unrealized gains (losses) are allocated to each class of the Fund on a daily basis, based on the relative net assets of each class, for purposes of determining the net asset value of each class.
Federal Income Tax Status
The Fund intends to qualify each year as a regulated investment company under Subchapter M of the Internal Revenue Code, as amended, and will distribute substantially all of its tax exempt or taxable income (including net short-term capital gains), if any, for its tax year, and as such will not be subject to federal income taxes. In addition, the Fund intends to distribute in each calendar year substantially all of its net investment income, capital gains and certain other amounts, if any, such that the Fund should not be subject to federal excise tax. Therefore, no federal income or excise tax provision is recorded.
Foreign Taxes
The Fund may be subject to foreign taxes on income, gains on investments or currency repatriation, a portion of which may be recoverable. The Fund will accrue such taxes and recoveries, as applicable, based upon its current interpretation of tax rules and regulations that exist in the markets in which it invests.
Realized gains in certain countries may be subject to foreign taxes at the Fund level, based on statutory rates. The Fund accrues for such foreign taxes on net realized and unrealized gains at the appropriate rate for each jurisdiction, as applicable.
Distributions to Shareholders
Distributions from net investment income, if any, are declared and paid monthly. Net realized capital gains, if any, are distributed along with the income dividend. Income distributions and capital gain distributions are determined in accordance with federal income tax regulations, which may differ from GAAP.
Guarantees and Indemnifications
Under the Trust's organizational documents and, in some cases, by contract, its officers and trustees are indemnified against certain liabilities arising out of the performance of their duties to the Trust or its funds. In addition, certain of the Fund's contracts with its service providers contain general indemnification clauses. The Fund's maximum exposure under these arrangements is unknown since the amount of any future claims that may be made against the Fund cannot be determined, and the Fund has no historical basis for predicting the likelihood of any such claims.
Recent Accounting Pronouncement
Fair Value Measurements
In May 2011, the Financial Accounting Standards Board (FASB) issued ASU No. 2011-04 modifying Topic 820, Fair Value Measurements. At the same time, the International Accounting Standards Board (IASB) issued International Financial Reporting Standard 13, Fair Value Measurement. The objective of the FASB and IASB is the convergence of their guidance on fair value measurements and disclosures.
Annual Report 2012
26
Columbia International Bond Fund
Notes to Financial Statements (continued)
May 31, 2012
Specifically, ASU No. 2011-04 requires reporting entities to disclose: i) the amounts of any transfers between Level 1 and Level 2, and the reasons for the transfers, ii) for Level 3 fair value measurements, a) quantitative information about significant unobservable inputs used, b) a description of the valuation processes used by the reporting entity and c) a narrative description of the sensitivity of the fair value measurement to changes in unobservable inputs if a change in those inputs might result in a significantly higher or lower fair value measurement. The effective date of ASU No. 2011-04 is for interim and annual periods beginning after December 15, 2011. At this time, management is evaluating the implications of this guidance and the impact it will have on the financial statement amounts and footnote disclosures, if any.
Note 3. Fees and Compensation Paid to Affiliates
Investment Management Fees
Under an Investment Management Services Agreement, Columbia Management Investment Advisers, LLC (the Investment Manager), a wholly-owned subsidiary of Ameriprise Financial, Inc. (Ameriprise Financial), determines which securities will be purchased, held or sold. Effective July 1, 2011, the management fee is an annual fee that is equal to a percentage of the Fund's average daily net assets that declines from 0.57% to 0.47% as the Fund's net assets increase. Prior to July 1, 2011, the management fee was equal to a percentage of the Fund's average daily net assets that declined from 0.55% to 0.44% as the Fund's net assets increased. The effective management fee rate for the year ended May 31, 2012, was 0.57% of the Fund's average daily net assets.
Administration Fees
Under an Administrative Services Agreement, the Investment Manager serves as the Fund Administrator. Effective July 1, 2011, the Fund pays the Fund Administrator an annual fee for administration and accounting services equal to a percentage of the Fund's average daily net assets that declines from 0.08% to 0.05% as the Fund's net assets increase. Prior to July 1, 2011, the administration fee was equal to the annual rate of 0.05% of the Fund's average daily net assets. The effective administration fee rate for the year ended May 31, 2012, was 0.08% of the Fund's average daily net assets.
Pricing and Bookkeeping Fees
Prior to June 27, 2011, the Fund had entered into a Financial Reporting Services Agreement (the Financial Reporting Services Agreement) with State Street Bank and Trust Company (State Street) and the Investment Manager pursuant to which State Street provided financial reporting services to the Fund. The Fund also entered into an Accounting Services Agreement (collectively with the Financial Reporting Services Agreement, the State Street Agreements) with State Street and the Investment Manager pursuant to which State Street provided accounting services to the Fund. Under the State Street Agreements, the Fund paid State Street an annual fee of $38,000 paid monthly plus an additional monthly fee based on an annualized percentage rate of average daily net assets of the Fund for the month. The aggregate fee did not exceed $140,000 per year (exclusive of out-of-pocket expenses and charges). The Fund also reimbursed State Street for certain out-of-pocket expenses and charges. Effective June 27, 2011, these services are now provided under the Administrative Services Agreement discussed above.
Compensation of Board Members
Board members are compensated for their services to the Fund as disclosed in the Statement of Operations. The Trust's eligible Trustees may participate in a Deferred Compensation Plan (the Plan) which may be terminated at any time. Obligations of the Plan will be paid solely out of the Fund's assets.
Compensation of Chief Compliance Officer
The Board has appointed a Chief Compliance Officer to the Fund in accordance with federal securities regulations. The Fund pays its pro-rata share of the expenses associated with the Chief Compliance Officer. The Fund's expenses for the Chief Compliance Officer will not exceed $15,000 per year.
Transfer Agent Fees
Under a Transfer and Dividend Disbursing Agent Agreement, Columbia Management Investment Services Corp. (the Transfer Agent), an affiliate of the Investment Manager and a wholly-owned subsidiary of Ameriprise Financial, is responsible for providing transfer agency services to the Fund. The Transfer Agent has contracted with Boston Financial Data Services (BFDS) to serve as sub-transfer agent.
The Transfer Agent receives monthly account-based service fees based on the number of open accounts and is reimbursed by the Fund for the fees and expenses the Transfer Agent pays to financial intermediaries that maintain omnibus accounts with the Fund that is a percentage of the average aggregate value of the Fund's shares maintained in each such omnibus account (other than omnibus accounts for which American Enterprise Investment Services Inc. is the broker of record or accounts where the beneficial shareholder is a customer of Ameriprise Financial Services, Inc., which are paid a per account fee). The Transfer Agent pays the fees of BFDS for services as sub-transfer agent and is not entitled to
Annual Report 2012
27
Columbia International Bond Fund
Notes to Financial Statements (continued)
May 31, 2012
reimbursement for such fees from the Fund (with the exception of out-of-pocket fees).
The Transfer Agent also receives compensation from fees for various shareholder services and reimbursements for certain out-of-pocket fees. Class I shares do not pay transfer agent fees.
For the year ended May 31, 2012, the Fund's effective transfer agent fee rates as a percentage of average daily net assets of each class were as follows:
| Class A | | | 0.14 | % | |
| Class C | | | 0.14 | | |
| Class Z | | | 0.14 | | |
An annual minimum account balance fee of $20 may apply to certain accounts with a value below the Fund's initial minimum investment requirements to reduce the impact of small accounts on transfer agent fees. These minimum account balance fees are recorded as part of expense reductions in the Statement of Operations. For the year ended May 31, 2012, no minimum account balance fees were charged by the Fund.
Distribution and Service Fees
The Fund has an agreement with Columbia Management Investment Distributors, Inc. (the Distributor), an affiliate of the Investment Manager and a wholly-owned subsidiary of Ameriprise Financial, for distribution and shareholder services. Pursuant to Rule 12b-1 under the 1940 Act, the Board has approved, and the Fund has adopted, distribution and shareholder service plans (the Plans) which set the distribution and service fees for the Fund. These fees are calculated daily and are intended to compensate the Distributor and/or eligible selling and/or servicing agents for selling shares of the Fund and providing services to investors.
The Plans require the payment of a monthly service fee to the Distributor at the maximum annual rate of 0.25% of the average daily net assets attributable to Class A and Class C shares of the Fund. The Plans also require the payment of a monthly distribution fee to the Distributor at the maximum annual rate of 0.75% of the average daily net assets attributable to Class C shares only.
Sales Charges
Sales charges, including front-end charges and CDSCs, received by the Distributor for distributing Fund shares were $16,071 for Class A and $64 for Class C shares for the year ended May 31, 2012.
Expenses Waived/Reimbursed by the Investment Manager and its Affiliates
Effective July 1, 2011, the Investment Manager and certain of its affiliates have contractually agreed to waive fees and/or reimburse expenses (excluding certain fees and expenses described below), through September 31, 2012, unless sooner terminated at the sole discretion of the Board, so that the Fund's net operating expenses, after giving effect to fees waived/expenses reimbursed and any balance credits and/or overdraft charges from the Fund's custodian, do not exceed the following annual rates as a percentage of the class' average daily net assets:
| Class A | | | 1.10 | % | |
| Class C | | | 1.85 | | |
| Class I | | | 0.81 | | |
| Class Z | | | 0.85 | | |
Prior to July 1, 2011, the Investment Manager and its affiliates contractually agreed to waive fees and/or reimburse expenses (excluding certain fees and expenses described below), so that the Fund's net operating expenses, after giving effect to fees waived/expenses reimbursed and any balance credits from the Fund's custodian, did not exceed the following annual rates as a percentage of the class' average daily net assets:
| Class A | | | 1.10 | % | |
| Class C | | | 1.85 | | |
| Class I | | | 0.84 | | |
| Class Z | | | 0.85 | | |
Under the agreement, the following fees and expenses are excluded from the waiver/reimbursement commitment, and therefore will be paid by the Fund, if applicable: taxes (including foreign transaction taxes), expenses associated with investments in affiliated and non-affiliated pooled investment vehicles (including mutual funds and exchange traded funds), transaction costs and brokerage commissions, costs related to any securities lending program, dividend expenses associated with securities sold short, inverse floater program fees and expenses, transaction charges and interest on borrowed money, interest, extraordinary expenses and any other expenses the exclusion of which is specifically approved by the Board. This agreement may be modified or amended only with approval from all parties.
Note 4. Federal Tax Information
The timing and character of income and capital gain distributions are determined in accordance with income tax regulations, which may differ from GAAP because of temporary or permanent book to tax differences.
For the year ended May 31, 2012, these differences are primarily due to differing treatment for Trustees' deferred compensation, foreign currency transactions, market discount/premium, paydown reclassifications, post-October capital losses and recognition of unrealized appreciation (depreciation) for certain derivative investments.
Annual Report 2012
28
Columbia International Bond Fund
Notes to Financial Statements (continued)
May 31, 2012
To the extent these differences are permanent, reclassifications are made among the components of the Fund's net assets in the Statement of Assets and Liabilities. Temporary differences do not require reclassifications. In the Statement of Assets and Liabilities the following reclassifications were made:
| Undistributed net investment income | | $ | 10,408 | | |
| Accumulated net realized loss | | | (16,285 | ) | |
| Paid-in capital | | | 5,877 | | |
Net investment income and net realized gains (losses), as disclosed in the Statement of Operations, and net assets were not affected by this reclassification.
The tax character of distributions paid during the years indicated was as follows:
| Year Ended May 31, | | 2012 | | 2011 | |
| Ordinary income | | $ | 1,600,953 | | | $ | 695,472 | | |
| Long-term capital gains | | | — | | | | 19,794 | | |
Short-term capital gain distributions, if any, are considered ordinary income distributions for tax purposes.
At May 31, 2012, the components of distributable earnings on a tax basis were as follows:
| Undistributed ordinary income | | $ | 261,459 | | |
| Unrealized appreciation | | | 330,472 | | |
At May 31, 2012, the cost of investments for federal income tax purposes was $59,269,540 and the aggregate gross unrealized appreciation and depreciation based on that cost was:
| Unrealized appreciation | | $ | 2,391,097 | | |
| Unrealized depreciation | | | (2,060,625 | ) | |
| Net unrealized appreciation | | | 330,472 | | |
The following capital loss carryforward, determined at May 31, 2012, may be available to reduce taxable income arising from future net realized gains on investments, if any, to the extent permitted by the Internal Revenue Code:
| Year of Expiration | | Amount ($) | |
| Unlimited short-term | | | 3,615 | | |
| Unlimited long-term | | | 62,532 | | |
Unlimited capital loss carryforwards are required to be utilized prior to any capital losses which carry an expiration date. As a result of this ordering rule, capital loss carryforwards which carry an expiration date may be more likely to expire unused.
Under current tax rules, regulated investment companies can elect to treat certain late-year ordinary losses incurred and post-October capital losses (capital losses realized after October 31) as arising on the first day of the following taxable year. As of May 31, 2012, the Fund will elect to treat post-October capital losses of $433,131 as arising on June 1, 2012.
Management of the Fund has concluded that there are no significant uncertain tax positions that would require recognition in the financial statements. However, management's conclusion may be subject to review and adjustment at a later date based on factors including, but not limited to, new tax laws, regulations, and administrative interpretations (including relevant court decisions). Generally, the Fund's federal tax returns for the prior three fiscal years remain subject to examination by the Internal Revenue Service.
Note 5. Portfolio Information
The cost of purchases and proceeds from sales of securities, excluding short-term obligations, aggregated to $27,517,874 and $11,470,091, respectively, for the year ended May 31, 2012.
Note 6. Lending of Portfolio Securities
Effective June 27, 2011, the Fund has entered into a Master Securities Lending Agreement (the Agreement) with JPMorgan Chase Bank, N.A. (JPMorgan). The Agreement, which replaces the previous securities lending arrangement with State Street, authorizes JPMorgan as lending agent to lend securities to authorized borrowers in order to generate additional income on behalf of the Fund. Pursuant to the Agreement, the securities loaned are secured by cash or securities that either are issued or guaranteed as to principal and interest by the U.S. government, its agencies, authorities or instrumentalities with value equal to at least 100% of the market value of the loaned securities. Any additional collateral required to maintain those levels due to market fluctuations of the loaned securities is requested to be delivered the following business day. Cash collateral received is invested by the lending agent on behalf of the Fund into authorized investments pursuant to the Agreement. The investments made with the cash collateral are listed in the Portfolio of Investments. The values of such investments and any uninvested cash collateral are disclosed in the Statement of Assets and Liabilities along with the related obligation to return the collateral upon the return of the securities loaned.
Risks of delay in recovery of securities or even loss of rights in the securities may occur should the borrower of the securities fail financially. Risks may also arise to the extent that the value of the securities loaned increases above the value of the collateral received. JPMorgan will indemnify the Fund from losses resulting from a borrower's failure to return a loaned security when due. Such indemnification does not extend to losses associated with declines in the value of cash collateral investments. The Investment Manager is not responsible for any losses incurred by the Fund in connection with the
Annual Report 2012
29
Columbia International Bond Fund
Notes to Financial Statements (continued)
May 31, 2012
securities lending program. Loans are subject to termination by the Fund or the borrower at any time, and are, therefore, not considered to be illiquid investments.
Pursuant to the Agreement, the Fund receives income for lending its securities either in the form of fees or by earning interest on invested cash collateral, net of negotiated rebates paid to borrowers and fees paid to the lending agent for services provided and any other securities lending expenses. The Fund continues to earn and accrue interest and dividends on the securities loaned.
Prior to June 27, 2011, the Fund participated in a securities lending arrangement with State Street. Each security on loan was collateralized in an amount at least equal to the market value of the securities loaned plus accrued income from the investment of collateral. The income generated by the investment of the collateral, net of any fees remitted to State Street as the lending agent and borrower rebates, was paid to the Fund.
For the year ended May 31, 2012, the Fund did not participate in securities lending activity.
Note 7. Custody Credits
Prior to June 27, 2011, the Fund had an agreement with its custodian bank under which custody fees may have been reduced by balance credits. These credits are recorded as part of expense reductions on the Statement of Operations. The Fund could have invested a portion of the assets utilized in connection with the expense offset arrangement in an income-producing asset if they had not entered into such an agreement. Subsequent to this date, the Fund may invest its daily balance in an affiliated money market fund as detailed below. For the period June 1, 2011 through June 26, 2011, there were no custody credits.
Note 8. Affiliated Money Market Fund
Effective June 27, 2011, the Fund may invest its daily cash balances in Columbia Short-Term Cash Fund, an affiliated money market fund established for the exclusive use by the Fund and other affiliated funds. The income earned by the Fund from such investments is included as "Dividends from affiliates" in the Statement of Operations. As an investing fund, the Fund indirectly bears its proportionate share of the expenses of Columbia Short-Term Cash Fund.
Note 9. Shareholder Concentration
At May 31, 2012, one unaffiliated shareholder account owned 15.1% of the outstanding shares of the Fund. The Fund has no knowledge about whether any portion of those shares was owned beneficially by such account. Affiliated shareholder accounts owned 75.7% of the outstanding shares of the Fund. Subscription and redemption activity by concentrated accounts may have a significant effect on the operations of the Fund.
Note 10. Line of Credit
The Fund has entered into a revolving credit facility with a syndicate of banks led by JPMorgan whereby the Fund may borrow for the temporary funding of shareholder redemptions or for other temporary or emergency purposes. The credit facility became effective on June 27, 2011, replacing a prior credit facility. The credit facility agreement, as amended, which is a collective agreement between the Fund and certain other funds managed by the Investment Manager, severally and not jointly, permits collective borrowings up to $500 million. Pursuant to a December 13, 2011 amendment to the credit facility agreement, interest is charged to each participating fund based on its borrowings at a rate equal to the higher of (i) the overnight federal funds rate plus 1.00% or (ii) the one-month LIBOR rate plus 1.00%. Each borrowing under the credit facility matures no later than 60 days after the date of borrowing. The Fund also pays a commitment fee equal to its pro rata share of the amount of the credit facility at a rate of 0.08% per annum. For the period June 27, 2011 through December 12, 2011, interest was charged to each participating fund based on its borrowings at a rate equal to the sum of the federal funds rate plus (i) 1.25% per annum plus (ii) if one-month LIBOR exceeds the federal funds rate, the amount of such excess. The Fund also paid a commitment fee equal to its pro rata share of the amount of the credit facility at a rate of 0.10% per annum.
Prior to June 27, 2011, the Fund and certain other funds managed by the Investment Manager participated in a $150 million committed, unsecured revolving credit facility provided by State Street. Interest was charged to each fund based on its borrowings at a rate equal to the greater of the (i) federal funds rate plus 1.25% per annum or (ii) the overnight LIBOR rate plus 1.25% per annum. The Fund also paid a commitment fee equal to its pro rata share of the amount of the credit facility at a rate of 0.125% per annum.
The Fund had no borrowings during the year ended May 31, 2012.
Note 11. Significant Risks
Non-Diversification Risk
A non-diversified fund is permitted to invest a greater percentage of its total assets in fewer issuers than a diversified fund. The Fund may, therefore, have a greater risk of loss from a few issuers than a similar fund that invests more broadly.
Annual Report 2012
30
Columbia International Bond Fund
Notes to Financial Statements (continued)
May 31, 2012
Foreign Securities Risk
Investing in foreign securities may include certain risks and considerations not typically associated with investing in U.S. securities, such as fluctuating currency values and changing local and regional economic, political and social conditions, which may result in greater market volatility. In addition, certain foreign securities may not be as liquid as U.S. securities. Investing in emerging markets may accentuate these risks.
Investments in emerging market countries are subject to additional risk. The risk of foreign investments is typically increased in less developed countries. These countries are also more likely to experience high levels of inflation, deflation or currency devaluation which could hurt their economies and securities markets.
Note 12. Subsequent Events
Management has evaluated the events and transactions that have occurred through the date the financial statements were issued. Other than as noted below, there were no items requiring adjustment of the financial statements or additional disclosure.
On June 6, 2012, the Board approved a change in the Fund's fiscal year end from May 31 to October 31. The change will be effective on October 31, 2012.
Note 13. Information Regarding Pending and Settled Legal Proceedings
In December 2005, without admitting or denying the allegations, American Express Financial Corporation (AEFC, which is now known as Ameriprise Financial, Inc. (Ameriprise Financial)) entered into settlement agreements with the Securities and Exchange Commission (SEC) and Minnesota Department of Commerce (MDOC) related to market timing activities. As a result, AEFC was censured and ordered to cease and desist from committing or causing any violations of certain provisions of the Investment Advisers Act of 1940, the Investment Company Act of 1940, and various Minnesota laws. AEFC agreed to pay disgorgement of $10 million and civil money penalties of $7 million. AEFC also agreed to retain an independent distribution consultant to assist in developing a plan for distribution of all disgorgement and civil penalties ordered by the SEC in accordance with various undertakings detailed at www.sec.gov/litigation/admin/ia-2451.pdf. Ameriprise Financial and its affiliates have cooperated with the SEC and the MDOC in these legal proceedings, and have made regular reports to the funds' Boards of Trustees.
Ameriprise Financial and certain of its affiliates have historically been involved in a number of legal, arbitration and regulatory proceedings, including routine litigation, class actions, and governmental actions, concerning matters arising in connection with the conduct of their business activities. Ameriprise Financial believes that the Funds are not currently the subject of, and that neither Ameriprise Financial nor any of its affiliates are the subject of, any pending legal, arbitration or regulatory proceedings that are likely to have a material adverse effect on the Funds or the ability of Ameriprise Financial or its affiliates to perform under their contracts with the Funds. Ameriprise Financial is required to make 10-Q, 10-K and, as necessary, 8-K filings with the Securities and Exchange Commission on legal and regulatory matters that relate to Ameriprise Financial and its affiliates. Copies of these filings may be obtained by accessing the SEC website at www.sec.gov.
There can be no assurance that these matters, or the adverse publicity associated with them, will not result in increased fund redemptions, reduced sale of fund shares or other adverse consequences to the Funds. Further, although we believe proceedings are not likely to have a material adverse effect on the Funds or the ability of Ameriprise Financial or its affiliates to perform under their contracts with the Funds, these proceedings are subject to uncertainties and, as such, we are unable to estimate the possible loss or range of loss that may result. An adverse outcome in one or more of these proceedings could result in adverse judgments, settlements, fines, penalties or other relief that could have a material adverse effect on the consolidated financial condition or results of operations of Ameriprise Financial.
Annual Report 2012
31
Columbia International Bond Fund
Report of Independent Registered Public Accounting Firm
To the Trustees of Columbia Funds Series Trust I and
the Shareholders of Columbia International Bond Fund
In our opinion, the accompanying statement of assets and liabilities, including the portfolio of investments, and the related statements of operations and of changes in net assets and the financial highlights present fairly, in all material respects, the financial position of Columbia International Bond Fund (the "Fund") (a series of Columbia Funds Series Trust I) at May 31, 2012, the results of its operations for the year then ended, the changes in its net assets for each of the two years in the period then ended and the financial highlights for each of the periods indicated, in conformity with accounting principles generally accepted in the United States of America. These financial statements and financial highlights (hereafter referred to as "financial statements") are the responsibility of the Fund's management. Our responsibility is to express an opinion on these financial statements based on our audits. We conducted our audits of these financial statements in accordance with the standards of the Public Company Accounting Oversight Board (United States). Those standards require that we plan and perform the audit to obtain reasonable assurance about whether the financial statements are free of material misstatement. An audit includes examining, on a test basis, evidence supporting the amounts and disclosures in the financial statements, assessing the accounting principles used and significant estimates made by management, and evaluating the overall financial statement presentation. We believe that our audits, which included confirmation of securities at May 31, 2012 by correspondence with the custodian and brokers, provide a reasonable basis for our opinion.
PricewaterhouseCoopers LLP
Minneapolis, Minnesota
July 20, 2012
Annual Report 2012
32
Columbia International Bond Fund
Board Members and Officers
The Trustees serve terms of indefinite duration. The names, addresses and birth years of the Trustees and Officers of the Funds in Columbia Funds Series Trust I, the year each was first elected or appointed to office, their principal business occupations during at least the last five years, the number of Funds overseen by each Trustee and other directorships they hold are shown below. Each officer listed below serves as an officer of each Fund in Columbia Funds Series Trust I.
Independent Trustees
Name, Address and Year of Birth,
Position with Funds, Year First
Elected or Appointed to Office | | Principal Occupation(s) During Past Five Years, Number of Funds in Columbia
Funds Complex Overseen by Trustee, Other Directorships Held
| |
Rodman L. Drake (Born 1943)
c/o Columbia Management Investment Advisers, LLC
225 Franklin Street
Boston, MA 02110
Trustee (since 1994) and
Chairman of the Board (since 2009) | | Independent consultant since 2010; Co-Founder of Baringo Capital LLC (private equity) from 1997 to 2008; CEO of Crystal River Capital, Inc. (real estate investment trust) from 2003 to 2010; Oversees 52; Jackson Hewitt Tax Service Inc. (tax preparation services from 2004 to 2011); Celgene Corporation (global biotechnology company); Student Loan Corporation (student loan provider from 2005 to 2010); Celgene Corporation (global biotechnology company); The Helios Funds and Brookfield Funds (closed-end funds); Crystal River Capital, Inc. from 2005 to 2010; Parsons Brinckerhoff from 1995 to 2008; and Apex Silver Mines Ltd. from 2007 to 2009 | |
|
Douglas A. Hacker (Born 1955)
c/o Columbia Management Investment Advisers, LLC
225 Franklin Street
Boston, MA 02110
Trustee (since 1996) | | Independent business executive since May 2006; Executive Vice President — Strategy of United Airlines from December 2002 to May 2006; President of UAL Loyalty Services (airline marketing company) from September 2001 to December 2002; Executive Vice President and Chief Financial Officer of United Airlines from July 1999 to September 2001. Oversees 52; Nash Finch Company (food distributor); Aircastle Limited (aircraft leasing); and SeaCube Container Leasing Ltd. (container leasing) | |
|
Janet Langford Kelly (Born 1957)
c/o Columbia Management Investment Advisers, LLC
225 Franklin Street
Boston, MA 02110
Trustee (since 1996) | | Senior Vice President, General Counsel and Corporate Secretary, ConocoPhillips (integrated energy company) since September 2007; Deputy General Counsel — Corporate Legal Services, ConocoPhillips from August 2006 to August 2007; Partner, Zelle, Hofmann, Voelbel, Mason & Gette LLP (law firm) from March 2005 to July 2006; Adjunct Professor of Law, Northwestern University from September 2004 to June 2006; Director, UAL Corporation (airline) from February 2006 to July 2006; Chief Administrative Officer and Senior Vice President, Kmart Holding Corporation (consumer goods) from September 2003 to March 2004. Oversees 52; None | |
|
Nancy T. Lukitsh (Born 1956)
c/o Columbia Management Investment Advisers, LLC
225 Franklin Street
Boston, MA 02110
Trustee (since 2011) | | Senior Vice President, Partner and Director of Marketing, Wellington Management Company, LLP (investment adviser) from 1997 to 2010; Chair, Wellington Management Investment Portfolios (commingled non-U.S. investment pools) from 2007 to 2010; Director, Wellington Trust Company, NA and other Wellington affiliates from 1997 to 2010. Oversees 52; None | |
|
William E. Mayer (Born 1940)
c/o Columbia Management Investment Advisers, LLC
225 Franklin Street
Boston, MA 02110
Trustee (since 1994) | | Partner, Park Avenue Equity Partners (private equity) since February 1999; Dean and Professor, College of Business and Management, University of Maryland from 1992 to 1996. Oversees 52; DynaVox Inc. (speech creation); Lee Enterprises (print media); WR Hambrecht + Co. (financial service provider) from 2000 to 2012; BlackRock Kelso Capital Corporation (investment company) | |
|
David M. Moffett (Born 1952)
c/o Columbia Management Investment Advisers, LLC
225 Franklin Street
Boston, MA 02110
Trustee (since 2011) | | Retired. Chief Executive Officer, Federal Home Loan Mortgage Corporation, from 2008 to 2009; Senior Adviser, Global Financial Services Group, Carlyle Group, Inc., from 2007 to 2008; Vice Chairman and Chief Financial Officer, U.S. Bancorp, from 1993 to 2007. Oversees 52; CIT Group Inc. (commercial and consumer finance); eBay Inc. (online trading community); MBIA Inc. (financial service provider); E.W. Scripps Co. (print and television media), Building Materials Holding Corp. (building materials and construction services); and University of Oklahoma Foundation. | |
|
Charles R. Nelson (Born 1942)
c/o Columbia Management Investment Advisers, LLC
225 Franklin Street
Boston, MA 02110
Trustee (since 1981) | | Retired Professor Emeritus, University of Washington, since 2011; Professor of Economics, University of Washington from January 1976 to 2011; Ford and Louisa Van Voorhis Professor of Political Economy, University of Washington from 1993 to 2011; Adjunct Professor of Statistics, University of Washington from 1980 to 2011; Associate Editor, Journal of Money Credit and Banking from 1993 to 2008; consultant on econometric and statistical matters. Oversees 52; None | |
|
John J. Neuhauser (Born 1943)
c/o Columbia Management Investment Advisers, LLC
225 Franklin Street
Boston, MA 02110
Trustee (since 1984) | | President, Saint Michael's College, since August 2007; Director or Trustee of several non-profit organizations, including Fletcher Allen Health Care, Inc.; University Professor, Boston College from November 2005 to August 2007; Academic Vice President and Dean of Faculties, Boston College from August 1999 to October 2005. Oversees 52; Liberty All-Star Equity Fund and Liberty All-Star Growth Fund (closed-end funds) | |
|
Annual Report 2012
33
Columbia International Bond Fund
Board Members and Officers (continued)
Independent Trustees (continued)
Name, Address and Year of Birth,
Position with Funds, Year First
Elected or Appointed to Office | | Principal Occupation(s) During Past Five Years, Number of Funds in Columbia
Funds Complex Overseen by Trustee, Other Directorships Held
| |
Patrick J. Simpson (Born 1944)
c/o Columbia Management Investment Advisers, LLC
225 Franklin Street
Boston, MA 02110
Trustee (since 2000) | | Partner, Perkins Coie LLP (law firm). Oversees 52; None | |
|
Anne-Lee Verville (Born 1945)
c/o Columbia Management Investment Advisers, LLC
225 Franklin Street
Boston, MA 02110
Trustee (since 1998) | | Retired. General Manager — Global Education Industry from 1994 to 1997, President — Application Systems Division from 1991 to 1994, Chief Financial Officer — US Marketing & Services from 1988 to 1991, and Chief Information Officer from 1987 to 1988, IBM Corporation (computer and technology). Oversees 52; Enesco Group, Inc. (producer of giftware and home and garden decor products) from 2001 to 2006 | |
|
The Statement of Additional Information includes additional information about the Trustees of the Funds and is available, without charge, upon request by calling 1-800-345-6611.
Interested Trustee
Name, Address and Year of Birth,
Position with Funds, Year First
Elected or Appointed to Office | | Principal Occupation(s) During Past Five Years, Number of Funds in Columbia
Funds Complex Overseen by Trustee, Other Directorships Held
| |
William F. Truscott (born 1960)
53600 Ameriprise Financial Center
Minneapolis, MN 55474
Senior Vice President (since 2012) | | Chairman of the Board and President, Columbia Management Investment Advisers, LLC since May 2010 and February 2012, respectively (previously President, Chairman of the Board and Chief Investment Officer, from 2001 to April 2010); Chief Executive Officer, U.S. Asset Management & President, Annuities, Ameriprise Financial, Inc. since May 2010 (previously President — U.S. Asset Management and Chief Investment Officer from 2005 to April 2010, and Senior Vice President — Chief Investment Officer, from 2001 to 2005); Director, President and Chief Executive Officer, Ameriprise Certificate Company since 2006; Director and Chief Executive Officer, Columbia Management Investment Distributors, Inc. since May 2010 and February 2012, respectively (previously Chairman of the Board and Chief Executive Officer from 2008 to April 2010); Chairman of the Board and Chief Executive Officer, RiverSource Distributors, Inc. since 2006. Oversees 208; Columbia Funds Board. | |
|
Officers
| Name, Year of Birth and Address | | Principal Occupation(s) During the Past Five Years | |
J. Kevin Connaughton (Born 1964)
225 Franklin Street
Boston, MA 02110
President (since 2009) | | Senior Vice President and General Manager — Mutual Fund Products, Columbia Management Investment Advisers, LLC since May 2010; President, Columbia Funds, since 2009, and RiverSource Funds, since May 2010 (previously Senior Vice President and Chief Financial Officer, Columbia Funds, from June 2008 to January 2009, Treasurer, Columbia Funds, from October 2003 to May 2008, and senior officer of various other affiliated funds since 2000); Managing Director, Columbia Management Advisors, LLC from December 2004 to April 2010. | |
|
Michael G. Clarke (Born 1969)
225 Franklin Street
Boston, MA 02110
Treasurer (since 2011) and Chief Financial Officer (since 2009) | | Vice President, Columbia Management Investment Advisers, LLC since May 2010; Managing Director of Fund Administration, Columbia Management Advisors, LLC, from September 2004 to April 2010; senior officer of Columbia Funds and affiliated funds since 2002. | |
|
Scott R. Plummer (Born 1959)
5228 Ameriprise Financial Center
Minneapolis, MN 55474
Senior Vice President, Assistant Secretary and Chief Legal Officer (since 2010) | | Senior Vice President, Chief Legal Officer and Assistant Secretary, Columbia Management Investment Advisers, LLC since June 2005; Vice President and Lead Chief Counsel — Asset Management, Ameriprise Financial, Inc. since May 2010 (previously Vice President and Chief Counsel — Asset Management, from 2005 to April 2010); Vice President, Chief Counsel and Assistant Secretary, Columbia Management Investment Distributors, Inc. since 2008; Vice President, General Counsel and Secretary, Ameriprise Certificate Company since 2005; Chief Counsel, RiverSource Distributors, Inc. since 2006; Vice President, General Counsel and Secretary, RiverSource Funds since December 2006; Senior Vice President, Secretary and Chief Legal Officer, Columbia Funds, since May 2010. | |
|
Annual Report 2012
34
Columbia International Bond Fund
Board Members and Officers (continued)
Officers (continued)
| Name, Year of Birth and Address | | Principal Occupation(s) During the Past Five Years | |
William F. Truscott (Born 1960)
53600 Ameriprise Financial Center
Minneapolis, MN 55474
Senior Vice President (since 2010) | | Chairman of the Board and President, Columbia Management Investment Advisers, LLC since May 2010 and February 2012, respectively (previously President, Chairman of the Board and Chief Investment Officer, from 2001 to April 2010); Chief Executive Officer, U.S. Asset Management & President, Annuities, Ameriprise Financial, Inc. since May 2010 (previously President — U.S. Asset Management and Chief Investment Officer from 2005 to April 2010); Director, President and Chief Executive Officer, Ameriprise Certificate Company since 2006; Director and Chief Executive Officer, Columbia Management Investment Distributors, Inc. since May 2010 and February 2012, respectively (previously Chairman of the Board and Chief Executive Officer from 2008 to April 2010); Chairman of the Board and Chief Executive Officer, RiverSource Distributors, Inc. since 2006. | |
|
Thomas P. McGuire (Born 1972)
225 Franklin Street
Boston, MA 02110
Chief Compliance Officer (since 2012) | | Vice President — Asset Management Compliance, Columbia Management Investment Advisers, LLC since 2010; Chief Compliance Officer, Ameriprise Certificate Company, since September 2010; Compliance Executive, Bank of America, 2005-2010. | |
|
Colin Moore (Born 1958)
225 Franklin Street
Boston, MA 02110
Senior Vice President (since 2010) | | Director and Chief Investment Officer, Columbia Management Investment Advisers, LLC since May 2010; Manager, Managing Director and Chief Investment Officer of Columbia Management Advisors, LLC from 2007 to April 2010; Head of Equities, Columbia Management Advisors, LLC from 2002 to 2007. | |
|
Amy Johnson (Born 1965)
5228 Ameriprise Financial Center
Minneapolis, MN 55474
Vice President (since 2010) | | Senior Vice President and Chief Operating Officer, Columbia Management Investment Advisers, LLC since May 2010 (previously Chief Administrative Officer, from 2009 until April 2010, Vice President — Asset Management and Trust Company Services, from 2006 to 2009, and Vice President — Operations and Compliance from 2004 to 2006). | |
|
Joseph F. DiMaria (Born 1968)
225 Franklin Street
Boston, MA 02110
Vice President (since 2011) and Chief Accounting Officer (since 2008) | | Vice President, Mutual Fund Administration, Columbia Management Investment Advisers, LLC, since May 2010; Director of Fund Administration, Columbia Management Advisors, LLC from January 2006 to April 2010; Head of Tax/Compliance and Assistant Treasurer, Columbia Management Advisors, LLC, from November 2004 to December 2005. | |
|
Stephen T. Welsh (born 1957)
225 Franklin Street
Boston, MA 02110
Vice President (since 2006) | | President and Director, Columbia Management Investment Services Corp. since May 2010; President and Director, Columbia Management Services, Inc. from July 2004 to April 2010; Managing Director, Columbia Management Distributors, Inc. from August 2007 to April 2010. | |
|
Paul D. Pearson (born 1956)
10468 Ameriprise Financial Center
Minneapolis, MN 55474
Vice President and Assistant Treasurer (since 2011) | | Vice President, Investment Accounting, Columbia Management Investment Advisers, LLC, since May 2010; Vice President, Managed Assets, Investment Accounting, Ameriprise Financial Corporation. | |
|
Paul B. Goucher (born 1968)
5228 Ameriprise Financial Center
Minneapolis, MN 55474
Vice President and Assistant Secretary (since 2010) | | Vice President and Chief Counsel of Ameriprise Financial since January 2010 (formerly Vice President and Group Counsel from November 2008 to January 2010); Director, Managing Director and General Counsel of J. & W. Seligman & Co. Incorporated (Seligman) from July 2008 to November 2008 and Managing Director and Associate General Counsel of Seligman from January 2005 to July 2008. | |
|
Christopher O. Petersen (born 1970)
5228 Ameriprise Financial Center
Minneapolis, MN 55474
Vice President (since 2010) and Secretary (since 2011) | | Vice President and Chief Counsel, Ameriprise Financial since January 2010 (formerly Vice President and Group Counsel or Counsel from April 2004 to January 2010); Assistant Secretary of RiverSource Funds since January 2007; officer of Columbia Funds and affiliated funds since 2007. | |
|
Michael E. DeFao (born 1968)
225 Franklin Street
Boston, MA 02110
Vice President and Assistant Secretary (since 2011) | | Vice President and Chief Counsel, Ameriprise Financial since May 2010; Associate General Counsel, Bank of America from June 2005 to April 2010. | |
|
Annual Report 2012
35
Columbia International Bond Fund
Board Consideration and Approval of
Advisory Agreement
On March 7, 2012, the Board of Trustees (the "Board") and the Trustees who are not interested persons (as defined in the Investment Company Act of 1940) of the Trust (the "Independent Trustees") unanimously approved the continuation of the Investment Management Services Agreement (the "Advisory Agreement") with Columbia Management Investment Advisers, LLC (the "Investment Manager") with respect to Columbia International Bond Fund (the "Fund"), a series of the Trust. As detailed below, the Advisory Fees and Expenses Committee (the "Committee") and the Board met on multiple occasions to review and discuss, both among themselves and with the management team of the Investment Manager, materials provided by the Investment Manager before determining to approve the continuation of the Advisory Agreement.
In connection with their deliberations regarding the continuation of the Advisory Agreement, the Committee and the Board requested and evaluated materials from the Investment Manager regarding the Fund and the Advisory Agreement, and discussed these materials with representatives of the Investment Manager at the Committee meeting held on March 6, 2012 and at the Board meeting held on March 7, 2012. In addition, the Board considers matters bearing on the Agreement at most of its other meetings throughout the year and meets regularly with senior management of the Funds and the Investment Manager. Through the Board's Investment Oversight Committees, Trustees also meet with selected Fund portfolio managers and other investment personnel at various times throughout the year. The Committee and the Board also consulted with Fund counsel and with the Independent Trustees' independent legal counsel, who advised on the legal standard for consideration by the Board and otherwise assisted the Board in its deliberations. On March 6, 2012, the Committee recommended that the Board approve the continuation of the Advisory Agreement. On March 7, 2012, the Board, including the Independent Trustees, voting separately, unanimously approved the continuation of the Advisory Agreement for the Fund.
The Committee and the Board considered all information that they, their legal counsel, or the Investment Manager believed reasonably necessary to evaluate and to determine whether to approve the continuation of the Advisory Agreement. In their deliberations, the Trustees did not identify any particular information that was all-important or controlling, and individual Trustees may have attributed different weights to the various factors. The information and factors considered by the Committee and the Board in recommending for approval or approving the continuation of the Advisory Agreement for the Fund included the following:
• Information on the investment performance of the Fund relative to the performance of the Fund's benchmarks and the performance of a group of comparable mutual funds, as determined by an independent third-party data provider;
• Information on the Fund's advisory fees and total expenses, including information comparing the Fund's expenses to those of a group of comparable mutual funds, as determined by an independent third-party data provider;
• The Investment Manager's agreement to contractually limit or cap total operating expenses for the Fund so that total operating expenses (excluding certain fees and expenses, such as transaction costs and certain other investment related expenses, interest, taxes, acquired fund fees and expenses, and extraordinary expenses) would not exceed the median expenses of a group of comparable funds (as determined from time to time, generally annually, by an independent third-party data provider);
• The terms and conditions of the Advisory Agreement, including that the advisory fee rates payable by the Fund would not change;
• The terms and conditions of other agreements and arrangements with affiliates of the Investment Manager relating to the operations of the Fund, including the Administrative Services Agreement, the Distribution Agreement and the Transfer and Dividend Disbursing Agent Agreement, noting in the case of the Transfer and Dividend Disbursing Agent Agreement certain proposed changes to the fee rates payable thereunder;
• Descriptions of various functions performed by the Investment Manager under the Advisory Agreement, including portfolio management and portfolio trading practices;
• Information regarding the management fees and investment performance of any comparable portfolios of other clients of the Investment Manager, including institutional separate accounts; and
• The profitability to the Investment Manager and its affiliates from their relationships with the Fund.
Annual Report 2012
36
Columbia International Bond Fund
Board Consideration and Approval of
Advisory Agreement (continued)
Nature, Extent and Quality of Services to be Provided under the Advisory Agreement
The Committee and the Board considered the nature, extent and quality of services provided to the Fund by the Investment Manager and its affiliates under the Advisory Agreement and under separate agreements for the provision of transfer agency and administrative services, and the resources dedicated to the Fund and the other Columbia Funds by the Investment Manager and its affiliates. The Committee and the Board considered, among other things, the Investment Manager's ability to attract, motivate and retain highly qualified research, advisory and supervisory investment professionals (including personnel and other resources, compensation programs for personnel involved in fund management, reputation and other attributes), the portfolio management services provided by those investment professionals, the quality of the Investment Manager's investment research capabilities and trade execution services, and the other resources that the Investment Manager devotes to the Fund. The Committee and the Board also considered the potential benefits to shareholders of investing in a mutual fund that is part of a fund complex offering exposure to a variety of asset classes and investment disciplines and providing a variety of fund and shareholder services.
The Committee and the Board also considered the professional experience and qualifications of the senior personnel of the Investment Manager. The Committee and the Board noted the compliance programs of and the compliance-related resources provided to the Fund by the Investment Manager and its affiliates, and considered the Investment Manager's ability to provide administrative services to the Fund pursuant to a separate administrative services agreement, including the Investment Manager's ability to coordinate the activities of the Fund's other service providers. After reviewing these and related factors, the Committee and the Board concluded, within the context of their overall conclusions, that the expected nature, extent and quality of the services to be provided to the Fund under the Advisory Agreement supported the continuation of such agreement.
Investment Performance
The Committee and the Board reviewed information about the performance of the Fund over various time periods, including performance information relative to benchmarks and information based on reports of an independent third-party data provider that compared the performance of the Fund to the performance of a group of comparable mutual funds. The Committee and the Board also reviewed a description of the third party's methodology for identifying the Fund's peer groups for purposes of performance and expense comparisons. In the case of each Fund whose performance lagged that of a relevant peer group for certain (although not necessarily all) periods, the Committee and the Board concluded that other factors relevant to performance were sufficient, in light of other considerations, to warrant continuation of the Fund's Advisory Agreement. Those factors varied from fund to fund, but included one or more of the following: (i) that the Fund's performance, although lagging in certain recent periods, was stronger over the longer term; (ii) that the underperformance was attributable, to a significant extent, to investment decisions that were reasonable and consistent with the Fund's investment strategy and policies and that the Fund was performing within a reasonable range of expectations, given those investment decisions, market conditions and the Fund's investment strategy; (iii) that the Fund's performance was competitive when compared to other relevant performance benchmarks or peer groups; and (iv) that the Investment Manager had taken or was taking steps designed to help improve the Fund's investment performance, including, but not limited to, replacing portfolio managers, enhancing the resources supporting the portfolio managers, or modifying investment strategies.
The Committee and the Board noted that, through December 31, 2011, the Fund's performance was in the fiftieth, seventy-fifth and N/A percentiles (where the best performance would be in the first percentile) of its category selected by an independent third-party data provider for the purposes of performance comparisons for the one-, three- and five- year periods, respectively.
The Committee and the Board also considered the Investment Manager's performance and reputation generally, the Investment Manager's historical responsiveness to Board concerns about performance and the Investment Manager's willingness to take steps intended to improve performance. After reviewing these and related factors, the Committee and the Board concluded, within the context of their overall conclusions regarding the Advisory Agreement, that the performance of the Fund and the Investment Manager was sufficient, in light of other considerations, to warrant the continuation of the Advisory Agreement.
Annual Report 2012
37
Columbia International Bond Fund
Board Consideration and Approval of
Advisory Agreement (continued)
Investment Advisory Fee Rates and Other Expenses
The Committee and the Board considered the advisory fees to be charged to the Fund under the Advisory Agreement as well as the total expenses to be incurred by the Fund. In assessing the reasonableness of the fees under the Advisory Agreement, the Committee and the Board considered, among other information, the Fund's advisory fee and its expected total expense ratio as a percentage of average daily net assets. The Committee and the Board noted that the Fund's actual management fee and total net expense ratio are ranked in the first and fourth quintiles, respectively, against the Fund's expense universe as determined by an independent third-party data provider for purposes of expense comparison. The Committee and the Board also took into account the fee waiver and expense limitation arrangements agreed to by the Investment Manager, as noted above.
The Committee and the Board also considered the fact that the advisory fee rates payable by the Fund to the Investment Manager under the Advisory Agreement were the same as those currently paid by the Fund to the Investment Manager.
The Committee and the Board also received and considered information about the advisory fees charged by the Investment Manager to institutional separate accounts. In considering the fees charged to those accounts, the Committee and the Board took into account, among other things, the Investment Manager's representations about the differences between managing mutual funds as compared to other types of accounts, including differences in the services provided, differences in the risk profile of such business for the Investment Manager and the additional resources required to manage mutual funds effectively. In evaluating the Fund's advisory fees, the Committee and the Board also took into account the demands, complexity and quality of the investment management of the Fund.
After reviewing these and related factors, the Committee and the Board concluded, within the context of their overall conclusions, that the advisory fee rates and expenses of the Fund supported the continuation of the Advisory Agreement.
Costs of Services to be Provided and Profitability
The Committee and the Board also took note of the costs of the services provided (both on an absolute and relative basis) and the profitability to the Investment Manager and its affiliates in connection with their relationships with the Fund. In evaluating these considerations, the Committee and the Board took note of the advisory fees charged by the Investment Manager to other clients, including fees charged by the Investment Manager to any institutional separate account clients with similar investment strategies to those of the Fund.
The Committee and the Board also considered the compensation directly or indirectly received by the Investment Manager's affiliates in connection with their relationships with the Fund. The Committee and the Board reviewed information provided by management as to the profitability of the Investment Manager and its affiliates of their relationships with the Fund, and information about the allocation of expenses used to calculate profitability. When reviewing profitability, the Committee and the Board also considered court cases in which adviser profitability was an issue in whole or in part, the performance of the fund, the expense ratio of the fund, and the implementation of expense limitations with respect to the fund. The Committee and the Board also considered information provided by the Investment Manager regarding its financial condition and comparing its profitability to that of other asset management firms that are, or are subsidiaries of, publicly traded companies.
After reviewing these and related factors, the Committee and the Board concluded, within the context of their overall conclusions, that the profitability to the Investment Manager and its affiliates from their relationships with the Fund supported the continuation of the Advisory Agreement.
Economies of Scale
The Committee and the Board considered the potential existence of economies of scale in the provision by the Investment Manager of services to the Fund, to groups of related funds, and to the Investment Manager's investment advisory clients as a whole, and whether those economies of scale were shared with the Fund through breakpoints in investment advisory fees or other means, such as expense limitation arrangements and additional investments by the Investment Manager in investment, trading and compliance resources. The Committee and the Board noted that the investment advisory fee schedules for the Fund contained breakpoints that would reduce the fee rate on assets above specified threshold levels.
Annual Report 2012
38
Columbia International Bond Fund
Board Consideration and Approval of
Advisory Agreement (continued)
In considering these issues, the Committee and the Board also considered the costs of the services provided (both on an absolute and relative basis) and the profitability to the Investment Manager and its affiliates from their relationships with the Fund, as discussed above. After reviewing these and related factors, the Committee and the Board concluded, within the context of their overall conclusions, that the extent to which economies of scale were expected to be shared with the Fund supported the continuation of the Advisory Agreement.
Other Benefits to the Investment Manager
The Committee and the Board received and considered information regarding "fall-out" or ancillary benefits received by the Investment Manager and its affiliates as a result of their relationships with the Fund, such as the engagement of the Investment Manager to provide administrative services to the Fund and the engagement of the Investment Manager's affiliates to provide distribution and transfer agency services to the Fund. The Committee and the Board considered that the Fund's distributor retains a portion of the distribution fees from the Fund and receives a portion of the sales charges on sales or redemptions of certain classes of shares of the Fund. The Committee and the Board also considered the benefits of research made available to the Investment Manager by reason of brokerage commissions generated by the Fund's securities transactions, and reviewed information about the Investment Manager's practices with respect to allocating portfolio brokerage for brokerage and research services. The Committee and the Board considered the possible conflicts of interest associated with certain fall-out or other ancillary benefits and the reporting, disclosure and other processes that would be in place to address such possible conflicts of interest. The Committee and the Board recognized that the Investment Manager's profitability would be somewhat lower without these benefits.
Conclusion
The Committee and the Board reviewed all of the above considerations in reaching their decisions to recommend or approve the continuation of the Advisory Agreement. No single item was identified as paramount or controlling, and individual Trustees may have attributed different weights to various factors. Based on their evaluation of all factors that they deemed to be material, including those factors described above, and assisted by the advice of independent legal counsel, the Board, including the Independent Trustees, voting separately, unanimously approved the continuation of the Advisory Agreement.
Annual Report 2012
39
This page intentionally left blank.
Annual Report 2012
40
Columbia International Bond Fund
Important Information About This Report
Each fund mails one shareholder report to each shareholder address. If you would like more than one report, please call shareholder services at 800.345.6611 and additional reports will be sent to you.
The policy of the Board is to vote the proxies of the companies in which each fund holds investments consistent with the procedures as stated in the Statement of Additional Information (SAI). You may obtain a copy of the SAI without charge by calling 800.345.6611; contacting your financial intermediary; visiting columbiamanagement.com; or searching the website of the Securities and Exchange Commission (SEC) at http://www.sec.gov. Information regarding how each fund voted proxies relating to portfolio securities is filed with the SEC by August 31 for the most recent 12-month period ending June 30 of that year, and is available without charge by visiting columbiamanagement.com; or searching the website of the SEC at sec.gov.
Each fund files a complete schedule of portfolio holdings with the SEC for the first and third quarters of each fiscal year on Form N-Q. Each fund's Form N-Q is available on the SEC's website at sec.gov and may be reviewed and copied at the SEC's Public Reference Room in Washington, D.C. Information on the operation of the Public Reference Room may be obtained by calling 800.SEC.0330. Each fund's complete schedule of portfolio holdings, as filed on Form N-Q, can also be obtained without charge, upon request, by calling 800.345.6611.
Annual Report 2012
41

Columbia International Bond Fund
P.O. Box 8081
Boston, MA 02266-8081
columbiamanagement.com
This information is for use with concurrent or prior delivery of a fund prospectus. Please read and consider the investment objectives, risks, charges and expenses for any fund carefully before investing. For a prospectus which contains this and other important information about the fund go to columbiamanagement.com. The fund is distributed by Columbia Management Investment Distributors, Inc., member FINRA, and managed by Columbia Management Investment Advisers, LLC.
© 2012 Columbia Management Investment Advisers, LLC. All rights reserved.
C-1046 D (7/12)
Annual Report
May 31, 2012

Columbia Strategic Income Fund
Not FDIC insured • No bank guarantee • May lose value
Columbia Strategic Income Fund
President's Message
 Dear Shareholders,
A stock market rally that commenced in the fourth quarter of 2011 continued into 2012 in the United States and around the world, as all major market regions generated double-digit returns for the three-month period ended March 31, 2012. Volatility declined sharply as European debt fears quieted somewhat and sentiment improved. Returns in developed countries were buoyed by strong results in Germany, Belgium, Austria and the Nordic markets of Denmark, Finland, Norway and Sweden. Under the cloud of its own mounting debt problem, Spain was the only eurozone country to deliver a negative return during the three-month period. Solid economic growth and accommodative monetary policy helped boost gains in emerging markets. The rally in U.S. equities was largely driven by an expansion in "multiples" — an increase in stock prices relative to their earnings. By the end of the first quarter of 2012, stocks no longer appeared as cheap as they were late in 2011. Bonds lagged stocks during the first quarter as investors responded to signs of an improved environment with a greater appetite for risk.
Concerns around the health of the global economy were centered in news headlines focusing on Washington D.C., Europe, China and the Middle East. In the United States, economic indicators remained mixed but generally indicated support for slow, sustainable economic growth. European policymakers have made progress in containing the eurozone debt crisis, though they still have not solved the issue of long-term solvency. The European Central Bank has lowered interest rates and flooded the financial system with liquidity that may provide breathing space for a restructuring of fiscal balance sheets. These massive infusions of liquidity may whet the appetite for risk from investors around the world. However, they have delayed a true reckoning with the European financial situation, as concerns about Greece, Spain and Portugal continue to cloud the outlook. The structural challenges that persist in the developed world, and slower growth in emerging market economies, leave the global economy in a fragile state. Domestic demand, combined with slowing inflationary trends, has also helped to shore up emerging market economies. Joblessness remains relatively low and monetary conditions remain easy.
Despite the challenges and surprises of 2011, we see pockets of strength — and as a result, attractive opportunities — both here and abroad for 2012. We hope to help you capitalize on these opportunities with various articles in our 2012 Perspectives, which is available via the Market Insights tab at columbiamanagement.com. This publication showcases the strong research capabilities and experienced investment teams of Columbia Management and offers a diverse array of investment ideas based on our five key themes for 2012.
Other information and resources available at columbiamanagement.com include:
> detailed up-to-date fund performance and portfolio information
> economic analysis and market commentary
> quarterly fund commentaries
> Columbia Management Investor, our award-winning quarterly newsletter for shareholders
Thank you for your continued support of the Columbia Funds. We look forward to serving your investment needs for many years to come.
Best Regards,

J. Kevin Connaughton
President, Columbia Funds
Investors should consider the investment objectives, risks, charges and expenses of a mutual fund carefully before investing. For a free prospectus, which contains this and other important information about the funds, visit columbiamanagement.com. The prospectus should be read carefully before investing.
Columbia Funds are distributed by Columbia Management Investment Distributors, Inc., member FINRA, and managed by Columbia Management Investment Advisers, LLC.
© 2012 Columbia Management Investment Advisers, LLC. All rights reserved.
Annual Report 2012
Columbia Strategic Income Fund
Table of Contents
| Performance Overview | | | 2 | | |
|
| Manager Discussion of Fund Performance | | | 4 | | |
|
| Understanding Your Fund's Expenses | | | 6 | | |
|
| Portfolio of Investments | | | 7 | | |
|
| Statement of Assets and Liabilities | | | 43 | | |
|
| Statement of Operations | | | 45 | | |
|
| Statement of Changes in Net Assets | | | 46 | | |
|
| Financial Highlights | | | 49 | | |
|
| Notes to Financial Statements | | | 57 | | |
|
Report of Independent Registered
Public Accounting Firm | | | 70 | | |
|
| Board Members and Officers | | | 71 | | |
|
Board Consideration and Approval of
Advisory Agreement | | | 74 | | |
|
| Important Information About This Report | | | 81 | | |
|
Fund Investment Manager
Columbia Management Investment
Advisers, LLC
225 Franklin Street
Boston, MA 02110
Fund Distributor
Columbia Management Investment
Distributors, Inc.
225 Franklin Street
Boston, MA 02110
Fund Transfer Agent
Columbia Management Investment
Services Corp.
P.O. Box 8081
Boston, MA 02266-8081
For more information about any of the funds, please visit columbiamanagement.com or call 800.345.6611. Customer Service Representatives are available to answer your questions Monday through Friday from 8 a.m. to 8 p.m. Eastern time.
The views expressed in this report reflect the current views of the respective parties. These views are not guarantees of future performance and involve certain risks, uncertainties and assumptions that are difficult to predict, so actual outcomes and results may differ significantly from the views expressed. These views are subject to change at any time based upon economic, market or other conditions and the respective parties disclaim any responsibility to update such views. These views may not be relied on as investment advice and, because investment decisions for a Columbia Fund are based on numerous factors, may not be relied on as an indication of trading intent on behalf of any particular Columbia Fund. References to specific securities should not be construed as a recommendation or investment advice.
Annual Report 2012
Columbia Strategic Income Fund
Performance Overview
Performance Summary
> For the 12-month period that ended May 31, 2012, Columbia Strategic Income Fund (the fund) Class A shares returned 4.44% excluding sales charge.
> The fund lagged its primary benchmark, the Barclays Government/Credit Bond Index, its new blended benchmark and its former blended benchmark, which returned 8.29%, 5.12% and 5.43%, respectively for the same period.
> Underweights in U.S. Treasury securities, which were especially strong performers this past year, and in Japanese government bonds hurt relative performance.
Average Annual Total Returns (%) (for period ended May 31, 2012)
| | | Inception | | 1 Year | | 5 Years | | 10 Years | |
| Class A | | 04/21/77 | | | | | | | | | | | | | |
| Excluding sales charges | | | | | 4.44 | | | | 6.54 | | | | 7.68 | | |
| Including sales charges | | | | | -0.56 | | | | 5.50 | | | | 7.16 | | |
| Class B | | 05/15/92 | | | | | | | | | | | | | |
| Excluding sales charges | | | | | 3.65 | | | | 5.78 | | | | 6.88 | | |
| Including sales charges | | | | | -1.30 | | | | 5.46 | | | | 6.88 | | |
| Class C | | 07/01/97 | | | | | | | | | | | | | |
| Excluding sales charges | | | | | 3.64 | | | | 5.90 | | | | 7.04 | | |
| Including sales charges | | | | | 2.65 | | | | 5.90 | | | | 7.04 | | |
| Class R* | | 09/27/10 | | | 4.20 | | | | 6.38 | | | | 7.47 | | |
| Class R4* | | 03/07/11 | | | 4.59 | | | | 6.58 | | | | 7.70 | | |
| Class R5* | | 03/07/11 | | | 4.86 | | | | 6.65 | | | | 7.74 | | |
| Class W* | | 09/27/10 | | | 4.34 | | | | 6.51 | | | | 7.67 | | |
| Class Z | | 01/29/99 | | | 4.75 | | | | 6.84 | | | | 7.93 | | |
| Barclays Government/Credit Bond Index | | | | | 8.29 | | | | 6.86 | | | | 5.88 | | |
| New Blended Index | | | | | 5.12 | | | | 7.52 | | | | 8.04 | | |
| Former Blended Index | | | | | 5.43 | | | | 7.62 | | | | 8.19 | | |
Returns for Class A are shown with and without the maximum initial sales charge of 4.75%. Returns for Class B are shown with and without the applicable contingent deferred sales charge (CDSC) of 5.00% in the first year, declining to 1.00% in the sixth year and eliminated thereafter. Returns for Class C are shown with and without the 1.00% CDSC for the first year only. The fund's other classes are not subject to sales charges and have limited eligibility. Please see the fund's prospectuses for details. Performance for different share classes will vary based on differences in sales charges and fees associated with each class. All results shown assume reinvestment of distributions during the period. Returns do not reflect the deduction of taxes that a shareholder may pay on fund distributions or on the redemption of fund shares. Performance results reflect the effect of any fee waivers or reimbursements of fund expenses by Columbia Management Investment Advisers, LLC and/or any of its affiliates. Absent these fee waivers or expense reimbursement arrangements, performance results would have been lower.
The performance information shown represents past performance and is not a guarantee of future results. The investment return and principal value of your investment will fluctuate so that your shares, when redeemed, may be worth more or less than their original cost. Current performance may be lower or higher than the performance information shown. You may obtain performance information current to the most recent month-end by contacting your financial intermediary, visiting columbiamanagement.com or calling 800.345.6611.
*The returns shown for periods prior to the share class inception date (including returns since inception if shown, which are since fund inception) include the returns of the fund's oldest share class. These returns are adjusted to reflect any higher class-related operating expenses of the newer share classes, as applicable. Please visit columbiamanagement.com/mutual-funds/appended-performance for more information.
The Barclays Government/Credit Bond Index tracks the performance of U.S. government and corporate bonds rated investment grade or better, with maturities of at least one year.
The New Blended Benchmark is a weighted custom composite, established by the Investment Manager, consisting of a 35% weighting of the Barclays Aggregate Bond Index, a 35% weighting of the BofA Merrill Lynch US High Yield Cash Pay Constrained Index, a 15% weighting of the Citigroup Non-U.S. World Government Bond Index — Unhedged and a 15% weighting of the JPMorgan Emerging Markets Bond Index (EMBI) — Global. The BofA Merrill Lynch US High Yield Cash Pay Constrained Index tracks the performance of U.S. dollar-denominated below investment grade corporate debt, currently in a coupon paying period, that is publicly issued in the U.S. domestic market. The JPMorgan EMBI — Global is based on U.S. dollar-denominated debt instruments issued by emerging market sovereign and quasi-sovereign entities, such as Brady bonds, Eurobonds and loans, and reflects reinvestment of all distributions and changes in market prices.
The Former Blended Benchmark consists of 35% Barclays Aggregate Bond Index, 35% JPMorgan Global High Yield Index, 15% Citigroup Non-U.S. World Government Bond Index-Unhedged and 15% JPMorgan EMBI Global Diversified Index. The Barclays Aggregate Bond Index is a market value-weighted index that tracks the daily price, coupon, pay-downs and total return performance of fixed-rate, publicly placed, dollar-denominated and non-convertible investment grade debt issues with at least $250 million par amount outstanding and with at least one year to final maturity. The JPMorgan Global High Yield Index is designed to mirror the investable universe of the U.S. dollar global high yield corporate debt market, including domestic and international issues. The Citigroup Non-U.S. World Government Bond Index — Unhedged is calculated on a market-weighted basis and includes all fixed-rate bonds with a remaining maturity of one year or longer and with amounts outstanding of at least the equivalent of U.S. $25 million while excluding floating or variable rate bonds, securities aimed principally at non-institutional investors and private placement-type securities. The JPMorgan EMBI Global Diversified Index tracks total returns for traded external debt instruments in the emerging markets including U.S. dollar-denominated Brady bonds, loans and Eurobonds with an outstanding face value of at least $500 million.
Indices are not available for investment, are not professionally managed and do not reflect sales charges, fees, brokerage commissions, taxes or other expenses of investing. Securities in the fund may not match those in an index.
Annual Report 2012
2
Columbia Strategic Income Fund
Performance Overview (continued)
Performance of a Hypothetical $10,000 Investment (June 1, 2002 – May 31, 2012)
The chart above shows the change in value of a hypothetical $10,000 investment in Class A shares of Columbia Strategic Income Fund during the stated time period, and does not reflect the deduction of taxes that a shareholder may pay on fund distributions or on the redemption of fund shares.
Annual Report 2012
3
Columbia Strategic Income Fund
Manager Discussion of Fund Performance
On February 29, 2012, the fund changed two components in its blended benchmark from a 35% weight in the JPMorgan Global High Yield Index and a 15% weight in the JPMorgan EMBI Global Diversified Index to a 35% weight in the BofA Merrill Lynch US High Yield Cash Pay Constrained Index and a 15% weight in the JPMorgan EMBI Global Index. We believe the new blended benchmark is more consistent with the fund's investment strategy.
For the 12 month period that ended May 31, 2012, the fund's Class A shares returned 4.44% without sales charge. The fund lagged the 8.29% return of its benchmark, the Barclays Government/Credit Bond Index; the 5.12% return of its new blended benchmark, which consists of 35% Barclays Aggregate Bond Index, 35% BofA Merrill Lynch US High Yield Cash Pay Constrained Index, 15% Citigroup Non-U.S. World Government Bond Index — Unhedged and 15% JPMorgan EMBI Global Index and the 5.43% return of its former blended benchmark, which was made up of 35% Barclays Aggregate Bond Index, 35% JPMorgan Global High Yield Index, 15% Citigroup Non-U.S. World Government Bond Index — Unhedged and 15% JPMorgan EMBI Global Diversified Index. An underweight in U.S. Treasuries and Japanese government bonds contributed to the fund's underperformance.
A Shifting Economic Climate
Early in the 12-month period, Europe's debt problems and wrangling in Washington over the federal budget and the national debt dominated world headlines. U.S. economic news was lackluster and job growth was disappointing. The pace of both economic and job growth picked up early in 2012, but disappointed again as the period wore on. Even though approximately 1.4 million new jobs were added to the labor markets during the 12-month period, the pace of job growth slowed markedly in April and May. First quarter economic growth, as measured by gross domestic product, slipped to 1.9% and expectations for second quarter growth are no higher. Manufacturing activity continued to expand — the one consistent bright spot throughout this recovery. And the housing market showed a glimmer of improvement, as year-over-year sales improved, inventories tightened and prices stabilized somewhat.
Underweights Generated Mixed Results
With U.S. interest rates starting the period at low levels, we thought there would be little room for them to fall much further and, therefore, less opportunity for price appreciation. As a result, we maintained an underweight in Treasuries, which proved costly as the sector outperformed over the one-year period. Performance also was hampered by an underweight relative to its benchmarks in Japanese government bonds, which benefited as the Japanese yen appreciated relative to most other currencies.
By contrast, an underweight in foreign developed market government bonds aided performance, as the U.S. dollar strengthened. Increased exposure to high-yield bonds also aided results. The sector generated strong performance in the fourth quarter of 2011 and first quarter of 2012, thanks to growing confidence among investors that Europe's problems were being addressed and the U.S. economy was on the mend. Later in the period, we took profits and reduced the fund's stake in more volatile sectors, including high-yield bonds. We also trimmed exposure to high-yield bank loans and emerging market issues.
Portfolio Management
Colin Lundgren, CFA
Gene R. Tannuzzo, CFA
Brian Lavin, CFA
Annual Report 2012
4
Columbia Strategic Income Fund
Manager Discussion of Fund Performance (continued)
Derivative Positions in the Fund
The fund utilized Treasury futures and options to manage duration and yield curve exposure, credit default swaps to hedge credit exposure, currency forwards for hedging and total return purposes and mortgage TBAs to add exposure to agency mortgage-backed securities (MBS). TBA stands for "to be announced." They are mortgage securities that are bought and sold for future settlement with an agreed upon price, coupon and face value, but without reference to the characteristics of the underlying pool of mortgages until 48 hours before delivery is taken. This feature gives TBA participants immediate exposure to agency MBS without having to value each individual security.
Looking Ahead
We think global economic growth is likely to remain sluggish, especially given the recession that began late in 2011 in the eurozone and concerns about economic slowing in the United States and other international economies. However, credit fundamentals remain strong with credit spreads — the difference in yield between higher- and lower-quality issues — above both their long-term averages and last year's lows. In an environment of low government bond yields, we think corporate bonds offer the best return potential as balance sheets generally remain strong and valuations are attractive on a historical basis. Given this outlook, we plan to maintain overweights in investment-grade and high-yield corporate bonds and underweights in developed foreign market government debt, because we believe that the current European sovereign debt crisis might be a preview of what could unfold in other heavily indebted nations, including the United States. While not immune to a global slowdown, we believe emerging markets offer an attractive alternative to their developed market counterparts.
Portfolio Breakdown (%)
(at May 31, 2012) | |
| Corporate Bonds & Notes | | | 44.3 | | |
Residential Mortgage-Backed
Securities — Agency | | | 9.3 | | |
Residential Mortgage-Backed
Securities — Non-Agency | | | 2.3 | | |
| Commercial Mortgage-Backed Securities — Non-Agency | | | 2.9 | | |
Asset-Backed
Securities — Non-Agency | | | 0.1 | | |
| Inflation-Indexed Bonds | | | 2.2 | | |
| U.S. Treasury Obligations | | | 5.2 | | |
| Foreign Government Obligations | | | 22.0 | | |
| Municipal Bonds | | | 0.1 | | |
| Senior Loans | | | 3.9 | | |
| Common Stocks | | | 0.0 | (a) | |
| Warrants | | | 0.0 | (a) | |
| Treasury Bill | | | 0.1 | | |
| Options Purchased Puts | | | 0.0 | (a) | |
| Other(b) | | | 7.6 | | |
Percentages indicated are based upon total investments (excluding Investments of Cash Collateral Received for Securities on Loan). The Fund's composition is subject to change.
(a) Rounds to less than 0.1%.
(b) Includes investments in money market funds.
Quality Breakdown (%)
(at May 31, 2012) | |
| A rating | | | 4.8 | | |
| AA rating | | | 1.3 | | |
| AAA rating | | | 26.8 | | |
| B rating | | | 23.8 | | |
| BB rating | | | 17.5 | | |
| BBB rating | | | 18.5 | | |
| CCC rating | | | 5.3 | | |
| Not rated | | | 2.0 | | |
Percentages indicated are based upon total fixed income securities (excluding Investments of Cash Collateral Received for Securities on Loan and money market funds).
Bond ratings apply to the underlying holdings of the Fund and not the Fund itself and are divided into categories ranging from AAA (highest) to D (lowest), and are subject to change. The ratings shown are determined by using the middle rating of Moody's, S&P, and Fitch after dropping the highest and lowest available ratings. When a rating from only two agencies is available, the lower rating is used. When a rating from only one agency is available, that rating is used. When a bond is not rated by one of these agencies, it is designated as Not rated. Credit ratings are subjective opinions and not statements of fact.
Annual Report 2012
5
Columbia Strategic Income Fund
Understanding Your Fund's Expenses
(Unaudited)
As an investor, you incur two types of costs. There are transaction costs, which generally include sales charges on purchases and may include redemption fees. There are also ongoing costs, which generally include management fees, distribution and service (Rule 12b-1) fees, and other fund expenses. The following information is intended to help you understand your ongoing costs (in dollars) of investing in the Fund and to help you compare these costs with the ongoing costs of investing in other mutual funds.
Analyzing Your Fund's Expenses
To illustrate these ongoing costs, we have provided examples and calculated the expenses paid by investors in each share class of the Fund during the period. The actual and hypothetical information in the table is based on an initial investment of $1,000 at the beginning of the period indicated and held for the entire period. Expense information is calculated two ways and each method provides you with different information. The amount listed in the "Actual" column is calculated using the Fund's actual operating expenses and total return for the period. You may use the Actual information, together with the amount invested, to estimate the expenses that you paid over the period. Simply divide your account value by $1,000 (for example, an $8,600 account value divided by $1,000 = 8.6), then multiply the results by the expenses paid during the period under the Actual column. The amount listed in the "Hypothetical" column assumes a 5% annual rate of return before expenses (which is not the Fund's actual return) and then applies the Fund's actual expense ratio for the period to the hypothetical return. You should not use the hypothetical account values and expenses to estimate either your actual account balance at the end of the period or the expenses you paid during the period. See "Compare With Other Funds" below for details on how to use the hypothetical data.
Compare With Other Funds
Since all mutual funds are required to include the same hypothetical calculations about expenses in shareholder reports, you can use this information to compare the ongoing cost of investing in the Fund with other funds. To do so, compare the hypothetical example with the 5% hypothetical examples that appear in the shareholder reports of other funds. As you compare hypothetical examples of other funds, it is important to note that hypothetical examples are meant to highlight the ongoing costs of investing in a fund only and do not reflect any transaction costs, such as sales charges, or redemption or exchange fees. Therefore, the hypothetical calculations are useful in comparing ongoing costs only, and will not help you determine the relative total costs of owning different funds. If transaction costs were included in these calculations, your costs would be higher.
December 1, 2011 – May 31, 2012
| | | Account Value at the Beginning
of the Period ($) | | Account Value at the End of the
Period ($) | | Expenses Paid During the
Period ($) | | Fund's Annualized
Expense Ratio (%) | |
| | | Actual | | Hypothetical | | Actual | | Hypothetical | | Actual | | Hypothetical | | Actual | |
| Class A | | | 1,000.00 | | | | 1,000.00 | | | | 1,049.00 | | | | 1,019.90 | | | | 5.22 | | | | 5.15 | | | | 1.02 | | |
| Class B | | | 1,000.00 | | | | 1,000.00 | | | | 1,045.00 | | | | 1,016.20 | | | | 9.00 | | | | 8.87 | | | | 1.76 | | |
| Class C | | | 1,000.00 | | | | 1,000.00 | | | | 1,045.80 | | | | 1,016.90 | | | | 8.29 | | | | 8.17 | | | | 1.62 | | |
| Class R | | | 1,000.00 | | | | 1,000.00 | | | | 1,047.50 | | | | 1,018.65 | | | | 6.50 | | | | 6.41 | | | | 1.27 | | |
| Class R4 | | | 1,000.00 | | | | 1,000.00 | | | | 1,050.10 | | | | 1,020.60 | | | | 4.51 | | | | 4.45 | | | | 0.88 | | |
| Class R5 | | | 1,000.00 | | | | 1,000.00 | | | | 1,051.40 | | | | 1,021.85 | | | | 3.23 | | | | 3.18 | | | | 0.63 | | |
| Class W | | | 1,000.00 | | | | 1,000.00 | | | | 1,049.00 | | | | 1,019.90 | | | | 5.22 | | | | 5.15 | | | | 1.02 | | |
| Class Z | | | 1,000.00 | | | | 1,000.00 | | | | 1,050.90 | | | | 1,021.15 | | | | 3.95 | | | | 3.89 | | | | 0.77 | | |
Expenses paid during the period are equal to the annualized expense ratio for each class as indicated above, multiplied by the average account value over the period and then multiplied by the number of days in the Fund's most recent fiscal half year and divided by 366.
Expenses do not include fees and expenses incurred indirectly by the Fund from the underlying funds in which the Fund may invest (also referred to as "acquired funds"), including affiliated and non-affiliated pooled investment vehicles (including mutual funds and exchange traded funds).
Had Columbia Management Investment Advisers, LLC and/or certain of its affiliates not waived/reimbursed certain fees and expenses, account value at the end of the period would have been reduced.
Annual Report 2012
6
Columbia Strategic Income Fund
Portfolio of Investments
May 31, 2012
(Percentages represent value of investments compared to net assets)
Corporate Bonds & Notes(a) 46.0%
| Issuer | | Coupon
Rate | | Principal
Amount ($) | | Value ($) | |
| Aerospace & Defense 1.3% | |
ADS Tactical, Inc.
Senior Secured(b)(c)
04/01/18 | | | 11.000 | % | | | 6,990,000 | | | | 7,007,475 | | |
Huntington Ingalls Industries, Inc.
03/15/18 | | | 6.875 | % | | | 2,774,000 | | | | 2,871,090 | | |
Huntington Ingalls Industries, Inc.(c)
03/15/21 | | | 7.125 | % | | | 4,263,000 | | | | 4,422,863 | | |
Kratos Defense & Security Solutions, Inc.
Senior Secured
06/01/17 | | | 10.000 | % | | | 7,967,000 | | | | 8,445,020 | | |
Oshkosh Corp.
03/01/20 | | | 8.500 | % | | | 4,629,000 | | | | 5,080,327 | | |
Oshkosh Corp.(c)
03/01/17 | | | 8.250 | % | | | 1,263,000 | | | | 1,387,721 | | |
TransDigm, Inc.
12/15/18 | | | 7.750 | % | | | 2,463,000 | | | | 2,616,938 | | |
| Total | | | | | | | 31,831,434 | | |
| Automotive 1.3% | |
Allison Transmission, Inc.(b)(c)
05/15/19 | | | 7.125 | % | | | 1,603,000 | | | | 1,671,127 | | |
Chrysler Group LLC/Co-Issuer, Inc.(c)
Secured
06/15/19 | | | 8.000 | % | | | 1,267,000 | | | | 1,270,167 | | |
| 06/15/21 | | | 8.250 | % | | | 3,760,000 | | | | 3,769,400 | | |
Dana Holding Corp.(c)
Senior Unsecured
02/15/19 | | | 6.500 | % | | | 710,000 | | | | 743,725 | | |
| 02/15/21 | | | 6.750 | % | | | 408,000 | | | | 435,540 | | |
Delphi Corp.(c)
05/15/19 | | | 5.875 | % | | | 1,137,000 | | | | 1,191,008 | | |
| 05/15/21 | | | 6.125 | % | | | 757,000 | | | | 806,205 | | |
Ford Motor Credit Co. LLC
Senior Unsecured
04/15/15 | | | 7.000 | % | | | 597,000 | | | | 670,133 | | |
| 01/15/20 | | | 8.125 | % | | | 4,690,000 | | | | 5,956,492 | | |
Lear Corp.
03/15/18 | | | 7.875 | % | | | 6,815,000 | | | | 7,462,425 | | |
Lear Corp.(c)
03/15/20 | | | 8.125 | % | | | 1,738,000 | | | | 1,942,215 | | |
Schaeffler Finance BV(b)
Senior Secured
02/15/19 | | | 8.500 | % | | | 1,619,000 | | | | 1,708,045 | | |
Schaeffler Finance BV(b)(c)
Senior Secured
02/15/17 | | | 7.750 | % | | | 1,381,000 | | | | 1,429,335 | | |
Corporate Bonds & Notes(a) (continued)
| Issuer | | Coupon
Rate | | Principal
Amount ($) | | Value ($) | |
Visteon Corp.(c)
04/15/19 | | | 6.750 | % | | | 4,272,000 | | | | 4,255,980 | | |
| Total | | | | | | | 33,311,797 | | |
| Banking 1.3% | |
BES Investimento do Brasil SA
Senior Unsecured(b)
03/25/15 | | | 5.625 | % | | | 1,000,000 | | | | 905,000 | | |
BanColombia SA
Senior Unsecured(c)
06/03/21 | | | 5.950 | % | | | 2,300,000 | | | | 2,380,500 | | |
Banco Cruzeiro do Sul SA
Senior Unsecured(b)
01/20/16 | | | 8.250 | % | | | 500,000 | | | | 350,015 | | |
Banco de Bogota SA
Senior Unsecured(b)(c)
01/15/17 | | | 5.000 | % | | | 1,000,000 | | | | 1,022,661 | | |
Banco de Credito del Peru
Subordinated Notes(b)(d)
10/15/22 | | | 7.170 | % | | PEN | 2,000,000 | | | | 766,759 | | |
Bank of America Corp.
Senior Unsecured
05/13/21 | | | 5.000 | % | | | 12,850,000 | | | | 12,895,540 | | |
Citigroup, Inc.
Senior Unsecured
01/15/15 | | | 6.010 | % | | | 15,000 | | | | 16,071 | | |
Citigroup, Inc.(c)
Senior Unsecured
01/14/22 | | | 4.500 | % | | | 885,000 | | | | 904,941 | | |
JPMorgan Chase & Co.
Senior Unsecured
08/15/21 | | | 4.350 | % | | | 2,840,000 | | | | 2,964,608 | | |
Lloyds Banking Group PLC(b)
12/31/49 | | | 6.657 | % | | | 230,000 | | | | 134,550 | | |
Lloyds Banking Group PLC(b)(d)
11/29/49 | | | 6.267 | % | | | 3,152,000 | | | | 1,780,880 | | |
Morgan Stanley
Senior Unsecured
01/26/20 | | | 5.500 | % | | | 500,000 | | | | 469,887 | | |
Morgan Stanley(c)
Senior Unsecured
07/28/21 | | | 5.500 | % | | | 7,165,000 | | | | 6,708,905 | | |
Synovus Financial Corp.
Senior Unsecured
02/15/19 | | | 7.875 | % | | | 1,840,000 | | | | 1,927,400 | | |
| Total | | | | | | | 33,227,717 | | |
The accompanying Notes to Financial Statements are an integral part of this statement.
Annual Report 2012
7
Columbia Strategic Income Fund
Portfolio of Investments (continued)
May 31, 2012
Corporate Bonds & Notes(a) (continued)
| Issuer | | Coupon
Rate | | Principal
Amount ($) | | Value ($) | |
| Brokerage 0.6% | |
E*Trade Financial Corp.
Senior Unsecured
11/30/17 | | | 12.500 | % | | | 8,132,000 | | | | 9,331,470 | | |
E*Trade Financial Corp.(c)
Senior Unsecured
12/01/15 | | | 7.875 | % | | | 2,505,000 | | | | 2,542,575 | | |
Neuberger Berman Group LLC/Finance Corp.(b)
Senior Unsecured
03/15/20 | | | 5.625 | % | | | 1,092,000 | | | | 1,116,570 | | |
Neuberger Berman Group LLC/Finance Corp.(b)(c)
Senior Unsecured
03/15/22 | | | 5.875 | % | | | 1,637,000 | | | | 1,677,925 | | |
| Total | | | | | | | 14,668,540 | | |
| Building Materials 0.7% | |
Building Materials Corp. of America
Senior Notes(b)
05/01/21 | | | 6.750 | % | | | 7,777,000 | | | | 7,951,982 | | |
Gibraltar Industries, Inc.
12/01/15 | | | 8.000 | % | | | 2,915,000 | | | | 2,966,013 | | |
Interface, Inc.(c)
12/01/18 | | | 7.625 | % | | | 1,002,000 | | | | 1,074,645 | | |
Norcraft Companies LP/Finance Corp.
Secured
12/15/15 | | | 10.500 | % | | | 2,999,000 | | | | 2,864,045 | | |
Nortek, Inc.(c)
12/01/18 | | | 10.000 | % | | | 316,000 | | | | 333,380 | | |
| 04/15/21 | | | 8.500 | % | | | 1,307,000 | | | | 1,267,790 | | |
| Total | | | | | | | 16,457,855 | | |
| Chemicals 1.6% | |
Celanese U.S. Holdings LLC(c)
06/15/21 | | | 5.875 | % | | | 675,000 | | | | 703,688 | | |
Hexion US Finance Corp.
Senior Unsecured(b)(c)
04/15/20 | | | 6.625 | % | | | 3,611,000 | | | | 3,647,110 | | |
Huntsman International LLC
03/15/21 | | | 8.625 | % | | | 1,019,000 | | | | 1,141,280 | | |
Ineos Finance PLC(b)
Senior Secured
05/15/15 | | | 9.000 | % | | | 3,736,000 | | | | 3,922,800 | | |
| 02/15/19 | | | 8.375 | % | | | 3,266,000 | | | | 3,355,815 | | |
| 05/01/20 | | | 7.500 | % | | | 334,000 | | | | 330,660 | | |
JM Huber Corp.
Senior Unsecured(b)(c)
11/01/19 | | | 9.875 | % | | | 2,430,000 | | | | 2,527,200 | | |
LyondellBasell Industries NV(b)(c)
11/15/21 | | | 6.000 | % | | | 9,394,000 | | | | 10,051,580 | | |
Senior Notes
04/15/24 | | | 5.750 | % | | | 5,124,000 | | | | 5,252,100 | | |
Corporate Bonds & Notes(a) (continued)
| Issuer | | Coupon
Rate | | Principal
Amount ($) | | Value ($) | |
MacDermid, Inc.(b)
04/15/17 | | | 9.500 | % | | | 1,663,500 | | | | 1,730,040 | | |
Momentive Performance Materials, Inc.
Secured(c)
06/15/14 | | | 12.500 | % | | | 1,513,000 | | | | 1,584,867 | | |
Nova Chemicals Corp.
Senior Unsecured(c)
11/01/19 | | | 8.625 | % | | | 2,153,000 | | | | 2,405,977 | | |
Polypore International, Inc.(c)
11/15/17 | | | 7.500 | % | | | 2,710,000 | | | | 2,831,950 | | |
| Total | | | | | | | 39,485,067 | | |
| Construction Machinery 1.3% | |
CNH Capital LLC(b)
11/01/16 | | | 6.250 | % | | | 3,395,000 | | | | 3,539,287 | | |
Case New Holland, Inc.
12/01/17 | | | 7.875 | % | | | 5,512,000 | | | | 6,283,680 | | |
Columbus McKinnon Corp.
02/01/19 | | | 7.875 | % | | | 950,000 | | | | 1,002,250 | | |
Manitowoc Co., Inc. (The)(c)
02/15/18 | | | 9.500 | % | | | 605,000 | | | | 663,988 | | |
| 11/01/20 | | | 8.500 | % | | | 1,950,000 | | | | 2,091,375 | | |
Neff Rental LLC/Finance Corp.
Secured(b)
05/15/16 | | | 9.625 | % | | | 4,296,000 | | | | 4,263,780 | | |
UR Merger Sub Corp.(b)
05/15/20 | | | 7.375 | % | | | 1,015,000 | | | | 1,037,838 | | |
UR Merger Sub Corp.(b)(c)
04/15/22 | | | 7.625 | % | | | 2,540,000 | | | | 2,597,150 | | |
Secured
07/15/18 | | | 5.750 | % | | | 1,228,000 | | | | 1,243,350 | | |
UR Merger Sub Corp.(c)
12/15/19 | | | 9.250 | % | | | 5,225,000 | | | | 5,760,562 | | |
| 09/15/20 | | | 8.375 | % | | | 1,662,000 | | | | 1,695,240 | | |
Senior Unsecured
02/01/21 | | | 8.250 | % | | | 1,450,000 | | | | 1,533,375 | | |
Xerium Technologies, Inc.
06/15/18 | | | 8.875 | % | | | 1,920,000 | | | | 1,449,600 | | |
| Total | | | | | | | 33,161,475 | | |
| Consumer Cyclical Services 0.2% | |
Goodman Networks, Inc.
Senior Secured(b)
07/01/18 | | | 12.125 | % | | | 2,134,000 | | | | 2,158,007 | | |
Realogy Corp.
Senior Secured(b)(c)
01/15/20 | | | 9.000 | % | | | 1,762,000 | | | | 1,762,000 | | |
| Total | | | | | | | 3,920,007 | | |
The accompanying Notes to Financial Statements are an integral part of this statement.
Annual Report 2012
8
Columbia Strategic Income Fund
Portfolio of Investments (continued)
May 31, 2012
Corporate Bonds & Notes(a) (continued)
| Issuer | | Coupon
Rate | | Principal
Amount ($) | | Value ($) | |
| Consumer Products 0.5% | |
Libbey Glass, Inc.(b)
05/15/20 | | | 6.875 | % | | | 973,000 | | | | 980,297 | | |
Mead Products LLC/ACCO Brands Corp.(b)(c)
04/30/20 | | | 6.750 | % | | | 962,000 | | | | 988,455 | | |
Sealy Mattress Co.(c)
06/15/14 | | | 8.250 | % | | | 2,942,000 | | | | 2,846,385 | | |
Spectrum Brands, Inc.(b)
Senior Secured
06/15/18 | | | 9.500 | % | | | 1,096,000 | | | | 1,211,080 | | |
Spectrum Brands, Inc.(b)(c)
Senior Unsecured
03/15/20 | | | 6.750 | % | | | 667,000 | | | | 675,338 | | |
Spectrum Brands, Inc.(c)
Senior Secured
06/15/18 | | | 9.500 | % | | | 5,694,000 | | | | 6,291,870 | | |
| Total | | | | | | | 12,993,425 | | |
| Diversified Manufacturing 0.5% | |
Actuant Corp.(b)
06/15/22 | | | 5.625 | % | | | 1,319,000 | | | | 1,348,678 | | |
Amsted Industries, Inc.
Senior Notes(b)
03/15/18 | | | 8.125 | % | | | 2,182,000 | | | | 2,307,465 | | |
CPM Holdings, Inc.
Senior Secured
09/01/14 | | | 10.625 | % | | | 2,833,000 | | | | 3,002,980 | | |
Tomkins LLC/Inc.
Secured(c)
10/01/18 | | | 9.000 | % | | | 3,719,000 | | | | 4,086,251 | | |
WireCo WorldGroup, Inc.
05/15/17 | | | 9.500 | % | | | 1,737,000 | | | | 1,806,480 | | |
| Total | | | | | | | 12,551,854 | | |
| Electric 3.2% | |
AES Corp. (The)
Senior Unsecured
10/15/17 | | | 8.000 | % | | | 519,000 | | | | 576,090 | | |
AES Corp. (The)(b)(c)
Senior Unsecured
07/01/21 | | | 7.375 | % | | | 5,287,000 | | | | 5,709,960 | | |
Appalachian Power Co.
Senior Unsecured(c)
03/30/21 | | | 4.600 | % | | | 360,000 | | | | 403,442 | | |
Arizona Public Service Co.
Senior Unsecured
08/01/16 | | | 6.250 | % | | | 904,000 | | | | 1,067,532 | | |
Corporate Bonds & Notes(a) (continued)
| Issuer | | Coupon
Rate | | Principal
Amount ($) | | Value ($) | |
Calpine Corp.
Senior Secured(b)(c)
02/15/21 | | | 7.500 | % | | | 5,637,000 | | | | 5,890,665 | | |
Carolina Power & Light Co.
1st Mortgage(c)
05/15/42 | | | 4.100 | % | | | 1,500,000 | | | | 1,561,653 | | |
Cleveland Electric Illuminating Co. (The)
1st Mortgage
11/15/18 | | | 8.875 | % | | | 500,000 | | | | 659,936 | | |
Consolidated Edison Co. of New York, Inc.
Senior Unsecured
04/01/38 | | | 6.750 | % | | | 895,000 | | | | 1,285,810 | | |
Dominion Resources, Inc.
Senior Unsecured
11/30/17 | | | 6.000 | % | | | 1,080,000 | | | | 1,295,943 | | |
| 08/15/19 | | | 5.200 | % | | | 3,904,000 | | | | 4,613,716 | | |
Dominion Resources, Inc.(c)
Senior Unsecured
08/01/41 | | | 4.900 | % | | | 1,045,000 | | | | 1,173,449 | | |
Duke Energy Corp.
Senior Unsecured
09/15/14 | | | 3.950 | % | | | 3,930,000 | | | | 4,179,751 | | |
Duke Energy Ohio, Inc.
1st Mortgage
04/01/19 | | | 5.450 | % | | | 3,585,000 | | | | 4,354,689 | | |
Florida Power Corp.
1st Mortgage
06/15/38 | | | 6.400 | % | | | 1,470,000 | | | | 2,017,531 | | |
GenOn Energy, Inc.
Senior Unsecured
10/15/18 | | | 9.500 | % | | | 1,887,000 | | | | 1,754,910 | | |
Ipalco Enterprises, Inc.
Senior Secured(b)
04/01/16 | | | 7.250 | % | | | 2,415,000 | | | | 2,626,312 | | |
Nevada Power Co.
01/15/15 | | | 5.875 | % | | | 1,815,000 | | | | 2,029,909 | | |
| 05/15/18 | | | 6.500 | % | | | 10,355,000 | | | | 12,745,348 | | |
| 08/01/18 | | | 6.500 | % | | | 720,000 | | | | 891,607 | | |
| 04/01/36 | | | 6.650 | % | | | 950,000 | | | | 1,295,206 | | |
Oncor Electric Delivery Co. LLC
Senior Secured(b)
06/01/42 | | | 5.300 | % | | | 3,300,000 | | | | 3,496,747 | | |
PacifiCorp
1st Mortgage
09/15/13 | | | 5.450 | % | | | 255,000 | | | | 269,987 | | |
Pacific Gas & Electric Co.
Senior Unsecured
04/15/42 | | | 4.450 | % | | | 575,000 | | | | 612,852 | | |
Pacific Gas & Electric Co.(c)
Senior Unsecured
10/01/20 | | | 3.500 | % | | | 1,340,000 | | | | 1,442,175 | | |
The accompanying Notes to Financial Statements are an integral part of this statement.
Annual Report 2012
9
Columbia Strategic Income Fund
Portfolio of Investments (continued)
May 31, 2012
Corporate Bonds & Notes(a) (continued)
| Issuer | | Coupon
Rate | | Principal
Amount ($) | | Value ($) | |
Progress Energy, Inc.
Senior Unsecured
04/01/22 | | | 3.150 | % | | | 4,175,000 | | | | 4,217,092 | | |
Sierra Pacific Power Co.
05/15/16 | | | 6.000 | % | | | 3,020,000 | | | | 3,529,731 | | |
TransAlta Corp.
Senior Unsecured
05/15/18 | | | 6.650 | % | | | 7,330,000 | | | | 8,319,411 | | |
| Total | | | | | | | 78,021,454 | | |
| Entertainment 0.2% | |
AMC Entertainment, Inc.
06/01/19 | | | 8.750 | % | | | 2,188,000 | | | | 2,341,160 | | |
AMC Entertainment, Inc.(c)
12/01/20 | | | 9.750 | % | | | 1,965,000 | | | | 2,112,375 | | |
Six Flags, Inc.(b)(e)(f)(g)
06/01/14 | | | 9.625 | % | | | 1,557,000 | | | | — | | |
Speedway Motorsports, Inc.(c)
02/01/19 | | | 6.750 | % | | | 722,000 | | | | 741,855 | | |
Vail Resorts, Inc.
05/01/19 | | | 6.500 | % | | | 623,000 | | | | 652,593 | | |
| Total | | | | | | | 5,847,983 | | |
| Food and Beverage 1.3% | |
ConAgra Foods, Inc.
Senior Unsecured
10/01/28 | | | 7.000 | % | | | 855,000 | | | | 1,069,791 | | |
Cott Beverages, Inc.(c)
11/15/17 | | | 8.375 | % | | | 1,185,000 | | | | 1,276,838 | | |
| 09/01/18 | | | 8.125 | % | | | 1,291,000 | | | | 1,391,052 | | |
Del Monte Corp.
02/15/19 | | | 7.625 | % | | | 596,000 | | | | 578,120 | | |
Kraft Foods, Inc.
Senior Unsecured
02/01/18 | | | 6.125 | % | | | 14,587,000 | | | | 17,384,495 | | |
| 08/23/18 | | | 6.125 | % | | | 235,000 | | | | 283,455 | | |
MHP SA(b)
04/29/15 | | | 10.250 | % | | | 3,204,000 | | | | 3,125,745 | | |
SABMiller Holdings, Inc.(b)
01/15/17 | | | 2.450 | % | | | 6,905,000 | | | | 7,084,164 | | |
| Total | | | | | | | 32,193,660 | | |
| Gaming 1.3% | |
Caesars Entertainment Operating Co., Inc.(b)(c)
Senior Secured
02/15/20 | | | 8.500 | % | | | 3,756,000 | | | | 3,741,915 | | |
Caesars Entertainment Operating Co., Inc.(c)
Senior Secured
06/01/17 | | | 11.250 | % | | | 2,384,000 | | | | 2,533,000 | | |
Corporate Bonds & Notes(a) (continued)
| Issuer | | Coupon
Rate | | Principal
Amount ($) | | Value ($) | |
Chester Downs & Marina LLC
Senior Secured(b)(c)
02/01/20 | | | 9.250 | % | | | 1,718,000 | | | | 1,769,540 | | |
MGM Resorts International
03/01/18 | | | 11.375 | % | | | 1,925,000 | | | | 2,218,562 | | |
Senior Secured
03/15/20 | | | 9.000 | % | | | 5,811,000 | | | | 6,363,045 | | |
MGM Resorts International(c)
07/15/15 | | | 6.625 | % | | | 780,000 | | | | 800,963 | | |
| 06/01/16 | | | 7.500 | % | | | 995,000 | | | | 1,017,388 | | |
Penn National Gaming, Inc.
Senior Subordinated Notes(c)
08/15/19 | | | 8.750 | % | | | 1,647,000 | | | | 1,815,817 | | |
ROC Finance LLC/Corp.
Secured(b)
09/01/18 | | | 12.125 | % | | | 2,529,000 | | | | 2,826,157 | | |
Seminole Indian Tribe of Florida(b)
10/01/17 | | | 7.750 | % | | | 444,000 | | | | 477,300 | | |
| 10/01/20 | | | 7.804 | % | | | 2,675,000 | | | | 2,645,495 | | |
Senior Secured
10/01/20 | | | 6.535 | % | | | 1,510,000 | | | | 1,513,503 | | |
Seneca Gaming Corp.(b)
12/01/18 | | | 8.250 | % | | | 2,909,000 | | | | 2,948,999 | | |
Tunica-Biloxi Gaming Authority
Senior Unsecured(b)
11/15/15 | | | 9.000 | % | | | 2,397,000 | | | | 2,313,105 | | |
| Total | | | | | | | 32,984,789 | | |
| Gas Pipelines 2.4% | |
Colorado Interstate Gas Co. LLC
Senior Unsecured
11/15/15 | | | 6.800 | % | | | 3,219,000 | | | | 3,742,329 | | |
El Paso LLC
Senior Unsecured
01/15/32 | | | 7.750 | % | | | 6,853,000 | | | | 7,821,610 | | |
El Paso LLC(c)
Senior Unsecured
06/15/14 | | | 6.875 | % | | | 1,495,000 | | | | 1,598,494 | | |
| 06/01/18 | | | 7.250 | % | | | 779,000 | | | | 876,375 | | |
| 09/15/20 | | | 6.500 | % | | | 6,412,000 | | | | 7,021,140 | | |
Enterprise Products Operating LLC
06/01/15 | | | 3.700 | % | | | 2,510,000 | | | | 2,682,141 | | |
| 02/15/42 | | | 5.700 | % | | | 2,145,000 | | | | 2,387,627 | | |
Kinder Morgan Energy Partners LP
Senior Unsecured
01/15/38 | | | 6.950 | % | | | 670,000 | | | | 795,604 | | |
MarkWest Energy Partners LP/Finance Corp.
06/15/22 | | | 6.250 | % | | | 3,513,000 | | | | 3,600,825 | | |
NiSource Finance Corp.
09/15/17 | | | 5.250 | % | | | 9,425,000 | | | | 10,540,402 | | |
The accompanying Notes to Financial Statements are an integral part of this statement.
Annual Report 2012
10
Columbia Strategic Income Fund
Portfolio of Investments (continued)
May 31, 2012
Corporate Bonds & Notes(a) (continued)
| Issuer | | Coupon
Rate | | Principal
Amount ($) | | Value ($) | |
Northwest Pipeline GP
Senior Unsecured
04/15/17 | | | 5.950 | % | | | 500,000 | | | | 586,944 | | |
Plains All American Pipeline LP/Finance Corp.
05/01/19 | | | 8.750 | % | | | 2,715,000 | | | | 3,586,450 | | |
Regency Energy Partners LP/Finance Corp.
12/01/18 | | | 6.875 | % | | | 1,682,000 | | | | 1,766,100 | | |
| 07/15/21 | | | 6.500 | % | | | 3,807,000 | | | | 3,921,210 | | |
Regency Energy Partners LP/Finance Corp.(c)
06/01/16 | | | 9.375 | % | | | 1,409,000 | | | | 1,542,855 | | |
Southern Natural Gas Co. LLC
Senior Unsecured(b)
04/01/17 | | | 5.900 | % | | | 840,000 | | | | 968,128 | | |
Southern Star Central Corp.
Senior Unsecured
03/01/16 | | | 6.750 | % | | | 2,270,000 | | | | 2,304,050 | | |
TransCanada PipeLines Ltd.
Senior Unsecured
01/15/39 | | | 7.625 | % | | | 575,000 | | | | 850,072 | | |
Transcontinental Gas Pipe Line Co. LLC
Senior Unsecured(c)
08/15/41 | | | 5.400 | % | | | 2,465,000 | | | | 2,882,837 | | |
| Total | | | | | | | 59,475,193 | | |
| Health Care 2.6% | |
American Renal Associates Holdings, Inc.
Senior Unsecured PIK
03/01/16 | | | 9.750 | % | | | 697,305 | | | | 725,197 | | |
American Renal Holdings, Inc.
Senior Secured
05/15/18 | | | 8.375 | % | | | 1,625,000 | | | | 1,706,250 | | |
CHS/Community Health Systems, Inc.
11/15/19 | | | 8.000 | % | | | 2,605,000 | | | | 2,660,356 | | |
ConvaTec Healthcare E SA
Senior Unsecured(b)
12/15/18 | | | 10.500 | % | | | 5,272,000 | | | | 5,192,920 | | |
Emdeon, Inc.(b)
12/31/19 | | | 11.000 | % | | | 2,635,000 | | | | 2,924,850 | | |
Fresenius Medical Care U.S. Finance II, Inc.(b)
01/31/22 | | | 5.875 | % | | | 1,054,000 | | | | 1,048,730 | | |
Fresenius Medical Care U.S. Finance II, Inc.(b)(c)
07/31/19 | | | 5.625 | % | | | 813,000 | | | | 806,903 | | |
Fresenius Medical Care U.S. Finance, Inc.(b)(c)
09/15/18 | | | 6.500 | % | | | 621,000 | | | | 647,393 | | |
HCA, Inc.
Senior Secured
02/15/20 | | | 6.500 | % | | | 4,178,000 | | | | 4,413,012 | | |
| 02/15/20 | | | 7.875 | % | | | 1,665,000 | | | | 1,827,337 | | |
Corporate Bonds & Notes(a) (continued)
| Issuer | | Coupon
Rate | | Principal
Amount ($) | | Value ($) | |
HCA, Inc.(c)
02/15/22 | | | 7.500 | % | | | 2,076,000 | | | | 2,175,907 | | |
Senior Secured
09/15/20 | | | 7.250 | % | | | 7,979,000 | | | | 8,697,110 | | |
Health Management Associates, Inc.
Senior Unsecured(b)(c)
01/15/20 | | | 7.375 | % | | | 1,539,000 | | | | 1,577,475 | | |
IASIS Healthcare LLC/Capital Corp.(c)
05/15/19 | | | 8.375 | % | | | 2,015,000 | | | | 1,894,100 | | |
Kinetic Concepts, Inc./KCI U.S.A., Inc.(b)(c)
11/01/18 | | | 10.500 | % | | | 2,502,000 | | | | 2,527,020 | | |
| 11/01/19 | | | 12.500 | % | | | 1,929,000 | | | | 1,721,633 | | |
LifePoint Hospitals, Inc.(c)
10/01/20 | | | 6.625 | % | | | 1,002,000 | | | | 1,049,595 | | |
Multiplan, Inc.(b)(c)
09/01/18 | | | 9.875 | % | | | 4,520,000 | | | | 4,791,200 | | |
Omnicare, Inc.
06/01/20 | | | 7.750 | % | | | 1,499,000 | | | | 1,641,405 | | |
PSS World Medical, Inc.(b)
03/01/22 | | | 6.375 | % | | | 409,000 | | | | 413,090 | | |
Physio-Control International, Inc.
Senior Secured(b)
01/15/19 | | | 9.875 | % | | | 2,117,000 | | | | 2,244,020 | | |
Radnet Management, Inc.(c)
04/01/18 | | | 10.375 | % | | | 970,000 | | | | 960,300 | | |
Rural/Metro Corp.
Senior Unsecured(b)
07/15/19 | | | 10.125 | % | | | 1,692,000 | | | | 1,607,400 | | |
STHI Holding Corp.
Secured(b)
03/15/18 | | | 8.000 | % | | | 891,000 | | | | 935,550 | | |
United Surgical Partners International, Inc.
Senior Unsecured(b)
04/01/20 | | | 9.000 | % | | | 1,472,000 | | | | 1,527,200 | | |
Vanguard Health Holding Co. II LLC/Inc.(b)
02/01/19 | | | 7.750 | % | | | 834,000 | | | | 808,980 | | |
Vanguard Health Holding Co. II LLC/Inc.(c)
02/01/18 | | | 8.000 | % | | | 6,289,000 | | | | 6,163,220 | | |
| 02/01/19 | | | 7.750 | % | | | 410,000 | | | | 401,800 | | |
Wolverine Healthcare Analytics
Senior Unsecured(b)(h)
06/01/20 | | | 10.625 | % | | | 1,268,000 | | | | 1,274,340 | | |
| Total | | | | | | | 64,364,293 | | |
| Healthcare Insurance 0.1% | |
AMERIGROUP Corp.
Senior Unsecured
11/15/19 | | | 7.500 | % | | | 1,285,000 | | | | 1,374,950 | | |
The accompanying Notes to Financial Statements are an integral part of this statement.
Annual Report 2012
11
Columbia Strategic Income Fund
Portfolio of Investments (continued)
May 31, 2012
Corporate Bonds & Notes(a) (continued)
| Issuer | | Coupon
Rate | | Principal
Amount ($) | | Value ($) | |
WellPoint, Inc.
Senior Unsecured
02/15/19 | | | 7.000 | % | | | 960,000 | | | | 1,210,543 | | |
| Total | | | | | | | 2,585,493 | | |
| Home Construction 0.2% | |
KB Home(c)
03/15/20 | | | 8.000 | % | | | 1,053,000 | | | | 1,018,778 | | |
Meritage Homes Corp.(b)
04/01/22 | | | 7.000 | % | | | 1,000,000 | | | | 1,015,000 | | |
Shea Homes LP/Funding Corp.
Senior Secured(c)
05/15/19 | | | 8.625 | % | | | 1,535,000 | | | | 1,600,237 | | |
Taylor Morrison Communities, Inc./Monarch(b)
04/15/20 | | | 7.750 | % | | | 2,129,000 | | | | 2,192,870 | | |
| Total | | | | | | | 5,826,885 | | |
| Independent Energy 4.3% | |
Anadarko Petroleum Corp.
Senior Unsecured
09/15/16 | | | 5.950 | % | | | 8,505,000 | | | | 9,643,666 | | |
Antero Resources Finance Corp.(b)(c)
08/01/19 | | | 7.250 | % | | | 552,000 | | | | 558,900 | | |
Antero Resources Finance Corp.(c)
12/01/17 | | | 9.375 | % | | | 154,000 | | | | 166,320 | | |
Berry Petroleum Co.
Senior Unsecured(c)
11/01/20 | | | 6.750 | % | | | 760,000 | | | | 786,600 | | |
Carrizo Oil & Gas, Inc.(c)
10/15/18 | | | 8.625 | % | | | 4,451,000 | | | | 4,651,295 | | |
Chaparral Energy, Inc.
10/01/20 | | | 9.875 | % | | | 1,090,000 | | | | 1,212,625 | | |
Chaparral Energy, Inc.(b)(c)
11/15/22 | | | 7.625 | % | | | 2,140,000 | | | | 2,188,150 | | |
Chaparral Energy, Inc.(c)
09/01/21 | | | 8.250 | % | | | 2,849,000 | | | | 3,019,940 | | |
Chesapeake Energy Corp.(c)
08/15/20 | | | 6.625 | % | | | 7,185,000 | | | | 6,825,750 | | |
| 02/15/21 | | | 6.125 | % | | | 4,711,000 | | | | 4,428,340 | | |
Cimarex Energy Co.(c)
05/01/22 | | | 5.875 | % | | | 3,136,000 | | | | 3,214,400 | | |
Comstock Resources, Inc.(h)
06/15/20 | | | 9.500 | % | | | 3,958,000 | | | | 3,772,132 | | |
Concho Resources, Inc.
01/15/22 | | | 6.500 | % | | | 1,059,000 | | | | 1,106,655 | | |
Concho Resources, Inc.(c)
01/15/21 | | | 7.000 | % | | | 3,680,000 | | | | 3,946,800 | | |
Corporate Bonds & Notes(a) (continued)
| Issuer | | Coupon
Rate | | Principal
Amount ($) | | Value ($) | |
Continental Resources, Inc.
10/01/19 | | | 8.250 | % | | | 216,000 | | | | 239,760 | | |
| 10/01/20 | | | 7.375 | % | | | 224,000 | | | | 246,400 | | |
| 04/01/21 | | | 7.125 | % | | | 3,095,000 | | | | 3,404,500 | | |
Continental Resources, Inc.(b)
09/15/22 | | | 5.000 | % | | | 4,997,000 | | | | 4,947,030 | | |
Everest Acquisition LLC/Finance, Inc.(b)
Senior Secured
05/01/19 | | | 6.875 | % | | | 2,358,000 | | | | 2,416,950 | | |
Everest Acquisition LLC/Finance, Inc.(b)(c)
Senior Unsecured
05/01/20 | | | 9.375 | % | | | 3,378,000 | | | | 3,462,450 | | |
Goodrich Petroleum Corp.(c)
03/15/19 | | | 8.875 | % | | | 1,568,000 | | | | 1,489,600 | | |
Kodiak Oil & Gas Corp.(b)
12/01/19 | | | 8.125 | % | | | 7,211,000 | | | | 7,427,330 | | |
Laredo Petroleum, Inc.
02/15/19 | | | 9.500 | % | | | 6,085,000 | | | | 6,754,350 | | |
Laredo Petroleum, Inc.(b)
05/01/22 | | | 7.375 | % | | | 929,000 | | | | 938,290 | | |
MEG Energy Corp.(b)
03/15/21 | | | 6.500 | % | | | 2,610,000 | | | | 2,662,200 | | |
Newfield Exploration Co.
Senior Subordinated Notes(c)
02/01/20 | | | 6.875 | % | | | 2,095,000 | | | | 2,220,700 | | |
Oasis Petroleum, Inc.
02/01/19 | | | 7.250 | % | | | 3,349,000 | | | | 3,449,470 | | |
Oasis Petroleum, Inc.(c)
11/01/21 | | | 6.500 | % | | | 3,320,000 | | | | 3,320,000 | | |
QEP Resources, Inc.
Senior Unsecured
03/01/21 | | | 6.875 | % | | | 3,280,000 | | | | 3,550,600 | | |
QEP Resources, Inc.(c)
Senior Unsecured
10/01/22 | | | 5.375 | % | | | 1,431,000 | | | | 1,402,380 | | |
Range Resources Corp.
05/01/18 | | | 7.250 | % | | | 369,000 | | | | 388,373 | | |
| 05/15/19 | | | 8.000 | % | | | 1,115,000 | | | | 1,215,350 | | |
| 08/01/20 | | | 6.750 | % | | | 2,335,000 | | | | 2,515,962 | | |
| 06/01/21 | | | 5.750 | % | | | 385,000 | | | | 396,550 | | |
Range Resources Corp.(c)
08/15/22 | | | 5.000 | % | | | 527,000 | | | | 505,920 | | |
SM Energy Co.
Senior Unsecured(c)
11/15/21 | | | 6.500 | % | | | 1,297,000 | | | | 1,326,183 | | |
WPX Energy, Inc.
Senior Unsecured(b)(c)
01/15/22 | | | 6.000 | % | | | 806,000 | | | | 775,775 | | |
Whiting Petroleum Corp.
10/01/18 | | | 6.500 | % | | | 156,000 | | | | 163,020 | | |
The accompanying Notes to Financial Statements are an integral part of this statement.
Annual Report 2012
12
Columbia Strategic Income Fund
Portfolio of Investments (continued)
May 31, 2012
Corporate Bonds & Notes(a) (continued)
| Issuer | | Coupon
Rate | | Principal
Amount ($) | | Value ($) | |
Woodside Finance Ltd.(b)
05/10/21 | | | 4.600 | % | | | 4,500,000 | | | | 4,855,239 | | |
| Total | | | | | | | 105,595,955 | | |
| Integrated Energy 0.2% | |
Lukoil International Finance BV(b)
11/05/19 | | | 7.250 | % | | | 1,100,000 | | | | 1,205,516 | | |
| 11/09/20 | | | 6.125 | % | | | 2,300,000 | | | | 2,374,402 | | |
TNK-BP Finance SA(b)
03/13/18 | | | 7.875 | % | | | 425,000 | | | | 480,581 | | |
| Total | | | | | | | 4,060,499 | | |
| Media Cable 1.3% | |
CCO Holdings LLC/Capital Corp.
04/30/20 | | | 8.125 | % | | | 4,045,000 | | | | 4,459,612 | | |
CCO Holdings LLC/Capital Corp.(c)
04/30/18 | | | 7.875 | % | | | 370,000 | | | | 395,900 | | |
| 01/15/19 | | | 7.000 | % | | | 2,900,000 | | | | 3,052,250 | | |
| 01/31/22 | | | 6.625 | % | | | 458,000 | | | | 468,878 | | |
CSC Holdings LLC
Senior Unsecured(b)
11/15/21 | | | 6.750 | % | | | 4,051,000 | | | | 4,101,637 | | |
Cablevision Systems Corp.
Senior Unsecured(c)
04/15/20 | | | 8.000 | % | | | 1,175,000 | | | | 1,224,937 | | |
Comcast Corp.
08/15/37 | | | 6.950 | % | | | 3,430,000 | | | | 4,412,990 | | |
DISH DBS Corp.
06/01/21 | | | 6.750 | % | | | 7,824,000 | | | | 8,078,280 | | |
DISH DBS Corp.(b)(c)
07/15/22 | | | 5.875 | % | | | 920,000 | | | | 892,400 | | |
DISH DBS Corp.(c)
09/01/19 | | | 7.875 | % | | | 523,000 | | | | 581,838 | | |
Time Warner Cable, Inc.
07/01/18 | | | 6.750 | % | | | 335,000 | | | | 405,911 | | |
Time Warner Cable, Inc.(c)
02/01/20 | | | 5.000 | % | | | 650,000 | | | | 727,800 | | |
UPCB Finance V Ltd.
Senior Secured(b)(c)
11/15/21 | | | 7.250 | % | | | 1,749,000 | | | | 1,801,737 | | |
UPCB Finance VI Ltd.
Senior Secured(b)(c)
01/15/22 | | | 6.875 | % | | | 1,660,000 | | | | 1,635,598 | | |
Videotron Ltee(b)(c)
07/15/22 | | | 5.000 | % | | | 115,000 | | | | 112,125 | | |
Virgin Media Finance PLC
02/15/22 | | | 5.250 | % | | | 215,000 | | | | 209,625 | | |
| Total | | | | | | | 32,561,518 | | |
Corporate Bonds & Notes(a) (continued)
| Issuer | | Coupon
Rate | | Principal
Amount ($) | | Value ($) | |
| Media Non-Cable 3.3% | |
AMC Networks, Inc.(b)(c)
07/15/21 | | | 7.750 | % | | | 5,832,000 | | | | 6,473,520 | | |
Clear Channel Worldwide Holdings, Inc.
12/15/17 | | | 9.250 | % | | | 4,899,000 | | | | 5,266,425 | | |
Clear Channel Worldwide Holdings, Inc.(b)
03/15/20 | | | 7.625 | % | | | 851,000 | | | | 799,940 | | |
| 03/15/20 | | | 7.625 | % | | | 6,806,000 | | | | 6,499,730 | | |
Hughes Satellite Systems Corp.(c)
06/15/21 | | | 7.625 | % | | | 1,245,000 | | | | 1,288,575 | | |
Senior Secured
06/15/19 | | | 6.500 | % | | | 4,440,000 | | | | 4,506,600 | | |
Intelsat Jackson Holdings SA(b)
10/15/20 | | | 7.250 | % | | | 1,620,000 | | | | 1,607,850 | | |
Intelsat Jackson Holdings SA(c)
04/01/19 | | | 7.250 | % | | | 395,000 | | | | 394,506 | | |
| 04/01/21 | | | 7.500 | % | | | 2,660,000 | | | | 2,660,000 | | |
Intelsat Luxembourg SA(b)
PIK
02/04/17 | | | 11.500 | % | | | 1,943,000 | | | | 1,889,568 | | |
Intelsat Luxembourg SA(c)
PIK
02/04/17 | | | 11.500 | % | | | 2,809,000 | | | | 2,759,842 | | |
Lamar Media Corp.(b)(c)
02/01/22 | | | 5.875 | % | | | 2,098,000 | | | | 2,111,112 | | |
National CineMedia LLC
Senior Unsecured
07/15/21 | | | 7.875 | % | | | 2,784,000 | | | | 2,909,280 | | |
National CineMedia LLC(b)
Senior Secured
04/15/22 | | | 6.000 | % | | | 2,284,000 | | | | 2,278,290 | | |
News America, Inc.
12/15/35 | | | 6.400 | % | | | 150,000 | | | | 170,564 | | |
| 02/15/41 | | | 6.150 | % | | | 5,395,000 | | | | 6,183,420 | | |
Nielsen Finance LLC/Co.
10/15/18 | | | 7.750 | % | | | 4,236,000 | | | | 4,553,700 | | |
Salem Communications Corp.
Secured
12/15/16 | | | 9.625 | % | | | 3,856,000 | | | | 4,222,320 | | |
Sinclair Television Group, Inc.
Secured(b)
11/01/17 | | | 9.250 | % | | | 6,127,000 | | | | 6,739,700 | | |
TCM Sub LLC(b)
01/15/15 | | | 3.550 | % | | | 5,510,000 | | | | 5,834,352 | | |
Univision Communications, Inc.(b)
Senior Secured
11/01/20 | | | 7.875 | % | | | 5,743,000 | | | | 5,872,217 | | |
The accompanying Notes to Financial Statements are an integral part of this statement.
Annual Report 2012
13
Columbia Strategic Income Fund
Portfolio of Investments (continued)
May 31, 2012
Corporate Bonds & Notes(a) (continued)
| Issuer | | Coupon
Rate | | Principal
Amount ($) | | Value ($) | |
Univision Communications, Inc.(b)(c)
05/15/21 | | | 8.500 | % | | | 1,455,000 | | | | 1,400,438 | | |
Senior Secured
05/15/19 | | | 6.875 | % | | | 2,100,000 | | | | 2,047,500 | | |
XM Satellite Radio, Inc.(b)(c)
11/01/18 | | | 7.625 | % | | | 3,273,000 | | | | 3,481,654 | | |
| Total | | | | | | | 81,951,103 | | |
| Metals 1.9% | |
Aleris International, Inc.
Senior Unsecured(f)(g)
06/01/20 | | | 6.000 | % | | | 3,093 | | | | 3,147 | | |
Alpha Natural Resources, Inc.(c)
06/01/19 | | | 6.000 | % | | | 3,295,000 | | | | 2,957,262 | | |
| 06/01/21 | | | 6.250 | % | | | 1,425,000 | | | | 1,278,938 | | |
ArcelorMittal
Senior Unsecured(c)
03/01/21 | | | 5.500 | % | | | 6,465,000 | | | | 6,156,445 | | |
Arch Coal, Inc.(b)
06/15/21 | | | 7.250 | % | | | 313,000 | | | | 267,615 | | |
Arch Coal, Inc.(b)(c)
06/15/19 | | | 7.000 | % | | | 2,409,000 | | | | 2,065,718 | | |
CONSOL Energy, Inc.
04/01/17 | | | 8.000 | % | | | 1,116,000 | | | | 1,118,790 | | |
CONSOL Energy, Inc.(c)
04/01/20 | | | 8.250 | % | | | 2,994,000 | | | | 2,994,000 | | |
Calcipar SA
Senior Secured(b)
05/01/18 | | | 6.875 | % | | | 3,797,000 | | | | 3,806,492 | | |
FMG Resources August 2006 Proprietary Ltd.(b)(c)
02/01/16 | | | 6.375 | % | | | 1,855,000 | | | | 1,813,263 | | |
| 02/01/18 | | | 6.875 | % | | | 943,000 | | | | 926,498 | | |
| 11/01/19 | | | 8.250 | % | | | 4,606,000 | | | | 4,813,270 | | |
Senior Unsecured
04/01/22 | | | 6.875 | % | | | 2,295,000 | | | | 2,208,937 | | |
Inmet Mining Corp.
Senior Notes(b)(c)
06/01/20 | | | 8.750 | % | | | 5,315,000 | | | | 5,182,125 | | |
JMC Steel Group
Senior Notes(b)
03/15/18 | | | 8.250 | % | | | 3,808,000 | | | | 3,846,080 | | |
Peabody Energy Corp.(b)
11/15/18 | | | 6.000 | % | | | 2,594,000 | | | | 2,587,515 | | |
Peabody Energy Corp.(b)(c)
11/15/21 | | | 6.250 | % | | | 1,918,000 | | | | 1,913,205 | | |
Rain CII Carbon LLC/Corp.
Senior Secured(b)
12/01/18 | | | 8.000 | % | | | 3,182,000 | | | | 3,333,145 | | |
| Total | | | | | | | 47,272,445 | | |
Corporate Bonds & Notes(a) (continued)
| Issuer | | Coupon
Rate | | Principal
Amount ($) | | Value ($) | |
| Non-Captive Consumer 0.5% | |
SLM Corp.
Senior Notes
01/25/16 | | | 6.250 | % | | | 2,434,000 | | | | 2,464,425 | | |
Senior Unsecured
03/25/20 | | | 8.000 | % | | | 3,637,000 | | | | 3,722,553 | | |
| 01/25/22 | | | 7.250 | % | | | 2,682,000 | | | | 2,625,099 | | |
Springleaf Finance Corp.
Senior Unsecured
12/15/17 | | | 6.900 | % | | | 4,029,000 | | | | 3,162,765 | | |
| Total | | | | | | | 11,974,842 | | |
| Non-Captive Diversified 2.5% | |
Ally Financial, Inc.
02/15/17 | | | 5.500 | % | | | 910,000 | | | | 910,819 | | |
Ally Financial, Inc.(c)
03/15/20 | | | 8.000 | % | | | 12,417,000 | | | | 14,000,167 | | |
| 09/15/20 | | | 7.500 | % | | | 6,054,000 | | | | 6,644,265 | | |
CIT Group, Inc.(b)
Senior Secured
04/01/18 | | | 6.625 | % | | | 3,125,000 | | | | 3,242,188 | | |
Senior Unsecured
02/15/15 | | | 4.750 | % | | | 1,790,000 | | | | 1,781,050 | | |
CIT Group, Inc.(b)(c)
Senior Unsecured
02/15/19 | | | 5.500 | % | | | 7,171,000 | | | | 6,991,725 | | |
CIT Group, Inc.(c)
Senior Unsecured
03/15/18 | | | 5.250 | % | | | 3,007,000 | | | | 2,961,895 | | |
| 05/15/20 | | | 5.375 | % | | | 1,953,000 | | | | 1,874,880 | | |
General Electric Capital Corp.
Senior Unsecured(c)
10/17/21 | | | 4.650 | % | | | 9,370,000 | | | | 10,294,575 | | |
International Lease Finance Corp.
Senior Unsecured
09/01/17 | | | 8.875 | % | | | 2,590,000 | | | | 2,900,800 | | |
| 04/01/19 | | | 5.875 | % | | | 853,000 | | | | 837,886 | | |
International Lease Finance Corp.(c)
Senior Unsecured
05/15/19 | | | 6.250 | % | | | 1,589,000 | | | | 1,589,000 | | |
| 12/15/20 | | | 8.250 | % | | | 3,500,000 | | | | 3,902,500 | | |
| 01/15/22 | | | 8.625 | % | | | 2,266,000 | | | | 2,583,240 | | |
| Total | | | | | | | 60,514,990 | | |
| Oil Field Services 0.9% | |
Atwood Oceanics, Inc.
Senior Unsecured
02/01/20 | | | 6.500 | % | | | 6,024,000 | | | | 6,234,840 | | |
Gazstream SA for Gazprom OAO(b)
07/22/13 | | | 5.625 | % | | | 8,299 | | | | 8,422 | | |
The accompanying Notes to Financial Statements are an integral part of this statement.
Annual Report 2012
14
Columbia Strategic Income Fund
Portfolio of Investments (continued)
May 31, 2012
Corporate Bonds & Notes(a) (continued)
| Issuer | | Coupon
Rate | | Principal
Amount ($) | | Value ($) | |
Green Field Energy Services, Inc.
Senior Secured(b)
11/15/16 | | | 13.000 | % | | | 3,895,000 | | | | 3,817,100 | | |
Novatek Finance Ltd.
Senior Unsecured(b)(c)
02/03/21 | | | 6.604 | % | | | 300,000 | | | | 322,520 | | |
Offshore Group Investments Ltd.(b)
Senior Secured
08/01/15 | | | 11.500 | % | | | 1,760,000 | | | | 1,874,400 | | |
Offshore Group Investments Ltd.(c)
Senior Secured
08/01/15 | | | 11.500 | % | | | 6,936,000 | | | | 7,386,840 | | |
Oil States International, Inc.(c)
06/01/19 | | | 6.500 | % | | | 3,301,000 | | | | 3,408,282 | | |
Weatherford International Ltd.
03/15/13 | | | 5.150 | % | | | 14,000 | | | | 14,423 | | |
| Total | | | | | | | 23,066,827 | | |
| Other Industry 0.1% | |
Interline Brands, Inc.(c)
11/15/18 | | | 7.000 | % | | | 1,288,000 | | | | 1,326,640 | | |
| Packaging 1.0% | |
Ardagh Packaging Finance PLC(b)(c)
10/15/20 | | | 9.125 | % | | | 2,771,000 | | | | 2,881,840 | | |
Senior Secured
10/15/17 | | | 7.375 | % | | | 3,932,000 | | | | 4,187,580 | | |
Berry Plastics Corp.
Secured
01/15/21 | | | 9.750 | % | | | 771,000 | | | | 801,840 | | |
Reynolds Group Issuer, Inc./LLC(b)
Senior Secured
08/15/19 | | | 7.875 | % | | | 5,224,000 | | | | 5,524,380 | | |
Reynolds Group Issuer, Inc./LLC(b)(c)
Senior Secured
04/15/19 | | | 7.125 | % | | | 2,868,000 | | | | 2,946,870 | | |
Senior Unsecured
08/15/19 | | | 9.875 | % | | | 3,423,000 | | | | 3,414,443 | | |
| 08/15/19 | | | 9.875 | % | | | 3,947,000 | | | | 3,937,132 | | |
| Total | | | | | | | 23,694,085 | | |
| Paper 0.1% | |
Cascades, Inc.(c)
12/15/17 | | | 7.750 | % | | | 2,490,000 | | | | 2,477,550 | | |
| Pharmaceuticals 0.5% | |
Endo Health Solutions, Inc.(c)
01/15/22 | | | 7.250 | % | | | 1,171,000 | | | | 1,223,695 | | |
Grifols, Inc.
02/01/18 | | | 8.250 | % | | | 2,873,000 | | | | 3,056,154 | | |
Corporate Bonds & Notes(a) (continued)
| Issuer | | Coupon
Rate | | Principal
Amount ($) | | Value ($) | |
Mylan, Inc.(b)(c)
11/15/18 | | | 6.000 | % | | | 6,169,000 | | | | 6,369,492 | | |
Pharmaceutical Product Development, Inc.
Senior Unsecured(b)(c)
12/01/19 | | | 9.500 | % | | | 912,000 | | | | 971,280 | | |
Warner Chilcott Co. LLC/Finance
09/15/18 | | | 7.750 | % | | | 1,439,000 | | | | 1,518,145 | | |
| Total | | | | | | | 13,138,766 | | |
| Railroads 0.2% | |
CSX Corp.
Senior Unsecured
04/15/41 | | | 5.500 | % | | | 3,205,000 | | | | 3,625,775 | | |
Union Pacific Corp.
Senior Unsecured
08/15/18 | | | 5.700 | % | | | 1,440,000 | | | | 1,723,866 | | |
| Total | | | | | | | 5,349,641 | | |
| Refining —% | |
Phillips 66(b)
05/01/17 | | | 2.950 | % | | | 595,000 | | | | 606,428 | | |
| REITs —% | |
Duke Realty LP
Senior Unsecured
08/15/19 | | | 8.250 | % | | | 200 | | | | 248 | | |
| Restaurants 0.3% | |
Yum! Brands, Inc.
Senior Unsecured
09/15/19 | | | 5.300 | % | | | 5,417,000 | | | | 6,314,472 | | |
| Retailers 1.3% | |
99 Cents Only Stores(b)
12/15/19 | | | 11.000 | % | | | 1,316,000 | | | | 1,404,830 | | |
AutoNation, Inc.
02/01/20 | | | 5.500 | % | | | 186,000 | | | | 187,395 | | |
Best Buy Co., Inc.
Senior Unsecured(c)
03/15/21 | | | 5.500 | % | | | 1,125,000 | | | | 1,046,249 | | |
Burlington Coat Factory Warehouse Corp.(c)
02/15/19 | | | 10.000 | % | | | 4,121,000 | | | | 4,254,932 | | |
Jo-Ann Stores, Inc.
Senior Unsecured(b)(c)
03/15/19 | | | 8.125 | % | | | 1,842,000 | | | | 1,800,555 | | |
Limited Brands, Inc.
02/15/22 | | | 5.625 | % | | | 1,832,000 | | | | 1,845,740 | | |
Limited Brands, Inc.(c)
04/01/21 | | | 6.625 | % | | | 4,690,000 | | | | 5,030,025 | | |
The accompanying Notes to Financial Statements are an integral part of this statement.
Annual Report 2012
15
Columbia Strategic Income Fund
Portfolio of Investments (continued)
May 31, 2012
Corporate Bonds & Notes(a) (continued)
| Issuer | | Coupon
Rate | | Principal
Amount ($) | | Value ($) | |
Rite Aid Corp.
Senior Secured
08/15/20 | | | 8.000 | % | | | 4,650,000 | | | | 5,085,937 | | |
Senior Unsecured
02/15/27 | | | 7.700 | % | | | 2,012,000 | | | | 1,639,780 | | |
Rite Aid Corp.(b)
03/15/20 | | | 9.250 | % | | | 1,273,000 | | | | 1,218,898 | | |
Rite Aid Corp.(b)(c)
03/15/20 | | | 9.250 | % | | | 3,143,000 | | | | 3,017,280 | | |
Rite Aid Corp.(c)
06/15/17 | | | 9.500 | % | | | 2,492,000 | | | | 2,392,320 | | |
Sally Holdings LLC/Capital, Inc.
06/01/22 | | | 5.750 | % | | | 724,000 | | | | 732,145 | | |
Sally Holdings LLC/Capital, Inc.(b)(c)
11/15/19 | | | 6.875 | % | | | 1,217,000 | | | | 1,293,063 | | |
| Total | | | | | | | 30,949,149 | | |
| Supranational 0.4% | |
European Investment Bank
Senior Unsecured
06/20/17 | | | 1.400 | % | | JPY | 446,000,000 | | | | 5,993,469 | | |
| 01/18/27 | | | 2.150 | % | | JPY | 29,100,000 | | | | 391,447 | | |
International Finance Corp.
02/28/13 | | | 7.500 | % | | AUD | 2,675,000 | | | | 2,690,546 | | |
| Total | | | | | | | 9,075,462 | | |
| Technology 1.8% | |
Alliance Data Systems Corp.(b)(c)
04/01/20 | | | 6.375 | % | | | 1,145,000 | | | | 1,139,275 | | |
Amkor Technology, Inc.
Senior Unsecured
05/01/18 | | | 7.375 | % | | | 775,000 | | | | 775,000 | | |
| 06/01/21 | | | 6.625 | % | | | 4,190,000 | | | | 3,938,600 | | |
Anixter, Inc.
05/01/19 | | | 5.625 | % | | | 650,000 | | | | 661,375 | | |
Brocade Communications Systems, Inc.
Senior Secured
01/15/20 | | | 6.875 | % | | | 1,817,000 | | | | 1,980,530 | | |
CDW LLC/Finance Corp.
Senior Secured
12/15/18 | | | 8.000 | % | | | 2,247,000 | | | | 2,381,820 | | |
CDW LLC/Finance Corp.(b)(c)
04/01/19 | | | 8.500 | % | | | 895,000 | | | | 918,494 | | |
CDW LLC/Finance Corp.(c)
04/01/19 | | | 8.500 | % | | | 4,254,000 | | | | 4,370,985 | | |
Cardtronics, Inc.
09/01/18 | | | 8.250 | % | | | 2,916,000 | | | | 3,214,890 | | |
CommScope, Inc.(b)(c)
01/15/19 | | | 8.250 | % | | | 473,000 | | | | 486,599 | | |
Corporate Bonds & Notes(a) (continued)
| Issuer | | Coupon
Rate | | Principal
Amount ($) | | Value ($) | |
Equinix, Inc.
Senior Unsecured
07/15/21 | | | 7.000 | % | | | 1,055,000 | | | | 1,128,850 | | |
First Data Corp.(b)
Senior Secured
08/15/20 | | | 8.875 | % | | | 3,745,000 | | | | 3,997,787 | | |
First Data Corp.(b)(c)
Senior Secured
06/15/19 | | | 7.375 | % | | | 2,674,000 | | | | 2,674,000 | | |
First Data Corp.(c)
01/15/21 | | | 12.625 | % | | | 4,183,000 | | | | 3,942,477 | | |
Freescale Semiconductor, Inc.
Senior Secured(b)
04/15/18 | | | 9.250 | % | | | 3,027,000 | | | | 3,185,918 | | |
Interactive Data Corp.(c)
08/01/18 | | | 10.250 | % | | | 4,310,000 | | | | 4,773,325 | | |
NXP BV/Funding LLC
Senior Secured(b)(c)
08/01/18 | | | 9.750 | % | | | 3,800,000 | | | | 4,313,000 | | |
| Total | | | | | | | 43,882,925 | | |
| Transportation Services 0.3% | |
Avis Budget Car Rental LLC/Finance, Inc.(c)
01/15/19 | | | 8.250 | % | | | 1,775,000 | | | | 1,837,125 | | |
| 03/15/20 | | | 9.750 | % | | | 1,330,000 | | | | 1,456,350 | | |
ERAC U.S.A. Finance LLC(b)
10/01/20 | | | 5.250 | % | | | 1,150,000 | | | | 1,291,382 | | |
| 10/15/37 | | | 7.000 | % | | | 402,000 | | | | 489,152 | | |
Hertz Corp. (The)(c)
01/15/21 | | | 7.375 | % | | | 2,028,000 | | | | 2,126,865 | | |
| Total | | | | | | | 7,200,874 | | |
| Wireless 2.0% | |
Cricket Communications, Inc.(c)
10/15/20 | | | 7.750 | % | | | 1,574,000 | | | | 1,440,210 | | |
Senior Secured
05/15/16 | | | 7.750 | % | | | 5,472,000 | | | | 5,772,960 | | |
MetroPCS Wireless, Inc.(c)
09/01/18 | | | 7.875 | % | | | 2,415,000 | | | | 2,451,225 | | |
| 11/15/20 | | | 6.625 | % | | | 535,000 | | | | 517,613 | | |
NII Capital Corp.
04/01/21 | | | 7.625 | % | | | 2,763,000 | | | | 2,327,827 | | |
Nextel Communications, Inc.(c)
08/01/15 | | | 7.375 | % | | | 1,405,000 | | | | 1,373,387 | | |
SBA Telecommunications, Inc.
08/15/19 | | | 8.250 | % | | | 2,834,000 | | | | 3,074,890 | | |
Sprint Capital Corp.(c)
11/15/28 | | | 6.875 | % | | | 12,091,000 | | | | 8,977,567 | | |
The accompanying Notes to Financial Statements are an integral part of this statement.
Annual Report 2012
16
Columbia Strategic Income Fund
Portfolio of Investments (continued)
May 31, 2012
Corporate Bonds & Notes(a) (continued)
| Issuer | | Coupon
Rate | | Principal
Amount ($) | | Value ($) | |
Sprint Nextel Corp.(b)(c)
11/15/18 | | | 9.000 | % | | | 9,383,000 | | | | 10,133,640 | | |
| 03/01/20 | | | 7.000 | % | | | 1,261,000 | | | | 1,270,458 | | |
Senior Unsecured
03/01/17 | | | 9.125 | % | | | 330,000 | | | | 327,525 | | |
United States Cellular Corp.
Senior Unsecured
12/15/33 | | | 6.700 | % | | | 2,005,000 | | | | 2,106,780 | | |
VimpelCom Holdings BV(b)
03/01/22 | | | 7.504 | % | | | 1,000,000 | | | | 906,860 | | |
Wind Acquisition Finance SA
Senior Secured(b)(c)
02/15/18 | | | 7.250 | % | | | 9,536,000 | | | | 8,200,960 | | |
| Total | | | | | | | 48,881,902 | | |
| Wirelines 2.5% | |
AT&T, Inc.
Senior Unsecured
02/15/39 | | | 6.550 | % | | | 2,715,000 | | | | 3,465,866 | | |
AT&T, Inc.(c)
Senior Unsecured
08/15/41 | | | 5.550 | % | | | 2,905,000 | | | | 3,404,590 | | |
Embarq Corp.
Senior Unsecured
06/01/36 | | | 7.995 | % | | | 11,265,000 | | | | 11,542,344 | | |
Frontier Communications Corp.
Senior Unsecured
04/15/20 | | | 8.500 | % | | | 2,480,000 | | | | 2,486,200 | | |
Frontier Communications Corp.(c)
Senior Unsecured
04/15/15 | | | 7.875 | % | | | 104,000 | | | | 112,060 | | |
| 04/15/17 | | | 8.250 | % | | | 260,000 | | | | 268,450 | | |
| 10/01/18 | | | 8.125 | % | | | 935,000 | | | | 951,363 | | |
| 07/01/21 | | | 9.250 | % | | | 1,122,000 | | | | 1,161,270 | | |
| 04/15/22 | | | 8.750 | % | | | 953,000 | | | | 960,148 | | |
Integra Telecom Holdings, Inc.
Senior Secured(b)
04/15/16 | | | 10.750 | % | | | 1,303,000 | | | | 1,250,880 | | |
Level 3 Communications, Inc.
Senior Unsecured
02/01/19 | | | 11.875 | % | | | 2,857,000 | | | | 3,064,132 | | |
Level 3 Financing, Inc.
04/01/19 | | | 9.375 | % | | | 2,778,000 | | | | 2,951,625 | | |
| 07/01/19 | | | 8.125 | % | | | 1,656,000 | | | | 1,656,000 | | |
Level 3 Financing, Inc.(c)
02/15/17 | | | 8.750 | % | | | 1,094,000 | | | | 1,129,555 | | |
| 02/01/18 | | | 10.000 | % | | | 1,620,000 | | | | 1,745,550 | | |
PAETEC Holding Corp.
12/01/18 | | | 9.875 | % | | | 3,015,000 | | | | 3,308,962 | | |
Senior Secured
06/30/17 | | | 8.875 | % | | | 5,158,000 | | | | 5,544,850 | | |
Corporate Bonds & Notes(a) (continued)
| Issuer | | Coupon
Rate | | Principal
Amount ($) | | Value ($) | |
Qtel International Finance Ltd.(b)
06/10/19 | | | 7.875 | % | | | 600,000 | | | | 751,339 | | |
| 10/19/25 | | | 5.000 | % | | | 1,900,000 | | | | 1,969,135 | | |
Telefonica Emisiones SAU(c)
04/27/15 | | | 3.729 | % | | | 7,335,000 | | | | 6,815,066 | | |
Verizon New York, Inc.
Senior Unsecured
04/01/32 | | | 7.375 | % | | | 4,725,000 | | | | 5,920,505 | | |
Windstream Corp.(c)
09/01/18 | | | 8.125 | % | | | 1,485,000 | | | | 1,540,688 | | |
| 03/15/19 | | | 7.000 | % | | | 395,000 | | | | 387,100 | | |
| Total | | | | | | | 62,387,678 | | |
Total Corporate Bonds & Notes
(Cost: $1,099,882,931) | | | | | | | 1,135,192,920 | | |
Residential Mortgage-Backed Securities — Agency 9.7%
Federal Home Loan Mortgage Corp.(d)(i)(j)
CMO IO Series 2957 Class SW
04/15/35 | | | 5.761 | % | | | 12,191,926 | | | | 2,028,932 | | |
CMO IO Series 3122 Class IS
03/15/36 | | | 6.461 | % | | | 11,048,636 | | | | 1,826,270 | | |
CMO IO Series 3550 Class EI
07/15/39 | | | 6.161 | % | | | 13,542,849 | | | | 2,444,861 | | |
CMO IO Series 3761 Class KS
06/15/40 | | | 5.761 | % | | | 13,035,727 | | | | 2,150,887 | | |
CMO IO Series 3960 Class SL
11/15/41 | | | 6.261 | % | | | 14,580,979 | | | | 3,301,546 | | |
CMO IO Series 3966 Class SA
12/15/41 | | | 5.661 | % | | | 19,378,413 | | | | 4,303,980 | | |
CMO IO Series 3998 Class GS
05/15/36 | | | 6.311 | % | | | 9,790,517 | | | | 1,821,224 | | |
Federal Home Loan Mortgage Corp.(i)
05/01/21 -
06/01/36 | | | 5.000 | % | | | 4,873,335 | | | | 5,255,448 | | |
| 01/01/20 | | | 10.500 | % | | | 3,930 | | | | 3,950 | | |
Federal National Mortgage Association(d)(i)(j)
CMO IO Series 2006-5 Class N2
02/25/35 | | | 2.135 | % | | | 9,720,035 | | | | 523,899 | | |
CMO IO Series 2010-135 Class MS
12/25/40 | | | 5.711 | % | | | 7,090,117 | | | | 1,271,270 | | |
Federal National Mortgage Association(h)(i)
07/01/27 | | | 2.500 | % | | | 56,500,000 | | | | 58,080,234 | | |
| 07/01/27 | | | 3.000 | % | | | 27,000,000 | | | | 28,202,344 | | |
| 06/01/42 | | | 3.500 | % | | | 32,000,000 | | | | 33,584,998 | | |
| 06/01/42 | | | 4.000 | % | | | 11,500,000 | | | | 12,242,109 | | |
| 06/01/42 | | | 5.000 | % | | | 5,000,000 | | | | 5,415,625 | | |
The accompanying Notes to Financial Statements are an integral part of this statement.
Annual Report 2012
17
Columbia Strategic Income Fund
Portfolio of Investments (continued)
May 31, 2012
Residential Mortgage-Backed Securities — Agency (continued)
| Issuer | | Coupon
Rate | | Principal
Amount ($) | | Value ($) | |
Federal National Mortgage Association(i)
05/01/41 | | | 4.000 | % | | | 18,917,224 | | | | 20,044,869 | | |
| 12/01/20 | | | 4.500 | % | | | 227,689 | | | | 244,890 | | |
05/01/33 -
03/01/34 | | | 5.000 | % | | | 545,717 | | | | 592,065 | | |
02/01/35 -
11/01/36 | | | 5.500 | % | | | 3,679,604 | | | | 4,021,012 | | |
04/01/34 -
08/01/37 | | | 6.000 | % | | | 12,212,048 | | | | 13,483,618 | | |
12/01/31 -
05/01/33 | | | 6.500 | % | | | 55,234 | | | | 63,219 | | |
| 07/01/38 | | | 7.000 | % | | | 347,940 | | | | 404,500 | | |
| 04/01/14 | | | 10.000 | % | | | 14,335 | | | | 14,543 | | |
Federal National Mortgage Association(i)(k)
07/01/40 | | | 4.500 | % | | | 14,018,060 | | | | 15,363,940 | | |
| 11/01/36 | | | 6.500 | % | | | 9,171,260 | | | | 10,353,970 | | |
| 10/01/37 | | | 7.000 | % | | | 330,959 | | | | 386,355 | | |
Government National Mortgage Association(d)(i)(j)
CMO IO Series 2010-108 Class PI
02/20/38 | | | 5.860 | % | | | 15,661,848 | | | | 2,245,693 | | |
CMO IO Series 2012-41 Class SA
03/20/42 | | | 6.360 | % | | | 23,102,883 | | | | 6,549,554 | | |
CMO IO Series 2012-48 Class SA
04/16/42 | | | 6.411 | % | | | 4,966,781 | | | | 1,168,926 | | |
Government National Mortgage Association(i)
08/15/13 | | | 11.750 | % | | | 1,336 | | | | 1,343 | | |
Government National Mortgage Association(i)(j)
CMO IO Series 2010-167 Class GI
02/20/38 | | | 4.000 | % | | | 8,601,211 | | | | 1,125,080 | | |
Total Residential Mortgage-Backed
Securities — Agency
(Cost: $231,717,575) | | | | | | | 238,521,154 | | |
Residential Mortgage-Backed Securities — Non-Agency 2.4%
BCAP LLC Trust(b)(d)(i)
CMO Series 2010-RR7 Class 17A7
03/26/36 | | | 5.036 | % | | | 1,769,159 | | | | 1,405,190 | | |
BCAP LLC Trust(b)(i)
CMO Series 2010-RR7 Class 8A6
05/26/35 | | | 5.500 | % | | | 2,640,000 | | | | 2,609,500 | | |
Castle Peak Loan Trust(b)(i)
CMO Series 2010-NPL1 Class A
12/25/50 | | | 7.750 | % | | | 21,093 | | | | 21,093 | | |
CMO Series 2011-1 Class 22A1
05/25/52 | | | 6.250 | % | | | 3,637,820 | | | | 3,625,088 | | |
CMO Series 2012-1A Class A1
05/25/52 | | | 5.000 | % | | | 12,703,374 | | | | 12,703,374 | | |
Residential Mortgage-Backed Securities — Non-Agency (continued)
| Issuer | | Coupon
Rate | | Principal
Amount ($) | | Value ($) | |
Citigroup Mortgage Loan Trust, Inc.(b)(d)(i)
CMO Series 2009-3 Class 4A3
10/25/33 | | | 2.440 | % | | | 6,105,977 | | | | 3,775,622 | | |
CMO Series 2009-4 Class 9A2
03/25/36 | | | 3.792 | % | | | 3,040,248 | | | | 2,333,010 | | |
CMO Series 2010-6 Class 2A2
09/25/35 | | | 2.668 | % | | | 1,143,314 | | | | 726,403 | | |
CMO Series 2010-6 Class 3A2
07/25/36 | | | 2.673 | % | | | 4,920,000 | | | | 4,562,173 | | |
CMO Series 2010-7 Class 3A4
12/25/35 | | | 7.002 | % | | | 2,185,000 | | | | 2,304,267 | | |
Credit Suisse Mortgage Capital Certificates(b)(d)(i)
CMO Series 2010-17R Class 1A2
06/26/36 | | | 2.568 | % | | | 2,810,000 | | | | 1,640,958 | | |
CMO Series 2011-4R Class 4A7
08/27/37 | | | 4.000 | % | | | 8,522,738 | | | | 8,331,513 | | |
Deutsche Mortgage Securities, Inc.
CMO Series 2003-1 Class 1A7(i)
04/25/33 | | | 5.500 | % | | | 3,656,037 | | | | 3,755,094 | | |
JPMorgan Reremic
CMO Series 2010-5 Class 1A6(b)(d)(i)
04/26/37 | | | 4.500 | % | | | 1,312,000 | | | | 1,334,861 | | |
PennyMac Loan Trust
Series 2011-NPL1 Class A(b)(d)(i)
09/25/51 | | | 5.250 | % | | | 706,843 | | | | 708,033 | | |
RBSSP Resecuritization Trust
CMO Series 2010-12 Class 3A4(b)(d)(i)
06/27/32 | | | 4.000 | % | | | 2,725,264 | | | | 2,730,238 | | |
Wells Fargo Mortgage-Backed Securities Trust(i)
CMO Series 2005-14 Class 2A1
12/25/35 | | | 5.500 | % | | | 523,466 | | | | 513,009 | | |
CMO Series 2005-18 Class 2A6
01/25/36 | | | 5.500 | % | | | 2,239,194 | | | | 2,256,756 | | |
CMO Series 2005-9 Class 2A5
10/25/35 | | | 5.250 | % | | | 4,041,331 | | | | 4,043,404 | | |
Total Residential Mortgage-Backed
Securities — Non-Agency
(Cost: $60,960,103) | | | | | | | 59,379,586 | | |
Commercial Mortgage-Backed Securities — Non-Agency 3.0%
Bear Stearns Commercial Mortgage Securities(d)(i)
Series 2005-T18 Class A4
02/13/42 | | | 4.933 | % | | | 1,705,000 | | | | 1,842,803 | | |
Bear Stearns Commercial Mortgage Securities(i)
Series 2006-PW14 Class A4
12/11/38 | | | 5.201 | % | | | 5,000,000 | | | | 5,579,120 | | |
CFCRE Commercial Mortgage Trust
Series 2011-C2 Class A2(i)
12/15/47 | | | 3.061 | % | | | 4,650,000 | | | | 4,822,269 | | |
The accompanying Notes to Financial Statements are an integral part of this statement.
Annual Report 2012
18
Columbia Strategic Income Fund
Portfolio of Investments (continued)
May 31, 2012
Commercial Mortgage-Backed Securities — Non-Agency (continued)
| Issuer | | Coupon
Rate | | Principal
Amount ($) | | Value ($) | |
Commercial Mortgage Pass-Through Certificates
Series 2011-THL Class A(b)(i)
06/09/28 | | | 3.376 | % | | | 3,982,843 | | | | 4,056,020 | | |
Credit Suisse First Boston Mortgage Securities Corp.
Series 2004-C2 Class A1(i)
05/15/36 | | | 3.819 | % | | | 514,747 | | | | 520,282 | | |
GS Mortgage Securities Corp. II(c)(i)
Series 2005-GG4 Class A4A
07/10/39 | | | 4.751 | % | | | 4,825,000 | | | | 5,201,615 | | |
GS Mortgage Securities Corp. II(d)(i)
Series 2006-GG6 Class A4
04/10/38 | | | 5.553 | % | | | 4,898,000 | | | | 5,411,580 | | |
Greenwich Capital Commercial Funding Corp.(d)(i)
Series 2004-GG1 Class A7
06/10/36 | | | 5.317 | % | | | 1,395,000 | | | | 1,478,494 | | |
Greenwich Capital Commercial Funding Corp.(i)
Series 2003-C2 Class A3
01/05/36 | | | 4.533 | % | | | 180,888 | | | | 180,794 | | |
Series 2007-GG11 Class A1
12/10/49 | | | 5.358 | % | | | 86,116 | | | | 86,048 | | |
Series 2007-GG9 Class A4
03/10/39 | | | 5.444 | % | | | 5,650,000 | | | | 6,161,890 | | |
JPMorgan Chase Commercial Mortgage Securities Corp.(d)(i)
Series 2005-LDP4 Class AM
10/15/42 | | | 4.999 | % | | | 1,000,000 | | | | 1,050,808 | | |
JPMorgan Chase Commercial Mortgage Securities Corp.(i)
Series 2003-CB6 Class A1
07/12/37 | | | 4.393 | % | | | 199,905 | | | | 200,881 | | |
Series 2007-CB18 Class A4
06/12/47 | | | 5.440 | % | | | 4,000,000 | | | | 4,439,228 | | |
Series 2011-C5 Class A2
08/15/46 | | | 3.149 | % | | | 3,140,000 | | | | 3,311,430 | | |
Series 2012-C6 Class A3
05/15/45 | | | 3.507 | % | | | 4,000,000 | | | | 4,140,785 | | |
Morgan Stanley Capital I, Inc.
Series 2005-HQ6 Class A4A(i)
08/13/42 | | | 4.989 | % | | | 4,825,000 | | | | 5,279,365 | | |
Morgan Stanley Reremic Trust
Series 2010-GG10 Class A4A(b)(c)(d)(i)
08/15/45 | | | 5.786 | % | | | 9,600,000 | | | | 10,698,442 | | |
S2 Hospitality LLC
Series 2012-LV1 Class A(h)(i)
04/15/25 | | | 4.500 | % | | | 4,650,000 | | | | 4,650,000 | | |
TIAA Seasoned Commercial Mortgage Trust
Series 2007-C4 Class A3(d)(i)
08/15/39 | | | 5.620 | % | | | 50,000 | | | | 53,662 | | |
Wachovia Bank Commercial Mortgage Trust
Series 2005-C21 Class A4(c)(d)(i)
10/15/44 | | | 5.204 | % | | | 4,825,000 | | | | 5,319,283 | | |
Total Commercial Mortgage-Backed
Securities — Non-Agency
(Cost: $69,067,482) | | | | | | | 74,484,799 | | |
Asset-Backed Securities — Non-Agency 0.1%
| Issuer | | Coupon
Rate | | Principal
Amount ($) | | Value ($) | |
DT Auto Owner Trust
Series 2009-1 Class A1(b)
10/15/15 | | | 2.980 | % | | | 99,935 | | | | 99,935 | | |
GMAC Mortgage Corp Loan Trust
Series 2004-HE5 Class A5 (FGIC)(d)
09/25/34 | | | 5.865 | % | | | 2,000,834 | | | | 1,501,819 | | |
Santander Drive Auto Receivables Trust
Series 2010-2 Class A2
08/15/13 | | | 0.950 | % | | | 136,653 | | | | 136,693 | | |
Total Asset-Backed Securities — Non-Agency
(Cost: $2,238,327) | | | | | | | 1,738,447 | | |
Inflation-Indexed Bonds(a) 2.3%
| United States 1.4% | |
U.S. Treasury Inflation-Indexed Bond
02/15/41 | | | 2.125 | % | | | 21,290,438 | | | | 30,887,763 | | |
U.S. Treasury Inflation-Indexed Bond(c)
02/15/42 | | | 0.750 | % | | | 4,060,760 | | | | 4,330,102 | | |
| Total | | | | | | | 35,217,865 | | |
| Uruguay 0.9% | |
Uruguay Government International Bond
04/05/27 | | | 4.250 | % | | UYU | 226,639,416 | | | | 11,257,484 | | |
| 06/26/37 | | | 3.700 | % | | UYU | 108,829,871 | | | | 4,972,632 | | |
Senior Unsecured
12/15/28 | | | 4.375 | % | | UYU | 123,635,461 | | | | 6,238,579 | | |
| Total | | | | | | | 22,468,695 | | |
Total Inflation-Indexed Bonds
(Cost: $50,395,005) | | | | | | | 57,686,560 | | |
U.S. Treasury Obligations 5.4%
U.S. Treasury
11/15/41 | | | 3.125 | % | | | 41,470,000 | | | | 45,344,874 | | |
U.S. Treasury(c)
12/31/13 | | | 0.125 | % | | | 57,645,000 | | | | 57,521,178 | | |
| 07/31/16 | | | 1.500 | % | | | 14,000,000 | | | | 14,541,408 | | |
| 02/15/22 | | | 2.000 | % | | | 9,655,000 | | | | 10,044,975 | | |
U.S. Treasury(c)(l)
STRIPS
11/15/13 | | | 0.000 | % | | | 2,250,000 | | | | 2,241,475 | | |
U.S. Treasury(l)
STRIPS
05/15/23 | | | 0.000 | % | | | 4,550,000 | | | | 3,694,787 | | |
Total U.S. Treasury Obligations
(Cost: $127,432,010) | | | | | | | 133,388,697 | | |
The accompanying Notes to Financial Statements are an integral part of this statement.
Annual Report 2012
19
Columbia Strategic Income Fund
Portfolio of Investments (continued)
May 31, 2012
Foreign Government Obligations(a) 22.9%
| Issuer | | Coupon
Rate | | Principal
Amount ($) | | Value ($) | |
| Argentina 0.6% | |
Argentina Boden Bonds
Senior Unsecured
10/03/15 | | | 7.000 | % | | | 2,275,000 | | | | 1,723,313 | | |
Argentina Bonar Bonds
Senior Unsecured
04/17/17 | | | 7.000 | % | | | 2,879,000 | | | | 1,914,535 | | |
Argentina Republic Government International Bond
Senior Unsecured(d)
12/15/35 | | | 4.383 | % | | | 1,829,000 | | | | 173,755 | | |
Argentine Republic Government International Bond
Senior Unsecured
12/31/33 | | | 8.280 | % | | | 10,537,099 | | | | 6,216,888 | | |
Provincia de Buenos Aires(b)
Senior Unsecured
10/05/15 | | | 11.750 | % | | | 280,000 | | | | 201,665 | | |
| 01/26/21 | | | 10.875 | % | | | 2,490,000 | | | | 1,370,064 | | |
Provincia de Cordoba
Senior Unsecured(b)
08/17/17 | | | 12.375 | % | | | 3,670,000 | | | | 2,458,900 | | |
| Total | | | | | | | 14,059,120 | | |
| Australia 0.5% | |
Treasury Corp. of Victoria
Local Government Guaranteed
11/15/16 | | | 5.750 | % | | AUD | 4,600,000 | | | | 4,937,682 | | |
| 06/15/20 | | | 6.000 | % | | AUD | 5,680,000 | | | | 6,335,376 | | |
| Total | | | | | | | 11,273,058 | | |
| Brazil 1.6% | |
Banco Nacional de Desenvolvimento Economico e Social(b)
07/12/20 | | | 5.500 | % | | | 850,000 | | | | 941,375 | | |
Brazil Notas do Tesouro Nacional
01/01/13 | | | 10.000 | % | | BRL | 4,280,000 | | | | 2,232,219 | | |
| 01/01/17 | | | 10.000 | % | | BRL | 440,000 | | | | 229,484 | | |
Brazilian Government International Bond
01/20/34 | | | 8.250 | % | | | 6,260,000 | | | | 9,530,850 | | |
| 08/17/40 | | | 11.000 | % | | | 2,700,000 | | | | 3,483,000 | | |
Senior Unsecured
01/05/22 | | | 12.500 | % | | BRL | 10,275,000 | | | | 6,852,208 | | |
Morgan Stanley
Senior Unsecured
10/22/20 | | | 11.500 | % | | BRL | 6,285,000 | | | | 3,240,036 | | |
Morgan Stanley(b)
Senior Unsecured
05/03/17 | | | 10.090 | % | | BRL | 400,000 | | | | 204,775 | | |
Petrobras International Finance Co.
03/15/19 | | | 7.875 | % | | | 7,880,000 | | | | 9,530,655 | | |
| 01/27/21 | | | 5.375 | % | | | 2,200,000 | | | | 2,354,827 | | |
Foreign Government Obligations(a) (continued)
| Issuer | | Coupon
Rate | | Principal
Amount ($) | | Value ($) | |
Petrobras International Finance Co.(c)
01/20/40 | | | 6.875 | % | | | 1,400,000 | | | | 1,634,564 | | |
| Total | | | | | | | 40,233,993 | | |
| Canada 0.8% | |
Canadian Government Bond
06/01/19 | | | 3.750 | % | | CAD | 14,000,000 | | | | 15,579,532 | | |
| 06/01/23 | | | 8.000 | % | | CAD | 2,100,000 | | | | 3,273,528 | | |
| Total | | | | | | | 18,853,060 | | |
| Chile —% | |
Empresa Nacional del Petroleo
Senior Unsecured(b)(c)
07/08/19 | | | 6.250 | % | | | 600,000 | | | | 675,226 | | |
| Colombia 1.0% | |
Bogota Distrito Capital
Senior Unsecured(b)
07/26/28 | | | 9.750 | % | | COP | 200,000,000 | | | | 148,197 | | |
Colombia Government International Bond
Senior Unsecured
01/18/41 | | | 6.125 | % | | | 4,200,000 | | | | 5,204,585 | | |
Colombia Government International Bond(c)
Senior Unsecured
05/21/24 | | | 8.125 | % | | | 1,890,000 | | | | 2,664,900 | | |
Corp. Andina de Fomento
Senior Unsecured(c)
06/04/19 | | | 8.125 | % | | | 900,000 | | | | 1,139,741 | | |
Ecopetrol SA
Senior Unsecured
07/23/19 | | | 7.625 | % | | | 3,855,000 | | | | 4,760,925 | | |
Empresa de Energia de Bogota SA
Senior Unsecured(b)(c)
11/10/21 | | | 6.125 | % | | | 2,725,000 | | | | 2,825,793 | | |
Empresas Publicas de Medellin ESP(b)
Senior Unsecured
07/29/19 | | | 7.625 | % | | | 100,000 | | | | 119,000 | | |
| 02/01/21 | | | 8.375 | % | | COP | 11,190,000,000 | | | | 6,519,950 | | |
Republic of Colombia
Senior Unsecured
06/28/27 | | | 9.850 | % | | COP | 300,000,000 | | | | 232,796 | | |
Transportadora de Gas Internacional SA ESP
Senior Unsecured(b)(c)
03/20/22 | | | 5.700 | % | | | 1,100,000 | | | | 1,122,867 | | |
| Total | | | | | | | 24,738,754 | | |
| Dominican Republic 0.3% | |
Dominican Republic International Bond(b)
Senior Unsecured
05/06/21 | | | 7.500 | % | | | 4,325,000 | | | | 4,520,236 | | |
| 04/20/27 | | | 8.625 | % | | | 2,900,000 | | | | 3,098,650 | | |
| Total | | | | | | | 7,618,886 | | |
The accompanying Notes to Financial Statements are an integral part of this statement.
Annual Report 2012
20
Columbia Strategic Income Fund
Portfolio of Investments (continued)
May 31, 2012
Foreign Government Obligations(a) (continued)
| Issuer | | Coupon
Rate | | Principal
Amount ($) | | Value ($) | |
| El Salvador 0.1% | |
El Salvador Government International Bond(b)
Senior Unsecured
04/10/32 | | | 8.250 | % | | | 400,000 | | | | 438,000 | | |
| 06/15/35 | | | 7.650 | % | | | 490,000 | | | | 503,475 | | |
| 02/01/41 | | | 7.625 | % | | | 1,500,000 | | | | 1,537,500 | | |
| Total | | | | | | | 2,478,975 | | |
| Finland 0.1% | |
Finland Government Bond
Senior Unsecured
07/04/15 | | | 4.250 | % | | EUR | 2,720,000 | | | | 3,764,386 | | |
| France 1.2% | |
France Government Bond OAT
04/25/13 | | | 4.000 | % | | EUR | 5,300,000 | | | | 6,778,040 | | |
| 04/25/17 | | | 3.750 | % | | EUR | 4,000,000 | | | | 5,529,630 | | |
| 10/25/18 | | | 4.250 | % | | EUR | 2,600,000 | | | | 3,716,104 | | |
| 04/25/29 | | | 5.500 | % | | EUR | 5,920,000 | | | | 9,710,090 | | |
French Treasury Note
07/12/15 | | | 2.000 | % | | EUR | 2,770,000 | | | | 3,564,166 | | |
| Total | | | | | | | 29,298,030 | | |
| Germany 1.3% | |
Bundesrepublik Deutschland
06/20/16 | | | 6.000 | % | | EUR | 12,600,000 | | | | 19,154,622 | | |
| 07/04/17 | | | 4.250 | % | | EUR | 1,850,000 | | | | 2,731,766 | | |
| 01/04/18 | | | 4.000 | % | | EUR | 1,180,000 | | | | 1,742,199 | | |
| 01/04/19 | | | 3.750 | % | | EUR | 3,500,000 | | | | 5,188,533 | | |
| 07/04/21 | | | 3.250 | % | | EUR | 980,000 | | | | 1,443,460 | | |
| 07/04/34 | | | 4.750 | % | | EUR | 55,000 | | | | 103,385 | | |
KFW
01/20/14 | | | 1.350 | % | | JPY | 63,000,000 | | | | 819,421 | | |
| Total | | | | | | | 31,183,386 | | |
| Indonesia 1.7% | |
Indonesia Government International Bond(b)
Senior Unsecured
05/04/14 | | | 10.375 | % | | | 6,180,000 | | | | 7,037,475 | | |
| 04/20/15 | | | 7.250 | % | | | 1,300,000 | | | | 1,446,250 | | |
Indonesia Government International Bond(b)(c)
Senior Unsecured
03/13/20 | | | 5.875 | % | | | 11,125,000 | | | | 12,404,375 | | |
Indonesia Treasury Bond
Senior Unsecured
09/15/19 | | | 11.500 | % | | IDR | 22,600,000,000 | | | | 3,105,586 | | |
| 11/15/20 | | | 11.000 | % | | IDR | 2,000,000,000 | | | | 274,562 | | |
| 06/15/21 | | | 12.800 | % | | IDR | 17,200,000,000 | | | | 2,603,837 | | |
| 07/15/22 | | | 10.250 | % | | IDR | 2,900,000,000 | | | | 387,134 | | |
| 09/15/25 | | | 11.000 | % | | IDR | 53,500,000,000 | | | | 7,644,609 | | |
Foreign Government Obligations(a) (continued)
| Issuer | | Coupon
Rate | | Principal
Amount ($) | | Value ($) | |
Majapahit Holding BV(b)
06/28/17 | | | 7.250 | % | | | 562,000 | | | | 624,247 | | |
| 01/20/20 | | | 7.750 | % | | | 1,100,000 | | | | 1,251,843 | | |
| 06/29/37 | | | 7.875 | % | | | 2,780,000 | | | | 3,162,250 | | |
PT Perusahaan Listrik Negara
Senior Unsecured(b)(c)
11/22/21 | | | 5.500 | % | �� | | 500,000 | | | | 492,750 | | |
Perusahaan Penerbit SBSN
Senior Unsecured(b)
04/23/14 | | | 8.800 | % | | | 700,000 | | | | 777,000 | | |
| Total | | | | | | | 41,211,918 | | |
| Japan 0.6% | |
Japan Government 10-Year Bond
Senior Unsecured
09/20/18 | | | 1.500 | % | | JPY | 330,000,000 | | | | 4,500,499 | | |
Japan Government 20-Year Bond
Senior Unsecured
09/20/26 | | | 2.200 | % | | JPY | 710,000,000 | | | | 10,139,264 | | |
| Total | | | | | | | 14,639,763 | | |
| Kazakhstan 0.4% | |
KazMunayGas National Co.(b)
Senior Unsecured
01/23/15 | | | 11.750 | % | | | 400,000 | | | | 469,000 | | |
| 07/02/18 | | | 9.125 | % | | | 5,980,000 | | | | 7,176,000 | | |
| 05/05/20 | | | 7.000 | % | | | 400,000 | | | | 438,299 | | |
| 04/09/21 | | | 6.375 | % | | | 2,500,000 | | | | 2,650,000 | | |
| Total | | | | | | | 10,733,299 | | |
| Latvia —% | |
Republic of Latvia
Senior Unsecured(b)(c)
06/16/21 | | | 5.250 | % | | | 1,250,000 | | | | 1,207,346 | | |
| Lithuania 0.3% | |
Lithuania Government International Bond(b)
Senior Unsecured
03/09/21 | | | 6.125 | % | | | 1,550,000 | | | | 1,628,691 | | |
Lithuania Government International Bond(b)(c)
Senior Unsecured
09/14/17 | | | 5.125 | % | | | 2,150,000 | | | | 2,216,438 | | |
| 02/01/22 | | | 6.625 | % | | | 2,550,000 | | | | 2,755,354 | | |
| Total | | | | | | | 6,600,483 | | |
| Mexico 2.2% | |
Mexican Bonos
12/20/12 | | | 9.000 | % | | MXN | 5,300,000 | | | | 3,778,064 | | |
| 12/17/15 | | | 8.000 | % | | MXN | 1,485,000 | | | | 1,137,160 | | |
| 06/16/16 | | | 6.250 | % | | MXN | 4,100,000 | | | | 2,982,567 | | |
| 12/15/16 | | | 7.250 | % | | MXN | 659,000 | | | | 498,434 | | |
| 12/14/17 | | | 7.750 | % | | MXN | 950,000 | | | | 741,059 | | |
The accompanying Notes to Financial Statements are an integral part of this statement.
Annual Report 2012
21
Columbia Strategic Income Fund
Portfolio of Investments (continued)
May 31, 2012
Foreign Government Obligations(a) (continued)
| Issuer | | Coupon
Rate | | Principal
Amount ($) | | Value ($) | |
| 12/13/18 | | | 8.500 | % | | MXN | 5,586,000 | | | | 4,559,541 | | |
| 06/09/22 | | | 6.500 | % | | MXN | 7,200,000 | | | | 5,148,305 | | |
| 06/03/27 | | | 7.500 | % | | MXN | 6,769,000 | | | | 5,056,632 | | |
Mexico Government International Bond
Senior Unsecured(c)
01/11/40 | | | 6.050 | % | | | 3,350,000 | | | | 4,078,625 | | |
Pemex Finance Ltd.
Senior Unsecured
11/15/18 | | | 9.150 | % | | | 2,485,000 | | | | 3,016,494 | | |
Senior Unsecured (NPFGC)
08/15/17 | | | 10.610 | % | | | 1,650,000 | | | | 1,999,235 | | |
Pemex Project Funding Master Trust
03/01/18 | | | 5.750 | % | | | 9,870,000 | | | | 11,029,725 | | |
| 01/21/21 | | | 5.500 | % | | | 3,750,000 | | | | 4,125,000 | | |
| 06/15/35 | | | 6.625 | % | | | 870,000 | | | | 989,625 | | |
Pemex Project Funding Master Trust(c)
06/15/38 | | | 6.625 | % | | | 450,000 | | | | 511,875 | | |
Petroleos Mexicanos
05/03/19 | | | 8.000 | % | | | 600,000 | | | | 747,000 | | |
Petroleos Mexicanos(b)
06/02/41 | | | 6.500 | % | | | 500,000 | | | | 561,250 | | |
Petroleos Mexicanos(c)
06/02/41 | | | 6.500 | % | | | 2,000,000 | | | | 2,245,000 | | |
| Total | | | | | | | 53,205,591 | | |
| Netherlands 0.3% | |
Netherlands Government Bond
07/15/16 | | | 4.000 | % | | EUR | 5,135,000 | | | | 7,204,063 | | |
| New Zealand 0.2% | |
New Zealand Government Bond
Senior Unsecured
05/15/21 | | | 6.000 | % | | NZD | 6,150,000 | | | | 5,592,064 | | |
| Norway 0.7% | |
Norway Government Bond
05/15/13 | | | 6.500 | % | | NOK | 655,000 | | | | 111,964 | | |
| 05/19/17 | | | 4.250 | % | | NOK | 87,185,000 | | | | 16,144,474 | | |
| Total | | | | | | | 16,256,438 | | |
| Peru 0.5% | |
Corp. Financiera de Desarrollo SA
Senior Unsecured(b)
02/08/22 | | | 4.750 | % | | | 2,900,000 | | | | 3,004,704 | | |
Peru Enhanced Pass-Through Finance Ltd.
Pass-Thru Certificates(b)(c)(l)
05/31/18 | | | 0.000 | % | | | 2,231,522 | | | | 1,919,109 | | |
Peruvian Government International Bond
Senior Unsecured
11/21/33 | | | 8.750 | % | | | 4,508,000 | | | | 7,122,640 | | |
Foreign Government Obligations(a) (continued)
| Issuer | | Coupon
Rate | | Principal
Amount ($) | | Value ($) | |
Peruvian Government International Bond(b)
Senior Unsecured
08/12/20 | | | 7.840 | % | | PEN | 3,100,000 | | | | 1,335,261 | | |
| Total | | | | | | | 13,381,714 | | |
| Philippines 0.5% | |
Philippine Government International Bond
Senior Unsecured
01/15/19 | | | 9.875 | % | | | 70,000 | | | | 97,650 | | |
| 01/14/31 | | | 7.750 | % | | | 200,000 | | | | 275,000 | | |
| 01/14/36 | | | 6.250 | % | | PHP | 112,000,000 | | | | 2,683,057 | | |
Philippine Government International Bond(c)
Senior Unsecured
01/15/21 | | | 4.000 | % | | | 3,489,000 | | | | 3,659,089 | | |
| 03/30/26 | | | 5.500 | % | | | 3,825,000 | | | | 4,398,750 | | |
Power Sector Assets & Liabilities Management Corp.
Government Guaranteed(b)
12/02/24 | | | 7.390 | % | | | 1,390,000 | | | | 1,743,315 | | |
| Total | | | | | | | 12,856,861 | | |
| Poland 0.8% | |
Poland Government Bond
10/24/15 | | | 6.250 | % | | PLN | 24,300,000 | | | | 7,140,408 | | |
| 10/25/17 | | | 5.250 | % | | PLN | 3,655,000 | | | | 1,038,131 | | |
| 10/25/19 | | | 5.500 | % | | PLN | 22,000,000 | | | | 6,290,855 | | |
Poland Government International Bond
Senior Unsecured
03/23/22 | | | 5.000 | % | | | 2,950,000 | | | | 3,085,700 | | |
Poland Government International Bond(c)
Senior Unsecured
07/15/19 | | | 6.375 | % | | | 1,470,000 | | | | 1,685,516 | | |
| 04/21/21 | | | 5.125 | % | | | 1,000,000 | | | | 1,050,000 | | |
| Total | | | | | | | 20,290,610 | | |
| Qatar 0.2% | |
Nakilat, Inc.
Senior Secured(b)
12/31/33 | | | 6.067 | % | | | 3,260,000 | | | | 3,537,100 | | |
Qatar Government International Bond
Senior Unsecured(b)
01/20/22 | | | 4.500 | % | | | 1,000,000 | | | | 1,073,500 | | |
| Total | | | | | | | 4,610,600 | | |
| Republic of Namibia 0.1% | |
Namibia International Bonds
Senior Unsecured(b)
11/03/21 | | | 5.500 | % | | | 1,700,000 | | | | 1,742,500 | | |
| Republic of the Congo —% | |
Republic of Congo
Senior Unsecured(d)
06/30/29 | | | 3.000 | % | | | 475,000 | | | | 351,975 | | |
The accompanying Notes to Financial Statements are an integral part of this statement.
Annual Report 2012
22
Columbia Strategic Income Fund
Portfolio of Investments (continued)
May 31, 2012
Foreign Government Obligations(a) (continued)
| Issuer | | Coupon
Rate | | Principal
Amount ($) | | Value ($) | |
| Romania 0.1% | |
Romanian Government International Bond
Senior Unsecured(b)
02/07/22 | | | 6.750 | % | | | 2,300,000 | | | | 2,301,507 | | |
| Russian Federation 2.0% | |
Gazprom OAO Via Gaz Capital SA(b)
Senior Unsecured
04/11/18 | | | 8.146 | % | | | 4,535,000 | | | | 5,318,467 | | |
| 08/16/37 | | | 7.288 | % | | | 300,000 | | | | 333,450 | | |
Gazprom OAO Via Gaz Capital SA(b)(c)
Senior Unsecured
11/22/16 | | | 6.212 | % | | | 400,000 | | | | 430,600 | | |
| 01/23/21 | | | 5.999 | % | | | 4,000,000 | | | | 4,178,000 | | |
| 03/07/22 | | | 6.510 | % | | | 4,535,000 | | | | 4,896,848 | | |
Russian Foreign Bond — Eurobond
Senior Unsecured
03/31/30 | | | 7.500 | % | | | 17,879,050 | | | | 21,030,233 | | |
Russian Foreign Bond — Eurobond(b)
Senior Unsecured
04/29/20 | | | 5.000 | % | | | 1,200,000 | | | | 1,279,500 | | |
Russian Foreign Bond — Eurobond(b)(c)
Senior Unsecured
03/31/30 | | | 7.500 | % | | | 2,322,425 | | | | 2,731,752 | | |
Sberbank of Russia Via SB Capital SA
Senior Unsecured(b)(c)
02/07/22 | | | 6.125 | % | | | 3,200,000 | | | | 3,268,393 | | |
Vnesheconombank Via VEB Finance PLC
Senior Unsecured(b)(c)
11/22/25 | | | 6.800 | % | | | 5,810,000 | | | | 6,085,975 | | |
| Total | | | | | | | 49,553,218 | | |
| South Africa 0.1% | |
South Africa Government International Bond
Senior Unsecured(c)
01/17/24 | | | 4.665 | % | | | 1,800,000 | | | | 1,842,300 | | |
| South Korea 0.2% | |
Export-Import Bank of Korea
Senior Unsecured
04/11/22 | | | 5.000 | % | | | 3,900,000 | | | | 4,237,916 | | |
| Sweden 0.7% | |
Sweden Government Bond(c)
08/12/17 | | | 3.750 | % | | SEK | 108,600,000 | | | | 17,012,430 | | |
| Trinidad and Tobago 0.1% | |
Petroleum Co. of Trinidad & Tobago Ltd.
Senior Unsecured(b)(c)
08/14/19 | | | 9.750 | % | | | 2,740,000 | | | | 3,342,647 | | |
Foreign Government Obligations(a) (continued)
| Issuer | | Coupon
Rate | | Principal
Amount ($) | | Value ($) | |
| Turkey 1.1% | |
Turkey Government International Bond
01/14/41 | | | 6.000 | % | | | 2,200,000 | | | | 2,145,220 | | |
Senior Unsecured
09/26/16 | | | 7.000 | % | | | 1,235,000 | | | | 1,369,306 | | |
| 11/07/19 | | | 7.500 | % | | | 1,300,000 | | | | 1,519,375 | | |
| 06/05/20 | | | 7.000 | % | | | 850,000 | | | | 966,875 | | |
| 03/30/21 | | | 5.625 | % | | | 7,250,000 | | | | 7,576,250 | | |
| 09/26/22 | | | 6.250 | % | | | 550,000 | | | | 588,500 | | |
| 02/05/25 | | | 7.375 | % | | | 8,680,000 | | | | 10,142,580 | | |
| 03/17/36 | | | 6.875 | % | | | 230,000 | | | | 253,000 | | |
| 05/30/40 | | | 6.750 | % | | | 1,500,000 | | | | 1,620,000 | | |
| Total | | | | | | | 26,181,106 | | |
| Ukraine 0.2% | |
City of Kyiv Via Kyiv Finance PLC
Senior Unsecured(b)
07/11/16 | | | 9.375 | % | | | 1,300,000 | | | | 1,090,181 | | |
National JSC Naftogaz of Ukraine
Government Guaranteed
09/30/14 | | | 9.500 | % | | | 4,125,000 | | | | 3,918,119 | | |
Ukraine Government International Bond
Senior Unsecured(b)
06/26/12 | | | 6.385 | % | | | 250,000 | | | | 250,128 | | |
| Total | | | | | | | 5,258,428 | | |
| United Arab Emirates 0.2% | |
Abu Dhabi National Energy Co.
Senior Unsecured(b)(c)
12/13/21 | | | 5.875 | % | | | 1,300,000 | | | | 1,401,579 | | |
Dolphin Energy Ltd.
Senior Secured(b)
12/15/21 | | | 5.500 | % | | | 3,050,000 | | | | 3,368,430 | | |
| Total | | | | | | | 4,770,009 | | |
| United Kingdom 0.8% | |
United Kingdom Gilt
03/07/19 | | | 4.500 | % | | GBP | 800,000 | | | | 1,517,628 | | |
| 09/07/19 | | | 3.750 | % | | GBP | 3,200,000 | | | | 5,846,056 | | |
| 09/07/21 | | | 3.750 | % | | GBP | 1,500,000 | | | | 2,762,832 | | |
| 03/07/25 | | | 5.000 | % | | GBP | 4,510,000 | | | | 9,369,765 | | |
| Total | | | | | | | 19,496,281 | | |
| Uruguay 0.1% | |
Uruguay Government International Bond
Senior Unsecured
03/21/36 | | | 7.625 | % | | | 725,000 | | | | 989,625 | | |
Senior Unsecured PIK
01/15/33 | | | 7.875 | % | | | 1,940,000 | | | | 2,677,200 | | |
| Total | | | | | | | 3,666,825 | | |
The accompanying Notes to Financial Statements are an integral part of this statement.
Annual Report 2012
23
Columbia Strategic Income Fund
Portfolio of Investments (continued)
May 31, 2012
Foreign Government Obligations(a) (continued)
| Issuer | | Coupon
Rate | | Principal
Amount ($) | | Value ($) | |
| Venezuela 1.3% | |
Petroleos de Venezuela SA
04/12/17 | | | 5.250 | % | | | 11,540,000 | | | | 7,847,200 | | |
| 11/02/17 | | | 8.500 | % | | | 8,835,000 | | | | 6,979,650 | | |
Senior Unsecured
10/28/15 | | | 5.000 | % | | | 799,500 | | | | 619,612 | | |
Petroleos de Venezuela SA(c)
02/17/22 | | | 12.750 | % | | | 1,600,000 | | | | 1,444,000 | | |
Venezuela Government International Bond
Senior Unsecured
08/23/22 | | | 12.750 | % | | | 3,006,000 | | | | 2,818,125 | | |
| 05/07/23 | | | 9.000 | % | | | 15,124,000 | | | | 11,343,000 | | |
Venezuela Government International Bond(c)
Senior Unsecured
02/26/16 | | | 5.750 | % | | | 2,050,000 | | | | 1,752,750 | | |
| Total | | | | | | | 32,804,337 | | |
Total Foreign Government Obligations
(Cost: $533,329,528) | | | | | | | 564,529,103 | | |
Municipal Bonds 0.1%
Cabazon Band Mission Indians
Revenue Bonds
Series 2004(b)(f)(m)(n)
06/01/12 | | | 13.000 | % | | | 2,820,000 | | | | 1,692,000 | | |
Total Municipal Bonds
(Cost: $2,820,000) | | | | | | | 1,692,000 | | |
Senior Loans 4.0%
Borrower | | Weighted
Average
Coupon | | Principal
Amount ($) | |
Value ($) | |
| Aerospace & Defense —% | |
Huntington Ingalls Industries, Inc.
Term Loan(d)(o)
03/30/16 | | | 2.750 | % | | | 190,000 | | | | 188,100 | | |
TASC, Inc.
Tranche B Term Loan(d)(o)
12/18/15 | | | 4.500 | % | | | 312 | | | | 305 | | |
| Total | | | | | | | 188,405 | | |
| Airlines 0.1% | |
U.S. Airways Group, Inc.
Term Loan(d)(o)
03/21/14 | | | 2.740 | % | | | 899,306 | | | | 851,345 | | |
United Air Lines, Inc.
Tranche B Term Loan(d)(o)
02/01/14 | | | 2.250 | % | | | 658,167 | | | | 636,119 | | |
| Total | | | | | | | 1,487,464 | | |
Senior Loans (continued)
Borrower | | Weighted
Average
Coupon | | Principal
Amount ($) | |
Value ($) | |
| Automotive 0.1% | |
Allison Transmission, Inc.
Tranche B1 Term Loan(d)(o)
08/07/14 | | | 2.740 | % | | | 1,077,922 | | | | 1,057,042 | | |
Chrysler Group LLC
Tranche B Term Loan(d)(o)
05/24/17 | | | 6.000 | % | | | 821,812 | | | | 818,731 | | |
Federal-Mogul Corp.(d)(o)
Tranche B Term Loan
12/29/14 | | | 2.178 | % | | | 429,802 | | | | 404,014 | | |
Tranche C Term Loan
12/28/15 | | | 2.178 | % | | | 219,287 | | | | 206,129 | | |
Goodyear Tire & Rubber Co. (The)
2nd Lien Term Loan(d)(o)
04/30/19 | | | 4.750 | % | | | 625,000 | | | | 604,688 | | |
Schaeffler AG
Tranche C2 Term Loan(d)(o)
01/27/17 | | | 6.000 | % | | | 675,000 | | | | 671,625 | | |
| Total | | | | | | | 3,762,229 | | |
| Brokerage —% | |
Nuveen Investments, Inc.(d)(o)
1st Lien Term Loan
05/13/17 | | | 7.250 | % | | | 250,000 | | | | 249,375 | | |
2nd Lien Term Loan
02/28/19 | | | 8.250 | % | | | 425,000 | | | | 427,524 | | |
| Total | | | | | | | 676,899 | | |
| Building Materials 0.1% | |
CPG International I, Inc.
Term Loan(d)(o)
02/18/17 | | | 6.000 | % | | | 641,875 | | | | 617,805 | | |
Custom Building Products, Inc.
Term Loan(d)(o)
03/19/15 | | | 5.750 | % | | | 69,153 | | | | 68,317 | | |
Goodman Global, Inc.(d)(o)
1st Lien Term Loan
10/28/16 | | | 5.750 | % | | | 93,083 | | | | 92,734 | | |
2nd Lien Term Loan
10/30/17 | | | 9.000 | % | | | 63,636 | | | | 64,177 | | |
Potters Holdings II LP(d)(o)
Tranche B 1st Lien Term Loan
05/06/17 | | | 6.000 | % | | | 496,250 | | | | 491,288 | | |
Tranche B 2nd Lien Term Loan
11/06/17 | | | 10.250 | % | | | 125,000 | | | | 124,896 | | |
Roofing Supply Group LLC
Term Loan(d)(h)(o)
05/31/19 | | | 6.500 | % | | | 400,000 | | | | 399,000 | | |
| Total | | | | | | | 1,858,217 | | |
The accompanying Notes to Financial Statements are an integral part of this statement.
Annual Report 2012
24
Columbia Strategic Income Fund
Portfolio of Investments (continued)
May 31, 2012
Senior Loans (continued)
Borrower | | Weighted
Average
Coupon | | Principal
Amount ($) | |
Value ($) | |
| Chemicals 0.2% | |
AZ Chem U.S., Inc.
Term Loan(d)(o)
12/22/17 | | | 7.250 | % | | | 160,682 | | | | 161,016 | | |
Cristal Inorganic Chemicals U.S., Inc.
2nd Lien Term Loan(d)(o)
11/15/14 | | | 6.220 | % | | | 125,000 | | | | 124,375 | | |
Emerald Performance Materials LLC
1st Lien Term Loan(d)(o)
05/18/18 | | | 7.750 | % | | | 225,000 | | | | 222,750 | | |
Houghton International, Inc.
Tranche B1 Term Loan(d)(o)
01/29/16 | | | 6.750 | % | | | 253,945 | | | | 254,262 | | |
Ineos U.S. Finance LLC
Term Loan(d)(o)
05/04/18 | | | 6.500 | % | | | 475,000 | | | | 465,243 | | |
Momentive Performance Materials
Tranche B3 Term Loan(d)(o)
05/05/15 | | | 3.750 | % | | | 175,000 | | | | 167,017 | | |
Momentive Specialty Chemicals, Inc.(d)(o)
Tranche C1B Term Loan
05/05/15 | | | 4.000 | % | | | 125,346 | | | | 121,116 | | |
Tranche C2B Term Loan
05/05/15 | | | 4.250 | % | | | 56,648 | | | | 54,736 | | |
Tranche C5B Term Loan
05/05/15 | | | 4.250 | % | | | 95,250 | | | | 90,249 | | |
Nexeo Solutions LLC
Term Loan(d)(o)
09/08/17 | | | 5.000 | % | | | 174,559 | | | | 169,977 | | |
Norit Holding BV
Term Loan(d)(o)
07/10/17 | | | 6.750 | % | | | 223,875 | | | | 223,035 | | |
Omnova Solutions, Inc.
Term Loan(d)(o)
05/31/17 | | | 5.750 | % | | | 641,855 | | | | 639,050 | | |
PQ Corp.
1st Lien Term Loan(d)(o)
07/30/14 | | | 3.989 | % | | | 636,207 | | | | 610,142 | | |
Trinseo Materials Operating SCA(d)(h)(o)
Term Loan
08/02/17 | | | 6.027 | % | | | 325,000 | | | | 289,900 | | |
Trinseo Materials Operating SCA(d)(o)
Term Loan
08/02/17 | | | 6.027 | % | | | 444,375 | | | | 396,383 | | |
Tronox Pigments B.V.(d)(o)
Term Loan
02/08/18 | | | 4.250 | % | | | 235,714 | | | | 231,589 | | |
Tronox Pigments B.V.(d)(o)(p)
Delayed Draw Term Loan
02/08/18 | | | 1.000 | % | | | 64,286 | | | | 63,161 | | |
Senior Loans (continued)
Borrower | | Weighted
Average
Coupon | | Principal
Amount ($) | |
Value ($) | |
Univar, Inc.
Tranche B Term Loan(d)(o)
06/30/17 | | | 5.000 | % | | | 962,812 | | | | 935,613 | | |
| Total | | | | | | | 5,219,614 | | |
| Construction Machinery 0.1% | |
Douglas Dynamics LLC
Term Loan(d)(o)
04/18/18 | | | 5.750 | % | | | 659,895 | | | | 648,895 | | |
Manitowoc Co., Inc. (The)
Tranche B Term Loan(d)(o)
11/13/17 | | | 4.250 | % | | | 475,000 | | | | 472,824 | | |
NACCO Materials Handling Group, Inc.
Term Loan(d)(o)
03/21/13 | | | 1.989 | % | | | 246,590 | | | | 245,049 | | |
Terex Corp.
Term Loan(d)(o)
04/28/17 | | | 5.500 | % | | | 547,250 | | | | 546,911 | | |
| Total | | | | | | | 1,913,679 | | |
| Consumer Cyclical Services 0.1% | |
Instant Web, Inc.(d)(o)
Delayed Draw Term Loan
08/07/14 | | | 3.614 | % | | | 25,223 | | | | 21,944 | | |
Term Loan
08/07/14 | | | 3.614 | % | | | 241,966 | | | | 210,510 | | |
Live Nation Entertainment, Inc.
Tranche B Term Loan(d)(o)
11/07/16 | | | 4.500 | % | | | 517,085 | | | | 514,826 | | |
Sabre, Inc.
Term Loan(d)(o)
09/30/17 | | | 5.989 | % | | | 641,559 | | | | 603,065 | | |
| Total | | | | | | | 1,350,345 | | |
| Consumer Products 0.2% | |
Affinion Group, Inc.
Tranche B Term Loan(d)(o)
10/09/16 | | | 5.000 | % | | | 641,733 | | | | 593,205 | | |
Amscan Holdings, Inc.
Term Loan(d)(o)
12/02/17 | | | 6.750 | % | | | 911,804 | | | | 911,804 | | |
Fender Musical Instruments Corp.(d)(o)
Delayed Draw Term Loan
06/09/14 | | | 2.490 | % | | | 153,663 | | | | 149,534 | | |
Term Loan
06/09/14 | | | 2.490 | % | | | 304,124 | | | | 295,952 | | |
Jarden Corp.
Tranche B Term Loan(d)(o)
03/31/18 | | | 3.239 | % | | | 322,498 | | | | 321,047 | | |
The accompanying Notes to Financial Statements are an integral part of this statement.
Annual Report 2012
25
Columbia Strategic Income Fund
Portfolio of Investments (continued)
May 31, 2012
Senior Loans (continued)
Borrower | | Weighted
Average
Coupon | | Principal
Amount ($) | |
Value ($) | |
NBTY, Inc.
Tranche B1 Term Loan(d)(o)
10/02/17 | | | 4.250 | % | | | 796,821 | | | | 789,355 | | |
Visant Corp.
Tranche B Term Loan(d)(o)
12/22/16 | | | 5.250 | % | | | 919,808 | | | | 887,044 | | |
| Total | | | | | | | 3,947,941 | | |
| Diversified Manufacturing 0.1% | |
Acosta, Inc.
Tranche B Term Loan(d)(o)
03/01/18 | | | 4.750 | % | | | 611,572 | | | | 603,316 | | |
Colfax Corp.
Tranche B Term Loan(d)(o)
01/11/19 | | | 4.500 | % | | | 274,313 | | | | 273,624 | | |
Generac Power System, Inc.
Term Loan(d)(o)
05/30/18 | | | 6.250 | % | | | 800,000 | | | | 791,000 | | |
IMG Worldwide, Inc.
Tranche B Term Loan(d)(o)
06/16/16 | | | 5.500 | % | | | 744,375 | | | | 738,792 | | |
Tomkins LLC/Inc.
Tranche B1 Term Loan(d)(o)
09/29/16 | | | 4.250 | % | | | 732,198 | | | | 728,230 | | |
| Total | | | | | | | 3,134,962 | | |
| Electric 0.1% | |
Calpine Corp.(d)(o)
Term Loan
04/01/18 | | | 4.500 | % | | | 248,125 | | | | 243,927 | | |
| 04/01/18 | | | 4.500 | % | | | 644,679 | | | | 633,771 | | |
Equipower Resources Holdings LLC
Tranche B Term Loan(d)(o)
01/26/18 | | | 5.750 | % | | | 72,455 | | | | 71,006 | | |
FREIF North American Power I LLC(d)(o)
Tranche B Term Loan
03/29/19 | | | 6.000 | % | | | 216,049 | | | | 214,969 | | |
Tranche C Term Loan
03/29/19 | | | 6.000 | % | | | 33,951 | | | | 33,781 | | |
GenOn Energy/Americas, Inc.
Term Loan(d)(o)
12/04/17 | | | 6.000 | % | | | 921,044 | | | | 902,623 | | |
NRG Energy, Inc.
Term Loan(d)(o)
07/01/18 | | | 4.000 | % | | | 645,125 | | | | 637,932 | | |
TPF Generation Holdings LLC
1st Lien Synthetic Letter of Credit(d)(o)
12/15/13 | | | 2.470 | % | | | 84,723 | | | | 84,194 | | |
Senior Loans (continued)
Borrower | | Weighted
Average
Coupon | | Principal
Amount ($) | |
Value ($) | |
Texas Competitive Electric Holdings Co. LLC
Term Loan(d)(o)
10/10/14 | | | 3.739 | % | | | 1,345,945 | | | | 820,191 | | |
| Total | | | | | | | 3,642,394 | | |
| Entertainment 0.1% | |
24 Hour Fitness Worldwide, Inc.
Tranche B Term Loan(d)(o)
04/22/16 | | | 7.500 | % | | | 844,476 | | | | 837,923 | | |
Alpha Topco Ltd.
Tranche B Term Loan(d)(o)
04/28/17 | | | 5.750 | % | | | 1,000,000 | | | | 997,290 | | |
Six Flags Theme Parks, Inc.
Tranche B Term Loan(d)(o)
12/20/18 | | | 4.250 | % | | | 275,000 | | | | 272,055 | | |
| Total | | | | | | | 2,107,268 | | |
| Environmental 0.1% | |
EnviroSolutions Real Property Holdings, Inc.
2nd Lien Term Loan(d)(o)
07/29/14 | | | 8.000 | % | | | 1,386,588 | | | | 1,369,256 | | |
Synagro Technologies, Inc.
1st Lien Term Loan(d)(o)
04/02/14 | | | 2.240 | % | | | 175,785 | | | | 153,372 | | |
WCA Waste Corp.
Term Loan(d)(o)
03/23/18 | | | 5.500 | % | | | 200,000 | | | | 199,000 | | |
| Total | | | | | | | 1,721,628 | | |
| Food and Beverage 0.2% | |
Advantage Sales & Marketing, Inc.
1st Lien Term Loan(d)(o)
12/18/17 | | | 5.250 | % | | | 172,812 | | | | 170,509 | | |
Del Monte Foods Co.
Term Loan(d)(o)
03/08/18 | | | 4.500 | % | | | 794,000 | | | | 773,817 | | |
Dole Food Co., Inc.
Tranche B2 Term Loan(d)(o)
07/08/18 | | | 5.040 | % | | | 304,933 | | | | 303,661 | | |
Earthbound Holdings III LLC
Term Loan(d)(o)
12/21/16 | | | 5.750 | % | | | 839,375 | | | | 834,482 | | |
JBS U.S.A. LLC
Term Loan(d)(o)
05/25/18 | | | 4.250 | % | | | 173,687 | | | | 171,082 | | |
Michael Foods Group, Inc.
Tranche B Term Loan(d)(o)
02/25/18 | | | 4.250 | % | | | 345 | | | | 343 | | |
The accompanying Notes to Financial Statements are an integral part of this statement.
Annual Report 2012
26
Columbia Strategic Income Fund
Portfolio of Investments (continued)
May 31, 2012
Senior Loans (continued)
Borrower | | Weighted
Average
Coupon | | Principal
Amount ($) | |
Value ($) | |
Pierre Foods, Inc.
1st Lien Term Loan(d)(o)
09/30/16 | | | 7.000 | % | | | 862,554 | | | | 863,417 | | |
Solvest Ltd.
Tranche C2 Term Loan(d)(o)
07/08/18 | | | 5.026 | % | | | 545,670 | | | | 543,395 | | |
U.S. Foodservice, Inc.
Term Loan(d)(o)
07/03/14 | | | 2.740 | % | | | 740,285 | | | | 714,841 | | |
WM. Bolthouse Farms, Inc.(d)(o)
1st Lien Term Loan
02/11/16 | | | 5.507 | % | | | 516,674 | | | | 517,190 | | |
2nd Lien Term Loan
08/11/16 | | | 9.500 | % | | | 200,000 | | | | 200,300 | | |
Windsor Quality Food Co., Ltd.
Tranche B Term Loan(d)(f)(o)
02/16/17 | | | 5.000 | % | | | 717,750 | | | | 698,012 | | |
| Total | | | | | | | 5,791,049 | | |
| Gaming 0.1% | |
Affinity Gaming LLC
Term Loan(d)(o)
11/09/17 | | | 5.500 | % | | | 225,000 | | | | 226,575 | | |
Caesars Entertainment Operating Co., Inc.
Tranche B2 Term Loan(d)(o)
01/28/15 | | | 3.239 | % | | | 800,000 | | | | 730,000 | | |
Caesars Octavius LLC
Tranche B Term Loan(d)(o)
04/25/17 | | | 9.250 | % | | | 725,000 | | | | 721,375 | | |
Cannery Casino Resorts LLC
2nd Lien Term Loan(d)(o)
05/18/14 | | | 4.489 | % | | | 25,000 | | | | 23,250 | | |
Golden Nugget, Inc.
2nd Lien Term Loan(d)(o)
12/31/14 | | | 3.490 | % | | | 50,000 | | | | 43,750 | | |
Las Vegas Sands LLC(d)(o)
Tranche B Term Loan
11/23/16 | | | 2.850 | % | | | 219,295 | | | | 212,324 | | |
Tranche I Delayed Draw Term Loan
11/23/16 | | | 2.850 | % | | | 27,564 | | | | 26,688 | | |
Pinnacle Entertainment, Inc.
Tranche A Term Loan(d)(o)
03/19/19 | | | 4.000 | % | | | 600,000 | | | | 594,750 | | |
ROC Finance LLC
Tranche B Term Loan(d)(o)
08/19/17 | | | 8.500 | % | | | 175,000 | | | | 176,094 | | |
SLS Las Vegas
Term Loan(d)(o)
05/02/17 | | | 13.000 | % | | | 300,000 | | | | 295,500 | | |
Senior Loans (continued)
Borrower | | Weighted
Average
Coupon | | Principal
Amount ($) | |
Value ($) | |
Twin River Worldwide Holdings, Inc.
Term Loan(d)(o)
11/05/15 | | | 8.500 | % | | | 391,375 | | | | 391,621 | | |
| Total | | | | | | | 3,441,927 | | |
| Gas Distributors —% | |
Energy Transfer Equity LP
Term Loan(d)(o)
03/23/17 | | | 3.750 | % | | | 200,000 | | | | 194,166 | | |
| Health Care 0.3% | |
Alere, Inc.
Tranche B Term Loan(d)(o)
06/30/17 | | | 4.750 | % | | | 199,000 | | | | 195,943 | | |
Ardent Medical Services, Inc.
Term Loan(d)(o)
09/15/15 | | | 6.500 | % | | | 193,847 | | | | 191,585 | | |
Bausch & Lomb, Inc.(d)(o)
Term Loan
05/17/19 | | | 5.250 | % | | | 425,000 | | | | 417,333 | | |
Bausch & Lomb, Inc.(d)(o)(p)
Delayed Draw Term Loan
09/30/15 | | | 1.000 | % | | | 225,000 | | | | 221,625 | | |
Community Health Systems, Inc.(d)(o)
Term Loan
07/25/14 | | | 2.573 | % | | | 730,113 | | | | 715,628 | | |
| 01/25/17 | | | 3.967 | % | | | 1,049,791 | | | | 1,025,813 | | |
ConvaTec, Inc.
Term Loan(d)(o)
12/22/16 | | | 5.750 | % | | | 653,402 | | | | 648,338 | | |
DaVita, Inc.
Tranche B Term Loan(d)(o)
10/20/16 | | | 4.500 | % | | | 666,563 | | | | 662,250 | | |
Health Management Associates, Inc.
Tranche B Term Loan(d)(o)
11/16/18 | | | 4.500 | % | | | 249,375 | | | | 245,517 | | |
IASIS Healthcare LLC
Tranche B Term Loan(d)(h)(o)
05/03/18 | | | 5.000 | % | | | 299,244 | | | | 294,475 | | |
Inventiv Health, Inc.
Term Loan(d)(o)
08/04/16 | | | 6.500 | % | | | 543,881 | | | | 509,209 | | |
Onex Carestream Finance LP
Term Loan(d)(o)
02/25/17 | | | 5.000 | % | | | 692,829 | | | | 667,042 | | |
Quintiles Transnational Corp.
Tranche B Term Loan(d)(o)
06/08/18 | | | 5.000 | % | | | 967,688 | | | | 952,872 | | |
The accompanying Notes to Financial Statements are an integral part of this statement.
Annual Report 2012
27
Columbia Strategic Income Fund
Portfolio of Investments (continued)
May 31, 2012
Senior Loans (continued)
Borrower | | Weighted
Average
Coupon | | Principal
Amount ($) | |
Value ($) | |
RPI Finance Trust
Term Loan(d)(o)
05/09/18 | | | 4.000 | % | | | 900,000 | | | | 894,375 | | |
Select Medical Corp.
Tranche B Term Loan(d)(o)
06/01/18 | | | 5.500 | % | | | 272,938 | | | | 262,929 | | |
| Total | | | | | | | 7,904,934 | | |
| Integrated Energy —% | |
Gibson Energy ULC
Tranche B Term Loan(d)(o)
06/15/18 | | | 4.750 | % | | | 242,647 | | | | 241,131 | | |
| Life Insurance —% | |
CNO Financial Group, Inc.
Tranche B1 Term Loan(d)(o)
09/30/16 | | | 6.250 | % | | | 458,764 | | | | 456,470 | | |
| Media Cable 0.1% | |
Cequel Communications LLC
Term Loan(d)(o)
02/14/19 | | | 4.000 | % | | | 450,000 | | | | 438,300 | | |
MCC Iowa LLC
Tranche F Term Loan(d)(o)
10/23/17 | | | 4.500 | % | | | 691,206 | | | | 685,593 | | |
Mediacom Illinois LLC
Tranche E Term Loan(d)(o)
10/23/17 | | | 4.500 | % | | | 913,379 | | | | 906,986 | | |
San Juan Cable LLC
Tranche B 1st Lien Term Loan(d)(o)
06/09/17 | | | 6.000 | % | | | 148,875 | | | | 144,875 | | |
WideOpenWest Finance LLC(d)(o)
1st Lien Term Loan
06/30/14 | | | 2.740 | % | | | 545,704 | | | | 540,590 | | |
Tranche A Term Loan
06/30/14 | | | 6.739 | % | | | 122,052 | | | | 121,198 | | |
| Total | | | | | | | 2,837,542 | | |
| Media Non-Cable 0.5% | |
AMC Networks, Inc.
Tranche B Term Loan(d)(o)
12/31/18 | | | 4.000 | % | | | 198,500 | | | | 196,640 | | |
Cengage Learning Acquisitions, Inc.
Term Loan(d)(o)
07/03/14 | | | 2.490 | % | | | 537,475 | | | | 485,373 | | |
Clear Channel Communications, Inc.
Tranche B Term Loan(d)(o)
01/29/16 | | | 3.889 | % | | | 1,360,974 | | | | 1,058,538 | | |
Senior Loans (continued)
Borrower | | Weighted
Average
Coupon | | Principal
Amount ($) | |
Value ($) | |
Cumulus Media Holdings, Inc.(d)(o)
1st Lien Term Loan
09/17/18 | | | 5.750 | % | | | 548,340 | | | | 544,057 | | |
2nd Lien Term Loan
03/18/19 | | | 7.500 | % | | | 725,000 | | | | 726,087 | | |
Emmis Operating Co.
Tranche B Term Loan(d)(o)
11/01/13 | | | 4.473 | % | | | 582,480 | | | | 560,276 | | |
Encompass Digital Media, Inc.
Tranche B Term Loan(d)(o)
08/10/17 | | | 8.000 | % | | | 1,000,000 | | | | 990,000 | | |
GateHouse Media Operating, Inc.
Term Loan(d)(o)
08/28/14 | | | 2.490 | % | | | 689,244 | | | | 214,527 | | |
Granite Broadcasting
Tranche B Term Loan(d)(f)(h)(o)
05/23/18 | | | 8.500 | % | | | 525,000 | | | | 517,125 | | |
Gray Television, Inc
Tranche B Term Loan(d)(o)
12/31/14 | | | 3.740 | % | | | 913,080 | | | | 903,949 | | |
Hubbard Radio LLC
lst Lien Term Loan(d)(o)
04/28/17 | | | 5.250 | % | | | 325,044 | | | | 322,193 | | |
Intelsat Jackson Holdings SA(d)(o)
Term Loan
02/01/14 | | | 2.740 | % | | | 500,000 | | | | 480,625 | | |
| 02/01/14 | | | 3.239 | % | | | 125,000 | | | | 121,875 | | |
Tranche B Term Loan
04/02/18 | | | 5.250 | % | | | 497,487 | | | | 493,030 | | |
LIN Television Corp.
Tranche B Term Loan(d)(o)
12/21/18 | | | 5.000 | % | | | 174,562 | | | | 174,636 | | |
MediaNews Group, Inc.
Term Loan(d)(o)
03/19/14 | | | 8.500 | % | | | 25,391 | | | | 24,328 | | |
Newsday LLC
Term Loan(d)(o)
08/01/13 | | | 6.717 | % | | | 25,000 | | | | 25,021 | | |
NextMedia Operating, Inc.
Term Loan(d)(o)
05/27/16 | | | 8.250 | % | | | 944,070 | | | | 912,605 | | |
Penton Media, Inc.
1st Lien Term Loan(d)(o)
08/01/14 | | | 5.000 | % | | | 486,541 | | | | 365,601 | | |
Postmedia Network, Inc.
Tranche C Term Loan(d)(o)
07/13/16 | | | 6.250 | % | | | 498,751 | | | | 491,893 | | |
Radio One, Inc.
Term Loan(d)(o)
03/31/16 | | | 7.500 | % | | | 738,614 | | | | 723,384 | | |
The accompanying Notes to Financial Statements are an integral part of this statement.
Annual Report 2012
28
Columbia Strategic Income Fund
Portfolio of Investments (continued)
May 31, 2012
Senior Loans (continued)
Borrower | | Weighted
Average
Coupon | | Principal
Amount ($) | |
Value ($) | |
Revolution Studios Distribution Co. LLC
Tranche B Term Loan(d)(f)(o)
12/21/14 | | | 3.990 | % | | | 232,759 | | | | 193,190 | | |
Sinclair Television Group, Inc.
Tranche B Term Loan(d)(o)
10/28/16 | | | 4.000 | % | | | 494,731 | | | | 490,313 | | |
Tribune Co.(d)(n)(o)
Tranche B Term Loan
06/04/14 | | | 5.250 | % | | | 98,750 | | | | 63,761 | | |
Tranche X Term Loan
09/29/14 | | | 5.000 | % | | | 17,067 | | | | 10,863 | | |
Univision Communications, Inc.
1st Lien Term Loan(d)(o)
03/31/17 | | | 4.489 | % | | | 1,189,452 | | | | 1,089,990 | | |
| Total | | | | | | | 12,179,880 | | |
| Metals —% | |
Novelis, Inc.
Tranche B2 Term Loan(d)(o)
03/10/17 | | | 4.000 | % | | | 447,750 | | | | 438,235 | | |
| Non-Captive Diversified —% | |
iStar Financial, Inc.
Tranche A2 Term Loan(d)(o)
06/30/14 | | | 7.000 | % | | | 675,000 | | | | 673,312 | | |
| Oil Field Services —% | |
Frac Tech Services
Term Loan(d)(o)
05/06/16 | | | 6.250 | % | | | 802,683 | | | | 710,375 | | |
| Other Financial Institutions 0.1% | |
Alix Partners(d)(h)(o)
06/13/19 | | | 6.500 | % | | | 350,000 | | | | 344,750 | | |
Harland Clarke Holdings Corp.
Tranche B Term Loan(d)(o)
06/30/14 | | | 2.773 | % | | | 563,414 | | | | 512,239 | | |
Springleaf Financial Funding Co.
Term Loan(d)(o)
05/10/17 | | | 5.500 | % | | | 800,000 | | | | 737,664 | | |
| Total | | | | | | | 1,594,653 | | |
| Other Industry 0.1% | |
ATI Acquisition Co.
Tranche B Term Loan(d)(f)(n)(o)
12/30/14 | | | 12.250 | % | | | 87,169 | | | | 4,359 | | |
On Assignment, Inc.
Tranche B Term Loan(d)(h)(o)
05/15/19 | | | 5.000 | % | | | 275,000 | | | | 271,906 | | |
Senior Loans (continued)
Borrower | | Weighted
Average
Coupon | | Principal
Amount ($) | |
Value ($) | |
Rexnord LLC/RBS Global, Inc.
Tranche B Term Loan(d)(o)
04/01/18 | | | 5.000 | % | | | 798,000 | | | | 793,212 | | |
Sensus U.S.A., Inc.
2nd Lien Term Loan(d)(o)
05/09/18 | | | 8.500 | % | | | 725,000 | | | | 717,750 | | |
| Total | | | | | | | 1,787,227 | | |
| Other Utility —% | |
BRSP LLC
Term Loan(d)(o)
06/24/14 | | | 7.500 | % | | | 309,432 | | | | 309,689 | | |
| Packaging 0.1% | |
Berry Plastics Holding Corp.
Tranche C Term Loan(d)(o)
04/03/15 | | | 2.240 | % | | | 857,603 | | | | 823,702 | | |
Reynolds Group Holdings, Inc.(d)(o)
Tranche B Term Loan
02/09/18 | | | 6.500 | % | | | 514,144 | | | | 514,360 | | |
Tranche C Term Loan
08/09/18 | | | 6.500 | % | | | 442,932 | | | | 444,111 | | |
| Total | | | | | | | 1,782,173 | | |
| Paper —% | |
NewPage Corp.
Debtor In Possession Term Loan(d)(o)(q)
03/08/13 | | | 8.000 | % | | | 325,000 | | | | 327,574 | | |
| Pharmaceuticals 0.1% | |
Endo Health Solutions, Inc.(d)(o)
Tranche A Term Loan
06/17/16 | | | 2.250 | % | | | 242,969 | | | | 240,712 | | |
Tranche B Term Loan
06/17/18 | | | 4.000 | % | | | 83,304 | | | | 82,946 | | |
Grifols, Inc.
Tranche B Term Loan(d)(o)
06/01/17 | | | 4.500 | % | | | 622,604 | | | | 613,913 | | |
Pharmaceutical Product Development, Inc.
Term Loan(d)(o)
12/05/18 | | | 6.250 | % | | | 174,562 | | | | 174,594 | | |
Valeant Pharmaceuticals International, Inc.
Tranche B Term Loan(d)(o)
02/13/19 | | | 3.750 | % | | | 225,000 | | | | 219,881 | | |
| Total | | | | | | | 1,332,046 | | |
| Property & Casualty 0.1% | |
Asurion LLC
2nd Lien Term Loan(d)(o)
05/24/19 | | | 9.000 | % | | | 1,000,000 | | | | 1,004,380 | | |
The accompanying Notes to Financial Statements are an integral part of this statement.
Annual Report 2012
29
Columbia Strategic Income Fund
Portfolio of Investments (continued)
May 31, 2012
Senior Loans (continued)
Borrower | | Weighted
Average
Coupon | | Principal
Amount ($) | |
Value ($) | |
HUB International Ltd.
Term Loan(d)(h)(o)
06/13/17 | | | 4.970 | % | | | 250,000 | | | | 248,750 | | |
| Total | | | | | | | 1,253,130 | | |
| Railroads —% | |
RailAmerica, Inc.
Term Loan(d)(o)
03/01/19 | | | 4.000 | % | | | 325,000 | | | | 323,512 | | |
| REITs —% | |
CB Richard Ellis Services, Inc.
Tranche C Term Loan(d)(o)
03/04/18 | | | 3.489 | % | | | 272,937 | | | | 268,434 | | |
| Retailers 0.5% | |
Academy Ltd.
Term Loan(d)(o)
08/03/18 | | | 6.000 | % | | | 799,125 | | | | 799,125 | | |
BJ's Wholesale Club, Inc.
1st Lien Term Loan(d)(o)
09/28/18 | | | 5.250 | % | | | 797,060 | | | | 795,234 | | |
Bass Pro Group LLC
Term Loan(d)(o)
06/13/17 | | | 5.250 | % | | | 631,339 | | | | 629,237 | | |
Claire's Stores, Inc.
Tranche B Term Loan(d)(o)
05/29/14 | | | 3.057 | % | | | 789,034 | | | | 733,589 | | |
David's Bridal, Inc.
Term Loan(d)(o)
01/31/14 | | | 2.239 | % | | | 436,679 | | | | 433,042 | | |
General Nutrition Centers, Inc.
Tranche B Term Loan(d)(o)
03/02/18 | | | 4.250 | % | | | 850,000 | | | | 839,834 | | |
J. Crew Group, Inc.
Term Loan(d)(o)
03/07/18 | | | 4.750 | % | | | 915,750 | | | | 891,995 | | |
Jo-Ann Stores, Inc.
Term Loan(d)(o)
03/16/18 | | | 4.750 | % | | | 993,637 | | | | 982,458 | | |
Leslie's Poolmart, Inc.
Tranche B Term Loan(d)(o)
11/21/16 | | | 4.500 | % | | | 199,495 | | | | 197,001 | | |
Neiman Marcus Group, Inc. (The)
Term Loan(d)(o)
05/16/18 | | | 4.750 | % | | | 1,000,000 | | | | 980,780 | | |
Orchard Supply Hardware LLC
Term Loan(d)(o)
12/21/13 | | | 5.000 | % | | | 903,580 | | | | 679,944 | | |
Senior Loans (continued)
Borrower | | Weighted
Average
Coupon | | Principal
Amount ($) | |
Value ($) | |
Pantry, Inc. (The)(d)(o)
Delayed Draw Term Loan
05/15/14 | | | 1.990 | % | | | 67,449 | | | | 66,943 | | |
Term Loan
05/15/14 | | | 1.990 | % | | | 717,646 | | | | 712,264 | | |
Pep Boys-Manny, Moe & Jack (The)
Term Loan(d)(o)
10/27/13 | | | 2.470 | % | | | 555,949 | | | | 553,630 | | |
PetCo Animal Supplies, Inc.
Term Loan(d)(o)
11/24/17 | | | 4.500 | % | | | 627,500 | | | | 618,960 | | |
Rite Aid Corp.
Tranche 2 Term Loan(d)(o)
06/04/14 | | | 1.990 | % | | | 899,022 | | | | 876,547 | | |
Toys 'R' Us-Delaware, Inc.
Term Loan(d)(o)
09/01/16 | | | 6.000 | % | | | 641,834 | | | | 626,751 | | |
| Total | | | | | | | 11,417,334 | | |
| Supermarkets —% | |
Supervalu, Inc.
Tranche B2 Term Loan(d)(o)
10/05/15 | | | 3.489 | % | | | 888,756 | | | | 875,318 | | |
| Technology 0.3% | |
Aeroflex, Inc.
Tranche B Term Loan(d)(o)
05/09/18 | | | 5.750 | % | | | 203,703 | | | | 197,592 | | |
Commscope, Inc.
Tranche 1 Term Loan(d)(o)
01/14/18 | | | 4.250 | % | | | 571,868 | | | | 567,934 | | |
Edwards (Cayman Islands II) Ltd.(d)(o)
1st Lien Term Loan
05/31/16 | | | 5.500 | % | | | 389,012 | | | | 384,881 | | |
| 05/31/16 | | | 5.500 | % | | | 215,578 | | | | 213,288 | | |
First Data Corp.(d)(o)
Term Loan
03/23/18 | | | 4.239 | % | | | 848,315 | | | | 766,359 | | |
Tranche B1 Term Loan
09/24/14 | | | 2.989 | % | | | 90,278 | | | | 85,361 | | |
Freescale Semiconductor, Inc.
Tranche B1 Term Loan(d)(o)
12/01/16 | | | 4.489 | % | | | 922,198 | | | | 864,173 | | |
Greeneden U.S. Holdings II LLC
Term Loan(d)(o)
01/31/19 | | | 6.750 | % | | | 550,000 | | | | 549,312 | | |
Interactive Data Corp.
Tranche B Term Loan(d)(o)
02/11/18 | | | 4.500 | % | | | 862,249 | | | | 847,159 | | |
The accompanying Notes to Financial Statements are an integral part of this statement.
Annual Report 2012
30
Columbia Strategic Income Fund
Portfolio of Investments (continued)
May 31, 2012
Senior Loans (continued)
Borrower | | Weighted
Average
Coupon | | Principal
Amount ($) | |
Value ($) | |
Kasima LLC
Term Loan(d)(o)
03/31/17 | | | 5.000 | % | | | 272,250 | | | | 272,250 | | |
Microsemi Corp.
Term Loan(d)(o)
02/02/18 | | | 4.000 | % | | | 820,906 | | | | 800,383 | | |
NDS Finance Ltd.
Tranche B Term Loan(d)(o)
03/12/18 | | | 3.750 | % | | | 123,750 | | | | 122,745 | | |
Novell, Inc.
1st Lien Term Loan(d)(o)
11/22/17 | | | 7.250 | % | | | 492,000 | | | | 481,894 | | |
Openlink International, Inc.
Term Loan(d)(o)
10/30/17 | | | 7.752 | % | | | 149,625 | | | | 149,999 | | |
Rovi Solutions Corp./Guides, Inc.(d)(o)
Tranche A1 Term Loan
02/07/16 | | | 2.740 | % | | | 95,000 | | | | 94,763 | | |
Tranche B2 Term Loan
03/29/19 | | | 4.000 | % | | | 249,250 | | | | 247,174 | | |
Sensata Technology BV/Finance Co. LLC
Term Loan(d)(o)
05/12/18 | | | 4.000 | % | | | 322,562 | | | | 317,253 | | |
SunGard Data Systems, Inc.
Tranche B Term Loan(d)(o)
02/28/16 | | | 3.930 | % | | | 401,514 | | | | 396,748 | | |
Syniverse Holdings, Inc.(d)(h)(o)
Term Loan
04/23/19 | | | 5.000 | % | | | 450,000 | | | | 443,533 | | |
Syniverse Holdings, Inc.(d)(o)
Term Loan
04/23/19 | | | 5.000 | % | | | 350,000 | | | | 344,971 | | |
Trans Union LLC
Term Loan(d)(o)
02/10/18 | | | 5.500 | % | | | 198,000 | | | | 198,842 | | |
Verint Systems, Inc.
Term Loan(d)(o)
10/27/17 | | | 4.500 | % | | | 198,000 | | | | 195,773 | | |
| Total | | | | | | | 8,542,387 | | |
| Textile —% | |
Levi Strauss & Co.
Term Loan(d)(o)
03/27/14 | | | 2.489 | % | | | 600,000 | | | | 585,750 | | |
Springs Window Fashions LLC
Tranche B Term Loan(d)(o)
05/31/17 | | | 6.000 | % | | | 188,215 | | | | 185,391 | | |
| Total | | | | | | | 771,141 | | |
Senior Loans (continued)
Borrower | | Weighted
Average
Coupon | | Principal
Amount ($) | |
Value ($) | |
| Transportation Services —% | |
Avis Budget Car Rental LLC
Tranche C Term Loan(d)(o)
03/15/19 | | | 4.250 | % | | | 375,000 | | | | 371,906 | | |
Hertz Corp. (The)
Letter of Credit(d)(o)
03/11/18 | | | 3.750 | % | | | 500,000 | | | | 480,000 | | |
| Total | | | | | | | 851,906 | | |
| Wireless 0.1% | |
MetroPCS Wireless, Inc.
Tranche B3 Term Loan(d)(o)
03/19/18 | | | 4.000 | % | | | 692,252 | | | | 672,841 | | |
Ntelos, Inc.
Tranche B Term Loan(d)(o)
08/07/15 | | | 4.000 | % | | | 305,958 | | | | 302,745 | | |
Telesat Canada
Tranche B Term Loan(d)(o)
03/28/19 | | | 4.250 | % | | | 575,000 | | | | 567,301 | | |
| Total | | | | | | | 1,542,887 | | |
| Wirelines 0.1% | |
Alaska Communications Systems Holdings, Inc.
Term Loan(d)(o)
10/21/16 | | | 5.500 | % | | | 893,974 | | | | 777,757 | | |
Integra Telecom Holdings, Inc.
Term Loan(d)(o)
04/15/15 | | | 9.250 | % | | | 196,500 | | | | 190,318 | | |
Level 3 Financing, Inc.
Tranche B Term Loan(d)(o)
09/01/18 | | | 5.750 | % | | | 350,000 | | | | 346,689 | | |
| Total | | | | | | | 1,314,764 | | |
Total Senior Loans
(Cost: $102,600,985) | | | | | | | 100,174,241 | | |
Common Stocks —%
| Issuer | | Shares | | Value ($) | |
| CONSUMER DISCRETIONARY —% | |
| Auto Components —% | |
| Delphi Automotive PLC(r) | | | 1,315 | | | | 38,174 | | |
| Hotels, Restaurants & Leisure —% | |
| BLB Management Services , Inc.(r) | | | 5,526 | | | | 68,108 | | |
| Buffets Restaurants Holdings, Inc.(r) | | | 1,852 | | | | 926 | | |
| Total | | | | | 69,034 | | |
The accompanying Notes to Financial Statements are an integral part of this statement.
Annual Report 2012
31
Columbia Strategic Income Fund
Portfolio of Investments (continued)
May 31, 2012
Common Stocks (continued)
| Issuer | | Shares | | Value ($) | |
| Media —% | |
| Cumulus Media, Inc. Class A(c)(r) | | | 2,038 | | | | 5,707 | | |
| Media News Group(r) | | | 2,495 | | | | 36,801 | | |
| Total | | | | | 42,508 | | |
| Total Consumer Discretionary | | | | | 149,716 | | |
| INFORMATION TECHNOLOGY —% | |
| IT Services —% | |
| Advanstar Communications, Inc.(r) | | | 315 | | | | 3,191 | | |
| Total Information Technology | | | | | 3,191 | | |
| MATERIALS —% | |
| Chemicals —% | |
| LyondellBasell Industries NV, Class A | | | 3,806 | | | | 150,185 | | |
| Metals & Mining —% | |
| Aleris International, Inc. | | | 3,583 | | | | 173,775 | | |
| Total Materials | | | | | 323,960 | | |
| TELECOMMUNICATION SERVICES —% | |
| Diversified Telecommunication Services —% | |
| Hawaiian Telcom Holdco, Inc.(r) | | | 478 | | | | 8,987 | | |
| Total Telecommunication Services | | | | | 8,987 | | |
Total Common Stocks
(Cost: $519,261) | | | | | 485,854 | | |
Warrants —%
| ENERGY —% | |
| Energy Equipment & Services —% | |
| Green Field Energy Services, Inc.(r) | | | 3,895 | | | | 237,595 | | |
| Total Energy | | | | | 237,595 | | |
| INFORMATION TECHNOLOGY —% | |
| Communications Equipment —% | |
| CMP Susquehanna Corp.(b)(f)(g)(r) | | | 46,584 | | | | 466 | | |
| Total Information Technology | | | | | 466 | | |
Total Warrants
(Cost: $158,098) | | | | | 238,061 | | |
Treasury Bill 0.1%
| Issuer | | Effective
Yield | | Principal
Amount ($) | | Value ($) | |
| Treasury 0.1% | |
Australia Treasury Bills
08/10/12 | | | 3.610 | % | | AUD | 2,700,000 | | | | 2,613,579 | | |
Total Treasury Bill
(Cost: $2,769,945) | | | | | | | 2,613,579 | | |
Options Purchased Puts —%
| Issuer | | Contracts | | Exercise
Price ($) | | Expiration
Date | | Value ($) | |
U.S. Treasury
Note Futures,
10-year | | | 1,450 | | | | 132 | | | 07/20/12 | | | 702,344 | | |
Total Options Purchased Puts
(Cost: $751,782) | | | | | | | | | 702,344 | | |
Money Market Funds 7.9%
| Issuer | | Shares | | Value ($) | |
Columbia Short-Term Cash Fund,
0.161%(s)(t) | | | 194,567,321 | | | | 194,567,321 | | |
Total Money Market Funds
(Cost: $194,567,321) | | | | | 194,567,321 | | |
Investments of Cash Collateral Received for Securities on Loan 15.9%
Issuer | | Effective
Yield | | Par ($)/
Principal ($)/
Shares | |
Value ($) | |
| Asset-Backed Commercial Paper 1.0% | |
Atlantis One
08/01/12 | | | 0.662 | % | | | 1,993,327 | | | | 1,993,327 | | |
| 10/11/12 | | | 0.541 | % | | | 3,989,020 | | | | 3,989,020 | | |
Kells Funding LLC
06/04/12 | | | 0.501 | % | | | 7,989,444 | | | | 7,989,444 | | |
| 10/12/12 | | | 0.612 | % | | | 3,987,597 | | | | 3,987,597 | | |
| 10/12/12 | | | 0.612 | % | | | 4,984,580 | | | | 4,984,580 | | |
Rheingold Securitization
06/25/12 | | | 0.550 | % | | | 1,999,175 | | | | 1,999,175 | | |
| Total | | | | | | | 24,943,143 | | |
| Certificates of Deposit 8.6% | |
ABM AMRO Bank N.V.
06/21/12 | | | 0.400 | % | | | 9,989,788 | | | | 9,989,788 | | |
Australia and New Zealand Bank Group, Ltd.
08/07/12 | | | 0.650 | % | | | 5,000,000 | | | | 5,000,000 | | |
| 08/16/12 | | | 0.620 | % | | | 5,000,000 | | | | 5,000,000 | | |
The accompanying Notes to Financial Statements are an integral part of this statement.
Annual Report 2012
32
Columbia Strategic Income Fund
Portfolio of Investments (continued)
May 31, 2012
Investments of Cash Collateral Received for Securities on Loan (continued)
Issuer | | Effective
Yield | | Par ($)/
Principal ($)/
Shares | |
Value ($) | |
Bank of Nova Scotia
07/26/12 | | | 0.319 | % | | | 8,000,000 | | | | 8,000,000 | | |
Barclays Bank PLC
07/18/12 | | | 0.280 | % | | | 15,000,000 | | | | 15,000,000 | | |
Branch Banking & Trust Corporation
07/12/12 | | | 0.420 | % | | | 3,000,000 | | | | 3,000,000 | | |
Credit Suisse
10/09/12 | | | 0.500 | % | | | 5,000,000 | | | | 5,000,000 | | |
| 11/08/12 | | | 0.399 | % | | | 10,000,000 | | | | 10,000,000 | | |
DZ Bank AG
07/27/12 | | | 0.320 | % | | | 10,000,000 | | | | 10,000,000 | | |
Deutsche Bank AG
09/14/12 | | | 0.750 | % | | | 8,000,000 | | | | 8,000,000 | | |
| 11/02/12 | | | 0.729 | % | | | 5,000,000 | | | | 5,000,000 | | |
DnB NOR ASA
09/14/12 | | | 0.530 | % | | | 5,000,000 | | | | 5,000,000 | | |
Hong Kong Shanghai Bank Corp., Ltd.
06/01/12 | | | 0.250 | % | | | 12,000,000 | | | | 12,000,000 | | |
| 06/25/12 | | | 0.240 | % | | | 5,000,000 | | | | 5,000,000 | | |
Mitsubishi UFJ Trust and Banking Corp.
08/06/12 | | | 0.410 | % | | | 4,000,098 | | | | 4,000,098 | | |
Mizuho Corporate Bank Ltd.
06/01/12 | | | 0.370 | % | | | 20,000,000 | | | | 20,000,000 | | |
N.V. Bank Nederlandse Gemeenten
06/29/12 | | | 0.260 | % | | | 5,000,000 | | | | 5,000,000 | | |
National Bank of Canada
11/09/12 | | | 0.299 | % | | | 5,000,000 | | | | 5,000,000 | | |
Nordea Bank AB
08/23/12 | | | 0.290 | % | | | 10,000,000 | | | | 10,000,000 | | |
Norinchukin Bank
10/31/12 | | | 0.560 | % | | | 5,000,000 | | | | 5,000,000 | | |
| 11/09/12 | | | 0.519 | % | | | 10,000,000 | | | | 10,000,000 | | |
Rabobank
10/26/12 | | | 0.515 | % | | | 10,000,000 | | | | 10,000,000 | | |
Sumitomo Mitsui Banking Corp.
07/24/12 | | | 0.350 | % | | | 6,000,000 | | | | 6,000,000 | | |
| 10/11/12 | | | 0.500 | % | | | 10,000,000 | | | | 10,000,000 | | |
Sumitomo Trust & Banking Co., Ltd.
08/29/12 | | | 0.350 | % | | | 5,000,000 | | | | 5,000,000 | | |
| 11/01/12 | | | 0.479 | % | | | 10,000,000 | | | | 10,000,000 | | |
Svenska Handelsbanken
08/27/12 | | | 0.270 | % | | | 2,000,026 | | | | 2,000,026 | | |
| 09/13/12 | | | 0.490 | % | | | 5,000,000 | | | | 5,000,000 | | |
| Total | | | | | | | 212,989,912 | | |
Investments of Cash Collateral Received for Securities on Loan (continued)
Issuer | | Effective
Yield | | Par ($)/
Principal ($)/
Shares | |
Value ($) | |
| Commercial Paper 4.9% | |
BTM Capital
06/27/12 | | | 0.511 | % | | | 4,993,554 | | | | 4,993,554 | | |
Bank of New Zealand
11/02/12 | | | 0.359 | % | | | 10,000,000 | | | | 10,000,000 | | |
Caisse d'Amortissement de la Dette Sociale
07/19/12 | | | 0.471 | % | | | 4,992,167 | | | | 4,992,167 | | |
| 08/10/12 | | | 0.531 | % | | | 9,978,947 | | | | 9,978,947 | | |
Caisse des Depots
08/31/12 | | | 0.360 | % | | | 4,995,350 | | | | 4,995,350 | | |
| 10/05/12 | | | 0.562 | % | | | 4,985,767 | | | | 4,985,767 | | |
Development Bank of Singapore Ltd.
07/27/12 | | | 0.561 | % | | | 4,986,933 | | | | 4,986,933 | | |
| 08/02/12 | | | 0.551 | % | | | 9,973,417 | | | | 9,973,417 | | |
DnB NOR
07/25/12 | | | 0.602 | % | | | 4,984,833 | | | | 4,984,833 | | |
| 10/10/12 | | | 0.511 | % | | | 4,987,038 | | | | 4,987,038 | | |
Erste Abwicklungsanstalt
09/07/12 | | | 0.471 | % | | | 4,991,971 | | | | 4,991,971 | | |
Macquarie Bank Ltd.
10/19/12 | | | 0.980 | % | | | 10,000,000 | | | | 10,000,000 | | |
Skandinaviska Enskilda Banken AB
06/15/12 | | | 0.330 | % | | | 4,997,250 | | | | 4,997,250 | | |
| 07/03/12 | | | 0.315 | % | | | 4,997,331 | | | | 4,997,331 | | |
| 07/17/12 | | | 0.300 | % | | | 4,997,333 | | | | 4,997,333 | | |
Suncorp Metway Ltd.
06/04/12 | | | 0.450 | % | | | 3,996,850 | | | | 3,996,850 | | |
| 07/23/12 | | | 0.460 | % | | | 9,991,950 | | | | 9,991,950 | | |
The Commonwealth Bank of Australia
08/16/12 | | | 0.299 | % | | | 7,000,000 | | | | 7,000,000 | | |
Westpac Securities NZ Ltd.
08/27/12 | | | 0.491 | % | | | 4,988,771 | | | | 4,988,771 | | |
| Total | | | | | | | 120,839,462 | | |
| Repurchase Agreements 1.4% | |
Citibank NA
dated 05/31/12,
matures 06/01/12,
repurchase price
$3,000,018(u) | | | 0.210 | % | | | 3,000,000 | | | | 3,000,000 | | |
Citigroup Global Markets, Inc.
dated 05/31/12,
matures 06/01/12,
repurchase price
$1,000,006(u) | | | 0.220 | % | | | 1,000,000 | | | | 1,000,000 | | |
The accompanying Notes to Financial Statements are an integral part of this statement.
Annual Report 2012
33
Columbia Strategic Income Fund
Portfolio of Investments (continued)
May 31, 2012
Investments of Cash Collateral Received for Securities on Loan (continued)
Issuer | | Effective
Yield | | Par ($)/
Principal ($)/
Shares | |
Value ($) | |
Goldman Sachs & Co.
dated 05/31/12,
matures 06/01/12,
repurchase price
$10,000,058(u) | | | 0.210 | % | | | 10,000,000 | | | | 10,000,000 | | |
Mizuho Securities USA, Inc.
dated 05/31/12,
matures 06/01/12,
repurchase price
$5,000,035(u) | | | 0.250 | % | | | 5,000,000 | | | | 5,000,000 | | |
Natixis Financial Products, Inc.
dated 05/31/12,
matures 06/01/12,
repurchase price
$5,000,033(u) | | | 0.240 | % | | | 5,000,000 | | | | 5,000,000 | | |
UBS Securities LLC
dated 05/31/12,
matures 06/01/12,
repurchase price
$9,101,649(u) | | | 0.210 | % | | | 9,101,596 | | | | 9,101,596 | | |
| Total | | | | | | | 33,101,596 | | |
Total Investments of Cash Collateral
Received for Securities on Loan
(Cost: $391,874,113) | | | | | | | 391,874,113 | | |
Total Investments
(Cost: $2,871,084,466) | | | | | | | 2,957,268,779 | | |
| Other Assets & Liabilities, Net | | | | | | | (488,313,136 | ) | |
| Net Assets | | | | | | | 2,468,955,643 | | |
The accompanying Notes to Financial Statements are an integral part of this statement.
Annual Report 2012
34
Columbia Strategic Income Fund
Portfolio of Investments (continued)
May 31, 2012
Investments in Derivatives
Futures Contracts Outstanding at May 31, 2012
| Contract Description | | Number of
Contracts
Long (Short) | | Notional
Market
Value ($) | | Expiration
Date | | Unrealized
Appreciation ($) | | Unrealized
Depreciation ($) | |
| U.S. Treasury Long Bond, 20-year | | | 297 | | | | 44,466,469 | | | September 2012 | | | 630,680 | | | | — | | |
| U.S. Treasury Note, 2-year | | | 317 | | | | 69,868,781 | | | September 2012 | | | 44,104 | | | | — | | |
| U.S. Treasury Note, 5-year | | | 33 | | | | 4,098,188 | | | September 2012 | | | 14,130 | | | | — | | |
| U.S. Treasury Note, 10-year | | | (1,962 | ) | | | (262,785,375 | ) | | September 2012 | | | — | | | | (1,826,995 | ) | |
| U.S. Treasury Ultra Bond, 30-year | | | (117 | ) | | | (19,773,000 | ) | | September 2012 | | | — | | | | (546,784 | ) | |
| Total | | | | | | | | | 688,914 | | | | (2,373,779 | ) | |
Credit Default Swap Contracts Outstanding at May 31, 2012
Buy Protection
| Counterparty | | Reference
Entity | | Expiration Date | | Pay Fixed
Rate (%) | | Notional
Amount ($) | | Market
Value ($) | | Periodic
Payments
Receivable
(Payable) ($) | | Unrealized
Appreciation
($) | | Unrealized
Depreciation
($) | |
| Barclays Capital | | Federative
Republic
of Brazil | | September 20, 2014 | | | 1.470 | | | | 10,000,000 | | | | (63,386 | ) | | | (29,808 | ) | | | — | | | | (93,194 | ) | |
| Total | | | | | | | | | | | | | | | — | | | | (93,194 | ) | |
Forward Foreign Currency Exchange Contracts Open at May 31, 2012
| Counterparty | | Exchange Date | | Currency to
be Delivered | | Currency to
be Received | | Unrealized
Appreciation ($) | | Unrealized
Depreciation ($) | |
| J.P. Morgan Securities, Inc. | | June 8, 2012
| | | 10,457,451
(USD) | | | | 840,000,000
(JPY) | | | | 262,746
| | | | —
| | |
| UBS Securities | | June 15, 2012
| | | 6,100,000
(NZD) | | | | 4,797,040
(USD) | | | | 203,457
| | | | —
| | |
| State Street Bank & Trust Company | | June 18, 2012
| | | 8,628,000
(EUR) | | | | 11,167,307
(USD) | | | | 498,097
| | | | —
| | |
| J.P. Morgan Securities, Inc. | | June 19, 2012
| | | 18,500,000
(PLN) | | | | 5,489,614
(USD) | | | | 282,355
| | | | —
| | |
| Goldman, Sachs & Co. | | June 27, 2012
| | | 24,569,000
(EUR) | | | | 31,364,344
(USD) | | | | 981,566
| | | | —
| | |
| State Street Bank & Trust Company | | June 27, 2012
| | | 7,859,000
(GBP) | | | | 12,416,356
(USD) | | | | 305,395
| | | | —
| | |
| HSBC Securities (USA), Inc. | | June 27, 2012
| | | 1,469,126,000
(JPY) | | | | 18,507,478
(USD) | | | | —
| | | | (245,380
| ) | |
| Barclays Bank PLC | | June 27, 2012
| | | 18,462,860
(USD) | | | | 18,746,000
(AUD) | | | | —
| | | | (242,475
| ) | |
| UBS Securities | | June 27, 2012
| | | 12,335,207
(USD) | | | | 11,808,000
(CHF) | | | | —
| | | | (174,226
| ) | |
| J.P. Morgan Securities, Inc. | | June 27, 2012
| | | 31,007,233
(USD) | | | | 184,869,000
(NOK) | | | | —
| | | | (802,135
| ) | |
| Total | | | | | | | | | 2,533,616 | | | | (1,464,216 | ) | |
The accompanying Notes to Financial Statements are an integral part of this statement.
Annual Report 2012
35
Columbia Strategic Income Fund
Portfolio of Investments (continued)
May 31, 2012
Notes to Portfolio of Investments
(a) Principal amounts are denominated in United States Dollars unless otherwise noted.
(b) Security exempt from registration pursuant to Rule 144A under the Securities Act of 1933. This security may be resold in transactions exempt from registration, normally to qualified institutional buyers. At May 31, 2012, the value of these securities amounted to $579,375,960 or 23.47% of net assets.
(c) At May 31, 2012, security was partially or fully on loan.
(d) Variable rate security. The interest rate shown reflects the rate as of May 31, 2012.
(e) Negligible market value.
(f) Identifies issues considered to be illiquid as to their marketability. The aggregate value of such securities at May 31, 2012 was $3,108,299, representing 0.13% of net assets. Information concerning such security holdings at May 31, 2012 was as follows:
| Security | | Acquisition Dates | | Cost ($) | |
Aleris International, Inc.
Senior Unsecured
06/01/20 6.000% | | 06/29/10 | | | — | | |
ATI Acquisition Co.
Tranche B Term Loan
12/30/14 12.250% | | 12/23/09 thru 04/24/12 | | | 77,250 | | |
Cabazon Band Mission Indians
Revenue Bonds
Series 2004
06/01/12 13.000% | | 10/04/04 | | | 2,820,000 | | |
| CMP Susquehanna Corp. | | 03/26/09 | | | 466 | | |
Revolution Studios Distribution Co. LLC
Tranche B Term Loan
12/21/14 3.990% | | 10/15/08 | | | 207,365 | | |
Six Flags, Inc.
06/01/14 9.625% | | 05/07/10 | | | — | | |
Windsor Quality Food Co., Ltd.
Tranche B Term Loan
02/16/17 5.000% | | 02/14/11 | | | 710,573 | | |
(g) Represents fair value as determined in good faith under procedures approved by the Board of Trustees. At May 31, 2012, the value of these securities amounted to $3,613, which represents less than 0.01% of net assets.
(h) Represents a security purchased on a when-issued or delayed delivery basis.
(i) The maturity dates shown represent the original maturity of the underlying obligation. Actual maturity may vary based upon prepayment activity on these obligations. Unless otherwise noted, the coupon rates presented are fixed rates.
(j) Interest Only (IO) security. The actual effective yield of this security is different than the stated coupon rate.
(k) At May 31, 2012, investments in securities included securities valued at $6,691,937 that were partially pledged as collateral to cover initial margin deposits on open interest rate futures contracts.
(l) Zero coupon bond.
(m) Municipal obligations include debt obligations issued by or on behalf of territories, possessions, or sovereign nations within the territorial boundaries of the United States. At May 31, 2012, the value of these securities amounted to $1,692,000 or 0.07% of net assets.
(n) Represents securities that have defaulted on payment of interest. The Fund has stopped accruing interest on these securities. At May 31, 2012, the value of these securities amounted to $1,770,983, which represents 0.07% of net assets.
(o) Senior loans have rates of interest that float periodically based primarily on the London Interbank Offered Rate ("LIBOR") and other short-term rates. The interest rate shown reflects the weighted average coupon as of May 31, 2012. The interest rate shown for senior loans purchased on a when-issued or delayed delivery basis, if any, reflects an estimated average coupon. Remaining maturities of senior loans may be less than the stated maturities shown as a result of contractual or optional prepayments by the borrower. Such prepayments cannot be predicted with certainty.
The accompanying Notes to Financial Statements are an integral part of this statement.
Annual Report 2012
36
Columbia Strategic Income Fund
Portfolio of Investments (continued)
May 31, 2012
Notes to Portfolio of Investments (continued)
(p) At May 31, 2012, the Fund had unfunded senior loan commitments pursuant to the terms of the loan agreement. The Fund receives a stated coupon rate until the borrower draws on the loan commitment, at which time the rate will become the stated rate in the loan agreement.
| Borrower | | Unfunded
Commitment ($) | |
Bausch & Lomb, Inc.
Delayed Draw Term Loan | | | 225,000 | | |
Tronox Pigments B.V.
Delayed Draw Term Loan | | | 64,286 | | |
| Total | | | 289,286 | | |
(q) The borrower filed for protection under Chapter 11 of the U.S. Federal Bankruptcy Code.
(r) Non-income producing.
(s) The rate shown is the seven-day current annualized yield at May 31, 2012.
(t) Investments in affiliates during the year ended May 31, 2012:
| Issuer | | Beginning
Cost ($) | | Purchase
Cost ($) | | Sales Cost/
Proceeds
from Sales ($) | | Realized
Gain/Loss ($) | | Ending
Cost ($) | | Dividends
or Interest
Income ($) | | Value ($) | |
Columbia
Short-Term
Cash Fund | | | 12,988,808 | | | | 764,526,625 | | | | (582,948,112 | ) | | | — | | | | 194,567,321 | | | | 122,038 | | | | 194,567,321 | | |
(u) The table below represents securities received as collateral for repurchase agreements. This collateral is deposited with the Fund's custodian and, pursuant to the terms of the repurchase agreement, must have an aggregate value greater than or equal to the repurchase price plus accrued interest at all times. The value of securities and/or cash held as collateral for repurchase agreements is monitored on a daily basis to ensure the proper level of collateral.
| Security Description | | Value ($) | |
| Citibank NA (0.210%) | |
| Fannie Mae Pool | | | 1,500,842 | | |
| Fannie Mae REMICS | | | 708,979 | | |
| Ginnie Mae I Pool | | | 850,179 | | |
| Total Market Value of Collateral Securities | | | 3,060,000 | | |
| Security Description | | Value ($) | |
| Citigroup Global Markets, Inc. (0.220%) | |
| Fannie Mae Benchmark REMIC | | | 5,027 | | |
| Fannie Mae REMICS | | | 395,861 | | |
| Fannie Mae-Aces | | | 8,212 | | |
| Freddie Mac Reference REMIC | | | 2,207 | | |
| Freddie Mac REMICS | | | 503,719 | | |
| Government National Mortgage Association | | | 104,974 | | |
| Total Market Value of Collateral Securities | | | 1,020,000 | | |
The accompanying Notes to Financial Statements are an integral part of this statement.
Annual Report 2012
37
Columbia Strategic Income Fund
Portfolio of Investments (continued)
May 31, 2012
Notes to Portfolio of Investments (continued)
| Security Description | | Value ($) | |
| Goldman Sachs & Co. (0.210%) | |
| Ginnie Mae I Pool | | | 8,107,002 | | |
| Ginnie Mae II Pool | | | 2,092,998 | | |
| Total Market Value of Collateral Securities | | | 10,200,000 | | |
| Security Description | | Value ($) | |
| Mizuho Securities USA, Inc. (0.250%) | |
| Fannie Mae Grantor Trust | | | 151,844 | | |
| Fannie Mae Pool | | | 11,733 | | |
| Fannie Mae REMICS | | | 2,570,190 | | |
| Fannie Mae Whole Loan | | | 177,263 | | |
| FHLMC Structured Pass Through Securities | | | 80,953 | | |
| Freddie Mac Non Gold Pool | | | 354,619 | | |
| Freddie Mac REMICS | | | 337,081 | | |
| Ginnie Mae II Pool | | | 1,416,317 | | |
| Total Market Value of Collateral Securities | | | 5,100,000 | | |
| Security Description | | Value ($) | |
| Natixis Financial Products, Inc. (0.240%) | |
| Fannie Mae Pool | | | 422,249 | | |
| Fannie Mae REMICS | | | 1,360,147 | | |
| Fannie Mae-Aces | | | 16,500 | | |
| Freddie Mac Gold Pool | | | 573,291 | | |
| Freddie Mac REMICS | | | 1,120,066 | | |
| Government National Mortgage Association | | | 1,115,994 | | |
| United States Treasury Note/Bond | | | 491,787 | | |
| Total Market Value of Collateral Securities | | | 5,100,034 | | |
| Security Description | | Value ($) | |
| UBS Securities LLC (0.210%) | |
| Ginnie Mae I Pool | | | 5,686,245 | | |
| Ginnie Mae II Pool | | | 3,597,383 | | |
| Total Market Value of Collateral Securities | | | 9,283,628 | | |
Abbreviation Legend
CMO Collateralized Mortgage Obligation
FGIC Financial Guaranty Insurance Company
NPFGC National Public Finance Guarantee Corporation
PIK Payment-in-Kind
STRIPS Separate Trading of Registered Interest and Principal Securities
The accompanying Notes to Financial Statements are an integral part of this statement.
Annual Report 2012
38
Columbia Strategic Income Fund
Portfolio of Investments (continued)
May 31, 2012
Currency Legend
AUD Australian Dollar
BRL Brazilian Real
CAD Canadian Dollar
CHF Swiss Franc
COP Colombian Peso
EUR Euro
GBP British Pound
IDR Indonesian Rupiah
JPY Japanese Yen
MXN Mexican Peso
NOK Norwegian Krone
NZD New Zealand Dollar
PEN Peru Nuevos Soles
PHP Philippine Peso
PLN Polish Zloty
SEK Swedish Krona
USD US Dollar
UYU Uruguay Pesos
Fair Value Measurements
Generally accepted accounting principles (GAAP) require disclosure regarding the inputs and valuation techniques used to measure fair value and any changes in valuation inputs or techniques. In addition, investments shall be disclosed by major category.
The Fund categorizes its fair value measurements according to a three-level hierarchy that maximizes the use of observable inputs and minimizes the use of unobservable inputs by prioritizing that the most observable input be used when available. Observable inputs are those that market participants would use in pricing an investment based on market data obtained from sources independent of the reporting entity. Unobservable inputs are those that reflect the Fund's assumptions about the information market participants would use in pricing an investment. An investment's level within the fair value hierarchy is based on the lowest level of any input that is deemed significant to the asset or liability's fair value measurement. The input levels are not necessarily an indication of the risk or liquidity associated with investments at that level. For example, certain U.S. government securities are generally high quality and liquid, however, they are reflected as Level 2 because the inputs used to determine fair value may not always be quoted prices in an active market.
Fair value inputs are summarized in the three broad levels listed below:
> Level 1 — Valuations based on quoted prices for investments in active markets that the Fund has the ability to access at the measurement date (including NAV for open-end mutual funds). Valuation adjustments are not applied to Level 1 investments.
> Level 2 — Valuations based on other significant observable inputs (including quoted prices for similar securities, interest rates, prepayment speeds, credit risks, etc.).
> Level 3 — Valuations based on significant unobservable inputs (including the Fund's own assumptions and judgment in determining the fair value of investments).
Inputs that are used in determining fair value of an investment may include price information, credit data, volatility statistics, and other factors. These inputs can be either observable or unobservable. The availability of observable inputs can vary between investments, and is affected by various factors such as the type of investment, and the volume and level of activity for that investment or similar investments in the marketplace. The inputs will be considered by the Investment Manager, along with any other relevant factors in the calculation of an investment's fair value. The Fund uses prices and inputs that are current as of the measurement date, which may include periods of market dislocations. During these periods, the availability of prices and inputs may be reduced for many investments. This condition could cause an investment to be reclassified between the various levels within the hierarchy.
Short-term securities are valued using amortized cost, as permitted under Rule 2a-7 of the Investment Company Act of 1940, as amended. Generally, amortized cost approximates the current fair value of these securities, but because the value is not obtained from a quoted price in an active market, such securities are reflected as Level 2.
The accompanying Notes to Financial Statements are an integral part of this statement.
Annual Report 2012
39
Columbia Strategic Income Fund
Portfolio of Investments (continued)
May 31, 2012
Fair Value Measurements (continued)
Investments falling into the Level 3 category are primarily supported by quoted prices from brokers and dealers participating in the market for those investments. However, these may be classified as Level 3 investments due to lack of market transparency and corroboration to support these quoted prices. Additionally, valuation models may be used as the pricing source for any remaining investments classified as Level 3. These models rely on one or more significant unobservable inputs and/or significant assumptions by the Investment Manager. Inputs used in valuations may include, but are not limited to, financial statement analysis, capital account balances, discount rates and estimated cash flows, and comparable company data.
The following table is a summary of the inputs used to value the Fund's investments at May 31, 2012:
| Description | | Level 1
Quoted Prices in Active
Markets for Identical
Assets ($) | |
Level 2
Other Significant
Observable Inputs ($) | |
Level 3
Significant
Unobservable Inputs ($) | |
Total ($) | |
| Bonds | |
| Corporate Bonds & Notes | |
| Banking | | | — | | | | 32,460,958 | | | | 766,759 | | | | 33,227,717 | | |
| Metals | | | — | | | | 47,269,298 | | | | 3,147 | | | | 47,272,445 | | |
| All other industries | | | — | | | | 1,054,692,758 | | | | — | | | | 1,054,692,758 | | |
Residential Mortgage-Backed
Securities — Agency | | | — | | | | 238,521,154 | | | | — | | | | 238,521,154 | | |
Residential Mortgage-Backed
Securities — Non-Agency | | | — | | | | 43,030,031 | | | | 16,349,555 | | | | 59,379,586 | | |
Commercial Mortgage-Backed
Securities — Non-Agency | | | — | | | | 74,484,799 | | | | — | | | | 74,484,799 | | |
| Asset-Backed Securities — Non-Agency | | | — | | | | 1,738,447 | | | | — | | | | 1,738,447 | | |
| Inflation-Indexed Bonds | | | — | | | | 57,686,560 | | | | — | | | | 57,686,560 | | |
| U.S. Treasury Obligations | | | 127,452,435 | | | | 5,936,262 | | | | — | | | | 133,388,697 | | |
| Foreign Government Obligations | | | — | | | | 562,609,994 | | | | 1,919,109 | | | | 564,529,103 | | |
| Municipal Bonds | | | — | | | | 1,692,000 | | | | — | | | | 1,692,000 | | |
| Total Bonds | | | 127,452,435 | | | | 2,120,122,261 | | | | 19,038,570 | | | | 2,266,613,266 | | |
| Senior Loans | |
| Aerospace & Defense | | | — | | | | 305 | | | | 188,100 | | | | 188,405 | | |
| Chemicals | | | — | | | | 4,683,580 | | | | 536,034 | | | | 5,219,614 | | |
| Consumer Cyclical Services | | | — | | | | 1,117,891 | | | | 232,454 | | | | 1,350,345 | | |
| Electric | | | — | | | | 3,322,638 | | | | 319,756 | | | | 3,642,394 | | |
| Gaming | | | — | | | | 2,697,302 | | | | 744,625 | | | | 3,441,927 | | |
| Health Care | | | — | | | | 7,683,309 | | | | 221,625 | | | | 7,904,934 | | |
| Media Non-Cable | | | — | | | | 10,479,565 | | | | 1,700,315 | | | | 12,179,880 | | |
| Other Industry | | | — | | | | 1,782,868 | | | | 4,359 | | | | 1,787,227 | | |
| Technology | | | — | | | | 7,224,992 | | | | 1,317,395 | | | | 8,542,387 | | |
| All other industries | | | — | | | | 55,917,128 | | | | — | | | | 55,917,128 | | |
| Total Senior Loans | | | — | | | | 94,909,578 | | | | 5,264,663 | | | | 100,174,241 | | |
The accompanying Notes to Financial Statements are an integral part of this statement.
Annual Report 2012
40
Columbia Strategic Income Fund
Portfolio of Investments (continued)
May 31, 2012
Fair Value Measurements (continued)
| Description | | Level 1
Quoted Prices in Active
Markets for Identical
Assets ($) | |
Level 2
Other Significant
Observable Inputs ($) | |
Level 3
Significant
Unobservable Inputs ($) | |
Total ($) | |
| Equity Securities | |
| Common Stocks | |
| Consumer Discretionary | | | 43,881 | | | | 68,108 | | | | 37,727 | | | | 149,716 | | |
| Information Technology | | | — | | | | — | | | | 3,191 | | | | 3,191 | | |
| Materials | | | 150,185 | | | | — | | | | 173,775 | | | | 323,960 | | |
| Telecommunication Services | | | 8,987 | | | | — | | | | — | | | | 8,987 | | |
| Warrants | |
| Energy | | | — | | | | 237,595 | | | | — | | | | 237,595 | | |
| Information Technology | | | — | | | | — | | | | 466 | | | | 466 | | |
| Total Equity Securities | | | 203,053 | | | | 305,703 | | | | 215,159 | | | | 723,915 | | |
| Short-Term Securities | |
| Treasury Bill | | | — | | | | 2,613,579 | | | | — | | | | 2,613,579 | | |
| Total Short-Term Securities | | | — | | | | 2,613,579 | | | | — | | | | 2,613,579 | | |
| Other | |
| Options Purchased Puts | | | 702,344 | | | | — | | | | — | | | | 702,344 | | |
| Money Market Funds | | | 194,567,321 | | | | — | | | | — | | | | 194,567,321 | | |
Investments of Cash Collateral
Received for Securities on Loan | | | — | | | | 391,874,113 | | | | — | | | | 391,874,113 | | |
| Total Other | | | 195,269,665 | | | | 391,874,113 | | | | — | | | | 587,143,778 | | |
| Investments in Securities | | | 322,925,153 | | | | 2,609,825,234 | | | | 24,518,392 | | | | 2,957,268,779 | | |
| Derivatives | |
| Assets | |
| Futures Contracts | | | 688,914 | | | | — | | | | — | | | | 688,914 | | |
Forward Foreign Currency
Exchange Contracts | | | — | | | | 2,533,616 | | | | — | | | | 2,533,616 | | |
| Liabilities | |
| Futures Contracts | | | (2,373,779 | ) | | | — | | | | — | | | | (2,373,779 | ) | |
Forward Foreign Currency
Exchange Contracts | | | — | | | | (1,464,216 | ) | | | — | | | | (1,464,216 | ) | |
| Swap Contracts | | | — | | | | (93,194 | ) | | | — | | | | (93,194 | ) | |
| Total | | | 321,240,288 | | | | 2,610,801,440 | | | | 24,518,392 | | | | 2,956,560,120 | | |
See the Portfolio of Investments for all investment classifications not indicated in the table.
The Fund's assets assigned to the Level 2 input category are generally valued using the market approach, in which a security's value is determined through reference to prices and information from market transactions for similar or identical assets.
The Fund's assets assigned to the Level 3 category are valued utilizing the valuation technique deemed the most appropriate in the circumstances. Certain Residential Mortgage Backed Securities, Corporate Bonds, Senior Loans, Common Stock and Foreign Government Obligations classified as Level 3 are valued using the market approach and utilize single market quotations from broker dealers. Certain Corporate Bonds classified as Level 3 are valued using an income approach. To determine fair value for these securities, management considered estimates of future distributions from the liquidation of company assets or potential actions related to the respective company's bankruptcy filing. Warrants classified as Level 3 are valued using a market approach. To determine fair value for these securities, management considered various factors which may have included, but were not limited to, trades of similar securities, estimated earnings of
The accompanying Notes to Financial Statements are an integral part of this statement.
Annual Report 2012
41
Columbia Strategic Income Fund
Portfolio of Investments (continued)
May 31, 2012
the respective company, market multiples derived from a set of comparable companies, and the position of the security within the respective company's capital structure.
Fair Value Measurements (continued)
There were no transfers of financial assets between Levels 1 and 2 during the period.
Futures contracts, forward foreign currency contracts and swap contracts are valued at unrealized appreciation (depreciation).
The following table is a reconciliation of level 3 assets for which significant unobservable inputs were used to determine fair value.
| | | Corporate
Bonds &
Notes ($) | | Residential
Mortgage-
Backed
Securities —
Non-Agency ($) | | Foreign
Government
Obligations
($) | | Senior
Loans ($) | | Common
Stocks ($) | | Preferred
Stocks ($) | | Warrants ($) | | Total ($) | |
Balance as of
May 31, 2011 | | | 161,000 | | | | 11,257,231 | | | | — | | | | 2,139,296 | | | | — | | | | 408 | | | | 466 | | | | 13,558,401 | | |
Accrued discounts/
premiums | | | 656 | | | | — | | | | 48,561 | | | | 28,496 | | | | — | | | | — | | | | — | | | | 77,713 | | |
| Realized gain (loss) | | | — | | | | 15,802 | | | | 83,097 | | | | 18,644 | | | | — | | | | 407,242 | | | | — | | | | 524,785 | | |
Change in
unrealized
appreciation
(depreciation)(a) | | | 86,091 | | | | (3,950 | ) | | | 54,837 | | | | (119,331 | ) | | | (137,322 | ) | | | — | | | | — | | | | (119,675 | ) | |
| Sales | | | — | | | | (6,853,954 | ) | | | (342,335 | ) | | | (1,431,148 | ) | | | — | | | | (407,650 | ) | | | — | | | | (9,035,087 | ) | |
| Purchases | | | 683,159 | | | | 19,975,416 | | | | 2,074,949 | | | | 4,541,330 | | | | 352,015 | | | | — | | | | — | | | | 27,626,869 | | |
Transfers into
Level 3 | | | — | | | | — | | | | — | | | | 1,370,981 | | | | — | | | | — | | | | — | | | | 1,370,981 | | |
Transfers out of
Level 3 | | | (161,000 | ) | | | (8,040,990 | ) | | | — | | | | (1,283,605 | ) | | | — | | | | — | | | | — | | | | (9,485,595 | ) | |
Balance as of
May 31, 2012 | | | 769,906 | | | | 16,349,555 | | | | 1,919,109 | | | | 5,264,663 | | | | 214,693 | | | | — | | | | 466 | | | | 24,518,392 | | |
(a) Change in unrealized appreciation (depreciation) relating to securities held at May 31, 2012 was $(105,541), which is comprised of Corporate Bonds & Notes of $86,091, Residential Mortgage-Backed Securities — Non-Agency of $(3,950), Foreign Government Obligations of $54,837, Senior Loans of $(105,197) and Common Stocks of $(137,322).
Financial Assets were transferred from Level 2 to Level 3 due to utilizing a single market quotation from a broker dealer. As a result, as of period end, management determined to fair value the security under consistently applied procedures established by and under the general supervision of the Board of Trustees.
Financial assets were transferred from Level 3 to Level 2 as observable market inputs were utilized and management's determination that there was sufficient, reliable and observable market data to value these assets as of period end, May 31, 2012.
Transfers in and/or out of Level 3 are determined based on the fair value at the beginning of the period for security positions held throughout the period.
The accompanying Notes to Financial Statements are an integral part of this statement.
Annual Report 2012
42
Columbia Strategic Income Fund
Statement of Assets and Liabilities
May 31, 2012
| Assets | |
| Investments, at value* | |
| Unaffiliated issuers (identified cost $2,284,643,032) | | $ | 2,370,827,345 | | |
| Affiliated issuers (identified cost $194,567,321) | | | 194,567,321 | | |
| Investment of cash collateral received for securities on loan | |
| Short-term securities (identified cost $358,772,517) | | | 358,772,517 | | |
| Repurchase agreements (identified cost $33,101,596) | | | 33,101,596 | | |
| Total investments (identified cost $2,871,084,466) | | | 2,957,268,779 | | |
| Cash | | | 1,450,557 | | |
| Foreign currency (identified cost $4,731,478) | | | 4,539,956 | | |
| Unrealized appreciation on forward foreign currency exchange contracts | | | 2,533,616 | | |
| Receivable for: | |
| Investments sold | | | 107,145,842 | | |
| Capital shares sold | | | 3,030,680 | | |
| Dividends | | | 24,899 | | |
| Interest | | | 32,487,207 | | |
| Reclaims | | | 221,204 | | |
| Expense reimbursement due from Investment Manager | | | 1,214 | | |
| Prepaid expenses | | | 1,737 | | |
| Trustees' deferred compensation plan | | | 157,232 | | |
| Total assets | | | 3,108,862,923 | | |
| Liabilities | |
| Due upon return of securities on loan | | | 391,874,113 | | |
| Unrealized depreciation on forward foreign currency exchange contracts | | | 1,464,216 | | |
| Unrealized depreciation on swap contracts | | | 93,194 | | |
| Payable for: | |
| Investments purchased | | | 92,801,718 | | |
| Investments purchased on a delayed delivery basis | | | 149,628,820 | | |
| Capital shares purchased | | | 2,615,300 | | |
| Variation margin on futures contracts | | | 377,945 | | |
| Foreign capital gains taxes deferred | | | 248,963 | | |
| Investment management fees | | | 34,787 | | |
| Distribution and service fees | | | 16,271 | | |
| Transfer agent fees | | | 329,143 | | |
| Administration fees | | | 4,248 | | |
| Plan administration fees | | | 51 | | |
| Compensation of board members | | | 58,393 | | |
| Chief compliance officer expenses | | | 337 | | |
| Other expenses | | | 202,549 | | |
| Trustees' deferred compensation plan | | | 157,232 | | |
| Total liabilities | | | 639,907,280 | | |
| Net assets applicable to outstanding capital stock | | $ | 2,468,955,643 | | |
The accompanying Notes to Financial Statements are an integral part of this statement.
Annual Report 2012
43
Columbia Strategic Income Fund
Statement of Assets and Liabilities (continued)
May 31, 2012
| Represented by | |
| Paid-in capital | | $ | 2,408,886,127 | | |
| Undistributed net investment income | | | 2,649,575 | | |
| Accumulated net realized loss | | | (27,248,124 | ) | |
| Unrealized appreciation (depreciation) on: | |
| Investments | | | 86,184,313 | | |
| Foreign currency translations | | | (558,626 | ) | |
| Forward foreign currency exchange contracts | | | 1,069,400 | | |
| Futures contracts | | | (1,684,865 | ) | |
| Swap contracts | | | (93,194 | ) | |
| Foreign capital gains tax | | | (248,963 | ) | |
| Total — representing net assets applicable to outstanding capital stock | | $ | 2,468,955,643 | | |
*Value of securities on loan $427,484,121
| Class A | |
| Net assets | | $ | 1,365,605,072 | | |
| Shares outstanding | | | 223,438,311 | | |
| Net asset value per share | | $ | 6.11 | | |
| Maximum offering price per share(a) | | $ | 6.41 | | |
| Class B | |
| Net assets | | $ | 55,594,401 | | |
| Shares outstanding | | | 9,100,454 | | |
| Net asset value per share | | $ | 6.11 | | |
| Class C | |
| Net assets | | $ | 234,350,788 | | |
| Shares outstanding | | | 38,327,531 | | |
| Net asset value per share | | $ | 6.11 | | |
| Class R | |
| Net assets | | $ | 70,853 | | |
| Shares outstanding | | | 11,541 | | |
| Net asset value per share | | $ | 6.14 | | |
| Class R4 | |
| Net assets | | $ | 219,390 | | |
| Shares outstanding | | | 36,347 | | |
| Net asset value per share | | $ | 6.04 | | |
| Class R5 | |
| Net assets | | $ | 276,579 | | |
| Shares outstanding | | | 45,815 | | |
| Net asset value per share | | $ | 6.04 | | |
| Class W | |
| Net assets | | $ | 2,478 | | |
| Shares outstanding | | | 406 | | |
| Net asset value per share | | $ | 6.10 | | |
| Class Z | |
| Net assets | | $ | 812,836,082 | | |
| Shares outstanding | | | 134,673,070 | | |
| Net asset value per share | | $ | 6.04 | | |
(a) The maximum offering price per share is calculated by dividing the net asset value by 1.0 minus the maximum sales charge of 4.75%.
The accompanying Notes to Financial Statements are an integral part of this statement.
Annual Report 2012
44
Columbia Strategic Income Fund
Statement of Operations
Year Ended May 31, 2012
| Net investment income | |
| Income: | |
| Dividends | | $ | 155,613 | | |
| Interest | | | 134,143,693 | | |
| Dividends from affiliates | | | 122,038 | | |
| Income from securities lending — net | | | 1,145,654 | | |
| Foreign taxes withheld | | | (479,077 | ) | |
| Total income | | | 135,087,921 | | |
| Expenses: | |
| Investment management fees | | | 11,871,078 | | |
| Distribution fees | |
| Class B | | | 488,995 | | |
| Class C | | | 1,626,607 | | |
| Class R | | | 141 | | |
| Service fees | |
| Class A | | | 3,230,326 | | |
| Class B | | | 163,250 | | |
| Class C | | | 541,936 | | |
| Class W | | | 6 | | |
| Transfer agent fees | |
| Class A | | | 2,084,576 | | |
| Class B | | | 108,264 | | |
| Class C | | | 348,096 | | |
| Class R | | | 48 | | |
| Class R4 | | | 71 | | |
| Class R5 | | | 79 | | |
| Class W | | | 4 | | |
| Class Z | | | 1,145,218 | | |
| Administration fees | | | 1,450,327 | | |
| Plan administration fees | |
| Class R4 | | | 534 | | |
| Compensation of board members | | | 83,177 | | |
| Custodian fees | | | 152,871 | | |
| Printing and postage fees | | | 159,848 | | |
| Registration fees | | | 202,222 | | |
| Professional fees | | | 134,390 | | |
| Chief compliance officer expenses | | | 1,164 | | |
| Other | | | 66,229 | | |
| Total expenses | | | 23,859,457 | | |
| Fees waived or expenses reimbursed by Investment Manager and its affiliates | | | (182,250 | ) | |
| Fees waived by Distributor — Class C | | | (323,325 | ) | |
| Expense reductions | | | (8,823 | ) | |
| Total net expenses | | | 23,345,059 | | |
| Net investment income | | | 111,742,862 | | |
| Realized and unrealized gain (loss) — net | |
| Net realized gain (loss) on: | |
| Investments | | | 43,584,287 | | |
| Foreign currency translations | | | (765,984 | ) | |
| Forward foreign currency exchange contracts | | | 2,394,851 | | |
| Futures contracts | | | (21,885,053 | ) | |
| Options contracts written | | | 986,180 | | |
| Swap contracts | | | (149,042 | ) | |
| Net realized gain | | | 24,165,239 | | |
| Net change in unrealized appreciation (depreciation) on: | |
| Investments | | | (35,649,065 | ) | |
| Foreign currency translations | | | (555,881 | ) | |
| Forward foreign currency exchange contracts | | | 879,748 | | |
| Futures contracts | | | (1,725,754 | ) | |
| Swap contracts | | | 151,791 | | |
| Foreign capital gains tax | | | (248,963 | ) | |
| Net change in unrealized depreciation | | | (37,148,124 | ) | |
| Net realized and unrealized loss | | | (12,982,885 | ) | |
| Net increase in net assets resulting from operations | | $ | 98,759,977 | | |
The accompanying Notes to Financial Statements are an integral part of this statement.
Annual Report 2012
45
Columbia Strategic Income Fund
Statement of Changes in Net Assets
| | | Year Ended
May 31,
2012 | | Year Ended
May 31,
2011(a)(b) | |
| Operations | |
| Net investment income | | $ | 111,742,862 | | | $ | 101,752,453 | | |
| Net realized gain | | | 24,165,239 | | | | 114,391,303 | | |
| Net change in unrealized appreciation (depreciation) | | | (37,148,124 | ) | | | 28,649,553 | | |
| Net increase in net assets resulting from operations | | | 98,759,977 | | | | 244,793,309 | | |
| Distributions to shareholders | |
| Net investment income | |
| Class A | | | (66,539,026 | ) | | | (69,981,175 | ) | |
| Class B | | | (2,824,433 | ) | | | (4,835,348 | ) | |
| Class C | | | (9,849,005 | ) | | | (12,463,225 | ) | |
| Class R | | | (1,222 | ) | | | (129 | ) | |
| Class R4 | | | (11,357 | ) | | | (32 | ) | |
| Class R5 | | | (15,349 | ) | | | (33 | ) | |
| Class W | | | (129 | ) | | | (133 | ) | |
| Class Z | | | (38,835,078 | ) | | | (49,909,500 | ) | |
| Total distributions to shareholders | | | (118,075,599 | ) | | | (137,189,575 | ) | |
| Increase (decrease) in net assets from share transactions | | | 623,615,952 | | | | (259,350,846 | ) | |
| Total increase (decrease) in net assets | | | 604,300,330 | | | | (151,747,112 | ) | |
| Net assets at beginning of year | | | 1,864,655,313 | | | | 2,016,402,425 | | |
| Net assets at end of year | | $ | 2,468,955,643 | | | $ | 1,864,655,313 | | |
| Undistributed net investment income | | $ | 2,649,575 | | | $ | 4,632,213 | | |
(a) Class R and Class W shares are for the period from September 27, 2010 (commencement of operations) to May 31, 2011.
(b) Class R4 and Class R5 shares are for the period from March 7, 2011 (commencement of operations) to May 31, 2011.
The accompanying Notes to Financial Statements are an integral part of this statement.
Annual Report 2012
46
Columbia Strategic Income Fund
Statement of Changes in Net Assets (continued)
| | | Year Ended May 31, 2012 | | Year Ended May 31, 2011(a)(b) | |
| | | Shares | | Dollars ($) | | Shares | | Dollars ($) | |
| Capital stock activity | |
| Class A shares | |
| Subscriptions(c) | | | 52,489,779 | | | | 320,916,293 | | | | 22,444,538 | | | | 136,451,728 | | |
| Fund merger | | | 50,379,122 | | | | 310,385,658 | | | | — | | | | — | | |
| Distributions reinvested | | | 8,155,920 | | | | 49,568,948 | | | | 7,415,133 | | | | 44,784,581 | | |
| Redemptions | | | (42,689,073 | ) | | | (260,445,140 | ) | | | (48,368,248 | ) | | | (294,113,944 | ) | |
| Net increase (decrease) | | | 68,335,748 | | | | 420,425,759 | | | | (18,508,577 | ) | | | (112,877,635 | ) | |
| Class B shares | |
| Subscriptions | | | 976,504 | | | | 5,951,250 | | | | 715,729 | | | | 4,343,096 | | |
| Fund merger | | | 3,427,244 | | | | 21,120,603 | | | | — | | | | — | | |
| Distributions reinvested | | | 327,055 | | | | 1,984,880 | | | | 423,625 | | | | 2,552,887 | | |
| Redemptions(c) | | | (5,644,122 | ) | | | (34,428,362 | ) | | | (6,851,911 | ) | | | (41,582,909 | ) | |
| Net decrease | | | (913,319 | ) | | | (5,371,629 | ) | | | (5,712,557 | ) | | | (34,686,926 | ) | |
| Class C shares | |
| Subscriptions | | | 10,704,507 | | | | 65,378,318 | | | | 4,802,590 | | | | 29,231,386 | | |
| Fund merger | | | 3,538,608 | | | | 21,808,409 | | | | — | | | | — | | |
| Distributions reinvested | | | 1,040,533 | | | | 6,326,289 | | | | 1,104,074 | | | | 6,665,128 | | |
| Redemptions | | | (7,096,976 | ) | | | (43,274,133 | ) | | | (9,369,474 | ) | | | (56,956,485 | ) | |
| Net increase (decrease) | | | 8,186,672 | | | | 50,238,883 | | | | (3,462,810 | ) | | | (21,059,971 | ) | |
| Class R shares | |
| Subscriptions | | | 10,170 | | | | 62,779 | | | | 406 | | | | 2,500 | | |
| Fund merger | | | 859 | | | | 5,322 | | | | — | | | | — | | |
| Distributions reinvested | | | 111 | | | | 686 | | | | — | | | | — | | |
| Redemptions | | | (5 | ) | | | (31 | ) | | | — | | | | — | | |
| Net increase | | | 11,135 | | | | 68,756 | | | | 406 | | | | 2,500 | | |
| Class R4 shares | |
| Subscriptions | | | — | | | | — | | | | 416 | | | | 2,500 | | |
| Fund merger | | | 36,339 | | | | 221,227 | | | | — | | | | — | | |
| Distributions reinvested | | | 1,778 | | | | 10,674 | | | | — | | | | — | | |
| Redemptions | | | (2,186 | ) | | | (13,236 | ) | | | — | | | | — | | |
| Net increase | | | 35,931 | | | | 218,665 | | | | 416 | | | | 2,500 | | |
| Class R5 shares | |
| Subscriptions | | | — | | | | — | | | | 416 | | | | 2,500 | | |
| Fund merger | | | 45,399 | | | | 276,592 | | | | — | | | | — | | |
| Net increase | | | 45,399 | | | | 276,592 | | | | 416 | | | | 2,500 | | |
| Class W shares | |
| Subscriptions | | | — | | | | — | | | | 430 | | | | 2,650 | | |
| Redemptions | | | — | | | | — | | | | (24 | ) | | | (151 | ) | |
| Net increase | | | — | | | | — | | | | 406 | | | | 2,499 | | |
The accompanying Notes to Financial Statements are an integral part of this statement.
Annual Report 2012
47
Columbia Strategic Income Fund
Statement of Changes in Net Assets (continued)
| | | Year Ended May 31, 2012 | | Year Ended May 31, 2011(a)(b) | |
| | | Shares | | Dollars ($) | | Shares | | Dollars ($) | |
| Capital stock activity (continued) | |
| Class Z shares | |
| Subscriptions | | | 56,110,241 | | | | 339,467,116 | | | | 20,596,037 | | | | 124,112,385 | | |
| Distributions reinvested | | | 1,329,496 | | | | 7,983,778 | | | | 1,743,711 | | | | 10,411,117 | | |
| Redemptions | | | (31,284,926 | ) | | | (189,691,968 | ) | | | (37,504,048 | ) | | | (225,259,815 | ) | |
| Net increase (decrease) | | | 26,154,811 | | | | 157,758,926 | | | | (15,164,300 | ) | | | (90,736,313 | ) | |
| Total net increase (decrease) | | | 101,856,377 | | | | 623,615,952 | | | | (42,846,600 | ) | | | (259,350,846 | ) | |
(a) Class R and Class W shares are for the period from September 27, 2010 (commencement of operations) to May 31, 2011.
(b) Class R4 and Class R5 shares are for the period from March 7, 2011 (commencement of operations) to May 31, 2011.
(c) Includes conversions of Class B shares to Class A shares, if any.
The accompanying Notes to Financial Statements are an integral part of this statement.
Annual Report 2012
48
Columbia Strategic Income Fund
Financial Highlights
The following tables are intended to help you understand the Fund's financial performance. Certain information reflects financial results for a single share of a class held for the periods shown. Per share net investment income (loss) amounts are calculated based on average shares outstanding during the period. Total returns assume reinvestment of all dividends and distributions. Total returns do not reflect payment of sales charges, if any, and are not annualized for periods of less than one year.
| | | Year Ended May 31, | |
| Class A | | 2012 | | 2011 | | 2010 | | 2009 | | 2008 | |
| Per share data | |
| Net asset value, beginning of period | | $ | 6.16 | | | $ | 5.84 | | | $ | 5.40 | | | $ | 5.91 | | | $ | 6.01 | | |
| Income from investment operations: | |
| Net investment income | | | 0.30 | | | | 0.32 | | | | 0.29 | | | | 0.29 | | | | 0.31 | | |
| Net realized and unrealized gain (loss) | | | (0.04 | ) | | | 0.43 | | | | 0.41 | | | | (0.41 | ) | | | (0.05 | ) | |
| Total from investment operations | | | 0.26 | | | | 0.75 | | | | 0.70 | | | | (0.12 | ) | | | 0.26 | | |
| Less distributions to shareholders: | |
| Net investment income | | | (0.31 | ) | | | (0.43 | ) | | | (0.26 | ) | | | (0.38 | ) | | | (0.36 | ) | |
| Tax return of capital | | | — | | | | — | | | | — | | | | (0.01 | ) | | | — | | |
| Total distributions to shareholders | | | (0.31 | ) | | | (0.43 | ) | | | (0.26 | ) | | | (0.39 | ) | | | (0.36 | ) | |
| Net asset value, end of period | | $ | 6.11 | | | $ | 6.16 | | | $ | 5.84 | | | $ | 5.40 | | | $ | 5.91 | | |
| Total return | | | 4.44 | % | | | 13.21 | % | | | 13.14 | % | | | (1.79 | %) | | | 4.47 | % | |
| Ratios to average net assets(a) | |
| Expenses prior to fees waived or expenses reimbursed | | | 1.03 | % | | | 1.01 | % | | | 0.99 | % | | | 0.98 | % | | | 0.95 | % | |
| Net expenses after fees waived or expenses reimbursed(b) | | | 1.02 | %(c) | | | 1.00 | %(c) | | | 0.99 | %(c) | | | 0.98 | %(c) | | | 0.95 | %(c) | |
| Net investment income | | | 4.89 | %(c) | | | 5.22 | %(c) | | | 5.09 | %(c) | | | 5.46 | %(c) | | | 5.24 | %(c) | |
| Supplemental data | |
| Net assets, end of period (in thousands) | | $ | 1,365,605 | | | $ | 956,132 | | | $ | 1,013,941 | | | $ | 913,087 | | | $ | 865,282 | | |
| Portfolio turnover | | | 83 | %(d) | | | 128 | % | | | 50 | % | | | 43 | % | | | 41 | % | |
Notes to Financial Highlights
(a) In addition to the fees and expenses which the Fund bears directly, the Fund indirectly bears a pro rata share of the fees and expenses of the acquired funds in which it invests. Such indirect expenses are not included in the reported expense ratios.
(b) The Investment Manager and certain of its affiliates agreed to waive/reimburse certain fees and expenses, if applicable.
(c) The benefits derived from expense reductions had an impact of less than 0.01%.
(d) Includes mortgage dollar rolls. If mortgage dollar roll transactions were excluded, the portfolio turnover would have been 63% for the year ended May 31, 2012.
The accompanying Notes to Financial Statements are an integral part of this statement.
Annual Report 2012
49
Columbia Strategic Income Fund
Financial Highlights (continued)
| | | Year Ended May 31, | |
| Class B | | 2012 | | 2011 | | 2010 | | 2009 | | 2008 | |
| Per share data | |
| Net asset value, beginning of period | | $ | 6.16 | | | $ | 5.84 | | | $ | 5.40 | | | $ | 5.91 | | | $ | 6.00 | | |
| Income from investment operations: | |
| Net investment income | | | 0.25 | | | | 0.27 | | | | 0.25 | | | | 0.25 | | | | 0.27 | | |
| Net realized and unrealized gain (loss) | | | (0.03 | ) | | | 0.43 | | | | 0.41 | | | | (0.41 | ) | | | (0.05 | ) | |
| Total from investment operations | | | 0.22 | | | | 0.70 | | | | 0.66 | | | | (0.16 | ) | | | 0.22 | | |
| Less distributions to shareholders: | |
| Net investment income | | | (0.27 | ) | | | (0.38 | ) | | | (0.22 | ) | | | (0.34 | ) | | | (0.31 | ) | |
| Tax return of capital | | | — | | | | — | | | | — | | | | (0.01 | ) | | | — | | |
| Total distributions to shareholders | | | (0.27 | ) | | | (0.38 | ) | | | (0.22 | ) | | | (0.35 | ) | | | (0.31 | ) | |
| Net asset value, end of period | | $ | 6.11 | | | $ | 6.16 | | | $ | 5.84 | | | $ | 5.40 | | | $ | 5.91 | | |
| Total return | | | 3.65 | % | | | 12.37 | % | | | 12.30 | % | | | (2.52 | %) | | | 3.86 | % | |
| Ratios to average net assets(a) | |
| Expenses prior to fees waived or expenses reimbursed | | | 1.78 | % | | | 1.76 | % | | | 1.74 | % | | | 1.73 | % | | | 1.70 | % | |
| Net expenses after fees waived or expenses reimbursed(b) | | | 1.77 | %(c) | | | 1.75 | %(c) | | | 1.74 | %(c) | | | 1.73 | %(c) | | | 1.70 | %(c) | |
| Net investment income | | | 4.15 | %(c) | | | 4.47 | %(c) | | | 4.43 | %(c) | | | 4.71 | %(c) | | | 4.50 | %(c) | |
| Supplemental data | |
| Net assets, end of period (in thousands) | | $ | 55,594 | | | $ | 61,684 | | | $ | 91,784 | | | $ | 122,915 | | | $ | 169,001 | | |
| Portfolio turnover | | | 83 | %(d) | | | 128 | % | | | 50 | % | | | 43 | % | | | 41 | % | |
Notes to Financial Highlights
(a) ��In addition to the fees and expenses which the Fund bears directly, the Fund indirectly bears a pro rata share of the fees and expenses of the acquired funds in which it invests. Such indirect expenses are not included in the reported expense ratios.
(b) The Investment Manager and certain of its affiliates agreed to waive/reimburse certain fees and expenses, if applicable.
(c) The benefits derived from expense reductions had an impact of less than 0.01%.
(d) Includes mortgage dollar rolls. If mortgage dollar roll transactions were excluded, the portfolio turnover would have been 63% for the year ended May 31, 2012.
The accompanying Notes to Financial Statements are an integral part of this statement.
Annual Report 2012
50
Columbia Strategic Income Fund
Financial Highlights (continued)
| | | Year Ended May 31, | |
| Class C | | 2012 | | 2011 | | 2010 | | 2009 | | 2008 | |
| Per share data | |
| Net asset value, beginning of period | | $ | 6.17 | | | $ | 5.84 | | | $ | 5.41 | | | $ | 5.91 | | | $ | 6.01 | | |
| Income from investment operations: | |
| Net investment income | | | 0.26 | | | | 0.28 | | | | 0.26 | | | | 0.26 | | | | 0.28 | | |
| Net realized and unrealized gain (loss) | | | (0.04 | ) | | | 0.44 | | | | 0.40 | | | | (0.41 | ) | | | (0.06 | ) | |
| Total from investment operations | | | 0.22 | | | | 0.72 | | | | 0.66 | | | | (0.15 | ) | | | 0.22 | | |
| Less distributions to shareholders: | |
| Net investment income | | | (0.28 | ) | | | (0.39 | ) | | | (0.23 | ) | | | (0.34 | ) | | | (0.32 | ) | |
| Tax return of capital | | | — | | | | — | | | | — | | | | (0.01 | ) | | | — | | |
| Total distributions to shareholders | | | (0.28 | ) | | | (0.39 | ) | | | (0.23 | ) | | | (0.35 | ) | | | (0.32 | ) | |
| Net asset value, end of period | | $ | 6.11 | | | $ | 6.17 | | | $ | 5.84 | | | $ | 5.41 | | | $ | 5.91 | | |
| Total return | | | 3.64 | % | | | 12.72 | % | | | 12.26 | % | | | (2.21 | %) | | | 3.84 | % | |
| Ratios to average net assets(a) | |
| Expenses prior to fees waived or expenses reimbursed | | | 1.78 | % | | | 1.76 | % | | | 1.74 | % | | | 1.73 | % | | | 1.70 | % | |
| Net expenses after fees waived or expenses reimbursed(b) | | | 1.62 | %(c) | | | 1.60 | %(c) | | | 1.59 | %(c) | | | 1.58 | %(c) | | | 1.55 | %(c) | |
| Net investment income | | | 4.28 | %(c) | | | 4.62 | %(c) | | | 4.47 | %(c) | | | 4.85 | %(c) | | | 4.63 | %(c) | |
| Supplemental data | |
| Net assets, end of period (in thousands) | | $ | 234,351 | | | $ | 185,859 | | | $ | 196,319 | | | $ | 157,492 | | | $ | 130,420 | | |
| Portfolio turnover | | | 83 | %(d) | | | 128 | % | | | 50 | % | | | 43 | % | | | 41 | % | |
Notes to Financial Highlights
(a) In addition to the fees and expenses which the Fund bears directly, the Fund indirectly bears a pro rata share of the fees and expenses of the acquired funds in which it invests. Such indirect expenses are not included in the reported expense ratios.
(b) The Investment Manager and certain of its affiliates agreed to waive/reimburse certain fees and expenses, if applicable.
(c) The benefits derived from expense reductions had an impact of less than 0.01%.
(d) Includes mortgage dollar rolls. If mortgage dollar roll transactions were excluded, the portfolio turnover would have been 63% for the year ended May 31, 2012.
The accompanying Notes to Financial Statements are an integral part of this statement.
Annual Report 2012
51
Columbia Strategic Income Fund
Financial Highlights (continued)
| | | Year Ended May 31, | |
| Class R | | 2012 | | 2011(a) | |
| Per share data | |
| Net asset value, beginning of period | | $ | 6.19 | | | $ | 6.16 | | |
| Income from investment operations: | |
| Net investment income | | | 0.27 | | | | 0.22 | | |
| Net realized and unrealized gain (loss) | | | (0.02 | ) | | | 0.13 | | |
| Total from investment operations | | | 0.25 | | | | 0.35 | | |
| Less distributions to shareholders: | |
| Net investment income | | | (0.30 | ) | | | (0.32 | ) | |
| Total distributions to shareholders | | | (0.30 | ) | | | (0.32 | ) | |
| Net asset value, end of period | | $ | 6.14 | | | $ | 6.19 | | |
| Total return | | | 4.20 | % | | | 5.86 | % | |
| Ratios to average net assets(b) | |
| Expenses prior to fees waived or expenses reimbursed | | | 1.29 | % | | | 1.36 | %(c) | |
| Net expenses after fees waived or expenses reimbursed(d) | | | 1.27 | %(e) | | | 1.25 | %(c)(e) | |
| Net investment income | | | 4.44 | %(e) | | | 5.31 | %(c)(e) | |
| Supplemental data | |
| Net assets, end of period (in thousands) | | $ | 71 | | | $ | 3 | | |
| Portfolio turnover | | | 83 | %(f) | | | 128 | % | |
Notes to Financial Highlights
(a) For the period from September 27, 2010 (commencement of operations) to May 31, 2011.
(b) In addition to the fees and expenses which the Fund bears directly, the Fund indirectly bears a pro rata share of the fees and expenses of the acquired funds in which it invests. Such indirect expenses are not included in the reported expense ratios.
(c) Annualized.
(d) The Investment Manager and certain of its affiliates agreed to waive/reimburse certain fees and expenses, if applicable.
(e) The benefits derived from expense reductions had an impact of less than 0.01%.
(f) Includes mortgage dollar rolls. If mortgage dollar roll transactions were excluded, the portfolio turnover would have been 63% for the year ended May 31, 2012.
The accompanying Notes to Financial Statements are an integral part of this statement.
Annual Report 2012
52
Columbia Strategic Income Fund
Financial Highlights (continued)
| | | Year Ended May 31, | |
| Class R4 | | 2012 | | 2011(a) | |
| Per share data | |
| Net asset value, beginning of period | | $ | 6.09 | | | $ | 6.01 | | |
| Income from investment operations: | |
| Net investment income | | | 0.30 | | | | 0.07 | | |
| Net realized and unrealized gain (loss) | | | (0.03 | ) | | | 0.09 | | |
| Total from investment operations | | | 0.27 | | | | 0.16 | | |
| Less distributions to shareholders: | |
| Net investment income | | | (0.32 | ) | | | (0.08 | ) | |
| Total distributions to shareholders | | | (0.32 | ) | | | (0.08 | ) | |
| Net asset value, end of period | | $ | 6.04 | | | $ | 6.09 | | |
| Total return | | | 4.59 | % | | | 2.62 | % | |
| Ratios to average net assets(b) | |
| Expenses prior to fees waived or expenses reimbursed | | | 0.90 | % | | | 0.89 | %(c) | |
| Net expenses after fees waived or expenses reimbursed(d) | | | 0.90 | %(e) | | | 0.89 | %(c)(e) | |
| Net investment income | | | 5.00 | %(e) | | | 5.19 | %(c)(e) | |
| Supplemental data | |
| Net assets, end of period (in thousands) | | $ | 219 | | | $ | 3 | | |
| Portfolio turnover | | | 83 | %(f) | | | 128 | % | |
Notes to Financial Highlights
(a) For the period from March 7, 2011 (commencement of operations) to May 31, 2011.
(b) In addition to the fees and expenses which the Fund bears directly, the Fund indirectly bears a pro rata share of the fees and expenses of the acquired funds in which it invests. Such indirect expenses are not included in the reported expense ratios.
(c) Annualized.
(d) The Investment Manager and certain of its affiliates agreed to waive/reimburse certain fees and expenses, if applicable.
(e) The benefits derived from expense reductions had an impact of less than 0.01%.
(f) Includes mortgage dollar rolls. If mortgage dollar roll transactions were excluded, the portfolio turnover would have been 63% for the year ended May 31, 2012.
The accompanying Notes to Financial Statements are an integral part of this statement.
Annual Report 2012
53
Columbia Strategic Income Fund
Financial Highlights (continued)
| | | Year Ended May 31, | |
| Class R5 | | 2012 | | 2011(a) | |
| Per share data | |
| Net asset value, beginning of period | | $ | 6.09 | | | $ | 6.01 | | |
| Income from investment operations: | |
| Net investment income | | | 0.32 | | | | 0.08 | | |
| Net realized and unrealized gain (loss) | | | (0.03 | ) | | | 0.08 | | |
| Total from investment operations | | | 0.29 | | | | 0.16 | | |
| Less distributions to shareholders: | |
| Net investment income | | | (0.34 | ) | | | (0.08 | ) | |
| Total distributions to shareholders | | | (0.34 | ) | | | (0.08 | ) | |
| Net asset value, end of period | | $ | 6.04 | | | $ | 6.09 | | |
| Total return | | | 4.86 | % | | | 2.68 | % | |
| Ratios to average net assets(b) | |
| Expenses prior to fees waived or expenses reimbursed | | | 0.65 | % | | | 0.63 | %(c) | |
| Net expenses after fees waived or expenses reimbursed(d) | | | 0.65 | %(e) | | | 0.63 | %(c)(e) | |
| Net investment income | | | 5.26 | %(e) | | | 5.45 | %(c)(e) | |
| Supplemental data | |
| Net assets, end of period (in thousands) | | $ | 277 | | | $ | 3 | | |
| Portfolio turnover | | | 83 | %(f) | | | 128 | % | |
Notes to Financial Highlights
(a) For the period from March 7, 2011 (commencement of operations) to May 31, 2011.
(b) In addition to the fees and expenses which the Fund bears directly, the Fund indirectly bears a pro rata share of the fees and expenses of the acquired funds in which it invests. Such indirect expenses are not included in the reported expense ratios.
(c) Annualized.
(d) The Investment Manager and certain of its affiliates agreed to waive/reimburse certain fees and expenses, if applicable.
(e) The benefits derived from expense reductions had an impact of less than 0.01%.
(f) Includes mortgage dollar rolls. If mortgage dollar roll transactions were excluded, the portfolio turnover would have been 63% for the year ended May 31, 2012.
The accompanying Notes to Financial Statements are an integral part of this statement.
Annual Report 2012
54
Columbia Strategic Income Fund
Financial Highlights (continued)
| | | Year Ended May 31, | |
| Class W | | 2012 | | 2011(a) | |
| Per share data | |
| Net asset value, beginning of period | | $ | 6.16 | | | $ | 6.16 | | |
| Income from investment operations: | |
| Net investment income | | | 0.30 | | | | 0.21 | | |
| Net realized and unrealized gain (loss) | | | (0.04 | ) | | | 0.12 | | |
| Total from investment operations | | | 0.26 | | | | 0.33 | | |
| Less distributions to shareholders: | |
| Net investment income | | | (0.32 | ) | | | (0.33 | ) | |
| Total distributions to shareholders | | | (0.32 | ) | | | (0.33 | ) | |
| Net asset value, end of period | | $ | 6.10 | | | $ | 6.16 | | |
| Total return | | | 4.34 | % | | | 5.53 | % | |
| Ratios to average net assets(b) | |
| Expenses prior to fees waived or expenses reimbursed | | | 1.03 | % | | | 0.89 | %(c) | |
| Net expenses after fees waived or expenses reimbursed(d) | | | 1.02 | %(e) | | | 0.89 | %(c)(e) | |
| Net investment income | | | 4.89 | %(e) | | | 5.10 | %(c)(e) | |
| Supplemental data | |
| Net assets, end of period (in thousands) | | $ | 2 | | | $ | 3 | | |
| Portfolio turnover | | | 83 | %(f) | | | 128 | % | |
Notes to Financial Highlights
(a) For the period from September 27, 2010 (commencement of operations) to May 31, 2011.
(b) In addition to the fees and expenses which the Fund bears directly, the Fund indirectly bears a pro rata share of the fees and expenses of the acquired funds in which it invests. Such indirect expenses are not included in the reported expense ratios.
(c) Annualized.
(d) The Investment Manager and certain of its affiliates agreed to waive/reimburse certain fees and expenses, if applicable.
(e) The benefits derived from expense reductions had an impact of less than 0.01%.
(f) Includes mortgage dollar rolls. If mortgage dollar roll transactions were excluded, the portfolio turnover would have been 63% for the year ended May 31, 2012.
The accompanying Notes to Financial Statements are an integral part of this statement.
Annual Report 2012
55
Columbia Strategic Income Fund
Financial Highlights (continued)
| | | Year Ended May 31, | |
| Class Z | | 2012 | | 2011 | | 2010 | | 2009 | | 2008 | |
| Per share data | |
| Net asset value, beginning of period | | $ | 6.09 | | | $ | 5.78 | | | $ | 5.35 | | | $ | 5.85 | | | $ | 5.95 | | |
| Income from investment operations: | |
| Net investment income | | | 0.31 | | | | 0.33 | | | | 0.31 | | | | 0.30 | | | | 0.32 | | |
| Net realized and unrealized gain (loss) | | | (0.03 | ) | | | 0.42 | | | | 0.39 | | | | (0.40 | ) | | | (0.05 | ) | |
| Total from investment operations | | | 0.28 | | | | 0.75 | | | | 0.70 | | | | (0.10 | ) | | | 0.27 | | |
| Less distributions to shareholders: | |
| Net investment income | | | (0.33 | ) | | | (0.44 | ) | | | (0.27 | ) | | | (0.39 | ) | | | (0.37 | ) | |
| Tax return of capital | | | — | | | | — | | | | — | | | | (0.01 | ) | | | — | | |
| Total distributions to shareholders | | | (0.33 | ) | | | (0.44 | ) | | | (0.27 | ) | | | (0.40 | ) | | | (0.37 | ) | |
| Net asset value, end of period | | $ | 6.04 | | | $ | 6.09 | | | $ | 5.78 | | | $ | 5.35 | | | $ | 5.85 | | |
| Total return | | | 4.75 | % | | | 13.46 | % | | | 13.36 | % | | | (1.38 | %) | | | 4.77 | % | |
| Ratios to average net assets(a) | |
| Expenses prior to fees waived or expenses reimbursed | | | 0.78 | % | | | 0.76 | % | | | 0.74 | % | | | 0.73 | % | | | 0.70 | % | |
| Net expenses after fees waived or expenses reimbursed(b) | | | 0.77 | %(c) | | | 0.75 | %(c) | | | 0.74 | %(c) | | | 0.73 | %(c) | | | 0.70 | %(c) | |
| Net investment income | | | 5.13 | %(c) | | | 5.47 | %(c) | | | 5.35 | %(c) | | | 5.71 | %(c) | | | 5.47 | %(c) | |
| Supplemental data | |
| Net assets, end of period (in thousands) | | $ | 812,836 | | | $ | 660,970 | | | $ | 714,358 | | | $ | 704,118 | | | $ | 726,217 | | |
| Portfolio turnover | | | 83 | %(d) | | | 128 | % | | | 50 | % | | | 43 | % | | | 41 | % | |
Notes to Financial Highlights
(a) In addition to the fees and expenses which the Fund bears directly, the Fund indirectly bears a pro rata share of the fees and expenses of the acquired funds in which it invests. Such indirect expenses are not included in the reported expense ratios.
(b) The Investment Manager and certain of its affiliates agreed to waive/reimburse certain fees and expenses, if applicable.
(c) The benefits derived from expense reductions had an impact of less than 0.01%.
(d) Includes mortgage dollar rolls. If mortgage dollar roll transactions were excluded, the portfolio turnover would have been 63% for the year ended May 31, 2012.
The accompanying Notes to Financial Statements are an integral part of this statement.
Annual Report 2012
56
Columbia Strategic Income Fund
Notes to Financial Statements
May 31, 2012
Note 1. Organization
Columbia Strategic Income Fund (the Fund), a series of Columbia Funds Series Trust I (the Trust), is a diversified fund. The Trust is registered under the Investment Company Act of 1940, as amended (the 1940 Act), as an open-end management investment company organized as a Massachusetts business trust.
Fund Shares
The Trust may issue an unlimited number of shares (without par value). The Fund offers Class A, Class B, Class C, Class R, Class R4, Class R5, Class W and Class Z shares. All share classes have identical voting, dividend and liquidation rights. Each share class has its own expense structure and sales charges, as applicable.
Class A shares are subject to a maximum front-end sales charge of 4.75% based on the initial investment amount. Class A shares purchased without an initial sales charge in accounts aggregating $1 million to $50 million at the time of purchase are subject to a contingent deferred sales charge (CDSC) if the shares are sold within 18 months of purchase, charged as follows: 1.00% CDSC if redeemed within 12 months of purchase, and 0.50% CDSC if redeemed more than 12, but less than 18, months after purchase.
Class B shares may be subject to a maximum CDSC of 5.00% based upon the holding period after purchase. Class B shares will generally convert to Class A shares eight years after purchase. The Fund no longer accepts investments by new or existing investors in the Fund's Class B shares, except in connection with the reinvestment of any dividend and/or capital gain distributions in Class B shares of the Fund and exchanges by existing Class B shareholders of certain other funds within the Columbia Family of Funds.
Class C shares are subject to a 1.00% CDSC on shares redeemed within one year of purchase.
Class R shares are not subject to sales charges and are only available to qualifying institutional investors.
Class R4 shares are not subject to sales charges; however, this share class is closed to new investors.
Class R5 shares are not subject to sales charges; however, this share class is closed to new investors.
Class W shares are not subject to sales charges and are only available to investors purchasing through authorized investment programs managed by investment professionals, including discretionary managed account programs.
Class Z shares are not subject to sales charges, and are only available to certain investors, as described in the Fund's Class Z prospectus.
Note 2. Summary of Significant Accounting Policies
Use of Estimates
The preparation of financial statements in accordance with U.S. generally accepted accounting principles (GAAP) requires management to make certain estimates and assumptions that affect the reported amounts of assets and liabilities, the disclosure of contingent assets and liabilities at the date of the financial statements and the reported amounts of revenue and expenses during the reporting period. Actual results could differ from those estimates.
The following is a summary of significant accounting policies consistently followed by the Fund in the preparation of its financial statements.
Security Valuation
Debt securities generally are valued by pricing services approved by the Board of Trustees (the Board) based upon market transactions for normal, institutional-size trading units of similar securities. The services may use various pricing techniques which take into account appropriate factors such as yield, quality, coupon rate, maturity, type of issue, trading characteristics and other data, as well as broker quotes. Debt securities for which quotations are readily available may also be valued based upon an over-the-counter or exchange bid quotation.
Asset and mortgage-backed securities are generally valued by pricing services, which utilize pricing models that incorporate the securities' cash flow and loan performance data. These models also take into account available market data, including trades, market quotations, and benchmark yield curves for identical or similar securities. Factors used to identify similar securities may include, but are not limited to, issuer, collateral type, vintage, prepayment speeds, collateral performance, credit ratings, credit enhancement and expected life. Asset-backed securities for which quotations are readily available may also be valued based upon an over-the-counter or exchange bid quotation.
Foreign securities are valued based on quotations from the principal market in which such securities are normally traded. If any foreign share prices are not readily available as a result of limited share activity the securities are valued at the mean of the latest quoted bid and ask prices on such exchanges or markets. Foreign currency exchange rates are generally determined at 4:00 p.m. Eastern (U.S.) time. However, many
Annual Report 2012
57
Columbia Strategic Income Fund
Notes to Financial Statements (continued)
May 31, 2012
securities markets and exchanges outside the U.S. close prior to the close of the NYSE; therefore, the closing prices for securities in such markets or on such exchanges may not fully reflect events that occur after such close but before the close of the NYSE. In those situations, foreign securities will be fair valued pursuant to the policy adopted by the Board, including utilizing a third party pricing service to determine these fair values. The third party pricing service takes into account multiple factors, including, but not limited to, movements in the U.S. securities markets, certain depositary receipts, futures contracts and foreign exchange rates that have occurred subsequent to the close of the foreign exchange or market, to determine a good faith estimate that reasonably reflects the current market conditions as of the close of the NYSE. The fair value of a security is likely to be different from the quoted or published price, if available.
All equity securities are valued at the close of business of the New York Stock Exchange (NYSE). Equity securities are valued at the last quoted sales price on the principal exchange or market on which they trade, except for securities traded on the NASDAQ Stock Market, which are valued at the NASDAQ official close price. Unlisted securities or listed securities for which there were no sales during the day are valued at the mean of the latest quoted bid and ask prices on such exchanges or markets.
Investments in other open-end investment companies, including money market funds, are valued at net asset value.
Short-term securities purchased within 60 days to maturity are valued at amortized cost, which approximates market value. The value of short-term securities originally purchased with maturities greater than 60 days is determined based on an amortized value to par upon reaching 60 days to maturity. Short-term securities maturing in more than 60 days from the valuation date are valued at the market price or approximate market value based on current interest rates.
Forward foreign currency exchange contracts are marked-to-market based upon foreign currency exchange rates provided by a pricing service.
Futures and options on futures contracts are valued based upon the settlement price established each day by the board of trade or exchange on which they are traded.
Option contracts are valued at the mean of the latest quoted bid and asked prices on their primary exchanges. Option contracts, including over-the-counter (OTC) option contracts, with no readily available market value are valued using quotations obtained from independent brokers as of the close of the NYSE.
Swap transactions are valued through an independent pricing service or broker, or if neither is available, through an internal model based upon observable inputs.
Investments for which market quotations are not readily available, or that have quotations which management believes are not reliable, are valued at fair value as determined in good faith under consistently applied procedures established by and under the general supervision of the Board. If a security or class of securities (such as foreign securities) is valued at fair value, such value is likely to be different from the last quoted market price for the security. The determination of fair value often requires significant judgment. To determine fair value, management may use assumptions including but not limited to future cash flows and estimated risk premiums. Multiple inputs from various sources may be used to determine fair value.
Foreign Currency Transactions and Translation
The values of all assets and liabilities denominated in foreign currencies are translated into U.S. dollars at that day's exchange rates. Net realized and unrealized gains (losses) on foreign currency transactions and translations include gains (losses) arising from the fluctuation in exchange rates between trade and settlement dates on securities transactions, gains (losses) arising from the disposition of foreign currency and currency gains (losses) between the accrual and payment dates on dividends, interest income and foreign withholding taxes.
For financial statement purposes, the Fund does not distinguish that portion of gains (losses) on investments which is due to changes in foreign exchange rates from that which is due to changes in market prices of the investments. Such fluctuations are included with the net realized and unrealized gains (losses) on investments in the Statement of Operations.
Derivative Instruments
The Fund invests in certain derivative instruments, as detailed below, to meet its investment objectives. Derivatives are instruments whose values depend on, or are derived from, in whole or in part, the value of one or more other assets, such as securities, currencies, commodities or indices. Derivative instruments may be used to maintain cash reserves while maintaining exposure to certain other assets, to offset anticipated declines in values of investments, to facilitate trading, to reduce transaction costs and to pursue higher investment returns. The Fund may also use derivative instruments to mitigate certain investment risks, such as foreign currency exchange rate risk, interest rate risk and credit risk. Derivatives may involve various risks, including the potential inability of the counterparty to fulfill its obligation under the terms of the contract, the potential for an
Annual Report 2012
58
Columbia Strategic Income Fund
Notes to Financial Statements (continued)
May 31, 2012
illiquid secondary market and the potential for market movements which may expose the Fund to gains or losses in excess of the amount shown in the Statement of Assets and Liabilities.
The Fund and any counterparty are required to maintain an agreement that requires the Fund and that counterparty to monitor (on a daily basis) the net fair value of all derivatives entered into pursuant to the agreement between the Fund and such counterparty. If the net fair value of such derivatives between the Fund and that counterparty exceeds a certain threshold (as defined in the agreement), the Fund or the counterparty (as the case may be) is required to post cash and/or securities as collateral. Fair values of derivatives presented in the financial statements are not netted with the fair value of other derivatives or with any collateral amounts posted by the Fund or any counterparty.
Forward Foreign Currency Exchange Contracts
Forward foreign currency exchange contracts are agreements between two parties to buy and sell a currency at a set price on a future date. These contracts are intended to be used to minimize the exposure to foreign exchange rate fluctuations during the period between the trade and settlement dates of the contract. The Fund utilized forward foreign currency exchange contracts to hedge the currency exposure associated with some or all of the Fund's securities, to shift foreign currency exposure back to U.S. dollars and to shift investment exposure from one currency to another.
The values of forward foreign currency exchange contracts fluctuate with changes in foreign currency exchange rates. The Fund will record a realized gain or loss when the forward foreign currency exchange contract is closed.
The use of forward foreign currency exchange contracts does not eliminate fluctuations in the prices of the Fund's portfolio securities. The risks of forward foreign currency exchange contracts include movement in the values of the foreign currencies relative to the U.S. dollar (or other foreign currencies) and the possibility that counterparties will not complete their contractual obligations, which may be in excess of the amount reflected, if any, in the Statement of Assets and Liabilities.
Futures Contracts
Futures contracts represent commitments for the future purchase or sale of an asset at a specified price on a specified date. The Fund bought and sold futures contracts to manage the duration and yield curve exposure of the Fund versus the benchmark. Upon entering into futures contracts, the Fund bears risks which may include interest rates, exchange rates or securities prices moving unexpectedly, in which case, the Fund may not achieve the anticipated benefits of the futures contracts and may realize a loss. Additional risks include counterparty credit risk, the possibility of an illiquid market, and that a change in the value of the contract or option may not correlate with changes in the value of the underlying asset.
Upon entering into a futures contract, the Fund pledges cash or securities with the broker in an amount sufficient to meet the initial margin requirement. Subsequent payments (variation margin) are made or received by the Fund each day. The variation margin payments are equal to the daily change in the contract value and are recorded as variation margin receivable or payable and are offset in unrealized gains or losses. The Fund recognizes a realized gain or loss when the contract is closed or expires. Futures contracts involve, to varying degrees, risk of loss in excess of the variation margin disclosed in the Statement of Assets and Liabilities.
Options
Options are contracts which entitle the holder to purchase or sell securities or other identified assets at a specified price, or in the case of index option contracts, to receive or pay the difference between the index value and the strike price of the index option contract. The Fund purchased and wrote option contracts to manage the duration and yield curve exposure of the Fund versus the benchmark. Completion of transactions for option contracts traded in the OTC market depends upon the performance of the other party. Cash collateral may be collected or posted by the Fund to secure certain OTC option contract trades. Cash collateral held or posted by the Fund for such option contract trades must be returned to the counterparty or the Fund upon closure, exercise or expiration of the contract.
Option contracts purchased are recorded as investments and options contracts written are recorded as liabilities of the Fund. The Fund will realize a gain or loss when the option contract expires. When option contracts are exercised, the proceeds on sales for a written call or purchased put option contract, or the purchase cost for a written put or purchased call option contract, is adjusted by the amount of premium received or paid.
The risk in buying an option contract is that the Fund pays a premium whether or not the option contract is exercised. The Fund also has the additional risk of being unable to enter into a closing transaction if a liquid secondary market does not exist. The risk in writing a call option contract is that the Fund gives up the opportunity for profit if the market price of the security increases. The risk in writing a put option contract is that the Fund may incur a loss if the market price of the security decreases and the option contract is exercised. The Fund's maximum payout in the case of written put option
Annual Report 2012
59
Columbia Strategic Income Fund
Notes to Financial Statements (continued)
May 31, 2012
contracts represents the maximum potential amount of future payments (undiscounted) that the Fund could be required to make under the contract. For OTC options contracts, the transaction is also subject to counterparty credit risk. The maximum payout amount may be offset by the subsequent sale, if any, of assets obtained upon the exercise of the put option contracts by holders of the option contracts or proceeds received upon entering into the contracts.
Contracts and premiums associated with options contracts written for the year ended May 31, 2012 are as follows:
| | | Calls | |
| | | Contracts | | Premiums ($) | |
| Balance at May 31, 2011 | | | — | | | | — | | |
| Opened | | | 570 | | | | 986,180 | | |
| Expired | | | (570 | ) | | | (986,180 | ) | |
| Balance at May 31, 2012 | | | — | | | | — | | |
Credit Default Swap Contracts
Credit default swap contracts are agreements in which one party pays fixed periodic payments to a counterparty in consideration for a guarantee from the counterparty to make a specific payment should a specified negative credit event(s) take place. The Fund entered into credit default swap contracts to increase or decrease its credit exposure to a single issuer of debt securities.
As the purchaser of a credit default swap contract, the Fund purchases protection by paying a periodic interest rate on the notional amount to the counterparty. The interest amount is accrued daily as a component of unrealized appreciation (depreciation) and is recorded as a realized loss upon payment. If a credit event as specified in the contract occurs, the Fund may have the option either to deliver the reference obligation to the seller in exchange for a cash payment of its par amount, or to receive a net cash settlement equal to the par amount less an agreed-upon value of the reference obligation as of the date of the credit event. The difference between the value of the obligation or cash delivered and the notional amount received will be recorded as a realized gain (loss).
As the seller of a credit default swap contract, the Fund sells protection to a buyer and will generally receive a periodic interest rate on the notional amount. The interest amount is accrued daily as a component of unrealized appreciation (depreciation) and is recorded as a realized gain upon receipt of the payment. If a credit event as specified in the contract occurs, the Fund may either be required to accept the reference obligation from the buyer in exchange for a cash payment of its notional amount, or to pay the buyer a net cash settlement equal to the notional amount less an agreed-upon value of the reference obligation as of the date of the credit event. The difference between the value of the obligation or cash received and the notional amount paid will be recorded as a realized gain (loss). The maximum potential amount of undiscounted future payments the Fund could be required to make as the seller of protection under a credit default swap contract is equal to the notional amount of the reference obligation. Notional amounts of all credit default swap contracts outstanding for which the Fund is the seller of protection, if any, are disclosed in the Credit Default Swap Contracts Outstanding schedule following the Portfolio of Investments. These potential amounts may be partially offset by any recovery values of the respective reference obligations or premiums received upon entering into the agreement.
As a protection seller, the Fund bears the risk of loss from the credit events specified in the contract. Although specified events are contract specific, credit events are generally defined as bankruptcy, failure to pay, restructuring, obligation acceleration, obligation default, or repudiation/moratorium. For credit default swap contracts on credit indices, quoted market prices and resulting market values serve as an indicator of the current status of the payment/performance risk. Increasing market values, in absolute terms when compared to the notional amount of the swap, represent a deterioration of the reference entity's credit soundness and a greater likelihood or risk of default or other credit event occurring as defined under the terms of the contract. Market values for credit default swap contracts in which the Fund is the seller of protection, if any, are disclosed in the Credit Default Swap Contracts Outstanding schedule following the Portfolio of Investments.
The notional amounts and market values of credit default swap contracts are not recorded in the financial statements. Any premium paid or received by the Fund upon entering into a credit default swap contract is recorded as an asset or liability, respectively, and amortized daily as a component of realized gain (loss) in the Statement of Operations. Credit default swap contracts are valued daily, and the change in value is recorded as unrealized appreciation (depreciation) until the termination of the swap, at which time a realized gain (loss) is recorded.
Credit default swap contracts can involve greater risks than if a fund had invested in the reference obligation directly since, in addition to general market risks, credit default swaps are subject to counterparty credit risk, leverage risk, hedging risk, correlation risk and liquidity risk. The Fund will enter into credit default swap transactions only with counterparties that meet certain standards of creditworthiness.
Annual Report 2012
60
Columbia Strategic Income Fund
Notes to Financial Statements (continued)
May 31, 2012
Effects of Derivative Transactions in the Financial Statements
The following tables are intended to provide additional information about the effect of derivatives on the financial statements of the Fund, including: the fair value of derivatives by risk category and the location of those fair values in the Statement of Assets and Liabilities; the impact of derivative transactions on the Fund's operations over the period including realized gains or losses and unrealized gains or losses. The derivative schedules following the Portfolio of Investments present additional information regarding derivative instruments outstanding at the end of the period, if any.
The following table is a summary of the fair value of derivative instruments at May 31, 2012:
| | | Asset Derivatives | |
Risk Exposure
Category | | Statement of Assets and
Liabilities Location | | Fair Value ($) | |
Foreign exchange
contracts | | Unrealized appreciation on
forward foreign currency
exchange contracts | | | 2,533,616 | | |
Interest rate
contracts | | Net assets — unrealized
appreciation on futures
contracts | | | 688,914 | * | |
| Total | | | | | 3,222,530 | | |
| | | Liability Derivatives | |
Risk Exposure
Category | | Statement of Assets and
Liabilities Location | | Fair Value ($) | |
| Credit contracts | | Unrealized depreciation on
swap contracts | | | 93,194 | | |
Foreign exchange
contracts | | Unrealized depreciation on
forward foreign currency
exchange contracts | | | 1,464,216 | | |
Interest rate
contracts | | Net assets — unrealized
depreciation on futures
contracts | | | 2,373,779 | * | |
| Total | | | | | 3,931,189 | | |
*Includes cumulative appreciation (depreciation) of futures contracts as reported in the Futures Contracts Outstanding table following the Portfolio of Investments. Only the current day's variation margin is reported in receivables or payables in the Statement of Assets and Liabilities.
The effect of derivative instruments in the Statement of Operations for the year ended May 31, 2012:
| Amount of Realized Gain (Loss) on Derivatives Recognized in Income | |
Risk Exposure
Category | | Forward Foreign
Currency Exchange
Contracts ($) | | Futures
Contracts ($) | | Options Contracts
Written and
Purchased ($) | | Swap
Contracts ($) | | Total ($) | |
| Credit contracts | | | — | | | | — | | | | — | | | | (149,042 | ) | | | (149,042 | ) | |
| Foreign exchange contracts | | | 2,394,851 | | | | — | | | | — | | | | — | | | | 2,394,851 | | |
| Interest rate contracts | | | — | | | | (21,885,053 | ) | | | 1,367,495 | | | | — | | | | (20,517,558 | ) | |
| Total | | | 2,394,851 | | | | (21,885,053 | ) | | | 1,367,495 | | | | (149,042 | ) | | | (18,271,749 | ) | |
| Change in Unrealized Appreciation (Depreciation) on Derivatives Recognized in Income | |
Risk Exposure
Category | | Forward Foreign
Currency Exchange
Contracts ($) | | Futures
Contracts ($) | | Options Contracts
Written and
Purchased ($) | | Swap
Contracts ($) | | Total ($) | |
| Credit contracts | | | — | | | | — | | | | — | | | | 151,791 | | | | 151,791 | | |
| Foreign exchange contracts | | | (879,748 | ) | | | — | | | | — | | | | — | | | | (879,748 | ) | |
| Interest rate contracts | | | — | | | | (1,725,754 | ) | | | (49,438 | ) | | | — | | | | (1,775,192 | ) | |
| Total | | | (879,748 | ) | | | (1,725,754 | ) | | | (49,438 | ) | | | 151,791 | | | | (2,503,149 | ) | |
Annual Report 2012
61
Columbia Strategic Income Fund
Notes to Financial Statements (continued)
May 31, 2012
The following table is a summary of the volume of derivative instruments for the year ended May 31, 2012:
| Derivative Instrument | | Contracts Opened | |
| Forward Foreign Currency Exchange Contracts | | | 274 | | |
| Futures Contracts | | | 15,829 | | |
| Options Contracts | | | 7,534 | | |
| Swap Contracts | | | — | | |
| Derivative Instrument | | Aggregate Notional
Opened ($) | |
| Credit Default Swap Contracts — Buy Protection | | | — | | |
Repurchase Agreements
The Fund may engage in repurchase agreement transactions with institutions that management has determined are creditworthy. The Fund, through the custodian, receives delivery of the underlying securities collateralizing a repurchase agreement. Management is responsible for determining that the collateral is at least equal, at all times, to the value of the repurchase obligation including interest. A repurchase agreement transaction involves certain risks in the event of default or insolvency of the counterparty. These risks include possible delays in or restrictions on a Fund's ability to dispose of the underlying securities and a possible decline in the value of the underlying securities during the period while the Fund seeks to assert its rights.
Delayed Delivery Securities
The Fund may trade securities on other than normal settlement terms, including securities purchased or sold on a "when-issued" basis. This may increase the risk if the other party to the transaction fails to deliver and causes the Fund to subsequently invest at less advantageous prices. The Fund designates cash or liquid securities in an amount equal to the delayed delivery commitment.
Mortgage Dollar Roll Transactions
The Fund may enter into mortgage "dollar rolls" in which the Fund sells securities for delivery in the current month and simultaneously contracts with the same counterparty to repurchase similar (same type, coupon and maturity) but not identical securities on a specified future date not exceeding 120 days. During the roll period, the Fund loses the right to receive principal and interest paid on the securities sold. However, the Fund will benefit because it receives negotiated amounts in the form of reductions of the purchase price for the future purchase plus the interest earned on the cash proceeds of the securities sold until the settlement date of the forward purchase. The Fund records the incremental difference between the forward purchase and sale of each forward roll as a realized gain or loss. Unless any realized gains exceed the income, capital appreciation, and gain or loss due to mortgage prepayments that would have been realized on the securities sold as part of the mortgage dollar roll, the use of this technique will diminish the investment performance of the Fund compared to what the performance would have been without the use of mortgage dollar rolls. All cash proceeds will be invested in instruments that are permissible investments for the Fund. The Fund identifies within its Portfolio of Investments cash or liquid securities in an amount equal to the forward purchase price.
For financial reporting and tax purposes, the Fund treats "to be announced" mortgage dollar rolls as two separate transactions, one involving the purchase of a security and a separate transaction involving a sale. This treatment may exaggerate the Fund's portfolio turnover rate. The Fund does not currently enter into mortgage dollar rolls that are accounted for as financing transactions.
Mortgage dollar rolls involve certain risks. If the broker-dealer to whom the Fund sells the securities becomes insolvent, the Fund's right to purchase or repurchase the mortgage-related securities may be restricted and the instruments which the Fund is required to repurchase may be worth less than instruments which the Fund originally held. Successful use of mortgage dollar rolls may depend upon the Investment Manager's ability to predict interest rates and mortgage prepayments. For these reasons, there is no assurance that mortgage dollar rolls can be successfully employed.
Treasury Inflation Protected Securities
The Fund may invest in treasury inflation protected securities (TIPS). The principal amount of TIPS is adjusted periodically and is increased for inflation or decreased for deflation based on a monthly published index. Interest payments are based on the adjusted principal at the time the interest is paid. These adjustments are recorded as interest income in the Statement of Operations.
Loan Participations and Commitments
The Fund may invest in loan participations. When the Fund purchases a loan participation, the Fund typically enters into a contractual relationship with the lender or third party selling such participation (Selling Participant), but not the borrower. However, the Fund assumes the credit risk of the borrower, Selling Participant and any other persons interpositioned between the Fund and the borrower. The Fund may not directly benefit from the collateral supporting the senior loan which it has purchased from the Selling Participant.
Annual Report 2012
62
Columbia Strategic Income Fund
Notes to Financial Statements (continued)
May 31, 2012
Stripped Securities
The Fund may invest in Interest Only (IO) and Principal Only (PO) stripped mortgage-backed securities. These securities are derivative multi-class mortgage securities structured so that one class receives most, if not all, of the principal from the underlying mortgage assets, while the other class receives most, if not all, of the interest and the remainder of the principal. If the underlying mortgage assets experience greater than anticipated prepayments of principal, the Fund may fail to fully recoup its initial investment in an IO security, therefore the daily interest accrual factor is adjusted each month to reflect the paydown of principal. The market value of these securities can be extremely volatile in response to changes in interest rates. Credit risk reflects the risk that the Fund may not receive all or part of its principal because the issuer or credit enhancer has defaulted on its obligation.
Security Transactions
Security transactions are accounted for on the trade date. Cost is determined and gains (losses) are based upon the specific identification method for both financial statement and federal income tax purposes.
Income Recognition
Interest income is recorded on an accrual basis. Market premium and discount are amortized and accreted, respectively, on all debt securities, unless otherwise noted. Original issue discount is accreted to interest income over the life of the security with a corresponding increase in the cost basis, if any.
Corporate actions and dividend income are recorded net of any non-reclaimable tax withholdings, on the ex-dividend date or upon receipt of ex-dividend notification in the case of certain foreign securities.
The value of additional securities received as an income payment is recorded as income and increases the cost basis of such securities.
Expenses
General expenses of the Trust are allocated to the Fund and other funds of the Trust based upon relative net assets or other expense allocation methodologies determined by the nature of the expense. Expenses directly attributable to the Fund are charged to the Fund. Expenses directly attributable to a specific class of shares are charged to that share class.
Determination of Class Net Asset Value
All income, expenses (other than class-specific expenses, which are charged to that share class, as shown in the Statement of Operations) and realized and unrealized gains (losses) are allocated to each class of the Fund on a daily basis, based on the relative net assets of each class, for purposes of determining the net asset value of each class.
Federal Income Tax Status
The Fund intends to qualify each year as a regulated investment company under Subchapter M of the Internal Revenue Code, as amended, and will distribute substantially all of its taxable income (including net short-term capital gains), if any, for its tax year, and as such will not be subject to federal income taxes. In addition, the Fund intends to distribute in each calendar year substantially all of its net investment income, capital gains and certain other amounts, if any, such that the Fund should not be subject to federal excise tax. Therefore, no federal income or excise tax provision is recorded.
Foreign Taxes
The Fund may be subject to foreign taxes on income, gains on investments or currency repatriation, a portion of which may be recoverable. The Fund will accrue such taxes and recoveries, as applicable, based upon its current interpretation of tax rules and regulations that exist in the markets in which it invests.
Realized gains in certain countries may be subject to foreign taxes at the Fund level, based on statutory rates. The Fund accrues for such foreign taxes on net realized and unrealized gains at the appropriate rate for each jurisdiction, as applicable.
Distributions to Shareholders
Distributions from net investment income, if any, are declared and paid monthly. Net realized capital gains, if any, are distributed along with the income dividend. Income distributions and capital gain distributions are determined in accordance with federal income tax regulations, which may differ from GAAP.
Guarantees and Indemnifications
Under the Trust's organizational documents and, in some cases, by contract, its officers and trustees are indemnified against certain liabilities arising out of the performance of their duties to the Trust or its funds. In addition, certain of the Fund's contracts with its service providers contain general indemnification clauses. The Fund's maximum exposure under these arrangements is unknown since the amount of any future claims that may be made against the Fund cannot be determined, and the Fund has no historical basis for predicting the likelihood of any such claims.
Annual Report 2012
63
Columbia Strategic Income Fund
Notes to Financial Statements (continued)
May 31, 2012
Recent Accounting Pronouncement
Fair Value Measurements
In May 2011, the Financial Accounting Standards Board (FASB) issued ASU No. 2011-04 modifying Topic 820, Fair Value Measurements. At the same time, the International Accounting Standards Board (IASB) issued International Financial Reporting Standard 13, Fair Value Measurement. The objective of the FASB and IASB is the convergence of their guidance on fair value measurements and disclosures.
Specifically, ASU No. 2011-04 requires reporting entities to disclose: i) the amounts of any transfers between Level 1 and Level 2, and the reasons for the transfers, ii) for Level 3 fair value measurements, a) quantitative information about significant unobservable inputs used, b) a description of the valuation processes used by the reporting entity and c) a narrative description of the sensitivity of the fair value measurement to changes in unobservable inputs if a change in those inputs might result in a significantly higher or lower fair value measurement. The effective date of ASU No. 2011-04 is for interim and annual periods beginning after December 15, 2011. At this time, management is evaluating the implications of this guidance and the impact it will have on the financial statement amounts and footnote disclosures, if any.
Note 3. Fees and Compensation Paid to Affiliates
Investment Management Fees
Under an Investment Management Services Agreement, Columbia Management Investment Advisers, LLC (the Investment Manager), a wholly-owned subsidiary of Ameriprise Financial, Inc. (Ameriprise Financial), determines which securities will be purchased, held or sold. The management fee is an annual fee that is equal to a percentage of the Fund's average daily net assets that declines from 0.530% to 0.353% as the Fund's net assets increase. The effective management fee rate for the year ended May 31, 2012, was 0.52% of the Fund's average daily net assets.
Administration Fees
Under an Administrative Services Agreement, the Investment Manager serves as the Fund Administrator. The Fund pays the Fund Administrator an annual fee for administration and accounting services equal to a percentage of the Fund's average daily net assets that declines from 0.07% to 0.04% as the Fund's net assets increase. The effective administration fee rate for the year ended May 31, 2012, was 0.06% of the Fund's average daily net assets.
Compensation of Board Members
Board members are compensated for their services to the Fund as disclosed in the Statement of Operations. The Trust's eligible Trustees may participate in a Deferred Compensation Plan (the Plan) which may be terminated at any time. Obligations of the Plan will be paid solely out of the Fund's assets.
Compensation of Chief Compliance Officer
The Board has appointed a Chief Compliance Officer to the Fund in accordance with federal securities regulations. The Fund pays its pro-rata share of the expenses associated with the Chief Compliance Officer. The Fund's expenses for the Chief Compliance Officer will not exceed $15,000 per year.
Transfer Agent Fees
Under a Transfer and Dividend Disbursing Agent Agreement, Columbia Management Investment Services Corp. (the Transfer Agent), an affiliate of the Investment Manager and a wholly-owned subsidiary of Ameriprise Financial, is responsible for providing transfer agency services to the Fund. The Transfer Agent has contracted with Boston Financial Data Services (BFDS) to serve as sub-transfer agent.
The Transfer Agent receives monthly account-based service fees based on the number of open accounts and is reimbursed by the Fund for the fees and expenses the Transfer Agent pays to financial intermediaries that maintain omnibus accounts with the Fund that is a percentage of the average aggregate value of the Fund's shares maintained in each such omnibus account (other than omnibus accounts for which American Enterprise Investment Services Inc. is the broker of record or accounts where the beneficial shareholder is a customer of Ameriprise Financial Services, Inc., which are paid a per account fee). The Transfer Agent pays the fees of BFDS for services as sub-transfer agent and is not entitled to reimbursement for such fees from the Fund (with the exception of out-of-pocket fees).
The Transfer Agent also receives compensation from fees for various shareholder services and reimbursements for certain out-of-pocket fees. Total transfer agent fees for Class R4 and Class R5 shares are subject to an annual limitation of not more than 0.05% of the average daily net assets attributable to each share class.
Annual Report 2012
64
Columbia Strategic Income Fund
Notes to Financial Statements (continued)
May 31, 2012
For the year ended May 31, 2012, the Fund's effective transfer agent fee rates as a percentage of average daily net assets of each class were as follows:
| Class A | | | 0.16 | % | |
| Class B | | | 0.17 | | |
| Class C | | | 0.16 | | |
| Class R | | | 0.17 | | |
| Class R4 | | | 0.03 | | |
| Class R5 | | | 0.03 | | |
| Class W | | | 0.18 | | |
| Class Z | | | 0.16 | | |
An annual minimum account balance fee of $20 may apply to certain accounts with a value below the Fund's initial minimum investment requirements to reduce the impact of small accounts on transfer agent fees. These minimum account balance fees are recorded as part of expense reductions in the Statement of Operations. For the year ended May 31, 2012, these minimum account balance fees reduced total expenses by $8,823.
Plan Administration Fees
Under a Plan Administration Services Agreement with the Transfer Agent, the Fund pays an annual fee at a rate of 0.25% of the Fund's average daily net assets attributable to Class R4 shares for the provision of various administrative, recordkeeping, communication and educational services.
Distribution and Service Fees
The Fund has an agreement with Columbia Management Investment Distributors, Inc. (the Distributor), an affiliate of the Investment Manager and a wholly-owned subsidiary of Ameriprise Financial, for distribution and shareholder services. Pursuant to Rule 12b-1 under the 1940 Act, the Board has approved, and the Fund has adopted, distribution and shareholder service plans (the Plans) which set the distribution and service fees for the Fund. These fees are calculated daily and are intended to compensate the Distributor and/or eligible selling and/or servicing agents for selling shares of the Fund and providing services to investors.
Effective July 1, 2011, the Plans require the payment of a monthly service fee to the Distributor equal to 0.25% annually of the average daily net assets attributable to Class A, Class B, Class C and Class W shares of the Fund. Prior to July 1, 2011, the Fund paid a monthly service fee which was equal to 0.15% annually of the average daily net assets attributable to outstanding Class A and Class B shares of the Fund issued prior to January 1, 1993 and 0.25% annually of the average daily net assets attributable to outstanding Class A, Class B, Class C and Class W shares issued thereafter. The arrangement resulted in an annual rate of service fee for shares that was a blend between the 0.15% and 0.25% rates. For the year ended May 31, 2012, the Fund's effective service fee rate was 0.25% of the Fund's average daily net assets attributable to Class A, Class B, Class C and Class W shares.
The Plans also require the payment of a monthly distribution fee to the Distributor at the maximum annual rates of 0.75%, 0.75%, 0.50% and 0.25% of the of the average daily net assets attributable to Class B, Class C, Class R and Class W shares, respectively.
The Distributor has voluntarily agreed to waive a portion of the distribution fee for Class C shares so that the combined distribution and service fee does not exceed 0.85% annually of the average daily net assets attributable to Class C shares. This arrangement may be modified or terminated by the Distributor at any time.
The Fund may pay a distribution fee of up to 0.25% of the Fund's average daily net assets attributable to Class W shares and a service fee of up to 0.25% of the Fund's average daily net assets attributable to Class W shares, provided, however, that the aggregate fee shall not exceed 0.25% of the Fund's average daily net assets attributable to Class W shares.
Sales Charges
Sales charges, including front-end charges and CDSCs, received by the Distributor for distributing Fund shares were $1,735,829 for Class A, $39,178 for Class B and $15,293 for Class C shares for the year ended May 31, 2012.
Expenses Waived/Reimbursed by the Investment Manager and its Affiliates
The Investment Manager and certain of its affiliates have contractually agreed to waive fees and/or reimburse expenses (excluding certain fees and expenses described below), through September 30, 2012, unless sooner terminated at the sole discretion of the Board, so that the Fund's net operating expenses, after giving effect to fees waived/expenses reimbursed and/or overdraft charges from the Fund's custodian, do not exceed the following annual rates as a percentage of the class' average daily net assets:
| Class A | | | 1.02 | % | |
| Class B | | | 1.77 | | |
| Class C | | | 1.77 | | |
| Class R | | | 1.27 | | |
| Class R4 | | | 0.97 | | |
| Class R5 | | | 0.72 | | |
| Class W | | | 1.02 | | |
| Class Z | | | 0.77 | | |
Annual Report 2012
65
Columbia Strategic Income Fund
Notes to Financial Statements (continued)
May 31, 2012
Under the agreement, the following fees and expenses, are excluded from the waiver/reimbursement commitment, and therefore will be paid by the Fund, if applicable: taxes (including foreign transaction taxes), expenses associated with investments in affiliated and non-affiliated pooled investment vehicles (including mutual funds and exchange traded funds), transaction costs and brokerage commissions, costs related to any securities lending program, dividend expenses associated with securities sold short, inverse floater program fees and expenses, transaction charges and interest on borrowed money, interest, extraordinary expenses and any other expenses the exclusion of which is specifically approved by the Board. This agreement may be modified or amended only with approval from all parties. Class C distribution fees waived by the Distributor, as discussed above, are in addition to the waiver/reimbursement commitment under the agreement.
Note 4. Federal Tax Information
The timing and character of income and capital gain distributions are determined in accordance with income tax regulations, which may differ from GAAP because of temporary or permanent book to tax differences.
At May 31, 2012, these differences are primarily due to differing treatment for deferral/reversal of wash sale losses, Trustees' deferred compensation, capital loss carryforwards, foreign capital gains tax, foreign currency transactions, market discount/premium, paydown reclassifications, recognition of unrealized appreciation (depreciation) for certain derivative investments and tax straddles. To the extent these differences are permanent, reclassifications are made among the components of the Fund's net assets in the Statement of Assets and Liabilities. Temporary differences do not require reclassifications. In the Statement of Assets and Liabilities the following reclassifications were made:
| Undistributed net investment income | | $ | 8,186,932 | | |
| Accumulated net realized loss | | | (7,781,307 | ) | |
| Paid-in capital | | | (405,625 | ) | |
Net investment income and net realized gains (losses), as disclosed in the Statement of Operations, and net assets were not affected by this reclassification.
The tax character of distributions paid during the years indicated was as follows:
| Year Ended May 31, | | 2012 | | 2011 | |
| Ordinary income | | $ | 118,075,599 | | | $ | 137,189,575 | | |
| Long-term capital gains | | | — | | | | — | | |
Short-term capital gain distributions, if any, are considered ordinary income distributions for tax purposes.
At May 31, 2012, the components of distributable earnings on a tax basis were as follows:
| Undistributed ordinary income | | $ | 6,720,163 | | |
| Undistributed accumulated long-term gain | | | — | | |
| Unrealized appreciation | | | 84,478,179 | | |
At May 31, 2012, the cost of investments for federal income tax purposes was $2,872,790,600 and the aggregate gross unrealized appreciation and depreciation based on that cost was:
| Unrealized appreciation | | $ | 114,504,218 | | |
| Unrealized depreciation | | | (30,026,039 | ) | |
| Net unrealized appreciation | | $ | 84,478,179 | | |
The following capital loss carryforward, determined at May 31, 2012, may be available to reduce taxable income arising from future net realized gains on investments, if any, to the extent permitted by the Internal Revenue Code:
| Year of Expiration | | Amount | |
| 2018 | | $ | 26,548,320 | | |
For the year ended May 31, 2012, $16,667,140 of capital loss carryforward was utilized.
Management of the Fund has concluded that there are no significant uncertain tax positions that would require recognition in the financial statements. However, management's conclusion may be subject to review and adjustment at a later date based on factors including, but not limited to, new tax laws, regulations, and administrative interpretations (including relevant court decisions). Generally, the Fund's federal tax returns for the prior three fiscal years remain subject to examination by the Internal Revenue Service.
Note 5. Portfolio Information
The cost of purchases and proceeds from sales of securities, excluding short-term obligations, aggregated to $1,987,059,664 and $1,835,147,357, respectively, for the year ended May 31, 2012, of which $1,177,861,658 and $1,023,812,446, respectively, were U.S. government securities.
Note 6. Lending of Portfolio Securities
The Fund has entered into a Master Securities Lending Agreement (the Agreement) with JPMorgan Chase Bank, N.A. (JPMorgan). The Agreement authorizes JPMorgan as lending agent to lend securities to authorized borrowers in order to generate additional income on behalf of the Fund. Pursuant to the Agreement, the securities loaned are secured by cash or securities that either are issued or guaranteed as to principal and interest by the U.S. government, its agencies, authorities or instrumentalities with value equal to at least 100% of the market value of the loaned securities. Any
Annual Report 2012
66
Columbia Strategic Income Fund
Notes to Financial Statements (continued)
May 31, 2012
additional collateral required to maintain those levels due to market fluctuations of the loaned securities is requested to be delivered the following business day. Cash collateral received is invested by the lending agent on behalf of the Fund into authorized investments pursuant to the Agreement. The investments made with the cash collateral are listed in the Portfolio of Investments. The values of such investments and any uninvested cash collateral are disclosed in the Statement of Assets and Liabilities along with the related obligation to return the collateral upon the return of the securities loaned.
Risks of delay in recovery of securities or even loss of rights in the securities may occur should the borrower of the securities fail financially. Risks may also arise to the extent that the value of the securities loaned increases above the value of the collateral received. JPMorgan will indemnify the Fund from losses resulting from a borrower's failure to return a loaned security when due. Such indemnification does not extend to losses associated with declines in the value of cash collateral investments. The Investment Manager is not responsible for any losses incurred by the Fund in connection with the securities lending program. Loans are subject to termination by the Fund or the borrower at any time, and are, therefore, not considered to be illiquid investments.
Pursuant to the Agreement, the Fund receives income for lending its securities either in the form of fees or by earning interest on invested cash collateral, net of negotiated rebates paid to borrowers and fees paid to the lending agent for services provided and any other securities lending expenses. Net income earned from securities lending for the year ended May 31, 2012 is disclosed in the Statement of Operations. The Fund continues to earn and accrue interest and dividends on the securities loaned.
At May 31, 2012, securities valued at $427,484,121 were on loan, secured by U.S. government and agency securities valued at $46,519,634 and by cash collateral of $391,874,113 (which does not reflect calls for collateral made to borrowers by JPMorgan at period end) that is partially or fully invested in short-term securities or other cash equivalents.
Note 7. Affiliated Money Market Fund
The Fund may invest its daily cash balances in Columbia Short-Term Cash Fund, an affiliated money market fund established for the exclusive use by the Fund and other affiliated funds. The income earned by the Fund from such investments is included as "Dividends from affiliates" in the Statement of Operations. As an investing fund, the Fund indirectly bears its proportionate share of the expenses of Columbia Short-Term Cash Fund.
Note 8. Shareholder Concentration
At May 31, 2012, two unaffiliated shareholder accounts owned an aggregate of 54.1% of the outstanding shares of the Fund. The Fund has no knowledge about whether any portion of those shares was owned beneficially by such accounts. Subscription and redemption activity by concentrated accounts may have a significant effect on the operations of the Fund.
Note 9. Line of Credit
The Fund has entered into a revolving credit facility with a syndicate of banks led by JPMorgan whereby the Fund may borrow for the temporary funding of shareholder redemptions or for other temporary or emergency purposes. The credit facility agreement, as amended, which is a collective agreement between the Fund and certain other funds managed by the Investment Manager, severally and not jointly, permits collective borrowings up to $500 million. Pursuant to a December 13, 2011 amendment to the credit facility agreement, interest is charged to each participating fund based on its borrowings at a rate equal to the higher of (i) the overnight federal funds rate plus 1.00% or (ii) the one-month LIBOR rate plus 1.00%. Each borrowing under the credit facility matures no later than 60 days after the date of borrowing. The Fund also pays a commitment fee equal to its pro rata share of the amount of the credit facility at a rate of 0.08% per annum.
Prior to December 13, 2011, interest was charged to each participating fund based on its borrowings at a rate equal to the sum of the federal funds rate plus (i) 1.25% per annum plus (ii) if one-month LIBOR exceeds the federal funds rate, the amount of such excess. The Fund also paid a commitment fee equal to its pro rata share of the amount of the credit facility at a rate of 0.10% per annum.
The Fund had no borrowings during the year ended May 31, 2012.
Note 10. Fund Merger
At the close of business on June 3, 2011, the Fund acquired the assets and assumed the identified liabilities of RiverSource Strategic Income Allocation Fund, a series of RiverSource Strategic Allocation Series, Inc. The reorganization was completed after shareholders of RiverSource Strategic Income Allocation Fund approved the plan on February 15, 2011. The purpose of the transaction was to combine two funds managed by the Investment Manager with comparable investment objectives and strategies.
The aggregate net assets of the Fund immediately before the acquisition were $1,863,662,877 and the combined net assets immediately after the acquisition were $2,217,480,688.
Annual Report 2012
67
Columbia Strategic Income Fund
Notes to Financial Statements (continued)
May 31, 2012
The merger was accomplished by a tax-free exchange of 35,698,301 shares of RiverSource Strategic Income Allocation Fund valued at $353,817,811 (including $21,440,497 of unrealized appreciation).
In exchange for RiverSource Strategic Income Allocation Fund shares, the Fund issued the following number of shares:
| | | Shares | |
| Class A | | | 50,379,122 | | |
| Class B | | | 3,427,244 | | |
| Class C | | | 3,538,608 | | |
| Class R | | | 859 | | |
| Class R4 | | | 36,339 | | |
| Class R5 | | | 45,399 | | |
For financial reporting purposes, net assets received and shares issued by the Fund were recorded at fair value; however, RiverSource Strategic Income Allocation Fund's cost of investments was carried forward
The financial statements reflect the operations of the Fund for the period prior to the merger and the combined fund for the period subsequent to the merger. Because the combined investment portfolios have been managed as a single integrated portfolio since the merger was completed, it is not practicable to separate the amounts of revenue and earnings of RiverSource Strategic Income Allocation Fund that have been included in the combined Fund's Statement of Operations since the merger was completed.
Assuming the merger had been completed on June 1, 2011 the Fund's pro-forma net investment income, net gain on investments, net change in unrealized appreciation (depreciation) and net increase in net assets from operations for the year ended May 31, 2012 would have been approximately $111.5 million, $24.3 million, $(37.4) million and $98.3 million, respectively.
Note 11. Significant Risks
Foreign Securities Risk
Investing in foreign securities may include certain risks and considerations not typically associated with investing in U.S. securities, such as fluctuating currency values and changing local and regional economic, political and social conditions, which may result in greater market volatility. In addition, certain foreign securities may not be as liquid as U.S. securities. Investing in emerging markets may accentuate these risks.
Investments in emerging market countries are subject to additional risk. The risk of foreign investments is typically increased in less developed countries. These countries are also more likely to experience high levels of inflation, deflation or currency devaluation which could hurt their economies and securities markets.
High Yield Securities Risk
Investing in high-yield fixed income securities may involve greater credit risk and considerations not typically associated with investing in U.S. Government bonds and other higher quality fixed income securities. These securities are non-investment grade securities, often referred to as "junk" bonds. Economic downturns may disrupt the high yield market and impair the ability of issuers to repay principal and interest. Also, an increase in interest rates would likely have an adverse impact on the value of such obligations. Moreover, high-yield securities may be less liquid to the extent that there is no established secondary market.
Note 12. Subsequent Events
Management has evaluated the events and transactions that have occurred through the date the financial statements were issued. Other than as noted below, there were no items requiring adjustment of the financial statements or additional disclosure.
On June 6, 2012, the Board approved a change in the Fund's fiscal year end from May 31 to October 31. The change will be effective on October 31, 2012.
Note 13. Information Regarding Pending and Settled Legal Proceedings
In December 2005, without admitting or denying the allegations, American Express Financial Corporation (AEFC, which is now known as Ameriprise Financial, Inc. (Ameriprise Financial)) entered into settlement agreements with the Securities and Exchange Commission (SEC) and Minnesota Department of Commerce (MDOC) related to market timing activities. As a result, AEFC was censured and ordered to cease and desist from committing or causing any violations of certain provisions of the Investment Advisers Act of 1940, the Investment Company Act of 1940, and various Minnesota laws. AEFC agreed to pay disgorgement of $10 million and civil money penalties of $7 million. AEFC also agreed to retain an independent distribution consultant to assist in developing a plan for distribution of all disgorgement and civil penalties ordered by the SEC in accordance with various undertakings detailed at www.sec.gov/litigation/admin/ia-2451.pdf. Ameriprise Financial and its affiliates have cooperated with the SEC and the MDOC in these legal proceedings, and have made regular reports to the funds' Boards of Trustees.
Ameriprise Financial and certain of its affiliates have historically been involved in a number of legal, arbitration and
Annual Report 2012
68
Columbia Strategic Income Fund
Notes to Financial Statements (continued)
May 31, 2012
regulatory proceedings, including routine litigation, class actions, and governmental actions, concerning matters arising in connection with the conduct of their business activities. Ameriprise Financial believes that the Funds are not currently the subject of, and that neither Ameriprise Financial nor any of its affiliates are the subject of, any pending legal, arbitration or regulatory proceedings that are likely to have a material adverse effect on the Funds or the ability of Ameriprise Financial or its affiliates to perform under their contracts with the Funds. Ameriprise Financial is required to make 10-Q, 10-K and, as necessary, 8-K filings with the Securities and Exchange Commission on legal and regulatory matters that relate to Ameriprise Financial and its affiliates. Copies of these filings may be obtained by accessing the SEC website at www.sec.gov.
There can be no assurance that these matters, or the adverse publicity associated with them, will not result in increased fund redemptions, reduced sale of fund shares or other adverse consequences to the Funds. Further, although we believe proceedings are not likely to have a material adverse effect on the Funds or the ability of Ameriprise Financial or its affiliates to perform under their contracts with the Funds, these proceedings are subject to uncertainties and, as such, we are unable to estimate the possible loss or range of loss that may result. An adverse outcome in one or more of these proceedings could result in adverse judgments, settlements, fines, penalties or other relief that could have a material adverse effect on the consolidated financial condition or results of operations of Ameriprise Financial.
Annual Report 2012
69
Columbia Strategic Income Fund
Report of Independent Registered Public Accounting Firm
To the Trustees of Columbia Funds Series Trust I and
the Shareholders of Columbia Strategic Income Fund
In our opinion, the accompanying statement of assets and liabilities, including the portfolio of investments, and the related statements of operations and of changes in net assets and the financial highlights present fairly, in all material respects, the financial position of Columbia Strategic Income Fund (the "Fund") (a series of Columbia Funds Series Trust I) at May 31, 2012, the results of its operations for the year then ended, the changes in its net assets for each of the two years in the period then ended and the financial highlights for each of the periods indicated, in conformity with accounting principles generally accepted in the United States of America. These financial statements and financial highlights (hereafter referred to as "financial statements") are the responsibility of the Fund's management. Our responsibility is to express an opinion on these financial statements based on our audits. We conducted our audits of these financial statements in accordance with the standards of the Public Company Accounting Oversight Board (United States). Those standards require that we plan and perform the audit to obtain reasonable assurance about whether the financial statements are free of material misstatement. An audit includes examining, on a test basis, evidence supporting the amounts and disclosures in the financial statements, assessing the accounting principles used and significant estimates made by management, and evaluating the overall financial statement presentation. We believe that our audits, which included confirmation of securities at May 31, 2012 by correspondence with the custodian, brokers, agent banks and transfer agent, provide a reasonable basis for our opinion.
PricewaterhouseCoopers LLP
Minneapolis, Minnesota
July 20, 2012
Annual Report 2012
70
Columbia Strategic Income Fund
Board Members and Officers
The Trustees serve terms of indefinite duration. The names, addresses and birth years of the Trustees and Officers of the Funds in Columbia Funds Series Trust I, the year each was first elected or appointed to office, their principal business occupations during at least the last five years, the number of Funds overseen by each Trustee and other directorships they hold are shown below. Each officer listed below serves as an officer of each Fund in Columbia Funds Series Trust I.
Independent Trustees
Name, Address and Year of Birth,
Position with Funds, Year First
Elected or Appointed to Office | | Principal Occupation(s) During Past Five Years, Number of Funds in Columbia
Funds Complex Overseen by Trustee, Other Directorships Held
| |
Rodman L. Drake (Born 1943)
c/o Columbia Management Investment Advisers, LLC
225 Franklin Street
Boston, MA 02110
Trustee (since 1994) and
Chairman of the Board (since 2009) | | Independent consultant since 2010; Co-Founder of Baringo Capital LLC (private equity) from 1997 to 2008; CEO of Crystal River Capital, Inc. (real estate investment trust) from 2003 to 2010; Oversees 52; Jackson Hewitt Tax Service Inc. (tax preparation services from 2004 to 2011); Celgene Corporation (global biotechnology company); Student Loan Corporation (student loan provider from 2005 to 2010); Celgene Corporation (global biotechnology company); The Helios Funds and Brookfield Funds (closed-end funds); Crystal River Capital, Inc. from 2005 to 2010; Parsons Brinckerhoff from 1995 to 2008; and Apex Silver Mines Ltd. from 2007 to 2009 | |
|
Douglas A. Hacker (Born 1955)
c/o Columbia Management Investment Advisers, LLC
225 Franklin Street
Boston, MA 02110
Trustee (since 1996) | | Independent business executive since May 2006; Executive Vice President — Strategy of United Airlines from December 2002 to May 2006; President of UAL Loyalty Services (airline marketing company) from September 2001 to December 2002; Executive Vice President and Chief Financial Officer of United Airlines from July 1999 to September 2001. Oversees 52; Nash Finch Company (food distributor); Aircastle Limited (aircraft leasing); and SeaCube Container Leasing Ltd. (container leasing) | |
|
Janet Langford Kelly (Born 1957)
c/o Columbia Management Investment Advisers, LLC
225 Franklin Street
Boston, MA 02110
Trustee (since 1996) | | Senior Vice President, General Counsel and Corporate Secretary, ConocoPhillips (integrated energy company) since September 2007; Deputy General Counsel — Corporate Legal Services, ConocoPhillips from August 2006 to August 2007; Partner, Zelle, Hofmann, Voelbel, Mason & Gette LLP (law firm) from March 2005 to July 2006; Adjunct Professor of Law, Northwestern University from September 2004 to June 2006; Director, UAL Corporation (airline) from February 2006 to July 2006; Chief Administrative Officer and Senior Vice President, Kmart Holding Corporation (consumer goods) from September 2003 to March 2004. Oversees 52; None | |
|
Nancy T. Lukitsh (Born 1956)
c/o Columbia Management Investment Advisers, LLC
225 Franklin Street
Boston, MA 02110
Trustee (since 2011) | | Senior Vice President, Partner and Director of Marketing, Wellington Management Company, LLP (investment adviser) from 1997 to 2010; Chair, Wellington Management Investment Portfolios (commingled non-U.S. investment pools) from 2007 to 2010; Director, Wellington Trust Company, NA and other Wellington affiliates from 1997 to 2010. Oversees 52; None | |
|
William E. Mayer (Born 1940)
c/o Columbia Management Investment Advisers, LLC
225 Franklin Street
Boston, MA 02110
Trustee (since 1994) | | Partner, Park Avenue Equity Partners (private equity) since February 1999; Dean and Professor, College of Business and Management, University of Maryland from 1992 to 1996. Oversees 52; DynaVox Inc. (speech creation); Lee Enterprises (print media); WR Hambrecht + Co. (financial service provider) from 2000 to 2012; BlackRock Kelso Capital Corporation (investment company) | |
|
David M. Moffett (Born 1952)
c/o Columbia Management Investment Advisers, LLC
225 Franklin Street
Boston, MA 02110
Trustee (since 2011) | | Retired. Chief Executive Officer, Federal Home Loan Mortgage Corporation, from 2008 to 2009; Senior Adviser, Global Financial Services Group, Carlyle Group, Inc., from 2007 to 2008; Vice Chairman and Chief Financial Officer, U.S. Bancorp, from 1993 to 2007. Oversees 52; CIT Group Inc. (commercial and consumer finance); eBay Inc. (online trading community); MBIA Inc. (financial service provider); E.W. Scripps Co. (print and television media), Building Materials Holding Corp. (building materials and construction services); and University of Oklahoma Foundation. | |
|
Charles R. Nelson (Born 1942)
c/o Columbia Management Investment Advisers, LLC
225 Franklin Street
Boston, MA 02110
Trustee (since 1981) | | Retired Professor Emeritus, University of Washington, since 2011; Professor of Economics, University of Washington from January 1976 to 2011; Ford and Louisa Van Voorhis Professor of Political Economy, University of Washington from 1993 to 2011; Adjunct Professor of Statistics, University of Washington from 1980 to 2011; Associate Editor, Journal of Money Credit and Banking from 1993 to 2008; consultant on econometric and statistical matters. Oversees 52; None | |
|
John J. Neuhauser (Born 1943)
c/o Columbia Management Investment Advisers, LLC
225 Franklin Street
Boston, MA 02110
Trustee (since 1984) | | President, Saint Michael's College, since August 2007; Director or Trustee of several non-profit organizations, including Fletcher Allen Health Care, Inc.; University Professor, Boston College from November 2005 to August 2007; Academic Vice President and Dean of Faculties, Boston College from August 1999 to October 2005. Oversees 52; Liberty All-Star Equity Fund and Liberty All-Star Growth Fund (closed-end funds) | |
|
Annual Report 2012
71
Columbia Strategic Income Fund
Board Members and Officers (continued)
Independent Trustees (continued)
Name, Address and Year of Birth,
Position with Funds, Year First
Elected or Appointed to Office | | Principal Occupation(s) During Past Five Years, Number of Funds in Columbia
Funds Complex Overseen by Trustee, Other Directorships Held
| |
Patrick J. Simpson (Born 1944)
c/o Columbia Management Investment Advisers, LLC
225 Franklin Street
Boston, MA 02110
Trustee (since 2000) | | Partner, Perkins Coie LLP (law firm). Oversees 52; None | |
|
Anne-Lee Verville (Born 1945)
c/o Columbia Management Investment Advisers, LLC
225 Franklin Street
Boston, MA 02110
Trustee (since 1998) | | Retired. General Manager — Global Education Industry from 1994 to 1997, President — Application Systems Division from 1991 to 1994, Chief Financial Officer — US Marketing & Services from 1988 to 1991, and Chief Information Officer from 1987 to 1988, IBM Corporation (computer and technology). Oversees 52; Enesco Group, Inc. (producer of giftware and home and garden decor products) from 2001 to 2006 | |
|
The Statement of Additional Information includes additional information about the Trustees of the Funds and is available, without charge, upon request by calling 1-800-345-6611.
Interested Trustee
Name, Address and Year of Birth,
Position with Funds, Year First
Elected or Appointed to Office | | Principal Occupation(s) During Past Five Years, Number of Funds in Columbia
Funds Complex Overseen by Trustee, Other Directorships Held
| |
William F. Truscott (born 1960)
53600 Ameriprise Financial Center
Minneapolis, MN 55474
Senior Vice President (since 2012) | | Chairman of the Board and President, Columbia Management Investment Advisers, LLC since May 2010 and February 2012, respectively (previously President, Chairman of the Board and Chief Investment Officer, from 2001 to April 2010); Chief Executive Officer, U.S. Asset Management & President, Annuities, Ameriprise Financial, Inc. since May 2010 (previously President — U.S. Asset Management and Chief Investment Officer from 2005 to April 2010, and Senior Vice President — Chief Investment Officer, from 2001 to 2005); Director, President and Chief Executive Officer, Ameriprise Certificate Company since 2006; Director and Chief Executive Officer, Columbia Management Investment Distributors, Inc. since May 2010 and February 2012, respectively (previously Chairman of the Board and Chief Executive Officer from 2008 to April 2010); Chairman of the Board and Chief Executive Officer, RiverSource Distributors, Inc. since 2006. Oversees 208; Columbia Funds Board. | |
|
Officers
| Name, Year of Birth and Address | | Principal Occupation(s) During the Past Five Years | |
J. Kevin Connaughton (Born 1964)
225 Franklin Street
Boston, MA 02110
President (since 2009) | | Senior Vice President and General Manager — Mutual Fund Products, Columbia Management Investment Advisers, LLC since May 2010; President, Columbia Funds, since 2009, and RiverSource Funds, since May 2010 (previously Senior Vice President and Chief Financial Officer, Columbia Funds, from June 2008 to January 2009, Treasurer, Columbia Funds, from October 2003 to May 2008, and senior officer of various other affiliated funds since 2000); Managing Director, Columbia Management Advisors, LLC from December 2004 to April 2010. | |
|
Michael G. Clarke (Born 1969)
225 Franklin Street
Boston, MA 02110
Treasurer (since 2011) and Chief Financial Officer (since 2009) | | Vice President, Columbia Management Investment Advisers, LLC since May 2010; Managing Director of Fund Administration, Columbia Management Advisors, LLC, from September 2004 to April 2010; senior officer of Columbia Funds and affiliated funds since 2002. | |
|
Scott R. Plummer (Born 1959)
5228 Ameriprise Financial Center
Minneapolis, MN 55474
Senior Vice President, Assistant Secretary and Chief Legal Officer (since 2010) | | Senior Vice President, Chief Legal Officer and Assistant Secretary, Columbia Management Investment Advisers, LLC since June 2005; Vice President and Lead Chief Counsel — Asset Management, Ameriprise Financial, Inc. since May 2010 (previously Vice President and Chief Counsel — Asset Management, from 2005 to April 2010); Vice President, Chief Counsel and Assistant Secretary, Columbia Management Investment Distributors, Inc. since 2008; Vice President, General Counsel and Secretary, Ameriprise Certificate Company since 2005; Chief Counsel, RiverSource Distributors, Inc. since 2006; Vice President, General Counsel and Secretary, RiverSource Funds since December 2006; Senior Vice President, Secretary and Chief Legal Officer, Columbia Funds, since May 2010. | |
|
Annual Report 2012
72
Columbia Strategic Income Fund
Board Members and Officers (continued)
Officers (continued)
| Name, Year of Birth and Address | | Principal Occupation(s) During the Past Five Years | |
William F. Truscott (Born 1960)
53600 Ameriprise Financial Center
Minneapolis, MN 55474
Senior Vice President (since 2010) | | Chairman of the Board and President, Columbia Management Investment Advisers, LLC since May 2010 and February 2012, respectively (previously President, Chairman of the Board and Chief Investment Officer, from 2001 to April 2010); Chief Executive Officer, U.S. Asset Management & President, Annuities, Ameriprise Financial, Inc. since May 2010 (previously President — U.S. Asset Management and Chief Investment Officer from 2005 to April 2010); Director, President and Chief Executive Officer, Ameriprise Certificate Company since 2006; Director and Chief Executive Officer, Columbia Management Investment Distributors, Inc. since May 2010 and February 2012, respectively (previously Chairman of the Board and Chief Executive Officer from 2008 to April 2010); Chairman of the Board and Chief Executive Officer, RiverSource Distributors, Inc. since 2006. | |
|
Thomas P. McGuire (Born 1972)
225 Franklin Street
Boston, MA 02110
Chief Compliance Officer (since 2012) | | Vice President — Asset Management Compliance, Columbia Management Investment Advisers, LLC since 2010; Chief Compliance Officer, Ameriprise Certificate Company, since September 2010; Compliance Executive, Bank of America, 2005-2010. | |
|
Colin Moore (Born 1958)
225 Franklin Street
Boston, MA 02110
Senior Vice President (since 2010) | | Director and Chief Investment Officer, Columbia Management Investment Advisers, LLC since May 2010; Manager, Managing Director and Chief Investment Officer of Columbia Management Advisors, LLC from 2007 to April 2010; Head of Equities, Columbia Management Advisors, LLC from 2002 to 2007. | |
|
Amy Johnson (Born 1965)
5228 Ameriprise Financial Center
Minneapolis, MN 55474
Vice President (since 2010) | | Senior Vice President and Chief Operating Officer, Columbia Management Investment Advisers, LLC since May 2010 (previously Chief Administrative Officer, from 2009 until April 2010, Vice President — Asset Management and Trust Company Services, from 2006 to 2009, and Vice President — Operations and Compliance from 2004 to 2006). | |
|
Joseph F. DiMaria (Born 1968)
225 Franklin Street
Boston, MA 02110
Vice President (since 2011) and Chief Accounting Officer (since 2008) | | Vice President, Mutual Fund Administration, Columbia Management Investment Advisers, LLC, since May 2010; Director of Fund Administration, Columbia Management Advisors, LLC from January 2006 to April 2010; Head of Tax/Compliance and Assistant Treasurer, Columbia Management Advisors, LLC, from November 2004 to December 2005. | |
|
Stephen T. Welsh (born 1957)
225 Franklin Street
Boston, MA 02110
Vice President (since 2006) | | President and Director, Columbia Management Investment Services Corp. since May 2010; President and Director, Columbia Management Services, Inc. from July 2004 to April 2010; Managing Director, Columbia Management Distributors, Inc. from August 2007 to April 2010. | |
|
Paul D. Pearson (born 1956)
10468 Ameriprise Financial Center
Minneapolis, MN 55474
Vice President and Assistant Treasurer (since 2011) | | Vice President, Investment Accounting, Columbia Management Investment Advisers, LLC, since May 2010; Vice President, Managed Assets, Investment Accounting, Ameriprise Financial Corporation. | |
|
Paul B. Goucher (born 1968)
5228 Ameriprise Financial Center
Minneapolis, MN 55474
Vice President and Assistant Secretary (since 2010) | | Vice President and Chief Counsel of Ameriprise Financial since January 2010 (formerly Vice President and Group Counsel from November 2008 to January 2010); Director, Managing Director and General Counsel of J. & W. Seligman & Co. Incorporated (Seligman) from July 2008 to November 2008 and Managing Director and Associate General Counsel of Seligman from January 2005 to July 2008. | |
|
Christopher O. Petersen (born 1970)
5228 Ameriprise Financial Center
Minneapolis, MN 55474
Vice President (since 2010) and Secretary (since 2011) | | Vice President and Chief Counsel, Ameriprise Financial since January 2010 (formerly Vice President and Group Counsel or Counsel from April 2004 to January 2010); Assistant Secretary of RiverSource Funds since January 2007; officer of Columbia Funds and affiliated funds since 2007. | |
|
Michael E. DeFao (born 1968)
225 Franklin Street
Boston, MA 02110
Vice President and Assistant Secretary (since 2011) | | Vice President and Chief Counsel, Ameriprise Financial since May 2010; Associate General Counsel, Bank of America from June 2005 to April 2010. | |
|
Annual Report 2012
73
Columbia Strategic Income Fund
Board Consideration and Approval of
Advisory Agreement
On March 7, 2012, the Board of Trustees (the "Board") and the Trustees who are not interested persons (as defined in the Investment Company Act of 1940) of the Trust (the "Independent Trustees") unanimously approved the continuation of the Investment Management Services Agreement (the "Advisory Agreement") with Columbia Management Investment Advisers, LLC (the "Investment Manager") with respect to Columbia Strategic Income Fund (the "Fund"), a series of the Trust. As detailed below, the Advisory Fees and Expenses Committee (the "Committee") and the Board met on multiple occasions to review and discuss, both among themselves and with the management team of the Investment Manager, materials provided by the Investment Manager before determining to approve the continuation of the Advisory Agreement.
In connection with their deliberations regarding the continuation of the Advisory Agreement, the Committee and the Board requested and evaluated materials from the Investment Manager regarding the Fund and the Advisory Agreement, and discussed these materials with representatives of the Investment Manager at the Committee meeting held on March 6, 2012 and at the Board meeting held on March 7, 2012. In addition, the Board considers matters bearing on the Agreement at most of its other meetings throughout the year and meets regularly with senior management of the Funds and the Investment Manager. Through the Board's Investment Oversight Committees, Trustees also meet with selected Fund portfolio managers and other investment personnel at various times throughout the year. The Committee and the Board also consulted with Fund counsel and with the Independent Trustees' independent legal counsel, who advised on the legal standard for consideration by the Board and otherwise assisted the Board in its deliberations. On March 6, 2012, the Committee recommended that the Board approve the continuation of the Advisory Agreement. On March 7, 2012, the Board, including the Independent Trustees, voting separately, unanimously approved the continuation of the Advisory Agreement for the Fund.
The Committee and the Board considered all information that they, their legal counsel, or the Investment Manager believed reasonably necessary to evaluate and to determine whether to approve the continuation of the Advisory Agreement. In their deliberations, the Trustees did not identify any particular information that was all-important or controlling, and individual Trustees may have attributed different weights to the various factors. The information and factors considered by the Committee and the Board in recommending for approval or approving the continuation of the Advisory Agreement for the Fund included the following:
• Information on the investment performance of the Fund relative to the performance of the Fund's benchmarks and the performance of a group of comparable mutual funds, as determined by an independent third-party data provider;
• Information on the Fund's advisory fees and total expenses, including information comparing the Fund's expenses to those of a group of comparable mutual funds, as determined by an independent third-party data provider;
• The Investment Manager's agreement to contractually limit or cap total operating expenses for the Fund so that total operating expenses (excluding certain fees and expenses, such as transaction costs and certain other investment related expenses, interest, taxes, acquired fund fees and expenses, and extraordinary expenses) would not exceed the median expenses of a group of comparable funds (as determined from time to time, generally annually, by an independent third-party data provider);
• The terms and conditions of the Advisory Agreement, including that the advisory fee rates payable by the Fund would not change;
• The terms and conditions of other agreements and arrangements with affiliates of the Investment Manager relating to the operations of the Fund, including the Administrative Services Agreement, the Distribution Agreement and the Transfer and Dividend Disbursing Agent Agreement, noting in the case of the Transfer and Dividend Disbursing Agent Agreement certain proposed changes to the fee rates payable thereunder;
• Descriptions of various functions performed by the Investment Manager under the Advisory Agreement, including portfolio management and portfolio trading practices;
• Information regarding the management fees and investment performance of any comparable portfolios of other clients of the Investment Manager, including institutional separate accounts; and
• The profitability to the Investment Manager and its affiliates from their relationships with the Fund.
Annual Report 2012
74
Columbia Strategic Income Fund
Board Consideration and Approval of
Advisory Agreement (continued)
Nature, Extent and Quality of Services to be Provided under the Advisory Agreement
The Committee and the Board considered the nature, extent and quality of services provided to the Fund by the Investment Manager and its affiliates under the Advisory Agreement and under separate agreements for the provision of transfer agency and administrative services, and the resources dedicated to the Fund and the other Columbia Funds by the Investment Manager and its affiliates. The Committee and the Board considered, among other things, the Investment Manager's ability to attract, motivate and retain highly qualified research, advisory and supervisory investment professionals (including personnel and other resources, compensation programs for personnel involved in fund management, reputation and other attributes), the portfolio management services provided by those investment professionals, the quality of the Investment Manager's investment research capabilities and trade execution services, and the other resources that the Investment Manager devotes to the Fund. The Committee and the Board also considered the potential benefits to shareholders of investing in a mutual fund that is part of a fund complex offering exposure to a variety of asset classes and investment disciplines and providing a variety of fund and shareholder services.
The Committee and the Board also considered the professional experience and qualifications of the senior personnel of the Investment Manager. The Committee and the Board noted the compliance programs of and the compliance-related resources provided to the Fund by the Investment Manager and its affiliates, and considered the Investment Manager's ability to provide administrative services to the Fund pursuant to a separate administrative services agreement, including the Investment Manager's ability to coordinate the activities of the Fund's other service providers. After reviewing these and related factors, the Committee and the Board concluded, within the context of their overall conclusions, that the expected nature, extent and quality of the services to be provided to the Fund under the Advisory Agreement supported the continuation of such agreement.
Investment Performance
The Committee and the Board reviewed information about the performance of the Fund over various time periods, including performance information relative to benchmarks and information based on reports of an independent third-party data provider that compared the performance of the Fund to the performance of a group of comparable mutual funds. The Committee and the Board also reviewed a description of the third party's methodology for identifying the Fund's peer groups for purposes of performance and expense comparisons. In the case of each Fund whose performance lagged that of a relevant peer group for certain (although not necessarily all) periods, the Committee and the Board concluded that other factors relevant to performance were sufficient, in light of other considerations, to warrant continuation of the Fund's Advisory Agreement. Those factors varied from fund to fund, but included one or more of the following: (i) that the Fund's performance, although lagging in certain recent periods, was stronger over the longer term; (ii) that the underperformance was attributable, to a significant extent, to investment decisions that were reasonable and consistent with the Fund's investment strategy and policies and that the Fund was performing within a reasonable range of expectations, given those investment decisions, market conditions and the Fund's investment strategy; (iii) that the Fund's performance was competitive when compared to other relevant performance benchmarks or peer groups; and (iv) that the Investment Manager had taken or was taking steps designed to help improve the Fund's investment performance, including, but not limited to, replacing portfolio managers, enhancing the resources supporting the portfolio managers, or modifying investment strategies.
The Committee and the Board noted that, through December 31, 2011, the Fund's performance was in the twelfth, eighty-second and thirty-third percentiles (where the best performance would be in the first percentile) of its category selected by an independent third-party data provider for the purposes of performance comparisons for the one-, three- and five- year periods, respectively.
The Committee and the Board also considered the Investment Manager's performance and reputation generally, the Investment Manager's historical responsiveness to Board concerns about performance and the Investment Manager's willingness to take steps intended to improve performance. After reviewing these and related factors, the Committee and the Board concluded, within the context of their overall conclusions regarding the Advisory Agreement, that the performance of the Fund and the Investment Manager was sufficient, in light of other considerations, to warrant the continuation of the Advisory Agreement.
Annual Report 2012
75
Columbia Strategic Income Fund
Board Consideration and Approval of
Advisory Agreement (continued)
Investment Advisory Fee Rates and Other Expenses
The Committee and the Board considered the advisory fees to be charged to the Fund under the Advisory Agreement as well as the total expenses to be incurred by the Fund. In assessing the reasonableness of the fees under the Advisory Agreement, the Committee and the Board considered, among other information, the Fund's advisory fee and its expected total expense ratio as a percentage of average daily net assets. The Committee and the Board noted that the Fund's actual management fee and total net expense ratio are both ranked in the third quintile against the Fund's expense universe as determined by an independent third-party data provider for purposes of expense comparison. The Committee and the Board also took into account the fee waiver and expense limitation arrangements agreed to by the Investment Manager, as noted above.
The Committee and the Board also considered the fact that the advisory fee rates payable by the Fund to the Investment Manager under the Advisory Agreement were the same as those currently paid by the Fund to the Investment Manager.
The Committee and the Board also received and considered information about the advisory fees charged by the Investment Manager to institutional separate accounts. In considering the fees charged to those accounts, the Committee and the Board took into account, among other things, the Investment Manager's representations about the differences between managing mutual funds as compared to other types of accounts, including differences in the services provided, differences in the risk profile of such business for the Investment Manager and the additional resources required to manage mutual funds effectively. In evaluating the Fund's advisory fees, the Committee and the Board also took into account the demands, complexity and quality of the investment management of the Fund.
After reviewing these and related factors, the Committee and the Board concluded, within the context of their overall conclusions, that the advisory fee rates and expenses of the Fund supported the continuation of the Advisory Agreement.
Costs of Services to be Provided and Profitability
The Committee and the Board also took note of the costs of the services provided (both on an absolute and relative basis) and the profitability to the Investment Manager and its affiliates in connection with their relationships with the Fund. In evaluating these considerations, the Committee and the Board took note of the advisory fees charged by the Investment Manager to other clients, including fees charged by the Investment Manager to any institutional separate account clients with similar investment strategies to those of the Fund.
The Committee and the Board also considered the compensation directly or indirectly received by the Investment Manager's affiliates in connection with their relationships with the Fund. The Committee and the Board reviewed information provided by management as to the profitability of the Investment Manager and its affiliates of their relationships with the Fund, and information about the allocation of expenses used to calculate profitability. When reviewing profitability, the Committee and the Board also considered court cases in which adviser profitability was an issue in whole or in part, the performance of the fund, the expense ratio of the fund, and the implementation of expense limitations with respect to the fund. The Committee and the Board also considered information provided by the Investment Manager regarding its financial condition and comparing its profitability to that of other asset management firms that are, or are subsidiaries of, publicly traded companies.
After reviewing these and related factors, the Committee and the Board concluded, within the context of their overall conclusions, that the profitability to the Investment Manager and its affiliates from their relationships with the Fund supported the continuation of the Advisory Agreement.
Economies of Scale
The Committee and the Board considered the potential existence of economies of scale in the provision by the Investment Manager of services to the Fund, to groups of related funds, and to the Investment Manager's investment advisory clients as a whole, and whether those economies of scale were shared with the Fund through breakpoints in investment advisory fees or other means, such as expense limitation arrangements and additional investments by the Investment Manager in investment, trading and compliance resources. The Committee and the Board noted that the investment advisory fee schedules for the Fund contained breakpoints that would reduce the fee rate on assets above specified threshold levels.
In considering these issues, the Committee and the Board also considered the costs of the services provided (both on an absolute and relative basis) and the profitability to the Investment Manager and its affiliates from their relationships with the
Annual Report 2012
76
Columbia Strategic Income Fund
Board Consideration and Approval of
Advisory Agreement (continued)
Fund, as discussed above. After reviewing these and related factors, the Committee and the Board concluded, within the context of their overall conclusions, that the extent to which economies of scale were expected to be shared with the Fund supported the continuation of the Advisory Agreement.
Other Benefits to the Investment Manager
The Committee and the Board received and considered information regarding "fall-out" or ancillary benefits received by the Investment Manager and its affiliates as a result of their relationships with the Fund, such as the engagement of the Investment Manager to provide administrative services to the Fund and the engagement of the Investment Manager's affiliates to provide distribution and transfer agency services to the Fund. The Committee and the Board considered that the Fund's distributor retains a portion of the distribution fees from the Fund and receives a portion of the sales charges on sales or redemptions of certain classes of shares of the Fund. The Committee and the Board also considered the benefits of research made available to the Investment Manager by reason of brokerage commissions generated by the Fund's securities transactions, and reviewed information about the Investment Manager's practices with respect to allocating portfolio brokerage for brokerage and research services. The Committee and the Board considered the possible conflicts of interest associated with certain fall-out or other ancillary benefits and the reporting, disclosure and other processes that would be in place to address such possible conflicts of interest. The Committee and the Board recognized that the Investment Manager's profitability would be somewhat lower without these benefits.
Conclusion
The Committee and the Board reviewed all of the above considerations in reaching their decisions to recommend or approve the continuation of the Advisory Agreement. No single item was identified as paramount or controlling, and individual Trustees may have attributed different weights to various factors. Based on their evaluation of all factors that they deemed to be material, including those factors described above, and assisted by the advice of independent legal counsel, the Board, including the Independent Trustees, voting separately, unanimously approved the continuation of the Advisory Agreement.
Annual Report 2012
77
This page intentionally left blank.
Annual Report 2012
78
This page intentionally left blank.
Annual Report 2012
79
This page intentionally left blank.
Annual Report 2012
80
Columbia Strategic Income Fund
Important Information About This Report
Each fund mails one shareholder report to each shareholder address. If you would like more than one report, please call shareholder services at 800.345.6611 and additional reports will be sent to you.
The policy of the Board is to vote the proxies of the companies in which each fund holds investments consistent with the procedures as stated in the Statement of Additional Information (SAI). You may obtain a copy of the SAI without charge by calling 800.345.6611; contacting your financial intermediary; visiting columbiamanagement.com; or searching the website of the Securities and Exchange Commission (SEC) at http://www.sec.gov. Information regarding how each fund voted proxies relating to portfolio securities is filed with the SEC by August 31 for the most recent 12-month period ending June 30 of that year, and is available without charge by visiting columbiamanagement.com; or searching the website of the SEC at sec.gov.
Each fund files a complete schedule of portfolio holdings with the SEC for the first and third quarters of each fiscal year on Form N-Q. Each fund's Form N-Q is available on the SEC's website at sec.gov and may be reviewed and copied at the SEC's Public Reference Room in Washington, D.C. Information on the operation of the Public Reference Room may be obtained by calling 800.SEC.0330. Each fund's complete schedule of portfolio holdings, as filed on Form N-Q, can also be obtained without charge, upon request, by calling 800.345.6611.
Annual Report 2012
81

Columbia Strategic Income Fund
P.O. Box 8081
Boston, MA 02266-8081
columbiamanagement.com
This information is for use with concurrent or prior delivery of a fund prospectus. Please read and consider the investment objectives, risks, charges and expenses for any fund carefully before investing. For a prospectus which contains this and other important information about the fund go to columbiamanagement.com. The fund is distributed by Columbia Management Investment Distributors, Inc., member FINRA, and managed by Columbia Management Investment Advisers, LLC.
© 2012 Columbia Management Investment Advisers, LLC. All rights reserved.
C-1036 D (7/12)
Item 2. Code of Ethics.
(a) The registrant has adopted a code of ethics that applies to the registrant’s principal executive officer, principal financial officer, principal accounting officer or controller, or persons performing similar functions, regardless of whether these individuals are employed by the registrant or a third party.
(b) During the period covered by this report, there were not any amendments to a provision of the code of ethics adopted in 2(a) above.
(c) During the period covered by this report, there were no waivers, including any implicit waivers, from a provision of the code of ethics described in 2(a) above that relates to one or more of the items set forth in paragraph (b) of this item’s instructions.
Item 3. Audit Committee Financial Expert.
The registrant’s Board of Trustees has determined that Douglas A. Hacker, David M. Moffett and Anne-Lee Verville, each of whom are members of the registrant’s Board of Trustees and Audit Committee, each qualify as an audit committee financial expert. Mr. Hacker, Mr. Moffett and Ms. Verville are each independent trustees, as defined in paragraph (a)(2) of this item’s instructions.
Item 4. Principal Accountant Fees and Services.
Fee information below is disclosed for the five series of the registrant whose report to stockholders is included in this annual filing. Two series changed their fiscal year end during the period effective May 31, 2012, one from September 30 and one from June 30. The fees presented for 2012 represent the fiscal year ended May 31, 2012 for three series, the eight month period ended May 31, 2012 for one series and the eleven month period ended May 31, 2012 for one series. The fees presented for 2011 include information for the fiscal year ended May 31, 2011 for three series, September 30, 2011 for one series and June 30, 2011 for one series.
(a) Audit Fees. Aggregate Audit Fees billed by the principal accountant for professional services rendered during the period ended May 31, 2012 and the indicated 2011 fiscal years are approximately as follows:
2012 | | May 31,2011
(for three series) | | June 30, 2011
(for one series) | | September 30, 2011
(for one series) | |
$ | 206,200 | | $ | 129,800 | | $ | 33,600 | | $ | 30,300 | |
| | | | | | | | | | | |
Audit Fees include amounts related to the audit of the registrant’s annual financial statements or services that are normally provided by the accountant in connection with statutory and regulatory filings or engagements for those fiscal years. Fiscal period 2012 and the 2011 fiscal years also include audit fees for the review and provision of consent in connection with filing Form N-1A for new share classes.
(b) Audit-Related Fees. Aggregate Audit-Related Fees billed to the registrant by the principal accountant for professional services rendered during the period ended May 31, 2012 and the indicated 2011 fiscal years are approximately as follows:
2012 | | May 31,2011
(for three series) | | June 30, 2011
(for one series) | | September 30, 2011
(for one series) | |
$ | 18,500 | | $ | 28,300 | | $ | 7,600 | | $ | 7,100 | |
| | | | | | | | | | | |
Audit-Related Fees include amounts for assurance and related services by the principal accountant that are reasonably related to the performance of the audit of the registrant’s financial statements and are not reported in Audit Fees above. In both fiscal period 2012 and the 2011 fiscal years, Audit-Related Fees consist of agreed-upon procedures performed for semi-annual shareholder reports. The 2011 fiscal years also includes Audit-Related Fees for agreed-upon procedures related to fund mergers and fund accounting and custody conversions.
During the period ended May 31, 2012 and the indicated 2011 fiscal years, there were no Audit-Related Fees billed by the registrant’s principal accountant to the registrant’s investment adviser (not including any sub-adviser whose role is primarily portfolio management and is subcontracted with or overseen by another investment adviser) and any entity controlling, controlled by, or under common control with the adviser that provides ongoing services to the registrant for an engagement that related directly to the operations and financial reporting of the registrant.
(c) Tax Fees. Aggregate Tax Fees billed by the principal accountant to the registrant for professional services rendered during the period ended May 31, 2012 and the indicated 2011 fiscal years are approximately as follows:
2012 | | May 31,2011
(for three series) | | June 30, 2011
(for one series) | | September 30, 2011
(for one series) | |
$ | 21,200 | | $ | 15,700 | | $ | 6,500 | | $ | 3,900 | |
| | | | | | | | | | | |
Tax Fees include amounts for the review of annual tax returns, the review of required shareholder distribution calculations and typically include amounts for professional services by the principal accountant for tax compliance, tax advice and tax planning.
During the period ended May 31, 2012 and the indicated 2011 fiscal years, there were no Tax Fees billed by the registrant’s principal accountant to the registrant’s investment adviser (not including any sub-adviser whose role is primarily portfolio management and is subcontracted with or overseen by another investment adviser) and any entity controlling, controlled by, or under common control with the adviser that provides ongoing services to the registrant for an engagement that related directly to the operations and financial reporting of the registrant.
(d) All Other Fees. Aggregate All Other Fees billed by the principal accountant to the registrant for professional services rendered during the period ended May 31, 2012 and the indicated 2011 fiscal years are approximately as follows:
2012 | | May 31,2011
(for three series) | | June 30, 2011
(for one series) | | September 30, 2011
(for one series) | |
$ | 0 | | $ | 0 | | $ | 0 | | $ | 0 | |
| | | | | | | | | | | |
All Other Fees include amounts for products and services provided by the principal accountant, other than the services reported in paragraphs (a) through (c) above.
Aggregate All Other Fees billed by the registrant’s principal accountant to the registrant’s investment adviser (not including any sub-adviser whose role is primarily portfolio management and is subcontracted with or overseen by another investment adviser) and any entity controlling, controlled by, or under common control with the adviser that provides ongoing services to the registrant for an engagement that related directly to the operations and financial reporting of the registrant during the period ended May 31, 2012 and the indicated 2011 fiscal years are approximately as follows:
2012 | | May 31,2011
(for three series) | | June 30, 2011
(for one series) | | September 30, 2011
(for one series) | |
$ | 395,800 | | $ | 495,300 | | $ | 495,300 | | $ | 395,300 | |
| | | | | | | | | | | |
In both fiscal period 2012 and the 2011 fiscal years, All Other Fees consist of fees billed for internal control examinations of the registrant’s transfer agent and investment advisor.
(e)(1) Audit Committee Pre-Approval Policies and Procedures
The registrant’s Audit Committee is required to pre-approve the engagement of the registrant’s independent accountants to provide audit and non-audit services to the registrant and non-audit services to its investment adviser (not including any sub-adviser whose role is primarily portfolio management and is subcontracted with or overseen by another investment adviser) or any entity controlling, controlled by or under common control with such investment adviser that provides ongoing services to the registrant (“Adviser Affiliates”), if the engagement relates directly to the operations and financial reporting of the registrant.
The Audit Committee has adopted a Policy for Engagement of Independent Accountants for Audit and Non-Audit Services (“Policy”). The Policy sets forth the understanding of the Audit Committee regarding the engagement of the registrant’s independent accountants to provide (i) audit and permissible audit-related, tax and other services to the registrant (collectively “Fund Services”); (ii) non-audit services to the registrant’s investment adviser (not including any sub-adviser whose role is primarily portfolio management and is subcontracted with or overseen by another investment adviser) and Adviser Affiliates, if the engagement relates directly to the operations or financial reporting of a Fund (collectively “Fund-related Adviser Services”); and (iii) certain other audit and non-audit services to the registrant’s investment adviser (not including any sub-adviser whose role is primarily portfolio management and is subcontracted with or overseen by another investment adviser) and Adviser Affiliates. As set forth in this Fund Policy, a service will require specific pre-approval by the Audit Committee if it is to be provided by the Fund’s independent auditor; provided, however, that pre-approval of non-audit services to the Fund, the Adviser or Control Affiliates may be waived if certain de minimis requirements set forth in the SEC’s rules are met.
Under the Policy, the Audit Committee may delegate pre-approval authority to any pre-designated member or members who are Independent Trustees/Directors. The member(s) to whom such authority is delegated must report, for informational purposes only, any pre-approval decisions to the Audit Committee at its next regular meeting. The Audit Committee’s responsibilities with respect to the pre-approval of services performed by the independent accountants may not be delegated to management.
On an annual basis, at a regularly scheduled Audit Committee meeting, the Fund’s Treasurer or other Fund Officer shall submit to the Audit Committee a schedule of the types of Fund Services and Fund-related Adviser Services that are subject to specific pre-approval.
This schedule will provide a description of each type of service that is subject to specific pre-approval, along with total projected fees for each service. The pre-approval will generally cover a one-year period. The Audit Committee will review and approve the types of services and the projected fees for the next one-year period and may add to, or subtract from, the list of pre-approved services from time to time, based on subsequent determinations. This specific approval acknowledges that the Audit Committee is in agreement with the types of services that the independent accountants will be permitted to perform.
The Fund’s Treasurer or other Fund Officer shall report to the Audit Committee at each of its regular meetings regarding all Fund Services or Fund-related Adviser Services initiated since the last such report was rendered, including a general description of the services with forecasted fees for the annual period, proposed changes requiring specific pre-approval and a description of services provided by the independent auditor with actual fees during the current reporting period.
*****
(e)(2) The percentage of services described in paragraphs (b) through (d) of this Item approved pursuant to the “de minimis” exception under paragraph (c)(7)(i)(C) of Rule 2-01 of Regulation S-X during the period ended May 31, 2012 and the indicated 2011 fiscal years was zero.
(f) Not applicable.
(g) The aggregate non-audit fees billed by the registrant’s accountant for services rendered to the registrant, and rendered to the registrant’s investment adviser (not including any sub-adviser whose role is primarily portfolio management and is subcontracted with or overseen by another investment adviser), and any entity controlling, controlled by, or under common control with the adviser that provides ongoing services to the registrant for the period ended May 31, 2012 and the indicated 2011 fiscal years are approximately as follows:
2012 | | May 31,2011
(for three series) | | June 30, 2011
(for one series) | | September 30, 2011
(for one series) | |
$ | 435,500 | | $ | 539,300 | | $ | 509,400 | | $ | 406,300 | |
| | | | | | | | | | | |
(h) The registrant’s Audit Committee of the Board of Directors has considered whether the provision of non-audit services that were rendered to the registrant’s adviser (not including any sub-adviser whose role is primarily portfolio management and is subcontracted with or overseen by another investment adviser), and any entity controlling, controlled by, or under common control with the investment adviser that provides ongoing services to the registrant that were not pre-approved pursuant to paragraph (c)(7)(ii) of Rule 2-01 of Regulation S-X, is compatible with maintaining the principal accountant’s independence.
Item 5. Audit Committee of Listed Registrants.
Not applicable.
Item 6. Investments
(a) The registrant’s “Schedule I — Investments in securities of unaffiliated issuers” (as set forth in 17 CFR 210.12-12) is included in Item 1 of this Form N-CSR.
(b) Not applicable.
Item 7. Disclosure of Proxy Voting Policies and Procedures for Closed-End Management Investment Companies.
Not applicable.
Item 8. Portfolio Managers of Closed-End Management Investment Companies.
Not applicable.
Item 9. Purchases of Equity Securities by Closed-End Management Investment Company and Affiliated Purchasers.
Not applicable.
Item 10. Submission of Matters to a Vote of Security Holders.
There were no material changes to the procedures by which shareholders may recommend nominees to the registrant’s board of directors.
Item 11. Controls and Procedures.
(a) The registrant’s principal executive officer and principal financial officers, based on their evaluation of the registrant’s disclosure controls and procedures as of a date within 90 days of the filing of this report, have concluded that such controls and procedures are adequately designed to ensure that material information required to be disclosed by the registrant in Form N-CSR is accumulated and communicated to the registrant’s management, including the principal executive officer and principal financial officer, or persons performing similar functions, as appropriate to allow timely decisions regarding required disclosure.
(b) There was no change in the registrant’s internal control over financial reporting that occurred during the registrant’s second fiscal quarter of the period covered by this report that has materially affected, or is reasonably likely to materially affect, the registrant’s internal control over financial reporting.
Item 12. Exhibits.
(a)(1) Code of ethics required to be disclosed under Item 2 of Form N-CSR attached hereto as Exhibit 99.CODE ETH.
(a)(2) Certifications pursuant to Rule 30a-2(a) under the Investment Company Act of 1940 (17 CFR 270.30a-2(a)) attached hereto as Exhibit 99.CERT.
(a)(3) Not applicable.
(b) Certification pursuant to Rule 30a-2(b) under the Investment Company Act of 1940 (17 CFR 270.30a-2(b)) attached hereto as Exhibit 99.906CERT.
SIGNATURES
Pursuant to the requirements of the Securities Exchange Act of 1934 and the Investment Company Act of 1940, the registrant has duly caused this report to be signed on its behalf by the undersigned, thereunto duly authorized.
(registrant) | | Columbia Funds Series Trust I | |
| |
| |
By (Signature and Title) | | /s/ J. Kevin Connaughton | |
| | J. Kevin Connaughton, President and Principal Executive Officer |
| |
| |
Date | | July 23, 2012 | |
| | | | | |
Pursuant to the requirements of the Securities Exchange Act of 1934 and the Investment Company Act of 1940, this report has been signed below by the following persons on behalf of the registrant and in the capacities and on the dates indicated.
By (Signature and Title) | | /s/ J. Kevin Connaughton | |
| | J. Kevin Connaughton, President and Principal Executive Officer |
| |
| |
Date | | July 23, 2012 | |
| |
| |
By (Signature and Title) | | /s/ Michael G. Clarke | |
| | Michael G. Clarke, Treasurer and Chief Financial Officer |
| |
| |
Date | | July 23, 2012 | |
| | | | | | |