UNITED STATES
SECURITIES AND EXCHANGE COMMISSION
Washington, D.C. 20549
FORM N-CSR
CERTIFIED SHAREHOLDER REPORT OF REGISTERED
MANAGEMENT INVESTMENT COMPANIES
Investment Company Act file number | 811-04367 |
|
Columbia Funds Series Trust I |
(Exact name of registrant as specified in charter) |
|
225 Franklin Street, Boston, Massachusetts | | 02110 |
(Address of principal executive offices) | | (Zip code) |
|
Scott R. Plummer 5228 Ameriprise Financial Center Minneapolis, MN 55474 |
(Name and address of agent for service) |
|
Registrant’s telephone number, including area code: | 1-612-671-1947 | |
|
Date of fiscal year end: | March 31 | |
|
Date of reporting period: | March 31, 2012 | |
| | | | | | | | |
Form N-CSR is to be used by management investment companies to file reports with the Commission not later than 10 days after the transmission to stockholders of any report that is required to be transmitted to stockholders under Rule 30e-1 under the Investment Company Act of 1940 (17 CFR 270.30e-1). The Commission may use the information provided on Form N-CSR in its regulatory, disclosure review, inspection, and policymaking roles.
A registrant is required to disclose the information specified by Form N-CSR, and the Commission will make this information public. A registrant is not required to respond to the collection of information contained in Form N-CSR unless the Form displays a currently valid Office of Management and Budget (“OMB”) control number. Please direct comments concerning the accuracy of the information collection burden estimate and any suggestions for reducing the burden to Secretary, Securities and Exchange Commission, 450 Fifth Street, NW, Washington, DC 20549-0609. The OMB has reviewed this collection of information under the clearance requirements of 44 U.S.C. § 3507.
Item 1. Reports to Stockholders.

Columbia Emerging Markets Fund
Annual Report for the Period Ended March 31, 2012
Table of contents
The views expressed in this report reflect the current views of the respective parties. These views are not guarantees of future performance and involve certain risks, uncertainties and assumptions that are difficult to predict, so actual outcomes and results may differ significantly from the views expressed. These views are subject to change at any time based upon economic, market or other conditions and the respective parties disclaim any responsibility to update such views. These views may not be relied on as investment advice and, because investment decisions for a Columbia Fund are based on numerous factors, may not be relied on as an indication of trading intent on behalf of any particular Columbia Fund. References to specific securities should not be construed as a recommendation or investment advice.
President’s Message

Dear Shareholders,
A stock market rally that commenced in the fourth quarter of 2011 continued into 2012 in the United States and around the world, as all major market regions generated double-digit returns for the three-month period ended March 31, 2012. Volatility declined sharply as European debt fears quieted somewhat and sentiment improved. Returns in developed countries were buoyed by strong results in Germany, Belgium, Austria and the Nordic markets of Denmark, Finland, Norway and Sweden. Under the cloud of its own mounting debt problem, Spain was the only eurozone country to deliver a negative return during the three-month period. Solid economic growth and accommodative monetary policy helped boost gains in emerging markets. The rally in U.S. equities was largely driven by an expansion in “multiples”— an increase in stock prices relative to their earnings. By the end of the first quarter of 2012, stocks
no longer appeared as cheap as they were late in 2011. Bonds lagged stocks during the first quarter as investors responded to signs of an improved environment with a greater appetite for risk.
Concerns around the health of the global economy were centered in news headlines focusing on Washington D.C., Europe, China and the Middle East. In the United States, economic indicators remained mixed but generally indicated support for slow, sustainable economic growth. European policymakers have made progress in containing the eurozone debt crisis, though they still have not solved the issue of long-term solvency. The European Central Bank has lowered interest rates and flooded the financial system with liquidity that may provide breathing space for companies to restructure their balance sheets. These massive infusions of liquidity may whet the appetite for risk from investors around the world. However, it has delayed a true reckoning with the European financial situation, as concerns about Spain and Portugal continue to cloud the outlook. These structural challenges that persist in the developed world, and slowing growth in emerging market economies, leave the global economy in a fragile state. Domestic demand, combined with slowing inflationary trends, has also helped to shore up emerging market economies. Joblessness remains low and monetary conditions remain easy.
Despite the challenges and surprises of 2011, we see pockets of strength — and as a result, attractive opportunities — both here and abroad for 2012. We hope to help you capitalize on these opportunities with various articles in our 2012 Perspectives, which is available via the Market Insights tab at columbiamanagement.com. This publication showcases the strong research capabilities and experienced investment teams of Columbia Management and offers a diverse array of investment ideas based on our five key themes for 2012.
Other information and resources available at columbiamanagement.com include:
| n | | detailed up-to-date fund performance and portfolio information |
| n | | economic analysis and market commentary |
| n | | quarterly fund commentaries |
| n | | Columbia Management Investor, our award-winning quarterly newsletter for shareholders |
Thank you for your continued support of the Columbia Funds. We look forward to serving your investment needs for many years to come.
Best Regards,

J. Kevin Connaughton
President, Columbia Funds
Investors should consider the investment objectives, risks, charges and expenses of a mutual fund carefully before investing. For a free prospectus, which contains this and other important information about the funds, visit columbiamanagement.com. The prospectus should be read carefully before investing.
Columbia Funds are distributed by Columbia Management Investment Distributors, Inc., member FINRA, and managed by Columbia Management Investment Advisers, LLC.
© 2012 Columbia Management Investment Advisers, LLC. All rights reserved.
Fund Profile – Columbia Emerging Markets Fund
Summary
| n | | For the 12-month period that ended March 31, 2012, the fund’s Class A shares returned -8.06% without sales charge. |
| n | | The MSCI Emerging Markets Index (Net)1 returned -8.81%, while the MSCI EAFE Index (Net)2 returned -5.77%. |
| n | | In a challenging environment for emerging stock markets, the fund’s results were aided by its emphasis on Southeast Asia and by stock selection in consumer-related areas. |
Portfolio Management
Dara J. White, lead manager, has co-managed the fund since 2008. From 2006 until joining Columbia Management Investment Advisors, LLC (the Investment Manager) in May 2010, Mr. White was associated with the fund’s previous investment adviser as an investment professional.
Jasmine (Weili) Huang has co-managed the fund since 2008. From 2003 until joining the Investment Manager in May 2010, Ms. Huang was associated with the fund’s previous investment adviser as an investment professional.
Robert B. Cameron has co-managed the fund since December 2008. From 2008 until joining the Investment Manager in May 2010, Mr. Cameron was associated with the fund’s previous investment adviser as an investment professional.
| 1 | The MSCI Emerging Markets (EM) Index (Net) is a free float-adjusted market capitalization index that is designed to measure equity market performance of emerging markets. As of December 31, 2010, the MSCI EM Index (Net) consisted of the following 21 emerging market country indices: Brazil, Chile, China, Colombia, Czech Republic, Egypt, Hungary, India, Indonesia, Korea, Malaysia, Mexico, Morocco, Peru, Philippines, Poland, Russia, South Africa, Taiwan, Thailand and Turkey. |
| 2 | The MSCI Europe, Australasia, Far East (EAFE) Index (Net) is a free float-adjusted market capitalization index that is designed to measure the equity market performance of developed markets, excluding the U.S. & Canada. As of December 31, 2010, the MSCI EAFE Index (Net) consisted of the following 22 developed market country indices: Australia, Austria, Belgium, Denmark, Finland, France, Germany, Greece, Hong Kong, Ireland, Israel, Italy, Japan, the Netherlands, New Zealand, Norway, Portugal, Singapore, Spain, Sweden, Switzerland and the United Kingdom. |
Indices are not available for investment, are not professionally managed and do not reflect sales charges, fees, brokerage commissions, taxes or other expenses of investing. Securities in the fund may not match those in an index.
Performance data quoted represents past performance and current performance may be lower or higher. Past performance is no guarantee of future results. The investment return and principal value will fluctuate so that shares, when redeemed, may be worth more or less than the original cost. Please visit www.columbiamanagement.com for daily and most recent month-end performance updates.
Summary
1-year return as of 03/31/12
| | |
| |
 | | –8.06% Class A shares (without sales charge) |
| |
| | –8.81% MSCI Emerging Markets Index (Net) |
| |
| | –5.77% MSCI EAFE Index (Net) |
|
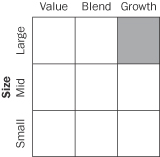
Morningstar Style Box™ |
|
Equity Style |
|
The Morningstar Style Box™ is based on the fund’s portfolio holdings. For equity funds, the vertical axis shows the market capitalization of the stocks owned, and the horizontal axis shows investment style (value, blend, or growth). Information shown is based on the most recent data provided by Morningstar.
© 2012 Morningstar, Inc. All rights reserved. The Morningstar information contained herein: (1) is proprietary to Morningstar and/or its content providers; (2) may not be copied or distributed; and (3) is not warranted to be accurate, complete or timely. Neither Morningstar nor its content providers are responsible for any damages or losses arising from any use of this information.
1
Performance Information – Columbia Emerging Markets Fund
Performance data quoted represents past performance and current performance may be lower or higher. Past performance is no guarantee of future results. The investment return and principal value will fluctuate so that shares, when redeemed, may be worth more or less than the original cost. Please visit www.columbiamanagement.com for daily and most recent month-end performance updates.
|
| Performance of a $10,000 investment 04/01/02 – 03/31/12 |
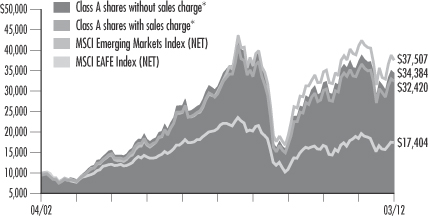
The chart above shows the change in value of a hypothetical $10,000 investment in Class A shares of Columbia Emerging Markets Fund during the stated time period, and does not reflect the deduction of taxes that a shareholder may pay on fund distributions or on the redemption of fund shares.
| | | | | | | | |
| Performance of a $10,000 investment 04/01/02 – 03/31/12 ($) | |
| | |
| Sales charge | | without | | | with | |
Class A* | | | 34,384 | | | | 32,420 | |
Class C* | | | 31,875 | | | | 31,875 | |
Class I* | | | 35,210 | | | | n/a | |
Class R* | | | 33,453 | | | | n/a | |
Class W* | | | 34,293 | | | | n/a | |
Class Z | | | 35,163 | | | | n/a | |
| | | | | | | | | | | | | | | | | | | | | | | | | | | | | | | | |
| Average annual total return as of 03/31/12 (%) | |
| | | | | | |
| Share class | | A* | | | C* | | | I* | | | R* | | | W* | | | Z | |
| Inception | | 09/28/07 | | | 09/28/07 | | | 09/27/10 | | | 09/27/10 | | | 09/27/10 | | | 01/02/98 | |
| Sales charge | | without | | | with | | | without | | | with | | | without | | | without | | | without | | | without | |
1-year | | | –8.06 | | | | –13.34 | | | | –8.86 | | | | –9.72 | | | | –7.79 | | | | –8.32 | | | | –8.15 | | | | –7.96 | |
5-year | | | 2.02 | | | | 0.81 | | | | 1.23 | | | | 1.23 | | | | 2.25 | | | | 1.72 | | | | 1.96 | | | | 2.22 | |
10-year | | | 13.15 | | | | 12.48 | | | | 12.29 | | | | 12.29 | | | | 13.41 | | | | 12.83 | | | | 13.12 | | | | 13.40 | |
The “with sales charge” returns include the maximum initial sales charge of 5.75% for Class A shares and the applicable contingent deferred sales charge of 1.00% for Class C shares for the first year only. The “without sales charge” returns do not include the effect of sales charges. If they had, returns would be lower.
Performance results reflect any fee waivers or reimbursements of fund expenses by Columbia Management Investment Advisors, LLC and/or any of its affiliates. Absent these fee waivers or expense reimbursement arrangements, performance results would have been lower.
All results shown assume reinvestment of distributions. Class I and Class Z shares are sold at net asset value with no distribution and service (Rule 12b-1) fees. Class R shares are sold at net asset with a distribution (Rule 12b-1) fee. Class W shares are sold at net asset value with a distribution and service (Rule 12b-1) fee. Class I, Class R, Class W and Class Z shares have limited eligibility and the investment minimum requirements may vary. Please see the fund’s prospectuses for details. Performance for different share classes will vary based on differences in sales charges and fees associated with each class.
The tables do not reflect the deduction of taxes that a shareholder may pay on fund distributions or on the redemption of fund shares.
| * | The returns shown for periods prior to the share class inception date (including returns since inception, which are since fund inception) include the returns of the fund’s Class Z shares, the fund’s oldest share class. These returns are adjusted to reflect any higher class-related operating expenses of the newer share classes, as applicable. Please visit columbiamanagement.com/mutual-funds/appended-performance for more information. |
2
Fund Expense Example – Columbia Emerging Markets Fund
As an investor, you incur two types of costs. There are transaction costs, which generally include sales charges on purchases and may include redemption fees. There are also ongoing costs, which generally include management fees, distribution and service (Rule 12b-1) fees, and other fund expenses. The following information is intended to help you understand your ongoing costs (in dollars) of investing in the Fund and to help you compare these costs with the ongoing costs of investing in other mutual funds.
Analyzing your fund’s expenses
To illustrate these ongoing costs, we have provided examples and calculated the expenses paid by investors in each share class of the Fund during the period. The actual and hypothetical information in the table is based on an initial investment of $1,000 at the beginning of the period indicated and held for the entire period. Expense information is calculated two ways and each method provides you with different information. The amount listed in the “Actual” column is calculated using the Fund’s actual operating expenses and total return for the period. You may use the Actual information, together with the amount invested, to estimate the expenses that you paid over the period. Simply divide your account value by $1,000 (for example, an $8,600 account value divided by $1,000 = 8.6), then multiply the results by the expenses paid during the period under the Actual column. The amount listed in the “Hypothetical” column assumes a 5% annual rate of return before expenses (which is not the Fund’s actual return) and then applies the Fund’s actual expense ratio for the period to the hypothetical return. You should not use the hypothetical account values and expenses to estimate either your actual account balance at the end of the period or the expenses you paid during the period. See “Compare with other funds” below for details on how to use the hypothetical data.
Compare with other funds
Since all mutual funds are required to include the same hypothetical calculations about expenses in shareholder reports, you can use this information to compare the ongoing cost of investing in the Fund with other funds. To do so, compare the hypothetical example with the 5% hypothetical examples that appear in the shareholder reports of other funds. As you compare hypothetical examples of other funds, it is important to note that hypothetical examples are meant to highlight the ongoing costs of investing in a fund only and do not reflect any transaction costs, such as sales charges, or redemption or exchange fees. Therefore, the hypothetical calculations are useful in comparing ongoing costs only, and will not help you determine the relative total costs of owning different funds. If transaction costs were included in these calculations, your costs would be higher.
| | | | | | | | | | | | | | | | | | | | | | | | | | | | |
| 10/01/11 – 03/31/12 | |
| | | | |
| | | Account value at the
beginning of the period ($) | | | Account value at the
end of the period ($) | | | Expenses paid
during the period ($) | | | Fund’s annualized
expense ratio (%) | |
| | | Actual | | | Hypothetical | | | Actual | | | Hypothetical | | | Actual | | | Hypothetical | | | Actual | |
Class A | | | 1,000.00 | | | | 1,000.00 | | | | 1,194.50 | | | | 1,015.17 | | | | 10.64 | | | | 9.77 | | | | 1.95 | |
Class C | | | 1,000.00 | | | | 1,000.00 | | | | 1,188.40 | | | | 1,011.44 | | | | 14.69 | | | | 13.50 | | | | 2.70 | |
Class I | | | 1,000.00 | | | | 1,000.00 | | | | 1,196.70 | | | | 1,017.26 | | | | 8.36 | | | | 7.67 | | | | 1.53 | |
Class R | | | 1,000.00 | | | | 1,000.00 | | | | 1,193.50 | | | | 1,013.92 | | | | 12.00 | | | | 11.02 | | | | 2.20 | |
Class W | | | 1,000.00 | | | | 1,000.00 | | | | 1,193.30 | | | | 1,015.17 | | | | 10.63 | | | | 9.77 | | | | 1.95 | |
Class Z | | | 1,000.00 | | | | 1,000.00 | | | | 1,195.50 | | | | 1,016.41 | | | | 9.28 | | | | 8.52 | | | | 1.70 | |
Expenses paid during the period are equal to the annualized expense ratio for each class as indicated above, multiplied by the average account value over the period and then multiplied by the number of days in the Fund’s most recent fiscal half year and divided by 366.
Expenses do not include fees and expenses incurred indirectly by the Fund from the underlying funds in which the Fund may invest (also referred to as “acquired funds”), including affiliated and non-affiliated pooled investments vehicles (including mutual funds and exchange traded funds).
Had Columbia Management Investment Advisers, LLC and/or certain of its affiliates not waived/reimbursed certain fees and expenses, account value at the end of the period would have been reduced.
3
Portfolio Managers’ Report – Columbia Emerging Markets Fund
Performance data quoted represents past performance and current performance may be lower or higher. Past performance is no guarantee of future results. The investment return and principal value will fluctuate so that shares, when redeemed, may be worth more or less than the original cost. Please visit www.columbiamanagement.com for daily and most recent month-end performance updates.
| | | | |
| Net asset value per share | |
| |
as of 03/31/12 ($) | | | | |
Class A | | | 10.01 | |
Class C | | | 9.84 | |
Class I | | | 10.04 | |
Class R | | | 9.99 | |
Class W | | | 10.00 | |
Class Z | | | 10.03 | |
| | | | |
| Distributions declared per share | |
| |
04/01/11 – 03/31/12 ($) | | | | |
Class A | | | 0.57 | |
Class C | | | 0.57 | |
Class I | | | 0.57 | |
Class R | | | 0.57 | |
Class W | | | 0.57 | |
Class Z | | | 0.57 | |
For the 12-month period that ended March 31, 2012, the fund’s Class A shares returned -8.06% without sales charge. The fund’s benchmarks, the MSCI Emerging Markets Index (Net) and the MSCI EAFE Index (Net), returned -8.81% and -5.77%. Overall country, sector and stock selection aided the fund’s results relative to the primary benchmark, the MSCI Emerging Markets Index. The fund had more exposure than the index to Southeastern Asian markets, notably the Philippines, Thailand and Indonesia, which held up better than the overall index in this challenging environment.
Global events weighed on emerging markets
During the first half of the 12-month period, world events clouded the outlook for emerging markets: a tsunami and earthquake in Japan, which disrupted the world’s production supply chain; Europe’s sovereign debt crisis and fears that the United States and Europe would fall back into recession. Rising inflationary pressures and monetary tightening policies among many major central banks also created a headwind to emerging market equities. However, in the second half of the period, the environment improved markedly. Valuation became extraordinarily attractive, inflation worries abated and central banks shifted their monetary policy to accommodate growth.
Fund focused on middle-class growth
Against this backdrop, the fund sought ways to take advantage of the expansion of middle class consumers in faster-developing economies. In that regard, investments in consumer discretionary companies aided fund results. This was particularly true in the Philippines, Thailand and Indonesia, three markets that outperformed the MSCI Emerging Markets Index. Overweight positions in each of these markets, combined with stock selection, helped shore up returns. In Indonesia, PT Ace Hardware Indonesia and PT Media Nusantara Citra (0.5% and 0.8% of net assets, respectively) were solid performers. PT Ace Hardware Indonesia, the operator of a chain of big-box home improvement centers, generated solid earnings gains on the back of increasing home ownership in Indonesia, while PT Media Nusantara Citra, a television broadcasting company, grew its earnings through advertising sales increases. Both companies were plays on the expansion of new middle class of consumers. The same middle-class development theme applied in the Philippines, where top performers included supermarket chain Puregold Price Club and financial institution Metropolitan Bank and Trust (0.4% and 1.4% of net assets, respectively). Similarly, in Thailand, Home Products Center, a chain of home improvement stores, and CP ALL, operator of 7-11 convenience stores (0.4% and 0.6% respectively), generated positive returns. Beer producer Cia de Bebidas das Americas of Brazil and South Africa’s Mr. Price Group, a fashion retailer with a low-price theme (1.2% and 0.4% of net assets, respectively), also aided results. We did well to limit exposure to poor-performing Eastern European countries, such as Hungary and Poland, and to underweight exposure to significant emerging market countries, such as India and Brazil, which performed poorly.
Russian exposure detracted from relative performance
Although country selection was generally helpful to fund results during the period, an overweight in Russia detracted from results relative to the fund’s primary benchmark. As metals and mining companies performed poorly amid concerns about slackening demand in a slowing
4
Portfolio Managers’ Report (continued) – Columbia Emerging Markets Fund
global economy, investments in Russian steel producers Mechel and Novolipetsk (0.3% of net assets) were notable detractors. We sold the positions in Mechel, as we did with another disappointing investment in the same industry, Tata Steel of India. However, we held onto India’s ICICI Bank (0.5% of net assets) despite its poor performance, because of our more favorable longer-term outlook for the financial institution. In China, an investment in Onet Communications, a producer of telecommunication equipment, did poorly before we sold it.
Looking ahead
We plan to continue to take advantage of increasing industrialization and the expansion of middle class populations in emerging markets, both longer-term secular trends that we believe present numerous investment opportunities. We also intend to maintain our focus on individual security selection and on finding good companies with strong managements and histories of producing solid returns on invested capital.
Portfolio characteristics and holdings are subject to change periodically and may not be representative of current characteristics and holdings. The outlook for the fund may differ from that presented for other Columbia Funds.
Equity securities are affected by stock market fluctuations that occur in response to economic and business developments.
International investing involves special risks, including foreign taxation, currency risks, risks associated with possible differences in financial standards and other risks associated with future political and economic developments.
Investing in emerging markets may involve greater risks than investing in more developed countries. In addition, concentration of investments in a single region may result in greater volatility.
| | | | |
| Country Breakdown1 | | | |
as of 03/31/12 (%) | | | | |
Argentina | | | 0.3 | % |
Brazil | | | 14.2 | |
Chile | | | 2.1 | |
China | | | 15.9 | |
Hong Kong | | | 1.3 | |
India | | | 4.9 | |
Indonesia | | | 6.5 | |
Malaysia | | | 1.6 | |
Mexico | | | 2.0 | |
Panama | | | 0.5 | |
Philippines | | | 2.5 | |
Poland | | | 0.9 | |
Russian Federation | | | 7.9 | |
South Africa | | | 4.7 | |
South Korea | | | 14.3 | |
Taiwan | | | 10.4 | |
Thailand | | | 5.7 | |
Turkey | | | 2.1 | |
United States | | | 2.2 | |
| | 1 | Percentages indicated are based upon total investments (excluding Investments of Cash Collateral Received for Securities on Loan and money market fund). The Fund’s portfolio composition is subject to change. |
| | | | |
| Top 10 holdings1 | | | |
as of 03/31/12 (%) | | | | |
Samsung Electronics Co., Ltd. | | | 3.4 | |
Gazprom OAO, ADR | | | 2.3 | |
Petroleo Brasileiro SA | | | 2.2 | |
Itaú Unibanco Holding SA, ADR | | | 2.1 | |
Industrial & Commercial Bank of China, Class H | | | 2.1 | |
PetroChina Co., Ltd., Class H | | | 1.9 | |
Kasikornbank PCL, Foreign Registered Shares | | | 1.6 | |
Sberbank of Russia | | | 1.4 | |
Banco Bradesco SA, ADR | | | 1.4 | |
Metropolitan Bank & Trust | | | 1.4 | |
| | 1 | Percentages indicated are based upon total investments (excluding Investments of Cash Collateral Received for Securities on Loan and money market fund). |
For further detail about these holdings, please refer to the section entitled “Portfolio of Investments.”
Fund holdings are as of the date given, are subject to change at any time, and are not recommendations to buy or sell any security.
5
Portfolio of Investments – Columbia Emerging Markets Fund
March 31, 2012
(Percentages represent value of investments compared to net assets)
| | | | | | | | |
| Issuer | | Shares | | | Value | |
Common Stocks 96.7% | | | | | | | | |
ARGENTINA 0.3% | | | | | | | | |
YPF SA, ADR | | | 54,125 | | | | $1,537,691 | |
BRAZIL 11.5% | | | | | | | | |
Banco Bradesco SA, ADR | | | 364,651 | | | | 6,381,392 | |
BR Malls Participacoes SA | | | 265,800 | | | | 3,436,347 | |
CETIP SA — Mercados Organizados | | | 114,300 | | | | 1,890,964 | |
Cia de Bebidas das Americas, ADR | | | 133,487 | | | | 5,515,683 | |
Cia Hering | | | 74,900 | | | | 1,934,611 | |
Fleury SA | | | 141,500 | | | | 1,871,215 | |
Itaú Unibanco Holding SA, ADR | | | 508,203 | | | | 9,752,416 | |
Localiza Rent a Car SA | | | 95,000 | | | | 1,748,610 | |
Mills Estruturas e Servicos de Engenharia SA | | | 164,100 | | | | 2,085,579 | |
Multiplus SA | | | 77,700 | | | | 1,608,951 | |
Odontoprev SA | | | 114,300 | | | | 1,922,271 | |
OGX Petroleo e Gas Participacoes SA(a) | | | 457,200 | | | | 3,786,937 | |
Raia Drogasil SA | | | 233,100 | | | | 2,238,485 | |
Telefonica Brasil SA, ADR | | | 112,575 | | | | 3,448,172 | |
Vale SA | | | 271,500 | | | | 6,338,892 | |
Total | | | | | | | 53,960,525 | |
CHILE 2.1% | | | | | | | | |
Banco Santander Chile, ADR | | | 46,507 | | | | 4,003,787 | |
ENTEL Chile SA | | | 135,412 | | | | 2,736,564 | |
SACI Falabella | | | 299,352 | | | | 2,889,427 | |
Total | | | | | | | 9,629,778 | |
CHINA 16.0% | | | | | | | | |
AAC Technologies Holdings, Inc. | | | 547,450 | | | | 1,491,081 | |
Airtac International Group | | | 122,000 | | | | 638,115 | |
AutoNavi Holdings Ltd., ADR(a)(b) | | | 86,741 | | | | 1,088,600 | |
Baidu, Inc., ADR(a) | | | 6,951 | | | | 1,013,247 | |
Belle International Holdings Ltd. | | | 2,775,000 | | | | 4,994,179 | |
China Coal Energy Co., Ltd., Class H | | | 2,932,000 | | | | 3,288,671 | |
China Communications Construction Co., Ltd., Class H | | | 5,362,000 | | | | 5,402,170 | |
China Construction Bank Corp., Class H | | | 3,449,000 | | | | 2,662,005 | |
China High Precision Automation Group Ltd.(b)(c)(d) | | | 1,823,000 | | | | 418,098 | |
China Merchants Holdings International Co., Ltd. | | | 744,000 | | | | 2,491,796 | |
China National Building Material Co., Ltd., Class H(b) | | | 1,708,000 | | | | 2,155,839 | |
China Shenhua Energy Co., Ltd., Class H | | | 1,251,000 | | | | 5,291,486 | |
China Unicom Hong Kong Ltd.(b) | | | 1,602,000 | | | | 2,695,796 | |
China Vanke Co., Ltd., Class B | | | 1,901,117 | | | | 2,265,171 | |
CNOOC Ltd. | | | 1,358,000 | | | | 2,779,789 | |
ENN Energy Holdings Ltd. | | | 730,000 | | | | 2,530,628 | |
Industrial & Commercial Bank of China, Class H | | | 14,916,000 | | | | 9,622,048 | |
NetQin Mobile, Inc., ADR(a)(b) | | | 166,082 | | | | 1,767,112 | |
PetroChina Co., Ltd., Class H(b) | | | 6,342,000 | | | | 8,930,441 | |
Sany Heavy Equipment International Holdings Co., Ltd. | | | 2,463,500 | | | | 1,862,690 | |
SINA Corp.(a)(b) | | | 54,777 | | | | 3,560,505 | |
Spreadtrum Communications, Inc.,
ADR(b) | | | 227,657 | | | | 3,756,341 | |
Want Want China Holdings Ltd. | | | 1,598,000 | | | | 1,788,057 | |
Zijin Mining Group Co., Ltd., Class H(b) | | | 5,606,000 | | | | 2,229,099 | |
Total | | | | | | | 74,722,964 | |
HONG KONG 1.3% | | | | | | | | |
Foxconn International Holdings Ltd.(a) | | | 1,606,000 | | | | 1,143,791 | |
| | | | | | | | |
| Issuer | | Shares | | | Value | |
Common Stocks (continued) | |
HONG KONG (cont.) | |
Towngas China Co., Ltd. | | | 2,317,000 | | | | $1,680,398 | |
Trinity Ltd. | | | 3,922,000 | | | | 3,227,133 | |
Total | | | | | | | 6,051,322 | |
INDIA 4.9% | | | | | | | | |
Ashok Leyland Ltd. | | | 2,798,184 | | | | 1,669,115 | |
Asian Paints Ltd. | | | 41,538 | | | | 2,642,986 | |
Bharat Forge Ltd. | | | 272,223 | | | | 1,711,737 | |
Cummins India Ltd. | | | 176,887 | | | | 1,719,979 | |
HDFC Bank Ltd., ADR | | | 176,468 | | | | 6,017,559 | |
ICICI Bank Ltd., ADR | | | 68,135 | | | | 2,375,867 | |
ITC Ltd. | | | 436,101 | | | | 1,941,666 | |
Larsen & Toubro Ltd. | | | 52,060 | | | | 1,337,805 | |
Sobha Developers Ltd. | | | 164,338 | | | | 1,073,577 | |
Titan Industries Ltd. | | | 588,434 | | | | 2,638,656 | |
Total | | | | | | | 23,128,947 | |
INDONESIA 6.5% | | | | | | | | |
PT Ace Hardware Indonesia Tbk | | | 5,042,500 | | | | 2,456,972 | |
PT AKR Corporindo Tbk | | | 7,153,500 | | | | 3,367,370 | |
PT Astra International Tbk | | | 265,500 | | | | 2,148,222 | |
PT Bank Rakyat Indonesia Persero Tbk | | | 2,266,000 | | | | 1,726,947 | |
PT Bank Tabungan Pensiunan Nasional Tbk(a) | | | 3,439,500 | | | | 1,354,121 | |
PT Gudang Garam Tbk | | | 525,500 | | | | 3,165,099 | |
PT Indo Tambangraya Megah Tbk | | | 666,000 | | | | 3,171,872 | |
PT Indocement Tunggal Prakarsa Tbk | | | 1,192,700 | | | | 2,408,122 | |
PT Indomobil Sukses Internasional
Tbk(a) | | | 757,500 | | | | 1,252,138 | |
PT Media Nusantara Citra Tbk | | | 17,861,000 | | | | 3,676,492 | |
PT Nippon Indosari Corpindo Tbk | | | 5,676,000 | | | | 2,183,679 | |
PT Perusahaan Gas Negara Persero Tbk | | | 2,690,000 | | | | 1,120,854 | |
PT Sumber Alfaria Trijaya Tbk(a) | | | 4,460,000 | | | | 2,455,311 | |
Total | | | | | | | 30,487,199 | |
MALAYSIA 1.6% | | | | | | | | |
AMMB Holdings Bhd | | | 966,300 | | | | 1,994,204 | |
Genting Bhd | | | 584,300 | | | | 2,068,577 | |
Hartalega Holdings Bhd | | | 606,300 | | | | 1,578,828 | |
RHB Capital Bhd | | | 702,000 | | | | 1,766,547 | |
Total | | | | | | | 7,408,156 | |
MEXICO 2.0% | | | | | | | | |
Alfa SAB de CV, Class A | | | 205,000 | | | | 2,951,347 | |
Fomento Economico Mexicano SAB de CV, ADR(b) | | | 41,343 | | | | 3,401,289 | |
Grupo Mexico SAB de CV, Class B | | | 887,990 | | | | 2,804,077 | |
Total | | | | | | | 9,156,713 | |
PANAMA 0.5% | | | | | | | | |
Copa Holdings SA, Class A | | | 28,283 | | | | 2,240,014 | |
PHILIPPINES 2.5% | | | | | | | | |
Metropolitan Bank & Trust | | | 3,114,085 | | | | 6,349,465 | |
Puregold Price Club, Inc.(a) | | | 4,009,900 | | | | 1,908,886 | |
Security Bank Corp. | | | 277,590 | | | | 926,289 | |
SM Investments Corp. | | | 165,470 | | | | 2,548,923 | |
Total | | | | | | | 11,733,563 | |
POLAND 0.9% | | | | | | | | |
Eurocash SA | | | 358,664 | | | | 4,038,164 | |
The Accompanying Notes to Financial Statements are an integral part of this statement.
6
Columbia Emerging Markets Fund
March 31, 2012
(Percentages represent value of investments compared to net assets)
| | | | | | | | |
| Issuer | | Shares | | | Value | |
Common Stocks (continued) | |
RUSSIAN FEDERATION 7.9% | | | | | | | | |
E.ON Russia JSC(a) | | | 15,361,859 | | | | $1,382,567 | |
Eurasia Drilling Co., Ltd., GDR(b)(e) | | | 86,313 | | | | 2,379,650 | |
Gazprom OAO, ADR | | | 883,635 | | | | 10,780,347 | |
Globaltrans Investment PLC, GDR(e) | | | 133,923 | | | | 2,290,083 | |
Lukoil OAO, ADR | | | 100,991 | | | | 6,136,718 | |
Magnit OJSC, GDR(e) | | | 65,081 | | | | 1,896,460 | |
NovaTek OAO, GDR(e) | | | 33,705 | | | | 4,567,028 | |
Novolipetsk Steel OJSC, GDR(e) | | | 56,885 | | | | 1,182,070 | |
Sberbank of Russia | | | 2,023,254 | | | | 6,535,111 | |
Total | | | | | | | 37,150,034 | |
SOUTH AFRICA 4.7% | | | | | | | | |
AVI Ltd. | | | 693,468 | | | | 4,193,714 | |
Barloworld Ltd. | | | 239,725 | | | | 3,124,457 | |
Clicks Group Ltd. | | | 409,545 | | | | 2,388,078 | |
FirstRand Ltd. | | | 363,601 | | | | 1,123,366 | |
Gold Fields Ltd., ADR | | | 163,329 | | | | 2,270,273 | |
Life Healthcare Group Holdings Ltd. | | | 664,455 | | | | 2,165,477 | |
Mr. Price Group Ltd. | | | 151,216 | | | | 1,859,695 | |
MTN Group Ltd. | | | 276,474 | | | | 4,866,317 | |
Total | | | | | | | 21,991,377 | |
SOUTH KOREA 14.4% | | | | | | | | |
Asia Pacific Systems, Inc.(a) | | | 73,821 | | | | 852,262 | |
Capro Corp. | | | 89,470 | | | | 1,950,207 | |
Cheil Industries, Inc. | | | 22,006 | | | | 1,865,435 | |
Hankook Tire Co., Ltd. | | | 61,720 | | | | 2,290,445 | |
Huchems Fine Chemical Corp. | | | 138,830 | | | | 2,616,359 | |
Hynix Semiconductor, Inc.(a) | | | 28,890 | | | | 747,096 | |
Hyundai Mobis | | | 17,270 | | | | 4,383,432 | |
Hyundai Motor Co. | | | 30,344 | | | | 6,265,982 | |
Iljin Display Co., Ltd. | | | 129,340 | | | | 1,386,123 | |
JNK Heaters Co., Ltd. | | | 89,177 | | | | 1,282,305 | |
LG Chem Ltd. | | | 17,742 | | | | 5,808,534 | |
LG Corp. | | | 32,071 | | | | 1,843,545 | |
LG Display Co., Ltd.(a) | | | 75,140 | | | | 1,762,094 | |
LG Household & Health Care Ltd. | | | 5,224 | | | | 2,747,678 | |
LS Corp. | | | 37,345 | | | | 2,641,054 | |
NCSoft Corp. | | | 12,446 | | | | 3,301,896 | |
Samsung Electronics Co., Ltd. | | | 14,183 | | | | 15,999,201 | |
Seegene, Inc.(a) | | | 23,913 | | | | 1,482,846 | |
SFA Engineering Corp. | | | 42,314 | | | | 1,998,714 | |
Shinhan Financial Group Co., Ltd. | | | 73,640 | | | | 2,852,845 | |
SK Innovation Co., Ltd. | | | 20,850 | | | | 3,060,004 | |
Total | | | | | | | 67,138,057 | |
TAIWAN 10.4% | | | | | | | | |
AU Optronics Corp. | | | 5,848,000 | | | | 2,691,813 | |
Catcher Technology Co., Ltd. | | | 530,000 | | | | 3,757,009 | |
Chinatrust Financial Holding Co., Ltd. | | | 2,828,000 | | | | 1,784,817 | |
Epistar Corp. | | | 470,000 | | | | 1,202,252 | |
Far EasTone Telecommunications Co., Ltd. | | | 2,364,000 | | | | 4,858,858 | |
Formosa Chemicals & Fibre Corp. | | | 923,000 | | | | 2,704,075 | |
Fubon Financial Holding Co., Ltd. | | | 2,920,503 | | | | 3,296,386 | |
Giant Manufacturing Co., Ltd. | | | 517,800 | | | | 2,285,181 | |
Hiwin Technologies Corp. | | | 80,000 | | | | 904,731 | |
Hon Hai Precision Industry Co., Ltd. | | | 1,487,000 | | | | 5,789,137 | |
HTC Corp. | | | 94,000 | | | | 1,919,450 | |
MediaTek, Inc. | | | 367,000 | | | | 3,525,165 | |
Simplo Technology Co., Ltd. | | | 306,000 | | | | 2,318,846 | |
| | | | | | | | |
| Issuer | | Shares | | | Value | |
Common Stocks (continued) | |
TAIWAN (cont.) | |
Taiwan Semiconductor Manufacturing Co., Ltd. | | | 2,137,190 | | | | $6,144,370 | |
Tong Hsing Electronic Industries Ltd. | | | 468,000 | | | | 1,655,253 | |
TSRC Corp. | | | 863,800 | | | | 2,213,582 | |
United Microelectronics Corp. | | | 3,109,000 | | | | 1,514,359 | |
Total | | | | | | | 48,565,284 | |
THAILAND 5.7% | | | | | | | | |
Bangkok Bank PCL, Foreign Registered Shares(b) | | | 967,400 | | | | 5,807,815 | |
CP ALL PCL, Foreign Registered Shares | | | 1,253,100 | | | | 2,660,890 | |
Home Product Center PCL, Foreign Registered Shares(b) | | | 4,577,567 | | | | 2,063,030 | |
Kasikornbank PCL, Foreign Registered Shares | | | 1,477,500 | | | | 7,376,920 | |
LPN Development PCL, Foreign Registered Shares | | | 1,893,500 | | | | 952,428 | |
LPN Development PCL, NVDR | | | 1,547,300 | | | | 778,290 | |
PTT PCL, Foreign Registered Shares | | | 320,900 | | | | 3,682,098 | |
Siam Cement PCL, NVDR(b) | | | 310,800 | | | | 3,572,779 | |
Total | | | | | | | 26,894,250 | |
TURKEY 2.1% | | | | | | | | |
Tofas Turk Otomobil Fabrikasi AS | | | 905,555 | | | | 3,871,587 | |
Turkiye Garanti Bankasi AS | | | 1,467,358 | | | | 5,812,460 | |
Total | | | | | | | 9,684,047 | |
UNITED STATES 1.4% | | | | | | | | |
Freeport-McMoRan Copper & Gold, Inc. | | | 116,678 | | | | 4,438,431 | |
Newmont Mining Corp. | | | 42,501 | | | | 2,179,026 | |
Total | | | | | | | 6,617,457 | |
Total Common Stocks | | | | | |
(Cost: $358,825,420) | | | | $452,135,542 | |
| |
Preferred Stocks 2.7% | | | | | | | | |
BRAZIL 2.7% | | | | | | | | |
Gerdau SA | | | 280,600 | | | | 2,683,873 | |
Petroleo Brasileiro SA | | | 789,400 | | | | 10,054,261 | |
Total | | | | | | | 12,738,134 | |
Total Preferred Stocks | | | | | |
(Cost: $5,841,579) | | | | $12,738,134 | |
| |
Rights —% | |
TAIWAN —% | | | | | | | | |
Chinatrust Financial Holding Co.,
Ltd.(a)(c) | | | 136,308 | | | | 10,391 | |
Total Rights | | | | | |
(Cost: $—) | | | | $10,391 | |
| |
Money Market Funds 0.8% | |
Columbia Short-Term Cash Fund, 0.161%(f)(g) | | | 3,836,855 | | | | 3,836,855 | |
Total Money Market Funds | | | | | |
(Cost: $3,836,855) | | | | $3,836,855 | |
| |
The Accompanying Notes to Financial Statements are an integral part of this statement.
7
Columbia Emerging Markets Fund
March 31, 2012
(Percentages represent value of investments compared to net assets)
| | | | | | | | | | |
| Issuer | | Effective
Yield | | Principal | | | Value | |
Investments of Cash Collateral Received for Securities on Loan 4.2% | |
Repurchase Agreements 4.2% | | | | | | | | |
Natixis Financial Products, Inc.
dated 3/30/12, matures 04/02/12,
repurchase price $10,000,217(h) | |
| | 0.260% | | | $10,000,000 | | | | $10,000,000 | |
Nomura Securities
dated 3/30/12, matures 04/02/12,
repurchase price $3,000,050(h) | |
| | 0.200% | | | 3,000,000 | | | | 3,000,000 | |
| | | | | | | | | | |
| Issuer | | Effective
Yield | | Principal | | | Value | |
Investments of Cash Collateral Received for Securities on Loan (continued) | |
UBS Securities LLC
dated 3/30/12, matures 04/02/12,
repurchase price $6,489,568(h) | |
| | | 0.180% | | | $6,489,471 | | | | $6,489,471 | |
Total | | | | | | | | | 19,489,471 | |
Total Investments of Cash Collateral Received for Securities on Loan | |
(Cost: $19,489,471) | | | | $19,489,471 | |
Total Investments | | | | | | | | | | |
(Cost: $387,993,325) | | | | | | | $488,210,393 | |
Other Assets & Liabilities, Net | | | | | | | (20,719,501 | ) |
Net Assets | | | | | | | | | $467,490,892 | |
Summary of Investments in Securities by Industry
The following table represents the portfolio investments of the Fund by industry classifications as a percentage of net assets at March 31, 2012:
| | | | | | | | |
| Industry | | Percentage of
Net Assets | | | Value | |
Airlines | | | 0.5 | % | | | $2,240,014 | |
Auto Components | | | 1.8 | | | | 8,385,614 | |
Automobiles | | | 2.6 | | | | 12,285,791 | |
Beverages | | | 1.9 | | | | 8,916,972 | |
Biotechnology | | | 0.3 | | | | 1,482,846 | |
Capital Markets | | | 0.4 | | | | 1,890,964 | |
Chemicals | | | 4.2 | | | | 19,801,178 | |
Commercial Banks | | | 17.8 | | | | 83,118,802 | |
Commercial Services & Supplies | | | 0.3 | | | | 1,608,951 | |
Communications Equipment | | | 0.7 | | | | 3,410,531 | |
Computers & Peripherals | | | 1.3 | | | | 6,075,855 | |
Construction & Engineering | | | 1.4 | | | | 6,739,975 | |
Construction Materials | | | 1.7 | | | | 8,136,740 | |
Diversified Financial Services | | | 1.4 | | | | 6,413,956 | |
Diversified Telecommunication Services | | | 1.3 | | | | 6,143,968 | |
Electrical Equipment | | | 0.6 | | | | 2,641,054 | |
Electronic Equipment, Instruments & Components | | | 3.3 | | | | 15,458,900 | |
Energy Equipment & Services | | | 0.5 | | | | 2,379,650 | |
Food & Staples Retailing | | | 3.8 | | | | 17,586,274 | |
Food Products | | | 1.8 | | | | 8,165,450 | |
Gas Utilities | | | 1.1 | | | | 5,331,880 | |
Health Care Equipment & Supplies | | | 0.3 | | | | 1,578,828 | |
Health Care Providers & Services | | | 1.3 | | | | 5,958,963 | |
Hotels, Restaurants & Leisure | | | 0.4 | | | | 2,068,577 | |
Household Products | | | 0.6 | | | | 2,747,678 | |
Independent Power Producers & Energy Traders | | | 0.3 | | | | 1,382,567 | |
Industrial Conglomerates | | | 1.6 | | | | 7,343,815 | |
Internet Software & Services | | | 1.0 | | | | 4,573,752 | |
Leisure Equipment & Products | | | 0.5 | | | | 2,285,181 | |
Machinery | | | 1.7 | | | | 8,076,935 | |
Media | | | 0.8 | | | | 3,676,492 | |
Metals & Mining | | | 5.2 | | | | 24,125,741 | |
Multiline Retail | | | 0.6 | | | | 2,889,427 | |
Oil, Gas & Consumable Fuels | | | 14.4 | | | | 67,067,343 | |
Real Estate Management & Development | | | 1.8 | | | | 8,505,813 | |
Road & Rail | | | 0.9 | | | | 4,038,693 | |
Semiconductors & Semiconductor Equipment | | | 7.5 | | | | 35,127,169 | |
The Accompanying Notes to Financial Statements are an integral part of this statement.
8
Columbia Emerging Markets Fund
March 31, 2012
| | | | | | | | |
| Industry | | Percentage of
Net Assets | | | Value | |
Software | | | 1.3 | % | | | $6,157,608 | |
Specialty Retail | | | 3.1 | | | | 14,560,625 | |
Textiles, Apparel & Luxury Goods | | | 1.3 | | | | 5,865,789 | |
Tobacco | | | 1.1 | | | | 5,106,765 | |
Trading Companies & Distributors | | | 1.8 | | | | 8,577,406 | |
Transportation Infrastructure | | | 0.5 | | | | 2,491,796 | |
Wireless Telecommunication Services | | | 2.7 | | | | 12,461,739 | |
Total | | | | | | | $464,884,067 | |
|
Notes to Portfolio of Investments |
| (b) | At March 31, 2012, security was partially or fully on loan. |
| (c) | Identifies issues considered to be illiquid as to their marketability. The aggregate value of such securities at March 31, 2012 was $428,489, representing 0.09% of net assets. Information concerning such security holdings at March 31, 2012 was as follows: |
| | | | | | |
| Security Description | | Acquisition
Dates | | Cost | |
China High Precision Automation Group Ltd. | | 03/01/11-07/22/11 | | | $1,411,084 | |
Chinatrust Financial Holding Co., Ltd. | | 02/10/12 | | | — | |
| (d) | Represents fair value as determined in good faith under procedures approved by the Board of Trustees. At March 31, 2012, the value of these securities amounted to $418,098, which represents 0.09% of net assets. |
| (e) | Security exempt from registration pursuant to Rule 144A under the Securities Act of 1933. This security may be resold in transactions exempt from registration, normally to qualified institutional buyers. At March 31, 2012, the value of these securities amounted to $12,315,291 or 2.63% of net assets. |
| (f) | The rate shown is the seven-day current annualized yield at March 31, 2012. |
| (g) | Investments in affiliates during the year ended March 31, 2012: |
| | | | | | | | | | | | | | | | | | | | | | | | | | | | |
| Issuer | | Beginning
Cost | | | Purchase | | | Sales
Proceeds | | | Realized
Gain/Loss | | | Ending
Cost | | | Dividends
Income | | | Value | |
Columbia Short-Term Cash Fund | | | $— | | | | $221,129,136 | | | | $(217,292,281 | ) | | | $— | | | | $3,836,855 | | | | $3,718 | | | | $3,836,855 | |
| (h) | The table below represents securities received as collateral for repurchase agreements. This collateral is deposited with the Fund’s custodian and, pursuant to the terms of the repurchase agreement, must have an aggregate market value greater than or equal to the repurchase price plus accrued interest at all times. The value of securities and/or cash held as collateral for repurchase agreements is monitored on a daily basis to ensure the proper level of collateral. |
Natixis Financial Products, Inc. (0.260%)
| | | | |
| Security Description | | Value | |
Fannie Mae Pool | | | $1,722,374 | |
Fannie Mae REMICS | | | 2,961,553 | |
Freddie Mac Gold Pool | | | 360,258 | |
Freddie Mac REMICS | | | 3,555,359 | |
Government National Mortgage Association | | | 415,199 | |
United States Treasury Inflation Indexed Bonds | | | 372,088 | |
United States Treasury Note/Bond | | | 813,390 | |
Total Market Value of Collateral Securities | | | $10,200,221 | |
| |
| Nomura Securities (0.200%) | | | | |
| Security Description | | Value | |
Fannie Mae Pool | | | $1,714,078 | |
Freddie Mac Gold Pool | | | 1,345,922 | |
Total Market Value of Collateral Securities | | | $3,060,000 | |
The Accompanying Notes to Financial Statements are an integral part of this statement.
9
Columbia Emerging Markets Fund
March 31, 2012
|
Notes to Portfolio of Investments (continued) |
| | | | |
| UBS Securities LLC (0.180%) | | | | |
| Security Description | | Value | |
Ginnie Mae I Pool | | | $1,284,692 | |
Ginnie Mae II Pool | | | 5,334,568 | |
Total Market Value of Collateral Securities | | | $6,619,260 | |
| | |
| ADR | | American Depositary Receipt |
| GDR | | Global Depositary Receipt |
| NVDR | | Non-voting Depository Receipt |
Generally accepted accounting principles (GAAP) require disclosure regarding the inputs and valuation techniques used to measure fair value and any changes in valuation inputs or techniques. In addition, investments shall be disclosed by major category.
The Fund categorizes its fair value measurements according to a three-level hierarchy that maximizes the use of observable inputs and minimizes the use of unobservable inputs by prioritizing that the most observable input be used when available. Observable inputs are those that market participants would use in pricing an investment based on market data obtained from sources independent of the reporting entity. Unobservable inputs are those that reflect the Fund’s assumptions about the information market participants would use in pricing an investment. An investment’s level within the fair value hierarchy is based on the lowest level of any input that is deemed significant to the asset or liability’s fair value measurement. The input levels are not necessarily an indication of the risk or liquidity associated with investments at that level. For example, certain U.S. government securities are generally high quality and liquid, however, they are reflected as Level 2 because the inputs used to determine fair value may not always be quoted prices in an active market.
Fair value inputs are summarized in the three broad levels listed below:
| | Ÿ | | Level 1 – Valuations based on quoted prices for investments in active markets that the Fund has the ability to access at the measurement date (including NAV for open-end mutual funds). Valuation adjustments are not applied to Level 1 investments. |
| | Ÿ | | Level 2 – Valuations based on other significant observable inputs (including quoted prices for similar securities, interest rates, prepayment speeds, credit risks, etc.). |
| | Ÿ | | Level 3 – Valuations based on significant unobservable inputs (including the Fund’s own assumptions and judgment in determining the fair value of investments). |
Inputs that are used in determining fair value of an investment may include price information, credit data, volatility statistics, and other factors. These inputs can be either observable or unobservable. The availability of observable inputs can vary between investments, and is affected by various factors such as the type of investment, and the volume and level of activity for that investment or similar investments in the marketplace. The inputs will be considered by the Investment Manager, along with any other relevant factors in the calculation of an investment’s fair value. The Fund uses prices and inputs that are current as of the measurement date, which may include periods of market dislocations. During these periods, the availability of prices and inputs may be reduced for many investments. This condition could cause an investment to be reclassified between the various levels within the hierarchy.
Foreign equity securities actively traded in markets where there is a significant delay in the local close relative to the New York Stock Exchange (NYSE) are classified as Level 2. The values of these securities may include an adjustment to reflect the impact of significant market movements following the close of local trading, as described in Note 2 to the financial statements — Security Valuation.
Investments falling into the Level 3 category are primarily supported by quoted prices from brokers and dealers participating in the market for those investments. However, these may be classified as Level 3 investments due to lack of market transparency and corroboration to support these quoted prices. Additionally, valuation models may be used as the pricing source for any remaining investments classified as Level 3. These models rely on one or more significant unobservable inputs and/or significant assumptions by the Investment Manager. Inputs used in valuations may include, but are not limited to, financial statement analysis, capital account balances, discount rates and estimated cash flows, and comparable company data.
The Accompanying Notes to Financial Statements are an integral part of this statement.
10
Columbia Emerging Markets Fund
March 31, 2012
|
Fair Value Measurements (continued) |
The following table is a summary of the inputs used to value the Fund’s investments as of March 31, 2012:
| | | | | | | | | | | | | | | | |
| | | Fair value at March 31, 2012 | |
| Description | | Level 1
quoted prices
in active
markets for
identical assets | | | Level 2
other
significant
observable
inputs | | | Level 3
significant
unobservable
inputs | | | Total | |
Equity Securities | | | | | | | | | | | | | | | | |
Common Stocks | | | | | | | | | | | | | | | | |
Consumer Discretionary | | | $1,934,611 | | | | $50,082,885 | | | | $— | | | | $52,017,496 | |
Consumer Staples | | | 11,155,457 | | | | 31,367,682 | | | | — | | | | 42,523,139 | |
Energy | | | 11,461,346 | | | | 47,931,386 | | | | — | | | | 59,392,732 | |
Financials | | | 33,858,332 | | | | 66,060,812 | | | | — | | | | 99,919,144 | |
Health Care | | | 3,793,486 | | | | 5,227,151 | | | | — | | | | 9,020,637 | |
Industrials | | | 10,634,501 | | | | 33,124,138 | | | | — | | | | 43,758,639 | |
Information Technology | | | 11,185,805 | | | | 59,199,912 | | | | 418,098 | | | | 70,803,815 | |
Materials | | | 18,030,699 | | | | 31,349,087 | | | | — | | | | 49,379,786 | |
Telecommunication Services | | | 3,448,172 | | | | 15,157,535 | | | | — | | | | 18,605,707 | |
Utilities | | | — | | | | 6,714,447 | | | | — | | | | 6,714,447 | |
Preferred Stocks | | | | | | | | | | | | | | | | |
Energy | | | 10,054,261 | | | | — | | | | — | | | | 10,054,261 | |
Materials | | | 2,683,873 | | | | — | | | | — | | | | 2,683,873 | |
Rights | | | | | | | | | | | | | | | | |
Financials | | | — | | | | 10,391 | | | | — | | | | 10,391 | |
Total Equity Securities | | | 118,240,543 | | | | 346,225,426 | | | | 418,098 | | | | 464,884,067 | |
Other | | | | | | | | | | | | | | | | |
Money Market Funds | | | 3,836,855 | | | | — | | | | — | | | | 3,836,855 | |
Investments of Cash Collateral Received for Securities on Loan | | | — | | | | 19,489,471 | | | | — | | | | 19,489,471 | |
Total Other | | | 3,836,855 | | | | 19,489,471 | | | | — | | | | 23,326,326 | |
Total | | | $122,077,398 | | | | $365,714,897 | | | | $418,098 | | | | $488,210,393 | |
See the Portfolio of Investments for all investment classifications not indicated in the table.
The Fund’s assets assigned to the Level 2 input category are generally valued using the market approach, in which a security’s value is determined through reference to prices and information from market transactions for similar or identical assets. These assets include certain foreign securities for which a third party statistical pricing service may be employed for purposes of fair market valuation. The models utilized by the third party statistical pricing service take into account a security’s correlation to available market data including, but not limited to, intraday index, ADR, and ETF movements.
The Fund’s assets assigned to the Level 3 category are valued utilizing the valuation technique deemed the most appropriate in the circumstances. Certain common stock classified as Level 3 securities are valued using the market approach. To determine fair value for these securities, management considered various factors which may have included, but were not limited to, the halt price of the security, the movement in observed market prices for other securities from the issuer, the movement in certain foreign or domestic market indices, models utilized by the third party statistical pricing service, and the position of the security within the respective company’s capital structure.
There were no significant transfers between Levels 1 and 2 during the period.
The Accompanying Notes to Financial Statements are an integral part of this statement.
11
Columbia Emerging Markets Fund
March 31, 2012
|
Fair Value Measurements (continued) |
The following table is a reconciliation of Level 3 assets for which significant unobservable inputs were used to determine fair value.
| | | | | | | | |
| | | Common Stocks | | | Total | |
Balance as of March 31, 2011 | | | $— | | | | $— | |
Accrued discounts/premiums | | | — | | | | — | |
Realized loss | | | (1,051,570 | ) | | | (1,051,570 | ) |
Change in unrealized depreciation** | | | (626,561 | ) | | | (626,561 | ) |
Sales | | | (594,922 | ) | | | (594,922 | ) |
Purchases | | | 865,105 | | | | 865,105 | |
Transfers into Level 3 | | | 1,826,046 | | | | 1,826,046 | |
Transfers out of Level 3 | | | — | | | | — | |
Balance as of March 31, 2012 | | | $418,098 | | | | $418,098 | |
| ** | Change in unrealized depreciation relating to securities held at March 31, 2012 was $(626,561). |
Financial Assets were transferred from Level 2 to Level 3 due to unavailable market quotes. As a result, as of period end, management determined to fair value the securities under consistently applied procedures established by and under the general supervision of the Board of Trustees.
Transfers in and/or out of Level 3 are determined based on the fair value at the beginning of the period for security positions held throughout the period.
The Accompanying Notes to Financial Statements are an integral part of this statement.
12
Statement of Assets and Liabilities – Columbia Emerging Markets Fund
March 31, 2012
| | | | |
| Assets | | | | |
Investments, at value* | | | | |
Unaffiliated issuers (identified cost $364,666,999) | | $ | 464,884,067 | |
Affiliated issuers (identified cost $3,836,855) | | | 3,836,855 | |
Investment of cash collateral received for securities on loan | | | | |
Repurchase agreements (identified cost $19,489,471) | | | 19,489,471 | |
Total investments (identified cost $387,993,325) | | | 488,210,393 | |
Foreign currency (identified cost $1) | | | 1 | |
Receivable for: | | | | |
Capital shares sold | | | 211,010 | |
Dividends | | | 977,968 | |
Interest | | | 19,611 | |
Reclaims | | | 40,778 | |
Prepaid expense | | | 10,592 | |
Trustees’ deferred compensation plan | | | 22,129 | |
Total assets | | | 489,492,482 | |
| |
| Liabilities | | | | |
Disbursements in excess of cash | | | 50,034 | |
Due upon return of securities on loan | | | 19,489,471 | |
Payable for: | | | | |
Capital shares purchased | | | 308,359 | |
Foreign capital gains taxes deferred | | | 1,908,535 | |
Investment management fees | | | 16,108 | |
Distribution and service fees | | | 377 | |
Transfer agent fees | | | 58,860 | |
Administration fees | | | 1,015 | |
Compensation of board members | | | 1,000 | |
Chief compliance officer expenses | | | 223 | |
Expense reimbursement due to Investment Manager | | | 986 | |
Other expenses | | | 144,493 | |
Trustees’ deferred compensation plan | | | 22,129 | |
Total liabilities | | | 22,001,590 | |
Net assets applicable to outstanding capital stock | | $ | 467,490,892 | |
The Accompanying Notes to Financial Statements are an integral part of this statement.
13
Statement of Assets and Liabilities (continued) – Columbia Emerging Markets Fund
March 31, 2012
| | | | |
| Represented by | | | | |
Paid-in capital | | $ | 351,233,735 | |
Overdistributed net investment income | | | (897,513 | ) |
Accumulated net realized gain | | | 18,852,777 | |
Unrealized appreciation (depreciation) on: | | | | |
Investments | | | 100,217,068 | |
Foreign currency translations | | | (6,640 | ) |
Foreign capital gains tax | | | (1,908,535 | ) |
Total — representing net assets applicable to outstanding capital stock | | $ | 467,490,892 | |
*Value of securities on loan | | $ | 18,683,359 | |
Net assets applicable to outstanding shares | | | | |
Class A | | $ | 12,259,621 | |
Class C | | $ | 2,879,380 | |
Class I | | $ | 214,524,430 | |
Class R | | $ | 513,926 | |
Class W | | $ | 30,862,540 | |
Class Z | | $ | 206,450,995 | |
Shares outstanding | | | | |
Class A | | | 1,225,270 | |
Class C | | | 292,546 | |
Class I | | | 21,364,670 | |
Class R | | | 51,419 | |
Class W | | | 3,085,340 | |
Class Z | | | 20,578,002 | |
Net asset value per share | | | | |
Class A(a) | | $ | 10.01 | |
Class C | | $ | 9.84 | |
Class I | | $ | 10.04 | |
Class R | | $ | 9.99 | |
Class W | | $ | 10.00 | |
Class Z | | $ | 10.03 | |
| (a) | The maximum offering price per share for Class A is $10.62. The offering price is calculated by dividing the net asset value by 1.0 minus the maximum sales charge of 5.75%. |
The Accompanying Notes to Financial Statements are an integral part of this statement.
14
Statement of Operations – Columbia Emerging Markets Fund
Year ended March 31, 2012
| | | | |
| Net investment income | | | | |
Income: | | | | |
Dividends | | $ | 11,426,317 | |
Interest | | | 44,696 | |
Dividends from affiliates | | | 3,718 | |
Income from securities lending — net | | | 125,023 | |
Foreign taxes withheld | | | (1,033,580 | ) |
Total income | | | 10,566,174 | |
Expenses: | | | | |
Investment management fees | | | 5,473,885 | |
Distribution fees | | | | |
Class C | | | 14,910 | |
Class R | | | 567 | |
Service fees | | | | |
Class A | | | 27,458 | |
Class C | | | 4,970 | |
Class W | | | 90,934 | |
Transfer agent fees | | | | |
Class A | | | 29,166 | |
Class C | | | 5,137 | |
Class R | | | 257 | |
Class W | | | 101,629 | |
Class Z | | | 686,603 | |
Administration fees | | | 463,603 | |
Compensation of board members | | | 33,757 | |
Pricing and bookkeeping fees | | | 38,036 | |
Custodian fees | | | 600,229 | |
Printing and postage fees | | | 74,268 | |
Registration fees | | | 81,958 | |
Professional fees | | | 62,711 | |
Line of credit interest expense | | | 2,122 | |
Chief compliance officer expenses | | | 730 | |
Other | | | 60,255 | |
Total expenses | | | 7,853,185 | |
Fees waived or expenses reimbursed by Investment Manager and its affiliates | | | (734,739 | ) |
Expense reductions | | | (3,032 | ) |
Total net expenses | | | 7,115,414 | |
Net investment income | | | 3,450,760 | |
| |
| Realized and unrealized gain (loss) — net | | | | |
Net realized gain (loss) on: | | | | |
Investments | | | 20,515,911 | |
Foreign currency translations | | | (1,185,597 | ) |
Net realized gain | | | 19,330,314 | |
Net change in unrealized appreciation (depreciation) on: | | | | |
Investments | | | (65,258,586 | ) |
Foreign currency translations | | | (24,709 | ) |
Foreign capital gains tax | | | (500,537 | ) |
Net change in unrealized depreciation | | | (65,783,832 | ) |
Net realized and unrealized loss | | | (46,453,518 | ) |
Net decrease in net assets from operations | | $ | (43,002,758 | ) |
The Accompanying Notes to Financial Statements are an integral part of this statement.
15
Statement of Changes in Net Assets – Columbia Emerging Markets Fund
| | | | | | | | |
| | | Year Ended
March 31, 2012 | | | Year Ended
March 31, 2011(a) | |
| | |
| Operations | | | | | | | | |
Net investment income | | $ | 3,450,760 | | | $ | 1,784,324 | |
Net realized gain | | | 19,330,314 | | | | 60,474,200 | |
Net change in unrealized appreciation (depreciation) | | | (65,783,832 | ) | | | 1,763,197 | |
Net increase (decrease) in net assets resulting from operations | | | (43,002,758 | ) | | | 64,021,721 | |
| | |
| Distributions to shareholders from: | | | | | | | | |
Net investment income | | | | | | | | |
Class A | | | — | | | | (68,895 | ) |
Class C | | | — | | | | (3,022 | ) |
Class I | | | — | | | | (128,973 | ) |
Class R | | | — | | | | (13 | ) |
Class W | | | — | | | | (325,283 | ) |
Class Z | | | — | | | | (3,264,227 | ) |
Net realized gains | | | | | | | | |
Class A | | | (592,509 | ) | | | (1,107,014 | ) |
Class C | | | (98,528 | ) | | | (240,371 | ) |
Class I | | | (4,482,137 | ) | | | (1,196,541 | ) |
Class R | | | (121 | ) | | | (212 | ) |
Class W | | | (2,457,505 | ) | | | (3,971,955 | ) |
Class Z | | | (15,459,948 | ) | | | (47,203,700 | ) |
Total distributions to shareholders | | | (23,090,748 | ) | | | (57,510,206 | ) |
Increase in net assets from share transactions | | | 37,201,115 | | | | 85,121,466 | |
Total increase (decrease) in net assets | | | (28,892,391 | ) | | | 91,632,981 | |
Net assets at beginning of year | | | 496,383,283 | | | | 404,750,302 | |
Net assets at end of year | | $ | 467,490,892 | | | $ | 496,383,283 | |
Overdistributed net investment income | | $ | (897,513 | ) | | $ | (4,144,560 | ) |
| (a) | Class I, Class R and Class W are for period from September 27, 2010 (commencement of operations) to March 31, 2011. |
The Accompanying Notes to Financial Statements are an integral part of this statement.
16
Statement of Changes in Net Assets (continued) – Columbia Emerging Markets Fund
| | | | | | | | | | | | | | | | |
| | | Year ended
March 31, 2012 | | | Year ended
March 31, 2011(a) | |
| | | Shares | | | Dollars ($) | | | Shares | | | Dollars ($) | |
| Capital stock activity | | | | | | | | | | | | | | | | |
Class A shares | | | | | | | | | | | | | | | | |
Subscriptions | | | 555,663 | | | | 5,446,196 | | | | 672,498 | | | | 7,777,389 | |
Distributions reinvested | | | 44,090 | | | | 458,094 | | | | 83,830 | | | | 916,965 | |
Redemptions | | | (453,183 | ) | | | (4,533,244 | ) | | | (242,231 | ) | | | (2,684,532 | ) |
Net increase | | | 146,570 | | | | 1,371,046 | | | | 514,097 | | | | 6,009,822 | |
Class C shares | | | | | | | | | | | | | | | | |
Subscriptions | | | 196,797 | | | | 1,842,538 | | | | 128,365 | | | | 1,474,873 | |
Distributions reinvested | | | 7,347 | | | | 75,603 | | | | 16,139 | | | | 175,594 | |
Redemptions | | | (95,911 | ) | | | (934,131 | ) | | | (97,589 | ) | | | (1,085,763 | ) |
Net increase | | | 108,233 | | | | 984,010 | | | | 46,915 | | | | 564,704 | |
Class I shares | | | | | | | | | | | | | | | | |
Subscriptions | | | 17,888,097 | | | | 179,326,082 | | | | 9,609,286 | | | | 109,335,486 | |
Distributions reinvested | | | 430,963 | | | | 4,482,016 | | | | 118,966 | | | | 1,325,278 | |
Redemptions | | | (6,063,738 | ) | | | (63,290,156 | ) | | | (618,904 | ) | | | (6,965,764 | ) |
Net increase | | | 12,255,322 | | | | 120,517,942 | | | | 9,109,348 | | | | 103,695,000 | |
Class R shares | | | | | | | | | | | | | | | | |
Subscriptions | | | 54,120 | | | | 491,245 | | | | 214 | | | | 2,500 | |
Redemptions | | | (2,915 | ) | | | (28,812 | ) | | | — | | | | — | |
Net increase | | | 51,205 | | | | 462,433 | | | | 214 | | | | 2,500 | |
Class W shares | | | | | | | | | | | | | | | | |
Subscriptions | | | 2,191,717 | | | | 22,357,223 | | | | 4,507,710 | | | | 53,729,837 | |
Distributions reinvested | | | 236,514 | | | | 2,457,384 | | | | 385,382 | | | | 4,297,007 | |
Redemptions | | | (3,750,857 | ) | | | (36,168,400 | ) | | | (485,126 | ) | | | (5,442,289 | ) |
Net increase (decrease) | | | (1,322,626 | ) | | | (11,353,793 | ) | | | 4,407,966 | | | | 52,584,555 | |
Class Z shares | | | | | | | | | | | | | | | | |
Subscriptions | | | 3,480,320 | | | | 34,454,928 | | | | 3,901,409 | | | | 43,768,237 | |
Distributions reinvested | | | 889,517 | | | | 9,250,974 | | | | 3,577,654 | | | | 38,965,258 | |
Redemptions | | | (12,230,897 | ) | | | (118,486,425 | ) | | | (14,276,666 | ) | | | (160,468,610 | ) |
Net decrease | | | (7,861,060 | ) | | | (74,780,523 | ) | | | (6,797,603 | ) | | | (77,735,115 | ) |
Total net increase | | | 3,377,644 | | | | 37,201,115 | | | | 7,280,937 | | | | 85,121,466 | |
| (a) | Class I, Class R and Class W are for period from September 27, 2010 (commencement of operations) to March 31, 2011. |
The Accompanying Notes to Financial Statements are an integral part of this statement.
17
Financial Highlights – Columbia Emerging Markets Fund
The following tables are intended to help you understand the Fund’s financial performance. Certain information reflects financial results for a single share of a class held for the periods shown. Per share net investment income (loss) amounts are calculated based on average shares outstanding during the period. Total returns assume reinvestment of all dividends and distributions. Total returns do not reflect payment of sales charges, if any, and are not annualized for periods of less than one year.
| | | | | | | | | | | | | | | | | | | | |
| | | Year ended March 31, | |
| | | 2012 | | | 2011 | | | 2010 | | | 2009 | | | 2008(a) | |
| Class A | | | | | | | | | | | | | | | |
| Per share data | | | | | | | | | | | | | | | | | | | | |
Net asset value, beginning of period | | | $11.48 | | | | $11.27 | | | | $6.42 | | | | $14.96 | | | | $17.77 | |
Income from investment operations: | | | | | | | | | | | | | | | | | | | | |
Net investment income (loss) | | | 0.05 | | | | 0.01 | | | | (0.01 | ) | | | 0.07 | | | | 0.04 | (b) |
Net realized and unrealized gain (loss) | | | (0.95 | ) | | | 1.75 | | | | 5.00 | | | | (6.36 | ) | | | (1.63 | ) |
Total from investment operations | | | (0.90 | ) | | | 1.76 | | | | 4.99 | | | | (6.29 | ) | | | (1.59 | ) |
Less distributions to shareholders from: | | | | | | | | | | | | | | | | | | | | |
Net investment income | | | — | | | | (0.09 | ) | | | (0.14 | ) | | | — | | | | (0.06 | ) |
Net realized gains | | | (0.57 | ) | | | (1.46 | ) | | | — | | | | (2.26 | ) | | | (1.16 | ) |
Total distributions to shareholders | | | (0.57 | ) | | | (1.55 | ) | | | (0.14 | ) | | | (2.26 | ) | | | (1.22 | ) |
Redemption fees: | | | | | | | | | | | | | | | | | | | | |
Redemption fees added to paid-in-capital | | | — | | | | — | | | | 0.00 | (c) | | | 0.01 | | | | 0.00 | (c) |
Net asset value, end of period | | | $10.01 | | | | $11.48 | | | | $11.27 | | | | $6.42 | | | | $14.96 | |
| Total return | | | (8.06% | ) | | | 16.74% | | | | 78.17% | | | | (49.44% | ) | | | (9.80% | ) |
| Ratios to average net assets(d) | | | | | | | | | | | | | | | | | | | | |
Expenses prior to fees waived or expenses reimbursed
(including interest expense) | | | 2.08% | (e) | | | 1.96% | (e) | | | 1.77% | (e) | | | 2.14% | | | | 1.90% | (e)(f) |
Net expenses after fees waived or expenses reimbursed
(including interest expense)(g) | | | 1.87% | (e)(h) | | | 1.65% | (e)(h) | | | 1.74% | (e)(h) | | | 1.96% | (h) | | | 1.85% | (e)(f)(h) |
Expenses prior to fees waived or expenses reimbursed
(excluding interest expense) | | | 2.08% | | | | 1.96% | | | | 1.77% | | | | 2.13% | | | | 1.90% | (f) |
Net expenses after fees waived or expenses reimbursed
(excluding interest expense)(g) | | | 1.87% | (h) | | | 1.65% | (h) | | | 1.74% | (h) | | | 1.95% | (h) | | | 1.85% | (f)(h) |
Net investment income (loss) | | | 0.54% | (h) | | | 0.07% | (h) | | | (0.12% | )(h) | | | 0.71% | (h) | | | 0.46% | (f)(h) |
| Supplemental data | | | | | | | | | | | | | | | | | | | | |
Net assets, end of period (in thousands) | | | $12,260 | | | | $12,388 | | | | $6,362 | | | | $917 | | | | $1,231 | |
Portfolio turnover | | | 117% | | | | 78% | | | | 74% | | | | 82% | | | | 29% | |
Notes to Financial Highlights
| (a) | For the period from September 28, 2007 (commencement of operations) to March 31, 2008. |
| (b) | Net investment income per share reflects special dividends. The effect of these dividends amounted to $0.03 per share. |
| (c) | Rounds to less than $0.01. |
| (d) | In addition to the fees and expenses which the Fund bears directly, the Fund indirectly bears a pro rata share of the fees and expenses of the acquired funds in which it invests. Such indirect expenses are not included in the reported expense ratios. |
| (e) | Includes interest expense which rounds to less than 0.01%. |
| (g) | The Investment Manager and certain of its affiliates agreed to waive/reimburse certain fees and expenses, if applicable. |
| (h) | The benefits derived from expense reductions had an impact of less than 0.01%. |
The Accompanying Notes to Financial Statements are an integral part of this statement.
18
Financial Highlights (continued) – Columbia Emerging Markets Fund
| | | | | | | | | | | | | | | | | | | | |
| | | Year ended March 31, | |
| | 2012 | | | 2011 | | | 2010 | | | 2009 | | | 2008(a) | |
| Class C | | | | | | | | | | | | | | | |
| Per share data | | | | | | | | | | | | | | | | | | | | |
Net asset value, beginning of period | | | $11.39 | | | | $11.21 | | | | $6.36 | | | | $14.94 | | | | $17.77 | |
Income from investment operations: | | | | | | | | | | | | | | | | | | | | |
Net investment income (loss) | | | (0.03 | ) | | | (0.07 | ) | | | (0.09 | ) | | | 0.00 | (b) | | | (0.04 | )(c) |
Net realized and unrealized gain (loss) | | | (0.95 | ) | | | 1.73 | | | | 4.97 | | | | (6.33 | ) | | | (1.61 | ) |
Total from investment operations | | | (0.98 | ) | | | 1.66 | | | | 4.88 | | | | (6.33 | ) | | | (1.65 | ) |
Less distributions to shareholders from: | | | | | | | | | | | | | | | | | | | | |
Net investment income | | | — | | | | (0.02 | ) | | | (0.03 | ) | | | — | | | | (0.02 | ) |
Net realized gains | | | (0.57 | ) | | | (1.46 | ) | | | — | | | | (2.26 | ) | | | (1.16 | ) |
Total distributions to shareholders | | | (0.57 | ) | | | (1.48 | ) | | | (0.03 | ) | | | (2.26 | ) | | | (1.18 | ) |
Redemption fees: | | | | | | | | | | | | | | | | | | | | |
Redemption fees added to paid-in-capital | | | — | | | | — | | | | 0.00 | (b) | | | 0.01 | | | | 0.00 | (b) |
Net asset value, end of period | | | $9.84 | | | | $11.39 | | | | $11.21 | | | | $6.36 | | | | $14.94 | |
| Total return | | | (8.86% | ) | | | 15.92% | | | | 76.73% | | | | (49.82% | ) | | | (10.11% | ) |
| Ratios to average net assets(d) | | | | | | | | | | | | | | | | | | | | |
Expenses prior to fees waived or expenses reimbursed
(including interest expense) | | | 2.83% | (e) | | | 2.71% | (e) | | | 2.52% | (e) | | | 2.89% | | | | 2.65% | (e)(f) |
Net expenses after fees waived or expenses reimbursed
(including interest expense)(g) | | | 2.62% | (e)(h) | | | 2.40% | (e)(h) | | | 2.49% | (e)(h) | | | 2.71% | (h) | | | 2.60% | (e)(f)(h) |
Expenses prior to fees waived or expenses reimbursed
(excluding interest expense) | | | 2.83% | | | | 2.71% | | | | 2.52% | | | | 2.88% | | | | 2.65% | (f) |
Net expenses after fees waived or expenses reimbursed
(excluding interest expense)(g) | | | 2.62% | (h) | | | 2.40% | (h) | | | 2.49% | (h) | | | 2.70% | (h) | | | 2.60% | (f)(h) |
Net investment loss | | | (0.27% | )(h) | | | (0.62% | )(h) | | | (0.86% | )(h) | | | (0.01% | )(h) | | | (0.44% | )(f)(h) |
| Supplemental data | | | | | | | | | | | | | | | | | | | | |
Net assets, end of period (in thousands) | | | $2,879 | | | | $2,100 | | | | $1,540 | | | | $242 | | | | $458 | |
Portfolio turnover | | | 117% | | | | 78% | | | | 74% | | | | 82% | | | | 29% | |
Notes to Financial Highlights
| (a) | For the period from September 28, 2007 (commencement of operations) to March 31, 2008. |
| (b) | Rounds to less than $0.01. |
| (c) | Net investment income per share reflects special dividends. The effect of these dividends amounted to $0.03 per share. |
| (d) | In addition to the fees and expenses which the Fund bears directly, the Fund indirectly bears a pro rata share of the fees and expenses of the acquired funds in which it invests. Such indirect expenses are not included in the reported expense ratios. |
| (e) | Includes interest expense which rounds to less than 0.01%. |
| (g) | The Investment Manager and certain of its affiliates agreed to waive/reimburse certain fees and expenses, if applicable. |
| (h) | The benefits derived from expense reductions had an impact of less than 0.01%. |
The Accompanying Notes to Financial Statements are an integral part of this statement.
19
Financial Highlights (continued) – Columbia Emerging Markets Fund
| | | | | | | | |
| | | Year ended March 31, | |
| | | 2012 | | | 2011(a) | |
| Class I | | | | | | |
| Per share data | | | | | | | | |
Net asset value, beginning of period | | | $11.48 | | | | $11.71 | |
Income from investment operations: | | | | | | | | |
Net investment income (loss) | | | 0.06 | | | | (0.01 | ) |
Net realized and unrealized gain (loss) | | | (0.93 | ) | | | 0.88 | |
Total from investment operations | | | (0.87 | ) | | | 0.87 | |
Less distributions to shareholders from: | | | | | | | | |
Net investment income | | | — | | | | (0.10 | ) |
Net realized gains | | | (0.57 | ) | | | (1.00 | ) |
Total distributions to shareholders | | | (0.57 | ) | | | (1.10 | ) |
Net asset value, end of period | | | $10.04 | | | | $11.48 | |
| Total return | | | (7.79% | ) | | | 7.75% | |
| Ratios to average net assets(b) | | | | | | | | |
Expenses prior to fees waived or expenses reimbursed (including interest expense) | | | 1.56% | (c) | | | 1.59% | (c)(d) |
Net expenses after fees waived or expenses reimbursed (including interest expense)(e) | | | 1.51% | (c)(f) | | | 1.33% | (c)(d)(f) |
Expenses prior to fees waived or expenses reimbursed (excluding interest expense) | | | 1.56% | | | | 1.59% | (d) |
Net expenses after fees waived or expenses reimbursed (excluding interest expense)(e) | | | 1.51% | (f) | | | 1.33% | (d)(f) |
Net investment income (loss) | | | 0.65% | (f) | | | (0.09% | )(d)(f) |
| Supplemental data | | | | | | | | |
Net assets, end of period (in thousands) | | | $214,524 | | | | $104,595 | |
Portfolio turnover | | | 117% | | | | 78% | |
Notes to Financial Highlights
| (a) | For the period from September 27, 2010 (commencement of operations) to March 31, 2011. |
| (b) | In addition to the fees and expenses which the Fund bears directly, the Fund indirectly bears a pro rata share of the fees and expenses of the acquired funds in which it invests. Such indirect expenses are not included in the reported expense ratios. |
| (c) | Includes interest expense which rounds to less than 0.01%. |
| (e) | The Investment Manager and certain of its affiliates agreed to waive/reimburse certain fees and expenses, if applicable. |
| (f) | The benefits derived from expense reductions had an impact of less than 0.01%. |
The Accompanying Notes to Financial Statements are an integral part of this statement.
20
Financial Highlights (continued) – Columbia Emerging Markets Fund
| | | | | | | | |
| | | Year ended March 31, | |
| | | 2012 | | | 2011(a) | |
| Class R | | | | | | |
| Per share data | | | | | | | | |
Net asset value, beginning of period | | | $11.49 | | | | $11.70 | |
Income from investment operations: | | | | | | | | |
Net investment loss | | | (0.06 | ) | | | (0.06 | ) |
Net realized and unrealized gain (loss) | | | (0.87 | ) | | | 0.91 | |
Total from investment operations | | | (0.93 | ) | | | 0.85 | |
Less distributions to shareholders from: | | | | | | | | |
Net investment income | | | — | | | | (0.06 | ) |
Net realized gains | | | (0.57 | ) | | | (1.00 | ) |
Total distributions to shareholders | | | (0.57 | ) | | | (1.06 | ) |
Net asset value, end of period | | | $9.99 | | | | $11.49 | |
| Total return | | | (8.32% | ) | | | 7.50% | |
| Ratios to average net assets(b) | | | | | | | | |
Expenses prior to fees waived or expenses reimbursed (including interest expense) | | | 2.37% | (c) | | | 2.21% | (c)(d) |
Net expenses after fees waived or expenses reimbursed (including interest expense)(e) | | | 2.20% | (c)(f) | | | 1.91% | (c)(d)(f) |
Expenses prior to fees waived or expenses reimbursed (excluding interest expense) | | | 2.37% | | | | 2.21% | (d) |
Net expenses after fees waived or expenses reimbursed (excluding interest expense)(e) | | | 2.20% | (f) | | | 1.91% | (d)(f) |
Net investment loss | | | (0.58% | )(f) | | | (0.97% | )(d)(f) |
| Supplemental data | | | | | | | | |
Net assets, end of period (in thousands) | | | $514 | | | | $2 | |
Portfolio turnover | | | 117% | | | | 78% | |
Notes to Financial Highlights
| (a) | For the period from September 27, 2010 (commencement of operations) to March 31, 2011. |
| (b) | In addition to the fees and expenses which the Fund bears directly, the Fund indirectly bears a pro rata share of the fees and expenses of the acquired funds in which it invests. Such indirect expenses are not included in the reported expense ratios. |
| (c) | Includes interest expense which rounds to less than 0.01%. |
| (e) | The Investment Manager and certain of its affiliates agreed to waive/reimburse certain fees and expenses, if applicable. |
| (f) | The benefits derived from expense reductions had an impact of less than 0.01%. |
The Accompanying Notes to Financial Statements are an integral part of this statement.
21
Financial Highlights (continued) – Columbia Emerging Markets Fund
| | | | | | | | |
| | | Year ended March 31, | |
| | | 2012 | | | 2011(a) | |
| Class W | | | | | | |
| Per share data | | | | | | | | |
Net asset value, beginning of period | | | $11.48 | | | | $11.70 | |
Income from investment operations: | | | | | | | | |
Net investment income (loss) | | | 0.07 | | | | (0.02 | ) |
Net realized and unrealized gain (loss) | | | (0.98 | ) | | | 0.88 | |
Total from investment operations | | | (0.91 | ) | | | 0.86 | |
Less distributions to shareholders from: | | | | | | | | |
Net investment income | | | — | | | | (0.08 | ) |
Net realized gains | | | (0.57 | ) | | | (1.00 | ) |
Total distributions to shareholders | | | (0.57 | ) | | | (1.08 | ) |
Net asset value, end of period | | | $10.00 | | | | $11.48 | |
| Total return | | | (8.15% | ) | | | 7.61% | |
| Ratios to average net assets(b) | | | | | | | | |
Expenses prior to fees waived or expenses reimbursed (including interest expense) | | | 2.09% | (c) | | | 1.95% | (c)(d) |
Net expenses after fees waived or expenses reimbursed (including interest expense)(e) | | | 1.85% | (c)(f) | | | 1.65% | (c)(d)(f) |
Expenses prior to fees waived or expenses reimbursed (excluding interest expense) | | | 2.09% | | | | 1.95% | (d) |
Net expenses after fees waived or expenses reimbursed (excluding interest expense)(e) | | | 1.85% | (f) | | | 1.65% | (d)(f) |
Net investment income (loss) | | | 0.73% | (f) | | | (0.41% | )(d)(f) |
| Supplemental data | | | | | | | | |
Net assets, end of period (in thousands) | | | $30,863 | | | | $50,623 | |
Portfolio turnover | | | 117% | | | | 78% | |
Notes to Financial Highlights
| (a) | For the period from September 27, 2010 (commencement of operations) to March 31, 2011. |
| (b) | In addition to the fees and expenses which the Fund bears directly, the Fund indirectly bears a pro rata share of the fees and expenses of the acquired funds in which it invests. Such indirect expenses are not included in the reported expense ratios. |
| (c) | Includes interest expense which rounds to less than 0.01%. |
| (e) | The Investment Manager and certain of its affiliates agreed to waive/reimburse certain fees and expenses, if applicable. |
| (f) | The benefits derived from expense reductions had an impact of less than 0.01%. |
The Accompanying Notes to Financial Statements are an integral part of this statement.
22
Financial Highlights (continued) – Columbia Emerging Markets Fund
| | | | | | | | | | | | | | | | | | | | |
| | | Year ended March 31, | |
| | | 2012 | | | 2011 | | | 2010 | | | 2009 | | | 2008 | |
| Class Z | | | | | | | | | | | | | | | |
| Per share data | | | | | | | | | | | | | | | | | | | | |
Net asset value, beginning of period | | | $11.49 | | | | $11.26 | | | | $6.42 | | | | $14.94 | | | | $14.06 | |
Income from investment operations: | | | | | | | | | | | | | | | | | | | | |
Net investment income | | | 0.09 | | | | 0.06 | | | | 0.05 | | | | 0.11 | | | | 0.12 | (a) |
Net realized and unrealized gain (loss) | | | (0.98 | ) | | | 1.74 | | | | 4.97 | | | | (6.38 | ) | | | 2.04 | |
Total from investment operations | | | (0.89 | ) | | | 1.80 | | | | 5.02 | | | | (6.27 | ) | | | 2.16 | |
Less distributions to shareholders from: | | | | | | | | | | | | | | | | | | | | |
Net investment income | | | — | | | | (0.11 | ) | | | (0.18 | ) | | | — | | | | (0.12 | ) |
Net realized gains | | | (0.57 | ) | | | (1.46 | ) | | | — | | | | (2.26 | ) | | | (1.16 | ) |
Total distributions to shareholders | | | (0.57 | ) | | | (1.57 | ) | | | (0.18 | ) | | | (2.26 | ) | | | (1.28 | ) |
Redemption fees: | | | | | | | | | | | | | | | | | | | | |
Redemption fees added to paid-in-capital | | | — | | | | — | | | | 0.00 | (b) | | | 0.01 | | | | 0.00 | (b) |
Net asset value, end of period | | | $10.03 | | | | $11.49 | | | | $11.26 | | | | $6.42 | | | | $14.94 | |
| Total return | | | (7.96% | ) | | | 17.16% | | | | 78.84% | | | | (49.37% | ) | | | 14.31% | |
| Ratios to average net assets(c) | | | | | | | | | | | | | | | | | | | | |
Expenses prior to fees waived or expenses reimbursed (including interest expense) | | | 1.83% | (d) | | | 1.71% | (d) | | | 1.52% | (d) | | | 1.89% | | | | 1.89% | (d) |
Net expenses after fees waived or expenses reimbursed (including interest expense)(e) | | | 1.61% | (d)(f) | | | 1.40% | (d)(f) | | | 1.49% | (d)(f) | | | 1.71% | (f) | | | 1.85% | (d)(f) |
Expenses prior to fees waived or expenses reimbursed (excluding interest expense) | | | 1.83% | | | | 1.71% | | | | 1.52% | | | | 1.88% | | | | 1.89% | |
Net expenses after fees waived or expenses reimbursed (excluding interest expense)(e) | | | 1.61% | (f) | | | 1.40% | (f) | | | 1.49% | (f) | | | 1.70% | (f) | | | 1.85% | (f) |
Net investment income | | | 0.87% | (f) | | | 0.52% | (f) | | | 0.47% | (f) | | | 1.01% | (f) | | | 0.73% | (f) |
| Supplemental data | | | | | | | | | | | | | | | | | | | | |
Net assets, end of period (in thousands) | | | $206,451 | | | | $326,675 | | | | $396,849 | | | | $237,412 | | | | $1,014,715 | |
Portfolio turnover | | | 117% | | | | 78% | | | | 74% | | | | 82% | | | | 29% | |
Notes to Financial Highlights
| (a) | Net investment income per share reflects special dividends. The effect of these dividends amounted to $0.03 per share. |
| (b) | Rounds to less than $0.01. |
| (c) | In addition to the fees and expenses which the Fund bears directly, the Fund indirectly bears a pro rata share of the fees and expenses of the acquired funds in which it invests. Such indirect expenses are not included in the reported expense ratios. |
| (d) | Includes interest expense which rounds to less than 0.01%. |
| (e) | The Investment Manager and certain of its affiliates agreed to waive/reimburse certain fees and expenses, if applicable. |
| (f) | The benefits derived from expense reductions had an impact of less than 0.01%. |
The Accompanying Notes to Financial Statements are an integral part of this statement.
23
Notes to Financial Statements – Columbia Emerging Markets Fund
March 31, 2012
Note 1. Organization
Columbia Emerging Markets Fund (the Fund), a series of Columbia Funds Series Trust I (the Trust), is a diversified fund. The Trust is registered under the Investment Company Act of 1940, as amended (the 1940 Act), as an open-end management investment company organized as a Massachusetts business trust.
Fund Shares
The Trust may issue an unlimited number of shares (without par value). The Fund offers Class A, Class C, Class I, Class R, Class W and Class Z shares. All share classes have identical voting, dividend and liquidation rights. Each share class has its own expense structure and sales charges, as applicable.
Class A shares are subject to a maximum front-end sales charge of 5.75% based on the initial investment amount. Class A shares purchased without an initial sales charge in accounts aggregating $1 million to $50 million at the time of purchase are subject to a contingent deferred sales charge (CDSC) if the shares are sold within 18 months of purchase, charged as follows: 1.00% CDSC if redeemed within 12 months of purchase, and 0.50% CDSC if redeemed more than 12, but less than 18, months after purchase.
Class C shares are subject to a 1.00% CDSC on shares redeemed within one year of purchase.
Class I shares are not subject to sales charges and are only available to the Columbia Family of Funds.
Class R shares are not subject to sales charges and are only available to qualifying institutional investors.
Class W shares are not subject to sales charges and are only available to investors purchasing through authorized investment programs managed by investment professionals, including discretionary managed account programs.
Class Z shares are not subject to sales charges, and are only available to certain investors, as described in the Fund’s prospectus.
Note 2. Summary of Significant Accounting Policies
Use of Estimates
The preparation of financial statements in accordance with U.S. generally accepted accounting principles (GAAP) requires management to make certain estimates and assumptions that affect the reported amounts of assets and liabilities, the disclosure of contingent assets and liabilities at the date of the financial statements
and the reported amounts of revenue and expenses during the reporting period. Actual results could differ from those estimates.
The following is a summary of significant accounting policies consistently followed by the Fund in the preparation of its financial statements.
Security Valuation
All equity securities are valued at the close of business of the New York Stock Exchange (NYSE). Equity securities are valued at the last quoted sales price on the principal exchange or market on which they trade, except for securities traded on the NASDAQ Stock Market, which are valued at the NASDAQ official close price. Unlisted securities or listed securities for which there were no sales during the day are valued at the mean of the latest quoted bid and asked prices on such exchanges or markets.
Foreign securities are valued based on quotations from the principal market in which such securities are normally traded. If any foreign share prices are not readily available as a result of limited share activity the securities are valued at the mean of the latest quoted bid and asked prices on such exchanges or markets. Foreign currency exchange rates are generally determined at 4:00 p.m. Eastern (U.S.) time. However, many securities markets and exchanges outside the U.S. close prior to the close of the NYSE; therefore, the closing prices for securities in such markets or on such exchanges may not fully reflect events that occur after such close but before the close of the NYSE. In those situations, foreign securities will be fair valued pursuant to the policy adopted by the Board of Trustees (the Board), including utilizing a third party pricing service to determine these fair values. The third party pricing service takes into account multiple factors, including, but not limited to, movements in the U.S. securities markets, certain depositary receipts, futures contracts and foreign exchange rates that have occurred subsequent to the close of the foreign exchange, to determine a good faith estimate that reasonably reflects the current market conditions as of the close of the NYSE. The fair value of a security is likely to be different from the quoted or published price, if available.
Investments in other open-end investment companies, including money market funds, are valued at net asset value.
Short-term securities purchased within 60 days to maturity are valued at amortized cost, which approximates market value. The value of short-term securities originally purchased with maturities greater than 60 days is determined based on an amortized value to par upon reaching 60 days to maturity. Short-term securities maturing in more than 60 days from the valuation date are valued at
24
Columbia Emerging Markets Fund
March 31, 2012
the market price or approximate market value based on current interest rates.
Forward foreign currency exchange contracts are marked-to-market based upon foreign currency exchange rates provided by a pricing service.
Investments for which market quotations are not readily available, or that have quotations which management believes are not reliable, are valued at fair value as determined in good faith under consistently applied procedures established by and under the general supervision of the Board. If a security or class of securities (such as foreign securities) is valued at fair value, such value is likely to be different from the last quoted market price for the security. The determination of fair value often requires significant judgment. To determine fair value, management may use assumptions including but not limited to future cash flows and estimated risk premiums. Multiple inputs from various sources may be used to determine value.
Foreign Currency Transactions and Translation
The values of all assets and liabilities denominated in foreign currencies are translated into U.S. dollars at that day’s exchange rates. Net realized and unrealized gains (losses) on foreign currency transactions and translations include gains (losses) arising from the fluctuation in exchange rates between trade and settlement dates on securities transactions, gains (losses) arising from the disposition of foreign currency and currency gains (losses) between the accrual and payment dates on dividends, interest income and foreign withholding taxes.
For financial statement purposes, the Fund does not distinguish that portion of gains (losses) on investments which is due to changes in foreign exchange rates from that which is due to changes in market prices of the investments. Such fluctuations are included with the net realized and unrealized gains (losses) on investments in the Statement of Operations.
Repurchase Agreements
The Fund may engage in repurchase agreement transactions with institutions that management has determined are creditworthy. The Fund, through the custodian, receives delivery of the underlying securities collateralizing a repurchase agreement. Management is responsible for determining that the collateral is at least equal, at all times, to the value of the repurchase obligation including interest. A repurchase agreement transaction involves certain risks in the event of default or insolvency of the counterparty. These risks include possible delays in or restrictions on a Fund’s ability to dispose of the
underlying securities and a possible decline in the value of the underlying securities during the period while the Fund seeks to assert its rights.
Security Transactions
Security transactions are accounted for on the trade date. Cost is determined and gains (losses) are based upon the specific identification method for both financial statement and federal income tax purposes.
Income Recognition
Corporate actions and dividend income are recorded net of any non-reclaimable tax withholdings, on the ex-dividend date or upon receipt of ex-dividend notification in the case of certain foreign securities.
Interest income is recorded on the accrual basis.
Awards from class action litigation are recorded as a reduction of cost basis if the Fund still owns the applicable securities on the payment date. If the Fund no longer owns the applicable securities, the proceeds are recorded as realized gains.
Expenses
General expenses of the Trust are allocated to the Fund and other funds of the Trust based upon relative net assets or other expense allocation methodologies determined by the nature of the expense. Expenses directly attributable to the Fund are charged to the Fund. Expenses directly attributable to a specific class of shares are charged to that share class.
Determination of Class Net Asset Value
All income, expenses (other than class-specific expenses, which are charged to that share class, as shown in the Statement of Operations) and realized and unrealized gains (losses) are allocated to each class of the Fund on a daily basis, based on the relative net assets of each class, for purposes of determining the net asset value of each class.
Federal Income Tax Status
The Fund intends to qualify each year as a regulated investment company under Subchapter M of the Internal Revenue Code, as amended, and will distribute substantially all of its taxable income (including net short-term capital gains), if any, for its tax year, and as such will not be subject to federal income taxes. In addition, the Fund intends to distribute in each calendar year substantially all of its net investment income, capital gains and certain other amounts, if
25
Columbia Emerging Markets Fund
March 31, 2012
any, such that the Fund should not be subject to federal excise tax. Therefore, no federal income or excise tax provision is recorded.
Foreign Taxes
The Fund may be subject to foreign taxes on income, gains on investments or currency repatriation, a portion of which may be recoverable. The Fund will accrue such taxes and recoveries, as applicable, based upon its current interpretation of tax rules and regulations that exist in the markets in which it invests.
Realized gains in certain countries may be subject to foreign taxes at the Fund level, based on statutory rates. The Fund accrues for such foreign taxes on net realized and unrealized gains at the appropriate rate for each jurisdiction, as applicable.
Distributions to Shareholders
Distributions from net investment income, if any, are declared and paid semi-annually. Net realized capital gains, if any, are distributed along with the income dividend. Income distributions and capital gain distributions are determined in accordance with federal income tax regulations which may differ from GAAP.
Guarantees and Indemnifications
Under the Trust’s organizational documents and, in some cases, by contract, its officers and trustees are indemnified against certain liabilities arising out of the performance of their duties to the Trust or its funds. In addition, certain of the Fund’s contracts with its service providers contain general indemnification clauses. The Fund’s maximum exposure under these arrangements is unknown since the amount of any future claims that may be made against the Fund cannot be determined, and the Fund has no historical basis for predicting the likelihood of any such claims.
Recent Accounting Pronouncement
Fair Value Measurements and Disclosures
In May 2011, the Financial Accounting Standards Board (FASB) issued ASU No. 2011-04 modifying Topic 820, Fair Value Measurements and Disclosures. At the same time, the International Accounting Standards Board (IASB) issued International Financial Reporting Standard 13, Fair Value Measurement. The objective of the FASB and IASB is convergence of their guidance on fair value measurements and disclosures.
Specifically, ASU No. 2011-04 requires reporting entities to disclose i) the amounts of any transfers between Level 1 and Level 2, and the
reasons for the transfers, ii) for Level 3 fair value measurements, a) quantitative information about significant unobservable inputs used, b) a description of the valuation processes used by the reporting entity and c) a narrative description of the sensitivity of the fair value measurement to changes in unobservable inputs if a change in those inputs might result in a significantly higher or lower fair value measurement. The effective date of ASU No. 2011-04 is for interim and annual periods beginning after December 15, 2011. At this time, management is evaluating the implications of this guidance and the impact it will have on the financial statement amounts and footnote disclosures, if any.
Note 3. Fees and Compensation Paid to Affiliates
Investment Management Fees
Under an Investment Management Services Agreement (IMSA), Columbia Management Investment Advisers, LLC (the Investment Manager), a wholly-owned subsidiary of Ameriprise Financial, Inc. (Ameriprise Financial), determines which securities will be purchased, held or sold. Effective July 1, 2011, the management fee is an annual fee that is equal to a percentage of the Fund’s average daily net assets that declines from 1.27% to 0.66% as the Fund’s net assets increase. Prior to July 1, 2011, the management fee was equal to a percentage of the Fund’s average daily net assets that declined from 1.15% to 0.52% as the Fund’s net assets increased. The effective management fee rate for the year ended March 31, 2012 was 1.24% of the Fund’s average daily net assets.
Administration Fees
Under an Administrative Services Agreement, the Investment Manager serves as the Fund Administrator. Effective July 1, 2011, the Fund pays the Fund Administrator an annual fee for administration and accounting services equal to a percentage of the Fund’s average daily net assets that declines from 0.08% to 0.06% as the Fund’s net assets increase. Prior to July 1, 2011, the administration fee was equal to the annual rate of 0.20% of the Fund’s average daily net assets, less the fees that were payable by the Fund as described under the Pricing and Bookkeeping Fees note below. The effective administration fee rate for the year ended March 31, 2012 was 0.11% of the Fund’s average daily net assets.
Pricing and Bookkeeping Fees
Prior to July 25, 2011, the Fund had entered into a Financial Reporting Services Agreement (the Financial Reporting Services Agreement) with State Street Bank and Trust Company (State
26
Columbia Emerging Markets Fund
March 31, 2012
Street) and the Investment Manager pursuant to which State Street provided financial reporting services to the Fund. The Fund also entered into an Accounting Services Agreement (collectively with the Financial Reporting Services Agreement, the State Street Agreements) with State Street and the Investment Manager pursuant to which State Street provided accounting services to the Fund. Under the State Street Agreements, the Fund paid State Street an annual fee of $38,000 paid monthly plus an additional monthly fee based on an annualized percentage rate of average daily net assets of the Fund for the month. The aggregate fee did not exceed $140,000 per year (exclusive of out-of-pocket expenses and charges). The Fund also reimbursed State Street for certain out-of-pocket expenses and charges. Effective July 25, 2011, these services are provided under the Administrative Services Agreement discussed above.
Compensation of Board Members
Board members are compensated for their services to the Fund as disclosed in the Statement of Operations. The Trust’s eligible Trustees may participate in a Deferred Compensation Plan (the Plan) which may be terminated at any time. Obligations of the Plan will be paid solely out of the Fund’s assets.
Compensation of Chief Compliance Officer
The Board has appointed a Chief Compliance Officer to the Fund in accordance with federal securities regulations. The Fund, along with other affiliated funds, pays its pro-rata share of the expenses associated with the Chief Compliance Officer. The Fund’s expenses for the Chief Compliance Officer will not exceed $15,000 per year.
Transfer Agent Fees
Under a Transfer and Dividend Disbursing Agent Agreement, Columbia Management Investment Services Corp. (the Transfer Agent), an affiliate of the Investment Manager and a wholly-owned subsidiary of Ameriprise Financial, is responsible for providing transfer agency services to the Fund. The Transfer Agent has contracted with Boston Financial Data Services (BFDS) to serve as sub-transfer agent.
The Transfer Agent receives monthly account-based service fees based on the number of open accounts and is reimbursed by the Fund for the fees and expenses the Transfer Agent pays to financial intermediaries that maintain omnibus accounts with the Fund that is a percentage of the average aggregate value of the Fund’s shares maintained in each such omnibus account (other than omnibus accounts for which American Enterprise Investment Services Inc. is
the broker of record or accounts where the beneficial shareholder is a customer of Ameriprise Financial Services, Inc., which are paid a per account fee). The Transfer Agent pays the fees of BFDS for services as sub-transfer agent and is not entitled to reimbursement for such fees from the Fund (with the exception of out-of-pocket fees).
The Transfer Agent also receives compensation from fees for various shareholder services and reimbursements for certain out-of-pocket expenses. Class I shares do not pay transfer agent fees.
For the year ended March 31, 2012, the Fund’s effective transfer agent fee rates as a percentage of average daily net assets of each class were as follows:
| | | | |
| | | | |
| Class A | | | 0.27 | % |
| Class C | | | 0.26 | |
| Class R | | | 0.23 | |
| Class W | | | 0.28 | |
| Class Z | | | 0.27 | |
An annual minimum account balance fee of $20 may apply to certain accounts with a value below the Fund’s initial minimum investment requirements to reduce the impact of small accounts on transfer agent fees. These minimum account balance fees are recorded as part of expense reductions in the Statement of Operations. For the year ended March 31, 2012, these minimum account balance fees reduced total expenses by $3,006.
Distribution and Service Fees
The Fund has an agreement with Columbia Management Investment Distributors, Inc. (the Distributor), an affiliate of the Investment Manager and a wholly-owned subsidiary of Ameriprise Financial, for distribution and shareholder services. Pursuant to Rule 12b-1 under the 1940 Act, the Board has approved, and the Fund has adopted, distribution and shareholder service plans (the Plans) which set the distribution and service fees for the Fund. These fees are calculated daily and are intended to compensate the Distributor and/or eligible selling and/or servicing agents for selling shares of the Fund and providing services to investors.
The Plans require the payment of a monthly service fee to the Distributor at the maximum annual rate of 0.25% of the average daily net assets attributable to Class A, Class C and Class W shares of the Fund. The Plans also require the payment of a monthly distribution fee to the Distributor at the maximum annual rates of 0.75%, 0.50% and 0.25% of the average daily net assets attributable to Class C, Class R and Class W shares, respectively.
27
Columbia Emerging Markets Fund
March 31, 2012
The Fund may pay a distribution fee of up to 0.25% of the Fund’s average daily net assets attributable to Class W shares and a service fee of up to 0.25% of the Fund’s average daily net assets attributable to Class W shares, provided, however, that the aggregate fee shall not exceed 0.25% of the Fund’s average daily net assets attributable to Class W shares.
Sales Charges
Sales charges, including front-end charges and CDSCs, received by the Distributor for distributing Fund shares were $49,492 for Class A and $667 for Class C shares for the year ended March 31, 2012.
Expenses Waived/Reimbursed by the Investment Manager and its Affiliates
Effective July 1, 2011, the Investment Manager and certain of its affiliates have contractually agreed to waive fees and/or reimburse expenses (excluding certain fees and expenses described below), through July 31, 2012, unless sooner terminated at the sole discretion of the Board, so that the Fund’s net operating expenses, after giving effect to fees waived/expenses reimbursed and any balance credits and/or overdraft charges from the Fund’s custodian, do not exceed the following annual rates as a percentage of the class’ average daily net assets:
| | | | |
| | | | |
| Class A | | | 1.95 | % |
| Class C | | | 2.70 | |
| Class I | | | 1.62 | |
| Class R | | | 2.20 | |
| Class W | | | 1.95 | |
| Class Z | | | 1.70 | |
Under the agreement, the following fees and expenses are excluded from the waiver/reimbursement commitment, and therefore will be paid by the Fund, if applicable: taxes (including foreign transaction taxes), expenses associated with investments in affiliated and non-affiliated pooled investment vehicles (including mutual funds and exchange traded funds), transaction costs and brokerage commissions, costs related to any securities lending program, dividend expenses associated with securities sold short, inverse floater program fees and expenses, transaction charges and interest on borrowed money, interest, extraordinary expenses and any other expenses the exclusion of which is specifically approved by the
Board. This agreement may be modified or amended only with approval from all parties.
Prior to July 1, 2011, the Investment Manager voluntarily agreed to reimburse a portion of the Fund’s expenses (excluding certain expenses, such as brokerage commissions, interest, taxes and extraordinary expenses, but including custodian charges relating to overdrafts, if any) so that the Fund’s ordinary net operating expenses, after giving effect to fees waived/expenses reimbursed and any balance credits and/or overdraft charges from the Fund’s custodian, did not exceed the following annual rates as a percentage of the class’ average daily net assets:
| | | | |
| | | | |
| Class A | | | 1.65 | % |
| Class C | | | 2.40 | |
| Class I | | | 1.33 | |
| Class R | | | 1.90 | |
| Class W | | | 1.65 | |
| Class Z | | | 1.40 | |
Note 4. Federal Tax Information
The timing and character of income and capital gain distributions are determined in accordance with income tax regulations, which may differ from GAAP because of temporary or permanent book to tax differences.
For the year ended March 31, 2012, these differences are primarily due to differing treatment for deferral/reversal of wash sale losses, distributions, Trustees deferred compensation, foreign capital gains tax, foreign currency transactions and passive foreign investment company (PFIC) holdings. To the extent these differences are permanent, reclassifications are made among the components of the Fund’s net assets in the Statement of Assets and Liabilities. Temporary differences do not require reclassifications. In the Statement of Assets and Liabilities the following reclassifications were made:
| | | | |
| | | | |
| Overdistributed net investment income | | $ | (203,713 | ) |
| Accumulated net realized gain | | | 273,330 | |
| Paid-in capital | | | (69,617 | ) |
Net investment income and net realized gains (losses), as disclosed in the Statement of Operations, and net assets were not affected by this reclassification.
28
Columbia Emerging Markets Fund
March 31, 2012
The tax character of distributions paid during the years indicated was as follows:
| | | | | | | | |
| Year ended March 31, | | 2012 | | | 2011 | |
| Ordinary income* | | $ | — | | | $ | 3,268,726 | |
| Long-term capital gains | | | 23,090,748 | | | | 54,241,480 | |
| * | Short-term capital gain distributions, if any, are considered ordinary income distributions for tax purposes. |
At March 31, 2012, the components of distributable earnings on a tax basis were as follows:
| | | | |
| | | | |
| Undistributed ordinary income | | $ | — | |
| Undistributed accumulated long-term gain | | | 20,865,965 | |
| Unrealized appreciation | | | 97,363,573 | |
At March 31, 2012, the cost of investments for federal income tax purposes was $390,846,820 and the aggregate gross unrealized appreciation and depreciation based on that cost was:
| | | | |
| | | | |
| Unrealized appreciation | | $ | 104,946,620 | |
| Unrealized depreciation | | $ | (7,583,047 | ) |
| | | | |
| Net unrealized appreciation | | $ | 97,363,573 | |
The following capital loss carryforward, determined at March 31, 2012, may be available to reduce taxable income arising from future net realized gains on investments, if any, to the extent permitted by the Internal Revenue Code:
| | | | |
| | | | |
| Year of expiration | | Amount | |
| 2014 | | $ | 36,739 | |
On December 22, 2010, the Regulated Investment Company Modernization Act of 2010 (the Act) was enacted, which changed various technical rules governing the tax treatment of regulated investment companies. The changes are generally effective for taxable years beginning after the date of enactment. Under the Act, the Fund will be permitted to carry forward capital losses incurred in taxable years beginning after the date of enactment for an unlimited period. However, any losses incurred during those future taxable years will be required to be utilized prior to the losses incurred in pre-enactment taxable years, which carry an expiration date. As a result of this ordering rule, pre-enactment capital loss carryforwards may be more likely to expire unused.
For the year ended March 31, 2012, $249,452 of capital loss carryforward was utilized.
Under current tax rules, regulated investment companies can elect to treat certain late-year ordinary losses incurred and post-October capital losses (capital losses realized after October 31) as arising on the first day of the following taxable year.
Management of the Fund has concluded that there are no significant uncertain tax positions that would require recognition in the financial statements. However, management’s conclusion may be subject to review and adjustment at a later date based on factors including, but not limited to, new tax laws, regulations, and administrative interpretations (including relevant court decisions). Generally, the Fund’s federal tax returns for the prior three fiscal years remain subject to examination by the Internal Revenue Service.
Note 5. Portfolio Information
The cost of purchases and proceeds from sales of securities, excluding short-term obligations, aggregated to $540,163,749 and $523,482,456, respectively, for the year ended March 31, 2012.
Note 6. Lending of Portfolio Securities
Effective July 25, 2011, the Fund has entered into a Master Securities Lending Agreement (the Agreement) with JPMorgan Chase Bank, N.A. (JPMorgan). The Agreement, which replaces the previous securities lending arrangement with State Street, authorizes JPMorgan as lending agent to lend securities to authorized borrowers in order to generate additional income on behalf of the Fund. Pursuant to the Agreement, the securities loaned are secured by cash or U.S. government securities equal to at least 100% of the market value of the loaned securities. Any additional collateral required to maintain those levels due to market fluctuations of the loaned securities is requested to be delivered the following business day. Cash collateral received is invested by the lending agent on behalf of the Fund into authorized investments pursuant to the Agreement. The investments made with the cash collateral are listed in the Portfolio of Investments. The values of such investments and any uninvested cash collateral are disclosed in the Statement of Assets and Liabilities along with the related obligation to return the collateral upon the return of the securities loaned.
Risks of delay in recovery of securities or even loss of rights in the securities may occur should the borrower of the securities fail financially. Risks may also arise to the extent that the value of the securities loaned increases above the value of the collateral received.
29
Columbia Emerging Markets Fund
March 31, 2012
JPMorgan will indemnify the Fund from losses resulting from a borrower’s failure to return a loaned security when due. Such indemnification does not extend to losses associated with declines in the value of cash collateral investments. The Investment Manager is not responsible for any losses incurred by the Fund in connection with the securities lending program. Loans are subject to termination by the Fund or the borrower at any time, and are, therefore, not considered to be illiquid investments.
Pursuant to the Agreement, the Fund receives income for lending its securities either in the form of fees or by earning interest on invested cash collateral, net of negotiated rebates paid to borrowers and fees paid to the lending agent for services provided and any other securities lending expenses. Net income earned from securities lending for the year ended March 31, 2012 is disclosed in the Statement of Operations. The Fund continues to earn and accrue interest and dividends on the securities loaned.
Prior to July 25, 2011, the Fund participated in a securities lending arrangement with State Street. Each security on loan was collateralized in an amount at least equal to the market value of the securities loaned plus accrued income from the investment of collateral. The income generated by the investment of the collateral, net of any fees remitted to State Street as the lending agent and borrower rebates, was paid to the Fund.
At March 31, 2012, securities valued at $18,683,359 were on loan, secured by cash collateral of $19,489,471 (which does not reflect calls for collateral made to borrowers by JPMorgan at period end) that is partially or fully invested in short-term securities or other cash equivalents.
Note 7. Custody Credits
Prior to July 25, 2011, the Fund had an agreement with its custodian bank under which custody fees may have been reduced by balance credits. These credits are recorded as part of expense reductions on the Statement of Operations. The Fund could have invested a portion of the assets utilized in connection with the expense offset arrangement in an income-producing asset if they had not entered into such an agreement. Subsequent to this date, the Fund may invest its daily balance in an affiliated money market fund as detailed below. For the period April 1, 2011 through July 25, 2011, these credits reduced total expenses by $26.
Note 8. Affiliated Money Market Fund
Effective July 25, 2011, the Fund may invest its daily cash balances in Columbia Short-Term Cash Fund, an affiliated money market
fund established for the exclusive use by the Fund and other affiliated funds. The income earned by the Fund from such investments is included as “Dividends from affiliates” in the Statement of Operations. As an investing fund, the Fund indirectly bears its proportionate share of the expenses of Columbia Short-Term Cash Fund.
Note 9. Shareholder Concentration
At March 31, 2012, two unaffiliated shareholder accounts owned an aggregate of 31.5% of the outstanding shares of the Fund. The Fund has no knowledge about whether any portion of those shares was owned beneficially by such accounts. Affiliated shareholder accounts owned 45.9% of the outstanding shares of the Fund. Subscription and redemption activity by concentrated accounts may have a significant effect on the operations of the Fund.
Note 10. Line of Credit
The Fund has entered into a revolving credit facility with a syndicate of banks led by JPMorgan, whereby the Fund may borrow for the temporary funding of shareholder redemptions or for other temporary or emergency purposes. The credit facility became effective on July 25, 2011, replacing a prior credit facility. The credit facility agreement, as amended, which is a collective agreement between the Fund and certain other funds managed by the Investment Manager, severally and not jointly, permits collective borrowings up to $500 million. Pursuant to a December 13, 2011 amendment to the credit facility agreement, interest is charged to each participating fund based on its borrowings at a rate equal to the higher of (i) the overnight federal funds rate plus 1.00% or (i) the one-month LIBOR rate plus 1.00%. Each borrowing under the credit facility matures no later than 60 days after the date of borrowing. The Fund also pays a commitment fee equal to its pro rata share of the amount of the credit facility at a rate of 0.08% per annum. For the period July 25, 2011 through December 13, 2011, interest was charged to each participating fund based on its borrowings at a rate equal to the sum of the federal funds rate plus (i) 1.25% per annum plus (ii) if one-month LIBOR exceeds the federal funds rate, the amount of such excess. The Fund also paid a commitment fee equal to its pro rata share of the amount of the credit facility at a rate of 0.10% per annum.
For the period June 27, 2011 through July 24, 2011, the Fund and certain other funds managed by the Investment Manager participated in a $100 million committed, unsecured revolving credit facility provided by State Street. For the period May 16, 2011 through June 26, 2011, the collective borrowing amount of the credit facility
30
Columbia Emerging Markets Fund
March 31, 2012
was $150 million committed, unsecured revolving credit facility provided by State Street. Prior to May 16, 2011, the collective borrowing amount of the credit facility was $225 million. Interest was charged to each fund based on its borrowings at a rate equal to the greater of the (i) federal funds rate plus 1.25% per annum or (ii) the overnight LIBOR rate plus 1.25% per annum. The Fund also paid a commitment fee equal to its pro rata share of the amount of the credit facility at a rate of 0.125% per annum.
For the year ended March 31, 2012, the average daily loan balance outstanding on days when borrowing existed was $1,967,857 at a weighted average interest rate of 1.38%.
Note 11. Significant Risks
Foreign Securities Risk
Investing in foreign securities may include certain risks and considerations not typically associated with investing in U.S. securities, such as fluctuating currency values and changing local and regional economic, political and social conditions, which may result in greater market volatility. In addition, certain foreign securities may not be as liquid as U.S. securities. Investing in emerging markets may accentuate these risks.
Investments in emerging market countries are subject to additional risk. The risk of foreign investments is typically increased in less developed countries. These countries are also more likely to experience high levels of inflation, deflation or currency devaluation which could hurt their economies and securities markets.
Note 12. Subsequent Events
Management has evaluated the events and transactions that have occurred through the date the financial statements were issued and noted no items requiring adjustment of the financial statements or additional disclosure.
Note 13. Information Regarding Pending and Settled Legal Proceedings
In December 2005, without admitting or denying the allegations, American Express Financial Corporation (AEFC, which is now known as Ameriprise Financial, Inc. (Ameriprise Financial)) entered into settlement agreements with the Securities and Exchange Commission (SEC) and Minnesota Department of Commerce
(MDOC) related to market timing activities. As a result, AEFC was censured and ordered to cease and desist from committing or causing any violations of certain provisions of the Investment Advisers Act of 1940, the Investment Company Act of 1940, and various Minnesota laws. AEFC agreed to pay disgorgement of $10 million and civil money penalties of $7 million. AEFC also agreed to retain an independent distribution consultant to assist in developing a plan for distribution of all disgorgement and civil penalties ordered by the SEC in accordance with various undertakings detailed at www.sec.gov/litigation/admin/ia-2451.pdf. Ameriprise Financial and its affiliates have cooperated with the SEC and the MDOC in these legal proceedings, and have made regular reports to the funds’ Boards of Trustees.
Ameriprise Financial and certain of its affiliates have historically been involved in a number of legal, arbitration and regulatory proceedings, including routine litigation, class actions, and governmental actions, concerning matters arising in connection with the conduct of their business activities. Ameriprise Financial believes that the Funds are not currently the subject of, and that neither Ameriprise Financial nor any of its affiliates are the subject of, any pending legal, arbitration or regulatory proceedings that are likely to have a material adverse effect on the Funds or the ability of Ameriprise Financial or its affiliates to perform under their contracts with the Funds. Ameriprise Financial is required to make 10-Q, 10-K and, as necessary, 8-K filings with the Securities and Exchange Commission on legal and regulatory matters that relate to Ameriprise Financial and its affiliates. Copies of these filings may be obtained by accessing the SEC website at www.sec.gov.
There can be no assurance that these matters, or the adverse publicity associated with them, will not result in increased fund redemptions, reduced sale of fund shares or other adverse consequences to the Funds. Further, although we believe proceedings are not likely to have a material adverse effect on the Funds or the ability of Ameriprise Financial or its affiliates to perform under their contracts with the Funds, these proceedings are subject to uncertainties and, as such, we are unable to estimate the possible loss or range of loss that may result. An adverse outcome in one or more of these proceedings could result in adverse judgments, settlements, fines, penalties or other relief that could have a material adverse effect on the consolidated financial condition or results of operations of Ameriprise Financial.
31
Report of Independent Registered Public Accounting Firm
To the Trustees of Columbia Funds Series Trust I and the Shareholders of Columbia Emerging Markets Fund
In our opinion, the accompanying statement of assets and liabilities, including the investment portfolio, and the related statements of operations and of changes in net assets and the financial highlights present fairly, in all material respects, the financial position of Columbia Emerging Markets Fund (the “Fund”) (a series of Columbia Funds Series Trust I) at March 31, 2012, the results of its operations for the year then ended, the changes in its net assets for each of the two years in the period then ended and the financial highlights for the periods indicated, in conformity with accounting principles generally accepted in the United States of America. These financial statements and financial highlights (hereafter referred to as “financial statements”) are the responsibility of the Fund’s management. Our responsibility is to express an opinion on these financial statements based on our audits. We conducted our audits of these financial statements in accordance with the standards of the Public Company Accounting Oversight Board (United States). Those standards require that we plan and perform the audit to obtain reasonable assurance about whether the financial statements are free of material misstatement. An audit includes examining, on a test basis, evidence supporting the amounts and disclosures in the financial statements, assessing the accounting principles used and significant estimates made by management, and evaluating the overall financial statement presentation. We believe that our audits, which included confirmation of securities at March 31, 2012 by correspondence with the custodian, transfer agent and brokers, provide a reasonable basis for our opinion.
PricewaterhouseCoopers LLP
Minneapolis, Minnesota
May 22, 2012
32
Federal Income Tax Information (Unaudited) – Columbia Emerging Markets Fund
The Fund hereby designates as a capital gain dividend with respect to the fiscal year ended March 31, 2012, $22,116,690 or, if subsequently determined to be different, the net capital gain of such year.
Foreign taxes paid during the fiscal year ended March 31, 2012, of $1,165,557 are being passed through to shareholders. This represents $0.03 per share. Eligible shareholders may claim this amount as a foreign tax credit.
Gross income derived from sources within foreign countries was $10,998,587 ($0.24 per share) for the fiscal year ended March 31, 2012.
The Fund will notify shareholders in January 2013 of amounts for use in preparing 2012 income tax returns.
33
Fund Governance
The Trustees serve terms of indefinite duration. The names, addresses and birth years of the Trustees and Officers of the Funds in Columbia Funds Series Trust I, the year each was first elected or appointed to office, their principal business occupations during at least the last five years, the number of Funds overseen by each Trustee and other directorships they hold are shown below. Each officer listed below serves as an officer of each Fund in Columbia Funds Series Trust I.
Independent Trustees
| | |
Name, address and year of birth,
Position with funds, Year first
elected or appointed to office | | Principal occupation(s) during past five years, Number of funds in Columbia Funds
Complex overseen by trustee, Other directorships Held |
| |
| Rodman L. Drake (born 1943) | | |
c/o Columbia Management Investment Advisers, LLC 225 Franklin Street Boston, MA 02110 Trustee (since 1994) and Chairman of the Board (since 2009) | | Independent consultant since 2010; Co-Founder of Baringo Capital LLC (private equity) from 1997 to 2008; CEO of Crystal River Capital, Inc. (real estate investment trust) from 2003 to 2010; Oversees 51; Jackson Hewitt Tax Service Inc. (tax preparation services) from 2004 to 2011; Celgene Corporation (global biotechnology company); Student Loan Corporation (student loan provider) from 2005 to 2010; Celgene Corporation (global biotechnology company); The Helios Funds and Brookfield Funds (closed-end funds); Crystal River Capital, Inc. from 2005 to 2010; Parsons Brinckerhoff from 1995 to 2008; and Apex Silver Mines Ltd. from 2007 to 2009 |
| |
| Douglas A. Hacker (born 1955) | | |
c/o Columbia Management Investment Advisers, LLC 225 Franklin Street Boston, MA 02110 Trustee (since 1996) | | Independent business executive since May 2006; Executive Vice President–Strategy of United Airlines from December 2002 to May 2006; President of UAL Loyalty Services (airline marketing company) from September 2001 to December 2002; Executive Vice President and Chief Financial Officer of United Airlines from July 1999 to September 2001. Oversees 51; Nash Finch Company (food distributor); Aircastle Limited (aircraft leasing); and SeaCube Container Leasing Ltd (container leasing) |
|
| Janet Langford Kelly (born 1957) |
c/o Columbia Management Investment Advisers, LLC 225 Franklin Street Boston, MA 02110 Trustee (since 1996) | | Senior Vice President, General Counsel and Corporate Secretary, ConocoPhillips (integrated energy company) since September 2007; Deputy General Counsel–Corporate Legal Services, ConocoPhillips from August 2006 to August 2007; Partner, Zelle, Hofmann, Voelbel, Mason & Gette LLP (law firm) from March 2005 to July 2006; Adjunct Professor of Law, Northwestern University, from September 2004 to June 2006; Director, UAL Corporation (airline) from February 2006 to July 2006; Chief Administrative Officer and Senior Vice President, Kmart Holding Corporation (consumer goods) from September 2003 to March 2004; Oversees 51; None |
|
| Nancy T. Lukitsh (born 1956) |
c/o Columbia Management Investment Advisers, LLC 225 Franklin Street Boston, MA 02110 Trustee (since 2011) | | Senior Vice President, Partner and Director of Marketing, Wellington Management Company, LLP (investment adviser) from 1997 to 2010; Chair, Wellington Management Investment Portfolios (commingled non-U.S. investment pools) from 2007 to 2010; Director, Wellington Trust Company, NA and other Wellington affiliates from 1997 to 2010. Oversees 51; None |
|
| William E. Mayer (born 1940) |
c/o Columbia Management Investment Advisers, LLC 225 Franklin Street Boston, MA 02110 Trustee (since 1994) | | Partner, Park Avenue Equity Partners (private equity) since February 1999; Dean and Professor, College of Business and Management, University of Maryland from 1992 to 1996. Oversees 51; DynaVox Inc. (speech creation); Lee Enterprises (print media), WR Hambrecht + Co. (financial service provider) from 2000 to 2012; BlackRock Kelso Capital Corporation (investment company) |
34
Fund Governance (continued)
Independent Trustees (continued)
| | |
Name, address and year of birth,
Position with funds, Year first
elected or appointed to office | | Principal occupation(s) during past five years, Number of funds in Columbia Funds
Complex overseen by trustee, Other directorships held |
| |
| David M. Moffett (born 1952) | | |
c/o Columbia Management Investment Advisers, LLC 225 Franklin Street Boston, MA 02110 Trustee (since 2011) | | Retired. Chief Executive Officer, Federal Home Loan Mortgage Corporation, from 2008 to 2009; Senior Adviser, Global Financial Services Group, Carlyle Group, Inc., from 2007 to 2008; Vice Chairman and Chief Financial Officer, U.S. Bancorp, from 1993 to 2007. Oversees 51; CIT Group Inc. (commercial and consumer finance), eBay Inc. (online trading community), MBIA Corp (financial service provider), E.W. Scripps Co. (print and television media), Building Materials Holding Corp. (building materials and construction services), and University of Oklahoma Foundation. |
| |
| Charles R. Nelson (born 1942) | | |
c/o Columbia Management Investment Advisers, LLC 225 Franklin Street Boston, MA 02110 Trustee (since 1981) | | Retired. Professor Emeritus, University of Washington, since 2011; Professor of Economics, University of Washington, from 1976 to 2011; Ford and Louisa Van Voorhis Professor of Political Economy, University of Washington, from 1993 to 2011; Adjunct Professor of Statistics, University of Washington, from 1980 to 2011; Associate Editor, Journal of Money Credit and Banking from 1993 to 2008; consultant on econometric and statistical matters. Oversees 51; None |
| |
| John J. Neuhauser (born 1943) | | |
c/o Columbia Management Investment Advisers, LLC 225 Franklin Street Boston, MA 02110 Trustee (since 1984) | | President, Saint Michael’s College, since August 2007; Director or Trustee of several non-profit organization, including Fletcher Allen Health Care, Inc.; University Professor, Boston College from November 2005 to August 2007; Academic Vice President and Dean of Faculties, Boston College from August 1999 to October 2005. Oversees 51; Liberty All-Star Equity Fund and Liberty All-Star Growth Fund, Inc. (closed-end funds) |
| |
| Patrick J. Simpson (born 1944) | | |
c/o Columbia Management Investment Advisers, LLC 225 Franklin Street Boston, MA 02110 Trustee (since 2000) | | Partner, Perkins Coie LLP (law firm). Oversees 51; None |
| |
| Anne-Lee Verville (born 1945) | | |
c/o Columbia Management Investment Advisers, LLC 225 Franklin Street Boston, MA 02110 Trustee (since 1998) | | Retired. General Manager–Global Education Industry from 1994 to 1997, President–Application Systems Division from 1991 to 1994, Chief Financial Officer–US Marketing & Services from 1988 to 1991, and Chief Information Officer from 1987 to 1988, IBM Corporation (computer and technology)). Oversees 51; Enesco Group, Inc. (producer of giftware and home and garden decor products) from 2001 to 2006 |
The Statement of Additional Information includes additional information about the Trustees of the Funds and is available, without charge, upon request by calling 1-800-345-6611.
35
Fund Governance (continued)
Interested Trustees
| | |
Name, address and year of birth,
Position with funds, Year first
elected or appointed to office | | Principal occupation(s) during past five years, Number of funds in Columbia Funds
Complex overseen by trustee, Other directorships held |
| |
| William F. Truscott (born 1960) | | |
53600 Ameriprise Financial Center Minneapolis, MN 55474 Senior Vice President (since 2010) | | Chairman of the Board, Columbia Management Investment Advisers, LLC since May 2010 and February 2012, respectively (previously President, Chairman of the Board and Chief Investment Officer, from 2001 to April 2010); Chief Executive Officer, U.S. Asset Management & President, Annuities, Ameriprise Financial, Inc. since May 2010 (previously President–U.S. Asset Management and Chief Investment Officer from 2005 to April 2010, and Senior Vice President–Chief Investment Officer, from 2001 to 2005); Director, President and Chief Executive Officer, Ameriprise Certificate Company since 2006; Director, Columbia Management Investment Distributors, Inc. since May 2010 and February 2012, respectively (previously Chairman of the Board and Chief Executive Officer from 2008 to April 2010); Chairman of the Board and Chief Executive Officer, RiverSource Distributors, Inc. since 2006. Oversees 51; Columbia Funds Board. |
Officers
| | |
| Name, Year of birth and address | | Principal occupation(s) during the past five years |
|
| J. Kevin Connaughton (born 1964) |
225 Franklin Street Boston, MA 02110 President (since 2009) | | Senior Vice President and General Manager–Mutual Fund Products, Columbia Management Investment Advisers, LLC since May 2010; President, Columbia Funds, since 2009, and RiverSource Funds, since May 2010 (previously Senior Vice President and Chief Financial Officer, Columbia Funds, from June 2008 to January 2009, Treasurer, Columbia Funds, from October 2003 to May 2008, and senior officer of various other affiliated funds since 2000); Managing Director, Columbia Management Advisors, LLC from December 2004 to April 2010. |
| |
| Michael G. Clarke (born 1969) | | |
225 Franklin Street Boston, MA 02110 Treasurer (since 2011) and Chief Financial Officer (since 2009) | | Vice President, Columbia Management Investment Advisers, LLC since May 2010; Managing Director of Fund Administration, Columbia Management Advisors, LLC, from September 2004 to April 2010; senior officer of Columbia Funds and affiliated funds since 2002. |
| |
| Scott R. Plummer (born 1959) | | |
5228 Ameriprise Financial Center Minneapolis, MN 55474 Senior Vice President, Assistant Secretary and Chief Legal Officer (since 2010) | | Chief Legal Officer and Assistant Secretary, Columbia Management Investment Advisers, LLC since June 2005; Vice President and Lead Chief Counsel–Asset Management, Ameriprise Financial, Inc. since May 2010 (previously Vice President and Chief Counsel–Asset Management, from 2005 to April 2010, and Vice President–Asset Management Compliance from 2004 to 2005); Vice President, Chief Counsel and Assistant Secretary, Columbia Management Investment Distributors, Inc. since 2008; Vice President, General Counsel and Secretary, Ameriprise Certificate Company since 2005; Chief Counsel, RiverSource Distributors, Inc. since 2006; Vice President, General Counsel and Secretary, RiverSource Funds, since December 2006; Senior Vice President, Secretary and Chief Legal Officer, Columbia Funds, since May 2010. |
| |
| Thomas P. McGuire (born 1972) | | |
225 Franklin Street Boston, MA 02110 Chief Compliance Officer (since 2012) | | Vice President–Asset Management Compliance, Columbia Management Investment Advisers, LLC since March 2010; Chief Compliance Officer, Ameriprise Certificate Company, since September 2010; Compliance Executive, Bank of America, from June 2005 to April 2010. |
36
Fund Governance (continued)
Officers (continued)
| | |
| Name, Year of birth and address | | Principal occupation(s) during the past five years |
| |
| Colin Moore (born 1958) | | |
225 Franklin Street Boston, MA 02110 Senior Vice President (since 2010) | | Director and Chief Investment Officer, Columbia Management Investment Advisers, LLC since May 2010; Manager, Managing Director and Chief Investment Officer of Columbia Management Advisors, LLC from 2007 to April 2010; Head of Equities, Columbia Management Advisors, LLC from 2002 to 2007. |
| |
| Amy Johnson (born 1965) | | |
5228 Ameriprise Financial Center Minneapolis, MN 55474 Vice President (since 2010) | | Senior Vice President and Chief Operating Officer, Columbia Management Investment Advisers, LLC since May 2010 (previously Chief Administrative Officer, from 2009 until April 2010, Vice President–Asset Management and Trust Company Services, from 2006 to 2009, and Vice President–Operations and Compliance from 2004 to 2006). |
| |
| Joseph F. DiMaria (born 1968) | | |
225 Franklin Street Boston, MA 02110 Vice President (since 2011) and Chief Accounting Officer (since 2008) | | Vice President, Mutual Fund Administration, Columbia Management Investment Advisers, LLC, since May 2010; Director of Fund Administration, Columbia Management Advisors, LLC from January 2006 to April 2010; Head of Tax/Compliance and Assistant Treasurer, Columbia Management Advisors, LLC, from November 2004 to December 2005. |
| |
| Stephen T. Welsh (born 1957) | | |
225 Franklin Street Boston, MA 02110 Vice President (since 2006) | | President and Director, Columbia Management Investment Services Corp. since May 2010; President and Director, Columbia Management Services, Inc. from July 2004 to April 2010; Managing Director, Columbia Management Distributors, Inc. from August 2007 to April 2010. |
| |
| Paul D. Pearson (born 1956) | | |
5228 Ameriprise Financial Center Minneapolis, MN 55474 Vice President and Assistant Treasurer (since 2011) | | Vice President, Investment Accounting, Columbia Management Investment Advisers, LLC, since May 2010; Vice President, Managed Assets, Investment Accounting, Ameriprise Financial Corporation. |
| |
| Paul B. Goucher (born 1968) | | |
5228 Ameriprise Financial Center Minneapolis, MN 55474 Vice President and Assistant Secretary (since 2010) | | Vice President and Chief Counsel of Ameriprise Financial since January 2010 (formerly Vice President and Group Counsel from November 2008 to January 2010); Director, Managing Director and General Counsel of J. & W. Seligman & Co. Incorporated (Seligman) from July 2008 to November 2008 and Managing Director and Associate General Counsel of Seligman from January 2005 to July 2008. |
| |
| Christopher O. Petersen (born 1970) | | |
5228 Ameriprise Financial Center Minneapolis, MN 55474 Vice President (since 2010) and Secretary (since 2011) | | Vice President and Chief Counsel, Ameriprise Financial since January 2010 (formerly Vice President and Group Counsel or Counsel from April 2004 to January 2010); Assistant Secretary of RiverSource Funds since January 2007; officer of Columbia Funds and affiliated Funds since 2007. |
| |
| Michael E. DeFao (born 1968) | | |
225 Franklin Street Boston, MA 02110 Vice President and Assistant Secretary (since 2011) | | Vice President and Chief Counsel, Ameriprise Financial since May 2010; Associate General Counsel Bank of America from June 2005 to April 2010. |
37
Board Consideration and Approval of Advisory Agreement
On March 7, 2012, the Board of Trustees (the “Board”) and the Trustees who are not interested persons (as defined in the Investment Company Act of 1940) of the Trust (the “Independent Trustees”) unanimously approved the continuation of the Investment Management Services Agreement (the “Advisory Agreement”) with Columbia Management Investment Advisers, LLC (the “Investment Manager”) with respect to Columbia Emerging Markets Fund (the “Fund”), a series of the Trust. As detailed below, the Advisory Fees and Expenses Committee (the “Committee”) and the Board met on multiple occasions to review and discuss, both among themselves and with the management team of the Investment Manager, materials provided by the Investment Manager before determining to approve the continuation of the Advisory Agreement.
In connection with their deliberations regarding the continuation of the Advisory Agreement, the Committee and the Board requested and evaluated materials from the Investment Manager regarding the Fund and the Advisory Agreement, and discussed these materials with representatives of the Investment Manager at the Committee meeting held on March 6, 2012 and at the Board meeting held on March 7, 2012. In addition, the Board considers matters bearing on the Agreement at most of its other meetings throughout the year and meets regularly with senior management of the Funds and the Investment Manager. Through the Board’s Investment Oversight Committees, Trustees also meet with selected Fund portfolio managers and other investment personnel at various times throughout the year. The Committee and the Board also consulted with Fund counsel and with the Independent Trustees’ independent legal counsel, who advised on the legal standard for consideration by the Board and otherwise assisted the Board in its deliberations. On March 6, 2012, the Committee recommended that the Board approve the continuation of the Advisory Agreement. On March 7, 2012, the Board, including the Independent Trustees, voting separately, unanimously approved the continuation of the Advisory Agreement for the Fund.
The Committee and the Board considered all information that they, their legal counsel, or the Investment Manager believed reasonably necessary to evaluate and to determine whether to approve the continuation of the Advisory Agreement. In their deliberations, the Trustees did not identify any particular information that was all-important or controlling, and individual Trustees may have attributed different weights to the various factors. The information and factors considered by the Committee and the Board in
recommending for approval or approving the continuation of the Advisory Agreement for the Fund included the following:
| n | | Information on the investment performance of the Fund relative to the performance of the Fund’s benchmarks and the performance of a group of comparable mutual funds, as determined by an independent third-party data provider; |
| n | | Information on the Fund’s advisory fees and total expenses, including information comparing the Fund’s expenses to those of a group of comparable mutual funds, as determined by an independent third-party data provider; |
| n | | The Investment Manager’s agreement to contractually limit or cap total operating expenses for the Fund so that total operating expenses (excluding certain fees and expenses, such as transaction costs and certain other investment related expenses, interest, taxes, acquired fund fees and expenses, and extraordinary expenses) would not exceed the median expenses of a group of comparable funds (as determined from time to time, generally annually, by an independent third-party data provider); |
| n | | The terms and conditions of the Advisory Agreement, including that the advisory fee rates payable by the Fund would not change; |
| n | | The terms and conditions of other agreements and arrangements with affiliates of the Investment Manager relating to the operations of the Fund, including the Administrative Services Agreement, the Distribution Agreement and the Transfer and Dividend Disbursing Agent Agreement, noting in the case of the Transfer and Dividend Disbursing Agent Agreement certain proposed changes to the fee rates payable thereunder; |
| n | | Descriptions of various functions performed by the Investment Manager under the Advisory Agreement, including portfolio management and portfolio trading practices; |
| n | | Information regarding the management fees and investment performance of any comparable portfolios of other clients of the Investment Manager, including institutional separate accounts; and |
| n | | The profitability to the Investment Manager and its affiliates from their relationships with the Fund. |
Nature, Extent and Quality of Services to be Provided under the Advisory Agreement
The Committee and the Board considered the nature, extent and quality of services provided to the Fund by the Investment Manager
38
and its affiliates under the Advisory Agreement and under separate agreements for the provision of transfer agency and administrative services, and the resources dedicated to the Fund and the other Columbia Funds by the Investment Manager and its affiliates. The Committee and the Board considered, among other things, the Investment Manager’s ability to attract, motivate and retain highly qualified research, advisory and supervisory investment professionals (including personnel and other resources, compensation programs for personnel involved in fund management, reputation and other attributes), the portfolio management services provided by those investment professionals, the quality of the Investment Manager’s investment research capabilities and trade execution services, and the other resources that the Investment Manager devotes to the Fund. The Committee and the Board also considered the potential benefits to shareholders of investing in a mutual fund that is part of a fund complex offering exposure to a variety of asset classes and investment disciplines and providing a variety of fund and shareholder services.
The Committee and the Board also considered the professional experience and qualifications of the senior personnel of the Investment Manager. The Committee and the Board noted the compliance programs of and the compliance-related resources provided to the Fund by the Investment Manager and its affiliates, and considered the Investment Manager’s ability to provide administrative services to the Fund pursuant to a separate administrative services agreement, including the Investment Manager’s ability to coordinate the activities of the Fund’s other service providers. After reviewing these and related factors, the Committee and the Board concluded, within the context of their overall conclusions, that the expected nature, extent and quality of the services to be provided to the Fund under the Advisory Agreement supported the continuation of such agreement.
Investment Performance
The Committee and the Board reviewed information about the performance of the Fund over various time periods, including performance information relative to benchmarks and information based on reports of an independent third-party data provider that compared the performance of the Fund to the performance of a group of comparable mutual funds. The Committee and the Board also reviewed a description of the third party’s methodology for identifying the Fund’s peer groups for purposes of performance and expense comparisons. In the case of each Fund whose performance lagged that of a relevant peer group for certain (although not necessarily all) periods, the Committee and the Board concluded that
other factors relevant to performance were sufficient, in light of other considerations, to warrant continuation of the Fund’s Advisory Agreement. Those factors varied from fund to fund, but included one or more of the following: (i) that the Fund’s performance, although lagging in certain recent periods, was stronger over the longer term; (ii) that the underperformance was attributable, to a significant extent, to investment decisions that were reasonable and consistent with the Fund’s investment strategy and policies and that the Fund was performing within a reasonable range of expectations, given those investment decisions, market conditions and the Fund’s investment strategy; (iii) that the Fund’s performance was competitive when compared to other relevant performance benchmarks or peer groups; and (iv) that the Investment Manager had taken or was taking steps designed to help improve the Fund’s investment performance, including, but not limited to, replacing portfolio managers, enhancing the resources supporting the portfolio managers, or modifying investment strategies.
The Committee and the Board noted that, through December 31, 2011, the Fund’s performance was in the forty-third, twenty-seventh, and sixty-second percentiles (where the best performance would be in the first percentile) of its category selected by an independent third-party data provider for the purposes of performance comparisons for the one-, three- and five- year periods, respectively.
The Committee and the Board also considered the Investment Manager’s performance and reputation generally, the Investment Manager’s historical responsiveness to Board concerns about performance and the Investment Manager’s willingness to take steps intended to improve performance. After reviewing these and related factors, the Committee and the Board concluded, within the context of their overall conclusions regarding the Advisory Agreement, that the performance of the Fund and the Investment Manager was sufficient, in light of other considerations, to warrant the continuation of the Advisory Agreement.
Investment Advisory Fee Rates and Other Expenses
The Committee and the Board considered the advisory fees to be charged to the Fund under the Advisory Agreement as well as the total expenses to be incurred by the Fund. In assessing the reasonableness of the fees under the Advisory Agreement, the Committee and the Board considered, among other information, the Fund’s advisory fee and its expected total expense ratio as a percentage of average daily net assets. The Committee and the Board noted that the Fund’s actual management fee and total net
39
expense ratio are ranked in the fifth and fourth quintiles, respectively, against the Fund’s expense universe as determined by an independent third-party data provider for purposes of expense comparison. The Committee and the Board also took into account the fee waiver and expense limitation arrangements agreed to by the Investment Manager, as noted above.
The Committee and the Board also considered the fact that the advisory fee rates payable by the Fund to the Investment Manager under the Advisory Agreement were the same as those currently paid by the Fund to the Investment Manager.
The Committee and the Board also received and considered information about the advisory fees charged by the Investment Manager to institutional separate accounts. In considering the fees charged to those accounts, the Committee and the Board took into account, among other things, the Investment Manager’s representations about the differences between managing mutual funds as compared to other types of accounts, including differences in the services provided, differences in the risk profile of such business for the Investment Manager and the additional resources required to manage mutual funds effectively. In evaluating the Fund’s advisory fees, the Committee and the Board also took into account the demands, complexity and quality of the investment management of the Fund.
After reviewing these and related factors, the Committee and the Board concluded, within the context of their overall conclusions, that the advisory fee rates and expenses of the Fund supported the continuation of the Advisory Agreement.
Costs of Services to be Provided and Profitability
The Committee and the Board also took note of the costs of the services provided (both on an absolute and relative basis) and the profitability to the Investment Manager and its affiliates in connection with their relationships with the Fund. In evaluating these considerations, the Committee and the Board took note of the advisory fees charged by the Investment Manager to other clients, including fees charged by the Investment Manager to any institutional separate account clients with similar investment strategies to those of the Fund.
The Committee and the Board also considered the compensation directly or indirectly received by the Investment Manager’s affiliates in connection with their relationships with the Fund. The Committee and the Board reviewed information provided by management as to
the profitability of the Investment Manager and its affiliates of their relationships with the Fund, and information about the allocation of expenses used to calculate profitability. When reviewing profitability, the Committee and the Board also considered court cases in which adviser profitability was an issue in whole or in part, the performance of the fund, the expense ratio of the fund, and the implementation of expense limitations with respect to the fund. The Committee and the Board also considered information provided by the Investment Manager regarding its financial condition and comparing its profitability to that of other asset management firms that are, or are subsidiaries of, publicly traded companies.
After reviewing these and related factors, the Committee and the Board concluded, within the context of their overall conclusions, that the profitability to the Investment Manager and its affiliates from their relationships with the Fund supported the continuation of the Advisory Agreement.
Economies of Scale
The Committee and the Board considered the potential existence of economies of scale in the provision by the Investment Manager of services to the Fund, to groups of related funds, and to the Investment Manager’s investment advisory clients as a whole, and whether those economies of scale were shared with the Fund through breakpoints in investment advisory fees or other means, such as expense limitation arrangements and additional investments by the Investment Manager in investment, trading and compliance resources. The Committee and the Board noted that the investment advisory fee schedules for the Fund contained breakpoints that would reduce the fee rate on assets above specified threshold levels.
In considering these issues, the Committee and the Board also considered the costs of the services provided (both on an absolute and relative basis) and the profitability to the Investment Manager and its affiliates from their relationships with the Fund, as discussed above. After reviewing these and related factors, the Committee and the Board concluded, within the context of their overall conclusions, that the extent to which economies of scale were expected to be shared with the Fund supported the continuation of the Advisory Agreement.
Other Benefits to the Investment Manager
The Committee and the Board received and considered information regarding “fall-out” or ancillary benefits received by the Investment Manager and its affiliates as a result of their relationships with the Fund, such as the engagement of the Investment Manager to provide
40
administrative services to the Fund and the engagement of the Investment Manager’s affiliates to provide distribution and transfer agency services to the Fund. The Committee and the Board considered that the Fund’s distributor retains a portion of the distribution fees from the Fund and receives a portion of the sales charges on sales or redemptions of certain classes of shares of the Fund. The Committee and the Board also considered the benefits of research made available to the Investment Manager by reason of brokerage commissions generated by the Fund’s securities transactions, and reviewed information about the Investment Manager’s practices with respect to allocating portfolio brokerage for brokerage and research services. The Committee and the Board considered the possible conflicts of interest associated with certain fall-out or other ancillary benefits and the reporting, disclosure and other processes that would be in place to address such possible
conflicts of interest. The Committee and the Board recognized that the Investment Manager’s profitability would be somewhat lower without these benefits.
Conclusion
The Committee and the Board reviewed all of the above considerations in reaching their decisions to recommend or approve the continuation of the Advisory Agreement. No single item was identified as paramount or controlling, and individual Trustees may have attributed different weights to various factors. Based on their evaluation of all factors that they deemed to be material, including those factors described above, and assisted by the advice of independent legal counsel, the Board, including the Independent Trustees, voting separately, unanimously approved the continuation of the Advisory Agreement.
41
[THIS PAGE INTENTIONALLY LEFT BLANK]
42
[THIS PAGE INTENTIONALLY LEFT BLANK]
43
[THIS PAGE INTENTIONALLY LEFT BLANK]
44
Important Information About This Report
The fund mails one shareholder report to each shareholder address. If you would like more than one report, please call shareholder services at 1-800-345-6611 and additional reports will be sent to you. This report has been prepared for shareholders of Columbia Emerging Markets Fund.
A description of the policies and procedures that the fund uses to determine how to vote proxies and a copy of the fund’s voting records are available (i) at www.columbiamanagement.com, (ii) on the Securities and Exchange Commission’s website at www.sec.gov, and (iii) without charge, upon request, by calling 1-800-368-0346. Information regarding how the fund voted proxies relating to portfolio securities during the 12-month period ended June 30 is available from the SEC’s website. Information regarding how the fund voted proxies relating to portfolio securities is also available from the fund’s website, www.columbiamanagement.com.
The fund files a complete schedule of portfolio holdings with the SEC for the first and third quarters of each fiscal year on Form N-Q. The fund’s Form N-Q is available on the SEC’s website at www.sec.gov and may be reviewed and copied at the SEC’s Public Reference Room in Washington, D.C. Information on the operation of the Public Reference Room may be obtained by calling
1-800-SEC-0330.
Transfer Agent
Columbia Management Investment Services Corp.
P.O. Box 8081
Boston, MA 02266-8081
1-800-345-6611
Distributor
Columbia Management Investment
Distributors, Inc.
225 Franklin Street Boston, MA 02110
Investment Manager
Columbia Management Investment Advisers, LLC
225 Franklin Street Boston, MA 02110
45

Columbia Emerging Markets Fund
P.O. Box 8081
Boston, MA 02266-8081
columbiamanagement.com
This information is for use with concurrent or prior delivery of a fund prospectus. Investors should consider the investment objectives, risks, charges and expenses of a mutual fund carefully before investing. For a free prospectus, which contains this and other important information about the funds, visit columbiamanagement.com. Read the prospectus carefully before investing. The Fund is distributed by Columbia Management Investment Distributors, Inc., member FINRA, and managed by Columbia Management Investment Advisers, LLC.
©2012 Columbia Management Investment Advisers, LLC. All rights reserved.
C-1136 C (5/12)

Columbia Energy and Natural Resources Fund
Annual Report for the Period Ended March 31, 2012
Table of contents
The views expressed in this report reflect the current views of the respective parties. These views are not guarantees of future performance and involve certain risks, uncertainties and assumptions that are difficult to predict, so actual outcomes and results may differ significantly from the views expressed. These views are subject to change at any time based upon economic, market or other conditions and the respective parties disclaim any responsibility to update such views. These views may not be relied on as investment advice and, because investment decisions for a Columbia Fund are based on numerous factors, may not be relied on as an indication of trading intent on behalf of any particular Columbia Fund. References to specific securities should not be construed as a recommendation or investment advice.
President’s Message

Dear Shareholders,
A stock market rally that commenced in the fourth quarter of 2011 continued into 2012 in the United States and around the world, as all major market regions generated double-digit returns for the three-month period ended March 31, 2012. Volatility declined sharply as European debt fears quieted somewhat and sentiment improved. Returns in developed countries were buoyed by strong results in Germany, Belgium, Austria and the Nordic markets of Denmark, Finland, Norway and Sweden. Under the cloud of its own mounting debt problem, Spain was the only eurozone country to deliver a negative return during the three-month period. Solid economic growth and accommodative monetary policy helped boost gains in emerging markets. The rally in U.S. equities was largely driven by an expansion in “multiples”— an increase in
stock prices relative to their earnings. By the end of the first quarter of 2012, stocks no longer appeared as cheap as they were late in 2011. Bonds lagged stocks during the first quarter as investors responded to signs of an improved environment with a greater appetite for risk.
Concerns around the health of the global economy were centered in news headlines focusing on Washington D.C., Europe, China and the Middle East. In the United States, economic indicators remained mixed but generally indicated support for slow, sustainable economic growth. European policymakers have made progress in containing the eurozone debt crisis, though they still have not solved the issue of long-term solvency. The European Central Bank has lowered interest rates and flooded the financial system with liquidity that may provide breathing space for companies to restructure their balance sheets. These massive infusions of liquidity may whet the appetite for risk from investors around the world. However, it has delayed a true reckoning with the European financial situation, as concerns about Spain and Portugal continue to cloud the outlook. These structural challenges that persist in the developed world, and slowing growth in emerging market economies, leave the global economy in a fragile state. Domestic demand, combined with slowing inflationary trends, has also helped to shore up emerging market economies. Joblessness remains low and monetary conditions remain easy.
Despite the challenges and surprises of 2011, we see pockets of strength — and as a result, attractive opportunities — both here and abroad for 2012. We hope to help you capitalize on these opportunities with various articles in our 2012 Perspectives, which is available via the Market Insights tab at columbiamanagement.com. This publication showcases the strong research capabilities and experienced investment teams of Columbia Management and offers a diverse array of investment ideas based on our five key themes for 2012.
Other information and resources available at columbiamanagement.com include:
| n | | detailed up-to-date fund performance and portfolio information |
| n | | economic analysis and market commentary |
| n | | quarterly fund commentaries |
| n | | Columbia Management Investor, our award-winning quarterly newsletter for shareholders |
Thank you for your continued support of the Columbia Funds. We look forward to serving your investment needs for many years to come.
Best Regards,

J. Kevin Connaughton
President, Columbia Funds
Investors should consider the investment objectives, risks, charges and expenses of a mutual fund carefully before investing. For a free prospectus, which contains this and other important information about the funds, visit columbiamanagement.com. The prospectus should be read carefully before investing.
Columbia Funds are distributed by Columbia Management Investment Distributors, Inc., member FINRA, and managed by Columbia Management Investment Advisers, LLC.
© 2012 Columbia Management Investment Advisers, LLC. All rights reserved.
Fund Profile – Columbia Energy and Natural Resources Fund
Summary
| n | | For the 12-month period that ended March 31, 2012, the fund’s Class A shares returned –16.64% without sales charge. |
| n | | The S&P North American Natural Resources Sector Index1 returned –14.35%. |
| n | | Underexposure to more defensive groups within the sector generally accounted for the fund’s shortfall relative to the S&P index during a period that was generally weak for natural resources and energy all around. |
Portfolio Management
Colin Moore, lead manager, has co-managed the fund since July 2011. From 2002 until joining Columbia Investment Management Investment Advisers, LLC (the Investment Manager) in May 2010, Mr. Moore was associated with the fund’s previous investment adviser as an investment professional.
Tom Abrams has co-managed the fund since July 2011. From 2002 until joining the Investment Manager in May 2010, Mr. Abrams was associated with the fund’s previous investment adviser as an investment professional.
Josh Kapp has co-managed the fund since July 2011. From 2005 until joining the Investment Manager in May 2010, Mr. Kapp was associated with the fund’s previous investment adviser as an investment professional.
| 1 | The Standard & Poor’s (S&P) North American Natural Resources Sector Index is a modified market capitalization-weighted equity index designed as a benchmark for U.S. traded securities in the natural resources sector. The index includes companies involved in the following categories: extractive industries, energy companies, owners and operators of timber tracts, forestry services, producers of pulp and paper and owners of plantations. |
Indices are not available for investment, are not professionally managed and do not reflect sales charges, fees, brokerage commissions, taxes or other expenses of investing. Securities in the fund may not match those in an index.
Performance data quoted represents past performance and current performance may be lower or higher. Past performance is no guarantee of future results. The investment return and principal value will fluctuate so that shares, when redeemed, may be worth more or less than the original cost. Please visit www.columbiamanagement.com for daily and most recent month-end performance updates.
Summary
1-year return as of 03/31/12
| | |
| |
 | | –16.64% Class A shares (without sales charge) |
| |
| | –14.35% S&P North American Natural Resources Sector Index |
|
Morningstar Style Box™ |
|
Equity Style |
|
The Morningstar Style Box™ is based on the fund’s portfolio holdings. For equity funds, the vertical axis shows the market capitalization of the stocks owned, and the horizontal axis shows investment style (value, blend, or growth). Information shown is based on the most recent data provided by Morningstar.
© 2012 Morningstar, Inc. All rights reserved. The Morningstar information contained herein: (1) is proprietary to Morningstar and/or its content providers; (2) may not be copied or distributed; and (3) is not warranted to be accurate, complete or timely. Neither Morningstar nor its content providers are responsible for any damages or losses arising from any use of this information.
1
Performance Information – Columbia Energy and Natural Resources Fund
Performance data quoted represents past performance and current performance may be lower or higher. Past performance is no guarantee of future results. The investment return and principal value will fluctuate so that shares, when redeemed, may be worth more or less than the original cost. Please visit www.columbiamanagement.com for daily and most recent month-end performance updates.
|
| Performance of a $10,000 investment 04/01/02 – 03/31/12 ($) |
The chart above shows the change in value of a hypothetical $10,000 investment in Class A shares of Columbia Energy and Natural Resources Fund during the stated time period, and does not reflect the deduction of taxes that a shareholder may pay on fund distributions or on the redemption of fund shares.
| | | | | | | | |
| Performance of a $10,000 investment 04/01/02 – 03/31/12 ($) | |
| | |
| Sales charge | | without | | | with | |
Class A* | | | 27,552 | | | | 25,966 | |
Class B* | | | 25,118 | | | | 25,118 | |
Class C* | | | 25,625 | | | | 25,625 | |
Class I* | | | 28,321 | | | | n/a | |
Class R* | | | 26,664 | | | | n/a | |
Class R4* | | | 27,578 | | | | n/a | |
Class Z | | | 28,228 | | | | n/a | |
| | | | | | | | | | | | | | | | | | | | | | | | | | | | | | | | | | | | | | | | |
| Average annual total return as of 03/31/12 (%) | |
| | | | | | | |
| Share class | | A* | | | B* | | | C* | | | I* | | | R* | | | R4* | | | Z | |
| Inception | | 09/28/07 | | | 03/07/11 | | | 09/28/07 | | | 09/27/10 | | | 09/27/10 | | | 03/07/11 | | | 12/31/92 | |
| Sales charge | | without | | | with | | | without | | | with | | | without | | | with | | | without | | | without | | | without | | | without | |
1-year | | | –16.64 | | | | –21.43 | | | | –17.24 | | | | –21.30 | | | | –17.20 | | | | –18.01 | | | | –16.23 | | | | –16.80 | | | | –16.45 | | | | –16.37 | |
5-year | | | 1.44 | | | | 0.25 | | | | 0.51 | | | | 0.16 | | | | 0.72 | | | | 0.72 | | | | 1.75 | | | | 1.12 | | | | 1.46 | | | | 1.68 | |
10-year | | | 10.67 | | | | 10.01 | | | | 9.65 | | | | 9.65 | | | | 9.87 | | | | 9.87 | | | | 10.97 | | | | 10.30 | | | | 10.68 | | | | 10.93 | |
The “with sales charge” returns include the maximum initial sales charge of 5.75% for Class A shares and the applicable contingent deferred sales charge of 1.00% for Class C shares for the first year only. The “without sales charge” returns do not include the effect of sales charges. If they had, returns would be lower.
Performance results reflect any fee waivers or reimbursements of fund expenses by Columbia Management Investment Advisers, LLC and/or any of its affiliates. Absent these fee waivers or expense reimbursement arrangements, performance results would have been lower.
All results shown assume the reinvestment of distributions. Class I, Class R4 and Class Z shares are sold at net asset value with no distribution and service (Rule 12b-1) fees. Class R shares are sold at net asset value with a distribution (Rule 12b-1) fee. Class I, Class R, Class R4 and Class Z shares have limited eligibility and the investment minimum requirements may vary. Please see the fund’s prospectuses for details. Performance for different share classes will vary based on differences in sales charges and fees associated with each class.
The tables do not reflect the deduction of taxes that a shareholder may pay on fund distributions or on the redemption of fund shares.
| * | The returns shown for periods prior to the share class inception date (including returns since inception, which are since fund inception) include the returns of the fund’s oldest share class. These returns are adjusted to reflect any higher class-related operating expenses of the newer share classes, as applicable. Please visit columbiamanagement.com/mutual-funds/appended-performance for more information. |
2
Understanding Your Expenses – Columbia Energy and Natural Resources Fund
As an investor, you incur two types of costs. There are transaction costs, which generally include sales charges on purchases and may include redemption fees. There are also ongoing costs, which generally include management fees, distribution and service (Rule 12b-1) fees, and other fund expenses. The following information is intended to help you understand your ongoing costs (in dollars) of investing in the Fund and to help you compare these costs with the ongoing costs of investing in other mutual funds.
Analyzing your fund’s expenses
To illustrate these ongoing costs, we have provided examples and calculated the expenses paid by investors in each share class of the Fund during the period. The actual and hypothetical information in the table is based on an initial investment of $1,000 at the beginning of the period indicated and held for the entire period. Expense information is calculated two ways and each method provides you with different information. The amount listed in the “Actual” column is calculated using the Fund’s actual operating expenses and total return for the period. You may use the Actual information, together with the amount invested, to estimate the expenses that you paid over the period. Simply divide your account value by $1,000 (for example, an $8,600 account value divided by $1,000 = 8.6), then multiply the results by the expenses paid during the period under the Actual column. The amount listed in the “Hypothetical” column assumes a 5% annual rate of return before expenses (which is not the Fund’s actual return) and then applies the Fund’s actual expense ratio for the period to the hypothetical return. You should not use the hypothetical account values and expenses to estimate either your actual account balance at the end of the period or the expenses you paid during the period. See “Compare with other funds” below for details on how to use the hypothetical data.
Compare with other funds
Since all mutual funds are required to include the same hypothetical calculations about expenses in shareholder reports, you can use this information to compare the ongoing cost of investing in the Fund with other funds. To do so, compare the hypothetical example with the 5% hypothetical examples that appear in the shareholder reports of other funds. As you compare hypothetical examples of other funds, it is important to note that hypothetical examples are meant to highlight the ongoing costs of investing in a fund only and do not reflect any transaction costs, such as sales charges, or redemption or exchange fees. Therefore, the hypothetical calculations are useful in comparing ongoing costs only, and will not help you determine the relative total costs of owning different funds. If transaction costs were included in these calculations, your costs would be higher.
| | | | | | | | | | | | | | | | | | | | | | | | | | | | |
| 10/01/11 – 03/31/12 | |
| | | | |
| | | Account value at the
beginning of the period ($) | | | Account value at the
end of the period ($) | | | Expenses paid
during the period ($) | | | Fund’s annualized
expense ratio (%) | |
| | | Actual | | | Hypothetical | | | Actual | | | Hypothetical | | | Actual | | | Hypothetical | | | Actual | |
Class A | | | 1,000.00 | | | | 1,000.00 | | | | 1,199.70 | | | | 1,018.10 | | | | 7.44 | | | | 6.82 | | | | 1.36 | |
Class B | | | 1,000.00 | | | | 1,000.00 | | | | 1,194.70 | | | | 1,014.32 | | | | 11.57 | | | | 10.62 | | | | 2.12 | |
Class C | | | 1,000.00 | | | | 1,000.00 | | | | 1,196.00 | | | | 1,014.62 | | | | 11.25 | | | | 10.32 | | | | 2.06 | |
Class I | | | 1,000.00 | | | | 1,000.00 | | | | 1,202.80 | | | | 1,020.79 | | | | 4.49 | | | | 4.12 | | | | 0.82 | |
Class R | | | 1,000.00 | | | | 1,000.00 | | | | 1,199.00 | | | | 1,017.06 | | | | 8.58 | | | | 7.87 | | | | 1.57 | |
Class R4 | | | 1,000.00 | | | | 1,000.00 | | | | 1,200.90 | | | | 1,019.24 | | | | 6.18 | | | | 5.67 | | | | 1.13 | |
Class Z | | | 1,000.00 | | | | 1,000.00 | | | | 1,201.80 | | | | 1,019.69 | | | | 5.69 | | | | 5.22 | | | | 1.04 | |
Expenses paid during the period are equal to the annualized expense ratio for each class as indicated above, multiplied by the average account value over the period and then multiplied by the number of days in the Fund’s most recent fiscal half year and divided by 366.
Expenses do not include fees and expenses incurred indirectly by the Fund from the underlying funds in which the Fund may invest (also referred to as “acquired funds”), including affiliated and non-affiliated pooled investments vehicles (including mutual funds and exchange traded funds).
3
Portfolio Managers’ Report – Columbia Energy and Natural Resources Fund
Performance data quoted represents past performance and current performance may be lower or higher. Past performance is no guarantee of future results. The investment return and principal value will fluctuate so that shares, when redeemed, may be worth more or less than the original cost. Please visit www.columbiamanagement.com for daily and most recent month-end performance updates.
| | | | |
| Net asset value per share | |
| |
as of 03/31/12 ($) | | | | |
Class A | | | 20.89 | |
Class B | | | 20.29 | |
Class C | | | 20.30 | |
Class I | | | 21.02 | |
Class R | | | 20.88 | |
Class R4 | | | 20.99 | |
Class Z | | | 21.00 | |
| | | | |
| Distributions declared per share | |
| |
04/01/11 – 03/31/12 ($) | | | | |
Class A | | | 0.41 | |
Class B | | | 0.36 | |
Class C | | | 0.36 | |
Class I | | | 0.49 | |
Class R | | | 0.37 | |
Class R4 | | | 0.44 | |
Class Z | | | 0.45 | |
For the 12-month period that ended March 31, 2012, the fund’s Class A shares produced a total return of –16.64% without sales charge. The S&P North American Natural Resources Sector Index returned –14.35% for the same period. The fund’s performance lagged the index primarily because it had less exposure to the better-performing defensive segments, like major integrated oil and gas companies, especially early in the period. The consequential over-exposure to poorer-performing segments like mid-capitalization service companies in a generally weak environment more than offset the otherwise strong individual security selection relative to the index.
An improving economic picture
During the first half of the 12-month period, a series of natural disasters in Japan, Europe’s debt problems and wrangling in Washington over the federal budget and the national debt dominated world headlines. U.S. economic news was lackluster and job growth was disappointing. However, the pace of growth picked up in the second half of the period and prospects brightened as fears of a lapse back into recession faded. Consumer confidence improved as the labor market added more than a million new jobs between October 2011 and March 2012, while the jobless rate fell to 8.2%. Household net worth also picked up as the equity markets rebounded. Headline inflation — which tracks a broad range of consumer expenditures, including food and energy — moved marginally higher. Despite a modest slowdown in manufacturing activity late in the summer of 2011, manufacturing activity stabilized and expanded into 2012. Housing continues to be the one nagging weak spot in the economy. Yet, there is hope that a bottom in the housing market is in sight.
Big companies outperformed small
Against an improving economic backdrop, natural resource and energy stocks were buffeted as investors tended to migrate to traditionally defensive and higher-yielding groups to reduce risk exposure. This worked against the fund’s greater emphasis on oil service corporations and other smaller companies that we believed were likely to benefit from longer-term trends supporting higher oil prices. However, when commodity prices fell, oil service holdings, such as Halliburton and Weatherford International (2.5% and 1.7% of net assets, respectively), detracted from performance, as did Baker Hughes (0.5% of net assets). We reduced the fund’s exposure to Baker Hughes relative to the index. In a volatile environment, investors preferred more defensive stocks with higher dividend yields, notably the large, integrated oil companies. However, the fund was underweight in such major oil corporations as Exxon Mobil and ConocoPhillips (7.0% and 2.6% of net assets, respectively), and this positioning detracted from relative results, especially early in the period.
Sector positioning, stock selection aided relative returns
Avoiding natural gas exploration and production companies had a positive effect on performance, as the group performed poorly when natural gas prices continued to decline.
In the second half of the fiscal year, we decided to take advantage of these low prices by increasing exposure to chemical companies, whose operating profit margins received a boost from the low prices of gas, which is a critical raw material in chemical production. This was a successful move as holdings such as LyondellBasell Industries and Dow Chemical (0.9% and 1.1% of net assets, respectively) benefited from the favorable pricing environment. In addition,
4
Portfolio Managers’ Report (continued) – Columbia Energy and Natural Resources Fund
we added more defensive names, including integrated oil companies, gold companies and energy storage and transportation corporations. We also had good performance from selections of oil service equipment companies, such as Oil States International, National Oilwell Varco and Cameron International (1.0%, 2.9% and 1.8% of net assets, respectively). Although gold and metals stocks are not major parts of the portfolio, performance was helped by a position in Yamana Gold (1.8% of net assets) and the decision to sell gold miner Agnico-Eagle Mines. During the period, we began using options, namely covered calls, primarily to mitigate risks. These positions had a modestly positive impact on relative performance.
Looking ahead
Going into the new fiscal year, the fund’s allocations to both energy companies and materials corporations are more consistently aligned with the S&P benchmark, although we have added more non-benchmark chemicals investments as part of the fund’s materials allocation. The investment team’s members all are highly experienced in bottom-up, fundamental research and we plan to continue to rely heavily on individual security selection rather than changes in sector allocation. We remain bullish on the longer-term outlook for oil prices and have retained exposure to oil service stocks, even though these corporations have not done well recently. That said, oil prices have the potential to decline in the near term if the political situations in the Middle East appear to stabilize. We maintain a more cautious posture about natural gas companies, although we do think natural gas prices probably are close to trough levels. We are neutral with respect to both gold and metals stocks and remain concerned about weakness in metals pricing if growth in China slows considerably.
Portfolio characteristics and holdings are subject to change periodically and may not be representative of current characteristics and holdings. The outlook for the fund may differ from that presented for other Columbia Funds.
Equity securities are affected by stock market fluctuations that occur in response to economic and business developments.
International investing involves special risks, including foreign taxation, currency risks, risks associated with possible differences in financial standards and other risks associated with future political and economic developments.
Energy and natural resources stocks have been volatile. They may be affected by rising interest rates and inflation and can also be affected by factors such as natural events (for example, earthquakes or fires) and international politics.
The fund is non-diversified, which generally means that it may invest a greater percentage of its total assets in the securities of fewer issuers than a “diversified” fund. This increases the risk that a change in the value of any one investment held by the Fund could affect the overall value of the Fund more than it would affect that of a diversified fund holding a greater number of investments. Accordingly, the Fund’s value will likely be more volatile than the value of more diversified funds.
| | | | |
| Portfolio breakdown1 | |
| |
as of 03/31/12 | | | | |
Stocks | | | | |
Energy | | | 80.3 | % |
Materials | | | 19.5 | |
Other2 | | | 0.2 | |
| | 1 | Percentages indicated are based upon total investments (excluding Investments of Cash Collateral Received for Securities on Loan). The Fund’s portfolio composition is subject to change. |
| | 2 | Includes investments in money market funds. |
| | | | |
| Top ten holdings1 | |
| |
as of 03/31/12 | | | | |
Chevron Corp. | | | 9.8 | % |
Exxon Mobil Corp. | | | 7.0 | |
Occidental Petroleum Corp. | | | 5.7 | |
Anadarko Petroleum Corp. | | | 3.9 | |
Schlumberger Ltd. | | | 3.3 | |
Suncor Energy, Inc. | | | 3.2 | |
National Oilwell Varco, Inc. | | | 2.9 | |
ConocoPhillips | | | 2.6 | |
Halliburton Co. | | | 2.5 | |
Freeport-McMoRan Copper & Gold, Inc. | | | 2.4 | |
| | 1 | Percentages indicated are based upon total investments (excluding Investments of Cash Collateral Received for Securities on Loan and money market funds). |
For further detail about these holdings, please refer to the section entitled “Portfolio of Investments.”
Fund holdings are as of the date given, are subject to change at any time, and are not recommendations to buy or sell any security.
5
Portfolio of Investments – Columbia Energy and Natural Resources Fund
March 31, 2012
(Percentages represent value of investments compared to net assets)
| | | | | | | | |
| Issuer | | Shares | | | Value | |
Common Stocks 99.6% | |
ENERGY 80.1% | |
Energy Equipment & Services 19.8% | |
Baker Hughes, Inc. | | | 65,454 | | | | $2,745,141 | |
Cameron International Corp.(a)(b) | | | 200,788 | | | | 10,607,630 | |
Dresser-Rand Group, Inc.(a) | | | 69,697 | | | | 3,233,244 | |
Ensco PLC, ADR | | | 55,282 | | | | 2,926,076 | |
FMC Technologies, Inc.(a) | | | 80,403 | | | | 4,053,919 | |
Halliburton Co. | | | 445,504 | | | | 14,786,278 | |
Key Energy Services, Inc.(a) | | | 261,028 | | | | 4,032,882 | |
Nabors Industries Ltd.(a) | | | 86,300 | | | | 1,509,387 | |
National Oilwell Varco, Inc. | | | 214,991 | | | | 17,085,335 | |
Noble Corp.(a) | | | 85,000 | | | | 3,184,950 | |
Oil States International, Inc.(a)(b) | | | 74,933 | | | | 5,849,270 | |
Rowan Companies, Inc.(a) | | | 126,990 | | | | 4,181,781 | |
Schlumberger Ltd. | | | 279,599 | | | | 19,552,358 | |
Superior Energy Services, Inc.(a) | | | 272,886 | | | | 7,193,275 | |
Transocean Ltd. | | | 118,276 | | | | 6,469,697 | |
Weatherford International Ltd.(a) | | | 678,243 | | | | 10,234,687 | |
| | | | | | | | |
Total | | | | | | | 117,645,910 | |
Oil, Gas & Consumable Fuels 60.3% | | | | | | | | |
Alpha Natural Resources, Inc.(a)(b) | | | 76,500 | | | | 1,163,565 | |
Anadarko Petroleum Corp. | | | 295,240 | | | | 23,129,102 | |
Apache Corp. | | | 129,154 | | | | 12,972,228 | |
Cabot Oil & Gas Corp.(b) | | | 139,386 | | | | 4,344,662 | |
Carrizo Oil & Gas, Inc.(a)(b) | | | 132,000 | | | | 3,730,320 | |
Chesapeake Energy Corp. | | | 327,000 | | | | 7,576,590 | |
Chevron Corp. | | | 543,294 | | | | 58,262,848 | |
Cimarex Energy Co.(b) | | | 55,000 | | | | 4,150,850 | |
ConocoPhillips | | | 204,418 | | | | 15,537,812 | |
Devon Energy Corp. | | | 62,647 | | | | 4,455,455 | |
El Paso Corp. | | | 394,656 | | | | 11,662,085 | |
EOG Resources, Inc. | | | 125,400 | | | | 13,931,940 | |
Exxon Mobil Corp. | | | 476,930 | | | | 41,364,139 | |
HollyFrontier Corp.(b) | | | 74,699 | | | | 2,401,573 | |
Marathon Oil Corp.(b) | | | 247,187 | | | | 7,835,828 | |
Marathon Petroleum Corp. | | | 148,641 | | | | 6,445,074 | |
Noble Energy, Inc. | | | 60,502 | | | | 5,915,885 | |
Occidental Petroleum Corp. | | | 352,200 | | | | 33,540,006 | |
Peabody Energy Corp. | | | 92,563 | | | | 2,680,624 | |
Penn West Petroleum Ltd.(b) | | | 390,166 | | | | 7,635,549 | |
Pioneer Natural Resources Co.(b) | | | 77,063 | | | | 8,599,460 | |
Rosetta Resources, Inc.(a)(b) | | | 86,920 | | | | 4,238,219 | |
Royal Dutch Shell PLC, ADR | | | 133,406 | | | | 9,355,763 | |
SM Energy Co. | | | 103,124 | | | | 7,298,085 | |
Spectra Energy Corp. | | | 247,700 | | | | 7,814,935 | |
Stone Energy Corp.(a)(b) | | | 101,681 | | | | 2,907,060 | |
Suncor Energy, Inc. | | | 583,113 | | | | 19,067,795 | |
Talisman Energy, Inc. | | | 738,113 | | | | 9,300,224 | |
Valero Energy Corp. | | | 155,638 | | | | 4,010,791 | |
Whiting Petroleum Corp.(a) | | | 147,919 | | | | 8,032,002 | |
Williams Companies, Inc. (The)(b) | | | 297,750 | | | | 9,173,677 | |
| | | | | | | | |
Total | | | | | | | 358,534,146 | |
TOTAL ENERGY | | | | | | | 476,180,056 | |
MATERIALS 19.5% | | | | | | | | |
Chemicals 3.8% | | | | | | | | |
Celanese Corp., Class A | | | 92,863 | | | | 4,288,413 | |
Dow Chemical Co. (The)(b) | | | 190,399 | | | | 6,595,423 | |
| | | | | | | | |
| Issuer | | Shares | | | Value | |
Common Stocks (continued) | |
MATERIALS (cont.) | | | | | | | | |
Chemicals (cont.) | | | | | | | | |
EI du Pont de Nemours & Co. | | | 62,000 | | | | $3,279,800 | |
LyondellBasell Industries NV, Class A | | | 116,129 | | | | 5,069,031 | |
Mosaic Co. (The) | | | 31,700 | | | | 1,752,693 | |
Potash Corp. of Saskatchewan, Inc. | | | 40,135 | | | | 1,833,768 | |
| | | | | | | | |
Total | | | | | | | 22,819,128 | |
Containers & Packaging 1.7% | | | | | | | | |
Bemis Co., Inc. | | | 101,683 | | | | 3,283,344 | |
Owens-Illinois, Inc.(a)(b) | | | 138,345 | | | | 3,228,972 | |
Packaging Corp. of America | | | 118,848 | | | | 3,516,712 | |
| | | | | | | | |
Total | | | | | | | 10,029,028 | |
Metals & Mining 14.0% | | | | | | | | |
Alamos Gold, Inc. | | | 169,857 | | | | 3,118,032 | |
Barrick Gold Corp. | | | 313,366 | | | | 13,625,154 | |
Freeport-McMoRan Copper & Gold, Inc. | | | 377,430 | | | | 14,357,437 | |
Goldcorp, Inc. | | | 287,181 | | | | 12,940,376 | |
IAMGOLD Corp. | | | 376,420 | | | | 5,002,622 | |
Newmont Mining Corp. | | | 180,516 | | | | 9,255,055 | |
Osisko Mining Corp.(a) | | | 185,826 | | | | 2,150,936 | |
PAN American Silver Corp.(b) | | | 55,965 | | | | 1,234,588 | |
Silver Wheaton Corp. | | | 148,641 | | | | 4,934,881 | |
Teck Resources Ltd., Class B | | | 39,936 | | | | 1,424,118 | |
Vale SA, ADR(b) | | | 139,394 | | | | 3,252,062 | |
Walter Energy, Inc. | | | 23,266 | | | | 1,377,580 | |
Yamana Gold, Inc. | | | 668,987 | | | | 10,449,577 | |
| | | | | | | | |
Total | | | | | | | 83,122,418 | |
TOTAL MATERIALS | | | | | | | 115,970,574 | |
Total Common Stocks | | | | | | | | |
(Cost: $525,289,032) | | | | | | | $592,150,630 | |
| | |
| | | Shares | | | Value | |
Money Market Funds 0.2% | |
Columbia Short-Term Cash Fund, | | | 1,166,557 | | | | $1,166,557 | |
0.161%(c)(d) | | | | | | | | |
Total Money Market Funds | | | | | | | | |
(Cost: $1,166,557) | | | | | | | $1,166,557 | |
| | | | | | | | | | | | |
| | | |
| Issuer | | Effective
Yield | | | Par/
Principal/
Shares | | | Value | |
Investments of Cash Collateral Received for Securities on Loan 3.5% | |
Certificates of Deposit 1.0% | |
Norinchukin Bank | |
05/21/12 | | | 0.470 | % | | | $3,000,000 | | | | $3,000,000 | |
Skandinaviska Enskilda Banken | |
04/16/12 | | | 0.360 | % | | | 3,000,000 | | | | 3,000,000 | |
| | | | | | | | | | | | |
Total | | | | | | | | | | | 6,000,000 | |
Repurchase Agreements 2.5% | | | | | | | | | |
Citigroup Global Markets, Inc.
dated 03/30/2012, matures 04/02/2012,
repurchase price $2,500,038(e) | |
| | | 0.180 | % | | | 2,500,000 | | | | 2,500,000 | |
The Accompanying Notes to Financial Statements are an integral part of this statement.
6
Columbia Energy and Natural Resources Fund
March 31, 2012
(Percentages represent value of investments compared to net assets)
| | | | | | | | | | | | |
| | | |
| Issuer | | Effective
Yield | | | Par/
Principal/
Shares | | | Value | |
Investments of Cash Collateral Received for Securities on Loan (continued) | |
Repurchase Agreements (cont.) | |
RBS Securities, Inc.
dated 03/30/2012, matures 04/02/2012,
repurchase price $12,605,040(e) | |
| | | 0.200 | % | | | $12,604,830 | | | | $12,604,830 | |
| | | | | | | | | | | | |
Total | | | | | | | | | | | 15,104,830 | |
Total Investments of Cash Collateral Received for Securities on Loan | |
(Cost: $21,104,830) | | | | $21,104,830 | |
Total Investments | | | | | |
(Cost: $547,560,419) | | | | $614,422,017 | |
Other Assets & Liabilities, Net | | | | (19,723,960 | ) |
Net Assets | | | | $594,698,057 | |
|
Notes to Portfolio of Investments |
| (b) | At March 31, 2012, security was partially or fully on loan. |
| (c) | The rate shown is the seven-day current annualized yield at March 31, 2012. |
| (d) | Investments in affiliates during the year ended March 31, 2012: |
| | | | | | | | | | | | | | | | | | | | | | | | | | | | |
| Issuer | | Beginning
Cost | | | Purchase
Cost | | | Sales Cost/
Proceeds
from Sales | | | Realized
Gain/Loss | | | Ending
Cost | | | Dividends
or Interest
Income | | | Value | |
Columbia Short-Term Cash Fund | | | $— | | | | $525,565,673 | | | | $(524,399,116 | ) | | | $— | | | | $1,166,557 | | | | $11,496 | | | | $1,166,557 | |
| (e) | The table below represents securities received as collateral for repurchase agreements. This collateral is deposited with the Fund’s custodian and, pursuant to the terms of the repurchase agreement, must have an aggregate market value greater than or equal to the repurchase price plus accrued interest at all times. The value of securities and/or cash held as collateral for repurchase agreements is monitored on a daily basis to ensure the proper level of collateral. |
Citigroup Global Markets, Inc. (0.180%)
| | | | |
| Security Description | | Value | |
Fannie Mae REMICS | | | $720,831 | |
Fannie Mae-Aces | | | 79,527 | |
Freddie Mac REMICS | | | 692,359 | |
Ginnie Mae II Pool | | | 67,541 | |
Government National Mortgage Association | | | 989,742 | |
Total Market Value of Collateral Securities | | | $2,550,000 | |
| |
| RBS Securities, Inc. (0.200%) | | | | |
| Security Description | | Value | |
Fannie Mae Pool | | | $12,857,003 | |
Total Market Value of Collateral Securities | | | $12,857,003 | |
| | |
| ADR | | American Depositary Receipt |
The Accompanying Notes to Financial Statements are an integral part of this statement.
7
Columbia Energy and Natural Resources Fund
March 31, 2012
(Percentages represent value of investments compared to net assets)
Generally accepted accounting principles (GAAP) require disclosure regarding the inputs and valuation techniques used to measure fair value and any changes in valuation inputs or techniques. In addition, investments shall be disclosed by major category.
The Fund categorizes its fair value measurements according to a three-level hierarchy that maximizes the use of observable inputs and minimizes the use of unobservable inputs by prioritizing that the most observable input be used when available. Observable inputs are those that market participants would use in pricing an investment based on market data obtained from sources independent of the reporting entity. Unobservable inputs are those that reflect the Fund’s assumptions about the information market participants would use in pricing an investment. An investment’s level within the fair value hierarchy is based on the lowest level of any input that is deemed significant to the asset or liability’s fair value measurement. The input levels are not necessarily an indication of the risk or liquidity associated with investments at that level. For example, certain U.S. government securities are generally high quality and liquid, however, they are reflected as Level 2 because the inputs used to determine fair value may not always be quoted prices in an active market.
Fair value inputs are summarized in the three broad levels listed below:
| | Ÿ | | Level 1 – Valuations based on quoted prices for investments in active markets that the Fund has the ability to access at the measurement date (including NAV for open-end mutual funds). Valuation adjustments are not applied to Level 1 investments. |
| | Ÿ | | Level 2 – Valuations based on other significant observable inputs (including quoted prices for similar securities, interest rates, prepayment speeds, credit risks, etc.). |
| | Ÿ | | Level 3 – Valuations based on significant unobservable inputs (including the Fund’s own assumptions and judgment in determining the fair value of investments). |
Inputs that are used in determining fair value of an investment may include price information, credit data, volatility statistics, and other factors. These inputs can be either observable or unobservable. The availability of observable inputs can vary between investments, and is affected by various factors such as the type of investment, and the volume and level of activity for that investment or similar investments in the marketplace. The inputs will be considered by the Investment Manager, along with any other relevant factors in the calculation of an investment’s fair value. The Fund uses prices and inputs that are current as of the measurement date, which may include periods of market dislocations. During these periods, the availability of prices and inputs may be reduced for many investments. This condition could cause an investment to be reclassified between the various levels within the hierarchy.
Investments falling into the Level 3 category are primarily supported by quoted prices from brokers and dealers participating in the market for those investments. However, these may be classified as Level 3 investments due to lack of market transparency and corroboration to support these quoted prices. Additionally, valuation models may be used as the pricing source for any remaining investments classified as Level 3. These models rely on one or more significant unobservable inputs and/or significant assumptions by the Investment Manager. Inputs used in valuations may include, but are not limited to, financial statement analysis, capital account balances, discount rates and estimated cash flows, and comparable company data.
The following table is a summary of the inputs used to value the Fund’s investments as of March 31, 2012:
| | | | | | | | | | | | | | | | |
| | | Fair value at March 31, 2012 | |
| Description | | Level 1
quoted prices
in active
markets for
identical assets | | | Level 2
other
significant
observable
inputs | | | Level 3
significant
unobservable
inputs | | | Total | |
Equity Securities | | | | | | | | | | | | | | | | |
Common Stocks | | | | | | | | | | | | | | | | |
Energy | | | $476,180,056 | | | | $— | | | | $— | | | | $476,180,056 | |
Materials | | | 115,970,574 | | | | — | | | | — | | | | 115,970,574 | |
Total Equity Securities | | | 592,150,630 | | | | — | | | | — | | | | 592,150,630 | |
Other | | | | | | | | | | | | | | | | |
Money Market Funds | | | 1,166,557 | | | | — | | | | — | | | | 1,166,557 | |
Investments of Cash Collateral Received for Securities on Loan | | | — | | | | 21,104,830 | | | | — | | | | 21,104,830 | |
Total Other | | | 1,166,557 | | | | 21,104,830 | | | | — | | | | 22,271,387 | |
Total | | | $593,317,187 | | | | $21,104,830 | | | | $— | | | | $614,422,017 | |
See the Portfolio of Investments for all investment classifications not indicated in the table.
The Fund’s assets assigned to the Level 2 input category are generally valued using the market approach, in which a security’s value is determined through reference to prices and information from market transactions for similar or identical assets.
There were no significant transfers between Levels 1 and 2 during the period.
The Accompanying Notes to Financial Statements are an integral part of this statement.
8
Statement of Assets and Liabilities – Columbia Energy and Natural Resources Fund
March 31, 2012
| | | | |
| Assets | | | | |
Investments, at value* | | | | |
Unaffiliated issuers (identified cost $525,289,032) | | $ | 592,150,630 | |
Affiliated issuers (identified cost $1,166,557) | | | 1,166,557 | |
Investment of cash collateral received for securities on loan | | | | |
Short-term securities (identified cost $6,000,000) | | | 6,000,000 | |
Repurchase agreements (identified cost $15,104,830) | | | 15,104,830 | |
Total investments (identified cost $547,560,419) | | | 614,422,017 | |
Foreign currency (identified cost $680) | | | 662 | |
Receivable for: | | | | |
Investments sold | | | 6,330,319 | |
Capital shares sold | | | 156,214 | |
Dividends | | | 472,810 | |
Interest | | | 6,701 | |
Reclaims | | | 15,072 | |
Prepaid expense | | | 8,541 | |
Trustees’ deferred compensation plan | | | 25,032 | |
Total assets | | | 621,437,368 | |
| |
| Liabilities | | | | |
Due upon return of securities on loan | | | 21,104,830 | |
Payable for: | | | | |
Investments purchased | | | 2,938,921 | |
Capital shares purchased | | | 2,500,342 | |
Investment management fees | | | 11,182 | |
Distribution and service fees | | | 1,776 | |
Transfer agent fees | | | 81,722 | |
Administration fees | | | 972 | |
Plan administration fees | | | 47 | |
Compensation of board members | | | 4,905 | |
Chief compliance officer expenses | | | 277 | |
Other expenses | | | 69,305 | |
Trustees’ deferred compensation plan | | | 25,032 | |
Total liabilities | | | 26,739,311 | |
Net assets applicable to outstanding capital stock | | $ | 594,698,057 | |
The Accompanying Notes to Financial Statements are an integral part of this statement.
9
Statement of Assets and Liabilities (continued) – Columbia Energy and Natural Resources Fund
March 31, 2012
| | | | |
| Represented by | | | | |
Paid-in capital | | $ | 552,249,290 | |
Undistributed net investment income | | | 92,600 | |
Accumulated net realized loss | | | (24,505,425 | ) |
Unrealized appreciation (depreciation) on: | | | | |
Investments | | | 66,861,598 | |
Foreign currency translations | | | (6 | ) |
Total — representing net assets applicable to outstanding capital stock | | $ | 594,698,057 | |
*Value of securities on loan | | $ | 21,240,147 | |
Net assets applicable to outstanding shares | | | | |
Class A | | $ | 145,298,259 | |
Class B | | $ | 5,836,897 | |
Class C | | $ | 22,784,892 | |
Class I | | $ | 29,761,161 | |
Class R | | $ | 880,166 | |
Class R4 | | $ | 109,115 | |
Class Z | | $ | 390,027,567 | |
Shares outstanding | | | | |
Class A | | | 6,954,221 | |
Class B | | | 287,634 | |
Class C | | | 1,122,588 | |
Class I | | | 1,415,515 | |
Class R | | | 42,158 | |
Class R4 | | | 5,199 | |
Class Z | | | 18,576,030 | |
Net asset value per share | | | | |
Class A(a) | | $ | 20.89 | |
Class B | | $ | 20.29 | |
Class C | | $ | 20.30 | |
Class I | | $ | 21.02 | |
Class R | | $ | 20.88 | |
Class R4 | | $ | 20.99 | |
Class Z | | $ | 21.00 | |
| (a) | The maximum offering price per share for Class A is $22.16. The offering price is calculated by dividing the net asset value by 1.0 minus the maximum sales charge of 5.75%. |
The Accompanying Notes to Financial Statements are an integral part of this statement.
10
Statement of Operations – Columbia Energy and Natural Resources Fund
Year Ended March 31, 2012
| | | | |
| Net investment income | | | | |
Income: | | | | |
Dividends | | $ | 11,247,799 | |
Interest | | | 1,186 | |
Dividends from affiliates | | | 11,496 | |
Income from securities lending — net | | | 136,770 | |
Foreign taxes withheld | | | (347,876 | ) |
Total income | | | 11,049,375 | |
Expenses: | | | | |
Investment management fees | | | 5,262,966 | |
Distribution fees | | | | |
Class B | | | 44,822 | |
Class C | | | 188,847 | |
Class R | | | 1,810 | |
Service fees | | | | |
Class A | | | 377,408 | |
Class B | | | 14,941 | |
Class C | | | 62,949 | |
Transfer agent fees | | | | |
Class A | | | 330,300 | |
Class B | | | 11,887 | |
Class C | | | 52,518 | |
Class R | | | 743 | |
Class R4 | | | 51 | |
Class Z | | | 1,059,309 | |
Administration fees | | | 519,521 | |
Plan administration fees | | | | |
Class R4 | | | 259 | |
Compensation of board members | | | 43,484 | |
Pricing and bookkeeping fees | | | 11,820 | |
Custodian fees | | | 28,903 | |
Printing and postage fees | | | 156,976 | |
Registration fees | | | 111,621 | |
Professional fees | | | 65,512 | |
Line of credit interest expense | | | 204 | |
Chief compliance officer expenses | | | 909 | |
Other | | | 47,096 | |
Total expenses | | | 8,394,856 | |
Expense reductions | | | (6,890 | ) |
Total net expenses | | | 8,387,966 | |
Net investment income | | | 2,661,409 | |
| |
| Realized and unrealized gain (loss) — net | | | | |
Net realized gain (loss) on: | | | | |
Investments | | | 15,645,287 | |
Foreign currency translations | | | (99,990 | ) |
Options contracts written | | | 150,917 | |
Net realized gain | | | 15,696,214 | |
Net change in unrealized appreciation (depreciation) on: | | | | |
Investments | | | (182,171,779 | ) |
Foreign currency translations | | | (936 | ) |
Net change in unrealized depreciation | | | (182,172,715 | ) |
Net realized and unrealized loss | | | (166,476,501 | ) |
Net decrease in net assets from operations | | $ | (163,815,092 | ) |
The Accompanying Notes to Financial Statements are an integral part of this statement.
11
Statement of Changes in Net Assets – Columbia Energy and Natural Resources Fund
| | | | | | | | |
| Year Ended March 31, | | 2012 | | | 2011(a) | |
| | |
| Operations | | | | | | | | |
Net investment income | | $ | 2,661,409 | | | $ | 992,142 | |
Net realized gain | | | 15,696,214 | | | | 97,517,597 | |
Net change in unrealized appreciation (depreciation) | | | (182,172,715 | ) | | | 93,213,271 | |
Net increase (decrease) in net assets resulting from operations | | | (163,815,092 | ) | | | 191,723,010 | |
| | |
| Distributions to shareholders from: | | | | | | | | |
Net investment income | | | | | | | | |
Class A | | | (456,402 | ) | | | (23,329 | ) |
Class I | | | (473,597 | ) | | | (144,793 | ) |
Class R | | | (319 | ) | | | — | |
Class R4 | | | (534 | ) | | | (2 | ) |
Class Z | | | (2,288,248 | ) | | | (1,011,631 | ) |
Net realized gains | | | | | | | | |
Class A | | | (2,618,102 | ) | | | — | |
Class B | | | (108,924 | ) | | | — | |
Class C | | | (417,651 | ) | | | — | |
Class I | | | (711,708 | ) | | | — | |
Class R | | | (8,977 | ) | | | — | |
Class R4 | | | (2,209 | ) | | | — | |
Class Z | | | (7,662,137 | ) | | | — | |
Total distributions to shareholders | | | (14,748,808 | ) | | | (1,179,755 | ) |
Increase (decrease) in net assets from share transactions | | | (142,926,768 | ) | | | 35,938,716 | |
Proceeds from regulatory settlements (Note 6) | | | 4,585 | | | | — | |
Total increase (decrease) in net assets | | | (321,486,083 | ) | | | 226,481,971 | |
Net assets at beginning of year | | | 916,184,140 | | | | 689,702,169 | |
Net assets at end of year | | $ | 594,698,057 | | | $ | 916,184,140 | |
Undistributed net investment income | | $ | 92,600 | | | $ | 63,935 | |
| (a) | Class B and Class R4 shares for the period from March 7, 2011 (commencement of operations) to March 31, 2011. Class I and Class R shares for the period from September 27, 2010 (commencement of investment operations) March 31, 2011. |
The Accompanying Notes to Financial Statements are an integral part of this statement.
12
Statement of Changes in Net Assets (continued) – Columbia Energy and Natural Resources Fund
| | | | | | | | | | | | | | | | |
| Year Ended March 31, | | 2012 | | | 2011(a) | |
| | | Shares | | | Dollars ($) | | | Shares | | | Dollars ($) | |
| Capital stock activity | | | | | | | | | | | | | | | | |
Class A shares | | | | | | | | | | | | | | | | |
Subscriptions(b) | | | 1,264,704 | | | | 28,122,049 | | | | 1,150,892 | | | | 24,796,839 | |
Fund merger | | | 6,701,075 | | | | 157,664,942 | | | | — | | | | — | |
Distributions reinvested | | | 140,024 | | | | 2,843,648 | | | | 760 | | | | 18,884 | |
Redemptions | | | (3,886,721 | ) | | | (83,455,870 | ) | | | (942,663 | ) | | | (19,293,252 | ) |
Net increase | | | 4,219,082 | | | | 105,174,769 | | | | 208,989 | | | | 5,522,471 | |
Class B shares | | | | | | | | | | | | | | | | |
Subscriptions | | | 32,089 | | | | 690,955 | | | | 2,306 | | | | 56,527 | |
Fund merger | | | 511,902 | | | | 11,739,090 | | | | — | | | | — | |
Distributions reinvested | | | 5,243 | | | | 103,345 | | | | — | | | | — | |
Redemptions(b) | | | (263,906 | ) | | | (5,901,478 | ) | | | — | | | | — | |
Net increase | | | 285,328 | | | | 6,631,912 | | | | 2,306 | | | | 56,527 | |
Class C shares | | | | | | | | | | | | | | | | |
Subscriptions | | | 228,983 | | | | 4,923,413 | | | | 415,857 | | | | 8,714,881 | |
Fund merger | | | 280,755 | | | | 6,438,045 | | | | — | | | | — | |
Distributions reinvested | | | 17,645 | | | | 347,774 | | | | — | | | | — | |
Redemptions | | | (426,171 | ) | | | (8,915,368 | ) | | | (224,761 | ) | | | (4,538,662 | ) |
Net increase | | | 101,212 | | | | 2,793,864 | | | | 191,096 | | | | 4,176,219 | |
Class I shares | | | | | | | | | | | | | | | | |
Subscriptions | | | 2,218,577 | | | | 51,799,261 | | | | 5,239,281 | | | | 117,720,570 | |
Fund merger | | | 604 | | | | 14,295 | | | | — | | | | — | |
Distributions reinvested | | | 57,100 | | | | 1,184,943 | | | | 5,730 | | | | 144,788 | |
Redemptions | | | (5,373,416 | ) | | | (123,041,510 | ) | | | (732,361 | ) | | | (17,654,089 | ) |
Net increase (decrease) | | | (3,097,135 | ) | | | (70,043,011 | ) | | | 4,512,650 | | | | 100,211,269 | |
Class R shares | | | | | | | | | | | | | | | | |
Subscriptions | | | 49,382 | | | | 1,066,845 | | | | 2,135 | | | | 48,370 | |
Distributions reinvested | | | 457 | | | | 9,247 | | | | — | | | | — | |
Redemptions | | | (9,816 | ) | | | (210,083 | ) | | | — | | | | — | |
Net increase | | | 40,023 | | | | 866,009 | | | | 2,135 | | | | 48,370 | |
Class R4 shares | | | | | | | | | | | | | | | | |
Subscriptions | | | 775 | | | | 16,515 | | | | 98 | | | | 2,500 | |
Fund merger | | | 5,846 | | | | 138,127 | | | | — | | | | — | |
Distributions reinvested | | | 131 | | | | 2,662 | | | | — | | | | — | |
Redemptions | | | (1,651 | ) | | | (33,617 | ) | | | — | | | | — | |
Net increase | | | 5,101 | | | | 123,687 | | | | 98 | | | | 2,500 | |
Class Z shares | | | | | | | | | | | | | | | | |
Subscriptions | | | 4,359,217 | | | | 98,498,028 | | | | 10,793,305 | | | | 227,525,290 | |
Distributions reinvested | | | 352,520 | | | | 7,189,747 | | | | 33,019 | | | | 733,178 | |
Redemptions | | | (13,589,844 | ) | | | (294,161,773 | ) | | | (14,236,411 | ) | | | (302,337,108 | ) |
Net decrease | | | (8,878,107 | ) | | | (188,473,998 | ) | | | (3,410,087 | ) | | | (74,078,640 | ) |
Total net increase (decrease) | | | (7,324,496 | ) | | | (142,926,768 | ) | | | 1,507,187 | | | | 35,938,716 | |
| (a) | Class B and Class R4 shares for the period from March 7, 2011 (commencement of operations) to March 31, 2011. Class I and Class R shares for the period from September 27, 2010 (commencement of operations) to March 31, 2011. |
| (b) | Includes conversions of Class B shares to Class A shares, if any. |
The Accompanying Notes to Financial Statements are an integral part of this statement.
13
Financial Highlights – Columbia Energy and Natural Resources Fund
The following tables are intended to help you understand the Fund’s financial performance. Certain information reflects financial results for a single share of a class held for the periods shown. Per share net investment income (loss) amounts are calculated based on average shares outstanding during the period. Total returns assume reinvestment of all dividends and distributions. Total returns do not reflect payments of sales charges, if any, and are not annualized for periods of less than one year.
| | | | | | | | | | | | | | | | | | | | |
| | | Year ended March 31, | |
| | | 2012 | | | 2011 | | | 2010 | | | 2009 | | | 2008(a) | |
| Class A | | | | | | | | | | | | | | | |
| Per share data | | | | | | | | | | | | | | | | | | | | |
Net asset value, beginning of period | | | $25.57 | | | | $20.11 | | | | $13.62 | | | | $25.49 | | | | $27.64 | |
Income from investment operations: | | | | | | | | | | | | | | | | | | | | |
Net investment income (loss) | | | 0.05 | | | | (0.02 | ) | | | (0.02 | ) | | | (0.01 | ) | | | (0.00 | )(b) |
Net realized and unrealized gain (loss) | | | (4.32 | ) | | | 5.49 | | | | 6.52 | | | | (11.46 | ) | | | 1.72 | |
Total from investment operations | | | (4.27 | ) | | | 5.47 | | | | 6.50 | | | | (11.47 | ) | | | 1.72 | |
Less distributions to shareholders from: | | | | | | | | | | | | | | | | | | | | |
Net investment income | | | (0.05 | ) | | | (0.01 | ) | | | (0.01 | ) | | | — | | | | — | |
Net realized gains | | | (0.36 | ) | | | — | | | | — | | | | (0.40 | ) | | | (3.87 | ) |
Total distributions to shareholders | | | (0.41 | ) | | | (0.01 | ) | | | (0.01 | ) | | | (0.40 | ) | | | (3.87 | ) |
Proceeds from regulatory settlement | | | 0.00 | (b) | | | — | | | | 0.00 | (b) | | | — | | | | — | |
Net asset value, end of period | | | $20.89 | | | | $25.57 | | | | $20.11 | | | | $13.62 | | | | $25.49 | |
| Total return | | | (16.64% | ) | | | 27.20% | | | | 47.76% | | | | (45.88% | ) | | | 6.82% | |
| Ratios to average net assets(c) | | | | | | | | | | | | | | | | | | | | |
Expenses prior to fees waived or expenses reimbursed (including interest expense) | | | 1.28% | (d) | | | 1.26% | (d) | | | 1.21% | (d) | | | 1.28% | | | | 1.12% | (d)(e) |
Net expenses after fees waived or expenses reimbursed (including interest expense)(f) | | | 1.28% | (d)(g) | | | 1.26% | (d)(g) | | | 1.21% | (d)(g) | | | 1.24% | (g) | | | 1.07% | (d)(e)(g) |
Expenses prior to fees waived or expenses reimbursed (excluding interest expense) | | | 1.28% | | | | 1.26% | | | | 1.21% | | | | 1.28% | | | | 1.12% | (e) |
Net expenses after fees waived or expenses reimbursed (excluding interest expense)(f) | | | 1.28% | (g) | | | 1.26% | (g) | | | 1.21% | (g) | | | 1.24% | (g) | | | 1.07% | (e)(g) |
Net investment income (loss) | | | 0.21% | (g) | | | (0.08% | )(g) | | | (0.10% | )(g) | | | (0.03% | )(g) | | | (0.02% | )(e)(g) |
| Supplemental data | | | | | | | | | | | | | | | | | | | | |
Net assets, end of period (in thousands) | | | $145,298 | | | | $69,938 | | | | $50,812 | | | | $16,842 | | | | $5,328 | |
Portfolio turnover | | | 167% | | | | 551% | | | | 523% | | | | 484% | | | | 198% | |
Notes to Financial Highlights
| (a) | For the period from September 28, 2007 (commencement of operations) to March 31, 2008. |
| (b) | Rounds to less than $0.01. |
| (c) | In addition to the fees and expenses which the Fund bears directly, the Fund indirectly bears a pro rata share of the fees and expenses of the acquired funds in which it invests. Such indirect expenses are not included in the reported expense ratios. |
| (d) | Includes interest expense which rounds to less than 0.01%. |
| (f) | The Investment Manager and certain of its affiliates agreed to waive/reimburse certain fees and expenses, if applicable. |
| (g) | The benefits derived from expense reductions had an impact of less than 0.01%. |
The Accompanying Notes to Financial Statements are an integral part of this statement.
14
Financial Highlights (continued) – Columbia Energy and Natural Resources Fund
| | | | | | | | |
| | | Year ended March 31, | |
| | | 2012 | | | 2011(a) | |
| Class B | | | | | | |
| Per share data | | | | | | | | |
Net asset value, beginning of period | | | $24.96 | | | | $24.77 | |
Income from investment operations: | | | | | | | | |
Net investment loss | | | (0.11 | ) | | | (0.03 | ) |
Net realized and unrealized gain (loss) | | | (4.20 | ) | | | 0.22 | |
Total from investment operations | | | (4.31 | ) | | | 0.19 | |
Less distributions to shareholders from: | | | | | | | | |
Net realized gains | | | (0.36 | ) | | | — | |
Total distributions to shareholders | | | (0.36 | ) | | | — | |
Proceeds from regulatory settlement | | | 0.00 | (b) | | | — | |
Net asset value, end of period | | | $20.29 | | | | $24.96 | |
| Total return | | | (17.24% | ) | | | 0.77% | |
| Ratios to average net assets(c) | | | | | | | | |
Expenses prior to fees waived or expenses reimbursed (including interest expense) | | | 2.01% | (d) | | | 2.20% | (d)(e) |
Net expenses after fees waived or expenses reimbursed (including interest expense)(f) | | | 2.01% | (d)(g) | | | 2.20% | (d)(e)(g) |
Expenses prior to fees waived or expenses reimbursed (excluding interest expense) | | | 2.01% | | | | 2.20% | (e) |
Net expenses after fees waived or expenses reimbursed (excluding interest expense)(f) | | | 2.01% | (g) | | | 2.20% | (e)(g) |
Net investment loss | | | (0.54% | )(g) | | | (2.14% | )(e)(g) |
| Supplemental data | | | | | | | | |
Net assets, end of period (in thousands) | | | $5,837 | | | | $58 | |
Portfolio turnover | | | 167% | | | | 551% | |
Notes to Financial Highlights
| (a) | For the period from March 7, 2011 (commencement of operations) to March 31, 2011. |
| (b) | Rounds to less than $0.01. |
| (c) | In addition to the fees and expenses which the Fund bears directly, the Fund indirectly bears a pro rata share of the fees and expenses of the acquired funds in which it invests. Such indirect expenses are not included in the reported expense ratios. |
| (d) | Includes interest expense which rounds to less than 0.01%. |
| (f) | The Investment Manager and certain of its affiliates agreed to waive/reimburse certain fees and expenses, if applicable. |
| (g) | The benefits derived from expense reductions had an impact of less than 0.01%. |
The Accompanying Notes to Financial Statements are an integral part of this statement.
15
Financial Highlights (continued) – Columbia Energy and Natural Resources Fund
| | | | | | | | | | | | | | | | | | | | |
| | | Year ended March 31, | |
| | | 2012 | | | 2011 | | | 2010 | | | 2009 | | | 2008(a) | |
| Class C | | | | | | | | | | | | | | | |
| Per share data | | | | | | | | | | | | | | | | | | | | |
Net asset value, beginning of period | | | $24.96 | | | | $19.78 | | | | $13.47 | | | | $25.40 | | | | $27.64 | |
Income from investment operations: | | | | | | | | | | | | | | | | | | | | |
Net investment loss | | | (0.12 | ) | | | (0.17 | ) | | | (0.15 | ) | | | (0.13 | ) | | | (0.10 | ) |
Net realized and unrealized gain (loss) | | | (4.18 | ) | | | 5.35 | | | | 6.46 | | | | (11.40 | ) | | | 1.73 | |
Total from investment operations | | | (4.30 | ) | | | 5.18 | | | | 6.31 | | | | (11.53 | ) | | | 1.63 | |
Less distributions to shareholders from: | | | | | | | | | | | | | | | | | | | | |
Net realized gains | | | (0.36 | ) | | | — | | | | — | | | | (0.40 | ) | | | (3.87 | ) |
Total distributions to shareholders | | | (0.36 | ) | | | — | | | | — | | | | (0.40 | ) | | | (3.87 | ) |
Proceeds from regulatory settlement | | | 0.00 | (b) | | | — | | | | 0.00 | (b) | | | — | | | | — | |
Net asset value, end of period | | | $20.30 | | | | $24.96 | | | | $19.78 | | | | $13.47 | | | | $25.40 | |
| Total return | | | (17.20% | ) | | | 26.19% | | | | 46.84% | | | | (46.29% | ) | | | 6.45% | |
| Ratios to average net assets(c) | | | | | | | | | | | | | | | | | | | | |
Expenses prior to fees waived or expenses reimbursed (including interest expense) | | | 2.02% | (d) | | | 2.01% | (d) | | | 1.96% | (d) | | | 2.03% | | | | 1.87% | (d)(e) |
Net expenses after fees waived or expenses reimbursed (including interest expense)(f) | | | 2.02% | (d)(g) | | | 2.01% | (d)(g) | | | 1.96% | (d)(g) | | | 1.99% | (g) | | | 1.82% | (d)(e)(g) |
Expenses prior to fees waived or expenses reimbursed (excluding interest expense) | | | 2.02% | | | | 2.01% | | | | 1.96% | | | | 2.03% | | | | 1.87% | (e) |
Net expenses after fees waived or expenses reimbursed (excluding interest expense)(f) | | | 2.02% | (g) | | | 2.01% | (g) | | | 1.96% | (g) | | | 1.99% | (g) | | | 1.82% | (e)(g) |
Net investment loss | | | (0.55% | )(g) | | | (0.83% | )(g) | | | (0.84% | )(g) | | | (0.73% | )(g) | | | (0.78% | )(e)(g) |
| Supplemental data | | | | | | | | | | | | | | | | | | | | |
Net assets, end of period (in thousands) | | | $22,785 | | | | $25,494 | | | | $16,420 | | | | $5,843 | | | | $1,433 | |
Portfolio turnover | | | 167% | | | | 551% | | | | 523% | | | | 484% | | | | 198% | |
Notes to Financial Highlights
| (a) | For the period from September 28, 2007 (commencement of operations) to March 31, 2008. |
| (b) | Rounds to less than $0.01. |
| (c) | In addition to the fees and expenses which the Fund bears directly, the Fund indirectly bears a pro rata share of the fees and expenses of the acquired funds in which it invests. Such indirect expenses are not included in the reported expense ratios. |
| (d) | Includes interest expense which rounds to less than 0.01%. |
| (f) | The Investment Manager and certain of its affiliates agreed to waive/reimburse certain fees and expenses, if applicable. |
| (g) | The benefits derived from expense reductions had an impact of less than 0.01%. |
The Accompanying Notes to Financial Statements are an integral part of this statement.
16
Financial Highlights (continued) – Columbia Energy and Natural Resources Fund
| | | | | | | | |
| | | Year ended March 31, | |
| | | 2012 | | | 2011(a) | |
| Class I | | | | | | |
| Per share data | | | | | | | | |
Net asset value, beginning of period | | | $25.70 | | | | $18.82 | |
Income from investment operations: | | | | | | | | |
Net investment income | | | 0.11 | | | | 0.05 | |
Net realized and unrealized gain (loss) | | | (4.30 | ) | | | 6.86 | |
Total from investment operations | | | (4.19 | ) | | | 6.91 | |
Less distributions to shareholders from: | | | | | | | | |
Net investment income | | | (0.13 | ) | | | (0.03 | ) |
Net realized gains | | | (0.36 | ) | | | — | |
Total distributions to shareholders | | | (0.49 | ) | | | (0.03 | ) |
Proceeds from regulatory settlement | | | 0.00 | (b) | | | — | |
Net asset value, end of period | | | $21.02 | | | | $25.70 | |
| Total return | | | (16.23% | ) | | | 36.74% | |
| Ratios to average net assets(c) | | | | | | | | |
Expenses prior to fees waived or expenses reimbursed (including interest expense) | | | 0.80% | (d) | | | 0.85% | (d)(e) |
Net expenses after fees waived or expenses reimbursed (including interest expense)(f) | | | 0.80% | (d)(g) | | | 0.85% | (d)(e)(g) |
Expenses prior to fees waived or expenses reimbursed (excluding interest expense) | | | 0.80% | | | | 0.85% | (e) |
Net expenses after fees waived or expenses reimbursed (excluding interest expense)(f) | | | 0.80% | (g) | | | 0.85% | (e)(g) |
Net investment income | | | 0.49% | (g) | | | 0.38% | (e)(g) |
| Supplemental data | | | | | | | | |
Net assets, end of period (in thousands) | | | $29,761 | | | | $115,953 | |
Portfolio turnover | | | 167% | | | | 551% | |
Notes to Financial Highlights
| (a) | For the period from September 27, 2010 (commencement of operations) to March 31, 2011. |
| (b) | Rounds to less than $0.01. |
| (c) | In addition to the fees and expenses which the Fund bears directly, the Fund indirectly bears a pro rata share of the fees and expenses of the acquired funds in which it invests. Such indirect expenses are not included in the reported expense ratios. |
| (d) | Includes interest expense which rounds to less than 0.01%. |
| (f) | The Investment Manager and certain of its affiliates agreed to waive/reimburse certain fees and expenses, if applicable. |
| (g) | The benefits derived from expense reductions had an impact of less than 0.01%. |
The Accompanying Notes to Financial Statements are an integral part of this statement.
17
Financial Highlights (continued) – Columbia Energy and Natural Resources Fund
| | | | | | | | |
| | | Year ended March 31, | |
| | | 2012 | | | 2011(a) | |
| Class R | | | | | | |
| Per share data | | | | | | | | |
Net asset value, beginning of period | | | $25.56 | | | | $18.76 | |
Income from investment operations: | | | | | | | | |
Net investment income (loss) | | | 0.02 | | | | (0.02 | ) |
Net realized and unrealized gain (loss) | | | (4.33 | ) | | | 6.82 | |
Total from investment operations | | | (4.31 | ) | | | 6.80 | |
Less distributions to shareholders from: | | | | | | | | |
Net investment income | | | (0.01 | ) | | | — | |
Net realized gains | | | (0.36 | ) | | | — | |
Total distributions to shareholders | | | (0.37 | ) | | | — | |
Proceeds from regulatory settlement | | | 0.00 | (b) | | | — | |
Net asset value, end of period | | | $20.88 | | | | $25.56 | |
| Total return | | | (16.80% | ) | | | 36.25% | |
| Ratios to average net assets(c) | | | | | | | | |
Expenses prior to fees waived or expenses reimbursed (including interest expense) | | | 1.55% | (d) | | | 1.60% | (d)(e) |
Net expenses after fees waived or expenses reimbursed (including interest expense)(f) | | | 1.55% | (d)(g) | | | 1.60% | (d)(e)(g) |
Expenses prior to fees waived or expenses reimbursed (excluding interest expense) | | | 1.55% | | | | 1.60% | (e) |
Net expenses after fees waived or expenses reimbursed (excluding interest expense)(f) | | | 1.55% | (g) | | | 1.60% | (e)(g) |
Net investment income (loss) | | | 0.11% | (g) | | | (0.13% | )(e)(g) |
| Supplemental data | | | | | | | | |
Net assets, end of period (in thousands) | | | $880 | | | | $55 | |
Portfolio turnover | | | 167% | | | | 551% | |
Notes to Financial Highlights
| (a) | For the period from September 27, 2010 (commencement of operations) to March 31, 2011. |
| (b) | Rounds to less than $0.01. |
| (c) | In addition to the fees and expenses which the Fund bears directly, the Fund indirectly bears a pro rata share of the fees and expenses of the acquired funds in which it invests. Such indirect expenses are not included in the reported expense ratios. |
| (d) | Includes interest expense which rounds to less than 0.01%. |
| (f) | The Investment Manager and certain of its affiliates agreed to waive/reimburse certain fees and expenses, if applicable. |
| (g) | The benefits derived from expense reductions had an impact of less than 0.01%. |
The Accompanying Notes to Financial Statements are an integral part of this statement.
18
Financial Highlights (continued) – Columbia Energy and Natural Resources Fund
| | | | | | | | |
| | | Year ended March 31, | |
| | | 2012 | | | 2011(a) | |
| Class R4 | | | | | | |
| Per share data | | | | | | | | |
Net asset value, beginning of period | | | $25.67 | | | | $25.48 | |
Income from investment operations: | | | | | | | | |
Net investment income (loss) | | | 0.09 | | | | (0.01 | ) |
Net realized and unrealized gain (loss) | | | (4.33 | ) | | | 0.22 | |
Total from investment operations | | | (4.24 | ) | | | 0.21 | |
Less distributions to shareholders from: | | | | | | | | |
Net investment income | | | (0.08 | ) | | | (0.02 | ) |
Net realized gains | | | (0.36 | ) | | | — | |
Total distributions to shareholders | | | (0.44 | ) | | | (0.02 | ) |
Proceeds from regulatory settlement | | | 0.00 | (b) | | | — | |
Net asset value, end of period | | | $20.99 | | | | $25.67 | |
| Total return | | | (16.45% | ) | | | 0.82% | |
| Ratios to average net assets(c) | | | | | | | | |
Expenses prior to fees waived or expenses reimbursed (including interest expense) | | | 1.11% | (d) | | | 1.26% | (d)(e) |
Net expenses after fees waived or expenses reimbursed (including interest expense)(f) | | | 1.11% | (d)(g) | | | 1.26% | (d)(e)(g) |
Expenses prior to fees waived or expenses reimbursed (excluding interest expense) | | | 1.11% | | | | 1.26% | (e) |
Net expenses after fees waived or expenses reimbursed (excluding interest expense)(f) | | | 1.11% | (g) | | | 1.26% | (e)(g) |
Net investment income (loss) | | | 0.43% | (g) | | | (0.57% | )(e)(g) |
| Supplemental data | | | | | | | | |
Net assets, end of period (in thousands) | | | $109 | | | | $3 | |
Portfolio turnover | | | 167% | | | | 551% | |
Notes to Financial Highlights
| (a) | For the period from March 7, 2011 (commencement of operations) to March 31, 2011. |
| (b) | Rounds to less than $0.01. |
| (c) | In addition to the fees and expenses which the Fund bears directly, the Fund indirectly bears a pro rata share of the fees and expenses of the acquired funds in which it invests. Such indirect expenses are not included in the reported expense ratios. |
| (d) | Includes interest expense which rounds to less than 0.01%. |
| (f) | The Investment Manager and certain of its affiliates agreed to waive/reimburse certain fees and expenses, if applicable. |
| (g) | The benefits derived from expense reductions had an impact of less than 0.01%. |
The Accompanying Notes to Financial Statements are an integral part of this statement.
19
Financial Highlights (continued) – Columbia Energy and Natural Resources Fund
| | | | | | | | | | | | | | | | | | | | |
| | | Year ended March 31, | |
| | | 2012 | | | 2011 | | | 2010 | | | 2009 | | | 2008 | |
| Class Z | | | | | | | | | | | | | | | |
| Per share data | | | | | | | | | | | | | | | | | | | | |
Net asset value, beginning of period | | | $25.67 | | | | $20.17 | | | | $13.66 | | | | $25.49 | | | | $23.30 | |
Income from investment operations: | | | | | | | | | | | | | | | | | | | | |
Net investment income | | | 0.09 | | | | 0.03 | | | | 0.04 | | | | 0.02 | | | | 0.01 | |
Net realized and unrealized gain (loss) | | | (4.31 | ) | | | 5.51 | | | | 6.52 | | | | (11.45 | ) | | | 6.08 | |
Total from investment operations | | | (4.22 | ) | | | 5.54 | | | | 6.56 | | | | (11.43 | ) | | | 6.09 | |
Less distributions to shareholders from: | | | | | | | | | | | | | | | | | | | | |
Net investment income | | | (0.09 | ) | | | (0.04 | ) | | | (0.05 | ) | | | — | | | | (0.03 | ) |
Net realized gains | | | (0.36 | ) | | | — | | | | — | | | | (0.40 | ) | | | (3.87 | ) |
Total distributions to shareholders | | | (0.45 | ) | | | (0.04 | ) | | | (0.05 | ) | | | (0.40 | ) | | | (3.90 | ) |
Proceeds from regulatory settlement | | | 0.00 | (a) | | | — | | | | 0.00 | (a) | | | — | | | | — | |
Net asset value, end of period | | | $21.00 | | | | $25.67 | | | | $20.17 | | | | $13.66 | | | | $25.49 | |
| Total return | | | (16.37% | ) | | | 27.47% | | | | 48.12% | | | | (45.72% | ) | | | 26.84% | |
| Ratios to average net assets(b) | | | | | | | | | | | | | | | | | | | | |
Expenses prior to fees waived or expenses reimbursed (including interest expense) | | | 1.01% | (c) | | | 1.01% | (c) | | | 0.96% | (c) | | | 1.03% | | | | 1.11% | (c) |
Net expenses after fees waived or expenses reimbursed (including interest expense)(d) | | | 1.01% | (c)(e) | | | 1.01% | (c)(e) | | | 0.96% | (c)(e) | | | 0.99% | (e) | | | 1.07% | (c)(e) |
Expenses prior to fees waived or expenses reimbursed (excluding interest expense) | | | 1.01% | | | | 1.01% | | | | 0.96% | | | | 1.03% | | | | 1.11% | |
Net expenses after fees waived or expenses reimbursed (excluding interest expense)(d) | | | 1.01% | (e) | | | 1.01% | (e) | | | 0.96% | (e) | | | 0.99% | (e) | | | 1.07% | (e) |
Net investment income | | | 0.42% | (e) | | | 0.17% | (e) | | | 0.21% | (e) | | | 0.11% | (e) | | | 0.05% | (e) |
| Supplemental data | | | | | | | | | | | | | | | | | | | | |
Net assets, end of period (in thousands) | | | $390,028 | | | | $704,685 | | | | $622,471 | | | | $338,292 | | | | $712,080 | |
Portfolio turnover | | | 167% | | | | 551% | | | | 523% | | | | 484% | | | | 198% | |
Notes to Financial Highlights
| (a) | Rounds to less than $0.01. |
| (b) | In addition to the fees and expenses which the Fund bears directly, the Fund indirectly bears a pro rata share of the fees and expenses of the acquired funds in which it invests. Such indirect expenses are not included in the reported expense ratios. |
| (c) | Includes interest expense which rounds to less than 0.01%. |
| (d) | The Investment Manager and certain of its affiliates agreed to waive/reimburse certain fees and expenses, if applicable. |
| (e) | The benefits derived from expense reductions had an impact of less than 0.01%. |
The Accompanying Notes to Financial Statements are an integral part of this statement.
20
Notes to Financial Statements – Columbia Energy and Natural Resources Fund
March 31, 2012
Note 1. Organization
Columbia Energy and Natural Resources Fund (the Fund), a series of Columbia Funds Series Trust I (the Trust), is a non-diversified fund. The Trust is registered under the Investment Company Act of 1940, as amended (the 1940 Act), as an open-end management investment company organized as a Massachusetts business trust.
Fund Shares
The Trust may issue an unlimited number of shares (without par value). The Fund offers Class A, Class B, Class C, Class I, Class R, Class R4 and Class Z shares. All share classes have identical voting, dividend and liquidation rights. Each share class has its own expense structure and sales charges, as applicable.
Class A shares are subject to a maximum front-end sales charge of 5.75% based on the initial investment amount. Class A shares purchased without an initial sales charge in accounts aggregating $1 million to $50 million at the time of purchase are subject to a contingent deferred sales charge (CDSC) if the shares are sold within 18 months of purchase, charged as follows: 1.00% CDSC if redeemed within 12 months of purchase, and 0.50% CDSC if redeemed more than 12, but less than 18, months after purchase.
Class B shares may be subject to a maximum CDSC of 5.00% based upon the holding period after purchase. Class B shares will generally convert to Class A shares eight years after purchase. The Fund no longer accepts investments by new or existing investors in the Fund’s Class B shares, except in connection with the reinvestment of any dividend and/or capital gain distributions in Class B shares of the Fund and exchanges by existing Class B shareholders of certain other funds within the Columbia Family of Funds.
Class C shares are subject to a 1.00% CDSC on shares redeemed within one year of purchase.
Class I shares are not subject to sales charges and are only available to the Columbia Family of Funds.
Class R shares are not subject to sales charges and are only available to qualifying institutional investors.
Class R4 shares are not subject to sales charges; however, this share class is closed to new investors.
Class Z shares are not subject to sales charges, and are only available to certain investors, as described in the Fund’s prospectus.
Note 2. Summary of Significant Accounting Policies
Use of Estimates
The preparation of financial statements in accordance with U.S. generally accepted accounting principles (GAAP) requires management to make certain estimates and assumptions that affect the reported amounts of assets and liabilities, the disclosure of contingent assets and liabilities at the date of the financial statements and the reported amounts of revenue and expenses during the reporting period. Actual results could differ from those estimates.
The following is a summary of significant accounting policies consistently followed by the Fund in the preparation of its financial statements.
Security Valuation
All equity securities are valued at the close of business of the New York Stock Exchange (NYSE). Equity securities are valued at the last quoted sales price on the principal exchange or market on which they trade, except for securities traded on the NASDAQ Stock Market, which are valued at the NASDAQ official close price. Unlisted securities or listed securities for which there were no sales during the day are valued at the mean of the latest quoted bid and asked prices on such exchanges or markets.
Foreign securities are valued based on quotations from the principal market in which such securities are normally traded. If any foreign share prices are not readily available as a result of limited share activity the securities are valued at the mean of the latest quoted bid and asked prices on such exchanges or markets. Foreign currency exchange rates are generally determined at 4:00 p.m. Eastern (U.S.) time. However, many securities markets and exchanges outside the U.S. close prior to the close of the NYSE; therefore, the closing prices for securities in such markets or on such exchanges may not fully reflect events that occur after such close but before the close of the NYSE. In those situations, foreign securities will be fair valued pursuant to the policy adopted by the Board of Trustees (the Board), including utilizing a third party pricing service to determine these fair values. The third party pricing service takes into account multiple factors, including, but not limited to, movements in the U.S. securities markets, certain depositary receipts, futures contracts and foreign exchange rates that have occurred subsequent to the close of the foreign exchange, to determine a good faith estimate that reasonably reflects the current market conditions as of the close of the NYSE. The fair value of a security is likely to be different from the quoted or published price, if available.
21
Columbia Energy and Natural Resources Fund
March 31, 2012
Investments in other open-end investment companies, including money market funds, are valued at net asset value.
Short-term securities purchased within 60 days to maturity are valued at amortized cost, which approximates market value. The value of short-term securities originally purchased with maturities greater than 60 days is determined based on an amortized value to par upon reaching 60 days to maturity. Short-term securities maturing in more than 60 days from the valuation date are valued at the market price or approximate market value based on current interest rates.
Option contracts are valued at the mean of the latest quoted bid and asked prices on their primary exchanges. Option contracts, including over-the-counter (OTC) option contracts, with no readily available market value are valued using quotations obtained from independent brokers as of the close of the NYSE.
Investments for which market quotations are not readily available, or that have quotations which management believes are not reliable, are valued at fair value as determined in good faith under consistently applied procedures established by and under the general supervision of the Board. If a security or class of securities (such as foreign securities) is valued at fair value, such value is likely to be different from the last quoted market price for the security. The determination of fair value often requires significant judgment. To determine fair value, management may use assumptions including but not limited to future cash flows and estimated risk premiums. Multiple inputs from various sources may be used to determine value.
Foreign Currency Transactions and Translation
The values of all assets and liabilities denominated in foreign currencies are translated into U.S. dollars at that day’s exchange rates. Net realized and unrealized gains (losses) on foreign currency transactions and translations include gains (losses) arising from the fluctuation in exchange rates between trade and settlement dates on securities transactions, gains (losses) arising from the disposition of foreign currency and currency gains (losses) between the accrual and payment dates on dividends, interest income and foreign withholding taxes.
For financial statement purposes, the Fund does not distinguish that portion of gains (losses) on investments which is due to changes in foreign exchange rates from that which is due to changes in market prices of the investments. Such fluctuations are included with the net realized and unrealized gains (losses) on investments in the Statement of Operations.
Derivative Instruments
The Fund invests in certain derivative instruments as detailed below to meet its investment objectives. Derivatives are instruments whose values depend on, or are derived from, in whole or in part, the value of one or more other assets, such as securities, currencies, commodities or indices. Derivative instruments may be used to maintain cash reserves while maintaining exposure to certain other assets, to offset anticipated declines in values of investments, to facilitate trading, to reduce transaction costs and to pursue higher investment returns. The Fund may also use derivative instruments to mitigate certain investment risks, such as foreign currency exchange rate risk, interest rate risk and credit risk. Derivatives may involve various risks, including the potential inability of the counterparty to fulfill its obligation under the terms of the contract, the potential for an illiquid secondary market and the potential for market movements which may expose the Fund to gains or losses in excess of the amount shown in the Statement of Assets and Liabilities.
The Fund and any counterparty are required to maintain an agreement that requires the Fund and that counterparty to monitor (on a daily basis) the net fair value of all derivatives entered into pursuant to the agreement between the Fund and such counterparty. If the net fair value of such derivatives between the Fund and that counterparty exceeds a certain threshold (as defined in the agreement), the Fund or the counterparty (as the case may be) is required to post cash and/or securities as collateral. Fair values of derivatives presented in the financial statements are not netted with the fair value of other derivatives or with any collateral amounts posted by the Fund or any counterparty.
Options
Options are contracts which entitle the holder to purchase or sell securities or other identified assets at a specified price, or in the case of index option contracts, to receive or pay the difference between the index value and the strike price of the index option contract. The Fund purchased and wrote option contracts to decrease the Fund’s exposure to equity risk and to increase return on investments and protect gains. Completion of transactions for option contracts traded in the OTC market depends upon the performance of the other party. Cash collateral may be collected or posted by the Fund to secure certain OTC option contract trades. Cash collateral held or posted by the Fund for such option contract trades must be returned to the counterparty or the Fund upon closure, exercise or expiration of the contract.
22
Columbia Energy and Natural Resources Fund
March 31, 2012
Option contracts purchased are recorded as investments and options contracts written are recorded as liabilities of the Fund. The Fund will realize a gain or loss when the option contract expires or is exercised. When option contracts on debt securities or futures are exercised, the Fund will realize a gain or loss. When other option contracts are exercised, the proceeds on sales for a written call or purchased put option contract, or the purchase cost for a written put or purchased call option contract, is adjusted by the amount of premium received or paid.
The risk in buying an option contract is that the Fund pays a premium whether or not the option contract is exercised. The Fund also has the additional risk of being unable to enter into a closing transaction if a liquid secondary market does not exist. The risk in writing a call option contract is that the Fund gives up the opportunity for profit if the market price of the security increases. The risk in writing a put option contract is that the Fund may incur a loss if the market price of the security decreases and the option contract is exercised. The Fund’s maximum payout in the case of written put option contracts represents the maximum potential amount of future payments (undiscounted) that the Fund could be required to make under the contract. For OTC options contracts, the transaction is also subject to counterparty credit risk. The maximum payout amount may be offset by the subsequent sale, if any, of assets obtained upon the exercise of the put option contracts by holders of the option contracts or proceeds received upon entering into the contracts.
Contracts and premiums associated with options contracts written for the year ended March 31, 2012 are as follows:
| | | | | | | | |
| | | Calls | |
| | | Contracts | | | Premiums | |
| Balance at March 31, 2011 | | | — | | | $ | — | |
| Opened | | | 4,600 | | | | 169,194 | |
| Closed | | | (780 | ) | | | (21,754 | ) |
| Exercised | | | (100 | ) | | | (2,657 | ) |
| Expired | | | (3,720 | ) | | | (144,783 | ) |
| Balance at March 31, 2012 | | | — | | | $ | — | |
Effects of Derivative Transactions in the Financial Statements
The following tables are intended to provide additional information about the effect of derivatives on the financial statements of the Fund, including: the fair value of derivatives by risk category and the location of those fair values in the Statement of Assets and Liabilities; the impact of derivative transactions on the Fund’s
operations over the period including realized gains or losses and unrealized gains or losses. The derivative schedules following the Portfolio of Investments present additional information regarding derivative instruments outstanding at the end of the period, if any.
| | |
Fair Values of Derivative Instruments at
March 31, 2012 |
| At March 31, 2012, the Fund had no outstanding derivatives. |
| | | | |
Effect of Derivative Instruments in the Statement of
Operations for the Year Ended March 31, 2012 | |
| | | Amount of Realized Gain
(Loss) on Derivatives | |
| Risk Exposure Category | | Options Contracts
Written and Purchased | |
| Equity contracts | | $ | 150,917 | |
| | | | |
| | |
| | | Change in Unrealized
Appreciation
(Depreciation) on
Derivatives Recognized
in Income | |
| Risk Exposure Category | | Options Contracts
Written and Purchased | |
| Equity contracts | | $ | — | |
| | | | |
Volume of Derivative Instruments for the
Year Ended March 31, 2012 | |
| | | Contracts
Opened | |
| Options Contracts | | | 5,580 | |
Repurchase Agreements
The Fund may engage in repurchase agreement transactions with institutions that management has determined are creditworthy. The Fund, through the custodian, receives delivery of the underlying securities collateralizing a repurchase agreement. Management is responsible for determining that the collateral is at least equal, at all times, to the value of the repurchase obligation including interest. A repurchase agreement transaction involves certain risks in the event of default or insolvency of the counterparty. These risks include possible delays in or restrictions on a Fund’s ability to dispose of the underlying securities and a possible decline in the value of the underlying securities during the period while the Fund seeks to assert its rights.
23
Columbia Energy and Natural Resources Fund
March 31, 2012
Security Transactions
Security transactions are accounted for on the trade date. Cost is determined and gains (losses) are based upon the specific identification method for both financial statement and federal income tax purposes.
Income Recognition
Corporate actions and dividend income are recorded net of any non-reclaimable tax withholdings, on the ex-dividend date or upon receipt of ex-dividend notification in the case of certain foreign securities.
Interest income is recorded on the accrual basis.
Awards from class action litigation are recorded as a reduction of cost basis if the Fund still owns the applicable securities on the payment date. If the Fund no longer owns the applicable securities, the proceeds are recorded as realized gains.
Expenses
General expenses of the Trust are allocated to the Fund and other funds of the Trust based upon relative net assets or other expense allocation methodologies determined by the nature of the expense. Expenses directly attributable to the Fund are charged to the Fund. Expenses directly attributable to a specific class of shares are charged to that share class.
Determination of Class Net Asset Value
All income, expenses (other than class-specific expenses, which are charged to that share class, as shown in the Statement of Operations) and realized and unrealized gains (losses) are allocated to each class of the Fund on a daily basis, based on the relative net assets of each class, for purposes of determining the net asset value of each class.
Federal Income Tax Status
The Fund intends to qualify each year as a regulated investment company under Subchapter M of the Internal Revenue Code, as amended, and will distribute substantially all of its taxable income (including net short-term capital gains), if any, for its tax year, and as such will not be subject to federal income taxes. In addition, the Fund intends to distribute in each calendar year substantially all of its net investment income, capital gains and certain other amounts, if any, such that the Fund should not be subject to federal excise tax. Therefore, no federal income or excise tax provision is recorded.
Distributions to Shareholders
Distributions from net investment income, if any, are declared and paid each calendar quarter. Net realized capital gains, if any, are distributed along with the income dividend. Income distributions and capital gain distributions are determined in accordance with federal income tax regulations which may differ from GAAP.
Guarantees and Indemnifications
Under the Trust’s organizational documents and, in some cases, by contract, its officers and trustees are indemnified against certain liabilities arising out of the performance of their duties to the Trust or its funds. In addition, certain of the Fund’s contracts with its service providers contain general indemnification clauses. The Fund’s maximum exposure under these arrangements is unknown since the amount of any future claims that may be made against the Fund cannot be determined, and the Fund has no historical basis for predicting the likelihood of any such claims.
Recent Accounting Pronouncement
Fair Value Measurements and Disclosures
In May 2011, the Financial Accounting Standards Board (FASB) issued ASU No. 2011-04 modifying Topic 820, Fair Value Measurements and Disclosures. At the same time, the International Accounting Standards Board (IASB) issued International Financial Reporting Standard 13, Fair Value Measurement. The objective of the FASB and IASB is convergence of their guidance on fair value measurements and disclosures.
Specifically, ASU No. 2011-04 requires reporting entities to disclose i) the amounts of any transfers between Level 1 and Level 2, and the reasons for the transfers, ii) for Level 3 fair value measurements, a) quantitative information about significant unobservable inputs used, b) a description of the valuation processes used by the reporting entity and c) a narrative description of the sensitivity of the fair value measurement to changes in unobservable inputs if a change in those inputs might result in a significantly higher or lower fair value measurement. The effective date of ASU No. 2011-04 is for interim and annual periods beginning after December 15, 2011. At this time, management is evaluating the implications of this guidance and the impact it will have on the financial statement amounts and footnote disclosures, if any.
24
Columbia Energy and Natural Resources Fund
March 31, 2012
Note 3. Fees and Compensation Paid to Affiliates
Investment Management Fees
Under an Investment Management Services Agreement (IMSA), Columbia Management Investment Advisers, LLC (the Investment Manager), a wholly-owned subsidiary of Ameriprise Financial, Inc. (Ameriprise Financial), determines which securities will be purchased, held or sold. Effective May 1, 2011, the management fee is an annual fee that is equal to a percentage of the Fund’s average daily net assets that declines from 0.69% to 0.54% as the Fund’s net assets increase. Prior to May 1, 2011, the management fee was equal to a percentage of the Fund’s average daily net assets that declined from 0.60% to 0.43% as the Fund’s net assets increased. The effective management fee rate for the year ended March 31, 2012 was 0.68% of the Fund’s average daily net assets.
Administration Fees
Under an Administrative Services Agreement, the Investment Manager serves as the Fund Administrator. Effective May 1, 2011, the Fund pays the Fund Administrator an annual fee for administration and accounting services equal to a percentage of the Fund’s average daily net assets that declines from 0.06% to 0.04% as the Fund’s net assets increase. Prior to May 1, 2011, the administration fee was equal to the annual rate of 0.15% of the Fund’s average daily net assets, less the fees that were payable by the Fund as described under the Pricing and Bookkeeping Fees note below. The effective administration fee rate for the year ended March 31, 2012 was 0.07% of the Fund’s average daily net assets.
Pricing and Bookkeeping Fees
Prior to May 16, 2011, the Fund had entered into a Financial Reporting Services Agreement (the Financial Reporting Services Agreement) with State Street Bank and Trust Company (State Street) and the Investment Manager pursuant to which State Street provided financial reporting services to the Fund. The Fund also entered into an Accounting Services Agreement (collectively with the Financial Reporting Services Agreement, the State Street Agreements) with State Street and the Investment Manager pursuant to which State Street provided accounting services to the Fund. Under the State Street Agreements, the Fund paid State Street an annual fee of $38,000 paid monthly plus an additional monthly fee based on an annualized percentage rate of average daily net assets of the Fund for the month. The aggregate fee did not exceed $140,000 per year (exclusive of out-of-pocket expenses and charges). The Fund also reimbursed State Street for certain out-of-pocket expenses
and charges. Effective May 16, 2011, these services are provided under the Administrative Services Agreement discussed above.
Compensation of Board Members
Board members are compensated for their services to the Fund as disclosed in the Statement of Operations. The Trust’s eligible Trustees may participate in a Deferred Compensation Plan (the Plan) which may be terminated at any time. Obligation of the Plan will be paid solely out of the Fund’s assets.
Compensation of Chief Compliance Officer
The Board has appointed a Chief Compliance Officer to the Fund in accordance with federal securities regulations. The Fund, along with other affiliated funds, pays its pro-rata share of the expenses associated with the Chief Compliance Officer. The Fund’s expenses for the Chief Compliance Officer will not exceed $15,000 per year.
Transfer Agent Fees
Under a Transfer and Dividend Disbursing Agent Agreement, Columbia Management Investment Services Corp. (the Transfer Agent), an affiliate of the Investment Manager and a wholly-owned subsidiary of Ameriprise Financial, is responsible for providing transfer agency services to the Fund. The Transfer Agent has contracted with Boston Financial Data Services (BFDS) to serve as sub-transfer agent.
The Transfer Agent receives monthly account-based service fees based on the number of open accounts and is reimbursed by the Fund for the fees and expenses the Transfer Agent pays to financial intermediaries that maintain omnibus accounts with the Fund that is a percentage of the average aggregate value of the Fund’s shares maintained in each such omnibus account (other than omnibus accounts for which American Enterprise Investment Services Inc. is the broker of record or accounts where the beneficial shareholder is a customer of Ameriprise Financial Services, Inc., which are paid a per account fee). The Transfer Agent pays the fees of BFDS for services as sub-transfer agent and is not entitled to reimbursement for such fees from the Fund (with the exception of out-of-pocket fees).
The Transfer Agent also receives compensation from fees for various shareholder services and reimbursements for certain out-of-pocket expenses. Class I shares do not pay transfer agent fees. Total transfer agent fees for Class R4 shares are subject to an annual limitation of not more than 0.05% of the average daily net assets attributable to each share class.
25
Columbia Energy and Natural Resources Fund
March 31, 2012
For the year ended March 31, 2012, the Fund’s effective transfer agent fee rates as a percentage of average daily net assets of each class were as follows:
| | | | |
| | | | |
| Class A | | | 0.22 | % |
| Class B | | | 0.20 | |
| Class C | | | 0.21 | |
| Class R | | | 0.21 | |
| Class R4 | | | 0.05 | |
| Class Z | | | 0.20 | |
An annual minimum account balance fee of $20 may apply to certain accounts with a value below the Fund’s initial minimum investment requirements to reduce the impact of small accounts on transfer agent fees. These minimum account balance fees are recorded as part of expense reductions in the Statement of Operations. For the year ended March 31, 2012, these minimum account balance fees reduced total expenses by $6,849.
Plan Administration Fees
Under a Plan Administration Services Agreement with the Transfer Agent, the Fund pays an annual fee at a rate of 0.25% of the Fund’s average daily net assets attributable to Class R4 shares for the provision of various administrative, recordkeeping, communication and educational services.
Distribution and Service Fees
The Fund has an agreement with Columbia Management Investment Distributors, Inc. (the Distributor), an affiliate of the Investment Manager and a wholly-owned subsidiary of Ameriprise Financial, for distribution and shareholder services. Pursuant to Rule 12b-1 under the 1940 Act, the Board has approved, and the Fund has adopted, distribution and shareholder service plans (the Plans) which set the distribution and service fees for the Fund. These fees are calculated daily and are intended to compensate the Distributor and/or eligible selling and/or servicing agents for selling shares of the Fund and providing services to investors.
The Plans require the payment of a monthly service fee to the Distributor at the maximum annual rate of 0.25% of the average daily net assets attributable to Class A, Class B, and Class C shares of the Fund. The Plans also require the payment of a monthly distribution fee to the Distributor at the maximum annual rates of 0.75%, 0.75% and 0.50% of the average daily net assets attributable to Class B, Class C and Class R shares, respectively.
Sales Charges
Sales charges, including front-end charges and CDSCs, received by the Distributor for distributing Fund shares were $231,804 for Class A and $5,419 for Class C shares for the year ended March 31, 2012.
Expenses Waived/Reimbursed by the Investment Manager and its Affiliates
Effective May 1, 2011, the Investment Manager and certain of its affiliates have contractually agreed to waive fees and/or reimburse expenses (excluding certain fees and expenses described below), through July 31, 2012, unless sooner terminated at the sole discretion of the Board, so that the Fund’s net operating expenses, after giving effect to fees waived/expenses reimbursed and any balance credits and/or overdraft charges from the Fund’s custodian, do not exceed the following annual rates as a percentage of the class’ average daily net assets:
| | | | |
| | | | |
| Class A | | | 1.45 | % |
| Class B | | | 2.20 | |
| Class C | | | 2.20 | |
| Class I | | | 1.07 | |
| Class R | | | 1.70 | |
| Class R4 | | | 1.37 | |
| Class Z | | | 1.20 | |
Under the agreement, the following fees and expenses are excluded from the waiver/reimbursement commitment, and therefore will be paid by the Fund, if applicable: taxes (including foreign transaction taxes), expenses associated with investments in affiliated and non-affiliated pooled investment vehicles (including mutual funds and exchange traded funds), transaction costs and brokerage commissions, costs related to any securities lending program, dividend expenses associated with securities sold short, inverse floater program fees and expenses, transaction charges and interest on borrowed money, interest, extraordinary expenses and any other expenses the exclusion of which is specifically approved by the Board. This agreement may be modified or amended only with approval from all parties.
Prior to May 1, 2011, the Investment Manager voluntarily agreed to reimburse a portion of the Fund’s expenses (excluding certain expenses, such as brokerage commissions, interest, taxes and extraordinary expenses, but including custodian charges relating to overdrafts, if any) so that the Fund’s ordinary net operating
26
Columbia Energy and Natural Resources Fund
March 31, 2012
expenses, after giving effect to fees waived/expenses reimbursed and any balance credits from the Fund’s custodian, did not exceed the following annual rates as a percentage of the class’ average daily net assets:
| | | | |
| | | | |
| Class A | | | 1.45 | % |
| Class B | | | 2.20 | |
| Class C | | | 2.20 | |
| Class I | | | 1.06 | |
| Class R | | | 1.70 | |
| Class R4 | | | 1.36 | |
| Class Z | | | 1.20 | |
Note 4. Federal Tax Information
The timing and character of income and capital gain distributions are determined in accordance with income tax regulations, which may differ from GAAP because of temporary or permanent book to tax differences.
For the year ended March 31, 2012, these differences are primarily due to differing treatment for deferral/reversal of wash sale losses, Trustees’ deferred compensation, foreign currency transactions, passive foreign investment company (PFIC) holdings, post-October capital losses and tax straddles. To the extent these differences are permanent, reclassifications are made among the components of the Fund’s net assets in the Statement of Assets and Liabilities. Temporary differences do not require reclassifications. In the Statement of Assets and Liabilities the following reclassifications were made:
| | | | |
| | | | |
| Undistributed net investment income | | $ | 21,220,558 | |
| Accumulated net realized loss | | | (15,415,272 | ) |
| Paid-in capital | | | (5,805,286 | ) |
Net investment income and net realized gains (losses), as disclosed in the Statement of Operations, and net assets were not affected by this reclassification.
The tax character of distributions paid during the years indicated was as follows:
| | | | | | | | |
| Year ended March 31, | | 2012 | | | 2011 | |
| Ordinary income | | $ | 3,219,100 | | | $ | 1,179,755 | |
| Long-term capital gains | | | 11,529,708 | | | | — | |
Short-term capital gain distributions, if any, are considered ordinary income distributions for tax purposes.
At March 31, 2012, the components of distributable earnings on a tax basis were as follows:
| | | | |
| | | | |
| Undistributed ordinary income | | $ | 188,471 | |
| Undistributed accumulated long-term gain | | | — | |
| Unrealized appreciation | | | 59,767,920 | |
At March 31, 2012, the cost of investments for federal income tax purposes was $554,654,097 and the aggregate gross unrealized appreciation and depreciation based on that cost was:
| | | | |
| | | | |
| Unrealized appreciation | | $ | 84,092,363 | |
| Unrealized depreciation | | $ | (24,324,443 | ) |
| | | | |
| Net unrealized appreciation | | $ | 59,767,920 | |
On December 22, 2010, the Regulated Investment Company Modernization Act of 2010 (the Act) was enacted, which changed various technical rules governing the tax treatment of regulated investment companies. The changes are generally effective for taxable years beginning after the date of enactment. Under the Act, the Fund will be permitted to carry forward capital losses incurred in taxable years beginning after the date of enactment for an unlimited period. However, any losses incurred during those future taxable years will be required to be utilized prior to the losses incurred in pre-enactment taxable years, which carry an expiration date. As a result of this ordering rule, pre-enactment capital loss carryforwards may be more likely to expire unused.
For the year ended March 31, 2012, $9,909,297 of capital loss carryforward was utilized.
Under current tax rules, regulated investment companies can elect to treat certain late-year ordinary losses incurred and post-October capital losses (capital losses realized after October 31) as arising on the first day of the following taxable year. As of March 31, 2012, the Fund will elect to treat post-October capital losses of $17,445,999 as arising on April 1, 2012.
Management of the Fund has concluded that there are no significant uncertain tax positions that would require recognition in the financial statements. However, management’s conclusion may be subject to review and adjustment at a later date based on factors including, but not limited to, new tax laws, regulations, and administrative interpretations (including relevant court decisions). Generally, the Fund’s federal tax returns for the prior three fiscal years remain subject to examination by the Internal Revenue Service.
27
Columbia Energy and Natural Resources Fund
March 31, 2012
Note 5. Portfolio Information
The cost of purchases and proceeds from sales of securities, excluding short-term obligations, aggregated to $1,291,237,930 and $1,592,820,865, respectively, for the year ended March 31, 2012.
Note 6. Regulatory Settlements
During the year ended March 31, 2012, the Fund received payments of $4,585 resulting from certain regulatory settlements with third parties in which the Fund had participated. The payments have been included in “Proceeds from regulatory settlements” in the Statement of Changes in Net Assets.
Note 7. Lending of Portfolio Securities
Effective May 16, 2011, the Fund has entered into a Master Securities Lending Agreement (the Agreement) with JPMorgan Chase Bank, N.A. (JPMorgan). The Agreement, which replaces the previous securities lending arrangement with State Street, authorizes JPMorgan as lending agent to lend securities to authorized borrowers in order to generate additional income on behalf of the Fund. Pursuant to the Agreement, the securities loaned are secured by cash or U.S. government securities equal to at least 100% of the market value of the loaned securities. Any additional collateral required to maintain those levels due to market fluctuations of the loaned securities is requested to be delivered the following business day. Cash collateral received is invested by the lending agent on behalf of the Fund into authorized investments pursuant to the Agreement. The investments made with the cash collateral are listed in the Portfolio of Investments. The values of such investments and any uninvested cash collateral are disclosed in the Statement of Assets and Liabilities along with the related obligation to return the collateral upon the return of the securities loaned.
Risks of delay in recovery of securities or even loss of rights in the securities may occur should the borrower of the securities fail financially. Risks may also arise to the extent that the value of the securities loaned increases above the value of the collateral received. JPMorgan will indemnify the Fund from losses resulting from a borrower’s failure to return a loaned security when due. Such indemnification does not extend to losses associated with declines in the value of cash collateral investments. The Investment Manager is not responsible for any losses incurred by the Fund in connection with the securities lending program. Loans are subject to termination by the Fund or the borrower at any time, and are, therefore, not considered to be illiquid investments.
Pursuant to the Agreement, the Fund receives income for lending its securities either in the form of fees or by earning interest on invested cash collateral, net of negotiated rebates paid to borrowers and fees paid to the lending agent for services provided and any other securities lending expenses. Net income earned from securities lending for the year ended March 31, 2012 is disclosed in the Statement of Operations. The Fund continues to earn and accrue interest and dividends on the securities loaned.
Prior to May 16, 2011, the Fund participated in a securities lending arrangement with State Street. Each security on loan was collateralized in an amount at least equal to the market value of the securities loaned plus accrued income from the investment of collateral. The income generated by the investment of the collateral, net of any fees remitted to State Street as the lending agent and borrower rebates, was paid to the Fund.
At March 31, 2012, securities valued at $21,240,147 were on loan, secured by U.S. government securities valued at $565,852 and by cash collateral of $21,104,830 (which does not reflect calls for collateral made to borrowers by JPMorgan at period end) that is partially or fully invested in short-term securities or other cash equivalents.
Note 8. Custody Credits
Prior to May 16, 2011, the Fund had an agreement with its custodian bank under which custody fees may have been reduced by balance credits. These credits are recorded as part of expense reductions on the Statement of Operations. The Fund could have invested a portion of the assets utilized in connection with the expense offset arrangement in an income-producing asset if they had not entered into such an agreement. Subsequent to this date, the Fund may invest its daily balance in an affiliated money market fund as detailed below. For the period April 1, 2011 through May 15, 2011, these credits reduced total expenses by $41.
Note 9. Affiliated Money Market Fund
Effective May 16, 2011, the Fund may invest its daily cash balances in Columbia Short-Term Cash Fund, an affiliated money market fund established for the exclusive use by the Fund and other affiliated funds. The income earned by the Fund from such investments is included as “Dividends from affiliates” in the Statement of Operations. As an investing fund, the Fund indirectly bears its proportionate share of the expenses of Columbia Short-Term Cash Fund.
28
Columbia Energy and Natural Resources Fund
March 31, 2012
Note 10. Shareholder Concentration
At March 31, 2012, two unaffiliated shareholder account owned 31.0% of the outstanding shares of the Fund. The Fund has no knowledge about whether any portion of those shares was owned beneficially by such accounts. Subscription and redemption activity by concentrated accounts may have a significant effect on the operations of the Fund.
Note 11. Line of Credit
The Fund has entered into a revolving credit facility with a syndicate of banks led by JPMorgan, whereby the Fund may borrow for the temporary funding of shareholder redemptions or for other temporary or emergency purposes. The credit facility became effective on May 16, 2011, replacing a prior credit facility. The credit facility agreement, as amended, which is a collective agreement between the Fund and certain other funds managed by the Investment Manager, severally and not jointly, permits collective borrowings up to $500 million. Pursuant to a December 13, 2011 amendment to the credit facility agreement, interest is charged to each participating fund based on its borrowings at a rate equal to the higher of (i) the overnight federal funds rate plus 1.00% or (i) the one-month LIBOR rate plus 1.00%. Each borrowing under the credit facility matures no later than 60 days after the date of borrowing. The Fund also pays a commitment fee equal to its pro rata share of the amount of the credit facility at a rate of 0.08% per annum. For the period May 16, 2011 through December 13, 2011, interest was charged to each participating fund based on its borrowings at a rate equal to the sum of the federal funds rate plus (i) 1.25% per annum plus (ii) if one-month LIBOR exceeds the federal funds rate, the amount of such excess. The Fund also paid a commitment fee equal to its pro rata share of the amount of the credit facility at a rate of 0.10% per annum.
Prior to May 16, 2011, the Fund and certain other funds managed by the Investment Manager participated in a $225 million committed, unsecured revolving credit facility provided by State Street. Interest was charged to each fund based on its borrowings at a rate equal to the greater of the (i) federal funds rate plus 1.25% per annum or (ii) the overnight LIBOR rate plus 1.25% per annum. The Fund also paid a commitment fee equal to its pro rata share of the amount of the credit facility at a rate of 0.125% per annum. For the year ended March 31, 2012, the average daily loan balance outstanding on days when borrowing existed was $2,650,000 at a weighted average interest rate of 1.39%.
Note 12. Fund Merger
At the close of business on June 3, 2011, the Fund acquired the assets and assumed the identified liabilities of RiverSource Precious Metals and Mining Fund, a series of RiverSource Selected Series, Inc. The reorganization was completed after shareholders of RiverSource Precious Metals and Mining Fund approved the plan on February 15, 2011. The purpose of the transaction was to combine two funds managed by the Investment Manager with comparable investment objectives and strategies.
The aggregate net assets of the Fund immediately before the acquisition were $859,188,131 and the combined net assets immediately after the acquisition were $1,035,182,630.
The merger was accomplished by a tax-free exchange of 12,525,870 shares of RiverSource Precious Metals and Mining Fund valued at $175,994,499 (including $56,637,074 of unrealized appreciation).
In exchange for RiverSource Precious Metals and Mining Fund shares, the Fund issued the following number of shares:
| | | | |
| | | | |
| | | Shares | |
| Class A | | | 6,701,075 | |
| Class B | | | 511,902 | |
| Class C | | | 280,755 | |
| Class I | | | 604 | |
| Class R4 | | | 5,846 | |
For financial reporting purposes, net assets received and shares issued by the Fund were recorded at fair value; however, RiverSource Precious Metals and Mining Fund’s cost of investments was carried forward.
The financial statements reflect the operations of the Fund for the period prior to the merger and the combined fund for the period subsequent to the merger. Because the combined investment portfolios have been managed as a single integrated portfolio since the merger was completed, it is not practicable to separate the amounts of revenue and earnings of RiverSource Precious Metals and Mining Fund that have been included in the combined Fund’s Statement of Operations since the merger was completed.
Assuming the merger had been completed on April 1, 2011, the Fund’s pro-forma net investment income, net gain on investments, net change in unrealized depreciation and net decrease in net assets from operations for the year ended March 31, 2012 would have been approximately $2.7 million, $25.3 million, $(204.0) million and $(176.0) million, respectively.
29
Columbia Energy and Natural Resources Fund
March 31, 2012
Note 13. Significant Risks
Non-Diversification Risk
A non-diversified fund is permitted to invest a greater percentage of its total assets in fewer issuers than a diversified fund. The Fund may, therefore, have a greater risk of loss from a few issuers than a similar fund that invests more broadly.
Note 14. Subsequent Events
Management has evaluated the events and transactions that have occurred through the date the financial statements were issued and noted no items requiring adjustment of the financial statements or additional disclosure.
Note 15. Information Regarding Pending and Settled Legal Proceedings
In December 2005, without admitting or denying the allegations, American Express Financial Corporation (AEFC, which is now known as Ameriprise Financial, Inc. (Ameriprise Financial)) entered into settlement agreements with the Securities and Exchange Commission (SEC) and Minnesota Department of Commerce (MDOC) related to market timing activities. As a result, AEFC was censured and ordered to cease and desist from committing or causing any violations of certain provisions of the Investment Advisers Act of 1940, the Investment Company Act of 1940, and various Minnesota laws. AEFC agreed to pay disgorgement of $10 million and civil money penalties of $7 million. AEFC also agreed to retain an independent distribution consultant to assist in developing a plan for distribution of all disgorgement and civil penalties ordered by the SEC in accordance with various undertakings detailed at www.sec.gov/litigation/admin/ia-2451.pdf. Ameriprise Financial and its affiliates have cooperated with the SEC and the MDOC in these legal proceedings, and have made regular reports to the funds’ Boards of Trustees.
Ameriprise Financial and certain of its affiliates have historically been involved in a number of legal, arbitration and regulatory proceedings, including routine litigation, class actions, and governmental actions, concerning matters arising in connection with the conduct of their business activities. Ameriprise Financial believes that the Funds are not currently the subject of, and that neither Ameriprise Financial nor any of its affiliates are the subject of, any pending legal, arbitration or regulatory proceedings that are likely to have a material adverse effect on the Funds or the ability of Ameriprise Financial or its affiliates to perform under their contracts with the Funds. Ameriprise Financial is required to make 10-Q, 10-K and, as necessary, 8-K filings with the Securities and Exchange Commission on legal and regulatory matters that relate to Ameriprise Financial and its affiliates. Copies of these filings may be obtained by accessing the SEC website at www.sec.gov.
There can be no assurance that these matters, or the adverse publicity associated with them, will not result in increased fund redemptions, reduced sale of fund shares or other adverse consequences to the Funds. Further, although we believe proceedings are not likely to have a material adverse effect on the Funds or the ability of Ameriprise Financial or its affiliates to perform under their contracts with the Funds, these proceedings are subject to uncertainties and, as such, we are unable to estimate the possible loss or range of loss that may result. An adverse outcome in one or more of these proceedings could result in adverse judgments, settlements, fines, penalties or other relief that could have a material adverse effect on the consolidated financial condition or results of operations of Ameriprise Financial.
30
Report of Independent Registered Public Accounting Firm
To the Trustees of Columbia Funds Series Trust I and the Shareholders of Columbia Energy and Natural Resources Fund
In our opinion, the accompanying statement of assets and liabilities, including the investment portfolio, and the related statements of operations and of changes in net assets and the financial highlights present fairly, in all material respects, the financial position of Columbia Energy and Natural Resources Fund (the “Fund”) (a series of Columbia Funds Series Trust I ) at March 31, 2012, the results of its operations for the year then ended, the changes in its net assets for each of the two years in the period then ended and the financial highlights for the periods indicated, in conformity with accounting principles generally accepted in the United States of America. These financial statements and financial highlights (hereafter referred to as “financial statements”) are the responsibility of the Fund’s management. Our responsibility is to express an opinion on these financial statements based on our audits. We conducted our audits of these financial statements in accordance with the standards of the Public Company Accounting Oversight Board (United States). Those standards require that we plan and perform the audit to obtain reasonable assurance about whether the financial statements are free of material misstatement. An audit includes examining, on a test basis, evidence supporting the amounts and disclosures in the financial statements, assessing the accounting principles used and significant estimates made by management, and evaluating the overall financial statement presentation. We believe that our audits, which included confirmation of securities at March 31, 2012 by correspondence with the custodian, transfer agent and brokers, provide a reasonable basis for our opinion.
PricewaterhouseCoopers LLP
Minneapolis, Minnesota
May 22, 2012
31
Federal Income Tax Information (Unaudited) – Columbia Energy and Natural Resources Fund
The Fund hereby designates as a capital gain dividend with respect to the fiscal year ended March 31, 2012, $12,106,193, or if subsequently determined to be different, the net capital gain of such year.
100.00% of the ordinary income distributed by the Fund for the fiscal year ended March 31, 2012, qualifies for the corporate dividends received deduction.
For non-corporate shareholders 100.00%, or the maximum amount allowable under the Jobs and Growth Tax Relief Reconciliation Act of 2003, of ordinary income distributed by the Fund for the fiscal year ended March 31, 2012 may represent qualified dividend income.
The Fund will notify shareholders in January 2013 of amounts for use in preparing 2012 income tax returns.
32
Fund Governance
The Trustees serve terms of indefinite duration. The names, addresses and birth years of the Trustees and Officers of the Funds in Columbia Funds Series Trust I, the year each was first elected or appointed to office, their principal business occupations during at least the last five years, the number of Funds overseen by each Trustee and other directorships they hold are shown below. Each officer listed below serves as an officer of each Fund in Columbia Funds Series Trust I.
Independent Trustees
| | |
Name, address and year of birth,
Position with funds, Year first
elected or appointed to office | | Principal occupation(s) during past five years, Number of funds in Columbia Funds
Complex overseen by trustee, Other directorships Held |
| |
| Rodman L. Drake (born 1943) | | |
c/o Columbia Management Investment Advisers, LLC 225 Franklin Street Boston, MA 02110 Trustee (since 1994) and Chairman of the Board (since 2009) | | Independent consultant since 2010; Co-Founder of Baringo Capital LLC (private equity) from 1997 to 2008; CEO of Crystal River Capital, Inc. (real estate investment trust) from 2003 to 2010; Oversees 51; Jackson Hewitt Tax Service Inc. (tax preparation services) from 2004 to 2011; Celgene Corporation (global biotechnology company); Student Loan Corporation (student loan provider) from 2005 to 2010; Celgene Corporation (global biotechnology company); The Helios Funds and Brookfield Funds (closed-end funds); Crystal River Capital, Inc. from 2005 to 2010; Parsons Brinckerhoff from 1995 to 2008; and Apex Silver Mines Ltd. from 2007 to 2009 |
| |
| Douglas A. Hacker (born 1955) | | |
c/o Columbia Management Investment Advisers, LLC 225 Franklin Street Boston, MA 02110 Trustee (since 1996) | | Independent business executive since May 2006; Executive Vice President–Strategy of United Airlines from December 2002 to May 2006; President of UAL Loyalty Services (airline marketing company) from September 2001 to December 2002; Executive Vice President and Chief Financial Officer of United Airlines from July 1999 to September 2001. Oversees 51; Nash Finch Company (food distributor); Aircastle Limited (aircraft leasing); and SeaCube Container Leasing Ltd (container leasing) |
|
| Janet Langford Kelly (born 1957) |
c/o Columbia Management Investment Advisers, LLC 225 Franklin Street Boston, MA 02110 Trustee (since 1996) | | Senior Vice President, General Counsel and Corporate Secretary, ConocoPhillips (integrated energy company) since September 2007; Deputy General Counsel–Corporate Legal Services, ConocoPhillips from August 2006 to August 2007; Partner, Zelle, Hofmann, Voelbel, Mason & Gette LLP (law firm) from March 2005 to July 2006; Adjunct Professor of Law, Northwestern University, from September 2004 to June 2006; Director, UAL Corporation (airline) from February 2006 to July 2006; Chief Administrative Officer and Senior Vice President, Kmart Holding Corporation (consumer goods) from September 2003 to March 2004 Oversees 51; None |
|
| Nancy T. Lukitsh (born 1956) |
c/o Columbia Management Investment Advisers, LLC 225 Franklin Street Boston, MA 02110 Trustee (since 2011) | | Senior Vice President, Partner and Director of Marketing, Wellington Management Company, LLP (investment adviser) from 1997 to 2010; Chair, Wellington Management Investment Portfolios (commingled non-U.S. investment pools) from 2007 to 2010; Director, Wellington Trust Company, NA and other Wellington affiliates from 1997 to 2010. Oversees 51; None |
|
| William E. Mayer (born 1940) |
c/o Columbia Management Investment Advisers, LLC 225 Franklin Street Boston, MA 02110 Trustee (since 1994) | | Partner, Park Avenue Equity Partners (private equity) since February 1999; Dean and Professor, College of Business and Management, University of Maryland from 1992 to 1996. Oversees 51; DynaVox Inc. (speech creation); Lee Enterprises (print media), WR Hambrecht + Co. (financial service provider) from 2000 to 2012; BlackRock Kelso Capital Corporation (investment company) |
33
Fund Governance (continued)
Independent Trustees (continued)
| | |
Name, address and year of birth,
Position with funds, Year first
elected or appointed to office | | Principal occupation(s) during past five years, Number of funds in Columbia Funds
Complex overseen by trustee, Other directorships held |
| |
| David M. Moffett (born 1952) | | |
c/o Columbia Management Investment Advisers, LLC 225 Franklin Street Boston, MA 02110 Trustee (since 2011) | | Retired. Chief Executive Officer, Federal Home Loan Mortgage Corporation, from 2008 to 2009; Senior Adviser, Global Financial Services Group, Carlyle Group, Inc., from 2007 to 2008; Vice Chairman and Chief Financial Officer, U.S. Bancorp, from 1993 to 2007. Oversees 51; CIT Group Inc. (commercial and consumer finance), eBay Inc. (online trading community), MBIA Corp (financial service provider), E.W. Scripps Co. (print and television media), Building Materials Holding Corp. (building materials and construction services), and University of Oklahoma Foundation. |
| |
| Charles R. Nelson (born 1942) | | |
c/o Columbia Management Investment Advisers, LLC 225 Franklin Street Boston, MA 02110 Trustee (since 1981) | | Retired. Professor Emeritus, University of Washington, since 2011; Professor of Economics, University of Washington, from 1976 to 2011; Ford and Louisa Van Voorhis Professor of Political Economy, University of Washington, from 1993 to 2011; Adjunct Professor of Statistics, University of Washington, from 1980 to 2011; Associate Editor, Journal of Money Credit and Banking from 1993 to 2008; consultant on econometric and statistical matters. Oversees 51; None |
| |
| John J. Neuhauser (born 1943) | | |
c/o Columbia Management Investment Advisers, LLC 225 Franklin Street Boston, MA 02110 Trustee (since 1984) | | President, Saint Michael’s College, since August 2007; Director or Trustee of several non-profit organization, including Fletcher Allen Health Care, Inc.; University Professor, Boston College from November 2005 to August 2007; Academic Vice President and Dean of Faculties, Boston College from August 1999 to October 2005. Oversees 51; Liberty All-Star Equity Fund and Liberty All-Star Growth Fund, Inc. (closed-end funds) |
| |
| Patrick J. Simpson (born 1944) | | |
c/o Columbia Management Investment Advisers, LLC 225 Franklin Street Boston, MA 02110 Trustee (since 2000) | | Partner, Perkins Coie LLP (law firm). Oversees 51; None |
| |
| Anne-Lee Verville (born 1945) | | |
c/o Columbia Management Investment Advisers, LLC 225 Franklin Street Boston, MA 02110 Trustee (since 1998) | | Retired. General Manager–Global Education Industry from 1994 to 1997, President–Application Systems Division from 1991 to 1994, Chief Financial Officer–US Marketing & Services from 1988 to 1991, and Chief Information Officer from 1987 to 1988, IBM Corporation (computer and technology). Oversees 51; Enesco Group, Inc. (producer of giftware and home and garden decor products) from 2001 to 2006 |
The Statement of Additional Information includes additional information about the Trustees of the Funds and is available, without charge, upon request by calling 1-800-345-6611.
34
Fund Governance (continued)
Interested Trustees
| | |
Name, address and year of birth,
Position with funds, Year first
elected or appointed to office | | Principal occupation(s) during past five years, Number of funds in Columbia Funds
Complex overseen by trustee, Other directorships held |
| |
| William F. Truscott (born 1960) | | |
53600 Ameriprise Financial Center Minneapolis, MN 55474 Senior Vice President (since 2010) | | Chairman of the Board, Columbia Management Investment Advisers, LLC since May 2010 and February 2012, respectively (previously President, Chairman of the Board and Chief Investment Officer, from 2001 to April 2010); Chief Executive Officer, U.S. Asset Management & President, Annuities, Ameriprise Financial, Inc. since May 2010 (previously President–U.S. Asset Management and Chief Investment Officer from 2005 to April 2010, and Senior Vice President–Chief Investment Officer, from 2001 to 2005); Director, President and Chief Executive Officer, Ameriprise Certificate Company since 2006; Director, Columbia Management Investment Distributors, Inc. since May 2010 and February 2012, respectively (previously Chairman of the Board and Chief Executive Officer from 2008 to April 2010); Chairman of the Board and Chief Executive Officer, RiverSource Distributors, Inc. since 2006. Oversees 51; Columbia Funds Board. |
35
Fund Governance (continued)
Officers
| | |
| Name, Year of birth and address | | Principal occupation(s) during the past five years |
|
| J. Kevin Connaughton (born 1964) |
225 Franklin Street Boston, MA 02110 President (since 2009) | | Senior Vice President and General Manager–Mutual Fund Products, Columbia Management Investment Advisers, LLC since May 2010; President, Columbia Funds, since 2009, and RiverSource Funds, since May 2010 (previously Senior Vice President and Chief Financial Officer, Columbia Funds, from June 2008 to January 2009, Treasurer, Columbia Funds, from October 2003 to May 2008, and senior officer of various other affiliated funds since 2000); Managing Director, Columbia Management Advisors, LLC from December 2004 to April 2010. |
| |
| Michael G. Clarke (born 1969) | | |
225 Franklin Street Boston, MA 02110 Treasurer (since 2011) and Chief Financial Officer (since 2009) | | Vice President, Columbia Management Investment Advisers, LLC since May 2010; Managing Director of Fund Administration, Columbia Management Advisors, LLC, from September 2004 to April 2010; senior officer of Columbia Funds and affiliated funds since 2002. |
| |
| Scott R. Plummer (born 1959) | | |
5228 Ameriprise Financial Center Minneapolis, MN 55474 Senior Vice President, Assistant Secretary and Chief Legal Officer (since 2010) | | Chief Legal Officer and Assistant Secretary, Columbia Management Investment Advisers, LLC since June 2005; Vice President and Lead Chief Counsel–Asset Management, Ameriprise Financial, Inc. since May 2010 (previously Vice President and Chief Counsel–Asset Management, from 2005 to April 2010, and Vice President–Asset Management Compliance from 2004 to 2005); Vice President, Chief Counsel and Assistant Secretary, Columbia Management Investment Distributors, Inc. since 2008; Vice President, General Counsel and Secretary, Ameriprise Certificate Company since 2005; Chief Counsel, RiverSource Distributors, Inc. since 2006; Vice President, General Counsel and Secretary, RiverSource Funds, since December 2006; Senior Vice President, Secretary and Chief Legal Officer, Columbia Funds, since May 2010. |
| |
| Thomas P. McGuire (born 1972) | | |
225 Franklin Street Boston, MA 02110 Chief Compliance Officer (since 2012) | | Vice President–Asset Management Compliance, Columbia Management Investment Advisers, LLC since 2010; Chief Compliance Officer, Ameriprise Certificate Company, since September 2010; Compliance Executive, Bank of America, 2005-2010. |
| |
| William F. Truscott (born 1960) | | |
53600 Ameriprise Financial Center Minneapolis, MN 55474 Senior Vice President (since 2010) | | Chairman of the Board, Columbia Management Investment Advisers, LLC since May 2010 and February 2012, respectively (previously President, Chairman of the Board and Chief Investment Officer, from 2001 to April 2010); Chief Executive Officer, U.S. Asset Management & President, Annuities, Ameriprise Financial, Inc. since May 2010 (previously President–U.S. Asset Management and Chief Investment Officer from 2005 to April 2010, and Senior Vice President–Chief Investment Officer, from 2001 to 2005); Director, President and Chief Executive Officer, Ameriprise Certificate Company since 2006; Director, Columbia Management Investment Distributors, Inc. since May 2010 and February 2012, respectively (previously Chairman of the Board and Chief Executive Officer from 2008 to April 2010); Chairman of the Board and Chief Executive Officer, RiverSource Distributors, Inc. since 2006. |
|
| Colin Moore (born 1958) |
225 Franklin Street Boston, MA 02110 Senior Vice President (since 2010) | | Director and Chief Investment Officer, Columbia Management Investment Advisers, LLC since May 2010; Manager, Managing Director and Chief Investment Officer of Columbia Management Advisors, LLC from 2007 to April 2010; Head of Equities, Columbia Management Advisors, LLC from 2002 to 2007. |
36
Fund Governance (continued)
Officers (continued)
| | |
| Name, Year of birth and address | | Principal occupation(s) during the past five years |
| |
| Amy Johnson (born 1965) | | |
5228 Ameriprise Financial Center Minneapolis, MN 55474 Vice President (since 2010) | | Senior Vice President and Chief Operating Officer, Columbia Management Investment Advisers, LLC since May 2010 (previously Chief Administrative Officer, from 2009 until April 2010, Vice President–Asset Management and Trust Company Services, from 2006 to 2009, and Vice President–Operations and Compliance from 2004 to 2006). |
| |
| Joseph F. DiMaria (born 1968) | | |
225 Franklin Street Boston, MA 02110 Vice President (since 2011) and Chief Accounting Officer (since 2008) | | Vice President, Mutual Fund Administration, Columbia Management Investment Advisers, LLC, since May 2010; Director of Fund Administration, Columbia Management Advisors, LLC from January 2006 to April 2010; Head of Tax/Compliance and Assistant Treasurer, Columbia Management Advisors, LLC, from November 2004 to December 2005. |
| |
| Stephen T. Welsh (born 1957) | | |
225 Franklin Street Boston, MA 02110 Vice President (since 2006) | | President and Director, Columbia Management Investment Services Corp. since May 2010; President and Director, Columbia Management Services, Inc. from July 2004 to April 2010; Managing Director, Columbia Management Distributors, Inc. from August 2007 to April 2010. |
| |
| Paul D. Pearson (born 1956) | | |
5228 Ameriprise Financial Center Minneapolis, MN 55474 Vice President and Assistant Treasurer (since 2011) | | Vice President, Investment Accounting, Columbia Management Investment Advisers, LLC, since May 2010; Vice President, Managed Assets, Investment Accounting, Ameriprise Financial Corporation. |
| |
| Paul B. Goucher (born 1968) | | |
5228 Ameriprise Financial Center Minneapolis, MN 55474 Vice President and Assistant Secretary (since 2010) | | Vice President and Chief Counsel of Ameriprise Financial since January 2010 (formerly Vice President and Group Counsel from November 2008 to January 2010); Director, Managing Director and General Counsel of J. & W. Seligman & Co. Incorporated (Seligman) from July 2008 to November 2008 and Managing Director and Associate General Counsel of Seligman from January 2005 to July 2008. |
| |
| Christopher O. Petersen (born 1970) | | |
5228 Ameriprise Financial Center Minneapolis, MN 55474 Vice President (since 2010) and Secretary (since 2011) | | Vice President and Chief Counsel, Ameriprise Financial since January 2010 (formerly Vice President and Group Counsel or Counsel from April 2004 to January 2010); Assistant Secretary of RiverSource Funds since January 2007; officer of Columbia Funds and affiliated funds since 2007. |
| |
| Michael E. DeFao (born 1968) | | |
225 Franklin Street Boston, MA 02110 Vice President and Assistant Secretary (since 2011) | | Vice President and Chief Counsel, Ameriprise Financial since May 2010; Associate General Counsel Bank of America from June 2005 to April 2010. |
37
Board Consideration and Approval of Advisory Agreement
On March 7, 2012, the Board of Trustees (the “Board”) and the Trustees who are not interested persons (as defined in the Investment Company Act of 1940) of the Trust (the “Independent Trustees”) unanimously approved the continuation of the Investment Management Services Agreement (the “Advisory Agreement”) with Columbia Management Investment Advisers, LLC (the “Investment Manager”) with respect to Columbia Energy and Natural Resources Fund (the “Fund”), a series of the Trust. As detailed below, the Advisory Fees and Expenses Committee (the “Committee”) and the Board met on multiple occasions to review and discuss, both among themselves and with the management team of the Investment Manager, materials provided by the Investment Manager before determining to approve the continuation of the Advisory Agreement.
In connection with their deliberations regarding the continuation of the Advisory Agreement, the Committee and the Board requested and evaluated materials from the Investment Manager regarding the Fund and the Advisory Agreement, and discussed these materials with representatives of the Investment Manager at the Committee meeting held on March 6, 2012 and at the Board meeting held on March 7, 2012. In addition, the Board considers matters bearing on the Agreement at most of its other meetings throughout the year and meets regularly with senior management of the Funds and the Investment Manager. Through the Board’s Investment Oversight Committees, Trustees also meet with selected Fund portfolio managers and other investment personnel at various times throughout the year. The Committee and the Board also consulted with Fund counsel and with the Independent Trustees’ independent legal counsel, who advised on the legal standard for consideration by the Board and otherwise assisted the Board in its deliberations. On March 6, 2012, the Committee recommended that the Board approve the continuation of the Advisory Agreement. On March 7, 2012, the Board, including the Independent Trustees, voting separately, unanimously approved the continuation of the Advisory Agreement for the Fund.
The Committee and the Board considered all information that they, their legal counsel, or the Investment Manager believed reasonably necessary to evaluate and to determine whether to approve the continuation of the Advisory Agreement. In their deliberations, the Trustees did not identify any particular information that was all-important or controlling, and individual Trustees may have attributed different weights to the various factors. The information and factors considered by the Committee and the Board in
recommending for approval or approving the continuation of the Advisory Agreement for the Fund included the following:
| n | | Information on the investment performance of the Fund relative to the performance of the Fund’s benchmarks and the performance of a group of comparable mutual funds, as determined by an independent third-party data provider; |
| n | | Information on the Fund’s advisory fees and total expenses, including information comparing the Fund’s expenses to those of a group of comparable mutual funds, as determined by an independent third-party data provider; |
| n | | The Investment Manager’s agreement to contractually limit or cap total operating expenses for the Fund so that total operating expenses (excluding certain fees and expenses, such as transaction costs and certain other investment related expenses, interest, taxes, acquired fund fees and expenses, and extraordinary expenses) would not exceed the median expenses of a group of comparable funds (as determined from time to time, generally annually, by an independent third-party data provider); |
| n | | The terms and conditions of the Advisory Agreement, including that the advisory fee rates payable by the Fund would not change; |
| n | | The terms and conditions of other agreements and arrangements with affiliates of the Investment Manager relating to the operations of the Fund, including the Administrative Services Agreement, the Distribution Agreement and the Transfer and Dividend Disbursing Agent Agreement, noting in the case of the Transfer and Dividend Disbursing Agent Agreement certain proposed changes to the fee rates payable thereunder; |
| n | | Descriptions of various functions performed by the Investment Manager under the Advisory Agreement, including portfolio management and portfolio trading practices; |
| n | | Information regarding the management fees and investment performance of any comparable portfolios of other clients of the Investment Manager, including institutional separate accounts; and |
| n | | The profitability to the Investment Manager and its affiliates from their relationships with the Fund. |
Nature, Extent and Quality of Services to be Provided under the Advisory Agreement
The Committee and the Board considered the nature, extent and quality of services provided to the Fund by the Investment Manager
38
and its affiliates under the Advisory Agreement and under separate agreements for the provision of transfer agency and administrative services, and the resources dedicated to the Fund and the other Columbia Funds by the Investment Manager and its affiliates. The Committee and the Board considered, among other things, the Investment Manager’s ability to attract, motivate and retain highly qualified research, advisory and supervisory investment professionals (including personnel and other resources, compensation programs for personnel involved in fund management, reputation and other attributes), the portfolio management services provided by those investment professionals, the quality of the Investment Manager’s investment research capabilities and trade execution services, and the other resources that the Investment Manager devotes to the Fund. The Committee and the Board also considered the potential benefits to shareholders of investing in a mutual fund that is part of a fund complex offering exposure to a variety of asset classes and investment disciplines and providing a variety of fund and shareholder services.
The Committee and the Board also considered the professional experience and qualifications of the senior personnel of the Investment Manager. The Committee and the Board noted the compliance programs of and the compliance-related resources provided to the Fund by the Investment Manager and its affiliates, and considered the Investment Manager’s ability to provide administrative services to the Fund pursuant to a separate administrative services agreement, including the Investment Manager’s ability to coordinate the activities of the Fund’s other service providers. After reviewing these and related factors, the Committee and the Board concluded, within the context of their overall conclusions, that the expected nature, extent and quality of the services to be provided to the Fund under the Advisory Agreement supported the continuation of such agreement.
Investment Performance
The Committee and the Board reviewed information about the performance of the Fund over various time periods, including performance information relative to benchmarks and information based on reports of an independent third-party data provider that compared the performance of the Fund to the performance of a group of comparable mutual funds. The Committee and the Board also reviewed a description of the third party’s methodology for identifying the Fund’s peer groups for purposes of performance and expense comparisons. In the case of each Fund whose performance lagged that of a relevant peer group for certain (although not necessarily all) periods, the Committee and the Board concluded that
other factors relevant to performance were sufficient, in light of other considerations, to warrant continuation of the Fund’s Advisory Agreement. Those factors varied from fund to fund, but included one or more of the following: (i) that the Fund’s performance, although lagging in certain recent periods, was stronger over the longer term; (ii) that the underperformance was attributable, to a significant extent, to investment decisions that were reasonable and consistent with the Fund’s investment strategy and policies and that the Fund was performing within a reasonable range of expectations, given those investment decisions, market conditions and the Fund’s investment strategy; (iii) that the Fund’s performance was competitive when compared to other relevant performance benchmarks or peer groups; and (iv) that the Investment Manager had taken or was taking steps designed to help improve the Fund’s investment performance, including, but not limited to, replacing portfolio managers, enhancing the resources supporting the portfolio managers, or modifying investment strategies.
The Committee and the Board noted that, through December 31, 2011, the Fund’s performance was in the ninety-ninth, eighty-ninth and fiftieth percentiles (where the best performance would be in the first percentile) of its category selected by an independent third-party data provider for the purposes of performance comparisons for the one-, three- and five- year periods, respectively.
The Committee and the Board also considered the Investment Manager’s performance and reputation generally, the Investment Manager’s historical responsiveness to Board concerns about performance and the Investment Manager’s willingness to take steps intended to improve performance. After reviewing these and related factors, the Committee and the Board concluded, within the context of their overall conclusions regarding the Advisory Agreement, that the performance of the Fund and the Investment Manager was sufficient, in light of other considerations, to warrant the continuation of the Advisory Agreement.
Investment Advisory Fee Rates and Other Expenses
The Committee and the Board considered the advisory fees to be charged to the Fund under the Advisory Agreement as well as the total expenses to be incurred by the Fund. In assessing the reasonableness of the fees under the Advisory Agreement, the Committee and the Board considered, among other information, the Fund’s advisory fee and its expected total expense ratio as a percentage of average daily net assets. The Committee and the Board noted that the Fund’s actual management fee and total net
39
expense ratio are ranked in the second and first quintiles, respectively, against the Fund’s expense universe as determined by an independent third-party data provider for purposes of expense comparison. The Committee and the Board also took into account the fee waiver and expense limitation arrangements agreed to by the Investment Manager, as noted above.
The Committee and the Board also considered the fact that the advisory fee rates payable by the Fund to the Investment Manager under the Advisory Agreement were the same as those currently paid by the Fund to the Investment Manager.
The Committee and the Board also received and considered information about the advisory fees charged by the Investment Manager to institutional separate accounts. In considering the fees charged to those accounts, the Committee and the Board took into account, among other things, the Investment Manager’s representations about the differences between managing mutual funds as compared to other types of accounts, including differences in the services provided, differences in the risk profile of such business for the Investment Manager and the additional resources required to manage mutual funds effectively. In evaluating the Fund’s advisory fees, the Committee and the Board also took into account the demands, complexity and quality of the investment management of the Fund.
After reviewing these and related factors, the Committee and the Board concluded, within the context of their overall conclusions, that the advisory fee rates and expenses of the Fund supported the continuation of the Advisory Agreement.
Costs of Services to be Provided and Profitability
The Committee and the Board also took note of the costs of the services provided (both on an absolute and relative basis) and the profitability to the Investment Manager and its affiliates in connection with their relationships with the Fund. In evaluating these considerations, the Committee and the Board took note of the advisory fees charged by the Investment Manager to other clients, including fees charged by the Investment Manager to any institutional separate account clients with similar investment strategies to those of the Fund.
The Committee and the Board also considered the compensation directly or indirectly received by the Investment Manager’s affiliates in connection with their relationships with the Fund. The Committee and the Board reviewed information provided by management as to
the profitability of the Investment Manager and its affiliates of their relationships with the Fund, and information about the allocation of expenses used to calculate profitability. When reviewing profitability, the Committee and the Board also considered court cases in which adviser profitability was an issue in whole or in part, the performance of the fund, the expense ratio of the fund, and the implementation of expense limitations with respect to the fund. The Committee and the Board also considered information provided by the Investment Manager regarding its financial condition and comparing its profitability to that of other asset management firms that are, or are subsidiaries of, publicly traded companies.
After reviewing these and related factors, the Committee and the Board concluded, within the context of their overall conclusions, that the profitability to the Investment Manager and its affiliates from their relationships with the Fund supported the continuation of the Advisory Agreement.
Economies of Scale
The Committee and the Board considered the potential existence of economies of scale in the provision by the Investment Manager of services to the Fund, to groups of related funds, and to the Investment Manager’s investment advisory clients as a whole, and whether those economies of scale were shared with the Fund through breakpoints in investment advisory fees or other means, such as expense limitation arrangements and additional investments by the Investment Manager in investment, trading and compliance resources. The Committee and the Board noted that the investment advisory fee schedules for the Fund contained breakpoints that would reduce the fee rate on assets above specified threshold levels.
In considering these issues, the Committee and the Board also considered the costs of the services provided (both on an absolute and relative basis) and the profitability to the Investment Manager and its affiliates from their relationships with the Fund, as discussed above. After reviewing these and related factors, the Committee and the Board concluded, within the context of their overall conclusions, that the extent to which economies of scale were expected to be shared with the Fund supported the continuation of the Advisory Agreement.
Other Benefits to the Investment Manager
The Committee and the Board received and considered information regarding “fall-out” or ancillary benefits received by the Investment Manager and its affiliates as a result of their relationships with the Fund, such as the engagement of the Investment Manager to provide
40
administrative services to the Fund and the engagement of the Investment Manager’s affiliates to provide distribution and transfer agency services to the Fund. The Committee and the Board considered that the Fund’s distributor retains a portion of the distribution fees from the Fund and receives a portion of the sales charges on sales or redemptions of certain classes of shares of the Fund. The Committee and the Board also considered the benefits of research made available to the Investment Manager by reason of brokerage commissions generated by the Fund’s securities transactions, and reviewed information about the Investment Manager’s practices with respect to allocating portfolio brokerage for brokerage and research services. The Committee and the Board considered the possible conflicts of interest associated with certain fall-out or other ancillary benefits and the reporting, disclosure and other processes that would be in place to address such possible
conflicts of interest. The Committee and the Board recognized that the Investment Manager’s profitability would be somewhat lower without these benefits.
Conclusion
The Committee and the Board reviewed all of the above considerations in reaching their decisions to recommend or approve the continuation of the Advisory Agreement. No single item was identified as paramount or controlling, and individual Trustees may have attributed different weights to various factors. Based on their evaluation of all factors that they deemed to be material, including those factors described above, and assisted by the advice of independent legal counsel, the Board, including the Independent Trustees, voting separately, unanimously approved the continuation of the Advisory Agreement.
41
[THIS PAGE INTENTIONALLY LEFT BLANK]
42
[THIS PAGE INTENTIONALLY LEFT BLANK]
43
[THIS PAGE INTENTIONALLY LEFT BLANK]
44
Important Information About This Report
The fund mails one shareholder report to each shareholder address. If you would like more than one report, please call shareholder services at 1-800-345-6611 and additional reports will be sent to you. This report has been prepared for shareholders of Columbia Energy and Natural Resources Fund.
A description of the policies and procedures that the fund uses to determine how to vote proxies and a copy of the fund’s voting records are available (i) at www.columbiamanagement.com, (ii) on the Securities and Exchange Commission’s website at www.sec.gov, and (iii) without charge, upon request, by calling 1-800-368-0346. Information regarding how the fund voted proxies relating to portfolio securities during the 12-month period ended June 30 is available from the SEC’s website. Information regarding how the fund voted proxies relating to portfolio securities is also available from the fund’s website, www.columbiamanagement.com.
The fund files a complete schedule of portfolio holdings with the SEC for the first and third quarters of each fiscal year on Form N-Q. The fund’s Form N-Q is available on the SEC’s website at www.sec.gov and may be reviewed and copied at the SEC’s Public Reference Room in Washington, D.C. Information on the operation of the Public Reference Room may be obtained by calling
1-800-SEC-0330.
Transfer Agent
Columbia Management Investment Services Corp.
P.O. Box 8081
Boston, MA 02266-8081
1-800-345-6611
Distributor
Columbia Management Investment
Distributors, Inc.
225 Franklin Street Boston, MA 02110
Investment Manager
Columbia Management Investment Advisers, LLC
225 Franklin Street Boston, MA 02110
45

Columbia Energy and Natural Resources Fund
P.O. Box 8081
Boston, MA 02266-8081
columbiamanagement.com
This information is for use with concurrent or prior delivery of a fund prospectus. Investors should consider the investment objectives, risks, charges and expenses of a mutual fund carefully before investing. For a free prospectus, which contains this and other important information about the funds, visit columbiamanagement.com. Read the prospectus carefully before investing. The Fund is distributed by Columbia Management Investment Distributors, Inc., member FINRA, and managed by Columbia Management Investment Advisers, LLC.
©2012 Columbia Management Investment Advisers, LLC. All rights reserved.
C-1141 C (5/12)

Columbia Pacific/Asia Fund
Annual Report for the Period Ended March 31, 2012
Table of contents
The views expressed in this report reflect the current views of the respective parties. These views are not guarantees of future performance and involve certain risks, uncertainties and assumptions that are difficult to predict, so actual outcomes and results may differ significantly from the views expressed. These views are subject to change at any time based upon economic, market or other conditions and the respective parties disclaim any responsibility to update such views. These views may not be relied on as investment advice and, because investment decisions for a Columbia Fund are based on numerous factors, may not be relied on as an indication of trading intent on behalf of any particular Columbia Fund. References to specific securities should not be construed as a recommendation or investment advice.
President’s Message

Dear Shareholders,
A stock market rally that commenced in the fourth quarter of 2011 continued into 2012 in the United States and around the world, as all major market regions generated double-digit returns for the three-month period ended March 31, 2012. Volatility declined sharply as European debt fears quieted somewhat and sentiment improved. Returns in developed countries were buoyed by strong results in Germany, Belgium, Austria and the Nordic markets of Denmark, Finland, Norway and Sweden. Under the cloud of its own mounting debt problem, Spain was the only eurozone country to deliver a negative return during the three-month period. Solid economic growth and accommodative monetary policy helped boost gains in emerging markets. The rally in U.S. equities was largely driven by an expansion in “multiples”— an increase in stock prices relative to their earnings. By the end of the first
quarter of 2012, stocks no longer appeared as cheap as they were late in 2011. Bonds lagged stocks during the first quarter as investors responded to signs of an improved environment with a greater appetite for risk.
Concerns around the health of the global economy were centered in news headlines focusing on Washington D.C., Europe, China and the Middle East. In the United States, economic indicators remained mixed but generally indicated support for slow, sustainable economic growth. European policymakers have made progress in containing the eurozone debt crisis, though they still have not solved the issue of long-term solvency. The European Central Bank has lowered interest rates and flooded the financial system with liquidity that may provide breathing space for companies to restructure their balance sheets. These massive infusions of liquidity may whet the appetite for risk from investors around the world. However, it has delayed a true reckoning with the European financial situation, as concerns about Spain and Portugal continue to cloud the outlook. These structural challenges that persist in the developed world, and slowing growth in emerging market economies, leave the global economy in a fragile state. Domestic demand, combined with slowing inflationary trends, has also helped to shore up emerging market economies. Joblessness remains low and monetary conditions remain easy.
Despite the challenges and surprises of 2011, we see pockets of strength — and as a result, attractive opportunities — both here and abroad for 2012. We hope to help you capitalize on these opportunities with various articles in our 2012 Perspectives, which is available via the Market Insights tab at columbiamanagement.com. This publication showcases the strong research capabilities and experienced investment teams of Columbia Management and offers a diverse array of investment ideas based on our five key themes for 2012.
Other information and resources available at columbiamanagement.com include:
| n | | detailed up-to-date fund performance and portfolio information |
| n | | economic analysis and market commentary |
| n | | quarterly fund commentaries |
| n | | Columbia Management Investor, our award-winning quarterly newsletter for shareholders |
Thank you for your continued support of the Columbia Funds. We look forward to serving your investment needs for many years to come.
Best Regards,

J. Kevin Connaughton
President, Columbia Funds
Investors should consider the investment objectives, risks, charges and expenses of a mutual fund carefully before investing. For a free prospectus, which contains this and other important information about the funds, visit columbiamanagement.com. The prospectus should be read carefully before investing.
Columbia Funds are distributed by Columbia Management Investment Distributors, Inc., member FINRA, and managed by Columbia Management Investment Advisers, LLC.
© 2012 Columbia Management Investment Advisers, LLC. All rights reserved.
Fund Profile – Columbia Pacific/Asia Fund
Summary
| n | | For the 12-month period that ended March 31, 2012, the fund’s Class A shares returned –4.28% without sales charge. |
| n | | In a challenging environment for stock markets in Asia and the Pacific Basin region (the Asia-Pacific region), the fund slightly underperformed the MSCI AC Asia Pacific Index (Net),1 which returned –4.24%. The fund outperformed the MSCI EAFE Index (Net),2 which returned –5.77%. |
| n | | Stock selection, especially in Korea, Taiwan and Thailand, helped buffer results, as did the fund’s positioning in the industrials, telecommunication services and utilities sectors. |
Portfolio Management
Daisuke Nomoto has co-managed the fund since 2008. From 2005 until joining Columbia Management Investment Advisers, LLC (the Investment Manager) in May 2010, Mr. Nomoto was associated with the fund’s previous investment adviser or its predecessor as an investment professional.
Jasmine (Weili) Huang has co-managed the fund since 2008. From 2003 until joining the Investment Manager in May 2010, Ms. Huang was associated with the fund’s previous investment adviser or its predecessor as an investment professional.
| 1 | The MSCI All Country (AC) Asia Pacific Index (Net) is a free float-adjusted market capitalization weighted index that is designed to measure the equity market performance in 13 developed and emerging markets in the Asia Pacific region. |
| 2 | The MSCI Europe, Australasia, Far East (EAFE) Index (Net) is a free float-adjusted market capitalization index that is designed to measure the equity market performance in 22 developed-market countries, excluding the U.S. and Canada. |
Indices are not available for investment, are not professionally managed and do not reflect sales charges, fees, brokerage commissions, taxes or other expenses of investing. Securities in the fund may not match those in an index.
Performance data quoted represents past performance and current performance may be lower or higher. Past performance is no guarantee of future results. The investment return and principal value will fluctuate so that shares, when redeemed, may be worth more or less than the original cost. Please visit www.columbiamanagement.com for daily and most recent month-end performance updates.
Summary
1-year return as of 03/31/12
| | |
| |
 | | –4.28% Class A shares (without sales charge) |
| |
| | –4.24% MSCI AC Asia Pacific Index (Net) |
| |
| | –5.77% MSCI EAFE Index (Net) |
|
Morningstar Style Box™ |
|
Equity Style |

|
The Morningstar Style Box™ is based on the fund’s portfolio holdings. For equity funds, the vertical axis shows the market capitalization of the stocks owned, and the horizontal axis shows investment style (value, blend, or growth). Information shown is based on the most recent data provided by Morningstar.
© 2012 Morningstar, Inc. All rights reserved. The Morningstar information contained herein: (1) is proprietary to Morningstar and/or its content providers; (2) may not be copied or distributed; and (3) is not warranted to be accurate, complete or timely. Neither Morningstar nor its content providers are responsible for any damages or losses arising from any use of this information.
1
Performance Information – Columbia Pacific/Asia Fund
Performance data quoted represents past performance and current performance may be lower or higher. Past performance is no guarantee of future results. The investment return and principal value will fluctuate so that shares, when redeemed, may be worth more or less than the original cost. Please visit www.columbiamanagement.com for daily and most recent month-end performance updates.
|
| Performance of a $10,000 investment 04/01/02 – 03/31/12 |
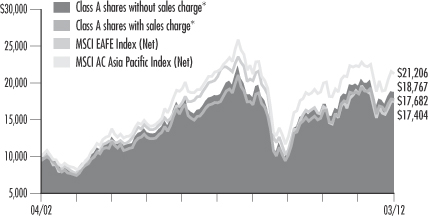
The chart above shows the change in value of a hypothetical $10,000 investment in Class A shares of Columbia Pacific/Asia Fund during the stated time period, and does not reflect the deduction of taxes that a shareholder may pay on fund distributions or on the redemption of fund shares.
| | | | | | | | |
| Performance of a $10,000 investment 04/01/02 – 03/31/12 ($) | |
| | |
| Sales charge | | without | | | with | |
Class A* | | | 18,767 | | | | 17,682 | |
Class C* | | | 17,461 | | | | 17,461 | |
Class I* | | | 19,344 | | | | n/a | |
Class Z | | | 19,301 | | | | n/a | |
| | | | | | | | | | | | | | | | | | | | | | | | |
| Average annual total return as of 03/31/12 (%) | |
| | | | |
| Share class | | A* | | | C* | | | I* | | | Z | |
| Inception | | 03/31/08 | | | 03/31/08 | | | 09/27/10 | | | 12/31/92 | |
| Sales charge | | without | | | with | | | without | | | with | | | without | | | without | |
1-year | | | –4.28 | | | | –9.76 | | | | –4.91 | | | | –5.86 | | | | –3.83 | | | | –4.04 | |
5-year | | | 0.52 | | | | –0.68 | | | | –0.18 | | | | –0.18 | | | | 0.88 | | | | 0.83 | |
10-year | | | 6.50 | | | | 5.87 | | | | 5.73 | | | | 5.73 | | | | 6.82 | | | | 6.80 | |
The “with sales charge” returns include the maximum initial sales charge of 5.75% for Class A shares and the applicable contingent deferred sales charge of 1.00% for Class C shares for the first year only. The “without sales charge” returns do not include the effect of sales charges. If they had, returns would be lower.
Performance results reflect any fee waivers or reimbursements of fund expenses by Columbia Management Investment Advisers, LLC and/or any of its affiliates. Absent these fee waivers or expense reimbursement arrangements, performance results would have been lower.
All results shown assume reinvestment of distributions. Class I and Class Z shares are sold at net asset value with no distribution and service (Rule 12b-1) fees. Class I and Class Z shares have limited eligibility and the investment minimum requirements may vary. Please see the fund’s prospectuses for details. Performance for different share classes will vary based on differences in sales charges and fees associated with each class.
The tables do not reflect the deduction of taxes that a shareholder may pay on fund distributions or on the redemption of fund shares.
| * | The returns shown for periods prior to the share class inception date (including returns since inception, which are since fund inception) include the returns of the fund’s oldest share class. These returns are adjusted to reflect any higher class-related operating expenses of the newer share classes, as applicable. Please visit columbiamanagement.com/mutual-funds/appended-performance for more information. |
2
Fund Expense Example – Columbia Pacific/Asia Fund
As an investor, you incur two types of costs. There are transaction costs, which generally include sales charges on purchases and may include redemption fees. There are also ongoing costs, which generally include management fees, distribution and service (Rule 12b-1) fees, and other fund expenses. The following information is intended to help you understand your ongoing costs (in dollars) of investing in the Fund and to help you compare these costs with the ongoing costs of investing in other mutual funds.
Analyzing your fund’s expenses
To illustrate these ongoing costs, we have provided examples and calculated the expenses paid by investors in each share class of the Fund during the period. The actual and hypothetical information in the table is based on an initial investment of $1,000 at the beginning of the period indicated and held for the entire period. Expense information is calculated two ways and each method provides you with different information. The amount listed in the “Actual” column is calculated using the Fund’s actual operating expenses and total return for the period. You may use the Actual information, together with the amount invested, to estimate the expenses that you paid over the period. Simply divide your account value by $1,000 (for example, an $8,600 account value divided by $1,000 = 8.6), then multiply the results by the expenses paid during the period under the Actual column. The amount listed in the “Hypothetical” column assumes a 5% annual rate of return before expenses (which is not the Fund’s actual return) and then applies the Fund’s actual expense ratio for the period to the hypothetical return. You should not use the hypothetical account values and expenses to estimate either your actual account balance at the end of the period or the expenses you paid during the period. See “Compare with other funds” below for details on how to use the hypothetical data.
Compare with other funds
Since all mutual funds are required to include the same hypothetical calculations about expenses in shareholder reports, you can use this information to compare the ongoing cost of investing in the Fund with other funds. To do so, compare the hypothetical example with the 5% hypothetical examples that appear in the shareholder reports of other funds. As you compare hypothetical examples of other funds, it is important to note that hypothetical examples are meant to highlight the ongoing costs of investing in a fund only and do not reflect any transaction costs, such as sales charges, or redemption or exchange fees. Therefore, the hypothetical calculations are useful in comparing ongoing costs only, and will not help you determine the relative total costs of owning different funds. If transaction costs were included in these calculations, your costs would be higher.
| | | | | | | | | | | | | | | | | | | | | | | | | | | | |
| 10/01/11 – 03/31/12 | | | | | | | |
| | | | |
| | | Account value at the
beginning of the period ($) | | | Account value at the
end of the period ($) | | | Expenses paid
during the period ($) | | | Fund’s annualized
expense ratio (%) | |
| | | Actual | | | Hypothetical | | | Actual | | | Hypothetical | | | Actual | | | Hypothetical | | | Actual | |
Class A | | | 1,000.00 | | | | 1,000.00 | | | | 1,124.50 | | | | 1,017.26 | | | | 8.08 | | | | 7.67 | | | | 1.53 | |
Class C | | | 1,000.00 | | | | 1,000.00 | | | | 1,121.30 | | | | 1,013.63 | | | | 11.92 | | | | 11.31 | | | | 2.26 | |
Class I | | | 1,000.00 | | | | 1,000.00 | | | | 1,128.20 | | | | 1,019.19 | | | | 6.03 | | | | 5.72 | | | | 1.14 | |
Class Z | | | 1,000.00 | | | | 1,000.00 | | | | 1,126.30 | | | | 1,018.40 | | | | 6.87 | | | | 6.52 | | | | 1.30 | |
Expenses paid during the period are equal to the annualized expense ratio for each class as indicated above, multiplied by the average account value over the period and then multiplied by the number of days in the Fund’s most recent fiscal half year and divided by 366.
Expenses do not include fees and expenses incurred indirectly by the Fund from the underlying funds in which the Fund may invest (also referred to as “acquired funds”), including affiliated and non-affiliated pooled investments vehicles (including mutual funds and exchange traded funds).
3
Portfolio Managers’ Report – Columbia Pacific/Asia Fund
Performance data quoted represents past performance and current performance may be lower or higher. Past performance is no guarantee of future results. The investment return and principal value will fluctuate so that shares, when redeemed, may be worth more or less than the original cost. Please visit www.columbiamanagement.com for daily and most recent month-end performance updates.
| | | | |
| Net asset value per share | |
| |
as of 03/31/12 ($) | | | | |
Class A | | | 8.09 | |
Class C | | | 8.04 | |
Class I | | | 8.12 | |
Class Z | | | 8.12 | |
| | | | |
| Distributions declared per share | |
| |
04/01/11 – 03/31/12 ($) | | | | |
Class A | | | 0.10 | |
Class C | | | 0.01 | |
Class I | | | 0.16 | |
Class Z | | | 0.14 | |
For the 12-month period that ended March 31, 2012, the fund’s Class A shares generated a return of –4.28% without sales charge. In a challenging environment for Asia-Pacific stock markets, the fund slightly underperformed the MSCI AC Asia Pacific Index (Net), which returned –4.24%. The fund outperformed the MSCI EAFE Index (Net), which returned –5.77%, for the same period. Stock selection in Korea, Taiwan and Thailand helped support results, which also was benefited by positioning in the industrials, telecommunication services and utilities sectors.
Southeast Asian exposure, stock selection aided results
During a period in which Southeast Asian economies — notably the Philippines, Thailand, Indonesia and Malaysia — outperformed other markets, our emphasis on those economies benefited results during an especially challenging period for Asia-Pacific stock markets. These economies were supported by growing middle class populations, healthy balance sheets and the impact of continuing infrastructure investments. Stock selection also benefited returns. Total Access Communications, a Thai wireless communications services provider, was one of the top performers for the period, as its strong cash flow lifted earnings and led to solid gains in share price before we took profits and sold the position. Samsung Electronics (3.7% of net assets), a major Korean consumer electronics products corporation, also added to the fund’s results on the back of healthy market share gains, especially in mobile phone products. Other leading contributors included CTCI, a Taiwanese provider of civil engineering services, and Guangdong Investment, a Hong-Kong listed water utility operating in mainland China as well as Hong Kong (1.3% and 1.3% of net assets, respectively). CTCI benefited from solid growth in new orders, while Guangdong’s stable earnings flow and good dividend yield attracted investors in a generally difficult market for Chinese equities.
Individual disappointments
Concerns about inflationary pressures and central government policies weighed on the Indian market, which produced the worst returns in the Asia-Pacific region for the 12 months. One of the fund’s notable detractors was Union Bank of India, a financial institution in which the national government has a major equity position. We gradually trimmed the position given the concern on deteriorating the asset quality, then sold it early in 2012 when Union Bank’s share price rebounded. However, because of its inexpensive price and healthy stock dividend, we retained an investment in Shinko Plantech (0.9% of net assets) of Japan, which experienced lower-than-expected new order flow as a result of the March 2011 earthquake and tsunami in Japan. Despite disappointing experience during the period, we held the position because of its favorable price and relatively healthy stock dividend.
Looking ahead
We believe that the emerging markets of the Asia-Pacific region, especially in Southeast Asia, have the potential to sustain their momentum, benefited from positive demographic trends as middle classes expand and nations continue to invest in infrastructure. Moreover, national governments, corporations and households all have generally healthy balance sheets. We have maintained a focus on Southeastern Asian markets, especially Thailand, Indonesia and the Philippines. While the industrial expansion in Thailand received a setback from recent flooding, we anticipate an economic rebound to offer potential investment opportunities. Inflationary pressures in Asia have slackened over the past two calendar quarters, and valuations generally
4
Portfolio Managers’ Report (continued) – Columbia Pacific/Asia Fund
appear compelling. A large part of the global economy continues to face the prospect of hindered growth because government balance sheets are highly leveraged. In particular, we are somewhat skeptical about prospects in the more developed economies, including Japan, which may continue to be held back by fiscal imbalances and high deficits. While Japan’s economy attempts to recover from the effects of the 2011 natural disasters, we think the nation’s growth rate is likely to be less robust than in Asia-Pacific nations with emerging market economies, such as China, Indonesia and Korea, where we expect to maintain our greatest emphasis.
Portfolio characteristics and holdings are subject to change periodically and may not be representative of current characteristics and holdings. The outlook for the fund may differ from that presented for other Columbia Funds.
Equity securities are affected by stock market fluctuations that occur in response to economic and business developments.
International investing involves special risks, including foreign taxation, currency risks, risks associated with possible differences in financial standards and other risks associated with future political and economic developments, including investment values that may fall, sometimes rapidly or unpredictably, or fail to rise.
Investing in emerging markets may involve greater risks than investing in more developed countries. In addition, concentration of investments in a single region may result in greater volatility.
| | | | |
| Country Breakdown1 | | | |
| |
at 03/31/12 (%) | | | | |
Stocks | | | 98.1 | |
Australia | | | 10.4 | |
China | | | 11.8 | |
Hong Kong | | | 5.2 | |
India | | | 2.6 | |
Indonesia | | | 3.3 | |
Japan | | | 37.0 | |
Malaysia | | | 1.2 | |
Philippines | | | 1.9 | |
Singapore | | | 3.1 | |
South Korea | | | 8.7 | |
Taiwan | | | 7.8 | |
Thailand | | | 4.1 | |
United States | | | 1.0 | |
Exchange-Traded Funds | | | 1.4 | |
Other2 | | | 0.5 | |
| 1 | Percentages indicated are based upon total investments. The Fund’s portfolio composition is subject to change. |
| 2 | Includes investments in money market funds. |
| | | | |
| Top ten holdings1 | |
| |
at 03/31/12 (%) | | | | |
Samsung Electronics Co., Ltd. | | | 3.7 | |
Toyota Motor Corp. | | | 2.2 | |
Mitsubishi UFJ Financial Group, Inc. | | | 2.1 | |
Taiwan Semiconductor Manufacturing Co., Ltd., ADR | | | 2.1 | |
Hitachi Ltd. | | | 2.1 | |
BHP Billiton Ltd. | | | 1.9 | |
Sumitomo Mitsui Financial Group, Inc. | | | 1.8 | |
Canon, Inc. | | | 1.8 | |
Industrial & Commercial Bank of China, Class H | | | 1.7 | |
ITOCHU Corp. | | | 1.7 | |
| | 1 | Percentages indicated are based upon total investments (excluding money market funds). |
For further detail about these holdings, please refer to the section entitled “Portfolio of Investments.”
Fund holdings are as of the date given, are subject to change at any time, and are not recommendations to buy or sell any security.
5
Portfolio of Investments – Columbia Pacific/Asia Fund
March 31, 2012
(Percentages represent value of investments compared to net assets)
| | | | | | | | |
| Issuer | | Shares | | | Value | |
Common Stocks 97.8% | |
AUSTRALIA 10.4% | | | | | | | | |
Australia & New Zealand Banking Group Ltd. | | | 179,600 | | | | $4,332,714 | |
BHP Billiton Ltd. | | | 145,211 | | | | 5,234,806 | |
Commonwealth Bank of Australia | | | 46,105 | | | | 2,392,530 | |
Iluka Resources Ltd. | | | 130,311 | | | | 2,416,473 | |
Monadelphous Group Ltd. | | | 98,859 | | | | 2,453,336 | |
National Australia Bank Ltd. | | | 154,875 | | | | 3,953,666 | |
Rio Tinto Ltd. | | | 19,986 | | | | 1,355,755 | |
Telstra Corp., Ltd. | | | 1,211,519 | | | | 4,126,459 | |
Westpac Banking Corp. | | | 146,185 | | | | 3,318,225 | |
Total | | | | | | | 29,583,964 | |
CHINA 11.7% | | | | | | | | |
Baidu, Inc., ADR(a) | | | 9,421 | | | | 1,373,299 | |
Bank of China Ltd., Class H | | | 6,576,000 | | | | 2,654,643 | |
China Communications Construction Co., Ltd., Class H | | | 2,870,000 | | | | 2,891,501 | |
China Mobile Ltd., ADR | | | 84,841 | | | | 4,673,042 | |
China Shenhua Energy Co., Ltd., Class H | | | 438,500 | | | | 1,854,770 | |
China Vanke Co., Ltd., Class B | | | 1,573,983 | | | | 1,875,392 | |
Citic Securities Co., Ltd., Class H | | | 463,500 | | | | 931,618 | |
CNOOC Ltd. | | | 2,040,000 | | | | 4,175,825 | |
Guangdong Investment Ltd. | | | 5,106,000 | | | | 3,563,881 | |
Industrial & Commercial Bank of China, Class H | | | 7,526,100 | | | | 4,854,954 | |
New Oriental Education & Technology Group, ADR(a) | | | 19,853 | | | | 545,163 | |
PetroChina Co., Ltd., Class H | | | 1,648,000 | | | | 2,320,619 | |
Spreadtrum Communications, Inc., ADR | | | 104,233 | | | | 1,719,845 | |
Total | | | | | | | 33,434,552 | |
HONG KONG 5.2% | | | | | | | | |
Cheung Kong Holdings Ltd. | | | 269,000 | | | | 3,478,711 | |
First Pacific Co., Ltd. | | | 2,782,919 | | | | 3,085,989 | |
Hongkong Land Holdings Ltd. | | | 233,000 | | | | 1,355,970 | |
Jardine Matheson Holdings Ltd. | | | 37,079 | | | | 1,857,305 | |
Swire Pacific Ltd., Class A | | | 240,700 | | | | 2,697,899 | |
Swire Properties Ltd. | | | 168,590 | | | | 419,003 | |
Trinity Ltd. | | | 2,155,603 | | | | 1,773,692 | |
Total | | | | | | | 14,668,569 | |
INDIA 2.6% | | | | | | | | |
Ashok Leyland Ltd. | | | 1,027,192 | | | | 612,719 | |
Bank of Baroda | | | 131,218 | | | | 2,048,028 | |
Cairn India Ltd.(a) | | | 212,959 | | | | 1,397,264 | |
HDFC Bank Ltd., ADR | | | 53,808 | | | | 1,834,853 | |
Titan Industries Ltd. | | | 328,254 | | | | 1,471,957 | |
Total | | | | | | | 7,364,821 | |
INDONESIA 3.3% | | | | | | | | |
PT AKR Corporindo Tbk | | | 2,442,500 | | | | 1,149,759 | |
PT Bank Rakyat Indonesia Persero Tbk | | | 2,512,000 | | | | 1,914,427 | |
PT Indocement Tunggal Prakarsa Tbk | | | 867,500 | | | | 1,751,527 | |
PT Perusahaan Gas Negara Persero Tbk | | | 6,705,500 | | | | 2,794,009 | |
PT United Tractors Tbk | | | 492,500 | | | | 1,780,697 | |
Total | | | | | | | 9,390,419 | |
JAPAN 36.8% | | | | | | | | |
Aeon Co., Ltd. | | | 75,000 | | | | 987,984 | |
Aeon Delight Co., Ltd. | | | 113,200 | | | | 2,387,179 | |
Aisin Seiki Co., Ltd. | | | 85,700 | | | | 3,047,938 | |
Arnest One Corp. | | | 259,300 | | | | 2,902,847 | |
Asahi Glass Co., Ltd. | | | 161,000 | | | | 1,380,194 | |
| | | | | | | | |
| Issuer | | Shares | | | Value | |
Common Stocks (continued) | |
JAPAN (cont.) | | | | | | | | |
Autobacs Seven Co., Ltd. | | | 63,800 | | | | $3,078,251 | |
Canon, Inc. | | | 108,100 | | | | 5,171,079 | |
Daiichikosho Co., Ltd. | | | 128,800 | | | | 2,528,866 | |
FANUC CORP. | | | 23,900 | | | | 4,280,853 | |
Fuji Heavy Industries Ltd. | | | 286,000 | | | | 2,335,800 | |
Fuji Machine Manufacturing Co., Ltd. | | | 128,400 | | | | 2,573,907 | |
Fuyo General Lease Co., Ltd. | | | 83,300 | | | | 2,966,479 | |
Hitachi Ltd. | | | 899,000 | | | | 5,816,468 | |
Honda Motor Co., Ltd. | | | 45,300 | | | | 1,744,693 | |
Inpex Corp. | | | 141 | | | | 958,731 | |
ITOCHU Corp. | | | 429,500 | | | | 4,705,960 | |
Japan Tobacco, Inc. | | | 554 | | | | 3,135,893 | |
JX Holdings, Inc. | | | 351,900 | | | | 2,195,577 | |
K’s Holdings Corp. | | | 21,600 | | | | 697,250 | |
Kansai Paint Co., Ltd. | | | 197,000 | | | | 1,997,182 | |
Kinki Sharyo Co., Ltd. | | | 258,000 | | | | 987,892 | |
Lawson, Inc. | | | 35,700 | | | | 2,248,988 | |
Mandom Corp. | | | 51,300 | | | | 1,288,986 | |
Mitsubishi UFJ Financial Group, Inc. | | | 1,210,800 | | | | 6,076,242 | |
Mitsui & Co., Ltd. | | | 221,900 | | | | 3,662,301 | |
Nissan Motor Co., Ltd. | | | 391,800 | | | | 4,212,648 | |
Nitto Denko Corp. | | | 73,900 | | | | 3,013,590 | |
NTT DoCoMo, Inc. | | | 2,409 | | | | 4,006,408 | |
ORIX Corp. | | | 44,330 | | | | 4,259,040 | |
Otsuka Holdings Co., Ltd. | | | 57,300 | | | | 1,698,634 | |
Shinko Plantech Co., Ltd. | | | 299,500 | | | | 2,563,291 | |
SoftBank Corp. | | | 70,600 | | | | 2,101,844 | |
Sumitomo Mitsui Financial Group, Inc. | | | 156,400 | | | | 5,176,486 | |
Toshiba Machine Co., Ltd. | | | 271,000 | | | | 1,382,589 | |
Toyota Motor Corp. | | | 144,800 | | | | 6,300,553 | |
Ubic, Inc. | | | 10,080 | | | | 1,099,896 | |
Total | | | | | | | 104,972,519 | |
MALAYSIA 1.2% | | | | | | | | |
Genting Bhd | | | 608,400 | | | | 2,153,897 | |
Hartalega Holdings Bhd | | | 469,300 | | | | 1,222,075 | |
Total | | | | | | | 3,375,972 | |
PHILIPPINES 1.9% | | | | | | | | |
Aboitiz Power Corp. | | | 2,682,200 | | | | 2,118,483 | |
Metropolitan Bank & Trust | | | 590,520 | | | | 1,204,041 | |
Puregold Price Club, Inc.(a) | | | 2,144,800 | | | | 1,021,018 | |
Universal Robina Corp. | | | 785,410 | | | | 1,154,165 | |
Total | | | | | | | 5,497,707 | |
SINGAPORE 3.1% | | | | | | | | |
Amtek Engineering Ltd. | | | 1,406,000 | | | | 801,532 | |
DBS Group Holdings Ltd. | | | 269,000 | | | | 3,039,555 | |
Fraser and Neave Ltd. | | | 298,000 | | | | 1,589,610 | |
SembCorp Industries Ltd. | | | 519,000 | | | | 2,178,611 | |
Wing Tai Holdings Ltd. | | | 1,215,000 | | | | 1,239,902 | |
Total | | | | | | | 8,849,210 | |
SOUTH KOREA 8.7% | | | | | | | | |
Capro Corp. | | | 79,370 | | | | 1,730,054 | |
Dongbu Insurance Co., Ltd. | | | 41,256 | | | | 1,784,891 | |
Hyundai Home Shopping Network Corp. | | | 12,844 | | | | 1,524,924 | |
Hyundai Motor Co. | | | 21,535 | | | | 4,446,940 | |
JNK Heaters Co., Ltd. | | | 52,799 | | | | 759,214 | |
KP Chemical Corp. | | | 119,030 | | | | 1,625,102 | |
The Accompanying Notes to Financial Statements are an integral part of this statement.
6
Columbia Pacific/Asia Fund
March 31, 2012
(Percentages represent value of investments compared to net assets)
| | | | | | | | |
| Issuer | | Shares | | | Value | |
Common Stocks (continued) | |
SOUTH KOREA (cont.) | | | | | | | | |
Samsung Electronics Co., Ltd. | | | 9,338 | | | | $10,533,776 | |
Shinhan Financial Group Co., Ltd. | | | 31,540 | | | | 1,221,873 | |
Youngone Corp. | | | 59,280 | | | | 1,133,986 | |
Total | | | | | | | 24,760,760 | |
TAIWAN 7.8% | | | | | | | | |
Catcher Technology Co., Ltd. | | | 202,000 | | | | 1,431,917 | |
CTCI Corp. | | | 2,181,000 | | | | 3,616,033 | |
Gigabyte Technology Co., Ltd. | | | 4,026,000 | | | | 3,390,135 | |
Hon Hai Precision Industry Co., Ltd. | | | 822,000 | | | | 3,200,182 | |
HTC Corp. | | | 87,000 | | | | 1,776,512 | |
Huaku Development Co., Ltd. | | | 1,147,615 | | | | 2,914,674 | |
Taiwan Semiconductor Manufacturing Co., Ltd., ADR | | | 387,773 | | | | 5,925,171 | |
Total | | | | | | | 22,254,624 | |
THAILAND 4.1% | | | | | | | | |
Bangkok Bank PCL, Foreign Registered Shares | | | 667,400 | | | | 4,006,756 | |
Bangkok Expressway PCL, Foreign Registered Shares | | | 1,584,200 | | | | 1,109,268 | |
LPN Development PCL, Foreign Registered Shares | | | 4,113,149 | | | | 2,068,908 | |
LPN Development PCL, NVDR | | | 1,446,900 | | | | 727,789 | |
PTT PCL, Foreign Registered Shares | | | 332,430 | | | | 3,814,396 | |
Total | | | | | | | 11,727,117 | |
| | | | | | | | |
| Issuer | | Shares | | | Value | |
Common Stocks (continued) | |
UNITED STATES 1.0% | | | | | | | | |
Freeport-McMoRan Copper & Gold, Inc. | | | 30,434 | | | | $1,157,709 | |
Newmont Mining Corp. | | | 33,409 | | | | 1,712,880 | |
Total | | | | | | | 2,870,589 | |
Total Common Stocks | | | | | | | | |
(Cost: $252,119,729) | | | | | | | $278,750,823 | |
| |
Exchange-Traded Funds 1.3% | |
iShares MSCI Emerging Markets Index Fund | | | 32,362 | | | | 1,389,624 | |
iShares MSCI Japan Index Fund | | | 109,032 | | | | 1,109,946 | |
iShares MSCI Pacific ex-Japan Index Fund | | | 32,250 | | | | 1,403,520 | |
Total Exchange-Traded Funds | | | | | | | | |
(Cost: $3,831,949) | | | | | | | $3,903,090 | |
| |
Money Market Funds 0.5% | |
Columbia Short-Term Cash Fund, 0.161%(b)(c) | | | 1,410,266 | | | | 1,410,266 | |
Total Money Market Funds | | | | | | | | |
(Cost: $1,410,266) | | | | | | | $1,410,266 | |
Total Investments | | | | | | | | |
(Cost: $257,361,944) | | | | | | | $284,064,179 | |
Other Assets & Liabilities, Net | | | | | | | 1,043,677 | |
Net Assets | | | | | | | $285,107,856 | |
|
| Investments in Derivatives |
Forward Foreign Currency Exchange Contracts Open at March 31, 2012
| | | | | | | | | | | | | | |
| Counterparty | | Exchange Date | | Currency to be
Delivered | | Currency to be
Received | | Unrealized
Appreciation | | | Unrealized
Depreciation | |
Morgan Stanley | | April 12, 2012 | | 517,000 (CAD) | | 514,796 (USD) | | $ | — | | | $ | (3,434 | ) |
Morgan Stanley | | April 12, 2012 | | 36,170,764,000 (IDR) | | 3,932,204 (USD) | | | — | | | | (19,958 | ) |
Morgan Stanley | | April 12, 2012 | | 143,599,000 (PHP) | | 3,325,976 (USD) | | | — | | | | (16,376 | ) |
Morgan Stanley | | April 12, 2012 | | 65,289,000 (THB) | | 2,120,878 (USD) | | | 5,824 | | | | — | |
Morgan Stanley | | April 12, 2012 | | 175,398,000 (THB) | | 5,645,253 (USD) | | | — | | | | (36,809 | ) |
Morgan Stanley | | April 12, 2012 | | 70,462,000 (TWD) | | 2,385,400 (USD) | | | — | | | | (2,066 | ) |
Morgan Stanley | | April 12, 2012 | | 13,125,881 (USD) | | 12,422,000 (AUD) | | | — | | | | (271,634 | ) |
Morgan Stanley | | April 12, 2012 | | 849,912 (USD) | | 43,558,000 (INR) | | | 3,276 | | | | — | |
Morgan Stanley | | April 12, 2012 | | 2,865,770 (USD) | | 142,742,000 (INR) | | | — | | | | (69,825 | ) |
Morgan Stanley | | April 12, 2012 | | 3,874,123 (USD) | | 308,780,000 (JPY) | | | — | | | | (143,231 | ) |
Morgan Stanley | | April 12, 2012 | | 846,773 (USD) | | 963,374,000 (KRW) | | | 2,880 | | | | — | |
Morgan Stanley | | April 12, 2012 | | 1,461,691 (USD) | | 1,656,827,000 (KRW) | | | — | | | | (443 | ) |
Morgan Stanley | | April 12, 2012 | | 2,317,736 (USD) | | 7,083,000 (MYR) | | | — | | | | (7,177 | ) |
Morgan Stanley | | April 12, 2012 | | 512,013 (USD) | | 621,000 (NZD) | | | — | | | | (3,846 | ) |
Morgan Stanley | | April 12, 2012 | | 815,319 (USD) | | 1,036,000 (SGD) | | | 8,839 | | | | — | |
Total | | | | | | | | $ | 20,819 | | | $ | (574,799 | ) |
Summary of Investments in Securities by Industry
The following table represents the portfolio investments of the Fund by industry classifications as a percentage of net assets at March 31, 2012:
| | | | | | | | |
| Industry | | Percentage of
Net Assets | | | Value | |
Stocks | | | 97.8 | % | | | $278,750,823 | |
Auto Components | | | 1.1 | | | | $3,047,938 | |
Automobiles | | | 6.7 | | | | 19,040,634 | |
Building Products | | | 0.5 | | | | 1,380,194 | |
Capital Markets | | | 0.3 | | | | 931,618 | |
The Accompanying Notes to Financial Statements are an integral part of this statement.
7
Columbia Pacific/Asia Fund
March 31, 2012
| | | | | | | | |
| Industry | | Percentage of
Net Assets | | | Value | |
Chemicals | | | 2.9 | % | | | $ 8,365,928 | |
Commercial Banks | | | 16.8 | | | | 48,028,993 | |
Commercial Services & Supplies | | | 0.8 | | | | 2,387,179 | |
Communications Equipment | | | 0.6 | | | | 1,776,512 | |
Computers & Peripherals | | | 1.7 | | | | 4,822,052 | |
Construction & Engineering | | | 3.1 | | | | 8,960,870 | |
Construction Materials | | | 0.6 | | | | 1,751,527 | |
Diversified Consumer Services | | | 0.2 | | | | 545,163 | |
Diversified Financial Services | | | 3.6 | | | | 10,311,508 | |
Diversified Telecommunication Services | | | 1.5 | | | | 4,126,459 | |
Electronic Equipment, Instruments & Components | | | 3.2 | | | | 9,016,650 | |
Energy Equipment & Services | | | 0.9 | | | | 2,563,291 | |
Food & Staples Retailing | | | 1.5 | | | | 4,257,990 | |
Food Products | | | 0.4 | | | | 1,154,165 | |
Gas Utilities | | | 1.0 | | | | 2,794,009 | |
Health Care Equipment & Supplies | | | 0.4 | | | | 1,222,075 | |
Hotels, Restaurants & Leisure | | | 0.8 | | | | 2,153,897 | |
Household Durables | | | 1.0 | | | | 2,902,847 | |
Independent Power Producers & Energy Traders | | | 0.7 | | | | 2,118,483 | |
Industrial Conglomerates | | | 2.0 | | | | 5,625,526 | |
Insurance | | | 0.6 | | | | 1,784,891 | |
Internet & Catalog Retail | | | 0.5 | | | | 1,524,924 | |
Internet Software & Services | | | 0.5 | | | | 1,373,299 | |
IT Services | | | 0.4 | | | | 1,099,896 | |
Machinery | | | 4.6 | | | | 13,179,403 | |
Media | | | 0.9 | | | | 2,528,866 | |
Metals & Mining | | | 4.2 | | | | 11,877,623 | |
Office Electronics | | | 1.8 | | | | 5,171,079 | |
Oil, Gas & Consumable Fuels | | | 5.9 | | | | 16,717,182 | |
Personal Products | | | 0.5 | | | | 1,288,986 | |
Pharmaceuticals | | | 0.6 | | | | 1,698,634 | |
Real Estate Management & Development | | | 5.9 | | | | 16,778,248 | |
Semiconductors & Semiconductor Equipment | | | 6.4 | | | | 18,178,792 | |
Specialty Retail | | | 1.3 | | | | 3,775,501 | |
Textiles, Apparel & Luxury Goods | | | 1.5 | | | | 4,379,635 | |
Tobacco | | | 1.1 | | | | 3,135,893 | |
Trading Companies & Distributors | | | 3.3 | | | | 9,518,020 | |
Transportation Infrastructure | | | 0.4 | | | | 1,109,268 | |
Water Utilities | | | 1.3 | | | | 3,563,881 | |
Wireless Telecommunication Services | | | 3.8 | | | | 10,781,294 | |
Exchange-Traded Funds | | | 1.3 | | | | 3,903,090 | |
Other1 | | | 0.5 | | | | 1,410,266 | |
Total | | | | | | | $284,064,179 | |
| 1 | Includes investments in money market funds. |
|
Notes to Portfolio of Investments |
| (b) | The rate shown is the seven-day current annualized yield at March 31, 2012. |
| (c) | Investments in affiliates during the year ended March 31, 2012: |
| | | | | | | | | | | | | | | | | | | | | | | | | | | | |
| Issuer | | Beginning
Cost | | | Purchase
Cost | | | Sales Cost/
Proceeds
from Sales | | | Realized
Gain/Loss | | | Ending
Cost | | | Dividends
or Interest
Income | | | Value | |
Columbia Short-Term Cash Fund | | | $— | | | | $221,115,502 | | | | $(219,705,236 | ) | | | $— | | | | $1,410,266 | | | | $4,958 | | | | $1,410,266 | |
| | |
| ADR | | American Depositary Receipt |
| NVDR | | Non-voting Depository Receipt |
The Accompanying Notes to Financial Statements are an integral part of this statement.
8
Columbia Pacific/Asia Fund
March 31, 2012
| | |
| AUD | | Australian Dollar |
| CAD | | Canadian Dollar |
| IDR | | Indonesian Rupiah |
| INR | | Indian Rupee |
| JPY | | Japanese Yen |
| KRW | | Korean Won |
| MYR | | Malaysia Ringgits |
| NZD | | New Zealand Dollar |
| PHP | | Philippine Peso |
| SGD | | Singapore Dollar |
| THB | | Thailand Baht |
| TWD | | Taiwan Dollar |
| USD | | US Dollar |
Generally accepted accounting principles (GAAP) require disclosure regarding the inputs and valuation techniques used to measure fair value and any changes in valuation inputs or techniques. In addition, investments shall be disclosed by major category.
The Fund categorizes its fair value measurements according to a three-level hierarchy that maximizes the use of observable inputs and minimizes the use of unobservable inputs by prioritizing that the most observable input be used when available. Observable inputs are those that market participants would use in pricing an investment based on market data obtained from sources independent of the reporting entity. Unobservable inputs are those that reflect the Fund’s assumptions about the information market participants would use in pricing an investment. An investment’s level within the fair value hierarchy is based on the lowest level of any input that is deemed significant to the asset or liability’s fair value measurement. The input levels are not necessarily an indication of the risk or liquidity associated with investments at that level. For example, certain U.S. government securities are generally high quality and liquid, however, they are reflected as Level 2 because the inputs used to determine fair value may not always be quoted prices in an active market.
Fair value inputs are summarized in the three broad levels listed below:
| | Ÿ | | Level 1 – Valuations based on quoted prices for investments in active markets that the Fund has the ability to access at the measurement date (including NAV for open-end mutual funds). Valuation adjustments are not applied to Level 1 investments. |
| | Ÿ | | Level 2 – Valuations based on other significant observable inputs (including quoted prices for similar securities, interest rates, prepayment speeds, credit risks, etc.). |
| | Ÿ | | Level 3 – Valuations based on significant unobservable inputs (including the Fund’s own assumptions and judgment in determining the fair value of investments). |
Inputs that are used in determining fair value of an investment may include price information, credit data, volatility statistics, and other factors. These inputs can be either observable or unobservable. The availability of observable inputs can vary between investments, and is affected by various factors such as the type of investment, and the volume and level of activity for that investment or similar investments in the marketplace. The inputs will be considered by the Investment Manager, along with any other relevant factors in the calculation of an investment’s fair value. The Fund uses prices and inputs that are current as of the measurement date, which may include periods of market dislocations. During these periods, the availability of prices and inputs may be reduced for many investments. This condition could cause an investment to be reclassified between the various levels within the hierarchy.
Foreign equity securities actively traded in markets where there is a significant delay in the local close relative to the New York Stock Exchange (NYSE) are classified as Level 2. The values of these securities may include an adjustment to reflect the impact of significant market movements following the close of local trading, as described in Note 2 to the financial statements – Security Valuation.
Investments falling into the Level 3 category are primarily supported by quoted prices from brokers and dealers participating in the market for those investments. However, these may be classified as Level 3 investments due to lack of market transparency and corroboration to support these quoted prices. Additionally, valuation models may be used as the pricing source for any remaining investments classified as Level 3. These models rely on one or more significant unobservable inputs and/or significant assumptions by the Investment Manager. Inputs used in valuations may include, but are not limited to, financial statement analysis, capital account balances, discount rates and estimated cash flows, and comparable company data.
The Accompanying Notes to Financial Statements are an integral part of this statement.
9
Columbia Pacific/Asia Fund
March 31, 2012
|
Fair Value Measurements (continued) |
The following table is a summary of the inputs used to value the Fund’s investments as of March 31, 2012:
| | | | | | | | | | | | | | | | |
| | | Fair value at March 31, 2012 | |
| Description | | Level 1
quoted prices
in active
markets for
identical assets | | | Level 2
other
significant
observable
inputs | | | Level 3
significant
unobservable
inputs | | | Total | |
Equity Securities | | | | | | | | | | | | | | | | |
Common Stocks | | | | | | | | | | | | | | | | |
Consumer Discretionary | | | $545,163 | | | | $39,354,242 | | | | $— | | | | $39,899,405 | |
Consumer Staples | | | — | | | | 9,837,034 | | | | — | | | | 9,837,034 | |
Energy | | | — | | | | 19,280,473 | | | | — | | | | 19,280,473 | |
Financials | | | 1,834,853 | | | | 76,000,405 | | | | — | | | | 77,835,258 | |
Health Care | | | — | | | | 2,920,709 | | | | — | | | | 2,920,709 | |
Industrials | | | — | | | | 42,160,460 | | | | — | | | | 42,160,460 | |
Information Technology | | | 9,018,315 | | | | 32,419,965 | | | | — | | | | 41,438,280 | |
Materials | | | 2,870,589 | | | | 19,124,489 | | | | — | | | | 21,995,078 | |
Telecommunication Services | | | 4,673,042 | | | | 10,234,711 | | | | — | | | | 14,907,753 | |
Utilities | | | — | | | | 8,476,373 | | | | — | | | | 8,476,373 | |
Exchange-Traded Funds | | | 3,903,090 | | | | — | | | | — | | | | 3,903,090 | |
Total Equity Securities | | | 22,845,052 | | | | 259,808,861 | | | | — | | | | 282,653,913 | |
Other | | | | | | | | | | | | | | | | |
Money Market Funds | | | 1,410,266 | | | | — | | | | — | | | | 1,410,266 | |
Total Other | | | 1,410,266 | | | | — | | | | — | | | | 1,410,266 | |
Investments in Securities | | | 24,255,318 | | | | 259,808,861 | | | | — | | | | 284,064,179 | |
Derivatives | | | | | | | | | | | | | | | | |
Assets | | | | | | | | | | | | | | | | |
Forward Foreign Currency Exchange Contracts | | | — | | | | 20,819 | | | | — | | | | 20,819 | |
Liabilities | | | | | | | | | | | | | | | | |
Forward Foreign Currency Exchange Contracts | | | — | | | | (574,799 | ) | | | — | | | | (574,799 | ) |
Total | | | $24,255,318 | | | | $259,254,881 | | | | $— | | | | $283,510,199 | |
See the Portfolio of Investments for all investment classifications not indicated in the table.
The Fund’s assets assigned to the Level 2 input category are generally valued using the market approach, in which a security’s value is determined through reference to prices and information from market transactions for similar or identical assets. These assets include certain foreign securities for which a third party statistical pricing service may be employed for purposes of fair market valuation. The models utilized by the third party statistical pricing service take into account a security’s correlation to available market data including, but not limited to, intraday index, ADR, and ETF movements.
There were no significant transfers between Levels 1 and 2 during the period.
Derivative instruments are valued at unrealized appreciation (depreciation).
The Accompanying Notes to Financial Statements are an integral part of this statement.
10
Statement of Assets and Liabilities – Columbia Pacific/Asia Fund
March 31, 2012
| | | | |
| Assets | | | | |
Investments, at value | | | | |
Unaffiliated issuers (identified cost $255,951,678) | | $ | 282,653,913 | |
Affiliated issuers (identified cost $1,410,266) | | | 1,410,266 | |
Total investments (identified cost $257,361,944) | | | 284,064,179 | |
Foreign currency (identified cost $334,656) | | | 334,711 | |
Unrealized appreciation on forward foreign currency exchange contracts | | | 20,819 | |
Receivable for: | | | | |
Investments sold | | | 4,267,368 | |
Capital shares sold | | | 6,511 | |
Dividends | | | 1,955,346 | |
Reclaims | | | 110,181 | |
Prepaid expense | | | 1,880 | |
Trustees’ deferred compensation plan | | | 9,954 | |
Total assets | | | 290,770,949 | |
| |
| Liabilities | | | | |
Disbursements in excess of cash | | | 12 | |
Unrealized depreciation on forward foreign currency exchange contracts | | | 574,799 | |
Payable for: | | | | |
Investments purchased | | | 4,541,231 | |
Capital shares purchased | | | 79,054 | |
Foreign capital gains taxes deferred | | | 348,609 | |
Investment management fees | | | 6,762 | |
Distribution and service fees | | | 20 | |
Transfer agent fees | | | 2,008 | |
Administration fees | | | 622 | |
Compensation of board members | | | 432 | |
Chief compliance officer expenses | | | 163 | |
Other expenses | | | 99,427 | |
Trustees’ deferred compensation plan | | | 9,954 | |
Total liabilities | | | 5,663,093 | |
Net assets applicable to outstanding capital stock | | $ | 285,107,856 | |
The Accompanying Notes to Financial Statements are an integral part of this statement.
11
Statement of Assets and Liabilities (continued) – Columbia Pacific/Asia Fund
March 31, 2012
| | | | |
| Represented by | | | | |
Paid-in capital | | $ | 290,364,601 | |
Undistributed net investment income | | | 1,463,800 | |
Accumulated net realized loss | | | (32,509,120 | ) |
Unrealized appreciation (depreciation) on: | | | | |
Investments | | | 26,702,235 | |
Foreign currency translations | | | (11,071 | ) |
Forward foreign currency exchange contracts | | | (553,980 | ) |
Foreign capital gains tax | | | (348,609 | ) |
Total — representing net assets applicable to outstanding capital stock | | $ | 285,107,856 | |
Net assets applicable to outstanding shares | | | | |
Class A | | $ | 1,675,184 | |
Class C | | $ | 300,262 | |
Class I | | $ | 259,769,415 | |
Class Z | | $ | 23,362,995 | |
Shares outstanding | | | | |
Class A | | | 206,944 | |
Class C | | | 37,357 | |
Class I | | | 31,999,824 | |
Class Z | | | 2,876,478 | |
Net asset value per share | | | | |
Class A(a) | | $ | 8.09 | |
Class C | | $ | 8.04 | |
Class I | | $ | 8.12 | |
Class Z | | $ | 8.12 | |
| (a) | The maximum offering price per share for Class A is $8.58. The offering price is calculated by dividing the net asset value by 1.0 minus the maximum sales charge of 5.75%. |
The Accompanying Notes to Financial Statements are an integral part of this statement.
12
Statement of Operations – Columbia Pacific/Asia Fund
Year ended March 31, 2012
| | | | |
| Net investment income | | | | |
Income: | | | | |
Dividends | | $ | 6,044,736 | |
Interest | | | 28 | |
Dividends from affiliates | | | 4,958 | |
Foreign taxes withheld | | | (531,292 | ) |
Total income | | | 5,518,430 | |
Expenses: | | | | |
Investment management fees | | | 1,493,109 | |
Distribution fees | | | | |
Class C | | | 1,771 | |
Service fees | | | | |
Class A | | | 3,549 | |
Class C | | | 590 | |
Transfer agent fees | | | | |
Class A | | | 2,286 | |
Class C | | | 337 | |
Class Z | | | 29,425 | |
Administration fees | | | 161,661 | |
Compensation of board members | | | 20,707 | |
Pricing and bookkeeping fees | | | 11,950 | |
Custodian fees | | | 189,610 | |
Printing and postage fees | | | 56,454 | |
Registration fees | | | 54,917 | |
Professional fees | | | 50,919 | |
Chief compliance officer expenses | | | 575 | |
Other | | | 10,972 | |
Total expenses | | | 2,088,832 | |
Expense reductions | | | (960 | ) |
Total net expenses | | | 2,087,872 | |
Net investment income | | | 3,430,558 | |
| |
| Realized and unrealized gain (loss) — net | | | | |
Net realized gain (loss) on: | | | | |
Investments | | | (10,748,827 | ) |
Foreign currency translations | | | (758,286 | ) |
Forward foreign currency exchange contracts | | | 657,993 | |
Futures contracts | | | 122,400 | |
Net realized loss | | | (10,726,720 | ) |
Net change in unrealized appreciation (depreciation) on: | | | | |
Investments | | | 17,411,150 | |
Foreign currency translations | | | (10,971 | ) |
Forward foreign currency exchange contracts | | | (592,249 | ) |
Foreign capital gains tax | | | (241,334 | ) |
Net change in unrealized appreciation | | | 16,566,596 | |
Net realized and unrealized gain | | | 5,839,876 | |
Net increase in net assets resulting from operations | | $ | 9,270,434 | |
The Accompanying Notes to Financial Statements are an integral part of this statement.
13
Statement of Changes in Net Assets – Columbia Pacific/Asia Fund
| | | | | | | | |
| Year ended March 31, | | 2012 | | | 2011(a) | |
| | |
| Operations | | | | | | | | |
Net investment income | | $ | 3,430,558 | | | $ | 681,453 | |
Net realized loss | | | (10,726,720 | ) | | | (520,340 | ) |
Net change in unrealized appreciation | | | 16,566,596 | | | | 4,176,752 | |
Net increase in net assets resulting from operations | | | 9,270,434 | | | | 4,337,865 | |
| | |
| Distributions to shareholders from: | | | | | | | | |
Net investment income | | | | | | | | |
Class A | | | (18,637 | ) | | | (16,019 | ) |
Class C | | | (379 | ) | | | (1,053 | ) |
Class I | | | (2,534,647 | ) | | | — | |
Class Z | | | (331,396 | ) | | | (788,608 | ) |
Total distributions to shareholders | | | (2,885,059 | ) | | | (805,680 | ) |
Increase in net assets from share transactions | | | 177,577,624 | | | | 65,859,360 | |
Proceeds from regulatory settlements (Note 6) | | | 51,358 | | | | — | |
Total increase in net assets | | | 184,014,357 | | | | 69,391,545 | |
Net assets at beginning of year | | | 101,093,499 | | | | 31,701,954 | |
Net assets at end of year | | $ | 285,107,856 | | | $ | 101,093,499 | |
Undistributed net investment income | | $ | 1,463,800 | | | $ | 784,369 | |
| (a) | Class I shares are for the period from September 27, 2010 (commencement of operations) to March 31, 2011. |
The Accompanying Notes to Financial Statements are an integral part of this statement.
14
Statement of Changes in Net Assets (continued) – Columbia Pacific/Asia Fund
| | | | | | | | | | | | | | | | |
| Year ended March 31, | | 2012 | | | 2011(a) | |
| | | Shares | | | Dollars ($) | | | Shares | | | Dollars ($) | |
| | | | |
| Capital stock activity | | | | | | | | | | | | | | | | |
Class A shares | | | | | | | | | | | | | | | | |
Subscriptions | | | 125,767 | | | | 1,023,075 | | | | 103,020 | | | | 845,413 | |
Distributions reinvested | | | 1,941 | | | | 15,520 | | | | 2,104 | | | | 14,873 | |
Redemptions | | | (83,500 | ) | | | (681,547 | ) | | | (48,823 | ) | | | (391,641 | ) |
Net increase | | | 44,208 | | | | 357,048 | | | | 56,301 | | | | 468,645 | |
Class C shares | | | | | | | | | | | | | | | | |
Subscriptions | | | 29,649 | | | | 239,371 | | | | 7,372 | | | | 59,350 | |
Distributions reinvested | | | 46 | | | | 379 | | | | 150 | | | | 1,052 | |
Redemptions | | | (3,837 | ) | | | (29,485 | ) | | | (43,553 | ) | | | (330,581 | ) |
Net increase (decrease) | | | 25,858 | | | | 210,265 | | | | (36,031 | ) | | | (270,179 | ) |
Class I shares | | | | | | | | | | | | | | | | |
Subscriptions | | | 27,404,955 | | | | 211,361,997 | | | | 9,752,365 | | | | 84,252,982 | |
Distributions reinvested | | | 335,144 | | | | 2,534,598 | | | | — | | | | — | |
Redemptions | | | (5,081,849 | ) | | | (41,181,341 | ) | | | (410,791 | ) | | | (3,519,304 | ) |
Net increase | | | 22,658,250 | | | | 172,715,254 | | | | 9,341,574 | | | | 80,733,678 | |
Class Z shares | | | | | | | | | | | | | | | | |
Subscriptions | | | 1,486,138 | | | | 10,958,874 | | | | 1,419,644 | | | | 11,149,482 | |
Distributions reinvested | | | 24,699 | | | | 192,194 | | | | 78,825 | | | | 559,654 | |
Redemptions | | | (858,770 | ) | | | (6,856,011 | ) | | | (3,245,820 | ) | | | (26,781,920 | ) |
Net increase (decrease) | | | 652,067 | | | | 4,295,057 | | | | (1,747,351 | ) | | | (15,072,784 | ) |
Total net increase | | | 23,380,383 | | | | 177,577,624 | | | | 7,614,493 | | | | 65,859,360 | |
| (a) | Class I shares are for the period from September 27, 2010 (commencement of operations) to March 31, 2011. |
The Accompanying Notes to Financial Statements are an integral part of this statement.
15
Financial Highlights – Columbia Pacific/Asia Fund
The following tables are intended to help you understand the Fund’s financial performance. Certain information reflects financial results for a single share of a class held for the periods shown. Per share net investment income (loss) amounts are calculated based on average shares outstanding during the period. Total returns assume reinvestment of all dividends and distributions. Total returns do not reflect payment of sales charges, if any, and are not annualized for periods of less than one year.
| | | | | | | | | | | | | | | | | | | | |
| | | Year ended March 31, | |
| | | 2012 | | | 2011 | | | 2010 | | | 2009 | | | 2008(a) | |
| Class A | | | | | | | | | | | | | | | |
| Per share data | | | | | | | | | | | | | | | | | | | | |
Net asset value, beginning of period | | | $8.56 | | | | $7.64 | | | | $4.82 | | | | $9.42 | | | | $9.42 | |
Income from investment operations: | | | | | | | | | | | | | | | | | | | | |
Net investment income | | | 0.13 | | | | 0.08 | | | | 0.04 | | | | 0.11 | | | | 0.00 | (b) |
Net realized and unrealized gain (loss) | | | (0.50 | )(c) | | | 0.98 | | | | 2.78 | | | | (3.35 | ) | | | 0.00 | (b) |
Total from investment operations | | | (0.37 | ) | | | 1.06 | | | | 2.82 | | | | (3.24 | ) | | | 0.00 | (b) |
Less distributions to shareholders from: | | | | | | | | | | | | | | | | | | | | |
Net investment income | | | (0.10 | ) | | | (0.14 | ) | | | (0.02 | ) | | | (0.04 | ) | | | — | |
Net realized gains | | | — | | | | — | | | | — | | | | (1.32 | ) | | | — | |
Total distributions to shareholders | | | (0.10 | ) | | | (0.14 | ) | | | (0.02 | ) | | | (1.36 | ) | | | — | |
Proceeds from regulatory settlement | | | 0.00 | (b) | | | — | | | | 0.02 | | | | — | | | | — | |
Redemption fees: | | | | | | | | | | | | | | | | | | | | |
Redemption fees added to paid-in-capital | | | — | | | | — | | | | 0.00 | (b) | | | 0.00 | (b) | | | 0.00 | (b) |
Net asset value, end of period | | | $8.09 | | | | $8.56 | | | | $7.64 | | | | $4.82 | | | | $9.42 | |
| Total return | | | (4.28% | ) | | | 14.26% | | | | 59.07% | | | | (40.21% | ) | | | 0.00% | |
| Ratios to average net assets(d) | | | | | | | | | | | | | | | | | | | | |
Expenses prior to fees waived or expenses reimbursed (including interest expense) | | | 1.60% | | | | 1.88% | (e) | | | 2.18% | | | | 2.02% | | | | 1.87% | (e)(f) |
Net expenses after fees waived or expenses reimbursed (including interest expense)(g) | | | 1.60% | (h) | | | 1.65% | (e) | | | 1.73% | | | | 1.91% | (h) | | | 1.82% | (e)(f)(h) |
Expenses prior to fees waived or expenses reimbursed (excluding interest expense) | | | 1.60% | | | | 1.88% | | | | 2.18% | | | | 2.01% | | | | 1.87% | (f) |
Net expenses after fees waived or expenses reimbursed (excluding interest expense)(g) | | | 1.60% | (h) | | | 1.65% | | | | 1.73% | | | | 1.90% | (h) | | | 1.82% | (f)(h) |
Net investment income (loss) | | | 1.64% | (h) | | | 1.01% | | | | 0.64% | | | | 1.94% | (h) | | | (0.80% | )(f)(h) |
| Supplemental data | | | | | | | | | | | | | | | | | | | | |
Net assets, end of period (in thousands) | | | $1,675 | | | | $1,394 | | | | $814 | | | | $175 | | | | $10 | |
Portfolio turnover | | | 94% | | | | 63% | | | | 98% | | | | 111% | | | | 68% | |
Notes to Financial Highlights
| (a) | For the period March 31, 2008 (commencement of operations). |
| (b) | Rounds to less than $0.01. |
| (c) | Calculation of the net loss per share (both realized and unrealized) does not correlate to the aggregate realized and unrealized gains presented in the Statement of Operations due to the timing of sales and repurchases of Fund shares in relation to fluctuations in the market value of the portfolio. |
| (d) | In addition to the fees and expenses which the Fund bears directly, the Fund indirectly bears a pro rata share of the fees and expenses of the acquired funds in which it invests. Such indirect expenses are not included in the reported expense ratios. |
| (e) | Includes interest expense which rounds to less than 0.01%. |
| (g) | The Investment Manager and certain of its affiliates agreed to waive/reimburse certain fees and expenses, if applicable. |
| (h) | The benefits derived from expense reductions had an impact of less than 0.01%. |
The Accompanying Notes to Financial Statements are an integral part of this statement.
16
Financial Highlights (continued) – Columbia Pacific/Asia Fund
| | | | | | | | | | | | | | | | | | | | |
| | | Year ended March 31, | |
| | | 2012 | | | 2011 | | | 2010 | | | 2009 | | | 2008(a) | |
| Class C | | | | | | | | | | | | | | | |
| Per share data | | | | | | | | | | | | | | | | | | | | |
Net asset value, beginning of period | | | $8.47 | | | | $7.56 | | | | $4.78 | | | | $9.42 | | | | $9.42 | |
Income from investment operations: | | | | | | | | | | | | | | | | | | | | |
Net investment income (loss) | | | 0.07 | | | | 0.00 | (b) | | | (0.01 | ) | | | 0.04 | | | | 0.00 | (b) |
Net realized and unrealized gain (loss) | | | (0.49 | )(c) | | | 1.00 | | | | 2.77 | | | | (3.32 | ) | | | 0.00 | (b) |
Total from investment operations | | | (0.42 | ) | | | 1.00 | | | | 2.76 | | | | (3.28 | ) | | | 0.00 | (b) |
Less distributions to shareholders from: | | | | | | | | | | | | | | | | | | | | |
Net investment income | | | (0.01 | ) | | | (0.09 | ) | | | — | | | | (0.04 | ) | | | — | |
Net realized gains | | | — | | | | — | | | | — | | | | (1.32 | ) | | | — | |
Total distributions to shareholders | | | (0.01 | ) | | | (0.09 | ) | | | — | | | | (1.36 | ) | | | — | |
Proceeds from regulatory settlement | | | 0.00 | (b) | | | — | | | | 0.02 | | | | — | | | | — | |
Redemption fees: | | | | | | | | | | | | | | | | | | | | |
Redemption fees added to paid-in-capital | | | — | | | | — | | | | 0.00 | (b) | | | 0.00 | (b) | | | 0.00 | (b) |
Net asset value, end of period | | | $8.04 | | | | $8.47 | | | | $7.56 | | | | $4.78 | | | | $9.42 | |
| Total return | | | (4.91% | ) | | | 13.46% | | | | 58.16% | | | | (40.69% | ) | | | 0.00% | |
| Ratios to average net assets(d) | | | | | | | | | | | | | | | | | | | | |
Expenses prior to fees waived or expenses reimbursed (including interest expense) | | | 2.32% | | | | 2.69% | (e) | | | 2.93% | | | | 2.77% | | | | 2.62% | (e)(f) |
Net expenses after fees waived or expenses reimbursed (including interest expense)(g) | | | 2.32% | (h) | | | 2.40% | (e) | | | 2.48% | | | | 2.66% | (h) | | | 2.57% | (e)(f)(h) |
Expenses prior to fees waived or expenses reimbursed (excluding interest expense) | | | 2.32% | | | | 2.69% | | | | 2.93% | | | | 2.76% | | | | 2.62% | (f) |
Net expenses after fees waived or expenses reimbursed (excluding interest expense)(g) | | | 2.32% | (h) | | | 2.40% | | | | 2.48% | | | | 2.65% | (h) | | | 2.57% | (f)(h) |
Net investment income (loss) | | | 0.92% | (h) | | | (0.01% | ) | | | (0.09% | ) | | | 0.87% | (h) | | | (1.55% | )(f)(h) |
| Supplemental data | | | | | | | | | | | | | | | | | | | | |
Net assets, end of period (in thousands) | | | $300 | | | | $97 | | | | $359 | | | | $238 | | | | $10 | |
Portfolio turnover | | | 94% | | | | 63% | | | | 98% | | | | 111% | | | | 68% | |
Notes to Financial Highlights
| (a) | For the period March 31, 2008 (commencement of operations). |
| (b) | Rounds to less than $0.01. |
| (c) | Calculation of the net loss per share (both realized and unrealized) does not correlate to the aggregate realized and unrealized gains presented in the Statement of Operations due to the timing of sales and repurchases of Fund shares in relation to fluctuations in the market value of the portfolio. |
| (d) | In addition to the fees and expenses which the Fund bears directly, the Fund indirectly bears a pro rata share of the fees and expenses of the acquired funds in which it invests. Such indirect expenses are not included in the reported expense ratios. |
| (e) | Includes interest expense which rounds to less than 0.01%. |
| (g) | The Investment Manager and certain of its affiliates agreed to waive/reimburse certain fees and expenses, if applicable. |
| (h) | The benefits derived from expense reductions had an impact of less than 0.01%. |
The Accompanying Notes to Financial Statements are an integral part of this statement.
17
Financial Highlights (continued) – Columbia Pacific/Asia Fund
| | | | | | | | |
| | | Year ended March 31, | |
| | | 2012 | | | 2011(a) | |
| Class I | | | | | | |
| Per share data | | | | | | | | |
Net asset value, beginning of period | | | $8.61 | | | | $7.89 | |
Income from investment operations: | | | | | | | | |
Net investment income | | | 0.16 | | | | 0.08 | |
Net realized and unrealized gain (loss) | | | (0.49 | )(b) | | | 0.64 | |
Total from investment operations | | | (0.33 | ) | | | 0.72 | |
Less distributions to shareholders from: | | | | | | | | |
Net investment income | | | (0.16 | ) | | | — | |
Total distributions to shareholders | | | (0.16 | ) | | | — | |
Proceeds from regulatory settlement | | | 0.00 | (c) | | | — | |
Net asset value, end of period | | | $8.12 | | | | $8.61 | |
| Total return | | | (3.83% | ) | | | 9.13% | |
| Ratios to average net assets(d) | | | | | | | | |
Expenses prior to fees waived or expenses reimbursed (including interest expense) | | | 1.17% | | | | 1.39% | (e)(f) |
Net expenses after fees waived or expenses reimbursed (including interest expense)(g) | | | 1.17% | | | | 1.34% | (e)(f) |
Expenses prior to fees waived or expenses reimbursed (excluding interest expense) | | | 1.17% | | | | 1.39% | (e) |
Net expenses after fees waived or expenses reimbursed (excluding interest expense)(g) | | | 1.17% | | | | 1.34% | (e) |
Net investment income | | | 1.99% | | | | 1.76% | (e) |
| Supplemental data | | | | | | | | |
Net assets, end of period (in thousands) | | | $259,769 | | | | $80,449 | |
Portfolio turnover | | | 94% | | | | 63% | |
Notes to Financial Highlights
| (a) | For the period from September 27, 2010 (commencement of operations) to March 31, 2011. |
| (b) | Calculation of the net loss per share (both realized and unrealized) does not correlate to the aggregate realized and unrealized gains presented in the Statement of Operations due to the timing of sales and repurchases of Fund shares in relation to fluctuations in the market value of the portfolio. |
| (c) | Rounds to less than $0.01. |
| (d) | In addition to the fees and expenses which the Fund bears directly, the Fund indirectly bears a pro rata share of the fees and expenses of the acquired funds in which it invests. Such indirect expenses are not included in the reported expense ratios. |
| (f) | Includes interest expense which rounds to less than 0.01%. |
| (g) | The Investment Manager and certain of its affiliates agreed to waive/reimburse certain fees and expenses, if applicable. |
The Accompanying Notes to Financial Statements are an integral part of this statement.
18
Financial Highlights (continued) – Columbia Pacific/Asia Fund
| | | | | | | | | | | | | | | | | | | | |
| | | Year ended March 31, | |
| | | 2012 | | | 2011 | | | 2010 | | | 2009 | | | 2008 | |
| Class Z | | | | | | | | | | | | | | | |
| Per share data | | | | | | | | | | | | | | | | | | | | |
Net asset value, beginning of period | | | $8.61 | | | | $7.69 | | | | $4.83 | | | | $9.42 | | | | $11.72 | |
Income from investment operations: | | | | | | | | | | | | | | | | | | | | |
Net investment income | | | 0.14 | | | | 0.09 | | | | 0.07 | | | | 0.10 | | | | 0.05 | |
Net realized and unrealized gain (loss) | | | (0.49 | )(a) | | | 0.99 | | | | 2.81 | | | | (3.33 | ) | | | 0.11 | |
Total from investment operations | | | (0.35 | ) | | | 1.08 | | | | 2.88 | | | | (3.23 | ) | | | 0.16 | |
Less distributions to shareholders from: | | | | | | | | | | | | | | | | | | | | |
Net investment income | | | (0.14 | ) | | | (0.16 | ) | | | (0.04 | ) | | | (0.04 | ) | | | (0.08 | ) |
Net realized gains | | | — | | | | — | | | | — | | | | (1.32 | ) | | | (2.38 | ) |
Total distributions to shareholders | | | (0.14 | ) | | | (0.16 | ) | | | (0.04 | ) | | | (1.36 | ) | | | (2.46 | ) |
Proceeds from regulatory settlement | | | 0.00 | (b) | | | — | | | | 0.02 | | | | — | | | | — | |
Redemption fees: | | | | | | | | | | | | | | | | | | | | |
Redemption fees added to paid-in-capital | | | — | | | | — | | | | 0.00 | (b) | | | 0.00 | (b) | | | 0.00 | (b) |
Net asset value, end of period | | | $8.12 | | | | $8.61 | | | | $7.69 | | | | $4.83 | | | | $9.42 | |
| Total return | | | (4.04% | ) | | | 14.44% | | | | 60.22% | | | | (40.10% | ) | | | (1.11% | )(c) |
| Ratios to average net assets(d) | | | | | | | | | | | | | | | | | | | | |
Expenses prior to fees waived or expenses reimbursed (including interest expense) | | | 1.35% | | | | 1.66% | (e) | | | 1.93% | | | | 1.77% | | | | 1.61% | (e) |
Net expenses after fees waived or expenses reimbursed (including interest expense)(f) | | | 1.35% | (g) | | | 1.40% | (e) | | | 1.48% | | | | 1.66% | (g) | | | 1.57% | (e)(g) |
Expenses prior to fees waived or expenses reimbursed (excluding interest expense) | | | 1.35% | | | | 1.66% | | | | 1.93% | | | | 1.76% | | | | 1.61% | |
Net expenses after fees waived or expenses reimbursed (excluding interest expense)(f) | | | 1.35% | (g) | | | 1.40% | | | | 1.48% | | | | 1.65% | (g) | | | 1.57% | (g) |
Net investment income | | | 1.80% | (g) | | | 1.22% | | | | 1.02% | | | | 1.33% | (g) | | | 0.39% | (g) |
| Supplemental data | | | | | | | | | | | | | | | | | | | | |
Net assets, end of period (in thousands) | | | $23,363 | | | | $19,154 | | | | $30,529 | | | | $24,521 | | | | $117,835 | |
Portfolio turnover | | | 94% | | | | 63% | | | | 98% | | | | 111% | | | | 68% | |
Notes to Financial Highlights
| (a) | Calculation of the net loss per share (both realized and unrealized) does not correlate to the aggregate realized and unrealized gains presented in the Statement of Operations due to the timing of sales and repurchases of Fund shares in relation to fluctuations in the market value of the portfolio. |
| (b) | Rounds to less than $0.01. |
| (c) | Total return includes a voluntary reimbursement by the Investment Manager for a realized investment loss due to a trading error. This reimbursement increased total return and net asset value per share by less than 0.01% and $0.01, respectively. |
| (d) | In addition to the fees and expenses which the Fund bears directly, the Fund indirectly bears a pro rata share of the fees and expenses of the acquired funds in which it invests. Such indirect expenses are not included in the reported expense ratios. |
| (e) | Includes interest expense which rounds to less than 0.01%. |
| (f) | The Investment Manager and certain of its affiliates agreed to waive/reimburse certain fees and expenses, if applicable. |
| (g) | The benefits derived from expense reductions had an impact of less than 0.01%. |
The Accompanying Notes to Financial Statements are an integral part of this statement.
19
Notes to Financial Statements – Columbia Pacific/Asia Fund
March 31, 2012
Note 1. Organization
Columbia Pacific/Asia Fund (the Fund), a series of Columbia Funds Series Trust I (the Trust), is a diversified fund. The Trust is registered under the Investment Company Act of 1940, as amended (the 1940 Act), as an open-end management investment company organized as a Massachusetts business trust.
Fund Shares
The Trust may issue an unlimited number of shares (without par value). The Fund offers Class A, Class C, Class I and Class Z shares. All share classes have identical voting, dividend and liquidation rights. Each share class has its own expense structure and sales charges, as applicable.
Class A shares are subject to a maximum front-end sales charge of 5.75% based on the initial investment amount. Class A shares purchased without an initial sales charge in accounts aggregating $1 million to $50 million at the time of purchase are subject to a contingent deferred sales charge (CDSC) if the shares are sold within 18 months of purchase, charged as follows: 1.00% CDSC if redeemed within 12 months of purchase, and 0.50% CDSC if redeemed more than 12, but less than 18, months after purchase.
Class C shares are subject to a 1.00% CDSC on shares redeemed within one year of purchase.
Class I shares are not subject to sales charges and are only available to the Columbia Family of Funds.
Class Z shares are not subject to sales charges, and are only available to certain investors, as described in the Fund’s prospectus.
Note 2. Summary of Significant Accounting Policies
Use of Estimates
The preparation of financial statements in accordance with U.S. generally accepted accounting principles (GAAP) requires management to make certain estimates and assumptions that affect the reported amounts of assets and liabilities, the disclosure of contingent assets and liabilities at the date of the financial statements and the reported amounts of revenue and expenses during the reporting period. Actual results could differ from those estimates.
The following is a summary of significant accounting policies consistently followed by the Fund in the preparation of its financial statements.
Security Valuation
All equity securities are valued at the close of business of the New York Stock Exchange (NYSE). Equity securities are valued at the last quoted sales price on the principal exchange or market on which they trade, except for securities traded on the NASDAQ Stock Market, which are valued at the NASDAQ official close price. Unlisted securities or listed securities for which there were no sales during the day are valued at the mean of the latest quoted bid and asked prices on such exchanges or markets.
Foreign securities are valued based on quotations from the principal market in which such securities are normally traded. If any foreign share prices are not readily available as a result of limited share activity the securities are valued at the mean of the latest quoted bid and asked prices on such exchanges or markets. Foreign currency exchange rates are generally determined at 4:00 p.m. Eastern (U.S.) time. However, many securities markets and exchanges outside the U.S. close prior to the close of the NYSE; therefore, the closing prices for securities in such markets or on such exchanges may not fully reflect events that occur after such close but before the close of the NYSE. In those situations, foreign securities will be fair valued pursuant to the policy adopted by the Board of Trustees (the Board), including utilizing a third party pricing service to determine these fair values. The third party pricing service takes into account multiple factors, including, but not limited to, movements in the U.S. securities markets, certain depositary receipts, futures contracts and foreign exchange rates that have occurred subsequent to the close of the foreign exchange, to determine a good faith estimate that reasonably reflects the current market conditions as of the close of the NYSE. The fair value of a security is likely to be different from the quoted or published price, if available.
Investments in other open-end investment companies, including money market funds, are valued at net asset value.
Forward foreign currency exchange contracts are marked-to-market based upon foreign currency exchange rates provided by a pricing service.
Futures and options on futures contracts are valued based upon the settlement price established each day by the board of trade or exchange on which they are traded.
Investments for which market quotations are not readily available, or that have quotations which management believes are not reliable, are valued at fair value as determined in good faith under consistently applied procedures established by and under the general supervision of the Board. If a security or class of securities (such as foreign
20
Columbia Pacific/Asia Fund
March 31, 2012
securities) is valued at fair value, such value is likely to be different from the last quoted market price for the security. The determination of fair value often requires significant judgment. To determine fair value, management may use assumptions including but not limited to future cash flows and estimated risk premiums. Multiple inputs from various sources may be used to determine value.
Foreign Currency Transactions and Translation
The values of all assets and liabilities denominated in foreign currencies are translated into U.S. dollars at that day’s exchange rates. Net realized and unrealized gains (losses) on foreign currency transactions and translations include gains (losses) arising from the fluctuation in exchange rates between trade and settlement dates on securities transactions, gains (losses) arising from the disposition of foreign currency and currency gains (losses) between the accrual and payment dates on dividends, interest income and foreign withholding taxes.
For financial statement purposes, the Fund does not distinguish that portion of gains (losses) on investments which is due to changes in foreign exchange rates from that which is due to changes in market prices of the investments. Such fluctuations are included with the net realized and unrealized gains (losses) on investments in the Statement of Operations.
Derivative Instruments
The Fund invests in certain derivative instruments as detailed below to meet its investment objectives. Derivatives are instruments whose values depend on, or are derived from, in whole or in part, the value of one or more other assets, such as securities, currencies, commodities or indices. Derivative instruments may be used to maintain cash reserves while maintaining exposure to certain other assets, to offset anticipated declines in values of investments, to facilitate trading, to reduce transaction costs and to pursue higher investment returns. The Fund may also use derivative instruments to mitigate certain investment risks, such as foreign currency exchange rate risk, interest rate risk and credit risk. Derivatives may involve various risks, including the potential inability of the counterparty to fulfill its obligation under the terms of the contract, the potential for an illiquid secondary market and the potential for market movements which may expose the Fund to gains or losses in excess of the amount shown in the Statement of Assets and Liabilities.
The Fund and any counterparty are required to maintain an agreement that requires the Fund and that counterparty to monitor (on a daily basis) the net fair value of all derivatives entered into
pursuant to the agreement between the Fund and such counterparty. If the net fair value of such derivatives between the Fund and that counterparty exceeds a certain threshold (as defined in the agreement), the Fund or the counterparty (as the case may be) is required to post cash and/or securities as collateral. Fair values of derivatives presented in the financial statements are not netted with the fair value of other derivatives or with any collateral amounts posted by the Fund or any counterparty.
Forward Foreign Currency Exchange Contracts
Forward foreign currency exchange contracts are agreements between two parties to buy and sell a currency at a set price on a future date. These contracts are intended to be used to minimize the exposure to foreign exchange rate fluctuations during the period between the trade and settlement dates of the contract. The Fund utilized forward foreign currency exchange contracts to hedge the currency exposure associated with some or all of the Fund’s securities, to shift foreign currency exposure back to U.S. dollars, to shift investment exposure from one currency to another and to shift U.S. dollar exposure to achieve a representative weighted mix of major currencies in its benchmark, and/or to recover an underweight country exposure in its portfolio.
The values of forward foreign currency exchange contracts fluctuate with changes in foreign currency exchange rates. The Fund will record a realized gain or loss when the forward foreign currency exchange contract is closed.
The use of forward foreign currency exchange contracts does not eliminate fluctuations in the prices of the Fund’s portfolio securities. The risks of forward foreign currency exchange contracts include movement in the values of the foreign currencies relative to the U.S. dollar (or other foreign currencies) and the possibility that counterparties will not complete their contractual obligations, which may be in excess of the amount reflected, if any, in the Statement of Assets and Liabilities.
Futures Contracts
Futures contracts represent commitments for the future purchase or sale of an asset at a specified price on a specified date. The Fund bought and sold futures contracts to maintain appropriate equity market exposure while keeping sufficient cash to accommodate daily redemptions. Upon entering into futures contracts, the Fund bears risks which may include interest rates, exchange rates or securities prices moving unexpectedly, in which case, the Fund may not achieve the anticipated benefits of the futures contracts and may
21
Columbia Pacific/Asia Fund
March 31, 2012
realize a loss. Additional risks include counterparty credit risk, the possibility of an illiquid market, and that a change in the value of the contract or option may not correlate with changes in the value of the underlying asset.
Upon entering into a futures contract, the Fund pledges cash or securities with the broker in an amount sufficient to meet the initial margin requirement. Subsequent payments (variation margin) are made or received by the Fund each day. The variation margin payments are equal to the daily change in the contract value and are recorded as variation margin receivable or payable and are offset in unrealized gains or losses. The Fund recognizes a realized gain or loss when the contract is closed or expires. Futures contracts involve, to varying degrees, risk of loss in excess of the variation margin disclosed in the Statement of Assets and Liabilities.
Effects of Derivative Transactions in the Financial Statements
The following tables are intended to provide additional information about the effect of derivatives on the financial statements of the Fund, including: the fair value of derivatives by risk category and the location of those fair values in the Statement of Assets and Liabilities; the impact of derivative transactions on the Fund’s operations over the period including realized gains or losses and unrealized gains or losses. The derivative schedules following the Portfolio of Investments present additional information regarding derivative instruments outstanding at the end of the period, if any.
| | | | | | | | |
Fair Values of Derivative Instruments at
March 31, 2012 |
| | | Asset derivatives | | Liability derivatives |
Risk
Exposure
Category | | Statement of
Assets and
Liabilities
Location | | Fair
Value | | Statement of
Assets and
Liabilities
Location | | Fair
Value |
Foreign
exchange
contracts | | Unrealized
appreciation
on forward
foreign
currency
exchange
contracts | | $20,819 | | Unrealized
depreciation
on forward
foreign
currency
exchange
contracts | | $574,799 |
| | | | | | | | | | | | |
Effect of Derivative Instruments in the Statement of
Operations for the Year Ended March 31, 2012 | |
| | | Amount of Realized Gain (Loss) on
Derivatives Recognized in Income | |
Risk Exposure
Category | | Forward Foreign
Currency Exchange
Contracts | | | Futures
Contracts | | | Total | |
| Equity contracts | | $ | — | | | $ | 122,400 | | | $ | 122,400 | |
| Foreign exchange contracts | | | 657,993 | | | | — | | | | 657,993 | |
| | | | | | | | | | | | |
| Total | | $ | 657,993 | | | $ | 122,400 | | | $ | 780,393 | |
| | | | | | | | | | | | |
| | |
| | | Change in Unrealized Appreciation
(Depreciation) on Derivatives
Recognized in Income | |
Risk Exposure
Category | | Forward Foreign
Currency Exchange
Contracts | | | Futures
Contracts | | | Total | |
| Foreign exchange contracts | | $ | (592,249 | ) | | $ | — | | | $ | (592,249 | ) |
| | | | |
Volume of Derivative Instruments for the
Year Ended March 31, 2012 | |
| | | Contracts
Opened | |
| Forward Foreign Currency Exchange Contracts | | | 176 | |
| Futures Contracts | | | 516 | |
Repurchase Agreements
The Fund may engage in repurchase agreement transactions with institutions that management has determined are creditworthy. The Fund, through the custodian, receives delivery of the underlying securities collateralizing a repurchase agreement. Management is responsible for determining that the collateral is at least equal, at all times, to the value of the repurchase obligation including interest. A repurchase agreement transaction involves certain risks in the event of default or insolvency of the counterparty. These risks include possible delays in or restrictions on a Fund’s ability to dispose of the underlying securities and a possible decline in the value of the underlying securities during the period while the Fund seeks to assert its rights.
Security Transactions
Security transactions are accounted for on the trade date. Cost is determined and gains (losses) are based upon the specific identification method for both financial statement and federal income tax purposes.
22
Columbia Pacific/Asia Fund
March 31, 2012
Income Recognition
Corporate actions and dividend income are recorded net of any non-reclaimable tax withholdings, on the ex-dividend date or upon receipt of ex-dividend notification in the case of certain foreign securities.
Interest income is recorded on the accrual basis.
Awards from class action litigation are recorded as a reduction of cost basis if the Fund still owns the applicable securities on the payment date. If the Fund no longer owns the applicable securities, the proceeds are recorded as realized gains.
Expenses
General expenses of the Trust are allocated to the Fund and other funds of the Trust based upon relative net assets or other expense allocation methodologies determined by the nature of the expense. Expenses directly attributable to the Fund are charged to the Fund. Expenses directly attributable to a specific class of shares are charged to that share class.
Determination of Class Net Asset Value
All income, expenses (other than class-specific expenses, which are charged to that share class, as shown in the Statement of Operations) and realized and unrealized gains (losses) are allocated to each class of the Fund on a daily basis, based on the relative net assets of each class, for purposes of determining the net asset value of each class.
Federal Income Tax Status
The Fund intends to qualify each year as a regulated investment company under Subchapter M of the Internal Revenue Code, as amended, and will distribute substantially all of its tax exempt or taxable income (including net short-term capital gains), if any, for its tax year, and as such will not be subject to federal income taxes. In addition, the Fund intends to distribute in each calendar year substantially all of its net investment income, capital gains and certain other amounts, if any, such that the Fund should not be subject to federal excise tax. Therefore, no federal income or excise tax provision is recorded.
Foreign Taxes
The Fund may be subject to foreign taxes on income, gains on investments or currency repatriation, a portion of which may be recoverable. The Fund will accrue such taxes and recoveries, as applicable, based upon its current interpretation of tax rules and regulations that exist in the markets in which it invests.
Realized gains in certain countries may be subject to foreign taxes at the Fund level, based on statutory rates. The Fund accrues for such foreign taxes on net realized and unrealized gains at the appropriate rate for each jurisdiction, as applicable.
Distributions to Shareholders
Distributions from net investment income, if any, are declared and paid semi-annually. Net realized capital gains, if any, are distributed along with the income dividend. Income distributions and capital gain distributions are determined in accordance with federal income tax regulations which may differ from GAAP.
Guarantees and Indemnifications
Under the Trust’s organizational documents and, in some cases, by contract, its officers and trustees are indemnified against certain liabilities arising out of the performance of their duties to the Trust or its funds. In addition, certain of the Fund’s contracts with its service providers contain general indemnification clauses. The Fund’s maximum exposure under these arrangements is unknown since the amount of any future claims that may be made against the Fund cannot be determined, and the Fund has no historical basis for predicting the likelihood of any such claims.
Recent Accounting Pronouncement
Fair Value Measurements and Disclosures
In May 2011, the Financial Accounting Standards Board (FASB) issued ASU No. 2011-04 modifying Topic 820, Fair Value Measurements and Disclosures. At the same time, the International Accounting Standards Board (IASB) issued International Financial Reporting Standard 13, Fair Value Measurement. The objective of the FASB and IASB is convergence of their guidance on fair value measurements and disclosures.
Specifically, ASU No. 2011-04 requires reporting entities to disclose i) the amounts of any transfers between Level 1 and Level 2, and the reasons for the transfers, ii) for Level 3 fair value measurements, a) quantitative information about significant unobservable inputs used, b) a description of the valuation processes used by the reporting entity and c) a narrative description of the sensitivity of the fair value measurement to changes in unobservable inputs if a change in those inputs might result in a significantly higher or lower fair value measurement. The effective date of ASU No. 2011-04 is for interim and annual periods beginning after December 15, 2011. At this time, management is evaluating the implications of this guidance and the impact it will have on the financial statement amounts and footnote disclosures, if any.
23
Columbia Pacific/Asia Fund
March 31, 2012
Note 3. Fees and Compensation Paid to Affiliates
Investment Management Fees
Under an Investment Management Services Agreement (IMSA), Columbia Management Investment Advisers, LLC (the Investment Manager), a wholly-owned subsidiary of Ameriprise Financial, Inc. (Ameriprise Financial), determines which securities will be purchased, held or sold. Effective July 1, 2011, the management fee is an annual fee that is equal to a percentage of the Fund’s average daily net assets that declines from 0.87% to 0.66% as the Fund’s net assets increase. Prior to July 1, 2011, the management fee was equal to a percentage of the Fund’s average daily net assets that declined from 0.75% to 0.52% as the Fund’s net assets increased. The effective management fee rate for the year ended March 31, 2012 was 0.85% of the Fund’s average daily net assets.
Administration Fees
Under an Administrative Services Agreement, the Investment Manager serves as the Fund Administrator. Effective July 1, 2011, the Fund pays the Fund Administrator an annual fee for administration and accounting services equal to a percentage of the Fund’s average daily net assets that declines from 0.08% to 0.06% as the Fund’s net assets increase. Prior to July 1, 2011, the administration fee was equal to the annual rate of 0.20% of the Fund’s average daily net assets, less the fees that were payable by the Fund as described under the Pricing and Bookkeeping Fees note below. The effective administration fee rate for the year ended March 31, 2012 was 0.10% of the Fund’s average daily net assets.
Pricing and Bookkeeping Fees
Prior to June 27, 2011, the Fund had entered into a Financial Reporting Services Agreement (the Financial Reporting Services Agreement) with State Street Bank and Trust Company (State Street) and the Investment Manager pursuant to which State Street provided financial reporting services to the Fund. The Fund also entered into an Accounting Services Agreement (collectively with the Financial Reporting Services Agreement, the State Street Agreements) with State Street and the Investment Manager pursuant to which State Street provided accounting services to the Fund. Under the State Street Agreements, the Fund paid State Street an annual fee of $38,000 paid monthly plus an additional monthly fee based on an annualized percentage rate of average daily net assets of the Fund for the month. The aggregate fee did not exceed $140,000 per year (exclusive of out-of-pocket expenses and charges). The Fund also reimbursed State Street for certain out-of-pocket expenses
and charges. Effective June 27, 2011, these services are provided under the Administrative Services Agreement discussed above.
Compensation of Board Members
Board members are compensated for their services to the Fund as disclosed in the Statement of Operations. The Trust’s eligible Trustees may participate in a Deferred Compensation Plan (the Plan) which may be terminated at any time. Obligation of the Plan will be paid solely out of the Fund’s assets.
Compensation of Chief Compliance Officer
The Board has appointed a Chief Compliance Officer to the Fund in accordance with federal securities regulations. The Fund, along with other affiliated funds, pays its pro-rata share of the expenses associated with the Chief Compliance Officer. The Fund’s expenses for the Chief Compliance Officer will not exceed $15,000 per year.
Transfer Agent Fees
Under a Transfer and Dividend Disbursing Agent Agreement, Columbia Management Investment Services Corp. (the Transfer Agent), an affiliate of the Investment Manager and a wholly-owned subsidiary of Ameriprise Financial, is responsible for providing transfer agency services to the Fund. The Transfer Agent has contracted with Boston Financial Data Services (BFDS) to serve as sub-transfer agent.
The Transfer Agent receives monthly account-based service fees based on the number of open accounts and is reimbursed by the Fund for the fees and expenses the Transfer Agent pays to financial intermediaries that maintain omnibus accounts with the Fund that is a percentage of the average aggregate value of the Fund’s shares maintained in each such omnibus account (other than omnibus accounts for which American Enterprise Investment Services Inc. is the broker of record or accounts where the beneficial shareholder is a customer of Ameriprise Financial Services, Inc., which are paid a per account fee). The Transfer Agent pays the fees of BFDS for services as sub-transfer agent and is not entitled to reimbursement for such fees from the Fund (with the exception of out-of-pocket fees).
The Transfer Agent also receives compensation from fees for various shareholder services and reimbursements for certain out-of-pocket expenses. Class I shares do not pay transfer agent fees.
24
Columbia Pacific/Asia Fund
March 31, 2012
For the year ended March 31, 2012, the Fund’s effective transfer agent fee rates as a percentage of average daily net assets of each class were as follows:
| | | | |
| | | | |
| Class A | | | 0.16 | % |
| Class C | | | 0.14 | |
| Class Z | | | 0.15 | |
An annual minimum account balance fee of $20 may apply to certain accounts with a value below the Fund’s initial minimum investment requirements to reduce the impact of small accounts on transfer agent fees. These minimum account balance fees are recorded as part of expense reductions in the Statement of Operations. For the year ended March 31, 2012, these minimum account balance fees reduced total expenses by $960.
Distribution and Service Fees
The Fund has an agreement with Columbia Management Investment Distributors, Inc. (the Distributor), an affiliate of the Investment Manager and a wholly-owned subsidiary of Ameriprise Financial, for distribution and shareholder services. Pursuant to Rule 12b-1 under the 1940 Act, the Board has approved, and the Fund has adopted, distribution and shareholder service plans (the Plans) which set the distribution and service fees for the Fund. These fees are calculated daily and are intended to compensate the Distributor and/or eligible selling and/or servicing agents for selling shares of the Fund and providing services to investors.
The Plans require the payment of a monthly service fee to the Distributor at the maximum annual rate of 0.25% of the average daily net assets attributable to Class A and Class C shares of the Fund. The Plans also require the payment of a monthly distribution fee to the Distributor at the maximum annual rate of 0.75% of the average daily net assets attributable to Class C shares, respectively.
Sales Charges
Sales charges, including front-end charges and CDSCs, received by the Distributor for distributing Fund shares were $9,127 for Class A for the year ended March 31, 2012.
Expenses Waived/Reimbursed by the Investment Manager and its Affiliates
Effective July 1, 2011, the Investment Manager and certain of its affiliates have contractually agreed to waive fees and/or reimburse expenses (excluding certain fees and expenses described below), through July 31, 2012, unless sooner terminated at the sole
discretion of the Board, so that the Fund’s net operating expenses, after giving effect to fees waived/expenses reimbursed and any balance credits and/or overdraft charges from the Fund’s custodian, do not exceed the following annual rates as a percentage of the class’ average daily net assets:
| | | | |
| | | | |
| Class A | | | 1.79 | % |
| Class C | | | 2.54 | |
| Class I | | | 1.48 | |
| Class Z | | | 1.54 | |
Under the agreement, the following fees and expenses are excluded from the waiver/reimbursement commitment, and therefore will be paid by the Fund, if applicable: taxes (including foreign transaction taxes), expenses associated with investments in affiliated and non-affiliated pooled investment vehicles (including mutual funds and exchange traded funds), transaction costs and brokerage commissions, costs related to any securities lending program, dividend expenses associated with securities sold short, inverse floater program fees and expenses, transaction charges and interest on borrowed money, interest, extraordinary expenses and any other expenses the exclusion of which is specifically approved by the Board. This agreement may be modified or amended only with approval from all parties.
Prior to July 1, 2011, the Investment Manager voluntarily agreed to reimburse a portion of the Fund’s expenses (excluding certain expenses, such as brokerage commissions, interest, taxes and extraordinary expenses, but including custodian charges relating to overdrafts, if any) so that the Fund’s ordinary net operating expenses, after giving effect to fees waived/expenses reimbursed and any balance credits from the Fund’s custodian, did not exceed the following annual rates as a percentage of the class’ average daily net assets:
| | | | |
| | | | |
| Class A | | | 1.65 | % |
| Class C | | | 2.40 | |
| Class I | | | 1.34 | |
| Class Z | | | 1.40 | |
Note 4. Federal Tax Information
The timing and character of income and capital gain distributions are determined in accordance with income tax regulations, which may differ from GAAP because of temporary or permanent book to tax differences.
25
Columbia Pacific/Asia Fund
March 31, 2012
For the year ended March 31, 2012, these differences are primarily due to differing treatment for deferral/reversal of wash sales losses, Trustees’ deferred compensation, foreign capital gains tax, foreign currency transactions, passive foreign investment company (PFIC) holdings, capital loss carryforward limitations related to ownership changes and recognition of unrealized appreciation (depreciation) for certain derivative investments. To the extent these differences are permanent, reclassifications are made among the components of the Fund’s net assets in the Statement of Assets and Liabilities. Temporary differences do not require reclassifications. In the Statement of Assets and Liabilities the following reclassifications were made:
| | | | |
| | | | |
| Undistributed net investment income | | $ | 133,932 | |
| Accumulated net realized loss | | | 1,491,280 | |
| Paid-in capital | | | (1,625,212 | ) |
Net investment income and net realized gains (losses), as disclosed in the Statement of Operations, and net assets were not affected by this reclassification.
The tax character of distributions paid during the years indicated was as follows:
| | | | |
| Year ended March 31, | | 2012 | | 2011 |
| Ordinary income | | $2,885,059 | | $805,680 |
Short-term capital gain distributions, if any, are considered ordinary income distributions for tax purposes.
At March 31, 2012, the components of distributable earnings on a tax basis were as follows:
| | | | |
| | | | |
| Undistributed ordinary income | | $ | 1,791,619 | |
| Undistributed accumulated long-term gain | | | — | |
| Unrealized appreciation | | | 22,945,116 | |
At March 31, 2012, the cost of investments for federal income tax purposes was $261,119,063 and the aggregate gross unrealized appreciation and depreciation based on that cost was:
| | | | |
| | | | |
| Unrealized appreciation | | $ | 25,454,769 | |
| Unrealized depreciation | | | (2,509,653 | ) |
| | | | |
| Net unrealized appreciation | | $ | 22,945,116 | |
The following capital loss carryforward, determined at March 31, 2012, may be available to reduce taxable income arising from future net realized gains on investments, if any, to the extent permitted by the Internal Revenue Code:
| | | | |
| | | | |
| Year of expiration | | Amount | |
| 2017 | | $ | 9,165,902 | |
| 2018 | | | 10,992,397 | |
| 2019 | | | 790,415 | |
| Unlimited short-term | | | 8,559,141 | |
| | | | |
| Total | | $ | 29,507,855 | |
On December 22, 2010, the Regulated Investment Company Modernization Act of 2010 (the Act) was enacted, which changed various technical rules governing the tax treatment of regulated investment companies. The changes are generally effective for taxable years beginning after the date of enactment. Under the Act, the Fund will be permitted to carry forward capital losses incurred in taxable years beginning after the date of enactment for an unlimited period. However, any losses incurred during those future taxable years will be required to be utilized prior to the losses incurred in pre-enactment taxable years, which carry an expiration date. As a result of this ordering rule, pre-enactment capital loss carryforwards may be more likely to expire unused.
Capital loss carryforward of $1,573,851 was permanently lost due to provisions under the Internal Revenue Code during the year ended March 31, 2012. Permanently lost capital loss carryforward is recorded as a reduction of paid in capital.
Management of the Fund has concluded that there are no significant uncertain tax positions that would require recognition in the financial statements. However, management’s conclusion may be subject to review and adjustment at a later date based on factors including, but not limited to, new tax laws, regulations, and administrative interpretations (including relevant court decisions). Generally, the Fund’s federal tax returns for the prior three fiscal years remain subject to examination by the Internal Revenue Service.
Note 5. Portfolio Information
The cost of purchases and proceeds from sales of securities, excluding short-term obligations, aggregated to $342,394,743 and $166,623,869, respectively, for the year ended March 31, 2012.
26
Columbia Pacific/Asia Fund
March 31, 2012
Note 6. Regulatory Settlements
During the year ended March 31, 2012, the Fund received $51,358 as a result of a settlement of an administrative proceeding brought by the Securities and Exchange Commission against an unaffiliated third party relating to market timing and/or late trading of mutual funds which represented the Fund’s portion of the proceeds from the settlement (the Fund was not a party to the proceeding). The proceeds received by the Fund were recorded as an increase to additional paid-in capital.
Note 7. Lending of Portfolio Securities
Effective June 27, 2011, the Fund has entered into a Master Securities Lending Agreement (the Agreement) with JPMorgan Chase Bank, N.A. (JPMorgan). The Agreement, which replaces the previous securities lending arrangement with State Street, authorizes JPMorgan as lending agent to lend securities to authorized borrowers in order to generate additional income on behalf of the Fund. Pursuant to the Agreement, the securities loaned are secured by cash or U.S. government securities equal to at least 100% of the market value of the loaned securities. Any additional collateral required to maintain those levels due to market fluctuations of the loaned securities is requested to be delivered the following business day. Cash collateral received is invested by the lending agent on behalf of the Fund into authorized investments pursuant to the Agreement. The investments made with the cash collateral are listed in the Portfolio of Investments. The values of such investments and any uninvested cash collateral are disclosed in the Statement of Assets and Liabilities along with the related obligation to return the collateral upon the return of the securities loaned.
Risks of delay in recovery of securities or even loss of rights in the securities may occur should the borrower of the securities fail financially. Risks may also arise to the extent that the value of the securities loaned increases above the value of the collateral received. JPMorgan will indemnify the Fund from losses resulting from a borrower’s failure to return a loaned security when due. Such indemnification does not extend to losses associated with declines in the value of cash collateral investments. The Investment Manager is not responsible for any losses incurred by the Fund in connection with the securities lending program. Loans are subject to termination by the Fund or the borrower at any time, and are, therefore, not considered to be illiquid investments.
Pursuant to the Agreement, the Fund receives income for lending its securities either in the form of fees or by earning interest on invested cash collateral, net of negotiated rebates paid to borrowers and fees paid to the lending agent for services provided and any other
securities lending expenses. The Fund continues to earn and accrue interest and dividends on the securities loaned.
Prior to June 27, 2011, the Fund participated in a securities lending arrangement with State Street. Each security on loan was collateralized in an amount at least equal to the market value of the securities loaned plus accrued income from the investment of collateral. The income generated by the investment of the collateral, net of any fees remitted to State Street as the lending agent and borrower rebates, was paid to the Fund.
For the year ended March 31, 2012, the Fund did not participate in securities lending activity.
Note 8. Custody Credits
Prior to June 27, 2011, the Fund had an agreement with its custodian bank under which custody fees may have been reduced by balance credits. These credits are recorded as part of expense reductions on the Statement of Operations. The Fund could have invested a portion of the assets utilized in connection with the expense offset arrangement in an income-producing asset if they had not entered into such an agreement. Subsequent to this date, the Fund may invest its daily balance in an affiliated money market fund as detailed below. For the period April 1, 2011 through June 27, 2011, there were no custody credits.
Note 9. Affiliated Money Market Fund
Effective June 27, 2011, the Fund may invest its daily cash balances in Columbia Short-Term Cash Fund, an affiliated money market fund established for the exclusive use by the Fund and other affiliated funds. The income earned by the Fund from such investments is included as “Dividends from affiliates” in the Statement of Operations. As an investing fund, the Fund indirectly bears its proportionate share of the expenses of Columbia Short-Term Cash Fund.
Note 10. Shareholder Concentration
At March 31, 2012, affiliated shareholder accounts owned 91.1% of the outstanding shares of the Fund. Subscription and redemption activity by concentrated accounts may have a significant effect on the operations of the Fund.
Note 11. Line of Credit
The Fund has entered into a revolving credit facility with a syndicate of banks led by JPMorgan, whereby the Fund may borrow for the temporary funding of shareholder redemptions or for other temporary or emergency purposes. The credit facility became effective on
27
Columbia Pacific/Asia Fund
March 31, 2012
June 27, 2011, replacing a prior credit facility. The credit facility agreement, as amended, which is a collective agreement between the Fund and certain other funds managed by the Investment Manager, severally and not jointly, permits collective borrowings up to $500 million. Pursuant to a December 13, 2011 amendment to the credit facility agreement, interest is charged to each participating fund based on its borrowings at a rate equal to the higher of (i) the overnight federal funds rate plus 1.00% or (i) the one-month LIBOR rate plus 1.00%. Each borrowing under the credit facility matures no later than 60 days after the date of borrowing. The Fund also pays a commitment fee equal to its pro rata share of the amount of the credit facility at a rate of 0.08% per annum. For the period June 27, 2011 through December 12, 2011, interest was charged to each participating fund based on its borrowings at a rate equal to the sum of the federal funds rate plus (i) 1.25% per annum plus (ii) if one-month LIBOR exceeds the federal funds rate, the amount of such excess. The Fund also paid a commitment fee equal to its pro rata share of the amount of the credit facility at a rate of 0.10% per annum.
For the period May 16, 2011 through June 26, 2011, the Fund and certain other funds managed by the Investment Manager participated in a $150 million committed, unsecured revolving credit facility provided by State Street. Prior to May 16, 2011, the collective borrowing amount of the credit facility was $225 million. Interest was charged to each fund based on its borrowings at a rate equal to the greater of the (i) federal funds rate plus 1.25% per annum or (ii) the overnight LIBOR rate plus 1.25% per annum. The Fund also paid a commitment fee equal to its pro rata share of the amount of the credit facility at a rate of 0.125% per annum.
The Fund had no borrowings during the year ended March 31, 2012.
Note 12. Significant Risks
Foreign Securities Risk
Investing in foreign securities may include certain risks and considerations not typically associated with investing in U.S. securities, such as fluctuating currency values and changing local and regional economic, political and social conditions, which may result in greater market volatility. In addition, certain foreign securities may not be as liquid as U.S. securities. Investing in emerging markets may accentuate these risks.
Investments in emerging market countries are subject to additional risk. The risk of foreign investments is typically increased in less developed countries. These countries are also more likely to experience high levels of inflation, deflation or currency devaluation which could hurt their economies and securities markets.
Note 13. Subsequent Events
Management has evaluated the events and transactions that have occurred through the date the financial statements were issued and noted no items requiring adjustment of the financial statements or additional disclosure.
Note 14. Information Regarding Pending and Settled Legal Proceedings
In December 2005, without admitting or denying the allegations, American Express Financial Corporation (AEFC, which is now known as Ameriprise Financial, Inc. (Ameriprise Financial)) entered into settlement agreements with the Securities and Exchange Commission (SEC) and Minnesota Department of Commerce (MDOC) related to market timing activities. As a result, AEFC was censured and ordered to cease and desist from committing or causing any violations of certain provisions of the Investment Advisers Act of 1940, the Investment Company Act of 1940, and various Minnesota laws. AEFC agreed to pay disgorgement of $10 million and civil money penalties of $7 million. AEFC also agreed to retain an independent distribution consultant to assist in developing a plan for distribution of all disgorgement and civil penalties ordered by the SEC in accordance with various undertakings detailed at www.sec.gov/litigation/admin/ia-2451.pdf. Ameriprise Financial and its affiliates have cooperated with the SEC and the MDOC in these legal proceedings, and have made regular reports to the funds’ Boards of Trustees.
Ameriprise Financial and certain of its affiliates have historically been involved in a number of legal, arbitration and regulatory proceedings, including routine litigation, class actions, and governmental actions, concerning matters arising in connection with the conduct of their business activities. Ameriprise Financial believes that the Funds are not currently the subject of, and that neither Ameriprise Financial nor any of its affiliates are the subject of, any pending legal, arbitration or regulatory proceedings that are likely to have a material adverse effect on the Funds or the ability of Ameriprise Financial or its affiliates to perform under their contracts with the Funds. Ameriprise Financial is required to make 10-Q, 10-K and, as necessary, 8-K filings with the Securities and Exchange Commission on legal and regulatory matters that relate to Ameriprise Financial and its affiliates. Copies of these filings may be obtained by accessing the SEC website at www.sec.gov.
There can be no assurance that these matters, or the adverse publicity associated with them, will not result in increased fund redemptions, reduced sale of fund shares or other adverse consequences to the Funds. Further, although we believe
28
Columbia Pacific/Asia Fund
March 31, 2012
proceedings are not likely to have a material adverse effect on the Funds or the ability of Ameriprise Financial or its affiliates to perform under their contracts with the Funds, these proceedings are subject to uncertainties and, as such, we are unable to estimate the possible loss or range of loss that may result. An adverse outcome in
one or more of these proceedings could result in adverse judgments, settlements, fines, penalties or other relief that could have a material adverse effect on the consolidated financial condition or results of operations of Ameriprise Financial.
29
Report of Independent Registered Public Accounting Firm
To the Trustees of Columbia Funds Series Trust I and the Shareholders of Columbia Pacific/Asia Fund
In our opinion, the accompanying statement of assets and liabilities, including the investment portfolio, and the related statements of operations and of changes in net assets and the financial highlights present fairly, in all material respects, the financial position of Columbia Pacific/Asia Fund (the “Fund”) (a series of Columbia Funds Series Trust I) at March 31, 2012, the results of its operations for the year then ended, the changes in its net assets for each of the two years in the period then ended and the financial highlights for the periods indicated, in conformity with accounting principles generally accepted in the United States of America. These financial statements and financial highlights (hereafter referred to as “financial statements”) are the responsibility of the Fund’s management. Our responsibility is to express an opinion on these financial statements based on our audits. We conducted our audits of these financial statements in accordance with the standards of the Public Company Accounting Oversight Board (United States). Those standards require that we plan and perform the audit to obtain reasonable assurance about whether the financial statements are free of material misstatement. An audit includes examining, on a test basis, evidence supporting the amounts and disclosures in the financial statements, assessing the accounting principles used and significant estimates made by management, and evaluating the overall financial statement presentation. We believe that our audits, which included confirmation of securities at March 31, 2012 by correspondence with the custodian, transfer agent and brokers, provide a reasonable basis for our opinion.
PricewaterhouseCoopers LLP
Minneapolis, Minnesota
May 22, 2012
30
Federal Income Tax Information (Unaudited) – Columbia Pacific/Asia Fund
Foreign taxes paid during the fiscal year ended March 31, 2012, of $536,888 are being passed through to shareholders. This represents $0.02 per share. Eligible shareholders may claim this amount as a foreign tax credit.
Gross income derived from sources within foreign countries was $5,925,589 ($0.17 per share) for the fiscal year ended March 31, 2012.
For non-corporate shareholders 88.65%, or the maximum amount allowable under the Jobs and Growth Tax Relief Reconciliation Act of 2003, of ordinary income distributed by the Fund for the fiscal year ended March 31, 2012 may represent qualified dividend income.
The Fund will notify shareholders in January 2013 of amounts for use in preparing 2012 income tax returns.
31
Fund Governance
The Trustees serve terms of indefinite duration. The names, addresses and birth years of the Trustees and Officers of the Funds in Columbia Funds Series Trust I, the year each was first elected or appointed to office, their principal business occupations during at least the last five years, the number of Funds overseen by each Trustee and other directorships they hold are shown below. Each officer listed below serves as an officer of each Fund in Columbia Funds Series Trust I.
Independent Trustees
| | |
Name, address and year of birth,
Position with funds, Year first
elected or appointed to office | | Principal occupation(s) during past five years, Number of funds in Columbia Funds
Complex overseen by trustee, Other directorships Held |
| |
| Rodman L. Drake (born 1943) | | |
c/o Columbia Management Investment Advisers, LLC 225 Franklin Street Boston, MA 02110 Trustee (since 1994) and Chairman of the Board (since 2009) | | Independent consultant since 2010; Co-Founder of Baringo Capital LLC (private equity) from 1997 to 2008; CEO of Crystal River Capital, Inc. (real estate investment trust) from 2003 to 2010; Oversees 51; Jackson Hewitt Tax Service Inc. (tax preparation services) from 2004 to 2011; Celgene Corporation (global biotechnology company); Student Loan Corporation (student loan provider) from 2005 to 2010; Celgene Corporation (global biotechnology company); The Helios Funds and Brookfield Funds (closed-end funds); Crystal River Capital, Inc. from 2005 to 2010; Parsons Brinckerhoff from 1995 to 2008; and Apex Silver Mines Ltd. from 2007 to 2009 |
| |
| Douglas A. Hacker (born 1955) | | |
c/o Columbia Management Investment Advisers, LLC 225 Franklin Street Boston, MA 02110 Trustee (since 1996) | | Independent business executive since May 2006; Executive Vice President–Strategy of United Airlines (airline) from December 2002 to May 2006; President of UAL Loyalty Services (airline marketing company) from September 2001 to December 2002; Executive Vice President and Chief Financial Officer of United Airlines from July 1999 to September 2001. Oversees 51; Nash Finch Company (food distributor); Aircastle Limited (aircraft leasing); and SeaCube Container Leasing Ltd (container leasing) |
|
| Janet Langford Kelly (born 1957) |
c/o Columbia Management Investment Advisers, LLC 225 Franklin Street Boston, MA 02110 Trustee (since 1996) | | Senior Vice President, General Counsel and Corporate Secretary, ConocoPhillips (integrated energy company) since September 2007; Deputy General Counsel–Corporate Legal Services, ConocoPhillips from August 2006 to August 2007; Partner, Zelle, Hofmann, Voelbel, Mason & Gette LLP (law firm) from March 2005 to July 2006; Adjunct Professor of Law, Northwestern University, from September 2004 to June 2006; Director, UAL Corporation (airline) from February 2006 to July 2006; Oversees 51; None |
|
| Nancy T. Lukitsh (born 1956) |
c/o Columbia Management Investment Advisers, LLC 225 Franklin Street Boston, MA 02110 Trustee (since 2011) | | Senior Vice President, Partner and Director, Marketing of Wellington Management Company, LLP (investment adviser) from 1997 to 2010; Chair, Wellington Management Investment Portfolios (commingled non-U.S. investment pools) from 2007 to 2010; Director, Wellington Trust Company, NA and other Wellington affiliates from 1997 to 2010. Oversees 51; None |
|
| William E. Mayer (born 1940) |
c/o Columbia Management Investment Advisers, LLC 225 Franklin Street Boston, MA 02110 Trustee (since 1994) | | Partner, Park Avenue Equity Partners (private equity) since February 1999; Dean and Professor, College of Business and Management, University of Maryland from 1992 to 1996. Oversees 51; DynaVox Inc. (speech creation); Lee Enterprises (print media), WR Hambrecht + Co. (financial service provider); BlackRock Kelso Capital Corporation (investment company) |
32
Fund Governance (continued)
Independent Trustees (continued)
| | |
Name, address and year of birth,
Position with funds, Year first
elected or appointed to office | | Principal occupation(s) during past five years, Number of funds in Columbia Funds
Complex overseen by trustee, Other directorships held |
| |
| David M. Moffett (born 1952) | | |
c/o Columbia Management Investment Advisers, LLC 225 Franklin Street Boston, MA 02110 Trustee (since 2011) | | Retired. Chief Executive Officer, Federal Home Loan Mortgage Corporation, from 2008 to 2009; Senior Adviser, Global Financial Services Group, Carlyle Group, Inc., from 2007 to 2008; Vice Chairman and Chief Financial Officer, U.S. Bancorp, from 1993 to 2007. Oversees 51; CIT Group Inc. (commercial and consumer finance), eBay Inc. (online trading community), MBIA Corp (financial service provider), E.W. Scripps Co. (print and television media), Building Materials Holding Corp. (building materials and construction services), and University of Oklahoma Foundation. |
| |
| Charles R. Nelson (born 1942) | | |
c/o Columbia Management Investment Advisers, LLC 225 Franklin Street Boston, MA 02110 Trustee (since 1981) | | Retired. Professor Emeritus, University of Washington, since 2011; Professor of Economics, University of Washington, from 1976 to 2011; Ford and Louisa Van Voorhis Professor of Political Economy, University of Washington, from 1993 to 2011; Adjunct Professor of Statistics, University of Washington, from 1980 to 2011; Associate Editor, Journal of Money Credit and Banking from 1993 to 2008; consultant on econometric and statistical matters. Oversees 51; None |
| |
| John J. Neuhauser (born 1943) | | |
c/o Columbia Management Investment Advisers, LLC 225 Franklin Street Boston, MA 02110 Trustee (since 1984) | | President, Saint Michael’s College, since August 2007; Director or Trustee of several non-profit organization, including Fletcher Allen Health Care, Inc.; University Professor, Boston College from November 2005 to August 2007; Academic Vice President and Dean of Faculties, Boston College from August 1999 to October 2005. Oversees 51; Liberty All-Star Equity Fund and Liberty All-Star Growth Fund, Inc. (closed-end funds) |
| |
| Patrick J. Simpson (born 1944) | | |
c/o Columbia Management Investment Advisers, LLC 225 Franklin Street Boston, MA 02110 Trustee (since 2000) | | Partner, Perkins Coie LLP (law firm). Oversees 51; None |
| |
| Anne-Lee Verville (born 1945) | | |
c/o Columbia Management Investment Advisers, LLC 225 Franklin Street Boston, MA 02110 Trustee (since 1998) | | Retired since 1997 (formerly General Manager–Global Education Industry from 1994 to 1997, President–Application Systems Division from 1991 to 1994, Chief Financial Officer–US Marketing & Services from 1988 to 1991, and Chief Information Officer from 1987 to 1988, IBM Corporation (computer and technology)). Oversees 51; Enesco Group, Inc. (producer of giftware and home and garden decor products) from 2001 to 2006 |
The Statement of Additional Information includes additional information about the Trustees of the Funds and is available, without charge, upon request by calling 1-800-345-6611.
33
Fund Governance (continued)
Interested Trustee
| | |
Name, address and year of birth,
Position with funds, Year first
elected or appointed to office | | Principal occupation(s) during past five years, Number of funds in Columbia Funds
Complex overseen by trustee, Other directorships held |
| |
| William F. Truscott (born 1960) | | |
53600 Ameriprise Financial Center Minneapolis, MN 55474 Senior Vice President (since 2010) | | Chairman of the Board and President, Columbia Management Investment Advisers, LLC since May 2010 and February 2012, respectively (previously President, Chairman of the Board and Chief Investment Officer, from 2001 to April 2010); Chief Executive Officer, U.S. Asset Management & President, Annuities, Ameriprise Financial, Inc. since May 2010 (previously President–U.S. Asset Management and Chief Investment Officer from 2005 to April 2010); Director, President and Chief Executive Officer, Ameriprise Certificate Company since 2006; Director and Chief Executive Officer, Columbia Management Investment Distributors, Inc. since May 2010 and February 2012, respectively (previously Chairman of the Board and Chief Executive Officer from 2008 to April 2010); Chairman of the Board and Chief Executive Officer, RiverSource Distributors, Inc. since 2006. Oversees 51; Columbia Funds Board. |
Officers
| | |
| Name, Year of birth and address | | Principal occupation(s) during past five years |
| |
| J. Kevin Connaughton (born 1964) | | |
225 Franklin Street Boston, MA 02110 President (since 2009) | | Senior Vice President and General Manager–Mutual Fund Products, Columbia Management Investment Advisers, LLC since May 2010; President, Columbia Funds, since 2009, and RiverSource Funds, since May 2010 (previously Senior Vice President and Chief Financial Officer, Columbia Funds, from June 2008 to January 2009, Treasurer, Columbia Funds, from October 2003 to May 2008, and senior officer of various other affiliated funds since 2000); Managing Director, Columbia Management Advisors, LLC from December 2004 to April 2010. |
| |
| Michael G. Clarke (born 1969) | | |
225 Franklin Street Boston, MA 02110 Treasurer (since 2011) and Chief Financial Officer
(since 2009) | | Vice President, Columbia Management Investment Advisers, LLC since May 2010; Managing Director of Fund Administration, Columbia Management Advisors, LLC, from September 2004 to April 2010; senior officer of Columbia Funds and affiliated funds since 2002. |
| |
| Scott R. Plummer (born 1959) | | |
5228 Ameriprise Financial Center Minneapolis, MN 55474 Senior Vice President, Secretary and Chief Legal Officer (since 2010) | | Chief Legal Officer and Assistant Secretary, Columbia Management Investment Advisers, LLC since June 2005; Vice President and Lead Chief Counsel–Asset Management, Ameriprise Financial, Inc. since May 2010 (previously Vice President and Chief Counsel–Asset Management, from 2005 to April 2010, Vice President and Chief Counsel–Asset Management, from 2005 to April 2010; Vice President, Chief Counsel and Assistant Secretary, Columbia Management Investment Distributors, Inc. since 2008; Vice President, General Counsel and Secretary, Ameriprise Certificate Company since 2005; Chief Counsel, RiverSource Distributors, Inc. since 2006; Senior officer of Columbia Funds and affiliated funds, since 2006. |
| |
| Thomas P. McGuire (born 1972) | | |
225 Franklin Street Boston, MA 02110 Chief Compliance Officer (since 2012) | | Vice President–Asset Management Compliance, Columbia Management Investment Advisers, LLC since March 2010; Chief Compliance Officer, Ameriprise Certificate Company, since September 2010; Compliance Executive, Bank of America, from June 2005 to April 2010. |
34
Fund Governance (continued)
Officers (continued)
| | |
| Name, Year of birth and address | | Principal occupation(s) during past five years |
| |
| William F. Truscott (born 1960) | | |
53600 Ameriprise Financial Center Minneapolis, MN 55474 Senior Vice President (since 2010) | | Chairman of the Board and President, Columbia Management Investment Advisers, LLC since May 2010 and February 2012, respectively (previously President, Chairman of the Board and Chief Investment Officer, from 2001 to April 2010); Chief Executive Officer, U.S. Asset Management & President, Annuities, Ameriprise Financial, Inc. since May 2010 (previously President–U.S. Asset Management and Chief Investment Officer from 2005 to April 2010); Director, President and Chief Executive Officer, Ameriprise Certificate Company since 2006; Director and Chief Executive Officer, Columbia Management Investment Distributors, Inc. since May 2010 and February 2012, respectively (previously Chairman of the Board and Chief Executive Officer from 2008 to April 2010); Chairman of the Board and Chief Executive Officer, RiverSource Distributors, Inc. since 2006. |
| |
| Paul D. Pearson (born 1956) | | |
10468 Ameriprise Financial Center Minneapolis, MN 55474 Vice President and Assistant Treasurer (since 2011) | | Vice President–Investment Accounting, Columbia Management Investment Advisers, LLC, since May 2010; Vice President–Managed Assets, Investment Accounting, Ameriprise Financial Corporation, 1998-2010. |
| |
| Colin Moore (born 1958) | | |
225 Franklin Street Boston, MA 02110 Senior Vice President (since 2010) | | Director and Chief Investment Officer, Columbia Management Investment Advisers, LLC since May 2010; Manager, Managing Director and Chief Investment Officer of Columbia Management Advisors, LLC from 2007 to April 2010; Head of Equities, Columbia Management Advisors, LLC from 2002 to 2007. |
| |
| Christopher O. Petersen (born 1970) | | |
5228 Ameriprise Financial Center Minneapolis, MN 55474 Vice President and Secretary (since 2011) | | Vice President and Chief Counsel, Ameriprise Financial since January 2010 (formerly Vice President and Group Counsel or Counsel from April 2004 to January 2010); Senior officer of Columbia Funds and affiliated funds, since 2007. |
| |
| Amy K. Johnson (born 1965) | | |
5228 Ameriprise Financial Center Minneapolis, MN 55474 Senior Vice President (since 2010) | | Senior Vice President and Chief Operating Officer, Columbia Management Investment Advisers, LLC since May 2010 (previously Chief Administrative Officer, from 2009 until April 2010, Vice President–Asset Management and Trust Company Services, from 2006 to 2009, and Vice President–Operations and Compliance from 2004 to 2006). |
| |
| Joseph F. DiMaria (born 1968) | | |
225 Franklin Street Boston, MA 02110 Vice President (since 2011) and Chief Accounting Officer (since 2008) | | Vice President, Mutual Fund Administration, Columbia Management Investment Advisers, LLC, since May 2010; Director of Fund Administration, Columbia Management Advisors, LLC from January 2006 to April 2010. |
| |
| Paul B. Goucher (born 1968) | | |
100 Park Avenue New York, NY 10017 Vice President and Assistant Secretary (since 2010) | | Vice President and Chief Counsel of Ameriprise Financial since January 2010 (formerly Vice President and Group Counsel from November 2008 to January 2010); Director, Managing Director and General Counsel of J. & W. Seligman & Co. Incorporated (Seligman) from July 2008 to November 2008 and Managing Director and Associate General Counsel of Seligman from January 2005 to July 2008. |
35
Fund Governance (continued)
Officers (continued)
| | |
| Name, Year of birth and address | | Principal occupation(s) during past five years |
| |
| Michael E. DeFao (born 1968) | | |
225 Franklin Street Boston, MA 02110 Vice President and Assistant Treasurer (since 2011) | | Vice President and Chief Counsel, Ameriprise Financial since May 2010; Associate General Counsel, Bank of America from June 2005 to April 2010. |
| |
| Stephen T. Welsh (born 1957) | | |
225 Franklin Street Boston, MA 02110 Vice President (since 2006) | | President, Columbia Management Investment Services, Corp. since May 2010; President and Director, Columbia Management Services, Inc. from July 2004 to April 2010; Managing Director, Columbia Management Distributors, Inc. from August 2007 to April 2010. |
36
Board Consideration and Approval of Advisory Agreement
On March 7, 2012, the Board of Trustees (the “Board”) and a majority of the Trustees who are not interested persons (as defined in the Investment Company Act of 1940) of the Trust (the “Independent Trustees”) unanimously approved the continuation of the Investment Management Services Agreement (the “Advisory Agreement”) with Columbia Management Investment Advisers, LLC (the “Investment Manager”) with respect to Columbia Pacific/Asia Fund (the “Fund”), a series of the Trust. As detailed below, the Advisory Fees and Expenses Committee (the “Committee”) and the Board met on multiple occasions to review and discuss, both among themselves and with the management team of the Investment Manager, materials provided by the Investment Manager before determining to approve the continuation of the Advisory Agreement.
In connection with their deliberations regarding the continuation of the Advisory Agreement, the Committee and the Board requested and evaluated materials from the Investment Manager regarding the Fund and the Advisory Agreement, and discussed these materials with representatives of the Investment Manager at the Committee meeting held on March 6, 2012 and at the Board meeting held on March 7, 2012. In addition, the Board considers matters bearing on the Agreement at most of its other meetings throughout the year and meets regularly with senior management of the Funds and the Investment Manager. Through the Board’s Investment Oversight Committees, Trustees also meet with selected Fund portfolio managers and other investment personnel at various times throughout the year. The Committee and the Board also consulted with Fund counsel and with the Independent Trustees’ independent legal counsel, who advised on the legal standard for consideration by the Board and otherwise assisted the Board in its deliberations. On March 6, 2012, the Committee recommended that the Board approve the continuation of the Advisory Agreement. On March 7, 2012, the Board, including a majority of the Independent Trustees, voting separately, unanimously approved the continuation of the Advisory Agreement for the Fund.
The Committee and the Board considered all information that they, their legal counsel, or the Investment Manager believed reasonably necessary to evaluate and to determine whether to approve the continuation of the Advisory Agreement. In their deliberations, the Trustees did not identify any particular information that was all-important or controlling, and individual Trustees may have attributed different weights to the various factors. The information and factors considered by the Committee and the Board in recommending for approval or approving the continuation of the Advisory Agreement for the Fund included the following:
| n | | Information on the investment performance of the Fund relative to the performance of the Fund’s benchmarks and the performance of |
| | | a group of comparable mutual funds, as determined by an independent third-party data provider; |
| n | | Information on the Fund’s advisory fees and total expenses, including information comparing the Fund’s expenses to those of a group of comparable mutual funds, as determined by an independent third-party data provider; |
| n | | The Investment Manager’s agreement to contractually limit or cap total operating expenses for the Fund so that total operating expenses (excluding certain fees and expenses, such as transaction costs and certain other investment related expenses, interest, taxes, acquired fund fees and expenses, and extraordinary expenses) would not exceed the median expenses of a group of comparable funds (as determined from time to time, generally annually, by an independent third-party data provider); |
| n | | The terms and conditions of the Advisory Agreement, including that the advisory fee rates payable by the Fund would not change; |
| n | | The terms and conditions of other agreements and arrangements with affiliates of the Investment Manager relating to the operations of the Fund, including the Administrative Services Agreement, the Distribution Agreement and the Transfer and Dividend Disbursing Agent Agreement, noting in the case of the Transfer and Dividend Disbursing Agent Agreement certain proposed changes to the fee rates payable thereunder; |
| n | | Descriptions of various functions performed by the Investment Manager under the Advisory Agreement, including portfolio management and portfolio trading practices; |
| n | | Information regarding the management fees and investment performance of any comparable portfolios of other clients of the Investment Manager, including institutional separate accounts; and |
| n | | The profitability to the Investment Manager and its affiliates from their relationships with the Fund. |
Nature, Extent and Quality of Services to be Provided under the Advisory Agreement
The Committee and the Board considered the nature, extent and quality of services provided to the Fund by the Investment Manager and its affiliates under the Advisory Agreement and under separate agreements for the provision of transfer agency and administrative services, and the resources dedicated to the Fund and the other Columbia Funds by the Investment Manager and its affiliates. The Committee and the Board considered, among other things, the Investment Manager’s ability to attract, motivate and retain highly
37
qualified research, advisory and supervisory investment professionals (including personnel and other resources, compensation programs for personnel involved in fund management, reputation and other attributes), the portfolio management services provided by those investment professionals, the quality of the Investment Manager’s investment research capabilities and trade execution services, and the other resources that the Investment Manager devotes to the Fund. The Committee and the Board also considered the potential benefits to shareholders of investing in a mutual fund that is part of a fund complex offering exposure to a variety of asset classes and investment disciplines and providing a variety of fund and shareholder services.
The Committee and the Board also considered the professional experience and qualifications of the senior personnel of the Investment Manager. The Committee and the Board noted the compliance programs of and the compliance-related resources provided to the Fund by the Investment Manager and its affiliates, and considered the Investment Manager’s ability to provide administrative services to the Fund pursuant to a separate administrative services agreement, including the Investment Manager’s ability to coordinate the activities of the Fund’s other service providers. After reviewing these and related factors, the Committee and the Board concluded, within the context of their overall conclusions, that the expected nature, extent and quality of the services to be provided to the Fund under the Advisory Agreement supported the continuation of such agreement.
Investment Performance
The Committee and the Board reviewed information about the performance of the Fund over various time periods, including performance information relative to benchmarks and information based on reports of an independent third-party data provider that compared the performance of the Fund to the performance of a group of comparable mutual funds. The Committee and the Board also reviewed a description of the third party’s methodology for identifying the Fund’s peer groups for purposes of performance and expense comparisons. In the case of each Fund whose performance lagged that of a relevant peer group for certain (although not necessarily all) periods, the Committee and the Board concluded that other factors relevant to performance were sufficient, in light of other considerations, to warrant continuation of the Fund’s Advisory Agreement. Those factors varied from fund to fund, but included one or more of the following: (i) that the Fund’s performance, although lagging in certain recent periods, was stronger over the longer term; (ii) that the underperformance was attributable, to a significant
extent, to investment decisions that were reasonable and consistent with the Fund’s investment strategy and policies and that the Fund was performing within a reasonable range of expectations, given those investment decisions, market conditions and the Fund’s investment strategy; (iii) that the Fund’s performance was competitive when compared to other relevant performance benchmarks or peer groups; and (iv) that the Investment Manager had taken or was taking steps designed to help improve the Fund’s investment performance, including, but not limited to, replacing portfolio managers, enhancing the resources supporting the portfolio managers, or modifying investment strategies.
The Committee and the Board noted that, through December 31, 2011, the Fund’s performance was in the twenty-fifth, fifty-eighth and forty-sixth percentile (where the best performance would be in the first percentile) of its category selected by an independent third-party data provider for the purposes of performance comparisons for the one-, three- and five- year periods, respectively.
The Committee and the Board also considered the Investment Manager’s performance and reputation generally, the Investment Manager’s historical responsiveness to Board concerns about performance and the Investment Manager’s willingness to take steps intended to improve performance. After reviewing these and related factors, the Committee and the Board concluded, within the context of their overall conclusions regarding the Advisory Agreement, that the performance of the Fund and the Investment Manager was sufficient, in light of other considerations, to warrant the continuation of the Advisory Agreement.
Investment Advisory Fee Rates and Other Expenses
The Committee and the Board considered the advisory fees to be charged to the Fund under the Advisory Agreement as well as the total expenses to be incurred by the Fund. In assessing the reasonableness of the fees under the Advisory Agreement, the Committee and the Board considered, among other information, the Fund’s advisory fee and its expected total expense ratio as a percentage of average daily net assets. The Committee and the Board noted that the Fund’s actual management fee and total net expense ratio are both ranked in the fourth quintiles against the Fund’s expense universe as determined by an independent third-party data provider for purposes of expense comparison. The Committee and the Board also took into account the fee waiver and expense limitation arrangements agreed to by the Investment Manager, as noted above.
38
The Committee and the Board also considered the fact that the advisory fee rates payable by the Fund to the Investment Manager under the Advisory Agreement were the same as those currently paid by the Fund to the Investment Manager.
The Committee and the Board also received and considered information about the advisory fees charged by the Investment Manager to institutional separate accounts. In considering the fees charged to those accounts, the Committee and the Board took into account, among other things, the Investment Manager’s representations about the differences between managing mutual funds as compared to other types of accounts, including differences in the services provided, differences in the risk profile of such business for the Investment Manager and the additional resources required to manage mutual funds effectively. In evaluating the Fund’s advisory fees, the Committee and the Board also took into account the demands, complexity and quality of the investment management of the Fund.
After reviewing these and related factors, the Committee and the Board concluded, within the context of their overall conclusions, that the advisory fee rates and expenses of the Fund supported the continuation of the Advisory Agreement.
Costs of Services to be Provided and Profitability
The Committee and the Board also took note of the costs of the services provided (both on an absolute and relative basis) and the profitability to the Investment Manager and its affiliates in connection with their relationships with the Fund. In evaluating these considerations, the Committee and the Board took note of the advisory fees charged by the Investment Manager to other clients, including fees charged by the Investment Manager to any institutional separate account clients with similar investment strategies to those of the Fund.
The Committee and the Board also considered the compensation directly or indirectly received by the Investment Manager’s affiliates in connection with their relationships with the Fund. The Committee and the Board reviewed information provided by management as to the profitability of the Investment Manager and its affiliates of their relationships with the Fund, and information about the allocation of expenses used to calculate profitability. When reviewing profitability, the Committee and the Board also considered court cases in which adviser profitability was an issue in whole or in part, the performance of the fund, the expense ratio of the fund, and the implementation of expense limitations with respect to the fund. The
Committee and the Board also considered information provided by the Investment Manager regarding its financial condition and comparing its profitability to that of other asset management firms that are, or are subsidiaries of, publicly traded companies.
After reviewing these and related factors, the Committee and the Board concluded, within the context of their overall conclusions, that the profitability to the Investment Manager and its affiliates from their relationships with the Fund supported the continuation of the Advisory Agreement.
Economies of Scale
The Committee and the Board considered the potential existence of economies of scale in the provision by the Investment Manager of services to the Fund, to groups of related funds, and to the Investment Manager’s investment advisory clients as a whole, and whether those economies of scale were shared with the Fund through breakpoints in investment advisory fees or other means, such as expense limitation arrangements and additional investments by the Investment Manager in investment, trading and compliance resources. The Committee and the Board noted that the investment advisory fee schedules for the Fund contained breakpoints that would reduce the fee rate on assets above specified threshold levels.
In considering these issues, the Committee and the Board also considered the costs of the services provided (both on an absolute and relative basis) and the profitability to the Investment Manager and its affiliates from their relationships with the Fund, as discussed above. After reviewing these and related factors, the Committee and the Board concluded, within the context of their overall conclusions, that the extent to which economies of scale were expected to be shared with the Fund supported the continuation of the Advisory Agreement.
Other Benefits to the Investment Manager
The Committee and the Board received and considered information regarding “fall-out” or ancillary benefits received by the Investment Manager and its affiliates as a result of their relationships with the Fund, such as the engagement of the Investment Manager to provide administrative services to the Fund and the engagement of the Investment Manager’s affiliates to provide distribution and transfer agency services to the Fund. The Committee and the Board considered that the Fund’s distributor retains a portion of the distribution fees from the Fund and receives a portion of the sales charges on sales or redemptions of certain classes of shares of the Fund. The Committee and the Board also considered the benefits of research made available to the Investment Manager by reason of
39
brokerage commissions generated by the Fund’s securities transactions, and reviewed information about the Investment Manager’s practices with respect to allocating portfolio brokerage for brokerage and research services. The Committee and the Board considered the possible conflicts of interest associated with certain fall-out or other ancillary benefits and the reporting, disclosure and other processes that would be in place to address such possible conflicts of interest. The Committee and the Board recognized that the Investment Manager’s profitability would be somewhat lower without these benefits.
Conclusion
The Committee and the Board reviewed all of the above considerations in reaching their decisions to recommend or approve the continuation of the Advisory Agreement. No single item was identified as paramount or controlling, and individual Trustees may have attributed different weights to various factors. Based on their evaluation of all factors that they deemed to be material, including those factors described above, and assisted by the advice of independent legal counsel, the Board, including a majority of the Independent Trustees, voting separately, unanimously approved the continuation of the Advisory Agreement.
40
Important Information About This Report
The fund mails one shareholder report to each shareholder address. If you would like more than one report, please call shareholder services at 1-800-345-6611 and additional reports will be sent to you. This report has been prepared for shareholders of Columbia Pacific/Asia Fund.
A description of the policies and procedures that the fund uses to determine how to vote proxies and a copy of the fund’s voting records are available (i) at www.columbiamanagement.com, (ii) on the Securities and Exchange Commission’s website at www.sec.gov, and (iii) without charge, upon request, by calling 1-800-368-0346. Information regarding how the fund voted proxies relating to portfolio securities during the 12-month period ended June 30 is available from the SEC’s website. Information regarding how the fund voted proxies relating to portfolio securities is also available from the fund’s website, www.columbiamanagement.com.
The fund files a complete schedule of portfolio holdings with the SEC for the first and third quarters of each fiscal year on Form N-Q. The fund’s Form N-Q is available on the SEC’s website at www.sec.gov and may be reviewed and copied at the SEC’s Public Reference Room in Washington, D.C. Information on the operation of the Public Reference Room may be obtained by calling
1-800-SEC-0330.
Transfer Agent
Columbia Management Investment Services Corp.
P.O. Box 8081
Boston, MA 02266-8081
1-800-345-6611
Distributor
Columbia Management Investment
Distributors, Inc.
225 Franklin Street Boston, MA 02110
Investment Manager
Columbia Management Investment Advisers, LLC
225 Franklin Street Boston, MA 02110
41

Columbia Pacific/Asia Fund
P.O. Box 8081
Boston, MA 02266-8081
columbiamanagement.com
This information is for use with concurrent or prior delivery of a fund prospectus. Investors should consider the investment objectives, risks, charges and expenses of a mutual fund carefully before investing. For a free prospectus, which contains this and other important information about the funds, visit columbiamanagement.com. Read the prospectus carefully before investing. The Fund is distributed by Columbia Management Investment Distributors, Inc., member FINRA, and managed by Columbia Management Investment Advisers, LLC.
©2012 Columbia Management Investment Advisers, LLC. All rights reserved.
C-1156 C (5/12)

Columbia Select Large Cap Growth Fund
Annual Report for the Period Ended March 31, 2012
Table of contents
The views expressed in this report reflect the current views of the respective parties. These views are not guarantees of future performance and involve certain risks, uncertainties and assumptions that are difficult to predict, so actual outcomes and results may differ significantly from the views expressed. These views are subject to change at any time based upon economic, market or other conditions and the respective parties disclaim any responsibility to update such views. These views may not be relied on as investment advice and, because investment decisions for a Columbia Fund are based on numerous factors, may not be relied on as an indication of trading intent on behalf of any particular Columbia Fund. References to specific securities should not be construed as a recommendation or investment advice.
President’s Message

Dear Shareholders,
A stock market rally that commenced in the fourth quarter of 2011 continued into 2012 in the United States and around the world, as all major market regions generated double-digit returns for the three-month period ended March 31, 2012. Volatility declined sharply as European debt fears quieted somewhat and sentiment improved. Returns in developed countries were buoyed by strong results in Germany, Belgium, Austria and the Nordic markets of Denmark, Finland, Norway and Sweden. Under the cloud of its own mounting debt problem, Spain was the only eurozone country to deliver a negative return during the three-month period. Solid economic growth and accommodative monetary policy helped boost gains in emerging markets. The rally in U.S. equities was largely driven by an expansion in “multiples”— an increase in
stock prices relative to their earnings. By the end of the first quarter of 2012, stocks no longer appeared as cheap as they were late in 2011. Bonds lagged stocks during the first quarter as investors responded to signs of an improved environment with a greater appetite for risk.
Concerns around the health of the global economy were centered in news headlines focusing on Washington D.C., Europe, China and the Middle East. In the United States, economic indicators remained mixed but generally indicated support for slow, sustainable economic growth. European policymakers have made progress in containing the eurozone debt crisis, though they still have not solved the issue of long-term solvency. The European Central Bank has lowered interest rates and flooded the financial system with liquidity that may provide breathing space for companies to restructure their balance sheets. These massive infusions of liquidity may whet the appetite for risk from investors around the world. However, it has delayed a true reckoning with the European financial situation, as concerns about Spain and Portugal continue to cloud the outlook. These structural challenges that persist in the developed world, and slowing growth in emerging market economies, leave the global economy in a fragile state. Domestic demand, combined with slowing inflationary trends, has also helped to shore up emerging market economies. Joblessness remains low and monetary conditions remain easy.
Despite the challenges and surprises of 2011, we see pockets of strength — and as a result, attractive opportunities — both here and abroad for 2012. We hope to help you capitalize on these opportunities with various articles in our 2012 Perspectives, which is available via the Market Insights tab at columbiamanagement.com. This publication showcases the strong research capabilities and experienced investment teams of Columbia Management and offers a diverse array of investment ideas based on our five key themes for 2012.
Other information and resources available at columbiamanagement.com include:
| n | | detailed up-to-date fund performance and portfolio information |
| n | | economic analysis and market commentary |
| n | | quarterly fund commentaries |
| n | | Columbia Management Investor, our award-winning quarterly newsletter for shareholders |
Thank you for your continued support of the Columbia Funds. We look forward to serving your investment needs for many years to come.
Best Regards,

J. Kevin Connaughton
President, Columbia Funds
Investors should consider the investment objectives, risks, charges and expenses of a mutual fund carefully before investing. For a free prospectus, which contains this and other important information about the funds, visit columbiamanagement.com. The prospectus should be read carefully before investing.
Columbia Funds are distributed by Columbia Management Investment Distributors, Inc., member FINRA, and managed by Columbia Management Investment Advisers, LLC.
© 2012 Columbia Management Investment Advisers, LLC. All rights reserved.
Fund Profile – Columbia Select Large Cap Growth Fund
Summary
| n | | For the 12-month period that ended March 31, 2012, the fund’s Class A shares returned 6.39% without sales charge. |
| n | | The fund’s return was less than the 11.02% return of its benchmark, the Russell 1000 Growth Index.1 |
| n | | Stock selection was the primary reason for the fund’s underperformance relative to the index, with the biggest disappointments coming from the information technology sector. |
Portfolio Management
Thomas M. Galvin, lead manager, has managed or co-managed the fund since 2008. From 2003 until joining Columbia Management Investment Advisers, LLC (the Investment Manager) in May 2010, Mr. Galvin was associated with the fund’s previous investment adviser or its predecessor as an investment professional.
Richard A. Carter has co-managed the fund since 2009. From 2003 until joining the Investment Manager in May 2010, Mr. Carter was associated with the fund’s previous investment adviser or its predecessor as an investment professional.
Todd D. Herget has co-managed the fund since 2009. From 1998 until joining the Investment Manager in May 2010, Mr. Herget was associated with the fund’s previous investment adviser or its predecessor as an investment professional.
| 1 | The Russell 1000 Growth Index measures the performance of those Russell 1000 Index companies with higher price-to-book ratios and higher forecasted growth values. |
Indices are not available for investment, are not professionally managed and do not reflect sales charges, fees, brokerage commissions, taxes or other expenses of investing. Securities in the fund may not match those in an index.
Performance data quoted represents past performance and current performance may be lower or higher. Past performance is no guarantee of future results. The investment return and principal value will fluctuate so that shares, when redeemed, may be worth more or less than the original cost. Please visit www.columbiamanagement.com for daily and most recent month-end performance updates.
Summary
1-year return as of 03/31/12
| | |
| |
 | | + 6.39% Class A Shares
(without sales charge) |
| |
| | + 11.02% Russell 1000 Growth Index |
|
Morningstar Style Box™ |
|
Equity Style |

|
The Morningstar Style Box™ is based on the fund’s portfolio holdings. For equity funds, the vertical axis shows the market capitalization of the stocks owned, and the horizontal axis shows investment style (value, blend, or growth). Information shown is based on the most recent data provided by Morningstar.
© 2012 Morningstar, Inc. All rights reserved. The Morningstar information contained herein: (1) is proprietary to Morningstar and/or its content providers; (2) may not be copied or distributed; and (3) is not warranted to be accurate, complete or timely. Neither Morningstar nor its content providers are responsible for any damages or losses arising from any use of this information.
1
Performance Information – Columbia Select Large Cap Growth Fund
Performance data quoted represents past performance and current performance may be lower or higher. Past performance is no guarantee of future results. The investment return and principal value will fluctuate so that shares, when redeemed, may be worth more or less than the original cost. Please visit www.columbiamanagement.com for daily and most recent month-end performance updates.
|
| Performance of a $10,000 investment 04/01/02 – 03/31/12 |
The chart above shows the change in value of a hypothetical $10,000 investment in Class A shares of Columbia Select Large Cap Growth Fund during the stated time period, and does not reflect the deduction of taxes that a shareholder may pay on fund distributions or on the redemption of fund shares.
| | | | | | | | |
| Performance of a $10,000 investment 04/01/02 – 03/31/12 ($) | |
| | |
| Sales charge | | without | | | with | |
Class A* | | | 16,199 | | | | 15,266 | |
Class C* | | | 15,030 | | | | 15,030 | |
Class I* | | | 16,639 | | | | n/a | |
Class R* | | | 15,740 | | | | n/a | |
Class W* | | | 16,165 | | | | n/a | |
Class Z | | | 16,594 | | | | n/a | |
| | | | | | | | | | | | | | | | | | | | | | | | | | | | | | | | |
| Average annual total return as of 03/31/12 (%) | |
| | | | | | |
| Share class | | A* | | | C* | | | I* | | | R* | | | W* | | | Z | |
| Inception | | 09/28/07 | | | 09/28/07 | | | 09/27/10 | | | 12/31/04 | | | 09/27/10 | | | 10/01/97 | |
| Sales charge | | without | | | with | | | without | | | with | | | without | | | without | | | without | | | without | |
1-year | | | 6.39 | | | | 0.29 | | | | 5.57 | | | | 4.57 | | | | 6.85 | | | | 6.11 | | | | 6.39 | | | | 6.64 | |
5-year | | | 6.44 | | | | 5.18 | | | | 5.65 | | | | 5.65 | | | | 6.75 | | | | 6.16 | | | | 6.41 | | | | 6.69 | |
10-year | | | 4.94 | | | | 4.32 | | | | 4.16 | | | | 4.16 | | | | 5.22 | | | | 4.64 | | | | 4.92 | | | | 5.19 | |
The “with sales charge” returns include the maximum initial sales charge of 5.75% for Class A shares and the applicable contingent deferred sales charge of 1.00% for Class C shares for the first year only. The “without sales charge” returns do not include the effect of sales charges. If they had, returns would be lower.
Performance results reflect any fee waivers or reimbursements of fund expenses by Columbia Management Investment Advisers, LLC and/or any of its affiliates. Absent these fee waivers or expense reimbursement arrangements, performance results would have been lower.
All results shown assume reinvestment of distributions. Class I and Class Z shares are sold at net asset value with no distribution and service (Rule 12b-1) fees. Class R shares are sold at net asset value with a distribution (Rule 12b-1) fee. Class W shares are sold at net asset value with a distribution and service (Rule 12b-1) fee. Class I, Class R, Class W and Class Z shares have limited eligibility and the investment minimum requirements may vary. Please see the fund’s prospectuses for details. Performance for different share classes will vary based on differences in sales charges and fees associated with each class.
The tables do not reflect the deduction of taxes that a shareholder may pay on fund distributions or on the redemption of fund shares.
| * | The returns shown for periods prior to the share class inception date (including returns since inception, which are since fund inception) include the returns of the fund’s oldest share class. These returns are adjusted to reflect any higher class-related operating expenses of the newer share classes, as applicable. Please visit columbiamanagement.com/mutual-funds/appended-performance for more information. |
2
Fund Expense Example – Columbia Select Large Cap Growth Fund
As an investor, you incur two types of costs. There are transaction costs, which generally include sales charges on purchases and may include redemption fees. There are also ongoing costs, which generally include management fees, distribution and service (Rule 12b-1) fees, and other fund expenses. The following information is intended to help you understand your ongoing costs (in dollars) of investing in the Fund and to help you compare these costs with the ongoing costs of investing in other mutual funds.
Analyzing your fund’s expenses
To illustrate these ongoing costs, we have provided examples and calculated the expenses paid by investors in each share class of the Fund during the period. The actual and hypothetical information in the table is based on an initial investment of $1,000 at the beginning of the period indicated and held for the entire period. Expense information is calculated two ways and each method provides you with different information. The amount listed in the “Actual” column is calculated using the Fund’s actual operating expenses and total return for the period. You may use the Actual information, together with the amount invested, to estimate the expenses that you paid over the period. Simply divide your account value by $1,000 (for example, an $8,600 account value divided by $1,000 = 8.6), then multiply the results by the expenses paid during the period under the Actual column. The amount listed in the “Hypothetical” column assumes a 5% annual rate of return before expenses (which is not the Fund’s actual return) and then applies the Fund’s actual expense ratio for the period to the hypothetical return. You should not use the hypothetical account values and expenses to estimate either your actual account balance at the end of the period or the expenses you paid during the period. See “Compare with other funds” below for details on how to use the hypothetical data.
Compare with other funds
Since all mutual funds are required to include the same hypothetical calculations about expenses in shareholder reports, you can use this information to compare the ongoing cost of investing in the Fund with other funds. To do so, compare the hypothetical example with the 5% hypothetical examples that appear in the shareholder reports of other funds. As you compare hypothetical examples of other funds, it is important to note that hypothetical examples are meant to highlight the ongoing costs of investing in a fund only and do not reflect any transaction costs, such as sales charges, or redemption or exchange fees. Therefore, the hypothetical calculations are useful in comparing ongoing costs only, and will not help you determine the relative total costs of owning different funds. If transaction costs were included in these calculations, your costs would be higher.
| | | | | | | | | | | | | | | | | | | | | | | | | | | | |
| 10/01/11 – 03/31/12 | | | | | | | |
| | | | |
| | | Account value at the
beginning of the period ($) | | | Account value at the
end of the period ($) | | | Expenses paid
during the period ($) | | | Fund’s annualized
expense ratio (%) | |
| | | Actual | | | Hypothetical | | | Actual | | | Hypothetical | | | Actual | | | Hypothetical | | | Actual | |
Class A | | | 1,000.00 | | | | 1,000.00 | | | | 1,269.30 | | | | 1,019.44 | | | | 6.15 | | | | 5.47 | | | | 1.09 | |
Class C | | | 1,000.00 | | | | 1,000.00 | | | | 1,264.90 | | | | 1,015.61 | | | | 10.47 | | | | 9.32 | | | | 1.86 | |
Class I | | | 1,000.00 | | | | 1,000.00 | | | | 1,271.50 | | | | 1,021.58 | | | | 3.73 | | | | 3.32 | | | | 0.66 | |
Class R | | | 1,000.00 | | | | 1,000.00 | | | | 1,267.80 | | | | 1,018.20 | | | | 7.56 | | | | 6.72 | | | | 1.34 | |
Class W | | | 1,000.00 | | | | 1,000.00 | | | | 1,269.30 | | | | 1,019.44 | | | | 6.15 | | | | 5.47 | | | | 1.09 | |
Class Z | | | 1,000.00 | | | | 1,000.00 | | | | 1,271.40 | | | | 1,020.69 | | | | 4.74 | | | | 4.22 | | | | 0.84 | |
Expenses paid during the period are equal to the annualized expense ratio for each class as indicated above, multiplied by the average account value over the period and then multiplied by the number of days in the Fund’s most recent fiscal half year and divided by 366.
Expenses do not include fees and expenses incurred indirectly by the Fund from the underlying funds in which the Fund may invest (also referred to as “acquired funds”), including affiliated and non-affiliated pooled investments vehicles (including mutual funds and exchange traded funds).
3
Portfolio Managers’ Report – Columbia Select Large Cap Growth Fund
Performance data quoted represents past performance and current performance may be lower or higher. Past performance is no guarantee of future results. The investment return and principal value will fluctuate so that shares, when redeemed, may be worth more or less than the original cost. Please visit www.columbiamanagement.com for daily and most recent month-end performance updates.
| | | | |
| Net asset value per share | |
| |
as of 03/31/12 ($) | | | | |
Class A | | | 14.28 | |
Class C | | | 13.80 | |
Class I | | | 14.47 | |
Class R | | | 13.87 | |
Class W | | | 14.28 | |
Class Z | | | 14.43 | |
| | | | |
| Distributions declared per share | |
| |
04/01/11 – 03/31/12 | | | | |
Class A | | | 0.21 | |
Class C | | | 0.21 | |
Class I | | | 0.21 | |
Class R | | | 0.21 | |
Class W | | | 0.21 | |
Class Z | | | 0.21 | |
For the 12-month period that ended March 31, 2012, the fund’s Class A shares returned 6.39% without sales charge. The fund underperformed its benchmark, the Russell 1000 Growth Index, which returned 11.02%. Stock selection was the primary reason for the shortfall relative to the index, with the biggest disappointments coming from the information technology sector.
An improving economy supports equity returns
During the first half of the 12-month period, a series of natural disasters in Japan, Europe’s debt problems and wrangling in Washington over the federal budget and the national debt dominated world headlines. U.S. economic news was lackluster and job growth was disappointing. However, the pace of growth picked up in the second half of the period and prospects brightened as fears of a lapse back into recession faded. Consumer confidence improved as the labor market added more than a million new jobs between October 2011 and March 2012, while the jobless rate fell to 8.2%. Household net worth also picked up as the equity markets rebounded. Headline inflation — which tracks a broad range of consumer expenditures, including food and energy — moved marginally higher. Despite a modest slowdown in manufacturing activity late in the summer of 2011, manufacturing activity stabilized and expanded into 2012. Housing continues to be the one nagging weak spot in the economy. Yet, there is hope that a bottom in the housing market is in sight.
Stock selection yields mixed results
The portfolio benefited early in the 12-month period as investors leaned toward high quality, high growth companies. However, overall growth stock returns were dampened during the summer of 2011 as the market began to focus on an uncertain economic landscape. In this environment, the stock multiples (the ratio of share prices to earnings) of many high growth firms were compressed as investors shifted to the stability and safety of mature, yield-oriented companies. In the second half of the period investor sentiment turned back to growth companies, but the boost was not enough to offset the 2011 summer selloff.
In this environment, our stock selection in the energy, consumer discretionary and health care sectors aided relative returns. In energy, we avoided many underperforming energy equipment and service companies, while a stake in offshore production technology provider FMC Technologies (2.9% of net assets) was also beneficial. The fund’s consumer discretionary holdings aided performance. Notable outperformers included lululemon athletica (3.9% of net assets), a specialty retailer that specializes in yoga-inspired clothing, and restaurant chain Chipotle Mexican Grill (2.3% of net assets). A number of health care holdings also performed strongly, including Biogen Idec, a leader in multiple sclerosis treatments; Celgene, which develops cancer treatments and Allergan, the maker of Botox and obesity devices (3.3%, 2.7% and 2.6% of net assets, respectively). Alexion Pharmaceuticals (2.2% of net assets) surged in price as it raised revenue guidance and gained FDA approval for Soliris, a drug that treats atypical hemolytic uremic syndrome, a genetic disease that damages vital organs.
In the consumer staples sector, Green Mountain Coffee Roasters (3.4% of net assets) detracted from returns. Despite revenue growth in excess of 90%, the stock was hurt as it missed consensus sales projections and on concerns about corporate governance. We added to the fund’s position on price weakness as we believe the company is well managed and will continue to capture market share while also benefiting from its Dunkin’ Donuts and Starbucks K-Cup
4
Portfolio Managers’ Report (continued) – Columbia Select Large Cap Growth Fund
partnerships. Meanwhile, biotechnology firm Dendreon was a significant detractor. We sold Dendreon as shares sold off sharply following the announcement of lower than anticipated demand for its advanced prostate cancer treatment Provenge.
Information technology stocks disappoint
The majority of the fund’s underperformance stemmed from positions in the information technology sector. Notable detractors included Internet protocol network solution provider Acme Packet and network infrastructure hardware maker Juniper Networks (3.1% of net assets). Juniper has a strong product pipeline, but the firm reported earnings and revenue below expectations. Acme Packet was sold from the portfolio.
Looking ahead
We believe that high quality, high growth companies should continue to benefit in this period of the economic cycle. Improvement in many economic metrics indicates that we are still in recovery mode, and much of the developed and emerging world’s central banks are remaining extremely accommodative or in an easing cycle, which could help carry the positive momentum further. Yet even with these positives, investors continue to look out for macro-related risks and seek relative safety in the fixed-income markets. The market has constantly focused on concerns ranging from credit defaults in the municipal markets, the tragedy in Japan, Asian growth slowdown, financial distress in Europe and now tensions in Iran and the higher prices of oil, all while the fund’s high growth companies continue to deliver products and services that are in demand regardless of these headwinds. Broadly speaking, we feel that that the S&P 500 Index’s impressive earnings growth of roughly 16% for the last two years will begin to slow down, which should allow the market to reward companies that are able to maintain high levels of organic sales and earnings growth. We believe we have invested the portfolio with a mix of established and emerging growth stocks that also have the benefit of more diverse earnings geographies and time frames, which help diversify the strategy in various market environments. While the broad market may not be as attractive after the first quarter 2012 rally, we believe that on a stock by stock basis there is the potential for more upside from here for some stocks.
Portfolio characteristics and holdings are subject to change periodically and may not be representative of current holdings and characteristics. The outlook for the fund may differ from that presented for other Columbia Funds.
Equity securities are affected by stock market fluctuations that occur in response to economic and business developments.
Investing in growth stocks incurs the possibility of losses because their prices are sensitive to changes in current or expected earnings.
| | | | |
| Portfolio Breakdown(1) | | | |
| |
as of 03/31/12 (%) | | | | |
Common Stocks | | | | |
Consumer Discretionary | | | 27.1 | |
Consumer Staples | | | 6.4 | |
Energy | | | 5.7 | |
Financials | | | 6.0 | |
Health Care | | | 17.3 | |
Industrials | | | 5.1 | |
Information Technology | | | 32.2 | |
Other(2) | | | 0.2 | |
| | 1 | Percentages indicated are based upon total investments (excluding Investments of Cash Collateral Received for Securities on Loan). The Fund’s composition is subject to change. |
| | 2 | Includes investments in affiliated money market fund. |
| | | | |
| Top Ten Holdings (1) | | | |
| |
as of 03/31/12 (%) | | | | |
Salesforce.com, Inc. | | | 4.7 | |
Baidu, Inc., ADR | | | 4.7 | |
priceline.com, Inc. | | | 4.6 | |
Cognizant Technology Solutions Corp., Class A | | | 4.2 | |
lululemon athletica, Inc. | | | 3.9 | |
Las Vegas Sands Corp. | | | 3.9 | |
Franklin Resources, Inc. | | | 3.9 | |
Michael Kors Holdings Ltd. | | | 3.9 | |
Amazon.com, Inc. | | | 3.7 | |
EMC Corp. | | | 3.7 | |
| | 1 | Percentages indicated are based upon total investments (excluding Investments of Cash Collateral Received for Securities on Loan and affiliated money market fund). |
Because the fund is actively managed, there is no guarantee the fund will continue to maintain the holdings breakdown listed.
The fund’s holdings and their weights within the portfolio may change as market conditions change.
5
Portfolio of Investments – Columbia Select Large Cap Growth Fund
March 31, 2012
(Percentages represent value of investments compared to net assets)
| | | | | | | | |
| Issuer | | Shares | | | Value | |
Common Stocks 99.2% | |
CONSUMER DISCRETIONARY 26.9% | |
Hotels, Restaurants & Leisure 9.1% | |
Chipotle Mexican Grill, Inc.(a) | | | 369,300 | | | | $154,367,400 | |
Las Vegas Sands Corp. | | | 4,601,900 | | | | 264,931,383 | |
Yum! Brands, Inc. | | | 2,832,190 | | | | 201,595,284 | |
| | | | | | | | |
Total | | | | | | | 620,894,067 | |
Internet & Catalog Retail 8.2% | | | | | | | | |
Amazon.com, Inc.(a)(b) | | | 1,245,555 | | | | 252,237,343 | |
priceline.com, Inc.(a)(b) | | | 431,153 | | | | 309,352,278 | |
| | | | | | | | |
Total | | | | | | | 561,589,621 | |
Textiles, Apparel & Luxury Goods 9.6% | | | | | | | | |
Fossil, Inc.(a) | | | 983,906 | | | | 129,855,914 | |
lululemon athletica, Inc.(a) | | | 3,559,891 | | | | 265,852,660 | |
Michael Kors Holdings Ltd.(a) | | | 5,611,070 | | | | 261,419,751 | |
| | | | | | | | |
Total | | | | | | | 657,128,325 | |
TOTAL CONSUMER DISCRETIONARY | | | | | | | 1,839,612,013 | |
CONSUMER STAPLES 6.4% | | | | | | | | |
Food Products 3.4% | | | | | | | | |
Green Mountain Coffee Roasters, Inc.(a) | | | 4,896,650 | | | | 229,359,086 | |
Personal Products 3.0% | | | | | | | | |
Estee Lauder Companies, Inc. (The), Class A | | | 3,327,050 | | | | 206,077,477 | |
TOTAL CONSUMER STAPLES | | | | | | | 435,436,563 | |
ENERGY 5.7% | | | | | | | | |
Energy Equipment & Services 2.9% | | | | | | | | |
FMC Technologies, Inc.(a) | | | 3,904,517 | | | | 196,865,747 | |
Oil, Gas & Consumable Fuels 2.8% | | | | | | | | |
EOG Resources, Inc. | | | 1,732,897 | | | | 192,524,857 | |
TOTAL ENERGY | | | | | | | 389,390,604 | |
FINANCIALS 5.9% | | | | | | | | |
Capital Markets 3.9% | | | | | | | | |
Franklin Resources, Inc. | | | 2,128,430 | | | | 263,989,173 | |
Diversified Financial Services 2.0% | | | | | | | | |
IntercontinentalExchange, Inc.(a) | | | 1,018,820 | | | | 140,006,244 | |
TOTAL FINANCIALS | | | | | | | 403,995,417 | |
HEALTH CARE 17.2% | | | | | | | | |
Biotechnology 8.2% | | | | | | | | |
Alexion Pharmaceuticals, Inc.(a) | | | 1,643,640 | | | | 152,628,410 | |
Biogen Idec, Inc.(a) | | | 1,799,900 | | | | 226,733,403 | |
Celgene Corp.(a) | | | 2,339,655 | | | | 181,370,056 | |
| | | | | | | | |
Total | | | | | | | 560,731,869 | |
Health Care Providers & Services 2.9% | | | | | | | | |
McKesson Corp. | | | 2,216,060 | | | | 194,503,586 | |
Pharmaceuticals 6.1% | | | | | | | | |
Allergan, Inc. | | | 1,890,806 | | | | 180,439,616 | |
Novo Nordisk A/S, ADR | | | 1,713,387 | | | | 237,663,911 | |
| | | | | | | | |
Total | | | | | | | 418,103,527 | |
TOTAL HEALTH CARE | | | | | | | 1,173,338,982 | |
INDUSTRIALS 5.0% | | | | | | | | |
Aerospace & Defense 2.7% | | | | | | | | |
Precision Castparts Corp. | | | 1,085,270 | | | | 187,643,183 | |
| | | | | | | | |
| Issuer | | Shares | | | Value | |
Common Stocks (continued) | |
INDUSTRIALS (cont.) | | | | | | | | |
Air Freight & Logistics 2.3% | | | | | | | | |
Expeditors International of Washington, Inc. | | | 3,368,302 | | | | $156,659,726 | |
TOTAL INDUSTRIALS | | | | | | | 344,302,909 | |
INFORMATION TECHNOLOGY 32.1% | | | | | | | | |
Communications Equipment 8.7% | | | | | | | | |
F5 Networks, Inc.(a) | | | 1,277,339 | | | | 172,389,672 | |
Juniper Networks, Inc.(a)(b) | | | 9,254,080 | | | | 211,733,350 | |
QUALCOMM, Inc. | | | 3,093,190 | | | | 210,398,784 | |
| | | | | | | | |
Total | | | | | | | 594,521,806 | |
Computers & Peripherals 3.7% | | | | | | | | |
EMC Corp.(a) | | | 8,428,440 | | | | 251,841,787 | |
Internet Software & Services 8.1% | | | | | | | | |
Baidu, Inc., ADR(a) | | | 2,186,087 | | | | 318,665,902 | |
Google, Inc., Class A(a) | | | 363,349 | | | | 232,993,913 | |
| | | | | | | | |
Total | | | | | | | 551,659,815 | |
IT Services 6.9% | | | | | | | | |
Cognizant Technology Solutions Corp., Class A(a) | | | 3,688,736 | | | | 283,848,235 | |
Visa, Inc., Class A | | | 1,629,300 | | | | 192,257,400 | |
| | | | | | | | |
Total | | | | | | | 476,105,635 | |
Software 4.7% | |
Salesforce.com, Inc.(a) | | | 2,066,120 | | | | 319,236,201 | |
TOTAL INFORMATION TECHNOLOGY | | | | | | | 2,193,365,244 | |
Total Common Stocks | | | | | | | | |
(Cost: $5,049,703,060) | | | | | | | $6,779,441,732 | |
| | | | | | | | |
Money Market Funds 0.2% | |
Columbia Short-Term Cash Fund, | | | | | | | | |
0.161%(c)(d) | | | 10,320,898 | | | | $10,320,898 | |
Total Money Market Funds | | | | | | | | |
(Cost: $10,320,898) | | | | | | | $10,320,898 | |
| | | | | | | | | | | | |
| | | |
| Issuer | | Effective
Yield | | | Principal | | | | |
Investments of Cash Collateral Received for Securities on Loan 0.6% | |
Asset-Backed Commercial Paper 0.1% | |
Atlantis One | |
04/11/12 | | | 0.511 | % | | | $4,993,554 | | | | $4,993,554 | |
Kells Funding LLC | |
04/13/12 | | | 0.581 | % | | | 1,997,004 | | | | 1,997,004 | |
06/04/12 | | | 0.501 | % | | | 1,997,361 | | | | 1,997,361 | |
| | | | | | | | | | | | |
Total | | | | | | | | | | | 8,987,919 | |
Certificates of Deposit 0.3% | |
Australia and New Zealand Bank Group, Ltd. | |
05/16/12 | | | 0.470 | % | | | 4,000,000 | | | | 4,000,000 | |
Bank of Nova Scotia | |
07/26/12 | | | 0.321 | % | | | 2,000,000 | | | | 2,000,000 | |
Barclays Bank PLC | |
04/18/12 | | | 0.600 | % | | | 4,000,000 | | | | 4,000,000 | |
The Accompanying Notes to Financial Statements are an integral part of this statement.
6
Columbia Select Large Cap Growth Fund
March 31, 2012
(Percentages represent value of investments compared to net assets)
| | | | | | | | | | | | |
| Issuer | | Effective
Yield | | | Principal | | | Value | |
Investments of Cash Collateral Received for Securities on Loan (continued) | |
Certificates of Deposit (cont.) | |
Hong Kong Shanghai Bank Corp., Ltd. | |
04/16/12 | | | 0.250 | % | | | $2,000,000 | | | | $2,000,000 | |
Mitsubishi UFJ Trust and Banking Corp. | |
05/31/12 | | | 0.390 | % | | | 3,000,038 | | | | 3,000,038 | |
Union Bank of Switzerland | |
04/17/12 | | | 0.580 | % | | | 5,000,000 | | | | 5,000,000 | |
Westpac Banking Corp. | |
04/02/12 | | | 0.250 | % | | | 3,000,000 | | | | 3,000,000 | |
| | | | | | | | | | | | |
Total | | | | | | | | | | | 23,000,038 | |
Commercial Paper 0.1% | |
Development Bank of Singapore Ltd. | |
08/02/12 | | | 0.551 | % | | | 1,994,683 | | | | 1,994,683 | |
Nordea Bank AB | |
07/24/12 | | | 0.627 | % | | | 2,990,521 | | | | 2,990,521 | |
| | | | | | | | | | | | |
Total | | | | | | | | | | | 4,985,204 | |
| | | | | | | | | | | | |
| Issuer | | Effective
Yield | | | Principal | | | Value | |
Investments of Cash Collateral Received for Securities on Loan (continued) | |
Repurchase Agreements 0.1% | | | | | | | | | |
UBS Securities LLC
dated 03/30/12, matures 04/02/12, | | | | | |
repurchase price $3,724,395(e) | | | 0.180 | % | | | $3,724,339 | | | | $3,724,339 | |
| | | | | | | | | | | | |
Total | | | | | | | | | | | 3,724,339 | |
Total Investments of Cash Collateral Received for Securities on Loan | |
(Cost: $40,697,500) | | | | | | | | $40,697,500 | |
Total Investments | |
(Cost: $5,100,721,458) | | | | | | | | $6,830,460,130 | |
Other Assets & Liabilities, Net | | | | (1,071,554 | ) |
Net Assets | | | | $6,829,388,576 | |
The Accompanying Notes to Financial Statements are an integral part of this statement.
7
| | |
Notes to Portfolio of Investments |
| (b) | At March 31, 2012, security was partially or fully on loan. |
| (c) | The rate shown is the seven-day current annualized yield at March 31, 2012. |
| (d) | Investments in affiliates during the year ended March 31, 2012: |
| | | | | | | | | | | | | | | | | | | | | | | | | | | | |
| Issuer | | Beginning
Cost | | | Purchase | | | Sales Proceeds | | | Realized
Gain/Loss | | | Ending
Cost | | | Dividends | | | Value | |
Columbia Short-Term Cash Fund | | | $— | | | | $2,083,378,806 | | | | $(2,073,057,908 | ) | | | $— | | | | $10,320,898 | | | | $123,435 | | | | $10,320,898 | |
Acme Packet, Inc. * | | | — | | | | 441,366,431 | | | | (257,090,566 | ) | | | (184,275,865 | ) | | | — | | | | — | | | | — | |
Total | | | $— | | | | $2,524,745,237 | | | | $(2,330,148,474 | ) | | | $(184,275,865 | ) | | | $10,320,898 | | | | $123,435 | | | | $10,320,898 | |
| | * | The Fund owned 5 % or more of the total shares outstanding for this security at various times during the fiscal year ended 03/31/2012. The Fund did not own any shares of this security at 03/31/2012. |
| (e) | The table below represents securities received as collateral for repurchase agreements. This collateral is deposited with the Fund’s custodian and, pursuant to the terms of the repurchase agreement, must have an aggregate market value greater than or equal to the repurchase price plus accrued interest at all times. The value of securities and/or cash held as collateral for repurchase agreements is monitored on a daily basis to ensure the proper level of collateral. |
UBS Securities LLC (0.180%)
| | | | |
| Security Description | | Value | |
Ginnie Mae I Pool | | | $737,291 | |
Ginnie Mae II Pool | | | 3,061,535 | |
Total Market Value of Collateral Securities | | | $3,798,826 | |
| | |
| ADR | | American Depositary Receipt |
Generally accepted accounting principles (GAAP) require disclosure regarding the inputs and valuation techniques used to measure fair value and any changes in valuation inputs or techniques. In addition, investments shall be disclosed by major category.
Columbia Select Large Cap Growth Fund
March 31, 2012
|
Fair Value Measurements (continued) |
The Fund categorizes its fair value measurements according to a three-level hierarchy that maximizes the use of observable inputs and minimizes the use of unobservable inputs by prioritizing that the most observable input be used when available. Observable inputs are those that market participants would use in pricing an investment based on market data obtained from sources independent of the reporting entity. Unobservable inputs are those that reflect the Fund’s assumptions about the information market participants would use in pricing an investment. An investment’s level within the fair value hierarchy is based on the lowest level of any input that is deemed significant to the asset or liability’s fair value measurement. The input levels are not necessarily an indication of the risk or liquidity associated with investments at that level. For example, certain U.S. government securities are generally high quality and liquid, however, they are reflected as Level 2 because the inputs used to determine fair value may not always be quoted prices in an active market.
Fair value inputs are summarized in the three broad levels listed below:
| | Ÿ | | Level 1 – Valuations based on quoted prices for investments in active markets that the Fund has the ability to access at the measurement date (including NAV for open-end mutual funds). Valuation adjustments are not applied to Level 1 investments. |
| | Ÿ | | Level 2 – Valuations based on other significant observable inputs (including quoted prices for similar securities, interest rates, prepayment speeds, credit risks, etc.). |
| | Ÿ | | Level 3 – Valuations based on significant unobservable inputs (including the Fund’s own assumptions and judgment in determining the fair value of investments). |
Inputs that are used in determining fair value of an investment may include price information, credit data, volatility statistics, and other factors. These inputs can be either observable or unobservable. The availability of observable inputs can vary between investments, and is affected by various factors such as the type of investment, and the volume and level of activity for that investment or similar investments in the marketplace. The inputs will be considered by the Investment Manager, along with any other relevant factors in the calculation of an investment’s fair value. The Fund uses prices and inputs that are current as of the measurement date, which may include periods of market dislocations. During these periods, the availability of prices and inputs may be reduced for many investments. This condition could cause an investment to be reclassified between the various levels within the hierarchy.
Investments falling into the Level 3 category are primarily supported by quoted prices from brokers and dealers participating in the market for those investments. However, these may be classified as Level 3 investments due to lack of market transparency and corroboration to support these quoted prices. Additionally, valuation models may be used as the pricing source for any remaining investments classified as Level 3. These models rely on one or more significant unobservable inputs and/or significant assumptions by the Investment Manager. Inputs used in valuations may include, but are not limited to, financial statement analysis, capital account balances, discount rates and estimated cash flows, and comparable company data.
The following table is a summary of the inputs used to value the Fund’s investments as of March 31, 2012:
| | | | | | | | | | | | | | | | |
| | | Fair value at March 31, 2012 | |
| Description | | Level 1
quoted prices
in active
markets for
identical assets | | | Level 2
other
significant
observable
inputs | | | Level 3
significant
unobservable
inputs | | | Total | |
Equity Securities | | | | | | | | | | | | | | | | |
Common Stocks | | | | | | | | | | | | | | | | |
Consumer Discretionary | | | $1,839,612,013 | | | | $— | | | | $— | | | | $1,839,612,013 | |
Consumer Staples | | | 435,436,563 | | | | — | | | | — | | | | 435,436,563 | |
Energy | | | 389,390,604 | | | | — | | | | — | | | | 389,390,604 | |
Financials | | | 403,995,417 | | | | — | | | | — | | | | 403,995,417 | |
Health Care | | | 1,173,338,982 | | | | — | | | | — | | | | 1,173,338,982 | |
Industrials | | | 344,302,909 | | | | — | | | | — | | | | 344,302,909 | |
Information Technology | | | 2,193,365,244 | | | | — | | | | — | | | | 2,193,365,244 | |
Total Equity Securities | | | 6,779,441,732 | | | | — | | | | — | | | | 6,779,441,732 | |
Other | | | | | | | | | | | | | | | | |
Money Market Funds | | | 10,320,898 | | | | — | | | | — | | | | 10,320,898 | |
Investments of Cash Collateral Received for Securities on Loan | | | — | | | | 40,697,500 | | | | — | | | | 40,697,500 | |
Total Other | | | 10,320,898 | | | | 40,697,500 | | | | — | | | | 51,018,398 | |
Total | | | $6,789,762,630 | | | | $40,697,500 | | | | $— | | | | $6,830,460,130 | |
See the Portfolio of Investments for all investment classifications not indicated in the table.
The Fund’s assets assigned to the Level 2 input category are generally valued using the market approach, in which a security’s value is determined through reference to prices and information from market transactions for similar or identical assets.
There were no significant transfers between Levels 1 and 2 during the period.
The Accompanying Notes to Financial Statements are an integral part of this statement.
8
Statement of Assets and Liabilities – Columbia Select Large Cap Growth Fund
March 31, 2012
| | | | |
| Assets | |
Investments, at value* | | | | |
Unaffiliated issuers (identified cost $5,049,703,060) | | $ | 6,779,441,732 | |
Affiliated issuers (identified cost $10,320,898) | | | 10,320,898 | |
Investment of cash collateral received for securities on loan | | | | |
Short-term securities (identified cost $36,973,161) | | | 36,973,161 | |
Repurchase agreements (identified cost $3,724,339) | | | 3,724,339 | |
Total investments (identified cost $5,100,721,458) | | | 6,830,460,130 | |
Receivable for: | | | | |
Investments sold | | | 43,139,578 | |
Capital shares sold | | | 19,627,977 | |
Dividends | | | 4,196,065 | |
Interest | | | 23,653 | |
Reclaims | | | 515,271 | |
Prepaid expense | | | 50,524 | |
Trustees’ deferred compensation plan | | | 53,309 | |
Total assets | | | 6,898,066,507 | |
| |
| Liabilities | | | | |
Due upon return of securities on loan | | | 40,697,500 | |
Payable for: | | | | |
Investments purchased | | | 4,848,157 | |
Capital shares purchased | | | 22,245,958 | |
Investment management fees | | | 108,722 | |
Distribution and service fees | | | 16,580 | |
Transfer agent fees | | | 504,805 | |
Administration fees | | | 8,486 | |
Compensation of board members | | | 1,804 | |
Chief compliance officer expenses | | | 859 | |
Other expenses | | | 191,751 | |
Trustees’ deferred compensation plan | | | 53,309 | |
Total liabilities | | | 68,677,931 | |
Net assets applicable to outstanding capital stock | | $ | 6,829,388,576 | |
The Accompanying Notes to Financial Statements are an integral part of this statement.
9
Statement of Assets and Liabilities (continued) – Columbia Select Large Cap Growth Fund
March 31, 2012
| | | | |
| Represented by | | | | |
Paid-in capital | | $ | 5,353,717,937 | |
Accumulated net investment loss | | | (8,316,288 | ) |
Accumulated net realized loss | | | (245,751,745 | ) |
Unrealized appreciation (depreciation) on: | | | | |
Investments | | | 1,729,738,672 | |
Total — representing net assets applicable to outstanding capital stock | | $ | 6,829,388,576 | |
*Value of securities on loan | | $ | 39,658,500 | |
Net assets applicable to outstanding shares | | | | |
Class A | | $ | 2,023,474,844 | |
Class C | | $ | 81,441,424 | |
Class I | | $ | 283,919,716 | |
Class R | | $ | 14,619,072 | |
Class W | | $ | 52,432,025 | |
Class Z | | $ | 4,373,501,495 | |
Shares outstanding | | | | |
Class A | | | 141,685,896 | |
Class C | | | 5,901,555 | |
Class I | | | 19,616,275 | |
Class R | | | 1,053,755 | |
Class W | | | 3,671,900 | |
Class Z | | | 303,186,112 | |
Net asset value per share | | | | |
Class A(a) | | $ | 14.28 | |
Class C | | $ | 13.80 | |
Class I | | $ | 14.47 | |
Class R | | $ | 13.87 | |
Class W | | $ | 14.28 | |
Class Z | | $ | 14.43 | |
| (a) | The maximum offering price per share for Class A is $15.15. The offering price is calculated by dividing the net asset value by 1.0 minus the maximum sales charge of 5.75%. |
The Accompanying Notes to Financial Statements are an integral part of this statement.
10
Statement of Operations – Columbia Select Large Cap Growth Fund
Year ended March 31, 2012
| | | | |
| Net investment income | | | | |
Income: | | | | |
Dividends | | $ | 25,152,590 | |
Interest | | | 4,470 | |
Dividends from affiliates | | | 123,435 | |
Income from securities lending — net | | | 153,070 | |
Foreign taxes withheld | | | (581,284 | ) |
Total income | | | 24,852,281 | |
Expenses: | | | | |
Investment management fees | | | 32,252,320 | |
Distribution fees | | | | |
Class C | | | 301,363 | |
Class R | | | 41,363 | |
Service fees | | | | |
Class A | | | 3,857,839 | |
Class C | | | 100,454 | |
Class W | | | 107,565 | |
Transfer agent fees | | | | |
Class A | | | 3,010,604 | |
Class C | | | 79,177 | |
Class R | | | 15,200 | |
Class W | | | 85,338 | |
Class Z | | | 7,442,121 | |
Administration fees | | | 3,883,788 | |
Compensation of board members | | | 160,325 | |
Pricing and bookkeeping fees | | | 46,858 | |
Custodian fees | | | 69,285 | |
Printing and postage fees | | | 306,285 | |
Registration fees | | | 323,559 | |
Professional fees | | | 198,307 | |
Chief compliance officer expenses | | | 3,207 | |
Other | | | 180,333 | |
Total expenses | | | 52,465,291 | |
Expense reductions | | | (5,090 | ) |
Total net expenses | | | 52,460,201 | |
Net investment loss | | | (27,607,920 | ) |
| |
| Realized and unrealized gain (loss) — net | | | | |
Net realized gain (loss) on: | | | | |
Investments | | | (240,158,887 | ) |
Net realized loss | | | (240,158,887 | ) |
Net change in unrealized appreciation (depreciation) on: | | | | |
Investments | | | 739,278,810 | |
Net change in unrealized appreciation | | | 739,278,810 | |
Net realized and unrealized gain | | | 499,119,923 | |
Net increase in net assets resulting from operations | | $ | 471,512,003 | |
The Accompanying Notes to Financial Statements are an integral part of this statement.
11
Statement of Changes in Net Assets – Columbia Select Large Cap Growth Fund
| | | | | | | | |
| Year ended March 31, | | 2012 | | | 2011 | |
| | |
| Operations | | | | | | | | |
Net investment loss | | $ | (27,607,920 | ) | | $ | (19,418,660 | ) |
Net realized gain (loss) | | | (240,158,887 | ) | | | 351,743,043 | |
Net change in unrealized appreciation | | | 739,278,810 | | | | 605,481,661 | |
Net increase in net assets resulting from operations | | | 471,512,003 | | | | 937,806,044 | |
| | |
| Distributions to shareholders from: | | | | | | | | |
Net realized gains | | | | | | | | |
Class A | | | (21,108,582 | ) | | | — | |
Class C | | | (373,116 | ) | | | — | |
Class I | | | (2,275,091 | ) | | | — | |
Class R | | | (64,675 | ) | | | — | |
Class W | | | (631,181 | ) | | | — | |
Class Z | | | (55,884,936 | ) | | | — | |
Total distributions to shareholders | | | (80,337,581 | ) | | | — | |
Increase (decrease) in net assets from share transactions | | | 1,656,374,397 | | | | 1,565,789,704 | |
Proceeds from regulatory settlements (Note 6) | | | 15,727 | | | | — | |
Total increase in net assets | | | 2,047,564,546 | | | | 2,503,595,748 | |
Net assets at beginning of year | | | 4,781,824,030 | | | | 2,278,228,282 | |
Net assets at end of year | | $ | 6,829,388,576 | | | $ | 4,781,824,030 | |
Accumulated net investment loss | | $ | (8,316,288 | ) | | $ | (34,097 | ) |
The Accompanying Notes to Financial Statements are an integral part of this statement.
12
Statement of Changes in Net Assets (continued) – Columbia Select Large Cap Growth Fund
| | | | | | | | | | | | | | | | |
| Year ended March 31, | | 2012 | | | 2011 | |
| | | Shares | | | Dollars ($) | | | Shares | | | Dollars ($) | |
| | | | |
| Capital stock activity | | | | | | | | | | | | | | | | |
Class A shares | | | | | | | | | | | | | | | | |
Subscriptions | | | 88,391,261 | | | | 1,130,425,807 | | | | 51,875,646 | | | | 606,878,992 | |
Distributions reinvested | | | 1,571,920 | | | | 20,780,793 | | | | — | | | | — | |
Redemptions | | | (39,426,582 | ) | | | (500,958,000 | ) | | | (15,170,970 | ) | | | (176,280,576 | ) |
Net increase | | | 50,536,599 | | | | 650,248,600 | | | | 36,704,676 | | | | 430,598,416 | |
Class C shares | | | | | | | | | | | | | | | | |
Subscriptions | | | 5,324,314 | | | | 66,175,011 | | | | 887,774 | | | | 11,066,341 | |
Distributions reinvested | | | 17,127 | | | | 219,913 | | | | — | | | | — | |
Redemptions | | | (533,782 | ) | | | (6,568,590 | ) | | | (104,918 | ) | | | (1,200,978 | ) |
Net increase | | | 4,807,659 | | | | 59,826,334 | | | | 782,856 | | | | 9,865,363 | |
Class I shares | | | | | | | | | | | | | | | | |
Subscriptions | | | 14,298,315 | | | | 183,965,493 | | | | 10,005,144 | | | | 131,694,928 | |
Distributions reinvested | | | 170,416 | | | | 2,275,045 | | | | — | | | | — | |
Redemptions | | | (4,073,600 | ) | | | (54,479,499 | ) | | | (784,000 | ) | | | (10,141,541 | ) |
Net increase | | | 10,395,131 | | | | 131,761,039 | | | | 9,221,144 | | | | 121,553,387 | |
Class R shares | | | | | | | | | | | | | | | | |
Subscriptions | | | 954,688 | | | | 12,007,038 | | | | 244,885 | | | | 2,682,857 | |
Distributions reinvested | | | 5,029 | | | | 64,675 | | | | — | | | | — | |
Redemptions | | | (126,277 | ) | | | (1,557,332 | ) | | | (63,966 | ) | | | (707,930 | ) |
Net increase | | | 833,440 | | | | 10,514,381 | | | | 180,919 | | | | 1,974,927 | |
Class W shares | | | | | | | | | | | | | | | | |
Subscriptions | | | 1,571,401 | | | | 19,941,166 | | | | 3,271,632 | | | | 41,579,863 | |
Distributions reinvested | | | 47,777 | | | | 631,135 | | | | — | | | | — | |
Redemptions | | | (1,011,577 | ) | | | (13,267,949 | ) | | | (207,333 | ) | | | (2,701,188 | ) |
Net increase | | | 607,601 | | | | 7,304,352 | | | | 3,064,299 | | | | 38,878,675 | |
Class Z shares | | | | | | | | | | | | | | | | |
Subscriptions | | | 145,887,125 | | | | 1,916,581,934 | | | | 123,894,850 | | | | 1,424,613,465 | |
Distributions reinvested | | | 695,700 | | | | 9,266,724 | | | | — | | | | — | |
Redemptions | | | (87,559,750 | ) | | | (1,129,128,967 | ) | | | (39,124,601 | ) | | | (461,694,529 | ) |
Net increase | | | 59,023,075 | | | | 796,719,691 | | | | 84,770,249 | | | | 962,918,936 | |
Total net increase | | | 126,203,505 | | | | 1,656,374,397 | | | | 134,724,143 | | | | 1,565,789,704 | |
The Accompanying Notes to Financial Statements are an integral part of this statement.
13
Financial Highlights – Columbia Select Large Cap Growth Fund
The following tables are intended to help you understand the Fund’s financial performance. Certain information reflects financial results for a single share of a class held for the periods shown. Per share net investment income (loss) amounts are calculated based on average shares outstanding during the period. Total returns assume reinvestment of all dividends and distributions. Total returns do not reflect payment of sales charges, if any, and are not annualized for periods of less than one year.
| | | | | | | | | | | | | | | | | | | | |
| | | Year ended March 31, | |
| | | 2012 | | | 2011 | | | 2010 | | | 2009 | | | 2008(a) | |
| Class A | | | | | | | | | | | | | | | |
| Per share data | | | | | | | | | | | | | | | | | | | | |
Net asset value, beginning of period | | | $13.63 | | | | $10.60 | | | | $7.06 | | | | $11.30 | | | | $12.18 | |
Income from investment operations: | | | | | | | | | | | | | | | | | | | | |
Net investment loss | | | (0.09 | ) | | | (0.09 | ) | | | (0.05 | ) | | | (0.06 | ) | | | (0.05 | ) |
Net realized and unrealized gain (loss) | | | 0.95 | | | | 3.12 | | | | 3.59 | | | | (4.18 | ) | | | (0.83 | ) |
Total from investment operations | | | 0.86 | | | | 3.03 | | | | 3.54 | | | | (4.24 | ) | | | (0.88 | ) |
Less distributions to shareholders from: | | | | | | | | | | | | | | | | | | | | |
Net realized gains | | | (0.21 | ) | | | — | | | | — | | | | — | | | | — | |
Total distributions to shareholders | | | (0.21 | ) | | | — | | | | — | | | | — | | | | — | |
Proceeds from regulatory settlement | | | 0.00 | (b) | | | — | | | | — | | | | 0.00 | (b) | | | — | |
Net asset value, end of period | | | $14.28 | | | | $13.63 | | | | $10.60 | | | | $7.06 | | | | $11.30 | |
| Total return | | | 6.39% | | | | 28.58% | | | | 50.14% | | | | (37.52% | ) | | | (7.22% | ) |
| Ratios to average net assets(c) | | | | | | | | | | | | | | | | | | | | |
Expenses prior to fees waived or expenses reimbursed (including interest expense) | | | 1.11% | | | | 1.24% | | | | 1.26% | | | | 1.33% | (e) | | | 1.21% | (d) |
Net expenses after fees waived or expenses reimbursed (including interest expense)(g) | | | 1.11% | (f) | | | 1.24% | (f) | | | 1.26% | (f) | | | 1.28% | (e)(f) | | | 1.16% | (d)(f) |
Expenses prior to fees waived or expenses reimbursed (excluding interest expense) | | | 1.11% | | | | 1.24% | | | | 1.26% | | | | 1.33% | | | | 1.21% | (d) |
Net expenses after fees waived or expenses reimbursed (excluding interest expense)(g) | | | 1.11% | (f) | | | 1.24% | (f) | | | 1.26% | (f) | | | 1.28% | (f) | | | 1.16% | (d)(f) |
Net investment loss | | | (0.66% | )(f) | | | (0.79% | )(f) | | | (0.53% | )(f) | | | (0.77% | )(f) | | | (0.92% | )(d)(f) |
| Supplemental data | | | | | | | | | | | | | | | | | | | | |
Net assets, end of period (in thousands) | | | $2,023,475 | | | | $1,242,211 | | | | $576,956 | | | | $84,493 | | | | $2,141 | |
Portfolio turnover | | | 53% | | | | 71% | | | | 27% | | | | 58% | | | | 39% | |
Notes to Financial Highlights
| (a) | The Predecessor Fund’s Class A shares commenced operations on September 28, 2007. Per share data and total return reflect activity from that date. |
| (b) | Rounds to less than $0.01. |
| (c) | In addition to the fees and expenses which the Fund bears directly, the Fund indirectly bears a pro rata share of the fees and expenses of the acquired funds in which it invests. Such indirect expenses are not included in the reported expense ratios. |
| (e) | Includes interest expense which rounds to less than 0.01%. |
| (f) | The benefits derived from expense reductions had an impact of less than 0.01%. |
| (g) | The Investment Manager and certain of its affiliates agreed to waive/reimburse certain fees and expenses, if applicable. |
The Accompanying Notes to Financial Statements are an integral part of this statement.
14
Financial Highlights (continued) – Columbia Select Large Cap Growth Fund
| | | | | | | | | | | | | | | | | | | | |
| | | Year ended March 31, | |
| | | 2012 | | | 2011 | | | 2010 | | | 2009 | | | 2008(a) | |
| Class C | |
| Per share data | |
Net asset value, beginning of period | | | $13.28 | | | | $10.40 | | | | $6.98 | | | | $11.26 | | | | $12.18 | |
Income from investment operations: | | | | | | | | | | | | | | | | | | | | |
Net investment loss | | | (0.17 | ) | | | (0.17 | ) | | | (0.12 | ) | | | (0.12 | ) | | | (0.09 | ) |
Net realized and unrealized gain (loss) | | | 0.90 | | | | 3.05 | | | | 3.54 | | | | (4.16 | ) | | | (0.83 | ) |
Total from investment operations | | | 0.73 | | | | 2.88 | | | | 3.42 | | | | (4.28 | ) | | | (0.92 | ) |
Less distributions to shareholders from: | | | | | | | | | | | | | | | | | | | | |
Net realized gains | | | (0.21 | ) | | | — | | | | — | | | | — | | | | — | |
Total distributions to shareholders | | | (0.21 | ) | | | — | | | | — | | | | — | | | | — | |
Proceeds from regulatory settlement | | | 0.00 | (b) | | | — | | | | — | | | | 0.00 | (b) | | | — | |
Net asset value, end of period | | | $13.80 | | | | $13.28 | | | | $10.40 | | | | $6.98 | | | | $11.26 | |
| Total return | | | 5.57% | | | | 27.69% | | | | 49.00% | | | | (38.01% | ) | | | (7.55% | ) |
| Ratios to average net assets(c) | | | | | | | | | | | | | | | | | | | | |
Expenses prior to fees waived or expenses reimbursed (including interest expense) | | | 1.86% | | | | 1.99% | | | | 2.01% | | | | 2.08% | (e) | | | 1.96% | (d) |
Net expenses after fees waived or expenses reimbursed (including interest expense)(g) | | | 1.86% | (f) | | | 1.99% | (f) | | | 2.01% | (f) | | | 2.03% | (e)(f) | | | 1.91% | (d)(f) |
Expenses prior to fees waived or expenses reimbursed (excluding interest expense) | | | 1.86% | | | | 1.99% | | | | 2.01% | | | | 2.08% | | | | 1.96% | (d) |
Net expenses after fees waived or expenses reimbursed (excluding interest expense)(g) | | | 1.86% | (f) | | | 1.99% | (f) | | | 2.01% | (f) | | | 2.03% | (f) | | | 1.91% | (d)(f) |
Net investment loss | | | (1.35% | )(f) | | | (1.49% | )(f) | | | (1.27% | )(f) | | | (1.37% | )(f) | | | (1.59% | )(d)(f) |
| Supplemental data | | | | | | | | | | | | | | | | | | | | |
Net assets, end of period (in thousands) | | | $81,441 | | | | $14,523 | | | | $3,234 | | | | $763 | | | | $238 | |
Portfolio turnover | | | 53% | | | | 71% | | | | 27% | | | | 58% | | | | 39% | |
Notes to Financial Highlights
| (a) | The Predecessor Fund’s Class C shares commenced operations on September 28, 2007. Per share data and total return reflect activity from that date. |
| (b) | Rounds to less than $0.01. |
| (c) | In addition to the fees and expenses which the Fund bears directly, the Fund indirectly bears a pro rata share of the fees and expenses of the acquired funds in which it invests. Such indirect expenses are not included in the reported expense ratios. |
| (e) | Includes interest expense which rounds to less than 0.01%. |
| (f) | The benefits derived from expense reductions had an impact of less than 0.01%. |
| (g) | The Investment Manager and certain of its affiliates agreed to waive/reimburse certain fees and expenses, if applicable. |
The Accompanying Notes to Financial Statements are an integral part of this statement.
15
Financial Highlights (continued) – Columbia Select Large Cap Growth Fund
| | | | | | | | |
| | | Year ended March 31, | |
| | | 2012 | | | 2011(a) | |
| Class I | | | | | | |
| Per share data | | | | | | | | |
Net asset value, beginning of period | | | $13.75 | | | | $11.23 | |
Income from investment operations: | | | | | | | | |
Net investment loss | | | (0.02 | ) | | | (0.01 | ) |
Net realized and unrealized gain | | | 0.95 | | | | 2.53 | |
Total from investment operations | | | 0.93 | | | | 2.52 | |
Less distributions to shareholders from: | | | | | | | | |
Net realized gains | | | (0.21 | ) | | | — | |
Total distributions to shareholders | | | (0.21 | ) | | | — | |
Proceeds from regulatory settlement | | | 0.00 | (b) | | | — | |
Net asset value, end of period | | | $14.47 | | | | $13.75 | |
| Total return | | | 6.85% | | | | 22.44% | |
| Ratios to average net assets(c) | | | | | | | | |
Expenses prior to fees waived or expenses reimbursed (including interest expense) | | | 0.67% | | | | 0.76% | (d) |
Net expenses after fees waived or expenses reimbursed (including interest expense)(f) | | | 0.67% | (e) | | | 0.76% | (d)(e) |
Expenses prior to fees waived or expenses reimbursed (excluding interest expense) | | | 0.67% | | | | 0.76% | (d) |
Net expenses after fees waived or expenses reimbursed (excluding interest expense)(f) | | | 0.67% | (e) | | | 0.76% | (d)(e) |
Net investment loss | | | (0.19% | )(e) | | | (0.18% | )(d)(e) |
| Supplemental data | | | | | | | | |
Net assets, end of period (in thousands) | | | $283,920 | | | | $126,813 | |
Portfolio turnover | | | 53% | | | | 71% | |
Notes to Financial Highlights
| (a) | For the period from September 27, 2010 (commencement of operations) to March 31, 2011. |
| (b) | Rounds to less than $0.01. |
| (c) | In addition to the fees and expenses which the Fund bears directly, the Fund indirectly bears a pro rata share of the fees and expenses of the acquired funds in which it invests. Such indirect expenses are not included in the reported expense ratios. |
| (e) | The benefits derived from expense reductions had an impact of less than 0.01%. |
| (f) | The Investment Manager and certain of its affiliates agreed to waive/reimburse certain fees and expenses, if applicable. |
The Accompanying Notes to Financial Statements are an integral part of this statement.
16
Financial Highlights (continued) – Columbia Select Large Cap Growth Fund
| | | | | | | | | | | | | | | | | | | | |
| | | Year ended March 31, | |
| | | 2012 | | | 2011 | | | 2010 | | | 2009 | | | 2008(a) | |
| Class R | | | | | | | | | | | | | | | |
| Per share data | | | | | | | | | | | | | | | | | | | | |
Net asset value, beginning of period | | | $13.28 | | | | $10.35 | | | | $6.91 | | | | $11.09 | | | | $10.45 | |
Income from investment operations: | | | | | | | | | | | | | | | | | | | | |
Net investment loss | | | (0.10 | ) | | | (0.12 | ) | | | (0.07 | ) | | | (0.07 | ) | | | (0.14 | ) |
Net realized and unrealized gain (loss) | | | 0.90 | | | | 3.05 | | | | 3.51 | | | | (4.11 | ) | | | 0.78 | |
Total from investment operations | | | 0.80 | | | | 2.93 | | | | 3.44 | | | | (4.18 | ) | | | 0.64 | |
Less distributions to shareholders from: | | | | | | | | | | | | | | | | | | | | |
Net realized gains | | | (0.21 | ) | | | — | | | | — | | | | — | | | | — | |
Total distributions to shareholders | | | (0.21 | ) | | | — | | | | — | | | | — | | | | — | |
Proceeds from regulatory settlement | | | 0.00 | (b) | | | — | | | | — | | | | 0.00 | (b) | | | — | |
Net asset value, end of period | | | $13.87 | | | | $13.28 | | | | $10.35 | | | | $6.91 | | | | $11.09 | |
| Total return | | | 6.11% | | | | 28.31% | | | | 49.78% | | | | (37.69% | ) | | | 6.12% | |
| Ratios to average net assets(c) | | | | | | | | | | | | | | | | | | | | |
Expenses prior to fees waived or expenses reimbursed (including interest expense) | | | 1.35% | | | | 1.49% | | | | 1.51% | | | | 1.58% | (d) | | | 1.70% | |
Net expenses after fees waived or expenses reimbursed (including interest expense)(f) | | | 1.35% | (e) | | | 1.49% | (e) | | | 1.51% | (e) | | | 1.53% | (d)(e) | | | 1.66% | (e) |
Expenses prior to fees waived or expenses reimbursed (excluding interest expense) | | | 1.35% | | | | 1.49% | | | | 1.51% | | | | 1.58% | | | | 1.70% | |
Net expenses after fees waived or expenses reimbursed (excluding interest expense)(f) | | | 1.35% | (e) | | | 1.49% | (e) | | | 1.51% | (e) | | | 1.53% | (e) | | | 1.66% | (e) |
Net investment loss | | | (0.84% | )(e) | | | (1.03% | )(e) | | | (0.71% | )(e) | | | (0.80% | )(e) | | | (1.22% | )(e) |
| Supplemental data | | | | | | | | | | | | | | | | | | | | |
Net assets, end of period (in thousands) | | | $14,619 | | | | $2,926 | | | | $408 | | | | $23 | | | | $22 | |
Portfolio turnover | | | 53% | | | | 71% | | | | 27% | | | | 58% | | | | 39% | |
Notes to Financial Highlights
| (a) | On March 31, 2008, Retirement Shares class of Large Cap Growth Fund, a series of Excelsior Funds, Inc., was reorganized into the Fund’s Class R shares. The financial information of the Fund’s Class R shares includes the financial information of Large Cap Growth Fund’s Retirement Shares class. |
| (b) | Rounds to less than $0.01. |
| (c) | In addition to the fees and expenses which the Fund bears directly, the Fund indirectly bears a pro rata share of the fees and expenses of the acquired funds in which it invests. Such indirect expenses are not included in the reported expense ratios. |
| (d) | Includes interest expense which rounds to less than 0.01%. |
| (e) | The benefits derived from expense reductions had an impact of less than 0.01%. |
| (f) | The Investment Manager and certain of its affiliates agreed to waive/reimburse certain fees and expenses, if applicable. |
The Accompanying Notes to Financial Statements are an integral part of this statement.
17
Financial Highlights (continued) – Columbia Select Large Cap Growth Fund
| | | | | | | | |
| | | Year ended March 31, | |
| | | 2012 | | | 2011(a) | |
| Class W | | | | | | |
| Per share data | | | | | | | | |
Net asset value, beginning of period | | | $13.63 | | | | $11.16 | |
Income from investment operations: | | | | | | | | |
Net investment loss | | | (0.09 | ) | | | (0.05 | ) |
Net realized and unrealized gain | | | 0.95 | | | | 2.52 | |
Total from investment operations | | | 0.86 | | | | 2.47 | |
Less distributions to shareholders from: | | | | | | | | |
Net realized gains | | | (0.21 | ) | | | — | |
Total distributions to shareholders | | | (0.21 | ) | | | — | |
Proceeds from regulatory settlement | | | 0.00 | (b) | | | — | |
Net asset value, end of period | | | $14.28 | | | | $13.63 | |
| Total return | | | 6.39% | | | | 22.13% | |
| Ratios to average net assets(c) | | | | | | | | |
Expenses prior to fees waived or expenses reimbursed (including interest expense) | | | 1.12% | | | | 1.25% | (d) |
Net expenses after fees waived or expenses reimbursed (including interest expense)(f) | | | 1.12% | (e) | | | 1.25% | (d)(e) |
Expenses prior to fees waived or expenses reimbursed (excluding interest expense) | | | 1.12% | | | | 1.25% | (d) |
Net expenses after fees waived or expenses reimbursed (excluding interest expense)(f) | | | 1.12% | (e) | | | 1.25% | (d)(e) |
Net investment loss | | | (0.67% | )(e) | | | (0.78% | )(d)(e) |
| Supplemental data | | | | | | | | |
Net assets, end of period (in thousands) | | | $52,432 | | | | $41,768 | |
Portfolio turnover | | | 53% | | | | 71% | |
Notes to Financial Highlights
| (a) | For the period from September 27, 2010 (commencement of operations) to March 31, 2011. |
| (b) | Rounds to less than $0.01. |
| (c) | In addition to the fees and expenses which the Fund bears directly, the Fund indirectly bears a pro rata share of the fees and expenses of the acquired funds in which it invests. Such indirect expenses are not included in the reported expense ratios. |
| (e) | The benefits derived from expense reductions had an impact of less than 0.01%. |
| (f) | The Investment Manager and certain of its affiliates agreed to waive/reimburse certain fees and expenses, if applicable. |
The Accompanying Notes to Financial Statements are an integral part of this statement.
18
Financial Highlights (continued) – Columbia Select Large Cap Growth Fund
| | | | | | | | | | | | | | | | | | | | |
| | | Year ended March 31, | |
| | | 2012 | | | 2011 | | | 2010 | | | 2009 | | | 2008(a)(b) | |
| Class Z | | | | | | | | | | | | | | | |
| Per share data | | | | | | | | | | | | | | | | | | | | |
Net asset value, beginning of period | | | $13.74 | | | | $10.65 | | | | $7.08 | | | | $11.30 | | | | $10.60 | |
Income from investment operations: | | | | | | | | | | | | | | | | | | | | |
Net investment loss | | | (0.06 | ) | | | (0.06 | ) | | | (0.03 | ) | | | (0.03 | ) | | | (0.08 | ) |
Net realized and unrealized gain (loss) | | | 0.96 | | | | 3.15 | | | | 3.60 | | | | (4.19 | ) | | | 0.78 | |
Total from investment operations | | | 0.90 | | | | 3.09 | | | | 3.57 | | | | (4.22 | ) | | | 0.70 | |
Less distributions to shareholders from: | | | | | | | | | | | | | | | | | | | | |
Net realized gains | | | (0.21 | ) | | | — | | | | — | | | | — | | | | — | |
Total distributions to shareholders | | | (0.21 | ) | | | — | | | | — | | | | — | | | | — | |
Proceeds from regulatory settlement | | | 0.00 | (c) | | | — | | | | — | | | | 0.00 | (c) | | | — | |
Net asset value, end of period | | | $14.43 | | | | $13.74 | | | | $10.65 | | | | $7.08 | | | | $11.30 | |
| Total return | | | 6.64% | | | | 29.01% | | | | 50.42% | | | | (37.35% | ) | | | 6.60% | |
| Ratios to average net assets(d) | | | | | | | | | | | | | | | | | | | | |
Expenses prior to fees waived or expenses reimbursed (including interest expense) | | | 0.86% | | | | 0.99% | | | | 1.01% | | | | 1.08% | (e) | | | 1.20% | |
Net expenses after fees waived or expenses reimbursed (including interest expense)(g) | | | 0.86% | (f) | | | 0.99% | (f) | | | 1.01% | (f) | | | 1.03% | (e)(f) | | | 1.16% | (f) |
Expenses prior to fees waived or expenses reimbursed (excluding interest expense) | | | 0.86% | | | | 0.99% | | | | 1.01% | | | | 1.08% | | | | 1.20% | |
Net expenses after fees waived or expenses reimbursed (excluding interest expense)(g) | | | 0.86% | (f) | | | 0.99% | (f) | | | 1.01% | (f) | | | 1.03% | (f) | | | 1.16% | (f) |
Net investment loss | | | (0.43% | )(f) | | | (0.54% | )(f) | | | (0.29% | )(f) | | | (0.38% | )(f) | | | (0.69% | )(f) |
| Supplemental data | | | | | | | | | | | | | | | | | | | | |
Net assets, end of period (in thousands) | | | $4,373,501 | | | | $3,353,583 | | | | $1,697,630 | | | | $732,391 | | | | $938,734 | |
Portfolio turnover | | | 53% | | | | 71% | | | | 27% | | | | 58% | | | | 39% | |
Notes to Financial Highlights
| (a) | On March 31, 2008, Shares class of Large Cap Growth Fund, a series of Excelsior Funds, Inc., was reorganized into the Fund’s Class Z shares. The financial information of the Fund’s Class Z shares includes the financial information of Large Cap Growth Fund’s Shares class. |
| (b) | On March 31, 2008, Large Cap Growth Fund’s Institutional Shares class was reorganized into the Fund’s Class Z shares. |
| (c) | Rounds to less than $0.01. |
| (d) | In addition to the fees and expenses which the Fund bears directly, the Fund indirectly bears a pro rata share of the fees and expenses of the acquired funds in which it invests. Such indirect expenses are not included in the reported expense ratios. |
| (e) | Includes interest expense which rounds to less than 0.01%. |
| (f) | The benefits derived from expense reductions had an impact of less than 0.01%. |
| (g) | The Investment Manager and certain of its affiliates agreed to waive/reimburse certain fees and expenses, if applicable. |
The Accompanying Notes to Financial Statements are an integral part of this statement.
19
Notes to Financial Statements – Columbia Select Large Cap Growth Fund
March 31, 2012
Note 1. Organization
Columbia Select Large Cap Growth Fund (the Fund), a series of Columbia Funds Series Trust I (the Trust), is a diversified fund. The Trust is registered under the Investment Company Act of 1940, as amended (the 1940 Act), as an open-end management investment company organized as a Massachusetts business trust.
Fund Shares
The Trust may issue an unlimited number of shares (without par value). The Fund offers Class A, Class C, Class I, Class R, Class W and Class Z shares. All share classes have identical voting, dividend and liquidation rights. Each share class has its own expense structure and sales charges, as applicable.
Class A shares are subject to a maximum front-end sales charge of 5.75% based on the initial investment amount. Class A shares purchased without an initial sales charge in accounts aggregating $1 million to $50 million at the time of purchase are subject to a contingent deferred sales charge (CDSC) if the shares are sold within 18 months of purchase, charged as follows: 1.00% CDSC if redeemed within 12 months of purchase, and 0.50% CDSC if redeemed more than 12, but less than 18, months after purchase.
Class C shares are subject to a 1.00% CDSC on shares redeemed within one year of purchase.
Class I shares are not subject to sales charges and are only available to the Columbia Family of Funds.
Class R shares are not subject to sales charges and are only available to qualifying institutional investors.
Class W shares are not subject to sales charges and are only available to investors purchasing through authorized investment programs managed by investment professionals, including discretionary managed account programs.
Class Z shares are not subject to sales charges, and are only available to certain investors, as described in the Fund’s prospectus.
Note 2. Summary of Significant Accounting Policies
Use of Estimates
The preparation of financial statements in accordance with U.S. generally accepted accounting principles (GAAP) requires management to make certain estimates and assumptions that affect the reported amounts of assets and liabilities, the disclosure of
contingent assets and liabilities at the date of the financial statements and the reported amounts of revenue and expenses during the reporting period. Actual results could differ from those estimates.
The following is a summary of significant accounting policies consistently followed by the Fund in the preparation of its financial statements.
Security Valuation
All equity securities are valued at the close of business of the New York Stock Exchange (NYSE). Equity securities are valued at the last quoted sales price on the principal exchange or market on which they trade, except for securities traded on the NASDAQ Stock Market, which are valued at the NASDAQ official close price. Unlisted securities or listed securities for which there were no sales during the day are valued at the mean of the latest quoted bid and asked prices on such exchanges or markets.
Investments in other open-end investment companies, including money market funds, are valued at net asset value.
Short-term securities purchased within 60 days to maturity are valued at amortized cost, which approximates market value. The value of short-term securities originally purchased with maturities greater than 60 days is determined based on an amortized value to par upon reaching 60 days to maturity. Short-term securities maturing in more than 60 days from the valuation date are valued at the market price or approximate market value based on current interest rates.
Investments for which market quotations are not readily available, or that have quotations which management believes are not reliable, are valued at fair value as determined in good faith under consistently applied procedures established by and under the general supervision of the Board of Trustees (the Board). If a security or class of securities (such as foreign securities) is valued at fair value, such value is likely to be different from the last quoted market price for the security. The determination of fair value often requires significant judgment. To determine fair value, management may use assumptions including but not limited to future cash flows and estimated risk premiums. Multiple inputs from various sources may be used to determine value.
Repurchase Agreements
The Fund may engage in repurchase agreement transactions with institutions that management has determined are creditworthy. The Fund, through the custodian, receives delivery of the underlying
20
Columbia Select Large Cap Growth Fund
March 31, 2012
securities collateralizing a repurchase agreement. Management is responsible for determining that the collateral is at least equal, at all times, to the value of the repurchase obligation including interest. A repurchase agreement transaction involves certain risks in the event of default or insolvency of the counterparty. These risks include possible delays in or restrictions on a Fund’s ability to dispose of the underlying securities and a possible decline in the value of the underlying securities during the period while the Fund seeks to assert its rights.
Security Transactions
Security transactions are accounted for on the trade date. Cost is determined and gains (losses) are based upon the specific identification method for both financial statement and federal income tax purposes.
Income Recognition
Corporate actions and dividend income are recorded net of any non-reclaimable tax withholdings, on the ex-dividend date or upon receipt of ex-dividend notification in the case of certain foreign securities.
Interest income is recorded on the accrual basis.
Expenses
General expenses of the Trust are allocated to the Fund and other funds of the Trust based upon relative net assets or other expense allocation methodologies determined by the nature of the expense. Expenses directly attributable to the Fund are charged to the Fund. Expenses directly attributable to a specific class of shares are charged to that share class.
Determination of Class Net Asset Value
All income, expenses (other than class-specific expenses, which are charged to that share class, as shown in the Statement of Operations) and realized and unrealized gains (losses) are allocated to each class of the Fund on a daily basis, based on the relative net assets of each class, for purposes of determining the net asset value of each class.
Federal Income Tax Status
The Fund intends to qualify each year as a regulated investment company under Subchapter M of the Internal Revenue Code, as amended, and will distribute substantially all of its tax exempt or taxable income (including net short-term capital gains), if any, for its tax year, and as such will not be subject to federal income taxes. In addition, the Fund intends to distribute in each calendar year
substantially all of its net investment income, capital gains and certain other amounts, if any, such that the Fund should not be subject to federal excise tax. Therefore, no federal income or excise tax provision is recorded.
Distributions to Shareholders
Distributions from net investment income, if any, are declared and paid each calendar quarter. Net realized capital gains, if any, are distributed along with the income dividend. Income distributions and capital gain distributions are determined in accordance with federal income tax regulations which may differ from GAAP.
Guarantees and Indemnifications
Under the Trust’s organizational documents and, in some cases, by contract, its officers and trustees are indemnified against certain liabilities arising out of the performance of their duties to the Trust or its funds. In addition, certain of the Fund’s contracts with its service providers contain general indemnification clauses. The Fund’s maximum exposure under these arrangements is unknown since the amount of any future claims that may be made against the Fund cannot be determined, and the Fund has no historical basis for predicting the likelihood of any such claims.
Recent Accounting Pronouncement
Fair Value Measurements and Disclosures
In May 2011, the Financial Accounting Standards Board (FASB) issued ASU No. 2011-04 modifying Topic 820, Fair Value Measurements and Disclosures. At the same time, the International Accounting Standards Board (IASB) issued International Financial Reporting Standard 13, Fair Value Measurement. The objective of the FASB and IASB is convergence of their guidance on fair value measurements and disclosures.
Specifically, ASU No. 2011-04 requires reporting entities to disclose i) the amounts of any transfers between Level 1 and Level 2, and the reasons for the transfers, ii) for Level 3 fair value measurements, a) quantitative information about significant unobservable inputs used, b) a description of the valuation processes used by the reporting entity and c) a narrative description of the sensitivity of the fair value measurement to changes in unobservable inputs if a change in those inputs might result in a significantly higher or lower fair value measurement. The effective date of ASU No. 2011-04 is for interim and annual periods beginning after December 15, 2011. At this time, management is evaluating the implications of this guidance and the impact it will have on the financial statement amounts and footnote disclosures, if any.
21
Columbia Select Large Cap Growth Fund
March 31, 2012
Note 3. Fees and Compensation Paid to Affiliates
Investment Management Fees
Under an Investment Management Services Agreement (IMSA), Columbia Management Investment Advisers, LLC (the Investment Manager), a wholly-owned subsidiary of Ameriprise Financial, Inc. (Ameriprise Financial), determines which securities will be purchased, held or sold. Effective July 1, 2011, the management fee is an annual fee that is equal to a percentage of the Fund’s average daily net assets that declines from 0.71% to 0.54% as the Fund’s net assets increase. Prior to July 1, 2011, the management fee was equal to a percentage of the Fund’s average daily net assets that declined from 0.75% to 0.43% as the Fund’s net assets increased. The effective management fee rate for the year ended March 31, 2012 was 0.57% of the Fund’s average daily net assets.
Administration Fees
Under an Administrative Services Agreement, the Investment Manager serves as the Fund Administrator. Effective July 1, 2011, the Fund pays the Fund Administrator an annual fee for administration and accounting services equal to a percentage of the Fund’s average daily net assets that declines from 0.06% to 0.03% as the Fund’s net assets increase. Prior to July 1, 2011, the administration fee was equal to the annual rate of 0.15% of the Fund’s average daily net assets, less the fees that were payable by the Fund as described under the Pricing and Bookkeeping Fees note below. The effective administration fee rate for the year ended March 31, 2012 was 0.07% of the Fund’s average daily net assets.
Pricing and Bookkeeping Fees
Prior to July 11, 2011, the Fund had entered into a Financial Reporting Services Agreement (the Financial Reporting Services Agreement) with State Street Bank and Trust Company (State Street) and the Investment Manager pursuant to which State Street provided financial reporting services to the Fund. The Fund also entered into an Accounting Services Agreement (collectively with the Financial Reporting Services Agreement, the State Street Agreements) with State Street and the Investment Manager pursuant to which State Street provided accounting services to the Fund. Under the State Street Agreements, the Fund paid State Street an annual fee of $38,000 paid monthly plus an additional monthly fee based on an annualized percentage rate of average daily net assets of the Fund for the month. The aggregate fee did not exceed $140,000
per year (exclusive of out-of-pocket expenses and charges). The Fund also reimbursed State Street for certain out-of-pocket expenses and charges. Effective July 11, 2011, these services are provided under the Administrative Services Agreement discussed above.
Compensation of Board Members
Board members are compensated for their services to the Fund as disclosed in the Statement of Operations. The Trust’s eligible Trustees may participate in a Deferred Compensation Plan (the Plan) which may be terminated at any time. Obligations of the Plan will be paid solely out of the Fund’s assets.
Compensation of Chief Compliance Officer
The Board has appointed a Chief Compliance Officer to the Fund in accordance with federal securities regulations. The Fund, along with other affiliated funds, pays its pro-rata share of the expenses associated with the Chief Compliance Officer. The Fund’s expenses for the Chief Compliance Officer will not exceed $15,000 per year.
Transfer Agent Fees
Under a Transfer and Dividend Disbursing Agent Agreement, Columbia Management Investment Services Corp. (the Transfer Agent), an affiliate of the Investment Manager and a wholly-owned subsidiary of Ameriprise Financial, is responsible for providing transfer agency services to the Fund. The Transfer Agent has contracted with Boston Financial Data Services (BFDS) to serve as sub-transfer agent.
The Transfer Agent receives monthly account-based service fees based on the number of open accounts and is reimbursed by the Fund for the fees and expenses the Transfer Agent pays to financial intermediaries that maintain omnibus accounts with the Fund that is a percentage of the average aggregate value of the Fund’s shares maintained in each such omnibus account (other than omnibus accounts for which American Enterprise Investment Services Inc. is the broker of record or accounts where the beneficial shareholder is a customer of Ameriprise Financial Services, Inc., which are paid a per account fee). The Transfer Agent pays the fees of BFDS for services as sub-transfer agent and is not entitled to reimbursement for such fees from the Fund (with the exception of out-of-pocket fees).
The Transfer Agent also receives compensation from fees for various shareholder services and reimbursements for certain out-of-pocket expenses. Class I shares do not pay transfer agent fees.
22
Columbia Select Large Cap Growth Fund
March 31, 2012
For the year ended March 31, 2012, the Fund’s effective transfer agent fee rates as a percentage of average daily net assets of each class were as follows:
| | | | |
| | |
| Class A | | | 0.20 | % |
| Class C | | | 0.20 | |
| Class R | | | 0.18 | |
| Class W | | | 0.20 | |
| Class Z | | | 0.20 | |
An annual minimum account balance fee of $20 may apply to certain accounts with a value below the Fund’s initial minimum investment requirements to reduce the impact of small accounts on transfer agent fees. These minimum account balance fees are recorded as part of expense reductions in the Statement of Operations. For the year ended March 31, 2012, these minimum account balance fees reduced total expenses by $4,964.
Distribution and Service Fees
The Fund has an agreement with Columbia Management Investment Distributors, Inc. (the Distributor), an affiliate of the Investment Manager and a wholly-owned subsidiary of Ameriprise Financial, for distribution and shareholder services. Pursuant to Rule 12b-1 under the 1940 Act, the Board has approved, and the Fund has adopted, distribution and shareholder service plans (the Plans) which set the distribution and service fees for the Fund. These fees are calculated daily and are intended to compensate the Distributor and/or eligible selling and/or servicing agents for selling shares of the Fund and providing services to investors.
The Plans require the payment of a monthly service fee to the Distributor at the maximum annual rate of 0.25% of the average daily net assets attributable to Class A, Class C and Class W shares of the Fund. The Plans also require the payment of a monthly distribution fee to the Distributor at the maximum annual rates of 0.75%, 0.50% and 0.25% of the average daily net assets attributable to Class C, Class R and Class W shares, respectively.
The Fund may pay a distribution fee of up to 0.25% of the Fund’s average daily net assets attributable to Class W shares and a service fee of up to 0.25% of the Fund’s average daily net assets attributable to Class W shares, provided, however, that the aggregate fee shall not exceed 0.25% of the Fund’s average daily net assets attributable to Class W shares.
Sales Charges
Sales charges, including front-end charges and CDSCs, received by the Distributor for distributing Fund shares were $916,316 for Class A shares and $15,120 for Class C shares for the year ended March 31, 2012.
Expenses Waived/Reimbursed by the Investment Manager and its Affiliates
Effective August 1, 2011, the Investment Manager and certain of its affiliates have contractually agreed to waive fees and/or reimburse expenses (excluding certain fees and expenses described below), through July 31, 2012, unless sooner terminated at the sole discretion of the Board, so that the Fund’s net operating expenses, after giving effect to fees waived/expenses reimbursed and any balance credits and/or overdraft charges from the Fund’s custodian, do not exceed the following annual rates as a percentage of the class’ average daily net assets:
| | | | |
| | |
| Class A | | | 1.25 | % |
| Class C | | | 2.00 | |
| Class I | | | 0.84 | |
| Class R | | | 1.50 | |
| Class W | | | 1.25 | |
| Class Z | | | 1.00 | |
Under the agreement, the following fees and expenses are excluded from the waiver/reimbursement commitment, and therefore will be paid by the Fund, if applicable: taxes (including foreign transaction taxes), expenses associated with investments in affiliated and non-affiliated pooled investment vehicles (including mutual funds and exchange traded funds), transaction costs and brokerage commissions, costs related to any securities lending program, dividend expenses associated with securities sold short, inverse floater program fees and expenses, transaction charges and interest on borrowed money, interest, extraordinary expenses and any other expenses the exclusion of which is specifically approved by the Board. This agreement may be modified or amended only with approval from all parties.
Prior to August 1, 2011, the Investment Manager voluntarily agreed to reimburse a portion of the Fund’s expenses (excluding certain expenses, such as brokerage commissions, interest, taxes and extraordinary expenses, but including custodian charges relating to overdrafts, if any) so that the Fund’s ordinary net operating
23
Columbia Select Large Cap Growth Fund
March 31, 2012
expenses, after giving effect to fees waived/expenses reimbursed and any balance credits and/or overdraft charges from the Fund’s custodian, did not exceed the following annual rates as a percentage of the class’ average daily net assets:
| | | | |
| | |
| Class A | | | 1.25 | % |
| Class C | | | 2.00 | |
| Class I | | | 0.89 | |
| Class R | | | 1.50 | |
| Class W | | | 1.25 | |
| Class Z | | | 1.00 | |
Effective April 20, 2012, the Investment Manager and certain of its affiliates have contractually agreed to waive fees and/or reimburse expenses (excluding certain fees and expenses described below), through July 31, 2014, unless sooner terminated at the sole discretion of the Board, so that the Fund’s net operating expenses, after giving effect to fees waived/expenses reimbursed and/or overdraft charges from the Fund’s custodian, will not exceed the following annual rates as a percentage of the class’ average daily net assets:
| | | | |
| | |
| Class A | | | 1.19 | % |
| Class C | | | 1.94 | |
| Class I | | | 0.82 | |
| Class R | | | 1.44 | |
| Class W | | | 1.19 | |
| Class Z | | | 0.94 | |
Note 4. Federal Tax Information
The timing and character of income and capital gain distributions are determined in accordance with income tax regulations, which may differ from GAAP because of temporary or permanent book to tax differences.
For the year ended March 31, 2012, these differences are primarily due to differing treatment for proceeds from regulatory settlement, deferral/reversal of wash sale losses, excess distributions, Trustees’ deferred compensation, net operating loss reclassifications, Post-October capital losses, and late-year ordinary losses. To the extent these differences are permanent, reclassifications are made among the components of the Fund’s net assets in the Statement of Assets and Liabilities. Temporary differences do not require
reclassifications. In the Statement of Assets and Liabilities the following reclassifications were made:
| | | | |
| | | | |
Accumulated net investment loss | | $ | 19,325,729 | |
| Accumulated net realized loss | | | 782,920 | |
| Paid-in capital | | | (20,108,649 | ) |
Net investment loss and net realized gains (losses), as disclosed in the Statement of Operations, and net assets were not affected by this reclassification.
The tax character of distributions paid during the years indicated was as follows:
| | | | | | |
| Year ended March 31, | | 2012 | | 2011 | |
| Ordinary income | | $— | | | $— | |
| Long-term capital gains | | 80,337,581 | | | — | |
Short-term capital gain distributions, if any, are considered ordinary income distributions for tax purposes.
At March 31, 2012, the components of distributable earnings on a tax basis were as follows:
| | | | |
| | | | |
| Undistributed long-term capital gains | | | $— | |
| Unrealized appreciation | | | 1,714,348,115 | |
At March 31, 2012, the cost of investments for federal income tax purposes was $5,116,112,015 and the aggregate gross unrealized appreciation and depreciation based on that cost was:
| | | | |
| | | | |
| Unrealized appreciation | | $ | 1,916,924,310 | |
| Unrealized depreciation | | | (202,576,195 | ) |
| | | | |
| Net unrealized appreciation | | $ | 1,714,348,115 | |
The following capital loss carryforward, determined at March 31, 2012, may be available to reduce taxable income arising from future net realized gains on investments, if any, to the extent permitted by the Internal Revenue Code:
| | | | |
| | | | |
| Year of expiration | | Amount | |
Unlimited short-term | | $ | 122,252,653 | |
On December 22, 2010, the Regulated Investment Company Modernization Act of 2010 (the Act) was enacted, which changed various technical rules governing the tax treatment of regulated
24
Columbia Select Large Cap Growth Fund
March 31, 2012
investment companies. The changes are generally effective for taxable years beginning after the date of enactment. Under the Act, the Fund will be permitted to carry forward capital losses incurred in taxable years beginning after the date of enactment for an unlimited period. However, any losses incurred during those future taxable years will be required to be utilized prior to the losses incurred in pre-enactment taxable years, which carry an expiration date. As a result of this ordering rule, pre-enactment capital loss carryforwards may be more likely to expire unused.
Under current tax rules, Regulated Investment Companies can elect to treat certain late-year ordinary losses incurred and post-October capital losses (capital losses realized after October 31) as arising on the first day of the following taxable year. As of March 31, 2012, the Fund will elect to treat late-year ordinary losses of $8,268,799 and post-October capital losses of $108,108,535 as arising on April 1, 2012.
Management of the Fund has concluded that there are no significant uncertain tax positions that would require recognition in the financial statements. However, management’s conclusion may be subject to review and adjustment at a later date based on factors including, but not limited to, new tax laws, regulations, and administrative interpretations (including relevant court decisions). Generally, the Fund’s federal tax returns for the prior three fiscal years remain subject to examination by the Internal Revenue Service.
Note 5. Portfolio Information
The cost of purchases and proceeds from sales of securities, excluding short-term obligations, aggregated to $4,591,397,643 and $2,991,603,613, respectively, for the year ended March 31, 2012.
Note 6. Regulatory Settlements
During the year ended March 31, 2012, the Fund received $15,727 as a result of a settlement of an administrative proceeding brought by the Securities and Exchange Commission against an unaffiliated third party relating to market timing and/or late trading of mutual funds. This amount represented the Fund’s portion of the proceeds from the settlement (the Fund was not a party to the proceeding). The proceeds received by the Fund were recorded as an increase to additional paid-in capital.
Note 7. Lending of Portfolio Securities
Effective July 11, 2011, the Fund has entered into a Master Securities Lending Agreement (the Agreement) with JPMorgan
Chase Bank, N.A. (JPMorgan). The Agreement, which replaces the previous securities lending arrangement with State Street, authorizes JPMorgan as lending agent to lend securities to authorized borrowers in order to generate additional income on behalf of the Fund. Pursuant to the Agreement, the securities loaned are secured by cash or U.S. government securities equal to at least 100% of the market value of the loaned securities. Any additional collateral required to maintain those levels due to market fluctuations of the loaned securities is requested to be delivered the following business day. Cash collateral received is invested by the lending agent on behalf of the Fund into authorized investments pursuant to the Agreement. The investments made with the cash collateral are listed in the Portfolio of Investments. The values of such investments and any uninvested cash collateral are disclosed in the Statement of Assets and Liabilities along with the related obligation to return the collateral upon the return of the securities loaned.
Risks of delay in recovery of securities or even loss of rights in the securities may occur should the borrower of the securities fail financially. Risks may also arise to the extent that the value of the securities loaned increases above the value of the collateral received. JPMorgan will indemnify the Fund from losses resulting from a borrower’s failure to return a loaned security when due. Such indemnification does not extend to losses associated with declines in the value of cash collateral investments. The Investment Manager is not responsible for any losses incurred by the Fund in connection with the securities lending program. Loans are subject to termination by the Fund or the borrower at any time, and are, therefore, not considered to be illiquid investments.
Pursuant to the Agreement, the Fund receives income for lending its securities either in the form of fees or by earning interest on invested cash collateral, net of negotiated rebates paid to borrowers and fees paid to the lending agent for services provided and any other securities lending expenses. Net income earned from securities lending for the year ended March 31, 2012 is disclosed in the Statement of Operations. The Fund continues to earn and accrue interest and dividends on the securities loaned.
Prior to July 11, 2011, the Fund participated in a securities lending arrangement with State Street. Each security on loan was collateralized in an amount at least equal to the market value of the securities loaned plus accrued income from the investment of collateral. The income generated by the investment of the collateral, net of any fees remitted to State Street as the lending agent and borrower rebates, was paid to the Fund.
25
Columbia Select Large Cap Growth Fund
March 31, 2012
At March 31, 2012, securities valued at $39,658,500 were on loan, secured by cash collateral of $40,697,500 (which does not reflect calls for collateral made to borrowers by JPMorgan at period end) that is partially or fully invested in short-term securities or other cash equivalents.
Note 8. Custody Credits
Prior to July 11, 2011, the Fund had an agreement with its custodian bank under which custody fees may have been reduced by balance credits. These credits are recorded as part of expense reductions on the Statement of Operations. The Fund could have invested a portion of the assets utilized in connection with the expense offset arrangement in an income-producing asset if they had not entered into such an agreement. Subsequent to this date, the Fund may invest its daily balance in an affiliated money market fund as detailed below. For the period April 1, 2011 through July 10, 2011, these credits reduced total expenses by $126.
Note 9. Affiliated Money Market Fund
Effective July 11, 2011, the Fund may invest its daily cash balances in Columbia Short-Term Cash Fund, an affiliated money market fund established for the exclusive use by the Fund and other affiliated funds. The income earned by the Fund from such investments is included as “Dividends from affiliates” in the Statement of Operations. As an investing fund, the Fund indirectly bears its proportionate share of the expenses of Columbia Short-Term Cash Fund.
Note 10. Shareholder Concentration
At March 31, 2012, two unaffiliated shareholder accounts owned an aggregate of 64.4% of the outstanding shares of the Fund. The Fund has no knowledge about whether any portion of those shares was owned beneficially by such accounts. Subscription and redemption activity by concentrated accounts may have a significant effect on the operations of the Fund.
Note 11. Line of Credit
The Fund has entered into a revolving credit facility with a syndicate of banks led by JPMorgan, whereby the Fund may borrow for the temporary funding of shareholder redemptions or for other temporary or emergency purposes. The credit facility became effective on July 11, 2011, replacing a prior credit facility. The credit facility agreement, as amended, which is a collective agreement between the Fund and certain other funds managed by the Investment Manager, severally and not jointly, permits collective
borrowings up to $500 million. Pursuant to a December 13, 2011 amendment to the credit facility agreement, interest is charged to each participating fund based on its borrowings at a rate equal to the higher of (i) the overnight federal funds rate plus 1.00% or (i) the one-month LIBOR rate plus 1.00%. Each borrowing under the credit facility matures no later than 60 days after the date of borrowing. The Fund also pays a commitment fee equal to its pro rata share of the amount of the credit facility at a rate of 0.08% per annum. For the period July 11, 2011 through December 13, 2011, interest was charged to each participating fund based on its borrowings at a rate equal to the sum of the federal funds rate plus (i) 1.25% per annum plus (ii) if one-month LIBOR exceeds the federal funds rate, the amount of such excess. The Fund also paid a commitment fee equal to its pro rata share of the amount of the credit facility at a rate of 0.10% per annum.
For the period June 27, 2011 through July 8, 2011, the Fund and certain other funds managed by the Investment Manager participated in a $100,000 committed, unsecured revolving credit facility provided by State Street. For the period May 16, 2011 through June 26, 2011, the collective borrowing amount of the credit facility was $150 million. Prior to May 16, 2011, the collective borrowing amount of the credit facility was $225 million. Interest was charged to each fund based on its borrowings at a rate equal to the greater of the (i) federal funds rate plus 1.25% per annum or (ii) the overnight LIBOR rate plus 1.25% per annum. The Fund also paid a commitment fee equal to its pro rata share of the amount of the credit facility at a rate of 0.125% per annum.
The Fund had no borrowings during the year ended March 31, 2012.
Note 12. Subsequent Events
Management has evaluated the events and transactions that have occurred through the date the financial statements were issued. Other than as noted in Note 3 above and in the next paragraph, there were no items requiring adjustment of the financial statements or additional disclosure.
On April 20, 2012, one unaffiliated shareholder of the Fund redeemed $903,837,648, substantially all through an in-kind transaction. This amount represented approximately 14% of the Fund’s net assets as of that date.
Note 13. Information Regarding Pending and Settled Legal Proceedings
In December 2005, without admitting or denying the allegations, American Express Financial Corporation (AEFC, which is now
26
Columbia Select Large Cap Growth Fund
March 31, 2012
known as Ameriprise Financial, Inc. (Ameriprise Financial)) entered into settlement agreements with the Securities and Exchange Commission (SEC) and Minnesota Department of Commerce (MDOC) related to market timing activities. As a result, AEFC was censured and ordered to cease and desist from committing or causing any violations of certain provisions of the Investment Advisers Act of 1940, the Investment Company Act of 1940, and various Minnesota laws. AEFC agreed to pay disgorgement of $10 million and civil money penalties of $7 million. AEFC also agreed to retain an independent distribution consultant to assist in developing a plan for distribution of all disgorgement and civil penalties ordered by the SEC in accordance with various undertakings detailed at www.sec.gov/litigation/admin/ia-2451.pdf. Ameriprise Financial and its affiliates have cooperated with the SEC and the MDOC in these legal proceedings, and have made regular reports to the funds’ Boards of Trustees.
Ameriprise Financial and certain of its affiliates have historically been involved in a number of legal, arbitration and regulatory proceedings, including routine litigation, class actions, and governmental actions, concerning matters arising in connection with the conduct of their business activities. Ameriprise Financial believes that the Funds are not currently the subject of, and that
neither Ameriprise Financial nor any of its affiliates are the subject of, any pending legal, arbitration or regulatory proceedings that are likely to have a material adverse effect on the Funds or the ability of Ameriprise Financial or its affiliates to perform under their contracts with the Funds. Ameriprise Financial is required to make 10-Q, 10-K and, as necessary, 8-K filings with the Securities and Exchange Commission on legal and regulatory matters that relate to Ameriprise Financial and its affiliates. Copies of these filings may be obtained by accessing the SEC website at www.sec.gov.
There can be no assurance that these matters, or the adverse publicity associated with them, will not result in increased fund redemptions, reduced sale of fund shares or other adverse consequences to the Funds. Further, although we believe proceedings are not likely to have a material adverse effect on the Funds or the ability of Ameriprise Financial or its affiliates to perform under their contracts with the Funds, these proceedings are subject to uncertainties and, as such, we are unable to estimate the possible loss or range of loss that may result. An adverse outcome in one or more of these proceedings could result in adverse judgments, settlements, fines, penalties or other relief that could have a material adverse effect on the consolidated financial condition or results of operations of Ameriprise Financial.
27
Report of Independent Registered Public Accounting Firm
To the Trustees of Columbia Funds Series Trust I and the Shareholders of Columbia Select Large Cap Growth Fund
In our opinion, the accompanying statement of assets and liabilities, including the investment portfolio, and the related statements of operations and of changes in net assets and the financial highlights present fairly, in all material respects, the financial position of Columbia Select Large Cap Growth Fund (the “Fund”) (a series of Columbia Funds Series Trust I) at March 31, 2012, the results of its operations for the year then ended, the changes in its net assets for each of the two years in the period then ended and the financial highlights for the periods indicated, in conformity with accounting principles generally accepted in the United States of America. These financial statements and financial highlights (hereafter referred to as “financial statements”) are the responsibility of the Fund’s management. Our responsibility is to express an opinion on these financial statements based on our audits. We conducted our audits of these financial statements in accordance with the standards of the Public Company Accounting Oversight Board (United States). Those standards require that we plan and perform the audit to obtain reasonable assurance about whether the financial statements are free of material misstatement. An audit includes examining, on a test basis, evidence supporting the amounts and disclosures in the financial statements, assessing the accounting principles used and significant estimates made by management, and evaluating the overall financial statement presentation. We believe that our audits, which included confirmation of securities at March 31, 2012 by correspondence with the custodian, transfer agent and brokers, provide a reasonable basis for our opinion.
PricewaterhouseCoopers LLP
Minneapolis, Minnesota
May 22, 2012
28
Fund Governance
The Trustees serve terms of indefinite duration. The names, addresses and birth years of the Trustees and Officers of the Funds in Columbia Funds Series Trust I, the year each was first elected or appointed to office, their principal business occupations during at least the last five years, the number of Funds overseen by each Trustee and other directorships they hold are shown below. Each officer listed below serves as an officer of each Fund in Columbia Funds Series Trust I.
Independent Trustees
| | |
Name, address and year of birth,
Position with funds, Year first
elected or appointed to office | | Principal occupation(s) during past five years, Number of funds in Columbia Funds
Complex overseen by trustee, Other directorships Held |
| |
| Rodman L. Drake (born 1943) | | |
c/o Columbia Management Investment Advisers, LLC 225 Franklin Street Boston, MA 02110 Trustee (since 1994) and Chairman of the Board (since 2009) | | Independent consultant since 2010; Co-Founder of Baringo Capital LLC (private equity) from 1997 to 2008; CEO of Crystal River Capital, Inc. (real estate investment trust) from 2003 to 2010; Oversees 51; Jackson Hewitt Tax Service Inc. (tax preparation services) from 2004 to 2011; Celgene Corporation (global biotechnology company); Student Loan Corporation (student loan provider) from 2005 to 2010; Celgene Corporation (global biotechnology company); The Helios Funds and Brookfield Funds (closed-end funds); Crystal River Capital, Inc. from 2005 to 2010; Parsons Brinckerhoff from 1995 to 2008; and Apex Silver Mines Ltd. from 2007 to 2009 |
| |
| Douglas A. Hacker (born 1955) | | |
c/o Columbia Management Investment Advisers, LLC 225 Franklin Street Boston, MA 02110 Trustee (since 1996) | | Independent business executive since May 2006; Executive Vice President–Strategy of United Airlines from December 2002 to May 2006; President of UAL Loyalty Services (airline marketing company) from September 2001 to December 2002; Executive Vice President and Chief Financial Officer of United Airlines from July 1999 to September 2001. Oversees 51; Nash Finch Company (food distributor); Aircastle Limited (aircraft leasing); and SeaCube Container Leasing Ltd (container leasing) |
|
| Janet Langford Kelly (born 1957) |
c/o Columbia Management Investment Advisers, LLC 225 Franklin Street Boston, MA 02110 Trustee (since 1996) | | Senior Vice President, General Counsel and Corporate Secretary, ConocoPhillips (integrated energy company) since September 2007; Deputy General Counsel–Corporate Legal Services, ConocoPhillips from August 2006 to August 2007; Partner, Zelle, Hofmann, Voelbel, Mason & Gette LLP (law firm) from March 2005 to July 2006; Adjunct Professor of Law, Northwestern University, from September 2004 to June 2006; Director, UAL Corporation (airline) from February 2006 to July 2006; Chief Administrative Officer and Senior Vice President, Kmart Holding Corporation (consumer goods) from September 2003 to March 2004 Oversees 51; None |
|
| Nancy T. Lukitsh (born 1956) |
c/o Columbia Management Investment Advisers, LLC 225 Franklin Street Boston, MA 02110 Trustee (since 2011) | | Senior Vice President, Partner and Director of Marketing, Wellington Management Company, LLP (investment adviser) from 1997 to 2010; Chair, Wellington Management Investment Portfolios (commingled non-U.S. investment pools) from 2007 to 2010; Director, Wellington Trust Company, NA and other Wellington affiliates from 1997 to 2010. Oversees 51; None |
|
| William E. Mayer (born 1940) |
c/o Columbia Management Investment Advisers, LLC 225 Franklin Street Boston, MA 02110 Trustee (since 1994) | | Partner, Park Avenue Equity Partners (private equity) since February 1999; Dean and Professor, College of Business and Management, University of Maryland from 1992 to 1996. Oversees 51; DynaVox Inc. (speech creation); Lee Enterprises (print media), WR Hambrecht + Co. (financial service provider) from 2000 to 2012; BlackRock Kelso Capital Corporation (investment company) |
29
Fund Governance (continued)
Independent Trustees (continued)
| | |
Name, address and year of birth,
Position with funds, Year first
elected or appointed to office | | Principal occupation(s) during past five years, Number of funds in Columbia Funds
Complex overseen by trustee, Other directorships held |
| |
| David M. Moffett (born 1952) | | |
c/o Columbia Management Investment Advisers, LLC 225 Franklin Street Boston, MA 02110 Trustee (since 2011) | | Retired. Chief Executive Officer, Federal Home Loan Mortgage Corporation, from 2008 to 2009; Senior Adviser, Global Financial Services Group, Carlyle Group, Inc., from 2007 to 2008; Vice Chairman and Chief Financial Officer, U.S. Bancorp, from 1993 to 2007. Oversees 51; CIT Group Inc. (commercial and consumer finance), eBay Inc. (online trading community), MBIA Corp (financial service provider), E.W. Scripps Co. (print and television media), Building Materials Holding Corp. (building materials and construction services), and University of Oklahoma Foundation. |
| |
| Charles R. Nelson (born 1942) | | |
c/o Columbia Management Investment Advisers, LLC 225 Franklin Street Boston, MA 02110 Trustee (since 1981) | | Retired. Professor Emeritus, University of Washington, since 2011; Professor of Economics, University of Washington, from 1976 to 2011; Ford and Louisa Van Voorhis Professor of Political Economy, University of Washington, from 1993 to 2011; Adjunct Professor of Statistics, University of Washington, from 1980 to 2011; Associate Editor, Journal of Money Credit and Banking from 1993 to 2008; consultant on econometric and statistical matters. Oversees 51; None |
| |
| John J. Neuhauser (born 1943) | | |
c/o Columbia Management Investment Advisers, LLC 225 Franklin Street Boston, MA 02110 Trustee (since 1984) | | President, Saint Michael’s College, since August 2007; Director or Trustee of several non-profit organization, including Fletcher Allen Health Care, Inc.; University Professor, Boston College from November 2005 to August 2007; Academic Vice President and Dean of Faculties, Boston College from August 1999 to October 2005. Oversees 51; Liberty All-Star Equity Fund and Liberty All-Star Growth Fund, Inc. (closed-end funds) |
| |
| Patrick J. Simpson (born 1944) | | |
c/o Columbia Management Investment Advisers, LLC 225 Franklin Street Boston, MA 02110 Trustee (since 2000) | | Partner, Perkins Coie LLP (law firm). Oversees 51; None |
| |
| Anne-Lee Verville (born 1945) | | |
c/o Columbia Management Investment Advisers, LLC 225 Franklin Street Boston, MA 02110 Trustee (since 1998) | | Retired. General Manager–Global Education Industry from 1994 to 1997, President–Application Systems Division from 1991 to 1994, Chief Financial Officer–US Marketing & Services from 1988 to 1991, and Chief Information Officer from 1987 to 1988, IBM Corporation (computer and technology). Oversees 51; Enesco Group, Inc. (producer of giftware and home and garden decor products) from 2001 to 2006 |
The Statement of Additional Information includes additional information about the Trustees of the Funds and is available, without charge, upon request by calling 1-800-345-6611.
30
Fund Governance (continued)
Interested Trustee
| | |
Name, address and year of birth,
Position with funds, Year first
elected or appointed to office | | Principal occupation(s) during past five years, Number of funds in Columbia Funds
Complex overseen by trustee, Other directorships held |
| |
| William F. Truscott (born 1960) | | |
53600 Ameriprise Financial Center Minneapolis, MN 55474 Senior Vice President (since 2010) | | Chairman of the Board, Columbia Management Investment Advisers, LLC since May 2010 and February 2012, respectively (previously President, Chairman of the Board and Chief Investment Officer, from 2001 to April 2010); Chief Executive Officer, U.S. Asset Management & President, Annuities, Ameriprise Financial, Inc. since May 2010 (previously President–U.S. Asset Management and Chief Investment Officer from 2005 to April 2010, and Senior Vice President–Chief Investment Officer, from 2001 to 2005); Director, President and Chief Executive Officer, Ameriprise Certificate Company since 2006; Director, Columbia Management Investment Distributors, Inc. since May 2010 and February 2012, respectively (previously Chairman of the Board and Chief Executive Officer from 2008 to April 2010); Chairman of the Board and Chief Executive Officer, RiverSource Distributors, Inc. since 2006. Oversees 51; Columbia Funds Board. |
31
Fund Governance (continued)
Officers
| | |
| Name, Year of birth and address | | Principal occupation(s) during the past five years |
|
| J. Kevin Connaughton (born 1964) |
225 Franklin Street Boston, MA 02110 President (since 2009) | | Senior Vice President and General Manager–Mutual Fund Products, Columbia Management Investment Advisers, LLC since May 2010; President, Columbia Funds, since 2009, and RiverSource Funds, since May 2010 (previously Senior Vice President and Chief Financial Officer, Columbia Funds, from June 2008 to January 2009, Treasurer, Columbia Funds, from October 2003 to May 2008, and senior officer of various other affiliated funds since 2000); Managing Director, Columbia Management Advisors, LLC from December 2004 to April 2010. |
| |
| Michael G. Clarke (born 1969) | | |
225 Franklin Street Boston, MA 02110 Treasurer (since 2011) and Chief Financial Officer (since 2009) | | Vice President, Columbia Management Investment Advisers, LLC since May 2010; Managing Director of Fund Administration, Columbia Management Advisors, LLC, from September 2004 to April 2010; senior officer of Columbia Funds and affiliated funds since 2002. |
| |
| Scott R. Plummer (born 1959) | | |
5228 Ameriprise Financial Center Minneapolis, MN 55474 Senior Vice President, Assistant Secretary and Chief Legal Officer (since 2010) | | Chief Legal Officer and Assistant Secretary, Columbia Management Investment Advisers, LLC since June 2005; Vice President and Lead Chief Counsel–Asset Management, Ameriprise Financial, Inc. since May 2010 (previously Vice President and Chief Counsel–Asset Management, from 2005 to April 2010, and Vice President–Asset Management Compliance from 2004 to 2005); Vice President, Chief Counsel and Assistant Secretary, Columbia Management Investment Distributors, Inc. since 2008; Vice President, General Counsel and Secretary, Ameriprise Certificate Company since 2005; Chief Counsel, RiverSource Distributors, Inc. since 2006; Vice President, General Counsel and Secretary, RiverSource Funds, since December 2006; Senior Vice President, Secretary and Chief Legal Officer, Columbia Funds, since May 2010. |
| |
| Thomas P. McGuire (born 1972) | | |
225 Franklin Street Boston, MA 02110 Chief Compliance Officer (since 2012) | | Vice President–Asset Management Compliance, Columbia Management Investment Advisers, LLC since 2010; Chief Compliance Officer, Ameriprise Certificate Company, since September 2010; Compliance Executive, Bank of America, 2005-2010. |
| |
| William F. Truscott (born 1960) | | |
53600 Ameriprise Financial Center Minneapolis, MN 55474 Senior Vice President (since 2010) | | Chairman of the Board, Columbia Management Investment Advisers, LLC since May 2010 and February 2012, respectively (previously President, Chairman of the Board and Chief Investment Officer, from 2001 to April 2010); Chief Executive Officer, U.S. Asset Management & President, Annuities, Ameriprise Financial, Inc. since May 2010 (previously President–U.S. Asset Management and Chief Investment Officer from 2005 to April 2010, and Senior Vice President–Chief Investment Officer, from 2001 to 2005); Director, President and Chief Executive Officer, Ameriprise Certificate Company since 2006; Director, Columbia Management Investment Distributors, Inc. since May 2010 and February 2012, respectively (previously Chairman of the Board and Chief Executive Officer from 2008 to April 2010); Chairman of the Board and Chief Executive Officer, RiverSource Distributors, Inc. since 2006. |
32
Fund Governance (continued)
Officers (continued)
| | |
| Name, Year of birth and address | | Principal occupation(s) during the past five years |
|
| Colin Moore (born 1958) |
225 Franklin Street Boston, MA 02110 Senior Vice President (since 2010) | | Director and Chief Investment Officer, Columbia Management Investment Advisers, LLC since May 2010; Manager, Managing Director and Chief Investment Officer of Columbia Management Advisors, LLC from 2007 to April 2010; Head of Equities, Columbia Management Advisors, LLC from 2002 to 2007. |
| |
| Amy Johnson (born 1965) | | |
5228 Ameriprise Financial Center Minneapolis, MN 55474 Vice President (since 2010) | | Senior Vice President and Chief Operating Officer, Columbia Management Investment Advisers, LLC since May 2010 (previously Chief Administrative Officer, from 2009 until April 2010, Vice President–Asset Management and Trust Company Services, from 2006 to 2009, and Vice President–Operations and Compliance from 2004 to 2006). |
| |
| Joseph F. DiMaria (born 1968) | | |
225 Franklin Street Boston, MA 02110 Vice President (since 2011) and Chief Accounting Officer (since 2008) | | Vice President, Mutual Fund Administration, Columbia Management Investment Advisers, LLC, since May 2010; Director of Fund Administration, Columbia Management Advisors, LLC from January 2006 to April 2010; Head of Tax/Compliance and Assistant Treasurer, Columbia Management Advisors, LLC, from November 2004 to December 2005. |
| |
| Stephen T. Welsh (born 1957) | | |
225 Franklin Street Boston, MA 02110 Vice President (since 2006) | | President and Director, Columbia Management Investment Services Corp. since May 2010; President and Director, Columbia Management Services, Inc. from July 2004 to April 2010; Managing Director, Columbia Management Distributors, Inc. from August 2007 to April 2010. |
| |
| Paul D. Pearson (born 1956) | | |
5228 Ameriprise Financial Center Minneapolis, MN 55474 Vice President and Assistant Treasurer (since 2011) | | Vice President, Investment Accounting, Columbia Management Investment Advisers, LLC, since May 2010; Vice President, Managed Assets, Investment Accounting, Ameriprise Financial Corporation. |
| |
| Paul B. Goucher (born 1968) | | |
5228 Ameriprise Financial Center Minneapolis, MN 55474 Vice President and Assistant Secretary (since 2010) | | Vice President and Chief Counsel of Ameriprise Financial since January 2010 (formerly Vice President and Group Counsel from November 2008 to January 2010); Director, Managing Director and General Counsel of J. & W. Seligman & Co. Incorporated (Seligman) from July 2008 to November 2008 and Managing Director and Associate General Counsel of Seligman from January 2005 to July 2008. |
| |
| Christopher O. Petersen (born 1970) | | |
5228 Ameriprise Financial Center Minneapolis, MN 55474 Vice President (since 2010) and Secretary (since 2011) | | Vice President and Chief Counsel, Ameriprise Financial since January 2010 (formerly Vice President and Group Counsel or Counsel from April 2004 to January 2010); Assistant Secretary of RiverSource Funds since January 2007; officer of Columbia Funds and affiliated funds since 2007. |
| |
| Michael E. DeFao (born 1968) | | |
225 Franklin Street Boston, MA 02110 Vice President and Assistant Secretary (since 2011) | | Vice President and Chief Counsel, Ameriprise Financial since May 2010; Associate General Counsel Bank of America from June 2005 to April 2010. |
33
Board Consideration and Approval of Advisory Agreement
On March 7, 2012, the Board of Trustees (the “Board”) and a majority of the Trustees who are not interested persons (as defined in the Investment Company Act of 1940) of the Trust (the “Independent Trustees”) unanimously approved the continuation of the Investment Management Services Agreement (the “Advisory Agreement”) with Columbia Management Investment Advisers, LLC (the “Investment Manager”) with respect to Columbia Select Large Cap Growth Fund (the “Fund”), a series of the Trust. As detailed below, the Advisory Fees and Expenses Committee (the “Committee”) and the Board met on multiple occasions to review and discuss, both among themselves and with the management team of the Investment Manager, materials provided by the Investment Manager before determining to approve the continuation of the Advisory Agreement.
In connection with their deliberations regarding the continuation of the Advisory Agreement, the Committee and the Board requested and evaluated materials from the Investment Manager regarding the Fund and the Advisory Agreement, and discussed these materials with representatives of the Investment Manager at the Committee meeting held on March 6, 2012 and at the Board meeting held on March 7, 2012. In addition, the Board considers matters bearing on the Agreement at most of its other meetings throughout the year and meets regularly with senior management of the Funds and the Investment Manager. Through the Board’s Investment Oversight Committees, Trustees also meet with selected Fund portfolio managers and other investment personnel at various times throughout the year. The Committee and the Board also consulted with Fund counsel and with the Independent Trustees’ independent legal counsel, who advised on the legal standard for consideration by the Board and otherwise assisted the Board in its deliberations. On March 6, 2012, the Committee recommended that the Board approve the continuation of the Advisory Agreement. On March 7, 2012, the Board, including a majority of the Independent Trustees, voting separately, unanimously approved the continuation of the Advisory Agreement for the Fund.
The Committee and the Board considered all information that they, their legal counsel, or the Investment Manager believed reasonably necessary to evaluate and to determine whether to approve the continuation of the Advisory Agreement. In their deliberations, the Trustees did not identify any particular information that was all-important or controlling, and individual Trustees may have attributed different weights to the various factors. The information and factors considered by the Committee and the Board in
recommending for approval or approving the continuation of the Advisory Agreement for the Fund included the following:
| n | | Information on the investment performance of the Fund relative to the performance of the Fund’s benchmarks and the performance of a group of comparable mutual funds, as determined by an independent third-party data provider; |
| n | | Information on the Fund’s advisory fees and total expenses, including information comparing the Fund’s expenses to those of a group of comparable mutual funds, as determined by an independent third-party data provider; |
| n | | The Investment Manager’s agreement to contractually limit or cap total operating expenses for the Fund so that total operating expenses (excluding certain fees and expenses, such as transaction costs and certain other investment related expenses, interest, taxes, acquired fund fees and expenses, and extraordinary expenses) would not exceed the median expenses of a group of comparable funds (as determined from time to time, generally annually, by an independent third-party data provider); |
| n | | The terms and conditions of the Advisory Agreement, including that the advisory fee rates payable by the Fund would not change; |
| n | | The terms and conditions of other agreements and arrangements with affiliates of the Investment Manager relating to the operations of the Fund, including the Administrative Services Agreement, the Distribution Agreement and the Transfer and Dividend Disbursing Agent Agreement, noting in the case of the Transfer and Dividend Disbursing Agent Agreement certain proposed changes to the fee rates payable thereunder; |
| n | | Descriptions of various functions performed by the Investment Manager under the Advisory Agreement, including portfolio management and portfolio trading practices; |
| n | | Information regarding the management fees and investment performance of any comparable portfolios of other clients of the Investment Manager, including institutional separate accounts; and |
| n | | The profitability to the Investment Manager and its affiliates from their relationships with the Fund. |
Nature, Extent and Quality of Services to be Provided under the Advisory Agreement
The Committee and the Board considered the nature, extent and quality of services provided to the Fund by the Investment Manager
34
and its affiliates under the Advisory Agreement and under separate agreements for the provision of transfer agency and administrative services, and the resources dedicated to the Fund and the other Columbia Funds by the Investment Manager and its affiliates. The Committee and the Board considered, among other things, the Investment Manager’s ability to attract, motivate and retain highly qualified research, advisory and supervisory investment professionals (including personnel and other resources, compensation programs for personnel involved in fund management, reputation and other attributes), the portfolio management services provided by those investment professionals, the quality of the Investment Manager’s investment research capabilities and trade execution services, and the other resources that the Investment Manager devotes to the Fund. The Committee and the Board also considered the potential benefits to shareholders of investing in a mutual fund that is part of a fund complex offering exposure to a variety of asset classes and investment disciplines and providing a variety of fund and shareholder services.
The Committee and the Board also considered the professional experience and qualifications of the senior personnel of the Investment Manager. The Committee and the Board noted the compliance programs of and the compliance-related resources provided to the Fund by the Investment Manager and its affiliates, and considered the Investment Manager’s ability to provide administrative services to the Fund pursuant to a separate administrative services agreement, including the Investment Manager’s ability to coordinate the activities of the Fund’s other service providers. After reviewing these and related factors, the Committee and the Board concluded, within the context of their overall conclusions, that the expected nature, extent and quality of the services to be provided to the Fund under the Advisory Agreement supported the continuation of such agreement.
Investment Performance
The Committee and the Board reviewed information about the performance of the Fund over various time periods, including performance information relative to benchmarks and information based on reports of an independent third-party data provider that compared the performance of the Fund to the performance of a group of comparable mutual funds. The Committee and the Board also reviewed a description of the third party’s methodology for identifying the Fund’s peer groups for purposes of performance and expense comparisons. In the case of each Fund whose performance lagged that of a relevant peer group for certain (although not necessarily all) periods, the Committee and the Board concluded that
other factors relevant to performance were sufficient, in light of other considerations, to warrant continuation of the Fund’s Advisory Agreement. Those factors varied from fund to fund, but included one or more of the following: (i) that the Fund’s performance, although lagging in certain recent periods, was stronger over the longer term; (ii) that the underperformance was attributable, to a significant extent, to investment decisions that were reasonable and consistent with the Fund’s investment strategy and policies and that the Fund was performing within a reasonable range of expectations, given those investment decisions, market conditions and the Fund’s investment strategy; (iii) that the Fund’s performance was competitive when compared to other relevant performance benchmarks or peer groups; and (iv) that the Investment Manager had taken or was taking steps designed to help improve the Fund’s investment performance, including, but not limited to, replacing portfolio managers, enhancing the resources supporting the portfolio managers, or modifying investment strategies.
The Committee and the Board noted that, through December 31, 2011, the Fund’s performance was in the 65.2,7.4 and 11.4 percentile (where the best performance would be in the first percentile) of its category selected by an independent third-party data provider for the purposes of performance comparisons for the one-, three- and five- year periods, respectively.
The Committee and the Board also considered the Investment Manager’s performance and reputation generally, the Investment Manager’s historical responsiveness to Board concerns about performance and the Investment Manager’s willingness to take steps intended to improve performance. After reviewing these and related factors, the Committee and the Board concluded, within the context of their overall conclusions regarding the Advisory Agreement, that the performance of the Fund and the Investment Manager was sufficient, in light of other considerations, to warrant the continuation of the Advisory Agreement.
Investment Advisory Fee Rates and Other Expenses
The Committee and the Board considered the advisory fees to be charged to the Fund under the Advisory Agreement as well as the total expenses to be incurred by the Fund. In assessing the reasonableness of the fees under the Advisory Agreement, the Committee and the Board considered, among other information, the Fund’s advisory fee and its expected total expense ratio as a percentage of average daily net assets. The Committee and the Board noted that the Fund’s actual management fee and total net
35
expense ratio are ranked in the 2 and 2 quintiles, respectively, against the Fund’s expense universe as determined by an independent third-party data provider for purposes of expense comparison. The Committee and the Board also took into account the fee waiver and expense limitation arrangements agreed to by the Investment Manager, as noted above.
The Committee and the Board also considered the fact that the advisory fee rates payable by the Fund to the Investment Manager under the Advisory Agreement were the same as those currently paid by the Fund to the Investment Manager.
The Committee and the Board also received and considered information about the advisory fees charged by the Investment Manager to institutional separate accounts. In considering the fees charged to those accounts, the Committee and the Board took into account, among other things, the Investment Manager’s representations about the differences between managing mutual funds as compared to other types of accounts, including differences in the services provided, differences in the risk profile of such business for the Investment Manager and the additional resources required to manage mutual funds effectively. In evaluating the Fund’s advisory fees, the Committee and the Board also took into account the demands, complexity and quality of the investment management of the Fund.
After reviewing these and related factors, the Committee and the Board concluded, within the context of their overall conclusions, that the advisory fee rates and expenses of the Fund supported the continuation of the Advisory Agreement.
Costs of Services to be Provided and Profitability
The Committee and the Board also took note of the costs of the services provided (both on an absolute and relative basis) and the profitability to the Investment Manager and its affiliates in connection with their relationships with the Fund. In evaluating these considerations, the Committee and the Board took note of the advisory fees charged by the Investment Manager to other clients, including fees charged by the Investment Manager to any institutional separate account clients with similar investment strategies to those of the Fund.
The Committee and the Board also considered the compensation directly or indirectly received by the Investment Manager’s affiliates in connection with their relationships with the Fund. The Committee and the Board reviewed information provided by management as to
the profitability of the Investment Manager and its affiliates of their relationships with the Fund, and information about the allocation of expenses used to calculate profitability. When reviewing profitability, the Committee and the Board also considered court cases in which adviser profitability was an issue in whole or in part, the performance of the fund, the expense ratio of the fund, and the implementation of expense limitations with respect to the fund. The Committee and the Board also considered information provided by the Investment Manager regarding its financial condition and comparing its profitability to that of other asset management firms that are, or are subsidiaries of, publicly traded companies.
After reviewing these and related factors, the Committee and the Board concluded, within the context of their overall conclusions, that the profitability to the Investment Manager and its affiliates from their relationships with the Fund supported the continuation of the Advisory Agreement.
Economies of Scale
The Committee and the Board considered the potential existence of economies of scale in the provision by the Investment Manager of services to the Fund, to groups of related funds, and to the Investment Manager’s investment advisory clients as a whole, and whether those economies of scale were shared with the Fund through breakpoints in investment advisory fees or other means, such as expense limitation arrangements and additional investments by the Investment Manager in investment, trading and compliance resources. The Committee and the Board noted that the investment advisory fee schedules for the Fund contained breakpoints that would reduce the fee rate on assets above specified threshold levels.
In considering these issues, the Committee and the Board also considered the costs of the services provided (both on an absolute and relative basis) and the profitability to the Investment Manager and its affiliates from their relationships with the Fund, as discussed above. After reviewing these and related factors, the Committee and the Board concluded, within the context of their overall conclusions, that the extent to which economies of scale were expected to be shared with the Fund supported the continuation of the Advisory Agreement.
Other Benefits to the Investment Manager
The Committee and the Board received and considered information regarding “fall-out” or ancillary benefits received by the Investment Manager and its affiliates as a result of their relationships with the Fund, such as the engagement of the Investment Manager to provide
36
administrative services to the Fund and the engagement of the Investment Manager’s affiliates to provide distribution and transfer agency services to the Fund. The Committee and the Board considered that the Fund’s distributor retains a portion of the distribution fees from the Fund and receives a portion of the sales charges on sales or redemptions of certain classes of shares of the Fund. The Committee and the Board also considered the benefits of research made available to the Investment Manager by reason of brokerage commissions generated by the Fund’s securities transactions, and reviewed information about the Investment Manager’s practices with respect to allocating portfolio brokerage for brokerage and research services. The Committee and the Board considered the possible conflicts of interest associated with certain fall-out or other ancillary benefits and the reporting, disclosure and other processes that would be in place to address such possible
conflicts of interest. The Committee and the Board recognized that the Investment Manager’s profitability would be somewhat lower without these benefits.
Conclusion
The Committee and the Board reviewed all of the above considerations in reaching their decisions to recommend or approve the continuation of the Advisory Agreement. No single item was identified as paramount or controlling, and individual Trustees may have attributed different weights to various factors. Based on their evaluation of all factors that they deemed to be material, including those factors described above, and assisted by the advice of independent legal counsel, the Board, including a majority of the Independent Trustees, voting separately, unanimously approved the continuation of the Advisory Agreement.
37
[THIS PAGE INTENTIONALLY LEFT BLANK]
38
[THIS PAGE INTENTIONALLY LEFT BLANK]
39
[THIS PAGE INTENTIONALLY LEFT BLANK]
40
Important Information About This Report
The fund mails one shareholder report to each shareholder address. If you would like more than one report, please call shareholder services at 1-800-345-6611 and additional reports will be sent to you. This report has been prepared for shareholders of Columbia Select Large Cap Growth Fund.
A description of the policies and procedures that the fund uses to determine how to vote proxies and a copy of the fund’s voting records are available (i) at www.columbiamanagement.com, (ii) on the Securities and Exchange Commission’s website at www.sec.gov, and (iii) without charge, upon request, by calling 1-800-368-0346. Information regarding how the fund voted proxies relating to portfolio securities during the 12-month period ended June 30 is available from the SEC’s website. Information regarding how the fund voted proxies relating to portfolio securities is also available from the fund’s website, www.columbiamanagement.com.
The fund files a complete schedule of portfolio holdings with the SEC for the first and third quarters of each fiscal year on Form N-Q. The fund’s Form N-Q is available on the SEC’s website at www.sec.gov and may be reviewed and copied at the SEC’s Public Reference Room in Washington, D.C. Information on the operation of the Public Reference Room may be obtained by calling
1-800-SEC-0330.
Transfer Agent
Columbia Management Investment Services Corp.
P.O. Box 8081
Boston, MA 02266-8081
1-800-345-6611
Distributor
Columbia Management Investment
Distributors, Inc.
225 Franklin Street Boston, MA 02110
Investment Manager
Columbia Management Investment Advisers, LLC
225 Franklin Street Boston, MA 02110
41

Columbia Select Large Cap Growth Fund
P.O. Box 8081
Boston, MA 02266-8081
columbiamanagement.com
This information is for use with concurrent or prior delivery of a fund prospectus. Investors should consider the investment objectives, risks, charges and expenses of a mutual fund carefully before investing. For a free prospectus, which contains this and other important information about the funds, visit columbiamanagement.com. Read the prospectus carefully before investing. The Fund is distributed by Columbia Management Investment Distributors, Inc., member FINRA, and managed by Columbia Management Investment Advisers, LLC.
©2012 Columbia Management Investment Advisers, LLC. All rights reserved.
C-1161 C (5/12)

Columbia Select Small Cap Fund
Annual Report for the Period Ended March 31, 2012
Table of contents
The views expressed in this report reflect the current views of the respective parties. These views are not guarantees of future performance and involve certain risks, uncertainties and assumptions that are difficult to predict, so actual outcomes and results may differ significantly from the views expressed. These views are subject to change at any time based upon economic, market or other conditions and the respective parties disclaim any responsibility to update such views. These views may not be relied on as investment advice and, because investment decisions for a Columbia Fund are based on numerous factors, may not be relied on as an indication of trading intent on behalf of any particular Columbia Fund. References to specific securities should not be construed as a recommendation or investment advice.
President’s Message

Dear Shareholders,
A stock market rally that commenced in the fourth quarter of 2011 continued into 2012 in the United States and around the world, as all major market regions generated double-digit returns for the three-month period ended March 31, 2012. Volatility declined sharply as European debt fears quieted somewhat and sentiment improved. Returns in developed countries were buoyed by strong results in Germany, Belgium, Austria and the Nordic markets of Denmark, Finland, Norway and Sweden. Under the cloud of its own mounting debt problem, Spain was the only eurozone country to deliver a negative return during the three-month period. Solid economic growth and accommodative monetary policy helped boost gains in emerging markets. The rally in U.S. equities was largely driven by an expansion in “multiples”— an increase in stock prices relative to their earnings. By the end of the first
quarter of 2012, stocks no longer appeared as cheap as they were late in 2011. Bonds lagged stocks during the first quarter as investors responded to signs of an improved environment with a greater appetite for risk.
Concerns around the health of the global economy were centered in news headlines focusing on Washington D.C., Europe, China and the Middle East. In the United States, economic indicators remained mixed but generally indicated support for slow, sustainable economic growth. European policymakers have made progress in containing the eurozone debt crisis, though they still have not solved the issue of long-term solvency. The European Central Bank has lowered interest rates and flooded the financial system with liquidity that may provide breathing space for companies to restructure their balance sheets. These massive infusions of liquidity may whet the appetite for risk from investors around the world. However, it has delayed a true reckoning with the European financial situation, as concerns about Spain and Portugal continue to cloud the outlook. These structural challenges that persist in the developed world, and slowing growth in emerging market economies, leave the global economy in a fragile state. Domestic demand, combined with slowing inflationary trends, has also helped to shore up emerging market economies. Joblessness remains low and monetary conditions remain easy.
Despite the challenges and surprises of 2011, we see pockets of strength — and as a result, attractive opportunities — both here and abroad for 2012. We hope to help you capitalize on these opportunities with various articles in our 2012 Perspectives, which is available via the Market Insights tab at columbiamanagement.com. This publication showcases the strong research capabilities and experienced investment teams of Columbia Management and offers a diverse array of investment ideas based on our five key themes for 2012.
Other information and resources available at columbiamanagement.com include:
| n | | detailed up-to-date fund performance and portfolio information |
| n | | economic analysis and market commentary |
| n | | quarterly fund commentaries |
| n | | Columbia Management Investor, our award-winning quarterly newsletter for shareholders |
Thank you for your continued support of the Columbia Funds. We look forward to serving your investment needs for many years to come.
Best Regards,

J. Kevin Connaughton
President, Columbia Funds
Investors should consider the investment objectives, risks, charges and expenses of a mutual fund carefully before investing. For a free prospectus, which contains this and other important information about the funds, visit columbiamanagement.com. The prospectus should be read carefully before investing.
Columbia Funds are distributed by Columbia Management Investment Distributors, Inc., member FINRA, and managed by Columbia Management Investment Advisers, LLC.
© 2012 Columbia Management Investment Advisers, LLC. All rights reserved.
Fund Profile – Columbia Select Small Cap Fund
Summary
| n | | For the 12-month period that ended March 31, 2012, the fund’s Class A shares returned –9.16% without sales charge. |
| n | | The fund lagged its benchmarks, the Russell 2000 Growth Index1 and the Russell 2000 Index.2 |
| n | | Stock selection detracted the most from performance versus the Russell indices, but sector allocations also hampered relative results. |
Portfolio Management
Wayne M. Collette, lead manager has managed or co-managed the fund since January 2012. From 2001 until joining Columbia Management Investment Advisers, LLC (the Investment Manager) in May 2010, Mr. Collette was associated with the fund’s previous investment adviser or its predecessor as an investment professional.
George J. Myers has co-managed the fund since January 2012. From 2004 until joining the Investment Manager in May 2010, Mr. Myers was associated with the fund’s previous investment adviser or its predecessor as an investment professional.
Lawrence W. Lin has co-managed the fund since January 2012. From 2006 until joining the Investment Manager in May 2010, Mr. Lin was associated with the fund’s previous investment adviser or its predecessor as an investment professional.
Brian D. Neigut has co-managed the fund since January 2012. From 2007 until joining the Investment Manager in May 2010, Mr. Neigut was associated with the fund’s previous investment adviser or its predecessor as an investment professional.
| 1 | The Russell 2000 Growth Index measures the performance of those Russell 2000 Index companies with higher price-to-book ratios and higher forecasted growth values. |
| 2 | The Russell 2000 Index measures the performance of the 2,000 smallest of the 3,000 largest US companies, based on market capitalization. |
Indices are not available for investment, are not professionally managed and do not reflect sales charges, fees, brokerage commissions, taxes or other expenses of investing. Securities in the fund may not match those in an index.
Performance data quoted represents past performance and current performance may be lower or higher. Past performance is no guarantee of future results. The investment return and principal value will fluctuate so that shares, when redeemed, may be worth more or less than the original cost. Please visit www.columbiamanagement.com for daily and most recent month-end performance updates.
Summary
1-year return as of 03/31/12
| | |
| |
 | | –9.16% Class A shares (without sales charge) |
| |
 | | +0.68% Russell 2000 Growth Index |
| |
| | –0.18% Russell 2000 Index |
|
Morningstar Style Box™ |
|
Equity Style |
|
The Morningstar Style Box™ is based on the fund’s portfolio holdings. For equity funds, the vertical axis shows the market capitalization of the stocks owned, and the horizontal axis shows investment style (value, blend, or growth). Information shown is based on the most recent data provided by Morningstar.
© 2012 Morningstar, Inc. All rights reserved. The Morningstar information contained herein: (1) is proprietary to Morningstar and/or its content providers; (2) may not be copied or distributed; and (3) is not warranted to be accurate, complete or timely. Neither Morningstar nor its content providers are responsible for any damages or losses arising from any use of this information.
1
Performance Information – Columbia Select Small Cap Fund
Performance data quoted represents past performance and current performance may be lower or higher. Past performance is no guarantee of future results. The investment return and principal value will fluctuate so that shares, when redeemed, may be worth more or less than the original cost. Please visit www.columbiamanagement.com for daily and most recent month-end performance updates.
|
| Performance of a $10,000 investment 04/01/02 – 03/31/12 |
The chart above shows the change in value of a hypothetical $10,000 investment in Class A shares of Columbia Select Small Cap Fund during the stated time period, and does not reflect the deduction of taxes that a shareholder may pay on fund distributions or on the redemption of fund shares.
| | | | | | | | |
| Performance of a $10,000 investment 04/01/02 – 03/31/12 ($) | |
| | |
| Sales charge | | without | | | with | |
Class A* | | | 16,995 | | | | 16,023 | |
Class C* | | | 15,765 | | | | 15,765 | |
Class R* | | | 16,580 | | | | n/a | |
Class Z | | | 17,487 | | | | n/a | |
| | | | | | | | | | | | | | | | | | | | | | | | |
| Average annual total return as of 3/31/12 (%) | |
| | | | |
| Share class | | A* | | | C* | | �� | R* | | | Z | |
| Inception | | 09/28/07 | | | 09/28/07 | | | 12/31/04 | | | 12/31/92 | |
| Sales charge | | without | | | with | | | without | | | with | | | without | | | without | |
1-year | | | –9.16 | | | | –14.38 | | | | –9.91 | | | | –10.81 | | | | –9.41 | | | | –8.99 | |
5-year | | | –0.50 | | | | –1.67 | | | | –1.25 | | | | –1.25 | | | | –0.78 | | | | –0.28 | |
10-year | | | 5.45 | | | | 4.83 | | | | 4.66 | | | | 4.66 | | | | 5.19 | | | | 5.75 | |
The “with sales charge” returns include the maximum initial sales charge of 5.75% for Class A shares, the applicable contingent deferred sales charge of 1.00% for Class C shares for the first year only. The “without sales charge” returns do not include the effect of sales charges. If they had, returns would be lower.
Performance results reflect any fee waivers or reimbursements of fund expenses by Columbia Management Investment Advisers, LLC and/or any of its affiliates. Absent these fee waivers or expense reimbursement arrangements, performance results would have been lower.
All results shown assume reinvestment of distributions. Class Z shares are sold at net asset value with no distribution and service (Rule 12b-1) fees. Class R shares are sold at net asset value with distribution (Rule 12b-1) fees. Class R and Class Z shares have limited eligibility and the investment minimum requirements may vary. Please see the fund’s prospectuses for details. Performance for different share classes will vary based on differences in sales charges and fees associated with each class.
The tables do not reflect the deduction of taxes that a shareholder may pay on fund distributions or on the redemption of fund shares.
| * | The returns shown for periods prior to the share class inception date (including returns since inception, which are since fund inception) include the returns of the fund’s oldest share class. These returns are adjusted to reflect any higher class-related operating expenses of the newer share classes, as applicable. Please visit columbiamanagement.com/mutual-funds/appended-performance for more information. |
2
Fund Expense Example – Columbia Select Small Cap Fund
As an investor, you incur two types of costs. There are transaction costs, which generally include sales charges on purchases and may include redemption fees. There are also ongoing costs, which generally include management fees, distribution and service (Rule 12b-1) fees, and other fund expenses. The following information is intended to help you understand your ongoing costs (in dollars) of investing in the Fund and to help you compare these costs with the ongoing costs of investing in other mutual funds.
Analyzing your fund’s expenses
To illustrate these ongoing costs, we have provided examples and calculated the expenses paid by investors in each share class of the Fund during the period. The actual and hypothetical information in the table is based on an initial investment of $1,000 at the beginning of the period indicated and held for the entire period. Expense information is calculated two ways and each method provides you with different information. The amount listed in the “Actual” column is calculated using the Fund’s actual operating expenses and total return for the period. You may use the Actual information, together with the amount invested, to estimate the expenses that you paid over the period. Simply divide your account value by $1,000 (for example, an $8,600 account value divided by $1,000 = 8.6), then multiply the results by the expenses paid during the period under the Actual column. The amount listed in the “Hypothetical” column assumes a 5% annual rate of return before expenses (which is not the Fund’s actual return) and then applies the Fund’s actual expense ratio for the period to the hypothetical return. You should not use the hypothetical account values and expenses to estimate either your actual account balance at the end of the period or the expenses you paid during the period. See “Compare with other funds” below for details on how to use the hypothetical data.
Compare with other funds
Since all mutual funds are required to include the same hypothetical calculations about expenses in shareholder reports, you can use this information to compare the ongoing cost of investing in the Fund with other funds. To do so, compare the hypothetical example with the 5% hypothetical examples that appear in the shareholder reports of other funds. As you compare hypothetical examples of other funds, it is important to note that hypothetical examples are meant to highlight the ongoing costs of investing in a fund only and do not reflect any transaction costs, such as sales charges, or redemption or exchange fees. Therefore, the hypothetical calculations are useful in comparing ongoing costs only, and will not help you determine the relative total costs of owning different funds. If transaction costs were included in these calculations, your costs would be higher.
| | | | | | | | | | | | | | | | | | | | | | | | | | | | |
| 10/01/11 – 03/31/12 | | | | |
| | | | |
| | | Account value at the
beginning of the period ($) | | | Account value at the end
of the period ($) | | | Expenses paid during the period ($) | | | Fund’s annualized
expense ratio (%) | |
| | | Actual | | | Hypothetical | | | Actual | | | Hypothetical | | | Actual | | | Hypothetical | | | Actual | |
Class A | | | 1,000.00 | | | | 1,000.00 | | | | 1,290.20 | | | | 1,018.15 | | | | 7.69 | | | | 6.77 | | | | 1.35 | |
Class C | | | 1,000.00 | | | | 1,000.00 | | | | 1,284.90 | | | | 1,014.37 | | | | 11.99 | | | | 10.57 | | | | 2.11 | |
Class R | | | 1,000.00 | | | | 1,000.00 | | | | 1,288.20 | | | | 1,016.91 | | | | 9.10 | | | | 8.02 | | | | 1.60 | |
Class Z | | | 1,000.00 | | | | 1,000.00 | | | | 1,291.60 | | | | 1,019.44 | | | | 6.21 | | | | 5.47 | | | | 1.09 | |
Expenses paid during the period are equal to the annualized expense ratio for each class as indicated above, multiplied by the average account value over the period and then multiplied by the number of days in the Fund’s most recent fiscal half year and divided by 366.
Expenses do not include fees and expenses incurred indirectly by the Fund from the underlying funds in which the Fund may invest (also referred to as “acquired funds”), including affiliated and non-affiliated pooled investments vehicles (including mutual funds and exchange traded funds).
Had Columbia Management Investment Advisers, LLC and/or certain of its affiliates not waived/reimbursed certain fees and expenses, account value at the end of the period would have been reduced.
3
Portfolio Managers’ Report – Columbia Select Small Cap Fund
Performance data quoted represents past performance and current performance may be lower or higher. Past performance is no guarantee of future results. The investment return and principal value will fluctuate so that shares, when redeemed, may be worth more or less than the original cost. Please visit www.columbiamanagement.com for daily and most recent month-end performance updates.
| | | | |
| Net asset value per share | |
| |
as of 03/31/12 ($) | | | | |
Class A | | | 16.85 | |
Class C | | | 16.28 | |
Class R | | | 16.36 | |
Class Z | | | 17.01 | |
On January 27, 2012, the Russell 2000 Growth Index was added as a benchmark for the fund. The benchmark was added as the Investment Manager believes it provides a useful performance comparison, given the fund’s investment in companies that have the potential for long-term, above-average earnings growth. On the same date, the fund’s management team also changed. Wayne M. Collette, George J. Myers, Lawrence W. Lin and Brian D. Neigut were named managers of the fund. Effective February 17, 2012, the fund was closed to most new investors and new accounts.
For the 12-month period that ended March 31, 2012, the fund’s Class A shares returned –9.16% without sales charge. The fund’s benchmarks, the Russell 2000 Growth Index and the Russell 2000 Index, returned 0.68% and –0.18%, respectively, over the same period. Both stock selection and sector weights contributed to disappointing performance relative to the benchmarks. For most of the period, the fund was concentrated in 30-40 small-cap stocks with attractive valuations and what we viewed as strong fundamentals.
Challenging year for the economy and for small-cap stocks
During the first half of the 12-month period, a series of natural disasters in Japan, Europe’s debt problems and wrangling in Washington over the federal budget and the national debt dominated world headlines. U.S. economic news was lackluster and job growth was disappointing. However, the pace of growth picked up in the second half of the period and prospects brightened as fears of a lapse back into recession faded.
Consumer confidence improved as the labor market added more than a million new jobs between October 2011 and March 2012, while the jobless rate fell to 8.2%. Household net worth also picked up as the equity markets rebounded. Headline inflation — which tracks a broad range of consumer expenditures, including food and energy — moved marginally higher. Despite a modest slowdown in manufacturing activity late in the summer of 2011, manufacturing activity stabilized and expanded into 2012. Housing continues to be the one nagging weak spot in the economy. Yet, there is hope that a bottom in the housing market is in sight.
In this environment, the U.S. stock market experienced significant volatility, especially within the small-cap universe. The Russell 2000 Index and the Russell 2000 Growth Index ended the year relatively flat, after recovering from a sharp slide during the summer of 2011, which was triggered by worries over a double-dip recession in the United States and a continuing debt crisis in Europe. Small-cap stocks ended the year behind large caps.
Biggest underperformance from consumer discretionary and financials
The fund lost the most ground relative to the Russell 2000 Growth Index from disappointing stock picks in the consumer discretionary and financials sectors. Among individual detractors within consumer discretionary was Vera Bradley (2.0% of net assets), whose products include women’s handbags, soft luggage and accessories. The company had begun building a presence in Japan when the earthquake and tsunami hit in March 2011, adding to start-up costs and delaying store openings. The stock declined as the company reported weak quarterly results and lowered earnings guidance for its upcoming fiscal year. Within financials, untimely ownership of Utah-based regional bank Zions Bancorp detracted. The stock fell sharply during last
4
Portfolio Managers’ Report (continued) – Columbia Select Small Cap Fund
summer’s downturn, and we exited the position. An underweight and disappointing stock selection in energy also hurt relative performance. Shares of exploration-and-production company Comstock Resources posted a steep decline as investors reacted negatively to a recent land acquisition in Texas. Sizable underweights in health care and consumer staples, along with stock picks in health care and materials, further hindered relative performance. Elsewhere, disappointments included STEC, which makes large-scale computer memory products. Its shares plunged as a component shortage in the wake of the Japan earthquake and tsunami led to sharp price competition, an earnings shortfall and market share loss. Zions and Comstock were not in the Russell 2000 Growth Index, and Comstock and STEC were sold from the portfolio in 2011.
Modest outperformance from industrials and technology
Positioning in industrials aided returns. Top contributors there included railroad operator Kansas City Southern (2.4% of net assets), whose stock benefited from a sharp rebound in volumes as the economic outlook improved in the second half of the period. Kansas City was not in the Russell 2000 Growth Index. In technology, which accounted for more than 25% of assets, winners included Fair Isaac (4.8% of net assets), a company that supplies credit scoring and credit account management products and services, and Manhattan Associates (4.3% of net assets), which provides supply chain management software and services. Fair Isaac’s shares benefited as growth in credit card volumes and increased consumer spending drove strong earnings results, while Manhattan’s stock gained from consistently high earnings and accelerating sales growth. Elsewhere, standouts included athenahealth (2.8% of net assets), a leading provider of medical billing services and electronic medical record management via a cloud network. Growing demand for its services in the wake of increased health care regulations pushed the stock sharply higher.
Cautiously optimistic outlook
While many of the issues that worried us in 2011 are still concerns, we are cautiously optimistic about the market’s prospects, given the likelihood in the United States of slow but steady economic growth, moderate inflation and improving employment. We are confident that we can find opportunities to invest in companies with strong balance sheets and improving profits in areas that stand to benefit from pent-up demand, such as autos, housing, technology and apparel. Going forward, we plan to maintain a more diversified portfolio with sectors weights near those of the Russell 2000 Growth Index, significantly more holdings and slightly smaller average market capitalization. We expect to focus on companies with expanding profit margins and market share as well as products and services that can command premium pricing.
Portfolio characteristics and holdings are subject to change periodically and may not be representative of current characteristics and holdings. The outlook for the fund may differ from that presented for other Columbia Funds.
Equity securities are affected by stock market fluctuations that occur in response to economic and business developments.
Stocks of small-cap companies pose special risks, including possible illiquidity and greater price volatility than stocks of larger, more established companies.
| | | | |
| Portfolio Breakdown1 | |
| |
as of 03/31/12 (%) | | | | |
Consumer Discretionary | | | 21.9 | |
Consumer Staples | | | 3.8 | |
Energy | | | 8.0 | |
Financials | | | 4.0 | |
Health Care | | | 9.2 | |
Industrials | | | 18.5 | |
Information Technology | | | 33.9 | |
Other2 | | | 0.7 | |
| | 1 | Percentages indicated are based upon total investments (excluding Investments of Cash Collateral Received for Securities on Loan). The Fund’s composition is subject to change. |
| | 2 | Includes investments in affiliated money market fund. |
| | | | |
| Top Ten Holdings1 | |
| |
as of 03/31/12 (%) | | | | |
Fair Isaac Corp. | | | 4.9 | |
Manhattan Associates, Inc. | | | 4.4 | |
Plantronics, Inc. | | | 4.3 | |
Endo Pharmaceuticals Holdings, Inc. | | | 4.2 | |
Harman International Industries, Inc. | | | 4.1 | |
Power Integrations, Inc. | | | 4.1 | |
CACI International, Inc.,
Class A | | | 4.0 | |
Meritage Homes Corp. | | | 3.9 | |
NeuStar, Inc., Class A | | | 3.7 | |
Chicago Bridge & Iron Co. NV | | | 3.5 | |
| | 1 | Percentages indicated are based upon total investments (excluding Investments of Cash Collateral Received for Securities on Loan and affiliated money market fund). |
Because the fund is actively managed, there is no guarantee the fund will continue to maintain the holdings breakdown listed.
The fund’s holdings and their weights within the portfolio may change as market conditions change.
5
Portfolio of Investments – Columbia Select Small Cap Fund
March 31, 2012
(Percentages represent value of investments compared to net assets)
| | | | | | | | |
| Issuer | | Shares | | | Value | |
Common Stocks 98.7% | | | | | | | | |
CONSUMER DISCRETIONARY 21.8% | | | | | | | | |
Diversified Consumer Services 2.4% | | | | | | | | |
Sotheby’s | | | 160,000 | | | | $6,294,400 | |
Hotels, Restaurants & Leisure 3.4% | | | | | | | | |
Bravo Brio Restaurant Group, Inc.(a)(b) | | | 248,355 | | | | 4,957,166 | |
Life Time Fitness, Inc.(a)(b) | | | 80,000 | | | | 4,045,600 | |
| | | | | | | | |
Total | | | | | | | 9,002,766 | |
Household Durables 9.7% | | | | | | | | |
Harman International Industries, Inc. | | | 230,000 | | | | 10,766,300 | |
Meritage Homes Corp.(a)(b) | | | 380,000 | | | | 10,282,800 | |
Ryland Group, Inc. (The)(b) | | | 240,000 | | | | 4,627,200 | |
| | | | | | | | |
Total | | | | | | | 25,676,300 | |
Media 1.4% | | | | | | | | |
Meredith Corp.(b) | | | 120,000 | | | | 3,895,200 | |
Textiles, Apparel & Luxury Goods 4.9% | | | | | | | | |
Oxford Industries, Inc. | | | 152,600 | | | | 7,755,132 | |
Vera Bradley, Inc.(a)(b) | | | 172,800 | | | | 5,216,832 | |
| | | | | | | | |
Total | | | | | | | 12,971,964 | |
TOTAL CONSUMER DISCRETIONARY | | | | | | | 57,840,630 | |
CONSUMER STAPLES 3.7% | | | | | | | | |
Food & Staples Retailing 2.1% | | | | | | | | |
Fresh Market, Inc. (The)(a)(b) | | | 120,000 | | | | 5,754,000 | |
Personal Products 1.6% | | | | | | | | |
Elizabeth Arden, Inc.(a) | | | 120,000 | | | | 4,197,600 | |
TOTAL CONSUMER STAPLES | | | | | | | 9,951,600 | |
ENERGY 7.9% | | | | | | | | |
Energy Equipment & Services 2.6% | | | | | | | | |
Helmerich & Payne, Inc.(b) | | | 128,296 | | | | 6,921,569 | |
Oil, Gas & Consumable Fuels 5.3% | | | | | | | | |
Carrizo Oil & Gas, Inc.(a)(b) | | | 300,000 | | | | 8,478,000 | |
SM Energy Co. | | | 80,926 | | | | 5,727,133 | |
| | | | | | | | |
Total | | | | | | | 14,205,133 | |
TOTAL ENERGY | | | | | | | 21,126,702 | |
FINANCIALS 4.0% | | | | | | | | |
Capital Markets 0.8% | | | | | | | | |
Greenhill & Co., Inc.(b) | | | 50,000 | | | | 2,182,000 | |
Commercial Banks 3.2% | | | | | | | | |
City National Corp. | | | 160,000 | | | | 8,395,200 | |
TOTAL FINANCIALS | | | | | | | 10,577,200 | |
HEALTH CARE 9.2% | | | | | | | | |
Health Care Providers & Services 2.3% | | | | | | | | |
Air Methods Corp.(a)(b) | | | 70,000 | | | | 6,107,500 | |
Health Care Technology 2.8% | | | | | | | | |
athenahealth, Inc.(a)(b) | | | 100,000 | | | | 7,412,000 | |
Pharmaceuticals 4.1% | | | | | | | | |
Endo Pharmaceuticals Holdings, Inc.(a) | | | 280,970 | | | | 10,881,968 | |
TOTAL HEALTH CARE | | | | | | | 24,401,468 | |
| | | | | | | | |
| Issuer | | Shares | | | Value | |
Common Stocks (continued) | | | | | | | | |
INDUSTRIALS 18.4% | | | | | | | | |
Building Products 6.5% | | | | | | | | |
Quanex Building Products Corp.(b) | | | 500,000 | | | | $8,815,000 | |
Simpson Manufacturing Co., Inc.(b) | | | 260,000 | | | | 8,385,000 | |
| | | | | | | | |
Total | | | | | | | 17,200,000 | |
Construction & Engineering 3.5% | | | | | | | | |
Chicago Bridge & Iron Co. NV | | | 214,655 | | | | 9,270,949 | |
Machinery 2.5% | | | | | | | | |
Robbins & Myers, Inc. | | | 130,000 | | | | 6,766,500 | |
Marine 0.5% | | | | | | | | |
Costamare, Inc. | | | 89,183 | | | | 1,228,050 | |
Professional Services 3.0% | | | | | | | | |
FTI Consulting, Inc.(a) | | | 210,000 | | | | 7,879,200 | |
Road & Rail 2.4% | | | | | | | | |
Kansas City Southern(a) | | | 89,888 | | | | 6,444,071 | |
TOTAL INDUSTRIALS | | | | | | | 48,788,770 | |
INFORMATION TECHNOLOGY 33.7% | | | | | | | | |
Communications Equipment 4.3% | | | | | | | | |
Plantronics, Inc. | | | 280,000 | | | | 11,272,800 | |
Computers & Peripherals 1.9% | | | | | | | | |
Synaptics, Inc.(a) | | | 140,000 | | | | 5,111,400 | |
Internet Software & Services 0.1% | | | | | | | | |
Millennial Media, Inc.(a) | | | 15,275 | | | | 358,962 | |
IT Services 10.8% | | | | | | | | |
CACI International, Inc., Class A(a)(b) | | | 170,000 | | | | 10,589,300 | |
Forrester Research, Inc.(b) | | | 260,000 | | | | 8,424,000 | |
NeuStar, Inc., Class A(a) | | | 260,000 | | | | 9,685,000 | |
| | | | | | | | |
Total | | | | | | | 28,698,300 | |
Semiconductors & Semiconductor Equipment 4.1% | |
Power Integrations, Inc.(b) | | | 290,000 | | | | 10,764,800 | |
Software 12.5% | | | | | | | | |
Fair Isaac Corp. | | | 290,000 | | | | 12,731,000 | |
Kenexa Corp.(a) | | | 290,000 | | | | 9,059,600 | |
Manhattan Associates, Inc.(a) | | | 240,000 | | | | 11,407,200 | |
| | | | | | | | |
Total | | | | | | | 33,197,800 | |
TOTAL INFORMATION TECHNOLOGY | | | | | | | 89,404,062 | |
Total Common Stocks | | | | | | | | |
(Cost: $183,371,363) | | | | | | | $262,090,432 | |
| |
Money Market Funds 0.7% | |
Columbia Short-Term Cash Fund, 0.161%(c)(d) | | | 1,903,692 | | | | $1,903,692 | |
Total Money Market Funds | | | | | | | | |
(Cost: $1,903,692) | | | | | | | $1,903,692 | |
The Accompanying Notes to Financial Statements are an integral part of this statement.
6
Columbia Select Small Cap Fund
March 31, 2012
(Percentages represent value of investments compared to net assets)
| | | | | | | | | | | | |
| Issuer | | Effective
Yield | | | Principal | | | Value | |
Investments of Cash Collateral Received for Securities on Loan 12.9% | |
Certificates of Deposit 0.4% | |
Norinchukin Bank | |
05/21/12 | | | 0.470 | % | | | $1,000,000 | | | | $1,000,000 | |
Other Short-Term Obligations 0.7% | |
Natixis Financial Products LLC | |
04/02/12 | | | 0.450 | % | | | 2,000,000 | | | | 2,000,000 | |
Repurchase Agreements 11.8% | |
Citigroup Global Markets, Inc.
dated 03/30/12, matures 04/02/12,
repurchase price $10,000,150(e) | |
| | | 0.180 | % | | | 10,000,000 | | | | 10,000,000 | |
Mizuho Securities USA, Inc.
dated 03/30/12, matures 04/02/12,
repurchase price $5,000,113(e) | |
| | | 0.270 | % | | | 5,000,000 | | | | 5,000,000 | |
| | | | | | | | | | | | |
| Issuer | | Effective
Yield | | | Principal | | | Value | |
Investments of Cash Collateral Received for Securities on Loan (continued) | |
Repurchase Agreements (cont.) | |
Nomura Securities
dated 03/30/12, matures 04/02/12,
repurchase price $10,000,167(e) | |
| | | 0.200 | % | | | $10,000,000 | | | | $10,000,000 | |
UBS Securities LLC
dated 03/30/12, matures 04/02/12,
repurchase price $6,390,744(e) | |
| | | 0.180 | % | | | 6,390,649 | | | | 6,390,649 | |
| | | | | | | | | | | | |
Total | | | | | | | | | | | 31,390,649 | |
| | | | | | | | |
Total Investments of Cash Collateral Received for Securities on Loan | |
(Cost: $34,390,649) | | | $34,390,649 | |
Total Investments | | | | |
(Cost: $219,665,704) | | | $298,384,773 | |
Other Assets & Liabilities, Net | | | (32,774,539 | ) |
Net Assets | | | $265,610,234 | |
| | |
Notes to Portfolio of Investments |
| (b) | At March 31, 2012, security was partially or fully on loan. |
| (c) | The rate shown is the seven-day current annualized yield at March 31, 2012. |
| (d) | Investments in affiliates during the year ended March 31, 2012: |
| | | | | | | | | | | | | | | | | | | | | | | | | | | | |
| Issuer | | Beginning
Cost | | | Purchase | | | Sales
Proceeds | | | Realized
Gain/Loss | | | Ending Cost | | | Dividends | | | Value | |
Columbia Short-Term Cash Fund | | | $— | | | | $67,325,136 | | | | $(65,421,444 | ) | | | $— | | | | $1,903,692 | | | | $1,359 | | | | $1,903,692 | |
| (e) | The table below represents securities received as collateral for repurchase agreements. This collateral is deposited with the Fund’s custodian and, pursuant to the terms of the repurchase agreement, must have an aggregate market value greater than or equal to the repurchase price plus accrued interest at all times. The value of securities and/or cash held as collateral for repurchase agreements is monitored on a daily basis to ensure the proper level of collateral. |
Citigroup Global Markets, Inc. (0.180%)
| | | | |
| Security Description | | Value | |
Fannie Mae REMICS | | | $2,883,323 | |
Fannie Mae-Aces | | | 318,109 | |
Freddie Mac REMICS | | | 2,769,436 | |
Ginnie Mae II Pool | | | 270,163 | |
Government National Mortgage Association | | | 3,958,969 | |
Total Market Value of Collateral Securities | | | $10,200,000 | |
| |
| Mizuho Securities USA, Inc. (0.270%) | | | | |
| Security Description | | Value | |
Ginnie Mae II Pool | | | $49,286 | |
Government National Mortgage Association | | | 368,838 | |
United States Treasury Note/Bond | | | 4,681,876 | |
Total Market Value of Collateral Securities | | | $5,100,000 | |
The Accompanying Notes to Financial Statements are an integral part of this statement.
7
Columbia Select Small Cap Fund
March 31, 2012
|
Notes to Portfolio of Investments (continued) |
| | | | |
| Nomura Securities (0.200%) | | | | |
| Security Description | | Value | |
Fannie Mae Pool | | | $5,713,592 | |
Freddie Mac Gold Pool | | | 4,486,408 | |
Total Market Value of Collateral Securities | | | $10,200,000 | |
| |
| UBS Securities LLC (0.180%) | | | | |
| Security Description | | Value | |
Ginnie Mae I Pool | | | $1,265,128 | |
Ginnie Mae II Pool | | | 5,253,333 | |
Total Market Value of Collateral Securities | | | $6,518,461 | |
Generally accepted accounting principles (GAAP) require disclosure regarding the inputs and valuation techniques used to measure fair value and any changes in valuation inputs or techniques. In addition, investments shall be disclosed by major category.
The Fund categorizes its fair value measurements according to a three-level hierarchy that maximizes the use of observable inputs and minimizes the use of unobservable inputs by prioritizing that the most observable input be used when available. Observable inputs are those that market participants would use in pricing an investment based on market data obtained from sources independent of the reporting entity. Unobservable inputs are those that reflect the Fund’s assumptions about the information market participants would use in pricing an investment. An investment’s level within the fair value hierarchy is based on the lowest level of any input that is deemed significant to the asset or liability’s fair value measurement. The input levels are not necessarily an indication of the risk or liquidity associated with investments at that level. For example, certain U.S. government securities are generally high quality and liquid, however, they are reflected as Level 2 because the inputs used to determine fair value may not always be quoted prices in an active market.
Fair value inputs are summarized in the three broad levels listed below:
| | Ÿ | | Level 1 – Valuations based on quoted prices for investments in active markets that the Fund has the ability to access at the measurement date (including NAV for open-end mutual funds). Valuation adjustments are not applied to Level 1 investments. |
| | Ÿ | | Level 2 – Valuations based on other significant observable inputs (including quoted prices for similar securities, interest rates, prepayment speeds, credit risks, etc.). |
| | Ÿ | | Level 3 – Valuations based on significant unobservable inputs (including the Fund’s own assumptions and judgment in determining the fair value of investments). |
Inputs that are used in determining fair value of an investment may include price information, credit data, volatility statistics, and other factors. These inputs can be either observable or unobservable. The availability of observable inputs can vary between investments, and is affected by various factors such as the type of investment, and the volume and level of activity for that investment or similar investments in the marketplace. The inputs will be considered by the Investment Manager, along with any other relevant factors in the calculation of an investment’s fair value. The Fund uses prices and inputs that are current as of the measurement date, which may include periods of market dislocations. During these periods, the availability of prices and inputs may be reduced for many investments. This condition could cause an investment to be reclassified between the various levels within the hierarchy.
Investments falling into the Level 3 category are primarily supported by quoted prices from brokers and dealers participating in the market for those investments. However, these may be classified as Level 3 investments due to lack of market transparency and corroboration to support these quoted prices. Additionally, valuation models may be used as the pricing source for any remaining investments classified as Level 3. These models rely on one or more significant unobservable inputs and/or significant assumptions by the Investment Manager. Inputs used in valuations may include, but are not limited to, financial statement analysis, capital account balances, discount rates and estimated cash flows, and comparable company data.
The Accompanying Notes to Financial Statements are an integral part of this statement.
8
Columbia Select Small Cap Fund
March 31, 2012
|
Fair Value Measurements (continued) |
The following table is a summary of the inputs used to value the Fund’s investments as of March 31, 2012:
| | | | | | | | | | | | | | | | |
| | | Fair value at March 31, 2012 | |
| Description | | Level 1 quoted prices in active markets for
identical assets | | | Level 2 other
significant
observable
inputs | | | Level 3
significant
unobservable
inputs | | | Total | |
Equity Securities | | | | | | | | | | | | | | | | |
Common Stocks | | | | | | | | | | | | | | | | |
Consumer Discretionary | | | $57,840,630 | | | | $— | | | | $— | | | | $57,840,630 | |
Consumer Staples | | | 9,951,600 | | | | — | | | | — | | | | 9,951,600 | |
Energy | | | 21,126,702 | | | | — | | | | — | | | | 21,126,702 | |
Financials | | | 10,577,200 | | | | — | | | | — | | | | 10,577,200 | |
Health Care | | | 24,401,468 | | | | — | | | | — | | | | 24,401,468 | |
Industrials | | | 48,788,770 | | | | — | | | | — | | | | 48,788,770 | |
Information Technology | | | 89,404,062 | | | | — | | | | — | | | | 89,404,062 | |
Total Equity Securities | | | 262,090,432 | | | | — | | | | — | | | | 262,090,432 | |
Other | | | | | | | | | | | | | | | | |
Money Market Funds | | | 1,903,692 | | | | — | | | | — | | | | 1,903,692 | |
Investments of Cash Collateral Received for Securities on Loan | | | — | | | | 34,390,649 | | | | — | | | | 34,390,649 | |
Total Other | | | 1,903,692 | | | | 34,390,649 | | | | — | | | | 36,294,341 | |
Total | | | $263,994,124 | | | | $34,390,649 | | | | $— | | | | $298,384,773 | |
See the Portfolio of Investments for all investment classifications not indicated in the table.
The Fund’s assets assigned to the Level 2 input category are generally valued using the market approach, in which a security’s value is determined through reference to prices and information from market transactions for similar or identical assets.
There were no significant transfers between Levels 1 and 2 during the period.
The Accompanying Notes to Financial Statements are an integral part of this statement.
9
Statement of Assets and Liabilities – Columbia Select Small Cap Fund
March 31, 2012
| | | | |
| Assets | | | | |
Investments, at value* | | | | |
Unaffiliated issuers (identified cost $183,371,363) | | $ | 262,090,432 | |
Affiliated issuers (identified cost $1,903,692) | | | 1,903,692 | |
Investment of cash collateral received for securities on loan | | | | |
Short-term securities (identified cost $3,000,000) | | | 3,000,000 | |
Repurchase agreements (identified cost $31,390,649) | | | 31,390,649 | |
Total investments (identified cost $219,665,704) | | | 298,384,773 | |
Receivable for: | | | | |
Investments sold | | | 2,396,883 | |
Capital shares sold | | | 21,480 | |
Dividends | | | 252 | |
Interest | | | 13,087 | |
Expense reimbursement due from Investment Manager | | | 105 | |
Prepaid expense | | | 10,291 | |
Trustees’ deferred compensation plan | | | 22,962 | |
Total assets | | | 300,849,833 | |
| |
| Liabilities | | | | |
Disbursements in excess of cash | | | 14 | |
Due upon return of securities on loan | | | 34,390,649 | |
Payable for: | | | | |
Investments purchased | | | 198,575 | |
Capital shares purchased | | | 504,915 | |
Investment management fees | | | 5,760 | |
Distribution and service fees | | | 203 | |
Transfer agent fees | | | 64,635 | |
Administration fees | | | 583 | |
Chief compliance officer expenses | | | 312 | |
Other expenses | | | 50,991 | |
Trustees’ deferred compensation plan | | | 22,962 | |
Total liabilities | | | 35,239,599 | |
Net assets applicable to outstanding capital stock | | $ | 265,610,234 | |
The Accompanying Notes to Financial Statements are an integral part of this statement.
10
Statement of Assets and Liabilities (continued) – Columbia Select Small Cap Fund
March 31, 2012
| | | | |
| Represented by | | | | |
Paid-in capital | | $ | 183,978,566 | |
Accumulated net investment loss | | | (376,904 | ) |
Accumulated net realized gain | | | 3,289,503 | |
Unrealized appreciation (depreciation) on: | | | | |
Investments | | | 78,719,069 | |
Total — representing net assets applicable to outstanding capital stock | | $ | 265,610,234 | |
*Value of securities on loan | | $ | 48,848,199 | |
Net assets applicable to outstanding shares | | | | |
Class A | | $ | 13,944,185 | |
Class C | | $ | 1,110,067 | |
Class R | | $ | 5,660,868 | |
Class Z | | $ | 244,895,114 | |
Shares outstanding | | | | |
Class A | | | 827,779 | |
Class C | | | 68,188 | |
Class R | | | 346,056 | |
Class Z | | | 14,397,334 | |
Net asset value per share | | | | |
Class A(a) | | $ | 16.85 | |
Class C | | $ | 16.28 | |
Class R | | $ | 16.36 | |
Class Z | | $ | 17.01 | |
| (a) | The maximum offering price per share for Class A is $17.88. The offering price is calculated by dividing the net asset value by 1.0 minus the maximum sales charge of 5.75%. |
The Accompanying Notes to Financial Statements are an integral part of this statement.
11
Statement of Operations – Columbia Select Small Cap Fund
Year Ended March 31, 2012
| | | | |
| Net investment income | | | | |
Income: | | | | |
Dividends | | $ | 1,725,133 | |
Interest | | | 10,022 | |
Dividends from affiliates | | | 1,359 | |
Income from securities lending — net | | | 169,153 | |
Foreign taxes withheld | | | (9,485 | ) |
Total income | | | 1,896,182 | |
Expenses: | | | | |
Investment management fees | | | 3,128,477 | |
Distribution fees | | | | |
Class C | | | 8,706 | |
Class R | | | 36,051 | |
Service fees | | | | |
Class A | | | 37,837 | |
Class C | | | 2,902 | |
Transfer agent fees | | | | |
Class A | | | 35,059 | |
Class C | | | 2,608 | |
Class R | | | 15,997 | |
Class Z | | | 839,943 | |
Administration fees | | | 389,565 | |
Compensation of board members | | | 35,444 | |
Pricing and bookkeeping fees | | | 33,384 | |
Custodian fees | | | 17,537 | |
Printing and postage fees | | | 66,982 | |
Registration fees | | | 63,624 | |
Professional fees | | | 58,856 | |
Line of credit interest expense | | | 9,235 | |
Chief compliance officer expenses | | | 813 | |
Other | | | 29,248 | |
Total expenses | | | 4,812,268 | |
Fees waived or expenses reimbursed by Investment Manager and its affiliates | | | (312,444 | ) |
Expense reductions | | | (3,930 | ) |
Total net expenses | | | 4,495,894 | |
Net investment loss | | | (2,599,712 | ) |
| |
| Realized and unrealized gain (loss) — net | | | | |
Net realized gain (loss) on: | | | | |
Investments | | | 41,874,318 | |
Net realized gain | | | 41,874,318 | |
Net change in unrealized appreciation (depreciation) on: | | | | |
Investments | | | (112,779,070 | ) |
Net change in unrealized depreciation | | | (112,779,070 | ) |
Net realized and unrealized loss | | | (70,904,752 | ) |
Net decrease in net assets from operations | | $ | (73,504,464 | ) |
The Accompanying Notes to Financial Statements are an integral part of this statement.
12
Statement of Changes in Net Assets – Columbia Select Small Cap Fund
| | | | | | | | |
| Year ended March 31, | | 2012 | | | 2011 | |
| | |
| Operations | | | | | | | | |
Net investment loss | | $ | (2,599,712 | ) | | $ | (1,844,507 | ) |
Net realized gain | | | 41,874,318 | | | | 95,064,234 | |
Net change in unrealized appreciation (depreciation) | | | (112,779,070 | ) | | | 38,993,847 | |
Net increase (decrease) in net assets resulting from operations | | | (73,504,464 | ) | | | 132,213,574 | |
Increase (decrease) in net assets from share transactions | | | (279,196,943 | ) | | | (137,897,113 | ) |
Proceeds from regulatory settlements (Note 6) | | | 25,405 | | | | — | |
Total decrease in net assets | | | (352,676,002 | ) | | | (5,683,539 | ) |
Net assets at beginning of year | | | 618,286,236 | | | | 623,969,775 | |
Net assets at end of year | | $ | 265,610,234 | | | $ | 618,286,236 | |
Accumulated net investment loss | | $ | (376,904 | ) | | $ | (18,162 | ) |
The Accompanying Notes to Financial Statements are an integral part of this statement.
13
Statement of Changes in Net Assets (continued) – Columbia Select Small Cap Fund
| | | | | | | | | | | | | | | | |
| Year ended March 31, | | 2012 | | | 2011 | |
| | | Shares | | | Dollars($) | | | Shares | | | Dollars($) | |
| Capital stock activity | | | | | | | | | | | | | | | | |
Class A shares | | | | | | | | | | | | | | | | |
Subscriptions | | | 161,859 | | | | 2,592,372 | | | | 286,895 | | | | 4,572,176 | |
Redemptions | | | (305,292 | ) | | | (4,998,218 | ) | | | (352,721 | ) | | | (5,529,175 | ) |
Net decrease | | | (143,433 | ) | | | (2,405,846 | ) | | | (65,826 | ) | | | (956,999 | ) |
Class C shares | | | | | | | | | | | | | | | | |
Subscriptions | | | 11,133 | | | | 174,909 | | | | 24,259 | | | | 382,496 | |
Redemptions | | | (14,952 | ) | | | (234,185 | ) | | | (27,673 | ) | | | (453,745 | ) |
Net decrease | | | (3,819 | ) | | | (59,276 | ) | | | (3,414 | ) | | | (71,249 | ) |
Class R shares | | | | | | | | | | | | | | | | |
Subscriptions | | | 98,752 | | | | 1,571,000 | | | | 213,182 | | | | 3,317,215 | |
Redemptions | | | (340,507 | ) | | | (5,323,618 | ) | | | (306,421 | ) | | | (4,597,584 | ) |
Net decrease | | | (241,755 | ) | | | (3,752,618 | ) | | | (93,239 | ) | | | (1,280,369 | ) |
Class Z shares | | | | | | | | | | | | | | | | |
Subscriptions | | | 1,684,193 | | | | 27,858,091 | | | | 5,218,684 | | | | 82,865,441 | |
Redemptions | | | (18,767,390 | ) | | | (300,837,294 | ) | | | (14,115,146 | ) | | | (218,453,937 | ) |
Net decrease | | | (17,083,197 | ) | | | (272,979,203 | ) | | | (8,896,462 | ) | | | (135,588,496 | ) |
Total net decrease | | | (17,472,204 | ) | | | (279,196,943 | ) | | | (9,058,941 | ) | | | (137,897,113 | ) |
The Accompanying Notes to Financial Statements are an integral part of this statement.
14
Financial Highlights – Columbia Select Small Cap Fund
The following tables are intended to help you understand the Fund’s financial performance. Certain information reflects financial results for a single share of a class held for the periods shown. Per share net investment income (loss) amounts are calculated based on average shares outstanding during the period. Total returns assume reinvestment of all dividends and distributions. Total returns do not reflect payment of sales charges, if any, and are not annualized for periods of less than one year.
| | | | | | | | | | | | | | | | | | | | |
| | | Year ended March 31, | |
| | | 2012 | | | 2011 | | | 2010 | | | 2009 | | | 2008(a) | |
| Class A | | | | | | | | | | | | | | | |
| Per share data | | | | | | | | | | | | | | | | | | | | |
Net asset value, beginning of period | | | $18.55 | | | | $14.74 | | | | $9.08 | | | | $16.15 | | | | $21.11 | |
Income from investment operations: | | | | | | | | | | | | | | | | | | | | |
Net investment loss | | | (0.14 | ) | | | (0.09 | )(b) | | | (0.08 | ) | | | (0.06 | ) | | | (0.05 | ) |
Net realized and unrealized gain (loss) | | | (1.56 | ) | | | 3.90 | | | | 5.74 | | | | (6.53 | ) | | | (3.43 | ) |
Total from investment operations | | | (1.70 | ) | | | 3.81 | | | | 5.66 | | | | (6.59 | ) | | | (3.48 | ) |
Less distributions to shareholders from: | | | | | | | | | | | | | | | | | | | | |
Net realized gains | | | — | | | | — | | | | — | | | | (0.48 | ) | | | (1.48 | ) |
Total distributions to shareholders | | | — | | | | — | | | | — | | | | (0.48 | ) | | | (1.48 | ) |
Proceeds from regulatory settlement | | | 0.00 | (c) | | | — | | | | 0.00 | (c) | | | 0.00 | (c) | | | — | |
Net asset value, end of period | | | $16.85 | | | | $18.55 | | | | $14.74 | | | | $9.08 | | | | $16.15 | |
| Total return | | | (9.16% | ) | | | 25.85% | | | | 62.33% | | | | (42.02% | ) | | | (17.38% | )(d) |
| Ratios to average net assets(e) | | | | | | | | | | | | | | | | | | | | |
Expenses prior to fees waived or expenses reimbursed (including interest expense) | | | 1.44% | (g) | | | 1.35% | (g) | | | 1.36% | (g) | | | 1.40% | (g) | | | 1.25% | (f)(g) |
Net expenses after fees waived or expenses reimbursed (including interest expense)(i) | | | 1.34% | (g)(h) | | | 1.35% | (g)(h) | | | 1.36% | (g)(h) | | | 1.36% | (g)(h) | | | 1.20% | (f)(g)(h) |
Expenses prior to fees waived or expenses reimbursed (excluding interest expense) | | | 1.44% | | | | 1.35% | | | | 1.36% | | | | 1.40% | | | | 1.25% | (f) |
Net expenses after fees waived or expenses reimbursed (excluding interest expense)(i) | | | 1.34% | (h) | | | 1.35% | (h) | | | 1.36% | (h) | | | 1.36% | (h) | | | 1.20% | (f)(h) |
Net investment loss | | | (0.85% | )(h) | | | (0.55% | )(h) | | | (0.63% | )(h) | | | (0.47% | )(h) | | | (0.67% | )(f)(h) |
| Supplemental data | | | | | | | | | | | | | | | | | | | | |
Net assets, end of period (in thousands) | | | $13,944 | | | | $18,020 | | | | $15,281 | | | | $6,671 | | | | $3,436 | |
Portfolio turnover | | | 61% | | | | 71% | | | | 73% | | | | 67% | | | | 73% | |
Notes to Financial Highlights
| (a) | The Predecessor Fund’s Class A shares commenced operations on September 28, 2007. Per share data and total return reflect activity from that date. |
| (b) | Net investment loss per share reflects a special dividend. The effect of this dividend amounted to $0.03 per share. |
| (c) | Rounds to less than $0.01. |
| (d) | Total return includes a voluntary reimbursement by the Investment Manager for a realized investment loss due to a trading error. This reimbursement increased total return and net asset value per share by less than 0.01% and less than $0.01, respectively. |
| (e) | In addition to the fees and expenses which the Fund bears directly, the Fund indirectly bears a pro rata share of the fees and expenses of the acquired funds in which it invests. Such indirect expenses are not included in the reported expense ratios. |
| (g) | Includes interest expense which rounds to less than 0.01%. |
| (h) | The benefits derived from expense reductions had an impact of less than 0.01%. |
| (i) | The Investment Manager and certain of its affiliates agreed to waive/reimburse certain fees and expenses, if applicable. |
The Accompanying Notes to Financial Statements are an integral part of this statement.
15
Financial Highlights (continued) – Columbia Select Small Cap Fund
| | | | | | | | | | | | | | | | | | | | |
| | | Year ended March 31, | |
| | | 2012 | | | 2011 | | | 2010 | | | 2009 | | | 2008(a) | |
| Class C | | | | | | | | | | | | | | | |
| Per share data | | | | | | | | | | | | | | | | | | | | |
Net asset value, beginning of period | | | $18.07 | | | | $14.46 | | | | $8.97 | | | | $16.10 | | | | $21.11 | |
Income from investment operations: | | | | | | | | | | | | | | | | | | | | |
Net investment loss | | | (0.25 | ) | | | (0.20 | )(b) | | | (0.16 | ) | | | (0.17 | ) | | | (0.12 | ) |
Net realized and unrealized gain (loss) | | | (1.54 | ) | | | 3.81 | | | | 5.65 | | | | (6.48 | ) | | | (3.41 | ) |
Total from investment operations | | | (1.79 | ) | | | 3.61 | | | | 5.49 | | | | (6.65 | ) | | | (3.53 | ) |
Less distributions to shareholders from: | | | | | | | | | | | | | | | | | | | | |
Net realized gains | | | — | | | | — | | | | — | | | | (0.48 | ) | | | (1.48 | ) |
Total distributions to shareholders | | | — | | | | — | | | | — | | | | (0.48 | ) | | | (1.48 | ) |
Proceeds from regulatory settlement | | | 0.00 | (c) | | | — | | | | 0.00 | (c) | | | 0.00 | (c) | | | — | |
Net asset value, end of period | | | $16.28 | | | | $18.07 | | | | $14.46 | | | | $8.97 | | | | $16.10 | |
| Total return | | | (9.91% | ) | | | 24.97% | | | | 61.20% | | | | (42.53% | ) | | | (17.63% | )(d) |
| Ratios to average net assets(e) | | | | | | | | | | | | | | | | | | | | |
Expenses prior to fees waived or expenses reimbursed (including interest expense) | | | 2.18% | (g) | | | 2.10% | (g) | | | 2.11% | (g) | | | 2.15% | (g) | | | 2.00% | (f)(g) |
Net expenses after fees waived or expenses reimbursed (including interest expense)(i) | | | 2.09% | (g)(h) | | | 2.10% | (g)(h) | | | 2.11% | (g)(h) | | | 2.11% | (g)(h) | | | 1.95% | (f)(g)(h) |
Expenses prior to fees waived or expenses reimbursed (excluding interest expense) | | | 2.18% | | | | 2.10% | | | | 2.11% | | | | 2.15% | | | | 2.00% | (f) |
Net expenses after fees waived or expenses reimbursed (excluding interest expense)(i) | | | 2.09% | (h) | | | 2.10% | (h) | | | 2.11% | (h) | | | 2.11% | (h) | | | 1.95% | (f)(h) |
Net investment loss | | | (1.60% | )(h) | | | (1.30% | )(h) | | | (1.34% | )(h) | | | (1.31% | )(h) | | | (1.42% | )(f)(h) |
| Supplemental data | | | | | | | | | | | | | | | | | | | | |
Net assets, end of period (in thousands) | | | $1,110 | | | | $1,301 | | | | $1,090 | | | | $1,063 | | | | $2,101 | |
Portfolio turnover | | | 61% | | | | 71% | | | | 73% | | | | 67% | | | | 73% | |
Notes to Financial Highlights
| (a) | The Predecessor Fund’s Class C shares commenced operations on September 28, 2007. Per share data and total return reflect activity from that date. |
| (b) | Net investment loss per share reflects a special dividend. The effect of this dividend amounted to $0.03 per share. |
| (c) | Rounds to less than $0.01. |
| (d) | Total return includes a voluntary reimbursement by the Investment Manager for a realized investment loss due to a trading error. This reimbursement increased total return and net asset value per share by less than 0.01% and less than $0.01, respectively. |
| (e) | In addition to the fees and expenses which the Fund bears directly, the Fund indirectly bears a pro rata share of the fees and expenses of the acquired funds in which it invests. Such indirect expenses are not included in the reported expense ratios. |
| (g) | Includes interest expense which rounds to less than 0.01%. |
| (h) | The benefits derived from expense reductions had an impact of less than 0.01%. |
| (i) | The Investment Manager and certain of its affiliates agreed to waive/reimburse certain fees and expenses, if applicable. |
The Accompanying Notes to Financial Statements are an integral part of this statement.
16
Financial Highlights (continued) – Columbia Select Small Cap Fund
| | | | | | | | | | | | | | | | | | | | |
| | | Year ended March 31, | |
| | | 2012 | | | 2011 | | | 2010 | | | 2009 | | | 2008(a) | |
| Class R | | | | | | | | | | | | | | | |
| Per share data | | | | | | | | | | | | | | | | | | | | |
Net asset value, beginning of period | | | $18.06 | | | | $14.38 | | | | $8.88 | | | | $15.86 | | | | $18.98 | |
Income from investment operations: | | | | | | | | | | | | | | | | | | | | |
Net investment loss | | | (0.18 | ) | | | (0.12 | )(b) | | | (0.10 | ) | | | (0.10 | ) | | | (0.21 | ) |
Net realized and unrealized gain (loss) | | | (1.52 | ) | | | 3.80 | | | | 5.60 | | | | (6.40 | ) | | | (1.43 | ) |
Total from investment operations | | | (1.70 | ) | | | 3.68 | | | | 5.50 | | | | (6.50 | ) | | | (1.64 | ) |
Less distributions to shareholders from: | | | | | | | | | | | | | | | | | | | | |
Net realized gains | | | — | | | | — | | | | — | | | | (0.48 | ) | | | (1.48 | ) |
Total distributions to shareholders | | | — | | | | — | | | | — | | | | (0.48 | ) | | | (1.48 | ) |
Proceeds from regulatory settlement | | | 0.00(c | ) | | | — | | | | 0.00 | (c) | | | 0.00 | (c) | | | — | |
Net asset value, end of period | | | $16.36 | | | | $18.06 | | | | $14.38 | | | | $8.88 | | | | $15.86 | |
| Total return | | | (9.41% | ) | | | 25.59% | | | | 61.94% | | | | (42.22% | ) | | | (9.66% | )(d) |
| Ratios to average net assets(e) | | | | | | | | | | | | | | | | | | | | |
Expenses prior to fees waived or expenses reimbursed (including interest expense) | | | 1.68% | (f) | | | 1.60% | (f) | | | 1.61% | (f) | | | 1.65% | (f) | | | 1.74% | (f) |
Net expenses after fees waived or expenses reimbursed (including interest expense)(h) | | | 1.59% | (f)(g) | | | 1.60% | (f)(g) | | | 1.61% | (f)(g) | | | 1.61% | (f)(g) | | | 1.70% | (f)(g) |
Expenses prior to fees waived or expenses reimbursed (excluding interest expense) | | | 1.68% | | | | 1.60% | | | | 1.61% | | | | 1.65% | | | | 1.74% | |
Net expenses after fees waived or expenses reimbursed (excluding interest expense)(h) | | | 1.59% | (g) | | | 1.60% | (g) | | | 1.61% | (g) | | | 1.61% | (g) | | | 1.70% | (g) |
Net investment loss | | | (1.11% | )(g) | | | (0.82% | )(g) | | | (0.85% | )(g) | | | (0.80% | )(g) | | | (1.13% | )(g) |
| Supplemental data | | | | | | | | | | | | | | | | | | | | |
Net assets, end of period (in thousands) | | | $5,661 | | | | $10,618 | | | | $9,795 | | | | $5,819 | | | | $6,881 | |
Portfolio turnover | | | 61% | | | | 71% | | | | 73% | | | | 67% | | | | 73% | |
Notes to Financial Highlights
| (a) | On March 31, 2008, Retirement Shares class of Small Cap Fund, a series of Excelsior Funds, Inc., was reorganized into the Fund’s Class R shares. The financial information of the Fund’s Class R shares includes the financial information of Small Cap Fund’s Retirement Shares class. |
| (b) | Net investment loss per share reflects a special dividend. The effect of this dividend amounted to $0.03 per share. |
| (c) | Rounds to less than $0.01. |
| (d) | Total return includes a voluntary reimbursement by the Investment Manager for a realized investment loss due to a trading error. This reimbursement increased total return and net asset value per share by less than 0.01% and less than $0.01, respectively. |
| (e) | In addition to the fees and expenses which the Fund bears directly, the Fund indirectly bears a pro rata share of the fees and expenses of the acquired funds in which it invests. Such indirect expenses are not included in the reported expense ratios. |
| (f) | Includes interest expense which rounds to less than 0.01%. |
| (g) | The benefits derived from expense reductions had an impact of less than 0.01%. |
| (h) | The Investment Manager and certain of its affiliates agreed to waive/reimburse certain fees and expenses, if applicable. |
The Accompanying Notes to Financial Statements are an integral part of this statement.
17
Financial Highlights (continued) – Columbia Select Small Cap Fund
| | | | | | | | | | | | | | | | | | | | |
| | | Year ended March 31, | |
| | | 2012 | | | 2011 | | | 2010 | | | 2009 | | | 2008(a) | |
| Class Z | | | | | | | | | | | | | | | |
| Per share data | | | | | | | | | | | | | | | | | | | | |
Net asset value, beginning of period | | | $18.69 | | | | $14.81 | | | | $9.10 | | | | $16.15 | | | | $19.21 | |
Income from investment operations: | | | | | | | | | | | | | | | | | | | | |
Net investment loss | | | (0.10 | ) | | | (0.05 | )(b) | | | (0.05 | ) | | | (0.04 | ) | | | (0.12 | ) |
Net realized and unrealized gain (loss) | | | (1.58 | ) | | | 3.93 | | | | 5.76 | | | | (6.53 | ) | | | (1.46 | ) |
Total from investment operations | | | (1.68 | ) | | | 3.88 | | | | 5.71 | | | | (6.57 | ) | | | (1.58 | ) |
Less distributions to shareholders from: | | | | | | | | | | | | | | | | | | | | |
Net realized gains | | | — | | | | — | | | | — | | | | (0.48 | ) | | | (1.48 | ) |
Total distributions to shareholders | | | — | | | | — | | | | — | | | | (0.48 | ) | | | (1.48 | ) |
Proceeds from regulatory settlement | | | 0.00 | (c) | | | — | | | | 0.00 | (c) | | | 0.00 | (c) | | | — | |
Net asset value, end of period | | | $17.01 | | | | $18.69 | | | | $14.81 | | | | $9.10 | | | | $16.15 | |
| Total return | | | (8.99% | ) | | | 26.20% | | | | 62.75% | | | | (41.89% | ) | | | (9.22% | )(d) |
| Ratios to average net assets(e) | | | | | | | | | | | | | | | | | | | | |
Expenses prior to fees waived or expenses reimbursed (including interest expense) | | | 1.17% | (f) | | | 1.10% | (f) | | | 1.11% | (f) | | | 1.15% | (f) | | | 1.24% | (f) |
Net expenses after fees waived or expenses reimbursed (including interest expense)(h) | | | 1.09% | (f)(g) | | | 1.10% | (f)(g) | | | 1.11% | (f)(g) | | | 1.11% | (f)(g) | | | 1.20% | (f)(g) |
Expenses prior to fees waived or expenses reimbursed (excluding interest expense) | | | 1.17% | | | | 1.10% | | | | 1.11% | | | | 1.15% | | | | 1.24% | |
Net expenses after fees waived or expenses reimbursed (excluding interest expense)(h) | | | 1.09% | (g) | | | 1.10% | (g) | | | 1.11% | (g) | | | 1.11% | (g) | | | 1.20% | (g) |
Net investment loss | | | (0.63% | )(g) | | | (0.31% | )(g) | | | (0.36% | )(g) | | | (0.31% | )(g) | | | (0.63% | )(g) |
| Supplemental data | | | | | | | | | | | | | | | | | | | | |
Net assets, end of period (in thousands) | | | $244,895 | | | | $588,347 | | | | $597,804 | | | | $321,684 | | | | $676,616 | |
Portfolio turnover | | | 61% | | | | 71% | | | | 73% | | | | 67% | | | | 73% | |
Notes to Financial Highlights
| (a) | On March 31, 2008, Shares class of Small Cap Fund, a series of Excelsior Funds, Inc., was reorganized into the Fund’s Class Z shares. The financial information of the Fund’s Class Z shares includes the financial information of Small Cap Fund’s Shares class. |
| (b) | Net investment loss per share reflects a special dividend. The effect of this dividend amounted to $0.03 per share. |
| (c) | Rounds to less than $0.01. |
| (d) | Total return includes a voluntary reimbursement by the Investment Manager for a realized investment loss due to a trading error. This reimbursement increased total return and net asset value per share by less than 0.01% and less than $0.01, respectively. |
| (e) | In addition to the fees and expenses which the Fund bears directly, the Fund indirectly bears a pro rata share of the fees and expenses of the acquired funds in which it invests. Such indirect expenses are not included in the reported expense ratios. |
| (f) | Includes interest expense which rounds to less than 0.01%. |
| (g) | The benefits derived from expense reductions had an impact of less than 0.01%. |
| (h) | The Investment Manager and certain of its affiliates agreed to waive/reimburse certain fees and expenses, if applicable. |
The Accompanying Notes to Financial Statements are an integral part of this statement.
18
Notes to Financial Statements – Columbia Select Small Cap Fund
March 31, 2012
Note 1. Organization
Columbia Select Small Cap Fund (the Fund), a series of Columbia Funds Series Trust I (the Trust), is a diversified fund. The Trust is registered under the Investment Company Act of 1940, as amended (the 1940 Act), as an open-end management investment company organized as a Massachusetts business trust.
Fund Shares
The Trust may issue an unlimited number of shares (without par value). The Fund offers Class A, Class C, Class R and Class Z shares. All share classes have identical voting, dividend and liquidation rights. Each share class has its own expense structure and sales charges, as applicable.
Class A shares are subject to a maximum front-end sales charge of 5.75% based on the initial investment amount. Class A shares purchased without an initial sales charge in accounts aggregating $1 million to $50 million at the time of purchase are subject to a contingent deferred sales charge (CDSC) if the shares are sold within 18 months of purchase, charged as follows: 1.00% CDSC if redeemed within 12 months of purchase, and 0.50% CDSC if redeemed more than 12, but less than 18, months after purchase.
Class C shares are subject to a 1.00% CDSC on shares redeemed within one year of purchase.
Class R shares are not subject to sales charges and are only available to qualifying institutional investors.
Class Z shares are not subject to sales charges, and are only available to certain investors, as described in the Fund’s prospectus.
Note 2. Summary of Significant Accounting Policies
Use of Estimates
The preparation of financial statements in accordance with U.S. generally accepted accounting principles (GAAP) requires management to make certain estimates and assumptions that affect the reported amounts of assets and liabilities, the disclosure of contingent assets and liabilities at the date of the financial statements and the reported amounts of revenue and expenses during the reporting period. Actual results could differ from those estimates.
The following is a summary of significant accounting policies consistently followed by the Fund in the preparation of its financial statements.
Security Valuation
All equity securities are valued at the close of business of the New York Stock Exchange (NYSE). Equity securities are valued at the last quoted sales price on the principal exchange or market on which they trade, except for securities traded on the NASDAQ Stock Market, which are valued at the NASDAQ official close price. Unlisted securities or listed securities for which there were no sales during the day are valued at the mean of the latest quoted bid and asked prices on such exchanges or markets.
Investments in other open-end investment companies, including money market funds, are valued at net asset value.
Short-term securities purchased within 60 days to maturity are valued at amortized cost, which approximates market value. The value of short-term securities originally purchased with maturities greater than 60 days is determined based on an amortized value to par upon reaching 60 days to maturity. Short-term securities maturing in more than 60 days from the valuation date are valued at the market price or approximate market value based on current interest rates.
Investments for which market quotations are not readily available, or that have quotations which management believes are not reliable, are valued at fair value as determined in good faith under consistently applied procedures established by and under the general supervision of the Board of Trustees (the Board). If a security or class of securities (such as foreign securities) is valued at fair value, such value is likely to be different from the last quoted market price for the security. The determination of fair value often requires significant judgment. To determine fair value, management may use assumptions including but not limited to future cash flows and estimated risk premiums. Multiple inputs from various sources may be used to determine value.
Repurchase Agreements
The Fund may engage in repurchase agreement transactions with institutions that management has determined are creditworthy. The Fund, through the custodian, receives delivery of the underlying securities collateralizing a repurchase agreement. Management is responsible for determining that the collateral is at least equal, at all times, to the value of the repurchase obligation including interest. A repurchase agreement transaction involves certain risks in the event of default or insolvency of the counterparty. These risks include possible delays in or restrictions on a Fund’s ability to dispose of the underlying securities and a possible decline in the value of the underlying securities during the period while the Fund seeks to assert its rights.
19
Columbia Select Small Cap Fund
March 31, 2012
Security Transactions
Security transactions are accounted for on the trade date. Cost is determined and gains (losses) are based upon the specific identification method for both financial statement and federal income tax purposes.
Income Recognition
Corporate actions and dividend income are recorded net of any non-reclaimable tax withholdings, on the ex-dividend date or upon receipt of ex-dividend notification in the case of certain foreign securities.
Interest income is recorded on the accrual basis.
Awards from class action litigation are recorded as a reduction of cost basis if the Fund still owns the applicable securities on the payment date. If the Fund no longer owns the applicable securities, the proceeds are recorded as realized gains.
Expenses
General expenses of the Trust are allocated to the Fund and other funds of the Trust based upon relative net assets or other expense allocation methodologies determined by the nature of the expense. Expenses directly attributable to the Fund are charged to the Fund. Expenses directly attributable to a specific class of shares are charged to that share class.
Determination of Class Net Asset Value
All income, expenses (other than class-specific expenses, which are charged to that share class, as shown in the Statement of Operations) and realized and unrealized gains (losses) are allocated to each class of the Fund on a daily basis, based on the relative net assets of each class, for purposes of determining the net asset value of each class.
Federal Income Tax Status
The Fund intends to qualify each year as a regulated investment company under Subchapter M of the Internal Revenue Code, as amended, and will distribute substantially all of its tax exempt or taxable income (including net short-term capital gains), if any, for its tax year, and as such will not be subject to federal income taxes. In addition, the Fund intends to distribute in each calendar year substantially all of its net investment income, capital gains and certain other amounts, if any, such that the Fund should not be subject to federal excise tax. Therefore, no federal income or excise tax provision is recorded.
Distributions to Shareholders
Distributions from net investment income, if any, are declared and paid each calendar quarter. Net realized capital gains, if any, are
distributed along with the income dividend. Income distributions and capital gain distributions are determined in accordance with federal income tax regulations which may differ from GAAP.
Guarantees and Indemnifications
Under the Trust’s organizational documents and, in some cases, by contract, its officers and trustees are indemnified against certain liabilities arising out of the performance of their duties to the Trust or its funds. In addition, certain of the Fund’s contracts with its service providers contain general indemnification clauses. The Fund’s maximum exposure under these arrangements is unknown since the amount of any future claims that may be made against the Fund cannot be determined, and the Fund has no historical basis for predicting the likelihood of any such claims.
Recent Accounting Pronouncement
Fair Value Measurements and Disclosures
In May 2011, the Financial Accounting Standards Board (FASB) issued ASU No. 2011-04 modifying Topic 820, Fair Value Measurements and Disclosures. At the same time, the International Accounting Standards Board (IASB) issued International Financial Reporting Standard 13, Fair Value Measurement. The objective of the FASB and IASB is convergence of their guidance on fair value measurements and disclosures.
Specifically, ASU No. 2011-04 requires reporting entities to disclose i) the amounts of any transfers between Level 1 and Level 2, and the reasons for the transfers, ii) for Level 3 fair value measurements, a) quantitative information about significant unobservable inputs used, b) a description of the valuation processes used by the reporting entity and c) a narrative description of the sensitivity of the fair value measurement to changes in unobservable inputs if a change in those inputs might result in a significantly higher or lower fair value measurement. The effective date of ASU No. 2011-04 is for interim and annual periods beginning after December 15, 2011. At this time, management is evaluating the implications of this guidance and the impact it will have on the financial statement amounts and footnote disclosures, if any.
Note 3. Fees and Compensation Paid to Affiliates
Investment Management Fees
Under an Investment Management Services Agreement (IMSA), Columbia Management Investment Advisers, LLC (the Investment Manager), a wholly-owned subsidiary of Ameriprise Financial, Inc.
20
Columbia Select Small Cap Fund
March 31, 2012
(Ameriprise Financial), determines which securities will be purchased, held or sold. Effective July 1, 2011, the management fee is an annual fee that is equal to a percentage of the Fund’s average daily net assets that declines from 0.79% to 0.70% as the Fund’s net assets increase. Prior to July 1, 2011, the management fee was equal to a percentage of the Fund’s average daily net assets that declined from 0.75% to 0.62% as the Fund’s net assets increased. The effective management fee rate for the year ended March 31, 2012 was 0.78% of the Fund’s average daily net assets.
Administration Fees
Under an Administrative Services Agreement, the Investment Manager serves as the Fund Administrator. Effective July 1, 2011, the Fund pays the Fund Administrator an annual fee for administration and accounting services equal to a percentage of the Fund’s average daily net assets that declines from 0.08% to 0.05% as the Fund’s net assets increase. Prior to July 1, 2011, the administration fee was equal to the annual rate of 0.15% of the Fund’s average daily net assets, less the fees that were payable by the Fund as described under the Pricing and Bookkeeping Fees note below. The effective administration fee rate for the year ended March 31, 2012 was 0.10% of the Fund’s average daily net assets.
Pricing and Bookkeeping Fees
Prior to July 11, 2011, the Fund had entered into a Financial Reporting Services Agreement (the Financial Reporting Services Agreement) with State Street Bank and Trust Company (State Street) and the Investment Manager pursuant to which State Street provided financial reporting services to the Fund. The Fund also entered into an Accounting Services Agreement (collectively with the Financial Reporting Services Agreement, the State Street Agreements) with State Street and the Investment Manager pursuant to which State Street provided accounting services to the Fund. Under the State Street Agreements, the Fund paid State Street an annual fee of $38,000 paid monthly plus an additional monthly fee based on an annualized percentage rate of average daily net assets of the Fund for the month. The aggregate fee did not exceed $140,000 per year (exclusive of out-of-pocket expenses and charges). The Fund also reimbursed State Street for certain out-of-pocket expenses and charges. Effective July 11, 2011, these services are provided under the Administrative Services Agreement discussed above.
Compensation of Board Members
Board members are compensated for their services to the Fund as disclosed in the Statement of Operations. The Trust’s eligible
Trustees may participate in a Deferred Compensation Plan (the Plan) which may be terminated at any time. Obligations of the Plan will be paid solely out of the Fund’s assets.
Compensation of Chief Compliance Officer
The Board has appointed a Chief Compliance Officer to the Fund in accordance with federal securities regulations. The Fund, along with other affiliated funds, pays its pro-rata share of the expenses associated with the Chief Compliance Officer. The Fund’s expenses for the Chief Compliance Officer will not exceed $15,000 per year.
Transfer Agent Fees
Under a Transfer and Dividend Disbursing Agent Agreement, Columbia Management Investment Services Corp. (the Transfer Agent), an affiliate of the Investment Manager and a wholly-owned subsidiary of Ameriprise Financial, is responsible for providing transfer agency services to the Fund. The Transfer Agent has contracted with Boston Financial Data Services (BFDS) to serve as sub-transfer agent.
The Transfer Agent receives monthly account-based service fees based on the number of open accounts and is reimbursed by the Fund for the fees and expenses the Transfer Agent pays to financial intermediaries that maintain omnibus accounts with the Fund that is a percentage of the average aggregate value of the Fund’s shares maintained in each such omnibus account (other than omnibus accounts for which American Enterprise Investment Services Inc. is the broker of record or accounts where the beneficial shareholder is a customer of Ameriprise Financial Services, Inc., which are paid a per account fee). The Transfer Agent pays the fees of BFDS for services as sub-transfer agent and is not entitled to reimbursement for such fees from the Fund (with the exception of out-of-pocket fees).
The Transfer Agent also receives compensation from fees for various shareholder services and reimbursements for certain out-of-pocket expenses.
For the year ended March 31, 2012, the Fund’s effective transfer agent fee rates as a percentage of average daily net assets of each class were as follows:
| | | | |
| | |
| Class A | | | 0.23 | % |
| Class C | | | 0.22 | |
| Class R | | | 0.22 | |
| Class Z | | | 0.22 | |
21
Columbia Select Small Cap Fund
March 31, 2012
An annual minimum account balance fee of $20 may apply to certain accounts with a value below the Fund’s initial minimum investment requirements to reduce the impact of small accounts on transfer agent fees. These minimum account balance fees are recorded as part of expense reductions in the Statement of Operations. For the year ended March 31, 2012, these minimum account balance fees reduced total expenses by $3,930.
Distribution and Service Fees
The Fund has an agreement with Columbia Management Investment Distributors, Inc. (the Distributor), an affiliate of the Investment Manager and a wholly-owned subsidiary of Ameriprise Financial, for distribution and shareholder services. Pursuant to Rule 12b-1 under the 1940 Act, the Board has approved, and the Fund has adopted, distribution and shareholder service plans (the Plans) which set the distribution and service fees for the Fund. These fees are calculated daily and are intended to compensate the Distributor and/or eligible selling and/or servicing agents for selling shares of the Fund and providing services to investors.
The Plans require the payment of a monthly service fee to the Distributor at the maximum annual rate of 0.25% of the average daily net assets attributable to Class A and Class C shares of the Fund. The Plans also require the payment of a monthly distribution fee to the Distributor at the maximum annual rates of 0.75% and 0.50% of the average daily net assets attributable to the Fund’s Class C and Class R shares, respectively.
Sales Charges
Sales charges, including front-end charges and CDSCs, received by the Distributor for distributing Fund shares were $4,004 for Class A shares and $15 for Class C shares for the year ended March 31, 2012.
Expenses Waived/Reimbursed by the Investment Manager and its Affiliates
Effective July 1, 2011, the Investment Manager and certain of its affiliates have contractually agreed to waive fees and/or reimburse expenses (excluding certain fees and expenses described below), through July 31, 2012, unless sooner terminated at the sole discretion of the Board, so that the Fund’s net operating expenses, after giving effect to fees waived/expenses reimbursed and any balance credits and/or overdraft charges from the Fund’s custodian, do not exceed the following annual rates as a percentage of the class’ average daily net assets:
| | | | |
| | |
| Class A | | | 1.34 | % |
| Class C | | | 2.09 | |
| Class R | | | 1.59 | |
| Class Z | | | 1.09 | |
Under the agreement, the following fees and expenses are excluded from the waiver/reimbursement commitment, and therefore will be paid by the Fund, if applicable: taxes (including foreign transaction taxes), expenses associated with investments in affiliated and non-affiliated pooled investment vehicles (including mutual funds and exchange traded funds), transaction costs and brokerage commissions, costs related to any securities lending program, dividend expenses associated with securities sold short, inverse floater program fees and expenses, transaction charges and interest on borrowed money, interest, extraordinary expenses and any other expenses the exclusion of which is specifically approved by the Board. This agreement may be modified or amended only with approval from all parties.
Prior to July 1, 2011, the Investment Manager voluntarily agreed to reimburse a portion of the Fund’s expenses (excluding certain expenses, such as distribution and services fees, brokerage commissions, interest, taxes and extraordinary expenses, but including custodian charges relating to overdrafts, if any) so that the Fund’s ordinary net operating expenses, after giving effect to fees waived/expenses reimbursed and any balance credits and/or overdraft charges from the Fund’s custodian, did not exceed 1.10% of the Fund’s average daily net assets on an annualized basis.
Note 4. Federal Tax Information
The timing and character of income and capital gain distributions are determined in accordance with income tax regulations, which may differ from GAAP because of temporary or permanent book to tax differences.
For the year ended March 31, 2012, these differences are primarily due to differing treatment for proceeds from regulatory settlement, deferral/reversal of wash sale losses, Trustees’ deferred compensation, net operating loss reclassifications and late-year ordinary losses. To the extent these differences are permanent, reclassifications are made among the components of the Fund’s net assets in the Statement of Assets and Liabilities. Temporary differences do not require reclassifications. In the Statement of Assets and Liabilities the following reclassifications were made:
22
Columbia Select Small Cap Fund
March 31, 2012
| | | | |
| | |
| Accumulated net investment loss | | $ | 2,240,970 | |
| Accumulated net realized gain | | | — | |
| Paid-in capital | | | (2,240,970 | ) |
Net investment loss and net realized gains (losses), as disclosed in the Statement of Operations, and net assets were not affected by this reclassification.
The tax character of distributions paid during the years indicated was as follows:
| | | | |
| Year ended March 31, | | 2012 | | 2011 |
| Ordinary income | | $— | | $— |
| Long-term capital gains | | — | | — |
Short-term capital gain distributions, if any, are considered ordinary income distributions for tax purposes.
At March 31, 2012, the components of distributable earnings on a tax basis were as follows:
| | | | |
| | | | |
| Undistributed ordinary income | | $ | — | |
| Undistributed long-term capital gains | | | 4,862,333 | |
| Unrealized appreciation | | | 77,146,238 | |
At March 31, 2012, the cost of investments for federal income tax purposes was $221,238,535 and the aggregate gross unrealized appreciation and depreciation based on that cost was:
| | | | |
| | | | |
| Unrealized appreciation | | $ | 80,323,201 | |
| Unrealized depreciation | | $ | (3,176,963 | ) |
| | | | |
| Net unrealized appreciation | | $ | 77,146,238 | |
On December 22, 2010, the Regulated Investment Company Modernization Act of 2010 (the Act) was enacted, which changed various technical rules governing the tax treatment of regulated investment companies. The changes are generally effective for taxable years beginning after the date of enactment. Under the Act, the Fund will be permitted to carry forward capital losses incurred in taxable years beginning after the date of enactment for an unlimited period. However, any losses incurred during those future taxable years will be required to be utilized prior to the losses incurred in pre-enactment taxable years, which carry an expiration date. As a result of this ordering rule, pre-enactment capital loss carryforwards may be more likely to expire unused.
For the year ended March 31, 2012, $38,113,765 of capital loss carryforward was utilized.
Under current tax rules, Regulated Investment Companies can elect to treat certain late-year ordinary losses incurred and post-October capital losses (capital losses realized after October 31) as arising on the first day of the following taxable year. As of March 31, 2012, the Fund will elect to treat late-year ordinary losses of $355,570 as arising on April 1, 2012.
Management of the Fund has concluded that there are no significant uncertain tax positions that would require recognition in the financial statements. However, management’s conclusion may be subject to review and adjustment at a later date based on factors including, but not limited to, new tax laws, regulations, and administrative interpretations (including relevant court decisions). Generally, the Fund’s federal tax returns for the prior three fiscal years remain subject to examination by the Internal Revenue Service.
Note 5. Portfolio Information
The cost of purchases and proceeds from sales of securities, excluding short-term obligations, aggregated to $250,991,867 and $534,068,829, respectively, for the year ended March 31, 2012.
Note 6. Regulatory Settlements
During the year ended March 31, 2012, the Fund received $25,405 as a result of a settlement of an administrative proceeding brought by the Securities and Exchange Commission against an unaffiliated third party relating to market timing and/or late trading of mutual funds. This amount represented the Fund’s portion of the proceeds from the settlement (the Fund was not a party to the proceeding). The proceeds received by the Fund were recorded as an increase to additional paid-in capital.
Note 7. Lending of Portfolio Securities
Effective July 11, 2011, the Fund has entered into a Master Securities Lending Agreement (the Agreement) with JPMorgan Chase Bank, N.A. (JPMorgan). The Agreement, which replaces the previous securities lending arrangement with State Street, authorizes JPMorgan as lending agent to lend securities to authorized borrowers in order to generate additional income on behalf of the Fund. Pursuant to the Agreement, the securities loaned are secured by cash or U.S. government securities equal to at least 100% of the market value of the loaned securities. Any additional collateral required to maintain those levels due to market fluctuations of the
23
Columbia Select Small Cap Fund
March 31, 2012
loaned securities is requested to be delivered the following business day. Cash collateral received is invested by the lending agent on behalf of the Fund into authorized investments pursuant to the Agreement. The investments made with the cash collateral are listed in the Portfolio of Investments. The values of such investments and any uninvested cash collateral are disclosed in the Statement of Assets and Liabilities along with the related obligation to return the collateral upon the return of the securities loaned.
Risks of delay in recovery of securities or even loss of rights in the securities may occur should the borrower of the securities fail financially. Risks may also arise to the extent that the value of the securities loaned increases above the value of the collateral received. JPMorgan will indemnify the Fund from losses resulting from a borrower’s failure to return a loaned security when due. Such indemnification does not extend to losses associated with declines in the value of cash collateral investments. The Investment Manager is not responsible for any losses incurred by the Fund in connection with the securities lending program. Loans are subject to termination by the Fund or the borrower at any time, and are, therefore, not considered to be illiquid investments.
Pursuant to the Agreement, the Fund receives income for lending its securities either in the form of fees or by earning interest on invested cash collateral, net of negotiated rebates paid to borrowers and fees paid to the lending agent for services provided and any other securities lending expenses. Net income earned from securities lending for the year ended March 31, 2012 is disclosed in the Statement of Operations. The Fund continues to earn and accrue interest and dividends on the securities loaned.
Prior to July 11, 2011, the Fund participated in a securities lending arrangement with State Street. Each security on loan was collateralized in an amount at least equal to the market value of the securities loaned plus accrued income from the investment of collateral. The income generated by the investment of the collateral, net of any fees remitted to State Street as the lending agent and borrower rebates, was paid to the Fund.
At March 31, 2012, securities valued at $48,848,199 were on loan, secured by U.S. government securities valued at $15,532,325 and by cash collateral of $34,390,649 (which does not reflect calls for collateral made to borrowers by JPMorgan at period end) that is partially or fully invested in short-term securities or other cash equivalents.
Note 8. Custody Credits
Prior to July 11, 2011, the Fund had an agreement with its custodian bank under which custody fees may have been reduced by balance credits. These credits are recorded as part of expense reductions on the Statement of Operations. The Fund could have invested a portion of the assets utilized in connection with the expense offset arrangement in an income-producing asset if they had not entered into such an agreement. Subsequent to this date, the Fund may invest its daily balance in an affiliated money market fund as detailed below. For the period April 1, 2011 through July 10, 2011, there were no custody credits.
Note 9. Affiliated Money Market Fund
Effective July 11, 2011, the Fund may invest its daily cash balances in Columbia Short-Term Cash Fund, an affiliated money market fund established for the exclusive use by the Fund and other affiliated funds. The income earned by the Fund from such investments is included as “Dividends from affiliates” in the Statement of Operations. As an investing fund, the Fund indirectly bears its proportionate share of the expenses of Columbia Short-Term Cash Fund.
Note 10. Shareholder Concentration
At March 31, 2012, two unaffiliated shareholder accounts owned an aggregate of 61.6% of the outstanding shares of the Fund. The Fund has no knowledge about whether any portion of those shares was owned beneficially by such accounts. Subscription and redemption activity by concentrated accounts may have a significant effect on the operations of the Fund.
Note 11. Line of Credit
The Fund has entered into a revolving credit facility with a syndicate of banks led by JPMorgan, whereby the Fund may borrow for the temporary funding of shareholder redemptions or for other temporary or emergency purposes. The credit facility became effective on July 11, 2011, replacing a prior credit facility. The credit facility agreement, as amended, which is a collective agreement between the Fund and certain other funds managed by the Investment Manager, severally and not jointly, permits collective borrowings up to $500 million. Pursuant to a December 13, 2011 amendment to the credit facility agreement, interest is charged to each participating fund based on its borrowings at a rate equal to the higher of (i) the overnight federal funds rate plus 1.00% or (i) the one-month LIBOR rate plus 1.00%. Each borrowing under the credit facility matures no later than
24
Columbia Select Small Cap Fund
March 31, 2012
60 days after the date of borrowing. The Fund also pays a commitment fee equal to its pro rata share of the amount of the credit facility at a rate of 0.08% per annum. For the period July 11, 2011 through December 13, 2011, interest was charged to each participating fund based on its borrowings at a rate equal to the sum of the federal funds rate plus (i) 1.25% per annum plus (ii) if one-month LIBOR exceeds the federal funds rate, the amount of such excess. The Fund also paid a commitment fee equal to its pro rata share of the amount of the credit facility at a rate of 0.10% per annum.
For the period June 27, 2011 through July 8, 2011, the Fund and certain other funds managed by the Investment Manager participated in a $100,000 committed, unsecured revolving credit facility provided by State Street. For the period May 16, 2011 through June 26, 2011, the collective borrowing amount of the credit facility was $150 million. Prior to May 16, 2011, the collective borrowing amount of the credit facility was $225 million. Interest was charged to each fund based on its borrowings at a rate equal to the greater of the (i) federal funds rate plus 1.25% per annum or (ii) the overnight LIBOR rate plus 1.25% per annum. The Fund also paid a commitment fee equal to its pro rata share of the amount of the credit facility at a rate of 0.125% per annum.
For the year ended March 31, 2012, the average daily loan balance outstanding on days when borrowing existed was $4,216,364 at a weighted average interest rate of 1.41%.
Note 12. Subsequent Events
Management has evaluated the events and transactions that have occurred through the date the financial statements were issued and noted no items requiring adjustment of the financial statements or additional disclosure.
Note 13. Information Regarding Pending and Settled Legal Proceedings
In December 2005, without admitting or denying the allegations, American Express Financial Corporation (AEFC, which is now known as Ameriprise Financial, Inc. (Ameriprise Financial)) entered into settlement agreements with the Securities and Exchange Commission (SEC) and Minnesota Department of Commerce (MDOC) related to market timing activities. As a result, AEFC was
censured and ordered to cease and desist from committing or causing any violations of certain provisions of the Investment Advisers Act of 1940, the Investment Company Act of 1940, and various Minnesota laws. AEFC agreed to pay disgorgement of $10 million and civil money penalties of $7 million. AEFC also agreed to retain an independent distribution consultant to assist in developing a plan for distribution of all disgorgement and civil penalties ordered by the SEC in accordance with various undertakings detailed at www.sec.gov/litigation/admin/ia-2451.pdf. Ameriprise Financial and its affiliates have cooperated with the SEC and the MDOC in these legal proceedings, and have made regular reports to the funds’ Boards of Trustees.
Ameriprise Financial and certain of its affiliates have historically been involved in a number of legal, arbitration and regulatory proceedings, including routine litigation, class actions, and governmental actions, concerning matters arising in connection with the conduct of their business activities. Ameriprise Financial believes that the Funds are not currently the subject of, and that neither Ameriprise Financial nor any of its affiliates are the subject of, any pending legal, arbitration or regulatory proceedings that are likely to have a material adverse effect on the Funds or the ability of Ameriprise Financial or its affiliates to perform under their contracts with the Funds. Ameriprise Financial is required to make 10-Q, 10-K and, as necessary, 8-K filings with the Securities and Exchange Commission on legal and regulatory matters that relate to Ameriprise Financial and its affiliates. Copies of these filings may be obtained by accessing the SEC website at www.sec.gov.
There can be no assurance that these matters, or the adverse publicity associated with them, will not result in increased fund redemptions, reduced sale of fund shares or other adverse consequences to the Funds. Further, although we believe proceedings are not likely to have a material adverse effect on the Funds or the ability of Ameriprise Financial or its affiliates to perform under their contracts with the Funds, these proceedings are subject to uncertainties and, as such, we are unable to estimate the possible loss or range of loss that may result. An adverse outcome in one or more of these proceedings could result in adverse judgments, settlements, fines, penalties or other relief that could have a material adverse effect on the consolidated financial condition or results of operations of Ameriprise Financial.
25
Report of Independent Registered Public Accounting Firm
To the Trustees of Columbia Funds Series Trust I and the Shareholders of Columbia Select Small Cap Fund
In our opinion, the accompanying statement of assets and liabilities, including the investment portfolio, and the related statements of operations and of changes in net assets and the financial highlights present fairly, in all material respects, the financial position of Columbia Select Small Cap Fund (the “Fund”) (a series of Columbia Funds Series Trust I ) at March 31, 2012, the results of its operations for the year then ended, the changes in its net assets for each of the two years in the period then ended and the financial highlights for the periods indicated, in conformity with accounting principles generally accepted in the United States of America. These financial statements and financial highlights (hereafter referred to as “financial statements”) are the responsibility of the Fund’s management. Our responsibility is to express an opinion on these financial statements based on our audits. We conducted our audits of these financial statements in accordance with the standards of the Public Company Accounting Oversight Board (United States). Those standards require that we plan and perform the audit to obtain reasonable assurance about whether the financial statements are free of material misstatement. An audit includes examining, on a test basis, evidence supporting the amounts and disclosures in the financial statements, assessing the accounting principles used and significant estimates made by management, and evaluating the overall financial statement presentation. We believe that our audits, which included confirmation of securities at March 31, 2012 by correspondence with the custodian, transfer agent and brokers, provide a reasonable basis for our opinion.
PricewaterhouseCoopers LLP
Minneapolis, Minnesota
May 22, 2012
26
Federal Income Tax Information (Unaudited) – Columbia Select Small Cap Fund
The Fund hereby designates as a capital gain dividend with respect to the fiscal year ended March 31, 2012, $5,105,450 or, if subsequently determined to be different, the net capital gain of such year.
The Fund will notify shareholders in January 2013 of amounts for use in preparing 2012 income tax returns.
27
Fund Governance
The Trustees serve terms of indefinite duration. The names, addresses and birth years of the Trustees and Officers of the Funds in Columbia Funds Series Trust I, the year each was first elected or appointed to office, their principal business occupations during at least the last five years, the number of Funds overseen by each Trustee and other directorships they hold are shown below. Each officer listed below serves as an officer of each Fund in Columbia Funds Series Trust I.
Independent Trustees
| | |
Name, address and year of birth,
Position with funds, Year first
elected or appointed to office | | Principal occupation(s) during past five years, Number of funds in Columbia Funds
Complex overseen by trustee, Other directorships Held |
| |
| Rodman L. Drake (born 1943) | | |
c/o Columbia Management Investment Advisers, LLC 225 Franklin Street Boston, MA 02110 Trustee (since 1994) and Chairman of the Board (since 2009) | | Independent consultant since 2010; Co-Founder of Baringo Capital LLC (private equity) from 1997 to 2008; CEO of Crystal River Capital, Inc. (real estate investment trust) from 2003 to 2010; Oversees 51; Jackson Hewitt Tax Service Inc. (tax preparation services) from 2004 to 2011; Celgene Corporation (global biotechnology company); Student Loan Corporation (student loan provider) from 2005 to 2010; Celgene Corporation (global biotechnology company); The Helios Funds and Brookfield Funds (closed-end funds); Crystal River Capital, Inc. from 2005 to 2010; Parsons Brinckerhoff from 1995 to 2008; and Apex Silver Mines Ltd. from 2007 to 2009 |
| |
| Douglas A. Hacker (born 1955) | | |
c/o Columbia Management Investment Advisers, LLC 225 Franklin Street Boston, MA 02110 Trustee (since 1996) | | Independent business executive since May 2006; Executive Vice President–Strategy of United Airlines from December 2002 to May 2006; President of UAL Loyalty Services (airline marketing company) from September 2001 to December 2002; Executive Vice President and Chief Financial Officer of United Airlines from July 1999 to September 2001. Oversees 51; Nash Finch Company (food distributor); Aircastle Limited (aircraft leasing); and SeaCube Container Leasing Ltd (container leasing) |
|
| Janet Langford Kelly (born 1957) |
c/o Columbia Management Investment Advisers, LLC 225 Franklin Street Boston, MA 02110 Trustee (since 1996) | | Senior Vice President, General Counsel and Corporate Secretary, ConocoPhillips (integrated energy company) since September 2007; Deputy General Counsel–Corporate Legal Services, ConocoPhillips from August 2006 to August 2007; Partner, Zelle, Hofmann, Voelbel, Mason & Gette LLP (law firm) from March 2005 to July 2006; Adjunct Professor of Law, Northwestern University, from September 2004 to June 2006; Director, UAL Corporation (airline) from February 2006 to July 2006; Chief Administrative Officer and Senior Vice President, Kmart Holding Corporation (consumer goods) from September 2003 to March 2004. Oversees 51; None |
|
| Nancy T. Lukitsh (born 1956) |
c/o Columbia Management Investment Advisers, LLC 225 Franklin Street Boston, MA 02110 Trustee (since 2011) | | Senior Vice President, Partner and Director of Marketing, Wellington Management Company, LLP (investment adviser) from 1997 to 2010; Chair, Wellington Management Investment Portfolios (commingled non-U.S. investment pools) from 2007 to 2010; Director, Wellington Trust Company, NA and other Wellington affiliates from 1997 to 2010. Oversees 51; None |
|
| William E. Mayer (born 1940) |
c/o Columbia Management Investment Advisers, LLC 225 Franklin Street Boston, MA 02110 Trustee (since 1994) | | Partner, Park Avenue Equity Partners (private equity) since February 1999; Dean and Professor, College of Business and Management, University of Maryland from 1992 to 1996. Oversees 51; DynaVox Inc. (speech creation); Lee Enterprises (print media), WR Hambrecht + Co. (financial service provider) from 2000 to 2012; BlackRock Kelso Capital Corporation (investment company) |
28
Independent Trustees (continued)
| | |
Name, address and year of birth,
Position with funds, Year first
elected or appointed to office | | Principal occupation(s) during past five years, Number of funds in Columbia Funds
Complex overseen by trustee, Other directorships held |
| |
| David M. Moffett (born 1952) | | |
c/o Columbia Management Investment Advisers, LLC 225 Franklin Street Boston, MA 02110 Trustee (since 2011) | | Retired. Chief Executive Officer, Federal Home Loan Mortgage Corporation, from 2008 to 2009; Senior Adviser, Global Financial Services Group, Carlyle Group, Inc., from 2007 to 2008; Vice Chairman and Chief Financial Officer, U.S. Bancorp, from 1993 to 2007. Oversees 51; CIT Group Inc. (commercial and consumer finance), eBay Inc. (online trading community), MBIA Corp (financial service provider), E.W. Scripps Co. (print and television media), Building Materials Holding Corp. (building materials and construction services), and University of Oklahoma Foundation. |
| |
| Charles R. Nelson (born 1942) | | |
c/o Columbia Management Investment Advisers, LLC 225 Franklin Street Boston, MA 02110 Trustee (since 1981) | | Retired. Professor Emeritus, University of Washington, since 2011; Professor of Economics, University of Washington, from 1976 to 2011; Ford and Louisa Van Voorhis Professor of Political Economy, University of Washington, from 1993 to 2011; Adjunct Professor of Statistics, University of Washington, from 1980 to 2011; Associate Editor, Journal of Money Credit and Banking from 1993 to 2008; consultant on econometric and statistical matters. Oversees 51; None |
| |
| John J. Neuhauser (born 1943) | | |
c/o Columbia Management Investment Advisers, LLC 225 Franklin Street Boston, MA 02110 Trustee (since 1984) | | President, Saint Michael’s College, since August 2007; Director or Trustee of several non-profit organization, including Fletcher Allen Health Care, Inc.; University Professor, Boston College from November 2005 to August 2007; Academic Vice President and Dean of Faculties, Boston College from August 1999 to October 2005. Oversees 51; Liberty All-Star Equity Fund and Liberty All-Star Growth Fund, Inc. (closed-end funds) |
| |
| Patrick J. Simpson (born 1944) | | |
c/o Columbia Management Investment Advisers, LLC 225 Franklin Street Boston, MA 02110 Trustee (since 2000) | | Partner, Perkins Coie LLP (law firm). Oversees 51; None |
| |
| Anne-Lee Verville (born 1945) | | |
c/o Columbia Management Investment Advisers, LLC 225 Franklin Street Boston, MA 02110 Trustee (since 1998) | | Retired. General Manager–Global Education Industry from 1994 to 1997, President–Application Systems Division from 1991 to 1994, Chief Financial Officer–US Marketing & Services from 1988 to 1991, and Chief Information Officer from 1987 to 1988, IBM Corporation (computer and technology). Oversees 51; Enesco Group, Inc. (producer of giftware and home and garden decor products) from 2001 to 2006 |
29
Fund Governance (continued)
Interested Trustee
| | |
Name, address and year of birth,
Position with funds, Year first
elected or appointed to office | | Principal occupation(s) during past five years, Number of funds in Columbia Funds
Complex overseen by trustee, Other directorships held |
| |
| William F. Truscott (born 1960) | | |
53600 Ameriprise Financial Center Minneapolis, MN 55474 Senior Vice President (since 2010) | | Chairman of the Board, Columbia Management Investment Advisers, LLC since May 2010 and February 2012, respectively (previously President, Chairman of the Board and Chief Investment Officer, from 2001 to April 2010); Chief Executive Officer, U.S. Asset Management & President, Annuities, Ameriprise Financial, Inc. since May 2010 (previously President–U.S. Asset Management and Chief Investment Officer from 2005 to April 2010, and Senior Vice President–Chief Investment Officer, from 2001 to 2005); Director, President and Chief Executive Officer, Ameriprise Certificate Company since 2006; Director, Columbia Management Investment Distributors, Inc. since May 2010 and February 2012, respectively (previously Chairman of the Board and Chief Executive Officer from 2008 to April 2010); Chairman of the Board and Chief Executive Officer, RiverSource Distributors, Inc. since 2006. Oversees 51; Columbia Funds Board. |
The Statement of Additional Information includes additional information about the Trustees of the Funds and is available, without charge, upon request by calling 1-800-345-6611.
30
Fund Governance (continued)
Officers
| | |
| Name, Year of birth and address | | Principal occupation(s) during the past five years |
|
| J. Kevin Connaughton (born 1964) |
225 Franklin Street Boston, MA 02110 President (since 2009) | | Senior Vice President and General Manager–Mutual Fund Products, Columbia Management Investment Advisers, LLC since May 2010; President, Columbia Funds, since 2009, and RiverSource Funds, since May 2010 (previously Senior Vice President and Chief Financial Officer, Columbia Funds, from June 2008 to January 2009, Treasurer, Columbia Funds, from October 2003 to May 2008, and senior officer of various other affiliated funds since 2000); Managing Director, Columbia Management Advisors, LLC from December 2004 to April 2010. |
| |
| Michael G. Clarke (born 1969) | | |
225 Franklin Street Boston, MA 02110 Treasurer (since 2011) and Chief Financial Officer (since 2009) | | Vice President, Columbia Management Investment Advisers, LLC since May 2010; Managing Director of Fund Administration, Columbia Management Advisors, LLC, from September 2004 to April 2010; senior officer of Columbia Funds and affiliated funds since 2002. |
| |
| Scott R. Plummer (born 1959) | | |
5228 Ameriprise Financial Center Minneapolis, MN 55474 Senior Vice President, Assistant Secretary and Chief Legal Officer (since 2010) | | Chief Legal Officer and Assistant Secretary, Columbia Management Investment Advisers, LLC since June 2005; Vice President and Lead Chief Counsel–Asset Management, Ameriprise Financial, Inc. since May 2010 (previously Vice President and Chief Counsel–Asset Management, from 2005 to April 2010, and Vice President–Asset Management Compliance from 2004 to 2005); Vice President, Chief Counsel and Assistant Secretary, Columbia Management Investment Distributors, Inc. since 2008; Vice President, General Counsel and Secretary, Ameriprise Certificate Company since 2005; Chief Counsel, RiverSource Distributors, Inc. since 2006; Vice President, General Counsel and Secretary, RiverSource Funds, since December 2006; Senior Vice President, Secretary and Chief Legal Officer, Columbia Funds, since May 2010. |
| |
| Thomas P. McGuire (born 1972) | | |
225 Franklin Street Boston, MA 02110 Chief Compliance Officer (since 2012) | | Vice President–Asset Management Compliance, Columbia Management Investment Advisers, LLC since 2010; Chief Compliance Officer, Ameriprise Certificate Company, since September 2010; Compliance Executive, Bank of America, 2005 to 2010. |
| |
| William F. Truscott (born 1960) | | |
53600 Ameriprise Financial Center Minneapolis, MN 55474 Senior Vice President (since 2010) | | Chairman of the Board, Columbia Management Investment Advisers, LLC since May 2010 and February 2012, respectively (previously President, Chairman of the Board and Chief Investment Officer, from 2001 to April 2010); Chief Executive Officer, U.S. Asset Management & President, Annuities, Ameriprise Financial, Inc. since May 2010 (previously President–U.S. Asset Management and Chief Investment Officer from 2005 to April 2010, and Senior Vice President–Chief Investment Officer, from 2001 to 2005); Director, President and Chief Executive Officer, Ameriprise Certificate Company since 2006; Director, Columbia Management Investment Distributors, Inc. since May 2010 and February 2012, respectively (previously Chairman of the Board and Chief Executive Officer from 2008 to April 2010); Chairman of the Board and Chief Executive Officer, RiverSource Distributors, Inc. since 2006. |
|
| Colin Moore (born 1958) |
225 Franklin Street Boston, MA 02110 Senior Vice President (since 2010) | | Director and Chief Investment Officer, Columbia Management Investment Advisers, LLC since May 2010; Manager, Managing Director and Chief Investment Officer of Columbia Management Advisors, LLC from 2007 to April 2010; Head of Equities, Columbia Management Advisors, LLC from 2002 to 2007. |
31
Fund Governance (continued)
Officers (continued)
| | |
| Name, Year of birth and address | | Principal occupation(s) during the past five years |
| |
| Amy Johnson (born 1965) | | |
5228 Ameriprise Financial Center Minneapolis, MN 55474 Vice President (since 2010) | | Senior Vice President and Chief Operating Officer, Columbia Management Investment Advisers, LLC since May 2010 (previously Chief Administrative Officer, from 2009 until April 2010, Vice President–Asset Management and Trust Company Services, from 2006 to 2009, and Vice President–Operations and Compliance from 2004 to 2006). |
| |
| Joseph F. DiMaria (born 1968) | | |
225 Franklin Street Boston, MA 02110 Vice President (since 2011) and Chief Accounting Officer (since 2008) | | Vice President, Mutual Fund Administration, Columbia Management Investment Advisers, LLC, since May 2010; Director of Fund Administration, Columbia Management Advisors, LLC from January 2006 to April 2010; Head of Tax/Compliance and Assistant Treasurer, Columbia Management Advisors, LLC, from November 2004 to December 2005. |
| |
| Stephen T. Welsh (born 1957) | | |
225 Franklin Street Boston, MA 02110 Vice President (since 2006) | | President and Director, Columbia Management Investment Services Corp. since May 2010; President and Director, Columbia Management Services, Inc. from July 2004 to April 2010; Managing Director, Columbia Management Distributors, Inc. from August 2007 to April 2010. |
| |
| Paul D. Pearson (born 1956) | | |
5228 Ameriprise Financial Center Minneapolis, MN 55474 Vice President and Assistant Treasurer (since 2011) | | Vice President, Investment Accounting, Columbia Management Investment Advisers, LLC, since May 2010; Vice President, Managed Assets, Investment Accounting, Ameriprise Financial Corporation. |
| |
| Paul B. Goucher (born 1968) | | |
5228 Ameriprise Financial Center Minneapolis, MN 55474 Vice President and Assistant Secretary (since 2010) | | Vice President and Chief Counsel of Ameriprise Financial since January 2010 (formerly Vice President and Group Counsel from November 2008 to January 2010); Director, Managing Director and General Counsel of J. & W. Seligman & Co. Incorporated (Seligman) from July 2008 to November 2008 and Managing Director and Associate General Counsel of Seligman from January 2005 to July 2008. |
| |
| Christopher O. Petersen (born 1970) | | |
5228 Ameriprise Financial Center Minneapolis, MN 55474 Vice President (since 2010) and Secretary (since 2011) | | Vice President and Chief Counsel, Ameriprise Financial since January 2010 (formerly Vice President and Group Counsel or Counsel from April 2004 to January 2010); Assistant Secretary of RiverSource Funds since January 2007; Officer of Columbia Funds and affiliated funds since 2007. |
| |
| Michael E. DeFao (born 1968) | | |
225 Franklin Street Boston, MA 02110 Vice President and Assistant Secretary (since 2011) | | Vice President and Chief Counsel, Ameriprise Financial since May 2010; Associate General Counsel Bank of America from June 2005 to April 2010. |
32
Board Consideration and Approval of Advisory Agreement
On March 7, 2012, the Board of Trustees (the “Board”) and a majority of the Trustees who are not interested persons (as defined in the Investment Company Act of 1940) of the Trust (the “Independent Trustees”) unanimously approved the continuation of the Investment Management Services Agreement (the “Advisory Agreement”) with Columbia Management Investment Advisers, LLC (the “Investment Manager”) with respect to Columbia Select Small Cap Fund (the “Fund”), a series of the Trust. As detailed below, the Advisory Fees and Expenses Committee (the “Committee”) and the Board met on multiple occasions to review and discuss, both among themselves and with the management team of the Investment Manager, materials provided by the Investment Manager before determining to approve the continuation of the Advisory Agreement.
In connection with their deliberations regarding the continuation of the Advisory Agreement, the Committee and the Board requested and evaluated materials from the Investment Manager regarding the Fund and the Advisory Agreement, and discussed these materials with representatives of the Investment Manager at the Committee meeting held on March 6, 2012 and at the Board meeting held on March 7, 2012. In addition, the Board considers matters bearing on the Agreement at most of its other meetings throughout the year and meets regularly with senior management of the Funds and the Investment Manager. Through the Board’s Investment Oversight Committees, Trustees also meet with selected Fund portfolio managers and other investment personnel at various times throughout the year. The Committee and the Board also consulted with Fund counsel and with the Independent Trustees’ independent legal counsel, who advised on the legal standard for consideration by the Board and otherwise assisted the Board in its deliberations. On March 6, 2012, the Committee recommended that the Board approve the continuation of the Advisory Agreement. On March 7, 2012, the Board, including a majority of the Independent Trustees, voting separately, unanimously approved the continuation of the Advisory Agreement for the Fund.
The Committee and the Board considered all information that they, their legal counsel, or the Investment Manager believed reasonably necessary to evaluate and to determine whether to approve the continuation of the Advisory Agreement. In their deliberations, the Trustees did not identify any particular information that was all-important or controlling, and individual Trustees may have attributed different weights to the various factors. The information and factors considered by the Committee and the Board in
recommending for approval or approving the continuation of the Advisory Agreement for the Fund included the following:
| n | | Information on the investment performance of the Fund relative to the performance of the Fund’s benchmarks and the performance of a group of comparable mutual funds, as determined by an independent third-party data provider; |
| n | | Information on the Fund’s advisory fees and total expenses, including information comparing the Fund’s expenses to those of a group of comparable mutual funds, as determined by an independent third-party data provider; |
| n | | The Investment Manager’s agreement to contractually limit or cap total operating expenses for the Fund so that total operating expenses (excluding certain fees and expenses, such as transaction costs and certain other investment related expenses, interest, taxes, acquired fund fees and expenses, and extraordinary expenses) would not exceed the median expenses of a group of comparable funds (as determined from time to time, generally annually, by an independent third-party data provider); |
| n | | The terms and conditions of the Advisory Agreement, including that the advisory fee rates payable by the Fund would not change; |
| n | | The terms and conditions of other agreements and arrangements with affiliates of the Investment Manager relating to the operations of the Fund, including the Administrative Services Agreement, the Distribution Agreement and the Transfer and Dividend Disbursing Agent Agreement, noting in the case of the Transfer and Dividend Disbursing Agent Agreement certain proposed changes to the fee rates payable thereunder; |
| n | | Descriptions of various functions performed by the Investment Manager under the Advisory Agreement, including portfolio management and portfolio trading practices; |
| n | | Information regarding the management fees and investment performance of any comparable portfolios of other clients of the Investment Manager, including institutional separate accounts; and |
| n | | The profitability to the Investment Manager and its affiliates from their relationships with the Fund. |
Nature, Extent and Quality of Services to be Provided under the Advisory Agreement
The Committee and the Board considered the nature, extent and quality of services provided to the Fund by the Investment Manager
33
and its affiliates under the Advisory Agreement and under separate agreements for the provision of transfer agency and administrative services, and the resources dedicated to the Fund and the other Columbia Funds by the Investment Manager and its affiliates. The Committee and the Board considered, among other things, the Investment Manager’s ability to attract, motivate and retain highly qualified research, advisory and supervisory investment professionals (including personnel and other resources, compensation programs for personnel involved in fund management, reputation and other attributes), the portfolio management services provided by those investment professionals, the quality of the Investment Manager’s investment research capabilities and trade execution services, and the other resources that the Investment Manager devotes to the Fund. The Committee and the Board also considered the potential benefits to shareholders of investing in a mutual fund that is part of a fund complex offering exposure to a variety of asset classes and investment disciplines and providing a variety of fund and shareholder services.
The Committee and the Board also considered the professional experience and qualifications of the senior personnel of the Investment Manager. The Committee and the Board noted the compliance programs of and the compliance-related resources provided to the Fund by the Investment Manager and its affiliates, and considered the Investment Manager’s ability to provide administrative services to the Fund pursuant to a separate administrative services agreement, including the Investment Manager’s ability to coordinate the activities of the Fund’s other service providers. After reviewing these and related factors, the Committee and the Board concluded, within the context of their overall conclusions, that the expected nature, extent and quality of the services to be provided to the Fund under the Advisory Agreement supported the continuation of such agreement.
Investment Performance
The Committee and the Board reviewed information about the performance of the Fund over various time periods, including performance information relative to benchmarks and information based on reports of an independent third-party data provider that compared the performance of the Fund to the performance of a group of comparable mutual funds. The Committee and the Board also reviewed a description of the third party’s methodology for identifying the Fund’s peer groups for purposes of performance and expense comparisons. In the case of each Fund whose performance lagged that of a relevant peer group for certain (although not necessarily all) periods, the Committee and the Board concluded that
other factors relevant to performance were sufficient, in light of other considerations, to warrant continuation of the Fund’s Advisory Agreement. Those factors varied from fund to fund, but included one or more of the following: (i) that the Fund’s performance, although lagging in certain recent periods, was stronger over the longer term; (ii) that the underperformance was attributable, to a significant extent, to investment decisions that were reasonable and consistent with the Fund’s investment strategy and policies and that the Fund was performing within a reasonable range of expectations, given those investment decisions, market conditions and the Fund’s investment strategy; (iii) that the Fund’s performance was competitive when compared to other relevant performance benchmarks or peer groups; and (iv) that the Investment Manager had taken or was taking steps designed to help improve the Fund’s investment performance, including, but not limited to, replacing portfolio managers, enhancing the resources supporting the portfolio managers, or modifying investment strategies.
The Committee and the Board noted that, through December 31, 2011, the Fund’s performance was in the 93.2, 85.6 and 72.6 percentile (where the best performance would be in the first percentile) of its category selected by an independent third-party data provider for the purposes of performance comparisons for the one-, three- and five- year periods, respectively.
The Committee and the Board also considered the Investment Manager’s performance and reputation generally, the Investment Manager’s historical responsiveness to Board concerns about performance and the Investment Manager’s willingness to take steps intended to improve performance. After reviewing these and related factors, the Committee and the Board concluded, within the context of their overall conclusions regarding the Advisory Agreement, that the performance of the Fund and the Investment Manager was sufficient, in light of other considerations, to warrant the continuation of the Advisory Agreement.
Investment Advisory Fee Rates and Other Expenses
The Committee and the Board considered the advisory fees to be charged to the Fund under the Advisory Agreement as well as the total expenses to be incurred by the Fund. In assessing the reasonableness of the fees under the Advisory Agreement, the Committee and the Board considered, among other information, the Fund’s advisory fee and its expected total expense ratio as a percentage of average daily net assets. The Committee and the Board noted that the Fund’s actual management fee and total net
34
expense ratio are ranked in the 3 and 2 quintiles, respectively, against the Fund’s expense universe as determined by an independent third-party data provider for purposes of expense comparison. The Committee and the Board also took into account the fee waiver and expense limitation arrangements agreed to by the Investment Manager, as noted above.
The Committee and the Board also considered the fact that the advisory fee rates payable by the Fund to the Investment Manager under the Advisory Agreement were the same as those currently paid by the Fund to the Investment Manager.
The Committee and the Board also received and considered information about the advisory fees charged by the Investment Manager to institutional separate accounts. In considering the fees charged to those accounts, the Committee and the Board took into account, among other things, the Investment Manager’s representations about the differences between managing mutual funds as compared to other types of accounts, including differences in the services provided, differences in the risk profile of such business for the Investment Manager and the additional resources required to manage mutual funds effectively. In evaluating the Fund’s advisory fees, the Committee and the Board also took into account the demands, complexity and quality of the investment management of the Fund.
After reviewing these and related factors, the Committee and the Board concluded, within the context of their overall conclusions, that the advisory fee rates and expenses of the Fund supported the continuation of the Advisory Agreement.
Costs of Services to be Provided and Profitability
The Committee and the Board also took note of the costs of the services provided (both on an absolute and relative basis) and the profitability to the Investment Manager and its affiliates in connection with their relationships with the Fund. In evaluating these considerations, the Committee and the Board took note of the advisory fees charged by the Investment Manager to other clients, including fees charged by the Investment Manager to any institutional separate account clients with similar investment strategies to those of the Fund.
The Committee and the Board also considered the compensation directly or indirectly received by the Investment Manager’s affiliates in connection with their relationships with the Fund. The Committee and the Board reviewed information provided by management as to
the profitability of the Investment Manager and its affiliates of their relationships with the Fund, and information about the allocation of expenses used to calculate profitability. When reviewing profitability, the Committee and the Board also considered court cases in which adviser profitability was an issue in whole or in part, the performance of the fund, the expense ratio of the fund, and the implementation of expense limitations with respect to the fund. The Committee and the Board also considered information provided by the Investment Manager regarding its financial condition and comparing its profitability to that of other asset management firms that are, or are subsidiaries of, publicly traded companies.
After reviewing these and related factors, the Committee and the Board concluded, within the context of their overall conclusions, that the profitability to the Investment Manager and its affiliates from their relationships with the Fund supported the continuation of the Advisory Agreement.
Economies of Scale
The Committee and the Board considered the potential existence of economies of scale in the provision by the Investment Manager of services to the Fund, to groups of related funds, and to the Investment Manager’s investment advisory clients as a whole, and whether those economies of scale were shared with the Fund through breakpoints in investment advisory fees or other means, such as expense limitation arrangements and additional investments by the Investment Manager in investment, trading and compliance resources. The Committee and the Board noted that the investment advisory fee schedules for the Fund contained breakpoints that would reduce the fee rate on assets above specified threshold levels.
In considering these issues, the Committee and the Board also considered the costs of the services provided (both on an absolute and relative basis) and the profitability to the Investment Manager and its affiliates from their relationships with the Fund, as discussed above. After reviewing these and related factors, the Committee and the Board concluded, within the context of their overall conclusions, that the extent to which economies of scale were expected to be shared with the Fund supported the continuation of the Advisory Agreement.
Other Benefits to the Investment Manager
The Committee and the Board received and considered information regarding “fall-out” or ancillary benefits received by the Investment Manager and its affiliates as a result of their relationships with the Fund, such as the engagement of the Investment Manager to provide
35
administrative services to the Fund and the engagement of the Investment Manager’s affiliates to provide distribution and transfer agency services to the Fund. The Committee and the Board considered that the Fund’s distributor retains a portion of the distribution fees from the Fund and receives a portion of the sales charges on sales or redemptions of certain classes of shares of the Fund. The Committee and the Board also considered the benefits of research made available to the Investment Manager by reason of brokerage commissions generated by the Fund’s securities transactions, and reviewed information about the Investment Manager’s practices with respect to allocating portfolio brokerage for brokerage and research services. The Committee and the Board considered the possible conflicts of interest associated with certain fall-out or other ancillary benefits and the reporting, disclosure and other processes that would be in place to address such possible
conflicts of interest. The Committee and the Board recognized that the Investment Manager’s profitability would be somewhat lower without these benefits.
Conclusion
The Committee and the Board reviewed all of the above considerations in reaching their decisions to recommend or approve the continuation of the Advisory Agreement. No single item was identified as paramount or controlling, and individual Trustees may have attributed different weights to various factors. Based on their evaluation of all factors that they deemed to be material, including those factors described above, and assisted by the advice of independent legal counsel, the Board, including a majority of the Independent Trustees, voting separately, unanimously approved the continuation of the Advisory Agreement.
36
Important Information About This Report
The fund mails one shareholder report to each shareholder address. If you would like more than one report, please call shareholder services at 1-800-345-6611 and additional reports will be sent to you. This report has been prepared for shareholders of Columbia Select Small Cap Fund.
A description of the policies and procedures that the fund uses to determine how to vote proxies and a copy of the fund’s voting records are available (i) at www.columbiamanagement.com, (ii) on the Securities and Exchange Commission’s website at www.sec.gov, and (iii) without charge, upon request, by calling 1-800-368-0346. Information regarding how the fund voted proxies relating to portfolio securities during the 12-month period ended June 30 is available from the SEC’s website. Information regarding how the fund voted proxies relating to portfolio securities is also available from the fund’s website, www.columbiamanagement.com.
The fund files a complete schedule of portfolio holdings with the SEC for the first and third quarters of each fiscal year on Form N-Q. The fund’s Form N-Q is available on the SEC’s website at www.sec.gov and may be reviewed and copied at the SEC’s Public Reference Room in Washington, D.C. Information on the operation of the Public Reference Room may be obtained by calling
1-800-SEC-0330.
Transfer Agent
Columbia Management Investment Services Corp.
P.O. Box 8081
Boston, MA 02266-8081
1-800-345-6611
Distributor
Columbia Management Investment
Distributors, Inc.
225 Franklin Street Boston, MA 02110
Investment Manager
Columbia Management Investment Advisers, LLC
225 Franklin Street Boston, MA 02110
37

Columbia Select Small Cap Fund
P.O. Box 8081
Boston, MA 02266-8081
columbiamanagement.com
This information is for use with concurrent or prior delivery of a fund prospectus. Investors should consider the investment objectives, risks, charges and expenses of a mutual fund carefully before investing. For a free prospectus, which contains this and other important information about the funds, visit columbiamanagement.com. Read the prospectus carefully before investing. The Fund is distributed by Columbia Management Investment Distributors, Inc., member FINRA, and managed by Columbia Management Investment Advisers, LLC.
©2012 Columbia Management Investment Advisers, LLC. All rights reserved.
C-1171 C (5/12)

Columbia Value and Restructuring Fund
Annual Report for the Period Ended March 31, 2012
Table of contents
The views expressed in this report reflect the current views of the respective parties. These views are not guarantees of future performance and involve certain risks, uncertainties and assumptions that are difficult to predict, so actual outcomes and results may differ significantly from the views expressed. These views are subject to change at any time based upon economic, market or other conditions and the respective parties disclaim any responsibility to update such views. These views may not be relied on as investment advice and, because investment decisions for a Columbia Fund are based on numerous factors, may not be relied on as an indication of trading intent on behalf of any particular Columbia Fund. References to specific securities should not be construed as a recommendation or investment advice.
President’s Message

Dear Shareholders,
A stock market rally that commenced in the fourth quarter of 2011 continued into 2012 in the United States and around the world, as all major market regions generated double-digit returns for the three-month period ended March 31, 2012. Volatility declined sharply as European debt fears quieted somewhat and sentiment improved. Returns in developed countries were buoyed by strong results in Germany, Belgium, Austria and the Nordic markets of Denmark, Finland, Norway and Sweden. Under the cloud of its own mounting debt problem, Spain was the only eurozone country to deliver a negative return during the three-month period. Solid economic growth and accommodative monetary policy helped boost gains in emerging markets. The rally in U.S. equities was largely driven by an expansion in “multiples”— an increase in
stock prices relative to their earnings. By the end of the first quarter of 2012, stocks no longer appeared as cheap as they were late in 2011. Bonds lagged stocks during the first quarter as investors responded to signs of an improved environment with a greater appetite for risk.
Concerns around the health of the global economy were centered in news headlines focusing on Washington D.C., Europe, China and the Middle East. In the United States, economic indicators remained mixed but generally indicated support for slow, sustainable economic growth. European policymakers have made progress in containing the eurozone debt crisis, though they still have not solved the issue of long-term solvency. The European Central Bank has lowered interest rates and flooded the financial system with liquidity that may provide breathing space for companies to restructure their balance sheets. These massive infusions of liquidity may whet the appetite for risk from investors around the world. However, it has delayed a true reckoning with the European financial situation, as concerns about Spain and Portugal continue to cloud the outlook. These structural challenges that persist in the developed world, and slowing growth in emerging market economies, leave the global economy in a fragile state. Domestic demand, combined with slowing inflationary trends, has also helped to shore up emerging market economies. Joblessness remains low and monetary conditions remain easy.
Despite the challenges and surprises of 2011, we see pockets of strength — and as a result, attractive opportunities — both here and abroad for 2012. We hope to help you capitalize on these opportunities with various articles in our 2012 Perspectives, which is available via the Market Insights tab at columbiamanagement.com. This publication showcases the strong research capabilities and experienced investment teams of Columbia Management and offers a diverse array of investment ideas based on our five key themes for 2012.
Other information and resources available at columbiamanagement.com include:
| n | | detailed up-to-date fund performance and portfolio information |
| n | | economic analysis and market commentary |
| n | | quarterly fund commentaries |
| n | | Columbia Management Investor, our award-winning quarterly newsletter for shareholders |
Thank you for your continued support of the Columbia Funds. We look forward to serving your investment needs for many years to come.
Best Regards,

J. Kevin Connaughton
President, Columbia Funds
Investors should consider the investment objectives, risks, charges and expenses of a mutual fund carefully before investing. For a free prospectus, which contains this and other important information about the funds, visit columbiamanagement.com. The prospectus should be read carefully before investing.
Columbia Funds are distributed by Columbia Management Investment Distributors, Inc., member FINRA, and managed by Columbia Management Investment Advisers, LLC.
© 2012 Columbia Management Investment Advisers, LLC. All rights reserved.
Fund Profile – Columbia Value and Restructuring Fund
Summary
| n | | For the 12-month period that ended March 31, 2012, the fund’s Class A shares returned –5.49% without sales charge. |
| n | | The fund trailed its benchmarks, the Russell 1000 Value Index1 and the S&P 500 Index2, which returned 4.79%% and 8.54%, respectively. |
| n | | Overweight positions in the energy and materials sectors detracted from performance relative to the benchmark as stocks in both sectors performed relatively poorly. |
Portfolio Management
David J. Williams has co-managed the fund since 2008 and the predecessor fund since 1992. From 1987 until joining Columbia Management Investment Advisers, LLC (the Investment Manager) in May 2010, Mr. Williams was associated with the fund’s previous investment adviser as an investment professional. Effective April 27, 2012, following the close of the reporting period, Mr. Williams retired from the Investment Manager.
Guy W. Pope has co-managed the fund since 2009. From 1993 until joining the Investment Manager in May 2010, Mr. Pope was associated with the fund’s previous investment adviser as an investment professional.
J. Nicholas Smith has co-managed the fund since 2009. From 2005 until joining the Investment Manager in May 2010, Mr. Smith was associated with the fund’s previous investment adviser as an investment professional.
| 1 | The Russell 1000 Value Index measures the performance of those Russell 1000 Index companies with lower price-to-book ratios and lower forecasted growth values. |
| 2 | The Standard & Poor’s (S&P) 500 Index tracks the performance of 500 widely held, large-capitalization U.S. stocks. |
Indices are not available for investment, are not professionally managed and do not reflect sales charges, fees, brokerage commissions, taxes or other expenses of investing. Securities in the fund may not match those in an index.
Performance data quoted represents past performance and current performance may be lower or higher. Past performance is no guarantee of future results. The investment return and principal value will fluctuate so that shares, when redeemed, may be worth more or less than the original cost. Please visit www.columbiamanagement.com for daily and most recent month-end performance updates.
Summary
1-year return as of 03/31/12
| | |
| |
 | | –5.49% Class A Shares (without sales charge) |
| |
 | | +4.79% Russell 1000 Value Index |
| |
| | +8.54% S&P 500 Index |
|
Morningstar Style Box™ |
|
Equity Style |
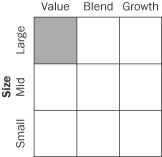
|
The Morningstar Style Box™ is based on the fund’s portfolio holdings. For equity funds, the vertical axis shows the market capitalization of the stocks owned, and the horizontal axis shows investment style (value, blend, or growth). Information shown is based on the most recent data provided by Morningstar.
© 2012 Morningstar, Inc. All rights reserved. The Morningstar information contained herein: (1) is proprietary to Morningstar and/or its content providers; (2) may not be copied or distributed; and (3) is not warranted to be accurate, complete or timely. Neither Morningstar nor its content providers are responsible for any damages or losses arising from any use of this information.
1
Performance Information – Columbia Value and Restructuring Fund
Performance data quoted represents past performance and current performance may be lower or higher. Past performance is no guarantee of future results. The investment return and principal value will fluctuate so that shares, when redeemed, may be worth more or less than the original cost. Please visit www.columbiamanagement.com for daily and most recent month-end performance updates.
|
| Performance of a $10,000 investment 04/01/02 – 03/31/12 |
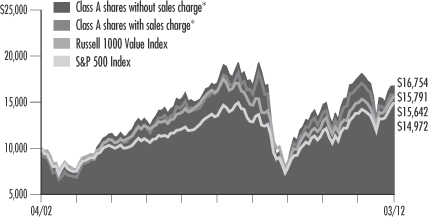
The chart above shows the change in value of a hypothetical $10,000 investment in Class A shares of Columbia Value and Restructuring Fund during the stated time period, and does not reflect the deduction of taxes that a shareholder may pay on fund distributions or on the redemption of fund shares.
| | | | | | | | |
| Performance of a $10,000 investment 04/01/02 – 03/31/12 ($) | |
| | |
| Sales charge | | without | | | with | |
Class A* | | | 16,754 | | | | 15,791 | |
Class C* | | | 15,558 | | | | 15,558 | |
Class I* | | | 17,168 | | | | n/a | |
Class R* | | | 16,344 | | | | n/a | |
Class W* | | | 16,744 | | | | n/a | |
Class Z | | | 17,150 | | | | n/a | |
| | | | | | | | | | | | | | | | | | | | | | | | | | | | | | | | |
| Average annual total return as of 03/31/12 (%) | |
| | | | | | |
| Share class | | A* | | | C* | | | I* | | | R* | | | W* | | | Z | |
| Inception | | 09/28/07 | | | 09/28/07 | | | 9/27/10 | | | 12/31/04 | | | 9/27/10 | | | 12/31/92 | |
| Sales charge | | without | | | with | | | without | | | with | | | without | | | without | | | without | | | without | |
1-year | | | –5.49 | | | | –10.93 | | | | –6.18 | | | | –7.11 | | | | –5.26 | | | | –5.70 | | | | –5.50 | | | | –5.26 | |
5-year | | | –0.46 | | | | –1.63 | | | | –1.19 | | | | –1.19 | | | | –0.22 | | | | –0.71 | | | | –0.48 | | | | –0.24 | |
10-year/Life | | | 5.30 | | | | 4.67 | | | | 4.52 | | | | 4.52 | | | | 5.55 | | | | 5.04 | | | | 5.29 | | | | 5.54 | |
The “with sales charge” returns include the maximum initial sales charge of 5.75% for Class A shares and the applicable contingent deferred sales charge of 1.00% for Class C shares for the first year only. The “without sales charge” returns do not include the effect of sales charges. If they had, returns would be lower.
Performance results reflect any fee waivers or reimbursements of fund expenses by Columbia Management Investment Advisers, LLC and/or any of its affiliates. Absent these fee waivers or expense reimbursement arrangements, performance results would have been lower.
All results shown assume the reinvestment of distributions. Class I and Z shares are sold at net asset value with no distribution and service (Rule 12b-1) fees. Class R shares are sold at net asset value with a distribution (Rule 12b-1) fee. Class W shares are sold at net asset value with a distribution and service (Rule 12b-1) fee. Class I, Class R, Class W and Class Z shares have limited eligibility and the investment minimum requirements may vary. Please see the fund’s prospectuses for details. Performance for different share classes will vary based on differences in sales charges and fees associated with each class.
The tables do not reflect the deduction of taxes that a shareholder may pay on fund distributions or on the redemption of fund shares.
| * | The returns shown for periods prior to the share class inception date (including returns since inception, which are since fund inception) include the returns of the fund’s oldest share class. These returns are adjusted to reflect any higher class-related operating expenses of the newer share classes, as applicable. Please visit columbiamanagement.com/mutual-funds/appended-performance for more information |
2
Understanding Your Expenses – Columbia Value and Restructuring Fund
As an investor, you incur two types of costs. There are transaction costs, which generally include sales charges on purchases and may include redemption fees. There are also ongoing costs, which generally include management fees, distribution and service (Rule 12b-1) fees, and other fund expenses. The following information is intended to help you understand your ongoing costs (in dollars) of investing in the Fund and to help you compare these costs with the ongoing costs of investing in other mutual funds.
Analyzing your fund’s expenses
To illustrate these ongoing costs, we have provided examples and calculated the expenses paid by investors in each share class of the Fund during the period. The actual and hypothetical information in the table is based on an initial investment of $1,000 at the beginning of the period indicated and held for the entire period. Expense information is calculated two ways and each method provides you with different information. The amount listed in the “Actual” column is calculated using the Fund’s actual operating expenses and total return for the period. You may use the Actual information, together with the amount invested, to estimate the expenses that you paid over the period. Simply divide your account value by $1,000 (for example, an $8,600 account value divided by $1,000 = 8.6), then multiply the results by the expenses paid during the period under the Actual column. The amount listed in the “Hypothetical” column assumes a 5% annual rate of return before expenses (which is not the Fund’s actual return) and then applies the Fund’s actual expense ratio for the period to the hypothetical return. You should not use the hypothetical account values and expenses to estimate either your actual account balance at the end of the period or the expenses you paid during the period. See “Compare with other funds” below for details on how to use the hypothetical data.
Compare with other funds
Since all mutual funds are required to include the same hypothetical calculations about expenses in shareholder reports, you can use this information to compare the ongoing cost of investing in the Fund with other funds. To do so, compare the hypothetical example with the 5% hypothetical examples that appear in the shareholder reports of other funds. As you compare hypothetical examples of other funds, it is important to note that hypothetical examples are meant to highlight the ongoing costs of investing in a fund only and do not reflect any transaction costs, such as sales charges, or redemption or exchange fees. Therefore, the hypothetical calculations are useful in comparing ongoing costs only, and will not help you determine the relative total costs of owning different funds. If transaction costs were included in these calculations, your costs would be higher.
| | | | | | | | | | | | | | | | | | | | | | | | | | | | |
10/01/11 – 03/31/12 | |
| | | | |
| | | Account value at the
beginning of the period ($) | | | Account value at the
end of the period ($) | | | Expenses paid
during the period ($) | | | Fund's annualized
expense ratio (%) | |
| | | Actual | | | Hypothetical | | | Actual | | | Hypothetical | | | Actual | | | Hypothetical | | | Actual | |
Class A | | | 1,000.00 | | | | 1,000.00 | | | | 1,265.60 | | | | 1,019.00 | | | | 6.65 | | | | 5.92 | | | | 1.18 | |
Class C | | | 1,000.00 | | | | 1,000.00 | | | | 1,261.20 | | | | 1,015.27 | | | | 10.85 | | | | 9.67 | | | | 1.93 | |
Class I | | | 1,000.00 | | | | 1,000.00 | | | | 1,268.90 | | | | 1,021.08 | | | | 4.29 | | | | 3.82 | | | | 0.76 | |
Class R | | | 1,000.00 | | | | 1,000.00 | | | | 1,264.20 | | | | 1,017.75 | | | | 8.05 | | | | 7.17 | | | | 1.43 | |
Class W | | | 1,000.00 | | | | 1,000.00 | | | | 1,265.80 | | | | 1,018.95 | | | | 6.70 | | | | 5.97 | | | | 1.19 | |
Class Z | | | 1,000.00 | | | | 1,000.00 | | | | 1,267.30 | | | | 1,020.24 | | | | 5.24 | | | | 4.67 | | | | 0.93 | |
Expenses paid during the period are equal to the annualized expense ratio for each class as indicated above, multiplied by the average account value over the period and then multiplied by the number of days in the Fund’s most recent fiscal half year and divided by 366.
Expenses do not include fees and expenses incurred indirectly by the Fund from the underlying funds in which the Fund may invest (also referred to as “acquired funds”), including affiliated and non-affiliated pooled investments vehicles (including mutual funds and exchange traded funds).
Had Columbia Management Investment Advisers, LLC and/or certain of its affiliates not waived/reimbursed certain fees and expenses, account value at the end of the period would have been reduced.
3
Portfolio Managers’ Report – Columbia Value and Restructuring Fund
Performance data quoted represents past performance and current performance may be lower or higher. Past performance is no guarantee of future results. The investment return and principal value will fluctuate so that shares, when redeemed, may be worth more or less than the original cost. Please visit www.columbiamanagement.com for daily and most recent month-end performance updates.
| | | | |
| Net asset value per share | |
| |
as of 03/31/12 ($) | | | | |
Class A | | | 49.58 | |
Class C | | | 49.44 | |
Class I | | | 49.48 | |
Class R | | | 49.55 | |
Class W | | | 49.56 | |
Class Z | | | 49.55 | |
| | | | |
| Distributions declared per share | |
|
04/01/11 – 03/31/12 ($) | |
Class A | | | 0.49 | |
Class C | | | 0.17 | |
Class I | | | 0.69 | |
Class R | | | 0.37 | |
Class W | | | 0.51 | |
Class Z | | | 0.61 | |
For the 12-month period that ended March 31, 2012, the fund’s Class A shares returned –5.49% without sales charge. The fund lagged its benchmarks, the Russell 1000 Value Index and the S&P 500 Index, which returned 4.79% and 8.54%, respectively. Overweight positions in the energy and materials sectors held back results, as both groups underperformed for the period. In addition, problems in the credit markets, caused by concerns about sovereign debt issues in Europe, hurt valuations of stocks of restructuring companies, which are an important part of our strategy. Investors seemed to fear that these firms could lose access to credit needed for their reorganizations. Fund results received a boost from several high-dividend stocks, which generated strong returns. Many investors perceived dividend-payers as less risky than other equities and as more attractive than low-yielding bonds.
An improving economic picture
During the first half of the 12-month period, a series of natural disasters in Japan, Europe’s debt problems and wrangling in Washington over the federal budget and the national debt dominated world headlines. U.S. economic news was lackluster and job growth was disappointing. However, the pace of growth picked up in the second half of the period and prospects brightened as fears of a lapse back into recession faded. Consumer confidence improved as the labor market added more than a million new jobs between October 2011 and March 2012, while the jobless rate fell to 8.2%. Household net worth also picked up as the equity markets rebounded. Headline inflation — which tracks a broad range of consumer expenditures, including food and energy — moved marginally higher. Despite a modest slowdown in manufacturing activity late in the summer of 2011, manufacturing activity stabilized and expanded into 2012. Housing continues to be the one nagging weak spot in the economy. Yet, there is hope that a bottom in the housing market is in sight.
Materials and energy stocks faltered
The fund was overweight relative to the benchmark in materials and energy stocks, which was a disadvantage during the period. A further emphasis on coal companies in the energy sector produced particularly disappointing results in Alpha Natural Resources and Consol Energy (0.2% and 2.4% of net assets, respectively). U.S. environmental policies combined with low natural gas prices in North America to put steam coal producers at a competitive disadvantage. Increased production by Australian metallurgical producers also posed a competitive challenge to their North American counterparts. The fund’s position in the Brazilian oil giant Petrobras (3.4% of net assets) struggled against interference by the Brazilian national government, which put the company at a disadvantage, especially when investors already were concerned about the costs of a capital improvement program. Devon Energy (4.0% of net assets), an independent oil and gas exploration and production company, also struggled. In materials, laggards included copper companies Freeport McMoRan (2.7% of net assets), Southern Copper and Grupo Mexico (positions eliminated). All three felt the effects of worries that slowing growth in China would undercut demand.
Investors favored higher-yielding equities
Several strong dividend-paying investments performed very well, including tobacco company Lorillard, retailing chain T.J. Maxx, technology corporation IBM and railroad Union Pacific (5.0%, 5.0%, 4.5% and 4.4% of net assets, respectively). They benefited when yield-seeking investors saw greater potential in higher-dividend stocks compared to bonds and
4
Portfolio Managers’ Report (continued) – Columbia Value and Restructuring Fund
viewed them as less risky than other types of equities. The fund also was helped by solid performance from Panama-based airline Copa Holdings (2.7% of net assets). It delivered solid earnings from its hub-and-spoke air traffic routing system, which gave it a competitive advantage in the South American and Central American markets.
Market approaches fair value
We believe the market rally of late 2011 and early 2012 has lifted stock prices close to reasonable valuations, but positive corporate earnings momentum has the potential to provide additional near-term opportunity. We continue to believe the capital markets need evidence of greater government fiscal discipline in both the United States and Europe before investor confidence will support a longer-term price surge. At the same time, any improvement in the macroeconomic backdrop would be encouraging, with investors especially watching for evidence that corporations are beginning to boost profits by increasing revenues, rather than primarily through cost-cutting. Among the various industry groups, we see particular opportunities in chemical companies, which have the potential to benefit from low natural gas prices in North America. Going forward, we plan to maintain our emphasis on stocks selling at a fairly significant discount to market averages and to look for companies with excellent longer-term growth opportunities. We continue to believe corporations with these characteristics should perform well over time.
Portfolio characteristics and holdings are subject to change periodically and may not be representative of current characteristics and holdings. The outlook for the fund may differ from that presented for other Columbia Funds.
Equity securities are affected by stock market fluctuations that occur in response to economic and business developments.
Value stocks are stocks of companies that may have experienced adverse business or industry developments or may be subject to special risks that have caused the stocks to be out of favor. If the manager’s assessment of a company’s prospects is wrong, the price of its stock may not approach the value the manager has placed on it.
International investing involves special risks, including foreign taxation, currency risks, risks associated with possible differences in financial standards and other risks associated with future political and economic developments.
Investing in emerging markets may involve greater risks than investing in more developed countries. In addition, concentration of investments in a single region may result in greater volatility.
| | | | |
| Portfolio breakdown1 | |
|
(as of March 31, 2012) | |
Stocks | | | 99.8 | % |
Consumer Discretionary | | | 6.4 | |
Consumer Staples | | | 5.9 | |
Energy | | | 22.8 | |
Financials | | | 13.3 | |
Health Care | | | 8.9 | |
Industrials | | | 20.8 | |
Information Technology | | | 9.5 | |
Materials | | | 10.5 | |
Telecommunication Services | | | 1.7 | |
Bonds | | | 0.2 | |
| | 1 | Percentages indicated are based upon total investments (excluding Investments of Cash Collateral Received for Securities on Loan). The Fund’s portfolio composition is subject to change. |
| | | | |
| Top ten holdings1 | |
|
(as of March 31, 2012) | |
TJX Companies, Inc. | | | 5.0 | % |
Lorillard, Inc. | | | 5.0 | |
Celanese Corp., Class A | | | 4.6 | |
International Business Machines Corp. | | | 4.5 | |
Union Pacific Corp. | | | 4.4 | |
ACE Ltd. | | | 4.2 | |
ConocoPhillips | | | 4.0 | |
Devon Energy Corp. | | | 4.0 | |
Eaton Corp. | | | 3.9 | |
Noble Energy, Inc. | | | 3.8 | |
| | 1 | Percentages indicated are based upon total investments (excluding Investments of Cash Collateral Received for Securities on Loan). |
For further detail about these holdings, please refer to the section entitled “Portfolio of Investments.”
Fund holdings are as of the date given, are subject to change at any time, and are not recommendations to buy or sell any security.
5
Portfolio of Investments – Columbia Value and Restructuring Fund
March 31, 2012
(Percentages represent value of investments compared to net assets)
| | | | | | | | |
| Issuer | | Shares | | | Value | |
Common Stocks 97.9% | |
CONSUMER DISCRETIONARY 6.4% | | | | | | | | |
Household Durables 1.4% | | | | | | | | |
Newell Rubbermaid, Inc. | | | 3,200,000 | | | | $56,992,000 | |
Specialty Retail 5.0% | | | | | | | | |
TJX Companies, Inc. | | | 5,200,000 | | | | 206,492,000 | |
TOTAL CONSUMER DISCRETIONARY | | | | | | | 263,484,000 | |
CONSUMER STAPLES 5.1% | | | | | | | | |
Food Products 0.1% | | | | | | | | |
Dole Food Co., Inc.(a)(b) | | | 700,000 | | | | 6,986,000 | |
Tobacco 5.0% | | | | | | | | |
Lorillard, Inc. | | | 1,590,000 | | | | 205,873,200 | |
TOTAL CONSUMER STAPLES | | | | | | | 212,859,200 | |
ENERGY 22.9% | | | | | | | | |
Oil, Gas & Consumable Fuels 22.9% | | | | | | | | |
Alpha Natural Resources, Inc.(a) | | | 576,564 | | | | 8,769,538 | |
Anadarko Petroleum Corp. | | | 1,500,000 | | | | 117,510,000 | |
Apache Corp. | | | 500,000 | | | | 50,220,000 | |
ConocoPhillips | | | 2,200,000 | | | | 167,222,000 | |
Consol Energy, Inc. | | | 2,850,000 | | | | 97,185,000 | |
Devon Energy Corp. | | | 2,350,000 | | | | 167,132,000 | |
Murphy Oil Corp. | | | 800,000 | | | | 45,016,000 | |
Noble Energy, Inc. | | | 1,600,000 | | | | 156,448,000 | |
Petroleo Brasileiro SA, ADR | | | 5,264,378 | | | | 139,821,880 | |
| | | | | | | | |
Total | | | | | | | 949,324,418 | |
TOTAL ENERGY | | | | | | | 949,324,418 | |
FINANCIALS 12.6% | | | | | | | | |
Capital Markets 4.1% | | | | | | | | |
Apollo Global Management LLC, Class A | | | 2,000,000 | | | | 28,560,000 | |
Apollo Investment Corp. | | | 4,500,000 | | | | 32,265,000 | |
Invesco Ltd. | | | 4,000,000 | | | | 106,680,000 | |
| | | | | | | | |
Total | | | | | | | 167,505,000 | |
Diversified Financial Services 1.1% | | | | | | | | |
JPMorgan Chase & Co. | | | 1,000,000 | | | | 45,980,000 | |
Insurance 6.7% | | | | | | | | |
ACE Ltd. | | | 2,400,000 | | | | 175,680,000 | |
Loews Corp. | | | 1,000,000 | | | | 39,870,000 | |
MetLife, Inc. | | | 1,600,000 | | | | 59,760,000 | |
| | | | | | | | |
Total | | | | | | | 275,310,000 | |
Real Estate Investment Trusts (REITs) 0.7% | |
Weyerhaeuser Co. | | | 1,400,000 | | | | 30,688,000 | |
TOTAL FINANCIALS | | | | | | | 519,483,000 | |
HEALTH CARE 8.9% | | | | | | | | |
Biotechnology 0.4% | | | | | | | | |
Vertex Pharmaceuticals, Inc.(a) | | | 400,000 | | | | 16,404,000 | |
Health Care Equipment & Supplies 1.0% | |
Baxter International, Inc. | | | 700,000 | | | | 41,846,000 | |
Health Care Providers & Services 4.1% | | | | | | | | |
AmerisourceBergen Corp. | | | 3,300,000 | | | | 130,944,000 | |
CIGNA Corp. | | | 750,000 | | | | 36,937,500 | |
| | | | | | | | |
Total | | | | | | | 167,881,500 | |
Pharmaceuticals 3.4% | | | | | | | | |
Merck & Co., Inc. | | | 600,000 | | | | 23,040,000 | |
Pfizer, Inc. | | | 3,700,000 | | | | 83,842,000 | |
| | | | | | | | |
| Issuer | | Shares | | | Value | |
Common Stocks (continued) | |
HEALTH CARE (cont.) | | | | | | | | |
Pharmaceuticals (cont.) | | | | | | | | |
Warner Chilcott PLC, Class A(a)(b) | | | 2,000,000 | | | | $33,620,000 | |
| | | | | | | | |
Total | | | | | | | 140,502,000 | |
TOTAL HEALTH CARE | | | | | | | 366,633,500 | |
INDUSTRIALS 20.8% | | | | | | | | |
Aerospace & Defense 1.2% | | | | | | | | |
United Technologies Corp. | | | 600,000 | | | | 49,764,000 | |
Airlines 2.8% | | | | | | | | |
Copa Holdings SA, Class A | | | 1,430,000 | | | | 113,256,000 | |
Construction & Engineering 1.0% | | | | | | | | |
AECOM Technology Corp.(a) | | | 1,850,000 | | | | 41,384,500 | |
Industrial Conglomerates 2.7% | | | | | | | | |
Tyco International Ltd. | | | 2,000,000 | | | | 112,360,000 | |
Machinery 7.3% | | | | | | | | |
AGCO Corp.(a)(b) | | | 1,400,000 | | | | 66,094,000 | |
Eaton Corp. | | | 3,200,000 | | | | 159,456,000 | |
Stanley Black & Decker, Inc. | | | 1,000,000 | | | | 76,960,000 | |
| | | | | | | | |
Total | | | | | | | 302,510,000 | |
Road & Rail 4.4% | | | | | | | | |
Union Pacific Corp. | | | 1,700,000 | | | | 182,716,000 | |
Trading Companies & Distributors 1.4% | |
AerCap Holdings NV(a) | | | 5,250,000 | | | | 58,327,500 | |
TOTAL INDUSTRIALS | | | | | | | 860,318,000 | |
INFORMATION TECHNOLOGY 9.5% | |
Communications Equipment 5.0% | |
Cisco Systems, Inc. | | | 2,700,000 | | | | 57,105,000 | |
Harris Corp.(b) | | | 3,300,000 | | | | 148,764,000 | |
| | | | | | | | |
Total | | | | | | | 205,869,000 | |
IT Services 4.5% | | | | | | | | |
International Business Machines Corp. | | | 900,000 | | | | 187,785,000 | |
TOTAL INFORMATION TECHNOLOGY | | | | | | | 393,654,000 | |
MATERIALS 10.0% | | | | | | | | |
Chemicals 6.3% | | | | | | | | |
Celanese Corp., Class A | | | 4,100,000 | | | | 189,338,000 | |
Methanex Corp. | | | 900,000 | | | | 29,187,000 | |
PPG Industries, Inc. | | | 450,000 | | | | 43,110,000 | |
| | | | | | | | |
Total | | | | | | | 261,635,000 | |
Metals & Mining 3.7% | | | | | | | | |
Cliffs Natural Resources, Inc. | | | 600,000 | | | | 41,556,000 | |
Freeport-McMoRan Copper & Gold, Inc.(b) | | | 2,900,000 | | | | 110,316,000 | |
| | | | | | | | |
Total | | | | | | | 151,872,000 | |
TOTAL MATERIALS | | | | | | | 413,507,000 | |
TELECOMMUNICATION SERVICES 1.7% | |
Diversified Telecommunication Services 1.7% | |
HKT Trust and HKT Ltd.(a)(b) | | | 58,000,000 | | | | 45,112,066 | |
Windstream Corp.(b) | | | 2,100,000 | | | | 24,591,000 | |
| | | | | | | | |
Total | | | | | | | 69,703,066 | |
TOTAL TELECOMMUNICATION SERVICES | | | | 69,703,066 | |
Total Common Stocks | | | | | |
(Cost: $2,806,638,613) | | | | $4,048,966,184 | |
| |
The Accompanying Notes to Financial Statements are an integral part of this statement.
6
Columbia Value and Restructuring Fund
March 31, 2012
(Percentages represent value of investments compared to net assets)
| | | | | | | | |
| Issuer | | Shares | | | Value | |
Convertible Preferred Stocks 2.0% | |
CONSUMER STAPLES 0.7% | | | | | | | | |
Food Products 0.7% | | | | | | | | |
2009 Dole Food Automatic Common Exchange Security Trust,
7.000%(a)(c) | | | 3,000,000 | | | | $29,390,700 | |
TOTAL CONSUMER STAPLES | | | | | | | 29,390,700 | |
FINANCIALS 0.8% | | | | | | | | |
Diversified Financial Services 0.8% | | | | | | | | |
Citigroup, Inc. 7.500% | | | 33,199,642 | | | | 30,972,000 | |
TOTAL FINANCIALS | | | | | | | 30,972,000 | |
MATERIALS 0.5% | | | | | | | | |
Metals & Mining 0.5% | | | | | | | | |
Molycorp, Inc., 5.500%(b) | | | 300,000 | | | | 21,513,000 | |
TOTAL MATERIALS | | | | | | | 21,513,000 | |
Total Convertible Preferred Stocks | | | | | |
(Cost: $84,903,987) | | | | $81,875,700 | |
| | | | | | | | | | | | |
| Issuer | | Coupon
Rate | | | Principal
Amount | | | Value | |
Convertible Bonds 0.3% | |
Banking 0.3% | |
Apollo Investment Corp. Senior Unsecured | |
01/15/16 | | | 5.750 | % | | | $10,000,000 | | | | $9,800,000 | |
Total Convertible Bonds | |
(Cost: $9,547,681) | | | | $9,800,000 | |
| Issuer | | Effective
Yield | | | Par/
Principal/
Shares | | | Value | |
Investments of Cash Collateral Received for Securities on Loan 1.3% | |
Asset-Backed Commercial Paper 0.6% | |
Aspen Funding Corp. | |
05/11/12 | | | 0.471 | % | | | $2,996,358 | | | | $2,996,359 | |
Kells Funding LLC | |
05/10/12 | | | 0.501 | % | | | 4,994,097 | | | | 4,994,097 | |
| | | | | | | | | | | | |
| Issuer | | Effective
Yield | | | Par/
Principal/
Shares | | | Value | |
Investments of Cash Collateral Received for Securities on Loan (continued) | |
Asset-Backed Commercial Paper (cont.) | |
Regency Markets No. 1 LLC | |
05/15/12 | | | 0.380 | % | | | $9,990,500 | | | | $9,990,500 | |
Rhein-Main Securitisation Ltd. | |
04/13/12 | | | 0.771 | % | | | 4,993,583 | | | | 4,993,583 | |
| | | | | | | | | | | | |
Total | | | | | | | | | | | 22,974,539 | |
Certificates of Deposit 0.4% | |
Australia and New Zealand Bank Group, Ltd. | |
05/09/12 | | | 0.500 | % | | | 3,000,000 | | | | 3,000,000 | |
Norinchukin Bank | |
05/21/12 | | | 0.470 | % | | | 5,000,000 | | | | 5,000,000 | |
Skandinaviska Enskilda Banken | |
04/16/12 | | | 0.360 | % | | | 5,000,000 | | | | 5,000,000 | |
Westpac Banking Corp. | |
04/02/12 | | | 0.250 | % | | | 3,000,000 | | | | 3,000,000 | |
| | | | | | | | | | | | |
Total | | | | | | | | | | | 16,000,000 | |
Commercial Paper —% | |
Manhattan Asset Funding Co. LLC | |
04/05/12 | | | 0.200 | % | | | 999,844 | | | | 999,844 | |
Repurchase Agreements 0.3% | |
Mizuho Securities USA, Inc. dated 03/30/12, matures 04/02/12,
repurchase price $5,000,113(d) | |
| | | 0.270 | % | | | 5,000,000 | | | | 5,000,000 | |
UBS Securities LLC dated 03/30/12, matures 04/02/12,
repurchase price $9,064,887(d) | |
| | | 0.180 | % | | | 9,064,751 | | | | 9,064,751 | |
| | | | | | | | | | | | |
Total | | | | | | | | | | | 14,064,751 | |
Total Investments of Cash Collateral Received for
Securities on Loan | |
(Cost: $54,039,134) | | | | $54,039,134 | |
Total Investments | |
(Cost: $2,955,129,415) | | | | $4,194,681,018 | (e) |
Other Assets & Liabilities, Net | | | | (60,119,609 | ) |
Net Assets | | | | $4,134,561,409 | |
| | |
Notes to Portfolio of Investments |
| (b) | At March 31, 2012, security was partially or fully on loan. |
| (c) | Security exempt from registration pursuant to Rule 144A under the Securities Act of 1933. This security may be resold in transactions exempt from registration, normally to qualified institutional buyers. At March 31, 2012, the value of these securities amounted to $29,390,700 or 0.71% of net assets. |
The Accompanying Notes to Financial Statements are an integral part of this statement.
7
Columbia Value and Restructuring Fund
March 31, 2012
(Percentages represent value of investments compared to net assets)
|
Notes to Portfolio of Investments (continued) |
| (d) | The table below represents securities received as collateral for repurchase agreements. This collateral is deposited with the Fund’s custodian and, pursuant to the terms of the repurchase agreement, must have an aggregate market value greater than or equal to the repurchase price plus accrued interest at all times. The value of securities and/or cash held as collateral for repurchase agreements is monitored on a daily basis to ensure the proper level of collateral. |
Mizuho Securities USA, Inc. (0.270%)
| | | | |
| Security Description | | Value | |
Ginnie Mae II Pool | | | $49,286 | |
Government National Mortgage Association | | | 368,838 | |
United States Treasury Note/Bond | | | 4,681,876 | |
Total Market Value of Collateral Securities | | | $5,100,000 | |
| |
| UBS Securities LLC (0.180%) | | | | |
| Security Description | | Value | |
Ginnie Mae I Pool | | | $1,794,509 | |
Ginnie Mae II Pool | | | 7,451,537 | |
Total Market Value of Collateral Securities | | | $9,246,046 | |
| (e) | Investments in affiliates during the period ended March 31, 2012: |
| | | | | | | | | | | | | | | | | | | | | | | | | | | | |
| Issuer | | Beginning
Cost | | | Purchase
Cost | | | Sales Cost/ Proceeds
from Sales | | | Realized
Gain/Loss | | | Ending
Cost | | | Dividends
or Interest
Income | | | Value | |
Columbia Short-Term Cash Fund | | | $— | | | | $433,256,099 | | | | $(433,256,099 | ) | | | $— | | | | $— | | | | $3,967 | | | | $— | |
| | |
| ADR | | American Depositary Receipt |
Generally accepted accounting principles (GAAP) require disclosure regarding the inputs and valuation techniques used to measure fair value and any changes in valuation inputs or techniques. In addition, investments shall be disclosed by major category.
The Fund categorizes its fair value measurements according to a three-level hierarchy that maximizes the use of observable inputs and minimizes the use of unobservable inputs by prioritizing that the most observable input be used when available. Observable inputs are those that market participants would use in pricing an investment based on market data obtained from sources independent of the reporting entity. Unobservable inputs are those that reflect the Fund’s assumptions about the information market participants would use in pricing an investment. An investment’s level within the fair value hierarchy is based on the lowest level of any input that is deemed significant to the asset or liability’s fair value measurement. The input levels are not necessarily an indication of the risk or liquidity associated with investments at that level. For example, certain U.S. government securities are generally high quality and liquid, however, they are reflected as Level 2 because the inputs used to determine fair value may not always be quoted prices in an active market.
Fair value inputs are summarized in the three broad levels listed below:
| | Ÿ | | Level 1 — Valuations based on quoted prices for investments in active markets that the Fund has the ability to access at the measurement date (including NAV for open-end mutual funds). Valuation adjustments are not applied to Level 1 investments. |
| | Ÿ | | Level 2 — Valuations based on other significant observable inputs (including quoted prices for similar securities, interest rates, prepayment speeds, credit risks, etc.). |
| | Ÿ | | Level 3 — Valuations based on significant unobservable inputs (including the Fund’s own assumptions and judgment in determining the fair value of investments). |
Inputs that are used in determining fair value of an investment may include price information, credit data, volatility statistics, and other factors. These inputs can be either observable or unobservable. The availability of observable inputs can vary between investments, and is affected by various factors such as the type of investment, and the volume and level of activity for that investment or similar investments in the marketplace. The inputs will be considered by the Investment Manager, along with any other relevant factors in the calculation of an investment’s fair value. The Fund uses prices and inputs that are current as of the measurement date, which may include periods of market dislocations. During these periods, the availability of prices and inputs may be reduced for many investments. This condition could cause an investment to be reclassified between the various levels within the hierarchy.
The Accompanying Notes to Financial Statements are an integral part of this statement.
8
Columbia Value and Restructuring Fund
March 31, 2012
(Percentages represent value of investments compared to net assets)
|
Fair Value Measurements (continued) |
Foreign equity securities actively traded in markets where there is a significant delay in the local close relative to the New York Stock Exchange (NYSE) are classified as Level 2. The values of these securities may include an adjustment to reflect the impact of significant market movements following the close of local trading, as described in Note 2 to the financial statements — Security Valuation.
Investments falling into the Level 3 category are primarily supported by quoted prices from brokers and dealers participating in the market for those investments. However, these may be classified as Level 3 investments due to lack of market transparency and corroboration to support these quoted prices. Additionally, valuation models may be used as the pricing source for any remaining investments classified as Level 3. These models rely on one or more significant unobservable inputs and/or significant assumptions by the Investment Manager. Inputs used in valuations may include, but are not limited to, financial statement analysis, capital account balances, discount rates and estimated cash flows, and comparable company data.
The following table is a summary of the inputs used to value the Fund’s investments as of March 31, 2012:
| | | | | | | | | | | | | | | | |
| | | Fair value at March 31, 2012 | |
| Description | | Level 1 quoted prices in active markets for
identical assets | | | Level 2 other
significant
observable
inputs | | | Level 3
significant
unobservable
inputs | | | Total | |
Equity Securities | | | | | | | | | | | | | | | | |
Common Stocks | | | | | | | | | | | | | | | | |
Consumer Discretionary | | | $263,484,000 | | | | $— | | | | $— | | | | $263,484,000 | |
Consumer Staples | | | 212,859,200 | | | | — | | | | — | | | | 212,859,200 | |
Energy | | | 949,324,418 | | | | — | | | | — | | | | 949,324,418 | |
Financials | | | 519,483,000 | | | | — | | | | — | | | | 519,483,000 | |
Health Care | | | 366,633,500 | | | | — | | | | — | | | | 366,633,500 | |
Industrials | | | 860,318,000 | | | | — | | | | — | | | | 860,318,000 | |
Information Technology | | | 393,654,000 | | | | — | | | | — | | | | 393,654,000 | |
Materials | | | 413,507,000 | | | | — | | | | — | | | | 413,507,000 | |
Telecommunication Services | | | 24,591,000 | | | | 45,112,066 | | | | — | | | | 69,703,066 | |
Convertible Preferred Stocks | | | | | | | | | | | | | | | | |
Consumer Staples | | | — | | | | 29,390,700 | | | | — | | | | 29,390,700 | |
Financials | | | — | | | | 30,972,000 | | | | — | | | | 30,972,000 | |
Materials | | | 21,513,000 | | | | — | | | | — | | | | 21,513,000 | |
Total Equity Securities | | | 4,025,367,118 | | | | 105,474,766 | | | | — | | | | 4,130,841,884 | |
Bonds | | | | | | | | | | | | | | | | |
Convertible Bonds | | | — | | | | 9,800,000 | | | | — | | | | 9,800,000 | |
Total Bonds | | | — | | | | 9,800,000 | | | | — | | | | 9,800,000 | |
Other | | | | | | | | | | | | | | | | |
Investments of Cash Collateral Received for Securities on Loan | | | — | | | | 54,039,134 | | | | — | | | | 54,039,134 | |
Total Other | | | — | | | | 54,039,134 | | | | — | | | | 54,039,134 | |
Total | | | $4,025,367,118 | | | | $169,313,900 | | | | $— | | | | $4,194,681,018 | |
| See | the Portfolio of Investments for all investment classifications not indicated in the table. |
The Fund’s assets assigned to the Level 2 input category are generally valued using the market approach, in which a security’s value is determined through reference to prices and information from market transactions for similar or identical assets. These assets include certain foreign securities for which a third party statistical pricing service may be employed for purposes of fair market valuation. The models utilized by the third party statistical pricing service take into account a security’s correlation to available market data including, but not limited to, intraday index, ADR, and ETF movements.
Financial assets were transferred from Level 1 to Level 2 as the market for these assets was deemed not to be active and fair values were consequently obtained using the observable market inputs rather than quoted prices for identical assets as of period end. Transfers between Level 1 and Level 2 are determined based on the fair value at the beginning of the period for security positions held throughout the period.
The following table shows transfers between Level 1 and Level 2 of the fair value hierarchy:
| | | | | | |
| Transfers In | | Transfers Out |
| Level 1 | | Level 2 | | Level 1 | | Level 2 |
$— | | $37,950,000 | | $37,950,000 | | $— |
The Accompanying Notes to Financial Statements are an integral part of this statement.
9
Statement of Assets and Liabilities – Columbia Value and Restructuring Fund
March 31, 2012
| | | | |
| Assets | | | | |
Investments, at value* | | | | |
(identified cost $2,901,090,281) | | $ | 4,140,641,884 | |
Investment of cash collateral received for securities on loan | | | | |
Short-term securities (identified cost $39,974,383) | | | 39,974,383 | |
Repurchase agreements (identified cost $14,064,751) | | | 14,064,751 | |
Total investments (identified cost $2,955,129,415) | | | 4,194,681,018 | |
Receivable for: | | | | |
Investments sold | | | 490,017 | |
Capital shares sold | | | 894,440 | |
Dividends | | | 5,149,185 | |
Interest | | | 158,788 | |
Reclaims | | | 193,926 | |
Expense reimbursement due from Investment Manager | | | 9,442 | |
Prepaid expense | | | 96,180 | |
Trustees’ deferred compensation plan | | | 196,738 | |
Other assets | | | 1,502 | |
Total assets | | | 4,201,871,236 | |
| |
| Liabilities | | | | |
Disbursements in excess of cash | | | 1,350,298 | |
Due upon return of securities on loan | | | 54,039,134 | |
Payable for: | | | | |
Capital shares purchased | | | 10,702,619 | |
Investment management fees | | | 77,922 | |
Distribution and service fees | | | 2,810 | |
Transfer agent fees | | | 742,253 | |
Administration fees | | | 6,776 | |
Chief compliance officer expenses | | | 1,953 | |
Other expenses | | | 189,324 | |
Trustees’ deferred compensation plan | | | 196,738 | |
Total liabilities | | | 67,309,827 | |
Net assets applicable to outstanding capital stock | | $ | 4,134,561,409 | |
The Accompanying Notes to Financial Statements are an integral part of this statement.
10
Statement of Assets and Liabilities (continued) – Columbia Value and Restructuring Fund
March 31, 2012
| | | | |
| Represented by | | | | |
Paid-in capital | | $ | 3,444,674,479 | |
Undistributed net investment income | | | 1,639,387 | |
Accumulated net realized loss | | | (551,288,118 | ) |
Unrealized appreciation (depreciation) on: | | | | |
Investments | | | 1,239,551,603 | |
Foreign currency translations | | | (15,942 | ) |
Total — representing net assets applicable to outstanding capital stock | | $ | 4,134,561,409 | |
*Value of securities on loan | | $ | 52,691,829 | |
Net assets applicable to outstanding shares | | | | |
Class A | | $ | 166,300,785 | |
Class C | | $ | 41,944,502 | |
Class I | | $ | 2,870 | |
Class R | | $ | 38,798,743 | |
Class W | | $ | 2,874 | |
Class Z | | $ | 3,887,511,635 | |
Shares outstanding | | | | |
Class A | | | 3,353,955 | |
Class C | | | 848,465 | |
Class I | | | 58 | |
Class R | | | 783,017 | |
Class W | | | 58 | |
Class Z | | | 78,452,005 | |
Net asset value per share | | | | |
Class A(a) | | $ | 49.58 | |
Class C | | $ | 49.44 | |
Class I | | $ | 49.48 | |
Class R | | $ | 49.55 | |
Class W | | $ | 49.56 | (b) |
Class Z | | $ | 49.55 | |
| (a) | The maximum offering price per share for Class A is $52.60. The offering price is calculated by dividing the net asset value by 1.0 minus the maximum sales charge of 5.75%. |
| (b) | Net asset value per share rounds to this amount due to fractional shares outstanding. |
The Accompanying Notes to Financial Statements are an integral part of this statement.
11
Statement of Operations – Columbia Value and Restructuring Fund
Year ended March 31, 2012
| | | | |
| Net investment income | | | | |
Income: | | | | |
Dividends | | $ | 121,611,457 | |
Interest | | | 905,467 | |
Dividends from affiliates | | | 3,967 | |
Income from securities lending — net | | | 285,893 | |
Foreign taxes withheld | | | (1,519,360 | ) |
Total income | | | 121,287,424 | |
Expenses: | | | | |
Investment management fees | | | 36,158,339 | |
Distribution fees | | | | |
Class C | | | 393,542 | |
Class R | | | 230,164 | |
Service fees | | | | |
Class A | | | 505,893 | |
Class C | | | 131,181 | |
Class W | | | 7 | |
Transfer agent fees | | | | |
Class A | | | 445,361 | |
Class C | | | 105,644 | |
Class R | | | 95,211 | |
Class W | | | 5 | |
Class Z | | | 10,275,489 | |
Administration fees | | | 4,735,917 | |
Compensation of board members | | | 210,211 | |
Pricing and bookkeeping fees | | | 48,156 | |
Custodian fees | | | 154,970 | |
Printing and postage fees | | | 673,890 | |
Registration fees | | | 119,850 | |
Professional fees | | | 243,480 | |
Line of credit interest expense | | | 23,419 | |
Chief compliance officer expenses | | | 3,889 | |
Other | | | 637,793 | |
Total expenses | | | 55,192,411 | |
Fees waived or expenses reimbursed by Investment Manager and its affiliates | | | (2,410,775 | ) |
Expense reductions | | | (43,652 | ) |
Total net expenses | | | 52,737,984 | |
Net investment income | | | 68,549,440 | |
| |
| Realized and unrealized gain (loss) — net | | | | |
Net realized gain (loss) on: | | | | |
Investments | | | 817,607,262 | |
Foreign currency translations | | | (51,882 | ) |
Options contracts written | | | (294,188 | ) |
Net realized gain | | | 817,261,192 | |
Net change in unrealized appreciation (depreciation) on: | | | | |
Investments | | | (1,411,547,064 | ) |
Foreign currency translations | | | (10,020 | ) |
Options contracts written | | | 1,329,546 | |
Net change in unrealized depreciation | | | (1,410,227,538 | ) |
Net realized and unrealized loss | | | (592,966,346 | ) |
Net decrease in net assets from operations | | $ | (524,416,906 | ) |
The Accompanying Notes to Financial Statements are an integral part of this statement.
12
Statement of Changes in Net Assets – Columbia Value and Restructuring Fund
| | | | | | | | |
| Year ended March 31, | | 2012 | | | 2011(a) | |
| | |
| Operations | | | | | | | | |
Net investment income | | $ | 68,549,440 | | | $ | 88,160,171 | |
Net realized gain | | | 817,261,192 | | | | 281,015,082 | |
Net change in unrealized appreciation (depreciation) | | | (1,410,227,538 | ) | | | 776,324,365 | |
Net increase (decrease) in net assets resulting from operations | | | (524,416,906 | ) | | | 1,145,499,618 | |
| | |
| Distributions to shareholders from: | | | | | | | | |
Net investment income | | | | | | | | |
Class A | | | (2,022,036 | ) | | | (3,204,542 | ) |
Class C | | | (178,216 | ) | | | (365,279 | ) |
Class I | | | (39 | ) | | | (54,138 | ) |
Class R | | | (351,895 | ) | | | (566,586 | ) |
Class W | | | (29 | ) | | | (11 | ) |
Class Z | | | (64,346,698 | ) | | | (87,200,668 | ) |
Total distributions to shareholders | | | (66,898,913 | ) | | | (91,391,224 | ) |
Increase (decrease) in net assets from share transactions | | | (2,288,996,250 | ) | | | (1,229,234,628 | ) |
Total decrease in net assets | | | (2,880,312,069 | ) | | | (175,126,234 | ) |
Net assets at beginning of year | | | 7,014,873,478 | | | | 7,189,999,712 | |
Net assets at end of year | | $ | 4,134,561,409 | | | $ | 7,014,873,478 | |
Undistributed net investment income | | $ | 1,639,387 | | | $ | 40,742 | |
| (a) | Class I and Class W shares commenced operations on September 27, 2010. |
The Accompanying Notes to Financial Statements are an integral part of this statement.
13
Statement of Changes in Net Assets (continued) – Columbia Value and Restructuring Fund
| | | | | | | | | | | | | | | | |
| Year Ended March 31, | | 2012 | | | 2011(a) | |
| | | Shares | | | Dollars ($) | | | Shares | | | Dollars ($) | |
| Capital stock activity | | | | | | | | | | | | | | | | |
Class A shares | | | | | | | | | | | | | | | | |
Subscriptions | | | 429,799 | | | | 20,748,380 | | | | 1,122,585 | | | | 51,295,242 | |
Distributions reinvested | | | 37,595 | | | | 1,698,011 | | | | 59,362 | | | | 2,627,179 | |
Redemptions | | | (2,169,299 | ) | | | (103,288,238 | ) | | | (2,653,210 | ) | | | (119,919,348 | ) |
Net decrease | | | (1,701,905 | ) | | | (80,841,847 | ) | | | (1,471,263 | ) | | | (65,996,927 | ) |
Class C shares | | | | | | | | | | | | | | | | |
Subscriptions | | | 87,938 | | | | 4,296,824 | | | | 187,589 | | | | 8,712,920 | |
Distributions reinvested | | | 2,972 | | | | 133,769 | | | | 6,299 | | | | 273,618 | |
Redemptions | | | (586,390 | ) | | | (27,697,861 | ) | | | (528,877 | ) | | | (23,533,078 | ) |
Net decrease | | | (495,480 | ) | | | (23,267,268 | ) | | | (334,989 | ) | | | (14,546,540 | ) |
Class I shares | | | | | | | | | | | | | | | | |
Subscriptions | | | 58,248 | | | | 3,123,981 | | | | 535,411 | | | | 26,380,052 | |
Distributions reinvested | | | — | | | | — | | | | 1,051 | | | | 54,122 | |
Redemptions | | | (560,760 | ) | | | (28,966,012 | ) | | | (33,892 | ) | | | (1,723,811 | ) |
Net increase (decrease) | | | (502,512 | ) | | | (25,842,031 | ) | | | 502,570 | | | | 24,710,363 | |
Class R shares | | | | | | | | | | | | | | | | |
Subscriptions | | | 145,708 | | | | 6,982,623 | | | | 278,727 | | | | 12,289,558 | |
Distributions reinvested | | | 7,762 | | | | 351,895 | | | | 12,868 | | | | 566,555 | |
Redemptions | | | (603,378 | ) | | | (30,008,857 | ) | | | (360,742 | ) | | | (16,451,024 | ) |
Net decrease | | | (449,908 | ) | | | (22,674,339 | ) | | | (69,147 | ) | | | (3,594,911 | ) |
Class W shares | | | | | | | | | | | | | | | | |
Subscriptions | | | — | | | | — | | | | 61 | | | | 2,651 | |
Redemptions | | | — | | | | — | | | | (3 | ) | | | (154 | ) |
Net increase | | | — | | | | — | | | | 58 | | | | 2,497 | |
Class Z shares | | | | | | | | | | | | | | | | |
Subscriptions | | | 10,657,053 | | | | 515,042,888 | | | | 30,084,448 | | | | 1,382,808,276 | |
Distributions reinvested | | | 922,759 | | | | 41,664,646 | | | | 1,314,238 | | | | 58,505,520 | |
Redemptions | | | (57,331,033 | ) | | | (2,693,078,299 | ) | | | (58,696,759 | ) | | | (2,611,122,906 | ) |
Net decrease | | | (45,751,221 | ) | | | (2,136,370,765 | ) | | | (27,298,073 | ) | | | (1,169,809,110 | ) |
Total net decrease | | | (48,901,026 | ) | | | (2,288,996,250 | ) | | | (28,670,844 | ) | | | (1,229,234,628 | ) |
| (a) | Class I and Class W shares commenced operations on September 27, 2010. |
The Accompanying Notes to Financial Statements are an integral part of this statement.
14
Financial Highlights – Columbia Value and Restructuring Fund
The following tables are intended to help you understand the Fund’s financial performance. Certain information reflects financial results for a single share of a class held for the periods shown. Per share net investment income (loss) amounts are calculated based on average shares outstanding during the period. Total returns assume reinvestment of all dividends and distributions. Total returns do not reflect payment of sales charges, if any, and are not annualized for periods of less than one year.
| | | | | | | | | | | | | | | | | | | | |
| | | Year ended March 31, | |
| | | 2012 | | | 2011 | | | 2010 | | | 2009 | | | 2008(a) | |
| Class A | | | | | | | | | | | | | | | |
| Per share data | | | | | | | | | | | | | | | | | | | | |
Net asset value, beginning of period | | | $53.03 | | | | $44.68 | | | | $26.51 | | | | $52.25 | | | | $58.58 | |
Income from investment operations: | | | | | | | | | | | | | | | | | | | | |
Net investment income | | | 0.49 | | | | 0.53 | (b) | | | 0.39 | (b) | | | 0.51 | | | | 0.24 | |
Net realized and unrealized gain (loss) | | | (3.45 | ) | | | 8.37 | | | | 18.16 | | | | (25.72 | ) | | | (5.70 | ) |
Total from investment operations | | | (2.96 | ) | | | 8.90 | | | | 18.55 | | | | (25.21 | ) | | | (5.46 | ) |
Less distributions to shareholders from: | | | | | | | | | | | | | | | | | | | | |
Net investment income | | | (0.49 | ) | | | (0.55 | ) | | | (0.38 | ) | | | (0.51 | ) | | | (0.36 | ) |
Net realized gains | | | — | | | | — | | | | — | | | | (0.02 | ) | | | (0.51 | ) |
Total distributions to shareholders | | | (0.49 | ) | | | (0.55 | ) | | | (0.38 | ) | | | (0.53 | ) | | | (0.87 | ) |
Proceeds from regulatory settlement | | | — | | | | — | | | | 0.00 | (c) | | | 0.00 | (c) | | | — | |
Net asset value, end of period | | | $49.58 | | | | $53.03 | | | | $44.68 | | | | $26.51 | | | | $52.25 | |
| Total return | | | (5.49% | ) | | | 20.17% | | | | 70.25% | | | | (48.51% | ) | | | (9.41% | ) |
| Ratios to average net assets(d) | | | | | | | | | | | | | | | | | | | | |
Expenses prior to fees waived or expenses reimbursed (including interest expense) | | | 1.26% | (e) | | | 1.20% | (e) | | | 1.14% | (e) | | | 1.18% | (e) | | | 1.07% | (f) |
Net expenses after fees waived or expenses reimbursed (including interest expense)(g) | | | 1.19% | (e)(h) | | | 1.20% | (e)(h) | | | 1.14% | (e)(h) | | | 1.14% | (e)(h) | | | 1.02% | (f)(h) |
Expenses prior to fees waived or expenses reimbursed (excluding interest expense) | | | 1.26% | | | | 1.20% | | | | 1.14% | | | | 1.18% | | | | 1.07% | (f) |
Net expenses after fees waived or expenses reimbursed (excluding interest expense)(g) | | | 1.19% | (h) | | | 1.20% | (h) | | | 1.14% | (h) | | | 1.14% | (h) | | | 1.02% | (f)(h) |
Net investment income | | | 1.03% | (h) | | | 1.16% | (h) | | | 1.01% | (h) | | | 1.35% | (h) | | | 0.83(f | )(h) |
| Supplemental data | | | | | | | | | | | | | | | | | | | | |
Net assets, end of period (in thousands) | | | $166,301 | | | | $268,124 | | | | $291,655 | | | | $163,338 | | | | $77,209 | |
Portfolio turnover | | | 9% | | | | 12% | | | | 6% | | | | 12% | | | | 11% | |
Notes to Financial Highlights
| (a) | For the period from September 28, 2007 (commencement of operations) to March 31, 2008. |
| (b) | Net investment income per share reflects special dividends. The effect of these dividends amounted to $0.18 and $0.04 per share, respectively. |
| (c) | Rounds to less than $0.01. |
| (d) | In addition to the fees and expenses which the Fund bears directly, the Fund indirectly bears a pro rata share of the fees and expenses of the acquired funds in which it invests. Such indirect expenses are not included in the reported expense ratios. |
| (e) | Includes interest expense which rounds to less than 0.01%. |
| (g) | The Investment Manager and certain of its affiliates agreed to waive/reimburse certain fees and expenses, if applicable. |
| (h) | The benefits derived from expense reductions had an impact of less than 0.01%. |
The Accompanying Notes to Financial Statements are an integral part of this statement.
15
Financial Highlights (continued) – Columbia Value and Restructuring Fund
| | | | | | | | | | | | | | | | | | | | |
| | | Year ended March 31, | |
| | | 2012 | | | 2011 | | | 2010 | | | 2009 | | | 2008(a) | |
| Class C | | | | | | | | | | | | | | | |
| Per share data | | | | | | | | | | | | | | | | | | | | |
Net asset value, beginning of period | | | $52.89 | | | | $44.60 | | | | $26.51 | | | | $52.23 | | | | $58.58 | |
Income from investment operations: | | | | | | | | | | | | | | | | | | | | |
Net investment income | | | 0.13 | | | | 0.18 | (b) | | | 0.10 | (b) | | | 0.23 | | | | 0.04 | |
Net realized and unrealized gain (loss) | | | (3.41 | ) | | | 8.36 | | | | 18.16 | | | | (25.73 | ) | | | (5.68 | ) |
Total from investment operations | | | (3.28 | ) | | | 8.54 | | | | 18.26 | | | | (25.50 | ) | | | (5.64 | ) |
Less distributions to shareholders from: | | | | | | | | | | | | | | | | | | | | |
Net investment income | | | (0.17 | ) | | | (0.25 | ) | | | (0.17 | ) | | | (0.20 | ) | | | (0.20 | ) |
Net realized gains | | | — | | | | — | | | | — | | | | (0.02 | ) | | | (0.51 | ) |
Total distributions to shareholders | | | (0.17 | ) | | | (0.25 | ) | | | (0.17 | ) | | | (0.22 | ) | | | (0.71 | ) |
Proceeds from regulatory settlement | | | — | | | | — | | | | 0.00 | (c) | | | 0.00 | (c) | | | — | |
Net asset value, end of period | | | $49.44 | | | | $52.89 | | | | $44.60 | | | | $26.51 | | | | $52.23 | |
| Total return | | | (6.18% | ) | | | 19.27% | | | | 69.00% | | | | (48.89% | ) | | | (9.72% | ) |
| Ratios to average net assets(d) | | | | | | | | | | | | | | | | | | | | |
Expenses prior to fees waived or expenses reimbursed (including interest expense) | | | 1.99% | (e) | | | 1.95% | (e) | | | 1.89% | (e) | | | 1.93% | (e) | | | 1.82% | (f) |
Net expenses after fees waived or expenses reimbursed (including interest expense)(g) | | | 1.95% | (e)(h) | | | 1.95% | (e)(h) | | | 1.89% | (e)(h) | | | 1.89% | (e)(h) | | | 1.77% | (f)(h) |
Expenses prior to fees waived or expenses reimbursed (excluding interest expense) | | | 1.99% | | | | 1.95% | | | | 1.89% | | | | 1.93% | | | | 1.82% | (f) |
Net expenses after fees waived or expenses reimbursed (excluding interest expense)(g) | | | 1.95% | (h) | | | 1.95% | (h) | | | 1.89% | (h) | | | 1.89% | (h) | | | 1.77% | (f)(h) |
Net investment income | | | 0.28% | (h) | | | 0.40% | (h) | | | 0.26% | (h) | | | 0.63% | (h) | | | 0.07% | (f)(h) |
| Supplemental data | | | | | | | | | | | | | | | | | | | | |
Net assets, end of period (in thousands) | | | $41,945 | | | | $71,083 | | | | $74,880 | | | | $40,380 | | | | $13,665 | |
Portfolio turnover | | | 9% | | | | 12% | | | | 6% | | | | 12% | | | | 11% | |
Notes to Financial Highlights
| (a) | For the period from September 28, 2007 (commencement of operations) to March 31, 2008. |
| (b) | Net investment income per share reflects special dividends. The effect of these dividends amounted to $0.18 and $0.04 per share, respectively. |
| (c) | Rounds to less than $0.01. |
| (d) | In addition to the fees and expenses which the Fund bears directly, the Fund indirectly bears a pro rata share of the fees and expenses of the acquired funds in which it invests. Such indirect expenses are not included in the reported expense ratios. |
| (e) | Includes interest expense which rounds to less than 0.01%. |
| (g) | The Investment Manager and certain of its affiliates agreed to waive/reimburse certain fees and expenses, if applicable. |
| (h) | The benefits derived from expense reductions had an impact of less than 0.01%. |
The Accompanying Notes to Financial Statements are an integral part of this statement.
16
Financial Highlights (continued) – Columbia Value and Restructuring Fund
| | | | | | | | |
| | | Year ended March 31, | |
| | | 2012 | | | 2011(a) | |
| Class I | | | | | | |
| Per share data | | | | | | | | |
Net asset value, beginning of period | | | $53.03 | | | | $43.47 | |
Income from investment operations: | | | | | | | | |
Net investment income | | | 0.09 | | | | 0.27 | |
Net realized and unrealized gain (loss) | | | (2.95 | ) | | | 9.57 | |
Total from investment operations | | | (2.86 | ) | | | 9.84 | |
Less distributions to shareholders from: | | | | | | | | |
Net investment income | | | (0.69 | ) | | | (0.28 | ) |
Total distributions to shareholders | | | (0.69 | ) | | | (0.28 | ) |
Net asset value, end of period | | | $49.48 | | | | $53.03 | |
| Total return | | | (5.26% | ) | | | 22.67% | |
| Ratios to average net assets(b) | | | | | | | | |
Expenses prior to fees waived or expenses reimbursed (including interest expense) | | | 0.78% | (c) | | | 0.79% | (c)(d) |
Net expenses after fees waived or expenses reimbursed (including interest expense)(e) | | | 0.78% | (c)(f) | | | 0.79% | (c)(d)(f) |
Expenses prior to fees waived or expenses reimbursed (excluding interest expense) | | | 0.78% | | | | 0.79% | (d) |
Net expenses after fees waived or expenses reimbursed (excluding interest expense)(e) | | | 0.78% | (f) | | | 0.79% | (d)(f) |
Net investment income | | | 0.17% | (f) | | | 1.05% | (d)(f) |
| Supplemental data | | | | | | | | |
Net assets, end of period (in thousands) | | | $3 | | | | $26,652 | |
Portfolio turnover | | | 9% | | | | 12% | |
Notes to Financial Highlights
| (a) | For the period from September 27, 2010 (commencement of operations) to March 31, 2011. |
| (b) | In addition to the fees and expenses which the Fund bears directly, the Fund indirectly bears a pro rata share of the fees and expenses of the acquired funds in which it invests. Such indirect expenses are not included in the reported expense ratios. |
| (c) | Includes interest expense which rounds to less than 0.01%. |
| (e) | The Investment Manager and certain of its affiliates agreed to waive/reimburse certain fees and expenses, before giving effect to any performance incentive adjustment, if applicable. |
| (f) | The benefits derived from expense reductions had an impact of less than 0.01%. |
The Accompanying Notes to Financial Statements are an integral part of this statement.
17
Financial Highlights (continued) – Columbia Value and Restructuring Fund
| | | | | | | | | | | | | | | | | | | | |
| | | Year ended March 31, | |
| | | 2012 | | | 2011 | | | 2010 | | | 2009 | | | 2008(a) | |
| Class R | | | | | | | | | | | | | | | |
| Per share data | | | | | | | | | | | | | | | | | | | | |
Net asset value, beginning of period | | | $52.98 | | | | $44.64 | | | | $26.50 | | | | $52.23 | | | | $54.30 | |
Income from investment operations: | | | | | | | | | | | | | | | | | | | | |
Net investment income | | | 0.37 | | | | 0.41 | (b) | | | 0.30 | (b) | | | 0.41 | | | | 0.33 | |
Net realized and unrealized gain (loss) | | | (3.43 | ) | | | 8.37 | | | | 18.14 | | | | (25.72 | ) | | | (1.41 | ) |
Total from investment operations | | | (3.06 | ) | | | 8.78 | | | | 18.44 | | | | (25.31 | ) | | | (1.08 | ) |
Less distributions to shareholders from: | | | | | | | | | | | | | | | | | | | | |
Net investment income | | | (0.37 | ) | | | (0.44 | ) | | | (0.30 | ) | | | (0.40 | ) | | | (0.48 | ) |
Net realized gains | | | — | | | | — | | | | — | | | | (0.02 | ) | | | (0.51 | ) |
Total distributions to shareholders | | | (0.37 | ) | | | (0.44 | ) | | | (0.30 | ) | | | (0.42 | ) | | | (0.99 | ) |
Proceeds from regulatory settlement | | | — | | | | — | | | | 0.00 | (c) | | | 0.00 | (c) | | | — | |
Net asset value, end of period | | | $49.55 | | | | $52.98 | | | | $44.64 | | | | $26.50 | | | | $52.23 | |
| Total return | | | (5.70% | ) | | | 19.86% | | | | 69.84% | | | | (48.65% | ) | | | (2.11% | ) |
| Ratios to average net assets(d) | | | | | | | | | | | | | | | | | | | | |
Expenses prior to fees waived or expenses reimbursed (including interest expense) | | | 1.50% | (e) | | | 1.45% | (e) | | | 1.39% | (e) | | | 1.43% | (e) | | | 1.39% | |
Net expenses after fees waived or expenses reimbursed (including interest expense)(f) | | | 1.44% | (e)(g) | | | 1.45% | (e)(g) | | | 1.39% | (e)(g) | | | 1.39% | (e)(g) | | | 1.35% | (g) |
Expenses prior to fees waived or expenses reimbursed (excluding interest expense) | | | 1.50% | | | | 1.45% | | | | 1.39% | | | | 1.43% | | | | 1.39% | |
Net expenses after fees waived or expenses reimbursed (excluding interest expense)(f) | | | 1.44% | (g) | | | 1.45% | (g) | | | 1.39% | (g) | | | 1.39% | (g) | | | 1.35% | (g) |
Net investment income | | | 0.76% | (g) | | | 0.91% | (g) | | | 0.78% | (g) | | | 1.05% | (g) | | | 0.60% | (g) |
| Supplemental data | | | | | | | | | | | | | | | | | | | | |
Net assets, end of period (in thousands) | | | $38,799 | | | | $65,321 | | | | $58,120 | | | | $37,637 | | | | $33,826 | |
Portfolio turnover | | | 9% | | | | 12% | | | | 6% | | | | 12% | | | | 11% | |
Notes to Financial Highlights
| (a) | On March 31, 2008, Retirement Shares class of Value and Restructuring Fund, a series of Excelsior Funds, Inc., was reorganized into the Fund’s Class R shares. The financial information of the Fund’s Class R shares includes the financial information of Value and Restructuring Fund’s Retirement Shares class. |
| (b) | Net investment income per share reflects special dividends. The effect of these dividends amounted to $0.18 and $0.04 per share, respectively. |
| (c) | Rounds to less than 0.01%. |
| (d) | In addition to the fees and expenses which the Fund bears directly, the Fund indirectly bears a pro rata share of the fees and expenses of the acquired funds in which it invests. Such indirect expenses are not included in the reported expense ratios. |
| (e) | Includes interest expense which rounds to less than 0.01%. |
| (f) | The Investment Manager and certain of its affiliates agreed to waive/reimburse certain fees and expenses, before giving effect to any performance incentive adjustment, if applicable. |
| (g) | The benefits derived from expense reductions had an impact of less than 0.01%. |
The Accompanying Notes to Financial Statements are an integral part of this statement.
18
Financial Highlights (continued) – Columbia Value and Restructuring Fund
| | | | | | | | |
| | | Year ended March 31, | |
| | | 2012 | | | 2011(a) | |
| Class W | | | | | | |
| Per share data | | | | | | | | |
Net asset value, beginning of period | | | $53.04 | | | | $43.49 | |
Income from investment operations: | | | | | | | | |
Net investment income | | | 0.50 | | | | 0.20 | |
Net realized and unrealized gain (loss) | | | (3.47 | ) | | | 9.53 | |
Total from investment operations | | | (2.97 | ) | | | 9.73 | |
Less distributions to shareholders from: | | | | | | | | |
Net investment income | | | (0.51 | ) | | | (0.18 | ) |
Total distributions to shareholders | | | (0.51 | ) | | | (0.18 | ) |
Net asset value, end of period | | | $49.56 | | | | $53.04 | |
| Total return | | | (5.50% | ) | | | 22.41% | |
| Ratios to average net assets(b) | | | | | | | | |
Expenses prior to fees waived or expenses reimbursed (including interest expense) | | | 1.22% | (c) | | | 1.19% | (c)(d) |
Net expenses after fees waived or expenses reimbursed (including interest expense)(e) | | | 1.17% | (c)(f) | | | 1.19% | (c)(d)(f) |
Expenses prior to fees waived or expenses reimbursed (excluding interest expense) | | | 1.22% | | | | 1.19% | (d) |
Net expenses after fees waived or expenses reimbursed (excluding interest expense)(e) | | | 1.17% | (f) | | | 1.19% | (d)(f) |
Net investment income | | | 1.04% | (f) | | | 0.81% | (d)(f) |
| Supplemental data | | | | | | | | |
Net assets, end of period (in thousands) | | | $3 | | | | $3 | |
Portfolio turnover | | | 9% | | | | 12% | |
Notes to Financial Highlights
| (a) | For the period from September 27, 2010 (commencement of operations) to March 31, 2011. |
| (b) | In addition to the fees and expenses which the Fund bears directly, the Fund indirectly bears a pro rata share of the fees and expenses of the acquired funds in which it invests. Such indirect expenses are not included in the reported expense ratios. |
| (c) | Includes interest expense which rounds to less than 0.01%. |
| (e) | The Investment Manager and certain of its affiliates agreed to waive/reimburse certain fees and expenses, before giving effect to any performance incentive adjustment, if applicable. |
| (f) | The benefits derived from expense reductions had an impact of less than 0.01%. |
The Accompanying Notes to Financial Statements are an integral part of this statement.
19
Financial Highlights (continued) – Columbia Value and Restructuring Fund
| | | | | | | | | | | | | | | | | | | | |
| | | Year ended March 31, | |
| | | 2012 | | | 2011 | | | 2010 | | | 2009 | | | 2008(a)(b) | |
| Class Z | | | | | | | | | | | | | | | |
| Per share data | | | | | | | | | | | | | | | | | | | | |
Net asset value, beginning of period | | | $53.01 | | | | $44.66 | | | | $26.49 | | | | $52.22 | | | | $54.33 | |
Income from investment operations: | | | | | | | | | | | | | | | | | | | | |
Net investment income | | | 0.61 | | | | 0.64 | (c) | | | 0.49 | (c) | | | 0.61 | | | | 0.60 | |
Net realized and unrealized gain (loss) | | | (3.46 | ) | | | 8.37 | | | | 18.15 | | | | (25.71 | ) | | | (1.47 | ) |
Total from investment operations | | | (2.85 | ) | | | 9.01 | | | | 18.64 | | | | (25.10 | ) | | | (0.87 | ) |
Less distributions to shareholders from: | | | | | | | | | | | | | | | | | | | | |
Net investment income | | | (0.61 | ) | | | (0.66 | ) | | | (0.47 | ) | | | (0.61 | ) | | | (0.73 | ) |
Net realized gains | | | — | | | | — | | | | — | | | | (0.02 | ) | | | (0.51 | ) |
Total distributions to shareholders | | | (0.61 | ) | | | (0.66 | ) | | | (0.47 | ) | | | (0.63 | ) | | | (1.24 | ) |
Proceeds from regulatory settlement | | | — | | | | — | | | | 0.00 | (d) | | | 0.00 | (d) | | | — | |
Net asset value, end of period | | | $49.55 | | | | $53.01 | | | | $44.66 | | | | $26.49 | | | | $52.22 | |
| Total return | | | (5.26% | ) | | | 20.46% | | | | 70.71% | | | | (48.39% | ) | | | (1.74% | ) |
| Ratios to average net assets(e) | | | | | | | | | | | | | | | | | | | | |
Expenses prior to fees waived or expenses reimbursed (including interest expense) | | | 0.99% | (f) | | | 0.95% | (f) | | | 0.89% | (f) | | | 0.93% | (f) | | | 1.06% | |
Net expenses after fees waived or expenses reimbursed (including interest expense)(g) | | | 0.94% | (f)(h) | | | 0.95% | (f)(h) | | | 0.89% | (f)(h) | | | 0.89% | (f)(h) | | | 1.02% | (h) |
Expenses prior to fees waived or expenses reimbursed (excluding interest expense) | | | 0.99% | | | | 0.95% | | | | 0.89% | | | | 0.93% | | | | 1.06% | |
Net expenses after fees waived or expenses reimbursed (excluding interest expense)(g) | | | 0.94% | (h) | | | 0.95% | (h) | | | 0.89% | (h) | | | 0.89% | (h) | | | 1.02% | (h) |
Net investment income | | | 1.28% | (h) | | | 1.40% | (h) | | | 1.28% | (h) | | | 1.47% | (h) | | | 1.07% | (h) |
| Supplemental data | | | | | | | | | | | | | | | | | | | | |
Net assets, end of period (in thousands) | | | $3,887,512 | | | | $6,583,690 | | | | $6,765,345 | | | | $4,352,176 | | | | $8,980,358 | |
Portfolio turnover | | | 9% | | | | 12% | | | | 6% | | | | 12% | | | | 11% | |
Notes to Financial Highlights
| (a) | On March 31, 2008, Retirement Shares class of Value and Restructuring Fund, a series of Excelsior Funds, Inc., was reorganized into the Fund’s Class Z shares. The financial information of the Fund’s Class Z shares includes the financial information of Value and Restructuring Fund’s Retirement Shares class. |
| (b) | On March 31, 2008, Value and Restructuring Fund’s Institutional Shares class was reorganized into the Fund’s Class Z. |
| (c) | Net investment income per share reflects special dividends. The effect of these dividends amounted to $0.18 and $0.04 per share, respectively. |
| (d) | Rounds to less than 0.01%. |
| (e) | In addition to the fees and expenses which the Fund bears directly, the Fund indirectly bears a pro rata share of the fees and expenses of the acquired funds in which it invests. Such indirect expenses are not included in the reported expense ratios. |
| (f) | Includes interest expense which rounds to less than 0.01%. |
| (g) | The Investment Manager and certain of its affiliates agreed to waive/reimburse certain fees and expenses, before giving effect to any performance incentive adjustment, if applicable. |
| (h) | The benefits derived from expense reductions had an impact of less than 0.01%. |
The Accompanying Notes to Financial Statements are an integral part of this statement.
20
Notes to Financial Statements – Columbia Value and Restructuring Fund
March 31, 2012
Note 1. Organization
Columbia Value and Restructuring Fund (the Fund), a series of Columbia Funds Series Trust I (the Trust), is a diversified fund. The Trust is registered under the Investment Company Act of 1940, as amended (the 1940 Act), as an open-end management investment company organized as a Massachusetts business trust.
Fund Shares
The Trust may issue an unlimited number of shares (without par value). The Fund offers Class A, Class C, Class I, Class R, Class W and Class Z shares. All share classes have identical voting, dividend and liquidation rights. Each share class has its own expense structure and sales charges, as applicable.
Class A shares are subject to a maximum front-end sales charge of 5.75% based on the initial investment amount. Class A shares purchased without an initial sales charge in accounts aggregating $1 million to $50 million at the time of purchase are subject to a contingent deferred sales charge (CDSC) if the shares are sold within 18 months of purchase, charged as follows: 1.00% CDSC if redeemed within 12 months of purchase, and 0.50% CDSC if redeemed more than 12, but less than 18, months after purchase.
Class C shares are subject to a 1.00% CDSC on shares redeemed within one year of purchase.
Class I shares are not subject to sales charges and are only available to the Columbia Family of Funds.
Class R shares are not subject to sales charges and are only available to qualifying institutional investors.
Class W shares are not subject to sales charges and are only available to investors purchasing through authorized investment programs managed by investment professionals, including discretionary managed account programs.
Class Z shares are not subject to sales charges, and are only available to certain investors, as described in the Fund’s prospectus.
Note 2. Summary of Significant Accounting Policies
Use of Estimates
The preparation of financial statements in accordance with U.S. generally accepted accounting principles (GAAP) requires management to make certain estimates and assumptions that affect the reported amounts of assets and liabilities, the disclosure of contingent assets and liabilities at the date of the financial statements
and the reported amounts of revenue and expenses during the reporting period. Actual results could differ from those estimates.
The following is a summary of significant accounting policies consistently followed by the Fund in the preparation of its financial statements.
Security Valuation
All equity securities are valued at the close of business of the New York Stock Exchange (NYSE). Equity securities are valued at the last quoted sales price on the principal exchange or market on which they trade, except for securities traded on the NASDAQ Stock Market, which are valued at the NASDAQ official close price. Unlisted securities or listed securities for which there were no sales during the day are valued at the mean of the latest quoted bid and asked prices on such exchanges or markets.
Debt securities generally are valued by pricing services approved by the Board of Trustees (the Board) based upon market transactions for normal, institutional-size trading units of similar securities. The services may use various pricing techniques which take into account appropriate factors such as yield, quality, coupon rate, maturity, type of issue, trading characteristics and other data, as well as broker quotes. Debt securities for which quotations are readily available may also be valued based upon an over-the-counter or exchange bid quotation.
Foreign securities are valued based on quotations from the principal market in which such securities are normally traded. If any foreign share prices are not readily available as a result of limited share activity the securities are valued at the mean of the latest quoted bid and asked prices on such exchanges or markets. Foreign currency exchange rates are generally determined at 4:00 p.m. Eastern (U.S.) time. However, many securities markets and exchanges outside the U.S. close prior to the close of the NYSE; therefore, the closing prices for securities in such markets or on such exchanges may not fully reflect events that occur after such close but before the close of the NYSE. In those situations, foreign securities will be fair valued pursuant to the policy adopted by the Board, including utilizing a third party pricing service to determine these fair values. The third party pricing service takes into account multiple factors, including, but not limited to, movements in the U.S. securities markets, certain depositary receipts, futures contracts and foreign exchange rates that have occurred subsequent to the close of the foreign exchange, to determine a good faith estimate that reasonably reflects the current market conditions as of the close of the NYSE. The fair value of a security is likely to be different from the quoted or published price, if available.
21
Columbia Value and Restructuring Fund
March 31, 2012
Investments in other open-end investment companies, including money market funds, are valued at net asset value.
Short-term securities purchased within 60 days to maturity are valued at amortized cost, which approximates market value. The value of short-term securities originally purchased with maturities greater than 60 days is determined based on an amortized value to par upon reaching 60 days to maturity. Short-term securities maturing in more than 60 days from the valuation date are valued at the market price or approximate market value based on current interest rates.
Option contracts are valued at the mean of the latest quoted bid and asked prices on their primary exchanges. Option contracts, including over-the-counter (OTC) option contracts, with no readily available market value are valued using quotations obtained from independent brokers as of the close of the NYSE.
Investments for which market quotations are not readily available, or that have quotations which management believes are not reliable, are valued at fair value as determined in good faith under consistently applied procedures established by and under the general supervision of the Board. If a security or class of securities (such as foreign securities) is valued at fair value, such value is likely to be different from the last quoted market price for the security. The determination of fair value often requires significant judgment. To determine fair value, management may use assumptions including but not limited to future cash flows and estimated risk premiums. Multiple inputs from various sources may be used to determine value.
Foreign Currency Transactions and Translation
The values of all assets and liabilities denominated in foreign currencies are translated into U.S. dollars at that day’s exchange rates. Net realized and unrealized gains (losses) on foreign currency transactions and translations include gains (losses) arising from the fluctuation in exchange rates between trade and settlement dates on securities transactions, gains (losses) arising from the disposition of foreign currency and currency gains (losses) between the accrual and payment dates on dividends, interest income and foreign withholding taxes.
For financial statement purposes, the Fund does not distinguish that portion of gains (losses) on investments which is due to changes in foreign exchange rates from that which is due to changes in market prices of the investments. Such fluctuations are included with the net realized and unrealized gains (losses) on investments in the Statement of Operations.
Derivative Instruments
The Fund invests in certain derivative instruments as detailed below to meet its investment objectives. Derivatives are instruments whose values depend on, or are derived from, in whole or in part, the value of one or more other assets, such as securities, currencies, commodities or indices. Derivative instruments may be used to maintain cash reserves while maintaining exposure to certain other assets, to offset anticipated declines in values of investments, to facilitate trading, to reduce transaction costs and to pursue higher investment returns. The Fund may also use derivative instruments to mitigate certain investment risks, such as foreign currency exchange rate risk, interest rate risk and credit risk. Derivatives may involve various risks, including the potential inability of the counterparty to fulfill its obligation under the terms of the contract, the potential for an illiquid secondary market and the potential for market movements which may expose the Fund to gains or losses in excess of the amount shown in the Statement of Assets and Liabilities.
The Fund and any counterparty are required to maintain an agreement that requires the Fund and that counterparty to monitor (on a daily basis) the net fair value of all derivatives entered into pursuant to the agreement between the Fund and such counterparty. If the net fair value of such derivatives between the Fund and that counterparty exceeds a certain threshold (as defined in the agreement), the Fund or the counterparty (as the case may be) is required to post cash and/or securities as collateral. Fair values of derivatives presented in the financial statements are not netted with the fair value of other derivatives or with any collateral amounts posted by the Fund or any counterparty.
Options
Options are contracts which entitle the holder to purchase or sell securities or other identified assets at a specified price, or in the case of index option contracts, to receive or pay the difference between the index value and the strike price of the index option contract. The Fund purchased and wrote option contracts to decrease the Fund’s exposure to equity risk and to increase return on investments and facilitate buying and selling of securities for investments. Completion of transactions for option contracts traded in the OTC market depends upon the performance of the other party. Cash collateral may be collected or posted by the Fund to secure certain OTC option contract trades. Cash collateral held or posted by the Fund for such option contract trades must be returned to the counterparty or the Fund upon closure, exercise or expiration of the contract.
Option contracts purchased are recorded as investments and options contracts written are recorded as liabilities of the Fund. The Fund
22
Columbia Value and Restructuring Fund
March 31, 2012
will realize a gain or loss when the option contract expires or is exercised. When option contracts on debt securities or futures are exercised, the Fund will realize a gain or loss. When other option contracts are exercised, the proceeds on sales for a written call or purchased put option contract, or the purchase cost for a written put or purchased call option contract, is adjusted by the amount of premium received or paid.
The risk in buying an option contract is that the Fund pays a premium whether or not the option contract is exercised. The Fund also has the additional risk of being unable to enter into a closing transaction if a liquid secondary market does not exist. The risk in writing a call option contract is that the Fund gives up the opportunity for profit if the market price of the security increases. The risk in writing a put option contract is that the Fund may incur a loss if the market price of the security decreases and the option contract is exercised. The Fund’s maximum payout in the case of written put option contracts represents the maximum potential amount of future payments (undiscounted) that the Fund could be required to make under the contract. For OTC options contracts, the transaction is also subject to counterparty credit risk. The maximum payout amount may be offset by the subsequent sale, if any, of assets obtained upon the exercise of the put option contracts by holders of the option contracts or proceeds received upon entering into the contracts.
Contracts and premiums associated with options contracts written for the year ended March 31, 2012 are as follows:
| | | | | | | | |
| | | Calls | |
| | | Contracts | | | Premiums | |
| Balance at March 31, 2011 | | | 5,000 | | | $ | 1,450,454 | |
| Opened | | | 12,759 | | | | 2,018,201 | |
| Closed | | | (4,259 | ) | | | (1,246,180 | ) |
| Exercised | | | (2,000 | ) | | | (846,232 | ) |
| Expired | | | (11,500 | ) | | | (1,376,243 | ) |
| Balance at March 31, 2012 | | | — | | | $ | — | |
Effects of Derivative Transactions in the Financial Statements
The following tables are intended to provide additional information about the effect of derivatives on the financial statements of the Fund, including: the fair value of derivatives by risk category and the location of those fair values in the Statement of Assets and Liabilities; the impact of derivative transactions on the Fund’s operations over the period including realized gains or losses and
unrealized gains or losses. The derivative schedules following the Portfolio of Investments present additional information regarding derivative instruments outstanding at the end of the period, if any.
| | | | | | |
| Fair Values of Derivative Instruments at March 31, 2012 |
| At March 31, 2012, the fund had no outstanding derivatives. |
| | | | | | | | |
Effect of Derivative Instruments in the Statement of
Operations for the Year Ended March 31, 2012 | |
| | | Amount of Realized Gain
(Loss) on Derivatives
Recognized in Income | |
Risk Exposure
Category | | Options
Contracts
Written and
Purchased | | | Total | |
| Equity contracts | | | (294,188 | ) | | $ | (294,188 | ) |
| | | | | | | | |
| | |
| | | Change in Unrealized
Appreciation
(Depreciation) on
Derivatives
Recognized in Income | |
Risk Exposure
Category | | Options
Contracts
Written and
Purchased | | | Total | |
| Equity contracts | | | 1,329,546 | | | $ | 1,329,546 | |
| | | | | | | | |
Volume of Derivative Instruments for the
Year Ended March 31, 2012 | |
| | | | | | | Contracts
Opened | |
| Options Contracts | | | | | | | 12,759 | |
Repurchase Agreements
The Fund may engage in repurchase agreement transactions with institutions that management has determined are creditworthy. The Fund, through the custodian, receives delivery of the underlying securities collateralizing a repurchase agreement. Management is responsible for determining that the collateral is at least equal, at all times, to the value of the repurchase obligation including interest. A repurchase agreement transaction involves certain risks in the event of default or insolvency of the counterparty. These risks include possible delays in or restrictions on a Fund’s ability to dispose of the underlying securities and a possible decline in the value of the underlying securities during the period while the Fund seeks to assert its rights.
23
Columbia Value and Restructuring Fund
March 31, 2012
Security Transactions
Security transactions are accounted for on the trade date. Cost is determined and gains (losses) are based upon the specific identification method for both financial statement and federal income tax purposes.
Income Recognition
Corporate actions and dividend income are recorded net of any non-reclaimable tax withholdings, on the ex-dividend date or upon receipt of ex-dividend notification in the case of certain foreign securities.
Interest income is recorded on the accrual basis. Market premium and discount are amortized and accreted, respectively, on all debt securities, unless otherwise noted. Original issue discount is accreted to interest income over the life of the security with a corresponding increase in the cost basis, if any. For convertible securities, premiums attributable to the conversion feature are not amortized.
The Fund receives distributions from holdings in real estate investment trusts (REITs) which report information on the character of their distributions annually. REIT distributions are allocated to dividend income, capital gain and return of capital based on estimates made by the Fund’s management if actual information has not yet been reported. Return of capital is recorded as a reduction of the cost basis of securities held. Management’s estimates are subsequently adjusted when the actual character of the distributions is disclosed by the REITs which could result in a proportionate increase in return of capital to shareholders.
Awards from class action litigation are recorded as a reduction of cost if the Fund still owns the applicable securities on the payment date. If the Fund no longer owns the applicable securities, the proceeds are recorded as realized gains.
Expenses
General expenses of the Trust are allocated to the Fund and other funds of the Trust based upon relative net assets or other expense allocation methodologies determined by the nature of the expense. Expenses directly attributable to the Fund are charged to the Fund. Expenses directly attributable to a specific class of shares are charged to that share class.
Determination of Class Net Asset Value
All income, expenses (other than class-specific expenses, which are charged to that share class, as shown in the Statement of Operations)
and realized and unrealized gains (losses) are allocated to each class of the Fund on a daily basis, based on the relative net assets of each class, for purposes of determining the net asset value of each class.
Federal Income Tax Status
The Fund intends to qualify each year as a regulated investment company under Subchapter M of the Internal Revenue Code, as amended, and will distribute substantially all of its taxable income (including net short-term capital gains), if any, for its tax year, and as such will not be subject to federal income taxes. In addition, the Fund intends to distribute in each calendar year substantially all of its net investment income, capital gains and certain other amounts, if any, such that the Fund should not be subject to federal excise tax. Therefore, no federal income or excise tax provision is recorded.
Foreign Taxes
The Fund may be subject to foreign taxes on income, gains on investments or currency repatriation, a portion of which may be recoverable. The Fund will accrue such taxes and recoveries, as applicable, based upon its current interpretation of tax rules and regulations that exist in the markets in which it invests.
Realized gains in certain countries may be subject to foreign taxes at the Fund level, based on statutory rates. The Fund accrues for such foreign taxes on net realized and unrealized gains at the appropriate rate for each jurisdiction, as applicable.
Distributions to Shareholders
Distributions from net investment income, if any, are declared and paid each calendar quarter. Net realized capital gains, if any, are distributed along with the income dividend. Income distributions and capital gain distributions are determined in accordance with federal income tax regulations which may differ from GAAP.
Guarantees and Indemnifications
Under the Trust’s organizational documents and, in some cases, by contract, its officers and trustees are indemnified against certain liabilities arising out of the performance of their duties to the Trust or its funds. In addition, certain of the Fund’s contracts with its service providers contain general indemnification clauses. The Fund’s maximum exposure under these arrangements is unknown since the amount of any future claims that may be made against the Fund cannot be determined, and the Fund has no historical basis for predicting the likelihood of any such claims.
24
Columbia Value and Restructuring Fund
March 31, 2012
Recent Accounting Pronouncement
Fair Value Measurements and Disclosures
In May 2011, the Financial Accounting Standards Board (FASB) issued ASU No. 2011-04 modifying Topic 820, Fair Value Measurements and Disclosures. At the same time, the International Accounting Standards Board (IASB) issued International Financial Reporting Standard 13, Fair Value Measurement. The objective of the FASB and IASB is convergence of their guidance on fair value measurements and disclosures.
Specifically, ASU No. 2011-04 requires reporting entities to disclose i) the amounts of any transfers between Level 1 and Level 2, and the reasons for the transfers, ii) for Level 3 fair value measurements, a) quantitative information about significant unobservable inputs used, b) a description of the valuation processes used by the reporting entity and c) a narrative description of the sensitivity of the fair value measurement to changes in unobservable inputs if a change in those inputs might result in a significantly higher or lower fair value measurement. The effective date of ASU No. 2011-04 is for interim and annual periods beginning after December 15, 2011. At this time, management is evaluating the implications of this guidance and the impact it will have on the financial statement amounts and footnote disclosures, if any.
Note 3. Fees and Compensation Paid to Affiliates
Investment Management Fees
Under an Investment Management Services Agreement (IMSA), Columbia Management Investment Advisers, LLC (the Investment Manager), a wholly-owned subsidiary of Ameriprise Financial, Inc. (Ameriprise Financial), determines which securities will be purchased, held or sold. Effective July 1, 2011, the management fee is an annual fee that is equal to a percentage of the Fund’s average daily net assets that declines from 0.69% to 0.54% as the Fund’s net assets increase. Prior to July 1, 2011, the management fee was equal to a percentage of the Fund’s average daily net assets that declined from 0.60% to 0.43% as the Fund’s net assets increased. The effective management fee rate for the year ended March 31, 2012 was 0.66% of the Fund’s average daily net assets.
Administration Fees
Under an Administrative Services Agreement, the Investment Manager serves as the Fund Administrator. Effective July 1, 2011, the Fund pays the Fund Administrator an annual fee for administration and accounting services equal to a percentage of the
Fund’s average daily net assets that declines from 0.06% to 0.03% as the Fund’s net assets increase. Prior to July 1, 2011, the administration fee was equal to the annual rate of 0.15% of the Fund’s average daily net assets, less the fees that were payable by the Fund as described under the Pricing and Bookkeeping Fees note below. The effective administration fee rate for the year ended March 31, 2012 was 0.09% of the Fund’s average daily net assets.
Pricing and Bookkeeping Fees
Prior to July 11, 2011, the Fund had entered into a Financial Reporting Services Agreement (the Financial Reporting Services Agreement) with State Street Bank and Trust Company (State Street) and the Investment Manager pursuant to which State Street provided financial reporting services to the Fund. The Fund also entered into an Accounting Services Agreement (collectively with the Financial Reporting Services Agreement, the State Street Agreements) with State Street and the Investment Manager pursuant to which State Street provided accounting services to the Fund. Under the State Street Agreements, the Fund paid State Street an annual fee of $38,000 paid monthly plus an additional monthly fee based on an annualized percentage rate of average daily net assets of the Fund for the month. The aggregate fee did not exceed $140,000 per year (exclusive of out-of-pocket expenses and charges). The Fund also reimbursed State Street for certain out-of-pocket expenses and charges. Effective July 11, 2011, these services are provided under the Administrative Services Agreement discussed above.
Compensation of Board Members
Board members are compensated for their services to the Fund as disclosed in the Statement of Operations. The Trust’s eligible Trustees may participate in a Deferred Compensation Plan (the Plan) which may be terminated at any time. Obligations of the Plan will be paid solely out of the Fund’s assets.
Compensation of Chief Compliance Officer
The Board has appointed a Chief Compliance Officer to the Fund in accordance with federal securities regulations. The Fund, along with other affiliated funds, pays its pro-rata share of the expenses associated with the Chief Compliance Officer. The Fund’s expenses for the Chief Compliance Officer will not exceed $15,000 per year.
Transfer Agent Fees
Under a Transfer and Dividend Disbursing Agent Agreement, Columbia Management Investment Services Corp. (the Transfer Agent), an affiliate of the Investment Manager and a wholly-owned
25
Columbia Value and Restructuring Fund
March 31, 2012
subsidiary of Ameriprise Financial, is responsible for providing transfer agency services to the Fund. The Transfer Agent has contracted with Boston Financial Data Services (BFDS) to serve as sub-transfer agent.
The Transfer Agent receives monthly account-based service fees based on the number of open accounts and is reimbursed by the Fund for the fees and expenses the Transfer Agent pays to financial intermediaries that maintain omnibus accounts with the Fund that is a percentage of the average aggregate value of the Fund’s shares maintained in each such omnibus account (other than omnibus accounts for which American Enterprise Investment Services Inc. is the broker of record or accounts where the beneficial shareholder is a customer of Ameriprise Financial Services, Inc., which are paid a per account fee). The Transfer Agent pays the fees of BFDS for services as sub-transfer agent and is not entitled to reimbursement for such fees from the Fund (with the exception of out-of-pocket fees).
The Transfer Agent also receives compensation from fees for various shareholder services and reimbursements for certain out-of-pocket expenses. Class I shares do not pay transfer agent fees.
For the year ended March 31, 2012, the Fund’s effective transfer agent fee rates as a percentage of average daily net assets of each class were as follows:
| | | | |
| | | | |
| Class A | | | 0.22 | % |
| Class C | | | 0.20 | |
| Class R | | | 0.21 | |
| Class W | | | 0.21 | |
| Class Z | | | 0.20 | |
An annual minimum account balance fee of $20 may apply to certain accounts with a value below the Fund’s initial minimum investment requirements to reduce the impact of small accounts on transfer agent fees. These minimum account balance fees are recorded as part of expense reductions in the Statement of Operations. For the year ended March 31, 2012, these minimum account balance fees reduced total expenses by $43,652.
Distribution and Service Fees
The Fund has an agreement with Columbia Management Investment Distributors, Inc. (the Distributor), an affiliate of the Investment Manager and a wholly-owned subsidiary of Ameriprise Financial, for distribution and shareholder services. Pursuant to Rule 12b-1 under the 1940 Act, the Board has approved, and the Fund has
adopted, distribution and shareholder service plans (the Plans) which set the distribution and service fees for the Fund. These fees are calculated daily and are intended to compensate the Distributor and/or eligible selling and/or servicing agents for selling shares of the Fund and providing services to investors.
The Plans require the payment of a monthly service fee to the Distributor at the maximum annual rate of 0.25% of the average daily net assets attributable to Class A, Class C and Class W shares of the Fund. The Plans also require the payment of a monthly distribution fee to the Distributor at the maximum annual rates of 0.75%, 0.50% and 0.25% of the average daily net assets attributable to Class C, Class R and Class W shares, respectively.
The Fund may pay a distribution fee of up to 0.25% of the Fund’s average daily net assets attributable to Class W shares and a service fee of up to 0.25% of the Fund’s average daily net assets attributable to Class W shares, provided, however, that the aggregate fee shall not exceed 0.25% of the Fund’s average daily net assets attributable to Class W shares.
Sales Charges
Sales charges, including front-end charges and CDSCs, received by the Distributor for distributing Fund shares were $56,508 for Class A, and $9,633 for Class C shares for the year ended March 31, 2012.
Expenses Waived/Reimbursed by the Investment Manager and its Affiliates
Effective July 1, 2011, the Investment Manager and certain of its affiliates have contractually agreed to waive fees and/or reimburse expenses (excluding certain fees and expenses described below), through July 31, 2012, unless sooner terminated at the sole discretion of the Board, so that the Fund’s net operating expenses, after giving effect to fees waived/expenses reimbursed and any balance credits and/or overdraft charges from the Fund’s custodian, do not exceed the following annual rates as a percentage of the class’ average daily net assets:
| | | | |
| | | | |
| Class A | | | 1.19 | % |
| Class C | | | 1.94 | |
| Class I | | | 0.81 | |
| Class R | | | 1.44 | |
| Class W | | | 1.19 | |
| Class Z | | | 0.94 | |
26
Columbia Value and Restructuring Fund
March 31, 2012
Under the agreement, the following fees and expenses are excluded from the waiver/reimbursement commitment, and therefore will be paid by the Fund, if applicable: taxes (including foreign transaction taxes), expenses associated with investments in affiliated and non-affiliated pooled investment vehicles (including mutual funds and exchange traded funds), transaction costs and brokerage commissions, costs related to any securities lending program, dividend expenses associated with securities sold short, inverse floater program fees and expenses, transaction charges and interest on borrowed money, interest, extraordinary expenses and any other expenses the exclusion of which is specifically approved by the Board. This agreement may be modified or amended only with approval from all parties.
Prior to July 1, 2011, the Investment Manager voluntarily agreed to reimburse a portion of the Fund’s expenses (excluding certain expenses, such as brokerage commissions, interest, taxes and extraordinary expenses, but including custodian charges relating to overdrafts, if any) so that the Fund’s ordinary net operating expenses, after giving effect to fees waived/expenses reimbursed and any balance credits and/or overdraft charges from the Fund’s custodian, did not exceed the following annual rates as a percentage of the class’ average daily net assets:
| | | | |
| | | | |
| Class A | | | 1.25 | % |
| Class C | | | 2.00 | |
| Class I | | | 0.88 | |
| Class R | | | 1.50 | |
| Class W | | | 1.25 | |
| Class Z | | | 1.00 | |
Note 4. Federal Tax Information
The timing and character of income and capital gain distributions are determined in accordance with income tax regulations, which may differ from GAAP because of temporary or permanent book to tax differences.
For the year ended March 31, 2012, these differences are primarily due to differing treatment for deferral/reversal of wash sales losses, Trustees’ deferred compensation, foreign currency transactions, post-October capital losses and recognition of unrealized appreciation (depreciation) for certain derivative investments. To the extent these differences are permanent, reclassifications are made among the components of the Fund’s net assets in the Statement of
Assets and Liabilities. Temporary differences do not require reclassifications. In the Statement of Assets and Liabilities the following reclassifications were made:
| | | | |
| | | | |
| Undistributed net investment income | | $ | (51,882 | ) |
| Accumulated net realized loss | | | 51,882 | |
| Paid-in capital | | | — | |
Net investment income and net realized gains (losses), as disclosed in the Statement of Operations, and net assets were not affected by this reclassification.
The tax character of distributions paid during the years indicated was as follows:
| | | | |
| Year ended March 31, | | 2012 | | 2011 |
| Ordinary income | | $66,898,913 | | $91,391,224 |
Short-term capital gain distributions, if any, are considered ordinary income distributions for tax purposes.
At March 31, 2012, the components of distributable earnings on a tax basis were as follows:
| | | | |
| | | | |
| Undistributed ordinary income | | $ | 1,802,541 | |
| Unrealized appreciation | | | 1,216,044,981 | |
At March 31, 2012, the cost of investments for federal income tax purposes was $2,978,636,037 and the aggregate gross unrealized appreciation and depreciation based on that cost was:
| | | | |
| | | | |
| Unrealized appreciation | | $ | 1,381,262,682 | |
| Unrealized depreciation | | $ | (165,217,701 | ) |
| Net unrealized appreciation | | $ | 1,216,044,981 | |
The following capital loss carryforward, determined at March 31, 2012, may be available to reduce taxable income arising from future net realized gains on investments, if any, to the extent permitted by the Internal Revenue Code:
| | | | |
| | | | |
| Year of expiration | | Amount | |
| 2018 | | $ | 511,299,923 | |
On December 22, 2010, the Regulated Investment Company Modernization Act of 2010 (the Act) was enacted, which changed various technical rules governing the tax treatment of regulated
27
Columbia Value and Restructuring Fund
March 31, 2012
investment companies. The changes are generally effective for taxable years beginning after the date of enactment. Under the Act, the Fund will be permitted to carry forward capital losses incurred in taxable years beginning after the date of enactment for an unlimited period. However, any losses incurred during those future taxable years will be required to be utilized prior to the losses incurred in pre-enactment taxable years, which carry an expiration date. As a result of this ordering rule, pre-enactment capital loss carryforwards may be more likely to expire unused.
For the year ended March 31, 2012, $832,672,482 of capital loss carryforward was utilized.
Under current tax rules, regulated investment companies can elect to treat certain late-year ordinary losses incurred and post-October capital losses (capital losses realized after October 31) as arising on the first day of the following taxable year. As of March 31, 2012, the Fund will elect to treat post-October capital losses of $16,460,759 as arising on April 1, 2012.
Management of the Fund has concluded that there are no significant uncertain tax positions that would require recognition in the financial statements. However, management’s conclusion may be subject to review and adjustment at a later date based on factors including, but not limited to, new tax laws, regulations, and administrative interpretations (including relevant court decisions). Generally, the Fund’s federal tax returns for the prior three fiscal years remain subject to examination by the Internal Revenue Service.
Note 5. Portfolio Information
The cost of purchases and proceeds from sales of securities, excluding short-term obligations, aggregated to $517,054,199 and $2,805,665,431, respectively, for the year ended March 31, 2012.
Note 6. Lending of Portfolio Securities
Effective July 11, 2011, the Fund has entered into a Master Securities Lending Agreement (the Agreement) with JPMorgan Chase Bank, N.A. (JPMorgan). The Agreement, which replaces the previous securities lending arrangement with State Street, authorizes JPMorgan as lending agent to lend securities to authorized borrowers in order to generate additional income on behalf of the Fund. Pursuant to the Agreement, the securities loaned are secured by cash or U.S. government securities equal to at least 100% of the market value of the loaned securities. Any additional collateral required to maintain those levels due to market fluctuations of the loaned securities is requested to be delivered the following business
day. Cash collateral received is invested by the lending agent on behalf of the Fund into authorized investments pursuant to the Agreement. The investments made with the cash collateral are listed in the Portfolio of Investments. The values of such investments and any uninvested cash collateral are disclosed in the Statement of Assets and Liabilities along with the related obligation to return the collateral upon the return of the securities loaned. At March 31, 2012, securities valued at $52,691,829 were on loan, secured by cash collateral of $54,039,134 (which does not reflect calls for collateral made to borrowers by JPMorgan at period end) that is partially or fully invested in short-term securities or other cash equivalents.
Risks of delay in recovery of securities or even loss of rights in the securities may occur should the borrower of the securities fail financially. Risks may also arise to the extent that the value of the securities loaned increases above the value of the collateral received. JPMorgan will indemnify the Fund from losses resulting from a borrower’s failure to return a loaned security when due. Such indemnification does not extend to losses associated with declines in the value of cash collateral investments. The Investment Manager is not responsible for any losses incurred by the Fund in connection with the securities lending program. Loans are subject to termination by the Fund or the borrower at any time, and are, therefore, not considered to be illiquid investments.
Pursuant to the Agreement, the Fund receives income for lending its securities either in the form of fees or by earning interest on invested cash collateral, net of negotiated rebates paid to borrowers and fees paid to the lending agent for services provided and any other securities lending expenses. Net income earned from securities lending for the year ended March 31, 2012 is disclosed in the Statement of Operations. The Fund continues to earn and accrue interest and dividends on the securities loaned.
Prior to July 11, 2011, the Fund participated in a securities lending arrangement with State Street. Each security on loan was collateralized in an amount at least equal to the market value of the securities loaned plus accrued income from the investment of collateral. The income generated by the investment of the collateral, net of any fees remitted to State Street as the lending agent and borrower rebates, was paid to the Fund.
Note 7. Custody Credits
Prior to July 11, 2011, the Fund had an agreement with its custodian bank under which custody fees may have been reduced by balance credits. These credits are recorded as part of expense reductions on the Statement of Operations. The Fund could have invested a portion
28
Columbia Value and Restructuring Fund
March 31, 2012
of the assets utilized in connection with the expense offset arrangement in an income-producing asset if they had not entered into such an agreement. Subsequent to this date, the Fund may invest its daily balance in an affiliated money market fund as detailed below. For the period April 1, 2011 through July 10, 2011, there were no custody credits.
Note 8. Affiliated Money Market Fund
Effective July 11, 2011, the Fund may invest its daily cash balances in Columbia Short-Term Cash Fund, an affiliated money market fund established for the exclusive use by the Fund and other affiliated funds. The income earned by the Fund from such investments is included as “Dividends from affiliates” in the Statement of Operations. As an investing fund, the Fund indirectly bears its proportionate share of the expenses of Columbia Short-Term Cash Fund.
Note 9. Shareholder Concentration
At March 31, 2012, two unaffiliated shareholder accounts owned an aggregate of 48.9% of the outstanding shares of the Fund. The Fund has no knowledge about whether any portion of those shares was owned beneficially by such accounts. Subscription and redemption activity by concentrated accounts may have a significant effect on the operations of the Fund.
Note 10. Line of Credit
The Fund has entered into a revolving credit facility with a syndicate of banks led by JPMorgan Chase whereby the Fund may borrow for the temporary funding of shareholder redemptions or for other temporary or emergency purposes. The credit facility became effective on July 11, 2011, replacing a prior credit facility. The credit facility agreement, as amended, which is a collective agreement between the Fund and certain other funds managed by the Investment Manager, severally and not jointly, permits collective borrowings up to $500 million. Pursuant to a December 13, 2011 amendment to the credit facility agreement, interest is charged to each participating fund based on its borrowings at a rate equal to the higher of (i) the overnight federal funds rate plus 1.00% or (i) the one-month LIBOR rate plus 1.00%. Each borrowing under the credit facility matures no later than 60 days after the date of borrowing. The Fund also pays a commitment fee equal to its pro rata share of the amount of the credit facility at a rate of 0.08% per annum. For the period July 11, 2011 through December 13, 2011, interest was charged to each participating fund based on its borrowings at a rate equal to the sum of the federal funds rate plus (i) 1.25% per annum
plus (ii) if one-month LIBOR exceeds the federal funds rate, the amount of such excess. The Fund also paid a commitment fee equal to its pro rata share of the amount of the credit facility at a rate of 0.10% per annum.
For the period June 27, 2011 through July 8, 2011, the Fund and certain other funds managed by the Investment Manager participated in a $100,000 committed, unsecured revolving credit facility provided by State Street. For the period May 16, 2011 through June 26, 2011, the collective borrowing amount of the credit facility was $150 million. Prior to May 16, 2011, the collective borrowing amount of the credit facility was $225 million. Interest was charged to each fund based on its borrowings at a rate equal to the greater of the (i) federal funds rate plus 1.25% per annum or (ii) the overnight LIBOR rate plus 1.25% per annum. The Fund also paid a commitment fee equal to its pro rata share of the amount of the credit facility at a rate of 0.125% per annum.
For the year ended March 31, 2012, the average daily loan balance outstanding on days when borrowing existed was $8,150,000 at a weighted average interest rate of 1.38%.
Note 11. Subsequent Events
Management has evaluated the events and transactions that have occurred through the date the financial statements were issued and noted no items requiring adjustment of the financial statements or additional disclosure.
Note 12. Information Regarding Pending and Settled Legal Proceedings
In December 2005, without admitting or denying the allegations, American Express Financial Corporation (AEFC, which is now known as Ameriprise Financial, Inc. (Ameriprise Financial)) entered into settlement agreements with the Securities and Exchange Commission (SEC) and Minnesota Department of Commerce (MDOC) related to market timing activities. As a result, AEFC was censured and ordered to cease and desist from committing or causing any violations of certain provisions of the Investment Advisers Act of 1940, the Investment Company Act of 1940, and various Minnesota laws. AEFC agreed to pay disgorgement of $10 million and civil money penalties of $7 million. AEFC also agreed to retain an independent distribution consultant to assist in developing a plan for distribution of all disgorgement and civil penalties ordered by the SEC in accordance with various undertakings detailed at www.sec.gov/litigation/admin/ia-2451.pdf. Ameriprise Financial and its affiliates have cooperated with the SEC and the MDOC in these legal proceedings, and have made regular reports to the funds’ Boards of Trustees.
29
Columbia Value and Restructuring Fund
March 31, 2012
Ameriprise Financial and certain of its affiliates have historically been involved in a number of legal, arbitration and regulatory proceedings, including routine litigation, class actions, and governmental actions, concerning matters arising in connection with the conduct of their business activities. Ameriprise Financial believes that the Funds are not currently the subject of, and that neither Ameriprise Financial nor any of its affiliates are the subject of, any pending legal, arbitration or regulatory proceedings that are likely to have a material adverse effect on the Funds or the ability of Ameriprise Financial or its affiliates to perform under their contracts with the Funds. Ameriprise Financial is required to make 10-Q, 10-K and, as necessary, 8-K filings with the Securities and Exchange Commission on legal and regulatory matters that relate to Ameriprise Financial and its affiliates. Copies of these filings may be obtained by accessing the SEC website at www.sec.gov.
There can be no assurance that these matters, or the adverse publicity associated with them, will not result in increased fund redemptions, reduced sale of fund shares or other adverse consequences to the Funds. Further, although we believe proceedings are not likely to have a material adverse effect on the Funds or the ability of Ameriprise Financial or its affiliates to perform under their contracts with the Funds, these proceedings are subject to uncertainties and, as such, we are unable to estimate the possible loss or range of loss that may result. An adverse outcome in one or more of these proceedings could result in adverse judgments, settlements, fines, penalties or other relief that could have a material adverse effect on the consolidated financial condition or results of operations of Ameriprise Financial.
30
Report of Independent Registered Public Accounting Firm
To the Trustees of Columbia Funds Series Trust I and the Shareholders of Columbia Value and Restructuring Fund
In our opinion, the accompanying statement of assets and liabilities, including the investment portfolio, and the related statements of operations and of changes in net assets and the financial highlights present fairly, in all material respects, the financial position of Columbia Value and Restructuring Fund (the “Fund”) (a series of Columbia Funds Series Trust I) at March 31, 2012, the results of its operations for the year then ended, the changes in its net assets for each of the two years in the period then ended and the financial highlights for the periods indicated, in conformity with accounting principles generally accepted in the United States of America. These financial statements and financial highlights (hereafter referred to as “financial statements”) are the responsibility of the Fund’s management. Our responsibility is to express an opinion on these financial statements based on our audits. We conducted our audits of these financial statements in accordance with the standards of the Public Company Accounting Oversight Board (United States). Those standards require that we plan and perform the audit to obtain reasonable assurance about whether the financial statements are free of material misstatement. An audit includes examining, on a test basis, evidence supporting the amounts and disclosures in the financial statements, assessing the accounting principles used and significant estimates made by management, and evaluating the overall financial statement presentation. We believe that our audits, which included confirmation of securities at March 31, 2012 by correspondence with the custodian, transfer agent and brokers, provide a reasonable basis for our opinion.
PricewaterhouseCoopers LLP
Minneapolis, Minnesota
May 22, 2012
31
Federal Income Tax Information (Unaudited) – Columbia Value and Restructuring Fund
100.00% of the ordinary income distributed by the Fund for the fiscal year ended March 31, 2012, qualifies for the corporate dividends received deduction.
For non-corporate shareholders 100.00%, or the maximum amount allowable under the Jobs and Growth Tax Relief Reconciliation Act of 2003, of ordinary income distributed by the Fund for the fiscal year ended March 31, 2012 may represent qualified dividend income.
The Fund will notify shareholders in January 2013 of amounts for use in preparing 2012 income tax returns.
32
Fund Governance
The Trustees serve terms of indefinite duration. The names, addresses and birth years of the Trustees and Officers of the Funds in Columbia Funds Series Trust I, the year each was first elected or appointed to office, their principal business occupations during at least the last five years, the number of Funds overseen by each Trustee and other directorships they hold are shown below. Each officer listed below serves as an officer of each Fund in Columbia Funds Series Trust I.
Independent Trustees
| | |
Name, address and year of birth,
Position with funds, Year first
elected or appointed to office | | Principal occupation(s) during past five years, Number of funds in Columbia Funds
Complex overseen by trustee, Other directorships Held |
| |
| Rodman L. Drake (born 1943) | | |
c/o Columbia Management Investment Advisers, LLC 225 Franklin Street Boston, MA 02110 Trustee (since 1994) and Chairman of the Board (since 2009) | | Independent consultant since 2010; Co-Founder of Baringo Capital LLC (private equity) from 1997 to 2008; CEO of Crystal River Capital, Inc. (real estate investment trust) from 2003 to 2010; Oversees 51; Jackson Hewitt Tax Service Inc. (tax preparation services) from 2004 to 2011; Celgene Corporation (global biotechnology company); Student Loan Corporation (student loan provider) from 2005 to 2010; Celgene Corporation (global biotechnology company); The Helios Funds and Brookfield Funds (closed-end funds); Crystal River Capital, Inc. from 2005 to 2010; Parsons Brinckerhoff from 1995 to 2008; and Apex Silver Mines Ltd. from 2007 to 2009 |
| |
| Douglas A. Hacker (born 1955) | | |
c/o Columbia Management Investment Advisers, LLC 225 Franklin Street Boston, MA 02110 Trustee (since 1996) | | Independent business executive since May 2006; Executive Vice President–Strategy of United Airlines from December 2002 to May 2006; President of UAL Loyalty Services (airline marketing company) from September 2001 to December 2002; Executive Vice President and Chief Financial Officer of United Airlines from July 1999 to September 2001. Oversees 51; Nash Finch Company (food distributor); Aircastle Limited (aircraft leasing); and SeaCube Container Leasing Ltd (container leasing) |
|
| Janet Langford Kelly (born 1957) |
c/o Columbia Management Investment Advisers, LLC 225 Franklin Street Boston, MA 02110 Trustee (since 1996) | | Senior Vice President, General Counsel and Corporate Secretary, ConocoPhillips (integrated energy company) since September 2007; Deputy General Counsel–Corporate Legal Services, ConocoPhillips from August 2006 to August 2007; Partner, Zelle, Hofmann, Voelbel, Mason & Gette LLP (law firm) from March 2005 to July 2006; Adjunct Professor of Law, Northwestern University, from September 2004 to June 2006; Director, UAL Corporation (airline) from February 2006 to July 2006; Chief Administrative Officer and Senior Vice President, Kmart Holding Corporation (consumer goods) from September 2003 to March 2004 Oversees 51; None |
|
| Nancy T. Lukitsh (born 1956) |
c/o Columbia Management Investment Advisers, LLC 225 Franklin Street Boston, MA 02110 Trustee (since 2011) | | Senior Vice President, Partner and Director of Marketing, Wellington Management Company, LLP (investment adviser) from 1997 to 2010; Chair, Wellington Management Investment Portfolios (commingled non-U.S. investment pools) from 2007 to 2010; Director, Wellington Trust Company, NA and other Wellington affiliates from 1997 to 2010. Oversees 51; None |
|
| William E. Mayer (born 1940) |
c/o Columbia Management Investment Advisers, LLC 225 Franklin Street Boston, MA 02110 Trustee (since 1994) | | Partner, Park Avenue Equity Partners (private equity) since February 1999; Dean and Professor, College of Business and Management, University of Maryland from 1992 to 1996. Oversees 51; DynaVox Inc. (speech creation); Lee Enterprises (print media), WR Hambrecht + Co. (financial service provider) from 2000 to 2012; BlackRock Kelso Capital Corporation (investment company) |
33
Fund Governance (continued)
Independent Trustees (continued)
| | |
Name, address and year of birth,
Position with funds, Year first
elected or appointed to office | | Principal occupation(s) during past five years, Number of funds in Columbia Funds
Complex overseen by trustee, Other directorships held |
| |
| David M. Moffett (born 1952) | | |
c/o Columbia Management Investment Advisers, LLC 225 Franklin Street Boston, MA 02110 Trustee (since 2011) | | Retired. Chief Executive Officer, Federal Home Loan Mortgage Corporation, from 2008 to 2009; Senior Adviser, Global Financial Services Group, Carlyle Group, Inc., from 2007 to 2008; Vice Chairman and Chief Financial Officer, U.S. Bancorp, from 1993 to 2007. Oversees 51; CIT Group Inc. (commercial and consumer finance), eBay Inc. (online trading community), MBIA Corp (financial service provider), E.W. Scripps Co. (print and television media), Building Materials Holding Corp. (building materials and construction services), and University of Oklahoma Foundation. |
| |
| Charles R. Nelson (born 1942) | | |
c/o Columbia Management Investment Advisers, LLC 225 Franklin Street Boston, MA 02110 Trustee (since 1981) | | Retired. Professor Emeritus, University of Washington, since 2011; Professor of Economics, University of Washington, from 1976 to 2011; Ford and Louisa Van Voorhis Professor of Political Economy, University of Washington, from 1993 to 2011; Adjunct Professor of Statistics, University of Washington, from 1980 to 2011; Associate Editor, Journal of Money Credit and Banking from 1993 to 2008; consultant on econometric and statistical matters. Oversees 51; None |
| |
| John J. Neuhauser (born 1943) | | |
c/o Columbia Management Investment Advisers, LLC 225 Franklin Street Boston, MA 02110 Trustee (since 1984) | | President, Saint Michael’s College, since August 2007; Director or Trustee of several non-profit organization, including Fletcher Allen Health Care, Inc.; University Professor, Boston College from November 2005 to August 2007; Academic Vice President and Dean of Faculties, Boston College from August 1999 to October 2005. Oversees 51; Liberty All-Star Equity Fund and Liberty All-Star Growth Fund, Inc. (closed-end funds) |
| |
| Patrick J. Simpson (born 1944) | | |
c/o Columbia Management Investment Advisers, LLC 225 Franklin Street Boston, MA 02110 Trustee (since 2000) | | Partner, Perkins Coie LLP (law firm). Oversees 51; None |
| |
| Anne-Lee Verville (born 1945) | | |
c/o Columbia Management Investment Advisers, LLC 225 Franklin Street Boston, MA 02110 Trustee (since 1998) | | Retired. General Manager–Global Education Industry from 1994 to 1997, President–Application Systems Division from 1991 to 1994, Chief Financial Officer–US Marketing & Services from 1988 to 1991, and Chief Information Officer from 1987 to 1988, IBM Corporation (computer and technology). Oversees 51; Enesco Group, Inc. (producer of giftware and home and garden decor products) from 2001 to 2006 |
The Statement of Additional Information includes additional information about the Trustees of the Funds and is available, without charge, upon request by calling 1-800-345-6611.
34
Fund Governance (continued)
Interested Trustees
| | |
Name, address and year of birth,
Position with funds, Year first
elected or appointed to office | | Principal occupation(s) during past five years, Number of funds in Columbia Funds
Complex overseen by trustee, Other directorships held |
| |
| William F. Truscott (born 1960) | | |
53600 Ameriprise Financial Center Minneapolis, MN 55474 Senior Vice President (since 2010) | | Chairman of the Board, Columbia Management Investment Advisers, LLC since May 2010 and February 2012, respectively (previously President, Chairman of the Board and Chief Investment Officer, from 2001 to April 2010); Chief Executive Officer, U.S. Asset Management & President, Annuities, Ameriprise Financial, Inc. since May 2010 (previously President–U.S. Asset Management and Chief Investment Officer from 2005 to April 2010, and Senior Vice President–Chief Investment Officer, from 2001 to 2005); Director, President and Chief Executive Officer, Ameriprise Certificate Company since 2006; Director, Columbia Management Investment Distributors, Inc. since May 2010 and February 2012, respectively (previously Chairman of the Board and Chief Executive Officer from 2008 to April 2010); Chairman of the Board and Chief Executive Officer, RiverSource Distributors, Inc. since 2006. Oversees 51; Columbia Funds Board. |
35
Fund Governance (continued)
Officers
| | |
| Name, Year of birth and address | | Principal occupation(s) during the past five years |
|
| J. Kevin Connaughton (born 1964) |
225 Franklin Street Boston, MA 02110 President (since 2009) | | Senior Vice President and General Manager–Mutual Fund Products, Columbia Management Investment Advisers, LLC since May 2010; President, Columbia Funds, since 2009, and RiverSource Funds, since May 2010 (previously Senior Vice President and Chief Financial Officer, Columbia Funds, from June 2008 to January 2009, Treasurer, Columbia Funds, from October 2003 to May 2008, and senior officer of various other affiliated funds since 2000); Managing Director, Columbia Management Advisors, LLC from December 2004 to April 2010. |
| |
| Michael G. Clarke (born 1969) | | |
225 Franklin Street Boston, MA 02110 Treasurer (since 2011) and Chief Financial Officer (since 2009) | | Vice President, Columbia Management Investment Advisers, LLC since May 2010; Managing Director of Fund Administration, Columbia Management Advisors, LLC, from September 2004 to April 2010; senior officer of Columbia Funds and affiliated funds since 2002. |
| |
| Scott R. Plummer (born 1959) | | |
5228 Ameriprise Financial Center Minneapolis, MN 55474 Senior Vice President, Assistant Secretary and Chief Legal Officer (since 2010) | | Chief Legal Officer and Assistant Secretary, Columbia Management Investment Advisers, LLC since June 2005; Vice President and Lead Chief Counsel–Asset Management, Ameriprise Financial, Inc. since May 2010 (previously Vice President and Chief Counsel–Asset Management, from 2005 to April 2010, and Vice President–Asset Management Compliance from 2004 to 2005); Vice President, Chief Counsel and Assistant Secretary, Columbia Management Investment Distributors, Inc. since 2008; Vice President, General Counsel and Secretary, Ameriprise Certificate Company since 2005; Chief Counsel, RiverSource Distributors, Inc. since 2006; Vice President, General Counsel and Secretary, RiverSource Funds, since December 2006; Senior Vice President, Secretary and Chief Legal Officer, Columbia Funds, since May 2010. |
| |
| Thomas P. McGuire (born 1972) | | |
225 Franklin Street Boston, MA 02110 Chief Compliance Officer (since 2012) | | Vice President–Asset Management Compliance, Columbia Management Investment Advisers, LLC since 2010; Chief Compliance Officer, Ameriprise Certificate Company, since September 2010; Compliance Executive, Bank of America, 2005-2010. |
| |
| William F. Truscott (born 1960) | | |
53600 Ameriprise Financial Center Minneapolis, MN 55474 Senior Vice President (since 2010) | | Chairman of the Board, Columbia Management Investment Advisers, LLC since May 2010 and February 2012, respectively (previously President, Chairman of the Board and Chief Investment Officer, from 2001 to April 2010); Chief Executive Officer, U.S. Asset Management & President, Annuities, Ameriprise Financial, Inc. since May 2010 (previously President–U.S. Asset Management and Chief Investment Officer from 2005 to April 2010, and Senior Vice President–Chief Investment Officer, from 2001 to 2005); Director, President and Chief Executive Officer, Ameriprise Certificate Company since 2006; Director, Columbia Management Investment Distributors, Inc. since May 2010 and February 2012, respectively (previously Chairman of the Board and Chief Executive Officer from 2008 to April 2010); Chairman of the Board and Chief Executive Officer, RiverSource Distributors, Inc. since 2006. |
36
Fund Governance (continued)
Officers (continued)
| | |
| Name, Year of birth and address | | Principal occupation(s) during the past five years |
|
| Colin Moore (born 1958) |
225 Franklin Street Boston, MA 02110 Senior Vice President (since 2010) | | Director and Chief Investment Officer, Columbia Management Investment Advisers, LLC since May 2010; Manager, Managing Director and Chief Investment Officer of Columbia Management Advisors, LLC from 2007 to April 2010; Head of Equities, Columbia Management Advisors, LLC from 2002 to 2007. |
| |
| Amy Johnson (born 1965) | | |
5228 Ameriprise Financial Center Minneapolis, MN 55474 Vice President (since 2010) | | Senior Vice President and Chief Operating Officer, Columbia Management Investment Advisers, LLC since May 2010 (previously Chief Administrative Officer, from 2009 until April 2010, Vice President–Asset Management and Trust Company Services, from 2006 to 2009, and Vice President–Operations and Compliance from 2004 to 2006). |
| |
| Joseph F. DiMaria (born 1968) | | |
225 Franklin Street Boston, MA 02110 Vice President (since 2011) and Chief Accounting Officer (since 2008) | | Vice President, Mutual Fund Administration, Columbia Management Investment Advisers, LLC, since May 2010; Director of Fund Administration, Columbia Management Advisors, LLC from January 2006 to April 2010; Head of Tax/Compliance and Assistant Treasurer, Columbia Management Advisors, LLC, from November 2004 to December 2005. |
| |
| Stephen T. Welsh (born 1957) | | |
225 Franklin Street Boston, MA 02110 Vice President (since 2006) | | President and Director, Columbia Management Investment Services Corp. since May 2010; President and Director, Columbia Management Services, Inc. from July 2004 to April 2010; Managing Director, Columbia Management Distributors, Inc. from August 2007 to April 2010. |
| |
| Paul D. Pearson (born 1956) | | |
5228 Ameriprise Financial Center Minneapolis, MN 55474 Vice President and Assistant Treasurer (since 2011) | | Vice President, Investment Accounting, Columbia Management Investment Advisers, LLC, since May 2010; Vice President, Managed Assets, Investment Accounting, Ameriprise Financial Corporation. |
| |
| Paul B. Goucher (born 1968) | | |
5228 Ameriprise Financial Center Minneapolis, MN 55474 Vice President and Assistant Secretary (since 2010) | | Vice President and Chief Counsel of Ameriprise Financial since January 2010 (formerly Vice President and Group Counsel from November 2008 to January 2010); Director, Managing Director and General Counsel of J. & W. Seligman & Co. Incorporated (Seligman) from July 2008 to November 2008 and Managing Director and Associate General Counsel of Seligman from January 2005 to July 2008. |
| |
| Christopher O. Petersen (born 1970) | | |
5228 Ameriprise Financial Center Minneapolis, MN 55474 Vice President (since 2010) and Secretary (since 2011) | | Vice President and Chief Counsel, Ameriprise Financial since January 2010 (formerly Vice President and Group Counsel or Counsel from April 2004 to January 2010); Assistant Secretary of RiverSource Funds since January 2007; officer of Columbia Funds and affiliated funds since 2007. |
| |
| Michael E. DeFao (born 1968) | | |
225 Franklin Street Boston, MA 02110 Vice President and Assistant Secretary (since 2011) | | Vice President and Chief Counsel, Ameriprise Financial since May 2010; Associate General Counsel Bank of America from June 2005 to April 2010. |
37
Board Consideration and Approval of Advisory Agreement
On March 7, 2012, the Board of Trustees (the “Board”) and the Trustees who are not interested persons (as defined in the Investment Company Act of 1940) of the Trust (the “Independent Trustees”) unanimously approved the continuation of the Investment Management Services Agreement (the “Advisory Agreement”) with Columbia Management Investment Advisers, LLC (the “Investment Manager”) with respect to Columbia Value and Restructuring Fund (the “Fund”), a series of the Trust. As detailed below, the Advisory Fees and Expenses Committee (the “Committee”) and the Board met on multiple occasions to review and discuss, both among themselves and with the management team of the Investment Manager, materials provided by the Investment Manager before determining to approve the continuation of the Advisory Agreement.
In connection with their deliberations regarding the continuation of the Advisory Agreement, the Committee and the Board requested and evaluated materials from the Investment Manager regarding the Fund and the Advisory Agreement, and discussed these materials with representatives of the Investment Manager at the Committee meeting held on March 6, 2012 and at the Board meeting held on March 7, 2012. In addition, the Board considers matters bearing on the Agreement at most of its other meetings throughout the year and meets regularly with senior management of the Funds and the Investment Manager. Through the Board’s Investment Oversight Committees, Trustees also meet with selected Fund portfolio managers and other investment personnel at various times throughout the year. The Committee and the Board also consulted with Fund counsel and with the Independent Trustees’ independent legal counsel, who advised on the legal standard for consideration by the Board and otherwise assisted the Board in its deliberations. On March 6, 2012, the Committee recommended that the Board approve the continuation of the Advisory Agreement. On March 7, 2012, the Board, including the Independent Trustees, voting separately, unanimously approved the continuation of the Advisory Agreement for the Fund.
The Committee and the Board considered all information that they, their legal counsel, or the Investment Manager believed reasonably necessary to evaluate and to determine whether to approve the continuation of the Advisory Agreement. In their deliberations, the Trustees did not identify any particular information that was all-important or controlling, and individual Trustees may have attributed different weights to the various factors. The information and factors considered by the Committee and the Board in
recommending for approval or approving the continuation of the Advisory Agreement for the Fund included the following:
| n | | Information on the investment performance of the Fund relative to the performance of the Fund’s benchmarks and the performance of a group of comparable mutual funds, as determined by an independent third-party data provider; |
| n | | Information on the Fund’s advisory fees and total expenses, including information comparing the Fund’s expenses to those of a group of comparable mutual funds, as determined by an independent third-party data provider; |
| n | | The Investment Manager’s agreement to contractually limit or cap total operating expenses for the Fund so that total operating expenses (excluding certain fees and expenses, such as transaction costs and certain other investment related expenses, interest, taxes, acquired fund fees and expenses, and extraordinary expenses) would not exceed the median expenses of a group of comparable funds (as determined from time to time, generally annually, by an independent third-party data provider); |
| n | | The terms and conditions of the Advisory Agreement, including that the advisory fee rates payable by the Fund would not change; |
| n | | The terms and conditions of other agreements and arrangements with affiliates of the Investment Manager relating to the operations of the Fund, including the Administrative Services Agreement, the Distribution Agreement and the Transfer and Dividend Disbursing Agent Agreement, noting in the case of the Transfer and Dividend Disbursing Agent Agreement certain proposed changes to the fee rates payable thereunder; |
| n | | Descriptions of various functions performed by the Investment Manager under the Advisory Agreement, including portfolio management and portfolio trading practices; |
| n | | Information regarding the management fees and investment performance of any comparable portfolios of other clients of the Investment Manager, including institutional separate accounts; and |
| n | | The profitability to the Investment Manager and its affiliates from their relationships with the Fund. |
Nature, Extent and Quality of Services to be Provided under the Advisory Agreement
The Committee and the Board considered the nature, extent and quality of services provided to the Fund by the Investment Manager
38
and its affiliates under the Advisory Agreement and under separate agreements for the provision of transfer agency and administrative services, and the resources dedicated to the Fund and the other Columbia Funds by the Investment Manager and its affiliates. The Committee and the Board considered, among other things, the Investment Manager’s ability to attract, motivate and retain highly qualified research, advisory and supervisory investment professionals (including personnel and other resources, compensation programs for personnel involved in fund management, reputation and other attributes), the portfolio management services provided by those investment professionals, the quality of the Investment Manager’s investment research capabilities and trade execution services, and the other resources that the Investment Manager devotes to the Fund. The Committee and the Board also considered the potential benefits to shareholders of investing in a mutual fund that is part of a fund complex offering exposure to a variety of asset classes and investment disciplines and providing a variety of fund and shareholder services.
The Committee and the Board also considered the professional experience and qualifications of the senior personnel of the Investment Manager. The Committee and the Board noted the compliance programs of and the compliance-related resources provided to the Fund by the Investment Manager and its affiliates, and considered the Investment Manager’s ability to provide administrative services to the Fund pursuant to a separate administrative services agreement, including the Investment Manager’s ability to coordinate the activities of the Fund’s other service providers. After reviewing these and related factors, the Committee and the Board concluded, within the context of their overall conclusions, that the expected nature, extent and quality of the services to be provided to the Fund under the Advisory Agreement supported the continuation of such agreement.
Investment Performance
The Committee and the Board reviewed information about the performance of the Fund over various time periods, including performance information relative to benchmarks and information based on reports of an independent third-party data provider that compared the performance of the Fund to the performance of a group of comparable mutual funds. The Committee and the Board also reviewed a description of the third party’s methodology for identifying the Fund’s peer groups for purposes of performance and expense comparisons. In the case of each Fund whose performance lagged that of a relevant peer group for certain (although not necessarily all) periods, the Committee and the Board concluded that
other factors relevant to performance were sufficient, in light of other considerations, to warrant continuation of the Fund’s Advisory Agreement. Those factors varied from fund to fund, but included one or more of the following: (i) that the Fund’s performance, although lagging in certain recent periods, was stronger over the longer term; (ii) that the underperformance was attributable, to a significant extent, to investment decisions that were reasonable and consistent with the Fund’s investment strategy and policies and that the Fund was performing within a reasonable range of expectations, given those investment decisions, market conditions and the Fund’s investment strategy; (iii) that the Fund’s performance was competitive when compared to other relevant performance benchmarks or peer groups; and (iv) that the Investment Manager had taken or was taking steps designed to help improve the Fund’s investment performance, including, but not limited to, replacing portfolio managers, enhancing the resources supporting the portfolio managers, or modifying investment strategies.
The Committee and the Board noted that, through December 31, 2011, the Fund’s performance was in the ninety-third, twenty-second and forty-fifth percentiles (where the best performance would be in the first percentile) of its category selected by an independent third-party data provider for the purposes of performance comparisons for the one-, three- and five-year periods, respectively.
The Committee and the Board also considered the Investment Manager’s performance and reputation generally, the Investment Manager’s historical responsiveness to Board concerns about performance and the Investment Manager’s willingness to take steps intended to improve performance. After reviewing these and related factors, the Committee and the Board concluded, within the context of their overall conclusions regarding the Advisory Agreement, that the performance of the Fund and the Investment Manager was sufficient, in light of other considerations, to warrant the continuation of the Advisory Agreement.
Investment Advisory Fee Rates and Other Expenses
The Committee and the Board considered the advisory fees to be charged to the Fund under the Advisory Agreement as well as the total expenses to be incurred by the Fund. In assessing the reasonableness of the fees under the Advisory Agreement, the Committee and the Board considered, among other information, the Fund’s advisory fee and its expected total expense ratio as a percentage of average daily net assets. The Committee and the Board noted that the Fund’s actual management fee and total net
39
expense ratio are ranked in the third and second quintiles, respectively, against the Fund’s expense universe as determined by an independent third-party data provider for purposes of expense comparison. The Committee and the Board also took into account the fee waiver and expense limitation arrangements agreed to by the Investment Manager, as noted above.
The Committee and the Board also considered the fact that the advisory fee rates payable by the Fund to the Investment Manager under the Advisory Agreement were the same as those currently paid by the Fund to the Investment Manager.
The Committee and the Board also received and considered information about the advisory fees charged by the Investment Manager to institutional separate accounts. In considering the fees charged to those accounts, the Committee and the Board took into account, among other things, the Investment Manager’s representations about the differences between managing mutual funds as compared to other types of accounts, including differences in the services provided, differences in the risk profile of such business for the Investment Manager and the additional resources required to manage mutual funds effectively. In evaluating the Fund’s advisory fees, the Committee and the Board also took into account the demands, complexity and quality of the investment management of the Fund.
After reviewing these and related factors, the Committee and the Board concluded, within the context of their overall conclusions, that the advisory fee rates and expenses of the Fund supported the continuation of the Advisory Agreement.
Costs of Services to be Provided and Profitability
The Committee and the Board also took note of the costs of the services provided (both on an absolute and relative basis) and the profitability to the Investment Manager and its affiliates in connection with their relationships with the Fund. In evaluating these considerations, the Committee and the Board took note of the advisory fees charged by the Investment Manager to other clients, including fees charged by the Investment Manager to any institutional separate account clients with similar investment strategies to those of the Fund.
The Committee and the Board also considered the compensation directly or indirectly received by the Investment Manager’s affiliates in connection with their relationships with the Fund. The Committee and the Board reviewed information provided by management as to
the profitability of the Investment Manager and its affiliates of their relationships with the Fund, and information about the allocation of expenses used to calculate profitability. When reviewing profitability, the Committee and the Board also considered court cases in which adviser profitability was an issue in whole or in part, the performance of the fund, the expense ratio of the fund, and the implementation of expense limitations with respect to the fund. The Committee and the Board also considered information provided by the Investment Manager regarding its financial condition and comparing its profitability to that of other asset management firms that are, or are subsidiaries of, publicly traded companies.
After reviewing these and related factors, the Committee and the Board concluded, within the context of their overall conclusions, that the profitability to the Investment Manager and its affiliates from their relationships with the Fund supported the continuation of the Advisory Agreement.
Economies of Scale
The Committee and the Board considered the potential existence of economies of scale in the provision by the Investment Manager of services to the Fund, to groups of related funds, and to the Investment Manager’s investment advisory clients as a whole, and whether those economies of scale were shared with the Fund through breakpoints in investment advisory fees or other means, such as expense limitation arrangements and additional investments by the Investment Manager in investment, trading and compliance resources. The Committee and the Board noted that the investment advisory fee schedules for the Fund contained breakpoints that would reduce the fee rate on assets above specified threshold levels.
In considering these issues, the Committee and the Board also considered the costs of the services provided (both on an absolute and relative basis) and the profitability to the Investment Manager and its affiliates from their relationships with the Fund, as discussed above. After reviewing these and related factors, the Committee and the Board concluded, within the context of their overall conclusions, that the extent to which economies of scale were expected to be shared with the Fund supported the continuation of the Advisory Agreement.
Other Benefits to the Investment Manager
The Committee and the Board received and considered information regarding “fall-out” or ancillary benefits received by the Investment Manager and its affiliates as a result of their relationships with the Fund, such as the engagement of the Investment Manager to provide
40
administrative services to the Fund and the engagement of the Investment Manager’s affiliates to provide distribution and transfer agency services to the Fund. The Committee and the Board considered that the Fund’s distributor retains a portion of the distribution fees from the Fund and receives a portion of the sales charges on sales or redemptions of certain classes of shares of the Fund. The Committee and the Board also considered the benefits of research made available to the Investment Manager by reason of brokerage commissions generated by the Fund’s securities transactions, and reviewed information about the Investment Manager’s practices with respect to allocating portfolio brokerage for brokerage and research services. The Committee and the Board considered the possible conflicts of interest associated with certain fall-out or other ancillary benefits and the reporting, disclosure and other processes that would be in place to address such possible
conflicts of interest. The Committee and the Board recognized that the Investment Manager’s profitability would be somewhat lower without these benefits.
Conclusion
The Committee and the Board reviewed all of the above considerations in reaching their decisions to recommend or approve the continuation of the Advisory Agreement. No single item was identified as paramount or controlling, and individual Trustees may have attributed different weights to various factors. Based on their evaluation of all factors that they deemed to be material, including those factors described above, and assisted by the advice of independent legal counsel, the Board, including the Independent Trustees, voting separately, unanimously approved the continuation of the Advisory Agreement.
41
[THIS PAGE INTENTIONALLY LEFT BLANK]
42
[THIS PAGE INTENTIONALLY LEFT BLANK]
43
[THIS PAGE INTENTIONALLY LEFT BLANK]
44
Important Information About This Report
The fund mails one shareholder report to each shareholder address. If you would like more than one report, please call shareholder services at 1-800-345-6611 and additional reports will be sent to you. This report has been prepared for shareholders of Columbia Value and Restructuring Fund.
A description of the policies and procedures that the fund uses to determine how to vote proxies and a copy of the fund’s voting records are available (i) at www.columbiamanagement.com, (ii) on the Securities and Exchange Commission’s website at www.sec.gov, and (iii) without charge, upon request, by calling 1-800-368-0346. Information regarding how the fund voted proxies relating to portfolio securities during the 12-month period ended June 30 is available from the SEC’s website. Information regarding how the fund voted proxies relating to portfolio securities is also available from the fund’s website, www.columbiamanagement.com.
The fund files a complete schedule of portfolio holdings with the SEC for the first and third quarters of each fiscal year on Form N-Q. The fund’s Form N-Q is available on the SEC’s website at www.sec.gov and may be reviewed and copied at the SEC’s Public Reference Room in Washington, D.C. Information on the operation of the Public Reference Room may be obtained by calling
1-800-SEC-0330.
Transfer Agent
Columbia Management Investment Services Corp.
P.O. Box 8081
Boston, MA 02266-8081
1-800-345-6611
Distributor
Columbia Management Investment
Distributors, Inc.
225 Franklin Street Boston, MA 02110
Investment Manager
Columbia Management Investment Advisers, LLC
225 Franklin Street Boston, MA 02110
45

Columbia Value and Restructuring Fund
P.O. Box 8081
Boston, MA 02266-8081
columbiamanagement.com
This information is for use with concurrent or prior delivery of a fund prospectus. Investors should consider the investment objectives, risks, charges and expenses of a mutual fund carefully before investing. For a free prospectus, which contains this and other important information about the funds, visit columbiamanagement.com. Read the prospectus carefully before investing. The Fund is distributed by Columbia Management Investment Distributors, Inc., member FINRA, and managed by Columbia Management Investment Advisers, LLC.
©2012 Columbia Management Investment Advisers, LLC. All rights reserved.
C-1201 C (5/12)
Item 2. Code of Ethics.
(a) The registrant has adopted a code of ethics that applies to the registrant’s principal executive officer, principal financial officer, principal accounting officer or controller, or persons performing similar functions, regardless of whether these individuals are employed by the registrant or a third party.
(b) During the period covered by this report, there were not any amendments to a provision of the code of ethics adopted in 2(a) above.
(c) During the period covered by this report, there were no waivers, including any implicit waivers, from a provision of the code of ethics described in 2(a) above that relates to one or more of the items set forth in paragraph (b) of this item’s instructions.
Item 3. Audit Committee Financial Expert.
The registrant’s Board of Trustees has determined that Douglas A. Hacker, David M. Moffett and Anne-Lee Verville, each of whom are members of the registrant’s Board of Trustees and Audit Committee, each qualify as an audit committee financial expert. Mr. Hacker, Mr. Moffett and Ms. Verville are each independent trustees, as defined in paragraph (a)(2) of this item’s instructions.
Item 4. Principal Accountant Fees and Services.
Fee information below is disclosed for the six series of the registrant whose report to stockholders are included in this annual filing. Fee information for fiscal year ended March 31, 2011 also includes fees for four series that merged during the period and four series that changed their fiscal year end from March 31 to April 30 in 2012.
(a) Audit Fees. Aggregate Audit Fees billed by the principal accountant for professional services rendered during the fiscal years ended March 31, 2012 and March 31, 2011 are approximately as follows:
2012 | | 2011 | |
$ | 172,200 | | $ | 335,000 | |
| | | | | |
Audit Fees include amounts related to the audit of the registrant’s annual financial statements or services that are normally provided by the accountant in connection with statutory and regulatory filings or engagements for those fiscal years. Fiscal year 2011 also includes audit fees for the review and provision of consent in connection with filing Form N-1A for new share classes.
(b) Audit-Related Fees. Aggregate Audit-Related Fees billed to the registrant by the principal accountant for professional services rendered during the fiscal years ended March 31, 2012 and March 31, 2011 are approximately as follows:
2012 | | 2011 | |
$ | 41,800 | | $ | 97,300 | |
| | | | | |
Audit-Related Fees include amounts for assurance and related services by the principal accountant that are reasonably related to the performance of the audit of the registrant’s financial statements and are not reported in Audit Fees above. In both fiscal years 2012 and 2011, Audit-Related Fees consist of agreed-upon procedures performed for semi-annual shareholder reports and agreed- upon procedures related to fund mergers. Fiscal year 2012 also includes Audit-Related Fees for agreed-upon procedures for fund accounting and custody conversions.
During the fiscal years ended March 31, 2012 and March 31, 2011, there were no Audit-Related Fees billed by the registrant’s principal accountant to the registrant’s investment adviser (not including any sub-adviser whose role is primarily portfolio management and is subcontracted with or overseen by another investment adviser) and any entity controlling, controlled by, or under common control with the adviser that provides ongoing services to the registrant for an engagement that related directly to the operations and financial reporting of the registrant.
(c) Tax Fees. Aggregate Tax Fees billed by the principal accountant to the registrant for professional services rendered during the fiscal years ended March 31, 2012 and March 31, 2011 are approximately as follows:
2012 | | 2011 | |
$ | 39,300 | | $ | 90,100 | |
| | | | | |
Tax Fees include amounts for the review of annual tax returns, the review of required shareholder distribution calculations and typically include amounts for professional services by the principal accountant for tax compliance, tax advice and tax planning. In fiscal year 2011, Tax Fees also include agreed-upon procedures related to fund mergers and the review of final tax returns.
During the fiscal years ended March 31, 2012 and March 31, 2011, there were no Tax Fees billed by the registrant’s principal accountant to the registrant’s investment adviser (not including any sub-adviser whose role is primarily portfolio management and is
subcontracted with or overseen by another investment adviser) and any entity controlling, controlled by, or under common control with the adviser that provides ongoing services to the registrant for an engagement that related directly to the operations and financial reporting of the registrant.
(d) All Other Fees. Aggregate All Other Fees billed by the principal accountant to the registrant for professional services rendered during the fiscal years ended March 31, 2012 and March 31, 2011 are approximately as follows:
All Other Fees include amounts for products and services provided by the principal accountant, other than the services reported in paragraphs (a) through (c) above.
Aggregate All Other Fees billed by the registrant’s principal accountant to the registrant’s investment adviser (not including any sub-adviser whose role is primarily portfolio management and is subcontracted with or overseen by another investment adviser) and any entity controlling, controlled by, or under common control with the adviser that provides ongoing services to the registrant for an engagement that related directly to the operations and financial reporting of the registrant during the fiscal years ended March 31, 2012 and March 31, 2011 are approximately as follows:
2012 | | 2011 | |
$ | 395,800 | | $ | 495,300 | |
| | | | | |
In both fiscal years 2012 and 2011, All Other Fees consist of fees billed for internal control examinations of the registrant’s transfer agent and investment advisor.
(e)(1) Audit Committee Pre-Approval Policies and Procedures
The registrant’s Audit Committee is required to pre-approve the engagement of the registrant’s independent accountants to provide audit and non-audit services to the registrant and non-audit services to its investment adviser (not including any sub-adviser whose role is primarily portfolio management and is subcontracted with or overseen by another investment adviser) or any entity controlling, controlled by or under common control with such investment adviser that provides ongoing services to the registrant (“Adviser Affiliates”), if the engagement relates directly to the operations and financial reporting of the registrant.
The Audit Committee has adopted a Policy for Engagement of Independent Accountants for Audit and Non-Audit Services (“Policy”). The Policy sets forth the understanding of the Audit Committee regarding the engagement of the registrant’s independent accountants to provide (i) audit and permissible audit-related, tax and other services to the registrant (collectively “Fund Services”); (ii) non-audit services to the registrant’s investment adviser (not including any sub-adviser whose role is primarily portfolio
management and is subcontracted with or overseen by another investment adviser) and Adviser Affiliates, if the engagement relates directly to the operations or financial reporting of a Fund (collectively “Fund-related Adviser Services”); and (iii) certain other audit and non-audit services to the registrant’s investment adviser (not including any sub-adviser whose role is primarily portfolio management and is subcontracted with or overseen by another investment adviser) and Adviser Affiliates. As set forth in this Fund Policy, a service will require specific pre-approval by the Audit Committee if it is to be provided by the Fund’s independent auditor; provided, however, that pre-approval of non-audit services to the Fund, the Adviser or Control Affiliates may be waived if certain de minimis requirements set forth in the SEC’s rules are met.
Under the Policy, the Audit Committee may delegate pre-approval authority to any pre-designated member or members who are Independent Trustees/Directors. The member(s) to whom such authority is delegated must report, for informational purposes only, any pre-approval decisions to the Audit Committee at its next regular meeting. The Audit Committee’s responsibilities with respect to the pre-approval of services performed by the independent accountants may not be delegated to management.
On an annual basis, at a regularly scheduled Audit Committee meeting, the Fund’s Treasurer or other Fund Officer shall submit to the Audit Committee a schedule of the types of Fund Services and Fund-related Adviser Services that are subject to specific pre-approval.
This schedule will provide a description of each type of service that is subject to specific pre-approval, along with total projected fees for each service. The pre-approval will generally cover a one-year period. The Audit Committee will review and approve the types of services and the projected fees for the next one-year period and may add to, or subtract from, the list of pre-approved services from time to time, based on subsequent determinations. This specific approval acknowledges that the Audit Committee is in agreement with the types of services that the independent accountants will be permitted to perform.
The Fund’s Treasurer or other Fund Officer shall report to the Audit Committee at each of its regular meetings regarding all Fund Services or Fund-related Adviser Services initiated since the last such report was rendered, including a general description of the services with forecasted fees for the annual period, proposed changes requiring specific pre-approval and a description of services provided by the independent auditor with actual fees during the current reporting period.
*****
(e)(2) The percentage of services described in paragraphs (b) through (d) of this Item approved pursuant to the “de minimis” exception under paragraph (c)(7)(i)(C) of Rule 2-01 of Regulation S-X during both fiscal years ended March 31, 2012 and March 31, 2011 was zero.
(f) Not applicable.
(g) The aggregate non-audit fees billed by the registrant’s accountant for services rendered to the registrant, and rendered to the registrant’s investment adviser (not including any sub-adviser whose role is primarily portfolio management and is subcontracted with or overseen by another investment adviser), and any entity controlling, controlled by, or under common control with the adviser that provides ongoing services to the registrant for the fiscal years ended March 31, 2012 and March 31, 2011 are approximately as follows:
2012 | | 2011 | |
$ | 476,900 | | $ | 682,700 | |
| | | | | |
(h) The registrant’s Audit Committee of the Board of Directors has considered whether the provision of non-audit services that were rendered to the registrant’s adviser (not including any sub-adviser whose role is primarily portfolio management and is subcontracted with or overseen by another investment adviser), and any entity controlling, controlled by, or under common control with the investment adviser that provides ongoing services to the registrant that were not pre-approved pursuant to paragraph (c)(7)(ii) of Rule 2-01 of Regulation S-X, is compatible with maintaining the principal accountant’s independence.
Item 5. Audit Committee of Listed Registrants.
Not applicable.
Item 6. Investments
(a) The registrant’s “Schedule I — Investments in securities of unaffiliated issuers” (as set forth in 17 CFR 210.12-12) is included in Item 1 of this Form N-CSR.
(b) Not applicable.
Item 7. Disclosure of Proxy Voting Policies and Procedures for Closed-End Management Investment Companies.
Not applicable.
Item 8. Portfolio Managers of Closed-End Management Investment Companies.
Not applicable.
Item 9. Purchases of Equity Securities by Closed-End Management Investment Company and Affiliated Purchasers.
Not applicable.
Item 10. Submission of Matters to a Vote of Security Holders.
There were no material changes to the procedures by which shareholders may recommend nominees to the registrant’s board of directors.
Item 11. Controls and Procedures.
(a) The registrant’s principal executive officer and principal financial officers, based on their evaluation of the registrant’s disclosure controls and procedures as of a date within 90 days of the filing of this report, have concluded that such controls and procedures are adequately designed to ensure that material information required to be disclosed by the registrant in Form N-CSR is accumulated and communicated to the registrant’s management, including the principal executive officer and principal financial officer, or persons performing similar functions, as appropriate to allow timely decisions regarding required disclosure.
(b) There was no change in the registrant’s internal control over financial reporting that occurred during the registrant’s second fiscal quarter of the period covered by this report that has materially affected, or is reasonably likely to materially affect, the registrant’s internal control over financial reporting.
Item 12. Exhibits.
(a)(1) Code of ethics required to be disclosed under Item 2 of Form N-CSR attached hereto as Exhibit 99.CODE ETH.
(a)(2) Certifications pursuant to Rule 30a-2(a) under the Investment Company Act of 1940 (17 CFR 270.30a-2(a)) attached hereto as Exhibit 99.CERT.
(a)(3) Not applicable.
(b) Certification pursuant to Rule 30a-2(b) under the Investment Company Act of 1940 (17 CFR 270.30a-2(b)) attached hereto as Exhibit 99.906CERT.
SIGNATURES
Pursuant to the requirements of the Securities Exchange Act of 1934 and the Investment Company Act of 1940, the registrant has duly caused this report to be signed on its behalf by the undersigned, thereunto duly authorized.
(registrant) | | Columbia Funds Series Trust I | |
| | |
| | |
By (Signature and Title) | | /s/ J. Kevin Connaughton | |
| J. Kevin Connaughton, President and Principal Executive Officer | |
| | |
| | |
Date | | May 23, 2012 | |
| | | | | |
Pursuant to the requirements of the Securities Exchange Act of 1934 and the Investment Company Act of 1940, this report has been signed below by the following persons on behalf of the registrant and in the capacities and on the dates indicated.
By (Signature and Title) | | /s/ J. Kevin Connaughton | |
| J. Kevin Connaughton, President and Principal Executive Officer | |
| | |
| | |
Date | | May 23, 2012 | |
| | |
| | |
By (Signature and Title) | | /s/ Michael G. Clarke | |
| Michael G. Clarke, Treasurer and Chief Financial Officer | |
| | |
| | |
Date | | May 23, 2012 | |
| | | | | |


