UNITED STATES
SECURITIES AND EXCHANGE COMMISSION
Washington, D.C. 20549
FORM N-CSR
CERTIFIED SHAREHOLDER REPORT OF REGISTERED
MANAGEMENT INVESTMENT COMPANIES
Investment Company Act file number 811-04367
Columbia Funds Series Trust I
(Exact name of registrant as specified in charter)
225 Franklin Street, Boston, Massachusetts 02110
(Address of principal executive offices) (Zip code)
Scott R. Plummer
5228 Ameriprise Financial Center
Minneapolis, MN 55474
(Name and address of agent for service)
Registrant’s telephone number, including area code: 1-612-671-1947
Date of fiscal year end: December 31
Date of reporting period: December 31, 2011
Form N-CSR is to be used by management investment companies to file reports with the Commission not later than 10 days after the transmission to stockholders of any report that is required to be transmitted to stockholders under Rule 30e-1 under the Investment Company Act of 1940 (17 CFR 270.30e-1). The Commission may use the information provided on Form N-CSR in its regulatory, disclosure review, inspection, and policymaking roles.
A registrant is required to disclose the information specified by Form N-CSR, and the Commission will make this information public. A registrant is not required to respond to the collection of information contained in Form N-CSR unless the Form displays a currently valid Office of Management and Budget (“OMB”) control number. Please direct comments concerning the accuracy of the information collection burden estimate and any suggestions for reducing the burden to Secretary, Securities and Exchange Commission, 450 Fifth Street, NW, Washington, DC 20549-0609. The OMB has reviewed this collection of information under the clearance requirements of 44 U.S.C. § 3507.
Item 1. Reports to Stockholders.

Columbia Real Estate Equity Fund
Annual Report for the Period Ended December 31, 2011
Table of contents
The views expressed in this report reflect the current views of the respective parties. These views are not guarantees of future performance and involve certain risks, uncertainties and assumptions that are difficult to predict, so actual outcomes and results may differ significantly from the views expressed. These views are subject to change at any time based upon economic, market or other conditions and the respective parties disclaim any responsibility to update such views. These views may not be relied on as investment advice and, because investment decisions for a Columbia Fund are based on numerous factors, may not be relied on as an indication of trading intent on behalf of any particular Columbia Fund. References to specific securities should not be construed as a recommendation or investment advice.
President’s Message

Dear Shareholders,
Americans were dispirited in the fourth quarter of 2011 by Washington’s inability to reach a plan for deficit reduction and Europe’s piecemeal attempt to address its own fiscal issues. Yet, there was sufficient good news to encourage risk taking, buoying both stocks and bonds to solid gains.
U.S. economic data surprised on the upside and fears of recession abated. With the bar of expectations set low, investors responded positively to the announcement that the economy had expanded by 1.8% in the third quarter. Consumer confidence improved, even though consumers remain under pressure with no real increase in disposable income and a continued decline in household net worth. Headline inflation — which tracks a broad range of consumer expenditures, including food and energy — declined. Even manufacturing held its ground.
Against this backdrop, the U.S. equity markets logged solid
returns. The S&P 500 Index gained 11.82%, moving into positive territory for the year with quarterly advances in all ten sectors. Mid- and small-cap stocks did even better. Value outperformed growth across all market capitalizations. Energy stocks led the market, as the price of oil moved above $100 a barrel in December. Industrials and materials stocks rose, buoyed by improving economic data. The U.S. fixed-income markets logged modest but solid returns. High-yield bonds were the best performers as the economy showed signs of improvement. Emerging market bonds were strong performers, as inflation came under control in key regions. Municipal bonds and Treasuries eked out only modest gains, as investors moved away from quality in favor of riskier assets.
While fourth quarter gains were encouraging, challenges still remain. Columbia Management, however, remains strong and steadfast. Columbia Management is the eighth largest manager of long-term mutual fund assets with $326 billion under management as of December 31, 2011. The past year has been one of considerable change for the organization as we worked diligently to align products, services and resources in the integration of Columbia Management with RiverSource Investments. The strong line-up of talent, resources and capabilities that has resulted is highlighted by the success of our products. As of December 31, 2011, Columbia Management offers 52 funds rated either 4 or 5 stars by Morningstar.*
For more information about these and other funds offered by Columbia Management, including detailed, up-to-date fund performance and portfolio information, please visit us online at columbiamanagement.com. Other information and resources available on our website include:
| n | | timely economic analysis and market commentary |
| n | | quarterly fund commentaries |
| n | | Columbia Management Investor, a quarterly newsletter for shareholders |
Thank you for your continued support of the Columbia Funds. We look forward to serving your investment needs for many years to come.
Best Regards,

J. Kevin Connaughton
President, Columbia Funds
* All ratings are based on Class Z shares as of 12/31/2011. Out of 119 Class Z share Columbia funds rated by Morningstar, 7 funds received a 5-star Overall Rating and 45 funds received a 4-star Overall Rating. The Overall Morningstar Rating for a retail mutual fund is derived from a weighted average of the performance figures associated with its 3-, 5- and 10-year (if applicable) Morningstar Rating metrics. For share classes that do not have a 3-, 5-, or 10-year actual performance history, the fund’s independent Morningstar Rating metric is then compared against the retail mutual fund universe breakpoints to determine its hypothetical rating.
For each fund with at least a three-year history, Morningstar calculates a Morningstar RatingTM based on a Morningstar Risk-Adjusted Return measure that accounts for variation in a fund’s monthly performance (including the effects of sales charges/loads, and redemption fees), placing more emphasis on downward variations and rewarding consistent performance. The top 10% of funds in each category receive 5 stars, the next 22.5% receive 4 stars, the next 35% receive 3 stars, the next 22.5% receive 2 stars and the bottom 10% receive 1 star. (Each share class is counted as a fraction of one fund within this scale and rated separately, which may cause slight variations in the distribution percentages.)
The Morningstar RatingTM is for Class Z shares only; other classes may have different performance characteristics and may have different ratings. ©2012 Morningstar, Inc. All Rights Reserved. The Morningstar information contained herein: (1) is proprietary to Morningstar and/or its content providers; (2) may not be copied or distributed; and (3) is not warranted to be accurate, complete or timely. Neither Morningstar nor its content providers are responsible for any damages or losses arising from any use of this information.
Investors should consider the investment objectives, risks, charges and expenses of a mutual fund carefully before investing. For a free prospectus, which contains this and other important information about the funds, visit columbiamanagement.com. The prospectus should be read carefully before investing.
Columbia Funds are distributed by Columbia Management Investment Distributors, Inc., member FINRA, and managed by Columbia Management Investment Advisers, LLC.
© 2012 Columbia Management Investment Advisers, LLC. All rights reserved.
Fund Profile – Columbia Real Estate Equity Fund
Summary
| n | | For the 12-month period that ended December 31, 2011, the fund’s Class A shares returned 6.59% without sales charge. |
| n | | The fund lagged its benchmark, the FTSE NAREIT Equity REITs Index.1 |
| n | | Security selection among diversified real estate investment trusts and apartments tended to hold back relative performance, despite good performance by holdings in office, industrial and health care properties. |
Portfolio Management
Arthur Hurley has managed the fund since September 2006 and has been associated with the advisor since May 2010. Prior to joining the advisor, Mr. Hurley was associated with the fund’s previous advisor or its predecessors since 2006.
| 1 | The FTSE National Association of Real Estate Investment Trusts (NAREIT) Equity REITs Index reflects performance of all publicly traded equity real estate investment trusts (REITs) other than those designated as timber REITs. |
| 2 | The FTSE National Association of Real Estate Investment Trusts (NAREIT) All Equity REITs Index reflects performance of all publicly traded equity real estate investment trusts (REITs), including timber REITs. Effective May 31, 2011, the FTSE NAREIT Equity REITs Index replaced the FTSE NAREIT All Equity REITs Index as the fund’s benchmark because the advisor believes that the FTSE NAREIT Equity REITs Index is more representative of the investment approach used to manage the fund. |
Indices are not available for investment, are not professionally managed and do not reflect sales charges, fees, brokerage commissions, taxes or other expenses of investing. Securities in the fund may not match those in an index.
Performance data quoted represents past performance and current performance may be lower or higher. Past performance is no guarantee of future results. The investment return and principal value will fluctuate so that shares, when redeemed, may be worth more or less than the original cost. Please visit www.columbiamanagement.com for daily and most recent month-end performance updates.
Summary
1-year return as of 12/31/11
| | |
| |
 | | +6.59% Class A shares (without sales charge) |
| |
| | +8.29% FTSE NAREIT Equity REITs Index |
| |
| | +8.28% FTSE NAREIT All Equity REITs Index2 |
1
Performance Information – Columbia Real Estate Equity Fund
Performance data quoted represents past performance and current performance may be lower or higher. Past performance is no guarantee of future results. The investment return and principal value will fluctuate so that shares, when redeemed, may be worth more or less than the original cost. Please visit www.columbiamanagement.com for daily and most recent month-end performance updates.
|
| Performance of a $10,000 investment 01/01/02 – 12/31/11 |
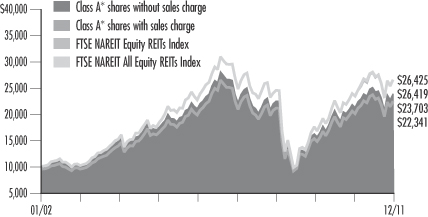
The chart above shows the change in value of a hypothetical $10,000 investment in Class A shares of Columbia Real Estate Equity Fund during the stated time period, and does not reflect the deduction of taxes that a shareholder may pay on fund distributions or on the redemption of fund shares.
| | | | | | | | |
| Performance of a $10,000 investment 01/01/02 – 12/31/11 | |
| | |
| Sales charge | | without | | | with | |
Class A* | | | 23,703 | | | | 22,341 | |
Class B* | | | 22,015 | | | | 22,015 | |
Class C* | | | 22,041 | | | | 22,041 | |
Class I* | | | 24,431 | | | | n/a | |
Class R* | | | 22,676 | | | | n/a | |
Class R4* | | | 24,101 | | | | n/a | |
Class R5* | | | 24,396 | | | | n/a | |
Class W* | | | 23,871 | | | | n/a | |
Class Z | | | 24,338 | | | | n/a | |
| | | | | | | | | | | | | | | | | | | | | | | | | | | | | | | | | | | | | | | | | | | | | | | | |
| Average annual total return as of 12/31/11 (%) | |
| Share class | | A* | | | B* | | | C* | | | I* | | | R* | | | R4* | | | R5* | | | W* | | | Z | |
| Inception | | 11/01/02 | | | 11/01/02 | | | 10/13/03 | | | 9/27/10 | | | 9/27/10 | | | 03/07/11 | | | 03/07/11 | | | 9/27/10 | | | 04/01/94 | |
| Sales charge | | without | | | with | | | without | | | with | | | without | | | with | | | without | | | without | | | without | | | without | | | without | | | without | |
1-year | | | 6.59 | | | | 0.44 | | | | 5.76 | | | | 0.76 | | | | 5.77 | | | | 4.77 | | | | 7.19 | | | | 6.25 | | | | 6.74 | | | | 6.99 | | | | 6.58 | | | | 6.73 | |
5-year | | | –1.75 | | | | –2.90 | | | | –2.48 | | | | –2.69 | | | | –2.49 | | | | –2.49 | | | | –1.45 | | | | –2.19 | | | | –1.61 | | | | –1.47 | | | | –1.71 | | | | –1.52 | |
10-year | | | 9.01 | | | | 8.37 | | | | 8.21 | | | | 8.21 | | | | 8.22 | | | | 8.22 | | | | 9.34 | | | | 8.53 | | | | 9.20 | | | | 9.33 | | | | 9.09 | | | | 9.30 | |
The “with sales charge” returns include the maximum initial sales charge of 5.75% for Class A shares and the applicable contingent deferred sales charge of 5.00% in the first year, declining to 1.00% in the sixth year, and eliminated thereafter for Class B shares and 1.00% for Class C shares in the first year only. The “without sales charge” returns do not include the effect of sales charges. If they had, returns would be lower.
Performance results reflect any fee waivers or reimbursements of fund expenses by the Investment Manager and/or any of its affiliates. Absent these fee waivers or expense reimbursement arrangements, performance results would have been lower.
All results shown assume reinvestment of distributions. Class I, Class R4, Class R5 and Class Z shares are sold at net asset value with no distribution and service (Rule 12b-1) fees. Class R shares are sold at net asset value with a distribution fee. Class W shares are sold at net asset value with a service (Rule 12b-1) fee. Class I, Class R, Class R4, Class R5, Class W and Class Z shares have limited eligibility and the investment minimum requirements may vary. Please see the fund’s prospectuses for details. Performance for different share classes will vary based on differences in sales charges and fees associated with each class.
The tables do not reflect the deduction of taxes that a shareholder may pay on fund distributions or on the redemption of fund shares.
| * | The returns shown for periods prior to the share class inception date (including returns since inception, which are since fund inception) include the returns of the fund’s oldest share class. These returns are adjusted to reflect any higher class-related operating expenses of the newer share classes, as applicable. Please visit columbiamanagement.com/mutual-funds/appended-performance for more information. |
2
Understanding Your Expenses – Columbia Real Estate Equity Fund
As a shareholder, you incur two types of costs. There are transaction costs, which generally include sales charges on purchases and may include redemption fees. There are also ongoing costs, which generally include management fees, distribution and service (Rule 12b-1) fees, and other fund expenses. The following information is intended to help you understand your ongoing costs (in dollars) of investing in the Fund and to compare these costs with the ongoing costs of investing in other mutual funds.
Analyzing your fund’s expenses
To illustrate these ongoing costs, we provided examples and calculated the expenses paid by investors in each share class of the Fund during the period. The information in the table is based on an initial investment of $1,000 at the beginning of the period indicated and held for the entire period. Expense information is calculated two ways and each method provides you with different information. The amount listed in the “Actual” column is calculated using the Fund’s actual operating expenses and total return for the period. You may use the Actual information, together with the amount invested, to estimate the expenses that you paid over the period. Simply divide your account value by $1,000 (for example, an $8,600 account value divided by $1,000 = 8.6), then multiply the results by the expenses paid during the period under the Actual column. The amount listed in the “Hypothetical” column assumes a 5% annual rate of return before expenses (which is not the Fund’s actual return) and then applies the Fund’s actual expense ratio for the period to the hypothetical return. You should not use the hypothetical account values and expenses to estimate either your actual account balance at the end of the period or the expenses you paid during the period. See the “Compare with other funds” information with details on using the hypothetical data.
Compare with other funds
Since all mutual funds are required to include the same hypothetical calculations about expenses in shareholder reports, you can use this information to compare the ongoing cost of investing in the Fund with other funds. To do so, compare the hypothetical example with the 5% hypothetical examples that appear in the shareholder reports of other funds. As you compare hypothetical examples of other funds, it is important to note that hypothetical examples are meant to highlight the ongoing costs of investing in a fund only and do not reflect any transaction costs, such as sales charges, or redemption or exchange fees. Therefore, the hypothetical calculations are useful in comparing ongoing costs only, and will not help you determine the relative total costs of owning different funds. If transaction costs were included in these calculations, your costs would have been higher.
| | | | | | | | | | | | | | | | | | | | | | | | | | | | |
| 07/01/11 – 12/31/11 | |
| | | | |
| | | Account value at the
beginning of the period ($) | | | Account value at the
end of the period ($) | | | Expenses paid
during the period ($) | | | Fund’s annualized
expense ratio (%) | |
| | | Actual | | | Hypothetical | | | Actual | | | Hypothetical | | | Actual | | | Hypothetical | | | Actual | |
Class A | | | 1,000.00 | | | | 1,000.00 | | | | 984.10 | | | | 1,018.75 | | | | 6.27 | | | | 6.38 | | | | 1.26 | |
Class B | | | 1,000.00 | | | | 1,000.00 | | | | 979.50 | | | | 1,014.84 | | | | 10.12 | | | | 10.30 | | | | 2.04 | |
Class C | | | 1,000.00 | | | | 1,000.00 | | | | 979.40 | | | | 1,014.94 | | | | 10.02 | | | | 10.20 | | | | 2.02 | |
Class I | | | 1,000.00 | | | | 1,000.00 | | | | 986.80 | | | | 1,021.11 | | | | 3.93 | | | | 4.00 | | | | 0.79 | |
Class R | | | 1,000.00 | | | | 1,000.00 | | | | 981.40 | | | | 1,017.50 | | | | 7.50 | | | | 7.64 | | | | 1.51 | |
Class R4 | | | 1,000.00 | | | | 1,000.00 | | | | 984.50 | | | | 1,019.60 | | | | 5.42 | | | | 5.52 | | | | 1.09 | |
Class R5 | | | 1,000.00 | | | | 1,000.00 | | | | 985.40 | | | | 1,021.16 | | | | 3.88 | | | | 3.95 | | | | 0.78 | |
Class W | | | 1,000.00 | | | | 1,000.00 | | | | 983.20 | | | | 1,018.75 | | | | 6.26 | | | | 6.38 | | | | 1.26 | |
Class Z | | | 1,000.00 | | | | 1,000.00 | | | | 984.30 | | | | 1,020.00 | | | | 5.02 | | | | 5.11 | | | | 1.01 | |
Expenses paid during the period are equal to the annualized expense ratio for each class as indicated above, multiplied by the average account value over the period and then multiplied by the number of days in the Fund’s most recent fiscal half year and divided by 365.
Expenses do not include fees and expenses incurred indirectly by the Fund from the underlying funds in which the Fund may invest (also referred to as “acquired funds”), including affiliated and non-affiliated pooled investments vehicles (including mutual funds and exchange traded funds).
Had Columbia Management Investment Advisers, LLC and/or certain of its affiliates not waived/reimbursed certain fees and expenses, account value at the end of the period would have been reduced.
3
Portfolio Manager’s Report – Columbia Real Estate Equity Fund
Performance data quoted represents past performance and current performance may be lower or higher. Past performance is no guarantee of future results. The investment return and principal value will fluctuate so that shares, when redeemed, may be worth more or less than the original cost. Please visit www.columbiamanagement.com for daily and most recent month-end performance updates.
| | | | |
| Net asset value per share | |
| |
as of 12/31/11 ($) | | | | |
Class A | | | 12.69 | |
Class B | | | 12.71 | |
Class C | | | 12.68 | |
Class I | | | 12.72 | |
Class R | | | 12.67 | |
Class R4 | | | 12.72 | |
Class R5 | | | 12.71 | |
Class W | | | 12.69 | |
Class Z | | | 12.70 | |
| | | | |
| Distributions declared per share | |
| |
01/01/11 – 12/31/11 ($) | | | | |
Class A | | | 0.51 | |
Class B | | | 0.41 | |
Class C | | | 0.41 | |
Class I | | | 0.56 | |
Class R | | | 0.48 | |
Class R4 | | | 0.52 | |
Class R5 | | | 0.56 | |
Class W | | | 0.51 | |
Class Z | | | 0.54 | |
For the 12-month period that ended December 31, 2011, the fund’s Class A shares returned 6.59% without sales charge. The fund’s benchmark, the FTSE NAREIT Equity REITs Index, returned 8.29%. While real estate benchmarks outpaced broader benchmarks for equities, the 12-month period saw extraordinary volatility. In the third calendar quarter alone, the benchmark FTSE index experienced three separate moves of more than 15% in gains or losses. These dramatic fluctuations in market prices occurred as a variety of worries about the general health of the economy weighed on investors’ minds. These concerns sometimes overrode evidence of improving business prospects in the real estate industry and generally cautiously optimistic outlooks by management.
Economic prospects brightened in second half of 2011
A series of natural disasters in Japan, Europe’s debt problems and wrangling in Washington over the federal budget and the national debt dominated the headlines in the first half of the year. Economic news was lackluster and job growth was disappointing. However, the pace of U.S. economic growth picked up in the second half of the year and as fears of a lapse back into recession faded, prospects brightened. Consumer confidence improved even though consumers remained under pressure, with no real increase in disposable income and a continued decline in household net worth. The labor markets added 420,000 new jobs in the fourth quarter of the year, and the jobless rate fell to 8.5%. Headline inflation — which tracks a broad range of consumer expenditures, including food and energy — declined. Even manufacturing held its ground. A third-quarter slowdown in manufacturing activity raised concern that this lynchpin of the recovery was ready to turn downward. However, a key index of manufacturing activity stabilized in November and December. Housing continues to be the one nagging weak spot in the economy. Even though home sales edged modestly higher over the year, home ownership declined and home prices continued to fall, weighed down by distressed sales. Against this backdrop, real estate investment trusts (REITs) generally met or exceeded their earnings expectations, with many properties improving their occupancy rates and gaining the ability to increase market rents.
Office, health care and industrial investments fared well
The most notable contributor to results in the office group was the investment in Digital Realty Trust (3.5% of net assets), which raised its earnings projections for the year as it enjoyed strong cash flow from operations. The low exposure to Corporate Office Properties Trust, which we sold prior to the end of the period, also supported relative performance when its cash flow from operations weakened as vacancy rates increased. In health care, the top-performing investment was HCP (5.7% of net assets), which maintained robust revenue and net income growth even as it completed a strategic acquisition of assisted living facilities. In industrials, the fund benefited from an underweight in Prologis (3.3% of net assets). Outside those areas, strong performers included American Campus Communities and AvonlonBay Communities (2.4% and 4.2% of net assets, respectively) as well as Duke Realty. We subsequently sold Duke Realty.
4
Portfolio Manager’s Report (continued) – Columbia Real Estate Equity Fund
Diversified REIT and apartment investments lagged
Among holdings of diversified REITs, overweighted positions in Lexington Realty Trust 0.5% of net assets and Cousins Properties, which we subsequently sold, were the greatest drags on performance. Lexington, which owns office, industrial and retail properties, was able to improve its balance sheet and sell non-core assets, but its share price did not respond as hoped. Cousins Properties, which develops, acquires and operates retail and office properties, also improved its portfolio, but investors focused more on the company’s exposure to land. In an environment in which large-cap REITs tended to do well, Cousins also was disadvantaged by its small-cap status. Apartment Investment & Management underperformed in the apartments group. Other lagging investments included DiamondRock Hospitality (1.3% of net assets), Alexandria Real Estate Equities and Starwood Hotels. We no longer own Apartment Investment & Management, Alexandria Real Estate Equities and Starwood Hotels.
Fund focused on investments with growth potential, superior capitalization
Our investment process analyzes the performance of REITs in terms of fundamentals, valuations and external growth opportunities. Although we see improvements in the fundamentals of most property types, the economic landscape suggests continued slow growth. Recognizing this, we are focused on investing in companies that have the ability to grow even in the face of muted demand. We also plan to continue emphasizing better-capitalized REITs with management teams with the expertise to take advantage of acquisition opportunities. The ability to gain access to additional capital also tends to favor publicly traded REITs, which are better positioned than private entities to make successful acquisitions. At the start of the new fiscal year, REITs were trading at premiums to their long-term averages. To justify paying these prices, we intend to continue to emphasize companies with growth opportunities and the lowest cost of capital, which together give them the potential to invest in ways that increase operating cash flow and earnings.
Portfolio characteristics and holdings are subject to change periodically and may not be representative of current characteristics and holdings. The outlook for the fund may differ from those presented for other Columbia Funds.
Equity securities are subject to stock market fluctuations that occur in response to economic and business developments.
The fund may be subject to the same types of risks associated with direct ownership of real estate, including the decline of property values due to general, local and regional economic conditions. In addition, the fund’s share price will likely be subject to more volatility than the overall stock market because it concentrates in real estate stocks.
| | | | |
| Top sectors | |
| |
as of 12/31/11 (%) | | | | |
Retail REITs | | | 26.8 | |
Specialized REITs | | | 24.4 | |
Residential REITs | | | 17.4 | |
Office REITs | | | 16.7 | |
Industrial REITs | | | 6.3 | |
Hotel Resorts & Cruise Lines | | | 4.8 | |
Diversified REITs | | | 2.4 | |
Real Estate Operating Companies | | | 0.8 | |
Leisure Facilities | | | 0.4 | |
The fund is actively managed and the composition of its portfolio will change over time. Information provided is calculated as a percentage of net assets.
| | | | |
Portfolio Breakdown1 at
December 31, 2011 (%) | |
| |
Consumer Discretionary | | | 0.4 | |
Real Estate Investment Trusts | | | 98.8 | |
| |
Real Estate Management & Development | | | 0.8 | |
Other2 | | | 0.0 | * |
| 1 | Percentages indicated are based upon total investments (excluding Investments of Cash Collateral Received for Securities on Loan). The Fund’s composition is subject to change. |
| 2 | Includes Cash Equivalents. |
| * | Rounds to less than 0.1% |
5
Portfolio of Investments – Columbia Real Estate Equity Fund
December 31, 2011
(Percentages represent value of investments compared to net assets)
| | | | | | | | |
| Issuer | |
Shares | | | Value | |
Common Stocks 99.8% | |
Consumer Discretionary 0.4% | | | | | | | | |
Hotels, Restaurants & Leisure 0.4% | | | | | | | | |
Vail Resorts, Inc.(a) | | | 51,113 | | | | $2,165,147 | |
| | | | | | | | |
Total Consumer Discretionary | | | | | | | 2,165,147 | |
Financials 99.4% | | | | | | | | |
Real Estate Investment Trusts (REITs) 98.7% | | | | | |
American Campus Communities, Inc.(a) | | | 294,389 | | | | 12,352,562 | |
AvalonBay Communities, Inc.(a) | | | 161,879 | | | | 21,141,397 | |
Boston Properties, Inc.(a) | | | 318,654 | | | | 31,737,938 | |
CBL & Associates Properties, Inc.(a) | | | 525,044 | | | | 8,243,191 | |
CubeSmart(a) | | | 465,270 | | | | 4,950,473 | |
DDR Corp.(a) | | | 1,090,372 | | | | 13,269,827 | |
DiamondRock Hospitality Co.(a) | | | 670,526 | | | | 6,463,871 | |
Digital Realty Trust, Inc.(a) | | | 269,157 | | | | 17,944,697 | |
DuPont Fabros Technology, Inc. | | | 155,000 | | | | 3,754,100 | |
EastGroup Properties, Inc.(a) | | | 272,390 | | | | 11,843,517 | |
Entertainment Properties Trust(a) | | | 133,100 | | | | 5,817,801 | |
Equity Residential | | | 430,374 | | | | 24,544,229 | |
Extra Space Storage, Inc.(a) | | | 242,600 | | | | 5,878,198 | |
Federal Realty Investment Trust(a) | | | 142,500 | | | | 12,931,875 | |
First Industrial Realty Trust, Inc.(a)(b) | | | 290,400 | | | | 2,970,792 | |
Glimcher Realty Trust(a) | | | 916,600 | | | | 8,432,720 | |
HCP, Inc.(a) | | | 696,009 | | | | 28,835,653 | |
Health Care REIT, Inc. | | | 324,588 | | | | 17,699,784 | |
Highwoods Properties, Inc.(a) | | | 234,200 | | | | 6,948,714 | |
Home Properties, Inc.(a) | | | 110,200 | | | | 6,344,214 | |
Host Hotels & Resorts, Inc.(a) | | | 1,010,356 | | | | 14,922,958 | |
Kilroy Realty Corp.(a) | | | 218,400 | | | | 8,314,488 | |
Kimco Realty Corp.(a) | | | 747,700 | | | | 12,142,648 | |
LaSalle Hotel Properties(a) | | | 287,335 | | | | 6,956,380 | |
Lexington Realty Trust(a) | | | 320,600 | | | | 2,401,294 | |
Mid-America Apartment Communities, Inc.(a) | | | 201,305 | | | | 12,591,628 | |
National Retail Properties, Inc.(a) | | | 174,600 | | | | 4,605,948 | |
Post Properties, Inc.(a) | | | 256,078 | | | | 11,195,730 | |
ProLogis, Inc.(a) | | | 592,869 | | | | 16,950,125 | |
Public Storage | | | 202,959 | | | | 27,289,867 | |
Realty Income Corp.(a) | | | 103,000 | | | | 3,600,880 | |
Simon Property Group, Inc.(a) | | | 502,954 | | | | 64,850,889 | |
SL Green Realty Corp.(a) | | | 201,778 | | | | 13,446,486 | |
Strategic Hotels & Resorts, Inc.(b) | | | 479,400 | | | | 2,574,378 | |
Ventas, Inc.(a) | | | 484,674 | | | | 26,720,078 | |
Vornado Realty Trust | | | 159,652 | | | | 12,270,853 | |
Weingarten Realty Investors(a) | | | 396,802 | | | | 8,658,220 | |
| | | | | | | | |
Total | | | | | | | 501,598,403 | |
Real Estate Management & Development 0.7% | | | | | | | | |
Brookfield Office Properties, Inc.(c) | | | 245,700 | | | | 3,842,748 | |
| | | | | | | | |
Total Financials | | | | | | | 505,441,151 | |
Total Common Stocks | | | | | | | | |
(Cost: $398,662,891) | | | | | | | 507,606,298 | |
| |
Money Market Funds —% | |
Columbia Short-Term Cash Fund, 0.141%(d)(e) | | | 153,606 | | | | 153,606 | |
Total Money Market Funds | | | | | | | | |
(Cost: $153,606) | | | | | | | $153,606 | |
| | | | | | | | | | | | |
| Issuer | | Effective
Yield | | | Par/Principal/
Shares | | | Value | |
Investments of Cash Collateral Received for Securities on Loan 19.3% | |
Asset-Backed Commercial Paper 4.5% | |
Argento Variable Funding Company LLC | |
01/09/12 | | | 0.310 | % | | | 2,999,122 | | | | $2,999,122 | |
Atlantis One | |
02/01/12 | | | 0.370 | % | | | 3,998,273 | | | | 3,998,273 | |
Cancara Asset Securitisation LLC | |
01/11/12 | | | 0.310 | % | | | 4,998,536 | | | | 4,998,536 | |
Grampian Funding LLC | |
01/18/12 | | | 0.310 | % | | | 2,001,119 | | | | 2,001,119 | |
Kells Funding, LLC | |
01/03/12 | | | 0.380 | % | | | 2,998,923 | | | | 2,998,923 | |
Thames Asset Global Securities | |
01/18/12 | | | 0.320 | % | | | 1,999,467 | | | | 1,999,467 | |
Windmill Funding Corp. | |
01/04/12 | | | 0.320 | % | | | 3,998,756 | | | | 3,998,756 | |
| | | | | | | | | | | | |
Total | | | | | | | | | | | 22,994,196 | |
Certificates of Deposit 7.7% | |
Bank of Nova Scotia | |
05/03/12 | | | 0.401 | % | | | 4,000,000 | | | | 4,000,000 | |
Canadian Imperial Bank | |
03/21/12 | | | 0.333 | % | | | 4,001,255 | | | | 4,001,255 | |
Credit Suisse | |
03/20/12 | | | 0.590 | % | | | 5,000,000 | | | | 5,000,000 | |
Development Bank of Singapore Ltd. | |
01/13/12 | | | 0.310 | % | | | 5,000,000 | | | | 5,000,000 | |
National Australia Bank | |
04/30/12 | | | 0.446 | % | | | 2,000,000 | | | | 2,000,000 | |
National Bank of Canada | |
05/08/12 | | | 0.425 | % | | | 4,000,000 | | | | 4,000,000 | |
Nordea Bank AB | |
01/13/12 | | | 0.350 | % | | | 3,000,000 | | | | 3,000,000 | |
Standard Chartered Bank PLC | |
03/30/12 | | | 0.625 | % | | | 1,996,845 | | | | 1,996,845 | |
Svenska Handelsbanken | |
02/28/12 | | | 0.490 | % | | | 5,000,000 | | | | 5,000,000 | |
United Overseas Bank Ltd. | |
01/12/12 | | | 0.320 | % | | | 5,000,000 | | | | 5,000,000 | |
| | | | | | | | | | | | |
Total | | | | | | | | | | | 38,998,100 | |
Commercial Paper 2.0% | |
HSBC Bank PLC | |
04/13/12 | | | 0.481 | % | | | 2,992,680 | | | | 2,992,680 | |
Suncorp Metway Ltd. | |
02/08/12 | | | 0.500 | % | | | 4,995,694 | | | | 4,995,694 | |
Westpac Securities NZ Ltd. | |
04/20/12 | | | 0.531 | % | | | 1,994,612 | | | | 1,994,612 | |
| | | | | | | | | | | | |
Total | | | | | | | | | | | 9,982,986 | |
Other Short-Term Obligations 0.6% | |
The Goldman Sachs Group, Inc. | |
01/13/12 | | | 0.550 | % | | | 3,000,000 | | | | 3,000,000 | |
Repurchase Agreements 4.5% | |
RBS Securities, Inc. dated 12/30/11, matures 01/03/12, repurchase price $6,276,432(f) | |
01/03/12 | | | 0.080 | % | | | 6,276,377 | | | | 6,276,377 | |
The Accompanying Notes to Financial Statements are an integral part of this statement
6
Columbia Real Estate Equity Fund
December 31, 2011
| | | | | | | | | | | | |
| Issuer | | Effective
Yield | | | Par/Principal/
Shares | | | Value | |
Investments of Cash Collateral Received for Securities on Loan (continued) | |
Repurchase Agreements (cont.) | |
Royal Bank of Canada dated 12/30/11, matures 01/03/12, repurchase price $16,680,761(f) | |
01/03/12 | | | 0.040 | % | | | 16,680,687 | | | | $16,680,687 | |
| | | | | | | | | | | | |
Total | | | | | | | | | | | 22,957,064 | |
Total Investments of Cash Collateral Received for Securities on Loan | | | | $97,932,346 | |
(Cost: $97,932,346) | | | | | |
Total Investments | | | | | |
(Cost: $496,748,843) | | | | $605,692,250 | |
Other Assets & Liabilities, Net | | | | (97,345,522 | ) |
Net Assets | | | | $508,346,728 | |
| | |
Notes to Portfolio of Investments |
| (a) | At December 31, 2011, security was partially or fully on loan. |
| (c) | Represents a foreign security. At December 31, 2011, the value of foreign securities, excluding short-term securities, amounted to $3,842,748 or 0.76% of net assets. |
| (d) | The rate shown is the seven-day current annualized yield at December 31, 2011. |
| (e) | Investments in affiliates during the year ended December 31, 2011: |
| | | | | | | | | | | | | | | | | | | | | | | | | | | | |
| Issuer | | Beginning
Cost | | | Purchase
Cost | | | Sales Cost/
Proceeds
from Sales | | | Realized
Gain/Loss | | | Ending
Cost | | | Dividends
or Interest
Income | | | Value | |
Columbia Short-Term Cash Fund | | | $— | | | | $148,576,258 | | | | $(148,422,652 | ) | | | $— | | | | $153,606 | | | | $4,613 | | | | $153,606 | |
| (f) | The table below represents securities received as collateral for repurchase agreements. This collateral is deposited with the Fund’s custodian and, pursuant to the terms of the repurchase agreement, must have an aggregate market value greater than or equal to the repurchase price plus accrued interest at all times. The value of securities and/or cash held as collateral for repurchase agreements is monitored on a daily basis to ensure the proper level of collateral. |
RBS Securities, Inc. (0.080%)
| | | | |
| Security Description | | Value | |
Fannie Mae Pool | | | $6,401,913 | |
Total Market Value of Collateral Securities | | | 6,401,913 | |
| |
| Royal Bank of Canada (0.040%) | | | | |
| Security Description | | Value | |
Fannie Mae Pool | | | $15,043,139 | |
Fannie Mae REMICS | | | 33,241 | |
Freddie Mac Gold Pool | | | 957,756 | |
Freddie Mac Non Gold Pool | | | 980,165 | |
Total Market Value of Collateral Securities | | | $17,014,301 | |
Generally accepted accounting principles (GAAP) require disclosure regarding the inputs and valuation techniques used to measure fair value and any changes in valuation inputs or techniques. In addition, investments shall be disclosed by major category.
The Accompanying Notes to Financial Statements are an integral part of this statement.
7
Columbia Real Estate Equity Fund
December 31, 2011
|
Fair Value Measurements (continued) |
The Fund categorizes its fair value measurements according to a three-level hierarchy that maximizes the use of observable inputs and minimizes the use of unobservable inputs by prioritizing that the most observable input be used when available. Observable inputs are those that market participants would use in pricing an investment based on market data obtained from sources independent of the reporting entity. Unobservable inputs are those that reflect the Fund’s assumptions about the information market participants would use in pricing an investment. An investment’s level within the fair value hierarchy is based on the lowest level of any input that is deemed significant to the asset or liability’s fair value measurement. The input levels are not necessarily an indication of the risk or liquidity associated with investments at that level. For example, certain U.S. government securities are generally high quality and liquid, however, they are reflected as Level 2 because the inputs used to determine fair value may not always be quoted prices in an active market.
Fair value inputs are summarized in the three broad levels listed below:
| | Ÿ | | Level 1 – Valuations based on quoted prices for investments in active markets that the Fund has the ability to access at the measurement date (including NAV for open-end mutual funds). Valuation adjustments are not applied to Level 1 investments. |
| | Ÿ | | Level 2 – Valuations based on other significant observable inputs (including quoted prices for similar securities, interest rates, prepayment speeds, credit risks, etc.). |
| | Ÿ | | Level 3 – Valuations based on significant unobservable inputs (including the Fund’s own assumptions and judgment in determining the fair value of investments). |
Inputs that are used in determining fair value of an investment may include price information, credit data, volatility statistics, and other factors. These inputs can be either observable or unobservable. The availability of observable inputs can vary between investments, and is affected by various factors such as the type of investment, and the volume and level of activity for that investment or similar investments in the marketplace. The inputs will be considered by the Investment Manager, along with any other relevant factors in the calculation of an investment’s fair value. The Fund uses prices and inputs that are current as of the measurement date, which may include periods of market dislocations. During these periods, the availability of prices and inputs may be reduced for many investments. This condition could cause an investment to be reclassified between the various levels within the hierarchy.
Short-term securities are valued using amortized cost, as permitted under Rule 2a-7 of the Investment Company Act of 1940, as amended. Generally, amortized cost approximates the current fair value of these securities, but because the value is not obtained from a quoted price in an active market, such securities are reflected as Level 2.
Investments falling into the Level 3 category are primarily supported by quoted prices from brokers and dealers participating in the market for those investments. However, these may be classified as Level 3 investments due to lack of market transparency and corroboration to support these quoted prices. Additionally, valuation models may be used as the pricing source for any remaining investments classified as Level 3. These models rely on one or more significant unobservable inputs and/or significant assumptions by the Investment Manager. Inputs used in valuations may include, but are not limited to, financial statement analysis, capital account balances, discount rates and estimated cash flows, and comparable company data.
The following table is a summary of the inputs used to value the Fund’s investments as of December 31, 2011:
| | | | | | | | | | | | | | | | |
| | | Fair value at December 31, 2011 | |
| Description(a) | | Level 1
quoted prices
in active
markets for
identical assets | | | Level 2
other
significant
observable
inputs(b) | | | Level 3
significant
unobservable
inputs | | | Total | |
Equity Securities | | | | | | | | | | | | | | | | |
Common Stocks | | | | | | | | | | | | | | | | |
Consumer Discretionary | | | $2,165,147 | | | | $— | | | | $— | | | | $2,165,147 | |
Financials | | | 505,441,151 | | | | — | | | | — | | | | 505,441,151 | |
Total Equity Securities | | | 507,606,298 | | | | — | | | | — | | | | 507,606,298 | |
Other | | | | | | | | | | | | | | | | |
Money Market Funds | | | 153,606 | | | | — | | | | — | | | | 153,606 | |
Investments of Cash Collateral Received for Securities
on Loan | | | — | | | | 97,932,346 | | | | — | | | | 97,932,346 | |
Total Other | | | 153,606 | | | | 97,932,346 | | | | — | | | | 98,085,952 | |
Total | | | $507,759,904 | | | | $97,932,346 | | | | $— | | | | $605,692,250 | |
The Fund’s assets assigned to the Level 2 input category are generally valued using the market approach, in which a security’s value is determined through reference to prices and information from market transactions for similar or identical assets.
| (a) | See the Portfolio of Investments for all investment classifications not indicated in the table. |
| (b) | There were no significant transfers between Levels 1 and 2 during the period. |
The Accompanying Notes to Financial Statements are an integral part of this statement.
8
Statement of Assets and Liabilities – Columbia Real Estate Equity Fund
December 31, 2011
| | | | |
| Assets | | | | |
Investments, at value* | | | | |
Unaffiliated issuers (identified cost $398,662,891) | | $ | 507,606,298 | |
Affiliated issuers (identified cost $153,606) | | | 153,606 | |
Investment of cash collateral received for securities on loan | | | | |
Short-term securities (identified cost $97,932,346) | | | 97,932,346 | |
Total investments (identified cost $496,748,843) | | | 605,692,250 | |
Cash | | | 15,466 | |
Receivable for: | | | | |
Capital shares sold | | | 669,361 | |
Dividends | | | 1,788,251 | |
Dividends from affiliated fund | | | 116 | |
Securities lending | | | 26,538 | |
Reclaims | | | 61,444 | |
Expense reimbursement due from Investment Manager | | | 153 | |
Prepaid expense | | | 7,250 | |
Trustees’ deferred compensation plan | | | 44,328 | |
Total assets | | | 608,305,157 | |
| |
| Liabilities | | | | |
Due upon return of securities on loan | | | 97,932,346 | |
Payable for: | | | | |
Capital shares purchased | | | 1,729,279 | |
Investment management fees | | | 9,676 | |
Distribution fees | | | 1,520 | |
Transfer agent fees | | | 101,825 | |
Administration fees | | | 840 | |
Plan administration fees | | | 31 | |
Chief compliance officer expenses | | | 100 | |
Other expenses | | | 138,484 | |
Trustees’ deferred compensation plan | | | 44,328 | |
Total liabilities | | | 99,958,429 | |
Net assets applicable to outstanding capital stock | | $ | 508,346,728 | |
The Accompanying Notes to Financial Statements are an integral part of this statement.
9
Statement of Assets and Liabilities (continued) – Columbia Real Estate Equity Fund
December 31, 2011
| | | | |
| Represented by | | | | |
Paid-in capital | | $ | 468,667,019 | |
Overdistributed net investment income | | | (50,270 | ) |
Accumulated net realized loss | | | (69,205,272 | ) |
Unrealized appreciation (depreciation) on: | | | | |
Investments | | | 108,943,407 | |
Foreign currency translations | | | (8,156 | ) |
Total — representing net assets applicable to outstanding capital stock | | $ | 508,346,728 | |
*Value of securities on loan | | $ | 93,947,334 | |
Net assets applicable to outstanding shares | | | | |
Class A | | $ | 99,334,797 | |
Class B | | $ | 7,273,609 | |
Class C | | $ | 19,801,769 | |
Class I | | $ | 68,507,925 | |
Class R | | $ | 6,003,919 | |
Class R4 | | $ | 74,693 | |
Class R5 | | $ | 3,463,115 | |
Class W | | $ | 5,759 | |
Class Z | | $ | 303,881,142 | |
Shares outstanding | | | | |
Class A | | | 7,830,710 | |
Class B | | | 572,290 | |
Class C | | | 1,561,724 | |
Class I | | | 5,386,238 | |
Class R | | | 473,684 | |
Class R4 | | | 5,874 | |
Class R5 | | | 272,428 | |
Class W | | | 454 | |
Class Z | | | 23,919,505 | |
Net asset value per share | | | | |
Class A(a) | | $ | 12.69 | |
Class B | | $ | 12.71 | |
Class C | | $ | 12.68 | |
Class I | | $ | 12.72 | |
Class R | | $ | 12.67 | |
Class R4 | | $ | 12.72 | |
Class R5 | | $ | 12.71 | |
Class W | | $ | 12.69 | |
Class Z | | $ | 12.70 | |
| (a) | The maximum offering price per share for Class A is $13.46. The offering price is calculated by dividing the net asset value by 1.0 minus the maximum sales charge of 5.75%. |
The Accompanying Notes to Financial Statements are an integral part of this statement.
10
Statement of Operations – Columbia Real Estate Equity Fund
Year Ended December 31, 2011
| | | | |
| Net investment income | | | | |
Income: | | | | |
Dividends | | $ | 13,877,348 | |
Interest | | | 475 | |
Dividends from affiliates | | | 4,613 | |
Income from securities lending – net | | | 178,801 | |
Foreign taxes withheld | | | (44,002 | ) |
Total income | | | 14,017,235 | |
Expenses: | | | | |
Investment management fees | | | 3,831,112 | |
Distribution fees | | | | |
Class B | | | 54,701 | |
Class C | | | 127,855 | |
Class R | | | 20,624 | |
Service fees | | | | |
Class A | | | 203,927 | |
Class B | | | 18,234 | |
Class C | | | 42,624 | |
Class W | | | 13 | |
Transfer agent fees | | | | |
Class A | | | 174,866 | |
Class B | | | 16,192 | |
Class C | | | 36,916 | |
Class R | | | 9,132 | |
Class R4 | | | 20 | |
Class R5 | | | 2 | |
Class W | | | 10 | |
Class Z | | | 690,959 | |
Administration fees | | | 289,260 | |
Plan administration fees | | | | |
Class R4 | | | 134 | |
Compensation of board members | | | 33,197 | |
Pricing and bookkeeping fees | | | 21,361 | |
Custodian fees | | | 25,799 | |
Printing and postage fees | | | 73,271 | |
Registration fees | | | 81,461 | |
Professional fees | | | 62,037 | |
Chief compliance officer expenses | | | 388 | |
Total expenses | | | 5,814,095 | |
Fees waived or expenses reimbursed by Investment Manager and its affiliates | | | (49,418 | ) |
Expense reductions | | | (6,043 | ) |
Total net expenses | | | 5,758,634 | |
Net Investment Income | | | 8,258,601 | |
| |
| Realized and unrealized gain (loss) — net | | | | |
Net realized gain (loss) on: | | | | |
Investments | | | 42,395,785 | |
Foreign currency translations | | | (41,156 | ) |
Forward foreign currency exchange contracts | | | 74,332 | |
Net realized gain | | | 42,428,961 | |
Net change in unrealized appreciation (depreciation) on: | | | | |
Investments | | | (19,632,155 | ) |
Foreign currency translations | | | (8,273 | ) |
Net change in unrealized depreciation | | | (19,640,428 | ) |
Net realized and unrealized gain | | | 22,788,533 | |
Net increase in net assets resulting from operations | | $ | 31,047,134 | |
The Accompanying Notes to Financial Statements are an integral part of this statement.
11
Statement of Changes in Net Assets – Columbia Real Estate Equity Fund
| | | | | | | | |
| | | 2011 | | | 2010 | |
| | |
| Operations | | | | | | | | |
Net investment income | | $ | 8,258,601 | | | $ | 4,124,127 | |
Net realized gain | | | 42,428,961 | | | | 53,191,163 | |
Net change in unrealized appreciation (depreciation) | | | (19,640,428 | ) | | | 19,302,330 | |
Net increase in net assets resulting from operations | | | 31,047,134 | | | | 76,617,620 | |
| | |
| Distributions to shareholders from: | | | | | | | | |
Net investment income | | | | | | | | |
Class A | | | (1,285,956 | ) | | | (531,336 | ) |
Class B | | | (58,245 | ) | | | (47,805 | ) |
Class C | | | (135,252 | ) | | | (95,953 | ) |
Class I | | | (2,269,688 | ) | | | (50,957 | ) |
Class R | | | (55,319 | ) | | | (20 | ) |
Class R4 | | | (931 | ) | | | — | |
Class R5 | | | (50,673 | ) | | | — | |
Class W | | | (76 | ) | | | (22 | ) |
Class Z | | | (5,275,846 | ) | | | (7,975,040 | ) |
Net realized gains | | | | | | | | |
Class A | | | (2,497,428 | ) | | | — | |
Class B | | | (186,608 | ) | | | — | |
Class C | | | (504,795 | ) | | | — | |
Class I | | | (1,694,822 | ) | | | — | |
Class R | | | (154,019 | ) | | | — | |
Class R4 | | | (1,862 | ) | | | — | |
Class R5 | | | (86,370 | ) | | | — | |
Class W | | | (147 | ) | | | — | |
Class Z | | | (7,727,009 | ) | | | — | |
Total distributions to shareholders | | | (21,985,046 | ) | | | (8,701,133 | ) |
Increase (decrease) in net assets from share transactions | | | 120,981,625 | | | | 9,449,400 | |
Proceeds from regulatory settlements (Note 6) | | | — | | | | 22,629 | |
Redemption fees | | | 1,016,032 | | | | — | |
Total increase in net assets | | | 131,059,745 | | | | 77,388,516 | |
Net assets at beginning of year | | | 377,286,983 | | | | 299,898,467 | |
Net assets at end of year | | $ | 508,346,728 | | | $ | 377,286,983 | |
Overdistributed net investment income | | $ | (50,270 | ) | | $ | (849,468 | ) |
The Accompanying Notes to Financial Statements are an integral part of this statement.
12
Statement of Changes in Net Assets (continued) – Columbia Real Estate Equity Fund
| | | | | | | | | | | | | | | | |
| Year ended December 31, | | 2011 | | | 2010 | |
| | | Shares | | | Dollars ($) | | | Shares | | | Dollars ($) | |
| Capital stock activity | | | | | | | | | | | | | | | | |
Class A shares | | | | | | | | | | | | | | | | |
Subscriptions | | | 1,281,729 | | | | 16,462,771 | | | | 909,223 | | | | 10,332,381 | |
Fund merger | | | 5,887,790 | | | | 75,122,126 | | | | — | | | | — | |
Distributions reinvested | | | 277,501 | | | | 3,360,077 | | | | 40,227 | | | | 466,486 | |
Redemptions | | | (1,833,805 | ) | | | (23,303,168 | ) | | | (543,168 | ) | | | (6,044,112 | ) |
Net increase | | | 5,613,215 | | | | 71,641,806 | | | | 406,282 | | | | 4,754,755 | |
Class B shares | | | | | | | | | | | | | | | | |
Subscriptions | | | 30,609 | | | | 395,556 | | | | 15,589 | | | | 179,794 | |
Fund merger | | | 643,986 | | | | 8,227,953 | | | | — | | | | — | |
Distributions reinvested | | | 18,347 | | | | 222,458 | | | | 3,404 | | | | 39,297 | |
Redemptions | | | (360,874 | ) | | | (4,668,213 | ) | | | (110,506 | ) | | | (1,256,435 | ) |
Net increase (decrease) | | | 332,068 | | | | 4,177,754 | | | | (91,513 | ) | | | (1,037,344 | ) |
Class C shares | | | | | | | | | | | | | | | | |
Subscriptions | | | 224,751 | | | | 2,861,797 | | | | 226,594 | | | | 2,494,066 | |
Fund merger | | | 1,118,143 | | | | 14,261,923 | | | | — | | | | — | |
Distributions reinvested | | | 35,511 | | | | 429,040 | | | | 7,494 | | | | 86,990 | |
Redemptions | | | (373,163 | ) | | | (4,744,141 | ) | | | (151,955 | ) | | | (1,693,165 | ) |
Net increase | | | 1,005,242 | | | | 12,808,619 | | | | 82,133 | | | | 887,891 | |
Class I shares | | | | | | | | | | | | | | | | |
Subscriptions | | | 2,432,283 | | | | 31,136,486 | | | | 2,855,527 | | | | 34,553,546 | |
Fund merger | | | 12,295,219 | | | | 157,105,589 | | | | — | | | | — | |
Distributions reinvested | | | 322,913 | | | | 3,963,514 | | | | 4,171 | | | | 50,933 | |
Redemptions | | | (12,512,568 | ) | | | (160,768,109 | ) | | | (11,307 | ) | | | (138,200 | ) |
Net increase | | | 2,537,847 | | | | 31,437,480 | | | | 2,848,391 | | | | 34,466,279 | |
Class R shares | | | | | | | | | | | | | | | | |
Subscriptions | | | 192,665 | | | | 2,374,729 | | | | 213 | | | | 2,500 | |
Fund merger | | | 472,472 | | | | 6,026,815 | | | | — | | | | — | |
Distributions reinvested | | | 5,723 | | | | 69,061 | | | | — | | | | — | |
Redemptions | | | (197,389 | ) | | | (2,558,695 | ) | | | — | | | | — | |
Net increase | | | 473,471 | | | | 5,911,910 | | | | 213 | | | | 2,500 | |
Class R4 shares | | | | | | | | | | | | | | | | |
Subscriptions | | | 197 | | | | 2,507 | | | | — | | | | — | |
Fund merger | | | 5,523 | | | | 70,653 | | | | — | | | | — | |
Distributions reinvested | | | 154 | | | | 1,870 | | | | — | | | | — | |
Net increase | | | 5,874 | | | | 75,030 | | | | — | | | | — | |
Class R5 shares | | | | | | | | | | | | | | | | |
Subscriptions | | | 197 | | | | 2,818 | | | | — | | | | — | |
Fund merger | | | 267,025 | | | | 3,414,970 | | | | — | | | | — | |
Distributions reinvested | | | 5,616 | | | | 67,904 | | | | — | | | | — | |
Redemptions | | | (410 | ) | | | (5,135 | ) | | | — | | | | — | |
Net increase | | | 272,428 | | | | 3,480,557 | | | | — | | | | — | |
Class W shares | | | | | | | | | | | | | | | | |
Subscriptions | | | — | | | | — | | | | 225 | | | | 2,650 | |
Fund merger | | | 241 | | | | 3,075 | | | | — | | | | — | |
Redemptions | | | — | | | | — | | �� | | (12 | ) | | | (150 | ) |
Net increase | | | 241 | | | | 3,075 | | | | 213 | | | | 2,500 | |
Class Z shares | | | | | | | | | | | | | | | | |
Subscriptions | | | 3,377,420 | | | | 43,202,907 | | | | 8,883,775 | | | | 101,334,335 | |
Fund merger | | | 7,642,501 | | | | 97,647,633 | | | | — | | | | — | |
Distributions reinvested | | | 644,315 | | | | 7,841,788 | | | | 401,949 | | | | 4,657,790 | |
Redemptions | | | (12,243,417 | ) | | | (157,246,934 | ) | | | (11,894,503 | ) | | | (135,619,306 | ) |
Net decrease | | | (579,181 | ) | | | (8,554,606 | ) | | | (2,608,779 | ) | | | (29,627,181 | ) |
Total net increase | | | 9,661,205 | | | | 120,981,625 | | | | 636,940 | | | | 9,449,400 | |
The Accompanying Notes to Financial Statements are an integral part of this statement.
13
Financial Highlights – Columbia Real Estate Equity Fund
The following tables are intended to help you understand the Fund’s financial performance. Certain information reflects financial results for a single share of a class held for the periods shown. Per share net investment income (loss) amounts are calculated based on average shares outstanding during the period. Total returns assume reinvestment of all dividends and distributions. Total returns do not reflect payment of sales charges, if any, and are not annualized for periods of less than one year.
| | | | | | | | | | | | | | | | | | | | | | | | |
| | | Year ended December 31, | | | Year ended August 31, | |
| | | 2011 | | | 2010 | | | 2009(a) | | | 2009 | | | 2008 | | | 2007 | |
| Class A | | | | | | | | | | | | | | | | | | |
| Per share data | | | | | | | | | | | | | | | | | | | | | | | | |
Net asset value, beginning of period | | | $12.41 | | | | $10.07 | | | | $9.11 | | | | $13.85 | | | | $20.72 | | | | $29.07 | |
Income from investment operations: | | | | | | | | | | | | | | | | | | | | | | | | |
Net investment income | | | 0.18 | | | | 0.12 | | | | 0.06 | | | | 0.22 | | | | 0.29 | | | | 0.22 | |
Net realized and unrealized gain (loss) | | | 0.59 | | | | 2.48 | | | | 1.10 | | | | (4.46 | ) | | | (1.10 | ) | | | 1.24 | |
Total from investment operations | | | 0.77 | | | | 2.60 | | | | 1.16 | | | | (4.24 | ) | | | (0.81 | ) | | | 1.46 | |
Less distributions to shareholders from: | | | | | | | | | | | | | | | | | | | | | | | | |
Net investment income | | | (0.19 | ) | | | (0.26 | ) | | | (0.12 | ) | | | (0.33 | ) | | | (0.16 | ) | | | (0.33 | ) |
Net realized gains | | | (0.32 | ) | | | — | | | | — | | | | — | | | | (5.90 | ) | | | (9.48 | ) |
Tax return of capital | | | — | | | | — | | | | (0.08 | ) | | | (0.17 | ) | | | — | | | | — | |
Total distributions to shareholders | | | (0.51 | ) | | | (0.26 | ) | | | (0.20 | ) | | | (0.50 | ) | | | (6.06 | ) | | | (9.81 | ) |
Proceeds from regulatory settlement | | | — | | | | 0.00 | (b) | | | — | | | | — | | | | — | | | | — | |
Redemption fees: | | | | | | | | | | | | | | | | | | | | | | | | |
Redemption fees added to paid-in-capital | | | 0.02 | | | | — | | | | — | | | | — | | | | — | | | | — | |
Net asset value, end of period | | | $12.69 | | | | $12.41 | | | | $10.07 | | | | $9.11 | | | | $13.85 | | | | $20.72 | |
| Total return | | | 6.59% | | | | 26.04% | (c) | | | 12.86% | | | | (29.89% | ) | | | (5.46% | ) | | | 1.72% | |
| Ratios to average net assets(d) | | | | | | | | | | | | | | | | | | | | | | | | |
Expenses prior to fees waived or expenses reimbursed | | | 1.26% | | | | 1.27% | (f) | | | 1.39% | (e) | | | 1.31% | | | | 1.28% | (f) | | | 1.21% | (f) |
Net expenses after fees waived or expenses reimbursed(g) | | | 1.24% | (h) | | | 1.27% | (f)(h) | | | 1.39% | (e)(h) | | | 1.31% | (h) | | | 1.28% | (f)(h) | | | 1.21% | (f)(h) |
Net investment income | | | 1.44% | (h) | | | 1.04% | (h) | | | 1.99% | (e)(h) | | | 2.69% | (h) | | | 1.93% | (h) | | | 0.84% | (h) |
| Supplemental data | | | | | | | | | | | | | | | | | | | | | | | | |
Net assets, end of period (in thousands) | | | $99,335 | | | | $27,511 | | | | $18,245 | | | | $17,114 | | | | $22,321 | | | | $31,069 | |
Portfolio turnover | | | 72% | | | | 108% | | | | 32% | | | | 110% | | | | 78% | | | | 67% | |
Notes to Financial Highlights
| (a) | For the period from September 1, 2009 to December 31, 2009. In 2009, the Fund’s fiscal year end was changed from August 31 to December 31. |
| (b) | Rounds to less than $0.01. |
| (c) | Total return includes a reimbursement of a loss experienced by the Fund due to a compliance violation. The reimbursement had an impact of less than 0.01% on total return. |
| (d) | In addition to the fees and expenses which the Fund bears directly, the Fund indirectly bears a pro rata share of the fees and expenses of the acquired funds in which it invests. Such indirect expenses are not included in the reported expense ratios. |
| (f) | Includes interest expense which rounds to less than 0.01%. |
| (g) | The Investment Manager and certain of its affiliates agreed to waive/reimburse certain fees and expenses, if applicable. |
| (h) | The benefits derived from expense reductions had an impact of less than 0.01%. |
The Accompanying Notes to Financial Statements are an integral part of this statement.
14
Financial Highlights (continued) – Columbia Real Estate Equity Fund
| | | | | | | | | | | | | | | | | | | | | | | | |
| | | Year ended December 31, | | | Year ended August 31, | |
| | | 2011 | | | 2010 | | | 2009(a) | | | 2009 | | | 2008 | | | 2007 | |
| Class B | | | | | | | | | | | | | | | | | | |
| Per share data | | | | | | | | | | | | | | | | | | | | | | | | |
Net asset value, beginning of period | | | $12.43 | | | | $10.09 | | | | $9.12 | | | | $13.85 | | | | $20.76 | | | | $29.09 | |
Income from investment operations: | | | | | | | | | | | | | | | | | | | | | | | | |
Net investment income | | | 0.08 | | | | 0.02 | | | | 0.04 | | | | 0.16 | | | | 0.20 | | | | 0.03 | |
Net realized and unrealized gain (loss) | | | 0.58 | | | | 2.50 | | | | 1.10 | | | | (4.46 | ) | | | (1.14 | ) | | | 1.24 | |
Total from investment operations | | | 0.66 | | | | 2.52 | | | | 1.14 | | | | (4.30 | ) | | | (0.94 | ) | | | 1.27 | |
Less distributions to shareholders from: | | | | | | | | | | | | | | | | | | | | | | | | |
Net investment income | | | (0.09 | ) | | | (0.18 | ) | | | (0.09 | ) | | | (0.26 | ) | | | (0.07 | ) | | | (0.12 | ) |
Net realized gains | | | (0.32 | ) | | | — | | | | — | | | | — | | | | (5.90 | ) | | | (9.48 | ) |
Tax return of capital | | | — | | | | — | | | | (0.08 | ) | | | (0.17 | ) | | | — | | | | — | |
Total distributions to shareholders | | | (0.41 | ) | | | (0.18 | ) | | | (0.17 | ) | | | (0.43 | ) | | | (5.97 | ) | | | (9.60 | ) |
Proceeds from regulatory settlement | | | — | | | | 0.00 | (b) | | | — | | | | — | | | | — | | | | — | |
Redemption fees: | | | | | | | | | | | | | | | | | | | | | | | | |
Redemption fees added to paid-in-capital | | | 0.03 | | | | — | | | | — | | | | — | | | | — | | | | — | |
Net asset value, end of period | | | $12.71 | | | | $12.43 | | | | $10.09 | | | | $9.12 | | | | $13.85 | | | | $20.76 | |
| Total return | | | 5.76% | | | | 25.07% | (c) | | | 12.57% | | | | (30.38% | ) | | | (6.21% | ) | | | 0.99% | |
| Ratios to average net assets(d) | | | | | | | | | | | | | | | | | | | | | | | | |
Expenses prior to fees waived or expenses reimbursed | | | 2.02% | | | | 2.02% | (f) | | | 2.14% | (e) | | | 2.06% | | | | 2.03% | (f) | | | 1.96% | (f) |
Net expenses after fees waived or expenses reimbursed(g) | | | 2.01% | (h) | | | 2.02% | (f)(h) | | | 2.14% | (e)(h) | | | 2.06% | (h) | | | 2.03% | (f)(h) | | | 1.96% | (f)(h) |
Net investment income | | | 0.61% | (h) | | | 0.21% | (h) | | | 1.22% | (e)(h) | | | 1.96% | (h) | | | 1.30% | (h) | | | 0.10% | (h) |
| Supplemental data | | | | | | | | | | | | | | | | | | | | | | | | |
Net assets, end of period (in thousands) | | | $7,274 | | | | $2,986 | | | | $3,348 | | | | $3,356 | | | | $7,123 | | | | $9,663 | |
Portfolio turnover | | | 72% | | | | 108% | | | | 32% | | | | 110% | | | | 78% | | | | 67% | |
Notes to Financial Highlights
| (a) | For the period from September 1, 2009 to December 31, 2009. In 2009, the Fund’s fiscal year end was changed from August 31 to December 31. |
| (b) | Rounds to less than $0.01. |
| (c) | Total return includes a reimbursement of a loss experienced by the Fund due to a compliance violation. The reimbursement had an impact of less than 0.01% on total return. |
| (d) | In addition to the fees and expenses which the Fund bears directly, the Fund indirectly bears a pro rata share of the fees and expenses of the acquired funds in which it invests. Such indirect expenses are not included in the reported expense ratios. |
| (f) | Includes interest expense which rounds to less than 0.01%. |
| (g) | The Investment Manager and certain of its affiliates agreed to waive/reimburse certain fees and expenses, if applicable. |
| (h) | The benefits derived from expense reductions had an impact of less than 0.01%. |
The Accompanying Notes to Financial Statements are an integral part of this statement.
15
Financial Highlights (continued) – Columbia Real Estate Equity Fund
| | | | | | | | | | | | | | | | | | | | | | | | |
| | | Year ended December 31, | | | Year ended August 31, | |
| | | 2011 | | | 2010 | | | 2009(a) | | | 2009 | | | 2008 | | | 2007 | |
| Class C | | | | | | | | | | | | | | | | | | |
| Per share data | | | | | | | | | | | | | | | | | | | | | | | | |
Net asset value, beginning of period | | | $12.40 | | | | $10.07 | | | | $9.10 | | | | $13.82 | | | | $20.72 | | | | $29.06 | |
Income from investment operations: | | | | | | | | | | | | | | | | | | | | | | | | |
Net investment income | | | 0.08 | | | | 0.03 | | | | 0.04 | | | | 0.16 | | | | 0.19 | | | | 0.03 | |
Net realized and unrealized gain (loss) | | | 0.59 | | | | 2.48 | | | | 1.10 | | | | (4.45 | ) | | | (1.12 | ) | | | 1.23 | |
Total from investment operations | | | 0.67 | | | | 2.51 | | | | 1.14 | | | | (4.29 | ) | | | (0.93 | ) | | | 1.26 | |
Less distributions to shareholders from: | | | | | | | | | | | | | | | | | | | | | | | | |
Net investment income | | | (0.09 | ) | | | (0.18 | ) | | | (0.09 | ) | | | (0.26 | ) | | | (0.07 | ) | | | (0.12 | ) |
Net realized gains | | | (0.32 | ) | | | — | | | | — | | | | — | | | | (5.90 | ) | | | (9.48 | ) |
Tax return of capital | | | — | | | | — | | | | (0.08 | ) | | | (0.17 | ) | | | — | | | | — | |
Total distributions to shareholders | | | (0.41 | ) | | | (0.18 | ) | | | (0.17 | ) | | | (0.43 | ) | | | (5.97 | ) | | | (9.60 | ) |
Proceeds from regulatory settlement | | | — | | | | 0.00 | (b) | | | — | | | | — | | | | — | | | | — | |
Redemption fees: | | | | | | | | | | | | | | | | | | | | | | | | |
Redemption fees added to paid-in-capital | | | 0.02 | | | | — | | | | — | | | | — | | | | — | | | | — | |
Net asset value, end of period | | | $12.68 | | | | $12.40 | | | | $10.07 | | | | $9.10 | | | | $13.82 | | | | $20.72 | |
| Total return | | | 5.77% | | | | 25.02% | (c) | | | 12.60% | | | | (30.37% | ) | | | (6.18% | ) | | | 0.94% | |
| Ratios to average net assets(d) | | | | | | | | | | | | | | | | | | | | | | | | |
Expenses prior to fees waived or expenses reimbursed | | | 2.01% | | | | 2.02% | (f) | | | 2.14% | (e) | | | 2.06% | | | | 2.03% | (f) | | | 1.96% | (f) |
Net expenses after fees waived or expenses reimbursed(g) | | | 2.00% | (h) | | | 2.02% | (f)(h) | | | 2.14% | (e)(h) | | | 2.06% | (h) | | | 2.03% | (f)(h) | | | 1.96% | (f)(h) |
Net investment income | | | 0.67% | (h) | | | 0.28% | (h) | | | 1.37% | (e)(h) | | | 1.95% | (h) | | | 1.26% | (h) | | | 0.11% | (h) |
| Supplemental data | | | | | | | | | | | | | | | | | | | | | | | | |
Net assets, end of period (in thousands) | | | $19,802 | | | | $6,900 | | | | $4,777 | | | | $3,553 | | | | $6,462 | | | | $8,263 | |
Portfolio turnover | | | 72% | | | | 108% | | | | 32% | | | | 110% | | | | 78% | | | | 67% | |
Notes to Financial Highlights
| (a) | For the period from September 1, 2009 to December 31, 2009. In 2009, the Fund’s fiscal year end was changed from August 31 to December 31. |
| (b) | Rounds to less than $0.01. |
| (c) | Total return includes a reimbursement of a loss experienced by the Fund due to a compliance violation. The reimbursement had an impact of less than 0.01% on total return. |
| (d) | In addition to the fees and expenses which the Fund bears directly, the Fund indirectly bears a pro rata share of the fees and expenses of the acquired funds in which it invests. Such indirect expenses are not included in the reported expense ratios. |
| (f) | Includes interest expense which rounds to less than 0.01%. |
| (g) | The Investment Manager and certain of its affiliates agreed to waive/reimburse certain fees and expenses, if applicable. |
| (h) | The benefits derived from expense reductions had an impact of less than 0.01%. |
The Accompanying Notes to Financial Statements are an integral part of this statement.
16
Financial Highlights (continued) – Columbia Real Estate Equity Fund
| | | | | | | | |
| | | Year ended December 31, | |
| | | 2011 | | | 2010 (a) | |
| Class I | | | | | | |
| Per share data | | | | | | | | |
Net asset value, beginning of period | | | $12.42 | | | | $11.77 | |
Income from investment operations: | | | | | | | | |
Net investment income | | | 0.21 | | | | 0.07 | |
Net realized and unrealized gain | | | 0.62 | | | | 0.70 | |
Total from investment operations | | | 0.83 | | | | 0.77 | |
Less distributions to shareholders from: | | | | | | | | |
Net investment income | | | (0.24 | ) | | | (0.12 | ) |
Net realized gains | | | (0.32 | ) | | | — | |
Total distributions to shareholders | | | (0.56 | ) | | | (0.12 | ) |
Redemption fees: | | | | | | | | |
Redemption fees added to paid-in capital | | | 0.03 | | | | — | |
Net asset value, end of period | | | $12.72 | | | | $12.42 | |
| Total return | | | 7.19% | | | | 6.52% | (b) |
| Ratios to average net assets(c) | | | | | | | | |
Expenses prior to fees waived or expenses reimbursed | | | 0.80% | | | | 0.96% | (d)(e) |
Net expenses after fees waived or expenses reimbursed(f) | | | 0.80% | (g) | | | 0.96% | (d)(e)(g) |
Net investment income | | | 1.65% | (g) | | | 2.34% | (d)(g) |
| Supplemental data | | | | | | | | |
Net assets, end of period (in thousands) | | | $68,508 | | | | $35,388 | |
Portfolio turnover | | | 72% | | | | 108% | |
Notes to Financial Highlights
| (a) | For the period from September 27, 2010 (commencement of operations) to December 31, 2010. |
| (b) | Total return includes a reimbursement of a loss experienced by the Fund due to a compliance violation. The reimbursement had an impact of less than 0.01% on total return. |
| (c) | In addition to the fees and expenses which the Fund bears directly, the Fund indirectly bears a pro rata share of the fees and expenses of the acquired funds in which it invests. Such indirect expenses are not included in the reported expense ratios. |
| (e) | Includes interest expense which rounds to less than 0.01%. |
| (f) | The Investment Manager and certain of its affiliates agreed to waive/reimburse certain fees and expenses, if applicable. |
| (g) | The benefits derived from expense reductions had an impact of less than 0.01%. |
The Accompanying Notes to Financial Statements are an integral part of this statement.
17
Financial Highlights (continued) – Columbia Real Estate Equity Fund
| | | | | | | | |
| | | Year ended December 31, | |
| | | 2011 | | | 2010(a) | |
| Class R | | | | | | |
| Per share data | | | | | | | | |
Net asset value, beginning of period | | | $12.40 | | | | $11.75 | |
Income from investment operations: | | | | | | | | |
Net investment income (loss) | | | 0.16 | | | | (0.07 | ) |
Net realized and unrealized gain | | | 0.56 | | | | 0.82 | |
Total from investment operations | | | 0.72 | | | | 0.75 | |
Less distributions to shareholders from: | | | | | | | | |
Net investment income | | | (0.16 | ) | | | (0.10 | ) |
Net realized gains | | | (0.32 | ) | | | — | |
Total distributions to shareholders | | | (0.48 | ) | | | (0.10 | ) |
Redemption fees: | | | | | | | | |
Redemption fees added to paid-in-capital | | | 0.03 | | | | — | |
Net asset value, end of period | | | $12.67 | | | | $12.40 | |
| Total return | | | 6.25% | | | | 6.36% | (b) |
| Ratios to average net assets(c) | | | | | | | | |
Expenses prior to fees waived or expenses reimbursed | | | 1.51% | | | | 1.76% | (d)(e) |
Net expenses after fees waived or expenses reimbursed(f) | | | 1.49% | (g) | | | 1.76% | (d)(e)(g) |
Net investment income (loss) | | | 1.29% | (g) | | | (2.20% | )(d)(g) |
| Supplemental data | | | | | | | | |
Net assets, end of period (in thousands) | | | $6,004 | | | | $3 | |
Portfolio turnover | | | 72% | | | | 108% | |
Notes to Financial Highlights
| (a) | For the period from September 27, 2010 (commencement of operations) to December 31, 2010. |
| (b) | Total return includes a reimbursement of a loss experienced by the Fund due to a compliance violation. The reimbursement had an impact of less than 0.01% on total return. |
| (c) | In addition to the fees and expenses which the Fund bears directly, the Fund indirectly bears a pro rata share of the fees and expenses of the acquired funds in which it invests. Such indirect expenses are not included in the reported expense ratios. |
| (e) | Includes interest expense which rounds to less than 0.01%. |
| (f) | The Investment Manager and certain of its affiliates agreed to waive/reimburse certain fees and expenses, if applicable. |
| (g) | The benefits derived from expense reductions had an impact of less than 0.01%. |
The Accompanying Notes to Financial Statements are an integral part of this statement.
18
Financial Highlights (continued) – Columbia Real Estate Equity Fund
| | | | |
| | | Year ended
December 31, 2011(a) | |
| Class R4 | | | |
| Per share data | | | | |
Net asset value, beginning of period | | | $12.73 | |
Income from investment operations: | | | | |
Net investment income | | | 0.18 | |
Net realized and unrealized gain | | | 0.31 | |
Total from investment operations | | | 0.49 | |
Less distributions to shareholders from: | | | | |
Net investment income | | | (0.20 | ) |
Net realized gains | | | (0.32 | ) |
Total distributions to shareholders | | | (0.52 | ) |
Redemption fees: | | | | |
Redemption fees added to paid-in-capital | | | 0.02 | |
Net asset value, end of period | | | $12.72 | |
| Total return | | | 4.24% | |
| Ratios to average net assets(b) | | | | |
Expenses prior to fees waived or expenses reimbursed | | | 1.12% | (c) |
Net expenses after fees waived or expenses reimbursed(d) | | | 1.12% | (c)(e) |
Net investment income | | | 1.66% | (c)(e) |
| Supplemental data | | | | |
Net assets, end of period (in thousands) | | | $75 | |
Portfolio turnover | | | 72% | |
Notes to Financial Highlights
| (a) | For the period from March 7, 2011 (commencement of operations) to December 31, 2011. |
| (b) | In addition to the fees and expenses which the Fund bears directly, the Fund indirectly bears a pro rata share of the fees and expenses of the acquired funds in which it invests. Such indirect expenses are not included in the reported expense ratios. |
| (d) | The Investment Manager and certain of its affiliates agreed to waive/reimburse certain fees and expenses, if applicable. |
| (e) | The benefits derived from expense reductions had an impact of less than 0.01%. |
The Accompanying Notes to Financial Statements are an integral part of this statement.
19
Financial Highlights (continued) – Columbia Real Estate Equity Fund
| | | | |
| | | Year ended
December 31, 2011(a) | |
| Class R5 | | | |
| Per share data | | | | |
Net asset value, beginning of period | | | $12.73 | |
Income from investment operations: | | | | |
Net investment income | | | 0.21 | |
Net realized and unrealized gain | | | 0.31 | |
Total from investment operations | | | 0.52 | |
Less distributions to shareholders from: | | | | |
Net investment income | | | (0.24 | ) |
Net realized gains | | | (0.32 | ) |
Total distributions to shareholders | | | (0.56 | ) |
Redemption fees: | | | | |
Redemption fees added to paid-in capital | | | 0.02 | |
Net asset value, end of period | | | $12.71 | |
| Total return | | | 4.47% | |
| Ratios to average net assets(b) | | | | |
Expenses prior to fees waived or expenses reimbursed | | | 0.79% | (c) |
Net expenses after fees waived or expenses reimbursed(d) | | | 0.79% | (c)(e) |
Net investment income | | | 1.99% | (c)(e) |
| Supplemental data | | | | |
Net assets, end of period (in thousands) | | | $3,463 | |
Portfolio turnover | | | 72% | |
Notes to Financial Highlights
| (a) | For the period from March 7, 2011 (commencement of operations) to December 31, 2011. |
| (b) | In addition to the fees and expenses which the Fund bears directly, the Fund indirectly bears a pro rata share of the fees and expenses of the acquired funds in which it invests. Such indirect expenses are not included in the reported expense ratios. |
| (d) | The Investment Manager and certain of its affiliates agreed to waive/reimburse certain fees and expenses, if applicable. |
| (e) | The benefits derived from expense reductions had an impact of less than 0.01%. |
The Accompanying Notes to Financial Statements are an integral part of this statement.
20
Financial Highlights (continued) – Columbia Real Estate Equity Fund
| | | | | | | | |
| | | Year ended December 31, | |
| | | 2011 | | | 2010(a) | |
| Class W | | | | | | |
| Per share data | | | | | | | | |
Net asset value, beginning of period | | | $12.41 | | | | $11.75 | |
Income from investment operations: | | | | | | | | |
Net investment income (loss) | | | 0.18 | | | | (0.05 | ) |
Net realized and unrealized gain | | | 0.59 | | | | 0.81 | |
Total from investment operations | | | 0.77 | | | | 0.76 | |
Less distributions to shareholders from: | | | | | | | | |
Net investment income | | | (0.19 | ) | | | (0.10 | ) |
Net realized gains | | | (0.32 | ) | | | — | |
Total distributions to shareholders | | | (0.51 | ) | | | (0.10 | ) |
| Redemption fees: | | | | | | | | |
Redemption fees added to paid-in capital | | | 0.02 | | | | — | |
Net asset value, end of period | | | $12.69 | | | | $12.41 | |
| Total return | | | 6.58% | | | | 6.51% | (b) |
| Ratios to average net assets(c) | | | | | | | | |
Expenses prior to fees waived or expenses reimbursed | | | 1.27% | | | | 1.22% | (d)(e) |
Net expenses after fees waived or expenses reimbursed(f) | | | 1.24% | (g) | | | 1.22% | (d)(e)(g) |
Net investment income (loss) | | | 1.41% | (g) | | | (1.64% | )(d)(g) |
| Supplemental data | | | | | | | | |
Net assets, end of period (in thousands) | | | $6 | | | | $3 | |
Portfolio turnover | | | 72% | | | | 108% | |
Notes to Financial Highlights
| (a) | For the period from September 27, 2010 (commencement of operations) to December 31, 2010. |
| (b) | Total return includes a reimbursement of a loss experienced by the Fund due to a compliance violation. The reimbursement had an impact of less than 0.01% on total return. |
| (c) | In addition to the fees and expenses which the Fund bears directly, the Fund indirectly bears a pro rata share of the fees and expenses of the acquired funds in which it invests. Such indirect expenses are not included in the reported expense ratios. |
| (e) | Includes interest expense which rounds to less than 0.01%. |
| (f) | The Investment Manager and certain of its affiliates agreed to waive/reimburse certain fees and expenses, if applicable. |
| (g) | The benefits derived from expense reductions had an impact of less than 0.01%. |
The Accompanying Notes to Financial Statements are an integral part of this statement.
21
Financial Highlights (continued) – Columbia Real Estate Equity Fund
| | | | | | | | | | | | | | | | | | | | | | | | |
| | | Year ended December 31, | | | Year ended August 31, | |
| | | 2011 | | | 2010 | | | 2009(a) | | | 2009 | | | 2008 | | | 2007 | |
| Class Z | | | | | | | | | | | | | | | | | | |
| Per share data | | | | | | | | | | | | | | | | | | | | | | | | |
Net asset value, beginning of period | | | $12.43 | | | | $10.09 | | | | $9.13 | | | | $13.88 | | | | $20.74 | | | | $29.10 | |
Income from investment operations: | | | | | | | | | | | | | | | | | | | | | | | | |
Net investment income | | | 0.19 | | | | 0.14 | | | | 0.07 | | | | 0.24 | | | | 0.33 | | | | 0.29 | |
Net realized and unrealized gain (loss) | | | 0.60 | | | | 2.49 | | | | 1.10 | | | | (4.47 | ) | | | (1.10 | ) | | | 1.22 | |
Total from investment operations | | | 0.79 | | | | 2.63 | | | | 1.17 | | | | (4.23 | ) | | | (0.77 | ) | | | 1.51 | |
Less distributions to shareholders from: | | | | | | | | | | | | | | | | | | | | | | | | |
Net investment income | | | (0.22 | ) | | | (0.29 | ) | | | (0.13 | ) | | | (0.35 | ) | | | (0.19 | ) | | | (0.39 | ) |
Net realized gains | | | (0.32 | ) | | | — | | | | — | | | | — | | | | (5.90 | ) | | | (9.48 | ) |
Tax return of capital | | | — | | | | — | | | | (0.08 | ) | | | (0.17 | ) | | | — | | | | — | |
Total distributions to shareholders | | | (0.54 | ) | | | (0.29 | ) | | | (0.21 | ) | | | (0.52 | ) | | | (6.09 | ) | | | (9.87 | ) |
Proceeds from regulatory settlement | | | — | | | | 0.00 | (b) | | | — | | | | — | | | | — | | | | — | |
Redemption fees: | | | | | | | | | | | | | | | | | | | | | | | | |
Redemption fees added to paid-in-capital | | | 0.02 | | | | — | | | | — | | | | — | | | | — | | | | — | |
Net asset value, end of period | | | $12.70 | | | | $12.43 | | | | $10.09 | | | | $9.13 | | | | $13.88 | | | | $20.74 | |
| Total return | | | 6.73% | | | | 26.29% | (c) | | | 12.97% | | | | (29.71% | ) | | | (5.21% | ) | | | 1.95% | |
| Ratios to average net assets(d) | | | | | | | | | | | | | | | | | | | | | | | | |
Expenses prior to fees waived or expenses reimbursed | | | 1.03% | | | | 1.02% | (f) | | | 1.14% | (e) | | | 1.06% | | | | 1.03% | (f) | | | 0.96% | (f) |
Net expenses after fees waived or expenses reimbursed(g) | | | 1.01% | (h) | | | 1.02% | (f)(h) | | | 1.14% | (e)(h) | | | 1.06% | (h) | | | 1.03% | (f)(h) | | | 0.96% | (f)(h) |
Net investment income | | | 1.52% | (h) | | | 1.23% | (h) | | | 2.28% | (e)(h) | | | 2.96% | (h) | | | 2.17% | (h) | | | 1.11% | (h) |
| Supplemental data | | | | | | | | | | | | | | | | | | | | | | | | |
Net assets, end of period (in thousands) | | | $303,881 | | | | $304,497 | | | | $273,528 | | | | $238,485 | | | | $282,293 | | | | $377,388 | |
Portfolio turnover | | | 72% | | | | 108% | | | | 32% | | | | 110% | | | | 78% | | | | 67% | |
Notes to Financial Highlights
| (a) | For the period from September 1, 2009 to December 31, 2009. In 2009, the Fund’s fiscal year end was changed from August 31 to December 31. |
| (b) | Rounds to less than $0.01. |
| (c) | Total return includes a reimbursement of a loss experienced by the Fund due to a compliance violation. The reimbursement had an impact of less than 0.01% on total return. |
| (d) | In addition to the fees and expenses which the Fund bears directly, the Fund indirectly bears a pro rata share of the fees and expenses of the acquired funds in which it invests. Such indirect expenses are not included in the reported expense ratios. |
| (f) | Includes interest expense which rounds to less than 0.01%. |
| (g) | The Investment Manager and certain of its affiliates agreed to waive/reimburse certain fees and expenses, if applicable. |
| (h) | The benefits derived from expense reductions had an impact of less than 0.01%. |
The Accompanying Notes to Financial Statements are an integral part of this statement.
22
Notes to Financial Statements – Columbia Real Estate Equity Fund
December 31, 2011
Note 1. Organization
Columbia Real Estate Equity Fund (the Fund), a series of Columbia Funds Series Trust I (the Trust), is a non-diversified fund. The Trust is registered under the Investment Company Act of 1940, as amended (the 1940 Act), as an open-end management investment company organized as a Massachusetts business trust.
Fund Shares
The Trust may issue an unlimited number of shares (without par value). The Fund offers Class A, Class B, Class C, Class I, Class R, Class R4, Class R5, Class W and Class Z shares. All share classes have identical voting, dividend and liquidation rights. Each share class has its own expense structure and sales charges, as applicable.
Class A shares are subject to a maximum front-end sales charge of 5.75% based on the initial investment amount. Class A shares purchased without an initial sales charge in accounts aggregating $1 million to $50 million at the time of purchase are subject to a contingent deferred sales charge (CDSC) if the shares are sold within 18 months of purchase, charged as follows: 1.00% CDSC if redeemed within 12 months of purchase, and 0.50% CDSC if redeemed more than 12, but less than 18, months after purchase.
Class B shares may be subject to a maximum CDSC of 5.00% based upon the holding period after purchase. Class B shares will generally convert to Class A shares eight years after purchase. The Fund no longer accepts investments by new or existing investors in the Fund’s Class B shares, except in connection with the reinvestment of any dividend and/or capital gain distributions in Class B shares of the Fund and exchanges by existing Class B shareholders of certain other funds within the Columbia Family of Funds.
Class C shares are subject to a 1.00% CDSC on shares redeemed within one year of purchase.
Class I shares are not subject to sales charges and are only available to the Columbia Family of Funds.
Class R shares are not subject to sales charges and are only available to qualifying institutional investors.
The Fund is authorized to issue Class R4 shares, which are not subject to sales charges; however, this share class is closed to new investors. Class R4 shares commenced operations on March 7, 2011.
The Fund is authorized to issue Class R5 shares, which are not subject to sales charges; however, this share class is closed to new investors. Class R5 shares commenced operations on March 7, 2011.
Class W shares are not subject to sales charges and are only available to investors purchasing through authorized investment programs managed by investment professionals, including discretionary managed account programs.
Class Z shares are not subject to sales charges, and are only available to certain investors, as described in the Fund’s prospectus.
Note 2. Summary of Significant Accounting Policies
Use of Estimates
The preparation of financial statements in accordance with U.S. generally accepted accounting principles (GAAP) requires management to make certain estimates and assumptions that affect the reported amounts of assets and liabilities, the disclosure of contingent assets and liabilities at the date of the financial statements and the reported amounts of revenue and expenses during the reporting period. Actual results could differ from those estimates.
The following is a summary of significant accounting policies consistently followed by the Fund in the preparation of its financial statements.
Security Valuation
All equity securities are valued at the close of business of the New York Stock Exchange (NYSE). Equity securities are valued at the last quoted sales price on the principal exchange or market on which they trade, except for securities traded on the NASDAQ Stock Market, which are valued at the NASDAQ official close price. Unlisted securities or listed securities for which there were no sales during the day are valued at the mean of the latest quoted bid and asked prices on such exchanges or markets.
Debt securities generally are valued by pricing services approved by the Board of Trustees (the Board) based upon market transactions for normal, institutional-size trading units of similar securities. The services may use various pricing techniques which take into account appropriate factors such as yield, quality, coupon rate, maturity, type of issue, trading characteristics and other data, as well as broker quotes. Debt securities for which quotations are readily available may also be valued based upon an over-the-counter or exchange bid quotation.
Investments in other open-end investment companies, including money market funds, are valued at net asset value.
23
Columbia Real Estate Equity Fund
December 31, 2011
Short-term securities purchased within 60 days to maturity are valued at amortized cost, which approximates market value. The value of short-term securities originally purchased with maturities greater than 60 days is determined based on an amortized value to par upon reaching 60 days to maturity. Short-term securities maturing in more than 60 days from the valuation date are valued at the market price or approximate market value based on current interest rates.
Forward foreign currency exchange contracts are marked-to-market based upon foreign currency exchange rates provided by a pricing service.
Investments for which market quotations are not readily available, or that have quotations which management believes are not reliable, are valued at fair value as determined in good faith under consistently applied procedures established by and under the general supervision of the Board. If a security or class of securities (such as foreign securities) is valued at fair value, such value is likely to be different from the last quoted market price for the security. The determination of fair value often requires significant judgment. To determine fair value, management may use assumptions including but not limited to future cash flows and estimated risk premiums. Multiple inputs from various sources may be used to determine value.
Derivative Instruments
The Fund invests in certain derivative instruments as detailed below to meet its investment objectives. Derivatives are instruments whose values depend on, or are derived from, in whole or in part, the value of one or more other assets, such as securities, currencies, commodities or indices. Derivative instruments may be used to maintain cash reserves while maintaining exposure to certain other assets, to offset anticipated declines in values of investments, to facilitate trading, to reduce transaction costs and to pursue higher investment returns. The Fund may also use derivative instruments to mitigate certain investment risks, such as foreign currency exchange rate risk, interest rate risk and credit risk. Derivatives may involve various risks, including the potential inability of the counterparty to fulfill its obligation under the terms of the contract, the potential for an illiquid secondary market and the potential for market movements which may expose the Fund to gains or losses in excess of the amount shown in the Statement of Assets and Liabilities.
The Fund and any counterparty are required to maintain an agreement that requires the Fund and that counterparty to monitor (on a daily basis) the net fair value of all derivatives entered into
pursuant to the agreement between the Fund and such counterparty. If the net fair value of such derivatives between the Fund and that counterparty exceeds a certain threshold (as defined in the agreement), the Fund or the counterparty (as the case may be) is required to post cash and/or securities as collateral. Fair values of derivatives presented in the financial statements are not netted with the fair value of other derivatives or with any collateral amounts posted by the Fund or any counterparty.
Forward Foreign Currency Exchange Contracts
Forward foreign currency exchange contracts are agreements between two parties to buy and sell a currency at a set price on a future date. These contracts are intended to be used to minimize the exposure to foreign exchange rate fluctuations during the period between the trade and settlement dates of the contract. The Fund’s custodian entered into forward foreign currency exchange contracts on the Fund’s behalf in order to facilitate the settlement of purchases and sales of securities.
The values of forward foreign currency exchange contracts fluctuate with changes in foreign currency exchange rates. The Fund will record a realized gain or loss when the forward foreign currency exchange contract is closed.
The use of forward foreign currency exchange contracts does not eliminate fluctuations in the prices of the Fund’s portfolio securities. The risks of forward foreign currency exchange contracts include movement in the values of the foreign currencies relative to the U.S. dollar (or other foreign currencies) and the possibility that counterparties will not complete their contractual obligations, which may be in excess of the amount reflected, if any, in the Statement of Assets and Liabilities.
Effects of Derivative Transactions in the Financial Statements
The following tables are intended to provide additional information about the effect of derivatives on the financial statements of the Fund, including: the fair value of derivatives by risk category and the location of those fair values in the Statement of Assets and Liabilities; the impact of derivative transactions on the Fund’s operations over the period including realized gains or losses and unrealized gains or losses. The derivative schedules following the Portfolio of Investments present additional information regarding derivative instruments outstanding at the end of the period, if any.
24
Columbia Real Estate Equity Fund
December 31, 2011
Fair Values of Derivative Instruments at December 31, 2011
At December 31, 2011, the fund had no outstanding derivatives.
Effect of Derivative Instruments in the Statement of Operations for the Year Ended December 31, 2011
| | | | |
| | | | |
| | | Amount of Realized Gain (Loss) on
Derivatives Recognized in Income | |
| Risk Exposure Category | | Forward Foreign Currency
Exchange Contracts | |
Foreign exchange contracts | | $ | 74,332 | |
| | | | |
| | | | |
| | | Change in Unrealized Appreciation
(Depreciation) on Derivatives
Recognized in Income | |
| Risk Exposure Category | | Forward Foreign Currency
Exchange Contracts | |
| Foreign exchange contracts | | | $— | |
Volume of Derivative Instruments for the Year Ended December 31, 2011
| | | | |
| | | | |
| | | Contracts Opened | |
| Forward Foreign Currency Exchange Contracts | | | 105 | |
Repurchase Agreements
The Fund may engage in repurchase agreement transactions with institutions that management has determined are creditworthy. The Fund, through the custodian, receives delivery of the underlying securities collateralizing a repurchase agreement. Management is responsible for determining that the collateral is at least equal, at all times, to the value of the repurchase obligation including interest. A repurchase agreement transaction involves certain risks in the event of default or insolvency of the counterparty. These risks include possible delays in or restrictions on a Fund’s ability to dispose of the underlying securities and a possible decline in the value of the underlying securities during the period while the Fund seeks to assert its rights.
Security Transactions
Security transactions are accounted for on the trade date. Cost is determined and gains (losses) are based upon the specific identification method for both financial statement and federal income tax purposes.
Income Recognition
Interest income is recorded on the accrual basis.
The Fund receives distributions from holdings in real estate investment trusts (REITs) which report information on the character of their distributions annually. REIT distributions are allocated to dividend income, capital gain and return of capital based on estimates made by the Fund’s management if actual information has not yet been reported. Return of capital is recorded as a reduction of the cost basis of securities held. Management’s estimates are subsequently adjusted when the actual character of the distributions is disclosed by the REITs which could result in a proportionate increase in return of capital to shareholders.
Expenses
General expenses of the Trust are allocated to the Fund and other funds of the Trust based upon relative net assets or other expense allocation methodologies determined by the nature of the expense. Expenses directly attributable to the Fund are charged to the Fund. Expenses directly attributable to a specific class of shares are charged to that share class.
Determination of Class Net Asset Value
All income, expenses (other than class-specific expenses, which are charged to that share class, as shown in the Statement of Operations) and realized and unrealized gains (losses) are allocated to each class of the Fund on a daily basis, based on the relative net assets of each class, for purposes of determining the net asset value of each class.
Federal Income Tax Status
The Fund intends to qualify each year as a regulated investment company under Subchapter M of the Internal Revenue Code, as amended, and will distribute substantially all of its tax exempt or taxable income (including net short-term capital gains), if any, for its tax year, and as such will not be subject to federal income taxes. In addition, the Fund intends to distribute in each calendar year substantially all of its net investment income, capital gains and certain other amounts, if any, such that the Fund should not be subject to federal excise tax. Therefore, no federal income or excise tax provision is recorded.
Distributions to Shareholders
Distributions from net investment income, if any, are declared and paid each calendar quarter. Net realized capital gains, if any, are distributed along with the income dividend. Income distributions and capital gain distributions are determined in accordance with federal income tax regulations which may differ from GAAP.
25
Columbia Real Estate Equity Fund
December 31, 2011
Guarantees and Indemnifications
Under the Trust’s organizational documents and, in some cases, by contract, its officers and trustees are indemnified against certain liabilities arising out of the performance of their duties to the Trust or its funds. In addition, certain of the Fund’s contracts with its service providers contain general indemnification clauses. The Fund’s maximum exposure under these arrangements is unknown since the amount of any future claims that may be made against the Fund cannot be determined, and the Fund has no historical basis for predicting the likelihood of any such claims.
Recent Accounting Pronouncement
Fair Value Measurements and Disclosures
In May 2011, the Financial Accounting and Standards Board (FASB) issued ASU No. 2011-04 modifying Topic 820, Fair Value Measurements and Disclosures. At the same time, the International Accounting Standards Board (IASB) issued International Financial Reporting Standard 13, Fair Value Measurement. The objective of the FASB and IASB is convergence of their guidance on fair value measurements and disclosures.
Specifically, ASU No. 2011-04 requires reporting entities to disclose i) the amounts of any transfers between Level 1 and Level 2, and the reasons for the transfers, ii) for Level 3 fair value measurements, a) quantitative information about significant unobservable inputs used, b) a description of the valuation processes used by the reporting entity and c) a narrative description of the sensitivity of the fair value measurement to changes in unobservable inputs if a change in those inputs might result in a significantly higher or lower fair value measurement. The effective date of ASU No. 2011-04 is for interim and annual periods beginning after December 15, 2011. At this time, management is evaluating the implications of this guidance and the impact it will have on the financial statement amounts and footnote disclosures, if any.
Note 3. Fees and Compensation Paid to Affiliates
Investment Management Fees
Under an Investment Management Services Agreement (IMSA), Columbia Management Investment Advisers, LLC (the Investment Manager), a wholly-owned subsidiary of Ameriprise Financial, Inc. (Ameriprise Financial), determines which securities will be purchased, held or sold. Effective March 1, 2011, the management fee is an annual fee that is equal to a percentage of the Fund’s
average daily net assets that declines from 0.69% to 0.62% as the Fund’s net assets increase. Prior to March 1, 2011, the management fee was equal to 0.75% of the Fund’s average daily net assets. The effective management fee rate for the year ended December 31, 2011 was 0.70% of the Fund’s average daily net assets.
Administration Fees
Under an Administrative Services Agreement, the Investment Manager serves as the Fund Administrator. Effective March 1, 2011, the Fund pays the Fund Administrator an annual fee for administration and accounting services equal to a percentage of the Fund’s average daily net assets that declines from 0.06% to 0.04% as the Fund’s net assets increase. Prior to March 1, 2011, the Investment Manager did not receive a fee for its services under the Administration Services Agreement. The effective administration fee rate for the year ended December 31, 2011 was 0.05% of the Fund’s average daily net assets.
Pricing and Bookkeeping Fees
Prior to March 28, 2011, the Fund had entered into a Financial Reporting Services Agreement (the Financial Reporting Services Agreement) with State Street Bank and Trust Company (State Street) and the Investment Manager pursuant to which State Street provided financial reporting services to the Fund. The Fund also entered into an Accounting Services Agreement (collectively with the Financial Reporting Services Agreement, the State Street Agreements) with State Street and the Investment Manager pursuant to which State Street provided accounting services to the Fund. Under the State Street Agreements, the Fund paid State Street an annual fee of $38,000 paid monthly plus an additional monthly fee based on an annualized percentage rate of average daily net assets of the Fund for the month. The aggregate fee did not exceed $140,000 per year (exclusive of out-of-pocket expenses and charges). The Fund also reimbursed State Street for certain out-of-pocket expenses and charges. Effective March 28, 2011, these services are now provided under the Administrative Services Agreement discussed above.
Compensation of Board Members
Board members are compensated for their services to the Fund as disclosed in the Statement of Operations. The Trust’s eligible Trustees may participate in a Deferred Compensation Plan (the Plan) which may be terminated at any time. Obligation of the Plan will be paid solely out of the Fund’s assets.
26
Columbia Real Estate Equity Fund
December 31, 2011
Compensation of Chief Compliance Officer
The Board has appointed a Chief Compliance Officer to the Fund in accordance with federal securities regulations. The Fund, along with other affiliated funds, pays its pro-rata share of the expenses associated with the Chief Compliance Officer. The Fund’s expenses for the Chief Compliance Officer will not exceed $15,000 per year.
Transfer Agent Fees
Under a Transfer and Dividend Disbursing Agent Agreement, Columbia Management Investment Services Corp. (the Transfer Agent), an affiliate of the Investment Manager and a wholly-owned subsidiary of Ameriprise Financial, is responsible for providing transfer agency services to the Fund. The Transfer Agent has contracted with Boston Financial Data Services (BFDS) to serve as sub-transfer agent.
The Transfer Agent receives monthly account-based service fees based on the number of open accounts and is reimbursed by the Fund for the fees and expenses the Transfer Agent pays to financial intermediaries that maintain omnibus accounts with the Fund that is a percentage of the average aggregate value of the Fund’s shares maintained in each such omnibus account (other than omnibus accounts for which American Enterprise Investment Services Inc. is the broker of record or accounts where the beneficial shareholder is a customer of Ameriprise Financial Services, Inc., which are paid a per account fee). The Transfer Agent pays the fees of BFDS for services as sub-transfer agent and is not entitled to reimbursement for such fees from the Fund (with the exception of out-of-pocket fees).
The Transfer Agent also receives compensation from fees for various shareholder services and reimbursements for certain out-of-pocket expenses. Class I shares do not pay transfer agent fees. Total transfer agent fees for Class R4 and Class R5 shares are subject to an annual limitation of not more than 0.05% of the average daily net assets attributable to each share class.
For the year ended December 31, 2011, the Fund’s effective transfer agent fee rates as a percentage of average daily net assets of each class were as follows:
| | | | |
| | | | |
| Class A | | | 0.21 | % |
| Class B | | | 0.22 | |
| Class C | | | 0.22 | |
| Class R | | | 0.22 | |
| Class R4* | | | 0.04 | |
| Class R5* | | | 0.00 | |
| Class W | | | 0.22 | |
| Class Z | | | 0.22 | |
An annual minimum account balance fee of $20 may apply to certain accounts with a value below the Fund’s initial minimum investment requirements to reduce the impact of small accounts on transfer agent fees. These minimum account balance fees are recorded as part of expense reductions in the Statement of Operations. For the year ended December 31, 2011, these minimum account balance fees reduced total expenses by $6,042.
The Fund and certain other associated investment companies (together, the Guarantors), have severally, but not jointly, guaranteed the performance and observance of all the terms and conditions of a lease entered into by Seligman Data Corp. (SDC), the former transfer agent, including the payment of rent by SDC (the Guaranty). The lease and the Guaranty expire in January 2019. At December 31, 2011, the Fund’s total potential future obligation over the life of the Guaranty is $41,220. The liability remaining at December 31, 2011 for non-recurring charges associated with the lease amounted to $27,177 and is included within other accrued expenses in the Statement of Assets and Liabilities.
Plan Administration Fees
Under a Plan Administration Services Agreement with the Transfer Agent, the Fund pays an annual fee at a rate of 0.25% of the Fund’s average daily net assets attributable to Class R4 shares for the provision of various administrative, recordkeeping, communication and educational services.
Distribution and Service Fees
The Fund has an agreement with Columbia Management Investment Distributors, Inc. (the Distributor), an affiliate of the Investment Manager and a wholly-owned subsidiary of Ameriprise Financial,
27
Columbia Real Estate Equity Fund
December 31, 2011
for distribution and shareholder services. Pursuant to Rule 12b-1 under the 1940 Act, the Board has approved, and the Fund has adopted, distribution and shareholder service plans (the Plans) which set the distribution and service fees for the Fund. These fees are calculated daily and are intended to compensate the Distributor and/or eligible selling and/or servicing agents for selling shares of the Fund and providing services to investors.
The Plans require the payment of a monthly service fee to the Distributor at the maximum annual rate of 0.25% of the average daily net assets attributable to Class A, Class B, Class C and Class W shares of the Fund. The Plans also require the payment of a monthly distribution fee to the Distributor at the maximum annual rates of 0.10%, 0.75%, 0.75%, 0.50% and 0.25% of the average daily net assets attributable to Class A, Class B, Class C, Class R and Class W shares, respectively.
The Fund may pay distribution and service fees up to a maximum annual rate of 0.35% of the Fund’s average daily net assets attributable to Class A shares (comprised of up to 0.10% for distribution services and up to 0.25% for shareholder liaison services), but currently limit such fees to an aggregate fee of not more than 0.25% of the Fund’s average daily net assets attributable to Class A shares.
The Fund may pay a distribution fee of up to 0.25% of the Fund’s average daily net assets attributable to Class W shares and a service fee of up to 0.25% of the Fund’s average daily net assets attributable to Class W shares, provided, however, that the aggregate fee shall not exceed 0.25% of the Fund’s average daily net assets attributable to Class W shares.
Sales Charges
Sales charges, including front-end charges and CDSCs, received by the Distributor for distributing Fund shares were $102,309 for Class A, $3,425 for Class B and $683 for Class C shares for the year ended December 31, 2011.
Expenses Waived/Reimbursed by the Investment Manager and its Affiliates
Effective March 1, 2011, the Investment Manager and certain of its affiliates have contractually agreed to waive fees and/or reimburse expenses (excluding certain fees and expenses described below), through April 30, 2012, unless sooner terminated at the sole discretion of the Board, so that the Fund’s net operating expenses, after giving effect to fees waived/expenses reimbursed and any
balance credits and/or overdraft charges from the Fund’s custodian, do not exceed the following annual rates as a percentage of the class’ average daily net assets:
| | | | |
| | |
| Class A | | | 1.26 | % |
| Class B | | | 2.01 | |
| Class C | | | 2.01 | |
| Class I | | | 0.90 | |
| Class R | | | 1.51 | |
| Class R4 | | | 1.20 | |
| Class R5 | | | 0.95 | |
| Class W | | | 1.26 | |
| Class Z | | | 1.01 | |
Prior to March 1, 2011, the Investment Manager and its affiliates voluntarily agreed to waive fees and/or reimburse expenses (excluding certain fees and expenses described below), so that the Fund’s net operating expenses, after giving effect to fees waived/expenses reimbursed and any balance credits and/or overdraft charges from the Fund’s custodian, did not exceed the following annual rates as a percentage of the class’ average daily net assets:
| | | | |
| | |
| Class A | | | 1.45 | % |
| Class B | | | 2.20 | |
| Class C | | | 2.20 | |
| Class I | | | 1.07 | |
| Class R | | | 1.70 | |
| Class W | | | 1.45 | |
| Class Z | | | 1.20 | |
Under the agreement, the following fees and expenses are excluded from the waiver/reimbursement commitment, and therefore will be paid by the Fund, if applicable: taxes (including foreign transaction taxes), expenses associated with investments in affiliated and non-affiliated pooled investment vehicles (including mutual funds and exchange traded funds), transaction costs and brokerage commissions, costs related to any securities lending program, dividend expenses associated with securities sold short, inverse floater program fees and expenses, transaction charges and interest on borrowed money, interest, extraordinary expenses and any other expenses the exclusion of which is specifically approved by the Board. This agreement may be modified or amended only with approval from all parties.
28
Columbia Real Estate Equity Fund
December 31, 2011
Note 4. Federal Tax Information
The timing and character of income and capital gain distributions are determined in accordance with income tax regulations, which may differ from GAAP because of temporary or permanent book to tax differences.
For the year ended December 31, 2011, these differences are primarily due to foreign currency transactions, passive foreign investment company (PFIC) holdings, excess distributions, capital loss carryforward limitations related to ownership changes, post-October capital losses, and deferral/reversal of wash sale losses. To the extent these differences are permanent, reclassifications are made among the components of the Fund’s net assets in the Statement of Assets and Liabilities. Temporary differences do not require reclassifications. In the Statement of Assets and Liabilities the following reclassifications were made:
| | | | |
| | |
| Overdistributed net investment income | | $ | 7,704,462 | |
| Accumulated net realized loss | | | 107,705,862 | |
| Paid-in capital | | | (115,410,324 | ) |
Net investment income and net realized gains (losses), as disclosed in the Statement of Operations, and net assets were not affected by this reclassification.
The tax character of distributions paid during the years indicated was as follows:
| | | | |
| Year ended December 31, | | 2011 | | 2010 |
| Ordinary income* | | $ 9,131,986 | | $8,104,155 |
| Long-term capital gains | | 12,853,060 | | 596,978 |
| * | Short-term capital gain distributions, if any, are considered ordinary income distributions for tax purposes. |
At December 31, 2011, the components of distributable earnings on a tax basis were as follows:
| | | | |
| | | | |
| Unrealized appreciation | | $ | 105,280,819 | |
At December 31, 2011, the cost of investments for federal income tax purposes was $500,411,431 and the aggregate gross unrealized appreciation and depreciation based on that cost was:
| | | | |
| | | | |
| Unrealized appreciation | | $ | 109,224,605 | |
| Unrealized depreciation | | | (3,943,786 | ) |
| | | | |
| Net unrealized appreciation | | $ | 105,280,819 | |
The following capital loss carryforward, determined at December 31, 2011, may be available to reduce taxable income arising from future net realized gains on investments, if any, to the extent permitted by the Internal Revenue Code:
| | | | |
| | | | |
| Year of Expiration | | Amount | |
| 2014 | | $ | 1,671,366 | |
| 2015 | | | 31,861,197 | |
| 2016 | | | 10,496,317 | |
| 2017 | | | 19,370,084 | |
| | | | |
| Total | | $ | 63,398,964 | |
For the year ended December 31, 2011, capital loss carryforwards of $113,019,892 were permanently lost and $20,438,418 were utilized to offset current year gains.
Columbia Real Estate Equity Fund acquired capital loss carryforwards in connection with the merger with RiverSource LaSalle Global Real Estate Fund, RiverSource Real Estate Fund, RiverSource LaSalle Monthly Dividend Real Estate Fund, and RiverSource LaSalle International Real Estate Fund of $18,257,511, $31,281,424, $39,100,200, and $108,218,139 respectively (Note 13). In addition to the acquired capital loss carryforwards, the Fund also acquired unrealized capital gains as a result of the merger. The yearly utilization of the acquired capital loss carryforwards may be limited by the Internal Revenue Code. Any capital loss carryforwards acquired as part of a merger that are permanently lost due to the provisions under the Internal Revenue Code are included as being expired.
Under current tax rules, Regulated Investment Companies can elect to treat certain late-year ordinary losses incurred and post-October capital losses (capital losses realized after October 31) as arising on the first day of the following taxable year. As of December 31, 2011, the fund will elect to treat post-October capital losses of $2,143,728 as arising on January 1, 2012.
On December 22, 2010, the Regulated Investment Company Modernization Act of 2010 (the Act) was enacted, which changed various technical rules governing the tax treatment of regulated investment companies. The changes are generally effective for taxable years beginning after the date of enactment. Under the Act, the Fund will be permitted to carry forward capital losses incurred in taxable years beginning after the date of enactment for an unlimited period. However, any losses incurred during those future taxable years will be required to be utilized prior to the losses incurred in
29
Columbia Real Estate Equity Fund
December 31, 2011
pre-enactment taxable years, which carry an expiration date. As a result of this ordering rule, pre-enactment capital loss carryforwards may be more likely to expire unused.
Management of the Fund has concluded that there are no significant uncertain tax positions that would require recognition in the financial statements. However, management’s conclusion may be subject to review and adjustment at a later date based on factors including, but not limited to, new tax laws, regulations, and administrative interpretations (including relevant court decisions). Generally, the Fund’s federal tax returns for the prior three fiscal years remain subject to examination by the Internal Revenue Service.
Note 5. Portfolio Information
The cost of purchases and proceeds from sales of securities, excluding short-term obligations, aggregated to $387,506,164 and $632,483,432, respectively, for the year ended December 31, 2011.
Transactions to realign the Fund’s portfolio following the merger as described in Note 13 are excluded for purposes of calculating the Fund’s portfolio turnover rate. These realignment transactions amounted to cost of purchases and proceeds from sales of $112,147,745 and $109,872,247, respectively.
Note 6. Regulatory Settlements
During the year ended December 31, 2010, the Fund received payments of $22,629 resulting from certain regulatory settlements with third parties in which the Fund had participated. The payments have been included in “Proceeds from regulatory settlements” in the Statement of Changes in Net Assets.
Note 7. Redemption Fees
Effective April 11, 2011, the Fund assesses a 2.00% redemption fee on the proceeds from fund shares only to shareholders who received their Class Z shares pursuant to the reorganization of RiverSource LaSalle International Real Estate Fund and only if such shareholders redeem such shares (by sale or exchange) on or before April 11, 2011.
The redemption fee is designed to offset brokerage commissions and other costs associated with short term trading of fund shares. The redemption fee, which is retained by the Fund, is accounted for as an addition to paid-in capital. Redemption fees received by the Fund for the year ended December 31, 2011 (all of which were received during the period April 11, 2011 through December 31, 2011) are disclosed in the Statement of Changes in Net Assets.
Note 8. Lending of Portfolio Securities
Effective March 28, 2011, the Fund has entered into a Master Securities Lending Agreement (the Agreement) with JPMorgan Chase Bank, N.A. (JPMorgan). The Agreement, which replaces the previous security lending arrangement with State Street, authorizes JPMorgan as lending agent to lend securities to authorized borrowers in order to generate additional income on behalf of the Fund. Pursuant to the Agreement, the securities loaned are secured by cash or U.S. government securities equal to at least 100% of the market value of the loaned securities. Any additional collateral required to maintain those levels due to market fluctuations of the loaned securities is requested to be delivered the following business day. Cash collateral received is invested by the lending agent on behalf of the Fund into authorized investments pursuant to the Agreement. The investments made with the cash collateral are listed in the Portfolio of Investments. The values of such investments and any uninvested cash collateral are disclosed in the Statement of Assets and Liabilities along with the related obligation to return the collateral upon the return of the securities loaned.
At December 31, 2011, securities valued at $93,947,334 were on loan, secured by cash collateral of $97,932,346 (which does not reflect calls for collateral made to borrowers by JPMorgan at period end) that is partially or fully invested in short-term securities or other cash equivalents.
Risks of delay in recovery of securities or even loss of rights in the securities may occur should the borrower of the securities fail financially. Risks may also arise to the extent that the value of the securities loaned increases above the value of the collateral received. JPMorgan will indemnify the Fund from losses resulting from a borrower’s failure to return a loaned security when due. Such indemnification does not extend to losses associated with declines in the value of cash collateral investments. The Investment Manager is not responsible for any losses incurred by the Fund in connection with the securities lending program. Loans are subject to termination by the Fund or the borrower at any time, and are, therefore, not considered to be illiquid investments.
Pursuant to the Agreement, the Fund receives income for lending its securities either in the form of fees or by earning interest on invested cash collateral, net of negotiated rebates paid to borrowers and fees paid to the lending agent for services provided and any other securities lending expenses. Net income earned from securities lending for the year ended December 31, 2011 is disclosed in the Statement of Operations. The Fund continues to earn and accrue interest and dividends on the securities loaned.
30
Columbia Real Estate Equity Fund
December 31, 2011
Prior to March 28, 2011, the Fund participated in a securities lending arrangement with State Street. Each security on loan was collateralized in an amount at least equal to the market value of the securities loaned plus accrued income from the investment of collateral. The income generated by the investment of the collateral, net of any fees remitted to State Street as the lending agent and borrower rebates, was paid to the Fund.
Note 9. Custody Credits
Prior to March 28, 2011, the Fund had an agreement with its custodian bank under which custody fees may have been reduced by balance credits. These credits are recorded as part of expense reductions on the Statement of Operations. The Fund could have invested a portion of the assets utilized in connection with the expense offset arrangement in an income-producing asset if they had not entered into such an agreement. Subsequent to this date, the Fund may invest its daily balance in an affiliated money market fund as detailed below. For the period January 1, 2011 through March 27, 2011, these credits reduced total expenses by $1.
Note 10. Affiliated Money Market Fund
Effective March 28, 2011, the Fund may invest its daily cash balances in Columbia Short-Term Cash Fund, a money market fund established for the exclusive use by the Fund and other affiliated funds. The income earned by the Fund from such investments is included as “Dividends from affiliates” in the Statement of Operations. As an investing fund, the Fund indirectly bears its proportionate share of the expenses of Columbia Short-Term Cash Fund.
Note 11. Shareholder Concentration
At December 31, 2011, two unaffiliated shareholder accounts owned 34.4% of the outstanding shares of the Fund. The Fund has no knowledge about whether any portion of those shares was owned beneficially. Affiliated shareholder accounts owned 13.4% of the outstanding shares of the Fund. Subscription and redemption activity of these accounts may have a significant effect on the operations of the Fund.
Note 12. Line of Credit
The Fund has entered into a revolving credit facility with a syndicate of banks led by JPMorgan Chase Bank, N.A. (the Administrative Agent), whereby the Fund may borrow for the temporary funding of shareholder redemptions or for other temporary or emergency purposes. The credit facility became effective on March 28, 2011,
replacing a prior credit facility. The credit facility agreement, as amended, which is a collective agreement between the Fund and certain other funds managed by the Investment Manager, severally and not jointly, permits collective borrowings up to $500 million. Pursuant to a December 13, 2011 amendment to the credit facility agreement, interest is charged to each participating fund based on its borrowings at a rate equal to the higher of (i) the overnight federal funds rate plus 1.00% or (i) the one-month LIBOR rate plus 1.00%. Each borrowing under the credit facility matures no later than 60 days after the date of borrowing. The Fund also pays a commitment fee equal to its pro rata share of the amount of the credit facility at a rate of 0.08% per annum.
For the period March 28, 2011 through December 13, 2011, interest was charged to each participating fund based on its borrowings at a rate equal to the sum of the federal funds rate plus (i) 1.25% per annum plus (ii) if one-month LIBOR exceeds the federal funds rate, the amount of such excess. The Fund also paid a commitment fee equal to its pro rata share of the amount of the credit facility at a rate of 0.10% per annum.
Prior to March 28, 2011, the Fund and certain other funds managed by the Investment Manager participated in a $280 million committed, unsecured revolving credit facility provided by State Street. Interest was charged to each fund based on its borrowings at a rate equal to the greater of the (i) federal funds rate plus 1.25% per annum or (ii) the overnight LIBOR rate plus 1.25% per annum. The Fund also paid a commitment fee equal to its pro rata share of the amount of the credit facility at a rate of 0.125% per annum.
The Fund had no borrowings during the year ended December 31, 2011.
Note 13. Fund Merger
At the close of business on April 8, 2011, Columbia Real Estate Equity Fund acquired the assets and assumed the identified liabilities of RiverSource LaSalle Monthly Dividend Real Estate Fund, RiverSource Real Estate Fund, RiverSource LaSalle Global Real Estate Fund, and RiverSource LaSalle International Real Estate Fund. The mergers were completed after shareholders of the acquired funds approved the plan on February 15, 2011.
The aggregate net assets of Columbia Real Estate Equity Fund immediately before the acquisitions were $376,118,171 and the combined net assets immediately after the acquisitions were $737,998,908. The acquisitions were accomplished by a tax-free exchange of 6,732,469 shares of RiverSource LaSalle Monthly
31
Columbia Real Estate Equity Fund
December 31, 2011
Dividend Real Estate Fund valued at $32,200,020 (including unrealized appreciation of $10,826,277); 19,288,542 shares of RiverSource Real Estate Fund valued at $217,100,607 (including unrealized appreciation of $26,920,212); 3,559,733 shares of RiverSource LaSalle Global Real Estate Fund valued at $14,932,477 (including unrealized appreciation of $2,556,790) and 9,613,304 shares of RiverSource LaSalle International Real Estate Fund valued at $97,647,633 (including unrealized appreciation of $9,524,654).
In exchange for shares of RiverSource LaSalle Monthly Dividend Real Estate Fund, RiverSource Real Estate Fund, RiverSource LaSalle Global Real Estate Fund and RiverSource LaSalle International Real Estate Fund, Columbia Real Estate Equity Fund issued the following number of shares:
| | | | | | | | |
| |
| | | RiverSource
LaSalle
Monthly
Dividend
Real Estate
Fund | | RiverSource
Real Estate
Fund | | RiverSource
LaSalle
Global
Real Estate
Fund | | RiverSource
LaSalle
International
Real Estate
Fund |
| Class A | | 766,429 | | 4,843,064 | | 278,297 | | — |
| Class B | | 165,212 | | 478,774 | | — | | — |
| Class C | | 811,623 | | 149,525 | | 156,995 | | — |
| Class I | | 181,168 | | 11,523,095 | | 590,956 | | — |
| Class R | | 456,117 | | — | | 16,355 | | — |
| Class R4 | | 1,955 | | 2,808 | | 760 | | — |
| Class R5 | | 141,132 | | — | | 125,893 | | — |
| Class W | | — | | 241 | | — | | — |
| Class Z | | — | | — | | — | | 7,642,501 |
For financial reporting purposes, net assets received and shares issued by Columbia Real Estate Equity Fund were recorded at fair value; however, RiverSource LaSalle Monthly Dividend Real Estate Fund, RiverSource Real Estate Fund, RiverSource LaSalle Global Real Estate Fund, and RiverSource LaSalle International Real Estate Fund’s cost of investments were carried forward.
The financial statements reflect the operations of Columbia Real Estate Equity Fund for the period prior to the mergers and the combined fund for the period subsequent to the mergers. Because the combined investment portfolios have been managed as a single integrated portfolio since the mergers were completed, it is not practicable to separate the amounts of revenue and earnings of RiverSource LaSalle Monthly Dividend Real Estate Fund, RiverSource Real Estate Fund, RiverSource LaSalle Global Real Estate Fund, and RiverSource LaSalle International Real Estate
Fund that have been included in the combined Fund’s Statement of Operations since the mergers were completed.
Assuming the mergers had been completed on January 1, 2011, Columbia Real Estate Equity Fund’s pro-forma net investment income, net gain on investments, net change in unrealized depreciation and net increase in net assets from operations for the year ended December 31, 2011 would have been $14.1 million, $46.6 million, $(14.7) million and $46.0 million, respectively.
Note 14. Significant Risks
Sector Focus Risk
The Fund may focus its investments in certain sectors, subjecting it to greater risk than a fund that invests in a wider range of industries.
Non-Diversification Risk
A non-diversified fund is permitted to invest a greater percentage of its total assets in fewer issuers than a diversified fund. The Fund may, therefore, have a greater risk of loss from a few issuers than a similar fund that invests more broadly.
Real Estate Sector Risk
The risks associated with the ownership of real estate and the real estate industry in general can include fluctuations in the value of the properties underlying the Fund’s portfolio holdings, defaults by borrowers or tenants, market saturation, decreases in market rates for rents, and other economic, political, or regulatory occurrences affecting the real estate industry, including REITs.
REITs depend upon specialized management skills, may have limited financial resources, may have less trading volume, and may be subject to more abrupt or erratic price movements than the overall securities markets. REITs are also subject to the risk of failing to qualify for tax-free pass-through of income. Some REITs (especially mortgage REITs) are affected by risks similar to those associated with investments in debt securities including changes in interest rates and the quality of credit extended.
Note 15. Subsequent Events
Management has evaluated the events and transactions that have occurred through the date the financial statements were issued and noted no items requiring adjustment of the financial statements or additional disclosure.
32
Columbia Real Estate Equity Fund
December 31, 2011
Note 16. Information Regarding Pending and Settled Legal Proceedings
In June 2004, an action captioned John E. Gallus et al. v. American Express Financial Corp. and American Express Financial Advisors Inc. was filed in the United States District Court for the District of Arizona. The plaintiffs allege that they are investors in several American Express Company mutual funds (currently branded as Columbia) and they purport to bring the action derivatively on behalf of those funds under the Investment Company Act of 1940. The plaintiffs allege that fees allegedly paid to the defendants by the funds for investment advisory and administrative services are excessive. The plaintiffs seek remedies including restitution and rescission of investment advisory and distribution agreements. The plaintiffs voluntarily agreed to transfer this case to the United States District Court for the District of Minnesota (the District Court). In response to defendants’ motion to dismiss the complaint, the District Court dismissed one of plaintiffs’ four claims and granted plaintiffs limited discovery. Defendants moved for summary judgment in April 2007. Summary judgment was granted in the defendants’ favor on July 9, 2007. The plaintiffs filed a notice of appeal with the Eighth Circuit Court of Appeals (the Eighth Circuit) on August 8, 2007. On April 8, 2009, the Eighth Circuit reversed summary judgment and remanded to the District Court for further proceedings. On August 6, 2009, defendants filed a writ of certiorari with the U.S. Supreme Court (the Supreme Court), asking the Supreme Court to stay the District Court proceedings while the Supreme Court considers and rules in a case captioned Jones v. Harris Associates, which involves issues of law similar to those presented in the Gallus case. On March 30, 2010, the Supreme Court issued its ruling in Jones v. Harris Associates, and on April 5, 2010, the Supreme Court vacated the Eighth Circuit’s decision in the Gallus case and remanded the case to the Eighth Circuit for further consideration in light of the Supreme Court’s decision in Jones v. Harris Associates. On June 4, 2010, the Eighth Circuit remanded the Gallus case to the District Court for further consideration in light of the Supreme Court’s decision in Jones v. Harris Associates. On December 9, 2010, the District Court reinstated its July 9, 2007 summary judgment order in favor of the defendants. On January 10, 2011, plaintiffs filed a notice of appeal with the Eighth Circuit. In response to the plaintiffs’ opening appellate brief filed on March 18, 2011, the defendants filed a response brief on May 4, 2011 with the Eighth Circuit. The plaintiffs filed a reply brief on May 26, 2011 and oral arguments took place on November 17, 2011.
In December 2005, without admitting or denying the allegations, American Express Financial Corporation (AEFC, which is now
known as Ameriprise Financial, Inc. (Ameriprise Financial) entered into settlement agreements with the Securities and Exchange Commission (SEC) and Minnesota Department of Commerce (MDOC) related to market timing activities. As a result, AEFC was censured and ordered to cease and desist from committing or causing any violations of certain provisions of the Investment Advisers Act of 1940, the Investment Company Act of 1940, and various Minnesota laws. AEFC agreed to pay disgorgement of $10 million and civil money penalties of $7 million. AEFC also agreed to retain an independent distribution consultant to assist in developing a plan for distribution of all disgorgement and civil penalties ordered by the SEC in accordance with various undertakings detailed at www.sec.gov/litigation/admin/ia-2451.pdf. Ameriprise Financial and its affiliates have cooperated with the SEC and the MDOC in these legal proceedings, and have made regular reports to the funds’ Boards of Trustees.
Ameriprise Financial and certain of its affiliates have historically been involved in a number of legal, arbitration and regulatory proceedings, including routine litigation, class actions, and governmental actions, concerning matters arising in connection with the conduct of their business activities. Ameriprise Financial believes that the Funds are not currently the subject of, and that neither Ameriprise Financial nor any of its affiliates are the subject of, any pending legal, arbitration or regulatory proceedings that are likely to have a material adverse effect on the Funds or the ability of Ameriprise Financial or its affiliates to perform under their contracts with the Funds. Ameriprise Financial is required to make 10-Q, 10-K and, as necessary, 8-K filings with the Securities and Exchange Commission on legal and regulatory matters that relate to Ameriprise Financial and its affiliates. Copies of these filings may be obtained by accessing the SEC website at www.sec.gov.
There can be no assurance that these matters, or the adverse publicity associated with them, will not result in increased fund redemptions, reduced sale of fund shares or other adverse consequences to the Funds. Further, although we believe proceedings are not likely to have a material adverse effect on the Funds or the ability of Ameriprise Financial or its affiliates to perform under their contracts with the Funds, these proceedings are subject to uncertainties and, as such, we are unable to estimate the possible loss or range of loss that may result. An adverse outcome in one or more of these proceedings could result in adverse judgments, settlements, fines, penalties or other relief that could have a material adverse effect on the consolidated financial condition or results of operations of Ameriprise Financial.
33
Report of Independent Registered Public Accounting Firm
To the Trustees of Columbia Funds Series Trust I and the Shareholders of Columbia Real Estate Equity Fund
In our opinion, the accompanying statement of assets and liabilities, including the investment portfolio, and the related statements of operations and of changes in net assets and the financial highlights present fairly, in all material respects, the financial position of Columbia Real Estate Equity Fund (the “Fund”) (a series of Columbia Funds Series Trust I) at December 31, 2011, the results of its operations for the year then ended, the changes in its net assets for each of the two years in the period then ended, and the financial highlights for the periods indicated, in conformity with accounting principles generally accepted in the United States of America. These financial statements and financial highlights (hereafter referred to as “financial statements”) are the responsibility of the Fund’s management. Our responsibility is to express an opinion on these financial statements based on our audits. We conducted our audits of these financial statements in accordance with the standards of the Public Company Accounting Oversight Board (United States). Those standards require that we plan and perform the audit to obtain reasonable assurance about whether the financial statements are free of material misstatement. An audit includes examining, on a test basis, evidence supporting the amounts and disclosures in the financial statements, assessing the accounting principles used and significant estimates made by management, and evaluating the overall financial statement presentation. We believe that our audits, which included confirmation of securities at December 31, 2011 by correspondence with the custodian, brokers and transfer agent provide a reasonable basis for our opinion.
PricewaterhouseCoopers LLP
Minneapolis, Minnesota
February 21, 2012
34
Federal Income Tax Information (Unaudited) – Columbia Real Estate Equity Fund
The fund hereby designates as a capital gain dividend with respect to the fiscal year ended December 31, 2011, $13,495,714, or, if subsequently determined to be different, the net capital gain of such year.
0.84% of the ordinary income distributed by the Fund for the fiscal year ended December 31, 2011, qualifies for the corporate dividends received deduction.
For non-corporate shareholders, 1.66% or the maximum amount allowable under the Jobs and Growth Tax Relief Reconciliation Act of 2003, of the ordinary income distributed by the Fund for the fiscal year ended December 31, 2011 may represent qualified dividend income.
The Fund will notify shareholders in February 2012 of amounts for use in preparing 2011 income tax returns.
35
Fund Governance
The Trustees serve terms of indefinite duration. The names, addresses and birth years of the Trustees and Officers of the Funds in Columbia Funds Series Trust I, the year each was first elected or appointed to office, their principal business occupations during at least the last five years, the number of Funds overseen by each Trustee and other directorships they hold are shown below. Each officer listed below serves as an officer of each Fund in Columbia Funds Series Trust I.
Independent Trustees
| | |
Name, address and year of birth,
Position with funds, Year first
elected or appointed to office | | Principal occupation(s) during past five years, Number of funds in Columbia Funds
Complex overseen by trustee, Other directorships Held |
| |
| Rodman L. Drake (born 1943) | | |
c/o Columbia Management Investment Advisers, LLC 225 Franklin Street Boston, MA 02110 Trustee (since 1994) and Chairman of the Board (since 2009) | | Independent consultant since 2010; Co-Founder of Baringo Capital LLC (private equity) from 1997 to 2008; CEO of Crystal River Capital, Inc. (real estate investment trust) from 2003 to 2010; Oversees 43; Jackson Hewitt Tax Service Inc. (tax preparation services) from 2004 to 2011; Celgene Corporation (global biotechnology company); Student Loan Corporation (student loan provider) from 2005 to 2010; Celgene Corporation (global biotechnology company); The Helios Funds and Brookfield Funds (closed-end funds); Crystal River Capital, Inc. from 2005 to 2010; Parsons Brinckerhoff from 1995 to 2008; and Apex Silver Mines Ltd. from 2007 to 2009 |
| |
| Douglas A. Hacker (born 1955) | | |
c/o Columbia Management Investment Advisers, LLC 225 Franklin Street Boston, MA 02110 Trustee (since 1996) | | Independent business executive since May 2006; Executive Vice President–Strategy of United Airlines (airline) from December 2002 to May 2006; President of UAL Loyalty Services (airline marketing company) from September 2001 to December 2002; Executive Vice President and Chief Financial Officer of United Airlines from July 1999 to September 2001. Oversees 43; Nash Finch Company (food distributor); Aircastle Limited (aircraft leasing); and SeaCube Container Leasing Ltd (container leasing) |
|
| Janet Langford Kelly (born 1957) |
c/o Columbia Management Investment Advisers, LLC 225 Franklin Street Boston, MA 02110 Trustee (since 1996) | | Senior Vice President, General Counsel and Corporate Secretary, ConocoPhillips (integrated energy company) since September 2007; Deputy General Counsel–Corporate Legal Services, ConocoPhillips from August 2006 to August 2007; Partner, Zelle, Hofmann, Voelbel, Mason & Gette LLP (law firm) from March 2005 to July 2006; Adjunct Professor of Law, Northwestern University, from September 2004 to June 2006; Director, UAL Corporation (airline) from February 2006 to July 2006; Oversees 43; None |
|
| Nancy T. Lukitsh (born 1956) |
c/o Columbia Management Investment Advisers, LLC 225 Franklin Street Boston, MA 02110 Trustee (since 2011) | | Senior Vice President, Partner and Director, Marketing of Wellington Management Company, LLP (investment adviser) from 1997 to 2010; Chair, Wellington Management Investment Portfolios (commingled non-U.S. investment pools) from 2007 to 2010; Director, Wellington Trust Company, NA and other Wellington affiliates from 1997 to 2010. Oversees 43; None |
|
| William E. Mayer (born 1940) |
c/o Columbia Management Investment Advisers, LLC 225 Franklin Street Boston, MA 02110 Trustee (since 1994) | | Partner, Park Avenue Equity Partners (private equity) since February 1999; Dean and Professor, College of Business and Management, University of Maryland from 1992 to 1996. Oversees 43; DynaVox Inc. (speech creation); Lee Enterprises (print media), WR Hambrecht + Co. (financial service provider); BlackRock Kelso Capital Corporation (investment company) |
36
Fund Governance (continued)
Independent Trustees (continued)
| | |
Name, address and year of birth,
Position with funds, Year first
elected or appointed to office | | Principal occupation(s) during past five years, Number of funds in Columbia Funds
Complex overseen by trustee, Other directorships held |
| |
| David M. Moffett (born 1952) | | |
c/o Columbia Management Investment Advisers, LLC 225 Franklin Street Boston, MA 02110 Trustee (since 2011) | | Retired. Chief Executive Officer, Federal Home Loan Mortgage Corporation, from 2008 to 2009; Senior Adviser, Global Financial Services Group, Carlyle Group, Inc., from 2007 to 2008; Vice Chairman and Chief Financial Officer, U.S. Bancorp, from 1993 to 2007. Oversees 43; CIT Group Inc. (commercial and consumer finance), eBay Inc. (online trading community), MBIA Corp (financial service provider), E.W. Scripps Co. (print and television media), Building Materials Holding Corp. (building materials and construction services), and University of Oklahoma Foundation. |
| |
| Charles R. Nelson (born 1942) | | |
c/o Columbia Management Investment Advisers, LLC 225 Franklin Street Boston, MA 02110 Trustee (since 1981) | | Retired. Professor Emeritus, University of Washington, since 2011; Professor of Economics, University of Washington, from 1976 to 2011; Ford and Louisa Van Voorhis Professor of Political Economy, University of Washington, from 1993 to 2011; Adjunct Professor of Statistics, University of Washington, from 1980 to 2011; Associate Editor, Journal of Money Credit and Banking from 1993 to 2008; consultant on econometric and statistical matters. Oversees 43; None |
| |
| John J. Neuhauser (born 1943) | | |
c/o Columbia Management Investment Advisers, LLC 225 Franklin Street Boston, MA 02110 Trustee (since 1984) | | President, Saint Michael’s College, since August 2007; Director or Trustee of several non-profit organization, including Fletcher Allen Health Care, Inc.; University Professor, Boston College from November 2005 to August 2007; Academic Vice President and Dean of Faculties, Boston College from August 1999 to October 2005. Oversees 43; Liberty All-Star Equity Fund and Liberty All-Star Growth Fund, Inc. (closed-end funds) |
| |
| Patrick J. Simpson (born 1944) | | |
c/o Columbia Management Investment Advisers, LLC 225 Franklin Street Boston, MA 02110 Trustee (since 2000) | | Partner, Perkins Coie LLP (law firm). Oversees 43; None |
| |
| Anne-Lee Verville (born 1945) | | |
c/o Columbia Management Investment Advisers, LLC 225 Franklin Street Boston, MA 02110 Trustee (since 1998) | | Retired since 1997 (formerly General Manager–Global Education Industry from 1994 to 1997, President–Application Systems Division from 1991 to 1994, Chief Financial Officer–US Marketing & Services from 1988 to 1991, and Chief Information Officer from 1987 to 1988, IBM Corporation (computer and technology)). Oversees 43; Enesco Group, Inc. (producer of giftware and home and garden decor products) from 2001 to 2006 |
The Statement of Additional Information includes additional information about the Trustees of the Funds and is available, without charge, upon request by calling 1-800-345-6611.
37
Fund Governance (continued)
Officers
| | |
| Name, Year of birth and address | | Principal occupation(s) during the past five years |
|
| J. Kevin Connaughton (born 1964) |
225 Franklin Street Boston, MA 02110 President (since 2009) | | Senior Vice President and General Manager–Mutual Fund Products, Columbia Management Investment Advisers, LLC since May 2010; President, Columbia Funds, since 2009, and RiverSource Funds, since May 2010 (previously Senior Vice President and Chief Financial Officer, Columbia Funds, from June 2008 to January 2009, Treasurer, Columbia Funds, from October 2003 to May 2008, and senior officer of various other affiliated funds since 2000); Managing Director, Columbia Management Advisors, LLC from December 2004 to April 2010. |
| |
| Michael G. Clarke (born 1969) | | |
225 Franklin Street Boston, MA 02110 Treasurer (since 2011) and Chief Financial Officer (since 2009) | | Vice President, Columbia Management Investment Advisers, LLC since May 2010; Managing Director of Fund Administration, Columbia Management Advisors, LLC, from September 2004 to April 2010; senior officer of Columbia Funds and affiliated funds since 2002. |
| |
| Scott R. Plummer (born 1959) | | |
5228 Ameriprise Financial Center Minneapolis, MN 55474 Senior Vice President, Assistant Secretary and Chief Legal Officer (since 2010) | | Chief Legal Officer and Assistant Secretary, Columbia Management Investment Advisers, LLC since June 2005; Vice President and Lead Chief Counsel–Asset Management, Ameriprise Financial, Inc. since May 2010 (previously Vice President and Chief Counsel–Asset Management, from 2005 to April 2010, and Vice President–Asset Management Compliance from 2004 to 2005); Vice President, Chief Counsel and Assistant Secretary, Columbia Management Investment Distributors, Inc. since 2008; Vice President, General Counsel and Secretary, Ameriprise Certificate Company since 2005; Chief Counsel, RiverSource Distributors, Inc. since 2006; Vice President, General Counsel and Secretary, RiverSource Funds, since December 2006; Senior Vice President, Secretary and Chief Legal Officer, Columbia Funds, since May 2010. |
| |
| Linda J. Wondrack (born 1964) | | |
225 Franklin Street Boston, MA 02110 Senior Vice President and Chief Compliance Officer (since 2007) | | Vice President and Chief Compliance Officer, Columbia Management Investment Advisers, LLC since May 2010; Chief Compliance Officer, Columbia Funds, since 2007, and RiverSource Funds, since May 2010; Director (Columbia Management Group, LLC and Investment Product Group Compliance), Bank of America, from June 2005 to April 2010; Director of Corporate Compliance and Conflicts Officer of MFS Investment Management (investment management) from August 2004 to May 2005. |
| |
| William F. Truscott (born 1960) | | |
53600 Ameriprise Financial Center Minneapolis, MN 55474 Senior Vice President (since 2010) | | Chairman of the Board, Columbia Management Investment Advisers, LLC since May 2010 (previously President, Chairman of the Board and Chief Investment Officer, from 2001 to April 2010); Chief Executive Officer, U.S. Asset Management & President, Annuities, Ameriprise Financial, Inc. since May 2010 (previously President–U.S. Asset Management and Chief Investment Officer from 2005 to April 2010, and Senior Vice President–Chief Investment Officer, from 2001 to 2005); Director, President and Chief Executive Officer, Ameriprise Certificate Company since 2006; Director, Columbia Management Investment Distributors, Inc. since May 2010 (previously Chairman of the Board and Chief Executive Officer from 2008 to April 2010); Chairman of the Board and Chief Executive Officer, RiverSource Distributors, Inc. since 2006. |
38
Fund Governance (continued)
Officers (continued)
| | |
| Name, Year of birth and address | | Principal occupation(s) during the past five years |
|
| Colin Moore (born 1958) |
225 Franklin Street Boston, MA 02110 Senior Vice President (since 2010) | | Director and Chief Investment Officer, Columbia Management Investment Advisers, LLC since May 2010; Manager, Managing Director and Chief Investment Officer of Columbia Management Advisors, LLC from 2007 to April 2010; Head of Equities, Columbia Management Advisors, LLC from 2002 to 2007. |
| |
| Amy Johnson (born 1965) | | |
5228 Ameriprise Financial Center Minneapolis, MN 55474 Vice President (since 2010) | | Senior Vice President and Chief Operating Officer, Columbia Management Investment Advisers, LLC since May 2010 (previously Chief Administrative Officer, from 2009 until April 2010, Vice President–Asset Management and Trust Company Services, from 2006 to 2009, and Vice President–Operations and Compliance from 2004 to 2006). |
| |
| Joseph F. DiMaria (born 1968) | | |
225 Franklin Street Boston, MA 02110 Vice President (since 2011) and Chief Accounting Officer (since 2008) | | Vice President, Mutual Fund Administration, Columbia Management Investment Advisers, LLC, since May 2010; Director of Fund Administration, Columbia Management Advisors, LLC from January 2006 to April 2010; Head of Tax/Compliance and Assistant Treasurer, Columbia Management Advisors, LLC, from November 2004 to December 2005. |
| |
| Stephen T. Welsh (born 1957) | | |
225 Franklin Street Boston, MA 02110 Vice President (since 2006) | | President and Director, Columbia Management Investment Services Corp. since May 2010; President and Director, Columbia Management Services, Inc. from July 2004 to April 2010; Managing Director, Columbia Management Distributors, Inc. from August 2007 to April 2010. |
| |
| Paul D. Pearson (born 1956) | | |
5228 Ameriprise Financial Center Minneapolis, MN 55474 Vice President and Assistant Treasurer (since 2011) | | Vice President, Investment Accounting, Columbia Management Investment Advisers, LLC, since May 2010; Vice President, Managed Assets, Investment Accounting, Ameriprise Financial Corporation. |
| |
| Paul B. Goucher (born 1968) | | |
5228 Ameriprise Financial Center Minneapolis, MN 55474 Vice President and Assistant Secretary (since 2010) | | Vice President and Chief Counsel of Ameriprise Financial since January 2010 (formerly Vice President and Group Counsel from November 2008 to January 2010); Director, Managing Director and General Counsel of J. & W. Seligman & Co. Incorporated (Seligman) from July 2008 to November 2008 and Managing Director and Associate General Counsel of Seligman from January 2005 to July 2008. |
| |
| Christopher O. Petersen (born 1970) | | |
5228 Ameriprise Financial Center Minneapolis, MN 55474 Vice President (since 2010) and Secretary (since 2011) | | Vice President and Chief Counsel, Ameriprise Financial since January 2010 (formerly Vice President and Group Counsel or Counsel from April 2004 to January 2010); Assistant Secretary of RiverSource Funds since January 2007 |
| |
| Michael E. DeFao (born 1968) | | |
5228 Ameriprise Financial Center Minneapolis, MN 55474 Vice President and Assistant Secretary (since 2011) | | Vice President and Chief Counsel, Ameriprise Financial since May 2010; Associate General Counsel Bank of America from June 2005 to April 2010. |
39
[THIS PAGE INTENTIONALLY LEFT BLANK]
40
Important Information About This Report
The fund mails one shareholder report to each shareholder address. If you would like more than one report, please call shareholder services at 1-800-345-6611 and additional reports will be sent to you. This report has been prepared for shareholders of Columbia Real Estate Equity Fund.
A description of the policies and procedures that the fund uses to determine how to vote proxies and a copy of the fund’s voting records are available (i) at www.columbiamanagement.com, (ii) on the Securities and Exchange Commission’s website at www.sec.gov, and (iii) without charge, upon request, by calling 1-800-368-0346. Information regarding how the fund voted proxies relating to portfolio securities during the 12-month period ended June 30 is available from the SEC’s website. Information regarding how the fund voted proxies relating to portfolio securities is also available from the fund’s website, www.columbiamanagement.com.
The fund files a complete schedule of portfolio holdings with the SEC for the first and third quarters of each fiscal year on Form N-Q. The fund’s Form N-Q is available on the SEC’s website at www.sec.gov and may be reviewed and copied at the SEC’s Public Reference Room in Washington, D.C. Information on the operation of the Public Reference Room may be obtained by calling
1-800-SEC-0330.
Transfer Agent
Columbia Management Investment Services Corp.
P.O. Box 8081
Boston, MA 02266-8081
1-800-345-6611
Distributor
Columbia Management Investment
Distributors, Inc.
225 Franklin Street Boston, MA 02110
Investment Manager
Columbia Management Investment Advisers, LLC
225 Franklin Street Boston, MA 02110
41

Columbia Real Estate Equity Fund
P.O. Box 8081
Boston, MA 02266-8081
columbiamanagement.com
This information is for use with concurrent or prior delivery of a fund prospectus. Investors should consider the investment objectives, risks, charges and expenses of a mutual fund carefully before investing. For a free prospectus, which contains this and other important information about the funds, visit columbiamanagement.com. Read the prospectus carefully before investing. The Fund is distributed by Columbia Management Investment Distributors, Inc., member FINRA, and managed by Columbia Management Investment Advisers, LLC.
©2012 Columbia Management Investment Advisers, LLC. All rights reserved.
C-1441 C (2/12)
Item 2. Code of Ethics.
| | (a) | The registrant has adopted a code of ethics that applies to the registrant’s principal executive officer, principal financial officer, principal accounting officer or controller, or persons performing similar functions, regardless of whether these individuals are employed by the registrant or a third party. |
| | (b) | During the period covered by this report, there were not any amendments to a provision of the code of ethics adopted in 2(a) above. |
| | (c) | During the period covered by this report, there were no waivers, including any implicit waivers, from a provision of the code of ethics described in 2(a) above that relates to one or more of the items set forth in paragraph (b) of this item’s instructions. |
Item 3. Audit Committee Financial Expert.
The registrant’s Board of Trustees has determined that Douglas A. Hacker, David M. Moffett and Anne-Lee Verville, each of whom are members of the registrant’s Board of Trustees and Audit Committee, each qualify as an audit committee financial expert. Mr. Hacker, Mr. Moffett and Ms. Verville are each independent trustees, as defined in paragraph (a)(2) of this item’s instructions.
Item 4. Principal Accountant Fees and Services.
Fee information below is disclosed for the one series of the registrant whose report to stockholders is included in this annual filing.
(a) Audit Fees. Aggregate Audit Fees billed by the principal accountant for professional services rendered during the fiscal years ended December 31, 2011 and December 31, 2010 are approximately $29,300 and $30,800, respectively.
Audit Fees include amounts related to the audit of the registrant’s annual financial statements or services that are normally provided by the accountant in connection with statutory and regulatory filings or engagements for those fiscal years. Fiscal year 2010 also includes audit fees for the review of and provision of consent in connection with filing Form N-1A for a new share class.
(b) Audit-Related Fees. Aggregate Audit-Related Fees billed to the registrant by the principal accountant for professional services rendered during the fiscal years ended December 31, 2011 and December 31, 2010 are approximately $9,100 and $9,600, respectively.
Audit-Related Fees include amounts for assurance and related services by the principal accountant that are reasonably related to the performance of the audit of the registrant’s financial statements and are not reported in Audit Fees above. In both fiscal years 2011 and 2010, Audit-Related Fees consist of agreed-upon procedures performed for a semi-annual shareholder report and agreed- upon procedures related to a fund merger. Fiscal year 2011, also includes agreed-upon procedures for a fund accounting and custody conversion.
During the fiscal years ended December 31, 2011 and December 31, 2010, there were no Audit-Related Fees billed by the registrant’s principal accountant to the registrant’s investment adviser (not including any sub-adviser whose role is primarily portfolio management and is subcontracted with or overseen by another investment adviser) and any entity controlling, controlled by, or under common control with the adviser that provides ongoing services to the registrant for an engagement that related directly to the operations and financial reporting of the registrant.
(c) Tax Fees. Aggregate Tax Fees billed by the principal accountant to the registrant for professional services rendered during the fiscal years ended December 31, 2011 and December 31, 2010 are approximately $6,900 and $4,000, respectively.
Tax Fees include amounts for the review of annual tax returns, the review of required shareholder distribution calculations and typically include amounts for professional services by the principal accountant for tax compliance, tax advice and tax planning.
During the fiscal years ended December 31, 2011 and December 31, 2010, there were no Tax Fees billed by the registrant’s principal accountant to the registrant’s investment adviser (not including any sub-adviser whose role is primarily portfolio management and is subcontracted with or overseen by another investment adviser) and any entity controlling, controlled by, or under common control with the adviser that provides ongoing services to the registrant for an engagement that related directly to the operations and financial reporting of the registrant.
(d) All Other Fees. There were no aggregate All Other Fees billed by the principal accountant to the registrant for professional services rendered during the fiscal years ended December 31, 2011 and December 31, 2010.
All Other Fees include amounts for products and services provided by the principal accountant, other than the services reported in paragraphs (a) through (c) above.
Aggregate All Other Fees billed by the registrant’s principal accountant to the registrant’s investment adviser (not including any sub-adviser whose role is primarily portfolio
management and is subcontracted with or overseen by another investment adviser) and any entity controlling, controlled by, or under common control with the adviser that provides ongoing services to the registrant for an engagement that related directly to the operations and financial reporting of the registrant during the fiscal years ended December 31, 2011 and December 31, 2010 are approximately $225,000 and $995,300, respectively.
In both fiscal years 2011 and 2010, All Other Fees consist of fees billed for internal control examinations of the registrant’s transfer agent and investment advisor. Fiscal year 2010 also includes fees related to the review of revenue modeling schedules.
(e)(1) Audit Committee Pre-Approval Policies and Procedures
The registrant’s Audit Committee is required to pre-approve the engagement of the registrant’s independent accountants to provide audit and non-audit services to the registrant and non-audit services to its investment adviser (not including any sub-adviser whose role is primarily portfolio management and is subcontracted with or overseen by another investment adviser) or any entity controlling, controlled by or under common control with such investment adviser that provides ongoing services to the registrant (“Adviser Affiliates”), if the engagement relates directly to the operations and financial reporting of the registrant.
The Audit Committee has adopted a Policy for Engagement of Independent Accountants for Audit and Non-Audit Services (“Policy”). The Policy sets forth the understanding of the Audit Committee regarding the engagement of the registrant’s independent accountants to provide (i) audit and permissible audit-related, tax and other services to the registrant (collectively “Fund Services”); (ii) non-audit services to the registrant’s investment adviser (not including any sub-adviser whose role is primarily portfolio management and is subcontracted with or overseen by another investment adviser) and Adviser Affiliates, if the engagement relates directly to the operations or financial reporting of a Fund (collectively “Fund-related Adviser Services”); and (iii) certain other audit and non-audit services to the registrant’s investment adviser (not including any sub-adviser whose role is primarily portfolio management and is subcontracted with or overseen by another investment adviser) and Adviser Affiliates. As set forth in this Fund Policy, a service will require specific pre-approval by the Audit Committee if it is to be provided by the Fund’s independent auditor; provided, however, that pre-approval of non-audit services to the Fund, the Adviser or Control Affiliates may be waived if certain de minimis requirements set forth in the SEC’s rules are met.
Under the Policy, the Audit Committee may delegate pre-approval authority to any pre-designated member or members who are Independent Trustees/Directors. The member(s) to whom such authority is delegated must report, for informational purposes only, any pre-approval decisions to the Audit Committee at its next regular meeting. The Audit Committee’s responsibilities with respect to the pre-approval of services performed by the independent accountants may not be delegated to management.
On an annual basis, at a regularly scheduled Audit Committee meeting, the Fund’s Treasurer or other Fund Officer shall submit to the Audit Committee a schedule of the types of Fund Services and Fund-related Adviser Services that are subject to specific pre-approval.
This schedule will provide a description of each type of service that is subject to specific pre-approval, along with total projected fees for each service. The pre-approval will generally cover a one-year period. The Audit Committee will review and approve the types of services and the projected fees for the next one-year period and may add to, or subtract from, the list of pre-approved services from time to time, based on subsequent determinations. This specific approval acknowledges that the Audit Committee is in agreement with the types of services that the independent accountants will be permitted to perform.
The Fund’s Treasurer or other Fund Officer shall report to the Audit Committee at each of its regular meetings regarding all Fund Services or Fund-related Adviser Services initiated since the last such report was rendered, including a general description of the services with forecasted fees for the annual period, proposed changes requiring specific pre-approval and a description of services provided by the independent auditor with actual fees during the current reporting period.
*****
(e)(2) The percentage of services described in paragraphs (b) through (d) of this Item approved pursuant to the “de minimis” exception under paragraph (c)(7)(i)(C) of Rule 2-01 of Regulation S-X during both fiscal years ended December 31, 2011 and December 31, 2010 was zero.
(f) Not applicable.
(g) The aggregate non-audit fees billed by the registrant’s accountant for services rendered to the registrant, and rendered to the registrant’s investment adviser (not including any sub-adviser whose role is primarily portfolio management and is subcontracted with or overseen by another investment adviser), and any entity controlling, controlled by, or under common control with the adviser that provides ongoing services to the registrant for the fiscal years ended December 31, 2011 and December 31, 2010 are approximately $241,000 and $1,008,900, respectively.
(h) The registrant’s Audit Committee of the Board of Directors has considered whether the provision of non-audit services that were rendered to the registrant’s adviser (not including any sub-adviser whose role is primarily portfolio management and is subcontracted with or overseen by another investment adviser), and any entity controlling, controlled by, or under common control with the investment adviser that provides ongoing services to the registrant that were not pre-approved pursuant to paragraph (c)(7)(ii) of Rule 2-01 of Regulation S-X, is compatible with maintaining the principal accountant’s independence.
Item 5. Audit Committee of Listed Registrants.
Not applicable.
Item 6. Investments
| | (a) | The registrant’s “Schedule I – Investments in securities of unaffiliated issuers” (as set forth in 17 CFR 210.12-12) is included in Item 1 of this Form N-CSR. |
Item 7. Disclosure of Proxy Voting Policies and Procedures for Closed-End Management Investment Companies.
Not applicable.
Item 8. Portfolio Managers of Closed-End Management Investment Companies.
Not applicable.
Item 9. Purchases of Equity Securities by Closed-End Management Investment Company and Affiliated Purchasers.
Not applicable.
Item 10. Submission of Matters to a Vote of Security Holders.
There were no material changes to the procedures by which shareholders may recommend nominees to the registrant’s board of directors.
Item 11. Controls and Procedures.
| | (a) | The registrant’s principal executive officer and principal financial officers, based on their evaluation of the registrant’s disclosure controls and procedures as of a date within 90 days of the filing of this report, have concluded that such controls and procedures are adequately designed to ensure that material information required to be disclosed by the registrant in Form N-CSR is accumulated and communicated to the registrant’s management, including the principal executive officer and principal financial officer, or persons performing similar functions, as appropriate to allow timely decisions regarding required disclosure. |
| | (b) | There was no change in the registrant’s internal control over financial reporting that occurred during the registrant’s second fiscal quarter of the period covered by this report that has materially affected, or is reasonably likely to materially affect, the registrant’s internal control over financial reporting. |
Item 12. Exhibits.
(a)(1) Code of ethics required to be disclosed under Item 2 of Form N-CSR attached hereto as Exhibit 99.CODE ETH.
(a)(2) Certifications pursuant to Rule 30a-2(a) under the Investment Company Act of 1940 (17 CFR 270.30a-2(a)) attached hereto as Exhibit 99.CERT.
(a)(3) Not applicable.
(b) Certification pursuant to Rule 30a-2(b) under the Investment Company Act of 1940 (17 CFR 270.30a-2(b)) attached hereto as Exhibit 99.906CERT.
SIGNATURES
Pursuant to the requirements of the Securities Exchange Act of 1934 and the Investment Company Act of 1940, the registrant has duly caused this report to be signed on its behalf by the undersigned, thereunto duly authorized.
| | | | |
| (registrant) | | Columbia Funds Series Trust I | | |
| | | | |
| | |
| By (Signature and Title) | | /s/ J. Kevin Connaughton | | |
| | J. Kevin Connaughton, President | | |
Pursuant to the requirements of the Securities Exchange Act of 1934 and the Investment Company Act of 1940, this report has been signed below by the following persons on behalf of the registrant and in the capacities and on the dates indicated.
| | | | |
| By (Signature and Title) | | /s/ J. Kevin Connaughton | | |
| | J. Kevin Connaughton, President | | |
| | | | |
| | |
| By (Signature and Title) | | /s/ Michael G. Clarke | | |
| | Michael G. Clarke, Chief Financial Officer | | |
