UNITED STATES
SECURITIES AND EXCHANGE COMMISSION
Washington, D.C. 20549
FORM N-CSR
CERTIFIED SHAREHOLDER REPORT OF REGISTERED
MANAGEMENT INVESTMENT COMPANIES
Investment Company Act file number 811-04367
|
| Columbia Funds Series Trust I |
(Exact name of registrant as specified in charter)
|
| 225 Franklin Street, Boston, Massachusetts 02110 |
(Address of principal executive offices) (Zip code)
|
Scott R. Plummer 5228 Ameriprise Financial Center Minneapolis, MN 55474 |
(Name and address of agent for service)
Registrant’s telephone number, including area code: 1-612-671-1947
Date of fiscal year end: April 30
Date of reporting period: April 30, 2012
Form N-CSR is to be used by management investment companies to file reports with the Commission not later than 10 days after the transmission to stockholders of any report that is required to be transmitted to stockholders under Rule 30e-1 under the Investment Company Act of 1940 (17 CFR 270.30e-1). The Commission may use the information provided on Form N-CSR in its regulatory, disclosure review, inspection, and policymaking roles.
A registrant is required to disclose the information specified by Form N-CSR, and the Commission will make this information public. A registrant is not required to respond to the collection of information contained in Form N-CSR unless the Form displays a currently valid Office of Management and Budget (“OMB”) control number. Please direct comments concerning the accuracy of the information collection burden estimate and any suggestions for reducing the burden to Secretary, Securities and Exchange Commission, 450 Fifth Street, NW, Washington, DC 20549-0609. The OMB has reviewed this collection of information under the clearance requirements of 44 U.S.C. § 3507.
Item 1. Reports to Stockholders.

Columbia Small Cap Value Fund I
Annual Report for the Period Ended April 30, 2012
Table of contents
The views expressed in this report reflect the current views of the respective parties. These views are not guarantees of future performance and involve certain risks, uncertainties and assumptions that are difficult to predict, so actual outcomes and results may differ significantly from the views expressed. These views are subject to change at any time based upon economic, market or other conditions and the respective parties disclaim any responsibility to update such views. These views may not be relied on as investment advice and, because investment decisions for a Columbia Fund are based on numerous factors, may not be relied on as an indication of trading intent on behalf of any particular Columbia Fund. References to specific securities should not be construed as a recommendation or investment advice.
President’s Message

Dear Shareholders,
A stock market rally that commenced in the fourth quarter of 2011 continued into 2012 in the United States and around the world, as all major market regions generated double-digit returns for the three-month period ended March 31, 2012. Volatility declined sharply as European debt fears quieted somewhat and sentiment improved. Returns in developed countries were buoyed by strong results in Germany, Belgium, Austria and the Nordic markets of Denmark, Finland, Norway and Sweden. Under the cloud of its own mounting debt problem, Spain was the only eurozone country to deliver a negative return during the three-month period. Solid economic growth and accommodative monetary policy helped boost gains in emerging markets. The rally in U.S. equities was largely driven by an expansion in “multiples”— an increase in
stock prices relative to their earnings. By the end of the first quarter of 2012, stocks no longer appeared as cheap as they were late in 2011. Bonds lagged stocks during the first quarter as investors responded to signs of an improved environment with a greater appetite for risk.
Concerns around the health of the global economy were centered in news headlines focusing on Washington D.C., Europe, China and the Middle East. In the United States, economic indicators remained mixed but generally indicated support for slow, sustainable economic growth. European policymakers have made progress in containing the eurozone debt crisis, though they still have not solved the issue of long-term solvency. The European Central Bank has lowered interest rates and flooded the financial system with liquidity that may provide breathing space for a restructuring of fiscal balance sheets. These massive infusions of liquidity may whet the appetite for risk from investors around the world. However, they have delayed a true reckoning with the European financial situation, as concerns about Greece, Spain and Portugal continue to cloud the outlook. The structural challenges that persist in the developed world, and slower growth in emerging market economies, leave the global economy in a fragile state. Domestic demand, combined with slowing inflationary trends, has also helped to shore up emerging market economies. Joblessness remains relatively low and monetary conditions remain easy.
Despite the challenges and surprises of 2011, we see pockets of strength — and as a result, attractive opportunities — both here and abroad for 2012. We hope to help you capitalize on these opportunities with various articles in our 2012 Perspectives, which is available via the Market Insights tab at columbiamanagement.com. This publication showcases the strong research capabilities and experienced investment teams of Columbia Management and offers a diverse array of investment ideas based on our five key themes for 2012.
Other information and resources available at columbiamanagement.com include:
| n | | detailed up-to-date fund performance and portfolio information |
| n | | economic analysis and market commentary |
| n | | quarterly fund commentaries |
| n | | Columbia Management Investor, our award-winning quarterly newsletter for shareholders |
Thank you for your continued support of the Columbia Funds. We look forward to serving your investment needs for many years to come.
Best Regards,

J. Kevin Connaughton
President, Columbia Funds
Investors should consider the investment objectives, risks, charges and expenses of a mutual fund carefully before investing. For a free prospectus, which contains this and other important information about the funds, visit columbiamanagement.com. The prospectus should be read carefully before investing.
Columbia Funds are distributed by Columbia Management Investment Distributors, Inc., member FINRA, and managed by Columbia Management Investment Advisers, LLC.
© 2012 Columbia Management Investment Advisers, LLC. All rights reserved.
Fund Profile – Columbia Small Cap Value Fund I
Summary
| n | | For the 10-month period that ended April 30, 2012, the fund’s Class A shares returned –3.21% without sales charge. |
| n | | The fund’s benchmark, the Russell 2000 Value Index1, returned 0.15%. |
| n | | The fund’s emphasis on higher quality companies generally accounted for its shortfall relative to the index, which was buoyed by stronger returns from companies with higher debt levels. |
Portfolio Management
Stephen D. Barbaro, lead manager, has co-managed the fund since June 2002. From 1976 until joining Columbia Management Investment Advisers, LLC (the Investment Manager) in May 2010, Mr. Barbaro was associated with the fund’s previous investment adviser as an investment professional.
Jeremy Javidi has co-managed the fund since August 2005. From 2000 until joining the Investment Manager in May 2010, Mr. Javidi was associated with the fund’s previous investment adviser as an investment professional.
John S. Barrett has co-managed the fund since March 2011. From 2003 until joining the Investment Manager in May 2010, Mr. Barrett was associated with the fund’s previous investment adviser as an investment professional.
| 1 | The Russell 2000 Value Index measures the performance of those Russell 2000 Index companies with lower price-to-book ratios and lower forecasted growth values. |
Indices are not available for investment, are not professionally managed and do not reflect sales charges, fees, brokerage commissions, taxes or other expenses of investing. Securities in the fund may not match those in an index.
Performance data quoted represents past performance and current performance may be lower or higher. Past performance is no guarantee of future results. The investment return and principal value will fluctuate so that shares, when redeemed, may be worth more or less than the original cost. Please visit www.columbiamanagement.com for daily and most recent month-end performance updates.
Summary
10-month (cumulative) return as of 04/30/12
| | |
| |
 | | –3.21% Class A shares (without sales charge) |
| |
 | | +0.15% Russell 2000 Value Index |
|
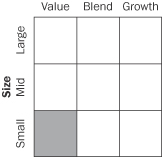
Morningstar Style Box™ |
|
Equity Style |
|
The Morningstar Style Box™ is based on the fund’s portfolio holdings. For equity funds, the vertical axis shows the market capitalization of the stocks owned, and the horizontal axis shows investment style (value, blend, or growth). Information shown is based on the most recent data provided by Morningstar.
© 2012 Morningstar, Inc. All rights reserved. The Morningstar information contained herein: (1) is proprietary to Morningstar and/or its content providers; (2) may not be copied or distributed; and (3) is not warranted to be accurate, complete or timely. Neither Morningstar nor its content providers are responsible for any damages or losses arising from any use of this information.
1
Performance Information – Columbia Small Cap Value Fund I
Performance data quoted represents past performance and current performance may be lower or higher. Past performance is no guarantee of future results. The investment return and principal value will fluctuate so that shares, when redeemed, may be worth more or less than the original cost. Please visit www.columbiamanagement.com for daily and most recent month-end performance updates.
|
| Performance of a $10,000 investment 05/01/02 – 04/30/12 |
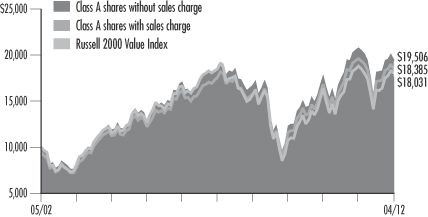
The chart above shows the change in value of a hypothetical $10,000 investment in Class A shares of Columbia Small Cap Value Fund I during the stated time period, and does not reflect the deduction of taxes that a shareholder may pay on fund distributions or on the redemption of fund shares.
| | | | | | | | |
| Performance of a $10,000 investment 05/01/02 – 04/30/12 ($) | |
| | |
| Sales charge | | without | | | with | |
Class A | | | 19,506 | | | | 18,385 | |
Class B | | | 18,091 | | | | 18,091 | |
Class C | | | 18,091 | | | | 18,091 | |
Class I* | | | 19,647 | | | | n/a | |
Class R* | | | 19,042 | | | | n/a | |
Class Y* | | | 19,741 | | | | n/a | |
Class Z | | | 20,034 | | | | n/a | |
| | | | | | | | | | | | | | | | | | | | | | | | | | | | | | | | | | | | | | | | |
| Average annual total return as of 04/30/12 (%) | |
| Share class | | A | | | B | | | C | | | I* | | | R* | | | Y* | | | Z | |
| Inception | | 07/25/86 | | | 11/09/92 | | | 01/15/96 | | | 09/27/10 | | | 09/27/10 | | | 07/15/09 | | | 07/31/95 | |
| Sales charge | | without | | | with | | | without | | | with | | | without | | | with | | | without | | | without | | | without | | | without | |
10-month (cumulative) | | | –3.21 | | | | –8.78 | | | | –3.85 | | | | –8.28 | | | | –3.84 | | | | –4.73 | | | | –2.85 | | | | –3.37 | | | | –2.86 | | | | –3.00 | |
1-year | | | –6.26 | | | | –11.64 | | | | –6.98 | | | | –11.26 | | | | –6.98 | | | | –7.84 | | | | –5.82 | | | | –6.42 | | | | –5.84 | | | | –6.03 | |
5-year | | | 0.88 | | | | –0.30 | | | | 0.13 | | | | –0.18 | | | | 0.12 | | | | 0.12 | | | | 1.03 | | | | 0.65 | | | | 1.13 | | | | 1.14 | |
10-year | | | 6.91 | | | | 6.28 | | | | 6.11 | | | | 6.11 | | | | 6.11 | | | | 6.11 | | | | 6.99 | | | | 6.65 | | | | 7.04 | | | | 7.20 | |
The “with sales charge” returns include the maximum initial sales charge of 5.75% for Class A shares and the applicable contingent deferred sales charge of 5.00% in the first year, declining to 1.00% in the sixth year and eliminated thereafter for Class B shares and 1.00% for Class C shares for the first year only. The “without sales charge” returns do not include the effect of sales charges. If they had, returns would be lower.
Performance results reflect any fee waivers or reimbursements of fund expenses by Columbia Management Investment Advisers, LLC and/or any of its affiliates. Absent these fee waivers or expense reimbursement arrangements, performance results would have been lower.
All results shown assume reinvestment of distributions. Class I, Class Y and Class Z shares are sold at net asset value with no distribution and service (Rule 12b-1) fees. Class R shares are sold at net asset value with a distribution (Rule 12b-1) fee. Class I, Class R, Class Y and Class Z shares have limited eligibility and the investment minimum requirements may vary. Please see the fund’s prospectuses for details. Performance for different share classes will vary based on differences in sales charges and fees associated with each class.
The tables do not reflect the deduction of taxes that a shareholder may pay on fund distributions or on the redemption of fund shares.
| * | The returns shown for periods prior to the share class inception date (including returns since inception, which are since fund inception) include the returns of the fund’s oldest share class. These returns are adjusted to reflect any higher class-related operating expenses of the newer share classes, as applicable. Please visit columbiamanagement.com/mutual-funds/appended-performance for more information. |
2
Fund Expense Example – Columbia Small Cap Value Fund I
As an investor, you incur two types of costs. There are transaction costs, which generally include sales charges on purchases and may include redemption fees. There are also ongoing costs, which generally include management fees, distribution and service (Rule 12b-1) fees, and other fund expenses. The following information is intended to help you understand your ongoing costs (in dollars) of investing in the Fund and to help you compare these costs with the ongoing costs of investing in other mutual funds.
Analyzing your fund’s expenses
To illustrate these ongoing costs, we have provided examples and calculated the expenses paid by investors in each share class of the Fund during the period. The actual and hypothetical information in the table is based on an initial investment of $1,000 at the beginning of the period indicated and held for the entire period. Expense information is calculated two ways and each method provides you with different information. The amount listed in the “Actual” column is calculated using the Fund’s actual operating expenses and total return for the period. You may use the Actual information, together with the amount invested, to estimate the expenses that you paid over the period. Simply divide your account value by $1,000 (for example, an $8,600 account value divided by $1,000 = 8.6), then multiply the results by the expenses paid during the period under the Actual column. The amount listed in the “Hypothetical” column assumes a 5% annual rate of return before expenses (which is not the Fund’s actual return) and then applies the Fund’s actual expense ratio for the period to the hypothetical return. You should not use the hypothetical account values and expenses to estimate either your actual account balance at the end of the period or the expenses you paid during the period. See “Compare with other funds” below for details on how to use the hypothetical data.
Compare with other funds
Since all mutual funds are required to include the same hypothetical calculations about expenses in shareholder reports, you can use this information to compare the ongoing cost of investing in the Fund with other funds. To do so, compare the hypothetical example with the 5% hypothetical examples that appear in the shareholder reports of other funds. As you compare hypothetical examples of other funds, it is important to note that hypothetical examples are meant to highlight the ongoing costs of investing in a fund only and do not reflect any transaction costs, such as sales charges, or redemption or exchange fees. Therefore, the hypothetical calculations are useful in comparing ongoing costs only, and will not help you determine the relative total costs of owning different funds. If transaction costs were included in these calculations, your costs would be higher.
| | | | | | | | | | | | | | | | | | | | | | | | | | | | |
| 11/01/11 – 04/30/12 | | | | | | | |
| | | | |
| | | Account value at the
beginning of the period ($) | | | Account value at the
end of the period ($) | | | Expenses paid
during the period ($) | | | Fund’s annualized
expense ratio (%) | |
| | | Actual | | | Hypothetical | | | Actual | | | Hypothetical | | | Actual | | | Hypothetical | | | Actual | |
Class A | | | 1,000.00 | | | | 1,000.00 | | | | 1,074.10 | | | | 1,018.35 | | | | 6.76 | | | | 6.57 | | | | 1.31 | |
Class B | | | 1,000.00 | | | | 1,000.00 | | | | 1,069.80 | | | | 1,014.62 | | | | 10.60 | | | | 10.32 | | | | 2.06 | |
Class C | | | 1,000.00 | | | | 1,000.00 | | | | 1,069.80 | | | | 1,014.62 | | | | 10.60 | | | | 10.32 | | | | 2.06 | |
Class I | | | 1,000.00 | | | | 1,000.00 | | | | 1,076.50 | | | | 1,020.59 | | | | 4.44 | | | | 4.32 | | | | 0.86 | |
Class R | | | 1,000.00 | | | | 1,000.00 | | | | 1,072.80 | | | | 1,017.16 | | | | 7.99 | | | | 7.77 | | | | 1.55 | |
Class Y | | | 1,000.00 | | | | 1,000.00 | | | | 1,076.40 | | | | 1,020.59 | | | | 4.44 | | | | 4.32 | | | | 0.86 | |
Class Z | | | 1,000.00 | | | | 1,000.00 | | | | 1,075.40 | | | | 1,019.64 | | | | 5.42 | | | | 5.27 | | | | 1.05 | |
Expenses paid during the period are equal to the annualized expense ratio for each class as indicated above, multiplied by the average account value over the period and then multiplied by the number of days in the Fund’s most recent fiscal half year and divided by 366.
Expenses do not include fees and expenses incurred indirectly by the Fund from the underlying funds in which the Fund may invest (also referred to as “acquired funds”), including affiliated and non-affiliated pooled investment vehicles (including mutual funds and exchange traded funds).
3
Portfolio Managers’ Report – Columbia Small Cap Value Fund I
Performance data quoted represents past performance and current performance may be lower or higher. Past performance is no guarantee of future results. The investment return and principal value will fluctuate so that shares, when redeemed, may be worth more or less than the original cost. Please visit www.columbiamanagement.com for daily and most recent month-end performance updates.
The Board of Trustees for Columbia Small Cap Value Fund I has approved the change of the fund’s fiscal year end from June 30 to April 30. As a result, this report covers the 10-month period since the last annual report. The next report you receive will be for the six-month period from May 1, 2012 through October 31, 2012.
For the 10-month period that ended April 30, 2012, the fund’s Class A shares returned –3.21% without sales charge, compared to 0.15% for its benchmark, the Russell 2000 Value Index. The fund remained focused on higher quality small companies with strong balance sheets, good cash flows and stable, positive earnings. These companies lagged lower quality, debt heavy companies, which outperformed in the first quarter of 2012. Sector allocations and stock selection also detracted somewhat from relative performance.
A turnaround for the market — and the U.S. economy
The U.S. stock market suffered a steep and broad-based downturn in the third quarter of 2011, as worries over Europe’s sovereign debt problems, the potential for a double-dip recession in the United States and the federal budget stalemate in Washington shook investors. In this environment, small-cap stocks suffered particularly steep losses. However, market conditions began to turn more favorable in the fourth quarter as investors perceived that Europe was making progress in addressing debt and U.S. economic growth picked up. New job growth and solid manufacturing activity helped buoy confidence. However, investors remained cautious and larger-cap, more liquid, dividend-paying issues led the rally. Within the Russell 2000 Value Index, financials were the strongest performers, while returns in telecommunication services, energy, health care and information technology were decidedly negative.
Disappointing results from financials and industrials
Investments in the financials and industrials sectors detracted the most from performance versus the Russell 2000 Value Index. Within financials, the fund’s underweight and security selection in the real estate investment trust (REIT) segment, coupled with below-average exposure to commercial banks, hurt results. REITs were strong performers in the index as the global search for yield attracted investors, while commercial banks rebounded nicely from their earlier lows. Individual detractors in the fund included Getty Realty, a REIT that owns and leases gas station properties that are operated under such brand names as Getty, BP and Shell. The stock fell sharply when its largest tenant went bankrupt, and we sold the position. Security selection within industrials also hurt. Among disappointments was GrafTech International (0.5% of net assets), which makes consumable inputs for the steel industry. Its shares posted a steep decline, as weakness in the European steel industry led to a reduced earnings outlook. Stock selection in the materials and energy sectors also nicked relative performance. Within materials, OM Group (0.8% of net assets), a multi-product company with cobalt and solar businesses, saw its stock fall as investors worried that austerity programs would force governments in Europe to lower their subsidies for solar projects. Energy service stocks Cal Dive International and Union Drilling also detracted. Cal Dive’s shares were pressured by the moratorium on drilling in the Gulf of Mexico, while Union Drilling’s stock suffered from declining natural gas prices. We sold both positions before period end.
4
Portfolio Managers’ Report (continued) – Columbia Small Cap Value Fund I
Positive stock selection in information technology and health care
The fund picked up ground versus the index in the information technology sector, where security selection was particularly helpful within the semiconductors and semiconductor equipment industries. Top contributors included Novellus Systems, a semiconductor test equipment company, whose stock rallied sharply after it received a premium acquisition offer in late 2011. We took profits and sold the position. Shares of Teradyne (0.4% of net assets), another semiconductor equipment company, also posted strong gains, benefiting from strong order growth in the first quarter of 2012 and an improved revenue outlook for the second quarter. Within health care, security selection among health care providers and services stood out. Top individual contributors included generic drug company Par Pharmaceutical (0.6% of net assets), whose stock benefited from patent expirations on branded drugs that allowed Par to expand its product portfolio.
Looking ahead
Despite modestly disappointing results this past year, we still expect the high quality small companies we favor to offer strong, long-term prospects for shareholders. Historically, that has been the case. In fact, from 1990 through the first quarter of 2012, companies with stronger balance sheets beat their weaker counterparts. Companies with excess debt tend, however, to outperform their higher quality peers during periods of prolonged low and stable interest rates—as we’ve seen recently. We think companies with high quality balance sheets will take the lead once the economic recovery kicks into full gear and the Federal Reserve Board begins to raise short-term interest rates. In addition, we’re encouraged because many small-cap stocks continue to offer attractive valuations. The fund ended the period with an economically sensitive bias that included overweights in the information technology, industrials and materials sectors. It had below-average exposure to the financials and utilities sectors, which continue to face headwinds from low interest rates, and to consumer discretionary and staples, where we’ve found fewer attractively valued stocks that meet our investment criteria.
Portfolio characteristics and holdings are subject to change periodically and may not be representative of current and holdings. The outlook for the fund may differ from that presented for other characteristics Columbia Funds.
Equity securities are subject to stock market fluctuations that occur in response to economic and business developments.
Investments in small-cap stocks may be subject to greater volatility and price fluctuations because they may be thinly traded and less liquid than investments in larger companies.
Value stocks are stocks of companies that may have experienced adverse business or industry developments or may be subject to special risks that have caused the stocks to be out of favor. If the manager’s assessment of a company’s prospects is wrong, the price of its stock may not approach the value the manager has placed on it.
| | | | |
| Portfolio Breakdown1 | |
|
at 04/30/12 (%) | |
Consumer Discretionary | | | 10.8 | |
Consumer Staples | | | 2.8 | |
Energy | | | 5.4 | |
Financials | | | 30.0 | |
Health Care | | | 8.7 | |
Industrials | | | 15.7 | |
Information Technology | | | 14.4 | |
Materials | | | 7.1 | |
Telecommunication Services | | | 1.5 | |
Utilities | | | 3.3 | |
Other2 | | | 0.3 | |
| | 1 | Percentages indicated are based upon total investments (excluding Investments of Cash Collateral Received for Securities on Loan). The Fund’s composition is subject to change. |
| | 2 | Includes investments in money market funds. |
| | | | |
| Top Ten Holdings1 | |
|
at 04/30/12 (%) | |
Rent-A-Center, Inc. | | | 1.0 | |
Greif, Inc., Class A | | | 0.9 | |
Sunstone Hotel Investors, Inc. | | | 0.9 | |
Starwood Property Trust, Inc. | | | 0.8 | |
H.B. Fuller Co. | | | 0.8 | |
OM Group, Inc. | | | 0.8 | |
FirstMerit Corp. | | | 0.8 | |
Hancock Holding Co. | | | 0.8 | |
DiamondRock Hospitality Co. | | | 0.8 | |
Wintrust Financial Corp. | | | 0.7 | |
| | 1 | Percentages indicated are based upon total investments (excluding Investments of Cash Collateral Received for Securities on Loan and money market funds). |
For further detail about these holdings, please refer to the section entitled “Portfolio of Investments.”
Fund holdings are as of the date given, are subject to change at any time, and are not recommendations to buy or sell any security.
5
Portfolio of Investments — Columbia Small Cap Value Fund I
April 30, 2012
(Percentages represent value of investments compared to net assets)
| | | | | | | | |
| Issuer | | Shares | | | Value | |
Common Stocks 99.2% | |
CONSUMER DISCRETIONARY 10.8% | |
Diversified Consumer Services 0.8% | |
Lincoln Educational Services Corp.(a) | | | 618,451 | | | | $4,539,430 | |
Regis Corp.(a) | | | 401,226 | | | | 7,362,497 | |
Universal Technical Institute, Inc.(a) | | | 172,489 | | | | 2,069,868 | |
| | | | | | | | |
Total | | | | | | | 13,971,795 | |
Hotels, Restaurants & Leisure 1.8% | |
Benihana, Inc.(a) | | | 504,550 | | | | 6,957,744 | |
Bob Evans Farms, Inc.(a) | | | 281,911 | | | | 10,780,277 | |
PF Chang’s China Bistro, Inc.(a) | | | 172,020 | | | | 6,827,474 | |
Red Robin Gourmet Burgers, Inc.(a)(b) | | | 184,219 | | | | 6,569,250 | |
| | | | | | | | |
Total | | | | | | | 31,134,745 | |
Household Durables 0.8% | |
American Greetings Corp., Class A(a) | | | 433,160 | | | | 6,930,560 | |
Cavco Industries, Inc.(a)(b) | | | 127,794 | | | | 6,594,171 | |
CSS Industries, Inc. | | | 35,509 | | | | 679,997 | |
| | | | | | | | |
Total | | | | | | | 14,204,728 | |
Specialty Retail 4.7% | |
Aaron’s, Inc. | | | 299,260 | | | | 8,130,894 | |
Children’s Place Retail Stores, Inc.
(The)(a)(b) | | | 221,171 | | | | 10,169,443 | |
Finish Line, Inc., Class A (The)(a) | | | 473,254 | | | | 10,534,634 | |
GameStop Corp., Class A(a) | | | 279,027 | | | | 6,350,655 | |
hhgregg, Inc.(a)(b) | | | 472,537 | | | | 4,942,737 | |
Men’s Wearhouse, Inc. (The)(a) | | | 332,936 | | | | 12,331,950 | |
Rent-A-Center, Inc.(a) | | | 496,635 | | | | 16,989,883 | |
Shoe Carnival, Inc.(a)(b) | | | 351,285 | | | | 6,828,980 | |
Stage Stores, Inc.(a) | | | 377,783 | | | | 5,768,746 | |
| | | | | | | | |
Total | | | | | | | 82,047,922 | |
Textiles, Apparel & Luxury Goods 2.7% | |
Columbia Sportswear Co.(a) | | | 100,030 | | | | 4,711,413 | |
Deckers Outdoor Corp.(b) | | | 175,190 | | | | 8,936,442 | |
G-III Apparel Group Ltd.(a)(b) | | | 209,210 | | | | 5,617,288 | |
Jones Group, Inc. (The)(a) | | | 859,800 | | | | 9,646,956 | |
Movado Group, Inc.(a) | | | 368,619 | | | | 10,450,349 | |
Warnaco Group, Inc. (The)(a)(b) | | | 139,720 | | | | 7,399,571 | |
| | | | | | | | |
Total | | | | | | | 46,762,019 | |
TOTAL CONSUMER DISCRETIONARY | | | | | | | 188,121,209 | |
CONSUMER STAPLES 2.8% | |
Food & Staples Retailing 1.5% | |
Andersons, Inc. (The)(a) | | | 223,580 | | | | 11,268,432 | |
Harris Teeter Supermarkets, Inc.(a) | | | 218,490 | | | | 8,296,065 | |
Spartan Stores, Inc.(a) | | | 368,381 | | | | 6,715,586 | |
| | | | | | | | |
Total | | | | | | | 26,280,083 | |
Food Products 1.3% | |
Chiquita Brands International, Inc.(a)(b) | | | 704,560 | | | | 5,988,760 | |
Darling International, Inc.(a)(b) | | | 316,100 | | | | 5,177,718 | |
Fresh Del Monte Produce, Inc.(a) | | | 498,177 | | | | 11,542,761 | |
| | | | | | | | |
Total | | | | | | | 22,709,239 | |
TOTAL CONSUMER STAPLES | | | | | | | 48,989,322 | |
ENERGY 5.3% | |
Energy Equipment & Services 2.8% | |
Gulf Island Fabrication, Inc.(a) | | | 244,897 | | | | 6,862,014 | |
Matrix Service Co.(a)(b) | | | 533,270 | | | | 7,279,136 | |
Patterson-UTI Energy, Inc.(a) | | | 415,480 | | | | 6,718,312 | |
| | | | | | | | |
| Issuer | | Shares | | | Value | |
Common Stocks (continued) | |
ENERGY (cont.) | |
Energy Equipment & Services (cont.) | |
RPC, Inc.(a) | | | 683,539 | | | | $7,067,793 | |
Tetra Technologies, Inc.(a)(b) | | | 707,385 | | | | 6,161,323 | |
TGC Industries, Inc.(b) | | | 653,344 | | | | 7,454,650 | |
Tidewater, Inc. | | | 141,730 | | | | 7,799,402 | |
| | | | | | | | |
Total | | | | | | | 49,342,630 | |
Oil, Gas & Consumable Fuels 2.5% | |
Bill Barrett Corp.(a)(b) | | | 370,970 | | | | 8,895,860 | |
Cloud Peak Energy, Inc.(a)(b) | | | 505,694 | | | | 7,782,631 | |
Forest Oil Corp.(a)(b) | | | 367,350 | | | | 4,893,102 | |
Stone Energy Corp.(a)(b) | | | 273,528 | | | | 7,672,460 | |
Swift Energy Co.(a)(b) | | | 225,059 | | | | 6,808,035 | |
VAALCO Energy, Inc.(a)(b) | | | 862,667 | | | | 7,824,390 | |
| | | | | | | | |
Total | | | | | | | 43,876,478 | |
TOTAL ENERGY | | | | | | | 93,219,108 | |
FINANCIALS 29.9% | | | | | | | | |
Capital Markets 1.5% | | | | | | | | |
GFI Group, Inc.(a) | | | 1,415,250 | | | | 4,670,325 | |
INTL FCStone, Inc.(a)(b) | | | 337,921 | | | | 7,265,301 | |
Investment Technology Group, Inc.(a)(b) | | | 232,233 | | | | 2,368,777 | |
Knight Capital Group, Inc., Class A(b) | | | 850,290 | | | | 11,172,811 | |
Medallion Financial Corp. | | | 75,730 | | | | 827,729 | |
| | | | | | | | |
Total | | | | | | | 26,304,943 | |
Commercial Banks 9.2% | |
Ameris Bancorp(a)(b) | | | 666,539 | | | | 8,265,083 | |
BancFirst Corp.(a) | | | 178,001 | | | | 7,422,642 | |
Bryn Mawr Bank Corp. | | | 349,303 | | | | 7,506,521 | |
Chemical Financial Corp.(a) | | | 411,853 | | | | 9,089,596 | |
Columbia Banking System, Inc.(a) | | | 489,165 | | | | 10,022,991 | |
Community Trust Bancorp, Inc.(a) | | | 273,724 | | | | 8,745,482 | |
First Citizens BancShares Inc., Class A | | | 45,778 | | | | 7,933,327 | |
First Commonwealth Financial Corp.(a) | | | 1,766,914 | | | | 11,361,257 | |
First Financial Corp.(a) | | | 307,157 | | | | 9,214,710 | |
First National Bank of Alaska | | | 2,615 | | | | 4,170,925 | |
FirstMerit Corp.(a) | | | 819,070 | | | | 13,760,376 | |
Glacier Bancorp, Inc.(a) | | | 632,410 | | | | 9,422,909 | |
Hancock Holding Co. | | | 417,198 | | | | 13,425,432 | |
Investors Bancorp, Inc.(a)(b) | | | 482,343 | | | | 7,447,376 | |
Merchants Bancshares, Inc. | | | 258,716 | | | | 6,954,286 | |
Northrim BanCorp, Inc.(c) | | | 328,351 | | | | 7,204,021 | |
West Coast Bancorp(a)(b) | | | 332,908 | | | | 6,505,022 | |
Wintrust Financial Corp.(a) | | | 349,015 | | | | 12,609,912 | |
| | | | | | | | |
Total | | | | | | | 161,061,868 | |
Consumer Finance 0.6% | |
Cash America International, Inc.(a) | | | 223,119 | | | | 10,430,813 | |
Diversified Financial Services 0.2% | |
Pico Holdings, Inc.(b) | | | 168,742 | | | | 4,051,496 | |
Insurance 7.6% | |
Allied World Assurance Co. Holdings AG | | | 122,440 | | | | 8,810,783 | |
American Safety Insurance Holdings
Ltd.(b) | | | 374,797 | | | | 7,094,907 | |
Argo Group International Holdings Ltd.(a) | | | 320,370 | | | | 9,245,878 | |
Baldwin & Lyons, Inc., Class B(a) | | | 288,562 | | | | 6,281,995 | |
eHealth, Inc.(b) | | | 325,565 | | | | 5,769,012 | |
EMC Insurance Group, Inc.(a) | | | 296,533 | | | | 5,862,458 | |
Endurance Specialty Holdings Ltd. | | | 176,340 | | | | 7,085,341 | |
The Accompanying Notes to Financial Statements are an integral part of this statement.
6
Columbia Small Cap Value Fund I
April 30, 2012
(Percentages represent value of investments compared to net assets)
| | | | | | | | |
| Issuer | | Shares | | | Value | |
Common Stocks (continued) | |
FINANCIALS (cont.) | | | | | | | | |
Insurance (cont.) | |
FBL Financial Group, Inc., Class A(a) | | | 168,885 | | | | $4,917,931 | |
Global Indemnity PLC(a)(b) | | | 486,409 | | | | 8,760,226 | |
Hanover Insurance Group, Inc. (The) | | | 218,713 | | | | 8,827,257 | |
Horace Mann Educators Corp.(a) | | | 512,391 | | | | 8,992,462 | |
Kemper Corp. | | | 235,269 | | | | 7,055,717 | |
National Western Life Insurance Co., Class A(a) | | | 32,022 | | | | 4,356,913 | |
Navigators Group, Inc. (The)(a)(b) | | | 178,981 | | | | 8,501,598 | |
Safety Insurance Group, Inc.(a) | | | 224,491 | | | | 8,945,966 | |
Stewart Information Services Corp.(a) | | | 368,745 | | | | 5,427,926 | |
Symetra Financial Corp. | | | 688,352 | | | | 8,370,360 | |
United Fire Group, Inc.(a) | | | 487,496 | | | | 8,394,681 | |
| | | | | | | | |
Total | | | | | | | 132,701,411 | |
Real Estate Investment Trusts (REITs) 6.3% | |
Chesapeake Lodging Trust(a) | | | 577,772 | | | | 10,457,673 | |
Corporate Office Properties Trust(a) | | | 277,200 | | | | 6,528,060 | |
Cousins Properties, Inc.(a) | | | 1,320,768 | | | | 10,381,236 | |
DiamondRock Hospitality Co.(a) | | | 1,259,399 | | | | 13,387,411 | |
Franklin Street Properties Corp.(a) | | | 695,123 | | | | 6,999,889 | |
National Health Investors, Inc.(a) | | | 168,058 | | | | 8,313,829 | |
Potlatch Corp.(a) | | | 321,951 | | | | 10,077,066 | |
Starwood Property Trust, Inc.(a) | | | 686,019 | | | | 14,317,217 | |
Sunstone Hotel Investors, Inc.(a)(b) | | | 1,456,993 | | | | 14,861,329 | |
Terreno Realty Corp.(c) | | | 534,299 | | | | 7,640,476 | |
Urstadt Biddle Properties, Inc., Class A(a) | | | 313,782 | | | | 6,037,166 | |
| | | | | | | | |
Total | | | | | | | 109,001,352 | |
Thrifts & Mortgage Finance 4.5% | |
Bank Mutual Corp. | | | 1,246,483 | | | | 4,861,284 | |
BankFinancial Corp. | | | 709,216 | | | | 4,723,379 | |
Beneficial Mutual Bancorp, Inc.(a)(b) | | | 951,316 | | | | 8,247,910 | |
Brookline Bancorp, Inc.(a) | | | 984,805 | | | | 8,843,549 | |
ESSA Bancorp, Inc. | | | 437,749 | | | | 4,268,053 | |
Home Federal Bancorp, Inc. | | | 737,674 | | | | 7,221,828 | |
MGIC Investment Corp.(b) | | | 1,653,100 | | | | 5,719,726 | |
Northfield Bancorp, Inc.(a) | | | 340,605 | | | | 4,754,846 | |
Provident New York Bancorp(a) | | | 683,208 | | | | 5,766,275 | |
TrustCo Bank Corp. | | | 536,097 | | | | 2,932,451 | |
United Financial Bancorp, Inc.(a) | | | 324,213 | | | | 5,200,376 | |
Washington Federal, Inc.(a) | | | 559,221 | | | | 9,808,736 | |
Westfield Financial, Inc.(a) | | | 850,511 | | | | 6,353,317 | |
| | | | | | | | |
Total | | | | | | | 78,701,730 | |
TOTAL FINANCIALS | | | | | | | 522,253,613 | |
HEALTH CARE 8.7% | |
Health Care Equipment & Supplies 3.3% | |
Analogic Corp. | | | 102,219 | | | | 6,972,358 | |
Angiodynamics, Inc.(a)(b) | | | 378,849 | | | | 4,690,151 | |
Cantel Medical Corp.(a) | | | 355,928 | | | | 8,357,189 | |
CONMED Corp.(a) | | | 284,750 | | | | 8,141,002 | |
ICU Medical, Inc.(a)(b) | | | 160,634 | | | | 8,431,679 | |
Kensey Nash Corp.(a) | | | 215,026 | | | | 6,113,189 | |
Medical Action Industries, Inc.(a)(b) | | | 509,953 | | | | 2,814,941 | |
Orthofix International NV(b) | | | 144,645 | | | | 5,962,267 | |
Quidel Corp.(a)(b) | | | 339,272 | | | | 5,604,773 | |
| | | | | | | | |
Total | | | | | | | 57,087,549 | |
Health Care Providers & Services 3.3% | |
Amsurg Corp.(b) | | | 344,061 | | | | 9,895,194 | |
| | | | | | | | |
| Issuer | | Shares | | | Value | |
Common Stocks (continued) | |
HEALTH CARE (cont.) | |
Health Care Providers & Services (cont.) | |
Centene Corp.(a)(b) | | | 219,900 | | | | $8,705,841 | |
Lincare Holdings, Inc.(a) | | | 319,170 | | | | 7,787,748 | |
Magellan Health Services, Inc.(a)(b) | | | 217,170 | | | | 9,616,288 | |
Medcath Corp. | | | 578,380 | | | | 4,563,418 | |
Molina Healthcare, Inc.(a)(b) | | | 277,020 | | | | 7,105,563 | |
Triple-S Management Corp., Class B(b) | | | 252,610 | | | | 5,319,967 | |
U.S. Physical Therapy, Inc.(a) | | | 235,554 | | | | 5,742,806 | |
| | | | | | | | |
Total | | | | | | | 58,736,825 | |
Pharmaceuticals 2.1% | |
Impax Laboratories, Inc.(a)(b) | | | 337,740 | | | | 8,318,536 | |
Medicis Pharmaceutical Corp., Class A(a) | | | 215,980 | | | | 8,308,751 | |
Par Pharmaceutical Companies, Inc.(a)(b) | | | 239,130 | | | | 10,124,764 | |
Viropharma, Inc.(a)(b) | | | 439,629 | | | | 9,561,931 | |
| | | | | | | | |
Total | | | | | | | 36,313,982 | |
TOTAL HEALTH CARE | | | | | | | 152,138,356 | |
INDUSTRIALS 15.6% | |
Aerospace & Defense 1.3% | |
AAR Corp.(a) | | | 279,308 | | | | 4,315,308 | |
Ceradyne, Inc.(a) | | | 355,502 | | | | 9,001,311 | |
Curtiss-Wright Corp.(a) | | | 290,530 | | | | 10,252,804 | |
| | | | | | | | |
Total | | | | | | | 23,569,423 | |
Building Products 0.4% | |
Universal Forest Products, Inc.(a) | | | 167,246 | | | | 6,255,000 | |
Commercial Services & Supplies 2.0% | |
ABM Industries, Inc.(a) | | | 335,360 | | | | 7,807,181 | |
Consolidated Graphics, Inc.(a)(b) | | | 136,329 | | | | 5,451,797 | |
Ennis, Inc.(a) | | | 308,039 | | | | 4,854,694 | |
Unifirst Corp.(a) | | | 144,562 | | | | 8,783,587 | |
United Stationers, Inc.(a) | | | 258,220 | | | | 7,323,119 | |
| | | | | | | | |
Total | | | | | | | 34,220,378 | |
Construction & Engineering 2.3% | |
Comfort Systems U.S.A., Inc.(a) | | | 421,107 | | | | 4,455,312 | |
Dycom Industries, Inc.(a)(b) | | | 392,631 | | | | 9,183,639 | |
EMCOR Group, Inc.(a) | | | 395,740 | | | | 11,603,097 | |
KHD Humboldt Wedag International AG(b) | | | 375,543 | | | | 2,910,061 | |
Layne Christensen Co.(a)(b) | | | 233,160 | | | | 4,791,438 | |
Pike Electric Corp.(a)(b) | | | 528,731 | | | | 4,346,169 | |
Sterling Construction Co., Inc.(a)(b) | | | 340,590 | | | | 3,334,376 | |
| | | | | | | | |
Total | | | | | | | 40,624,092 | |
Electrical Equipment 1.8% | |
Belden, Inc. | | | 235,771 | | | | 8,200,115 | |
Brady Corp., Class A(a) | | | 276,330 | | | | 8,574,520 | |
GrafTech International Ltd.(b) | | | 755,756 | | | | 8,872,576 | |
Powell Industries, Inc.(a)(b) | | | 155,694 | | | | 5,077,181 | |
| | | | | | | | |
Total | | | | | | | 30,724,392 | |
Machinery 4.6% | |
Astec Industries, Inc.(a)(b) | | | 203,188 | | | | 6,357,753 | |
Briggs & Stratton Corp.(a) | | | 422,329 | | | | 7,644,155 | |
CIRCOR International, Inc.(a) | | | 183,260 | | | | 5,703,051 | |
EnPro Industries, Inc.(a)(b) | | | 235,722 | | | | 9,761,248 | |
FreightCar America, Inc.(a) | | | 160,596 | | | | 3,468,874 | |
Harsco Corp. | | | 172,857 | | | | 3,854,711 | |
ITT Corp. | | | 233,490 | | | | 5,244,185 | |
The Accompanying Notes to Financial Statements are an integral part of this statement.
7
Columbia Small Cap Value Fund I
April 30, 2012
(Percentages represent value of investments compared to net assets)
| | | | | | | | |
| Issuer | | Shares | | | Value | |
Common Stocks (continued) | |
INDUSTRIALS (cont.) | |
Machinery (cont.) | |
Kadant, Inc.(a)(b) | | | 308,624 | | | | $7,984,103 | |
LB Foster Co., Class A(a) | | | 222,000 | | | | 5,951,820 | |
Mueller Industries, Inc. | | | 271,850 | | | | 12,426,263 | |
Robbins & Myers, Inc.(a) | | | 241,659 | | �� | | 11,771,210 | |
| | | | | | | | |
Total | | | | | | | 80,167,373 | |
Professional Services 0.9% | |
FTI Consulting, Inc.(a)(b) | | | 234,550 | | | | 8,523,547 | |
Korn/Ferry International(a)(b) | | | 423,841 | | | | 6,845,032 | |
| | | | | | | | |
Total | | | | | | | 15,368,579 | |
Road & Rail 1.4% | |
Heartland Express, Inc.(a) | | | 495,774 | | | | 6,856,555 | |
Ryder System, Inc. | | | 139,399 | | | | 6,791,519 | |
Werner Enterprises, Inc.(a) | | | 491,819 | | | | 11,616,765 | |
| | | | | | | | |
Total | | | | | | | 25,264,839 | |
Trading Companies & Distributors 0.9% | |
Applied Industrial Technologies, Inc.(a) | | | 185,850 | | | | 7,303,905 | |
Kaman Corp. | | | 265,922 | | | | 9,142,398 | |
| | | | | | | | |
Total | | | | | | | 16,446,303 | |
TOTAL INDUSTRIALS | | | | | | | 272,640,379 | |
INFORMATION TECHNOLOGY 14.4% | |
Communications Equipment 1.0% | |
Anaren, Inc.(a)(b) | | | 277,910 | | | | 5,013,496 | |
Emulex Corp.(b) | | | 906,000 | | | | 7,864,080 | |
Symmetricom, Inc.(a)(b) | | | 790,030 | | | | 4,392,567 | |
| | | | | | | | |
Total | | | | | | | 17,270,143 | |
Computers & Peripherals 0.4% | |
QLogic Corp.(b) | | | 358,900 | | | | 6,191,025 | |
Electronic Equipment, Instruments & Components 2.9% | |
Anixter International, Inc.(a)(b) | | | 153,098 | | | | 10,499,461 | |
Benchmark Electronics, Inc.(b) | | | 516,532 | | | | 8,202,528 | |
Electro Scientific Industries, Inc.(a) | | | 339,540 | | | | 4,841,841 | |
Littelfuse, Inc.(a) | | | 172,811 | | | | 10,830,065 | |
Methode Electronics, Inc.(a) | | | 400,152 | | | | 3,381,284 | |
MTS Systems Corp.(a) | | | 158,280 | | | | 7,592,692 | |
Nam Tai Electronics, Inc. | | | 969,051 | | | | 4,825,874 | |
| | | | | | | | |
Total | | | | | | | 50,173,745 | |
Internet Software & Services 1.6% | |
InfoSpace, Inc.(a)(b) | | | 596,310 | | | | 6,636,931 | |
j2 Global, Inc.(a) | | | 197,623 | | | | 5,104,602 | |
Monster Worldwide, Inc.(a)(b) | | | 606,870 | | | | 5,237,288 | |
United Online, Inc.(a) | | | 857,000 | | | | 4,062,180 | |
ValueClick, Inc.(a)(b) | | | 361,890 | | | | 7,664,830 | |
| | | | | | | | |
Total | | | | | | | 28,705,831 | |
IT Services 3.2% | |
Acxiom Corp.(a)(b) | | | 638,620 | | | | 8,768,253 | |
CACI International, Inc., Class A(a)(b) | | | 183,076 | | | | 11,191,436 | |
Convergys Corp.(a)(b) | | | 712,227 | | | | 9,522,475 | |
CSG Systems International, Inc.(b) | | | 334,541 | | | | 4,817,390 | |
Global Cash Access Holdings, Inc.(a)(b) | | | 1,116,168 | | | | 9,431,620 | |
MoneyGram International, Inc.(b) | | | 421,728 | | | | 7,101,899 | |
TeleTech Holdings, Inc.(a)(b) | | | 388,890 | | | | 5,891,683 | |
| | | | | | | | |
Total | | | | | | | 56,724,756 | |
| | | | | | | | |
| Issuer | | Shares | | | Value | |
Common Stocks (continued) | |
INFORMATION TECHNOLOGY (cont.) | |
Semiconductors & Semiconductor Equipment 3.9% | |
Amkor Technology, Inc.(a)(b) | | | 714,775 | | | | $3,695,387 | |
ATMI, Inc.(a)(b) | | | 322,982 | | | | 6,785,852 | |
Cabot Microelectronics Corp.(a) | | | 183,840 | | | | 6,320,419 | |
Cymer, Inc.(a)(b) | | | 198,030 | | | | 10,265,875 | |
Entegris, Inc.(b) | | | 1,066,510 | | | | 9,438,614 | |
Integrated Device Technology, Inc.(a)(b) | | | 894,390 | | | | 6,055,020 | |
MKS Instruments, Inc. | | | 351,308 | | | | 9,713,666 | |
Teradyne, Inc.(a)(b) | | | 433,300 | | | | 7,457,093 | |
Tessera Technologies, Inc.(a)(b) | | | 481,926 | | | | 7,537,323 | |
| | | | | | | | |
Total | | | | | | | 67,269,249 | |
Software 1.4% | |
Compuware Corp.(b) | | | 561,540 | | | | 4,896,629 | |
Monotype Imaging Holdings, Inc.(a)(b) | | | 333,368 | | | | 4,730,492 | |
Parametric Technology Corp.(b) | | | 257,770 | | | | 5,562,676 | |
Progress Software Corp.(a)(b) | | | 411,608 | | | | 9,524,609 | |
| | | | | | | | |
Total | | | | | | | 24,714,406 | |
TOTAL INFORMATION TECHNOLOGY | | | | | | | 251,049,155 | |
MATERIALS 7.0% | |
Chemicals 4.0% | |
A. Schulman, Inc.(a) | | | 85,276 | | | | 2,098,642 | |
Cabot Corp. | | | 134,570 | | | | 5,804,004 | |
Chemtura Corp.(b) | | | 525,270 | | | | 8,940,096 | |
Cytec Industries, Inc. | | | 126,230 | | | | 8,024,441 | |
Ferro Corp.(a)(b) | | | 987,480 | | | | 5,125,021 | |
H.B. Fuller Co.(a) | | | 432,119 | | | | 14,216,715 | |
Minerals Technologies, Inc. | | | 167,156 | | | | 11,216,168 | |
OM Group, Inc.(a)(b) | | | 580,989 | | | | 14,013,455 | |
| | | | | | | | |
Total | | | | | | | 69,438,542 | |
Containers & Packaging 1.4% | |
Greif, Inc., Class A(a) | | | 306,043 | | | | 16,416,147 | |
Greif, Inc., Class B(a) | | | 102,163 | | | | 5,562,775 | |
Packaging Corp. of America | | | 124,833 | | | | 3,643,875 | |
| | | | | | | | |
Total | | | | | | | 25,622,797 | |
Metals & Mining 1.2% | |
Olympic Steel, Inc.(a) | | | 232,857 | | | | 4,920,268 | |
Thompson Creek Metals Co., Inc.(b) | | | 1,319,590 | | | | 7,825,169 | |
Worthington Industries, Inc.(a) | | | 432,980 | | | | 7,724,363 | |
| | | | | | | | |
Total | | | | | | | 20,469,800 | |
Paper & Forest Products 0.4% | |
Wausau Paper Corp.(a) | | | 783,630 | | | | 7,099,688 | |
TOTAL MATERIALS | | | | | | | 122,630,827 | |
TELECOMMUNICATION SERVICES 1.4% | |
Diversified Telecommunication Services 1.0% | |
Cbeyond, Inc.(a)(b) | | | 676,237 | | | | 4,348,204 | |
Lumos Networks Corp.(a) | | | 221,920 | | | | 2,006,157 | |
Neutral Tandem, Inc.(b) | | | 524,120 | | | | 6,090,274 | |
Warwick Valley Telephone Co.(c) | | | 341,813 | | | | 4,662,329 | |
| | | | | | | | |
Total | | | | | | | 17,106,964 | |
The Accompanying Notes to Financial Statements are an integral part of this statement.
8
Columbia Small Cap Value Fund I
April 30, 2012
(Percentages represent value of investments compared to net assets)
| | | | | | | | |
| Issuer | | Shares | | | Value | |
Common Stocks (continued) | |
TELECOMMUNICATION SERVICES (cont.) | |
Wireless Telecommunication Services 0.4% | |
NTELOS Holdings Corp.(a) | | | 216,420 | | | | $4,376,013 | |
Shenandoah Telecommunications Co.(a) | | | 345,555 | | | | 3,852,938 | |
| | | | | | | | |
Total | | | | | | | 8,228,951 | |
TOTAL TELECOMMUNICATION SERVICES | | | | | | | 25,335,915 | |
UTILITIES 3.3% | |
Electric Utilities 2.0% | |
Allete, Inc. | | | 305,700 | | | | 12,597,897 | |
IDACORP, Inc. | | | 308,830 | | | | 12,581,734 | |
MGE Energy, Inc.(a) | | | 209,654 | | | | 9,589,574 | |
| | | | | | | | |
Total | | | | | | | 34,769,205 | |
Gas Utilities 1.3% | | | | | | | | |
Laclede Group, Inc.(The)(a) | | | 258,427 | | | | 10,176,855 | |
Southwest Gas Corp.(a) | | | 290,615 | | | | 12,211,643 | |
| | | | | | | | |
Total | | | | | | | 22,388,498 | |
TOTAL UTILITIES | | | | | | | 57,157,703 | |
Total Common Stocks | | | | | | | | |
(Cost: $1,450,870,069) | | | | | | | $1,733,535,587 | |
| |
Money Market Funds 0.3% | | | | | | | | |
Columbia Short-Term Cash Fund,
0.144%(c)(d) | | | 5,728,038 | | | | 5,728,038 | |
Total Money Market Funds | | | | | | | | |
(Cost: $5,728,038) | | | | | | | $5,728,038 | |
| | | | | | | | | | | | |
| | | |
| Issuer | | Effective
Yield | | | Par/
Principal/
Shares | | | Value | |
Investments of Cash Collateral Received for Securities on Loan 21.4% | |
Asset-Backed Commercial Paper 1.1% | |
Atlantis One | |
08/01/12 | | | 0.662 | % | | | $2,989,990 | | | | $2,989,990 | |
09/10/12 | | | 0.592 | % | | | 6,979,350 | | | | 6,979,350 | |
10/11/12 | | | 0.541 | % | | | 3,989,020 | | | | 3,989,020 | |
Kells Funding LLC | |
06/04/12 | | | 0.491 | % | | | 4,993,331 | | | | 4,993,331 | |
| | | | | | | | | | | | |
Total | | | | | | | | | | | 18,951,691 | |
Certificates of Deposit 11.0% | |
ABM AMRO Bank N.V. | |
06/21/12 | | | 0.400 | % | | | 9,989,788 | | | | 9,989,788 | |
Australia and New Zealand Bank Group, Ltd. | |
06/11/12 | | | 0.580 | % | | | 6,000,000 | | | | 6,000,000 | |
Bank of Nova Scotia | |
05/03/12 | | | 0.371 | % | | | 10,000,000 | | | | 10,000,000 | |
07/26/12 | | | 0.319 | % | | | 5,000,000 | | | | 5,000,000 | |
Banque et Caisse d’Epargne de l’Etat | |
06/15/12 | | | 0.430 | % | | | 9,989,023 | | | | 9,989,023 | |
DZ Bank AG | |
07/27/12 | | | 0.320 | % | | | 15,000,000 | | | | 15,000,000 | |
Deutsche Bank AG | |
10/09/12 | | | 0.750 | % | | | 10,000,000 | | | | 10,000,000 | |
DnB NOR ASA | |
09/14/12 | | | 0.530 | % | | | $10,000,000 | | | | 10,000,000 | |
| | | | | | | | | | | | |
| Issuer | | Effective
Yield | | | Par/
Principal/
Shares | | | Value | |
Investments of Cash Collateral Received for Securities on Loan (continued) | |
Certificates of Deposit (cont.) | |
Hong Kong Shanghai Bank Corp., Ltd. | |
05/02/12 | | | 0.200 | % | | | $10,000,000 | | | | $10,000,000 | |
06/01/12 | | | 0.250 | % | | | 5,000,000 | | | | 5,000,000 | |
Mitsubishi UFJ Trust and Banking Corp. | |
05/31/12 | | | 0.390 | % | | | 5,000,064 | | | | 5,000,064 | |
Mizuho Corporate Bank Ltd. | |
08/14/12 | | | 0.400 | % | | | 10,000,000 | | | | 10,000,000 | |
N.V. Bank Nederlandse Gemeenten | |
05/10/12 | | | 0.280 | % | | | 10,000,000 | | | | 10,000,000 | |
05/22/12 | | | 0.270 | % | | | 5,000,000 | | | | 5,000,000 | |
National Bank of Canada | |
05/08/12 | | | 0.391 | % | | | 10,000,000 | | | | 10,000,000 | |
Natixis | |
05/01/12 | | | 0.240 | % | | | 5,000,000 | | | | 5,000,000 | |
Norinchukin Bank | |
05/21/12 | | | 0.470 | % | | | 7,000,000 | | | | 7,000,000 | |
10/31/12 | | | 0.560 | % | | | 5,000,000 | | | | 5,000,000 | |
Rabobank | |
10/26/12 | | | 0.515 | % | | | 10,000,000 | | | | 10,000,000 | |
Standard Chartered Bank PLC | |
10/05/12 | | | 0.630 | % | | | 9,968,077 | | | | 9,968,077 | |
Sumitomo Mitsui Banking Corp. | |
07/24/12 | | | 0.350 | % | | | 3,000,000 | | | | 3,000,000 | |
10/11/12 | | | 0.500 | % | | | 10,000,000 | | | | 10,000,000 | |
Sumitomo Trust & Banking Co., Ltd. | |
09/17/12 | | | 0.470 | % | | | 5,000,000 | | | | 5,000,000 | |
10/10/12 | | | 0.500 | % | | | 5,984,789 | | | | 5,984,789 | |
| | | | | | | | | | | | |
Total | | | | | | | | | | | 191,931,741 | |
Commercial Paper 5.0% | |
BTM Capital | |
06/27/12 | | | 0.511 | % | | | 5,992,265 | | | | 5,992,265 | |
Caisse d’Amortissement de la Dette Sociale | |
07/19/12 | | | 0.471 | % | | | 4,992,167 | | | | 4,992,167 | |
DnB NOR | |
08/30/12 | | | 0.489 | % | | | 6,000,000 | | | | 6,000,000 | |
Macquarie Bank Ltd. | |
10/19/12 | | | 0.980 | % | | | 11,000,000 | | | | 11,000,000 | |
Mitsubishi UFJ Trust and Banking Corp. | |
05/03/12 | | | 0.430 | % | | | 4,995,760 | | | | 4,995,760 | |
Nordea Bank AB | |
07/24/12 | | | 0.627 | % | | | 6,977,882 | | | | 6,977,882 | |
Skandinaviska Enskilda Banken AB | |
05/25/12 | | | 0.320 | % | | | 4,998,044 | | | | 4,998,044 | |
06/15/12 | | | 0.330 | % | | | 4,997,250 | | | | 4,997,250 | |
05/03/12 | | | 0.350 | % | | | 4,996,840 | | | | 4,996,840 | |
05/14/12 | | | 0.330 | % | | | 2,998,295 | | | | 2,998,295 | |
Societe Generale | |
05/01/12 | | | 0.310 | % | | | 9,999,397 | | | | 9,999,397 | |
Suncorp Metway Ltd. | |
06/04/12 | | | 0.450 | % | | | 4,996,063 | | | | 4,996,063 | |
05/21/12 | | | 0.480 | % | | | 4,995,800 | | | | 4,995,800 | |
Svenska Handelsbank | |
05/23/12 | | | 0.300 | % | | | 4,996,458 | | | | 4,996,458 | |
The Commonwealth Bank of Australia | |
08/16/12 | | | 0.300 | % | | | 5,000,000 | | | | 5,000,000 | |
| | | | | | | | | | | | |
Total | | | | | | | | | | | 87,936,221 | |
The Accompanying Notes to Financial Statements are an integral part of this statement.
9
Columbia Small Cap Value Fund I
April 30, 2012
(Percentages represent value of investments compared to net assets)
| | | | | | | | | | | | |
| Issuer | | Effective
Yield | | | Par/
Principal/
Shares | | | Value | |
Investments of Cash Collateral Received for Securities on Loan (continued) | |
Repurchase Agreements 4.3% | |
Credit Suisse Securities (USA) LLC
dated 04/26/12, matures 05/03/12,
repurchase price $10,000,311(e) | |
| | | 0.160 | % | | | $10,000,000 | | | | $10,000,000 | |
Natixis Financial Products, Inc.
dated 04/30/12, matures 05/01/12,
repurchase price $35,000,233(e) | |
| | | 0.240 | % | | | 35,000,000 | | | | 35,000,000 | |
Nomura Securities
dated 04/30/12, matures 05/01/12,
repurchase price $5,000,033(e) | |
| | | 0.240 | % | | | 5,000,000 | | | | 5,000,000 | |
RBS Securities, Inc.
dated 04/30/12, matures 05/01/12,
repurchase price $15,000,088(e) | |
| | | 0.210 | % | | | 15,000,000 | | | | 15,000,000 | |
| | | | | | | | | | | | |
| Issuer | | Effective
Yield | | | Par/
Principal/
Shares | | | Value | |
Investments of Cash Collateral Received for Securities on Loan (continued) | |
Repurchase Agreements (cont.) | |
UBS Securities LLC
dated 04/30/12, matures 05/01/12,
repurchase price $10,373,733(e) | |
| | | 0.200 | % | | | $10,373,676 | | | | $10,373,676 | |
| | | | | | | | | | | | |
Total | | | | | | | | | | | 75,373,676 | |
Total Investments of Cash Collateral Received for Securities on Loan | |
(Cost: $374,193,329) | | | | $374,193,329 | |
Total Investments | |
(Cost: $1,830,791,436) | | | | $2,113,456,954 | |
Other Assets & Liabilities, Net | | | | (365,016,837 | ) |
Net Assets | | | | $1,748,440,117 | |
|
Notes to Portfolio of Investments |
| (a) | At April 30, 2012, security was partially or fully on loan. |
| (c) | Investments in affiliates during the period ended April 30, 2012: |
| | | | | | | | | | | | | | | | | | | | | | | | | | | | |
| Issuer | | Beginning
Cost | | | Purchase
Cost | | | Sales Cost/
Proceeds
from Sales | | | Realized
Gain/Loss | | | Ending
Cost | | | Dividends
or Interest
Income | | | Value | |
Columbia Short-Term Cash Fund | | | $36,544 | | | | $149,921,200 | | | | $(144,229,706 | ) | | | $— | | | | $5,728,038 | | | | $5,119 | | | | $5,728,038 | |
Northrim BanCorp, Inc. | | | 5,847,077 | | | | — | | | | (743,190 | ) | | | (181,710 | ) | | | 4,922,177 | | | | 131,733 | | | | 7,204,021 | |
Terreno Realty Corp. | | | 8,861,353 | | | | 813,245 | | | | (347,127 | ) | | | (73,413 | ) | | | 9,254,058 | | | | 204,037 | | | | 7,640,476 | * |
Warwick Valley Telephone Co. | | | 4,544,808 | | | | — | | | | (251,389 | ) | | | (10,037 | ) | | | 4,283,382 | | | | 278,113 | | | | 4,662,329 | |
Total | | | $19,289,782 | | | | $150,734,445 | | | | $(145,571,412 | ) | | | $(265,160 | ) | | | $24,187,655 | | | | $619,002 | | | | $25,234,864 | |
| | * | At April 30, 2012, the Fund owns less than five percent of the company’s outstanding voting shares. |
| (d) | The rate shown is the seven-day current annualized yield at April 30, 2012. |
| (e) | The table below represents securities received as collateral for repurchase agreements. This collateral is deposited with the Fund’s custodian and, pursuant to the terms of the repurchase agreement, must have an aggregate market value greater than or equal to the repurchase price plus accrued interest at all times. The value of securities and/or cash held as collateral for repurchase agreements is monitored on a daily basis to ensure the proper level of collateral. |
Credit Suisse Securities (USA) LLC (0.160%)
| | | | |
| Security Description | | Value | |
Fannie Mae Pool | | | $5,936,438 | |
Government National Mortgage Association | | | 4,263,563 | |
Total Market Value of Collateral Securities | | | $10,200,001 | |
| |
| Natixis Financial Products, Inc. (0.240%) | | | | |
| Security Description | | Value | |
Fannie Mae Pool | | | $1,236,899 | |
Fannie Mae REMICS | | | 9,181,211 | |
Fannie Mae Whole Loan | | | 288,444 | |
Freddie Mac Gold Pool | | | 2,590,756 | |
Freddie Mac Non Gold Pool | | | 670,233 | |
Freddie Mac REMICS | | | 8,019,430 | |
Government National Mortgage Association | | | 5,715,725 | |
United States Treasury Note/Bond | | | 7,997,540 | |
Total Market Value of Collateral Securities | | | $35,700,238 | |
The Accompanying Notes to Financial Statements are an integral part of this statement.
10
Columbia Small Cap Value Fund I
April 30, 2012
|
Notes to Portfolio of Investments (continued) |
| | | | |
| |
| Nomura Securities (0.240%) | | | | |
| Security Description | | Value | |
Fannie Mae Pool | | | $1,020,291 | |
Freddie Mac Gold Pool | | | 1,171,975 | |
Ginnie Mae II Pool | | | 2,907,734 | |
Total Market Value of Collateral Securities | | | $5,100,000 | |
| |
| RBS Securities, Inc. (0.210%) | | | | |
| Security Description | | Value | |
United States Treasury Note/Bond | | | $15,300,074 | |
Total Market Value of Collateral Securities | | | $15,300,074 | |
| |
| UBS Securities LLC (0.200%) | | | | |
| Security Description | | Value | |
United States Treasury Note/Bond | | | $10,581,153 | |
Total Market Value of Collateral Securities | | | $10,581,153 | |
Generally accepted accounting principles (GAAP) require disclosure regarding the inputs and valuation techniques used to measure fair value and any changes in valuation inputs or techniques. In addition, investments shall be disclosed by major category.
The Fund categorizes its fair value measurements according to a three-level hierarchy that maximizes the use of observable inputs and minimizes the use of unobservable inputs by prioritizing that the most observable input be used when available. Observable inputs are those that market participants would use in pricing an investment based on market data obtained from sources independent of the reporting entity. Unobservable inputs are those that reflect the Fund’s assumptions about the information market participants would use in pricing an investment. An investment’s level within the fair value hierarchy is based on the lowest level of any input that is deemed significant to the asset or liability’s fair value measurement. The input levels are not necessarily an indication of the risk or liquidity associated with investments at that level. For example, certain U.S. government securities are generally high quality and liquid, however, they are reflected as Level 2 because the inputs used to determine fair value may not always be quoted prices in an active market.
Fair value inputs are summarized in the three broad levels listed below:
| | Ÿ | | Level 1— Valuations based on quoted prices for investments in active markets that the Fund has the ability to access at the measurement date (including NAV for open-end mutual funds). Valuation adjustments are not applied to Level 1 investments. |
| | Ÿ | | Level 2 — Valuations based on other significant observable inputs (including quoted prices for similar securities, interest rates, prepayment speeds, credit risks, etc.). |
| | Ÿ | | Level 3 — Valuations based on significant unobservable inputs (including the Fund’s own assumptions and judgment in determining the fair value of investments). |
Inputs that are used in determining fair value of an investment may include price information, credit data, volatility statistics, and other factors. These inputs can be either observable or unobservable. The availability of observable inputs can vary between investments, and is affected by various factors such as the type of investment, and the volume and level of activity for that investment or similar investments in the marketplace. The inputs will be considered by the Investment Manager, along with any other relevant factors in the calculation of an investment’s fair value. The Fund uses prices and inputs that are current as of the measurement date, which may include periods of market dislocations. During these periods, the availability of prices and inputs may be reduced for many investments. This condition could cause an investment to be reclassified between the various levels within the hierarchy.
Foreign equity securities actively traded in markets where there is a significant delay in the local close relative to the New York Stock Exchange (NYSE) are classified as Level 2. The values of these securities may include an adjustment to reflect the impact of significant market movements following the close of local trading, as described in Note 2 to the financial statements – Security Valuation.
Investments falling into the Level 3 category are primarily supported by quoted prices from brokers and dealers participating in the market for those investments. However, these may be classified as Level 3 investments due to lack of market transparency and corroboration to support these quoted prices. Additionally, valuation models may be used as the pricing source for any remaining investments classified as Level 3. These models rely on one or more significant unobservable inputs and/or significant assumptions by the Investment Manager. Inputs used in valuations may include, but are not limited to, financial statement analysis, capital account balances, discount rates and estimated cash flows, and comparable company data.
The Accompanying Notes to Financial Statements are an integral part of this statement.
11
Columbia Small Cap Value Fund I
April 30, 2012
|
Fair Value Measurements (continued) |
The following table is a summary of the inputs used to value the Fund’s investments as of April 30, 2012:
| | | | | | | | | | | | | | | | |
| | | Fair value at April 30, 2012 | |
| Description | | Level 1
quoted prices
in active
markets for
identical assets | | | Level 2 other significant
observable inputs | | | Level 3
significant
unobservable
inputs | | | Total | |
Equity Securities | | | | | | | | | | | | | | | | |
Common Stocks | | | | | | | | | | | | | | | | |
Consumer Discretionary | | | $188,121,209 | | | | $— | | | | $— | | | | $188,121,209 | |
Consumer Staples | | | 48,989,322 | | | | — | | | | — | | | | 48,989,322 | |
Energy | | | 93,219,108 | | | | — | | | | — | | | | 93,219,108 | |
Financials | | | 522,253,613 | | | | — | | | | — | | | | 522,253,613 | |
Health Care | | | 152,138,356 | | | | — | | | | — | | | | 152,138,356 | |
Industrials | | | 269,730,318 | | | | 2,910,061 | | | | — | | | | 272,640,379 | |
Information Technology | | | 251,049,155 | | | | — | | | | — | | | | 251,049,155 | |
Materials | | | 122,630,827 | | | | — | | | | — | | | | 122,630,827 | |
Telecommunication Services | | | 25,335,915 | | | | — | | | | — | | | | 25,335,915 | |
Utilities | | | 57,157,703 | | | | — | | | | — | | | | 57,157,703 | |
Total Equity Securities | | | 1,730,625,526 | | | | 2,910,061 | | | | — | | | | 1,733,535,587 | |
Other | | | | | | | | | | | | | | | | |
Money Market Funds | | | 5,728,038 | | | | — | | | | — | | | | 5,728,038 | |
Investments of Cash Collateral Received for Securities on Loan | | | — | | | | 374,193,329 | | | | — | | | | 374,193,329 | |
Total Other | | | 5,728,038 | | | | 374,193,329 | | | | — | | | | 379,921,367 | |
Total | | | $1,736,353,564 | | | | $377,103,390 | | | | $— | | | | $2,113,456,954 | |
See the Portfolio of Investments for all investment classifications not indicated in the table.
The Fund’s assets assigned to the Level 2 input category are generally valued using the market approach, in which a security’s value is determined through reference to prices and information from market transactions for similar or identical assets. These assets include certain foreign securities for which a third party statistical pricing service may be employed for purposes of fair market valuation. The models utilized by the third party statistical pricing service take into account a security’s correlation to available market data including, but not limited to, intraday index, ADR, and ETF movements.
There were no transfers of financial assets between Levels 1 and 2 during the period.
The Accompanying Notes to Financial Statements are an integral part of this statement.
12
Statement of Assets and Liabilities – Columbia Small Cap Value Fund I
April 30, 2012
| | | | |
| Assets | | | | |
Investments, at value* | | | | |
Unaffiliated issuers (identified cost $1,441,664,510) | | $ | 1,721,669,237 | |
Affiliated issuers (identified cost $14,933,597) | | | 17,594,388 | |
Investment of cash collateral received for securities on loan | | | | |
Short-term securities (identified cost $298,819,653) | | | 298,819,653 | |
Repurchase agreements (identified cost $75,373,676) | | | 75,373,676 | |
Total investments (identified cost $1,830,791,436) | | | 2,113,456,954 | |
Cash | | | 576 | |
Receivable for: | | | | |
Investments sold | | | 21,903,748 | |
Capital shares sold | | | 1,810,333 | |
Dividends | | | 748,209 | |
Interest | | | 150,239 | |
Prepaid expense | | | 3,257 | |
Trustees’ deferred compensation plan | | | 82,982 | |
Total assets | | | 2,138,156,298 | |
| |
| Liabilities | | | | |
Due upon return of securities on loan | | | 374,193,329 | |
Payable for: | | | | |
Investments purchased | | | 11,519,967 | |
Capital shares purchased | | | 3,200,614 | |
Investment management fees | | | 107,182 | |
Distribution and service fees | | | 16,648 | |
Transfer agent fees | | | 458,589 | |
Administration fees | | | 10,780 | |
Compensation of board members | | | 1,573 | |
Chief compliance officer expenses | | | 128 | |
Other expenses | | | 124,389 | |
Trustees’ deferred compensation plan | | | 82,982 | |
Total liabilities | | | 389,716,181 | |
Net assets applicable to outstanding capital stock | | $ | 1,748,440,117 | |
The Accompanying Notes to Financial Statements are an integral part of this statement.
13
Statement of Assets and Liabilities (continued) – Columbia Small Cap Value Fund I
April 30, 2012
| | | | |
| Represented by | | | | |
Paid-in capital | | $ | 1,468,584,944 | |
Excess of distributions over net investment income | | | (1,845,411 | ) |
Accumulated net realized loss | | | (964,934 | ) |
Unrealized appreciation (depreciation) on: | | | | |
Investments | | | 282,665,518 | |
Total — representing net assets applicable to outstanding capital stock | | $ | 1,748,440,117 | |
*Value of securities on loan | | $ | 360,954,236 | |
Net assets applicable to outstanding shares | | | | |
Class A | | $ | 587,331,718 | |
Class B | | $ | 10,426,849 | |
Class C | | $ | 42,092,381 | |
Class I | | $ | 54,312,209 | |
Class R | | $ | 1,868,737 | |
Class Y | | $ | 1,055,839 | |
Class Z | | $ | 1,051,352,384 | |
Shares outstanding | | | | |
Class A | | | 14,095,518 | |
Class B | | | 313,840 | |
Class C | | | 1,191,289 | |
Class I | | | 1,236,460 | |
Class R | | | 44,818 | |
Class Y | | | 24,035 | |
Class Z | | | 23,956,089 | |
Net asset value per share | | | | |
Class A(a) | | $ | 41.67 | |
Class B | | $ | 33.22 | |
Class C | | $ | 35.33 | |
Class I | | $ | 43.93 | |
Class R | | $ | 41.70 | |
Class Y | | $ | 43.93 | |
Class Z | | $ | 43.89 | |
| (a) | The maximum offering price per share for Class A is $44.21. The offering price is calculated by dividing the net asset value by 1.0 minus the maximum sales charge of 5.75%. |
The Accompanying Notes to Financial Statements are an integral part of this statement.
14
Statement of Operations – Columbia Small Cap Value Fund I
| | | | | | | | |
| | | Year ended
April 30, 2012(a) | | | Year ended
June 30, 2011 | |
| Net investment income | | | | | | | | |
Income: | | | | | | | | |
Dividends | | $ | 23,027,843 | | | $ | 28,015,429 | |
Interest | | | — | | | | 6,422 | |
Dividends from affiliates | | | 619,002 | | | | 582,529 | |
Income from securities lending — net | | | 1,435,603 | | | | 93,483 | |
Foreign taxes withheld | | | — | | | | (14,931 | ) |
Total income | | | 25,082,448 | | | | 28,682,932 | |
Expenses: | | | | | | | | |
Investment management fees | | | 10,740,169 | | | | 13,093,445 | |
Distribution fees | | | | | | | | |
Class B | | | 83,699 | | | | 157,721 | |
Class C | | | 276,071 | | | | 404,763 | |
Class R | | | 4,446 | | | | 23 | |
Service fees | | | | | | | | |
Class B | | | 27,900 | | | | 51,999 | |
Class C | | | 92,024 | | | | 134,921 | |
Distribution and service fees — Class A | | | 1,267,447 | | | | 1,705,653 | |
Transfer agent fees | | | | | | | | |
Class A | | | 1,026,432 | | | | 1,292,263 | |
Class B | | | 23,178 | | | | 39,332 | |
Class C | | | 74,862 | | | | 102,063 | |
Class R | | | 1,488 | | | | 8 | |
Class Y | | | 27 | | | | 31 | |
Class Z | | | 1,679,505 | | | | 1,866,509 | |
Administration fees | | | 1,080,277 | | | | 240,540 | |
Compensation of board members | | | 66,009 | | | | 71,053 | |
Pricing and bookkeeping fees | | | — | | | | 107,487 | |
Custodian fees | | | 33,044 | | | | 61,274 | |
Printing and postage fees | | | 313,563 | | | | 392,981 | |
Registration fees | | | 114,747 | | | | 158,475 | |
Professional fees | | | 75,931 | | | | 150,502 | |
Line of credit interest expense | | | — | | | | 666 | |
Chief compliance officer expenses | | | 684 | | | | 3,066 | |
Other | | | 55,326 | | | | 58,660 | |
Total expenses | | | 17,036,829 | | | | 20,093,435 | |
Fees waived or expenses reimbursed by Investment Manager and its affiliates | | | — | | | | (10 | ) |
Expense reductions | | | (11,441 | ) | | | (88 | ) |
Total net expenses | | | 17,025,388 | | | | 20,093,337 | |
Net investment income | | | 8,057,060 | | | | 8,589,595 | |
| | |
| Realized and unrealized gain (loss) — net | | | | | | | | |
Net realized gain (loss) on: | | | | | | | | |
Investments — unaffiliated issuers | | | 14,540,559 | | | | 136,288,995 | |
Investments — affiliated issuers | | | (265,160 | ) | | | (1,017 | ) |
Foreign currency translations | | | 11 | | | | (39 | ) |
Futures contracts | | | — | | | | (133,350 | ) |
Net realized gain | | | 14,275,410 | | | | 136,154,589 | |
Net change in unrealized appreciation (depreciation) on: | | | | | | | | |
Investments | | | (87,829,082 | ) | | | 306,050,187 | |
Foreign currency translations | | | — | | | | 39 | |
Net change in unrealized appreciation (depreciation) | | | (87,829,082 | ) | | | 306,050,226 | |
Net realized and unrealized gain (loss) | | | (73,553,672 | ) | | | 442,204,815 | |
Net change in net assets resulting from operations | | $ | (65,496,612 | ) | | $ | 450,794,410 | |
| (a) | For the period from July 1, 2011 to April 30, 2012. During the period, the Fund’s fiscal year end was changed from June 30 to April 30. |
The Accompanying Notes to Financial Statements are an integral part of this statement.
15
Statement of Changes in Net Assets – Columbia Small Cap Value Fund I
| | | | | | | | | | | | |
| | | Year ended
April 30, 2012(a) | | | Year ended
June 30, 2011(b) | | | Year ended
June 30, 2010(c) | |
| | | |
| Operations | | | | | | | | | | | | |
Net investment income | | $ | 8,057,060 | | | $ | 8,589,595 | | | $ | 6,418,633 | |
Net realized gain | | | 14,275,410 | | | | 136,154,589 | | | | 52,490,466 | |
Net change in unrealized appreciation (depreciation) | | | (87,829,082 | ) | | | 306,050,226 | | | | 146,219,296 | |
Net increase (decrease) in net assets resulting from operations | | | (65,496,612 | ) | | | 450,794,410 | | | | 205,128,395 | |
| | | |
| Distributions to shareholders from: | | | | | | | | | | | | |
Net investment income | | | | | | | | | | | | |
Class A | | | (2,342,128 | ) | | | (7,017,198 | ) | | | (2,853,169 | ) |
Class B | | | — | | | | (88,560 | ) | | | (69,066 | ) |
Class C | | | — | | | | (213,115 | ) | | | (111,769 | ) |
Class I | | | (517,969 | ) | | | (138,731 | ) | | | — | |
Class R | | | (2,506 | ) | | | (23 | ) | | | — | |
Class Y | | | (9,857 | ) | | | (17,298 | ) | | | (7,732 | ) |
Class Z | | | (6,383,085 | ) | | | (11,796,161 | ) | | | (3,363,591 | ) |
Net realized gains | | | | | | | | | | | | |
Class A | | | (38,931,991 | ) | | | (2,463,814 | ) | | | — | |
Class B | | | (1,063,341 | ) | | | (96,216 | ) | | | — | |
Class C | | | (3,274,340 | ) | | | (228,826 | ) | | | — | |
Class I | | | (3,775,799 | ) | | | (28,480 | ) | | | — | |
Class R | | | (77,710 | ) | | | (10 | ) | | | — | |
Class Y | | | (72,726 | ) | | | (4,413 | ) | | | — | |
Class Z | | | (62,124,851 | ) | | | (3,391,556 | ) | | | — | |
Total distributions to shareholders | | | (118,576,303 | ) | | | (25,484,401 | ) | | | (6,405,327 | ) |
Increase (decrease) in net assets from share transactions | | | (28,202,753 | ) | | | 93,578,338 | | | | 362,267,219 | |
Proceeds from regulatory settlements (Note 6) | | | 253,732 | | | | — | | | | 4,978 | |
Total increase (decrease) in net assets | | | (212,021,936 | ) | | | 518,888,347 | | | | 560,995,265 | |
Net assets at beginning of year | | | 1,960,462,053 | | | | 1,441,573,706 | | | | 880,578,441 | |
Net assets at end of year | | $ | 1,748,440,117 | | | $ | 1,960,462,053 | | | $ | 1,441,573,706 | |
Undistributed (excess of distributions over) net investment income | | $ | (1,845,411) | | | $ | (4,947,871 | ) | | $ | 5,747,004 | |
| (a) | For the period from July 1, 2011 to April 30, 2012. During the period the Fund’s fiscal year end was changed from June 30 to April 30. |
| (b) | Class I and Class R shares are for the period from September 27, 2010 (commencement of operations) to June 30, 2011. |
| (c) | Class Y shares are for the period from July 15, 2009 (commencement of operations) to June 30, 2010. |
The Accompanying Notes to Financial Statements are an integral part of this statement.
16
Statement of Changes in Net Assets (continued) – Columbia Small Cap Value Fund I
| | | | | | | | | | | | | | | | | | | | | | | | |
| | | Year ended
April 30, 2012(a) | | | Year ended
June 30, 2011(b) | | | Year ended
June 30, 2010(c) | |
| | | Shares | | | Dollars($) | | | Shares | | | Dollars($) | | | Shares | | | Dollars($) | |
| | | | | | |
| Capital stock activity | | | | | | | | | | | | | | | | | | | | | | | | |
Class A shares | | | | | | | | | | | | | | | | | | | | | | | | |
Subscriptions(d) | | | 2,110,887 | | | | 86,271,345 | | | | 3,445,581 | | | | 146,347,011 | | | | 6,146,642 | | | | 221,981,390 | |
Fund merger | | | — | | | | — | | | | 84,483 | | | | 3,796,041 | | | | — | | | | — | |
Distributions reinvested | | | 969,748 | | | | 38,091,716 | | | | 194,540 | | | | 8,561,537 | | | | 75,419 | | | | 2,640,419 | |
Redemptions | | | (4,222,228 | ) | | | (173,382,526 | ) | | | (5,041,182 | ) | | | (215,635,581 | ) | | | (4,797,429 | ) | | | (173,704,231 | ) |
Net increase (decrease) | | | (1,141,593 | ) | | | (49,019,465 | ) | | | (1,316,578 | ) | | | (56,930,992 | ) | | | 1,424,632 | | | | 50,917,578 | |
Class B shares | | | | | | | | | | | | | | | | | | | | | | | | |
Subscriptions | | | 4,221 | | | | 134,328 | | | | 3,396 | | | | 125,008 | | | | 19,122 | | | | 550,695 | |
Fund merger | | | — | | | | — | | | | 3,912 | | | | 142,878 | | | | — | | | | — | |
Distributions reinvested | | | 29,327 | | | | 921,153 | | | | 4,280 | | | | 154,130 | | | | 2,192 | | | | 62,564 | |
Redemptions(d) | | | (196,793 | ) | | | (6,548,681 | ) | | | (315,227 | ) | | | (10,766,458 | ) | | | (450,056 | ) | | | (13,437,067 | ) |
Net decrease | | | (163,245 | ) | | | (5,493,200 | ) | | | (303,639 | ) | | | (10,344,442 | ) | | | (428,742 | ) | | | (12,823,808 | ) |
Class C shares | | | | | | | | | | | | | | | | | | | | | | | | |
Subscriptions | | | 44,381 | | | | 1,527,912 | | | | 62,434 | | | | 2,292,989 | | | | 304,578 | | | | 9,288,017 | |
Fund merger | | | — | | | | — | | | | 3,642 | | | | 140,698 | | | | — | | | | — | |
Distributions reinvested | | | 75,327 | | | | 2,516,690 | | | | 8,504 | | | | 323,786 | | | | 2,808 | | | | 85,020 | |
Redemptions | | | (243,532 | ) | | | (8,505,784 | ) | | | (375,679 | ) | | | (13,752,828 | ) | | | (441,992 | ) | | | (13,769,158 | ) |
Net decrease | | | (123,824 | ) | | | (4,461,182 | ) | | | (301,099 | ) | | | (10,995,355 | ) | | | (134,606 | ) | | | (4,396,121 | ) |
Class I shares | | | | | | | | | | | | | | | | | | | | | | | | |
Subscriptions | | | 213,483 | | | | 9,390,959 | | | | 854,521 | | | | 39,470,130 | | | | — | | | | — | |
Fund merger | | | — | | | | — | | | | 817,679 | | | | 38,645,293 | | | | — | | | | — | |
Distributions reinvested | | | 103,871 | | | | 4,292,969 | | | | 3,610 | | | | 167,163 | | | | — | | | | — | |
Redemptions | | | (638,896 | ) | | | (28,681,502 | ) | | | (117,808 | ) | | | (5,633,645 | ) | | | — | | | | — | |
Net increase (decrease) | | | (321,542 | ) | | | (14,997,574 | ) | | | 1,558,002 | | | | 72,648,941 | | | | — | | | | — | |
Class R shares | | | | | | | | | | | | | | | | | | | | | | | | |
Subscriptions | | | 45,476 | | | | 1,667,666 | | | | 371 | | | | 17,021 | | | | — | | | | — | |
Fund merger | | | — | | | | — | | | | 94 | | | | 4,223 | | | | — | | | | — | |
Distributions reinvested | | | 2,028 | | | | 79,770 | | | | — | | | | — | | | | — | | | | — | |
Redemptions | | | (3,151 | ) | | | (131,485 | ) | | | — | | | | — | | | | — | | | | — | |
Net increase | | | 44,353 | | | | 1,615,951 | | | | 465 | | | | 21,244 | | | | — | | | | — | |
Class Y shares | | | | | | | | | | | | | | | | | | | | | | | | |
Subscriptions | | | 1,974 | | | | 81,587 | | | | 1,282 | | | | 50,000 | | | | 61,757 | | | | 2,010,000 | |
Distributions reinvested | | | 24 | | | | 996 | | | | 470 | | | | 21,712 | | | | 211 | | | | 7,732 | |
Redemptions | | | (5,179 | ) | | | (237,025 | ) | | | (4,054 | ) | | | (175,000 | ) | | | (32,450 | ) | | | (1,129,792 | ) |
Net increase (decrease) | | | (3,181 | ) | | | (154,442 | ) | | | (2,302 | ) | | | (103,288 | ) | | | 29,518 | | | | 887,940 | |
Class Z shares | | | | | | | | | | | | | | | | | | | | | | | | |
Subscriptions | | | 5,756,016 | | | | 247,038,840 | | | | 7,631,753 | | | | 339,799,924 | | | | 13,255,465 | | | | 499,789,626 | |
Distributions reinvested | | | 1,195,804 | | | | 49,422,588 | | | | 226,837 | | | | 10,463,621 | | | | 55,528 | | | | 2,036,209 | |
Redemptions | | | (5,847,194 | ) | | | (252,154,269 | ) | | | (5,609,970 | ) | | | (250,981,315 | ) | | | (4,575,482 | ) | | | (174,144,205 | ) |
Net increase | | | 1,104,626 | | | | 44,307,159 | | | | 2,248,620 | | | | 99,282,230 | | | | 8,735,511 | | | | 327,681,630 | |
Total net increase (decrease) | | | (604,406 | ) | | | (28,202,753 | ) | | | 1,883,469 | | | | 93,578,338 | | | | 9,626,313 | | | | 362,267,219 | |
| (a) | For the period from July 1, 2011 to April 30, 2012. During the period, the Fund’s fiscal year end was changed from June 30 to April 30. |
| (b) | Class I and Class R shares are for the period from September 27, 2010 (commencement of operations) to June 30, 2011. |
| (c) | Class Y shares are for the period from July 15, 2009 (commencement of operations) to June 30, 2010. |
| (d) | Includes conversions of Class B shares to Class A shares, if any. |
The Accompanying Notes to Financial Statements are an integral part of this statement.
17
Financial Highlights – Columbia Small Cap Value Fund I
The following tables are intended to help you understand the Fund’s financial performance. Certain information reflects financial results for a single share of a class held for the periods shown. Per share net investment income (loss) amounts are calculated based on average shares outstanding during the period. Total returns assume reinvestment of all dividends and distributions. Total returns do not reflect payment of sales charges, if any, and are not annualized for periods of less than one year.
| | | | | | | | | | | | | | | | | | | | | | | | |
| | | Year ended
April 30, 2012(a) | | | Year ended June 30, | |
| | | | 2011 | | | 2010 | | | 2009 | | | 2008 | | | 2007 | |
| Class A | | | | | | | | | | | | | | | | | | |
| Per share data | | | | | | | | | | | | | | | | | | | | | | | | |
Net asset value, beginning of period | | | $46.21 | | | | $35.84 | | | | $29.29 | | | | $39.50 | | | | $52.16 | | | | $48.03 | |
Income from investment operations: | | | | | | | | | | | | | | | | | | | | | | | | |
Net investment income | | | 0.14 | | | | 0.16 | | | | 0.15 | | | | 0.23 | (b) | | | 0.15 | | | | 0.12 | (c) |
Net realized and unrealized gain (loss) | | | (1.81 | ) | | | 10.80 | | | | 6.58 | | | | (8.50 | ) | | | (8.46 | ) | | | 7.61 | |
Total from investment operations | | | (1.67 | ) | | | 10.96 | | | | 6.73 | | | | (8.27 | ) | | | (8.31 | ) | | | 7.73 | |
Less distributions to shareholders from: | | | | | | | | | | | | | | | | | | | | | | | | |
Net investment income | | | (0.16 | ) | | | (0.44 | ) | | | (0.18 | ) | | | (0.01 | ) | | | (0.14 | ) | | | (0.01 | ) |
Net realized gains | | | (2.72 | ) | | | (0.15 | ) | | | — | | | | (1.93 | ) | | | (4.21 | ) | | | (3.59 | ) |
Total distributions to shareholders | | | (2.88 | ) | | | (0.59 | ) | | | (0.18 | ) | | | (1.94 | ) | | | (4.35 | ) | | | (3.60 | ) |
Proceeds from regulatory settlement | | | 0.01 | | | | — | | | | 0.00 | (d) | | | 0.00 | (d) | | | — | | | | — | |
Net asset value, end of period | | | $41.67 | | | | $46.21 | | | | $35.84 | | | | $29.29 | | | | $39.50 | | | | $52.16 | |
| Total return | | | (3.21% | )(e) | | | 30.67% | | | | 22.99% | | | | (20.73% | ) | | | (16.96% | ) | | | 16.61% | |
| Ratios to average net assets(f) | | | | | | | | | | | | | | | | | | | | | | | | |
Expenses prior to fees waived or expenses reimbursed (including interest expense) | | | 1.31% | (g) | | | 1.25% | (h) | | | 1.27% | (h) | | | 1.38% | (h) | | | 1.26% | (h) | | | 1.29% | (h) |
Net expenses after fees waived or expenses reimbursed (including interest expense)(i) | | | 1.31% | (g)(j) | | | 1.25% | (h)(j) | | | 1.27% | (h)(j) | | | 1.38% | (h)(j) | | | 1.26% | (h)(j) | | | 1.29% | (h)(j) |
Expenses prior to fees waived or expenses reimbursed (excluding interest expense) | | | 1.31% | (g) | | | 1.25% | | | | 1.27% | | | | 1.38% | | | | 1.26% | | | | 1.29% | |
Net expenses after fees waived or expenses reimbursed (excluding interest expense)(i) | | | 1.31% | (g)(j) | | | 1.25% | (j) | | | 1.27% | (j) | | | 1.38% | (j) | | | 1.26% | (j) | | | 1.29% | (j) |
Net investment income | | | 0.41% | (g)(j) | | | 0.37% | (j) | | | 0.43% | (j) | | | 0.74% | (j) | | | 0.29% | (j) | | | 0.25% | (j) |
| Supplemental data | | | | | | | | | | | | | | | | | | | | | | | | |
Net assets, end of period (in thousands) | | | $587,332 | | | | $704,167 | | | | $593,209 | | | | $443,154 | | | | $513,671 | | | | $663,160 | |
Portfolio turnover | | | 23% | | | | 31% | | | | 30% | | | | 50% | | | | 40% | | | | 39% | |
Notes to Financial Highlights
| (a) | For the period from July 1, 2011 to April 30, 2012. During the period, the Fund’s fiscal year end was changed from June 30 to April 30. |
| (b) | Net investment income per share reflects special dividends. The effect of these dividends amounted to $0.03 per share. |
| (c) | Net investment income per share reflects special dividends. The effect of these dividends amounted to $0.05 per share. |
| (d) | Rounds to less than $0.01. |
| (e) | During the period ended April 30, 2012, the Fund received proceeds from a regulatory settlement. Had the Fund not received these proceeds, the total return would have been lower by 0.02%. |
| (f) | In addition to the fees and expenses which the Fund bears directly, the Fund indirectly bears a pro rata share of the fees and expenses of the acquired funds in which it invests. Such indirect expenses are not included in the reported expense ratios. |
| (h) | Includes interest expense which rounds to less than 0.01%. |
| (i) | The Investment Manager and certain of its affiliates agreed to waive/reimburse certain fees and expenses, if applicable. |
| (j) | The benefits derived from expense reductions had an impact of less than 0.01%. |
The Accompanying Notes to Financial Statements are an integral part of this statement.
18
Financial Highlights (continued) – Columbia Small Cap Value Fund I
| | | | | | | | | | | | | | | | | | | | | | | | |
| | | Year ended
April 30,
2012(a) | | | Year ended June 30, | |
| | | | 2011 | | | 2010 | | | 2009 | | | 2008 | | | 2007 | |
| Class B | | | | | | | | | | | | | | | | | | |
| Per share data | | | | | | | | | | | | | | | | | | | | | | | | |
Net asset value, beginning of period | | | $37.54 | | | | $29.17 | | | | $23.96 | | | | $33.00 | | | | $44.51 | | | | $41.75 | |
Income from investment operations: | | | | | | | | | | | | | | | | | | | | | | | | |
Net investment income (loss) | | | (0.10 | ) | | | (0.13 | ) | | | (0.10 | ) | | | (0.01 | )(b) | | | (0.21 | ) | | | (0.24 | )(c) |
Net realized and unrealized gain (loss) | | | (1.50 | ) | | | 8.80 | | | | 5.38 | | | | (7.10 | ) | | | (7.09 | ) | | | 6.59 | |
Total from investment operations | | | (1.60 | ) | | | 8.67 | | | | 5.28 | | | | (7.11 | ) | | | (7.30 | ) | | | 6.35 | |
Less distributions to shareholders from: | | | | | | | | | | | | | | | | | | | | | | | | |
Net investment income | | | — | | | | (0.15 | ) | | | (0.07 | ) | | | — | | | | — | | | | — | |
Net realized gains | | | (2.72 | ) | | | (0.15 | ) | | | — | | | | (1.93 | ) | | | (4.21 | ) | | | (3.59 | ) |
Total distributions to shareholders | | | (2.72 | ) | | | (0.30 | ) | | | (0.07 | ) | | | (1.93 | ) | | | (4.21 | ) | | | (3.59 | ) |
Proceeds from regulatory settlement | | | 0.00 | (d) | | | — | | | | 0.00 | (d) | | | 0.00 | (d) | | | — | | | | — | |
Net asset value, end of period | | | $33.22 | | | | $37.54 | | | | $29.17 | | | | $23.96 | | | | $33.00 | | | | $44.51 | |
| Total return | | | (3.85% | )(e) | | | 29.76% | | | | 22.02% | | | | (21.31% | ) | | | (17.58% | ) | | | 15.74% | |
| Ratios to average net assets(f) | | | | | | | | | | | | | | | | | | | | | | | | |
Expenses prior to fees waived or expenses reimbursed
(including interest expense) | | | 2.07% | (g) | | | 2.00% | (h) | | | 2.02% | (h) | | | 2.13% | (h) | | | 2.01% | (h) | | | 2.04% | (h) |
Net expenses after fees waived or expenses reimbursed
(including interest expense)(i) | | | 2.07% | (g)(j) | | | 2.00% | (h)(j) | | | 2.02% | (h)(j) | | | 2.13% | (h)(j) | | | 2.01% | (h)(j) | | | 2.04% | (h)(j) |
Expenses prior to fees waived or expenses reimbursed
(excluding interest expense) | | | 2.07% | (g) | | | 2.00% | | | | 2.02% | | | | 2.13% | | | | 2.01% | | | | 2.04% | |
Net expenses after fees waived or expenses reimbursed
(excluding interest expense)(i) | | | 2.07% | (g)(j) | | | 2.00% | (j) | | | 2.02% | (j) | | | 2.13% | (j) | | | 2.01% | (j) | | | 2.04% | (j) |
Net investment income (loss) | | | (0.37% | )(g)(j) | | | (0.38% | )(j) | | | (0.33% | )(j) | | | (0.02% | )(j) | | | (0.47% | )(j) | | | (0.55% | )(j) |
| Supplemental data | | | | | | | | | | | | | | | | | | | | | | | | |
Net assets, end of period (in thousands) | | | $10,427 | | | | $17,908 | | | | $22,775 | | | | $28,977 | | | | $50,784 | | | | $97,425 | |
Portfolio turnover | | | 23% | | | | 31% | | | | 30% | | | | 50% | | | | 40% | | | | 39% | |
Notes to Financial Highlights
| (a) | For the period from July 1, 2011 to April 30, 2012. During the period, the Fund’s fiscal year end was changed from June 30 to April 30. |
| (b) | Net investment income per share reflects special dividends. The effect of these dividends amounted to $0.03 per share. |
| (c) | Net investment income per share reflects special dividends. The effect of these dividends amounted to $0.05 per share. |
| (d) | Rounds to less than $0.01. |
| (e) | During the period ended April 30, 2012, the Fund received proceeds from a regulatory settlement. Had the Fund not received these proceeds, the total return would have been lower by 0.02%. |
| (f) | In addition to the fees and expenses which the Fund bears directly, the Fund indirectly bears a pro rata share of the fees and expenses of the acquired funds in which it invests. Such indirect expenses are not included in the reported expense ratios. |
| (h) | Includes interest expense which rounds to less than 0.01%. |
| (i) | The Investment Manager and certain of its affiliates agreed to waive/reimburse certain fees and expenses, if applicable. |
| (j) | The benefits derived from expense reductions had an impact of less than 0.01%. |
The Accompanying Notes to Financial Statements are an integral part of this statement.
19
Financial Highlights (continued) – Columbia Small Cap Value Fund I
| | | | | | | | | | | | | | | | | | | | | | | | |
| | | Year ended
April 30,
2012(a) | | | Year ended June 30, | |
| | | | 2011 | | | 2010 | | | 2009 | | | 2008 | | | 2007 | |
| Class C | | | | | | | | | | | | | | | | | | |
| Per share data | | | | | | | | | | | | | | | | | | | | | | | | |
Net asset value, beginning of period | | | $39.73 | | | | $30.87 | | | | $25.35 | | | | $34.76 | | | | $46.65 | | | | $43.60 | |
Income from investment operations: | | | | | | | | | | | | | | | | | | | | | | | | |
Net investment income (loss) | | | (0.10 | ) | | | (0.14 | ) | | | (0.10 | ) | | | (0.00 | )(b)(c) | | | (0.22 | ) | | | (0.23 | )(d) |
Net realized and unrealized gain (loss) | | | (1.58 | ) | | | 9.30 | | | | 5.69 | | | | (7.48 | ) | | | (7.46 | ) | | | 6.87 | |
Total from investment operations | | | (1.68 | ) | | | 9.16 | | | | 5.59 | | | | (7.48 | ) | | | (7.68 | ) | | | 6.64 | |
Less distributions to shareholders from: | | | | | | | | | | | | | | | | | | | | | | | | |
Net investment income | | | — | | | | (0.15 | ) | | | (0.07 | ) | | | — | | | | — | | | | — | |
Net realized gains | | | (2.72 | ) | | | (0.15 | ) | | | — | | | | (1.93 | ) | | | (4.21 | ) | | | (3.59 | ) |
Total distributions to shareholders | | | (2.72 | ) | | | (0.30 | ) | | | (0.07 | ) | | | (1.93 | ) | | | (4.21 | ) | | | (3.59 | ) |
Proceeds from regulatory settlement | | | 0.00 | (b) | | | — | | | | 0.00 | (b) | | | 0.00 | (b) | | | — | | | | — | |
Net asset value, end of period | | | $35.33 | | | | $39.73 | | | | $30.87 | | | | $25.35 | | | | $34.76 | | | | $46.65 | |
| Total return | | | (3.84% | )(e) | | | 29.71% | | | | 22.04% | | | | (21.30% | ) | | | (17.59% | ) | | | 15.74% | |
| Ratios to average net assets(f) | | | | | | | | | | | | | | | | | | | | | | | | |
Expenses prior to fees waived or expenses reimbursed
(including interest expense) | | | 2.06% | (g) | | | 2.00% | (h) | | | 2.02% | (h) | | | 2.13% | (h) | | | 2.01% | (h) | | | 2.04% | (h) |
Net expenses after fees waived or expenses reimbursed
(including interest expense)(i) | | | 2.06% | (g)(j) | | | 2.00% | (h)(j) | | | 2.02% | (h)(j) | | | 2.13% | (h)(j) | | | 2.01% | (h)(j) | | | 2.04% | (h)(j) |
Expenses prior to fees waived or expenses reimbursed
(excluding interest expense) | | | 2.06% | (g) | | | 2.00% | | | | 2.02% | | | | 2.13% | | | | 2.01% | | | | 2.04% | |
Net expenses after fees waived or expenses reimbursed
(excluding interest expense)(i) | | | 2.06% | (g)(j) | | | 2.00% | (j) | | | 2.02% | (j) | | | 2.13% | (j) | | | 2.01% | (j) | | | 2.04% | (j) |
Net investment income (loss) | | | (0.34% | )(g)(j) | | | (0.38% | )(j) | | | (0.33% | )(j) | | | (0.01% | )(j) | | | (0.47% | )(j) | | | (0.51% | )(j) |
| Supplemental data | | | | | | | | | | | | | | | | | | | | | | | | |
Net assets, end of period (in thousands) | | | $42,092 | | | | $52,248 | | | | $49,888 | | | | $44,377 | | | | $61,053 | | | | $87,642 | |
Portfolio turnover | | | 23% | | | | 31% | | | | 30% | | | | 50% | | | | 40% | | | | 39% | |
Notes to Financial Highlights
| (a) | For the period from July 1, 2011 to April 30, 2012. During the period, the Fund’s fiscal year end was changed from June 30 to April 30. |
| (b) | Rounds to less than $0.01. |
| (c) | Net investment income per share reflects special dividends. The effect of these dividends amounted to $0.03 per share. |
| (d) | Net investment income per share reflects special dividends. The effect of these dividends amounted to $0.05 per share. |
| (e) | During the period ended April 30, 2012, the Fund received proceeds from a regulatory settlement. Had the Fund not received these proceeds, the total return would have been lower by 0.02%. |
| (f) | In addition to the fees and expenses which the Fund bears directly, the Fund indirectly bears a pro rata share of the fees and expenses of the acquired funds in which it invests. Such indirect expenses are not included in the reported expense ratios. |
| (h) | Includes interest expense which rounds to less than 0.01%. |
| (i) | The Investment Manager and certain of its affiliates agreed to waive/reimburse certain fees and expenses, if applicable. |
| (j) | The benefits derived from expense reductions had an impact of less than 0.01%. |
The Accompanying Notes to Financial Statements are an integral part of this statement.
20
Financial Highlights (continued) – Columbia Small Cap Value Fund I
| | | | | | | | |
| | | Year ended
April 30, 2012(a) | | | Year ended
June 30, 2011(b) | |
| Class I | | | | | | |
| Per share data | | | | | | | | |
Net asset value, beginning of period | | | $48.60 | | | | $40.40 | |
Income from investment operations: | | | | | | | | |
Net investment income | | | 0.31 | | | | 0.30 | |
Net realized and unrealized gain (loss) | | | (1.90 | ) | | | 8.66 | |
Total from investment operations | | | (1.59 | ) | | | 8.96 | |
Less distributions to shareholders from: | | | | | | | | |
Net investment income | | | (0.37 | ) | | | (0.61 | ) |
Net realized gains | | | (2.72 | ) | | | (0.15 | ) |
Total distributions to shareholders | | | (3.09 | ) | | | (0.76 | ) |
Proceeds from regulatory settlement | | | 0.01 | | | | — | |
Net asset value, end of period | | | $43.93 | | | | $48.60 | |
| Total return | | | (2.85% | )(c) | | | 22.29% | |
| Ratios to average net assets(d) | | | | | | | | |
Expenses prior to fees waived or expenses reimbursed (including interest expense) | | | 0.86% | (e) | | | 0.83% | (e)(f) |
Net expenses after fees waived or expenses reimbursed (including interest expense)(g) | | | 0.86% | (e) | | | 0.83% | (e)(f)(h) |
Expenses prior to fees waived or expenses reimbursed (excluding interest expense) | | | 0.86% | (e) | | | 0.83% | (e) |
Net expenses after fees waived or expenses reimbursed (excluding interest expense)(g) | | | 0.86% | (e) | | | 0.83% | (e)(h) |
Net investment income | | | 0.85% | (e) | | | 0.84% | (e)(h) |
| Supplemental data | | | | | | | | |
Net assets, end of period (in thousands) | | | $54,312 | | | | $75,716 | |
Portfolio turnover | | | 23% | | | | 31% | |
Notes to Financial Highlights
| (a) | For the period from July 1, 2011 to April 30, 2012. During the period, the Fund’s fiscal year end was changed from June 30 to April 30. |
| (b) | For the period from September 27, 2010 (commencement of operations) to June 30, 2011. |
| (c) | During the period ended April 30, 2012, the Fund received proceeds from a regulatory settlement. Had the Fund not received these proceeds, the total return would have been lower by 0.02%. |
| (d) | In addition to the fees and expenses which the Fund bears directly, the Fund indirectly bears a pro rata share of the fees and expenses of the acquired funds in which it invests. Such indirect expenses are not included in the reported expense ratios. |
| (f) | Includes interest expense which rounds to less than 0.01%. |
| (g) | The Investment Manager and certain of its affiliates agreed to waive/reimburse certain fees and expenses, if applicable. |
| (h) | The benefits derived from expense reductions had an impact of less than 0.01%. |
The Accompanying Notes to Financial Statements are an integral part of this statement.
21
Financial Highlights (continued) – Columbia Small Cap Value Fund I
| | | | | | | | |
| | | Year ended
April 30, 2012(a) | | | Year ended
June 30, 2011(b) | |
| Class R | | | | | | |
| Per share data | | | | | | | | |
Net asset value, beginning of period | | | $46.23 | | | | $38.43 | |
Income from investment operations: | | | | | | | | |
Net investment income | | | 0.12 | | | | 0.09 | |
Net realized and unrealized gain (loss) | | | (1.86 | ) | | | 8.22 | |
Total from investment operations | | | (1.74 | ) | | | 8.31 | |
Less distributions to shareholders from: | | | | | | | | |
Net investment income | | | (0.08 | ) | | | (0.36 | ) |
Net realized gains | | | (2.72 | ) | | | (0.15 | ) |
Total distributions to shareholders | | | (2.80 | ) | | | (0.51 | ) |
Proceeds from regulatory settlement | | | 0.01 | | | | — | |
Net asset value, end of period | | | $41.70 | | | | $46.23 | |
| Total return | | | (3.37% | )(c) | | | 21.68% | |
| Ratios to average net assets(d) | | | | | | | | |
Expenses prior to fees waived or expenses reimbursed (including interest expense) | | | 1.53% | (e) | | | 1.50% | (e)(f) |
Net expenses after fees waived or expenses reimbursed (including interest expense)(g) | | | 1.53% | (e)(h) | | | 1.50% | (e)(f)(h) |
Expenses prior to fees waived or expenses reimbursed (excluding interest expense) | | | 1.53% | (e) | | | 1.50% | (e) |
Net expenses after fees waived or expenses reimbursed (excluding interest expense)(g) | | | 1.53% | (e)(h) | | | 1.50% | (e)(h) |
Net investment income | | | 0.34% | (e)(h) | | | 0.27% | (e)(h) |
| Supplemental data | | | | | | | | |
Net assets, end of period (in thousands) | | | $1,869 | | | | $21 | |
Portfolio turnover | | | 23% | | | | 31% | |
Notes to Financial Highlights
| (a) | For the period from July 1, 2011 to April 30, 2012. During the period, the Fund’s fiscal year end was changed from June 30 to April 30. |
| (b) | For the period from September 27, 2010 (commencement of operations) to June 30, 2011. |
| (c) | During the period ended April 30, 2012, the Fund received proceeds from a regulatory settlement. Had the Fund not received these proceeds, the total return would have been lower by 0.02%. |
| (d) | In addition to the fees and expenses which the Fund bears directly, the Fund indirectly bears a pro rata share of the fees and expenses of the acquired funds in which it invests. Such indirect expenses are not included in the reported expense ratios. |
| (f) | Includes interest expense which rounds to less than 0.01%. |
| (g) | The Investment Manager and certain of its affiliates agreed to waive/reimburse certain fees and expenses, if applicable. |
| (h) | The benefits derived from expense reductions had an impact of less than 0.01%. |
The Accompanying Notes to Financial Statements are an integral part of this statement.
22
Financial Highlights (continued) – Columbia Small Cap Value Fund I
| | | | | | | | | | | | |
| | | Year ended
April 30,
2012(a) | | | Year ended June 30, | |
| | | | 2011 | | | 2010(b) | |
| Class Y | | | | | | | | | |
| Per share data | | | | | | | | | | | | |
Net asset value, beginning of period | | | $48.60 | | | | $37.63 | | | | $31.68 | |
Income from investment operations | | | | | | | | | | | | |
Net investment income | | | 0.31 | | | | 0.37 | | | | 0.31 | |
Net realized and unrealized gain (loss) | | | (1.90 | ) | | | 11.36 | | | | 5.88 | |
Total from investment operations | | | (1.59 | ) | | | 11.73 | | | | 6.19 | |
Less distributions to shareholders from: | | | | | | | | | | | | |
Net investment income | | | (0.37 | ) | | | (0.61 | ) | | | (0.24 | ) |
Net realized gains | | | (2.72 | ) | | | (0.15 | ) | | | — | |
Total distributions to shareholders | | | (3.09 | ) | | | (0.76 | ) | | | (0.24 | ) |
Proceeds from regulatory settlement | | | 0.01 | | | | — | | | | 0.00 | (c) |
Net asset value, end of period | | | $43.93 | | | | $48.60 | | | | $37.63 | |
| Total return | | | (2.86% | )(d) | | | 31.27% | | | | 19.57% | |
| Ratios to average net assets(e) | | | | | | | | | | | | |
Expenses prior to fees waived or expenses reimbursed (including interest expense) | | | 0.86% | (f) | | | 0.81% | (g) | | | 0.85% | (f)(g) |
Net expenses after fees waived or expenses reimbursed (including interest expense)(h) | | | 0.86% | (f) | | | 0.81% | (g)(i) | | | 0.85% | (f)(g)(i) |
Expenses prior to fees waived or expenses reimbursed (excluding interest expense) | | | 0.86% | (f) | | | 0.81% | | | | 0.85% | (f) |
Net expenses after fees waived or expenses reimbursed (excluding interest expense)(h) | | | 0.86% | (f) | | | 0.81% | (i) | | | 0.85% | (f)(i) |
Net investment income | | | 0.85% | (f) | | | 0.82% | (i) | | | 0.85% | (f)(i) |
| Supplemental data | | | | | | | | | | | | |
Net assets, end of period (in thousands) | | | $1,056 | | | | $1,323 | | | | $1,111 | |
Portfolio turnover | | | 23% | | | | 31% | | | | 30% | |
Notes to Financial Highlights
| (a) | For the period from July 1, 2011 to April 30, 2012. During the period, the Fund’s fiscal year end was changed from June 30 to April 30. |
| (b) | For the period from July 15, 2009 (commencement of operations) to June 30, 2010. |
| (c) | Rounds to less than $0.01. |
| (d) | During the period ended April 30, 2012, the Fund received proceeds from a regulatory settlement. Had the Fund not received these proceeds, the total return would have been lower by 0.02%. |
| (e) | In addition to the fees and expenses which the Fund bears directly, the Fund indirectly bears a pro rata share of the fees and expenses of the acquired funds in which it invests. Such indirect expenses are not included in the reported expense ratios. |
| (g) | Includes interest expense which rounds to less than 0.01%. |
| (h) | The Investment Manager and certain of its affiliates agreed to waive/reimburse certain fees and expenses, if applicable. |
| (i) | The benefits derived from expense reductions had an impact of less than 0.01%. |
The Accompanying Notes to Financial Statements are an integral part of this statement.
23
Financial Highlights (continued) – Columbia Small Cap Value Fund I
| | | | | | | | | | | | | | | | | | | | | | | | |
| | | Year ended
April 30,
2012(a) | | | Year ended June 30, | |
| | | | 2011 | | | 2010 | | | 2009 | | | 2008 | | | 2007 | |
| Class Z | | | | | | | | | | | | | | | | | | |
| Per share data | | | | | | | | | | | | | | | | | | | | | | | | |
Net asset value, beginning of period | | | $48.53 | | | | $37.60 | | | | $30.68 | | | | $41.22 | | | | $54.23 | | | | $49.79 | |
Income from investment operations: | | | | | | | | | | | | | | | | | | | | | | | | |
Net investment income | | | 0.24 | | | | 0.28 | | | | 0.26 | | | | 0.32 | (b) | | | 0.30 | | | | 0.26 | (c) |
Net realized and unrealized gain (loss) | | | (1.89 | ) | | | 11.34 | | | | 6.88 | | | | (8.87 | ) | | | (8.84 | ) | | | 7.90 | |
Total from investment operations | | | (1.65 | ) | | | 11.62 | | | | 7.14 | | | | (8.55 | ) | | | (8.54 | ) | | | 8.16 | |
Less distributions to shareholders from: | | | | | | | | | | | | | | | | | | | | | | | | |
Net investment income | | | (0.28 | ) | | | (0.54 | ) | | | (0.22 | ) | | | (0.06 | ) | | | (0.26 | ) | | | (0.13 | ) |
Net realized gains | | | (2.72 | ) | | | (0.15 | ) | | | — | | | | (1.93 | ) | | | (4.21 | ) | | | (3.59 | ) |
Total distributions to shareholders | | | (3.00 | ) | | | (0.69 | ) | | | (0.22 | ) | | | (1.99 | ) | | | (4.47 | ) | | | (3.72 | ) |
Proceeds from regulatory settlement | | | 0.01 | | | | — | | | | 0.00 | (d) | | | 0.00 | (d) | | | — | | | | — | |
Net asset value, end of period | | | $43.89 | | | | $48.53 | | | | $37.60 | | | | $30.68 | | | | $41.22 | | | | $54.23 | |
| Total return | | | (3.00% | )(e) | | | 31.00% | | | | 23.28% | | | | (20.53% | ) | | | (16.74% | ) | | | 16.91% | |
| Ratios to average net assets(f) | | | | | | | | | | | | | | | | | | | | | | | | |
Expenses prior to fees waived or expenses reimbursed (including interest expense) | | | 1.06% | (g) | | | 1.00% | (h) | | | 1.02% | (h) | | | 1.13% | (h) | | | 1.01% | (h) | | | 1.04% | (h) |
Net expenses after fees waived or expenses reimbursed (including interest expense)(i) | | | 1.06% | (g)(j) | | | 1.00% | (h)(j) | | | 1.02% | (h)(j) | | | 1.13% | (h)(j) | | | 1.01% | (h)(j) | | | 1.04% | (h)(j) |
Expenses prior to fees waived or expenses reimbursed (excluding interest expense) | | | 1.06% | (g) | | | 1.00% | | | | 1.02% | | | | 1.13% | | | | 1.01% | | | | 1.04% | |
Net expenses after fees waived or expenses reimbursed (excluding interest expense)(i) | | | 1.06% | (g)(j) | | | 1.00% | (j) | | | 1.02% | (j) | | | 1.13% | (j) | | | 1.01% | (j) | | | 1.04% | (j) |
Net investment income | | | 0.67% | (g)(j) | | | 0.62% | (j) | | | 0.69% | (j) | | | 1.00% | (j) | | | 0.55% | (j) | | | 0.51% | (j) |
| Supplemental data | | | | | | | | | | | | | | | | | | | | | | | | |
Net assets, end of period (in thousands) | | | $1,051,352 | | | | $1,109,078 | | | | $774,590 | | | | $364,071 | | | | $235,632 | | | | $177,158 | |
Portfolio turnover | | | 23% | | | | 31% | | | | 30% | | | | 50% | | | | 40% | | | | 39% | |
Notes to Financial Highlights
| (a) | For the period from July 1, 2011 to April 30, 2012. During the period, the Fund’s fiscal year end was changed from June 30 to April 30. |
| (b) | Net investment income per share reflects special dividends. The effect of these dividends amounted to $0.03 per share. |
| (c) | Net investment income per share reflects special dividends. The effect of these dividends amounted to $0.05 per share. |
| (d) | Rounds to less than $0.01. |
| (e) | During the period ended April 30, 2012, the Fund received proceeds from a regulatory settlement. Had the Fund not received these proceeds, the total return would have been lower by 0.02%. |
| (f) | In addition to the fees and expenses which the Fund bears directly, the Fund indirectly bears a pro rata share of the fees and expenses of the acquired funds in which it invests. Such indirect expenses are not included in the reported expense ratios. |
| (h) | Includes interest expense which rounds to less than 0.01%. |
| (i) | The Investment Manager and certain of its affiliates agreed to waive/reimburse certain fees and expenses, if applicable. |
| (j) | The benefits derived from expense reductions had an impact of less than 0.01%. |
The Accompanying Notes to Financial Statements are an integral part of this statement.
24
Notes to Financial Statements – Columbia Small Cap Value Fund I
April 30, 2012
Note 1. Organization
Columbia Small Cap Value Fund I (the Fund), a series of Columbia Funds Series Trust I (the Trust), is a diversified fund. The Trust is registered under the Investment Company Act of 1940, as amended (the 1940 Act), as an open-end management investment company organized as a Massachusetts business trust.
Fiscal Year End Change
During the period, the Fund changed its fiscal year end from June 30 to April 30. Accordingly, this report includes activity for the period July 1, 2011 to April 30, 2012 and the year ended June 30, 2011.
Fund Shares
The Trust may issue an unlimited number of shares (without par value). The Fund offers Class A, Class B, Class C, Class I, Class R, Class Y and Class Z shares. All share classes have identical voting, dividend and liquidation rights. Each share class has its own expense structure and sales charges, as applicable.
Class A shares are subject to a maximum front-end sales charge of 5.75% based on the initial investment amount. Class A shares purchased without an initial sales charge in accounts aggregating $1 million to $50 million at the time of purchase are subject to a contingent deferred sales charge (CDSC) if the shares are sold within 18 months of purchase, charged as follows: 1.00% CDSC if redeemed within 12 months of purchase, and 0.50% CDSC if redeemed more than 12, but less than 18, months after purchase.
Class B shares may be subject to a maximum CDSC of 5.00% based upon the holding period after purchase. Class B shares will generally convert to Class A shares eight years after purchase. The Fund no longer accepts investments by new or existing investors in the Fund’s Class B shares, except in connection with the reinvestment of any dividend and/or capital gain distributions in Class B shares of the Fund and exchanges by existing Class B shareholders of certain other funds within the Columbia Family of Funds.
Class C shares are subject to a 1.00% CDSC on shares redeemed within one year of purchase.
Class I shares are not subject to sales charges and are only available to the Columbia Family of Funds.
Class R shares are not subject to sales charges and are only available to qualifying institutional investors.
Class Y shares are not subject to sales charges and are only available to certain categories of investors which are subject to minimum initial investment requirements.
Class Z shares are not subject to sales charges, and are only available to certain investors, as described in the Fund’s prospectus.
Note 2. Summary of Significant Accounting Policies
Use of Estimates
The preparation of financial statements in accordance with U.S. generally accepted accounting principles (GAAP) requires management to make certain estimates and assumptions that affect the reported amounts of assets and liabilities, the disclosure of contingent assets and liabilities at the date of the financial statements and the reported amounts of revenue and expenses during the reporting period. Actual results could differ from those estimates.
The following is a summary of significant accounting policies consistently followed by the Fund in the preparation of its financial statements.
Security Valuation
All equity securities are valued at the close of business of the New York Stock Exchange (NYSE). Equity securities are valued at the last quoted sales price on the principal exchange or market on which they trade, except for securities traded on the NASDAQ Stock Market, which are valued at the NASDAQ official close price. Unlisted securities or listed securities for which there were no sales during the day are valued at the mean of the latest quoted bid and asked prices on such exchanges or markets.
Foreign securities are valued based on quotations from the principal market in which such securities are normally traded. If any foreign share prices are not readily available as a result of limited share activity the securities are valued at the mean of the latest quoted bid and asked prices on such exchanges or markets. Foreign currency exchange rates are generally determined at 4:00 p.m. Eastern (U.S.) time. However, many securities markets and exchanges outside the U.S. close prior to the close of the NYSE; therefore, the closing prices for securities in such markets or on such exchanges may not fully reflect events that occur after such close but before the close of the NYSE. In those situations, foreign securities will be fair valued pursuant to the policy adopted by the Board, including utilizing a third party pricing service to determine these fair values. The third party pricing service takes into account multiple factors, including, but not limited to, movements in the U.S. securities markets, certain depositary receipts, futures contracts and foreign exchange rates that have occurred subsequent to the close of the foreign exchange, to determine a good faith estimate that reasonably reflects the current
25
Columbia Small Cap Value Fund I
April 30, 2012
market conditions as of the close of the NYSE. The fair value of a security is likely to be different from the quoted or published price, if available.
Investments in other open-end investment companies, including money market funds, are valued at net asset value.
Short-term securities purchased within 60 days to maturity are valued at amortized cost, which approximates market value. The value of short-term securities originally purchased with maturities greater than 60 days is determined based on an amortized value to par upon reaching 60 days to maturity. Short-term securities maturing in more than 60 days from the valuation date are valued at the market price or approximate market value based on current interest rates.
Investments for which market quotations are not readily available, or that have quotations which management believes are not reliable, are valued at fair value as determined in good faith under consistently applied procedures established by and under the general supervision of the Board. If a security or class of securities (such as foreign securities) is valued at fair value, such value is likely to be different from the last quoted market price for the security. The determination of fair value often requires significant judgment. To determine fair value, management may use assumptions including but not limited to future cash flows and estimated risk premiums. Multiple inputs from various sources may be used to determine value.
Foreign Currency Transactions and Translation
The values of all assets and liabilities denominated in foreign currencies are translated into U.S. dollars at that day’s exchange rates. Net realized and unrealized gains (losses) on foreign currency transactions and translations include gains (losses) arising from the fluctuation in exchange rates between trade and settlement dates on securities transactions, gains (losses) arising from the disposition of foreign currency and currency gains (losses) between the accrual and payment dates on dividends, interest income and foreign withholding taxes.
For financial statement purposes, the Fund does not distinguish that portion of gains (losses) on investments which is due to changes in foreign exchange rates from that which is due to changes in market prices of the investments. Such fluctuations are included with the net realized and unrealized gains (losses) on investments in the Statement of Operations.
Repurchase Agreements
The Fund may engage in repurchase agreement transactions with institutions that management has determined are creditworthy. The Fund, through the custodian, receives delivery of the underlying securities collateralizing a repurchase agreement. Management is responsible for determining that the collateral is at least equal, at all times, to the value of the repurchase obligation including interest. A repurchase agreement transaction involves certain risks in the event of default or insolvency of the counterparty. These risks include possible delays in or restrictions on a Fund’s ability to dispose of the underlying securities and a possible decline in the value of the underlying securities during the period while the Fund seeks to assert its rights.
Security Transactions
Security transactions are accounted for on the trade date. Cost is determined and gains (losses) are based upon the specific identification method for both financial statement and federal income tax purposes.
Income Recognition
Corporate actions and dividend income are recorded net of any non-reclaimable tax withholdings, on the ex-dividend date or upon receipt of ex-dividend notification in the case of certain foreign securities.
Interest income is recorded on the accrual basis.
The Fund receives distributions from holdings in real estate investment trusts (REITs) which report information on the character of their distributions annually. REIT distributions are allocated to dividend income, capital gain and return of capital based on estimates made by the Fund’s management if actual information has not yet been reported. Return of capital is recorded as a reduction of the cost basis of securities held. Management’s estimates are subsequently adjusted when the actual character of the distributions is disclosed by the REITs which could result in a proportionate change in return of capital to shareholders.
Awards from class action litigation are recorded as a reduction of cost basis if the Fund still owns the applicable securities on the payment date. If the Fund no longer owns the applicable securities, the proceeds are recorded as realized gains.
Expenses
General expenses of the Trust are allocated to the Fund and other funds of the Trust based upon relative net assets or other expense
26
Columbia Small Cap Value Fund I
April 30, 2012
allocation methodologies determined by the nature of the expense. Expenses directly attributable to the Fund are charged to the Fund. Expenses directly attributable to a specific class of shares are charged to that share class.
Determination of Class Net Asset Value
All income, expenses (other than class-specific expenses, which are charged to that share class, as shown in the Statement of Operations) and realized and unrealized gains (losses) are allocated to each class of the Fund on a daily basis, based on the relative net assets of each class, for purposes of determining the net asset value of each class.
Federal Income Tax Status
The Fund intends to qualify each year as a regulated investment company under Subchapter M of the Internal Revenue Code, as amended, and will distribute substantially all of its tax exempt or taxable income (including net short-term capital gains), if any, for its tax year, and as such will not be subject to federal income taxes. In addition, the Fund intends to distribute in each calendar year substantially all of its net investment income, capital gains and certain other amounts, if any, such that the Fund should not be subject to federal excise tax. Therefore, no federal income or excise tax provision is recorded.
Foreign Taxes
The Fund may be subject to foreign taxes on income, gains on investments or currency repatriation, a portion of which may be recoverable. The Fund will accrue such taxes and recoveries, as applicable, based upon its current interpretation of tax rules and regulations that exist in the markets in which it invests.
Realized gains in certain countries may be subject to foreign taxes at the Fund level, based on statutory rates. The Fund accrues for such foreign taxes on net realized and unrealized gains at the appropriate rate for each jurisdiction, as applicable.
Distributions to Shareholders
Distributions from net investment income are declared and paid annually. Net realized capital gains, if any, are distributed along with the income dividend. Income distributions and capital gain distributions are determined in accordance with federal income tax regulations which may differ from GAAP.
Guarantees and Indemnifications
Under the Trust’s organizational documents and, in some cases, by contract, its officers and trustees are indemnified against certain
liabilities arising out of the performance of their duties to the Trust or its funds. In addition, certain of the Fund’s contracts with its service providers contain general indemnification clauses. The Fund’s maximum exposure under these arrangements is unknown since the amount of any future claims that may be made against the Fund cannot be determined, and the Fund has no historical basis for predicting the likelihood of any such claims.
Recent Accounting Pronouncement
Fair Value Measurements and Disclosures
In May 2011, the Financial Accounting Standards Board (FASB) issued ASU No. 2011-04 modifying Topic 820, Fair Value Measurements and Disclosures. At the same time, the International Accounting Standards Board (IASB) issued International Financial Reporting Standard 13, Fair Value Measurement. The objective of the FASB and IASB is convergence of their guidance on fair value measurements and disclosures.
Specifically, ASU No. 2011-04 requires reporting entities to disclose i) the amounts of any transfers between Level 1 and Level 2, and the reasons for the transfers, ii) for Level 3 fair value measurements, a) quantitative information about significant unobservable inputs used, b) a description of the valuation processes used by the reporting entity and c) a narrative description of the sensitivity of the fair value measurement to changes in unobservable inputs if a change in those inputs might result in a significantly higher or lower fair value measurement. The effective date of ASU No. 2011-04 is for interim and annual periods beginning after December 15, 2011. At this time, management is evaluating the implications of this guidance and the impact it will have on the financial statement amounts and footnote disclosures, if any.
Note 3. Fees and Compensation Paid to Affiliates
Investment Management Fees
Under an Investment Management Services Agreement, Columbia Management Investment Advisers, LLC (the Investment Manager), a wholly-owned subsidiary of Ameriprise Financial, Inc. (Ameriprise Financial), determines which securities will be purchased, held or sold. The management fee is an annual fee that is equal to a percentage of the Fund’s average daily net assets that declines from 0.79% to 0.70% as the Fund’s net assets increase. For the period ended April 30, 2012 and the year ended June 30, 2011, the annualized effective management fee rate was 0.74% of the Fund’s average daily net assets.
27
Columbia Small Cap Value Fund I
April 30, 2012
Administration Fees
Under an Administrative Services Agreement, the Investment Manager serves as the Fund Administrator. The Fund pays the Fund Administrator an annual fee for administration and accounting services equal to a percentage of the Fund’s average daily net assets that declines from 0.08% to 0.05% as the Fund’s net assets increase. For the period ended April 30, 2012, the annualized effective administration fee rate was 0.07% of the Fund’s average daily net assets. For the year ended June 30, 2011, the effective administration fee rate was 0.01% of the Fund’s average daily net assets.
Compensation of Board Members
Board members are compensated for their services to the Fund as disclosed in the Statement of Operations. The Trust’s eligible Trustees may participate in a Deferred Compensation Plan (the Plan) which may be terminated at any time. Obligations of the Plan will be paid solely out of the Fund’s assets.
Compensation of Chief Compliance Officer
The Board has appointed a Chief Compliance Officer to the Fund in accordance with federal securities regulations. The Fund, along with other affiliated funds, pays its pro-rata share of the expenses associated with the Chief Compliance Officer. The Fund’s expenses for the Chief Compliance Officer will not exceed $15,000 per year.
Transfer Agent Fees
Under a Transfer and Dividend Disbursing Agent Agreement, Columbia Management Investment Services Corp. (the Transfer Agent), an affiliate of the Investment Manager and a wholly-owned subsidiary of Ameriprise Financial, is responsible for providing transfer agency services to the Fund. The Transfer Agent has contracted with Boston Financial Data Services (BFDS) to serve as sub-transfer agent.
The Transfer Agent receives monthly account-based service fees based on the number of open accounts and is reimbursed by the Fund for the fees and expenses the Transfer Agent pays to financial intermediaries that maintain omnibus accounts with the Fund that is a percentage of the average aggregate value of the Fund’s shares maintained in each such omnibus account (other than omnibus accounts for which American Enterprise Investment Services Inc. is the broker of record or accounts where the beneficial shareholder is a customer of Ameriprise Financial Services, Inc., which are paid a per account fee). The Transfer Agent pays the fees of BFDS for services as sub-transfer agent and is not entitled to reimbursement for such fees from the Fund (with the exception of out-of-pocket fees).
The Transfer Agent also receives compensation from fees for various shareholder services and reimbursements for certain out-of-pocket expenses. Class I shares do not pay transfer agent fees.
For the period ended April 30, 2012 and the year ended June 30, 2011, the Fund’s annualized effective transfer agent fee rates as a percentage of average daily net assets of each class were as follows:
| | | | | | | | |
| | | Period ended April 30, 2012 | | | Year ended June 30, 2011 | |
| Class A | | | 0.20 | % | | | 0.19 | % |
| Class B | | | 0.21 | | | | 0.19 | |
| Class C | | | 0.20 | | | | 0.19 | |
| Class R | | | 0.17 | | | | 0.17 | |
| Class Y | | | 0.00 | * | | | 0.00 | * |
| Class Z | | | 0.20 | | | | 0.19 | |
| * | Rounds to less than 0.01%. |
An annual minimum account balance fee of $20 may apply to certain accounts with a value below the Fund’s initial minimum investment requirements to reduce the impact of small accounts on transfer agent fees. These minimum account balance fees are recorded as part of expense reductions in the Statement of Operations. For the period ended April 30, 2012, these minimum account balance fees reduced total expenses by $11,441. For the year ended June 30, 2011, no minimum account balance fees were charged to accounts.
Distribution and Service Fees
The Fund has an agreement with Columbia Management Investment Distributors, Inc. (the Distributor), an affiliate of the Investment Manager and a wholly-owned subsidiary of Ameriprise Financial, for distribution and shareholder services. Pursuant to Rule 12b-1 under the 1940 Act, the Board has approved, and the Fund has adopted, distribution and shareholder service plans (the Plans) which set the distribution and service fees for the Fund. These fees are calculated daily and are intended to compensate the Distributor and/or eligible selling and/or servicing agents for selling shares of the Fund and providing services to investors.
The Plans require the payment of a monthly service fee to the Distributor at the maximum annual rate of 0.25% of the average daily net assets attributable to Class A, Class B and Class C shares of the Fund. The Plans also require the payment of a monthly distribution fee to the Distributor at the maximum annual rates of 0.75%, 0.75% and 0.50% of the average daily net assets attributable to Class B, Class C and Class R shares, respectively.
28
Columbia Small Cap Value Fund I
April 30, 2012
Sales Charges
Sales charges, including front-end charges and CDSCs, received by the Distributor for distributing Fund shares were $35,171 for Class A, $8,246 for Class B and $673 for Class C shares for the period ended April 30, 2012, and $315,838 for Class A, $19,950 for Class B and $3,509 for Class C for the year ended June 30, 2011.
Expenses Waived/Reimbursed by the Investment Manager and its Affiliates
The Investment Manager and certain of its affiliates have contractually agreed to waive fees and/or reimburse expenses (excluding certain fees and expenses described below), through October 31, 2012, unless sooner terminated at the sole discretion of the Board, so that the Fund’s net operating expenses, after giving effect to fees waived/expenses reimbursed and/or overdraft charges from the Fund’s custodian, do not exceed the following annual rates as a percentage of the class’ average daily net assets:
| | | | |
| | | | |
| Class A | | | 1.37 | % |
| Class B | | | 2.12 | |
| Class C | | | 2.12 | |
| Class I | | | 0.97 | |
| Class R | | | 1.62 | |
| Class Y | | | 1.12 | |
| Class Z | | | 1.12 | |
Under the agreement, the following fees and expenses, are excluded from the waiver/reimbursement commitment, and therefore will be paid by the Fund, if applicable: taxes (including foreign transaction taxes), expenses associated with investments in affiliated and non-affiliated pooled investment vehicles (including mutual funds and exchange traded funds), transaction costs and brokerage commissions, costs related to any securities lending program, dividend expenses associated with securities sold short, inverse floater program fees and expenses, transaction charges and interest on borrowed money, interest, extraordinary expenses and any other expenses the exclusion of which is specifically approved by the Board. This agreement may be modified or amended only with approval from all parties.
Note 4. Federal Tax Information
The timing and character of income and capital gain distributions are determined in accordance with income tax regulations, which may
differ from GAAP because of temporary or permanent book to tax differences.
For the year ended April 30, 2012, these differences are primarily due to differing treatment for deferral/reversal of wash sale losses, Trustees’ deferred compensation, foreign currency transactions, passive foreign investment company (PFIC) holdings, expiring capital loss carryforwards, distribution reclassifications, proceeds from regulatory settlements and redemption based payments treated as eligible for the dividends paid deduction. To the extent these differences are permanent, reclassifications are made among the components of the Fund’s net assets in the Statement of Assets and Liabilities. Temporary differences do not require reclassifications. In the Statement of Assets and Liabilities the following reclassifications were made:
| | | | |
| | | | |
| Excess of distributions over net investment income | | $ | 4,300,945 | |
| Accumulated net realized loss | | | (6,496,093 | ) |
| Paid-in capital | | | 2,195,148 | |
Net investment income and net realized gains (losses), as disclosed in the Statement of Operations, and net assets were not affected by this reclassification.
The tax character of distributions paid during the periods indicated was as follows:
| | | | | | | | | | | | |
| | | Period ended April 30, 2012 | | | Year ended June 30, 2011 | | | Year ended June 30, 2010 | |
| Ordinary income | | $ | 34,261,606 | | | $ | 19,271,086 | | | $ | 6,405,327 | |
| Long-term capital gains | | | 84,314,697 | | | | 6,213,315 | | | | — | |
Short-term capital gain distributions, if any, are considered ordinary income distributions for tax purposes.
At April 30, 2012, the components of distributable earnings on a tax basis were as follows:
| | | | |
| | | | |
| Undistributed ordinary income | | $ | — | |
| Undistributed long-term capital gains | | | 3,563,754 | |
| Unrealized appreciation | | | 276,376,919 | |
At April 30, 2012, the cost of investments for federal income tax purposes was approximately $1,837,080,035 and the aggregate gross
29
Columbia Small Cap Value Fund I
April 30, 2012
approximate unrealized appreciation and depreciation based on that cost was:
| | | | |
| | | | |
| Unrealized appreciation | | $ | 365,739,692 | |
| Unrealized depreciation | | | (89,362,773 | ) |
| | | | |
| Net unrealized appreciation | | $ | 276,376,919 | |
For the period ended April 30, 2012, $1,265,985 of capital loss carryforward was utilized and $205,574 of capital loss carryforward expired unused.
On December 22, 2010, the Regulated Investment Company Modernization Act of 2010 (the Act) was enacted, which changed various technical rules governing the tax treatment of regulated investment companies. The changes are generally effective for taxable years beginning after the date of enactment. Under the Act, the Fund will be permitted to carry forward capital losses incurred in taxable years beginning after the date of enactment for an unlimited period. However, any losses incurred during those future taxable years will be required to be utilized prior to the losses incurred in pre-enactment taxable years, which carry an expiration date. As a result of this ordering rule, pre-enactment capital loss carryforwards may be more likely to expire unused.
Management of the Fund has concluded that there are no significant uncertain tax positions that would require recognition in the financial statements. However, management’s conclusion may be subject to review and adjustment at a later date based on factors including, but not limited to, new tax laws, regulations, and administrative interpretations (including relevant court decisions). Generally, the Fund’s federal tax returns for the prior three fiscal years remain subject to examination by the Internal Revenue Service.
Note 5. Portfolio Information
The cost of purchases and proceeds from sales of securities, excluding short-term obligations, aggregated to $412,348,685 and $558,682,875, respectively, for the period ended April 30, 2012.
Note 6. Regulatory Settlements
During the period ended April 30, 2012, the Fund received payments of $253,732 as a result of a regulatory settlement proceeding brought by the Securities and Exchange Commission against an unaffiliated third party relating to market timing and/or late trading of mutual funds. This amount represented the Fund’s portion of the proceeds from the settlement (the Fund was not a party to the proceeding).
During the year ended June 30, 2010, the Fund received payments of $4,978 resulting from certain regulatory settlements with third parties in which the Fund had participated. These payments have been included in “Proceeds from regulatory settlements” in the Statement of Changes in Net Assets.
Note 7. Lending of Portfolio Securities
The Fund has entered into a Master Securities Lending Agreement (the Agreement) with JPMorgan Chase Bank, N.A. (JPMorgan). The Agreement authorizes JPMorgan as lending agent to lend securities to authorized borrowers in order to generate additional income on behalf of the Fund. Pursuant to the Agreement, the securities loaned are secured by cash or U.S. government securities equal to at least 100% of the market value of the loaned securities. Any additional collateral required to maintain those levels due to market fluctuations of the loaned securities is requested to be delivered the following business day. Cash collateral received is invested by the lending agent on behalf of the Fund into authorized investments pursuant to the Agreement. The investments made with the cash collateral are listed in the Portfolio of Investments. The values of such investments and any uninvested cash collateral are disclosed in the Statement of Assets and Liabilities along with the related obligation to return the collateral upon the return of the securities loaned.
Risks of delay in recovery of securities or even loss of rights in the securities may occur should the borrower of the securities fail
30
Columbia Small Cap Value Fund I
April 30, 2012
financially. Risks may also arise to the extent that the value of the securities loaned increases above the value of the collateral received. JPMorgan will indemnify the Fund from losses resulting from a borrower’s failure to return a loaned security when due. Such indemnification does not extend to losses associated with declines in the value of cash collateral investments. The Investment Manager is not responsible for any losses incurred by the Fund in connection with the securities lending program. Loans are subject to termination by the Fund or the borrower at any time, and are, therefore, not considered to be illiquid investments.
Pursuant to the Agreement, the Fund receives income for lending its securities either in the form of fees or by earning interest on invested cash collateral, net of negotiated rebates paid to borrowers and fees paid to the lending agent for services provided and any other securities lending expenses. Net income earned from securities lending for the period ended April 30, 2012 and the year ended June 30, 2011, is disclosed in the Statement of Operations. The Fund continues to earn and accrue interest and dividends on the securities loaned.
At April 30, 2012, securities valued at $360,954,236 were on loan, secured by cash collateral of $374,193,329 (which does not reflect calls for collateral made to borrowers by JPMorgan at period end) that is partially or fully invested in short-term securities or other cash equivalents.
Note 8. Affiliated Money Market Fund
The Fund may invest its daily cash balances in Columbia Short-Term Cash Fund, an affiliated money market fund established for the exclusive use by the Fund and other affiliated funds. The income earned by the Fund from such investments is included as “Dividends from affiliates” in the Statement of Operations. As an investing fund, the Fund indirectly bears its proportionate share of the expenses of Columbia Short-Term Cash Fund.
Note 9. Shareholder Concentration
At April 30, 2012, two unaffiliated shareholder accounts owned an aggregate of 28.6% of the outstanding shares of the Fund. The Fund has no knowledge about whether any portion of those shares was owned beneficially by such accounts. Subscription and redemption activity by concentrated accounts may have a significant effect on the operations of the Fund.
Note 10. Line of Credit
The Fund has entered into a revolving credit facility with a syndicate of banks led by JPMorgan whereby the Fund may borrow for the temporary funding of shareholder redemptions or for other temporary or emergency purposes. The credit facility agreement, as amended, which is a collective agreement between the Fund and certain other funds managed by the Investment Manager, severally and not jointly, permits collective borrowings up to $500 million. Pursuant to a December 13, 2011 amendment to the credit facility agreement, interest is charged to each participating fund based on its borrowings at a rate equal to the higher of (i) the overnight federal funds rate plus 1.00% or (i) the one-month LIBOR rate plus 1.00%. Each borrowing under the credit facility matures no later than 60 days after the date of borrowing. The Fund also pays a commitment fee equal to its pro rata share of the amount of the credit facility at a rate of 0.08% per annum.
Prior to December 13, 2011, interest was charged to each participating fund based on its borrowings at a rate equal to the sum of the federal funds rate plus (i) 1.25% per annum plus (ii) if one-month LIBOR exceeds the federal funds rate, the amount of such excess. The Fund also paid a commitment fee equal to its pro rata share of the amount of the credit facility at a rate of 0.10% per annum.
The Fund had no borrowings during the period ended April 30, 2012.
Note 11. Fund Merger
At the close of business on June 3, 2011, Columbia Small Cap Value Fund I acquired the assets and assumed the identified liabilities of RiverSource Disciplined Small Cap Value Fund. The reorganization was completed after shareholders approved the plan on February 15, 2011. The purpose of the transaction was to combine two funds managed by the Investment Manager with comparable investment objectives and strategies.
The aggregate net assets of Columbia Small Cap Value Fund I immediately before the acquisition were $1,873,264,948 and the combined net assets immediately after the acquisition were $1,915,994,081.
The merger was accomplished by a tax-free exchange of 4,604,408 shares of RiverSource Disciplined Small Cap Value Fund valued at $42,729,133 (including $4,256,611 of unrealized appreciation).
31
Columbia Small Cap Value Fund I
April 30, 2012
In exchange for RiverSource Disciplined Small Cap Value Fund shares, Columbia Small Cap Value Fund I issued the following number of shares:
| | | | |
| | |
| | | Shares | |
| Class A | | | 84,483 | |
| Class B | | | 3,912 | |
| Class C | | | 3,642 | |
| Class I | | | 817,679 | |
| Class R | | | 94 | |
For financial reporting purposes, net assets received and shares issued by Columbia Small Cap Value Fund I were recorded at fair value; however, RiverSource Disciplined Small Cap Value Fund’s cost of investments was carried forward.
The financial statements reflect the operations of Columbia Small Cap Value Fund I for the period prior to the merger and the combined fund for the period subsequent to the merger. Because the combined investment portfolios have been managed as a single integrated portfolio since the merger was completed, it is not practicable to separate the amounts of revenue and earnings of RiverSource Disciplined Small Cap Value Fund that have been included in the combined Fund’s Statement of Operations since the merger was completed.
Assuming the merger had been completed on July 1, 2010 Columbia Small Cap Value Fund I’s pro-forma net investment income, net gain on investments, net change in unrealized appreciation (depreciation) and net increase in net assets from operations for the year ended June 30, 2011 would have been approximately $7.9 million, $142.1 million, $310.9 million and $460.9 million, respectively.
Note 12. Significant Risks
Sector Focus Risk
The Fund may focus its investments in certain sectors, subjecting it to greater risk than a fund that invests in a wider range of industries.
Note 13. Subsequent Events
Management has evaluated the events and transactions that have occurred through the date the financial statements were issued and noted no items requiring adjustment of the financial statements or additional disclosure.
Note 14. Information Regarding Pending and Settled Legal Proceedings
In December 2005, without admitting or denying the allegations, American Express Financial Corporation (AEFC, which is now known as Ameriprise Financial, Inc. (Ameriprise Financial)) entered into settlement agreements with the Securities and Exchange Commission (SEC) and Minnesota Department of Commerce (MDOC) related to market timing activities. As a result, AEFC was censured and ordered to cease and desist from committing or causing any violations of certain provisions of the Investment Advisers Act of 1940, the Investment Company Act of 1940, and various Minnesota laws. AEFC agreed to pay disgorgement of $10 million and civil money penalties of $7 million. AEFC also agreed to retain an independent distribution consultant to assist in developing a plan for distribution of all disgorgement and civil penalties ordered by the SEC in accordance with various undertakings detailed at www.sec.gov/litigation/admin/ia-2451.pdf. Ameriprise Financial and its affiliates have cooperated with the SEC and the MDOC in these legal proceedings, and have made regular reports to the funds’ Boards of Trustees.
Ameriprise Financial and certain of its affiliates have historically been involved in a number of legal, arbitration and regulatory proceedings, including routine litigation, class actions, and governmental actions, concerning matters arising in connection with the conduct of their business activities. Ameriprise Financial believes that the Funds are not currently the subject of, and that neither Ameriprise Financial nor any of its affiliates are the subject of, any pending legal, arbitration or regulatory proceedings that are likely to have a material adverse effect on the Funds or the ability of Ameriprise Financial or its affiliates to perform under their contracts with the Funds. Ameriprise Financial is required to make 10-Q, 10-K and, as necessary, 8-K filings with the Securities and Exchange Commission on legal and regulatory matters that relate to Ameriprise Financial and its affiliates. Copies of these filings may be obtained by accessing the SEC website at www.sec.gov.
There can be no assurance that these matters, or the adverse publicity associated with them, will not result in increased fund redemptions, reduced sale of fund shares or other adverse consequences to the Funds. Further, although we believe proceedings are not likely to have a material adverse effect on the Funds or the ability of Ameriprise Financial or its affiliates to perform under their contracts with the Funds, these proceedings are subject to uncertainties and, as such, we are unable to estimate the possible loss or range of loss that may result. An adverse outcome in
32
Columbia Small Cap Value Fund I
April 30, 2012
one or more of these proceedings could result in adverse judgments, settlements, fines, penalties or other relief that could have a material adverse effect on the consolidated financial condition or results of operations of Ameriprise Financial.
33
Report of Independent Registered Public Accounting Firm
To the Trustees of Columbia Funds Series Trust I and the Shareholders of Columbia Small Cap Value Fund I
In our opinion, the accompanying statement of assets and liabilities, including the portfolio of investments, and the related statements of operations and of changes in net assets and the financial highlights present fairly, in all material respects, the financial position of Columbia Small Cap Value Fund I (the “Fund”) (a series of Columbia Funds Series Trust I) at April 30, 2012, the results of its operations, the changes in its net assets and the financial highlights for each of the periods indicated, in conformity with accounting principles generally accepted in the United States of America. These financial statements and financial highlights (hereafter referred to as “financial statements”) are the responsibility of the Fund’s management. Our responsibility is to express an opinion on these financial statements based on our audits. We conducted our audits of these financial statements in accordance with the standards of the Public Company Accounting Oversight Board (United States). Those standards require that we plan and perform the audit to obtain reasonable assurance about whether the financial statements are free of material misstatement. An audit includes examining, on a test basis, evidence supporting the amounts and disclosures in the financial statements, assessing the accounting principles used and significant estimates made by management, and evaluating the overall financial statement presentation. We believe that our audits, which included confirmation of securities at April 30, 2012 by correspondence with the custodian, transfer agent and brokers, provide a reasonable basis for our opinion.
PricewaterhouseCoopers LLP
Minneapolis, Minnesota
June 21, 2012
34
Federal Income Tax Information (Unaudited) – Columbia Small Cap Value Fund I
The Fund hereby designates as a capital gain dividend with respect to the fiscal year ended April 30, 2012, $9,483,249, or, if subsequently determined to be different, the net capital gain of such year.
72.01% of the ordinary income distributed by the Fund for the fiscal year ended April 30, 2012, qualifies for the corporate dividends received deduction.
For non-corporate shareholders, 72.17% or the maximum amount allowable under the Jobs and Growth Tax Relief Reconciliation Act of 2003, of the ordinary income distributed by the Fund for the fiscal year ended April 30, 2012 may represent qualified dividend income.
The Fund will notify shareholders in January 2013 of amounts for use in preparing 2012 income tax returns.
35
Fund Governance
The Trustees serve terms of indefinite duration. The names, addresses and birth years of the Trustees and Officers of the Funds in Columbia Funds Series Trust I, the year each was first elected or appointed to office, their principal business occupations during at least the last five years, the number of Funds overseen by each Trustee and other directorships they hold are shown below. Each officer listed below serves as an officer of each Fund in Columbia Funds Series Trust I.
Independent Trustees
| | |
Name, address and year of birth,
Position with funds, Year first
elected or appointed to office | | Principal occupation(s) during past five years, Number of funds in Columbia Funds
Complex overseen by trustee, Other directorships Held |
| |
| Rodman L. Drake (born 1943) | | |
c/o Columbia Management Investment Advisers, LLC 225 Franklin Street Boston, MA 02110 Trustee (since 1994) and Chairman of the Board (since 2009) | | Independent consultant since 2010; Co-Founder of Baringo Capital LLC (private equity) from 1997 to 2008; CEO of Crystal River Capital, Inc. (real estate investment trust) from 2003 to 2010; Oversees 51; Jackson Hewitt Tax Service Inc. (tax preparation services) from 2004 to 2011; Celgene Corporation (global biotechnology company); Student Loan Corporation (student loan provider) from 2005 to 2010; Celgene Corporation (global biotechnology company); The Helios Funds and Brookfield Funds (closed-end funds); Crystal River Capital, Inc. from 2005 to 2010; Parsons Brinckerhoff from 1995 to 2008; and Apex Silver Mines Ltd. from 2007 to 2009 |
| |
| Douglas A. Hacker (born 1955) | | |
c/o Columbia Management Investment Advisers, LLC 225 Franklin Street Boston, MA 02110 Trustee (since 1996) | | Independent business executive since May 2006; Executive Vice President–Strategy of United Airlines (airline) from December 2002 to May 2006; President of UAL Loyalty Services (airline marketing company) from September 2001 to December 2002; Executive Vice President and Chief Financial Officer of United Airlines from July 1999 to September 2001. Oversees 51; Nash Finch Company (food distributor); Aircastle Limited (aircraft leasing); and SeaCube Container Leasing Ltd (container leasing) |
|
| Janet Langford Kelly (born 1957) |
c/o Columbia Management Investment Advisers, LLC 225 Franklin Street Boston, MA 02110 Trustee (since 1996) | | Senior Vice President, General Counsel and Corporate Secretary, ConocoPhillips (integrated energy company) since September 2007; Deputy General Counsel–Corporate Legal Services, ConocoPhillips from August 2006 to August 2007; Partner, Zelle, Hofmann, Voelbel, Mason & Gette LLP (law firm) from March 2005 to July 2006; Adjunct Professor of Law, Northwestern University, from September 2004 to June 2006; Director, UAL Corporation (airline) from February 2006 to July 2006; Oversees 51; None |
|
| Nancy T. Lukitsh (born 1956) |
c/o Columbia Management Investment Advisers, LLC 225 Franklin Street Boston, MA 02110 Trustee (since 2011) | | Senior Vice President, Partner and Director, Marketing of Wellington Management Company, LLP (investment adviser) from 1997 to 2010; Chair, Wellington Management Investment Portfolios (commingled non-U.S. investment pools) from 2007 to 2010; Director, Wellington Trust Company, NA and other Wellington affiliates from 1997 to 2010. Oversees 51; None |
|
| William E. Mayer (born 1940) |
c/o Columbia Management Investment Advisers, LLC 225 Franklin Street Boston, MA 02110 Trustee (since 1994) | | Partner, Park Avenue Equity Partners (private equity) since February 1999; Dean and Professor, College of Business and Management, University of Maryland from 1992 to 1996. Oversees 51; DynaVox Inc. (speech creation); Lee Enterprises (print media), WR Hambrecht + Co. (financial service provider); BlackRock Kelso Capital Corporation (investment company) |
36
Fund Governance (continued)
Independent Trustees (continued)
| | |
Name, address and year of birth,
Position with funds, Year first
elected or appointed to office | | Principal occupation(s) during past five years, Number of funds in Columbia Funds
Complex overseen by trustee, Other directorships held |
| |
| David M. Moffett (born 1952) | | |
c/o Columbia Management Investment Advisers, LLC 225 Franklin Street Boston, MA 02110 Trustee (since 2011) | | Retired. Chief Executive Officer, Federal Home Loan Mortgage Corporation, from 2008 to 2009; Senior Adviser, Global Financial Services Group, Carlyle Group, Inc., from 2007 to 2008; Vice Chairman and Chief Financial Officer, U.S. Bancorp, from 1993 to 2007. Oversees 51; CIT Group Inc. (commercial and consumer finance), eBay Inc. (online trading community), MBIA Corp (financial service provider), E.W. Scripps Co. (print and television media), Building Materials Holding Corp. (building materials and construction services), and University of Oklahoma Foundation. |
| |
| Charles R. Nelson (born 1942) | | |
c/o Columbia Management Investment Advisers, LLC 225 Franklin Street Boston, MA 02110 Trustee (since 1981) | | Retired. Professor Emeritus, University of Washington, since 2011; Professor of Economics, University of Washington, from 1976 to 2011; Ford and Louisa Van Voorhis Professor of Political Economy, University of Washington, from 1993 to 2011; Adjunct Professor of Statistics, University of Washington, from 1980 to 2011; Associate Editor, Journal of Money Credit and Banking from 1993 to 2008; consultant on econometric and statistical matters. Oversees 51; None |
| |
| John J. Neuhauser (born 1943) | | |
c/o Columbia Management Investment Advisers, LLC 225 Franklin Street Boston, MA 02110 Trustee (since 1984) | | President, Saint Michael’s College, since August 2007; Director or Trustee of several non-profit organization, including Fletcher Allen Health Care, Inc.; University Professor, Boston College from November 2005 to August 2007; Academic Vice President and Dean of Faculties, Boston College from August 1999 to October 2005. Oversees 51; Liberty All-Star Equity Fund and Liberty All-Star Growth Fund, Inc. (closed-end funds) |
| |
| Patrick J. Simpson (born 1944) | | |
c/o Columbia Management Investment Advisers, LLC 225 Franklin Street Boston, MA 02110 Trustee (since 2000) | | Partner, Perkins Coie LLP (law firm). Oversees 51; None |
| |
| Anne-Lee Verville (born 1945) | | |
c/o Columbia Management Investment Advisers, LLC 225 Franklin Street Boston, MA 02110 Trustee (since 1998) | | Retired since 1997 (formerly General Manager–Global Education Industry from 1994 to 1997, President–Application Systems Division from 1991 to 1994, Chief Financial Officer–US Marketing & Services from 1988 to 1991, and Chief Information Officer from 1987 to 1988, IBM Corporation (computer and technology)). Oversees 51; Enesco Group, Inc. (producer of giftware and home and garden decor products) from 2001 to 2006 |
The Statement of Additional Information includes additional information about the Trustees of the Funds and is available, without charge, upon request by calling 1-800-345-6611.
37
Fund Governance (continued)
Interested Trustee
| | |
Name, address and year of birth,
Position with funds, Year first
elected or appointed to office | | Principal occupation(s) during past five years, Number of funds in Columbia Funds
Complex overseen by trustee, Other directorships held |
| |
| William F. Truscott (born 1960) | | |
53600 Ameriprise Financial Center Minneapolis, MN 55474 Senior Vice President (since 2010) | | Chairman of the Board and President, Columbia Management Investment Advisers, LLC since May 2010 and February 2012, respectively (previously President, Chairman of the Board and Chief Investment Officer, from 2001 to April 2010); Chief Executive Officer, U.S. Asset Management & President, Annuities, Ameriprise Financial, Inc. since May 2010 (previously President–U.S. Asset Management and Chief Investment Officer from 2005 to April 2010); Director, President and Chief Executive Officer, Ameriprise Certificate Company since 2006; Director and Chief Executive Officer, Columbia Management Investment Distributors, Inc. since May 2010 and February 2012, respectively (previously Chairman of the Board and Chief Executive Officer from 2008 to April 2010); Chairman of the Board and Chief Executive Officer, RiverSource Distributors, Inc. since 2006. Oversees 51; Columbia Funds Board. |
Officers
| | |
| Name, Year of birth and address | | Principal occupation(s) during past five years |
| |
| J. Kevin Connaughton (born 1964) | | |
225 Franklin Street Boston, MA 02110 President (since 2009) | | Senior Vice President and General Manager–Mutual Fund Products, Columbia Management Investment Advisers, LLC since May 2010; President, Columbia Funds, since 2009, and RiverSource Funds, since May 2010 (previously Senior Vice President and Chief Financial Officer, Columbia Funds, from June 2008 to January 2009, Treasurer, Columbia Funds, from October 2003 to May 2008, and senior officer of various other affiliated funds since 2000); Managing Director, Columbia Management Advisors, LLC from December 2004 to April 2010. |
| |
| Michael G. Clarke (born 1969) | | |
225 Franklin Street Boston, MA 02110 Treasurer (since 2011) and Chief Financial Officer
(since 2009) | | Vice President, Columbia Management Investment Advisers, LLC since May 2010; Managing Director of Fund Administration, Columbia Management Advisors, LLC, from September 2004 to April 2010; senior officer of Columbia Funds and affiliated funds since 2002. |
| |
| Scott R. Plummer (born 1959) | | |
5228 Ameriprise Financial Center Minneapolis, MN 55474 Senior Vice President, Secretary and Chief Legal Officer (since 2010) | | Chief Legal Officer and Assistant Secretary, Columbia Management Investment Advisers, LLC since June 2005; Vice President and Lead Chief Counsel–Asset Management, Ameriprise Financial, Inc. since May 2010 (previously Vice President and Chief Counsel–Asset Management, from 2005 to April 2010, Vice President and Chief Counsel–Asset Management, from 2005 to April 2010; Vice President, Chief Counsel and Assistant Secretary, Columbia Management Investment Distributors, Inc. since 2008; Vice President, General Counsel and Secretary, Ameriprise Certificate Company since 2005; Chief Counsel, RiverSource Distributors, Inc. since 2006; Senior officer of Columbia Funds and affiliated funds, since 2006. |
| |
| Thomas P. McGuire (born 1972) | | |
225 Franklin Street Boston, MA 02110 Chief Compliance Officer (since 2012) | | Vice President–Asset Management Compliance, Columbia Management Investment Advisers, LLC since March 2010; Chief Compliance Officer, Ameriprise Certificate Company, since September 2010; Compliance Executive, Bank of America, from June 2005 to April 2010. |
38
Fund Governance (continued)
Officers (continued)
| | |
| Name, Year of birth and address | | Principal occupation(s) during past five years |
| |
| William F. Truscott (born 1960) | | |
53600 Ameriprise Financial Center Minneapolis, MN 55474 Senior Vice President (since 2010) | | Chairman of the Board and President, Columbia Management Investment Advisers, LLC since May 2010 and February 2012, respectively (previously President, Chairman of the Board and Chief Investment Officer, from 2001 to April 2010); Chief Executive Officer, U.S. Asset Management & President, Annuities, Ameriprise Financial, Inc. since May 2010 (previously President–U.S. Asset Management and Chief Investment Officer from 2005 to April 2010); Director, President and Chief Executive Officer, Ameriprise Certificate Company since 2006; Director and Chief Executive Officer, Columbia Management Investment Distributors, Inc. since May 2010 and February 2012, respectively (previously Chairman of the Board and Chief Executive Officer from 2008 to April 2010); Chairman of the Board and Chief Executive Officer, RiverSource Distributors, Inc. since 2006. |
| |
| Paul D. Pearson (born 1956) | | |
10468 Ameriprise Financial Center Minneapolis, MN 55474 Vice President and Assistant Treasurer (since 2011) | | Vice President–Investment Accounting, Columbia Management Investment Advisers, LLC, since May 2010; Vice President–Managed Assets, Investment Accounting, Ameriprise Financial Corporation, 1998-2010. |
| |
| Colin Moore (born 1958) | | |
225 Franklin Street Boston, MA 02110 Senior Vice President (since 2010) | | Director and Chief Investment Officer, Columbia Management Investment Advisers, LLC since May 2010; Manager, Managing Director and Chief Investment Officer of Columbia Management Advisors, LLC from 2007 to April 2010; Head of Equities, Columbia Management Advisors, LLC from 2002 to 2007. |
| |
| Christopher O. Petersen (born 1970) | | |
5228 Ameriprise Financial Center Minneapolis, MN 55474 Vice President and Secretary (since 2011) | | Vice President and Chief Counsel, Ameriprise Financial since January 2010 (formerly Vice President and Group Counsel or Counsel from April 2004 to January 2010); Senior officer of Columbia Funds and affiliated funds, since 2007. |
| |
| Amy K. Johnson (born 1965) | | |
5228 Ameriprise Financial Center Minneapolis, MN 55474 Senior Vice President (since 2010) | | Senior Vice President and Chief Operating Officer, Columbia Management Investment Advisers, LLC since May 2010 (previously Chief Administrative Officer, from 2009 until April 2010, Vice President–Asset Management and Trust Company Services, from 2006 to 2009, and Vice President–Operations and Compliance from 2004 to 2006). |
| |
| Joseph F. DiMaria (born 1968) | | |
225 Franklin Street Boston, MA 02110 Vice President (since 2011) and Chief Accounting Officer (since 2008) | | Vice President, Mutual Fund Administration, Columbia Management Investment Advisers, LLC, since May 2010; Director of Fund Administration, Columbia Management Advisors, LLC from January 2006 to April 2010. |
| |
| Paul B. Goucher (born 1968) | | |
100 Park Avenue New York, NY 10017 Vice President and Assistant Secretary (since 2010) | | Vice President and Chief Counsel of Ameriprise Financial since January 2010 (formerly Vice President and Group Counsel from November 2008 to January 2010); Director, Managing Director and General Counsel of J. & W. Seligman & Co. Incorporated (Seligman) from July 2008 to November 2008 and Managing Director and Associate General Counsel of Seligman from January 2005 to July 2008. |
39
Fund Governance (continued)
Officers (continued)
| | |
| Name, Year of birth and address | | Principal occupation(s) during past five years |
| |
| Michael E. DeFao (born 1968) | | |
225 Franklin Street Boston, MA 02110 Vice President and Assistant Treasurer (since 2011) | | Vice President and Chief Counsel, Ameriprise Financial since May 2010; Associate General Counsel, Bank of America from June 2005 to April 2010. |
| |
| Stephen T. Welsh (born 1957) | | |
225 Franklin Street Boston, MA 02110 Vice President (since 2006) | | President, Columbia Management Investment Services, Corp. since May 2010; President and Director, Columbia Management Services, Inc. from July 2004 to April 2010; Managing Director, Columbia Management Distributors, Inc. from August 2007 to April 2010. |
40
Board Consideration and Approval of Advisory Agreement
On March 7, 2012, the Board of Trustees (the “Board”) and the Trustees who are not interested persons (as defined in the Investment Company Act of 1940) of the Trust (the “Independent Trustees”) unanimously approved the continuation of the Investment Management Services Agreement (the “Advisory Agreement”) with Columbia Management Investment Advisers, LLC (the “Investment Manager”) with respect to Columbia Small Cap Value Fund I (the “Fund”), a series of the Trust. As detailed below, the Advisory Fees and Expenses Committee (the “Committee”) and the Board met on multiple occasions to review and discuss, both among themselves and with the management team of the Investment Manager, materials provided by the Investment Manager before determining to approve the continuation of the Advisory Agreement.
In connection with their deliberations regarding the continuation of the Advisory Agreement, the Committee and the Board requested and evaluated materials from the Investment Manager regarding the Fund and the Advisory Agreement, and discussed these materials with representatives of the Investment Manager at the Committee meeting held on March 6, 2012 and at the Board meeting held on March 7, 2012. In addition, the Board considers matters bearing on the Agreement at most of its other meetings throughout the year and meets regularly with senior management of the Funds and the Investment Manager. Through the Board’s Investment Oversight Committees, Trustees also meet with selected Fund portfolio managers and other investment personnel at various times throughout the year. The Committee and the Board also consulted with Fund counsel and with the Independent Trustees’ independent legal counsel, who advised on the legal standard for consideration by the Board and otherwise assisted the Board in its deliberations. On March 6, 2012, the Committee recommended that the Board approve the continuation of the Advisory Agreement. On March 7, 2012, the Board, including the Independent Trustees, voting separately, unanimously approved the continuation of the Advisory Agreement for the Fund.
The Committee and the Board considered all information that they, their legal counsel, or the Investment Manager believed reasonably necessary to evaluate and to determine whether to approve the continuation of the Advisory Agreement. In their deliberations, the Trustees did not identify any particular information that was all-important or controlling, and individual Trustees may have attributed different weights to the various factors. The information and factors considered by the Committee and the Board in recommending for approval or approving the continuation of the Advisory Agreement for the Fund included the following:
| n | | Information on the investment performance of the Fund relative to the performance of the Fund’s benchmarks and the performance |
| | | of a group of comparable mutual funds, as determined by an independent third-party data provider; |
| n | | Information on the Fund’s advisory fees and total expenses, including information comparing the Fund’s expenses to those of a group of comparable mutual funds, as determined by an independent third-party data provider; |
| n | | The Investment Manager’s agreement to contractually limit or cap total operating expenses for the Fund so that total operating expenses (excluding certain fees and expenses, such as transaction costs and certain other investment related expenses, interest, taxes, acquired fund fees and expenses, and extraordinary expenses) would not exceed the median expenses of a group of comparable funds (as determined from time to time, generally annually, by an independent third-party data provider); |
| n | | The terms and conditions of the Advisory Agreement, including that the advisory fee rates payable by the Fund would not change; |
| n | | The terms and conditions of other agreements and arrangements with affiliates of the Investment Manager relating to the operations of the Fund, including the Administrative Services Agreement, the Distribution Agreement and the Transfer and Dividend Disbursing Agent Agreement, noting in the case of the Transfer and Dividend Disbursing Agent Agreement certain proposed changes to the fee rates payable thereunder; |
| n | | Descriptions of various functions performed by the Investment Manager under the Advisory Agreement, including portfolio management and portfolio trading practices; |
| n | | Information regarding the management fees and investment performance of any comparable portfolios of other clients of the Investment Manager, including institutional separate accounts; and |
| n | | The profitability to the Investment Manager and its affiliates from their relationships with the Fund. |
Nature, Extent and Quality of Services to be Provided under the Advisory Agreement
The Committee and the Board considered the nature, extent and quality of services provided to the Fund by the Investment Manager and its affiliates under the Advisory Agreement and under separate agreements for the provision of transfer agency and administrative services, and the resources dedicated to the Fund and the other Columbia Funds by the Investment Manager and its affiliates. The Committee and the Board considered, among other things, the
41
Investment Manager’s ability to attract, motivate and retain highly qualified research, advisory and supervisory investment professionals (including personnel and other resources, compensation programs for personnel involved in fund management, reputation and other attributes), the portfolio management services provided by those investment professionals, the quality of the Investment Manager’s investment research capabilities and trade execution services, and the other resources that the Investment Manager devotes to the Fund. The Committee and the Board also considered the potential benefits to shareholders of investing in a mutual fund that is part of a fund complex offering exposure to a variety of asset classes and investment disciplines and providing a variety of fund and shareholder services.
The Committee and the Board also considered the professional experience and qualifications of the senior personnel of the Investment Manager. The Committee and the Board noted the compliance programs of and the compliance-related resources provided to the Fund by the Investment Manager and its affiliates, and considered the Investment Manager’s ability to provide administrative services to the Fund pursuant to a separate administrative services agreement, including the Investment Manager’s ability to coordinate the activities of the Fund’s other service providers. After reviewing these and related factors, the Committee and the Board concluded, within the context of their overall conclusions, that the expected nature, extent and quality of the services to be provided to the Fund under the Advisory Agreement supported the continuation of such agreement.
Investment Performance
The Committee and the Board reviewed information about the performance of the Fund over various time periods, including performance information relative to benchmarks and information based on reports of an independent third-party data provider that compared the performance of the Fund to the performance of a group of comparable mutual funds. The Committee and the Board also reviewed a description of the third party’s methodology for identifying the Fund’s peer groups for purposes of performance and expense comparisons. In the case of each Fund whose performance lagged that of a relevant peer group for certain (although not necessarily all) periods, the Committee and the Board concluded that other factors relevant to performance were sufficient, in light of other considerations, to warrant continuation of the Fund’s Advisory Agreement. Those factors varied from fund to fund, but included one or more of the following: (i) that the Fund’s performance, although lagging in certain recent periods, was stronger over the longer term;
(ii) that the underperformance was attributable, to a significant extent, to investment decisions that were reasonable and consistent with the Fund’s investment strategy and policies and that the Fund was performing within a reasonable range of expectations, given those investment decisions, market conditions and the Fund’s investment strategy; (iii) that the Fund’s performance was competitive when compared to other relevant performance benchmarks or peer groups; and (iv) that the Investment Manager had taken or was taking steps designed to help improve the Fund’s investment performance, including, but not limited to, replacing portfolio managers, enhancing the resources supporting the portfolio managers, or modifying investment strategies.
The Committee and the Board noted that, through December 31, 2011, the Fund’s performance was in the sixty-ninth, eighty-fourth and forty-fifth percentiles (where the best performance would be in the first percentile) of its category selected by an independent third-party data provider for the purposes of performance comparisons for the one-, three- and five- year periods, respectively.
The Committee and the Board also considered the Investment Manager’s performance and reputation generally, the Investment Manager’s historical responsiveness to Board concerns about performance and the Investment Manager’s willingness to take steps intended to improve performance. After reviewing these and related factors, the Committee and the Board concluded, within the context of their overall conclusions regarding the Advisory Agreement, that the performance of the Fund and the Investment Manager was sufficient, in light of other considerations, to warrant the continuation of the Advisory Agreement.
Investment Advisory Fee Rates and Other Expenses
The Committee and the Board considered the advisory fees to be charged to the Fund under the Advisory Agreement as well as the total expenses to be incurred by the Fund. In assessing the reasonableness of the fees under the Advisory Agreement, the Committee and the Board considered, among other information, the Fund’s advisory fee and its expected total expense ratio as a percentage of average daily net assets. The Committee and the Board noted that the Fund’s actual management fee and total net expense ratio are ranked in the fourth and second quintiles, respectively, against the Fund’s expense universe as determined by an independent third-party data provider for purposes of expense comparison. The Committee and the Board also took into account the fee waiver and expense limitation arrangements agreed to by the Investment Manager, as noted above.
42
The Committee and the Board also considered the fact that the advisory fee rates payable by the Fund to the Investment Manager under the Advisory Agreement were the same as those currently paid by the Fund to the Investment Manager.
The Committee and the Board also received and considered information about the advisory fees charged by the Investment Manager to institutional separate accounts. In considering the fees charged to those accounts, the Committee and the Board took into account, among other things, the Investment Manager’s representations about the differences between managing mutual funds as compared to other types of accounts, including differences in the services provided, differences in the risk profile of such business for the Investment Manager and the additional resources required to manage mutual funds effectively. In evaluating the Fund’s advisory fees, the Committee and the Board also took into account the demands, complexity and quality of the investment management of the Fund.
After reviewing these and related factors, the Committee and the Board concluded, within the context of their overall conclusions, that the advisory fee rates and expenses of the Fund supported the continuation of the Advisory Agreement.
Costs of Services to be Provided and Profitability
The Committee and the Board also took note of the costs of the services provided (both on an absolute and relative basis) and the profitability to the Investment Manager and its affiliates in connection with their relationships with the Fund. In evaluating these considerations, the Committee and the Board took note of the advisory fees charged by the Investment Manager to other clients, including fees charged by the Investment Manager to any institutional separate account clients with similar investment strategies to those of the Fund.
The Committee and the Board also considered the compensation directly or indirectly received by the Investment Manager’s affiliates in connection with their relationships with the Fund. The Committee and the Board reviewed information provided by management as to the profitability of the Investment Manager and its affiliates of their relationships with the Fund, and information about the allocation of expenses used to calculate profitability. When reviewing profitability, the Committee and the Board also considered court cases in which adviser profitability was an issue in whole or in part, the performance of the fund, the expense ratio of the fund, and the implementation of expense limitations with respect to the fund. The
Committee and the Board also considered information provided by the Investment Manager regarding its financial condition and comparing its profitability to that of other asset management firms that are, or are subsidiaries of, publicly traded companies.
After reviewing these and related factors, the Committee and the Board concluded, within the context of their overall conclusions, that the profitability to the Investment Manager and its affiliates from their relationships with the Fund supported the continuation of the Advisory Agreement.
Economies of Scale
The Committee and the Board considered the potential existence of economies of scale in the provision by the Investment Manager of services to the Fund, to groups of related funds, and to the Investment Manager’s investment advisory clients as a whole, and whether those economies of scale were shared with the Fund through breakpoints in investment advisory fees or other means, such as expense limitation arrangements and additional investments by the Investment Manager in investment, trading and compliance resources. The Committee and the Board noted that the investment advisory fee schedules for the Fund contained breakpoints that would reduce the fee rate on assets above specified threshold levels.
In considering these issues, the Committee and the Board also considered the costs of the services provided (both on an absolute and relative basis) and the profitability to the Investment Manager and its affiliates from their relationships with the Fund, as discussed above. After reviewing these and related factors, the Committee and the Board concluded, within the context of their overall conclusions, that the extent to which economies of scale were expected to be shared with the Fund supported the continuation of the Advisory Agreement.
Other Benefits to the Investment Manager
The Committee and the Board received and considered information regarding “fall-out” or ancillary benefits received by the Investment Manager and its affiliates as a result of their relationships with the Fund, such as the engagement of the Investment Manager to provide administrative services to the Fund and the engagement of the Investment Manager’s affiliates to provide distribution and transfer agency services to the Fund. The Committee and the Board considered that the Fund’s distributor retains a portion of the distribution fees from the Fund and receives a portion of the sales charges on sales or redemptions of certain classes of shares of the Fund. The Committee and the Board also considered the benefits of research made available to the Investment Manager by reason of
43
brokerage commissions generated by the Fund’s securities transactions, and reviewed information about the Investment Manager’s practices with respect to allocating portfolio brokerage for brokerage and research services. The Committee and the Board considered the possible conflicts of interest associated with certain fall-out or other ancillary benefits and the reporting, disclosure and other processes that would be in place to address such possible conflicts of interest. The Committee and the Board recognized that the Investment Manager’s profitability would be somewhat lower without these benefits.
Conclusion
The Committee and the Board reviewed all of the above considerations in reaching their decisions to recommend or approve the continuation of the Advisory Agreement. No single item was identified as paramount or controlling, and individual Trustees may have attributed different weights to various factors. Based on their evaluation of all factors that they deemed to be material, including those factors described above, and assisted by the advice of independent legal counsel, the Board, including the Independent Trustees, voting separately, unanimously approved the continuation of the Advisory Agreement.
44
Important Information About This Report
The fund mails one shareholder report to each shareholder address. If you would like more than one report, please call shareholder services at 1-800-345-6611 and additional reports will be sent to you. This report has been prepared for shareholders of Columbia Small Cap Value Fund I.
A description of the policies and procedures that the fund uses to determine how to vote proxies and a copy of the fund’s voting records are available (i) at www.columbiamanagement.com, (ii) on the Securities and Exchange Commission’s website at www.sec.gov, and (iii) without charge, upon request, by calling 1-800-368-0346. Information regarding how the fund voted proxies relating to portfolio securities during the 12-month period ended June 30 is available from the SEC’s website. Information regarding how the fund voted proxies relating to portfolio securities is also available from the fund’s website, www.columbiamanagement.com.
The fund files a complete schedule of portfolio holdings with the SEC for the first and third quarters of each fiscal year on Form N-Q. The fund’s Form N-Q is available on the SEC’s website at www.sec.gov and may be reviewed and copied at the SEC’s Public Reference Room in Washington, D.C. Information on the operation of the Public Reference Room may be obtained by calling
1-800-SEC-0330.
Transfer Agent
Columbia Management Investment Services Corp.
P.O. Box 8081
Boston, MA 02266-8081
1-800-345-6611
Distributor
Columbia Management Investment
Distributors, Inc.
225 Franklin Street Boston, MA 02110
Investment Manager
Columbia Management Investment Advisers, LLC
225 Franklin Street Boston, MA 02110
45

Columbia Small Cap Value Fund I
P.O. Box 8081
Boston, MA 02266-8081
columbiamanagement.com
This information is for use with concurrent or prior delivery of a fund prospectus. Investors should consider the investment objectives, risks, charges and expenses of a mutual fund carefully before investing. For a free prospectus, which contains this and other important information about the funds, visit columbiamanagement.com. Read the prospectus carefully before investing. The Fund is distributed by Columbia Management Investment Distributors, Inc., member FINRA, and managed by Columbia Management Investment Advisers, LLC.
©2012 Columbia Management Investment Advisers, LLC. All rights reserved.
C-1361 D (6/12)
Item 2. Code of Ethics.
| | (a) | The registrant has adopted a code of ethics that applies to the registrant’s principal executive officer, principal financial officer, principal accounting officer or controller, or persons performing similar functions, regardless of whether these individuals are employed by the registrant or a third party. |
| | (b) | During the period covered by this report, there were not any amendments to a provision of the code of ethics adopted in 2(a) above. |
| | (c) | During the period covered by this report, there were no waivers, including any implicit waivers, from a provision of the code of ethics described in 2(a) above that relates to one or more of the items set forth in paragraph (b) of this item’s instructions. |
Item 3. Audit Committee Financial Expert.
The registrant’s Board of Trustees has determined that Douglas A. Hacker, David M. Moffett and Anne-Lee Verville, each of whom are members of the registrant’s Board of Trustees and Audit Committee, each qualify as an audit committee financial expert. Mr. Hacker, Mr. Moffett and Ms. Verville are each independent trustees, as defined in paragraph (a)(2) of this item’s instructions.
Item 4. Principal Accountant Fees and Services.
Fee information below is disclosed for the one series of the registrant whose report to stockholders is included in this annual filing. The series changed its fiscal year end from June 30 to April 30, effective April 30, 2012. The fees presented for 2012 represent the ten month period ended April 30, 2012. The fees presented for 2011 represent the fiscal year ended June 30, 2011.
(a) Audit Fees. Aggregate Audit Fees billed by the principal accountant for professional services rendered during the period ended April 30, 2012 and the fiscal year ended June 30, 2011 are approximately as follows:
| | | | | | |
| 2012 | | | 2011 | |
| $ | 30,900 | | | $ | 32,100 | |
Audit Fees include amounts related to the audit of the registrant’s annual financial statements or services that are normally provided by the accountant in connection with statutory and regulatory filings or engagements for those fiscal years. Fiscal year 2011 also includes audit fees for the review and provision of consent in connection with filing Form N-1A for new share classes.
(b) Audit-Related Fees. Aggregate Audit-Related Fees billed to the registrant by the principal accountant for professional services rendered during the period ended April 30, 2012 and the fiscal year ended June 30, 2011 are approximately as follows:
Audit-Related Fees include amounts for assurance and related services by the principal accountant that are reasonably related to the performance of the audit of the registrant’s financial statements and are not reported in Audit Fees above. In both fiscal years 2012 and 2011, Audit-Related Fees consist of agreed-upon procedures performed for semi-annual shareholder reports. Fiscal year 2011 also includes Audit-Related Fees for agreed-upon procedures related to fund mergers and fund accounting and custody conversions.
During the period ended April 30, 2012 and the fiscal year ended June 30, 2011, there were no Audit-Related Fees billed by the registrant’s principal accountant to the registrant’s investment adviser (not including any sub-adviser whose role is primarily portfolio management and is subcontracted with or overseen by another investment adviser) and any entity controlling, controlled by, or under common control with the adviser that provides ongoing services to the registrant for an engagement that related directly to the operations and financial reporting of the registrant.
(c) Tax Fees. Aggregate Tax Fees billed by the principal accountant to the registrant for professional services rendered during the period ended April 30, 2012 and the fiscal year ended June 30, 2011 are approximately as follows:
Tax Fees include amounts for the review of annual tax returns, the review of required shareholder distribution calculations and typically include amounts for professional services by the principal accountant for tax compliance, tax advice and tax planning.
During the period ended April 30, 2012 and the fiscal year ended June 30, 2011, there were no Tax Fees billed by the registrant’s principal accountant to the registrant’s investment adviser (not including any sub-adviser whose role is primarily portfolio management and is subcontracted with or overseen by another investment adviser) and any entity controlling, controlled by, or under common control with the adviser that provides ongoing services to the registrant for an engagement that related directly to the operations and financial reporting of the registrant.
(d) All Other Fees. Aggregate All Other Fees billed by the principal accountant to the registrant for professional services rendered during the period ended April 30, 2012 and the fiscal year ended June 30, 2011 are approximately as follows:
All Other Fees include amounts for products and services provided by the principal accountant, other than the services reported in paragraphs (a) through (c) above.
Aggregate All Other Fees billed by the registrant’s principal accountant to the registrant’s investment adviser (not including any sub-adviser whose role is primarily portfolio management and is subcontracted with or overseen by another investment adviser) and any entity controlling, controlled by, or under common control with the adviser that provides ongoing services to the registrant for an engagement that related directly to the operations and financial reporting of the registrant during the period ended April 30, 2012 and the fiscal year ended June 30, 2011 are approximately as follows:
| | | | | | |
| 2012 | | | 2011 | |
| $ | 395,800 | | | $ | 495,300 | |
In both fiscal years 2012 and 2011, All Other Fees consist of fees billed for internal control examinations of the registrant’s transfer agent and investment advisor.
(e)(1) Audit Committee Pre-Approval Policies and Procedures
The registrant’s Audit Committee is required to pre-approve the engagement of the registrant’s independent accountants to provide audit and non-audit services to the registrant and non-audit services to its investment adviser (not including any sub-adviser whose role is primarily portfolio management and is subcontracted with or overseen by another investment adviser) or any entity controlling, controlled by or under common control with such investment adviser that provides ongoing services to the registrant (“Adviser Affiliates”), if the engagement relates directly to the operations and financial reporting of the registrant.
The Audit Committee has adopted a Policy for Engagement of Independent Accountants for Audit and Non-Audit Services (“Policy”). The Policy sets forth the understanding of the Audit Committee regarding the engagement of the registrant’s independent accountants to provide (i) audit and permissible audit-related, tax and other services to the registrant (collectively “Fund Services”); (ii) non-audit services to the registrant’s investment adviser (not including any sub-adviser whose role is primarily portfolio management and is subcontracted with or overseen by another investment adviser) and Adviser Affiliates, if the engagement relates directly to the operations or financial reporting of a Fund (collectively “Fund-related Adviser Services”); and (iii) certain other audit and non-audit services to the registrant’s investment adviser (not including any sub-adviser whose role is primarily portfolio management and is subcontracted with or overseen by another investment adviser) and Adviser Affiliates. As set forth in this Fund Policy, a service will require specific pre-approval by the Audit Committee if it is to be provided by the Fund’s independent auditor; provided, however, that pre-approval of non-audit services to the Fund, the Adviser or Control Affiliates may be waived if certain de minimis requirements set forth in the SEC’s rules are met.
Under the Policy, the Audit Committee may delegate pre-approval authority to any pre-designated member or members who are Independent Trustees/Directors. The member(s) to whom such authority is delegated must report, for informational purposes only, any pre-approval decisions to the Audit Committee at its next regular meeting. The Audit Committee’s responsibilities with respect to the pre-approval of services performed by the independent accountants may not be delegated to management.
On an annual basis, at a regularly scheduled Audit Committee meeting, the Fund’s Treasurer or other Fund Officer shall submit to the Audit Committee a schedule of the types of Fund Services and Fund-related Adviser Services that are subject to specific pre-approval.
This schedule will provide a description of each type of service that is subject to specific pre-approval, along with total projected fees for each service. The pre-approval will generally cover a one-year period. The Audit Committee will review and approve the types of services and the projected fees for the next one-year period and may add to, or subtract from, the list of pre-approved services from time to time, based on subsequent determinations. This specific approval acknowledges that the Audit Committee is in agreement with the types of services that the independent accountants will be permitted to perform.
The Fund’s Treasurer or other Fund Officer shall report to the Audit Committee at each of its regular meetings regarding all Fund Services or Fund-related Adviser Services initiated since the last such report was rendered, including a general description of the services with forecasted fees for the annual period, proposed changes requiring specific pre-approval and a description of services provided by the independent auditor with actual fees during the current reporting period.
*****
(e)(2) The percentage of services described in paragraphs (b) through (d) of this Item approved pursuant to the “de minimis” exception under paragraph (c)(7)(i)(C) of Rule 2-01 of Regulation S-X during the period ended April 30, 2012 and the fiscal year ended June 30, 2011 was zero.
(f) Not applicable.
(g) The aggregate non-audit fees billed by the registrant’s accountant for services rendered to the registrant, and rendered to the registrant’s investment adviser (not including any sub-adviser whose role is primarily portfolio management and is subcontracted with or overseen by another investment adviser), and any entity controlling, controlled by, or under common control with the adviser that provides ongoing services to the registrant for the period ended April 30, 2012 and the fiscal year ended June 30, 2011 are approximately as follows:
| | | | | | |
| 2012 | | | 2011 | |
| $ | 406,400 | | | $ | 516,300 | |
(h) The registrant’s Audit Committee of the Board of Directors has considered whether the provision of non-audit services that were rendered to the registrant’s adviser (not including any sub-adviser whose role is primarily portfolio management and is subcontracted with or overseen by another investment adviser), and any entity controlling, controlled by, or under common control with the investment adviser that provides ongoing services to the registrant that were not pre-approved pursuant to paragraph (c)(7)(ii) of Rule 2-01 of Regulation S-X, is compatible with maintaining the principal accountant’s independence.
Item 5. Audit Committee of Listed Registrants.
Not applicable.
Item 6. Investments
| | (a) | The registrant’s “Schedule I – Investments in securities of unaffiliated issuers” (as set forth in 17 CFR 210.12-12) is included in Item 1 of this Form N-CSR. |
Item 7. Disclosure of Proxy Voting Policies and Procedures for Closed-End Management Investment Companies.
Not applicable.
Item 8. Portfolio Managers of Closed-End Management Investment Companies.
Not applicable.
Item 9. Purchases of Equity Securities by Closed-End Management Investment Company and Affiliated Purchasers.
Not applicable.
Item 10. Submission of Matters to a Vote of Security Holders.
There were no material changes to the procedures by which shareholders may recommend nominees to the registrant’s board of directors.
Item 11. Controls and Procedures.
| | (a) | The registrant’s principal executive officer and principal financial officers, based on their evaluation of the registrant’s disclosure controls and procedures as of a date within 90 days of the filing of this report, have concluded that such controls and procedures are adequately designed to ensure that material information required to be disclosed by the registrant in Form N-CSR is accumulated and communicated to the registrant’s management, including the principal executive officer and principal financial officer, or persons performing similar functions, as appropriate to allow timely decisions regarding required disclosure. |
| | (b) | There was no change in the registrant’s internal control over financial reporting that occurred during the registrant’s second fiscal quarter of the period covered by this report that has materially affected, or is reasonably likely to materially affect, the registrant’s internal control over financial reporting. |
Item 12. Exhibits.
(a)(1) Code of ethics required to be disclosed under Item 2 of Form N-CSR attached hereto as Exhibit 99.CODE ETH.
(a)(2) Certifications pursuant to Rule 30a-2(a) under the Investment Company Act of 1940 (17 CFR 270.30a-2(a)) attached hereto as Exhibit 99.CERT.
(a)(3) Not applicable.
(b) Certification pursuant to Rule 30a-2(b) under the Investment Company Act of 1940 (17 CFR 270.30a-2(b)) attached hereto as Exhibit 99.906CERT.
SIGNATURES
Pursuant to the requirements of the Securities Exchange Act of 1934 and the Investment Company Act of 1940, the registrant has duly caused this report to be signed on its behalf by the undersigned, thereunto duly authorized.
| | | | | | |
| (registrant) | | | | Columbia Funds Series Trust I |
| |
| By (Signature and Title) | | /s/ J. Kevin Connaughton |
| | | | | | J. Kevin Connaughton, President and Principal Executive Officer |
| | | |
| Date | | | | | | June 22, 2012 |
Pursuant to the requirements of the Securities Exchange Act of 1934 and the Investment Company Act of 1940, this report has been signed below by the following persons on behalf of the registrant and in the capacities and on the dates indicated.
| | | | |
| By (Signature and Title) | | /s/ J. Kevin Connaughton |
| | | | J. Kevin Connaughton, President and Principal Executive Officer |
| | |
| Date | | | | June 22, 2012 |
| |
| By (Signature and Title) | | /s/ Michael G. Clarke |
| | | | Michael G. Clarke,
Treasurer and Chief Financial Officer |
| | |
| Date | | | | June 22, 2012 |
