Exhibit (17)(b)(i)


| | A n n u a l R e p o r t S e p t e m b e r 3 0 , 2 0 0 7 |
EATON VANCE
MUNICIPALS
TRUST |
California
Florida
Massachusetts
Mississippi
New York
Ohio
Rhode Island
West Virginia |
| | IMPORTANT NOTICES REGARDING PRIVACY,
DELIVERY OF SHAREHOLDER DOCUMENTS,
PORTFOLIO HOLDINGS AND PROXY VOTING |
Privacy. The Eaton Vance organization is committed to ensuring your financial privacy. Each of the financial institutions identified below has in effect the following policy (“Privacy Policy”) with respect to nonpublic personal information about its customers:
- Only such information received from you, through application forms or otherwise, and information about your Eaton Vance fund transactions will be collected. This may include information such as name, address, social security number, tax status, account balances and transactions.
- None of such information about you (or former customers) will be disclosed to anyone, except as permitted by law (which includes disclosure to employees necessary to service your account). In the normal course of servicing a customer’s account, Eaton Vance may share information with unaffiliated third parties that perform various required services such as transfer agents, custodians and broker/dealers.
- Policies and procedures (including physical, electronic and procedural safeguards) are in place that are designed to protect the confidentiality of such information.
- We reserve the right to change our Privacy Policy at any time upon proper notification to you. Customers may want to review our Policy periodically for changes by accessing the link on our homepage: www.eatonvance.com.
Our pledge of privacy applies to the following entities within the Eaton Vance organization: the Eaton Vance Family of Funds, Eaton Vance Management, Eaton Vance Investment Counsel, Boston Management and Research, and Eaton Vance Distributors, Inc.
In addition, our Privacy Policy only applies to those Eaton Vance customers who are individuals and who have a direct relationship with us. If a customer’s account (i.e., fund shares) is held in the name of a third-party financial adviser/ broker-dealer, it is likely that only such adviser’s privacy policies apply to the customer. This notice supersedes all previously issued privacy disclosures.
| For more information about Eaton Vance’s Privacy Policy, please call 1-800-262-1122. |
Delivery of Shareholder Documents. The Securities and Exchange Commission (the “SEC”) permits funds to deliver only one copy of shareholder documents, including prospectuses, proxy statements and shareholder reports, to fund investors with multiple accounts at the same residential or post office box address. This practice is often called “householding” and it helps eliminate duplicate mailings to shareholders.
Eaton Vance, or your financial adviser, may household the mailing of your documents indefinitely unless you instruct Eaton Vance, or your financial adviser, otherwise.
If you would prefer that your Eaton Vance documents not be householded, please contact Eaton Vance at 1-800-262-1122, or contact your financial adviser.
Your instructions that householding not apply to delivery of your Eaton Vance documents will be effective within 30 days of receipt by Eaton Vance or your financial adviser.
Portfolio Holdings. Each Eaton Vance Fund and its underlying Portfolio (if applicable) will file a schedule of its portfolio holdings on Form N-Q with the SEC for the first and third quarters of each fiscal year. The Form N-Q will be available on the Eaton Vance website www.eatonvance.com, by calling Eaton Vance at 1-800-262-1122 or in the EDGAR database on the SEC’s website at www.sec.gov. Form N-Q may also be reviewed and copied at the SEC’s public reference room in Washington, D.C. (call 1-800-732-0330 for information on the operation of the public reference room).
Proxy Voting. From time to time, funds are required to vote proxies related to the securities held by the funds. The Eaton Vance Funds or their underlying Portfolios (if applicable) vote proxies according to a set of policies and procedures approved by the Funds’ and Portfolios’ Boards. You may obtain a description of these policies and procedures and information on how the Funds or Portfolios voted proxies relating to portfolio securities during the 12 month period ended June 30, without charge, upon request, by calling 1-800-262-1122. This description is also available on the SEC’s website at www.sec.gov.
Eaton Vance Municipals Funds a s o f S e p t e m b e r 3 0 , 2 0 0 7
T A B L E O F C O N T E N T S
| Management's Discussion of Fund Performance | | 2 |
| |
| Morningstar RatingsTM | | 3 |
| |
| Performance Information and Portfolio Composition | | |
| California | | 4 |
| Florida | | 6 |
| Massachusetts | | 8 |
| Mississippi | | 10 |
| New York | | 12 |
| Ohio | | 14 |
| Rhode Island | | 16 |
| West Virginia | | 18 |
| |
| Fund Expenses | | 20 |
| |
| Financial Statements | | 25 |
| |
| Federal Tax Information. | | 97 |
| |
| Board of Trustees' Annual Approval | | |
| of the Investment Advisory Agreements | | 98 |
| |
| Management and Organization | | 101 |
1
Eaton Vance Municipals Funds a s o f S e p t e m b e r 3 0 , 2 0 0 7
M A N A G E M E N T ' S D I S C U S S I O N O F F U N D P E R F O R M A N C E |
The investment objective of each Eaton Vance Municipals Fund (the "Fund" or "Funds") is to provide current income exempt from regular federal income tax and particular state or local income or other taxes, as applicable. The Funds primarily invest in investment-grade municipal obligations but may also invest in lower-rated obligations.
Economic and Market Conditions
Third quarter economic growth rose 3.1%, following the 3.8% growth rate achieved in the second quarter of 2007, according to preliminary Commerce Department data. During the third quarter ended September 30, 2007, the housing sector continued to struggle, as market concerns related to subprime mortgages caused a number of mortgage lenders to file for bankruptcy protection and others to limit new mortgage originations. Building permits and housing starts have both fallen significantly from their highs in early 2006, while sales of new and existing homes are down from their 2005 peaks. However, the weaker dollar is having a stimula-tive effect on economic growth in export-related indus-tries and on U.S.-based multinational companies whose foreign profits are translated into more dollars. Overa ll, we believe the economy appears to be slowing, but in a somewhat controlled manner.
According to the Federal Reserve’s (the “Fed”) preferred inflation indicator, the Personal Consumption Expenditure (PCE) price deflator, both absolute and core (excludes food and energy) inflation is fairly well contained within the upper end of the Fed’s comfort zone. In an unscheduled August 17, 2007 meeting, the Fed lowered its Discount Rate – the rate charged to banks borrowing directly from the Fed – to 5.75% from 6.25%. The move was aimed at providing liquidity dur-ing a period of increased uncerta inty and tighter credit conditions that surfaced rapidly in mid-August. On September 18, 2007, the Fed lowered its Federal Funds Rate to 4.75% from 5.25% – its first rate cut since the Fed stopped raising rates in June 2006 – and lowered the Discount Ra te again to 5.25% from 5.75%.
Municipal market supply rose to record levels in the first half of 2007, resulting in underperformance of the municipal sector. On September 30, 2007, long-term AAA-rated municipal bonds yielded 93.9% of U.S. Treasury bonds with similar maturities.1
For the year ended September 30, 2007, the Lehman Brothers Municipal Bond Index2 (the “Index”), an unmanaged index of municipal bonds, posted a gain of 3.10%. For more information about each Fund’s performance and that of funds in the same Lipper Classification,2 see the Performance Information and Portfolio Composition pages that follow.
Management Discussion
The Funds invest primarily in bonds with stated maturi-ties of 10 years or longer, as longer-maturity bonds historically have provided greater tax-exempt income for investors than shorter-maturity bonds.
The Funds underperformed their benchmark Index during the year ended September 30, 2007. Much of the underperformance can be attributed to the broader-based credit scare that took hold of the fixed-income markets in late August 2007. Yields on some municipal bonds reached 105% of U.S. Treasury yields. We believe th at the ratio was not the result of any fundamental problems within the municipal market, but rather reflected the extreme dislocation in the fixed-income marketplace caused by the subprime fears, hedge fund problems, the decentralized municipal marketplace and illiquidity across a range of markets. The Funds’ exposure to more liquid, higher-credit quality bonds actually hurt performance as hedge funds and other non-tradi-tional municipal market participants sold large positions of their most liquid bonds in order to raise cash.
Historically, there have been only a few instances of municipals trading at the cheap levels seen in August 2007, and it has generally been a short-term phenomenon. During September 2007, municipals outperformed Treasury bonds, as municipal yields reverted to their more historic relationship to Treasuries. Overall, liquidity has returned to the fixed-income marketplace, with a more rational view of the market and risk assessment.
1 Source: Bloomberg L.P. Yields are a compilation of a representative variety of general obligations and are not necessarily representative of a Fund’s yield.
2 It is not possible to invest directly in an Index or a Lipper Classification. The Index’s total return does not reflect expenses that would have been incurred if an investor individually purchased or sold the securities represented in the Index. Past performance is no guarantee of future results.
Fund shares are not insured by the FDIC and are not deposits or other obligations of, or guaranteed by, any depository institution. Shares are subject to investment risks, including possible loss of principal invested.
The views expressed throughout this report are those of the portfolio managers and are current only through the end of the period of the report as stated on the cover. These views are subject to change at any time based upon market or other conditions, and the investment adviser disclaims any responsibility to update such views. These views may not be relied on as investment advice and, because investment decisions for a fund are based on many factors, may not be relied on as an indication of trading intent on behalf of any Eaton Vance fund.
2
Eaton Vance Municipals Funds a s o f S e p t e m b e r 3 0 , 2 0 0 7
M O R N I N G S T A R R A T I N G S TM |
| As of September 30, 2007 | | | | | | | | |
| FUND | | OVERALL | | 3-YEARR | | 5-YEAR | | 10-YEAR |
| CALIFORNIA MUNICIPALS FUND – CLASS A | | *** | | *** | | *** | | *** |
| Load waived | | **** | | ***** | | **** | | **** |
| MUNI CALIFORNIA LONG CATEGORY | | 151 FUNDS | | 151 FUNDS | | 141 FUNDS | | 116 FUNDS |
| FLORIDA MUNICIPALS FUND – CLASS A | | **** | | *** | | *** | | **** |
| Load waived | | ***** | | ***** | | ***** | | ***** |
| MUNI FLORIDA CATEGORY | | 49 FUNDS | | 49 FUNDS | | 49 FUNDS | | 46 FUNDS |
| MASSACHUSETTS MUNICIPALS FUND – CLASS A | | **** | | *** | | **** | | **** |
| Load waived | | ***** | | ***** | | ***** | | ***** |
| MUNI MASSACHUSETTS CATEGORY | | 80 FUNDS | | 80 FUNDS | | 75 FUNDS | | 65 FUNDS |
| MISSISSIPPI MUNICIPALS FUND – CLASS A | | *** | | *** | | *** | | *** |
| Load waived | | **** | | **** | | **** | | **** |
| MUNI SINGLE STATE LONG CATEGORY | | 319 FUNDS | | 319 FUNDS | | 318 FUNDS | | 276 FUNDS |
| NEW YORK MUNICIPALS FUND – CLASS A | | *** | | *** | | *** | | **** |
| Load waived | | ***** | | **** | | ***** | | ***** |
| MUNI NEW YORK LONG CATEGORY | | 108 FUNDS | | 108 FUNDS | | 103 FUNDS | | 85 FUNDS |
| OHIO MUNICIPALS FUND – CLASS A | | **** | | **** | | ***** | | **** |
| Load waived | | ***** | | ***** | | ***** | | ***** |
| MUNI OHIO CATEGORY | | 74 FUNDS | | 74 FUNDS | | 73 FUNDS | | 61 FUNDS |
| RHODE ISLAND MUNICIPALS FUND – CLASS A | | **** | | *** | | **** | | **** |
| Load waived | | ***** | | ***** | | ***** | | ***** |
| MUNI SINGLE STATE LONG CATEGORY | | 319 FUNDS | | 319 FUNDS | | 318 FUNDS | | 276 FUNDS |
| WEST VIRGINIA MUNICIPALS FUND – CLASS A | | *** | | *** | | *** | | *** |
| Load waived | | **** | | ***** | | **** | | **** |
| MUNI SINGLE STATE LONG CATEGORY | | 319 FUNDS | | 319 FUNDS | | 318 FUNDS | | 276 FUNDS |
Based on risk-adjusted returns. Eaton Vance offers other mutual funds that are not listed here and that do not have similar performance records.
The Overall Morningstar Rating™ for a fund is derived from a weighted average of the performance figures associated with its 3-, 5- and 10-year (if applicable) Morningstar Rating™ metrics.
©2007 Morningstar, Inc. All Rights Reserved. The information contained herein: (1) is proprietary to Morningstar and/or its content providers; (2) may not be copied or distributed; and (3) is not warranted to be accurate, complete or timely. Neither Morningstar nor its content providers is responsible for any damages or losses arising from any use of this information. Past performance is no guarantee of future results. For each fund with at least a three-year history, Morningstar calculates a Morningstar Rating™ based on how a fund ranks on a Morningstar Risk-Adjusted Return measure against other funds in the same category. This measure takes into account variations in a fund’s monthly performance after adjusting for sales loads (except for load-waived A shares), redemption fees, and the risk-free rate, placing more emphasis on downward variations and rewarding consistent performance. The top 10% of funds in each category receive 5 stars; the next 22.5% receive 4 sta rs; the next 35% receive 3 stars; the next 22.5% receive 2 stars, and the bottom 10% receive 1 star.
Load-waived A share star ratings do not include any front-end sales load and are intended for those investors who have access to such purchase terms (e.g., plan participants of a defined contribution plan). Not all A share mutual funds for which Morningstar calculates a load-waived A share star rating may actually waive their front-end load. Therefore, Morningstar strongly encourages investors to contact their investment professional to determine whether they are eligible to purchase the A share without paying the front load. The Morningstar Rating may differ among share classes of a mutual fund as a result of different sales loads and/or expense structure.
As interest rates rise, the value of fi xed-income securities is likely to decrease. Fluctuations in the value of securities may not affect interest income on existing securities, but will be refl ected in the funds’ net asset values. For state municipal funds, a portion of income may be subject to federal, state and local tax; a portion may be subject to federal alternative minimum tax. Please see the fund’s prospectus for more information. Consult tax/legal advisor before making any tax-related investment decisions.
For information regarding each Fund’s performance, please refer to pages titled “Performance Information and Portfolio Composition” contained in this report.
3
Eaton Vance California Municipals Fund a s o f S e p t e m b e r 3 0 , 2 0 0 7
P E R F O R M A N C E I N F O R M A T I O N A N D P O R T F O L I O C O M P O S I T I O N |
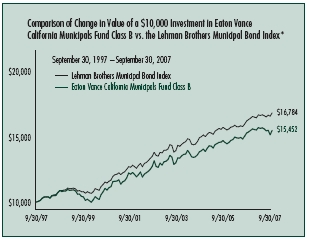
The line graph and table set forth below provide information about the Fund’s performance. The line graph compares the performance of Class B of the Fund with that of the Lehman Brothers Municipal Bond Index, an unmanaged index of municipal bonds. The lines on the graph represent the total returns of a hypothetical investment of $10,000 in each of Class B and the Lehman Brothers Municipal Bond Index. The table includes the total returns of each Class of the Fund at net asset value and maximum public offering price. The performance presented below does not reflect the deduction of taxes, if any, that a shareholder would pay on distributions or redemptions of Fund shares.
| Fund Performance1 as of 9/30/07 | | Class A | | Class B | | Class C |
| Share Class Symbol | | EACAX | | EVCAX | | ECCAX |
| Average Annual Total Returns (at net asset value) | | | | | | |
| One Year | | 1.61% | | 0.73% | | 0.83% |
| Five Years | | 3.86 | | 3.31 | | N.A. |
| Ten Years | | 4.91 | | 4.45 | | N.A. |
| Life of Fund† | | 5.87 | | 5.64 | | 3.73 |
| SEC Average Annual Total Returns (including sales charge or applicable CDSC) | | |
| One Year | | -3.19% | | -4.05% | | -0.13% |
| Five Years | | 2.86 | | 2.97 | | N.A. |
| Ten Years | | 4.40 | | 4.45 | | N.A. |
| Life of Fund† | | 5.48 | | 5.64 | | 3.73 |
| † Inception date: Class A: 5/27/94; Class B: 12/19/85; Class C: 8/31/04 | | |
| Total Annual | | | | | | |
| Operating Expenses2 | | Class A | | Class B | | Class C |
| Expense Ratio | | 1.23% | | 1.98% | | 1.98% |
| |
| Distribution Rates/Yields | | Class A | | Class B | | Class C |
| |
| Distribution Rate3 | | 4.24% | | 3.48% | | 3.48% |
| Taxable-Equivalent Distribution Rate3,4 | | 7.19 | | 5.90 | | 5.90 |
| SEC 30-day Yield5 | | 3.80 | | 3.25 | | 3.25 |
| Taxable-Equivalent SEC 30-day Yield4,5 | | 6.45 | | 5.51 | | 5.51 |
| Index Performance6 | | | | | | |
| Lehman Brothers Municipal Bond Index – Average Annual Total Returns | | | | |
| One Year | | 3.10% | | |
| Five Years | | 4.02 | | |
| Ten Years | | 5.32 | | |
| |
| Lipper Averages7 | | | | | | |
| Lipper California Municipal Debt Funds Classification – Average Annual Total Returns | | |
| One Year | | 1.47% | | |
| Five Years | | 3.38 | | |
| Ten Years | | 4.53 | | |
Portfolio Manager: Cynthia J. Clemson
*Sources: Thomson Financial; Lipper, Inc.
A $10,000 hypothetical investment at net asset value in Class A and Class C on 9/30/97 and 8/31/04 (commencement of operations), respectively, would have been valued at $16,154 ($15,387 at the maximum offering price) and $11,161, respectively, on 9/30/07. It is not possible to invest directly in an Index. The Index’s total return does not reflect the expenses that would have been incurred if an investor individually purchased or sold the securities represented in the Index.
Past performance is no guarantee of future results. Returns are historical and are calculated by determining the percentage change in net asset value or offering price (as applicable) with all distributions reinvested. Investment return and principal value will fluctuate so that shares, when redeemed, may be worth more or less than their original cost. Performance is for the stated time period only; due to market volatility, the Fund’s current performance may be lower or higher than the quoted return. For performance as of the most recent month end, please refer to www.eatonvance.com.
1 Average annual total returns do not include the 4.75% maximum sales charge for Class A shares or the applicable contingent deferred sales charges (CDSC) for Class B and Class C shares. If sales charges were deducted, returns would be lower. SEC Average Annual Total Returns for Class A reflect the maximum 4.75% sales charge. SEC Average Annual Total Returns for Class B reflect the applicable CDSC based on the following schedule: 5% - 1st and 2nd years; 4% - 3rd year; 3% - 4th year; 2% - 5th year; 1% - 6th year. SEC Average Annual Total Returns for Class C reflect a 1% CDSC for the first year. 2 Source: Prospectus dated 2/1/07, as revised 6/27/07. Includes interest expense of 0.37% relating to the Fund's liability with respect to floating-rate notes held by third parties in conjunction with inverse floater securities transactions by the Fund. The Fund also records offsetting in terest income relating to the municipal obligations underlying such transactions, and, as a result, net asset value and performance have not been affected by this expense. 3 The Fund's distribution rate represents actual distributions paid to shareholders and is calculated by dividing the last distribution per share (annualized) by the net asset value. 4 Taxable-equivalent figures assume a maximum 41.05% combined federal and state income tax rate. A lower tax rate would result in lower taxable-equivalent figures. 5 The Fund's SEC yield is calculated by dividing the net investment income per share for the 30-day period by the offering price at the end of the period and annualizing the result. 6 It is not possible to invest directly in an Index. The Index 's total return does not reflect the expenses that would have been incurred if an investor individually purchased or sold the securities represented in the Index. Index performance is available as of month end only. 7 The Lipper Averages are the average annual total returns, at net asset value, of the funds that are in the same Lipper Classification as the Fund. It is not possible to invest in a Lipper Classification. Lipper Classifications may include insured and uninsured funds, as well as leveraged and unleveraged funds. The Lipper California Municipal Debt Funds Classification contained 117, 97 and 71 funds for the 1-year, 5-year and 10-year periods, respectively. Lipper Averages are available as of month end only.
4
Eaton Vance California Municipals Fund a s o f S e p t e m b e r 3 0 , 2 0 0 7
P E R F O R M A N C E I N F O R M A T I O N A N D P O R T F O L I O C O M P O S I T I O N |
Rating Distribution*1,2
By total investments |
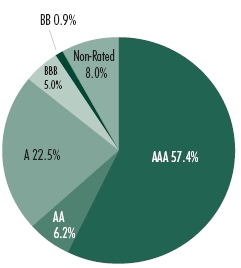
*The rating distribution presented above includes the ratings of securities held by special
purpose vehicles in which the Fund holds a residual interest. See Note 1I to the Fund's
financial statements. Absent such securities, the Fund's rating distribution at September 30,
2007, is as follows, and the average rating is AA: |
| AAA | | 53.7% | | BBB | | 5.4% |
| AA | | 6.7% | | BB | | 1.0% |
| A | | 24.5% | | Non-Rated | | 8.7% |
| Fund Statistics2,3 | | |
| |
| • | | Number of Issues: | | 96 |
| • | | Average Maturity: | | 21.8 years |
| • | | Average Effective Maturity: | | 13.3 years |
| • | | Average Call Protection: | | 9.1 years |
| • | | Average Dollar Price: | | $98.60 |
1 Rating Distribution is determined by dividing the total market value of the issues by the total investments of the Fund. 2 As of 9/30/07. Portfolio information may not be representative of the Fund's current or future investments and may change due to active management. 3 Portfolio holdings information excludes securities held by special purpose vehicles in which the Fund holds a residual interest. See Note 1I to the Fund's financial statements.
5
Eaton Vance Florida Municipals Fund a s o f S e p t e m b e r 3 0 , 2 0 0 7
P E R F O R M A N C E I N F O R M A T I O N A N D P O R T F O L I O C O M P O S I T I O N |
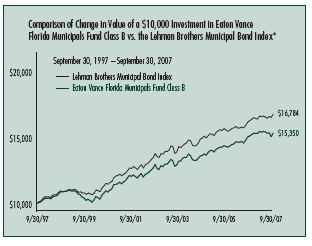
The line graph and table set forth below provide information about the Fund’s performance. The line graph compares the performance of Class B of the Fund with that of the Lehman Brothers Municipal Bond Index, an unmanaged index of municipal bonds. The lines on the graph represent the total returns of a hypothetical investment of $10,000 in each of Class B and the Lehman Brothers Municipal Bond Index. The table includes the total returns of each Class of the Fund at net asset value and maximum public offering price. The performance presented below does not reflect the deduction of taxes, if any, that a shareholder would pay on distributions or redemptions of Fund shares.
| Fund Performance1 as of 9/30/07 | | Class A | | Class B | | Class C |
| Share Class Symbol | | ETFLX | | EVFLX | | ECFLX |
| Average Annual Total Returns (at net asset value) | | | | | | |
| One Year | | 2.23% | | 1.53% | | 1.62% |
| Five Years | | 4.20 | | 3.45 | | N.A. |
| Ten Years | | 5.15 | | 4.38 | | N.A. |
| Life of Fund† | | 5.81 | | 5.59 | | 3.04 |
| SEC Average Annual Total Returns (including sales charge or applicable CDSC) | | |
| One Year | | -2.63% | | -3.36% | | 0.64% |
| Five Years | | 3.18 | | 3.11 | | N.A. |
| Ten Years | | 4.64 | | 4.38 | | N.A. |
| Life of Fund† | | 5.43 | | 5.59 | | 3.04 |
| † Inception date: Class A: 4/5/94; Class B: 8/28/90; Class C: 3/13/06 | | |
| |
| Total Annual | | | | | | |
| Operating Expenses2 | | Class A | | Class B | | Class C |
| |
| Expense Ratio | | 1.29% | | 2.04% | | 2.04% |
| |
| Distribution Rates/Yields | | Class A | | Class B | | Class C |
| |
| Distribution Rate3 | | 4.57% | | 3.82% | | 3.82% |
| Taxable-Equivalent Distribution Rate3,4 | | 7.03 | | 5.88 | | 5.88 |
| SEC 30-day Yield5 | | 3.97 | | 3.42 | | 3.43 |
| Taxable-Equivalent SEC 30-day Yield4,5 | | 6.11 | | 5.26 | | 5.28 |
| |
| Index Performance6 | | | | | | |
| Lehman Brothers Municipal Bond Index – Average Annual Total Returns | | | | |
| One Year | | 3.10% | | |
| Five Years | | 4.02 | | |
| Ten Years | | 5.32 | | |
| |
| Lipper Averages7 | | | | | | |
| Lipper Florida Municipal Debt Funds Classification – Average Annual Total Returns | | |
| One Year | | 1.99% | | |
| Five Years | | 3.46 | | |
| Ten Years | | 4.43 | | |
Portfolio Manager: Cynthia J. Clemson
*Sources: Thomson Financial; Lipper, Inc.
A $10,000 hypothetical investment at net asset value in Class A and Class C on 9/30/97 and 3/13/06 (commencement of operations), respectively, would have been valued at $16,533 ($15,748 at the maximum offering price) and $10,475, respectively, on 9/30/07. It is not possible to invest directly in an Index. The Index’s total return does not reflect the expenses that would have been incurred if an investor individually purchased or sold the securities represented in the Index.
Past performance is no guarantee of future results. Returns are historical and are calculated by determining the percentage change in net asset value or offering price (as applicable) with all distributions reinvested. Investment return and principal value will fluctuate so that shares, when redeemed, may be worth more or less than their original cost. Performance is for the stated time period only; due to market volatility, the Fund’s current performance may be lower or higher than the quoted return. For performance as of the most recent month end, please refer to www.eatonvance.com.
1 Average annual total returns do not include the 4.75% maximum sales charge for Class A shares or the applicable contingent deferred sales charges (CDSC) for Class B and Class C shares. If sales charges were deducted, returns would be lower. SEC Average Annual Total Returns for Class A reflect the maximum 4.75% sales charge. SEC Average Annual Total Returns for Class B reflect the applicable CDSC based on the following schedule: 5% - 1st and 2nd years; 4% - 3rd year; 3% - 4th year; 2% - 5th year; 1% - 6th year. SEC Average Annual Total Returns for Class C reflect a 1% CDSC for the first year. 2 Source: Prospectus dated 2/1/07, as revised 6/27/07. Includes interest expense of 0.50% relating to the Fund's liability with respect to floating-rate notes held by third parties in conjunction with inverse floater securities transactions by the Fund. The Fund also records offsetting in terest income relating to the municipal obligations underlying such transactions, and, as a result, net asset value and performance have not been affected by this expense. 3 The Fund's distribution rate represents actual distributions paid to shareholders and is calculated by dividing the last distribution per share (annualized) by the net asset value. 4 Taxable-equivalent figures assume a maximum 35.00% federal tax rate. A lower tax rate would result in lower taxable-equivalent figures. 5 The Fund's SEC yield is calculated by dividing the net investment income per share for the 30-day period by the offering price at the end of the period and annualizing the result. 6 It is not possible to invest directly in an Index. The Index's total return does not r eflect the expenses that would have been incurred if an investor individually purchased or sold the securities represented in the Index. Index performance is available as of month end only. 7 The Lipper Averages are the average annual total returns, at net asset value, of the funds that are in the same Lipper Classification as the Fund. It is not possible to invest in a Lipper Classification. Lipper Classifications may include insured and uninsured funds, as well as leveraged and unleveraged funds. The Lipper Florida Municipal Debt Funds Classification contained 31, 30 and 27 funds for the 1-year, 5-year and 10-year periods, respectively. Lipper Averages are available as of month end only.
6
Eaton Vance Florida Municipals Fund a s o f S e p t e m b e r 3 0 , 2 0 0 7
P E R F O R M A N C E I N F O R M A T I O N A N D P O R T F O L I O C O M P O S I T I O N |
Rating Distribution*1,2
By total investments |

*The rating distribution presented above includes the ratings of securities held by special
purpose vehicles in which the Fund holds a residual interest. See Note 1I to the Fund's
financial statements. Absent such securities, the Fund's rating distribution at September 30,
2007, is as follows, and the average rating is AA-: |
| AAA | | 58.4% | | BBB | | 3.3% |
| AA | | 7.6% | | Non-Rated | | 19.5% |
| A | | 11.2% | | | | |
| Fund Statistics2,3 | | |
| |
| • | | Number of Issues: | | 97 |
| • | | Average Maturity: | | 22.2 years |
| • | | Average Effective Maturity: | | 13.0 years |
| • | | Average Call Protection: | | 8.3 years |
| • | | Average Dollar Price: | | $98.39 |
1 Rating Distribution is determined by dividing the total market value of the issues by the total investments of the Fund. 2 As of 9/30/07. Portfolio information may not be representative of the Fund's current or future investments and may change due to active management. 3 Portfolio holdings information excludes securities held by special purpose vehicles in which the Fund holds a residual interest. See Note 1I to the Fund's financial statements.
7
Eaton Vance Massachusetts Municipals Fund a s o f S e p t e m b e r 3 0 , 2 0 0 7
P E R F O R M A N C E I N F O R M A T I O N A N D P O R T F O L I O C O M P O S I T I O N |
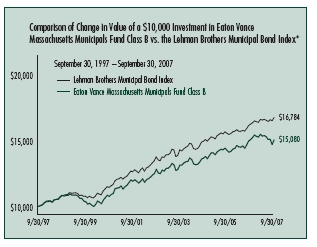
The line graph and table set forth below provide information about the Fund’s performance. The line graph compares the performance of Class B of the Fund with that of the Lehman Brothers Municipal Bond Index, an unmanaged index of municipal bonds. The lines on the graph represent the total returns of a hypothetical investment of $10,000 in each of Class B and the Lehman Brothers Municipal Bond Index. The table includes the total returns of each Class of the Fund at net asset value and maximum public offering price. The performance presented below does not reflect the deduction of taxes, if any, that a shareholder would pay on distributions or redemptions of Fund shares.
| Fund Performance1 as of 9/30/07 | | Class A | | Class B | | Class C | | Class I |
| Share Class Symbol | | ETMAX | | EVMAX ECMMX | | EIMAX |
| Average Annual Total Returns (at net asset value) | | | | | | | | |
| One Year | | 0.57% | | -0.07% | | -0.07% | | 0.77% |
| Five Years | | 4.02 | | 3.29 | | N.A. | | 4.27 |
| Ten Years | | 4.97 | | 4.19 | | N.A. | | 5.18 |
| Life of Fund† | | 4.85 | | 5.25 | | 2.83 | | 5.27 |
| |
| SEC Average Annual Total Returns (including sales charge or applicable CDSC) | | | | |
| One Year | | -4.20% | | -4.90% | | -1.04% | | 0.77% |
| Five Years | | 3.01 | | 2.95 | | N.A. | | 4.27 |
| Ten Years | | 4.46 | | 4.19 | | N.A. | | 5.18 |
| Life of Fund† | | 4.48 | | 5.25 | | 2.83 | | 5.27 |
| † Inception date: Class A: 12/7/93; Class B: 4/18/91; Class C: 5/2/06; Class I: 6/17/93 |
| |
| Total Annual | | | | | | | | |
| Operating Expenses2 | | Class A | | Class B | | Class C | | Class I |
| |
| Expense Ratio | | 1.21% | | 1.96% | | 1.96% | | 1.01% |
| |
| Distribution Rates/Yields | | Class A | | Class B | | Class C | | Class I |
| |
| Distribution Rate3 | | 4.34% | | 3.57% | | 3.57% | | 4.55% |
| Taxable-Equivalent Distribution Rate3,4 | | 7.05 | | 5.80 | | 5.80 | | 7.39 |
| SEC 30-day Yield5 | | 3.79 | | 3.23 | | 3.23 | | 4.18 |
| Taxable-Equivalent SEC 30-day Yield4,5 | | 6.16 | | 5.25 | | 5.25 | | 6.79 |
| Index Performance6 | | | | | | | | |
| Lehman Brothers Municipal Bond Index – Average Annual Total Returns | | | | |
| One Year | | | | 3.10% | | | | |
| Five Years | | | | 4.02 | | | | |
| Ten Years | | | | 5.32 | | | | |
| |
| Lipper Averages7 | | | | | | | | |
| Lipper Massachusetts Municipal Debt Funds Classification – Average Annual Total Returns | | |
| One Year | | | | 1.97% | | | | |
| Five Years | | | | 3.17 | | | | |
| Ten Years | | | | 4.37 | | | | |
Portfolio Manager: Robert B. MacIntosh, CFA
*Sources: Thomson Financial; Lipper, Inc.
A $10,000 hypothetical investment at net asset value in Class A on 9/30/97, Class C on 5/2/06 (commencement of operations) and Class I on 9/30/97 would have been valued at $16,243 ($15,472 at the maximum offering price), $10,402 and $16,567, respectively, on 9/30/07. It is not possible to invest directly in an Index. The Index’s total return does not reflect the expenses that would have been incurred if an investor individually purchased or sold the securities represented in the Index.
Past performance is no guarantee of future results. Returns are historical and are calculated by determining the percentage change in net asset value or offering price (as applicable) with all distributions reinvested. Investment return and principal value will fluctuate so that shares, when redeemed, may be worth more or less than their original cost. Performance is for the stated time period only; due to market volatility, the Fund’s current performance may be lower or higher than the quoted return. For performance as of the most recent month end, please refer to www.eatonvance.com.
1 Average annual total returns do not include the 4.75% maximum sales charge for Class A shares or the applicable contingent deferred sales charges (CDSC) for Class B and Class C shares. If sales charges were deducted, returns would be lower. SEC Average Annual Total Returns for Class A reflect the maximum 4.75% sales charge. SEC Average Annual Total Returns for Class B reflect the applicable CDSC based on the following schedule: 5% - 1st and 2nd years; 4% - 3rd year; 3% - 4th year; 2% - 5th year; 1% - 6th year. SEC Average Annual Total Returns for Class C reflect a 1% CDSC for the first year. Class I shares are not subject to a sales charge. 2 Source: Prospectus dated 2/1/07, as revised 6/27/07. Includes interest expense of 0.42% relating to the Fund's liability with respect to floating-rate notes held by third parties in conjunction with inverse floater securities transaction s by the Fund. The Fund also records offsetting interest income relating to the municipal obligations underlying such transactions, and, as a result, net asset value and performance have not been affected by this expense. 3 The Fund's distribution rate represents actual distributions paid to shareholders and is calculated by dividing the last distribution per share (annualized) by the net asset value. 4 Taxable-equivalent figures assume a maximum 38.45% combined federal and state income tax rate. A lower tax rate would result in lower taxable-equivalent figures. 5 The Fund's SEC yield is calculated by dividing the net investment income per share for the 30-day period by the offering price at the end of the period and annualizing the result. 6 It is not possible to invest directly in an Index. The Index's total return does not reflect the expenses that would have been incurred if an investor individually purchased or sold the securities represented in the Index. Index performance is available as of month end only. 7 The Lipper Averages are the average annual total returns, at net asset value, of the funds that are in the same Lipper Classification as the Fund. It is not possible to invest in a Lipper Classification. Lipper Classifications may include insured and uninsured funds, as well as leveraged and unleveraged funds. The Lipper Massachusetts Municipal Debt Funds Classification contained 55, 49 and 42 funds for the 1-year, 5-year and 10-year periods, respectively. Lipper Averages are available as of month end only.
8
Eaton Vance Massachusetts Municipals Fund a s o f S e p t e m b e r 3 0 , 2 0 0 7
P E R F O R M A N C E I N F O R M A T I O N A N D P O R T F O L I O C O M P O S I T I O N |
Rating Distribution*1,2
By total investments |
*The rating distribution presented above includes the ratings of securities held by special
purpose vehicles in which the Fund holds a residual interest. See Note 1I to the Fund's
financial statements. Absent such securities, the Fund's rating distribution at September 30,
2007, is as follows, and the average rating is AA+: |
| AAA | | 54.7% | | BBB | | 7.1% |
| AA | | 20.5% | | Non-Rated | | 4.3% |
| A | | 13.4% | | | | |
| Fund Statistics2,3 | | | | |
| |
| • | | Number of Issues: | | 81 | | |
| • | | Average Maturity: | | 24.5 | | years |
| • | | Average Effective Maturity: | | 15.3 | | years |
| • | | Average Call Protection: | | 11.3 | | years |
| • | | Average Dollar Price: | | $98.48 |
1 Rating Distribution is determined by dividing the total market value of the issues by the total investments of the Fund. 2 As of 9/30/07. Portfolio information may not be representative of the Fund's current or future investments and may change due to active management. 3 Portfolio holdings information excludes securities held by special purpose vehicles in which the Fund holds a residual interest. See Note 1I to the Fund's financial statements.
9
Eaton Vance Mississippi Municipals Fund a s o f S e p t e m b e r 3 0 , 2 0 0 7
P E R F O R M A N C E I N F O R M A T I O N A N D P O R T F O L I O C O M P O S I T I O N |
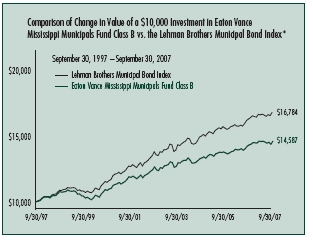
The line graph and table set forth below provide information about the Fund’s performance. The line graph compares the performance of Class B of the Fund with that of the Lehman Brothers Municipal Bond Index, an unmanaged index of municipal bonds. The lines on the graph represent the total returns of a hypothetical investment of $10,000 in each of Class B and the Lehman Brothers Municipal Bond Index. The table includes the total returns of each Class of the Fund at net asset value and maximum public offering price. The performance presented below does not reflect the deduction of taxes, if any, that a shareholder would pay on distributions or redemptions of Fund shares.
| Fund Performance1 as of 9/30/07 | | Class A | | Class B |
| Share Class Symbol | | ETMSX | | EVMSX |
| Average Annual Total Returns (at net asset value) | | | | |
| One Year | | 2.67% | | 1.94% |
| Five Years | | 3.62 | | 2.89 |
| Ten Years | | 4.61 | | 3.85 |
| Life of Fund† | | 4.57 | | 4.15 |
| |
| SEC Average Annual Total Returns (including sales charge or applicable CDSC) | | |
| One Year | | -2.18% | | -2.99% |
| Five Years | | 2.61 | | 2.55 |
| Ten Years | | 4.10 | | 3.85 |
| Life of Fund† | | 4.20 | | 4.15 |
| † Inception date: Class A: 12/7/93; Class B: 6/11/93 | | | | |
| |
| Total Annual | | | | |
| Operating Expenses2 | | Class A | | Class B |
| |
| Expense Ratio | | 1.00% | | 1.75% |
| |
| Distribution Rates/Yields | | Class A | | Class B |
| |
| Distribution Rate3 | | 4.19% | | 3.43% |
| Taxable-Equivalent Distribution Rate3,4 | | 6.79 | | 5.55 |
| SEC 30-day Yield5 | | 3.54 | | 2.97 |
| Taxable-Equivalent SEC 30-day Yield4,5 | | 5.73 | | 4.81 |
| |
| Index Performance6 | | | | |
| Lehman Brothers Municipal Bond Index – Average Annual Total Returns | | |
| One Year | | 3.10% | | |
| Five Years | | 4.02 | | |
| Ten Years | | 5.32 | | |
| |
| Lipper Averages7 | | | | |
| Lipper Other States Municipal Debt Funds Classification – Average Annual Total Returns |
| One Year | | 2.20% | | |
| Five Years | | 3.07 | | |
| Ten Years | | 4.180 | | |
Portfolio Manager: Craig R. Brandon, CFA
*Sources: Thomson Financial; Lipper, Inc.
A $10,000 hypothetical investment at net asset value in Class A on 9/30/97 would have been valued at $15,703 ($14,957 at the maximum offering price) on 9/30/07. It is not possible to invest directly in an Index. The Index’s total return does not reflect the expenses that would have been incurred if an investor individually purchased or sold the securities represented in the Index.
Past performance is no guarantee of future results. Returns are historical and are calculated by determining the percentage change in net asset value or offering price (as applicable) with all distributions reinvested. Investment return and principal value will fluctuate so that shares, when redeemed, may be worth more or less than their original cost. Performance is for the stated time period only; due to market volatility, the Fund’s current performance may be lower or higher than the quoted return. For performance as of the most recent month end, please refer to www.eatonvance.com.
1 Average annual total returns do not include the 4.75% maximum sales charge for Class A shares or the applicable contingent deferred sales charges (CDSC) for Class B shares. If sales charges were deducted, returns would be lower. SEC Average Annual Total Returns for Class A reflect the maximum 4.75% sales charge. SEC Average Annual Total Returns for Class B reflect the applicable CDSC based on the following schedule: 5% - 1st and 2nd years; 4% - 3rd year; 3% - 4th year; 2% - 5th year; 1% - 6th year. 2 Source: Prospectus dated 2/1/07, as revised 6/27/07. Includes interest expense of 0.19% relating to the Fund's liability with respect to floating-rate notes held by third parties in conjunction with inverse floater securities transactions by the Fund. The Fund also records offsetting interest income relating to the municipal obligations underlying such transactions, and, as a res ult, net asset value and performance have not been affected by this expense. 3 The Fund's distribution rate represents actual distributions paid to shareholders and is calculated by dividing the last distribution per share (annualized) by the net asset value. 4 Taxable-equivalent figures assume a maximum 38.25% combined federal and state income tax rate. A lower tax rate would result in lower taxable-equivalent figures. 5 The Fund's SEC yield is calculated by dividing the net investment income per share for the 30-day period by the offering price at the end of the period and annualizing the result. 6 It is not possible to invest directly in an Index. The Index's total return does not reflect the expenses that would have been incurred if an investor indi vidually purchased or sold the securities represented in the Index. Index performance is available as of month end only. 7 The Lipper Averages are the average annual total returns, at net asset value, of the funds that are in the same Lipper Classification as the Fund. It is not possible to invest in a Lipper Classification. Lipper Classifications may include insured and uninsured funds, as well as leveraged and unleveraged funds. The Lipper Other States Municipal Debt Funds Classification contained 76, 70 and 54 funds for the 1-year, 5-year and 10-year periods, respectively. Lipper Averages are available as of month end only.
10
Eaton Vance Mississippi Municipals Fund a s o f S e p t e m b e r 3 0 , 2 0 0 7
P E R F O R M A N C E I N F O R M A T I O N A N D P O R T F O L I O C O M P O S I T I O N |
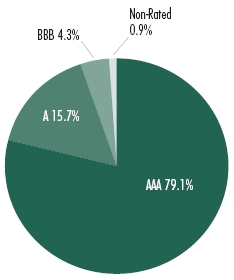
Rating Distribution*1,2
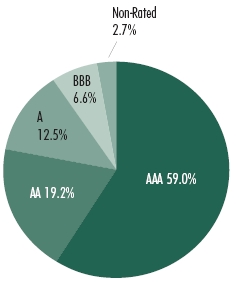
By total investments |
*The rating distribution presented above includes the ratings of securities held by special
purpose vehicles in which the Fund holds a residual interest. See Note 1I to the Fund's
financial statements. Absent such securities, the Fund's rating distribution at September 30,
2007, is as follows, and the average rating is AA+: |
| AAA | | 79.3% | | BB | | 0.3% |
| A | | 8.9% | | Non-Rated | | 2.8% |
| BBB | | 8.7% | | | | |
| Fund Statistics2,3 | | |
| |
| • | | Number of Issues: | | 48 |
| • | | Average Maturity: | | 18.9 years |
| • | | Average Effective Maturity: | | 10.0 years |
| • | | Average Call Protection: | | 7.7 years |
| • | | Average Dollar Price: | | $99.56 |
1 Rating Distribution is determined by dividing the total market value of the issues by the total investments of the Fund. 2 As of 9/30/07. Portfolio information may not be representative of the Fund's current or future investments and may change due to active management. 3 Portfolio holdings information excludes securities held by special purpose vehicles in which the Fund holds a residual interest. See Note 1I to the Fund's financial statements.
11
Eaton Vance New York Municipals Fund a s o f S e p t e m b e r 3 0 , 2 0 0 7
P E R F O R M A N C E I N F O R M A T I O N A N D P O R T F O L I O C O M P O S I T I O N |
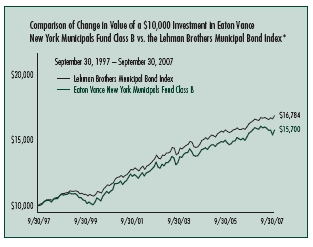
The line graph and table set forth below provide information about the Fund’s performance. The line graph compares the performance of Class B of the Fund with that of the Lehman Brothers Municipal Bond Index, an unmanaged index of municipal bonds. The lines on the graph represent the total returns of a hypothetical investment of $10,000 in each of Class B and the Lehman Brothers Municipal Bond Index. The table includes the total returns of each Class of the Fund at net asset value and maximum public offering price. The performance presented below does not reflect the deduction of taxes, if any, that a shareholder would pay on distributions or redemptions of Fund shares.
| Fund Performance1 as of 9/30/07 | | Class A | | Class B | | Class C |
| Share Class Symbol | | ETNYX | | EVNYX | | ECNYX |
| Average Annual Total Returns (at net asset value) | | | | | | |
| One Year | | 1.50% | | 0.83% | | 0.73% |
| Five Years | | 3.96 | | 3.39 | | N.A. |
| Ten Years | | 5.30 | | 4.61 | | N.A. |
| Life of Fund† | | 5.91 | | 5.98 | | 2.97 |
| SEC Average Annual Total Returns (including sales charge or applicable CDSC) | | |
| One Year | | -3.35% | | -4.01% | | -0.24% |
| Five Years | | 2.96 | | 3.06 | | N.A. |
| Ten Years | | 4.79 | | 4.61 | | N.A. |
| Life of Fund† | | 5.53 | | 5.98 | | 2.97 |
| † Inception date: Class A: 4/15/94; Class B: 8/30/90; Class C: 9/30/03 | | |
| Total Annual | | | | | | |
| Operating Expenses2 | | Class A | | Class B | | Class C |
| Expense Ratio | | 1.28% | | 2.03% | | 2.03% |
| |
| Distribution Rates/Yields | | Class A | | Class B | | Class C |
| |
| Distribution Rate3 | | 4.39% | | 3.63% | | 3.63% |
| Taxable-Equivalent Distribution Rate3,4 | | 7.25 | | 6.00 | | 6.00 |
| SEC 30-day Yield5 | | 3.87 | | 3.31 | | 3.31 |
| Taxable-Equivalent SEC 30-day Yield4,5 | | 6.39 | | 5.47 | | 5.47 |
| Index Performance6 | | | | | | |
| Lehman Brothers Municipal Bond Index – Average Annual Total Returns | | | | |
| One Year | | 3.10% | | |
| Five Years | | 4.02 | | |
| Ten Years | | 5.32 | | |
| Lipper Averages7 | | | | | | |
| Lipper New York Municipal Debt Funds Classification – Average Annual Total Returns | | |
| One Year | | 1.85% | | |
| Five Years | | 3.34 | | |
| Ten Years | | 4.45 | | |
Portfolio Manager: Craig R. Brandon, CFA
*Sources: Thomson Financial; Lipper, Inc.
A $10,000 hypothetical investment at net asset value in Class A and Class C on 9/30/97 and 9/30/03 (commencement of operations), respectively, would have been valued at $16,764 ($15,967 at the maximum offering price) and $11,187, respectively, on 9/30/07. It is not possible to invest directly in an Index. The Index’s total return does not reflect the expenses that would have been incurred if an investor individually purchased or sold the securities represented in the Index.
Past performance is no guarantee of future results. Returns are historical and are calculated by determining the percentage change in net asset value or offering price (as applicable) with all distributions reinvested. Investment return and principal value will fluctuate so that shares, when redeemed, may be worth more or less than their original cost. Performance is for the stated time period only; due to market volatility, the Fund’s current performance may be lower or higher than the quoted return. For performance as of the most recent month end, please refer to www.eatonvance.com.
1 Average annual total returns do not include the 4.75% maximum sales charge for Class A shares or the applicable contingent deferred sales charges (CDSC) for Class B and Class C shares. If sales charges were deducted, returns would be lower. SEC Average Annual Total Returns for Class A reflect the maximum 4.75% sales charge. SEC Average Annual Total Returns for Class B reflect the applicable CDSC based on the following schedule: 5% - 1st and 2nd years; 4% - 3rd year; 3% - 4th year; 2% - 5th year; 1% - 6th year. SEC Average Annual Total Returns for Class C reflect a 1% CDSC for the first year. 2 Source: Prospectus dated 2/1/07, as revised 6/27/07. Includes interest expense of 0.49% relating to the Fund's liability with respect to floating-rate notes held by third parties in conjunction with inverse floater securities transactions by the Fund. The Fund also records offsetting in terest income relating to the municipal obligations underlying such transactions, and, as a result, net asset value and performance have not been affected by this expense. 3 The Fund's distribution rate represents actual distributions paid to shareholders and is calculated by dividing the last distribution per share (annualized) by the net asset value. 4 Taxable-equivalent figures assume a maximum 39.45% combined federal and state income tax rate. A lower tax rate would result in lower taxable-equivalent figures. 5 The Fund's SEC yield is calculated by dividing the net investment income per share for the 30-day period by the offering price at the end of the period and annualizing the result. 6 It is not possible to invest directly in an Index. The Index 's total return does not reflect the expenses that would have been incurred if an investor individually purchased or sold the securities represented in the Index. Index performance is available as of month end only. 7 The Lipper Averages are the average annual total returns, at net asset value, of the funds that are in the same Lipper Classification as the Fund. It is not possible to invest in a Lipper Classification. Lipper Classifications may include insured and uninsured funds, as well as leveraged and unleveraged funds. The Lipper New York Municipal Debt Funds Classification contained 96, 89 and 68 funds for the 1-year, 5-year and 10-year periods, respectively. Lipper Averages are available as of month end only.
12
Eaton Vance New York Municipals Fund a s o f S e p t e m b e r 3 0 , 2 0 0 7
P E R F O R M A N C E I N F O R M A T I O N A N D P O R T F O L I O C O M P O S I T I O N |
Rating Distribution*1,2
By total investments |
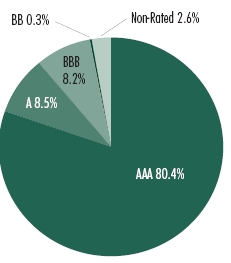
*The rating distribution presented above includes the ratings of securities held by special
purpose vehicles in which the Fund holds a residual interest. See Note 1I to the Fund's
financial statements. Absent such securities, the Fund's rating distribution at September 30,
2007, is as follows, and the average rating is AA: |
| AAA | | 36.7% | | BB | | 0.4% |
| AA | | 39.3% | | B | | 1.3% |
| A | | 14.2% | | Non-Rated | | 4.9% |
| BBB | | 3.2% | | | | |
| Fund Statistics2,3 | | | | |
| |
| • | | Number of Issues: | | 95 | | |
| • | | Average Maturity: | | 23.7 | | years |
| • | | Average Effective Maturity: | | 16.8 | | years |
| • | | Average Call Protection: | | 10.7 | | years |
| • | | Average Dollar Price: | | $102.05 |
1 Rating Distribution is determined by dividing the total market value of the issues by the total investments of the Fund. 2 As of 9/30/07. Portfolio information may not be representative of the Fund's current or future investments and may change due to active management. 3 Portfolio holdings information excludes securities held by special purpose vehicles in which the Fund holds a residual interest. See Note 1I to the Fund's financial statements.
13
Eaton Vance Ohio Municipals Fund a s o f S e p t e m b e r 3 0 , 2 0 0 7
P E R F O R M A N C E I N F O R M A T I O N A N D P O R T F O L I O C O M P O S I T I O N |
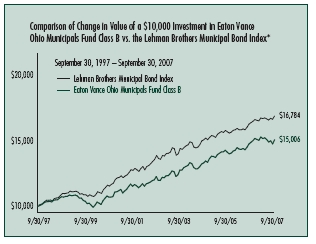
The line graph and table set forth below provide information about the Fund’s performance. The line graph compares the performance of Class B of the Fund with that of the Lehman Brothers Municipal Bond Index, an unmanaged index of municipal bonds. The lines on the graph represent the total returns of a hypothetical investment of $10,000 in each of Class B and the Lehman Brothers Municipal Bond Index. The table includes the total returns of each Class of the Fund at net asset value and maximum public offering price. The performance presented below does not reflect the deduction of taxes, if any, that a shareholder would pay on distributions or redemptions of Fund shares.
| Fund Performance1 as of 9/30/07 | | Class A | | Class B | | Class C |
| Share Class Symbol | | ETOHX | | EVOHX | | ECOHX |
| Average Annual Total Returns (at net asset value) | | | | | | |
| One Year | | 1.98% | | 1.32% | | 1.32% |
| Five Years | | 4.91 | | 4.16 | | N.A. |
| Ten Years | | 4.93 | | 4.14 | | N.A. |
| Life of Fund† | | 4.81 | | 5.28 | | 3.25 |
| SEC Average Annual Total Returns (including sales charge or applicable CDSC) | | |
| One Year | | -2.85% | | -3.57% | | 0.34% |
| Five Years | | 3.91 | | 3.82 | | N.A. |
| Ten Years | | 4.43 | | 4.14 | | N.A. |
| Life of Fund† | | 4.44 | | 5.28 | | 3.25 |
| † Inception date: Class A: 12/7/93; Class B: 4/18/91; Class C: 2/3/06 | | |
| |
| Total Annual | | | | | | |
| Operating Expenses2 | | Class A | | Class B | | Class C |
| |
| Expense Ratio | | 1.25% | | 2.00% | | 2.00% |
| |
| Distribution Rates/Yields | | Class A | | Class B | | Class C |
| |
| Distribution Rate3 | | 4.06% | | 3.31% | | 3.31% |
| Taxable-Equivalent Distribution Rate3,4 | | 6.68 | | 5.45 | | 5.45 |
| SEC 30-day Yield5 | | 3.64 | | 3.07 | | 3.07 |
| Taxable-Equivalent SEC 30-day Yield4,5 | | 5.99 | | 5.05 | | 5.05 |
| |
| Index Performance6 | | | | | | |
| Lehman Brothers Municipal Bond Index – Average Annual Total Returns | | | | |
| One Year | | 3.10% | | |
| Five Years | | 4.02 | | |
| Ten Years | | 5.32 | | |
| |
| Lipper Averages7 | | | | | | |
| Lipper Ohio Municipal Debt Funds Classification – Average Annual Total Returns | | |
| One Year | | 2.16% | | |
| Five Years | | 3.11 | | |
| Ten Years | | 4.26 | | |
Portfolio Manager: William H. Ahern, CFA
*Sources: Thomson Financial; Lipper, Inc.
A $10,000 hypothetical investment at net asset value in Class A and Class C on 9/30/97 and 2/3/06 (commencement of operations), respectively, would have been valued at $16,190 ($15,421 at the maximum offering price) and $10,543, respectively, on 9/30/07. It is not possible to invest directly in an Index. The Index’s total return does not reflect the expenses that would have been incurred if an investor individually purchased or sold the securities represented in the Index.
Past performance is no guarantee of future results. Returns are historical and are calculated by determining the percentage change in net asset value or offering price (as applicable) with all distributions reinvested. Investment return and principal value will fluctuate so that shares, when redeemed, may be worth more or less than their original cost. Performance is for the stated time period only; due to market volatility, the Fund’s current performance may be lower or higher than the quoted return. For performance as of the most recent month end, please refer to www.eatonvance.com.
1 Average annual total returns do not include the 4.75% maximum sales charge for Class A shares or the applicable contingent deferred sales charges (CDSC) for Class B and Class C shares. If sales charges were deducted, returns would be lower. SEC Average Annual Total Returns for Class A reflect the maximum 4.75% sales charge. SEC Average Annual Total Returns for Class B reflect the applicable CDSC based on the following schedule: 5% - 1st and 2nd years; 4% - 3rd year; 3% - 4th year; 2% - 5th year; 1% - 6th year. SEC Average Annual Total Returns for Class C reflect a 1% CDSC for the first year. 2 Source: Prospectus dated 2/1/07, as revised 6/27/07. Includes interest expense of 0.47% relating to the Fund's liability with respect to floating-rate notes held by third parties in conjunction with inverse floater securities transactions by the Fund. The Fund also records offsetting in terest income relating to the municipal obligations underlying such transactions, and, as a result, net asset value and performance have not been affected by this expense. 3 The Fund's distribution rate represents actual distributions paid to shareholders and is calculated by dividing the last distribution per share (annualized) by the net asset value. 4 Taxable-equivalent figures assume a maximum 39.26% combined federal and state income tax rate. A lower tax rate would result in lower taxable-equivalent figures. 5 The Fund's SEC yield is calculated by dividing the net investment income per share for the 30-day period by the offering price at the end of the period and annualizing the result. 6 It is not possible to invest directly in an Index. The Index 's total return does not reflect the expenses that would have been incurred if an investor individually purchased or sold the securities represented in the Index. Index performance is available as of month end only. 7 The Lipper Averages are the average annual total returns, at net asset value, of the funds that are in the same Lipper Classification as the Fund. It is not possible to invest in a Lipper Classification. Lipper Classifications may include insured and uninsured funds, as well as leveraged and unleveraged funds. The Lipper Ohio Municipal Debt Funds Classification contained 45, 41 and 34 funds for the 1-year, 5-year and 10-year periods, respectively. Lipper Averages are available as of month end only.
14
Eaton Vance Ohio Municipals Fund a s o f S e p t e m b e r 3 0 , 2 0 0 7
P E R F O R M A N C E I N F O R M A T I O N A N D P O R T F O L I O C O M P O S I T I O N |
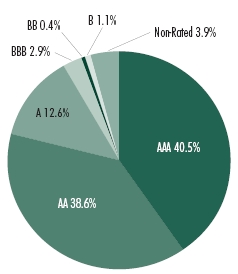
Rating Distribution*1,2
By total investments |
*The rating distribution presented above includes the ratings of securities held by special
purpose vehicles in which the Fund holds a residual interest. See Note 1I to the Fund's
financial statements. Absent such securities, the Fund's rating distribution at September 30,
2007, is as follows, and the average rating is AA+: |
| AAA | | 79.7% | | BBB | | 1.2% |
| AA | | 5.1% | | B | | 1.3% |
| A | | 7.9% | | Non-Rated | | 4.8% |
| Fund Statistics2,3 | | | | |
| |
| • | | Number of Issues: | | 131 | | |
| • | | Average Maturity: | | 22.1 years |
| • | | Average Effective Maturity: | | 13.6 years |
| • | | Average Call Protection: | | 10.2 years |
| • | | Average Dollar Price: | | $103.46 |
1 Rating Distribution is determined by dividing the total market value of the issues by the total investments of the Fund. 2 As of 9/30/07. Portfolio information may not be representative of the Fund's current or future investments and may change due to active management. 3 Portfolio holdings information excludes securities held by special purpose vehicles in which the Fund holds a residual interest. See Note 1I to the Fund's financial statements.
15
Eaton Vance Rhode Island Municipals Fund a s o f S e p t e m b e r 3 0 , 2 0 0 7
P E R F O R M A N C E I N F O R M A T I O N A N D P O R T F O L I O C O M P O S I T I O N |
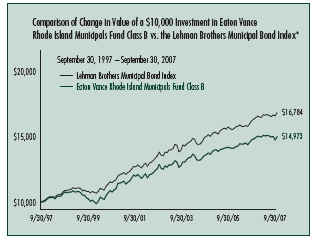
The line graph and table set forth below provide information about the Fund’s performance. The line graph compares the performance of Class B of the Fund with that of the Lehman Brothers Municipal Bond Index, an unmanaged index of municipal bonds. The lines on the graph represent the total returns of a hypothetical investment of $10,000 in each of Class B and the Lehman Brothers Municipal Bond Index. The table includes the total returns of each Class of the Fund at net asset value and maximum public offering price. The performance presented below does not reflect the deduction of taxes, if any, that a shareholder would pay on distributions or redemptions of Fund shares.
| Fund Performance1 as of 9/30/07 | | Class A | | Class B | | Class C |
| Share Class Symbol | | ETRIX | | EVRIX | | ERICX |
| Average Annual Total Returns (at net asset value) | | | | | | |
| One Year | | 1.91% | | 1.20% | | 1.20% |
| Five Years | | 3.85 | | 3.09 | | N.A. |
| Ten Years | | 4.88 | | 4.12 | | N.A. |
| Life of Fund† | | 4.65 | | 4.28 | | 2.36 |
| SEC Average Annual Total Returns (including sales charge or applicable CDSC) | | |
| One Year | | -2.92% | | -3.69% | | 0.22% |
| Five Years | | 2.85 | | 2.75 | | N.A. |
| Ten Years | | 4.37 | | 4.12 | | N.A. |
| Life of Fund† | | 4.28 | | 4.28 | | 2.36 |
| † Inception date: Class A: 12/7/93; Class B: 6/11/93; Class C: 3/20/06 | | |
| |
| Total Annual | | | | | | |
| Operating Expenses2 | | Class A | | Class B | | Class C |
| |
| Expense Ratio | | 1.10% | | 1.85% | | 1.85% |
| |
| Distribution Rates/Yields | | Class A | | Class B | | Class C |
| |
| Distribution Rate3 | | 4.07% | | 3.32% | | 3.31% |
| Taxable-Equivalent Distribution Rate3,4 | | 6.95 | | 5.67 | | 5.65 |
| SEC 30-day Yield5 | | 3.85 | | 3.30 | | 3.29 |
| Taxable-Equivalent SEC 30-day Yield4,5 | | 6.57 | | 5.64 | | 5.62 |
| |
| Index Performance6 | | | | | | |
| Lehman Brothers Municipal Bond Index – Average Annual Total Returns | | | | |
| One Year | | 3.10% | | |
| Five Years | | 4.02 | | |
| Ten Years | | 5.32 | | |
| |
| Lipper Averages7 | | | | | | |
| Lipper Other States Municipal Debt Funds Classification – Average Annual Total Returns |
| One Year | | 2.20% | | |
| Five Years | | 3.07 | | |
| Ten Years | | 4.18 | | |
Portfolio Manager: Robert B. MacIntosh, CFA
*Sources: Thomson Financial; Lipper, Inc.
A $10,000 hypothetical investment at net asset value in Class A and Class C on 9/30/97 and 3/20/06 (commencement of operations), respectively, would have been valued at $16,106 ($15,341 at the maximum offering price) and $10,363, respectively, on 9/30/07. It is not possible to invest directly in an Index. The Index’s total return does not reflect the expenses that would have been incurred if an investor individually purchased or sold the securities represented in the Index.
Past performance is no guarantee of future results. Returns are historical and are calculated by determining the percentage change in net asset value or offering price (as applicable) with all distributions reinvested. Investment return and principal value will fluctuate so that shares, when redeemed, may be worth more or less than their original cost. Performance is for the stated time period only; due to market volatility, the Fund’s current performance may be lower or higher than the quoted return. For performance as of the most recent month end, please refer to www.eatonvance.com.
1 Average annual total returns do not include the 4.75% maximum sales charge for Class A shares or the applicable contingent deferred sales charges (CDSC) for Class B and Class C shares. If sales charges were deducted, returns would be lower. SEC Average Annual Total Returns for Class A reflect the maximum 4.75% sales charge. SEC Average Annual Total Returns for Class B reflect the applicable CDSC based on the following schedule: 5% - 1st and 2nd years; 4% - 3rd year; 3% - 4th year; 2% - 5th year; 1% - 6th year. SEC Average Annual Total Returns for Class C reflect a 1% CDSC for the first year. 2 Source: Prospectus dated 2/1/07, as revised 6/27/07. Includes interest expense of 0.35% relating to the Fund's liability with respect to floating-rate notes held by third parties in conjunction with inverse floater securities transactions by the Fund. The Fund also records offsetting in terest income relating to the municipal obligations underlying such transactions, and, as a result, net asset value and performance have not been affected by this expense. 3 The Fund's distribution rate represents actual distributions paid to shareholders and is calculated by dividing the last distribution per share (annualized) by the net asset value. 4 Taxable-equivalent figures assume a maximum 41.44% combined federal and state income tax rate. A lower tax rate would result in lower taxable-equivalent figures. 5 The Fund's SEC yield is calculated by dividing the net investment income per share for the 30-day period by the offering price at the end of the period and annualizing the result. 6 It is not possible to invest directly in an Index. The Index 's total return does not reflect the expenses that would have been incurred if an investor individually purchased or sold the securities represented in the Index. Index performance is available as of month end only. 7 The Lipper Averages are the average annual total returns, at net asset value, of the funds that are in the same Lipper Classification as the Fund. It is not possible to invest in a Lipper Classification. Lipper Classifications may include insured and uninsured funds, as well as leveraged and unleveraged funds. The Lipper Other States Municipal Debt Funds Classification contained 76, 70 and 54 funds for the 1-year, 5-year and 10-year periods, respectively. Lipper Averages are available as of month end only.
16
Eaton Vance Rhode Island Municipals Fund a s o f S e p t e m b e r 3 0 , 2 0 0 7
P E R F O R M A N C E I N F O R M A T I O N A N D P O R T F O L I O C O M P O S I T I O N |
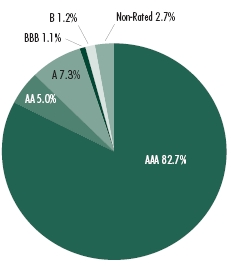
Rating Distribution*1,2
By total investments |
*The rating distribution presented above includes the ratings of securities held by special
purpose vehicles in which the Fund holds a residual interest. See Note 1I to the Fund's
financial statements. Absent such securities, the Fund's rating distribution at September 30,
2007, is as follows, and the average rating is AA+: |
| AAA | | 74.9% | | BBB | | 7.8% |
| AA | | 9.4% | | Non-Rated | | 3.0% |
| A | | 4.9% | | | | |
| Fund Statistics2,3 | | |
| |
| • | | Number of Issues: | | 72 |
| • | | Average Maturity: | | 21.0 years |
| • | | Average Effective Maturity: | | 9.8 years |
| • | | Average Call Protection: | | 8.0 years |
| • | | Average Dollar Price: | | $100.96 |
1 Rating Distribution is determined by dividing the total market value of the issues by the total investments of the Fund. 2 As of 9/30/07. Portfolio information may not be representative of the Fund's current or future investments and may change due to active management. 3 Portfolio holdings information excludes securities held by special purpose vehicles in which the Fund holds a residual interest. See Note 1I to the Fund's financial statements.
17
Eaton Vance West Virginia Municipals Fund a s o f S e p t e m b e r 3 0 , 2 0 0 7
P E R F O R M A N C E I N F O R M A T I O N A N D P O R T F O L I O C O M P O S I T I O N |
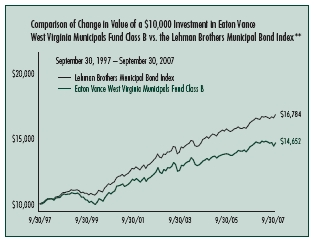
The line graph and table set forth below provide information about the Fund’s performance. The line graph compares the performance of Class B of the Fund with that of the Lehman Brothers Municipal Bond Index, an unmanaged index of municipal bonds. The lines on the graph represent the total returns of a hypothetical investment of $10,000 in each of Class B and the Lehman Brothers Municipal Bond Index. The table includes the total returns of each Class of the Fund at net asset value and maximum public offering price. The performance presented below does not reflect the deduction of taxes, if any, that a shareholder would pay on distributions or redemptions of Fund shares.
| Fund Performance1 as of 9/30/07 | | Class A | | Class B |
| Share Class Symbol | | ETWVX | | EVWVX |
| Average Annual Total Returns (at net asset value) | | | | |
| One Year | | 2.26% | | 1.43% |
| Five Years | | 3.57 | | 2.79 |
| Ten Years | | 4.68 | | 3.89 |
| Life of Fund† | | 4.67 | | 4.17 |
| SEC Average Annual Total Returns (including sales charge or applicable CDSC) | | |
| One Year | | -2.58% | | -3.48% |
| Five Years | | 2.56 | | 2.45 |
| Ten Years | | 4.17 | | 3.89 |
| Life of Fund† | | 4.30 | | 4.17 |
| † Inception date: Class A: 12/13/93; Class B: 6/11/93 | | |
| |
| Total Annual | | | | |
| Operating Expenses2 | | Class A | | Class B |
| |
| Expense Ratio | | 0.93% | | 1.68% |
| |
| Distribution Rates/Yields | | Class A | | Class B |
| |
| Distribution Rate3 | | 4.13% | | 3.36% |
| Taxable-Equivalent Distribution Rate3,4 | | 6.80 | | 5.53 |
| SEC 30-day Yield5 | | 3.63 | | 3.07 |
| Taxable-Equivalent SEC 30-day Yield5,6 | | 5.97 | | 5.05 |
| |
| Index Performance6 | | | | |
| Lehman Brothers Municipal Bond Index – Average Annual Total Returns | | |
| One Year | | 3.10% | | |
| Five Years | | 4.02 | | |
| Ten Years | | 5.32 | | |
| |
| Lipper Averages7 | | | | |
| Lipper Other States Municipal Debt Funds Classification – Average Annual Total Returns |
| One Year | | 2.20% | | |
| Five Years | | 3.07 | | |
| Ten Years | | 4.18 | | |
Portfolio Manager: Robert B. MacIntosh, CFA
Effective October 1, 2007, Adam Weigold, CFA, will replace Mr. MacIntosh as the Fund’s portfolio manager. Mr. Weigold is a Vice President of Eaton Vance Management and Boston Management and Research and manages other Eaton Vance municipal funds. He has been employed by the Eaton Vance organization since 1998.
**Sources: Thomson Financial; Lipper, Inc.
A $10,000 hypothetical investment at net asset value in Class A on 9/30/97 would have been valued at $15,801 ($15,051 at the maximum offering price) on 9/30/07. It is not possible to invest directly in an Index. The Index’s total return does not reflect the expenses that would have been incurred if an investor individually purchased or sold the securities represented in the Index.
Past performance is no guarantee of future results. Returns are historical and are calculated by determining the percentage change in net asset value or offering price (as applicable) with all distributions reinvested. Investment return and principal value will fluctuate so that shares, when redeemed, may be worth more or less than their original cost. Performance is for the stated time period only; due to market volatility, the Fund’s current performance may be lower or higher than the quoted return. For performance as of the most recent month end, please refer to www.eatonvance.com.
1 Average annual total returns do not include the 4.75% maximum sales charge for Class A shares or the applicable contingent deferred sales charges (CDSC) for Class B shares. If sales charges were deducted, returns would be lower. SEC Average Annual Total Returns for Class A reflect the maximum 4.75% sales charge. SEC Average Annual Total Returns for Class B reflect the applicable CDSC based on the following schedule: 5% - 1st and 2nd years; 4% - 3rd year; 3% - 4th year; 2% - 5th year; 1% - 6th year. 2 Source: Prospectus dated 2/1/07, as revised 6/27/07. Includes interest expense of 0.18% relating to the Fund's liability with respect to floating-rate notes held by third parties in conjunction with inverse floater securities transactions by the Fund. The Fund also records offsetting interest income relating to the municipal obligations underlying such transactions, and, as a res ult, net asset value and performance have not been affected by this expense. 3 The Fund's distribution rate represents actual distributions paid to shareholders and is calculated by dividing the last distribution per share (annualized) by the net asset value. 4 Taxable-equivalent figures assume a maximum 39.23% combined federal and state income tax rate. A lower tax rate would result in lower taxable-equivalent figures. 5 The Fund's SEC yield is calculated by dividing the net investment income per share for the 30-day period by the offering price at the end of the period and annualizing the result. 6 It is not possible to invest directly in an Index. The Index's total return does not reflect the expenses that would have been incurred if an investor indi vidually purchased or sold the securities represented in the Index. Index performance is available as of month end only. 7 The Lipper Averages are the average annual total returns, at net asset value, of the funds that are in the same Lipper Classification as the Fund. It is not possible to invest in a Lipper Classification. Lipper Classifications may include insured and uninsured funds, as well as leveraged and unleveraged funds. The Lipper Other States Municipal Debt Funds Classification contained 76, 70 and 54 funds for the 1-year, 5-year and 10-year periods, respectively. Lipper Averages are available as of month end only.
18
Eaton Vance West Virginia Municipals Fund a s o f S e p t e m b e r 3 0 , 2 0 0 7
P E R F O R M A N C E I N F O R M A T I O N A N D P O R T F O L I O C O M P O S I T I O N |
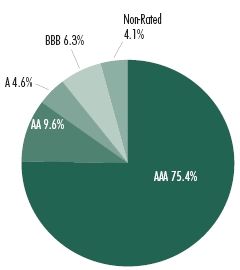
Rating Distribution*1,2
By total investments |
*The rating distribution presented above includes the ratings of securities held by special
purpose vehicles in which the Fund holds a residual interest. See Note 1I to the Fund's
financial statements. Absent such securities, the Fund's rating distribution at September 30,
2007, is as follows, and the average rating is AA+: |
| AAA | | 75.8% | | BBB | | 4.6% |
| A | | 16.7% | | Non-Rated | | 2.9% |
| Fund Statistics2,3 | | |
| |
| • | | Number of Issues: | | 49 |
| • | | Average Maturity: | | 23.3 years |
| • | | Average Effective Maturity: | | 12.3 years |
| • | | Average Call Protection: | | 9.6 years |
| • | | Average Dollar Price: | | $93.84 |
1 Rating Distribution is determined by dividing the total market value of the issues by the total investments of the Fund. 2 As of 9/30/07. Portfolio information may not be representative of the Fund's current or future investments and may change due to active management. 3 Portfolio holdings information excludes securities held by special purpose vehicles in which the Fund holds a residual interest. See Note 1I to the Fund's financial statements.
19
Eaton Vance Municipals Funds a s o f S e p t e m b e r 3 0 , 2 0 0 7
F U N D E X P E N S E S |
Example: As a shareholder of a Fund, you incur two types of costs: (1) transaction costs, including sales charges (loads) on purchases and redemption fees (if applicable); and (2) ongoing costs, including management fees; distribution or service fees; and other Fund expenses. This Example is intended to help you understand your ongoing costs (in dollars) of investing in a Fund and to compare these costs with the ongoing costs of investing in other mutual funds. The Example is based on an investment of $1,000 invested at the beginning of the period and held for the entire period (April 1, 2007 – September 30, 2007).
Actual Expenses: The first section of each table below provides information about actual account values and actual expenses. You may use the information in this line, together with the amount you invested, to estimate the expenses that you paid over the period. Simply divide your account value by $1,000 (for example, an $8,600 account value divided by $1,000 = 8.6), then multiply the result by the number in the first line under the heading entitled “Expenses Paid During Period” to estimate the expenses you paid on your account during this period.
Hypothetical Example for Comparison Purposes: The second section of each table below provides information about hypothetical account values and hypothetical expenses based on the actual Fund expense ratio and an assumed rate of return of 5% per year (before expenses), which is not the actual return of the Fund. The hypothetical account values and expenses may not be used to estimate the actual ending account balance or expenses you paid for the period. You may use this information to compare the ongoing costs of investing in the Funds and other funds. To do so, compare this 5% hypothetical example with the 5% hypothetical examples that appear in the shareholder reports of the other funds.
Please note that the expenses shown in each table are meant to highlight your ongoing costs only and do not reflect any transactional costs, such as sales charges (loads) or redemption fees (if applicable). Therefore, the second section of each table is useful in comparing ongoing costs only, and will not help you determine the relati ve total costs of owning different funds. In addition, if these transactional costs were included, your costs would have been higher.
| | | Eaton Vance California Municipals Fund | | |
| |
| | | Beginning Account Value | | Ending Account Value | | Expenses Paid During Period* |
| | | (4/1/07) | | (9/30/07) | | (4/1/07 – 9/30/07) |
| |
| Actual | | | | | | |
| Class A | | $1,000.00 | | $994.30 | | $5.65 |
| Class B | | $1,000.00 | | $990.30 | | $9.38 |
| Class C | | $1,000.00 | | $990.30 | | $9.38 |
| |
| |
| Hypothetical | | | | | | |
| (5% return per year before expenses) | | | | | | |
| Class A | | $1,000.00 | | $1,019.40 | | $5.72 |
| Class B | | $1,000.00 | | $1,015.60 | | $9.50 |
| Class C | | $1,000.00 | | $1,015.60 | | $9.50 |
| * | Expenses are equal to the Fund’s annualized expense ratio of 1.13% for Class A shares, 1.88% for Class B shares, and 1.88% for Class C shares multiplied by the average account value over the period, multiplied by 183/365 (to reflect the one-half year period). |
| | The Example assumes that the $1,000 was invested at the net asset value per share determined at the close of business on March 31, 2007. |
| |
20
Eaton Vance Municipals Funds a s o f S e p t e m b e r 3 0 , 2 0 0 7
F U N D E X P E N S E S C O N T ’ D |
| | | Eaton Vance Florida Municipals Fund | | |
| |
| | | Beginning Account Value | | Ending Account Value | | Expenses Paid During Period* |
| | | (4/1/07) | | (9/30/07) | | (4/1/07 – 9/30/07) |
| |
| Actual | | | | | | |
| Class A | | $1,000.00 | | $998.30 | | $6.91 |
| Class B | | $1,000.00 | | $995.10 | | $10.70 |
| Class C | | $1,000.00 | | $995.10 | | $10.65 |
| |
| |
| Hypothetical | | | | | | |
| (5% return per year before expenses) | | | | | | |
| Class A | | $1,000.00 | | $1,018.10 | | $6.98 |
| Class B | | $1,000.00 | | $1,014.30 | | $10.81 |
| Class C | | $1,000.00 | | $1,014.40 | | $10.76 |
| * | Expenses are equal to the Fund’s annualized expense ratio of 1.38% for Class A shares, 2.14% for Class B shares, and 2.13% for Class C shares multiplied by the average account value over the period, multiplied by 183/365 (to reflect the one-half year period). |
| | The Example assumes that the $1,000 was invested at the net asset value per share determined at the close of business on March 31, 2007. |
| |
| | | Eaton Vance Massachusetts Municipals Fund | | |
| |
| | | Beginning Account Value | | Ending Account Value | | Expenses Paid During Period* |
| | | (4/1/07) | | (9/30/07) | | (4/1/07 – 9/30/07) |
| |
| Actual | | | | | | |
| Class A | | $1,000.00 | | $984.50 | | $6.27 |
| Class B | | $1,000.00 | | $981.70 | | $9.99 |
| Class C | | $1,000.00 | | $981.70 | | $9.94 |
| Class I | | $1,000.00 | | $985.50 | | $5.28 |
| |
| |
| Hypothetical | | | | | | |
| (5% return per year before expenses) | | | | | | |
| Class A | | $1,000.00 | | $1,018.80 | | $6.38 |
| Class B | | $1,000.00 | | $1,015.00 | | $10.15 |
| Class C | | $1,000.00 | | $1,015.00 | | $10.10 |
| Class I | | $1,000.00 | | $1,019.80 | | $5.37 |
| * | Expenses are equal to the Fund’s annualized expense ratio of 1.26% for Class A shares, 2.01% for Class B shares, 2.00% for Class C shares, and 1.06% for Class I shares multiplied by the average account value over the period, multiplied by 183/365 (to reflect the one-half year period). The Example assumes that the $1,000 was invested at the next asset value per share determined at the close of business on March 31, 2007. |
| |
21
Eaton Vance Municipals Funds a s o f S e p t e m b e r 3 0 , 2 0 0 7
F U N D E X P E N S E S C O N T ’ D |
| | | Eaton Vance Mississippi Municipals Fund | | |
| |
| | | Beginning Account Value | | Ending Account Value | | Expenses Paid During Period* |
| | | (4/1/07) | | (9/30/07) | | (4/1/07 – 9/30/07) |
| |
| Actual | | | | | | |
| Class A | | $1,000.00 | | $1,005.40 | | $5.48 |
| Class B | | $1,000.00 | | $1,002.00 | | $9.23 |
| |
| |
| Hypothetical | | | | | | |
| (5% return per year before expenses) | | | | | | |
| Class A | | $1,000.00 | | $1,019.60 | | $5.52 |
| Class B | | $1,000.00 | | $1,015.80 | | $9.30 |
| * | Expenses are equal to the Fund’s annualized expense ratio of 1.09% for Class A shares and 1.84% for Class B shares multiplied by the average account value over the period, multiplied by 183/365 (to reflect the one-half year period). The Example assumes that the $1,000 was invested at the net asset value per share determined at the close of business on March 31, 2007. |
| |
| | | Eaton Vance New York Municipals Fund | | |
| |
| | | Beginning Account Value | | Ending Account Value | | Expenses Paid During Period* |
| | | (4/1/07) | | (9/30/07) | | (4/1/07 – 9/30/07) |
| |
| Actual | | | | | | |
| Class A | | $1,000.00 | | $993.30 | | $7.45 |
| Class B | | $1,000.00 | | $989.50 | | $11.17 |
| Class C | | $1,000.00 | | $988.60 | | $11.17 |
| |
| |
| Hypothetical | | | | | | |
| (5% return per year before expenses) | | | | | | |
| Class A | | $1,000.00 | | $1,017.60 | | $7.54 |
| Class B | | $1,000.00 | | $1,013.80 | | $11.31 |
| Class C | | $1,000.00 | | $1,013.80 | | $11.31 |
| * | Expenses are equal to the Fund’s annualized expense ratio of 1.49% for Class A shares, 2.24% for Class B shares and 2.24% for Class C shares multiplied by the average account value over the period, multiplied by 183/365 (to reflect the one-half year period). |
| | The Example assumes that the $1,000 was invested at the net asset per share determined at the close of business on March 31, 2007. |
| |
22
Eaton Vance Municipals Funds a s o f S e p t e m b e r 3 0 , 2 0 0 7
F U N D E X P E N S E S C O N T ’ D |
| | | Eaton Vance Ohio Municipals Fund | | |
| |
| | | Beginning Account Value | | Ending Account Value | | Expenses Paid During Period* |
| | | (4/1/07) | | (9/30/07) | | (4/1/07 – 9/30/07) |
| |
| Actual | | | | | | |
| Class A | | $1,000.00 | | $998.10 | | $5.36 |
| Class B | | $1,000.00 | | $994.40 | | $9.10 |
| Class C | | $1,000.00 | | $995.40 | | $9.10 |
| |
| |
| Hypothetical | | | | | | |
| (5% return per year before expenses) | | | | | | |
| Class A | | $1,000.00 | | $1,019.70 | | $5.42 |
| Class B | | $1,000.00 | | $1,015.90 | | $9.20 |
| Class C | | $1,000.00 | | $1,015.90 | | $9.20 |
| * | Expenses are equal to the Fund’s annualized expense ratio of 1.07% for Class A shares, 1.82% for Class B shares and 1.82% for Class C shares multiplied by the average account value over the period, multiplied by 183/365 (to reflect the one-half year period). |
| | The Example assumes that the $1,000 was invested at the net asset per share determined at the close of business on March 31, 2007. |
| |
| | | Eaton Vance Rhode Island Municipals Fund | | |
| |
| | | Beginning Account Value | | Ending Account Value | | Expenses Paid During Period* |
| | | (4/1/07) | | (9/30/07) | | (4/1/07 – 9/30/07) |
| |
| Actual | | | | | | |
| Class A | | $1,000.00 | | $1,001.00 | | $5.82 |
| Class B | | $1,000.00 | | $996.70 | | $9.56 |
| Class C | | $1,000.00 | | $997.70 | | $9.52 |
| |
| |
| Hypothetical | | | | | | |
| (5% return per year before expenses) | | | | | | |
| Class A | | $1,000.00 | | $1,019.30 | | $5.87 |
| Class B | | $1,000.00 | | $1,015.50 | | $9.65 |
| Class C | | $1,000.00 | | $1,015.50 | | $9.60 |
| * | Expenses are equal to the Fund’s annualized expense ratio of 1.16% for Class A shares, 1.91% for Class B shares, and 1.90% for Class C shares multiplied by the average account value over the period, multiplied by 183/365 (to reflect the one-half year period). |
| | The Example assumes that the $1,000 was invested at the net asset value per share determined at the close of business on March 31, 2007. |
| |
23
Eaton Vance Municipals Funds a s o f S e p t e m b e r 3 0 , 2 0 0 7
F U N D E X P E N S E S C O N T ’ D |
| | | Eaton Vance West Virginia Municipals Fund | | |
| |
| | | Beginning Account Value | | Ending Account Value | | Expenses Paid During Period* |
| | | (4/1/07) | | (9/30/07) | | (4/1/07 – 9/30/07) |
| |
| Actual | | | | | | |
| Class A | | $1,000.00 | | $999.10 | | $5.01 |
| Class B | | $1,000.00 | | $995.70 | | $8.76 |
| |
| |
| Hypothetical | | | | | | |
| (5% return per year before expenses) | | | | | | |
| Class A | | $1,000.00 | | $1,020.10 | | $5.06 |
| Class B | | $1,000.00 | | $1,016.30 | | $8.85 |
| * | Expenses are equal to the Fund’s annualized expense ratio of 1.00% for Class A shares and 1.75% for Class B shares multiplied by the average account value over the period, multiplied by 183/365 (to reflect the one-half year period). The Example assumes that the $1,000 was invested at the net asset value per share determined at the close of business on March 31, 2007. |
| |
24
Eaton Vance California Municipals Fund a s o f S e p t e m b e r 3 0 , 2 0 0 7
P O R T F O L I O O F I N V E S T M E N T S |
| Ta x - E x e m p t I n v e s t m e n t s — 1 0 7 . 9 % | | | | |
| |
| Principal Amount | | | | |
| (000’s omitted) | | Security | | Value |
| |
| Education — 3.7% | | | | |
| $ 3,500 | | California Educational Facilities Authority, | | | | |
| | | (Lutheran University), 5.00%, 10/1/29 | | $ | | 3,454,010 |
| 2,500 | | California Educational Facilities Authority, | | | | |
| | | (Santa Clara University), 5.25%, 9/1/26 | | | | 2,705,425 |
| 4,000 | | California Educational Facilities Authority, | | | | |
| | | (Stanford University), 5.25%, 12/1/32 | | | | 4,150,040 |
| | | | | $ | | 10,309,475 |
| |
| Electric Utilities — 1.1% | | | | |
| $ 3,000 | | Chula Vista, (San Diego Gas), (AMT), | | | | |
| | | 5.00%, 12/1/27 | | $ | | 3,018,810 |
| | | | | $ | | 3,018,810 |
| |
| Escrowed / Prerefunded — 7.1% | | | | |
| $ 1,000 | | Sacramento County, Single Family, (GNMA), | | | | |
| | | (AMT), Escrowed to Maturity, 8.25%, 1/1/21 | | $ | | 1,375,800 |
| 11,285 | | Sacramento County, Single Family, (GNMA), | | | | |
| | | (AMT), Escrowed to Maturity, 8.50%, 11/1/16 | | | | 15,085,337 |
| 5,765 | | San Joaquin Hills Transportation Corridor Agency, | | | | |
| | | Toll Road Bonds, Escrowed to Maturity, 0.00%, 1/1/26 | | | | 2,490,595 |
| 625 | | Santa Margarita Water District, Prerefunded to | | | | |
| | | 9/1/09, 6.20%, 9/1/20 | | | | 668,250 |
| | | | | $ | | 19,619,982 |
| |
| General Obligations — 4.6% | | | | |
| $ 2,250 | | California, 4.75%, 6/1/35 | | $ | | 2,227,612 |
| 2,500 | | California, 5.50%, 11/1/33 | | | | 2,648,875 |
| 7,710 | | San Francisco Bay Area Rapid Transit District, | | | | |
| | | (Election of 2004), Series B, 4.75%, 8/1/37 | | | | 7,772,914 |
| | | | | $ | | 12,649,401 |
| |
| Hospital — 16.4% | | | | |
| $ 1,000 | | California Health Facilities Financing Authority, | | | | |
| | | (Catholic Healthcare West), 5.25%, 7/1/23 | | $ | | 1,032,920 |
| 5,600 | | California Health Facilities Financing Authority, | | | | |
| | | (Cedars-Sinai Medical Center), 5.00%, 11/15/34 | | | | 5,612,656 |
| 4,000 | | California Health Facilities Financing Authority, | | | | |
| | | (Marshall Medical Center), 5.00%, 11/1/33 | | | | 4,017,600 |
| 2,250 | | California Infrastructure and Economic Development, | | | | |
| | | (Kaiser Hospital), 5.50%, 8/1/31 | | | | 2,317,117 |
| 6,500 | | California Statewide Communities Development Authority, | | | | |
| | | (Huntington Memorial Hospital), 5.00%, 7/1/35 | | | | 6,538,935 |
| Principal Amount | | | | |
| (000’s omitted) | | Security | | Value |
| |
| Hospital (continued) | | | | |
| $ 2,500 | | California Statewide Communities Development Authority, | | | | |
| | | (John Muir Health), 5.00%, 8/15/36 | | $ | | 2,502,525 |
| 2,500 | | California Statewide Communities Development Authority, | | | | |
| | | (John Muir Health), Series A, 5.00%, 8/15/34 | | | | 2,506,075 |
| 1,700 | | California Statewide Communities Development Authority, | | | | |
| | | (Kaiser Permanente), 5.00%, 3/1/41 | | | | 1,684,921 |
| 2,900 | | California Statewide Communities Development Authority, | | | | |
| | | (Kaiser Permanente), 5.25%, 3/1/45 | | | | 2,936,308 |
| 1,850 | | California Statewide Communities Development Authority, | | | | |
| | | (Kaiser Permanente), 5.50%, 11/1/32 | | | | 1,898,137 |
| 1,500 | | California Statewide Communities Development Authority, | | | | |
| | | (Sonoma County Indian Health), 6.40%, 9/1/29 | | | | 1,558,245 |
| 2,700 | | San Benito Health Care District, 5.40%, 10/1/20 | | | | 2,702,943 |
| 1,000 | | Torrance Hospital, (Torrance Memorial Medical Center), | | | | |
| | | 5.50%, 6/1/31 | | | | 1,024,510 |
| 2,640 | | Turlock, (Emanuel Medical Center, Inc.), | | | | |
| | | 5.375%, 10/15/34 | | | | 2,651,431 |
| 5,000 | | Washington Township Health Care District, | | | | |
| | | 5.00%, 7/1/37 | | | | 4,938,550 |
| 1,250 | | Washington Township Health Care District, | | | | |
| | | 5.25%, 7/1/29 | | | | 1,261,338 |
| | | | | $ | | 45,184,211 |
| |
| Housing — 0.7% | | | | |
| $ 1,396 | | Commerce (Hermitage III Senior Apartments), | | | | |
| | | 6.50%, 12/1/29 | | $ | | 1,468,527 |
| 419 | | Commerce (Hermitage III Senior Apartments), | | | | |
| | | 6.85%, 12/1/29 | | | | 436,870 |
| | | | | $ | | 1,905,397 |
| |
| Industrial Development Revenue — 2.9% | | | | |
| $ 2,750 | | California Pollution Control Financing Authority, | | | | |
| | | (Browning Ferris Industries), (AMT), 5.80%, 12/1/16 | | $ | | 2,768,260 |
| 1,700 | | California Pollution Control Financing Authority, | | | | |
| | | (Solid Waste Disposal), (AMT), 5.40%, 4/1/25 | | | | 1,715,572 |
| 4,000 | | California Statewide Communities Development Authority, | | | | |
| | | (Anheuser Busch Project), 4.80%, 9/1/46 | | | | 3,665,600 |
| | | | | $ | | 8,149,432 |
| |
| Insured-Education — 1.5% | | | | |
| $ 3,990 | | Puerto Rico Industrial, Tourist, Educational, | | | | |
| | | Medical and Environmental Control Facilities Authority, | | | | |
| | | (University Plaza), (MBIA), 5.00%, 7/1/33(1) | | $ | | 4,101,388 |
| | | | | $ | | 4,101,388 |
S e e n o t e s t o f i n a n c i a l s t a t e m e n t s
25 |
Eaton Vance California Municipals Fund a s o f S e p t e m b e r 3 0 , 2 0 0 7
P O R T F O L I O O F I N V E S T M E N T S C O N T ’ D |
| Principal Amount | | | | |
| (000’s omitted) | | Security | | Value |
| |
| Insured-Electric Utilities — 7.1% | | | | |
| $ 5,000 | | California Pollution Control Financing Authority, PCR, | | | | |
| | | (Pacific Gas and Electric), (MBIA), (AMT), | | | | |
| | | 5.35%, 12/1/16 | | $ | | 5,271,350 |
| 9,000 | | Northern California Power Agency, (Hydroelectric), | | | | |
| | | (MBIA), 5.125%, 7/1/23(1) | | | | 9,172,890 |
| 7,070 | | Southern California Public Power Authority, (MBIA), | | | | |
| | | 0.00%, 7/1/15 | | | | 5,221,478 |
| | | | | $ | | 19,665,718 |
| |
| Insured-Escrowed / Prerefunded — 5.6% | | | | |
| $ 2,500 | | California Infrastructure and Economic Development, | | | | |
| | | (Bay Area Toll Bridges), (AMBAC), Prerefunded to | | | | |
| | | 1/1/28, 5.00%, 7/1/33(2) | | $ | | 2,708,350 |
| 5,000 | | California Infrastructure and Economic Development, | | | | |
| | | (Bay Area Toll Bridges), (FGIC), Prerefunded to 1/1/28, | | | | |
| | | 5.00%, 7/1/29 | | | | 5,416,700 |
| 15,000 | | Foothill/Eastern Corridor Agency, Toll Road Bonds, (FSA), | | | | |
| | | Escrowed to Maturity, 0.00%, 1/1/28 | | | | 5,841,300 |
| 1,500 | | Puerto Rico Electric Power Authority, (FSA), | | | | |
| | | Prerefunded to 7/1/10, 5.25%, 7/1/29(1) | | | | 1,584,235 |
| | | | | $ | | 15,550,585 |
| |
| Insured-General Obligations — 8.4% | | | | |
| $ 3,000 | | Allan Hancock, (Joint Community College), (FSA), | | | | |
| | | 4.375%, 8/1/31 | | $ | | 2,887,981 |
| 3,500 | | California, (AGC), 4.50%, 8/1/30 | | | | 3,320,170 |
| 6,500 | | Los Angeles Unified School District, (Election of 2005), | | | | |
| | | Series E, (FSA), 4.75%, 7/1/32 | | | | 6,578,065 |
| 2,285 | | Merced Unified School District, (FGIC), 0.00%, 8/1/19 | | | | 1,379,066 |
| 3,300 | | Puerto Rico, (FSA), Variable Rate, | | | | |
| | | 7.742%, 7/1/27(3)(4) | | | | 3,852,981 |
| 4,500 | | San Diego Unified School District, (MBIA), | | | | |
| | | 5.50%, 7/1/24(1) | | | | 5,125,410 |
| | | | | $ | | 23,143,673 |
| |
| Insured-Hospital — 2.8% | | | | |
| $ 2,550 | | California Statewide Communities Development Authority, | | | | |
| | | (Children’s Hospital Los Angeles), (MBIA), | | | | |
| | | 5.25%, 8/15/29 | | $ | | 2,634,023 |
| 4,920 | | California Statewide Communities Development Authority, | | | | |
| | | (Sutter Health), (FSA), 5.75%, 8/15/27(1) | | | | 5,131,756 |
| | | | | $ | | 7,765,779 |
| Principal Amount | | | | |
| (000’s omitted) | | Security | | Value |
| |
| Insured-Lease Revenue / Certificates of | | | | |
| Participation — 5.0% | | | | |
| $ 6,500 | | Anaheim Public Financing Authority, | | | | |
| | | (Public Improvements), (FSA), 0.00%, 9/1/22 | | $ | | 3,273,075 |
| 11,280 | | Anaheim Public Financing Authority, | | | | |
| | | (Public Improvements), (FSA), 0.00%, 9/1/30 | | | | 3,701,645 |
| 5,000 | | Los Angeles County, (Disney Parking), (AMBAC), | | | | |
| | | 0.00%, 9/1/17 | | | | 3,321,150 |
| 5,370 | | Los Angeles County, (Disney Parking), (AMBAC), | | | | |
| | | 0.00%, 3/1/18 | | | | 3,460,428 |
| | | | | $ | | 13,756,298 |
| |
| Insured-Special Tax Revenue — 4.9% | | | | |
| $ 2,565 | | Ceres Redevelopment Agency, | | | | |
| | | (Ceres Redevelopment Project Area No. 1), | | | | |
| | | (AMBAC), 4.00%, 11/1/31 | | $ | | 2,278,130 |
| 1,400 | | Palm Springs Community Redevelopment, | | | | |
| | | (Merged Project No. 1), Series A, (AMBAC), | | | | |
| | | 5.00%, 9/1/34 | | | | 1,445,528 |
| 5,000 | | Puerto Rico Infrastructure Financing Authority, | | | | |
| | | (AMBAC), 5.50%, 7/1/27(1) | | | | 5,717,050 |
| 4,540 | | San Francisco Bay Area Rapid Transportation District, | | | | |
| | | Sales Tax Revenue, (FSA), 4.25%, 7/1/36 | | | | 4,173,032 |
| | | | | $ | | 13,613,740 |
| |
| Insured-Transportation — 6.0% | | | | |
| $ 4,320 | | Los Angeles County Metropolitan Transportation | | | | |
| | | Authority, (AMBAC), 5.00%, 7/1/23(1) | | $ | | 4,442,112 |
| 5,500 | | Puerto Rico Highway and Transportation Authority, | | | | |
| | | Series CC, (FSA), 5.25%, 7/1/32 | | | | 6,124,855 |
| 2,000 | | San Francisco City and County Airport Commission, | | | | |
| | | International Airport Revenue, (FGIC), (AMT), | | | | |
| | | Variable Rate, 6.876%, 5/1/30(3)(4) | | | | 2,028,080 |
| 1,800 | | San Joaquin Hills Transportation Corridor Agency, | | | | |
| | | Toll Road Bonds, (MBIA), 0.00%, 1/15/24 | | | | 855,054 |
| 3,000 | | San Jose, Airport Revenue, (AMBAC), (AMT), | | | | |
| | | Series A, 5.00%, 3/1/37 | | | | 3,024,570 |
| | | | | $ | | 16,474,671 |
| |
| Insured-Water and Sewer — 8.9% | | | | |
| $ 2,000 | | Calleguas Las Virgenes Public Financing Authority | | | | |
| | | Revenue (Municipal Water District), (MBIA), | | | | |
| | | 4.25%, 7/1/32 | | $ | | 1,860,700 |
| 8,000 | | Clovis Public Financing Authority, | | | | |
| | | Wastewater Revenue, (AMBAC), 4.50%, 8/1/38 | | | | 7,671,200 |
S e e n o t e s t o f i n a n c i a l s t a t e m e n t s
26 |
Eaton Vance California Municipals Fund a s o f S e p t e m b e r 3 0 , 2 0 0 7
P O R T F O L I O O F I N V E S T M E N T S C O N T ’ D |
| Principal Amount | | | | |
| (000’s omitted) | | Security | | Value |
| |
| Insured-Water and Sewer (continued) | | | | |
| $ 6,675 | | Los Angeles, Department of Water and Power, | | | | |
| | | (FSA), 4.75%, 7/1/36 | | $ | | 6,711,112 |
| 1,680 | | Los Angeles, Department of Water and Power, | | | | |
| | | (MBIA), 3.00%, 7/1/30 | | | | 1,288,274 |
| 3,000 | | San Diego County Water Authority, (FGIC), | | | | |
| | | Variable Rate, 7.433%, 4/22/09(5) | | | | 3,202,830 |
| 4,135 | | San Francisco City and County Public Utilities Commission, | | | | |
| | | (FSA), 4.25%, 11/1/33 | | | | 3,865,605 |
| | | | | $ | | 24,599,721 |
| |
| Lease Revenue / Certificates of Participation — 9.0% |
| $ 5,000 | | California Public Works, (University of California), | | | | |
| | | 5.25%, 6/1/20 | | $ | | 5,462,700 |
| 5,115 | | Los Angeles County, (Disney Parking), 0.00%, 3/1/16 | | | | 3,486,333 |
| 1,925 | | Los Angeles County, (Disney Parking), 0.00%, 3/1/17 | | | | 1,244,724 |
| 3,100 | | Los Angeles County, (Disney Parking), 0.00%, 3/1/20 | | | | 1,689,965 |
| 6,520 | | Pasadena Parking Facility, 6.25%, 1/1/18 | | | | 7,322,090 |
| 5,000 | | Sacramento City Financing Authority, 5.40%, 11/1/20 | | | | 5,550,250 |
| | | | | $ | | 24,756,062 |
| |
| Other Revenue — 2.6% | | | | |
| $ 615 | | California Infrastructure and Economic Development, | | | | |
| | | (Performing Arts Center), 5.00%, 12/1/32 | | $ | | 623,628 |
| 920 | | California Infrastructure and Economic Development, | | | | |
| | | (Performing Arts Center), 5.00%, 12/1/37 | | | | 929,816 |
| 5,135 | | Golden State Tobacco Securitization Corp., 5.75%, 6/1/47 | | | | 4,900,125 |
| 700 | | Puerto Rico Infrastructure Financing Authority, | | | | |
| | | Variable Rate, 8.488%, 10/1/34(3)(4) | | | | 815,346 |
| | | | | $ | | 7,268,915 |
| |
| Senior Living / Life Care — 0.4% | | | | |
| $ 250 | | California Statewide Communities Development Authority, | | | | |
| | | (Senior Living - Presbyterian Homes), 4.75%, 11/15/26 | | $ | | 237,180 |
| 1,000 | | California Statewide Communities Development Authority, | | | | |
| | | (Senior Living - Presbyterian Homes), 4.875%, 11/15/36 | | | | 929,530 |
| | | | | $ | | 1,166,710 |
| |
| Special Tax Revenue — 8.6% | | | | |
| $ 2,500 | | Bonita Canyon Public Financing Authority, 5.375%, 9/1/28 | | $ | | 2,453,700 |
| 415 | | Brentwood Infrastructure Financing Authority, 5.00%, 9/2/26 | | | | 393,806 |
| 665 | | Brentwood Infrastructure Financing Authority, 5.00%, 9/2/34 | | | | 610,257 |
| 1,810 | | Corona Public Financing Authority, 5.80%, 9/1/20 | | | | 1,814,543 |
| Principal Amount | | |
| (000’s omitted) | | Security | | Value |
| |
| Special Tax Revenue (continued) | | |
| $ 985 | | Fairfield Improvement Bond Act of 1915, | | |
| | | (North Cordelia District), 7.375%, 9/2/18 | | $ 1,023,878 |
| 600 | | Jurupa Community Services District, | | |
| | | (Community Facilities District No. 16), 5.30%, 9/1/34 | | 579,540 |
| 2,110 | | Lincoln Public Financing Authority, | | |
| | | Improvement Bond Act of 1915, (Twelve Bridges), | | |
| | | 6.20%, 9/2/25 | | 2,186,192 |
| 1,430 | | Moreno Valley Unified School District, 5.95%, 9/1/34 | | 1,446,088 |
| 6,475 | | Puerto Rico Sales Tax Financing, 5.25%, 8/1/57 | | 6,713,863 |
| 1,675 | | Santa Margarita Water District, 6.20%, 9/1/20 | | 1,741,799 |
| 1,000 | | Santaluz Community Facilities District No. 2, | | |
| | | 6.20%, 9/1/30 | | 1,003,420 |
| 350 | | Temecula Unified School District, 5.00%, 9/1/27 | | 330,782 |
| 535 | | Temecula Unified School District, 5.00%, 9/1/37 | | 491,167 |
| 1,000 | | Torrance Redevelopment Agency, 5.625%, 9/1/28 | | 1,002,890 |
| 1,000 | | Tustin Community Facilities District, 6.00%, 9/1/37 | | 1,030,470 |
| 900 | | Whittier Public Financing Authority, | | |
| | | (Greenleaf Avenue Redevelopment), 5.50%, 11/1/23 | | 917,334 |
| | | | | $ 23,739,729 |
| |
| Water and Sewer — 0.6% | | |
| $ 1,740 | | Metropolitan Water District of Southern California | | |
| | | (Waterworks Revenue Authorization), | | |
| | | 4.75%, 7/1/36(1) | | $ 1,754,155 |
| | | | | $ 1,754,155 |
| |
| Total Tax-Exempt Investments — 107.9% | | |
| (identified cost $283,357,690) | | $298,193,852 |
| |
| Other Assets, Less Liabilities — (7.9)% | | $ (21,929,993) |
| |
| Net Assets — 100.0% | | $276,263,859 |
| |
| AGC - Assured Guaranty Corp. | | |
| AMBAC - AMBAC Financial Group, Inc. | | |
| AMT - Interest earned from these securities may be considered a |
| tax preference item for purposes of the Federal Alternative |
| Minimum Tax. | | |
| FGIC - Financial Guaranty Insurance Company | | |
| FSA - Financial Security Assurance, Inc. | | |
| GNMA - Government National Mortgage Association (Ginnie Mae) |
| MBIA - Municipal Bond Insurance Association | | |
S e e n o t e s t o f i n a n c i a l s t a t e m e n t s
27 |
Eaton Vance California Municipals Fund a s o f S e p t e m b e r 3 0 , 2 0 0 7
P O R T F O L I O O F I N V E S T M E N T S C O N T ’ D |
The Fund invests primarily in debt securities issued by California municipalities. The ability of the issuers of the debt securities to meet their obligations may be affected by economic developments in a specific industry or municipality. In order to reduce the risk associated with such economic developments, at September 30, 2007, 46.5% of total investments are backed by bond insurance of various financial institutions and financial guaranty assurance agencies. The aggregate percentage insured by an individual financial institution ranged from 1.1% to 18.0% of total investments.
| (1) | Security represents the underlying municipal obligation of an inverse floating rate obligation held by the Fund. |
| |
| (2) | Security (or a portion thereof) has been segregated to cover margin requirements on open financial futures contracts. |
| |
| (3) | Security exempt from registration under Rule 144A of the Securities Act of 1933. These securities may be sold in transactions exempt from registration, normally to qualified institutional buyers. At September 30, 2007, the aggregate value of the securities is $6,696,407 or 2.4% of the Fund’s net assets. |
| |
| (4) | Security has been issued as a leveraged inverse floater bond. The stated interest rate represents the rate in effect at September 30, 2007. |
| |
| (5) | Security has been issued as an inverse floater bond. The stated interest rate represents the rate in effect at September 30, 2007. |
| |
S e e n o t e s t o f i n a n c i a l s t a t e m e n t s
28 |
Eaton Vance Florida Municipals Fund a s o f S e p t e m b e r 3 0 , 2 0 0 7
P O R T F O L I O O F I N V E S T M E N T S |
| Ta x - E x e m p t I n v e s t m e n t s — 1 1 4 . 2 % | | | | |
| |
| Principal Amount | | | | |
| (000’s omitted) | | Security | | Value |
| |
| Escrowed / Prerefunded — 4.3% | | | | |
| $ 1,000 | | Capital Trust Agency, (Seminole Tribe Convention), | | | | |
| | | Prerefunded to 10/1/12, 8.95%, 10/1/33(1) | | $ | | 1,226,170 |
| 615 | | Florida Mid-Bay Bridge Authority, Escrowed to Maturity, | | | | |
| | | 6.10%, 10/1/22 | | | | 726,721 |
| 1,675 | | Florida Mid-Bay Bridge Authority, Escrowed to Maturity, | | | | |
| | | 6.875%, 10/1/22 | | | | 2,129,243 |
| 1,000 | | Halifax Medical Center, Prerefunded to 10/1/10, | | | | |
| | | 7.25%, 10/1/24 | | | | 1,118,560 |
| 500 | | Lee County Industrial Development Authority, | | | | |
| | | (Shell Point Village), Prerefunded to 11/15/09, | | | | |
| | | 5.50%, 11/15/21 | | | | 524,610 |
| 3,690 | | North Miami Health Care Facilities Authority, (Imperial Club), | | | | |
| | | Prerefunded to 1/1/09, 6.75%, 1/1/33 | | | | 3,915,902 |
| 605 | | Vista Lakes Community Development District, | | | | |
| | | Prerefunded to 5/1/10, 7.20%, 5/1/32 | | | | 658,065 |
| | | | | $ | | 10,299,271 |
| |
| Health Care-Miscellaneous — 0.4% | | | | |
| $ 1,003 | | Osceola County Industrial Development Authority, | | | | |
| | | Community Provider Pooled Loan, 7.75%, 7/1/17 | | $ | | 1,003,822 |
| | | | | $ | | 1,003,822 |
| |
| Hospital — 8.2% | | | | |
| $ 1,910 | | Brevard County Health Facilities Authority, | | | | |
| | | (Health First, Inc.), 5.00%, 4/1/36 | | $ | | 1,901,367 |
| 2,795 | | Cape Canaveral Hospital District, | | | | |
| | | (Cape Canaveral Hospital, Inc.), 5.25%, 1/1/28 | | | | 2,814,258 |
| 1,750 | | Highlands County Health Facilities Authority, | | | | |
| | | (Adventist Glenoaks Hospital/Adventist Healthcare), | | | | |
| | | 5.00%, 11/15/31 | | | | 1,755,110 |
| 250 | | Highlands County Health Facilities Authority, | | | | |
| | | (Adventist Health System), 5.00%, 11/15/35 | | | | 250,232 |
| 2,750 | | Jacksonville Economic Development Authority, | | | | |
| | | (Mayo Clinic), 5.50%, 11/15/36 | | | | 2,879,030 |
| 4,790 | | Orange County Health Facilities Authority, | | | | |
| | | (Orlando Regional Healthcare), 5.125%, 11/15/39 | | | | 4,816,249 |
| 2,865 | | South Miami Health Facilities Authority, | | | | |
| | | (Baptist Health), 5.00%, 8/15/42 | | | | 2,857,780 |
| 2,500 | | West Orange Health Care District, 5.80%, 2/1/31 | | | | 2,585,475 |
| | | | | $ | | 19,859,501 |
| Principal Amount | | | | |
| (000’s omitted) | | Security | | Value |
| |
| Housing — 0.4% | | | | |
| $ 65 | | Florida Housing Finance Authority, 6.35%, 6/1/14 | | $ | | 65,105 |
| 460 | | Florida Housing Finance Authority, (AMT), 6.35%, 7/1/28 | | | | 464,830 |
| 485 | | Orange County Housing Finance Authority, (AMT), | | | | |
| | | 6.60%, 4/1/28 | | | | 488,162 |
| | | | | $ | | 1,018,097 |
| |
| Housing-Multifamily — 1.4% | | | | |
| $ 1,515 | | Capital Trust Agency, (Atlantic Housing Foundation), | | | | |
| | | 5.30%, 7/1/35 | | $ | | 1,511,591 |
| 1,720 | | Florida Capital Projects Finance Authority, | | | | |
| | | Student Housing Revenue, (Florida University), | | | | |
| | | Prerefunded to 8/15/10, 7.75%, 8/15/20 | | | | 1,918,643 |
| | | | | $ | | 3,430,234 |
| |
| Industrial Development Revenue — 4.2% | | | | |
| $ 2,314 | | Broward County, Industrial Development Revenue, | | | | |
| | | (Lynxs Cargoport), (AMT), 6.75%, 6/1/19 | | $ | | 2,350,302 |
| 2,460 | | Capital Trust Agency, (Fort Lauderdale Project), | | | | |
| | | (AMT), 5.75%, 1/1/32 | | | | 2,486,912 |
| 5,000 | | Liberty Development Corp., (Goldman Sachs Group, Inc.), | | | | |
| | | 5.25%, 10/1/35 | | | | 5,340,550 |
| | | | | $ | | 10,177,764 |
| |
| Insured-Education — 2.9% | | | | |
| $ 7,030 | | Florida Capital Improvement Revenue, | | | | |
| | | (Florida Gulf Coast University Financing Corporation), | | | | |
| | | (MBIA), 4.75%, 8/1/32 | | $ | | 7,036,678 |
| | | | | $ | | 7,036,678 |
| |
| Insured-Electric Utilities — 2.1% | | | | |
| $ 5,125 | | Lakeland Energy System, (XLCA), 4.75%, 10/1/36 | | $ | | 5,081,130 |
| | | | | $ | | 5,081,130 |
| |
| Insured-Escrowed / Prerefunded — 11.2% | | | | |
| $ 9,225 | | Dade County, (Baptist Hospital of Miami), (MBIA), | | | | |
| | | Escrowed to Maturity, 5.75%, 5/1/21 | | $ | | 10,283,845 |
| 3,835 | | Dade County, Professional Sports Franchise Facility, (MBIA), | | | | |
| | | Escrowed to Maturity, 0.00%, 10/1/23 | | | | 1,880,952 |
| 7,830 | | Orange County Tourist Development Tax, (AMBAC), | | | | |
| | | Prerefunded to 4/1/12, 5.125%, 10/1/30(2) | | | | 8,334,539 |
| 5,600 | | St. Lucie Utility System, (FGIC), Escrowed to Maturity, | | | | |
| | | 6.00%, 10/1/20 | | | | 6,572,160 |
| | | | | $ | | 27,071,496 |
S e e n o t e s t o f i n a n c i a l s t a t e m e n t s
29 |
Eaton Vance Florida Municipals Fund a s o f S e p t e m b e r 3 0 , 2 0 0 7
P O R T F O L I O O F I N V E S T M E N T S C O N T ’ D |
| Principal Amount | | | | |
| (000’s omitted) | | Security | | Value |
| |
| Insured-General Obligations — 1.3% | | | | |
| $ 2,700 | | Puerto Rico, (MBIA), 5.50%, 7/1/20(2) | | $ | | 3,076,776 |
| | | | | $ | | 3,076,776 |
| |
| Insured-Health Care-Miscellaneous — 0.0% | | |
| $ 26 | | Osceola County Industrial Development Authority, | | | | |
| | | Community Provider Pooled Loan-93 Program, | | | | |
| | | (FSA), 7.75%, 7/1/10 | | $ | | 26,274 |
| | | | | $ | | 26,274 |
| |
| Insured-Hospital — 4.4% | | | | |
| $ 9,560 | | Sarasota County Public Hospital Board, | | | | |
| | | (Sarasota Memorial Hospital), (MBIA), 5.50%, 7/1/28 | | $ | | 10,736,358 |
| | | | | $ | | 10,736,358 |
| |
| Insured-Housing — 1.2% | | | | |
| $ 3,000 | | Florida Housing Finance Authority, (Brittany of Rosemont), | | | | |
| | | (AMBAC), (AMT), 6.875%, 8/1/26 | | $ | | 3,003,750 |
| | | | | $ | | 3,003,750 |
| |
| Insured-Lease Revenue / Certificates of | | | | |
| Participation — 1.5% | | | | |
| $ 3,300 | | Puerto Rico Public Finance Corp., (AMBAC), | | | | |
| | | 5.125%, 6/1/24(2) | | $ | | 3,588,079 |
| | | | | $ | | 3,588,079 |
| |
| Insured-Special Tax Revenue — 15.7% | | | | |
| $ 4,875 | | Cape Coral, Special Obligation, (MBIA), 4.50%, 10/1/36 | | $ | | 4,658,257 |
| 6,345 | | Dade County, Special Obligation, (AMBAC), | | | | |
| | | 5.00%, 10/1/35(2) | | | | 6,372,622 |
| 1,500 | | Jacksonville, Excise Tax, (FGIC), (AMT), 0.00%, 10/1/12 | | | | 1,235,565 |
| 1,575 | | Miami-Dade County, Special Obligation, (MBIA), | | | | |
| | | 0.00%, 10/1/36 | | | | 353,903 |
| 6,630 | | Miami-Dade County, Special Obligation, (MBIA), | | | | |
| | | 0.00%, 10/1/37 | | | | 1,410,731 |
| 5,000 | | Miami-Dade County, Special Obligation, (MBIA), | | | | |
| | | 0.00%, 10/1/38 | | | | 1,007,950 |
| 10,000 | | Miami-Dade County, Special Obligation, (MBIA), | | | | |
| | | 0.00%, 10/1/39 | | | | 1,909,600 |
| 10,055 | | Miami-Dade County, Special Obligation, (MBIA), | | | | |
| | | 0.00%, 10/1/40 | | | | 1,822,972 |
| 985 | | Opa-Locka Sales Tax, (FGIC), 7.00%, 1/1/14 | | | | 987,689 |
| 4,000 | | Sunrise Public Facilities, (MBIA), 0.00%, 10/1/15 | | | | 2,918,080 |
| 4,140 | | Sunrise Public Facilities, (MBIA), 0.00%, 10/1/16 | | | | 2,880,364 |
| 2,525 | | Sunrise Public Facilities, (MBIA), 0.00%, 10/1/17 | | | | 1,674,201 |
| Principal Amount | | | | |
| (000’s omitted) | | Security | | Value |
| |
| Insured-Special Tax Revenue (continued) | | | | |
| $ 2,000 | | Tampa Utility Tax, (AMBAC), 0.00%, 10/1/18 | | $ | | 1,261,980 |
| 6,800 | | Tampa Utility Tax, (AMBAC), 0.00%, 4/1/19 | | | | 4,162,756 |
| 5,000 | | Tampa Utility Tax, (AMBAC), 0.00%, 10/1/19 | | | | 2,996,300 |
| 4,000 | | Tampa Utility Tax, (AMBAC), 0.00%, 10/1/20 | | | | 2,269,920 |
| | | | | $ | | 37,922,890 |
| |
| Insured-Transportation — 19.1% | | | | |
| $ 1,225 | | Florida Turnpike Authority, (FSA), 4.50%, 7/1/28 | | $ | | 1,206,233 |
| 8,750 | | Florida Turnpike Authority, Water & Sewer Revenue, | | | | |
| | | (Department of Transportation), (FGIC), 4.50%, 7/1/27(3) | | | | 8,653,488 |
| 8,700 | | Greater Orlando Aviation Authority, (FGIC), (AMT), | | | | |
| | | 5.25%, 10/1/18(2) | | | | 8,948,733 |
| 7,680 | | Miami-Dade County, Aviation Revenue, | | | | |
| | | (Miami International Airport), (CIFG), (AMT), | | | | |
| | | 5.00%, 10/1/38(2) | | | | 7,655,962 |
| 2,000 | | Orlando and Orange County Expressway Authority, | | | | |
| | | (FGIC), 8.25%, 7/1/14 | | | | 2,536,140 |
| 7,500 | | Palm Beach County Airport System, (MBIA), (AMT), | | | | |
| | | 5.00%, 10/1/34(2) | | | | 7,540,500 |
| 1,100 | | Port Palm Beach District, (Public Improvements), | | | | |
| | | (XLCA), 0.00%, 9/1/22 | | | | 562,870 |
| 1,100 | | Port Palm Beach District, (Public Improvements), | | | | |
| | | (XLCA), 0.00%, 9/1/23 | | | | 534,820 |
| 4,500 | | Puerto Rico Highway and Transportation Authority, | | | | |
| | | (AMBAC), 5.25%, 7/1/38 | | | | 5,022,495 |
| 3,940 | | Tampa-Hillsborough County Expressway Authority, | | | | |
| | | (AMBAC), 4.00%, 7/1/34 | | | | 3,467,673 |
| | | | | $ | | 46,128,914 |
| |
| Insured-Water and Sewer — 13.6% | | | | |
| $10,000 | | Fort Myers Utility, (FGIC), 5.50%, 10/1/29(2) | | $ | | 10,398,700 |
| 2,500 | | Martin County Utilities System, (AMBAC), 5.00%, 10/1/28 | | | | 2,581,775 |
| 2,000 | | Miami Beach, Storm Water, (FGIC), 5.375%, 9/1/30 | | | | 2,095,780 |
| 10,525 | | Sunrise Utility System, (AMBAC), 5.00%, 10/1/28 | | | | 10,991,784 |
| 2,600 | | Tampa Bay Water Utility System, (FGIC), | | | | |
| | | 4.75%, 10/1/27(2) | | | | 2,609,968 |
| 4,150 | | Tampa Bay Water Utility System, (FGIC), Prerefunded | | | | |
| | | to 10/1/08, 4.75%, 10/1/27(2) | | | | 4,240,168 |
| | | | | $ | | 32,918,175 |
| |
| Nursing Home — 3.2% | | | | |
| $ 4,085 | | Dade County Industrial Development Authority, | | | | |
| | | (Gramercy Park Nursing Care), (FHA), 6.60%, 8/1/23 | | $ | | 4,092,271 |
| 3,500 | | Orange County Health Facilities Authority, | | | | |
| | | (Westminster Community Care), 6.60%, 4/1/24 | | | | 3,591,840 |
| | | | | $ | | 7,684,111 |
S e e n o t e s t o f i n a n c i a l s t a t e m e n t s
30 |
Eaton Vance Florida Municipals Fund a s o f S e p t e m b e r 3 0 , 2 0 0 7
P O R T F O L I O O F I N V E S T M E N T S C O N T ’ D |
| Principal Amount | | |
| (000’s omitted) | | Security | | Value |
| |
| Senior Living / Life Care — 2.4% | | |
| $ 4,100 | | North Miami Health Care Facilities Authority, | | |
| | | (Imperial Club), 6.125%, 1/1/42 | | $ 3,954,696 |
| 1,750 | | Plantation Health Facilities Authority, | | |
| | | (Covenant Village of Florida), 5.125%, 12/1/22 | | 1,754,148 |
| | | | | $ 5,708,844 |
| |
| Special Tax Revenue — 13.0% | | |
| $ 1,115 | | Concorde Estates Community Development District, | | |
| | | 5.85%, 5/1/35 | | $ 1,074,336 |
| 255 | | Covington Park Community Development District, | | |
| | | (Capital Improvements), 5.00%, 5/1/21 | | 259,011 |
| 1,185 | | Covington Park Community Development District, | | |
| | | (Capital Improvements), 5.00%, 5/1/31 | | 1,178,447 |
| 560 | | Dupree Lakes Community Development District, | | |
| | | 5.00%, 11/1/10 | | 560,022 |
| 530 | | Dupree Lakes Community Development District, | | |
| | | 5.00%, 5/1/12 | | 508,461 |
| 1,015 | | Dupree Lakes Community Development District, | | |
| | | 5.375%, 5/1/37 | | 898,935 |
| 970 | | Fishhawk Community Development District, | | |
| | | 6.125%, 5/1/34 | | 1,030,703 |
| 235 | | Gateway Services Community Development District, | | |
| | | Special Assessment, 6.50%, 5/1/33 | | 257,085 |
| 5 | | Heritage Harbor South Community Development District, | | |
| | | (Capital Improvements), 5.40%, 11/1/08 | | 5,011 |
| 660 | | Heritage Harbor South Community Development District, | | |
| | | (Capital Improvements), 6.20%, 5/1/35 | | 729,267 |
| 480 | | Heritage Harbor South Community Development District, | | |
| | | (Capital Improvements), 6.50%, 5/1/34 | | 531,341 |
| 1,335 | | Heritage Springs Community Development District, | | |
| | | 5.25%, 5/1/26 | | 1,301,678 |
| 1,100 | | Lexington Oaks Community Development District, | | |
| | | 7.20%, 5/1/30 | | 1,124,519 |
| 185 | | Longleaf Community Development District, 6.20%, 5/1/09 | | 185,250 |
| 880 | | New River Community Development District, | | |
| | | (Capital Improvements), 5.00%, 5/1/13 | | 837,663 |
| 360 | | New River Community Development District, | | |
| | | (Capital Improvements), 5.35%, 5/1/38 | | 317,135 |
| 1,230 | | North Springs Improvement District, (Heron Bay), | | |
| | | 5.20%, 5/1/27 | | 1,122,055 |
| 6,065 | | Puerto Rico Sales Tax Financing, 5.25%, 8/1/57 | | 6,288,738 |
| 2,270 | | River Hall Community Development District, | | |
| | | (Capital Improvements), 5.45%, 5/1/36 | | 1,942,530 |
| 970 | | Southern Hills Plantation I Community Development District, | | |
| | | 5.80%, 5/1/35 | | 940,755 |
| 1,670 | | Sterling Hill Community Development District, | | |
| | | 6.20%, 5/1/35 | | 1,794,064 |
| Principal Amount | | |
| (000’s omitted) | | Security | | Value |
| |
| Special Tax Revenue (continued) | | |
| $ 2,500 | | Tisons Landing Community Development District, | | |
| | | 5.625%, 5/1/37 | | $ 2,298,150 |
| 2,770 | | University Square Community Development District, | | |
| | | 6.75%, 5/1/20 | | 2,875,066 |
| 400 | | West Palm Beach Community Redevelopment Agency, | | |
| | | (Northwood Pleasant Community), 5.00%, 3/1/29 | | 405,476 |
| 2,870 | | West Palm Beach Community Redevelopment Agency, | | |
| | | (Northwood Pleasant Community), 5.00%, 3/1/35 | | 2,889,516 |
| | | | | $ 31,355,214 |
| |
| Transportation — 1.0% | | |
| $ 2,385 | | Florida Mid-Bay Bridge Authority, 6.10%, 10/1/22 | | $ 2,454,141 |
| | | | | $ 2,454,141 |
| |
| Water and Sewer — 2.7% | | |
| $ 6,275 | | Jacksonville Electric Authority, Water and Sewer Revenue, | | |
| | | 5.25%, 10/1/39 | | $ 6,457,414 |
| | | | | $ 6,457,414 |
| |
| Total Tax-Exempt Investments — 114.2% | | |
| (identified cost $260,250,333) | | $276,038,933 |
| |
| Other Assets, Less Liabilities — (14.2)% | | $ (34,343,992) |
| |
| Net Assets — 100.0% | | $241,694,941 |
| AMBAC - AMBAC Financial Group, Inc. | | |
| AMT - Interest earned from these securities may be considered a |
| tax preference item for purposes of the Federal Alternative |
| Minimum Tax. | | |
| CIFG - CIFG Assurance North America, Inc. | | |
| FGIC - Financial Guaranty Insurance Company | | |
| FHA - Federal Housing Administration | | |
| FSA - Financial Security Assurance, Inc. | | |
| MBIA - Municipal Bond Insurance Association | | |
| XLCA - XL Capital Assurance, Inc. | | |
| The Fund invests primarily in debt securities issued by Florida |
| municipalities. The ability of the issuers of the debt securities to |
| meet their obligations may be affected by economic developments |
| in a specific industry or municipality. In order to reduce the risk |
| associated with such economic developments, at September 30, |
| 2007, 64.0% of total investments are backed by bond insurance of |
| various financial institutions and financial guaranty assurance |
| agencies. The aggregate percentage insured by an individual |
| financial institution ranged from 0.4% to 21.4% of total investments. |
S e e n o t e s t o f i n a n c i a l s t a t e m e n t s
31 |
Eaton Vance Florida Municipals Fund a s o f S e p t e m b e r 3 0 , 2 0 0 7
P O R T F O L I O O F I N V E S T M E N T S C O N T ’ D |
| (1) | Security exempt from registration under Rule 144A of the Securities Act of 1933. These securities may be sold in transactions exempt from registration, normally to qualified institutional buyers. At September 30, 2007, the aggregate value of the securities is $1,226,170 or 0.5% of the Fund’s net assets. |
| |
| (2) | Security represents the underlying municipal obligation of an inverse floating rate obligation held by the Fund. |
| |
| (3) | Security (or a portion thereof) has been segregated to cover margin requirements on open financial futures contracts. |
| |
S e e n o t e s t o f i n a n c i a l s t a t e m e n t s
32 |
Eaton Vance Massachusetts Municipals Fund a s o f S e p t e m b e r 3 0 , 2 0 0 7
P O R T F O L I O O F I N V E S T M E N T S |
| Ta x - E x e m p t I n v e s t m e n t s — 1 0 2 . 8 % | | | | |
| |
| Principal Amount | | | | |
| (000’s omitted) | | Security | | Value |
| |
| Education — 15.1% | | | | |
| $ 5,000 | | Massachusetts Development Finance Agency, | | | | |
| | | (Boston College), Variable Rate, 6.853%, 7/1/42(1)(2) | | $ | | 5,412,950 |
| 5,500 | | Massachusetts Development Finance Agency, | | | | |
| | | (Boston University), 5.45%, 5/15/59 | | | | 5,672,480 |
| 10,000 | | Massachusetts Development Finance Agency, | | | | |
| | | (Dexter School), 5.00%, 5/1/37 | | | | 10,086,800 |
| 1,000 | | Massachusetts Development Finance Agency, | | | | |
| | | (Middlesex School), 5.00%, 9/1/33 | | | | 1,016,100 |
| 1,000 | | Massachusetts Development Finance Agency, | | | | |
| | | (Wheeler School), 6.50%, 12/1/29 | | | | 1,036,200 |
| 4,000 | | Massachusetts Development Finance Agency, | | | | |
| | | (Boston University), Series P, 6.00%, 5/15/59 | | | | 4,470,680 |
| 10,000 | | Massachusetts Health and Educational Facilities Authority, | | | | |
| | | (Berklee College), Series A, 5.00%, 10/1/37 | | | | 10,153,500 |
| 1,700 | | Massachusetts Health and Educational Facilities Authority, | | | | |
| | | (Harvard University), 5.125%, 7/15/37 | | | | 1,774,630 |
| 4,000 | | Massachusetts Health and Educational Facilities Authority, | | | | |
| | | (Massachusetts Institute of Technology), 5.25%, 7/1/33 | | | | 4,517,240 |
| 3,605 | | Massachusetts Health and Educational Facilities Authority, | | | | |
| | | (Williams College), 4.50%, 7/1/33 | | | | 3,533,080 |
| 2,000 | | Massachusetts Industrial Finance Agency, | | | | |
| | | (St. John’s High School, Inc.), 5.35%, 6/1/28 | | | | 2,016,480 |
| | | | | $ | | 49,690,140 |
| |
| Electric Utilities — 5.8% | | | | |
| $ 8,715 | | Massachusetts Development Finance Agency, | | | | |
| | | (Dominion Energy Brayton Point), (AMT), 5.00%, 2/1/36 | | $ | | 8,546,103 |
| 3,000 | | Puerto Rico Electric Power Authority, Series N, | | | | |
| | | 0.00%, 7/1/17 | | | | 1,946,010 |
| 13,230 | | Puerto Rico Electric Power Authority, Series O, | | | | |
| | | 0.00%, 7/1/17 | | | | 8,581,904 |
| | | | | $ | | 19,074,017 |
| |
| Escrowed / Prerefunded — 7.3% | | | | |
| $20,000 | | Massachusetts Turnpike Authority, Escrowed to Maturity, | | | | |
| | | 5.00%, 1/1/20 | | $ | | 21,414,400 |
| 2,540 | | Massachusetts Water Resource Authority, | | | | |
| | | Escrowed to Maturity, 5.25%, 12/1/15 | | | | 2,749,067 |
| | | | | $ | | 24,163,467 |
| |
| Hospital — 7.9% | | | | |
| $ 1,000 | | Massachusetts Health and Educational Facilities Authority, | | | | |
| | | (Berkshire Health System), 6.25%, 10/1/31 | | $ | | 1,048,830 |
| 1,320 | | Massachusetts Health and Educational Facilities Authority, | | | | |
| | | (Central New England Health Systems), 6.125%, 8/1/13 | | | | 1,322,138 |
| Principal Amount | | | | |
| (000’s omitted) | | Security | | Value |
| |
| Hospital (continued) | | | | |
| $ 2,600 | | Massachusetts Health and Educational Facilities Authority, | | | | |
| | | (Healthcare System-Covenant Health), 6.00%, 7/1/22 | | $ | | 2,758,444 |
| 6,820 | | Massachusetts Health and Educational Facilities Authority, | | | | |
| | | (Partners Healthcare Systems), 5.00%, 7/1/29 | | | | 6,959,401 |
| 5,480 | | Massachusetts Health and Educational Facilities Authority, | | | | |
| | | (Partners Healthcare Systems), 5.00%, 7/1/32 | | | | 5,549,267 |
| 35 | | Massachusetts Health and Educational Facilities Authority, | | | | |
| | | (Partners Healthcare Systems), 5.75%, 7/1/32 | | | | 37,812 |
| 9,000 | | Massachusetts Industrial Finance Agency, | | | | |
| | | (Biomedical Research Corp.), 0.00%, 8/1/09 | | | | 8,400,240 |
| | | | | $ | | 26,076,132 |
| |
| Housing — 5.1% | | | | |
| $ 2,000 | | Massachusetts Housing Finance Agency, (AMT), | | | | |
| | | 4.65%, 12/1/36 | | $ | | 1,859,700 |
| 10,000 | | Massachusetts Housing Finance Agency, (AMT), | | | | |
| | | 4.85%, 6/1/40 | | | | 9,519,800 |
| 1,350 | | Massachusetts Housing Finance Agency, (AMT), | | | | |
| | | 5.00%, 12/1/28 | | | | 1,345,532 |
| 4,000 | | Massachusetts Housing Finance Agency, (AMT), | | | | |
| | | 5.10%, 12/1/37 | | | | 3,984,440 |
| | | | | $ | | 16,709,472 |
| |
| Industrial Development Revenue — 2.1% | | | | |
| $ 2,155 | | Massachusetts Industrial Finance Agency, | | | | |
| | | (American Hingham Water Co.), (AMT), 6.60%, 12/1/15 | | $ | | 2,181,140 |
| 5,170 | | Virgin Islands Public Finance Authority, (Hovensa LLC), | | | | |
| | | (AMT), 4.70%, 7/1/22 | | | | 4,850,236 |
| | | | | $ | | 7,031,376 |
| |
| Insured-Education — 12.4% | | | | |
| $ 2,500 | | Massachusetts College Building Authority, (XLCA), | | | | |
| | | 5.50%, 5/1/28 | | $ | | 2,846,700 |
| 5,000 | | Massachusetts College Building Authority, (XLCA), | | | | |
| | | 5.50%, 5/1/33(3) | | | | 5,726,050 |
| 8,615 | | Massachusetts College Building Authority, Series B, | | | | |
| | | (XLCA), 0.00%, 5/1/22 | | | | 4,481,178 |
| 6,000 | | Massachusetts Development Finance Agency, | | | | |
| | | (Boston University), (XLCA), 5.375%, 5/15/39(4) | | | | 6,645,360 |
| 5,460 | | Massachusetts Development Finance Agency, | | | | |
| | | (College of the Holy Cross), (AMBAC), 5.25%, 9/1/32(5) | | | | 6,144,739 |
| 2,800 | | Massachusetts Development Finance Agency, | | | | |
| | | (Franklin W. Olin College), (XLCA), 5.25%, 7/1/33 | | | | 2,900,968 |
| 5,000 | | Massachusetts Development Finance Agency, | | | | |
| | | (Massachusetts College of Pharmacy), (AGC), | | | | |
| | | 5.00%, 7/1/37(6) | | | | 5,161,450 |
| 1,000 | | Massachusetts Development Finance Agency, | | | | |
| | | (Merrimack College), (MBIA), 5.20%, 7/1/32 | | | | 1,046,700 |
S e e n o t e s t o f i n a n c i a l s t a t e m e n t s
33 |
Eaton Vance Massachusetts Municipals Fund a s o f S e p t e m b e r 3 0 , 2 0 0 7
P O R T F O L I O O F I N V E S T M E N T S C O N T ’ D |
| Principal Amount | | | | |
| (000’s omitted) | | Security | | Value |
| |
| Insured-Education (continued) | | | | |
| $ 3,120 | | Massachusetts Development Finance Agency, | | | | |
| | | (Simmons College), (XLCA), 5.25%, 10/1/33 | | $ | | 3,394,310 |
| 2,460 | | Massachusetts Health and Educational Facilities Authority, | | |
| | | (Worcester City Campus), (FGIC), 5.00%, 10/1/31 | | 2,549,347 |
| | | | | $ | | 40,896,802 |
| |
| Insured-Escrowed / Prerefunded — 2.7% | | |
| $ 200 | | Massachusetts Turnpike Authority, (MBIA), | | | | |
| | | Escrowed to Maturity, 5.00%, 1/1/20 | | $ | | 214,144 |
| 6,000 | | Puerto Rico Electric Power Authority, (FSA), | | | | |
| | | Prerefunded to 7/1/10, 5.25%, 7/1/29(5) | | | | 6,336,940 |
| 1,995 | | Puerto Rico Highway and Transportation Authority, | | |
| | | (MBIA), Prerefunded to 7/1/16, 5.00%, 7/1/36(5) | | 2,180,375 |
| | | | | $ | | 8,731,459 |
| |
| Insured-General Obligations — 0.8% | | |
| $ 560 | | Ashland, (AMBAC), 4.75%, 5/15/29 | | $ | | 570,198 |
| 500 | | Plymouth, (MBIA), 5.25%, 10/15/20 | | | | 526,970 |
| 1,200 | | Puerto Rico, (MBIA), 5.50%, 7/1/20(5) | | | | 1,367,456 |
| | | | | $ | | 2,464,624 |
| |
| Insured-Hospital — 0.7% | | | | |
| $ 2,250 | | Massachusetts Health and Educational Facilities Authority, | | |
| | | (The Medical Center of Central Massachusetts), (AMBAC), | | |
| | | Variable Rate, 8.82%, 6/23/22(7) | | $ | | 2,348,685 |
| | | | | $ | | 2,348,685 |
| |
| Insured-Lease Revenue / Certificates of | | |
| Participation — 3.0% | | | | |
| $ 7,500 | | Massachusetts Development Finance Agency, (MBIA), | | |
| | | 5.125%, 2/1/34 | | $ | | 7,787,700 |
| 1,800 | | Puerto Rico Public Finance Corp., (AMBAC), | | | | |
| | | 5.125%, 6/1/24(5) | | | | 1,957,134 |
| | | | | $ | | 9,744,834 |
| |
| Insured-Other Revenue — 3.1% | | | | |
| $ 8,680 | | Massachusetts Development Finance Agency, | | | | |
| | | (WGBH Educational Foundation), (AMBAC), | | | | |
| | | 5.75%, 1/1/42(5) | | $ | | 10,324,492 |
| 45 | | Massachusetts Health and Educational Facilities Authority, | | |
| | | (Capital Assets), (MBIA), 7.20%, 7/1/09 | | | | 45,126 |
| | | | | $ | | 10,369,618 |
| Principal Amount | | | | |
| (000’s omitted) | | Security | | Value |
| |
| Insured-Special Tax Revenue — 6.1% | | | | |
| $ 3,395 | | Martha’s Vineyard Land Bank, (AMBAC), 4.25%, 5/1/36 | | $ | | 3,154,430 |
| 1,000 | | Martha’s Vineyard Land Bank, (AMBAC), 5.00%, 5/1/29 | | | | 1,037,740 |
| 4,620 | | Martha’s Vineyard Land Bank, (AMBAC), 5.00%, 5/1/32 | | | | 4,736,794 |
| 2,630 | | Massachusetts Bay Transportation Authority, | | | | |
| | | Assessment Bonds, Sales Tax Revenue, (MBIA), | | | | |
| | | 4.50%, 7/1/35 | | | | 2,562,672 |
| 7,500 | | Massachusetts Special Obligation, Dedicated Tax Revenue, | | | | |
| | | (FGIC), 5.50%, 1/1/30 | | | | 8,622,075 |
| | | | | $ | | 20,113,711 |
| |
| Insured-Student Loan — 1.7% | | | | |
| $ 5,860 | | Massachusetts Educational Financing Authority, | | | | |
| | | (AMBAC), 4.70%, 1/1/33 | | $ | | 5,586,338 |
| | | | | $ | | 5,586,338 |
| |
| Insured-Transportation — 11.9% | | | | |
| $ 5,000 | | Massachusetts Port Authority, (Bosfuel Project), (FGIC), | | | | |
| | | (AMT), 5.00%, 7/1/32 | | $ | | 5,038,050 |
| 10,000 | | Massachusetts Port Authority, (Bosfuel Project), (FGIC), | | | | |
| | | (AMT), 5.00%, 7/1/38 | | | | 10,045,300 |
| 19,000 | | Massachusetts Turnpike Authority, (MBIA), 0.00%, 1/1/28 | | | | 7,326,020 |
| 10,750 | | Massachusetts Turnpike Authority, | | | | |
| | | Metropolitan Highway System, (MBIA), 0.00%, 1/1/22 | | | | 5,675,785 |
| 5,825 | | Puerto Rico Highway and Transportation Authority, | | | | |
| | | (AMBAC), 5.25%, 7/1/38 | | | | 6,501,341 |
| 4,320 | | Puerto Rico Highway and Transportation Authority, | | | | |
| | | (CIFG), 5.25%, 7/1/41(5) | | | | 4,783,536 |
| | | | | $ | | 39,370,032 |
| |
| Insured-Water and Sewer — 0.5% | | | | |
| $ 1,625 | | Massachusetts Water Resource Authority, (MBIA), | | | | |
| | | 5.25%, 12/1/15 | | $ | | 1,755,715 |
| | | | | $ | | 1,755,715 |
| |
| Nursing Home — 1.7% | | | | |
| $ 2,400 | | Massachusetts Health and Educational Facilities Authority, | | | | |
| | | (Christopher House), 6.875%, 1/1/29 | | $ | | 2,447,400 |
| 3,155 | | Massachusetts Industrial Finance Agency, | | | | |
| | | (Age Institute of Massachusetts), 8.05%, 11/1/25 | | | | 3,218,700 |
| | | | | $ | | 5,666,100 |
S e e n o t e s t o f i n a n c i a l s t a t e m e n t s
34 |
Eaton Vance Massachusetts Municipals Fund a s o f S e p t e m b e r 3 0 , 2 0 0 7
P O R T F O L I O O F I N V E S T M E N T S C O N T ’ D |
| Principal Amount | | | | |
| (000’s omitted) | | Security | | Value |
| |
| Other Revenue — 1.4% | | | | |
| $ 4,455 | | Puerto Rico Infrastructure Financing Authority, | | | | |
| | | 5.50%, 10/1/34(5) | | $ | | 4,699,698 |
| | | | | $ | | 4,699,698 |
| |
| Senior Living / Life Care — 1.6% | | | | |
| $ 1,250 | | Massachusetts Development Finance Agency, | | | | |
| | | (Berkshire Retirement Community, Inc./Edgecombe), | | | | |
| | | 5.10%, 7/1/29 | | $ | | 1,184,625 |
| 415 | | Massachusetts Development Finance Agency, | | | | |
| | | (First Mortgage VOA Concord), 5.125%, 11/1/27 | | | | 385,709 |
| 515 | | Massachusetts Development Finance Agency, | | | | |
| | | (First Mortgage VOA Concord), 5.20%, 11/1/41 | | | | 462,285 |
| 1,545 | | Massachusetts Development Finance Agency, | | | | |
| | | (Linden Ponds, Inc.), 5.75%, 11/15/35 | | | | 1,518,457 |
| 1,585 | | Massachusetts Development Finance Agency, | | | | |
| | | (Linden Ponds, Inc.), 5.75%, 11/15/42 | | | | 1,553,252 |
| | | | | $ | | 5,104,328 |
| |
| Solid Waste — 1.0% | | | | |
| $ 3,250 | | Massachusetts Industrial Finance Agency, Resource Recovery, | | | | |
| | | (Ogden Haverhill), (AMT), 5.60%, 12/1/19 | | $ | | 3,327,708 |
| | | | | $ | | 3,327,708 |
| |
| Special Tax Revenue — 4.7% | | | | |
| $14,395 | | Massachusetts Bay Transportation Authority, 0.00%, 7/1/34 | | $ | | 3,591,696 |
| 8,000 | | Massachusetts Bay Transportation Authority, | | | | |
| | | Sales Tax Revenue, 0.00%, 7/1/22 | | | | 3,944,000 |
| 7,690 | | Puerto Rico Sales Tax Financing, 5.25%, 8/1/57 | | | | 7,973,684 |
| | | | | $ | | 15,509,380 |
| |
| Water and Sewer — 6.2% | | | | |
| $ 8,080 | | Boston Industrial Development Authority, | | | | |
| | | (Harbor Electric Energy Co.), (AMT), 7.375%, 5/15/15 | | $ | | 8,143,832 |
| 3,220 | | Massachusetts Water Pollution Abatement Trust, | | | | |
| | | 5.25%, 8/1/25 | | | | 3,591,781 |
| 10,000 | | Massachusetts Water Resources Authority, 4.00%, 8/1/46 | | | | 8,628,200 |
| | | | | $ | | 20,363,813 |
| |
| Total Tax-Exempt Investments | | | | |
| (identified cost $328,292,902) | | $338,797,449 |
| S h o r t - Te r m I n v e s t m e n t s — 4 . 5 % | | | | |
| |
| Principal Amount | | | | |
| (000’s omitted) | | Security | | Value |
| $ 7,000 | | Massachusetts Development Finance Agency, | | | | |
| | | (Suffolk University), Variable Rate, 6.00%, 7/1/32(8) | | $ | | 7,000,000 |
| 4,895 | | Massachusetts Development Finance Agency, | | | | |
| | | (Wentworth Institute), Variable Rate, 6.00%, 10/1/33(8) | | | | 4,895,000 |
| 3,000 | | Massachusetts Health and Educational Facilities Authority, | | | | |
| | | (Harvard University), Variable Rate, 3.60%, 11/1/49(8) | | | | 3,000,000 |
| |
| Total Short-Term Investments | | | | |
| (identified cost $14,895,000) | | $ | | 14,895,000 |
| |
| Total Investments — 107.3% | | | | |
| (identified cost $343,187,902) | | $353,692,449 |
| |
| Other Assets, Less Liabilities — (7.3)% | | $ (24,075,560) |
| |
| Net Assets — 100.0% | | $329,616,889 |
| |
| AGC - Assured Guaranty Corp. | | | | |
| AMBAC - AMBAC Financial Group, Inc. | | | | |
| AMT - Interest earned from these securities may be considered a |
| tax preference item for purposes of the Federal Alternative |
| Minimum Tax. | | | | |
| CIFG - CIFG Assurance North America, Inc. | | | | |
| FGIC - Financial Guaranty Insurance Company | | | | |
| FSA - Financial Security Assurance, Inc. | | | | |
| MBIA - Municipal Bond Insurance Association | | | | |
| XLCA - XL Capital Assurance, Inc. | | | | |
| The Fund invests primarily in debt securities issued by | | | | |
| Massachusetts municipalities. The ability of the issuers of the debt |
| securities to meet their obligations may be affected by economic |
| developments in a specific industry or municipality. In order to |
| reduce the risk associated with such economic developments, at |
| September 30, 2007, 40.0% of total investments are backed by |
| bond insurance of various financial institutions and financial |
| guaranty assurance agencies. The aggregate percentage insured by |
| an individual financial institution ranged from 1.4% to 12.0% of |
| total investments. | | | | |
| (1) | Security exempt from registration under Rule 144A of the Securities Act of 1933. These securities may be sold in transactions exempt from registration, normally to qualified institutional buyers. At September 30, 2007, the aggregate value of the securities is $5,412,950 or 1.6% of the Fund’s net assets. |
| |
| (2) | Security has been issued as a leveraged inverse floater bond. The stated interest rate represents the rate in effect at September 30, 2007. |
| |
| (3) | Security (or a portion thereof) has been segregated to cover payable for when-issued securities. |
| |
| (4) | Security (or a portion thereof) has been segregated to cover margin requirements on open financial futures contracts. |
| |
| (5) | Security represents the underlying municipal obligation of an inverse floating rate obligation held by the Fund. |
| |
| (6) | When-issued security. |
| |
| (7) | Security has been issued as an inverse floater bond. The stated interest rate represents the rate in effect at September 30, 2007. |
| |
| (8) | Variable rate demand obligation. The stated interest rate represents the rate in effect at September 30, 2007. |
| |
S e e n o t e s t o f i n a n c i a l s t a t e m e n t s
35 |
Eaton Vance Mississippi Municipals Fund a s o f S e p t e m b e r 3 0 , 2 0 0 7
P O R T F O L I O O F I N V E S T M E N T S |
| Ta x - E x e m p t I n v e s t m e n t s — 1 0 3 . 8 % | | | | |
| |
| Principal Amount | | | | |
| (000’s omitted) | | Security | | Value |
| |
| Electric Utilities — 2.7% | | | | |
| $ 250 | | Mississippi Business Finance Corp., | | | | |
| | | (System Energy Resources, Inc.), 5.90%, 5/1/22 | | $ | | 252,647 |
| 50 | | Puerto Rico Electric Power Authority, DRIVERS, | | | | |
| | | Variable Rate, 6.79%, 7/1/25(1)(2) | | | | 54,367 |
| 150 | | Puerto Rico Electric Power Authority, DRIVERS, | | | | |
| | | Variable Rate, 6.79%, 7/1/37(1)(2) | | | | 156,387 |
| | | | | $ | | 463,401 |
| |
| Escrowed / Prerefunded — 10.7% | | | | |
| $2,500 | | Mississippi Housing Finance Corp., Single Family, | | | | |
| | | Escrowed to Maturity, 0.00%, 6/1/15 | | $ | | 1,841,375 |
| | | | | $ | | 1,841,375 |
| |
| Hospital — 6.3% | | | | |
| $ 500 | | Mississippi Hospital Equipment and Facilities Authority, | | | | |
| | | (Baptist Health System), 5.00%, 8/15/29 | | $ | | 492,455 |
| 600 | | Mississippi Hospital Equipment and Facilities Authority, | | | | |
| | | (South Central Regional Medical Center), 5.25%, 12/1/31 | | | | 595,488 |
| | | | | $ | | 1,087,943 |
| |
| Industrial Development Revenue — 4.3% | | | | |
| $ 200 | | Lowndes County, (Weyerhaeuser), 6.80%, 4/1/22 | | $ | | 231,760 |
| 175 | | Mississippi Business Finance Corp., (Air Cargo), (AMT), | | | | |
| | | 7.25%, 7/1/34 | | | | 187,287 |
| 300 | | Warren County, (International Paper), (AMT), | | | | |
| | | 6.70%, 8/1/18 | | | | 314,754 |
| | | | | $ | | 733,801 |
| |
| Insured-Bond Bank — 5.7% | | | | |
| $ 435 | | Mississippi Development Bank, (Capital Projects), | | | | |
| | | (AMBAC), 5.00%, 7/1/24 | | $ | | 436,192 |
| 500 | | Mississippi Development Bank, | | | | |
| | | (Hinds County Public Improvement), (FSA), 5.25%, 10/1/30 | | | | 552,560 |
| | | | | $ | | 988,752 |
| |
| Insured-Education — 7.6% | | | | |
| $ 750 | | Jackson State University Educational Building Corp., | | | | |
| | | (FGIC), 5.00%, 3/1/29 | | $ | | 768,607 |
| 500 | | Mississippi State University Educational Building Corp., | | | | |
| | | Facilities Renovation, (MBIA), 5.25%, 8/1/17 | | | | 550,365 |
| | | | | $ | | 1,318,972 |
| Principal Amount | | | | |
| (000’s omitted) | | Security | | Value |
| |
| Insured-Electric Utilities — 6.4% | | | | |
| $ 750 | | Mississippi Development Bank, (Municipal Energy), | | | | |
| | | (XLCA), 5.00%, 3/1/41 | | $ | | 761,565 |
| 300 | | Puerto Rico Electric Power Authority, (MBIA), | | | | |
| | | 5.50%, 7/1/16(3) | | | | 338,510 |
| | | | | $ | | 1,100,075 |
| |
| Insured-Escrowed / Prerefunded — 7.1% | | | | |
| $ 250 | | Mississippi Development Bank, (Waste Water Treatment), | | | | |
| | | (FSA), Prerefunded to 2/1/13, 5.00%, 2/1/28 | | $ | | 266,795 |
| 250 | | Puerto Rico Electric Power Authority, (FSA), | | | | |
| | | Prerefunded to 7/1/10, 5.25%, 7/1/29(3) | | | | 264,320 |
| 150 | | Puerto Rico, (FSA), Prerefunded to 7/1/11, | | | | |
| | | 5.125%, 7/1/30 | | | | 158,749 |
| 500 | | Southern Mississippi University Educational Building Corp., | | | | |
| | | (AMBAC), Prerefunded to 3/1/11, 5.00%, 3/1/21 | | | | 527,690 |
| | | | | $ | | 1,217,554 |
| |
| Insured-General Obligations — 12.4% | | | | |
| $ 500 | | Hinds County, (MBIA), 6.25%, 3/1/11 | | $ | | 542,910 |
| 500 | | Mississippi Development Bank, (FSA), 4.50%, 10/1/36 | | | | 481,795 |
| 500 | | Mississippi Development Bank, (Gulf Coast College District), | | | | |
| | | (XLCA), 4.25%, 1/1/24 | | | | 478,705 |
| 250 | | Mississippi, (FSA), 5.25%, 11/1/21(3) | | | | 278,970 |
| 100 | | Puerto Rico, (FSA), 5.125%, 7/1/30 | | | | 104,025 |
| 220 | | Puerto Rico, (FSA), Variable Rate, 7.742%, 7/1/27(1)(2) | | | | 256,865 |
| | | | | $ | | 2,143,270 |
| |
| Insured-Hospital — 12.3% | | | | |
| $ 750 | | Gulfport, (Gulfport Memorial Hospital), (MBIA), | | | | |
| | | 6.20%, 7/1/18 | | $ | | 751,395 |
| 455 | | Hinds County, (Mississippi Methodist Hospital), (AMBAC), | | | | |
| | | 5.60%, 5/1/12(4) | | | | 472,131 |
| 610 | | Mississippi Development Bank, (Covington County Hospital), | | | | |
| | | (AMBAC), 5.00%, 7/1/31 | | | | 623,188 |
| 250 | | Mississippi Hospital Equipment and Facilities Authority, | | | | |
| | | (Forrest County General Hospital), (FSA), 5.50%, 1/1/27 | | | | 266,970 |
| | | | | $ | | 2,113,684 |
| |
| Insured-Lease Revenue / Certificates of | | | | |
| Participation — 3.8% | | | | |
| $ 600 | | Puerto Rico Public Finance Corp., (AMBAC), | | | | |
| | | 5.125%, 6/1/24(3) | | $ | | 652,378 |
| | | | | $ | | 652,378 |
S e e n o t e s t o f i n a n c i a l s t a t e m e n t s
36 |
Eaton Vance Mississippi Municipals Fund a s o f S e p t e m b e r 3 0 , 2 0 0 7
P O R T F O L I O O F I N V E S T M E N T S C O N T ’ D |
| Principal Amount | | | | |
| (000’s omitted) | | Security | | Value |
| |
| Insured-Special Tax Revenue — 1.8% | | | | |
| $ 150 | | Puerto Rico Convention Center Authority, (CIFG), | | | | |
| | | 4.50%, 7/1/36 | | $ | | 148,202 |
| 735 | | Puerto Rico Sales Tax Financing, (AMBAC), 0.00%, 8/1/54 | | | | 72,383 |
| 135 | | Puerto Rico Sales Tax Financing, (MBIA), 0.00%, 8/1/44 | | | | 22,283 |
| 270 | | Puerto Rico Sales Tax Financing, (MBIA), 0.00%, 8/1/45 | | | | 42,393 |
| 215 | | Puerto Rico Sales Tax Financing, (MBIA), 0.00%, 8/1/46 | | | | 32,072 |
| | | | | $ | | 317,333 |
| |
| Insured-Transportation — 5.6% | | | | |
| $ 500 | | Jackson Municipal Airport Authority, (AMBAC), | | | | |
| | | 5.00%, 10/1/31 | | $ | | 514,790 |
| 250 | | Mississippi Development Bank, (Mississippi Highway | | | | |
| | | Construction), (FGIC), 5.00%, 1/1/25 | | | | 259,610 |
| 175 | | Puerto Rico Highway and Transportation Authority, | | | | |
| | | (AMBAC), 5.25%, 7/1/38 | | | | 195,319 |
| | | | | $ | | 969,719 |
| |
| Insured-Water and Sewer — 8.9% | | | | |
| $ 300 | | Gautier Utility District, (FGIC), 5.125%, 3/1/19 | | $ | | 314,982 |
| 500 | | Jackson Water and Sewer System, (FSA), 4.75%, 9/1/24 | | | | 510,410 |
| 435 | | Mississippi Development Bank, (Combined Water & Sewer | | | | |
| | | System), (AMBAC), 5.00%, 7/1/23 | | | | 446,340 |
| 250 | | Mississippi Development Bank, (Combined Water & Sewer | | | | |
| | | System), (FSA), 5.00%, 9/1/29 | | | | 258,033 |
| | | | | $ | | 1,529,765 |
| |
| Nursing Home — 1.6% | | | | |
| $ 290 | | Mississippi Business Finance Corp., (Magnolia Healthcare), | | | | |
| | | 7.99%, 7/1/25 | | $ | | 283,374 |
| | | | | $ | | 283,374 |
| |
| Other Revenue — 0.7% | | | | |
| $1,200 | | Children’s Trust Fund, Tobacco Settlement, 0.00%, 5/15/50 | | $ | | 74,556 |
| 1,500 | | Children’s Trust Fund, Tobacco Settlement, 0.00%, 5/15/55 | | | | 52,500 |
| | | | | $ | | 127,056 |
| |
| Special Tax Revenue — 2.9% | | | | |
| $ 485 | | Puerto Rico Sales Tax Financing, 5.25%, 8/1/57 | | $ | | 502,892 |
| | | | | $ | | 502,892 |
| Principal Amount | | |
| (000’s omitted) | | Security | | Value |
| |
| Water and Sewer — 3.0% | | |
| $ 250 | | Mississippi Development Bank, (Desoto County | | |
| | | Regional Utility Authority), 5.25%, 7/1/28 | | $ 261,130 |
| 250 | | Mississippi Development Bank, (Desoto County | | |
| | | Regional Utility Authority), 5.25%, 7/1/31 | | 259,670 |
| | | | | $ 520,800 |
| |
| Total Tax-Exempt Investments — 103.8% | | |
| (identified cost $17,231,754) | | $17,912,144 |
| |
| Other Assets, Less Liabilities — (3.8)% | | $ (650,886) |
| |
| Net Assets — 100.0% | | $17,261,258 |
| |
| AMBAC - AMBAC Financial Group, Inc. | | |
| AMT - Interest earned from these securities may be considered a |
| tax preference item for purposes of the Federal Alternative |
| Minimum Tax. | | |
| CIFG - CIFG Assurance North America, Inc. | | |
| DRIVERS - Derivative Inverse Tax-Exempt Receipts | | |
| FGIC - Financial Guaranty Insurance Company | | |
| FSA - Financial Security Assurance, Inc. | | |
| MBIA - Municipal Bond Insurance Association | | |
| XLCA - XL Capital Assurance, Inc. | | |
| The Fund invests primarily in debt securities issued by Mississippi |
| municipalities. The ability of the issuers of the debt securities to |
| meet their obligations may be affected by economic developments |
| in a specific industry or municipality. In order to reduce the risk |
| associated with such economic developments, at September 30, |
| 2007, 69.0% of total investments are backed by bond insurance of |
| various financial institutions and financial guaranty assurance |
| agencies. The aggregate percentage insured by an individual |
| financial institution ranged from 0.8% to 22.0% of total investments. |
| (1) | Security exempt from registration under Rule 144A of the Securities Act of 1933. These securities may be sold in transactions exempt from registration, normally to qualified institutional buyers. At September 30, 2007, the aggregate value of the securities is $467,619 or 2.7% of the Fund’s net assets. |
| |
| (2) | Security has been issued as a leveraged inverse floater bond. The stated interest rate represents the rate in effect at September 30, 2007. |
| |
| (3) | Security represents the underlying municipal obligation of an inverse floating rate obligation held by the Fund. |
| |
| (4) | Security (or a portion thereof) has been segregated to cover margin requirements on open financial futures contracts. |
| |
S e e n o t e s t o f i n a n c i a l s t a t e m e n t s
37 |
Eaton Vance New York Municipals Fund a s o f S e p t e m b e r 3 0 , 2 0 0 7
P O R T F O L I O O F I N V E S T M E N T S |
| Ta x - E x e m p t I n v e s t m e n t s — 1 1 0 . 6 % | | | | |
| |
| Principal Amount | | | | | | |
| (000’s omitted) | | Security | | | | Value |
| |
| Cogeneration — 0.9% | | | | | | |
| $ 4,250 | | Suffolk County Industrial Development Agency, | | | | |
| | | (Nissequogue Cogeneration Partners Facility), (AMT), | | | | |
| | | 5.50%, 1/1/23(1) | | | | $ | | 4,072,690 |
| | | | | | | $ | | 4,072,690 |
| |
| Education — 16.2% | | | | | | |
| $ 3,200 | | Hempstead Industrial Development Agency, | | | | | | |
| | | (Adelphi University), 4.50%, 10/1/24 | | | | $ | | 3,096,480 |
| 900 | | Hempstead Industrial Development Agency, | | | | | | |
| | | (Adelphi University), 5.00%, 10/1/35 | | | | | | 902,115 |
| 500 | | Hempstead Industrial Development Agency, | | | | | | |
| | | (Hofstra University Civic Facilities), 4.50%, 7/1/36 | | | | 469,295 |
| 2,110 | | New York City Industrial Development Agency, | | | | |
| | | (St. Francis College), 5.00%, 10/1/34 | | | | | | 2,109,979 |
| 8,500 | | New York Dormitory Authority, (City University), | | | | |
| | | 6.00%, 7/1/20 | | | | | | 9,871,475 |
| 2,400 | | New York Dormitory Authority, (City University), | | | | |
| | | 7.50%, 7/1/10 | | | | | | 2,547,600 |
| 9,850 | | New York Dormitory Authority, (State University | | | | |
| | | Educational Facilities), 5.25%, 5/15/15 | | | | | | 10,585,992 |
| 18,775 | | New York Dormitory Authority, (State University | | | | |
| | | Educational Facilities), 5.25%, 5/15/19(2) | | | | 20,385,895 |
| 14,680 | | New York Dormitory Authority, (State University | | | | |
| | | Educational Facilities), 5.25%, 5/15/21 | | | | | | 16,045,974 |
| 2,000 | | New York Dormitory Authority, (State University | | | | |
| | | Educational Facilities), 5.50%, 5/15/19 | | | | | | 2,225,880 |
| 1,085 | | New York Dormitory Authority, (Vassar College), | | | | |
| | | 4.25%, 7/1/32 | | | | | | 1,028,699 |
| 2,650 | | New York Dormitory Authority, (Vassar College), | | | | |
| | | 4.25%, 7/1/39 | | | | | | 2,473,165 |
| | | | | | | $ | | 71,742,549 |
| |
| Electric Utilities — 2.1% | | | | | | |
| $ 1,500 | | Long Island Power Authority, Electric System Revenue, | | | | |
| | | 5.00%, 9/1/24 | | | | $ | | 1,549,200 |
| 2,500 | | New York Energy Research and Development Authority, | | | | |
| | | (Brooklyn Union Gas), (AMT), Variable Rate, | | | | |
| | | 8.854%, 7/1/26(3) | | | | | | 2,643,750 |
| 4,900 | | Suffolk County Industrial Development Agency, | | | | |
| | | (Keyspan-Port Jefferson), (AMT), 5.25%, 6/1/27 | | | | 4,978,890 |
| | | | | | | $ | | 9,171,840 |
| |
| Escrowed / Prerefunded — 4.5% | | | | | | |
| $ 3,500 | | Metropolitan Transportation Authority, Prerefunded to | | | | |
| | | 11/15/13, 5.25%, 11/15/32 | | | | $ | | 3,824,065 |
| Principal Amount | | | | |
| (000’s omitted) | | Security | | Value |
| |
| Escrowed / Prerefunded (continued) | | | | |
| $ 2,415 | | New York City, Prerefunded to 12/1/11, | | | | |
| | | 5.375%, 12/1/26 | | $ | | 2,592,068 |
| 1,495 | | New York Dormitory Authority, (City University), | | | | |
| | | Escrowed to Maturity, 7.00%, 7/1/09 | | | | 1,551,571 |
| 2,000 | | Puerto Rico Electric Power Authority, Prerefunded to | | | | |
| | | 7/1/12, 5.25%, 7/1/31 | | | | 2,168,580 |
| 8,905 | | Triborough Bridge and Tunnel Authority, Escrowed to | | | | |
| | | Maturity, 5.50%, 1/1/17 | | | | 9,879,296 |
| | | | | $ | | 20,015,580 |
| |
| General Obligations — 1.9% | | | | |
| $ 2,250 | | New York City, 5.25%, 8/15/26 | | $ | | 2,363,040 |
| 5,755 | | New York City, 5.25%, 9/15/33 | | | | 5,973,920 |
| | | | | $ | | 8,336,960 |
| |
| Health Care-Miscellaneous — 0.2% | | | | |
| $ 360 | | New York City Industrial Development Agency, | | | | |
| | | (A Very Special Place, Inc.), 5.75%, 1/1/29 | | $ | | 353,725 |
| 110 | | Suffolk County Industrial Development Agency, | | | | |
| | | (Alliance of Long Island Agencies), Series A, 7.50%, 9/1/15 | | | | 116,245 |
| 70 | | Suffolk County Industrial Development Agency, | | | | |
| | | (Alliance of Long Island Agencies), Series C, 7.50%, 9/1/15 | | | | 73,974 |
| 165 | | Suffolk County Industrial Development Agency, | | | | |
| | | (Alliance of Long Island Agencies), Series F, 7.50%, 9/1/15 | | | | 174,367 |
| 145 | | Suffolk County Industrial Development Agency, | | | | |
| | | (Alliance of Long Island Agencies), Series J, 7.50%, 9/1/15 | | | | 153,232 |
| | | | | $ | | 871,543 |
| |
| Hospital — 8.9% | | | | |
| $ 1,040 | | Chautauqua County Industrial Development Agency, | | | | |
| | | (Women’s Christian Association), 6.35%, 11/15/17 | | $ | | 1,078,002 |
| 3,170 | | Chautauqua County Industrial Development Agency, | | | | |
| | | (Women’s Christian Association), 6.40%, 11/15/29 | | | | 3,275,054 |
| 3,000 | | Fulton County Industrial Development Agency, | | | | |
| | | (Nathan Littauer Hospital), 6.00%, 11/1/18 | | | | 3,010,560 |
| 4,250 | | Monroe County Industrial Development Agency, | | | | |
| | | (Highland Hospital), 5.00%, 8/1/22 | | | | 4,264,747 |
| 685 | | Nassau County Industrial Development Agency, | | | | |
| | | (North Shore Health System), 5.875%, 11/1/11 | | | | 714,845 |
| 4,500 | | New York Dormitory Authority, (Lenox Hill Hospital), | | | | |
| | | 5.50%, 7/1/30 | | | | 4,541,715 |
| 11,490 | | New York Dormitory Authority, (Memorial Sloan-Kettering | | | | |
| | | Cancer Center), 4.75%, 7/1/28(4) | | | | 11,674,491 |
| 2,000 | | New York Dormitory Authority, (Methodist Hospital), | | | | |
| | | 5.25%, 7/1/33 | | | | 2,055,340 |
| 2,750 | | Oneida County Industrial Development Agency, | | | | |
| | | (Elizabeth Medical Center), 5.875%, 12/1/29 | | | | 2,758,305 |
S e e n o t e s t o f i n a n c i a l s t a t e m e n t s
38 |
Eaton Vance New York Municipals Fund a s o f S e p t e m b e r 3 0 , 2 0 0 7
P O R T F O L I O O F I N V E S T M E N T S C O N T ’ D |
| Principal Amount | | | | |
| (000’s omitted) | | Security | | Value |
| |
| Hospital (continued) | | | | |
| $ 1,000 | | Oneida County Industrial Development Agency, | | | | |
| | | (Elizabeth Medical Center), 6.00%, 12/1/29 | | $ | | 1,007,590 |
| 5,000 | | Suffolk County Industrial Development Agency, | | | | |
| | | (Huntington Hospital), 5.875%, 11/1/32 | | | | 5,142,250 |
| | | | | $ | | 39,522,899 |
| |
| Housing — 5.2% | | | | |
| $ 3,445 | | New York City Housing Development Corp., (Linden | | | | |
| | | Boulevard Apartments), Series A, (FNMA), 4.75%, 1/15/39 | | $ | | 3,249,531 |
| 10,350 | | New York City Housing Development Corp., | | | | |
| | | (Multi-Family Housing), 4.95%, 11/1/33 | | | | 10,569,834 |
| 3,500 | | New York City Housing Development Corp., | | | | |
| | | (Multi-Family Housing), (AMT), 4.70%, 11/1/40 | | | | 3,294,200 |
| 5,730 | | New York City Housing Development Corp., | | | | |
| | | (Multi-Family Housing), (AMT), 5.00%, 11/1/24 | | | | 5,751,774 |
| | | | | $ | | 22,865,339 |
| |
| Industrial Development Revenue — 8.4% | | | | |
| $ 3,000 | | Liberty Development Corp., (Goldman Sachs Group, Inc.), | | | | |
| | | 5.25%, 10/1/35 | | $ | | 3,204,330 |
| 7,995 | | Liberty Development Corp., (Goldman Sachs Group, Inc.), | | | | |
| | | 5.25%, 10/1/35(4) | | | | 8,539,566 |
| 6,750 | | Liberty Development Corp., (Goldman Sachs Group, Inc.), | | | | |
| | | 5.50%, 10/1/37 | | | | 7,537,725 |
| 3,500 | | New York City Industrial Development Agency, (American, | | | | |
| | | Inc. - JFK International Airport), (AMT), 8.00%, 8/1/12 | | | | 3,859,310 |
| 10,500 | | Onondaga County Industrial Development Agency, | | | | |
| | | (Anheuser-Busch), 4.875%, 7/1/41 | | | | 10,303,020 |
| 1,965 | | Onondaga County Industrial Development Agency, | | | | |
| | | (Senior Air Cargo), (AMT), 6.125%, 1/1/32 | | | | 2,029,727 |
| 1,600 | | Port Authority of New York and New Jersey, | | | | |
| | | (Continental Airlines), (AMT), 9.125%, 12/1/15 | | | | 1,662,640 |
| | | | | $ | | 37,136,318 |
| |
| Insured-Education — 6.6% | | | | |
| $12,500 | | New York Dormitory Authority, (New York University), | | | | |
| | | (MBIA), 5.75%, 7/1/27(4) | | $ | | 14,665,675 |
| 4,400 | | New York Dormitory Authority, (University of Rochester), | | | | |
| | | (AMBAC), 4.25%, 7/1/39 | | | | 4,119,544 |
| 9,205 | | New York Dormitory Authority, (Yeshiva University), | | | | |
| | | (AMBAC), 5.50%, 7/1/35 | | | | 10,582,896 |
| | | | | $ | | 29,368,115 |
| |
| Insured-Electric Utilities — 2.6% | | | | |
| $ 5,725 | | Long Island Power Authority, Electric System Revenue, | | | | |
| | | (MBIA), 4.25%, 5/1/33 | | $ | | 5,383,389 |
| Principal Amount | | | | |
| (000’s omitted) | | Security | | Value |
| |
| Insured-Electric Utilities (continued) | | | | |
| $ 6,000 | | Puerto Rico Electric Power Authority, (MBIA), | | | | |
| | | 4.75%, 7/1/33(4) | | $ | | 6,064,360 |
| | | | | $ | | 11,447,749 |
| |
| Insured-Escrowed / Prerefunded — 5.3% | | | | |
| $15,135 | | New York City Cultural Resource Trust, (Museum of History), | | | | |
| | | (AMBAC), Prerefunded to 7/1/09, 5.75%, 7/1/29(4) | | $ | | 15,858,907 |
| 16,945 | | New York Dormitory Authority, (Memorial Sloan-Kettering | | | | |
| | | Cancer Center), (MBIA), Escrowed to Maturity, | | | | |
| | | 0.00%, 7/1/30 | | | | 5,860,598 |
| 1,500 | | Puerto Rico Electric Power Authority, (FSA), Prerefunded to | | | | |
| | | 7/1/10, Variable Rate, 7.43%, 7/1/29(5)(6) | | | | 1,752,705 |
| | | | | $ | | 23,472,210 |
| |
| Insured-General Obligations — 0.7% | | | | |
| $ 700 | | Jamestown, (AMBAC), 7.10%, 3/15/11 | | $ | | 779,611 |
| 675 | | Jamestown, (AMBAC), 7.10%, 3/15/12 | | | | 774,549 |
| 675 | | Jamestown, (AMBAC), 7.10%, 3/15/13 | | | | 789,838 |
| 515 | | Jamestown, (AMBAC), 7.10%, 3/15/14 | | | | 615,101 |
| | | | | $ | | 2,959,099 |
| |
| Insured-Lease Revenue / Certificates of | | | | |
| Participation — 4.6% | | | | |
| $16,865 | | Hudson Yards Infrastructure Corp., (MBIA), | | | | |
| | | 4.50%, 2/15/47 | | $ | | 16,217,890 |
| 1,086 | | Puerto Rico Public Buildings Authority, (CIFG), | | | | |
| | | 5.25%, 7/1/36(4) | | | | 1,144,130 |
| 3,013 | | Puerto Rico Public Buildings Authority, (CIFG), | | | | |
| | | Prerefunded to 7/1/12, 5.25%, 7/1/36(4) | | | | 3,234,724 |
| | | | | $ | | 20,596,744 |
| |
| Insured-Other Revenue — 5.2% | | | | |
| $ 4,000 | | New York City Cultural Resource Trust, (American Museum | | | | |
| | | of Natural History), (MBIA), 5.00%, 7/1/44 | | $ | | 4,094,800 |
| 11,815 | | New York City Industrial Development Agency, | | | | |
| | | (Queens Baseball Stadium), (AMBAC), 4.75%, 1/1/42 | | | | 11,818,544 |
| 5,735 | | New York City Industrial Development Agency, | | | | |
| | | (Yankee Stadium), (FGIC), 4.50%, 3/1/39 | | | | 5,614,794 |
| 1,500 | | New York City Industrial Development Agency, | | | | |
| | | (Yankee Stadium), (MBIA), 4.75%, 3/1/46 | | | | 1,488,150 |
| | | | | $ | | 23,016,288 |
| |
| Insured-Solid Waste — 0.7% | | | | |
| $ 3,015 | | Islip Resource Recovery Agency, (AMBAC), | | | | |
| | | 6.50%, 7/1/09 | | $ | | 3,054,677 |
| | | | | $ | | 3,054,677 |
S e e n o t e s t o f i n a n c i a l s t a t e m e n t s
39 |
Eaton Vance New York Municipals Fund a s o f S e p t e m b e r 3 0 , 2 0 0 7
P O R T F O L I O O F I N V E S T M E N T S C O N T ’ D |
| Principal Amount | | | | |
| (000’s omitted) | | Security | | Value |
| |
| Insured-Special Tax Revenue — 2.7% | | | | |
| $ 3,850 | | New York Convention Center Development Corp., Hotel | | | | |
| | | Occupancy Tax, (AMBAC), 4.75%, 11/15/45 | | $ | | 3,833,638 |
| 7,750 | | Puerto Rico Infrastructure Financing Authority, (AMBAC), | | | | |
| | | 0.00%, 7/1/28 | | | | 2,936,630 |
| 16,200 | | Puerto Rico Infrastructure Financing Authority, (AMBAC), | | | | |
| | | 0.00%, 7/1/34 | | | | 4,442,526 |
| 4,140 | | Puerto Rico Infrastructure Financing Authority, (AMBAC), | | | | |
| | | 0.00%, 7/1/37 | | | | 976,626 |
| | | | | $ | | 12,189,420 |
| |
| Insured-Transportation — 5.3% | | | | |
| $ 9,000 | | Metropolitan Transportation Authority, (FGIC), | | | | |
| | | 4.75%, 11/15/37 | | $ | | 9,053,460 |
| 3,500 | | Niagara Frontier Airport Authority, (Buffalo Niagara | | | | |
| | | International Airport), (MBIA), (AMT), 5.625%, 4/1/29(4) | | | | 3,610,460 |
| 5,170 | | Port Authority of New York and New Jersey, (CIFG), (AMT), | | | | |
| | | 4.50%, 9/1/35 | | | | 4,805,050 |
| 5,500 | | Puerto Rico Highway and Transportation Authority, Series CC, | | | | |
| | | (FSA), 5.25%, 7/1/32 | | | | 6,124,855 |
| | | | | $ | | 23,593,825 |
| |
| Insured-Water and Sewer — 0.6% | | | | |
| $ 2,535 | | Nassau County Industrial Development Agency, (Water | | | | |
| | | Services Corp.), (AMBAC), (AMT), 5.00%, 12/1/35 | | $ | | 2,565,369 |
| | | | | $ | | 2,565,369 |
| |
| Lease Revenue / Certificates of | | | | |
| Participation — 7.2% | | | | |
| $27,940 | | New York Urban Development Corp., 5.70%, 4/1/20 | | $ | | 31,804,102 |
| | | | | $ | | 31,804,102 |
| |
| Other Revenue — 3.8% | | | | |
| $ 2,000 | | Albany Industrial Development Agency Civic Facility, | | | | |
| | | (Charitable Leadership), 5.75%, 7/1/26 | | $ | | 2,008,060 |
| 3,770 | | New York City Industrial Development Agency, | | | | |
| | | (YMCA of Greater New York), 5.00%, 8/1/36 | | | | 3,787,154 |
| 10,500 | | Puerto Rico Infrastructure Financing Authority, | | | | |
| | | 5.50%, 10/1/32(4) | | | | 11,088,945 |
| | | | | $ | | 16,884,159 |
| |
| Senior Living / Life Care — 0.8% | | | | |
| $ 2,670 | | Glen Cove Industrial Development Agency, | | | | |
| | | (The Regency at Glen Cove), 9.50%, 7/1/12(7) | | $ | | 2,420,008 |
| 800 | | Mount Vernon Industrial Development Agency, | | | | |
| | | (Wartburg Senior Housing, Inc.), 6.20%, 6/1/29 | | | | 810,504 |
| 550 | | Suffolk County Industrial Development Agency, | | | | |
| | | (Jefferson’s Ferry Project), 5.00%, 11/1/28 | | | | 518,183 |
| | | | | $ | | 3,748,695 |
| Principal Amount | | |
| (000’s omitted) | | Security | | Value |
| |
| Special Tax Revenue — 3.4% | | |
| $10,520 | | Puerto Rico Sales Tax Financing, 5.25%, 8/1/57 | | $ 10,908,083 |
| 50,000 | | Puerto Rico Sales Tax Financing, Series A, 0.00%, 8/1/56 | | 4,035,500 |
| | | | | $ 14,943,583 |
| |
| Transportation — 5.4% | | |
| $ 5,500 | | Metropolitan Transportation Authority, 5.00%, 11/15/35 | | $ 5,645,640 |
| 2,500 | | Port Authority of New York and New Jersey, | | |
| | | 6.125%, 6/1/94 | | 2,910,050 |
| 7,600 | | Port Authority of New York and New Jersey, (AMT), | | |
| | | 4.75%, 6/15/33(4) | | 7,422,996 |
| 8,050 | | Port Authority of New York and New Jersey, (AMT), | | |
| | | 4.75%, 12/1/34 | | 7,836,112 |
| | | | | $ 23,814,798 |
| |
| Water and Sewer — 7.4% | | |
| $ 3,000 | | New York City Municipal Water Finance Authority, | | |
| | | 4.25%, 6/15/33 | | $ 2,816,610 |
| 3,250 | | New York State Environmental Facilities Corp., Clean Water, | | |
| | | (Municipal Water Finance), 4.50%, 6/15/36 | | 3,185,585 |
| 15,000 | | New York State Environmental Facilities Corp., Clean Water, | | |
| | | (Municipal Water Finance), Series A, 4.50%, 6/15/36 | | 14,702,700 |
| 12,420 | | New York State Environmental Facilities Corp., Clean Water, | | |
| | | (Municipal Water Finance), Series B, 4.50%, 6/15/36 | | 12,115,958 |
| | | | | $ 32,820,853 |
| |
| Total Tax-Exempt Investments — 110.6% | | |
| (identified cost $469,234,333) | | $490,015,404 |
| |
| Other Assets, Less Liabilities — (10.6)% | | $ (46,775,029) |
| |
| Net Assets — 100.0% | | $443,240,375 |
| |
| AMBAC - AMBAC Financial Group, Inc. | | |
| AMT - Interest earned from these securities may be considered a |
| tax preference item for purposes of the Federal Alternative |
| Minimum Tax. | | |
| CIFG - CIFG Assurance North America, Inc. | | |
| FGIC - Financial Guaranty Insurance Company | | |
| FNMA - Federal National Mortgage Association (Fannie Mae) |
| FSA - Financial Security Assurance, Inc. | | |
| MBIA - Municipal Bond Insurance Association | | |
S e e n o t e s t o f i n a n c i a l s t a t e m e n t s
40 |
Eaton Vance New York Municipals Fund a s o f S e p t e m b e r 3 0 , 2 0 0 7
P O R T F O L I O O F I N V E S T M E N T S C O N T ’ D |
The Fund invests primarily in debt securities issued by New York municipalities. The ability of the issuers of the debt securities to meet their obligations may be affected by economic developments in a specific industry or municipality. In order to reduce the risk associated with such economic developments, at September 30, 2007, 31.1% of total investments are backed by bond insurance of various financial institutions and financial guaranty assurance agencies. The aggregate percentage insured by an individual financial institution ranged from 1.6% to 12.9% of total investments.
| (1) | Security is in bankruptcy but continues to make full interest payments. |
| |
| (2) | Security (or a portion thereof) has been segregated to cover margin requirements on open financial futures contracts. |
| |
| (3) | Security has been issued as an inverse floater bond. The stated interest rate represents the rate in effect at September 30, 2007. |
| |
| (4) | Security represents the underlying municipal obligation of an inverse floating rate obligation held by the Fund. |
| |
| (5) | Security exempt from registration under Rule 144A of the Securities Act of 1933. These securities may be sold in transactions exempt from registration, normally to qualified institutional buyers. At September 30, 2007, the aggregate value of the securities is $1,752,705 or 0.4% of the Fund’s net assets. |
| |
| (6) | Security has been issued as a leveraged inverse floater bond. The stated interest rate represents the rate in effect at September 30, 2007. |
| |
| (7) | Security in default with respect to scheduled principal payments. |
| |
S e e n o t e s t o f i n a n c i a l s t a t e m e n t s
41 |
Eaton Vance Ohio Municipals Fund a s o f S e p t e m b e r 3 0 , 2 0 0 7
P O R T F O L I O O F I N V E S T M E N T S |
| Ta x - E x e m p t I n v e s t m e n t s — 1 0 6 . 3 % | | | | |
| |
| Principal Amount | | | | |
| (000’s omitted) | | Security | | Value |
| |
| Cogeneration — 0.6% | | | | |
| $ 1,905 | | Ohio Water Development Authority, Solid Waste Disposal, | | | | |
| | | (Bay Shore Power), (AMT), 5.875%, 9/1/20 | | $ | | 1,922,945 |
| | | | | $ | | 1,922,945 |
| |
| Education — 0.5% | | | | |
| $ 550 | | Ohio Higher Educational Facilities Authority, (Case Western | | | | |
| | | Reserve University), 6.50%, 10/1/20 | | $ | | 662,260 |
| 1,055 | | Ohio Higher Educational Facilities Authority, (Oberlin College), | | | | |
| | | 5.00%, 10/1/29 | | | | 1,071,015 |
| | | | | $ | | 1,733,275 |
| |
| Electric Utilities — 0.7% | | | | |
| $ 1,825 | | Clyde, Electric System Revenue, (AMT), 6.00%, 11/15/14 | | $ | | 1,882,579 |
| 125 | | Puerto Rico Electric Power Authority, DRIVERS, Variable Rate, | | | | |
| | | 6.79%, 7/1/25(1)(2) | | | | 135,919 |
| 375 | | Puerto Rico Electric Power Authority, DRIVERS, Variable Rate, | | | | |
| | | 6.79%, 7/1/37(1)(2) | | | | 390,967 |
| | | | | $ | | 2,409,465 |
| |
| Escrowed / Prerefunded — 6.7% | | | | |
| $ 2,000 | | Highland County, (Joint Township Hospital District), | | | | |
| | | Prerefunded to 12/1/09, 6.75%, 12/1/29 | | $ | | 2,157,240 |
| 1,205 | | North Canton Health Care Facilities, (St. Luke Lutheran), | | | | |
| | | (GNMA), Prerefunded to 3/20/11, 6.10%, 9/20/16 | | | | 1,296,002 |
| 6,455 | | North Canton Health Care Facilities, (St. Luke Lutheran), | | | | |
| | | (GNMA), Prerefunded to 3/20/11, 9.55%, 3/20/32 | | | | 7,855,154 |
| 2,500 | | Ohio Higher Educational Facilities Authority, (Case Western | | | | |
| | | Reserve University), Prerefunded to 10/1/12, | | | | |
| | | 5.50%, 10/1/21 | | | | 2,716,500 |
| 2,000 | | Ohio Water Development Authority, (Fresh Water | | | | |
| | | Improvement), Prerefunded to 6/1/14, 5.00%, 12/1/28 | | | | 2,159,180 |
| 4,250 | | Parma, (Parma Community General Hospital Association), | | | | |
| | | Prerefunded to 11/1/08, 5.375%, 11/1/29 | | | | 4,374,695 |
| 1,670 | | Richland County Hospital Facilities, (Medcentral Health | | | | |
| | | Systems), Prerefunded to 11/15/10, 6.375%, 11/15/30 | | | | 1,822,187 |
| | | | | $ | | 22,380,958 |
| |
| General Obligations — 0.2% | | | | |
| $ 580 | | Tuscarawas County Public Library Improvement, | | | | |
| | | 6.90%, 12/1/11 | | $ | | 581,235 |
| | | | | $ | | 581,235 |
| Principal Amount | | | | |
| (000’s omitted) | | Security | | Value |
| |
| Hospital — 5.2% | | | | |
| $ 1,350 | | Cuyahoga County, (Cleveland Clinic Health System), | | | | |
| | | 5.50%, 1/1/29 | | $ | | 1,411,789 |
| 500 | | Erie County Hospital Facilities, (Firelands Regional | | | | |
| | | Medical Center), 5.00%, 8/15/36 | | | | 497,700 |
| 2,350 | | Erie County Hospital Facilities, (Firelands Regional Medical | | | | |
| | | Center), 5.25%, 8/15/46 | | | | 2,374,440 |
| 3,000 | | Erie County Hospital Facilities, (Firelands Regional Medical | | | | |
| | | Center), 5.625%, 8/15/32 | | | | 3,102,030 |
| 1,250 | | Miami County, (Upper Valley Medical Center), | | | | |
| | | 5.25%, 5/15/26 | | | | 1,263,312 |
| 2,000 | | Ohio Higher Educational Facilities Authority, (University Hospital | | | | |
| | | Health Systems, Inc.), 4.75%, 1/15/36 | | | | 1,881,360 |
| 2,500 | | Ohio Higher Educational Facilities Authority, (University Hospital | | | | |
| | | Health Systems, Inc.), Series A, 4.75%, 1/15/46 | | | | 2,313,750 |
| 3,500 | | Richland County Hospital Facilities, (Medcentral Health | | | | |
| | | Systems), 5.25%, 11/15/36 | | | | 3,535,175 |
| 830 | | Richland County Hospital Facilities, (Medcentral Health | | | | |
| | | Systems), 6.375%, 11/15/30 | | | | 874,181 |
| | | | | $ | | 17,253,737 |
| |
| Industrial Development Revenue — 4.7% | | | | |
| $ 3,970 | | Cleveland Airport, (Continental Airlines), (AMT), | | | | |
| | | 5.375%, 9/15/27 | | $ | | 3,638,942 |
| 2,890 | | Dayton, Special Facilities Revenue, (Emery Air Freight), | | | | |
| | | 5.625%, 2/1/18 | | | | 2,961,036 |
| 1,000 | | Ohio Pollution Control, (Standard Oil), 6.75%, 12/1/15 | | | | 1,191,380 |
| 4,000 | | Ohio Sewer and Solid Waste Disposal Facilities, (Anheuser | | | | |
| | | Busch), (AMT), 6.00%, 7/1/35 | | | | 4,182,720 |
| 825 | | Ohio Water Development Authority, Solid Waste Disposal, | | | | |
| | | (Allied Waste North America, Inc.), (AMT), 5.15%, 7/15/15 | | | | 817,888 |
| 3,165 | | Virgin Islands Public Finance Authority, (Hovensa LLC), (AMT), | | | | |
| | | 4.70%, 7/1/22 | | | | 2,969,245 |
| | | | | $ | | 15,761,211 |
| |
| Insured-Education — 3.0% | | | | |
| $ 1,000 | | Miami University, (AMBAC), 3.25%, 9/1/26 | | $ | | 822,720 |
| 1,500 | | Ohio Higher Educational Facilities Authority, (University of | | | | |
| | | Dayton), (AMBAC), 5.00%, 12/1/30 | | | | 1,564,365 |
| 2,100 | | Puerto Rico Industrial, Tourist, Educational, Medical and | | | | |
| | | Environmental Control Facilities Authority, (University Plaza), | | | | |
| | | (MBIA), 5.00%, 7/1/33(3) | | | | 2,158,625 |
| 1,340 | | University of Akron, (FGIC), 4.75%, 1/1/26 | | | | 1,363,490 |
| 4,000 | | University of Cincinnati, (FGIC), 5.00%, 6/1/31 | | | | 4,092,720 |
| | | | | $ | | 10,001,920 |
| |
| Insured-Electric Utilities — 9.0% | | | | |
| $ 2,000 | | Cuyahoga County Utility Systems, (Medical Center Co.), | | | | |
| | | (MBIA), (AMT), 6.10%, 8/15/15 | | $ | | 2,007,280 |
S e e n o t e s t o f i n a n c i a l s t a t e m e n t s
42 |
Eaton Vance Ohio Municipals Fund a s o f S e p t e m b e r 3 0 , 2 0 0 7
P O R T F O L I O O F I N V E S T M E N T S C O N T ’ D |
| Principal Amount | | | | |
| (000’s omitted) | | Security | | Value |
| |
| Insured-Electric Utilities (continued) | | | | |
| $ 2,000 | | Hamilton, Electric System Revenue, (FSA), | | | | |
| | | 4.70%, 10/15/25 | | $ | | 2,033,780 |
| 13,750 | | Ohio Air Quality Development Authority, | | | | |
| | | (Dayton Power & Light Co.), (FGIC), 4.80%, 1/1/34 | | | | 13,797,575 |
| 5,330 | | Ohio Air Quality Development Authority, (Ohio Power), | | | | |
| | | (AMBAC), 5.15%, 5/1/26 | | | | 5,474,976 |
| 3,000 | | Ohio Municipal Electric Generation Agency, (MBIA), | | | | |
| | | 0.00%, 2/15/26 | | | | 1,277,250 |
| 2,500 | | Ohio Municipal Electric Generation Agency, (MBIA), | | | | |
| | | 0.00%, 2/15/27 | | | | 1,012,225 |
| 4,750 | | Ohio Municipal Electric Generation Agency, (MBIA), | | | | |
| | | 0.00%, 2/15/28 | | | | 1,824,665 |
| 2,700 | | Puerto Rico Electric Power Authority, (MBIA), | | | | |
| | | 4.75%, 7/1/33(3) | | | | 2,728,962 |
| | | | | $ | | 30,156,713 |
| |
| Insured-Escrowed / Prerefunded — 8.7% | | | | |
| $ 1,500 | | Amherst School District, (FGIC), Prerefunded to 12/1/11, | | | | |
| | | 5.00%, 12/1/26 | | $ | | 1,582,740 |
| 1,250 | | Athens City School District, (FSA), Prerefunded to | | | | |
| | | 12/1/10, 6.00%, 12/1/24 | | | | 1,353,275 |
| 1,000 | | Cincinnati City School District, (Classroom Facilities | | | | |
| | | Construction & Improvement), (FSA), Prerefunded to | | | | |
| | | 12/1/13, 5.00%, 12/1/31 | | | | 1,076,560 |
| 495 | | Cuyahoga County Hospital, (Cleveland Clinic), (MBIA), | | | | |
| | | Escrowed to Maturity, 5.125%, 1/1/29 | | | | 506,751 |
| 2,390 | | Hamilton County, Sales Tax Revenue, (AMBAC), | | | | |
| | | Prerefunded to 12/1/10, 5.25%, 12/1/32 | | | | 2,512,703 |
| 2,490 | | Hamilton County, Sales Tax Revenue, (MBIA), | | | | |
| | | Prerefunded to 6/1/08, 5.00%, 12/1/27 | | | | 2,539,651 |
| 1,475 | | Lima City School District, (AMBAC), Prerefunded to | | | | |
| | | 12/1/10, 6.00%, 12/1/22 | | | | 1,612,411 |
| 1,815 | | Little Miami School District, (FSA), Prerefunded to | | | | |
| | | 12/1/16, 5.00%, 12/1/34 | | | | 1,980,383 |
| 3,000 | | Marysville Exempt Village School District, (School Facilities), | | | | |
| | | (MBIA), Prerefunded to 6/1/15, 5.25%, 12/1/30 | | | | 3,299,010 |
| 1,300 | | Minerva Local School District, (Classroom Facility), (MBIA), | | | | |
| | | Prerefunded to 12/1/12, 5.30%, 12/1/29 | | | | 1,405,664 |
| 800 | | Norwalk City School District, (AMBAC), Prerefunded to | | | | |
| | | 12/1/09, 4.75%, 12/1/26 | | | | 821,320 |
| 4,640 | | Puerto Rico Electric Power Authority, (FGIC), Prerefunded to | | | | |
| | | 7/1/15, 5.00%, 7/1/35 | | | | 5,058,018 |
| 1,000 | | Springfield City School District, (Clark County), (FGIC), | | | | |
| | | Prerefunded to 12/1/11, 5.20%, 12/1/23 | | | | 1,080,920 |
| 4,000 | | University of Akron, (FGIC), Prerefunded to | | | | |
| | | 1/1/10, 5.75%, 1/1/29(3) | | | | 4,228,300 |
| | | | | $ | | 29,057,706 |
| Principal Amount | | | | |
| (000’s omitted) | | Security | | Value |
| |
| Insured-General Obligations — 37.3% | | | | |
| $ 2,000 | | Adams County Local School District, (FSA), 4.25%, 12/1/33 | | $ | | 1,869,440 |
| 2,500 | | Canal Winchester Local School District, (MBIA), | | | | |
| | | 0.00%, 12/1/32 | | | | 750,000 |
| 10,000 | | Cincinnati City School District, (Classroom Facilities | | | | |
| | | Construction & Improvement), (FGIC), 5.25%, 12/1/29 | | | | 11,218,100 |
| 1,000 | | Cincinnati City School District, (Classroom Facilities | | | | |
| | | Construction & Improvement), (FSA), 5.00%, 12/1/21 | | | | 1,087,540 |
| 2,155 | | Cleveland, (AMBAC), 5.50%, 10/1/23 | | | | 2,466,872 |
| 1,000 | | Cleveland, (FGIC), 4.75%, 11/15/27 | | | | 1,018,920 |
| 5,000 | | Columbus School District, (Classroom Facilities | | | | |
| | | Construction & Improvement), (FSA), 4.25%, 12/1/32 | | | | 4,687,200 |
| 4,000 | | Fairview Park, (MBIA), 5.00%, 12/1/25 | | | | 4,186,840 |
| 1,000 | | Gallia County Local School District, (FSA), 4.75%, 12/1/25 | | | | 1,024,590 |
| 3,085 | | Hamilton City School District, (FSA), 4.25%, 12/1/30 | | | | 2,895,488 |
| 1,120 | | Hamilton City School District, (FSA), 5.00%, 12/1/18 | | | | 1,211,493 |
| 2,890 | | Hilliard School District, (MBIA), 5.00%, 12/1/27 | | | | 3,025,136 |
| 6,580 | | Indian Lake Local School District, (School Facilities | | | | |
| | | Construction), (MBIA), 5.00%, 12/1/34 | | | | 6,843,200 |
| 1,975 | | Ironton City School District, (MBIA), 4.25%, 12/1/28 | | | | 1,885,849 |
| 4,000 | | Jackson Local School District, (Stark and Summit County), | | | | |
| | | (XLCA), 4.25%, 12/1/33 | | | | 3,721,200 |
| 1,180 | | Lake County, (MBIA), 5.00%, 12/1/25 | | | | 1,232,262 |
| 1,965 | | Lakewood City School District, (FSA), 4.50%, 12/1/26 | | | | 1,967,279 |
| 5,500 | | Lakota Ohio Local School District, (FSA), 5.00%, 12/1/29 | | | | 5,722,310 |
| 9,605 | | Maderia City School District, (FSA), 5.25%, 12/1/32 | | | | 10,721,869 |
| 3,505 | | Mahoning County, (FSA), 5.00%, 12/1/27 | | | | 3,683,124 |
| 1,065 | | Marysville Exempt Village School District, (FSA), | | | | |
| | | 4.375%, 12/1/29 | | | | 1,031,133 |
| 3,525 | | Mason City School District, (FSA), 5.25%, 12/1/31 | | | | 3,931,397 |
| 6,870 | | Olentangy School District, (FSA), 4.50%, 12/1/32 | | | | 6,735,623 |
| 3,695 | | Olentangy School District, (FSA), 5.00%, 12/1/21 | | | | 3,917,513 |
| 1,000 | | Orrville City School District, (AMBAC), 5.25%, 12/1/35 | | | | 1,061,890 |
| 1,000 | | Painesville City School District, (MBIA), 4.75%, 12/1/32 | | | | 1,005,660 |
| 1,620 | | Painesville City School District, (MBIA), 5.00%, 12/1/24 | | | | 1,696,804 |
| 2,115 | | Pickerington Local School District, (MBIA), 4.00%, 12/1/26 | | | | 1,968,409 |
| 8,340 | | Pickerington Local School District, (MBIA), 4.25%, 12/1/34 | | | | 7,773,047 |
| 1,500 | | Pickerington Local School District, (School Facility Contract), | | | | |
| | | (FGIC), 0.00%, 12/1/16 | | | | 1,036,530 |
| 1,250 | | South-Western City School District, (FSA), 4.25%, 12/1/26 | | | | 1,187,700 |
| 2,000 | | Springboro Community City School District, (FSA), | | | | |
| | | 5.25%, 12/1/30 | | | | 2,234,420 |
| 5,000 | | Springboro Community City School District, (FSA), | | | | |
| | | 5.25%, 12/1/32 | | | | 5,589,500 |
| 2,500 | | Sugarcreek Local School District, (FSA), 4.25%, 12/1/31 | | | | 2,322,650 |
| 5,000 | | Trotwood-Madison City School District, (School Improvements), | | | | |
| | | (FSA), 4.50%, 12/1/30 | | | | 4,925,400 |
| 6,705 | | Westerville City School District, (XLCA), 5.00%, 12/1/27 | | | | 7,206,199 |
| | | | | $124,842,587 |
S e e n o t e s t o f i n a n c i a l s t a t e m e n t s
43 |
Eaton Vance Ohio Municipals Fund a s o f S e p t e m b e r 3 0 , 2 0 0 7
P O R T F O L I O O F I N V E S T M E N T S C O N T ’ D |
| Principal Amount | | | | |
| (000’s omitted) | | Security | | Value |
| |
| Insured-Hospital — 3.3% | | | | |
| $ 1,000 | | Akron, Bath, Copley, Joint Township Hospital District, | | | | |
| | | (Children’s Hospital Medical Center), (FSA), | | | | |
| | | 5.25%, 11/15/25 | | $ | | 1,042,190 |
| 5,000 | | Butler County (Cincinnati Children’s Hospital), (FGIC), | | | | |
| | | 5.00%, 5/15/31 | | | | 5,131,900 |
| 500 | | Cuyahoga County, (Cleveland Clinic), (MBIA), | | | | |
| | | 5.125%, 1/1/29 | | | | 511,870 |
| 1,300 | | Franklin County, (Ohio Health Corp.), (MBIA), | | | | |
| | | 5.00%, 5/15/33 | | | | 1,320,631 |
| 2,845 | | Hamilton County, (Cincinnati Children’s Hospital), (FGIC), | | | | |
| | | 5.00%, 5/15/32 | | | | 2,900,278 |
| | | | | $ | | 10,906,869 |
| |
| Insured-Lease Revenue / Certificates of | | | | |
| Participation — 0.8% | | | | |
| $ 1,195 | | Ohio Higher Educational Facilities Authority, (Xavier | | | | |
| | | University), (CIFG), 5.00%, 5/1/22 | | $ | | 1,251,452 |
| 1,245 | | Ohio Higher Educational Facilities Authority, (Xavier | | | | |
| | | University), (CIFG), 5.25%, 5/1/21 | | | | 1,335,175 |
| | | | | $ | | 2,586,627 |
| |
| Insured-Special Tax Revenue — 2.4% | | | | |
| $ 610 | | Hamilton County, Sales Tax Revenue, (AMBAC), | | | | |
| | | 5.25%, 12/1/32 | | $ | | 632,857 |
| 4,760 | | Puerto Rico Infrastructure Financing Authority, (AMBAC), | | | | |
| | | 0.00%, 7/1/29 | | | | 1,702,700 |
| 5,000 | | Puerto Rico Infrastructure Financing Authority, (AMBAC), | | | | |
| | | 0.00%, 7/1/34 | | | | 1,371,150 |
| 590 | | Puerto Rico Infrastructure Financing Authority, (AMBAC), | | | | |
| | | 0.00%, 7/1/37 | | | | 139,181 |
| 3,600 | | Puerto Rico Infrastructure Financing Authority, (AMBAC), | | | | |
| | | 5.50%, 7/1/27(3) | | | | 4,116,276 |
| | | | | $ | | 7,962,164 |
| |
| Insured-Transportation — 10.9% | | | | |
| $ 1,000 | | Butler County Transportation Improvement District, (XLCA), | | | | |
| | | 4.50%, 12/1/34 | | $ | | 970,030 |
| 1,765 | | Butler County Transportation Improvement District, (XLCA), | | | | |
| | | 4.75%, 12/1/25 | | | | 1,808,578 |
| 5,000 | | Cleveland Airport, (FSA), 5.00%, 1/1/24 | | | | 5,223,850 |
| 7,000 | | Ohio Turnpike Commission, (FGIC), 5.50%, 2/15/24(4) | | | | 7,993,370 |
| 5,000 | | Puerto Rico Highway and Transportation Authority, (CIFG), | | | | |
| | | 5.25%, 7/1/41(3) | | | | 5,536,500 |
| 2,500 | | Puerto Rico Highway and Transportation Authority, (FSA), | | | | |
| | | 5.25%, 7/1/22 | | | | 2,793,725 |
| 6,000 | | Puerto Rico Highway and Transportation Authority, (MBIA), | | | | |
| | | 5.25%, 7/1/32(3) | | | | 6,681,690 |
| Principal Amount | | | | |
| (000’s omitted) | | Security | | Value |
| |
| Insured-Transportation (continued) | | | | |
| $ 4,765 | | Puerto Rico Highway and Transportation Authority, Series CC, | | | | |
| | | (FSA), 5.25%, 7/1/32 | | $ | | 5,306,352 |
| | | | | $ | | 36,314,095 |
| |
| Insured-Water and Sewer — 2.3% | | | | |
| $ 1,500 | | Marysville Wastewater Treatment System, (XLCA), | | | | |
| | | 4.75%, 12/1/46 | | $ | | 1,474,995 |
| 3,500 | | Marysville Wastewater Treatment System, (XLCA), | | | | |
| | | 4.75%, 12/1/47 | | | | 3,453,380 |
| 1,670 | | Northeast Ohio Regional Sewer District, Wastewater Revenue, | | | | |
| | | (MBIA), 4.50%, 11/15/37 | | | | 1,622,405 |
| 1,060 | | Toledo, Waterworks, (MBIA), 5.00%, 11/15/25 | | | | 1,109,290 |
| | | | | $ | | 7,660,070 |
| |
| Nursing Home — 0.4% | | | | |
| $ 1,195 | | Cuyahoga County Health Care Facilities, (Maple Care Center), | | | | |
| | | (GNMA), (AMT), 8.00%, 8/20/16 | | $ | | 1,288,007 |
| | | | | $ | | 1,288,007 |
| |
| Other Revenue — 2.8% | | | | |
| $ 9,000 | | Puerto Rico Infrastructure Financing Authority, | | | | |
| | | 5.50%, 10/1/32(3) | | $ | | 9,504,810 |
| | | | | $ | | 9,504,810 |
| |
| Pooled Loans — 3.6% | | | | |
| $ 740 | | Cleveland-Cuyahoga County Port Authority, | | | | |
| | | 5.125%, 5/15/25 | | $ | | 721,922 |
| 780 | | Cleveland-Cuyahoga County Port Authority, | | | | |
| | | (Columbia National), (AMT), 5.00%, 5/15/20 | | | | 772,395 |
| 225 | | Ohio Economic Development Commission, (Burrows Paper), | | | | |
| | | (AMT), 7.625%, 6/1/11 | | | | 225,650 |
| 1,440 | | Ohio Economic Development Commission, (Ohio Enterprise | | | | |
| | | Bond Fund), (AMT), 4.85%, 6/1/25 | | | | 1,473,538 |
| 570 | | Ohio Economic Development Commission, (Progress Plastic | | | | |
| | | Products), (AMT), 7.80%, 12/1/09 | | | | 571,756 |
| 7,455 | | Rickenbacker Port Authority, Oasbo Expanded Asset Pool | | | | |
| | | Loan, 5.375%, 1/1/27(3) | | | | 7,937,314 |
| 420 | | Toledo Lucas County, Port Authority Development, | | | | |
| | | 5.125%, 11/15/25 | | | | 421,361 |
| | | | | $ | | 12,123,936 |
| |
| Senior Living / Life Care — 0.0% | | | | |
| $ 40 | | Hamilton County Hospital Facilities, | | | | |
| | | (Episcopal Retirement Home), 6.80%, 1/1/08 | | $ | | 40,095 |
| | | | | $ | | 40,095 |
S e e n o t e s t o f i n a n c i a l s t a t e m e n t s
44 |
Eaton Vance Ohio Municipals Fund a s o f S e p t e m b e r 3 0 , 2 0 0 7
P O R T F O L I O O F I N V E S T M E N T S C O N T ’ D |
| Principal Amount | | | | |
| (000’s omitted) | | Security | | Value |
| |
| Special Tax Revenue — 1.1% | | | | |
| $ 2,000 | | Cleveland-Cuyahoga County Port Authority, 7.00%, 12/1/18 | | $ | | 2,161,320 |
| 1,400 | | Cuyahoga County, Economic Development, (Shaker Square), | | | | |
| | | 6.75%, 12/1/30 | | | | 1,537,214 |
| | | | | $ | | 3,698,534 |
| |
| Water and Sewer — 2.1% | | | | |
| $ 3,000 | | Cincinnati Water System Authority, 4.50%, 12/1/23 | | $ | | 3,030,180 |
| 4,000 | | Cincinnati Water System Authority, 5.00%, 12/1/32 | | | | 4,173,200 |
| | | | | $ | | 7,203,380 |
| |
| Total Tax-Exempt Investments | | | | |
| (identified cost $345,917,336) | | $355,390,339 |
| |
| S h o r t - Te r m I n v e s t m e n t s — 1 . 3 % | | | | |
| |
| Principal Amount | | | | |
| (000’s omitted) | | Security | | Value |
| $ 4,190 | | Franklin County, (Children’s Hospital), Series A, (FGIC), | | | | |
| | | Variable Rate, 3.93%, 5/1/31(5) | | $ | | 4,190,000 |
| |
| Total Short-Term Investments | | | | |
| (identified cost $4,190,000) | | $ | | 4,190,000 |
| |
| Total Investments — 107.6% | | | | |
| (identified cost $350,107,336) | | $359,580,339 |
| |
| Other Assets, Less Liabilities — (7.6)% | | $ (25,300,611) |
| |
| Net Assets — 100.0% | | $334,279,728 |
| AMBAC - AMBAC Financial Group, Inc. | | | | |
| AMT - Interest earned from these securities may be considered a |
| tax preference item for purposes of the Federal Alternative |
| Minimum Tax. | | | | |
| CIFG - CIFG Assurance North America, Inc. | | | | |
| DRIVERS - Derivative Inverse Tax-Exempt Receipts | | | | |
| FGIC - Financial Guaranty Insurance Company | | | | |
| FSA - Financial Security Assurance, Inc. | | | | |
| GNMA - Government National Mortgage Association (Ginnie Mae) |
| MBIA - Municipal Bond Insurance Association | | | | |
| XLCA - XL Capital Assurance, Inc. | | | | |
The Fund invests primarily in debt securities issued by Ohio municipalities. The ability of the issuers of the debt securities to meet their obligations may be affected by economic developments in a specific industry or municipality. In order to reduce the risk associated with such economic developments, at September 30, 2007, 73.3% of total investments are backed by bond insurance of various financial institutions and financial guaranty assurance agencies. The aggregate percentage insured by an individual financial institution ranged from 2.3% to 24.3% of total investments.
| (1) | Security exempt from registration under Rule 144A of the Securities Act of 1933. These securities may be sold in transactions exempt from registration, normally to qualified institutional buyers. At September 30, 2007, the aggregate value of the securities is $526,886 or 0.2% of the Fund’s net assets. |
| |
| (2) | Security has been issued as a leveraged inverse floater bond. The stated interest rate represents the rate in effect at September 30, 2007. |
| |
| (3) | Security represents the underlying municipal obligation of an inverse floating rate obligation held by the Fund. |
| |
| (4) | Security (or a portion thereof) has been segregated to cover margin requirements on open financial futures contracts. |
| |
| (5) | Variable rate demand obligation. The stated interest rate represents the rate in effect at September 30, 2007. |
| |
S e e n o t e s t o f i n a n c i a l s t a t e m e n t s
45 |
Eaton Vance Rhode Island Municipals Fund a s o f S e p t e m b e r 3 0 , 2 0 0 7
P O R T F O L I O O F I N V E S T M E N T S |
| Ta x - E x e m p t I n v e s t m e n t s — 1 0 4 . 4 % | | |
| |
| Principal Amount | | | | |
| (000’s omitted) | | Security | | Value |
| |
| Education — 5.5% | | | | |
| $ 500 | | Rhode Island Health and Educational Building Corp., | | |
| | | (Brown University), 4.75%, 9/1/33 | | $ | | 502,420 |
| 2,105 | | Rhode Island Health and Educational Building Corp., | | |
| | | (Brown University), 4.75%, 9/1/37 | | | | 2,110,852 |
| 400 | | Rhode Island Health and Educational Building Corp., | | |
| | | (Higher Education Facility-Brown University), | | |
| | | 5.00%, 9/1/23 | | | | 414,092 |
| 500 | | Rhode Island Health and Educational Building Corp., | | |
| | | (Higher Education Facility-Salve Regina University), | | |
| | | 5.125%, 3/15/32 | | | | 493,470 |
| | | | | $ | | 3,520,834 |
| |
| Electric Utilities — 1.0% | | | | |
| $ 150 | | Puerto Rico Electric Power Authority, DRIVERS, Variable Rate, | | |
| | | 6.79%, 7/1/25(1)(2) | | $ | | 163,102 |
| 450 | | Puerto Rico Electric Power Authority, DRIVERS, Variable Rate, | | |
| | | 6.79%, 7/1/37(1)(2) | | | | 469,161 |
| | | | | $ | | 632,263 |
| |
| Escrowed / Prerefunded — 3.5% | | | | |
| $ 210 | | Puerto Rico Electric Power Authority, Prerefunded to 7/1/13, | | |
| | | 5.125%, 7/1/29(3) | | $ | | 227,135 |
| 790 | | Puerto Rico Electric Power Authority, Prerefunded to 7/1/13, | | |
| | | 5.125%, 7/1/29(3) | | | | 854,460 |
| 400 | | Puerto Rico Electric Power Authority, Prerefunded to 7/1/13, | | |
| | | Variable Rate, 6.01%, 7/1/29(1)(4) | | | | 465,268 |
| 1,000 | | Rhode Island Health and Educational Building Corp., | | |
| | | (Hospital Financing-Lifespan Obligation Group), | | |
| | | Prerefunded to 8/15/12, 6.50%, 8/15/32 | | 1,127,970 |
| | | | | $ | | 2,674,833 |
| |
| General Obligations — 0.2% | | | | |
| $ 225 | | Puerto Rico, 0.00%, 7/1/16 | | $ | | 155,475 |
| | | | | $ | | 155,475 |
| |
| Hospital — 0.8% | | | | |
| $ 500 | | Rhode Island Health and Educational Building Corp., | | |
| | | (Newport Hospital), 5.30%, 7/1/29 | | $ | | 506,870 |
| | | | | $ | | 506,870 |
| Principal Amount | | | | |
| (000’s omitted) | | Security | | Value |
| |
| Housing — 3.0% | | | | |
| $ 900 | | Rhode Island Housing and Mortgage Finance Corp., (AMT), | | | | |
| | | 4.90%, 4/1/22 | | $ | | 901,134 |
| 1,000 | | Rhode Island Housing and Mortgage Finance Corp., (AMT), | | | | |
| | | 4.90%, 10/1/28 | | | | 983,890 |
| | | | | $ | | 1,885,024 |
| |
| Industrial Development Revenue — 3.4% | | | | |
| $1,000 | | Rhode Island Industrial Facilities Corp., | | | | |
| | | (Waste Management, Inc.), (AMT), 4.625%, 4/1/16 | | $ | | 997,210 |
| 1,250 | | Virgin Islands Public Finance Authority, | | | | |
| | | (Hovensa LLC), (AMT), 4.70%, 7/1/22 | | | | 1,172,687 |
| | | | | $ | | 2,169,897 |
| |
| Insured-Education — 14.8% | | | | |
| $2,145 | | Rhode Island Health and Educational Building Corp., | | | | |
| | | (Bryant College), (AMBAC), 5.00%, 12/1/31 | | $ | | 2,195,107 |
| 900 | | Rhode Island Health and Educational Building Corp., | | | | |
| | | (Higher Education Facilities-Rhode Island School of Design), | | | | |
| | | (XLCA), 5.00%, 8/15/23 | | | | 933,606 |
| 1,000 | | Rhode Island Health and Educational Building Corp., | | | | |
| | | (Higher Education Facilities-University of Rhode Island), | | | | |
| | | (AMBAC), 5.00%, 9/15/30 | | | | 1,034,830 |
| 1,575 | | Rhode Island Health and Educational Building Corp., | | | | |
| | | (Johnson and Wales University), (MBIA), 5.00%, 4/1/29 | | | | 1,613,367 |
| 1,000 | | Rhode Island Health and Educational Building Corp., | | | | |
| | | (Providence College), (XLCA), 5.00%, 11/1/24 | | | | 1,030,370 |
| 1,600 | | Rhode Island Health and Educational Building Corp., | | | | |
| | | (Rhode Island School of Design), (MBIA), 5.00%, 6/1/31 | | | | 1,637,968 |
| 500 | | Rhode Island Health and Educational Building Corp., | | | | |
| | | (Roger Williams College), (AMBAC), 5.00%, 11/15/24 | | | | 515,350 |
| 500 | | Rhode Island Health and Educational Building Corp. | | | | |
| | | (Public Schools), Series B, (AMBAC), 5.00%, 5/15/27 | | | | 520,725 |
| | | | | $ | | 9,481,323 |
| |
| Insured-Electric Utilities — 2.6% | | | | |
| $ 975 | | Puerto Rico Electric Power Authority, (MBIA), | | | | |
| | | 0.00%, 7/1/17 | | $ | | 632,453 |
| 900 | | Puerto Rico Electric Power Authority, (MBIA), | | | | |
| | | 5.50%, 7/1/16(3) | | | | 1,015,530 |
| | | | | $ | | 1,647,983 |
S e e n o t e s t o f i n a n c i a l s t a t e m e n t s
46 |
Eaton Vance Rhode Island Municipals Fund a s o f S e p t e m b e r 3 0 , 2 0 0 7
P O R T F O L I O O F I N V E S T M E N T S C O N T ’ D |
| Principal Amount | | | | |
| (000’s omitted) | | Security | | Value |
| |
| Insured-Escrowed / Prerefunded — 8.7% | | | | |
| $1,000 | | North Kingstown, (FGIC), Prerefunded to 10/1/09, | | | | |
| | | 5.875%, 10/1/25(5) | | $ | | 1,055,700 |
| 1,000 | | Puerto Rico Electric Power Authority, (FSA), Prerefunded to | | | | |
| | | 7/1/10, 5.25%, 7/1/29(3) | | | | 1,056,437 |
| 230 | | Rhode Island Depositors Economic Protection Corp., (FSA), | | | | |
| | | Escrowed to Maturity, 5.75%, 8/1/21 | | | | 268,042 |
| 500 | | Rhode Island Depositors Economic Protection Corp., (MBIA), | | | | |
| | | Escrowed to Maturity, 5.80%, 8/1/09 | | | | 520,630 |
| 1,000 | | Rhode Island Depositors Economic Protection Corp., (MBIA), | | | | |
| | | Escrowed to Maturity, 5.80%, 8/1/12 | | | | 1,098,530 |
| 1,000 | | Rhode Island Health and Educational Building Corp., | | | | |
| | | (University of Rhode Island), (AMBAC), Prerefunded to | | | | |
| | | 9/15/10, 5.70%, 9/15/30 | | | | 1,069,700 |
| 500 | | Rhode Island Health and Educational Building Corp., | | | | |
| | | (University of Rhode Island), (MBIA), Prerefunded to | | | | |
| | | 9/15/09, 5.50%, 9/15/19 | | | | 523,825 |
| | | | | $ | | 5,592,864 |
| |
| Insured-General Obligations — 6.8% | | | | |
| $ 600 | | North Kingstown, (FGIC), 5.00%, 10/1/25 | | $ | | 627,990 |
| 500 | | Puerto Rico, (FSA), Variable Rate, 7.742%, 7/1/27(1)(2) | | | | 583,785 |
| 600 | | Rhode Island and Providence Plantations, (FSA), | | | | |
| | | 4.75%, 8/1/26 | | | | 614,106 |
| 1,850 | | Rhode Island and Providence Plantations, (MBIA), | | | | |
| | | 5.00%, 11/15/25 | | | | 1,946,126 |
| 575 | | Warwick, (AMBAC), 5.00%, 7/15/21 | | | | 600,352 |
| | | | | $ | | 4,372,359 |
| |
| Insured-Hospital — 6.6% | | | | |
| $1,900 | | Rhode Island Health and Educational Building Corp., | | | | |
| | | (Lifespan), (MBIA), 5.25%, 5/15/26 | | $ | | 1,936,727 |
| 2,250 | | Rhode Island Health and Educational Building Corp., | | | | |
| | | (Rhode Island Hospital), (FSA), 5.00%, 5/15/32 | | | | 2,301,322 |
| | | | | $ | | 4,238,049 |
| |
| Insured-Housing — 3.7% | | | | |
| $1,000 | | Rhode Island Housing and Mortgage Finance Corp., | | | | |
| | | (Rental Housing Program), (FSA), (AMT), 5.00%, 10/1/48 | | $ | | 966,380 |
| 400 | | Rhode Island Housing and Mortgage Finance Corp., | | | | |
| | | (Rental Housing Program), (FSA), (AMT), 5.25%, 10/1/31 | | | | 402,044 |
| 1,000 | | Rhode Island Housing and Mortgage Finance Corp., | | | | |
| | | (Rental Housing Program), (FSA), (AMT), 5.55%, 10/1/32 | | | | 1,014,440 |
| | | | | $ | | 2,382,864 |
| Principal Amount | | | | |
| (000’s omitted) | | Security | | Value |
| |
| Insured-Lease Revenue / Certificates of | | | | |
| Participation — 2.7% | | | | |
| $ 680 | | Providence Redevelopment Agency, (Public Safety Building), | | | | |
| | | (AMBAC), 5.00%, 4/1/25 | | $ | | 705,187 |
| 1,000 | | Providence Redevelopment Agency, (Public Safety Building), | | | | |
| | | (AMBAC), 5.00%, 4/1/28 | | | | 1,032,520 |
| | | | | $ | | 1,737,707 |
| |
| Insured-Pooled Loans — 2.3% | | | | |
| $1,000 | | Rhode Island Student Loan Authority, (AMBAC), (AMT), | | | | |
| | | 4.85%, 12/1/36 | | $ | | 974,940 |
| 500 | | Rhode Island Student Loan Authority, (AMBAC), (AMT), | | | | |
| | | 4.90%, 12/1/26 | | | | 506,980 |
| | | | | $ | | 1,481,920 |
| |
| Insured-Solid Waste — 1.2% | | | | |
| $ 750 | | Rhode Island Resource Recovery Corp., (MBIA), (AMT), | | | | |
| | | 5.00%, 3/1/22 | | $ | | 763,965 |
| | | | | $ | | 763,965 |
| |
| Insured-Special Tax Revenue — 8.9% | | | | |
| $2,300 | | Convention Center Authority of Rhode Island, (MBIA), | | | | |
| | | 5.25%, 5/15/15 | | $ | | 2,460,655 |
| 265 | | Puerto Rico Infrastructure Financing Authority, (AMBAC), | | | | |
| | | 0.00%, 7/1/28 | | | | 100,414 |
| 1,425 | | Puerto Rico Infrastructure Financing Authority, (AMBAC), | | | | |
| | | 0.00%, 7/1/29 | | | | 509,737 |
| 1,625 | | Puerto Rico Infrastructure Financing Authority, (AMBAC), | | | | |
| | | 0.00%, 7/1/37 | | | | 383,338 |
| 2,000 | | Puerto Rico Infrastructure Financing Authority, (FGIC), | | | | |
| | | 0.00%, 7/1/30 | | | | 678,320 |
| 2,145 | | Puerto Rico Sales Tax Financing, (AMBAC), 0.00%, 8/1/54 | | | | 211,240 |
| 395 | | Puerto Rico Sales Tax Financing, (MBIA), 0.00%, 8/1/44 | | | | 65,199 |
| 785 | | Puerto Rico Sales Tax Financing, (MBIA), 0.00%, 8/1/45 | | | | 123,253 |
| 630 | | Puerto Rico Sales Tax Financing, (MBIA), 0.00%, 8/1/46 | | | | 93,977 |
| 1,000 | | Rhode Island Economic Development Corp., | | | | |
| | | (Rhode Island Department of Transportation), | | | | |
| | | Motor Fuel Tax Revenue, (AMBAC), 5.00%, 6/15/26 | | | | 1,040,400 |
| | | | | $ | | 5,666,533 |
| |
| Insured-Transportation — 10.2% | | | | |
| $1,000 | | Puerto Rico Highway and Transportation Authority, (AMBAC), | | | | |
| | | 5.25%, 7/1/38 | | $ | | 1,116,110 |
| 1,500 | | Puerto Rico Highway and Transportation Authority, (CIFG), | | | | |
| | | 5.25%, 7/1/41(3) | | | | 1,660,950 |
| 1,500 | | Puerto Rico Highway and Transportation Authority, (FSA), | | | | |
| | | 5.25%, 7/1/33 | | | | 1,671,660 |
S e e n o t e s t o f i n a n c i a l s t a t e m e n t s
47 |
Eaton Vance Rhode Island Municipals Fund a s o f S e p t e m b e r 3 0 , 2 0 0 7
P O R T F O L I O O F I N V E S T M E N T S C O N T ’ D |
| Principal Amount | | | | |
| (000’s omitted) | | Security | | Value |
| |
| Insured-Transportation (continued) | | | | |
| $1,000 | | Rhode Island Economic Development Corp. | | | | |
| | | (T.F. Green Airport), (FSA), (AMT), 5.00%, 7/1/20 | | $ | | 1,030,550 |
| 1,000 | | Rhode Island Economic Development Corp., | | | | |
| | | (Rhode Island Airport Corp.), (CIFG), 5.00%, 7/1/31 | | | | 1,031,770 |
| | | | | $ | | 6,511,040 |
| |
| Insured-Water and Sewer — 6.8% | | | | |
| $2,850 | | Narragansett Bay Commission, (MBIA), 5.00%, 8/1/27 | | $ | | 2,959,326 |
| 1,000 | | Narragansett Bay Commission, (MBIA), 5.00%, 8/1/28 | | | | 1,037,020 |
| 350 | | Rhode Island Clean Water, Water Pollution Control, (MBIA), | | | | |
| | | 5.40%, 10/1/15 | | | | 378,385 |
| | | | | $ | | 4,374,731 |
| |
| Nursing Home — 4.4% | | | | |
| $ 500 | | Rhode Island Health and Educational Building Corp., | | | | |
| | | (Roger Williams Realty), 6.50%, 8/1/29 | | $ | | 528,900 |
| 1,275 | | Rhode Island Health and Educational Building Corp., | | | | |
| | | (Steere House), 5.80%, 7/1/20 | | | | 1,273,725 |
| 1,000 | | Rhode Island Health and Educational Building Corp., | | | | |
| | | (Tockwotton Home), 6.25%, 8/15/22 | | | | 1,004,920 |
| | | | | $ | | 2,807,545 |
| |
| Other Revenue — 3.5% | | | | |
| $ 250 | | Central Falls Detention Facility Revenue, 7.25%, 7/15/35 | | $ | | 275,090 |
| 1,545 | | Puerto Rico Infrastructure Financing Authority, | | | | |
| | | 5.50%, 10/1/32(3) | | | | 1,631,659 |
| 7,125 | | Tobacco Settlement Financing Corp., 0.00%, 6/1/52 | | | | 337,440 |
| | | | | $ | | 2,244,189 |
| |
| Special Tax Revenue — 3.1% | | | | |
| $1,410 | | Puerto Rico Sales Tax Financing, 5.25%, 8/1/57 | | $ | | 1,462,015 |
| 500 | | Tiverton, Obligation Tax Increment, (Mount Hope Bay Village), | | | | |
| | | 6.875%, 5/1/22 | | | | 534,630 |
| | | | | $ | | 1,996,645 |
| |
| Total Tax-Exempt Investments — 104.4% | | | | |
| (identified cost $65,163,199) | | $66,844,913 |
| |
| Other Assets, Less Liabilities — (4.4)% | | $ (2,811,572) |
| |
| Net Assets — 100.0% | | $64,033,341 |
| AMBAC - AMBAC Financial Group, Inc. |
| AMT - Interest earned from these securities may be considered a |
| tax preference item for purposes of the Federal Alternative |
| Minimum Tax. |
| CIFG - CIFG Assurance North America, Inc. |
| DRIVERS - Derivative Inverse Tax-Exempt Receipts |
| FGIC - Financial Guaranty Insurance Company |
| FSA - Financial Security Assurance, Inc. |
| GNMA - Government National Mortgage Association (Ginnie Mae) |
| MBIA - Municipal Bond Insurance Association |
| XLCA - XL Capital Assurance, Inc. |
The Fund invests primarily in debt securities issued by Rhode Island municipalities. The ability of the issuers of the debt securities to meet their obligations may be affected by economic developments in a specific industry or municipality. In order to reduce the risk associated with such economic developments, at September 30, 2007, 72.2% of total investments are backed by bond insurance of various financial institutions and financial guaranty assurance agencies. The aggregate percentage insured by an individual financial institution ranged from 2.9% to 28.1% of total investments.
| (1) | Security exempt from registration under Rule 144A of the Securities Act of 1933. These securities may be sold in transactions exempt from registration, normally to qualified institutional buyers. At September 30, 2007, the aggregate value of the securities is $1,681,316 or 2.6% of the Fund’s net assets. |
| |
| (2) | Security has been issued as a leveraged inverse floater bond. The stated interest rate represents the rate in effect at September 30, 2007. |
| |
| (3) | Security represents the underlying municipal obligation of an inverse floating rate obligation held by the Fund. |
| |
| (4) | Security has been issued as an inverse floater bond. The stated interest rate represents the rate in effect at September 30, 2007. |
| |
| (5) | Security (or a portion thereof) has been segregated to cover margin requirements on open financial futures contracts. |
| |
S e e n o t e s t o f i n a n c i a l s t a t e m e n t s
48 |
Eaton Vance West Virginia Municipals Fund a s o f S e p t e m b e r 3 0 , 2 0 0 7
P O R T F O L I O O F I N V E S T M E N T S |
| Ta x - E x e m p t I n v e s t m e n t s — 1 0 4 . 5 % | | | | |
| |
| Principal Amount | | | | |
| (000’s omitted) | | Security | | Value |
| |
| Education — 2.4% | | | | |
| $ 750 | | Shepherd College Board of Governors, 5.125%, 12/1/33 | | $ | | 758,430 |
| | | | | $ | | 758,430 |
| |
| Electric Utilities — 2.3% | | | | |
| $ 500 | | Mason County PCR, (Appalachian Power Co.), | | | | |
| | | 5.50%, 10/1/22 | | $ | | 505,090 |
| 50 | | Puerto Rico Electric Power Authority, DRIVERS, | | | | |
| | | Variable Rate, 6.79%, 7/1/25(1)(2) | | | | 54,367 |
| 150 | | Puerto Rico Electric Power Authority, DRIVERS, | | | | |
| | | Variable Rate, 6.79%, 7/1/37(1)(2) | | | | 156,387 |
| | | | | $ | | 715,844 |
| |
| Escrowed / Prerefunded — 12.3% | | | | |
| $ 2,500 | | Kanawha-Putnam, Single Family, Escrowed to Maturity, | | | | |
| | | 0.00%, 12/1/16 | | $ | | 1,715,175 |
| 1,820 | | West Virginia Health Facilities Authority, (Charleston Area | | | | |
| | | Medical Center), Escrowed to Maturity, 6.50%, 9/1/23 | | | | 2,200,598 |
| | | | | $ | | 3,915,773 |
| |
| Housing — 6.1% | | | | |
| $ 800 | | West Virginia Housing Development Fund, (AMT), | | | | |
| | | 4.625%, 11/1/32 | | $ | | 750,280 |
| 1,190 | | West Virginia Housing Development Fund, Series B, (AMT), | | | | |
| | | 5.10%, 11/1/27 | | | | 1,200,282 |
| | | | | $ | | 1,950,562 |
| |
| Industrial Development Revenue — 3.0% | | | | |
| $ 1,000 | | Virgin Islands Public Finance Authority, (Hovensa LLC), | | | | |
| | | (AMT), 4.70%, 7/1/22 | | $ | | 938,150 |
| | | | | $ | | 938,150 |
| |
| Insured-Education — 7.1% | | | | |
| $ 750 | | Fairmont College Student Activity Revenue, (FGIC), | | | | |
| | | 5.00%, 6/1/32 | | $ | | 768,967 |
| 455 | | West Virginia Higher Education Interim Governing Board, | | | | |
| | | (Marshall University), (FGIC), 5.00%, 5/1/31 | | | | 462,676 |
| 500 | | West Virginia Higher Education Policy Commission, (FGIC), | | | | |
| | | 5.00%, 4/1/29 | | | | 515,815 |
| 500 | | West Virginia University, (FGIC), 4.75%, 10/1/35 | | | | 502,215 |
| | | | | $ | | 2,249,673 |
| Principal Amount | | | | |
| (000’s omitted) | | Security | | Value |
| |
| Insured-Electric Utilities — 14.5% | | | | |
| $ 250 | | Pleasants County PCR, (Potomac Edison), (AMBAC), | | | | |
| | | (AMT), 5.50%, 4/1/29 | | $ | | 255,272 |
| 1,000 | | Pleasants County PCR, (West Pennsylvania), (AMBAC), | | | | |
| | | (AMT), 5.50%, 4/1/29(3) | | | | 1,027,380 |
| 1,800 | | Puerto Rico Electric Power Authority, (MBIA), | | | | |
| �� | | 4.75%, 7/1/33(4) | | | | 1,819,308 |
| 450 | | Puerto Rico Electric Power Authority, (MBIA), | | | | |
| | | 5.50%, 7/1/16(4) | | | | 507,765 |
| 1,000 | | West Virginia Economic Development Authority, | | | | |
| | | (Ohio Power Co.), (AMBAC), (AMT), 4.90%, 6/1/37 | | | | 979,700 |
| | | | | $ | | 4,589,425 |
| |
| Insured-Escrowed / Prerefunded — 1.6% | | | | |
| $ 500 | | Harrison County Building Commission, (Maplewood Retirement), | | | | |
| | | (AMBAC), Prerefunded to 4/1/08, 5.25%, 4/1/28 | | $ | | 514,235 |
| | | | | $ | | 514,235 |
| |
| Insured-General Obligations — 9.0% | | | | |
| $ 1,000 | | Monongalia County Board of Education, (MBIA), | | | | |
| | | 5.00%, 5/1/33 | | $ | | 1,032,590 |
| 250 | | Ohio County Board of Education, (MBIA), 5.125%, 6/1/18 | | | | 257,033 |
| 190 | | Puerto Rico, (FSA), 5.125%, 7/1/30 | | | | 197,648 |
| 300 | | Puerto Rico, (FSA), Variable Rate, 7.742%, 7/1/27(1)(2) | | | | 350,271 |
| 1,700 | | West Virginia, (FGIC), 0.00%, 11/1/19 | | | | 1,012,724 |
| | | | | $ | | 2,850,266 |
| |
| Insured-Hospital — 5.6% | | | | |
| $ 500 | | Randolph County Commission Health System, | | | | |
| | | (Davis Health System, Inc.), (FSA), 5.20%, 11/1/21 | | $ | | 522,865 |
| 1,200 | | West Virginia Health Facilities Authority, (West Virginia | | | | |
| | | University Medical Corp.), (MBIA), 6.10%, 1/1/18 | | | | 1,253,412 |
| | | | | $ | | 1,776,277 |
| |
| Insured-Lease Revenue / Certificates of | | | | |
| Participation — 3.2% | | | | |
| $ 500 | | West Virginia Economic Development Authority, (Correctional | | | | |
| | | Juvenile and Public), (MBIA), 5.00%, 6/1/26 | | $ | | 518,985 |
| 500 | | West Virginia Economic Development Authority, | | | | |
| | | (West Virginia University), (AMBAC), 5.00%, 7/15/31 | | | | 513,055 |
| | | | | $ | | 1,032,040 |
S e e n o t e s t o f i n a n c i a l s t a t e m e n t s
49 |
Eaton Vance West Virginia Municipals Fund a s o f S e p t e m b e r 3 0 , 2 0 0 7
P O R T F O L I O O F I N V E S T M E N T S C O N T ’ D |
| Principal Amount | | | | |
| (000’s omitted) | | Security | | Value |
| |
| Insured-Special Tax Revenue — 5.1% | | | | |
| $ 3,780 | | Puerto Rico Infrastructure Financing Authority, | | | | |
| | | (AMBAC), 0.00%, 7/1/29 | | $ | | 1,352,144 |
| 1,225 | | Puerto Rico Sales Tax Financing, (AMBAC), 0.00%, 8/1/54 | | | | 120,638 |
| 225 | | Puerto Rico Sales Tax Financing, (MBIA), 0.00%, 8/1/44 | | | | 37,139 |
| 445 | | Puerto Rico Sales Tax Financing, (MBIA), 0.00%, 8/1/45 | | | | 69,869 |
| 355 | | Puerto Rico Sales Tax Financing, (MBIA), 0.00%, 8/1/46 | | | | 52,955 |
| | | | | $ | | 1,632,745 |
| |
| Insured-Transportation — 3.5% | | | | |
| $ 750 | | Puerto Rico Highway and Transportation Authority, (CIFG), | | | | |
| | | 5.25%, 7/1/41(4) | | $ | | 830,475 |
| 250 | | West Virginia Parkways, Economic Development and Tourism | | | | |
| | | Authority, (FGIC), 5.25%, 5/15/19 | | | | 277,130 |
| | | | | $ | | 1,107,605 |
| |
| Insured-Water and Sewer — 20.8% | | | | |
| $ 500 | | Crab Orchard-MacArthur, Public Service District Sewer System, | | | | |
| | | (AMBAC), 5.50%, 10/1/25 | | $ | | 505,745 |
| 500 | | Martinsburg Water and Sewer, (MBIA), 5.00%, 9/1/31 | | | | 512,730 |
| 750 | | West Virginia Water Development Authority, (AMBAC), | | | | |
| | | 5.00%, 10/1/28 | | | | 775,058 |
| 500 | | West Virginia Water Development Authority, | | | | |
| | | (Loan Program II), (AMBAC), 5.00%, 11/1/33 | | | | 514,405 |
| 500 | | West Virginia Water Development Authority, | | | | |
| | | (Loan Program II), (FGIC), 5.00%, 11/1/33 | | | | 516,335 |
| 500 | | West Virginia Water Development Authority, | | | | |
| | | (Loan Program III), (AMBAC), (AMT), 5.65%, 7/1/40 | | | | 521,855 |
| 500 | | West Virginia Water Development Authority, | | | | |
| | | (Loan Program IV), (AMBAC), 4.75%, 11/1/35 | | | | 500,810 |
| 750 | | West Virginia Water Development Authority, | | | | |
| | | (Loan Program IV), (FSA), 5.00%, 11/1/44 | | | | 768,263 |
| 1,000 | | West Virginia Water Development Authority, (West Virginia | | | | |
| | | Infrastructure Jobs Program), (FSA), 4.75%, 10/1/45 | | | | 995,630 |
| 1,000 | | Wheeling Waterworks and Sewer System, | | | | |
| | | (FSA), 4.75%, 6/1/36 | | | | 1,000,990 |
| | | | | $ | | 6,611,821 |
| |
| Lease Revenue / Certificates of Participation — 1.3% |
| $ 400 | | West Virginia Economic Development Authority, | | | | |
| | | (State Office Building), 5.00%, 10/1/26 | | $ | | 408,068 |
| | | | | $ | | 408,068 |
| |
| Senior Living / Life Care — 0.9% | | | | |
| $ 300 | | West Virginia Economic Development Authority, | | | | |
| | | (Edgewood Summit, Inc.), 5.50%, 11/1/29 | | $ | | 289,215 |
| | | | | $ | | 289,215 |
| Principal Amount | | |
| (000’s omitted) | | Security | | Value |
| |
| Special Tax Revenue — 5.8% | | |
| $ 815 | | Puerto Rico Sales Tax Financing, 5.25%, 8/1/57 | | $ 845,065 |
| 12,500 | | Puerto Rico Sales Tax Financing, Series A, 0.00%, 8/1/56 | | 1,008,875 |
| | | | | $ 1,853,940 |
| |
| Total Tax-Exempt Investments — 104.5% | | |
| (identified cost $32,294,466) | | $33,194,069 |
| |
| Other Assets, Less Liabilities — (4.5)% | | $ (1,441,741) |
| |
| Net Assets — 100.0% | | $31,752,328 |
| |
| AMBAC - AMBAC Financial Group, Inc. | | |
| AMT - Interest earned from these securities may be considered a |
| tax preference item for purposes of the Federal Alternative |
| Minimum Tax. | | |
| CIFG - CIFG Assurance North America, Inc. | | |
| DRIVERS - Derivative Inverse Tax-Exempt Receipts | | |
| FGIC - Financial Guaranty Insurance Company | | |
| FSA - Financial Security Assurance, Inc. | | |
| MBIA - Municipal Bond Insurance Association | | |
The Fund invests primarily in debt securities issued by West Virginia municipalities. The ability of the issuers of the debt securities to meet their obligations may be affected by economic developments in a specific industry or municipality. In order to reduce the risk associated with such economic developments, at September 30, 2007, 67.4% of total investments are backed by bond insurance of various financial institutions and financial guaranty assurance agencies. The aggregate percentage insured by an individual financial institution ranged from 2.5% to 22.8% of total investments.
| (1) | Security exempt from registration under Rule 144A of the Securities Act of 1933. These securities may be sold in transactions exempt from registration, normally to qualified institutional buyers. At September 30, 2007, the aggregate value of the securities is $561,025 or 1.8% of the Fund’s net assets. |
| |
| (2) | Security has been issued as a leveraged inverse floater bond. The stated interest rate represents the rate in effect at September 30, 2007. |
| |
| (3) | Security (or a portion thereof) has been segregated to cover margin requirements on open financial futures contracts. |
| |
| (4) | Security represents the underlying municipal obligation of an inverse floating rate obligation held by the Fund. |
| |
S e e n o t e s t o f i n a n c i a l s t a t e m e n t s
50 |
Eaton Vance Municipals Funds a s o f S e p t e m b e r 3 0 , 2 0 0 7
F I N A N C I A L S T A T E M E N T S
S t a t e m e n t s o f A s s e t s a n d L i a b i l i t i e s |
| As of September 30, 2007 | | | | | | | | | | | | | | | | |
| |
| | | California Fund | | Florida Fund | | Massachusetts Fund | | Mississippi Fund |
| Assets | | | | | | | | | | | | | | | | |
| Investments — | | | | | | | | | | | | | | | | |
| Identified cost | | $283,357,690 | | $260,250,333 | | $343,187,902 | | $17,231,754 |
| Unrealized appreciation | | | | 14,836,162 | | 15,788,600 | | | | 10,504,547 | | | | 680,390 |
| |
| Investments, at value | | $298,193,852 | | $276,038,933 | | $353,692,449 | | $17,912,144 |
| Cash | | $ | | 450,389 | | $ 732,956 | | $ | | 1,548,694 | | $ | | 136,341 |
| Receivable for investments sold | | | | — | | 80,000 | | | | — | | | | — |
| Receivable for Fund shares sold | | | | 22,250 | | 88,768 | | | | 384,981 | | | | 2,683 |
| Interest receivable | | | | 3,497,946 | | 4,912,617 | | | | 4,007,541 | | | | 211,119 |
| Receivable for open interest rate swap contracts | | | | 84,913 | | 83,861 | | | | 94,256 | | | | 17,560 |
| Other assets | | | | — | | | | — | | | | — | | | | 2,815 |
| |
| Total assets | | $302,249,350 | | $281,937,135 | | $359,727,921 | | $18,282,662 |
| |
| Liabilities | | | | | | | | | | | | | | | | |
| Payable for floating rate notes issued | | $ | | 23,875,000 | | $ 37,745,000 | | $ | | 22,606,500 | | $ | | 930,000 |
| Interest expense and fees payable | | | | 238,592 | | 731,721 | | | | 245,573 | | | | 10,773 |
| Payable for Fund shares redeemed | | | | 468,467 | | 413,389 | | | | 535,026 | | | | 2,999 |
| Dividends payable | | | | 378,161 | | 385,458 | | | | 456,612 | | | | 25,336 |
| Payable for open interest rate swap contracts | | | | 30,584 | | 27,437 | | | | 34,142 | | | | 1,642 |
| Payable for closed interest rate swap contracts | | | | 624,574 | | 602,107 | | | | 700,961 | | | | — |
| Payable for when-issued securities | | | | — | | | | — | | | | 5,111,900 | | | | — |
| Payable to affiliate for investment advisory fee | | | | 102,246 | | 84,340 | | | | 114,522 | | | | 2,129 |
| Payable to affiliate for distribution and service fees | | | | 178,013 | | 140,770 | | | | 183,419 | | | | 10,216 |
| Accrued expenses | | | | 89,854 | | 111,972 | | | | 122,377 | | | | 38,309 |
| |
| Total liabilities | | $ | | 25,985,491 | | $ 40,242,194 | | $ | | 30,111,032 | | $ | | 1,021,404 |
| |
| Net Assets | | $276,263,859 | | $241,694,941 | | $329,616,889 | | $17,261,258 |
| |
| Sources of Net Assets | | | | | | | | | | | | | | | | |
| Paid-in capital | | $260,155,064 | | $228,704,994 | | $323,826,630 | | $16,609,250 |
| Accumulated net realized gain (loss) (computed on the basis of identified cost) | | | | 1,244,140 | | (4,169,620) | | | | (4,701,874) | | | | (22,708) |
| Accumulated undistributed (distributions in excess of) net investment income | | | | (133,791) | | 1,203,386 | | | | (368,771) | | | | (24,674) |
| Net unrealized appreciation (computed on the basis of identified cost) | | | | 14,998,446 | | 15,956,181 | | | | 10,860,904 | | | | 699,390 |
| |
| Net Assets | | $276,263,859 | | $241,694,941 | | $329,616,889 | | $17,261,258 |
| |
| Class A Shares | | | | | | | | | | | | | | | | |
| Net Assets | | $261,253,931 | | $212,897,844 | | $254,365,700 | | $14,635,340 |
| Shares Outstanding | | | | 24,609,589 | | 20,113,986 | | | | 26,789,728 | | | | 1,533,493 |
| Net Asset Value and Redemption Price Per Share | | | | | | | | | | | | | | | | |
| (net assets ÷ shares of beneficial interest outstanding) | | $ | | 10.62 | | $ | | 10.58 | | $ | | 9.49 | | $ | | 9.54 |
| Maximum Offering Price Per Share | | | | | | | | | | | | | | | | |
| (100 ÷ 95.25 of net asset value per share) | | $ | | 11.15 | | $ | | 11.11 | | $ | | 9.96 | | $ | | 10.02 |
| |
| Class B Shares | | | | | | | | | | | | | | | | |
| Net Assets | | $ | | 3,545,330 | | $ 25,845,435 | | $ | | 40,937,597 | | $ | | 2,625,918 |
| Shares Outstanding | | | | 361,258 | | 2,382,666 | | | | 4,311,415 | | | | 269,047 |
| Net Asset Value and Offering Price Per Share* | | | | | | | | | | | | | | | | |
| (net assets ÷ shares of beneficial interest outstanding) | | $ | | 9.81 | | $ | | 10.85 | | $ | | 9.50 | | $ | | 9.76 |
| |
| Class C Shares | | | | | | | | | | | | | | | | |
| Net Assets | | $ | | 11,464,598 | | $ 2,951,662 | | $ | | 17,583,316 | | $ | | — |
| Shares Outstanding | | | | 1,168,111 | | 272,072 | | | | 1,851,515 | | | | — |
| Net Asset Value and Offering Price Per Share* | | | | | | | | | | | | | | | | |
| (net assets ÷ shares of beneficial interest outstanding) | | $ | | 9.81 | | $ | | 10.85 | | $ | | 9.50 | | $ | | — |
| |
| Class I Shares | | | | | | | | | | | | | | | | |
| Net Assets | | $ | | — | | $ | | — | | $ | | 16,730,276 | | $ | | — |
| Shares Outstanding | | | | — | | | | — | | | | 1,762,348 | | | | — |
| Net Asset Value, Offering Price and Redemption Price Per Share | | | | | | | | | | | | | | | | |
| (net assets ÷ shares of beneficial interest outstanding) | | $ | | — | | $ | | — | | $ | | 9.49 | | $ | | — |
| On sales of $25,000 or more, the offering price of Class A shares is reduced. | | | | | | | | | | | | | | | | |
* Redemption price per share is equal to net asset value less any applicable contingent deferred sales charge.
S e e n o t e s t o f i n a n c i a l s t a t e m e n t s
51 |
Eaton Vance Municipals Funds a s o f S e p t e m b e r 3 0 , 2 0 0 7
F I N A N C I A L S T A T E M E N T S C O N T ’ D
S t a t e m e n t s o f A s s e t s a n d L i a b i l i t i e s |
| As of September 30, 2007 | | | | | | | | | | | | | | | | |
| |
| | | New York Fund | | Ohio Fund | | Rhode Island Fund | | West Virginia Fund |
| Assets | | | | | | | | | | | | | | | | |
| Investments — | | | | | | | | | | | | | | | | |
| Identified cost | | $469,234,333 | | $350,107,336 | | $65,163,199 | | $32,294,466 |
| Unrealized appreciation | | 20,781,071 | | 9,473,003 | | | | 1,681,714 | | | | 899,603 |
| |
| Investments, at value | | $490,015,404 | | $359,580,339 | | $66,844,913 | | $33,194,069 |
| Cash | | $ | | 684,503 | | $ 2,582,732 | | $ | | 351,114 | | $ | | 305,230 |
| Receivable for investments sold | | | | — | | 246,042 | | | | — | | | | — |
| Receivable for Fund shares sold | | | | 584,266 | | 1,196,181 | | | | 131,006 | | | | 22,589 |
| Interest receivable | | | | 7,202,946 | | 5,232,880 | | | | 913,553 | | | | 469,645 |
| Receivable for open interest rate swap contracts | | | | 455,123 | | | | 24,309 | | | | 19,618 | | | | 10,269 |
| Other assets | | | | 56,296 | | | | — | | | | — | | | | — |
| |
| Total assets | | $498,998,538 | | $368,862,483 | | $68,260,204 | | $34,001,802 |
| |
| Liabilities | | | | | | | | | | | | | | | | |
| Payable for floating rate notes issued | | $ 52,363,000 | | $ 27,120,000 | | $ | | 3,795,000 | | $ | | 2,000,000 |
| Interest expense and fees payable | | | | 682,619 | | 364,300 | | | | 28,296 | | | | 20,191 |
| Payable for investments purchased | | | | — | | 5,344,150 | | | | — | | | | — |
| Payable for Fund shares redeemed | | | | 509,611 | | 676,449 | | | | 58,666 | | | | 41,327 |
| Dividends payable | | | | 575,542 | | 413,981 | | | | 86,947 | | | | 39,484 |
| Payable for closed interest rate swap contracts | | | | 1,048,446 | | 257,618 | | | | 143,787 | | | | 74,889 |
| Payable for open interest rate swap contracts | | | | 48,716 | | | | — | | | | 6,911 | | | | 3,489 |
| Payable to affiliate for investment advisory fee | | | | 157,361 | | 112,716 | | | | 16,173 | | | | 5,324 |
| Payable to affiliate for distribution and service fees | | | | 237,510 | | 189,092 | | | | 41,715 | | | | 19,806 |
| Accrued expenses | | | | 135,358 | | 104,449 | | | | 49,368 | | | | 44,964 |
| |
| Total liabilities | | $ 55,758,163 | | $ 34,582,755 | | $ | | 4,226,863 | | $ | | 2,249,474 |
| |
| Net Assets | | $443,240,375 | | $334,279,728 | | $64,033,341 | | $31,752,328 |
| |
| Sources of Net Assets | | | | | | | | | | | | | | | | |
| Paid-in capital | | $422,321,192 | | $333,972,182 | | $62,724,911 | | $31,354,720 |
| Accumulated net realized loss (computed on the basis of identified cost) | | | | (196,553) | | (8,806,338) | | | | (341,906) | | | | (484,034) |
| Accumulated distributions in excess of net investment income | | | | (283,631) | | (343,891) | | | | (60,671) | | | | (37,180) |
| Net unrealized appreciation (computed on the basis of identified cost) | | 21,399,367 | | 9,457,775 | | | | 1,711,007 | | | | 918,822 |
| |
| Net Assets | | $443,240,375 | | $334,279,728 | | $64,033,341 | | $31,752,328 |
| |
| Class A Shares | | | | | | | | | | | | | | | | |
| Net Assets | | $400,671,136 | | $274,850,128 | | $46,763,863 | | $25,703,311 |
| Shares Outstanding | | 38,526,923 | | 29,741,648 | | | | 4,849,374 | | | | 2,653,406 |
| Net Asset Value and Redemption Price Per Share | | | | | | | | | | | | | | | | |
| (net assets ÷ shares of beneficial interest outstanding) | | $ | | 10.40 | | $ | | 9.24 | | $ | | 9.64 | | $ | | 9.69 |
| Maximum Offering Price Per Share | | | | | | | | | | | | | | | | |
| (100 ÷ 95.25 of net asset value per share) | | $ | | 10.92 | | $ | | 9.70 | | $ | | 10.12 | | $ | | 10.17 |
| |
| Class B Shares | | | | | | | | | | | | | | | | |
| Net Assets | | $ 11,438,661 | | $ 28,625,536 | | $13,988,954 | | $ | | 6,049,017 |
| Shares Outstanding | | | | 1,098,001 | | 3,099,063 | | | | 1,418,062 | | | | 612,687 |
| Net Asset Value and Offering Price Per Share* | | | | | | | | | | | | | | | | |
| (net assets ÷ shares of beneficial interest outstanding) | | $ | | 10.42 | | $ | | 9.24 | | $ | | 9.86 | | $ | | 9.87 |
| |
| Class C Shares | | | | | | | | | | | | | | | | |
| Net Assets | | $ 31,130,578 | | $ 30,804,064 | | $ | | 3,280,524 | | $ | | — |
| Shares Outstanding | | | | 2,992,368 | | 3,335,311 | | | | 332,368 | | | | — |
| Net Asset Value and Offering Price Per Share* | | | | | | | | | | | | | | | | |
| (net assets ÷ shares of beneficial interest outstanding) | | $ | | 10.40 | | $ | | 9.24 | | $ | | 9.87 | | $ | | — |
| On sales of $25,000 or more, the offering price of Class A shares is reduced. | | | | | | | | | | | | | | | | |
* Redemption price per share is equal to net asset value less any applicable contingent deferred sales charge.
S e e n o t e s t o f i n a n c i a l s t a t e m e n t s
52 |
Eaton Vance Municipals Funds a s o f S e p t e m b e r 3 0 , 2 0 0 7
F I N A N C I A L S T A T E M E N T S C O N T ’ D
S t a t e m e n t s o f O p e r a t i o n s |
| For the Year Ended September 30, 2007 | | | | | | | | | | | | | | |
| |
| | | California Fund | | Florida Fund | | Massachusetts Fund | | Mississippi Fund |
| Investment Income | | | | | | | | | | | | | | |
| Interest | | $14,266,048 | | $14,864,113 | | $ | | 16,289,438 | | $ 978,539 |
| |
| Total investment income | | $14,266,048 | | $14,864,113 | | $ | | 16,289,438 | | $ 978,539 |
| |
| |
| Expenses | | | | | | | | | | | | | | |
| Investment adviser fee | | $ | | 1,198,210 | | $ 1,073,101 | | $ | | 1,246,654 | | $ | | 27,854 |
| Trustees’ fees and expenses | | | | 15,754 | | 16,770 | | | | 17,970 | | | | 185 |
| Distribution and service fees | | | | | | | | | | | | | | |
| Class A | | | | 633,506 | | 443,613 | | | | 450,062 | | | | 29,916 |
| Class B | | | | 39,783 | | 291,585 | | | | 426,026 | | | | 33,368 |
| Class C | | | | 83,792 | | 17,106 | | | | 106,997 | | | | — |
| Legal and accounting services | | | | 70,766 | | 72,913 | | | | 70,715 | | | | 36,936 |
| Printing and postage | | | | 22,604 | | 24,375 | | | | 29,379 | | | | 5,292 |
| Custodian fee | | | | 134,381 | | 151,821 | | | | 178,104 | | | | 26,909 |
| Interest expense and fees | | | | 874,621 | | 1,403,744 | | | | 1,381,663 | | | | 47,165 |
| Transfer and dividend disbursing agent fees | | | | 93,345 | | 103,775 | | | | 118,963 | | | | 9,444 |
| Registration fees | | | | 3,438 | | 13,038 | | | | 15,974 | | | | 1,005 |
| Miscellaneous | | | | 43,270 | | 40,979 | | | | 33,505 | | | | 9,676 |
| |
| Total expenses | | $ | | 3,213,470 | | $ 3,652,820 | | $ | | 4,076,012 | | $ 227,750 |
| Deduct — | | | | | | | | | | | | | | |
| Reduction of custodian fee | | $ | | 69,406 | | $ 18,213 | | $ | | 49,226 | | $ | | 4,805 |
| Allocation of expenses to investment adviser | | | | 5,358 | | 5,358 | | | | 6,611 | | | | 3,687 |
| |
| Total expense reductions | | $ | | 74,764 | | $ 23,571 | | $ | | 55,837 | | $ | | 8,492 |
| |
| |
| Net expenses | | $ | | 3,138,706 | | $ 3,629,249 | | $ | | 4,020,175 | | $ 219,258 |
| |
| |
| Net investment income | | $11,127,342 | | $11,234,864 | | $ | | 12,269,263 | | $ 759,281 |
| |
| |
| Realized and Unrealized Gain (Loss) | | | | | | | | | | | | | | |
| Net realized gain (loss) — | | | | | | | | | | | | | | |
| Investment transactions (identified cost basis) | | $ | | 1,034,353 | | $ 1,891,770 | | $ | | 1,084,834 | | $ 123,805 |
| Financial futures contracts | | | | 71,301 | | 143,162 | | | | (1,669,125) | | | | 4,298 |
| Interest rate swap contracts | | | | (1,099,149) | | (985,054) | | | | (1,242,034) | | | | (65,549) |
| |
| Net realized gain (loss) | | $ | | 6,505 | | $ 1,049,878 | | $ | | (1,826,325) | | $ | | 62,554 |
| Change in unrealized appreciation (depreciation) — | | | | | | | | | | | | | | |
| Investments (identified cost basis) | | $ (8,757,178) | | $ (8,012,352) | | $(11,577,041) | | $(438,440) |
| Financial futures contracts | | | | 1,110,595 | | 1,181,981 | | | | 1,873,238 | | | | 53,867 |
| Interest rate swap contracts | | | | 54,329 | | 56,424 | | | | 60,114 | | | | 26,365 |
| |
| Net change in unrealized appreciation (depreciation) | | $ (7,592,254) | | $ (6,773,947) | | $ | | (9,643,689) | | $(358,208) |
| |
| |
| Net realized and unrealized loss | | $ (7,585,749) | | $ (5,724,069) | | $ (11,470,014) | | $(295,654) |
| |
| |
| Net increase in net assets from operations | | $ | | 3,541,593 | | $ 5,510,795 | | $ | | 799,249 | | $ 463,627 |
S e e n o t e s t o f i n a n c i a l s t a t e m e n t s
53 |
Eaton Vance Municipals Funds a s o f S e p t e m b e r 3 0 , 2 0 0 7
F I N A N C I A L S T A T E M E N T S C O N T ’ D
S t a t e m e n t s o f O p e r a t i o n s |
| For the Year Ended September 30, 2007 | | | | | | | | | | | | | | | | |
| |
| | | New York Fund | | Ohio Fund | | Rhode Island Fund | | West Virginia Fund |
| Investment Income | | | | | | | | | | | | | | | | |
| Interest | | $ 24,677,291 | | $ 14,672,773 | | $ | | 3,257,767 | | $ | | 1,585,286 |
| |
| Total investment income | | $ 24,677,291 | | $ 14,672,773 | | $ | | 3,257,767 | | $ | | 1,585,286 |
| |
| |
| Expenses | | | | | | | | | | | | | | | | |
| Investment adviser fee | | $ 1,901,120 | | $ 1,182,720 | | $ | | 185,604 | | $ | | 63,083 |
| Trustees’ fees and expenses | | | | 21,200 | | | | 15,754 | | | | 7,170 | | | | 1,845 |
| Distribution and service fees | | | | | | | | | | | | | | | | |
| Class A | | | | 811,049 | | 465,766 | | | | 86,847 | | | | 49,719 |
| Class B | | | | 103,229 | | 295,917 | | | | 153,807 | | | | 61,602 |
| �� Class C | | | | 216,903 | | 199,363 | | | | 18,820 | | | | — |
| Legal and accounting services | | | | 80,050 | | | | 53,536 | | | | 46,937 | | | | 38,376 |
| Printing and postage | | | | 40,684 | | | | 32,490 | | | | 8,669 | | | | 6,883 |
| Custodian fee | | | | 205,806 | | 165,607 | | | | 44,812 | | | | 32,367 |
| Interest expense and fees | | 2,097,226 | | 895,562 | | | | 245,475 | | | | 77,755 |
| Transfer and dividend disbursing agent fees | | | | 183,650 | | 135,721 | | | | 27,403 | | | | 17,157 |
| Registration fees | | | | 5,105 | | | | 12,191 | | | | 1,254 | | | | 3,023 |
| Miscellaneous | | | | 66,841 | | | | 33,051 | | | | 15,345 | | | | 12,528 |
| |
| Total expenses | | $ | | 5,732,863 | | $ 3,487,678 | | $ | | 842,143 | | $ | | 364,338 |
| Deduct — | | | | | | | | | | | | | | | | |
| Reduction of custodian fee | | $ | | 59,116 | | $ | | 87,491 | | $ | | 30,402 | | $ | | 10,743 |
| Allocation of expenses to investment adviser | | | | 7,863 | | | | 4,523 | | | | 5,358 | | | | 3,688 |
| |
| Total expense reductions | | $ | | 66,979 | | $ | | 92,014 | | $ | | 35,760 | | $ | | 14,431 |
| |
| |
| Net expenses | | $ | | 5,665,884 | | $ 3,395,664 | | $ | | 806,383 | | $ | | 349,907 |
| |
| |
| Net investment income | | $ 19,011,407 | | $ 11,277,109 | | $ | | 2,451,384 | | $ | | 1,235,379 |
| |
| |
| Realized and Unrealized Gain (Loss) | | | | | | | | | | | | | | | | |
| Net realized gain (loss) — | | | | | | | | | | | | | | | | |
| Investment transactions (identified cost basis) | | $ | | 464,947 | | $ 266,678 | | $ | | 339,251 | | $ | | 351,642 |
| Financial futures contracts | | | | (911,943) | | (169,264) | | | | 21,074 | | | | (7,521) |
| Interest rate swap contracts | | (2,734,646) | | (38,279) | | | | (249,344) | | | | (127,805) |
| |
| Net realized gain (loss) | | $ (3,181,642) | | $ | | 59,135 | | $ | | 110,981 | | $ | | 216,316 |
| Change in unrealized appreciation (depreciation) — | | | | | | | | | | | | | | | | |
| Investments (identified cost basis) | | $(12,930,006) | | $ (7,108,322) | | $(1,868,980) | | $(1,014,737) |
| Financial futures contracts | | 2,378,695 | | | | 94,375 | | | | 290,846 | | | | 172,424 |
| Interest rate swap contracts | | | | 615,338 | | | | 24,309 | | | | 12,707 | | | | 6,780 |
| |
| Net change in unrealized appreciation (depreciation) | | $ (9,935,973) | | $ (6,989,638) | | $ (1,565,427) | | $ | | (835,533) |
| |
| |
| Net realized and unrealized loss | | $ (13,117,615) | | $ (6,930,503) | | $ (1,454,446) | | $ | | (619,217) |
| |
| |
| Net increase in net assets from operations | | $ | | 5,893,792 | | $ 4,346,606 | | $ | | 996,938 | | $ | | 616,162 |
S e e n o t e s t o f i n a n c i a l s t a t e m e n t s
54 |
Eaton Vance Municipals Funds a s o f S e p t e m b e r 3 0 , 2 0 0 7
F I N A N C I A L S T A T E M E N T S C O N T ’ D
S t a t e m e n t s o f C h a n g e s i n N e t A s s e t s |
| For the Year Ended September 30, 2007 | | | | | | | | | | | | | | |
| |
| Increase (Decrease) in Net Assets | | California Fund | | Florida Fund | | Massachusetts Fund | | Mississippi Fund |
| From operations — | | | | | | | | | | | | | | |
| Net investment income | | $ | | 11,127,342 | | $ 11,234,864 | | $ | | 12,269,263 | | $ | | 759,281 |
| Net realized gain (loss) from investment transactions, financial | | | | | | | | | | | | | | |
| futures contracts and interest rate swap contracts | | | | 6,505 | | 1,049,878 | | | | (1,826,325) | | | | 62,554 |
| Net change in unrealized appreciation (depreciation) from investments, | | | | | | | | | | | | | | |
| financial futures contracts and interest rate swap contracts | | | | (7,592,254) | | (6,773,947) | | | | (9,643,689) | | | | (358,208) |
| |
| Net increase in net assets from operations | | $ | | 3,541,593 | | $ 5,510,795 | | $ | | 799,249 | | $ | | 463,627 |
| Distributions to shareholders — | | | | | | | | | | | | | | |
| From net investment income | | | | | | | | | | | | | | |
| Class A | | $ (10,752,456) | | $ (9,892,502) | | $ | | (9,655,558) | | $ | | (628,731) |
| Class B | | | | (139,379) | | (1,137,775) | | | | (1,592,447) | | | | (121,144) |
| Class C | | | | (291,031) | | (66,730) | | | | (393,866) | | | | — |
| Class I | | | | — | | — | | | | (703,704) | | | | — |
| From net realized gain | | | | | | | | | | | | | | |
| Class A | | | | (3,830,123) | | — | | | | — | | | | — |
| Class B | | | | (70,687) | | — | | | | — | | | | — |
| Class C | | | | (112,357) | | — | | | | — | | | | — |
| |
| Total distributions to shareholders | | $ (15,196,033) | | $ (11,097,007) | | $ (12,345,575) | | $ | | (749,875) |
| Transactions in shares of beneficial interest — | | | | | | | | | | | | | | |
| Proceeds from sale of shares | | | | | | | | | | | | | | |
| Class A | | $ | | 68,842,124 | | $ 22,292,525 | | $103,672,116 | | $ | | 1,728,072 |
| Class B | | | | 809,294 | | 851,620 | | | | 2,051,364 | | | | 157,031 |
| Class C | | | | 7,725,735 | | 2,693,182 | | | | 16,773,647 | | | | — |
| Class I | | | | — | | — | | | | 5,509,026 | | | | — |
| Net asset value of shares issued to shareholders in payment of | | | | | | | | | | | | | | |
| distributions declared | | | | | | | | | | | | | | |
| Class A | | | | 8,872,948 | | 5,717,536 | | | | 5,578,575 | | | | 313,821 |
| Class B | | | | 114,296 | | 509,741 | | | | 872,130 | | | | 60,929 |
| Class C | | | | 269,209 | | 35,217 | | | | 311,249 | | | | — |
| Class I | | | | — | | — | | | | 235,829 | | | | — |
| Cost of shares redeemed | | | | | | | | | | | | | | |
| Class A | | | | (39,036,247) | | (36,483,021) | | | | (46,985,170) | | | | (3,290,329) |
| Class B | | | | (1,231,031) | | (6,589,466) | | | | (6,168,857) | | | | (653,035) |
| Class C | | | | (1,089,114) | | (366,929) | | | | (1,704,313) | | | | — |
| Class I | | | | — | | — | | | | (1,605,947) | | | | — |
| Net asset value of shares exchanged | | | | | | | | | | | | | | |
| Class A | | | | 57,762 | | 4,295,445 | | | | 3,211,515 | | | | 968,803 |
| Class B | | | | (57,762) | | (4,295,445) | | | | (3,211,515) | | | | (968,803) |
| |
| Net increase (decrease) in net assets from Fund share transactions | | $ | | 45,277,214 | | $ (11,339,595) | | $ | | 78,539,649 | | $ (1,683,511) |
| |
| Net increase (decrease) in net assets | | $ | | 33,622,774 | | $ (16,925,807) | | $ | | 66,993,323 | | $ (1,969,759) |
| |
| |
| Net Assets | | | | | | | | | | | | | | |
| At beginning of year | | $242,641,085 | | $258,620,748 | | $262,623,566 | | $19,231,017 |
| |
| At end of year | | $276,263,859 | | $241,694,941 | | $329,616,889 | | $17,261,258 |
| |
| |
| Accumulated undistributed (distributions in excess | | | | | | | | | | | | | | |
| of) net investment income included in net assets | | | | | | | | | | | | | | |
| |
| At end of year | | $ | | (133,791) | | $ 1,203,386 | | $ | | (368,771) | | $ | | (24,674) |
S e e n o t e s t o f i n a n c i a l s t a t e m e n t s
55 |
| | Eaton Vance Municipals Funds a s o f S e p t e m b e r 3 0 , 2 0 0 7
F I N A N C I A L S T A T E M E N T S C O N T ’ D
S t a t e m e n t s o f C h a n g e s i n N e t A s s e t s |
| For the Year Ended September 30, 2007 | | | | | | | | | | | | |
| |
| Increase (Decrease) in Net Assets | | New York Fund | | Ohio Fund | | Rhode Island Fund | | West Virginia Fund |
| From operations — | | | | | | | | | | | | |
| Net investment income | | $ 19,011,407 | | $ 11,277,109 | | $ | | 2,451,384 | | $ | | 1,235,379 |
| Net realized gain (loss) from investment transactions, | | | | | | | | | | | | |
| financial futures contracts and interest rate swap contracts | | (3,181,642) | | 59,135 | | | | 110,981 | | | | 216,316 |
| Net change in unrealized appreciation (depreciation) from investments, | | | | | | | | | | | | |
| financial futures contracts and interest rate swap contracts | | (9,935,973) | | (6,989,638) | | | | (1,565,427) | | | | (835,533) |
| |
| Net increase in net assets from operations | | $ 5,893,792 | | $ 4,346,606 | | $ | | 996,938 | | $ | | 616,162 |
| Distributions to shareholders — | | | | | | | | | | | | |
| From net investment income | | | | | | | | | | | | |
| Class A | | $ (17,487,881) | | $ (9,757,050) | | $ (1,801,325) | | $ (1,014,607) |
| Class B | | (385,335) | | (1,078,423) | | | | (552,760) | | | | (216,052) |
| Class C | | (806,831) | | (710,718) | | | | (66,047) | | | | — |
| From net realized gain | | | | | | | | | | | | |
| Class A | | (1,982,516) | | — | | | | — | | | | — |
| Class B | | (52,351) | | — | | | | — | | | | — |
| Class C | | (90,494) | | — | | | | — | | | | — |
| |
| Total distributions to shareholders | | $ (20,805,408) | | $ (11,546,191) | | $ (2,420,132) | | $ (1,230,659) |
| Transactions in shares of beneficial interest — | | | | | | | | | | | | |
| Proceeds from sale of shares | | | | | | | | | | | | |
| Class A | | $ 63,737,160 | | $115,781,671 | | $10,575,470 | | $ | | 5,313,235 |
| Class B | | 3,819,176 | | 3,632,785 | | | | 830,770 | | | | 205,869 |
| Class C | | 21,240,503 | | 25,568,762 | | | | 2,981,442 | | | | — |
| Net asset value of shares issued to shareholders in payment of | | | | | | | | | | | | |
| distributions declared | | | | | | | | | | | | |
| Class A | | 12,340,891 | | 5,860,186 | | | | 1,024,106 | | | | 624,413 |
| Class B | | 262,890 | | 591,771 | | | | 341,201 | | | | 134,979 |
| Class C | | 580,446 | | 447,894 | | | | 34,387 | | | | — |
| Cost of shares redeemed | | | | | | | | | | | | |
| Class A | | (55,937,002) | | (27,447,237) | | | | (5,935,326) | | | | (2,977,867) |
| Class B | | (1,051,209) | | (3,594,864) | | | | (2,578,607) | | | | (747,361) |
| Class C | | (3,696,268) | | (2,886,677) | | | | (100,177) | | | | — |
| Net asset value of shares exchanged | | | | | | | | | | | | |
| Class A | | 707,926 | | 3,825,140 | | | | 2,830,959 | | | | 435,798 |
| Class B | | (707,926) | | (3,825,140) | | | | (2,830,959) | | | | (435,798) |
| |
| Net increase in net assets from Fund share transactions | | $ 41,296,587 | | $117,954,291 | | $ | | 7,173,266 | | $ | | 2,553,268 |
| |
| |
| Net increase in net assets | | $ 26,384,971 | | $110,754,706 | | $ | | 5,750,072 | | $ | | 1,938,771 |
| |
| |
| Net Assets | | | | | | | | | | | | |
| At beginning of year | | $416,855,404 | | $223,525,022 | | $58,283,269 | | $29,813,557 |
| |
| At end of year | | $443,240,375 | | $334,279,728 | | $64,033,341 | | $31,752,328 |
| |
| |
| Accumulated distributions in | | | | | | | | | | | | |
| excess of net investment income | | | | | | | | | | | | |
| included in net assets | | | | | | | | | | | | |
| |
| At end of year | | $ (283,613) | | $ (343,891) | | $ | | (60,671) | | $ | | (37,180) |
S e e n o t e s t o f i n a n c i a l s t a t e m e n t s
56 |
Eaton Vance Municipals Funds a s o f S e p t e m b e r 3 0 , 2 0 0 7
F I N A N C I A L S T A T E M E N T S C O N T ’ D
S t a t e m e n t s o f C h a n g e s i n N e t A s s e t s |
| For the Year Ended September 30, 2006 | | | | | | | | | | | | | | |
| |
| Increase (Decrease) in Net Assets | | California Fund | | Florida Fund | | Massachusetts Fund | | Mississippi Fund |
| From operations — | | | | | | | | | | | | | | |
| Net investment income | | $ | | 10,182,311 | | $ 11,103,022 | | $ | | 10,315,447 | | $ | | 781,245 |
| Net realized gain from investment transactions, | | | | | | | | | | | | | | |
| financial futures contracts and interest rate swap contracts | | | | 9,128,146 | | 5,765,096 | | | | 3,171,135 | | | | 268,636 |
| Net change in unrealized appreciation (depreciation) from investments, | | | | | | | | | | | | | | |
| financial futures contracts and interest rate swap contracts | | | | (5,240,660) | | (1,585,810) | | | | 1,497,408 | | | | (119,212) |
| |
| Net increase in net assets from operations | | $ | | 14,069,797 | | $ 15,282,308 | | $ | | 14,983,990 | | $ | | 930,669 |
| Distributions to shareholders — | | | | | | | | | | | | | | |
| From net investment income | | | | | | | | | | | | | | |
| Class A | | $ | | (9,972,724) | | $ (9,441,249) | | $ | | (7,721,439) | | $ | | (603,656) |
| Class B | | | | (139,318) | | (1,502,836) | | | | (1,948,881) | | | | (168,393) |
| Class C | | | | (103,771) | | (5,141) | | | | (14,478) | | | | — |
| Class I | | | | — | | — | | | | (606,426) | | | | — |
| |
| Total distributions to shareholders | | $ (10,215,813) | | $ (10,949,226) | | $ (10,291,224) | | $ | | (772,049) |
| Transactions in shares of beneficial interest — | | | | | | | | | | | | | | |
| Proceeds from sale of shares | | | | | | | | | | | | | | |
| Class A | | $ | | 32,034,321 | | $ 49,480,953 | | $ | | 57,658,956 | | $ | | 3,408,757 |
| Class B | | | | 1,316,847 | | 2,264,945 | | | | 2,492,023 | | | | 84,085 |
| Class C | | | | 3,582,123 | | 668,884 | | | | 2,868,575 | | | | — |
| Class I | | | | — | | — | | | | 2,067,997 | | | | — |
| Net asset value of shares issued to shareholders in payment of | | | | | | | | | | | | | | |
| distributions declared | | | | | | | | | | | | | | |
| Class A | | | | 5,475,667 | | 5,159,159 | | | | 3,939,179 | | | | 266,225 |
| Class B | | | | 69,404 | | 687,930 | | | | 1,062,806 | | | | 83,618 |
| Class C | | | | 78,530 | | 1,510 | | | | 8,412 | | | | — |
| Class I | | | | — | | — | | | | 165,578 | | | | — |
| Cost of shares redeemed | | | | | | | | | | | | | | |
| Class A | | | | (31,262,512) | | (36,823,235) | | | | (27,591,007) | | | | (1,943,071) |
| Class B | | | | (894,048) | | (5,492,148) | | | | (6,467,954) | | | | (1,019,558) |
| Class C | | | | (520,843) | | (35,224) | | | | (102,038) | | | | — |
| Class I | | | | — | | — | | | | (962,093) | | | | — |
| Net asset value of shares exchanged | | | | | | | | | | | | | | |
| Class A | | | | 120,123 | | 4,169,418 | | | | 3,703,637 | | | | 394,330 |
| Class B | | | | (120,123) | | (4,169,418) | | | | (3,703,637) | | | | (394,330) |
| |
| Net increase in net assets from Fund share transactions | | $ | | 9,879,489 | | $ 15,912,774 | | $ | | 35,140,434 | | $ | | 880,056 |
| |
| |
| Net increase in net assets | | $ | | 13,733,473 | | $ 20,245,856 | | $ | | 39,833,200 | | $ | | 1,038,676 |
| |
| |
| Net Assets | | | | | | | | | | | | | | |
| At beginning of year | | $228,907,612 | | $238,374,892 | | $222,790,366 | | $18,192,341 |
| |
| At end of year | | $242,641,085 | | $258,620,748 | | $262,623,566 | | $19,231,017 |
| |
| |
| Accumulated undistributed (distributions in excess | | | | | | | | | | | | | | |
| of) net investment income included in net assets | | | | | | | | | | | | | | |
| |
| At end of year | | $ | | (49,064) | | $ 1,137,179 | | $ | | (231,223) | | $ | | (34,477) |
S e e n o t e s t o f i n a n c i a l s t a t e m e n t s
57 |
Eaton Vance Municipals Funds a s o f S e p t e m b e r 3 0 , 2 0 0 7
F I N A N C I A L S T A T E M E N T S C O N T ’ D
S t a t e m e n t s o f C h a n g e s i n N e t A s s e t s |
| For the Year Ended September 30, 2006 | | | | | | | | | | | | |
| |
| Increase (Decrease) in Net Assets | | New York Fund | | Ohio Fund | | Rhode Island Fund | | West Virginia Fund |
| From operations — | | | | | | | | | | | | |
| Net investment income | | $ 16,996,252 | | $ 8,384,944 | | $ | | 2,134,162 | | $ | | 1,194,306 |
| Net realized gain from investment transactions, | | | | | | | | | | | | |
| financial futures contracts and interest rate swap contracts | | 6,445,728 | | 821,216 | | | | 1,005,639 | | | | 452,871 |
| Net change in unrealized appreciation (depreciation) from investments, | | | | | | | | | | | | |
| financial futures contracts and interest rate swap contracts | | (102,096) | | 2,381,174 | | | | (436,979) | | | | (119,598) |
| |
| Net increase in net assets from operations | | $ 23,339,884 | | $ 11,587,334 | | $ | | 2,702,822 | | $ | | 1,527,579 |
| Distributions to shareholders — | | | | | | | | | | | | |
| From net investment income | | | | | | | | | | | | |
| Class A | | $(16,267,428) | | $ (7,143,933) | | $ (1,408,995) | | $ | | (905,143) |
| Class B | | (292,649) | | (1,268,140) | | | | (748,975) | | | | (257,946) |
| Class C | | (327,193) | | (77,302) | | | | (2,882) | | | | — |
| From net realized gain | | | | | | | | | | | | |
| Class A | | (4,001,915) | | — | | | | — | | | | — |
| Class B | | (80,541) | | — | | | | — | | | | — |
| Class C | | (70,625) | | — | | | | — | | | | — |
| |
| Total distributions to shareholders | | $ (21,040,351) | | $ (8,489,375) | | $ (2,160,852) | | $ (1,163,089) |
| Transactions in shares of beneficial interest — | | | | | | | | | | | | |
| Proceeds from sale of shares | | | | | | | | | | | | |
| Class A | | $ 67,952,820 | | $ 49,124,730 | | $10,055,904 | | $ | | 2,552,239 |
| Class B | | 4,152,878 | | 3,508,789 | | | | 866,449 | | | | 143,069 |
| Class C | | 10,165,692 | | 8,494,045 | | | | 422,979 | | | | — |
| Net asset value of shares issued to shareholders in payment of | | | | | | | | | | | | |
| distributions declared | | | | | | | | | | | | |
| Class A | | 13,458,930 | | 4,082,432 | | | | 692,472 | | | | 535,565 |
| Class B | | 229,042 | | 653,183 | | | | 458,469 | | | | 152,214 |
| Class C | | 245,516 | | 50,258 | | | | 1,800 | | | | — |
| Cost of shares redeemed | | | | | | | | | | | | |
| Class A | | (47,717,026) | | (15,301,626) | | | | (3,654,953) | | | | (2,451,138) |
| Class B | | (1,078,139) | | (4,416,758) | | | | (3,640,347) | | | | (1,018,300) |
| Class C | | (1,396,835) | | (379,377) | | | | — | | | | — |
| Net asset value of shares exchanged | | | | | | | | | | | | |
| Class A | | 88,818 | | 1,913,051 | | | | 2,091,173 | | | | 641,204 |
| Class B | | (88,818) | | (1,913,051) | | | | (2,091,173) | | | | (641,204) |
| |
| Net increase (decrease) in net assets from Fund share transactions | | $ 46,012,878 | | $ 45,815,676 | | $ | | 5,202,773 | | $ | | (86,351) |
| |
| |
| Net increase in net assets | | $ 48,312,411 | | $ 48,913,635 | | $ | | 5,744,743 | | $ | | 278,139 |
| |
| |
| Net Assets | | | | | | | | | | | | |
| At beginning of year | | $368,542,993 | | $174,611,387 | | $52,538,526 | | $29,535,418 |
| |
| At end of year | | $416,855,404 | | $223,525,022 | | $58,283,269 | | $29,813,557 |
| |
| |
| Accumulated distributions in | | | | | | | | | | | | |
| excess of net investment income | | | | | | | | | | | | |
| included in net assets | | | | | | | | | | | | |
| |
| At end of year | | $ (430,446) | | $ (141,004) | | $ | | (80,627) | | $ | | (23,512) |
S e e n o t e s t o f i n a n c i a l s t a t e m e n t s
58 |
Eaton Vance Municipals Funds a s o f S e p t e m b e r 3 0 , 2 0 0 7
F I N A N C I A L S T A T E M E N T S C O N T ’ D
S t a t e m e n t s o f C a s h F l o w s |
| For the Year Ended September 30, 2007 | | | | | | | | | | | | |
| |
| Cash flows from operating activities | | Florida Fund | | Massachusetts Fund | | New York Fund |
| Net increase in net assets from operations | | $ | | 5,510,795 | | $ | | 799,249 | | $ | | 5,893,792 |
| Adjustments to reconcile net increase in net assets from | | | | | | | | | | | | |
| operations to net cash provided by (used in) operating activities: | | | | | | | | | | | | |
| Investments purchased | | (53,609,907) | | (268,529,058) | | (202,831,864) |
| Investments sold | | | | 63,553,190 | | | | 211,963,979 | | 169,799,112 |
| Increase in short-term investments | | | | �� — | | | | (14,895,000) | | | | — |
| Net amortization of premium (discount) | | | | (1,473,054) | | | | (2,009,931) | | (1,083,997) |
| Increase in interest receivable | | | | (19,279) | | | | (617,085) | | | | (715,095) |
| Increase in receivable for investments sold | | | | (50,000) | | | | — | | | | — |
| Increase in receivable for open interest rate swap contracts | | | | (83,861) | | | | (94,256) | | | | (455,123) |
| Increase in other assets | | | | — | | | | — | | | | (56,296) |
| Increase (decrease) in payable for open interest rate swaps contracts | | | | 27,437 | | | | 34,142 | | | | (160,215) |
| Increase in payable for closed interest rate swap contracts | | | | 602,107 | | | | 700,961 | | | | 1,048,446 |
| Increase (decrease) in payable to affiliate for investment advisory fee | | | | (5,606) | | | | 25,145 | | | | 11,093 |
| Increase (decrease) in payable to affiliate for distribution and service fees | | | | (11,716) | | | | 30,699 | | | | 24,566 |
| Increase (decrease) in payable for when-issued securities | | | | (1,504,440) | | | | 5,111,900 | | (6,500,000) |
| Increase (decrease) in accrued expenses | | | | (5,529) | | | | 9,917 | | | | (12,019) |
| Increase (decrease) in interest expense and fees payable | | | | 248,794 | | | | (40,393) | | | | 92,255 |
| Net change in unrealized (appreciation) depreciation on investments | | | | 8,012,352 | | | | 11,577,041 | | 12,930,006 |
| Net realized (gain) loss on investments | | | | (1,891,770) | | | | (1,084,834) | | | | (464,947) |
| |
| Net cash provided by (used in) operating activities | | | | 19,299,513 | | | | (57,017,524) | | (22,480,286) |
| |
| |
| Cash flows from financing activities | | | | | | | | | | | | |
| Proceeds from shares sold | | $ 26,158,133 | | $ 128,441,326 | | $ 91,093,935 |
| Shares redeemed | | (43,422,840) | | | | (56,223,514) | | (60,694,900) |
| Cash distributions paid net of reinvestments | | | | (4,849,709) | | | | (5,342,085) | | (7,598,869) |
| Decrease in demand note payable | | | | (300,000) | | | | — | | | | — |
| Proceeds from secured borrowings | | | | 5,000,000 | | | | 30,200,000 | | | | 2,400,000 |
| Repayment of secured borrowings | | | | (1,250,000) | | | | (38,850,000) | | (3,025,000) |
| |
| Net cash provided by (used in) financing activities | | $(18,664,416) | | $ | | 58,225,727 | | $ 22,175,166 |
| |
| |
| Net increase (decrease) in cash | | $ | | 635,097 | | $ | | 1,208,203 | | $ | | (305,120) |
| |
| |
| Cash at beginning of year | | $ | | 97,859 | | $ | | 340,491 | | $ | | 989,623 |
| |
| |
| Cash at end of year | | $ | | 732,956 | | $ | | 1,548,694 | | $ | | 684,503 |
| |
| |
| Supplemental disclosure of cash flow information: | | | | | | | | | | | | |
| |
| Noncash financing activities not included herein consist of | | | | | | | | | | | | |
| reinvestment of dividends and distributions of : | | $ | | 6,262,494 | | $ | | 6,997,783 | | $ 13,184,227 |
S e e �� n o t e s t o f i n a n c i a l s t a t e m e n t s
59 |
Eaton Vance Municipals Funds a s o f S e p t e m b e r 3 0 , 2 0 0 7
F I N A N C I A L S T A T E M E N T S C O N T ’ D
F i n a n c i a l H i g h l i g h t s |
California Fund — Class A
Year Ended September 30, |
| | | 2007(1) | | 2006(1) | | 2005(1) | | 2004(1) | | 2003(1) |
| Net asset value — Beginning of year | | $ 11.080 | | $ 10.900 | | $ 10.860 | | $ 10.920 | | $11.250 |
| |
| |
| |
| Income (loss) from operations | | | | | | | | | | |
| Net investment income | | $ 0.458 | | $ 0.486 | | $ 0.515 | | $ 0.548 | | $ 0.542 |
| Net realized and unrealized gain (loss) | | (0.280) | | 0.181 | | 0.037 | | (0.078) | | (0.342) |
| |
| Total income from operations | | $ 0.178 | | $ 0.667 | | $ 0.552 | | $ 0.470 | | $ 0.200 |
| |
| |
| Less distributions | | | | | | | | | | |
| From net investment income | | $ (0.462) | | $ (0.487) | | $ (0.512) | | $ (0.530) | | $ (0.530) |
| From net realized gain | | (0.176) | | — | | — | | — | | — |
| |
| Total distributions | | $ (0.638) | | $ (0.487) | | $ (0.512) | | $ (0.530) | | $ (0.530) |
| |
| |
| Net asset value — End of year | | $ 10.620 | | $ 11.080 | | $ 10.900 | | $ 10.860 | | $ 10.920 |
| |
| |
| Total Return(2) | | 1.61% | | 6.28% | | 5.18% | | 4.42% | | 1.89% |
| |
| |
| Ratios/Supplemental Data | | | | | | | | | | |
| Net assets, end of year (000’s omitted) | | $261,254 | | $233,618 | | $223,528 | | $227,878 | | $34,753 |
| Ratios (As a percentage of average daily net assets): | | | | | | | | | | |
| Expenses excluding interest and fees | | 0.84%(3) | | 0.86% | | 0.88%(4) | | 0.90%(4) | | 0.88%(4) |
| Interest and fee expense(5) | | 0.33% | | 0.37% | | 0.23%(4) | | 0.15%(4) | | 0.12%(4) |
| Total expenses before custodian fee reduction | | 1.17%(3) | | 1.23% | | 1.11%(4) | | 1.05%(4) | | 1.00%(4) |
| Expenses after custodian fee reduction | | | | | | | | | | |
| excluding interest and fees | | 0.82%(3) | | 0.85% | | 0.87%(4) | | 0.90%(4) | | 0.87%(4) |
| Net investment income | | 4.22% | | 4.45% | | 4.71% | | 5.09% | | 4.97% |
| Portfolio Turnover of the Portfolio(6) | | — | | — | | — | | 18% | | 21% |
| Portfolio Turnover of the Fund | | 41% | | 30% | | 23% | | — | | — |
| (1) | Net investment income per share was computed using average shares outstanding. |
| |
| (2) | Returns are historical and are calculated by determining the percentage change in net asset value with all distributions reinvested. |
| |
| (3) | The investment adviser was allocated a portion of the Fund’s operating expenses (equal to less than 0.005% of average daily net assets for the year ended September 30, 2007). Absent this allocation, total return would be lower. |
| |
| (4) | Includes the Fund’s share of its corresponding Portfolio’s allocated expenses while the Fund was making investments directly into the Portfolio. |
| |
| (5) | Interest and fee expense relates to the liability for floating rate notes issued in conjunction with inverse floater securities transactions (see Note 1I). |
| |
| (6) | Portfolio turnover represents the rate of portfolio activity for the period while the Fund was making investments directly into the Portfolio. |
| |
S e e n o t e s t o f i n a n c i a l s t a t e m e n t s
60 |
| | Eaton Vance Municipals Funds a s o f S e p t e m b e r 3 0 , 2 0 0 7
F I N A N C I A L S T A T E M E N T S C O N T ’ D
F i n a n c i a l H i g h l i g h t s |
California Fund — Class B
Year Ended September 30, |
| | | 2007(1) | | 2006(1) | | 2005(1) | | 2004(1) | | 2003(1) |
| Net asset value — Beginning of year | | $10.260 | | $10.090 | | $10.060 | | $10.110 | | $ 10.400 |
| |
| |
| Income (loss) from operations | | | | | | | | | | |
| Net investment income | | $ 0.350 | | $ 0.374 | | $ 0.399 | | $ 0.483 | | $ 0.481 |
| Net realized and unrealized gain (loss) | | (0.273) | | 0.171 | | 0.030 | | (0.083) | | (0.317) |
| Total income from operations | | $ 0.077 | | $ 0.545 | | $ 0.429 | | $ 0.400 | | $ 0.164 |
| |
| |
| Less distributions | | | | | | | | | | |
| From net investment income | | $ (0.351) | | $ (0.375) | | $ (0.399) | | $ (0.455) | | $ (0.459) |
| From net realized gain | | (0.176) | | — | | — | | — | | — |
| Total distributions | | $ (0.527) | | $ (0.375) | | $ (0.399) | | $ (0.455) | | $ (0.459) |
| |
| Contingent deferred sales charges | | $ — | | $ — | | $ — | | $ 0.005 | | $ 0.005 |
| |
| Net asset value — End of year | | $ 9.810 | | $10.260 | | $10.090 | | $10.060 | | $ 10.110 |
| |
| Total Return(2) | | 0.73% | | 5.52% | | 4.50%(3) | | 4.14% | | 1.73% |
| |
| |
| Ratios/Supplemental Data | | | | | | | | | | |
| Net assets, end of year (000’s omitted) | | $ 3,545 | | $ 4,090 | | $ 3,655 | | $ 1,983 | | $212,145 |
| Ratios (As a percentage of average daily net assets): | | | | | | | | | | |
| Expenses excluding interest and fees | | 1.59%(4) | | 1.61% | | 1.63%(5) | | 1.10%(5) | | 1.09%(5) |
| Interest and fee expense(6) | | 0.33% | | 0.37% | | 0.23%(5) | | 0.15%(5) | | 0.12%(5) |
| Total expenses before custodian fee reduction | | 1.92%(4) | | 1.98% | | 1.86%(5) | | 1.25%(5) | | 1.21%(5) |
| Expenses after custodian fee reduction | | | | | | | | | | |
| excluding interest and fees | | 1.57%(4) | | 1.60% | | 1.62%(5) | | 1.10%(5) | | 1.08%(5) |
| Net investment income | | 3.48% | | 3.70% | | 3.94% | | 4.75% | | 4.79% |
| Portfolio Turnover of the Portfolio(7) | | — | | — | | — | | 18% | | 21% |
| Portfolio Turnover of the Fund | | 41% | | 30% | | 23% | | — | | — |
| (1) | Net investment income per share was computed using average shares outstanding. |
| |
| (2) | Returns are historical and are calculated by determining the percentage change in net asset value with all distributions reinvested. |
| |
| (3) | Total return reflects an increase of 0.17% due to a change in the timing of the payment and reinvestment of distributions. |
| |
| (4) | The investment adviser was allocated a portion of the Fund’s operating expenses (equal to less than 0.005% of average daily net assets for the year ended September 30, 2007). Absent this allocation, total return would be lower. |
| |
| (5) | Includes the Fund’s share of its corresponding Portfolio’s allocated expenses while the Fund was making investments directly into the Portfolio. |
| |
| (6) | Interest and fee expense relates to the liability for floating rate notes issued in conjunction with inverse floater securities transactions (see Note 1I). |
| |
| (7) | Portfolio turnover represents the rate of portfolio activity for the period while the Fund was making investments directly into the Portfolio. |
| |
S e e n o t e s t o f i n a n c i a l s t a t e m e n t s
61 |
Eaton Vance Municipals Funds a s o f S e p t e m b e r 3 0 , 2 0 0 7
F I N A N C I A L S T A T E M E N T S C O N T ’ D
F i n a n c i a l H i g h l i g h t s |
California Fund — Class C
Year Ended September 30, |
| | | 2007(1) | | 2006(1) | | 2005(1) | | 2004(1)(2) |
| Net asset value — Beginning of year | | $10.250 | | $10.090 | | $10.060 | | $10.000 |
| |
| |
| Income (loss) from operations | | | | | | | | | | |
| Net investment income | | $ 0.348 | | $ 0.366 | | $ 0.384 | | $ 0.033 |
| Net realized and unrealized gain (loss) | | (0.261) | | 0.169 | | 0.045 | | | | 0.062 |
| Total income from operations | | $ 0.087 | | $ 0.535 | | $ 0.429 | | $ 0.095 |
| |
| |
| Less distributions | | | | | | | | | | |
| From net investment income | | $ (0.351) | | $ (0.375) | | $ (0.399) | | $ (0.035) |
| From net realized gain | | (0.176) | | — | | — | | | | — |
| Total distributions | | $ (0.527) | | $ (0.375) | | $ (0.399) | | $ (0.035) |
| |
| Net asset value — End of year | | $ 9.810 | | $10.250 | | $10.090 | | $10.060 |
| |
| Total Return(3) | | 0.83% | | 5.42% | | 4.42%(4) | | | | 0.86%(10) |
| |
| |
| Ratios/Supplemental Data | | | | | | | | | | |
| Net assets, end of year (000’s omitted) | | $11,465 | | $ 4,933 | | $ 1,725 | | $ 96 |
| Ratios (As a percentage of average daily net assets): | | | | | | | | | | |
| Expenses excluding interest and fees | | 1.59%(5) | | 1.61% | | 1.63%(6) | | | | 1.65%(6)(7) |
| Interest and fee expense(8) | | 0.33% | | 0.37% | | 0.23%(6) | | | | 0.15%(6)(7) |
| Total expenses before custodian fee reduction | | 1.92%(5) | | 1.98% | | 1.86%(6) | | | | 1.80%(6)(7) |
| Expenses after custodian fee reduction excluding interest and fees | | 1.57%(5) | | 1.60% | | 1.62%(6) | | | | 1.65%(6)(7) |
| Net investment income | | 3.49% | | 3.62% | | 3.78% | | | | 4.24%(7) |
| Portfolio Turnover of the Portfolio(9) | | — | | — | | — | | | | 18% |
| Portfolio Turnover of the Fund | | 41% | | 30% | | 23% | | | | — |
| (1) | Net investment income per share was computed using average shares outstanding. |
| |
| (2) | For the period from the start of business, August 31, 2004 to September 30, 2004. |
| |
| (3) | Returns are historical and are calculated by determining the percentage change in net asset value with all distributions reinvested. |
| |
| (4) | Total return reflects an increase of 0.09% due to a change in the timing of the payment and reinvestment of distributions. |
| |
| (5) | The investment adviser was allocated a portion of the Fund’s operating expenses (equal to less than 0.005% of average daily net assets for the year ended September 30, 2007). Absent this allocation, total return would be lower. |
| |
| (6) | Includes the Fund’s share of its corresponding Portfolio’s allocated expenses while the Fund was making investments directly into the Portfolio. |
| |
| (7) | Annualized. |
| |
| (8) | Interest and fee expense relates to the liability for floating rate notes issued in conjunction with inverse floater securities transactions (see Note 1I). |
| |
| (9) | Portfolio turnover represents the rate of portfolio activity for the period while the Fund was making investments directly into the Portfolio. |
| |
| (10) | Not annualized. |
| |
S e e n o t e s t o f i n a n c i a l s t a t e m e n t s
62 |
Eaton Vance Municipals Funds a s o f S e p t e m b e r 3 0 , 2 0 0 7
F I N A N C I A L S T A T E M E N T S C O N T ’ D
F i n a n c i a l H i g h l i g h t s |
Florida Fund — Class A
Year Ended September 30, |
| | | 2007(1) | | 2006(1) | | 2005(1) | | 2004(1) | | 2003(1) |
| Net asset value — Beginning of year | | $ 10.820 | | $ 10.640 | | $ 10.580 | | $ 10.680 | | $10.940 |
| |
| |
| Income (loss) from operations | | | | | | | | | | |
| Net investment income | | $ 0.486 | | $ 0.490 | | $ 0.506 | | $ 0.536 | | $ 0.548 |
| Net realized and unrealized gain (loss) | | (0.246) | | 0.174 | | 0.065 | | (0.098) | | (0.259) |
| Total income from operations | | $ 0.240 | | $ 0.664 | | $ 0.571 | | $ 0.438 | | $ 0.289 |
| |
| |
| Less distributions | | | | | | | | | | |
| From net investment income | | $ (0.480) | | $ (0.484) | | $ (0.511) | | $ (0.538) | | $ (0.549) |
| Total distributions | | $ (0.480) | | $ (0.484) | | $ (0.511) | | $ (0.538) | | $ (0.549) |
| |
| Net asset value — End of year | | $ 10.580 | | $ 10.820 | | $ 10.640 | | $ 10.580 | | $ 10.680 |
| |
| Total Return(2) | | 2.23% | | 6.40% | | 5.50% | | 4.18% | | 2.76% |
| |
| |
| Ratios/Supplemental Data | | | | | | | | | | |
| Net assets, end of year (000’s omitted) | | $212,898 | | $222,008 | | $196,300 | | $193,379 | | $25,996 |
| Ratios (As a percentage of average daily net assets): | | | | | | | | | | |
| Expenses excluding interest and fees | | 0.79%(3) | | 0.79% | | 0.82%(4) | | 0.82%(4) | | 0.79%(4) |
| Interest and fee expense(5) | | 0.55% | | 0.44% | | 0.26%(4) | | 0.13%(4) | | 0.20%(4) |
| Total expenses before custodian fee reduction | | 1.34%(3) | | 1.23% | | 1.08%(4) | | 0.95%(4) | | 0.99%(4) |
| Expenses after custodian fee reduction | | | | | | | | | | |
| excluding interest and fees | | 0.78%(3) | | 0.78% | | 0.81%(4) | | 0.82%(4) | | 0.78%(4) |
| Net investment income | | 4.51% | | 4.59% | | 4.75% | | 5.09% | | 5.12% |
| Portfolio Turnover of the Portfolio(6) | | — | | — | | — | | 9% | | 23% |
| Portfolio Turnover of the Fund | | 19% | | 42% | | 16% | | — | | — |
| (1) | Net investment income per share was computed using average shares outstanding. |
| |
| (2) | Returns are historical and are calculated by determining the percentage change in net asset value with all distributions reinvested. |
| |
| (3) | The investment adviser was allocated a portion of the Fund’s operating expenses (equal to less than 0.005% of average daily net assets for the year ended September 30, 2007). Absent this allocation, total return would be lower. |
| |
| (4) | Includes the Fund’s share of its corresponding Portfolio’s allocated expenses while the Fund was making investments directly into the Portfolio. |
| |
| (5) | Interest and fee expense relates to the liability for floating rate notes issued in conjunction with inverse floater securities transactions (see Note 1I). |
| |
| (6) | Portfolio turnover represents the rate of portfolio activity for the period while the Fund was making investments directly into the Portfolio. |
| |
S e e n o t e s t o f i n a n c i a l s t a t e m e n t s
63 |
| | Eaton Vance Municipals Funds a s o f S e p t e m b e r 3 0 , 2 0 0 7
F I N A N C I A L S T A T E M E N T S C O N T ’ D
F i n a n c i a l H i g h l i g h t s |
Florida Fund — Class B
Year Ended September 30, |
| | | 2007(1) | | 2006(1) | | 2005(1) | | 2004(1) | | 2003(1) |
| Net asset value — Beginning of year | | $11.090 | | $10.910 | | $10.840 | | $10.950 | | $ 11.220 |
| |
| |
| Income (loss) from operations | | | | | | | | | | |
| Net investment income | | $ 0.416 | | $ 0.421 | | $ 0.437 | | $ 0.469 | | $ 0.482 |
| Net realized and unrealized gain (loss) | | (0.247) | | 0.172 | | 0.075 | | (0.110) | | (0.272) |
| Total income from operations | | $ 0.169 | | $ 0.593 | | $ 0.512 | | $ 0.359 | | $ 0.210 |
| |
| |
| Less distributions | | | | | | | | | | |
| From net investment income | | $ (0.409) | | $ (0.413) | | $ (0.442) | | $ (0.469) | | $ (0.480) |
| Total distributions | | $ (0.409) | | $ (0.413) | | $ (0.422) | | $ (0.469) | | $ (0.480) |
| |
| Net asset value — End of year | | $10.850 | | $11.090 | | $10.910 | | $10.840 | | $ 10.950 |
| |
| Total Return(2) | | 1.53% | | 5.55% | | 4.98%(3) | | 3.34% | | 1.93% |
| |
| |
| Ratios/Supplemental Data | | | | | | | | | | |
| Net assets, end of year (000’s omitted) | | $25,845 | | $35,969 | | $42,074 | | $51,162 | | $236,914 |
| Ratios (As a percentage of average daily net assets): | | | | | | | | | | |
| Expenses excluding interest and fees | | 1.54%(4) | | 1.54% | | 1.57%(5) | | 1.57%(5) | | 1.54%(5) |
| Interest and fee expense(6) | | 0.55% | | 0.44% | | 0.26%(5) | | 0.13%(5) | | 0.20%(5) |
| Total expenses before custodian fee reduction | | 2.09%(4) | | 1.98% | | 1.83%(5) | | 1.70%(5) | | 1.74%(5) |
| Expenses after custodian fee reduction | | | | | | | | | | |
| excluding interest and fees | | 1.53%(4) | | 1.53% | | 1.56%(5) | | 1.57%(5) | | 1.53%(5) |
| Net investment income | | 3.76% | | 3.85% | | 4.01% | | 4.26% | | 4.39% |
| Portfolio Turnover of the Portfolio(7) | | — | | — | | — | | 9% | | 23% |
| Portfolio Turnover of the Fund | | 19% | | 42% | | 16% | | — | | — |
| (1) | Net investment income per share was computed using average shares outstanding. |
| |
| (2) | Returns are historical and are calculated by determining the percentage change in net asset value with all distributions reinvested. |
| |
| (3) | Total return reflects an increase of 0.17% due to a change in the timing of the payment and reinvestment of distributions. |
| |
| (4) | The investment adviser was allocated a portion of the Fund’s operating expenses (equal to less than 0.005% of average daily net assets for the year ended September 30, 2007). Absent this allocation, total return would be lower. |
| |
| (5) | Includes the Fund’s share of its corresponding Portfolio’s allocated expenses while the Fund was making investments directly into the Portfolio. |
| |
| (6) | Interest and fee expense relates to the liability for floating rate notes issued in conjunction with inverse floater securities transactions (see Note 1I). |
| |
| (7) | Portfolio turnover represents the rate of portfolio activity for the period while the Fund was making investments directly into the Portfolio. |
| |
S e e n o t e s t o f i n a n c i a l s t a t e m e n t s
64 |
Eaton Vance Municipals Funds a s o f S e p t e m b e r 3 0 , 2 0 0 7
F I N A N C I A L S T A T E M E N T S C O N T ’ D
F i n a n c i a l H i g h l i g h t s |
| | | Florida Fund — Class C |
| | | Year Ended September 30, |
| | | 2007(1) | | 2006(1)(2) |
| Net asset value — Beginning of year | | $11.080 | | $10.970 |
| |
| |
| Income (loss) from operations | | | | | | |
| Net investment income | | $ 0.416 | | $ | | 0.215 |
| Net realized and unrealized gain (loss) | | (0.237) | | | | 0.118 |
| Total income from operations | | $ 0.179 | | $ | | 0.333 |
| |
| |
| Less distributions | | | | | | |
| From net investment income | | $ (0.409) | | $ (0.223) |
| Total distributions | | $ (0.409) | | $ (0.223) |
| |
| Net asset value — End of year | | $10.850 | | $11.080 |
| |
| Total Return(3) | | 1.62% | | | | 3.08%(8) |
| |
| |
| Ratios/Supplemental Data | | | | | | |
| Net assets, end of year (000’s omitted) | | $ 2,952 | | $ | | 643 |
| Ratios (As a percentage of average daily net assets): | | | | | | |
| Expenses excluding interest and fees | | 1.54%(4) | | | | 1.54%(5) |
| Interest and fee expense(6) | | 0.55% | | | | 0.44%(5) |
| Total expenses before custodian fee reduction | | 2.09%(4) | | | | 1.98%(5) |
| Expenses after custodian fee reduction excluding interest and fees | | 1.53%(4) | | | | 1.53%(5) |
| Net investment income | | 3.78% | | | | 3.53%(5) |
| Portfolio Turnover of the Fund | | 19% | | | | 42%(7) |
| (1) | Net investment income per share was computed using average shares outstanding. |
| |
| (2) | For the period from the start of business, March 13, 2006 to September 30, 2006. |
| |
| (3) | Returns are historical and are calculated by determining the percentage change in net asset value with all distributions reinvested. |
| |
| (4) | The investment adviser was allocated a portion of the Fund’s operating expenses (equal to less than 0.005% of average daily net assets for the year ended September 30, 2007). Absent this allocation, total return would be lower. |
| |
| (5) | Annualized. |
| |
| (6) | Interest and fee expense relates to the liability for floating rate notes issued in conjunction with inverse floater securities transactions (see Note 1I). |
| |
| (7) | For the year ended September 30, 2006. |
| |
| (8) | Not annualized. |
| |
S e e n o t e s t o f i n a n c i a l s t a t e m e n t s
65 |
| | Eaton Vance Municipals Funds a s o f S e p t e m b e r 3 0 , 2 0 0 7
F I N A N C I A L S T A T E M E N T S C O N T ’ D
F i n a n c i a l H i g h l i g h t s |
Massachusetts Fund — Class A
Year Ended September 30, |
| | | 2007(1) | | 2006(1) | | 2005(1) | | 2004(1) | | 2003(1) |
| Net asset value — Beginning of year | | $ 9.850 | | $ 9.670 | | $ 9.660 | | $ 9.680 | | $ 9.850 |
| |
| |
| Income (loss) from operations | | | | | | | | | | |
| Net investment income | | $ 0.415 | | $ 0.432 | | $ 0.449 | | $ 0.484 | | $ 0.492 |
| Net realized and unrealized gain (loss) | | (0.356) | | 0.180 | | 0.017 | | (0.020) | | (0.180) |
| Total income from operations | | $ 0.059 | | $ 0.612 | | $ 0.466 | | $ 0.464 | | $ 0.312 |
| |
| |
| Less distributions | | | | | | | | | | |
| From net investment income | | $ (0.419) | | $ (0.432) | | $ (0.456) | | $ (0.484) | | $ (0.482) |
| Total distributions | | $ (0.419) | | $ (0.432) | | $ (0.456) | | $ (0.484) | | $ (0.482) |
| |
| Net asset value — End of year | | $ 9.490 | | $ 9.850 | | $ 9.670 | | $ 9.660 | | $ 9.680 |
| |
| Total Return(2) | | 0.57% | | 6.51% | | 4.90% | | 4.92% | | 3.29% |
| |
| |
| Ratios/Supplemental Data | | | | | | | | | | |
| Net assets, end of year (000’s omitted) | | $254,366 | | $197,580 | | $156,382 | | $143,086 | | $41,413 |
| Ratios (As a percentage of average daily net assets): | | | | | | | | | | |
| Expenses excluding interest and fees | | 0.77%(3) | | 0.79% | | 0.79%(3)(4) | | 0.81%(4) | | 0.81%(4) |
| Interest and fee expense(5) | | 0.47% | | 0.42% | | 0.28%(4) | | 0.11%(4) | | 0.10%(4) |
| Total expenses before custodian fee reduction | | 1.24%(3) | | 1.21% | | 1.07%(3)(4) | | 0.92%(4) | | 0.91%(4) |
| Expenses after custodian fee reduction | | | | | | | | | | |
| excluding interest and fees | | 0.76%(3) | | 0.77% | | 0.78%(3)(4) | | 0.81%(4) | | 0.80%(4) |
| Net investment income | | 4.26% | | 4.48% | | 4.62% | | 5.05% | | 5.09% |
| Portfolio Turnover of the Portfolio(6) | | — | | — | | — | | 27% | | 16% |
| Portfolio Turnover of the Fund | | 65% | | 28% | | 15% | | — | | — |
| (1) | Net investment income per share was computed using average shares outstanding. |
| |
| (2) | Returns are historical and are calculated by determining the percentage change in net asset value with all distributions reinvested. |
| |
| (3) | The investment adviser was allocated a portion of the Fund’s operating expenses or reduced its investment adviser fee (equal to less than 0.005% of average daily net assets for the years ended September 30, 2007 and 2005). Absent this allocation or reduction, total return would be lower. |
| |
| (4) | Includes the Fund’s share of its corresponding Portfolio’s allocated expenses while the Fund was making investments directly into the Portfolio. |
| |
| (5) | Interest and fee expense relates to the liability for floating rate notes issued in conjunction with inverse floater securities transactions (see Note 1I). |
| |
| (6) | Portfolio turnover represents the rate of portfolio activity for the period while the Fund was making investments directly into the Portfolio. |
| |
S e e n o t e s t o f i n a n c i a l s t a t e m e n t s
66 |
Eaton Vance Municipals Funds a s o f S e p t e m b e r 3 0 , 2 0 0 7
F I N A N C I A L S T A T E M E N T S C O N T ’ D
F i n a n c i a l H i g h l i g h t s |
Massachusetts Fund — Class B
Year Ended September 30, |
| | | 2007(1) | | 2006(1) | | 2005(1) | | 2004(1) | | 2003(1) |
| Net asset value — Beginning of year | | $ 9.850 | | $ 9.670 | | $ 9.650 | | $ 9.680 | | $ 9.860 |
| |
| |
| Income (loss) from operations | | | | | | | | | | |
| Net investment income | | $ 0.343 | | $ 0.362 | | $ 0.378 | | $ 0.414 | | $ 0.421 |
| Net realized and unrealized gain (loss) | | (0.347) | | 0.179 | | 0.026 | | (0.031) | | (0.188) |
| Total income (loss) from operations | | $ (0.004) | | $ 0.541 | | $ 0.404 | | $ 0.383 | | $ 0.233 |
| |
| |
| Less distributions | | | | | | | | | | |
| From net investment income | | $ (0.346) | | $ (0.361) | | $ (0.384) | | $ (0.413) | | $ (0.413) |
| Total distributions | | $ (0.346) | | $ (0.361) | | $ (0.384) | | $ (0.413) | | $ (0.413) |
| |
| Net asset value — End of year | | $ 9.500 | | $ 9.850 | | $ 9.670 | | $ 9.650 | | $ 9.680 |
| |
| Total Return(2) | | (0.07)% | | 5.73% | | 4.39%(3) | | 4.07% | | 2.43% |
| |
| |
| Ratios/Supplemental Data | | | | | | | | | | |
| Net assets, end of year (000’s omitted) | | $40,938 | | $48,991 | | $54,708 | | $59,036 | | $160,416 |
| Ratios (As a percentage of average daily net assets): | | | | | | | | | | |
| Expenses excluding interest and fees | | 1.52%(4) | | 1.54% | | 1.54%(4)(5) | | 1.56%(5) | | 1.56%(5) |
| Interest and fee expense(6) | | 0.47% | | 0.42% | | 0.28%(5) | | 0.11%(5) | | 0.10%(5) |
| Total expenses before custodian fee reduction | | 1.99%(4) | | 1.96% | | 1.82%(4)(5) | | 1.67%(5) | | 1.66%(5) |
| Expenses after custodian fee reduction | | | | | | | | | | |
| excluding interest and fees | | 1.51%(4) | | 1.52% | | 1.53%(4)(5) | | 1.56%(5) | | 1.55%(5) |
| Net investment income | | 3.52% | | 3.75% | | 3.88% | | 4.26% | | 4.35% |
| Portfolio Turnover of the Portfolio(7) | | — | | — | | — | | 27% | | 16% |
| Portfolio Turnover of the Fund | | 65% | | 28% | | 15% | | — | | — |
| (1) | Net investment income per share was computed using average shares outstanding. |
| |
| (2) | Returns are historical and are calculated by determining the percentage change in net asset value with all distributions reinvested. |
| |
| (3) | Total return reflects an increase of 0.16% due to a change in the timing of the payment and reinvestment of distributions. |
| |
| (4) | The investment adviser was allocated a portion of the Fund’s operating expenses or reduced its investment adviser fee (equal to less than 0.005% of average daily net assets for the years ended September 30, 2007 and 2005). Absent this allocation or reduction, total return would be lower. |
| |
| (5) | Includes the Fund’s share of its corresponding Portfolio’s allocated expenses while the Fund was making investments directly into the Portfolio. |
| |
| (6) | Interest and fee expense relates to the liability for floating rate notes issued in conjunction with inverse floater securities transactions (see Note 1I). |
| |
| (7) | Portfolio turnover represents the rate of portfolio activity for the period while the Fund was making investments directly into the Portfolio. |
| |
S e e n o t e s t o f i n a n c i a l s t a t e m e n t s
67 |
Eaton Vance Municipals Funds a s o f S e p t e m b e r 3 0 , 2 0 0 7
F I N A N C I A L S T A T E M E N T S C O N T ’ D
F i n a n c i a l H i g h l i g h t s |
| | | Massachusetts Fund — Class C |
| | | Year Ended September 30, |
| | | 2007(1) | | 2006(1)(2) |
| Net asset value — Beginning of year | | $ 9.850 | | $ | | 9.610 |
| |
| |
| Income (loss) from operations | | | | | | |
| Net investment income | | $ 0.342 | | $ 0.136 |
| Net realized and unrealized gain (loss) | | (0.346) | | | | 0.254 |
| Total income (loss) from operations | | $ (0.004) | | $ | | 0.390 |
| |
| |
| Less distributions | | | | | | |
| From net investment income | | $ (0.346) | | $(0.150) |
| Total distributions | | $ (0.346) | | $(0.150) |
| |
| Net asset value — End of year | | $ 9.500 | | $ | | 9.850 |
| |
| Total Return(3) | | (0.07)% | | | | 4.10%(8) |
| |
| |
| Ratios/Supplemental Data | | | | | | |
| Net assets, end of year (000’s omitted) | | $17,583 | | $ | | 2,825 |
| Ratios (As a percentage of average daily net assets): | | | | | | |
| Expenses excluding interest and fees | | 1.51%(4) | | | | 1.54%(5) |
| Interest and fee expense(6) | | 0.47% | | | | 0.42%(5) |
| Total expenses before custodian fee reduction | | 1.98%(4) | | | | 1.96%(5) |
| Expenses after custodian fee reduction excluding interest and fees | | 1.50%(4) | | | | 1.52%(5) |
| Net investment income | | 3.53% | | | | 3.40%(5) |
| Portfolio Turnover of the Fund | | 65% | | | | 28%(7) |
| (1) | Net investment income per share was computed using average shares outstanding. |
| |
| (2) | For the period from the start of business, May 2, 2006 to September 30, 2006. |
| |
| (3) | Returns are historical and are calculated by determining the percentage change in net asset value with all distributions reinvested. |
| |
| (4) | The investment adviser was allocated a portion of the Fund’s operating expenses (equal to less than 0.005% of average daily net assets for the year ended September 30, 2007). Absent this allocation, total return would be lower. |
| |
| (5) | Annualized. |
| |
| (6) | Interest and fee expense relates to the liability for floating rate notes issued in conjunction with inverse floater securities transactions (see Note 1I). |
| |
| (7) | For the year ended September 30, 2006. |
| |
| (8) | Not annualized. |
| |
S e e n o t e s t o f i n a n c i a l s t a t e m e n t s
68 |
Eaton Vance Municipals Funds a s o f S e p t e m b e r 3 0 , 2 0 0 7
F I N A N C I A L S T A T E M E N T S C O N T ’ D
F i n a n c i a l H i g h l i g h t s |
Massachusetts Fund — Class I
Year Ended September 30, |
| | | 2007(1) | | 2006(1) | | 2005(1) | | 2004(1) | | 2003(1) |
| Net asset value — Beginning of year | | $ 9.850 | | $ 9.670 | | $ 9.650 | | $ 9.680 | | $ 9.840 |
| |
| |
| Income (loss) from operations | | | | | | | | | | |
| Net investment income | | $ 0.435 | | $ 0.453 | | $ 0.468 | | $ 0.504 | | $ 0.512 |
| Net realized and unrealized gain (loss) | | (0.356) | | 0.178 | | 0.027 | | (0.031) | | (0.172) |
| Total income from operations | | $ 0.079 | | $ 0.631 | | $ 0.495 | | $ 0.473 | | $ 0.340 |
| |
| |
| Less distributions | | | | | | | | | | |
| From net investment income | | $ (0.439) | | $ (0.451) | | $ (0.475) | | $(0.503) | | $(0.500) |
| Total distributions | | $ (0.439) | | $ (0.451) | | $ (0.475) | | $(0.503) | | $ (0.500) |
| |
| Net asset value — End of year | | $ 9.490 | | $ 9.850 | | $ 9.670 | | $ 9.650 | | $ 9.680 |
| |
| Total Return(2) | | 0.77% | | 6.72% | | 5.43%(3) | | 5.04% | | 3.51% |
| |
| |
| Ratios/Supplemental Data | | | | | | | | | | |
| Net assets, end of year (000’s omitted) | | $16,730 | | $13,227 | | $11,701 | | $ 8,321 | | $ 7,608 |
| Ratios (As a percentage of average daily net assets): | | | | | | | | | | |
| Expenses excluding interest and fees | | 0.57%(4) | | 0.59% | | 0.59%(4)(5) | | 0.61%(5) | | 0.61%(5) |
| Interest and fee expense(6) | | 0.47% | | 0.42% | | 0.28%(5) | | 0.11%(5) | | 0.10%(5) |
| Total expenses before custodian fee reduction | | 1.04%(4) | | 1.01% | | 0.87%(4)(5) | | 0.72%(5) | | 0.71%(5) |
| Expenses after custodian fee reduction | | | | | | | | | | |
| excluding interest and fees | | 0.56%(4) | | 0.57% | | 0.58%(4)(5) | | 0.61%(5) | | 0.60%(5) |
| Net investment income | | 4.47% | | 4.69% | | 4.81% | | 5.23% | | 5.29% |
| Portfolio Turnover of the Portfolio(7) | | — | | — | | — | | 27% | | 16% |
| Portfolio Turnover of the Fund | | 65% | | 28% | | 15% | | — | | — |
| (1) | Net investment income per share was computed using average shares outstanding. |
| |
| (2) | Returns are historical and are calculated by determining the percentage change in net asset value with all distributions reinvested. |
| |
| (3) | Total return reflects an increase of 0.20% due to a change in the timing of the payment and reinvestment of distributions. |
| |
| (4) | The investment adviser was allocated a portion of the Fund’s operating expenses or reduced its investment adviser fee (equal to less than 0.005% of average daily net assets for the years ended September 30, 2007 and 2005). Absent this allocation or reduction, total return would be lower. |
| |
| (5) | Includes the Fund’s share of its corresponding Portfolio’s allocated expenses while the Fund was making investments directly into the Portfolio. |
| |
| (6) | Interest and fee expense relates to the liability for floating rate notes issued in conjunction with inverse floater securities transactions (see Note 1I). |
| |
| (7) | Portfolio turnover represents the rate of portfolio activity for the period while the Fund was making investments directly into the Portfolio. |
| |
S e e n o t e s t o f i n a n c i a l s t a t e m e n t s
69 |
Eaton Vance Municipals Funds a s o f S e p t e m b e r 3 0 , 2 0 0 7
F I N A N C I A L S T A T E M E N T S C O N T ’ D
F i n a n c i a l H i g h l i g h t s |
Mississippi Fund — Class A
Year Ended September 30, |
| | | 2007(1) | | 2006(1) | | 2005(1) | | 2004(1) | | 2003(1) |
| Net asset value — Beginning of year | | $ 9.690 | | $ 9.610 | | $ 9.720 | | $ 9.840 | | $10.000 |
| |
| |
| Income (loss) from operations | | | | | | | | | | |
| Net investment income | | $ 0.410 | | $ 0.417 | | $ 0.428 | | $ 0.455 | | $ 0.473 |
| Net realized and unrealized gain (loss) | | (0.155) | | 0.075 | | (0.099) | | (0.116) | | (0.163) |
| Total income from operations | | $ 0.255 | | $ 0.492 | | $ 0.329 | | $ 0.339 | | $ 0.310 |
| |
| |
| Less distributions | | | | | | | | | | |
| From net investment income | | $ (0.405) | | $ (0.412) | | $ (0.439) | | $ (0.459) | | $ (0.470) |
| Total distributions | | $ (0.405) | | $ (0.412) | | $ (0.439) | | $ (0.459) | | $ (0.470) |
| |
| Net asset value — End of year | | $ 9.540 | | $ 9.690 | | $ 9.610 | | $ 9.720 | | $ 9.840 |
| |
| Total Return(2) | | 2.67% | | 5.26% | | 3.44% | | 3.54% | | 3.21% |
| |
| |
| Ratios/Supplemental Data | | | | | | | | | | |
| Net assets, end of year (000’s omitted) | | $14,635 | | $15,154 | | $12,901 | | $11,379 | | $ 2,727 |
| Ratios (As a percentage of average daily net assets): | | | | | | | | | | |
| Expenses excluding interest and fees | | 0.81%(3) | | 0.81% | | 0.86%(4) | | 0.84%(4) | | 0.81%(4) |
| Interest and fee expense(5) | | 0.26% | | 0.19% | | 0.12%(4) | | 0.06%(4) | | 0.03%(4) |
| Total expenses before custodian fee reduction | | 1.07%(3) | | 1.00% | | 0.98%(4) | | 0.90%(4) | | 0.84%(4) |
| Expenses after custodian fee reduction | | | | | | | | | | |
| excluding interest and fees | | 0.79%(3) | | 0.78% | | 0.84%(4) | | 0.83%(4) | | 0.79%(4) |
| Net investment income | | 4.26% | | 4.34% | | 4.41% | | 4.70% | | 4.81% |
| Portfolio Turnover of the Portfolio(6) | | — | | — | | — | | 15% | | 11% |
| Portfolio Turnover of the Fund | | 16% | | 22% | | 21% | | — | | — |
| (1) | Net investment income per share was computed using average shares outstanding. |
| |
| (2) | Returns are historical and are calculated by determining the percentage change in net asset value with all distributions reinvested. |
| |
| (3) | The investment adviser was allocated a portion of the Fund’s operating expenses (equal to 0.02% of average daily net assets for the year ended September 30, 2007). Absent this allocation, total return would be lower. |
| |
| (4) | Includes the Fund’s share of its corresponding Portfolio’s allocated expenses while the Fund was making investments directly into the Portfolio. |
| |
| (5) | Interest and fee expense primarily relates to the liability for floating rate notes issued in conjunction with inverse floater securities transactions (see Note 1I). |
| |
| (6) | Portfolio turnover represents the rate of portfolio activity for the period while the Fund was making investments directly into the Portfolio. |
| |
S e e n o t e s t o f i n a n c i a l s t a t e m e n t s
70 |
Eaton Vance Municipals Funds a s o f S e p t e m b e r 3 0 , 2 0 0 7
F I N A N C I A L S T A T E M E N T S C O N T ’ D
F i n a n c i a l H i g h l i g h t s |
Mississippi Fund — Class B
Year Ended September 30, |
| | | 2007(1) | | 2006(1) | | 2005(1) | | 2004(1) | | 2003(1) |
| Net asset value — Beginning of year | | $ 9.910 | | $ 9.830 | | $ 9.940 | | $10.060 | | $10.220 |
| |
| |
| Income (loss) from operations | | | | | | | | | | |
| Net investment income | | $ 0.345 | | $ 0.354 | | $ 0.365 | | $ 0.393 | | $ 0.409 |
| Net realized and unrealized gain (loss) | | (0.155) | | 0.073 | | (0.100) | | (0.119) | | (0.163) |
| Total income from operations | | $ 0.190 | | $ 0.427 | | $ 0.265 | | $ 0.274 | | $ 0.246 |
| |
| |
| Less distributions | | | | | | | | | | |
| From net investment income | | $(0.340) | | $(0.347) | | $ (0.375) | | $ (0.394) | | $ (0.406) |
| Total distributions | | $(0.340) | | $(0.347) | | $ (0.375) | | $ (0.394) | | $ (0.406) |
| |
| Net asset value — End of year | | $ 9.760 | | $ 9.910 | | $ 9.830 | | $ 9.940 | | $ 10.060 |
| |
| Total Return(2) | | 1.94% | | 4.44% | | 2.86%(3) | | 2.79% | | 2.47% |
| |
| |
| Ratios/Supplemental Data | | | | | | | | | | |
| Net assets, end of year (000’s omitted) | | $ 2,626 | | $ 4,077 | | $ 5,291 | | $ 6,013 | | $15,018 |
| Ratios (As a percentage of average daily net assets): | | | | | | | | | | |
| Expenses excluding interest and fees | | 1.56%(4) | | 1.56% | | 1.61%(5) | | 1.59%(5) | | 1.56%(5) |
| Interest and fee expense(6) | | 0.26% | | 0.19% | | 0.12%(5) | | 0.06%(5) | | 0.03%(5) |
| Total expenses before custodian fee reduction | | 1.82%(4) | | 1.75% | | 1.73%(5) | | 1.65%(5) | | 1.59%(5) |
| Expenses after custodian fee reduction | | | | | | | | | | |
| excluding interest and fees | | 1.54%(4) | | 1.53% | | 1.59%(5) | | 1.58%(5) | | 1.54%(5) |
| Net investment income | | 3.50% | | 3.61% | | 3.68% | | 3.93% | | 4.07% |
| Portfolio Turnover of the Portfolio(7) | | — | | — | | — | | 15% | | 11% |
| Portfolio Turnover of the Fund | | 16% | | 22% | | 21% | | — | | — |
| (1) | Net investment income per share was computed using average shares outstanding. |
| |
| (2) | Returns are historical and are calculated by determining the percentage change in net asset value with all distributions reinvested. |
| |
| (3) | Total return reflects an increase of 0.16% due to a change in the timing of payment and reinvestment of distributions. |
| |
| (4) | The investment adviser was allocated a portion of the Fund’s operating expenses (equal to 0.02% of average daily net assets for the year ended September 30, 2007). Absent this allocation, total return would be lower. |
| |
| (5) | Includes the Fund’s share of its corresponding Portfolio’s allocated expenses while the Fund was making investments directly into the Portfolio. |
| |
| (6) | Interest and fee expense primarily relates to the liability for floating rate notes issued in conjunction with inverse floater securities transactions (see Note 1I). |
| |
| (7) | Portfolio turnover represents the rate of portfolio activity for the period while the Fund was making investments directly into the Portfolio. |
| |
S e e n o t e s t o f i n a n c i a l s t a t e m e n t s
71 |
Eaton Vance Municipals Funds a s o f S e p t e m b e r 3 0 , 2 0 0 7
F I N A N C I A L S T A T E M E N T S C O N T ’ D
F i n a n c i a l H i g h l i g h t s |
New York Fund — Class A
Year Ended September 30, |
| | | 2007(1) | | 2006(1) | | 2005(1) | | 2004(1) | | 2003(1) |
| Net asset value — Beginning of year | | $ 10.750 | | $ 10.700 | | $ 10.800 | | $ 10.920 | | $11.070 |
| |
| |
| Income (loss) from operations | | | | | | | | | | |
| Net investment income | | $ 0.466 | | $ 0.476 | | $ 0.502 | | $ 0.542 | | $ 0.539 |
| Net realized and unrealized gain (loss) | | (0.305) | | 0.170 | | (0.090) | | (0.049) | | (0.165) |
| Total income from operations | | $ 0.161 | | $ 0.646 | | $ 0.412 | | $ 0.493 | | $ 0.374 |
| |
| |
| Less distributions | | | | | | | | | | |
| From net investment income | | $ (0.458) | | $ (0.473) | | $ (0.512) | | $ (0.587) | | $ (0.518) |
| From net realized gain | | (0.053) | | (0.123) | | — | | (0.026) | | (0.006) |
| Total distributions | | $ (0.511) | | $ (0.596) | | $ (0.512) | | $ (0.613) | | $ (0.524) |
| |
| Net asset value — End of year | | $ 10.400 | | $ 10.750 | | $ 10.700 | | $ 10.800 | | $10.920 |
| |
| Total Return(2) | | 1.50% | | 6.29% | | 3.88% | | 4.66% | | 3.54% |
| |
| |
| Ratios/Supplemental Data | | | | | | | | | | |
| Net assets, end of year (000’s omitted) | | $400,671 | | $393,479 | | $357,652 | | $335,153 | | $42,481 |
| Ratios (As a percentage of average daily net assets): | | | | | | | | | | |
| Expenses excluding interest and fees | | 0.77%(3) | | 0.79% | | 0.80%(4) | | 0.82%(4) | | 0.80%(4) |
| Interest and fee expense(5) | | 0.48% | | 0.48% | | 0.35%(4) | | 0.19%(4) | | 0.09%(4) |
| Total expenses before custodian fee reduction | | 1.25%(3) | | 1.27% | | 1.15%(4) | | 1.01%(4) | | 0.89%(4) |
| Expenses after custodian fee reduction excluding interest and fees | | 0.75%(3) | | 0.78% | | 0.79%(4) | | 0.82%(4) | | 0.80%(4) |
| Net investment income | | 4.39% | | 4.50% | | 4.65% | | 5.07% | | 4.99% |
| Portfolio Turnover of the Portfolio(6) | | — | | — | | — | | 26% | | 19% |
| Portfolio Turnover of the Fund | | 35% | | 34% | | 45% | | — | | — |
| (1) | Net investment income per share was computed using average shares outstanding. |
| |
| (2) | Returns are historical and are calculated by determining the percentage change in net asset value with all distributions reinvested. |
| |
| (3) | The investment adviser was allocated a portion of the Fund’s operating expenses (equal to less than 0.005% of average daily net assets for the year ended September 30, 2007). Absent this allocation, total return would be lower. |
| |
| (4) | Includes the Fund’s share of its corresponding Portfolio’s allocated expenses while the Fund was making investments directly into the Portfolio. |
| |
| (5) | Interest and fee expense relates to the liability for floating rate notes issued in conjunction with inverse floater securities transactions (see Note 1I). |
| |
| (6) | Portfolio turnover represents the rate of portfolio activity for the period while the Fund was making investments directly into the Portfolio. |
| |
S e e n o t e s t o f i n a n c i a l s t a t e m e n t s
72 |
Eaton Vance Municipals Funds a s o f S e p t e m b e r 3 0 , 2 0 0 7
F I N A N C I A L S T A T E M E N T S C O N T ’ D
F i n a n c i a l H i g h l i g h t s |
New York Fund — Class B
Year Ended September 30, |
| | | 2007(1) | | 2006(1) | | 2005(1) | | 2004(1) | | 2003(1) |
| Net asset value — Beginning of year | | $10.760 | | $10.700 | | $10.800 | | $10.910 | | $ 11.050 |
| |
| |
| Income (loss) from operations | | | | | | | | | | |
| Net investment income | | $ 0.386 | | $ 0.396 | | $ 0.415 | | $ 0.533 | | $ 0.494 |
| Net realized and unrealized gain (loss) | | (0.295) | | 0.181 | | (0.083) | | (0.084) | | (0.169) |
| Total income from operations | | $ 0.091 | | $ 0.577 | | $ 0.332 | | $ 0.449 | | $ 0.325 |
| |
| |
| Less distributions | | | | | | | | | | |
| From net investment income | | $ (0.378) | | $ (0.394) | | $ (0.432) | | $ (0.540) | | $ (0.463) |
| From net realized gain | | (0.053) | | (0.123) | | — | | (0.024) | | (0.006) |
| Total distributions | | $ (0.431) | | $ (0.517) | | $ (0.432) | | $ (0.564) | | $ (0.469) |
| |
| Contingent deferred sales charges | | $ — | | $ — | | $ — | | $ 0.005 | | $ 0.004 |
| |
| Net asset value — End of year | | $ 10.420 | | $ 10.760 | | $10.700 | | $10.800 | | $ 10.910 |
| |
| Total Return(2) | | 0.83% | | 5.59% | | 3.27%(3) | | 4.28% | | 3.08% |
| |
| |
| Ratios/Supplemental Data | | | | | | | | | | |
| Net assets, end of year (000’s omitted) | | $11,439 | | $ 9,488 | | $ 6,189 | | $ 2,984 | | $307,299 |
| Ratios (As a percentage of average daily net assets): | | | | | | | | | | |
| Expenses excluding interest and fees | | 1.51%(4) | | 1.54% | | 1.55%(5) | | 0.93%(5) | | 1.23%(5) |
| Interest and fee expense(6) | | 0.48% | | 0.48% | | 0.35%(5) | | 0.19%(5) | | 0.09%(5) |
| Total expenses before custodian fee reduction | | 1.99%(4) | | 2.02% | | 1.90%(5) | | 1.12%(5) | | 1.32%(5) |
| Expenses after custodian fee reduction excluding interest and fees | | 1.50%(4) | | 1.53% | | 1.54%(5) | | 0.93%(5) | | 1.23%(5) |
| Net investment income | | 3.63% | | 3.74% | | 3.84% | | 4.86% | | 4.58% |
| Portfolio Turnover of the Portfolio(7) | | — | | — | | — | | 26% | | 19% |
| Portfolio Turnover of the Fund | | 35% | | 34% | | 45% | | — | | — |
| (1) | Net investment income per share was computed using average shares outstanding. |
| |
| (2) | Returns are historical and are calculated by determining the percentage change in net asset value with all distributions reinvested. |
| |
| (3) | Total return reflects an increase of 0.16% due to a change in the timing of the payment and reinvestment of distributions. |
| |
| (4) | The investment adviser was allocated a portion of the Fund’s operating expenses (equal to less than 0.005% of average daily net assets for the year ended September 30, 2007). Absent this allocation, total return would be lower. |
| |
| (5) | Includes the Fund’s share of its corresponding Portfolio’s allocated expenses while the Fund was making investments directly into the Portfolio. |
| |
| (6) | Interest and fee expense relates to the liability for floating rate notes issued in conjunction with inverse floater securities transactions (see Note 1I). |
| |
| (7) | Portfolio turnover represents the rate of portfolio activity for the period while the Fund was making investments directly into the Portfolio. |
| |
S e e n o t e s t o f i n a n c i a l s t a t e m e n t s
73 |
Eaton Vance Municipals Funds a s o f S e p t e m b e r 3 0 , 2 0 0 7
F I N A N C I A L S T A T E M E N T S C O N T ’ D
F i n a n c i a l H i g h l i g h t s |
New York Fund — Class C
Year Ended September 30, |
| | | 2007(1) | | 2006(1) | | 2005(1) | | 2004(1) | | 2003(1)(2) |
| Net asset value — Beginning of period | | $10.750 | | $10.700 | | $10.800 | | $11.070 | | $11.020 |
| |
| |
| Income (loss) from operations | | | | | | | | | | | | |
| Net investment income | | $ 0.383 | | $ 0.391 | | $ 0.408 | | $ 0.448 | | $ | | 0.002 |
| Net realized and unrealized gain (loss) | | (0.302) | | 0.176 | | (0.077) | | (0.222) | | | | 0.049 |
| Total income from operations | | $ 0.081 | | $ 0.567 | | $ 0.331 | | $ 0.226 | | $ | | 0.051 |
| |
| |
| Less distributions | | | | | | | | | | | | |
| From net investment income | | $ (0.378) | | $ (0.394) | | $ (0.431) | | $ (0.467) | | $ (0.001) |
| From net realized gain | | (0.053) | | (0.123) | | — | | (0.029) | | | | — |
| Total distributions | | $ (0.431) | | $ (0.517) | | $ (0.431) | | $ (0.496) | | $ (0.001) |
| |
| Net asset value — End of period | | $ 10.400 | | $ 10.750 | | $10.700 | | $10.800 | | $ 11.070 |
| |
| Total Return(3) | | 0.73% | | 5.50% | | 3.20%(4) | | 1.99% | | | | 0.50% |
| |
| |
| Ratios/Supplemental Data | | | | | | | | | | | | |
| Net assets, end of period (000’s omitted) | | $31,131 | | $13,889 | | $ 4,702 | | $ 940 | | $ | | 11 |
| Ratios (As a percentage of average daily net assets): | | | | | | | | | | | | |
| Expenses excluding interest and fees | | 1.51%(5) | | 1.54% | | 1.54%(6) | | 1.56%(6) | | | | 1.89%(6)(7) |
| Interest and fee expense(8) | | 0.48% | | 0.48% | | 0.35%(6) | | 0.19%(6) | | | | 0.09%(6)(7) |
| Total expenses before custodian fee reduction | | 1.99%(5) | | 2.02% | | 1.89%(6) | | 1.75%(6) | | | | 1.98%(6)(7) |
| Expenses after custodian fee reduction excluding interest and fees | | 1.50%(5) | | 1.53% | | 1.53%(6) | | 1.56%(6) | | | | 1.89%(6)(7) |
| Net investment income | | 3.62% | | 3.70% | | 3.78% | | 4.17% | | | | 6.41%(7) |
| Portfolio Turnover of the Portfolio(9) | | — | | — | | — | | 26% | | | | 19% |
| Portfolio Turnover of the Fund | | 35% | | 34% | | 45% | | — | | | | — |
| (1) | Net investment income per share was computed using average shares outstanding. |
| |
| (2) | Class C commenced operations on September 30, 2003. |
| |
| (3) | Returns are historical and are calculated by determining the percentage change in net asset value with all distributions reinvested. |
| |
| (4) | Total return reflects an increase of 0.09% due to a change in the timing of the payment and reinvestment of distributions. |
| |
| (5) | The investment adviser was allocated a portion of the Fund’s operating expenses (equal to less than 0.005% of average daily net assets for the year ended September 30, 2007). Absent this allocation, total return would be lower. |
| |
| (6) | Includes the Fund’s share of its corresponding Portfolio’s allocated expenses while the Fund was making investments directly into the Portfolio. |
| |
| (7) | Annualized. |
| |
| (8) | Interest and fee expense relates to the liability for floating rate notes issued in conjunction with inverse floater securities transactions (see Note 1I). |
| |
| (9) | Portfolio turnover represents the rate of portfolio activity for the period while the Fund was making investments directly into the Portfolio. |
| |
S e e n o t e s t o f i n a n c i a l s t a t e m e n t s
74 |
| | Eaton Vance Municipals Funds a s o f S e p t e m b e r 3 0 , 2 0 0 7
F I N A N C I A L S T A T E M E N T S C O N T ’ D
F i n a n c i a l H i g h l i g h t s |
Ohio Fund — Class A
Year Ended September 30, |
| | | 2007(1) | | 2006(1) | | 2005(1) | | 2004(1) | | 2003 |
| Net asset value — Beginning of year | | $ 9.450 | | $ 9.320 | | $ 9.180 | | $ 9.230 | | $ 9.290 |
| |
| |
| Income (loss) from operations | | | | | | | | | | |
| Net investment income | | $ 0.382 | | $ 0.420 | | $ 0.464 | | $ 0.491 | | $ 0.499 |
| Net realized and unrealized gain (loss) | | (0.197) | | 0.137 | | 0.142 | | (0.034) | | (0.077) |
| Total income from operations | | $ 0.185 | | $ 0.557 | | $ 0.606 | | $ 0.457 | | $ 0.422 |
| |
| |
| Less distributions | | | | | | | | | | |
| From net investment income | | $ (0.395) | | $ (0.427) | | $ (0.466) | | $ (0.507) | | $ (0.482) |
| Total distributions | | $ (0.395) | | $ (0.427) | | $ (0.466) | | $ (0.507) | | $ (0.482) |
| |
| Net asset value — End of year | | $ 9.240 | | $ 9.450 | | $ 9.320 | | $ 9.180 | | $ 9.230 |
| |
| Total Return(2) | | 1.98% | | 6.15% | | 6.71% | | 5.07% | | 4.73% |
| |
| |
| Ratios/Supplemental Data | | | | | | | | | | |
| Net assets, end of year (000’s omitted) | | $274,850 | | $182,719 | | $140,355 | | $126,212 | | $15,612 |
| Ratios (As a percentage of average daily net assets): | | | | | | | | | | |
| Expenses excluding interest and fees | | 0.77%(3) | | 0.78% | | 0.82%(4) | | 0.85%(4) | | 0.81%(4) |
| Interest and fee expense(5) | | 0.31% | | 0.47% | | 0.35%(4) | | 0.25%(4) | | 0.25%(4) |
| Total expenses before custodian fee reduction | | 1.08%(3) | | 1.25% | | 1.17%(4) | | 1.10%(4) | | 1.06%(4) |
| Expenses after custodian fee reduction excluding interest and fees | | 0.74%(3) | | 0.75% | | 0.81%(4) | | 0.85%(4) | | 0.80%(4) |
| Net investment income | | 4.09% | | 4.53% | | 4.97% | | 5.38% | | 5.46% |
| Portfolio Turnover of the Portfolio(6) | | — | | — | | — | | 9% | | 15% |
| Portfolio Turnover of the Fund | | 39% | | 24% | | 28% | | — | | — |
| (1) | Net investment income per share was computed using average shares outstanding. |
| |
| (2) | Returns are historical and are calculated by determining the percentage change in net asset value with all distributions reinvested. |
| |
| (3) | The investment adviser was allocated a portion of the Fund’s operating expenses (equal to less than 0.005% of average daily net assets for the year ended September 30, 2007). Absent this allocation, total return would be lower. |
| |
| (4) | Includes the Fund’s share of its corresponding Portfolio’s allocated expenses while the Fund was making investments directly into the Portfolio. |
| |
| (5) | Interest and fee expense relates to the liability for floating rate notes issued in conjunction with inverse floater securities transactions (see Note 1I). |
| |
| (6) | Portfolio turnover represents the rate of portfolio activity for the period while the Fund was making investments directly into the Portfolio. |
| |
S e e n o t e s t o f i n a n c i a l s t a t e m e n t s
75 |
Eaton Vance Municipals Funds a s o f S e p t e m b e r 3 0 , 2 0 0 7
F I N A N C I A L S T A T E M E N T S C O N T ’ D
F i n a n c i a l H i g h l i g h t s |
Ohio Fund — Class B
Year Ended September 30, |
| | | 2007(1) | | 2006(1) | | 2005(1) | | 2004(1) | | 2003(1) |
| Net asset value �� Beginning of year | | $ 9.440 | | $ 9.320 | | $ 9.180 | | $ 9.240 | | $ 9.290 |
| |
| |
| Income (loss) from operations | | | | | | | | | | |
| Net investment income | | $ 0.315 | | $ 0.353 | | $ 0.394 | | $ 0.423 | | $ 0.433 |
| Net realized and unrealized gain (loss) | | (0.191) | | 0.124 | | 0.143 | | (0.046) | | (0.068) |
| Total income from operations | | $ 0.124 | | $ 0.477 | | $ 0.537 | | $ 0.377 | | $ 0.365 |
| |
| |
| Less distributions | | | | | | | | | | |
| From net investment income | | $ (0.324) | | $ (0.357) | | $ (0.397) | | $ (0.437) | | $ (0.415) |
| Total distributions | | $ (0.324) | | $ (0.357) | | $ (0.397) | | $ (0.437) | | $ (0.415) |
| |
| Net asset value — End of year | | $ 9.240 | | $ 9.440 | | $ 9.320 | | $ 9.180 | | $ 9.240 |
| |
| Total Return(2) | | 1.32% | | 5.25% | | 6.14%(3) | | 4.14% | | 4.01% |
| |
| |
| Ratios/Supplemental Data | | | | | | | | | | |
| Net assets, end of year (000’s omitted) | | $28,626 | | $32,512 | | $34,257 | | $36,545 | | $157,077 |
| Ratios (As a percentage of average daily net assets): | | | | | | | | | | |
| Expenses excluding interest and fees | | 1.52%(4) | | 1.53% | | 1.57%(5) | | 1.60%(5) | | 1.56%(5) |
| Interest and fee expense(6) | | 0.31% | | 0.47% | | 0.35%(5) | | 0.25%(5) | | 0.25%(5) |
| Total expenses before custodian fee reduction | | 1.83%(4) | | 2.00% | | 1.92%(5) | | 1.85%(5) | | 1.81%(5) |
| Expenses after custodian fee reduction excluding interest and fees | | 1.49%(4) | | 1.50% | | 1.56%(5) | | 1.60%(5) | | 1.55%(5) |
| Net investment income | | 3.36% | | 3.80% | | 4.23% | | 4.56% | | 4.73% |
| Portfolio Turnover of the Portfolio(7) | | — | | — | | — | | 9% | | 15% |
| Portfolio Turnover of the Fund | | 39% | | 24% | | 28% | | — | | — |
| (1) | Net investment income per share was computed using average shares outstanding. |
| |
| (2) | Returns are historical and are calculated by determining the percentage change in net asset value with all distributions reinvested. |
| |
| (3) | Total return reflects an increase of 0.18% due to a change in the timing of the payment and reinvestment of distributions. |
| |
| (4) | The investment adviser was allocated a portion of the Fund’s operating expenses (equal to less than 0.005% of average daily net assets for the year ended September 30, 2007). Absent this allocation, total return would be lower. |
| |
| (5) | Includes the Fund’s share of its corresponding Portfolio’s allocated expenses while the Fund was making investments directly into the Portfolio. |
| |
| (6) | Interest and fee expense relates to the liability for floating rate notes issued in conjunction with inverse floater securities transactions (see Note 1I). |
| |
| (7) | Portfolio turnover represents the rate of portfolio activity for the period while the Fund was making investments directly into the Portfolio. |
| |
S e e n o t e s t o f i n a n c i a l s t a t e m e n t s
76 |
| | Eaton Vance Municipals Funds a s o f S e p t e m b e r 3 0 , 2 0 0 7
F I N A N C I A L S T A T E M E N T S C O N T ’ D
F i n a n c i a l H i g h l i g h t s |
| | | Ohio Fund — Class C |
| | | Year Ended September 30, |
| | | 2007(1) | | 2006(1)(2) |
| Net asset value — Beginning of year | | $ 9.440 | | $ | | 9.300 |
| |
| |
| Income (loss) from operations | | | | | | |
| Net investment income | | $ 0.310 | | $ 0.211 |
| Net realized and unrealized gain (loss) | | (0.186) | | | | 0.160 |
| Total income from operations | | $ 0.124 | | $ 0.371 |
| |
| |
| Less distributions | | | | | | |
| From net investment income | | $ (0.324) | | $(0.231) |
| Total distributions | | $ (0.324) | | $(0.231) |
| |
| Net asset value — End of year | | $ 9.240 | | $ | | 9.440 |
| |
| Total Return(3) | | 1.32% | | | | 4.06%(8) |
| |
| |
| Ratios/Supplemental Data | | | | | | |
| Net assets, end of year (000’s omitted) | | $30,804 | | $ | | 8,294 |
| Ratios (As a percentage of average daily net assets): | | | | | | |
| Expenses excluding interest and fees | | 1.52%(4) | | | | 1.53%(5) |
| Interest and fee expense(6) | | 0.31% | | | | 0.47%(5) |
| Total expenses before custodian fee reduction | | 1.83%(4) | | | | 2.00%(5) |
| Expenses after custodian fee reduction excluding interest and fees | | 1.49%(4) | | | | 1.50%(5) |
| Net investment income | | 3.33% | | | | 3.45%(5) |
| Portfolio Turnover of the Fund | | 39% | | | | 24%(7) |
| (1) | Net investment income per share was computed using average shares outstanding. |
| |
| (2) | For the period from the start of business, February 3, 2006 to September 30, 2006. |
| |
| (3) | Returns are historical and are calculated by determining the percentage change in net asset value with all distributions reinvested. |
| |
| (4) | The investment adviser was allocated a portion of the Fund’s operating expenses (equal to less than 0.005% of average daily net assets for the year ended September 30, 2007). Absent this allocation, total return would be lower. |
| |
| (5) | Annualized. |
| |
| (6) | Interest and fee expense relates to the liability for floating rate notes issued in conjunction with inverse floater securities transactions (see Note 1I). |
| |
| (7) | For the year ended September 30, 2006. |
| |
| (8) | Not annualized. |
| |
S e e n o t e s t o f i n a n c i a l s t a t e m e n t s
77 |
Eaton Vance Municipals Funds a s o f S e p t e m b e r 3 0 , 2 0 0 7
F I N A N C I A L S T A T E M E N T S C O N T ’ D
F i n a n c i a l H i g h l i g h t s |
Rhode Island Fund — Class A
Year Ended September 30, |
| | | 2007(1) | | 2006(1) | | 2005(1) | | 2004(1) | | 2003(1) |
| Net asset value — Beginning of year | | $ 9.860 | | $ 9.760 | | $ 9.780 | | $ 9.760 | | $10.010 |
| |
| |
| Income (loss) from operations | | | | | | | | | | |
| Net investment income | | $ 0.411 | | $ 0.423 | | $ 0.441 | | $ 0.462 | | $ 0.472 |
| Net realized and unrealized gain (loss) | | (0.225) | | 0.106 | | (0.014) | | 0.028 | | (0.253) |
| Total income from operations | | $ 0.186 | | $ 0.529 | | $ 0.427 | | $ 0.490 | | $ 0.219 |
| |
| |
| Less distributions | | | | | | | | | | |
| From net investment income | | $ (0.406) | | $ (0.429) | | $ (0.447) | | $ (0.470) | | $ (0.469) |
| Total distributions | | $ (0.406) | | $ (0.429) | | $ (0.447) | | $ (0.470) | | $ (0.469) |
| |
| Net asset value — End of year | | $ 9.640 | | $ 9.860 | | $ 9.760 | | $ 9.780 | | $ 9.760 |
| |
| Total Return(2) | | 1.91% | | 5.56% | | 4.44% | | 5.13% | | 2.29% |
| |
| |
| Ratios/Supplemental Data | | | | | | | | | | |
| Net assets, end of year (000’s omitted) | | $46,764 | | $39,291 | | $29,745 | | $26,558 | | $11,701 |
| Ratios (As a percentage of average daily net assets): | | | | | | | | | | |
| Expenses excluding interest and fees | | 0.74%(3) | | 0.75% | | 0.77%(4) | | 0.77%(4) | | 0.74%(4) |
| Interest and fee expense(5) | | 0.40% | | 0.35% | | 0.18%(4) | | 0.10%(4) | | 0.09%(4) |
| Total expenses before custodian fee reduction | | 1.14%(3) | | 1.10% | | 0.95%(4) | | 0.87%(4) | | 0.83%(4) |
| Expenses after custodian fee reduction excluding interest and fees | | 0.69%(3) | | 0.72% | | 0.75%(4) | | 0.77%(4) | | 0.73%(4) |
| Net investment income | | 4.20% | | 4.34% | | 4.49% | | 4.74% | | 4.82% |
| Portfolio Turnover of the Portfolio(6) | | — | | — | | — | | 16% | | 19% |
| Portfolio Turnover of the Fund | | 14% | | 19% | | 15% | | — | | — |
| (1) | Net investment income per share was computed using average shares outstanding. |
| |
| (2) | Returns are historical and are calculated by determining the percentage change in net asset value with all distributions reinvested. |
| |
| (3) | The investment adviser was allocated a portion of the Fund’s operating expenses (equal to 0.01% of average daily net assets for the year ended September 30, 2007). Absent this allocation, total return would be lower. |
| |
| (4) | Includes the Fund’s share of its corresponding Portfolio’s allocated expenses while the Fund was making investments directly into the Portfolio. |
| |
| (5) | Interest and fee expense relates to the liability for floating rate notes issued in conjunction with inverse floater securities transactions (See Note 1I). |
| |
| (6) | Portfolio turnover represents the rate of portfolio activity for the period while the Fund was making investments directly into the Portfolio. |
| |
S e e n o t e s t o f i n a n c i a l s t a t e m e n t s
78 |
Eaton Vance Municipals Funds a s o f S e p t e m b e r 3 0 , 2 0 0 7
F I N A N C I A L S T A T E M E N T S C O N T ’ D
F i n a n c i a l H i g h l i g h t s |
Rhode Island Fund — Class B
Year Ended September 30, |
| | | 2007(1) | | 2006(1) | | 2005(1) | | 2004(1) | | 2003(1) |
| Net asset value — Beginning of year | | $10.080 | | $ 9.980 | | $10.000 | | $ 9.990 | | $10.250 |
| |
| |
| Income (loss) from operations | | | | | | | | | | |
| Net investment income | | $ 0.345 | | $ 0.361 | | $ 0.377 | | $ 0.401 | | $ 0.409 |
| Net realized and unrealized gain (loss) | | (0.224) | | 0.103 | | (0.015) | | 0.016 | | (0.262) |
| Total income from operations | | $ 0.121 | | $ 0.464 | | $ 0.362 | | $ 0.417 | | $ 0.147 |
| |
| |
| Less distributions | | | | | | | | | | |
| From net investment income | | $ (0.341) | | $ (0.364) | | $ (0.382) | | $ (0.407) | | $ (0.407) |
| Total distributions | | $ (0.341) | | $ (0.364) | | $ (0.382) | | $ (0.407) | | $ (0.407) |
| |
| Net asset value — End of year | | $ 9.860 | | $ 10.080 | | $ 9.980 | | $10.000 | | $ 9.990 |
| |
| Total Return(2) | | 1.20% | | 4.76% | | 3.83%(3) | | 4.25% | | 1.48% |
| |
| |
| Ratios/Supplemental Data | | | | | | | | | | |
| Net assets, end of year (000’s omitted) | | $13,989 | | $18,564 | | $22,793 | | $25,084 | | $42,930 |
| Ratios (As a percentage of average daily net assets): | | | | | | | | | | |
| Expenses excluding interest and fees | | 1.49%(4) | | 1.50% | | 1.52%(5) | | 1.52%(5) | | 1.49%(5) |
| Interest and fee expense(6) | | 0.40% | | 0.35% | | 0.18%(5) | | 0.10%(5) | | 0.09%(5) |
| Total expenses before custodian fee reduction | | 1.89%(4) | | 1.85% | | 1.70%(5) | | 1.62%(5) | | 1.58%(5) |
| Expenses after custodian fee reduction excluding interest and fees | | 1.44%(4) | | 1.47% | | 1.50%(5) | | 1.52%(5) | | 1.48%(5) |
| Net investment income | | 3.45% | | 3.62% | | 3.76% | | 4.00% | | 4.08% |
| Portfolio Turnover of the Portfolio(7) | | — | | — | | — | | 16% | | 19% |
| Portfolio Turnover of the Fund | | 14% | | 19% | | 15% | | — | | — |
| (1) | Net investment income per share was computed using average shares outstanding. |
| |
| (2) | Returns are historical and are calculated by determining the percentage change in net asset value with all distributions reinvested. |
| |
| (3) | Total return reflects an increase of 0.15% due to a change in the timing of the payment and reinvestment of distributions. |
| |
| (4) | The investment adviser was allocated a portion of the Fund’s operating expenses (equal to 0.01% of average daily net assets for the year ended September 30, 2007). Absent this allocation, total return would be lower. |
| |
| (5) | Includes the Fund’s share of its corresponding Portfolio’s allocated expenses while the Fund was making investments directly into the Portfolio. |
| |
| (6) | Interest and fee expense relates to the liability for floating rate notes issued in conjunction with inverse floater securities transactions (See Note 1I). |
| |
| (7) | Portfolio turnover represents the rate of portfolio activity for the period while the Fund was making investments directly into the Portfolio. |
| |
S e e n o t e s t o f i n a n c i a l s t a t e m e n t s
79 |
| | Eaton Vance Municipals Funds a s o f S e p t e m b e r 3 0 , 2 0 0 7
F I N A N C I A L S T A T E M E N T S C O N T ’ D
F i n a n c i a l H i g h l i g h t s |
| | | Rhode Island Fund — Class C |
| | | Year Ended September 30, |
| | | 2007(1) | | 2006(1)(2) |
| Net asset value — Beginning of year | | $10.090 | | $10.040 |
| |
| Income (loss) from operations | | | | | | |
| Net investment income | | $ 0.344 | | $ | | 0.173 |
| Net realized and unrealized gain (loss) | | (0.223) | | | | 0.065 |
| Total income from operations | | $ 0.121 | | $ | | 0.238 |
| |
| |
| Less distributions | | | | | | |
| From net investment income | | $ (0.341) | | $ (0.188) |
| Total distributions | | $ (0.341) | | $ (0.188) |
| |
| Net asset value — End of year | | $ 9.870 | | $10.090 |
| |
| Total Return(3) | | 1.20% | | | | 2.40%(8) |
| |
| |
| Ratios/Supplemental Data | | | | | | |
| Net assets, end of year (000’s omitted) | | $ 3,281 | | $ | | 428 |
| Ratios (As a percentage of average daily net assets): | | | | | | |
| Expenses excluding interest and fees | | 1.48%(4) | | | | 1.50%(5) |
| Interest and fee expense(6) | | 0.40% | | | | 0.35%(5) |
| Total expenses before custodian fee reduction | | 1.88%(4) | | | | 1.85%(5) |
| Expenses after custodian fee reduction excluding interest and fees | | 1.44%(4) | | | | 1.47%(5) |
| Net investment income | | 3.45% | | | | 3.23%(5) |
| Portfolio Turnover of the Fund | | 14% | | | | 19%(7) |
| (1) | Net investment income per share was computed using average shares outstanding. |
| |
| (2) | For the period from the start of business, March 20, 2006 to September 30, 2006. |
| |
| (3) | Returns are historical and are calculated by determining the percentage change in net asset value with all distributions reinvested. |
| |
| (4) | The investment adviser was allocated a portion of the Fund’s operating expenses (equal to 0.01% of average daily net assets for the year ended September 30, 2007). Absent this allocation, total return would be lower. |
| |
| (5) | Annualized. |
| |
| (6) | Interest and fee expense relates to the liability for floating rate notes issued in conjunction with inverse floater securities transactions (See Note 1I). |
| |
| (7) | For the year ended September 30, 2006. |
| |
| (8) | Not annualized. |
| |
S e e n o t e s t o f i n a n c i a l s t a t e m e n t s
80 |
Eaton Vance Municipals Funds a s o f S e p t e m b e r 3 0 , 2 0 0 7
F I N A N C I A L S T A T E M E N T S C O N T ’ D
F i n a n c i a l H i g h l i g h t s |
West Virginia Fund — Class A
Year Ended September 30, |
| | | 2007(1) | | 2006(1) | | 2005(1) | | 2004(1) | | 2003(1) |
| Net asset value — Beginning of year | | $ 9.870 | | $ 9.750 | | $ 9.810 | | $ 9.880 | | $10.130 |
| |
| |
| Income (loss) from operations | | | | | | | | | | |
| Net investment income | | $ 0.402 | | $ 0.415 | | $ 0.434 | | $ 0.462 | | $ 0.468 |
| Net realized and unrealized gain (loss) | | (0.181) | | 0.110 | | (0.053) | | (0.081) | | (0.253) |
| Total income from operations | | $ 0.221 | | $ 0.525 | | $ 0.381 | | $ 0.381 | | $ 0.215 |
| |
| |
| Less distributions | | | | | | | | | | |
| From net investment income | | $ (0.401) | | $ (0.405) | | $ (0.441) | | $ (0.451) | | $ (0.465) |
| Total distributions | | $ (0.401) | | $ (0.405) | | $ (0.441) | | $ (0.451) | | $ (0.465) |
| |
| Net asset value — End of year | | $ 9.690 | | $ 9.870 | | $ 9.750 | | $ 9.810 | | $ 9.880 |
| |
| Total Return(2) | | 2.26% | | 5.53% | | 3.95% | | 3.94% | | 2.23% |
| |
| |
| Ratios/Supplemental Data | | | | | | | | | | |
| Net assets, end of year (000’s omitted) | | $25,703 | | $22,812 | | $21,249 | | $18,670 | | $ 3,522 |
| Ratios (As a percentage of average daily net assets): | | | | | | | | | | |
| Expenses excluding interest and fees | | 0.75%(3) | | 0.75% | | 0.79%(4) | | 0.79%(4) | | 0.73%(4) |
| Interest and fee expense(5) | | 0.25% | | 0.18% | | 0.06%(4) | | 0.03%(4) | | 0.04%(4) |
| Total expenses before custodian fee reduction | | 1.00%(3) | | 0.93% | | 0.85%(4) | | 0.82%(4) | | 0.77%(4) |
| Expenses after custodian fee reduction excluding interest and fees | | 0.71%(3) | | 0.72% | | 0.78%(4) | | 0.78%(4) | | 0.71%(4) |
| Net investment income | | 4.10% | | 4.26% | | 4.42% | | 4.73% | | 4.74% |
| Portfolio Turnover of the Portfolio(6) | | — | | — | | — | | 12% | | 21% |
| Portfolio Turnover of the Fund | | 31% | | 20% | | 21% | | — | | — |
| (1) | Net investment income per share was computed using average shares outstanding. |
| |
| (2) | Returns are historical and are calculated by determining the percentage change in net asset value with all distributions reinvested. |
| |
| (3) | The investment adviser was allocated a portion of the Fund’s operating expenses (equal to 0.01% of average daily net assets for the year ended September 30, 2007). Absent this allocation, total return would be lower. |
| |
| (4) | Includes the Fund’s share of its corresponding Portfolio’s allocated expenses while the Fund was making investments directly into the Portfolio. |
| |
| (5) | Interest and fee expense relates to the liability for floating rate notes issued in conjunction with inverse floater securities transactions (See Note 1I). |
| |
| (6) | Portfolio turnover represents the rate of portfolio activity for the period while the Fund was making investments directly into the Portfolio. |
| |
S e e n o t e s t o f i n a n c i a l s t a t e m e n t s
81 |
Eaton Vance Municipals Funds a s o f S e p t e m b e r 3 0 , 2 0 0 7
F I N A N C I A L S T A T E M E N T S C O N T ’ D
F i n a n c i a l H i g h l i g h t s |
West Virginia Fund — Class B
Year Ended September 30, |
| | | 2007(1) | | 2006(1) | | 2005(1) | | 2004(1) | | 2003(1) |
| Net asset value — Beginning of year | | $10.060 | | $ 9.930 | | $10.000 | | $10.080 | | $10.340 |
| |
| |
| Income (loss) from operations | | | | | | | | | | |
| Net investment income | | $ 0.335 | | $ 0.350 | | $ 0.378 | | $ 0.395 | | $ 0.402 |
| Net realized and unrealized gain (loss) | | (0.191) | | 0.118 | | (0.073) | | (0.087) | | (0.261) |
| Total income from operations | | $ 0.144 | | $ 0.468 | | $ 0.305 | | $ 0.308 | | $ 0.141 |
| |
| |
| Less distributions | | | | | | | | | | |
| From net investment income | | $ (0.334) | | $ (0.338) | | $ (0.375) | | $ (0.388) | | $ (0.401) |
| Total distributions | | $ (0.334) | | $ (0.338) | | $ (0.375) | | $ (0.388) | | $ (0.401) |
| |
| Net asset value — End of year | | $ 9.870 | | $ 10.060 | | $ 9.930 | | $10.000 | | $ 10.080 |
| |
| Total Return(2) | | 1.43% | | 4.82% | | 3.26%(3) | | 3.09% | | 1.41% |
| |
| |
| Ratios/Supplemental Data | | | | | | | | | | |
| Net assets, end of year (000’s omitted) | | $ 6,049 | | $ 7,002 | | $ 8,287 | | $ 8,550 | | $23,634 |
| Ratios (As a percentage of average daily net assets): | | | | | | | | | | |
| Expenses excluding interest and fees | | 1.49%(4) | | 1.50% | | 1.54%(5) | | 1.55%(5) | | 1.48%(5) |
| Interest and fee expense(6) | | 0.25% | | 0.18% | | 0.06%(5) | | 0.03%(5) | | 0.04%(5) |
| Total expenses before custodian fee reduction | | 1.74%(4) | | 1.68% | | 1.60%(5) | | 1.58%(5) | | 1.52%(5) |
| Expenses after custodian fee reduction excluding interest and fees | | 1.46%(4) | | 1.47% | | 1.53%(5) | | 1.54%(5) | | 1.46%(5) |
| Net investment income | | 3.35% | | 3.53% | | 3.78% | | 3.91% | | 3.99% |
| Portfolio Turnover of the Portfolio(7) | | — | | — | | — | | 12% | | 21% |
| Portfolio Turnover of the Fund | | 31% | | 20% | | 21% | | — | | — |
| (1) | Net investment income per share was computed using average shares outstanding. |
| |
| (2) | Returns are historical and are calculated by determining the percentage change in net asset value with all distributions reinvested. |
| |
| (3) | Total return reflects an increase of 0.16% due to a change in the timing of payment and reinvestment of distributions. |
| |
| (4) | The investment adviser was allocated a portion of the Fund’s operating expenses (equal to 0.01% of average daily net assets for the year ended September 30, 2007). Absent this allocation, total return would be lower. |
| |
| (5) | Includes the Fund’s share of its corresponding Portfolio’s allocated expenses while the Fund was making investments directly into the Portfolio. |
| |
| (6) | Interest and fee expense relates to the liability for floating rate notes issued in conjunction with inverse floater securities transactions (See Note 1I). |
| |
| (7) | Portfolio turnover represents the rate of portfolio activity for the period while the Fund was making investments directly into the Portfolio. |
| |
S e e n o t e s t o f i n a n c i a l s t a t e m e n t s
82 |
Eaton Vance Municipals Funds a s o f S e p t e m b e r 3 0 , 2 0 0 7
N O T E S T O F I N A N C I A L S T A T E M E N T S |
1 Significant Accounting Policies
Eaton Vance Municipals Trust (the Trust) is a Massachusetts business trust registered under the Investment Company Act of 1940, as amended (the 1940 Act), as an open-end, management investment company. The Trust presently consists of twenty-eight funds, eight of which, each non-diversified, are included in these financial statements. They include Eaton Vance California Municipals Fund (California Fund), Eaton Vance Florida Municipals Fund (Florida Fund), Eaton Vance Massachusetts Municipals Fund (Massachusetts Fund), Eaton Vance Mississippi Municipals Fund (Mississippi Fund), Eaton Vance New York Municipals Fund (New York Fund), Eaton Vance Ohio Municipals Fund (Ohio Fund), Eaton Vance Rhode Island Municipals Fund (Rhode Island Fund) and Eaton Vance West Virginia Municipals Fund (West Virginia Fund) (each individually referred to as the Fund, and collectively, the Funds). The Funds seek to provide current income exempt from regular federal income tax and from particular state or lo cal income or other taxes, as applicable. The Mississippi Fund and West Virginia Fund offer two classes of shares. The California Fund, Florida Fund, New York Fund, Ohio Fund and Rhode Island Fund offer three classes of shares. The Massachusetts Fund offers four classes of shares. Class A shares are generally sold subject to a sales charge imposed at time of purchase. Class B and Class C shares are sold at net asset value and are generally subject to a contingent deferred sales charge (see Note 5). Class B shares of each Fund automatically convert to Class A shares eight years after their purchase as described in the Funds’ prospectus. Class I shares of the Massachusetts Fund are sold at net asset value. Each class represents a pro-rata interest in the Fund, but votes separately on class-specific matters and (as noted below) is subject to different expenses. Realized and unrealized gai ns and losses are allocated daily to each class of shares based on the relative net assets of each class to the total net assets of the Fund. Net investment income, other than class-specific expenses, is allocated daily to each class of shares based upon the ratio of the value of each class’s paid shares to the total value of all paid shares. Each class of shares differs in its distribution plan and certain other class-specific expenses.
The following is a summary of significant accounting policies of the Funds. The policies are in conformity with accounting principles generally accepted in the United States of America.
A Investment Valuation — Municipal bonds and taxable obligations, if any, are generally valued on the basis of valuations furnished by a pricing service. Financial futures contracts and options on financial futures contracts listed on commodity exchanges are valued at closing settlement prices. Interest rate swaps are generally valued on the basis of valuations furnished by a pricing service. Short-term obligations, maturing in sixty days or less, are valued at amortized cost, which approximates market value. Investments for which valuations or market quotations are not readily available, and investments for which the price of a security is not believed to represent its fair market value, are valued at fair value using methods determined in good faith by or at the direction of the Trustees.
B Investment Transactions and Related Income — Investment transactions for financial statement purposes are accounted for on a trade date basis. Realized gains and losses on investments sold are determined on the basis of identified cost. Interest income is recorded on the basis of interest accrued, adjusted for amortization of premium or accretion of discount.
C Federal Taxes — Each Fund’s policy is to comply with the provisions of the Internal Revenue Code applicable to regulated investment companies and to distribute to shareholders each year substantially all of its taxable, if any, and tax-exempt net investment income, and all or substantially all of its net realized capital gains. Accordingly, no provision for federal income or excise tax is necessary. Each Fund intends to satisfy conditions which will enable it to designate distributions from the interest income generated by its investments in municipal obligations, which are exempt from regular federal income taxes when received by each Fund, as exempt-interest dividends. The portion of such interest, if any, earned on private activity bonds issued after August 7, 198 6, may be considered a tax preference item to shareholders.
At September 30, 2007, the following Funds, for federal income tax purposes, had capital loss carryforwards which will reduce each Fund’s taxable income arising from future net realized gains on investment transactions, if any, to the extent permitted by the Internal Revenue Code, and thus will reduce the amount of distributions to shareholders which would otherwise be necessary to relieve the Funds of any liability for federal income or
83
Eaton Vance Municipals Funds a s o f S e p t e m b e r 3 0 , 2 0 0 7
N O T E S T O F I N A N C I A L S T A T E M E N T S C O N T ’ D |
excise tax. The amounts and expiration dates of the capital loss carryforwards are as follows:
| Fund | | Amount | | Expiration Date |
| Florida | | $4,180,059 | | September 30, 2013 |
| Massachusetts | | 856,779 | | September 30, 2010 |
| | | 1,430,573 | | September 30, 2011 |
| | | 355,911 | | September 30, 2012 |
| | | 1,751,809 | | September 30, 2013 |
| | | 440,164 | | September 30, 2015 |
| Mississippi | | 198,316 | | September 30, 2013 |
| New York | | 108,787 | | September 30, 2015 |
| Ohio | | 5,839,721 | | September 30, 2011 |
| | | 1,709,089 | | September 30, 2013 |
| Rhode Island | | 384,824 | | September 30, 2013 |
| West Virginia | | 529,815 | | September 30, 2013 |
During the year ended September 30, 2007, capital loss carryforwards of $2,531,757, $112,417, $1,558,592, $388,999 and $380,805 were utilized to offset net realized gains by the Florida Fund, Mississippi Fund, Ohio Fund, Rhode Island Fund and West Virginia Fund, respectively.
Additionally, at September 30, 2007, the New York Fund had net capital losses of $625,132 attributable to security transactions incurred after October 31, 2006. These capital losses are treated as arising on the first day of the Fund’s taxable year ending September 30, 2008.
D Expenses — The majority of expenses of the Trust are directly identifiable to an individual fund. Expenses which are not readily identifiable to a specific fund are allocated taking into consideration, among other things, the nature and type of expense and the relative size of the funds.
E Expense Reduction — State Street Bank and Trust Company (SSBT) serves as custodian of the Funds. Pursuant to the respective custodian agreements, SSBT receives a fee reduced by credits, which are determined based on the average daily cash balance each Fund maintains with SSBT. All credit balances, if any, used to reduce each Fund’s custodian fees are reported as a reduction of expenses in the Statements of Operations.
F Legal Fees — Legal fees and other related expenses incurred as part of negotiations of the terms and requirement of capital infusions, or that are expected to result in the restructuring of, or a plan of reorganization for, an investment are recorded as realized losses. Ongoing expenditures to protect or enhance an investment are treated as operating expenses.
G Use of Estimates — The preparation of the financial statements in conformity with accounting principles generally accepted in the United States of America requires management to make estimates and assumptions that affect the reported amounts of assets and liabilities at the date of the financial statements and the reported amounts of income and expense during the reporting period. Actual results could differ from those estimates.
H Indemnifications — Under the Trust’s organizational documents, its officers and Trustees may be indemnified against certain liabilities and expenses arising out of the performance of their duties to the Funds, and shareholders are indemnified against personal liability for obligations of the Trust. Additionally, in the normal course of business, each Fund enters into agreements with service providers that may contain indemnification clauses. Each Fund’s maximum exposure under these arrangements is unknown as this would involve future claims that may be made against each Fund that have not yet occurred.
I Floating Rate Notes Issued in Conjunction with Securities Held — The Funds may invest in inverse floating rate securities, whereby a Fund may sell a fixed rate bond to a broker for cash. At the same time, the Fund buys a residual interest in the assets and cash flows of a Special Purpose Vehicle (which is generally organized as a trust), (the SPV) set up by the broker, often referred to as an inverse floating rate obligation (Inverse Floater). The broker deposits a fixed rate bond into the SPV with the same CUSIP number as the fixed rate bond sold to the broker by the Fund, and which may have been, but is not r equired to be, the fixed rate bond purchased from the Fund (the Fixed Rate Bond). The SPV also issues floating rate notes (Floating Rate Notes) which are sold to third-parties. The Funds may enter into shortfall and forbearance agreements with the broker by which a Fund agrees to reimburse the broker, in certain circumstances, for the difference between the liquidation value of the Fixed Rate Bond held by the SPV and the liquidation value of the Floating Rate Notes, as well as any shortfalls in interest cash flows. The Inverse Floater held by a Fund gives the Fund the right (1) to cause the holders of the Floating Rate Notes to tender their notes at par, and (2) to have the broker transfer the Fixed Rate Bond held by the SPV to the Fund, thereby collapsing the SPV. Pursuant to Financial Accounting Standards Board (FASB) Statement No. 140, “Accounting for Transfers and Servicing of Financial Assets and Extinguishment of Liabilities” (FAS 140), the Funds account for the transaction described above as a secured borrowing by including the Fixed Rate Bond in their Portfolio of Investments, and the Floating Rate Notes as a liability under the caption “Payable
84
Eaton Vance Municipals Funds a s o f S e p t e m b e r 3 0 , 2 0 0 7
N O T E S T O F I N A N C I A L S T A T E M E N T S C O N T ’ D |
for floating rate notes issued” in their Statement of Assets and Liabilities. The Floating Rate Notes have interest rates that generally reset weekly and their holders have the option to tender their notes to the broker for redemption at par at each reset date. Interest expense related to the Funds’ liability with respect to Floating Rate Notes is recorded as incurred. At September 30, 2007, the amounts of the Funds’ Floating Rate Notes and related interest rates and collateral were as follows:
| | | | | | | Collateral for |
| | | Floating Rate | | Interest Rate | | Floating Rate |
| | | Notes | | or Range of | | Notes |
| Fund | | Outstanding | | Interest Rates | | Outstanding |
| California | | $23,875,000 | | 3.82% – 3.90% | | $37,028,996 |
| Florida | | 37,745,000 | | 3.88% – 3.98% | | 62,766,047 |
| Massachusetts | | 22,606,500 | | 3.85% – 3.95% | | 37,794,370 |
| Mississippi | | 930,000 | | 3.85% – 3.91% | | 1,534,178 |
| New York | | 52,363,000 | | 3.84% – 3.99% | | 83,304,254 |
| Ohio | | 27,120,000 | | 3.85% – 3.93% | | 42,892,477 |
| Rhode Island | | 3,795,000 | | 3.85% – 3.95% | | 6,446,171 |
| West Virginia | | 2,000,000 | | 3.85% – 3.88% | | 3,157,548 |
The Funds’ investment policies and restrictions expressly permit investments in Inverse Floaters. Inverse floating rate securities typically offer the potential for yields exceeding the yields available on fixed rate bonds with comparable credit quality and maturity. The Funds’ investment policies do not allow the Funds to borrow money for purposes of making investments. Management believes that the Funds’ restrictions on borrowings do not apply to the secured borrowings deemed to have occurred for accounting purposes pursuant to FAS 140, which is distinct from a legal borrowing of the Funds to which the policies apply. Inverse Floaters held by the Funds are securities exempt from registration under Rule 144A of the Securities Act of 1933.
J Financial Futures Contracts — The Funds may enter into financial futures contracts. The Funds’ investment in financial futures contracts is designed for hedging against changes in interest rates or as a substitute for the purchase of securities. Upon entering into a financial futures contract, a Fund is required to deposit with the broker, either in cash or securities an amount equal to a certain percentage of the purchase price (initial margin). Subsequent payments, known as variation margin, are made or received by the Fund each business day, depending on the daily fluctuations in the value of the underlying security, and are recorded as unrealized gains or losses by the Fund. Gains (losses) are realized upon the expiration or closing of the financial futures contracts. Should market conditions change unexpectedly, t he Fund may not achieve the anticipated benefits of the financial futures contracts and may realize a loss. In entering such contracts, the Fund bears the risk if the counterparties do not perform under the contracts’ terms.
K Interest Rate Swaps — A Fund may enter into interest rate swap agreements to enhance return, to hedge against fluctuations in securities prices or interest rates, or as substitution for the purchase or sale of securities. Pursuant to these agreements, a Fund makes periodic payments at a fixed interest rate and, in exchange, receives payments based on the interest rate of a benchmark industry index. During the term of the outstanding swap agreement, changes in the underlying value of the swap are recorded as unrealized gains or losses. The value of the swap is determined by changes in the relationship between two rates of interest. A Fund is exposed to credit loss in the event of non-performance by the swap counterparty. Risk may also arise from movements in interest rates.
L When-Issued Securities and Delayed Delivery Transactions — The Funds may purchase or sell securities on a delayed delivery or when-issued basis. Payment and delivery may take place after the customary settlement period for that security. At the time the transaction is negotiated, the price of the security that will be delivered is fixed. The Funds maintain security positions for these commitments such that sufficient liquid assets will be available to make payments upon settlement. Securities purchased on a delayed delivery or when-issued basis are marked-to-market daily and begin earning interest on settlement date. Losses may arise due to changes in the market value of the underlying securities or if the counterpar ty does not perform under the contract.
M Statement of Cash Flows — The cash amount shown in the Statement of Cash Flows of a Fund is the amount included in the Fund’s Statement of Assets and Liabilities and represents cash on hand at its custodian and does not include any short-term investments.
2 Distributions to Shareholders
The net income of each Fund is determined daily and substantially all of the net income so determined is declared as a dividend to shareholders of record at the time of declaration. Distributions are declared separately for each class of shares. Distributions are paid monthly. Distributions of realized capital gains, if any, are made at least annually. Shareholders may reinvest income and
85
Eaton Vance Municipals Funds a s o f S e p t e m b e r 3 0 , 2 0 0 7
N O T E S T O F I N A N C I A L S T A T E M E N T S C O N T ’ D |
capital gain distributions in additional shares of the same class of a Fund at the net asset value as of the reinvestment date. Distributions are paid in the form of additional shares of the same class or, at the election of the shareholder, in cash. The Funds distinguish between distributions on a tax basis and a financial reporting basis. Accounting principles generally accepted in the United States of America require that only distributions in excess of tax basis earnings and profits be reported in the financial statements as a return of capital. Permanent differences between book and tax accounting relating to distributions are reclassified to paid-in capital.
The tax character of distributions paid for the years ended September 30, 2007 and September 30, 2006 was as follows:
| Year Ended | | | | | | | | | | | | | | | | |
| September 30, | | | | | | | | | | | | | | | | |
| 2007 | | California | | Florida | | Massachusetts | | Mississippi |
| Distributions | | | | | | | | | | | | | | | | |
| declared from: | | | | | | | | | | | | | | | | |
| Tax-exempt | | | | | | | | | | | | | | | | |
| income | | $ 11,105,078 | | $ 11,096,447 | | $ 12,342,720 | | $ 744,103 |
| Ordinary income | | $ | | 77,788 | | $ | | 560 | | $ | | 2,855 | | $ | | 5,772 |
| Long-term | | | | | | | | | | | | | | | | |
| capital gains | | $ 4,013,167 | | $ | | — | | $ | | — | | $ | | — |
| |
| Year Ended | | | | | | | | | | | | | | | | |
| September 30, | | | | | | | | | | | | | | | | |
| 2007 | | New York | | Ohio | | Rhode Island | | West Virginia |
| Distributions | | | | | | | | | | | | | | | | |
| declared from: | | | | | | | | | | | | | | | | |
| Tax-exempt | | | | | | | | | | | | | | | | |
| income | | $ 18,685,280 | | $ 11,439,718 | | $ 2,420,132 | | $ 1,230,659 |
| Ordinary income | | $ | | — | | $ | | 106,473 | | $ | | — | | $ | | — |
| Long-term | | | | | | | | | | | | | | | | |
| capital gains | | $ | | 1,982,319 | | $ | | — | | $ | | — | | $ | | — |
| Short-term | | | | | | | | | | | | | | | | |
| capital gains | | $ | | 137,809 | | $ | | — | | $ | | — | | $ | | — |
| Year Ended | | | | | | | | | | | | | | | | |
| September 30, | | | | | | | | | | | | | | | | |
| 2006 | | California | | Florida | | Massachusetts | | Mississippi |
| Distributions | | | | | | | | | | | | | | | | |
| declared from: | | | | | | | | | | | | | | | | |
| Tax-exempt | | | | | | | | | | | | | | | | |
| income | | $ 10,215,813 | | $ 10,901,178 | | $ 10,291,224 | | $ 768,015 |
| Ordinary income | | $ | | — | | $ | | 48,048 | | $ | | — | | $ | | 4,034 |
| |
| Year Ended | | | | | | | | | | | | | | | | |
| September 30, | | | | | | | | | | | | | | | | |
| 2006 | | New York | | Ohio | | Rhode Island | | West Virginia |
| Distributions | | | | | | | | | | | | | | | | |
| declared from: | | | | | | | | | | | | | | | | |
| Tax-exempt | | | | | | | | | | | | | | | | |
| income | | $ 16,862,793 | | $ | | 8,486,588 | | $ 2,151,704 | | $ 1,163,089 |
| Ordinary income | | $ | | 24,477 | | $ | | 2,787 | | $ | | 9,148 | | $ | | — |
| Long-term | | | | | | | | | | | | | | | | |
| capital gains | | $ | | 4,153,081 | | $ | | — | | $ | | — | | $ | | — |
During the year ended September 30, 2007, the following amounts were reclassified due to differences between book and tax accounting, primarily for accretion of market discount:
| | | California | | Florida | | Massachusetts | | Mississippi |
| Increase (decrease): | | | | | | | | | | |
| Accumulated net | | | | | | | | | | |
| realized gain (loss) | | $ 29,203 | | $ 71,650 | | $ 61,236 | | $ | | (397) |
| Accumulated | | | | | | | | | | |
| undistributed | | | | | | | | | | |
| net investment | | | | | | | | | | |
| income | | $(29,203) | | $(71,650) | | $(61,236) | | $ | | 397 |
| |
| | | New York | | Ohio | | Rhode Island | | West Virginia |
| Increase (decrease): | | | | | | | | | | |
| Accumulated net | | | | | | | | | | |
| realized gain (loss) | | $ 184,545 | | $(66,195) | | $ 11,296 | | $ 18,388 |
| Accumulated | | | | | | | | | | |
| undistributed | | | | | | | | | | |
| net investment | | | | | | | | | | |
| income | | $(184,545) | | $ 66,195 | | $(11,296) | | $(18,388) |
These reclassifications had no effect on the net assets or net asset value per share of the Funds.
86
Eaton Vance Municipals Funds a s o f S e p t e m b e r 3 0 , 2 0 0 7
N O T E S T O F I N A N C I A L S T A T E M E N T S C O N T ’ D |
As of September 30, 2007, the components of distributable earnings (accumulated losses) and unrealized appreciation (depreciation) on a tax basis were as follows:
| | | California | | Florida | | Massachusetts | | Mississippi |
| Undistributed | | | | | | | | | | | | | | | | | | |
| income | | $ | | 244,370 | | $ | | 1,588,844 | | $ | | | | 87,841 | | $ | | 662 |
| Undistributed | | | | | | | | | | | | | | | | | | |
| long-term | | | | | | | | | | | | | | | | | | |
| capital gains | | $ 1,213,908 | | $ | | — | | $ | | | | — | | $ | | — |
| Capital loss | | | | | | | | | | | | | | | | | | |
| carryforwards | | $ | | — | | $ (4,180,059) | | $ | | (4,835,236) | | $ (198,316) |
| Unrealized | | | | | | | | | | | | | | | | | | |
| appreciation | | | | | | | | | | | | | | | | | | |
| (depreciation) | | $ 15,028,678 | | $ 15,966,620 | | $ | | 10,994,266 | | $ 874,998 |
| Other temporary | | | | | | | | | | | | | | | | | | |
| differences | | $ | | (378,161) | | $ | | (385,458) | | $ | | | | (456,612) | | $ | | (25,336) |
| |
| | | New York | | | | Ohio | | | | Rhode Island | | West Virginia |
| Undistributed | | | | | | | | | | | | | | | | | | |
| income | | $ | | 291,911 | | $ 70,090 | | | | $ | | 26,276 | | $ | | 2,304 |
| Capital loss | | | | | | | | | | | | | | | | | | |
| carryforwards and | | | | | | | | | | | | | | | | |
| post-October | | | | | | | | | | | | | | | | | | |
| losses | | $ | | (733,919) | | $ (7,548,810) | | $ | | (384,824) | | $ (529,815) |
| Unrealized | | | | | | | | | | | | | | | | | | |
| appreciation | | | | | | | | | | | | | | | | | | |
| (depreciation) | | $ 21,936,733 | | $ 8,200,247 | | $ 1,753,925 | | $ 964,603 |
| Other temporary | | | | | | | | | | | | | | | | | | |
| differences | | $ | | (575,542) | | $ (413,981) | | $ | | (86,947) | | $ (39,484) |
The differences between components of distributable earnings (accumulated losses) on a tax basis and the amounts reflected in the Statements of Assets and Liabilities are primarily due to wash sales, tax straddle accounting, dividends payable, and differences between book and tax accounting for futures contracts, accretion of market discount and inverse floaters.
3 Investment Adviser Fee and Other Transactions with Affiliates
The investment adviser fee is earned by Boston Management and Research (BMR), a subsidiary of Eaton Vance Management (EVM), as compensation for management and investment advisory services rendered to each Fund. The fee is based upon a percentage of average daily net assets plus a percentage of gross income (i.e., income other than gains from the sale of securities) and is payable monthly. In addition, pursuant to a voluntary expense reimbursement, BMR was allocated certain operating expenses. For the year ended September 30, 2007, advisory fees incurred by the Funds and the effective annual rates, as a percentage of average daily net assets, and expenses allocated to BMR, were as follows:
| | | Investment | | Effective | | Expenses |
| | | Adviser | | Annual | | Allocated |
| Fund | | Fee | | Rate | | to BMR |
| California | | $1,198,210 | | 0.45% | | $5,358 |
| Florida | | 1,073,101 | | 0.42% | | 5,358 |
| Massachusetts | | 1,246,654 | | 0.42% | | 6,611 |
| Mississippi | | 27,854 | | 0.15% | | 3,687 |
| New York | | 1,901,120 | | 0.43% | | 7,863 |
| Ohio | | 1,182,720 | | 0.41% | | 4,523 |
| Rhode Island | | 185,604 | | 0.30% | | 5,358 |
| West Virginia | | 63,083 | | 0.20% | | 3,688 |
EVM serves as the Administrator of each Fund, but receives no compensation. EVM serves as the sub-transfer agent of each Fund and receives from the transfer agent an aggregate fee based upon the actual expenses incurred by EVM in the performance of these services. Eaton Vance Distributors, Inc. (EVD), the Funds’ principal underwriter and a subsidiary of EVM, receives a portion of the sales charge on sales of Class A shares of the Funds. EVD also receives distribution and service fees from Class A, Class B and Class C shares (see Note 4) and contingent deferred sales charges (see Note 5). Sub-transfer agent fees earned by EVM and Class A sales charges that the Funds were informed were received by EVD for the year ended September 30, 2007 were as follows:
| | | | | | | EVD’s |
| | | Sub-Transfer | | Class A |
| Fund | | Agent Fees | | Sales Charges |
| California | | | | $5,410 | | $ 20,620 |
| Florida | | | | 5,930 | | 17,895 |
| Massachusetts | | | | 7,482 | | 71,133 |
| Mississippi | | | | 601 | | 1,907 |
| New York | | 10,505 | | 46,472 |
| Ohio | | | | 7,871 | | 109,867 |
| Rhode Island | | | | 1,740 | | 8,968 |
| West Virginia | | | | 1,134 | | 10,085 |
87
Eaton Vance Municipals Funds a s o f S e p t e m b e r 3 0 , 2 0 0 7
N O T E S T O F I N A N C I A L S T A T E M E N T S C O N T ’ D |
Except for Trustees of the Funds who are not members of EVM’s or BMR’s organizations, officers and Trustees receive remuneration for their services to the Funds out of the investment advisory fee. Trustees of the Funds who are not affiliated with the investment adviser may elect to defer receipt of all or a percentage of their annual fees in accordance with the terms of the Trustee Deferred Compensation Plan. For the year ended September 30, 2007, no significant amounts have been deferred. Certain officers and Trustees of the Funds are officers of the above organizations.
4 Distribution Plans
Each Fund has in effect a distribution plan for Class A shares (Class A Plan) pursuant to Rule 12b-1 under the 1940 Act. The Class A Plan provides that each Fund will pay EVD a distribution and service fee not exceeding 0.25% per annum of its average daily net assets attributable to Class A shares for distribution services and facilities provided to each Fund by EVD, as well as for personal services and/or the maintenance of shareholder accounts. The Trustees approved distribution and service fee payments equal to 0.20%, (0.25% for California Fund) per annum of each Fund’s average daily net assets attributable to Class A shares. Distribution and service fees paid or accrued to EVD for the year ended September 30, 2007 for Class A shares amounted to the following:
| | | Class A |
| | | Distribution and |
| Fund | | Service Fees |
| California | | $633,506 |
| Florida | | 443,613 |
| Massachusetts | | 450,062 |
| Mississippi | | 29,916 |
| New York | | 811,049 |
| Ohio | | 465,766 |
| Rhode Island | | 86,847 |
| West Virginia | | 49,719 |
Each Fund also has in effect distribution plans for Class B shares (Class B Plan) and Class C shares (Class C Plan) pursuant to Rule 12b-1 under the 1940 Act. The Class B and Class C Plans require each Fund to pay EVD amounts equal to 0.75% per annum of its average daily net assets attributable to Class B and Class C shares for providing ongoing distribution services and facilities to the respective Funds. Each Fund will automatically discontinue payments to EVD during any period in which there are no outstanding Uncovered Distribution
Charges, which are equivalent to the sum of (i) 5% and 6.25% of the aggregate amount received by each Fund for Class B and Class C shares sold, respectively, plus (ii) interest calculated by applying the rate of 1% over the prevailing prime rate to the outstanding balance of Uncovered Distribution Charges of EVD of each respective class, reduced by the aggregate amount of contingent deferred sales charges (see Note 5) and amounts theretofore paid or payable to EVD by each respective class. For the year ended September 30, 2007, the Funds paid or accrued to EVD the following distribution fees, each representing 0.75% of the average daily net assets for Class B and Class C shares:
| | | Class B | | Class C |
| Fund | | Distribution Fees | | Distribution Fees |
| California | | $ 29,837 | | $ 62,844 |
| Florida | | 230,199 | | 13,505 |
| Massachusetts | | 336,336 | | 84,477 |
| Mississippi | | 26,343 | | — |
| New York | | 81,497 | | 171,239 |
| Ohio | | 233,619 | | 157,392 |
| Rhode Island | | 121,427 | | 14,858 |
| West Virginia | | 48,633 | | — |
At September 30, 2007, the amounts of Uncovered Distribution Charges of EVD calculated under the Plans for Class B and Class C shares were approximately as follows:
| Fund | | | | Class B | | | | Class C |
| California | | $ | | 68,000 | | $ | | 654,000 |
| Florida | | | | 660,000 | | | | 168,000 |
| Massachusetts | | | | 455,000 | | | | 1,166,000 |
| Mississippi | | | | 495,000 | | | | — |
| New York | | | | 352,000 | | | | 1,898,000 |
| Ohio | | | | 78,000 | | | | 2,005,000 |
| Rhode Island | | | | 1,030,000 | | | | 209,000 |
| West Virginia | | | | 549,000 | | | | — |
The Class B and Class C Plans also authorize the Funds to make payments of service fees to EVD, investment dealers and other persons in amounts not exceeding 0.25% per annum of the average daily net assets attributable to that Class. The Trustees approved service fee payments equal to 0.20% (0.25% for California Fund) per annum of each Fund’s average daily net assets attributable to Class B and Class C shares. Service fees paid or accrued are for personal services and/or the
88
Eaton Vance Municipals Funds a s o f S e p t e m b e r 3 0 , 2 0 0 7
N O T E S T O F I N A N C I A L S T A T E M E N T S C O N T ’ D |
maintenance of shareholder accounts. They are separate and distinct from the Class B and Class C sales commissions and distribution fees and, as such, are not subject to automatic discontinuance when there are no outstanding Uncovered Distribution Charges of EVD. Service fees paid or accrued for the year ended September 30, 2007 amounted to the following:
| | | Class B | | Class C |
| Fund | | Service Fees | | Service Fees |
| California | | $ 9,946 | | $20,948 |
| Florida | | 61,386 | | 3,601 |
| Massachusetts | | 89,690 | | 22,520 |
| Mississippi | | 7,025 | | — |
| New York | | 21,732 | | 45,664 |
| Ohio | | 62,298 | | 41,971 |
| Rhode Island | | 32,380 | | 3,962 |
| West Virginia | | 12,969 | | — |
5 Contingent Deferred Sales Charges
A contingent deferred sales charge (CDSC) generally is imposed on redemptions of Class B shares made within six years of purchase and on redemptions of Class C shares within one year of purchase. Class A shares may be subject to a 1% CDSC if redeemed within eighteen months of purchase (depending upon the circumstances of purchase) or a 1% or 0.50% CDSC if redeemed within one year or two years, respectively, on purchases through the Eaton Vance Supplemental Retirement Account. Generally, the CDSC is based upon the lower of the net asset value at date of redemption or date of purchase. No charge is levied on shares acquired by reinvestment of dividends or capital gains distributions. The CDSC for Class B shares is imposed at declining rates that begin at 5% in the case of redemptions in the first and second year after purchase, declining one percentage point each subsequent year. Class C shares are subjec t to a 1% CDSC if redeemed within one year of purchase. No CDSC is levied on shares which have been sold to EVM or its affiliates or to their respective employees or clients and may be waived under certain other limited conditions. CDSCs received on Class B and Class C redemptions are paid to EVD to reduce the amount of Uncovered Distribution Charges calculated under each Fund’s Class B and Class C Plans. CDSCs received on Class B and Class C redemptions when no Uncovered Distribution Charges exist will be credited to each Fund. For the year ended September 30, 2007, the Funds were informed that EVD received approximately the following amounts of CDSC paid by Class A, Class B and Class C shareholders:
| Fund | | Class A | | Class B | | Class C |
| California | | $19,000 | | $24,000 | | $ 1,000 |
| Florida | | 8,000 | | 68,000 | | 2,000 |
| Massachusetts | | 3,000 | | 77,000 | | 7,000 |
| Mississippi | | — | | 7,000 | | — |
| New York | | 11,000 | | 19,000 | | 14,000 |
| Ohio | | 21,000 | | 68,000 | | 10,000 |
| Rhode Island | | 500 | | 40,000 | | 300 |
| West Virginia | | 2,000 | | 8,000 | | — |
6 Purchases and Sales of Investments
Purchases and sales of investments, other than short-term obligations, for the year ended September 30, 2007 were as follows:
| Fund | | Purchases | | Sales |
| California | | $159,743,818 | | $116,845,246 |
| Florida | | 53,609,907 | | 63,553,190 |
| Massachusetts | | 268,529,058 | | 211,963,979 |
| Mississippi | | 3,094,846 | | 5,360,378 |
| New York | | 202,831,864 | | 169,799,112 |
| Ohio | | 237,058,077 | | 118,253,438 |
| Rhode Island | | 14,243,358 | | 9,124,173 |
| West Virginia | | 12,301,712 | | 10,245,264 |
7 Shares of Beneficial Interest
Each Fund’s Declaration of Trust permits the Trustees to issue an unlimited number of full and fractional shares of beneficial interest (without par value). Such shares may be issued in a number of different series (such as the Funds) and classes. Transactions in Fund shares were as follows:
| California Fund | | | | |
| | | Year Ended | | Year Ended |
| Class A | | September 30, 2007 | | September 30, 2006 |
| Sales | | 6,320,582 | | 2,923,207 |
| Issued to shareholders electing to | | | | |
| receive payments of distributions | | |
| in Fund shares | | 816,466 | | 501,288 |
| Redemptions | | (3,617,907) | | (2,858,517) |
| Exchange from Class B shares | | 5,405 | | 10,952 |
| Net increase | | 3,524,546 | | 576,930 |
89
Eaton Vance Municipals Funds a s o f S e p t e m b e r 3 0 , 2 0 0 7
N O T E S T O F I N A N C I A L S T A T E M E N T S C O N T ’ D |
| California Fund (continued) | | | | |
| | | Year Ended | | Year Ended |
| Class B | | September 30, 2007 | | September 30, 2006 |
| Sales | | 80,771 | | 130,196 |
| Issued to shareholders electing to | | | | |
| receive payments of distributions | | |
| in Fund shares | | 11,353 | | 6,864 |
| Redemptions | | (123,820) | | (88,682) |
| Exchange to Class A shares | | (5,842) | | (11,829) |
| Net increase (decrease) | | (37,538) | | 36,549 |
| |
| | | Year Ended | | Year Ended |
| Class C | | September 30, 2007 | | September 30, 2006 |
| Sales | | 769,547 | | 353,834 |
| Issued to shareholders electing to | | | | |
| receive payments of distributions | | |
| in Fund shares | | 26,830 | | 7,759 |
| Redemptions | | (109,387) | | (51,450) |
| Net increase | | 686,990 | | 310,143 |
| |
| Florida Fund | | | | |
| | | Year Ended | | Year Ended |
| Class A | | September 30, 2007 | | September 30, 2006 |
| Sales | | 2,063,137 | | 4,655,592 |
| Issued to shareholders electing to | | | | |
| receive payments of distributions | | |
| in Fund shares | | 531,195 | | 483,287 |
| Redemptions | | (3,399,643) | | (3,449,888) |
| Exchange from Class B shares | | 397,602 | | 390,471 |
| Net increase (decrease) | | (407,709) | | 2,079,462 |
| |
| | | Year Ended | | Year Ended |
| Class B | | September 30, 2007 | | September 30, 2006 |
| Sales | | 77,019 | | 207,293 |
| Issued to shareholders electing to | | | | |
| receive payments of distributions | | |
| in Fund shares | | 46,163 | | 62,917 |
| Redemptions | | (597,112) | | (502,195) |
| Exchange to Class A shares | | (387,879) | | (380,876) |
| Net decrease | | (861,809) | | (612,861) |
| | | Year Ended | | Year Ended |
| Class C | | September 30, 2007 | | September 30, 2006(1) |
| Sales | | 244,226 | | 61,121 |
| Issued to shareholders electing to | | | | |
| receive payments of distributions | | |
| in Fund shares | | 3,206 | | 136 |
| Redemptions | | (33,403) | | (3,214) |
| Net increase | | 214,029 | | 58,043 |
| |
| Massachusetts Fund | | | | |
| | | Year Ended | | Year Ended |
| Class A | | September 30, 2007 | | September 30, 2006 |
| Sales | | 10,627,746 | | 5,947,826 |
| Issued to shareholders electing to | | | | |
| receive payments of distributions | | |
| in Fund shares | | 573,319 | | 407,730 |
| Redemptions | | (4,794,400) | | (2,855,747) |
| Exchange from Class B shares | | 328,056 | | 383,209 |
| Net increase | | 6,734,721 | | 3,883,018 |
| |
| | | Year Ended | | Year Ended |
| Class B | | September 30, 2007 | | September 30, 2006 |
| Sales | | 209,906 | | 258,255 |
| Issued to shareholders electing to | | | | |
| receive payments of distributions | | |
| in Fund shares | | 89,323 | | 110,071 |
| Redemptions | | (632,614) | | (671,372) |
| Exchange to Class A shares | | (328,043) | | (381,152) |
| Net decrease | | (661,428) | | (684,198) |
| |
| | | Year Ended | | Year Ended |
| Class C | | September 30, 2007 | | September 30, 2006(2) |
| Sales | | 1,710,911 | | 296,719 |
| Issued to shareholders electing to | | | | |
| receive payments of distributions | | |
| in Fund shares | | 32,159 | | 858 |
| Redemptions | | (178,505) | | (10,627) |
| Net increase | | 1,564,565 | | 286,950 |
90
Eaton Vance Municipals Funds a s o f S e p t e m b e r 3 0 , 2 0 0 7
N O T E S T O F I N A N C I A L S T A T E M E N T S C O N T ’ D |
| Massachusetts Fund (continued) | | |
| | | Year Ended | | Year Ended |
| Class I | | September 30, 2007 | | September 30, 2006 |
| Sales | | 557,977 | | 214,943 |
| Issued to shareholders electing to | | | | |
| receive payments of distributions | | |
| in Fund shares | | 24,293 | | 17,153 |
| Redemptions | | (162,657) | | (99,575) |
| Net increase | | 419,613 | | 132,521 |
| |
| Mississippi Fund | | | | |
| | | Year Ended | | Year Ended |
| Class A | | September 30, 2007 | | September 30, 2006 |
| Sales | | 179,598 | | 355,323 |
| Issued to shareholders electing to | | | | |
| receive payments of distributions | | |
| in Fund shares | | 32,600 | | 27,750 |
| Redemptions | | (342,866) | | (202,461) |
| Exchange from Class B shares | | 100,556 | | 40,983 |
| Net increase (decrease) | | (30,112) | | 221,595 |
| |
| | | Year Ended | | Year Ended |
| Class B | | September 30, 2007 | | September 30, 2006 |
| Sales | | 15,944 | | 8,576 |
| Issued to shareholders electing to | | | | |
| receive payments of distributions | | |
| in Fund shares | | 6,178 | | 8,526 |
| Redemptions | | (66,234) | | (103,928) |
| Exchange to Class A shares | | (98,224) | | (40,062) |
| Net decrease | | (142,336) | | (126,888) |
| |
| New York Fund | | | | |
| | | Year Ended | | Year Ended |
| Class A | | September 30, 2007 | | September 30, 2006 |
| Sales | | 5,983,066 | | 6,415,756 |
| Issued to shareholders electing to | | | | |
| receive payments of distributions | | |
| in Fund shares | | 1,159,942 | | 1,276,111 |
| Redemptions | | (5,297,544) | | (4,514,572) |
| Exchange from Class B shares | | 66,596 | | 8,667 |
| Net increase | | 1,912,060 | | 3,185,962 |
| | | Year Ended | | Year Ended |
| Class B | | September 30, 2007 | | September 30, 2006 |
| Sales | | 357,406 | | 392,545 |
| Issued to shareholders electing to | | | | |
| receive payments of distributions | | |
| in Fund shares | | 24,667 | | 21,695 |
| Redemptions | | (99,087) | | (102,685) |
| Exchange to Class A shares | | (66,449) | | (8,265) |
| Net increase | | 216,537 | | 303,290 |
| |
| | | Year Ended | | Year Ended |
| Class C | | September 30, 2007 | | September 30, 2006 |
| Sales | | 1,995,542 | | 961,161 |
| Issued to shareholders electing to | | | | |
| receive payments of distributions | | |
| in Fund shares | | 54,744 | | 23,257 |
| Redemptions | | (349,920) | | (132,016) |
| Net increase | | 1,700,366 | | 852,402 |
| |
| Ohio Fund | | | | |
| | | Year Ended | | Year Ended |
| Class A | | September 30, 2007 | | September 30, 2006 |
| Sales | | 12,315,012 | | 5,285,759 |
| Issued to shareholders electing to | | | | |
| receive payments of distributions | | |
| in Fund shares | | 625,675 | | 439,242 |
| Redemptions | | (2,943,015) | | (1,649,373) |
| Exchange from Class B shares | | 408,584 | | 206,014 |
| Net increase | | 10,406,256 | | 4,281,642 |
| |
| | | Year Ended | | Year Ended |
| Class B | | September 30, 2007 | | September 30, 2006 |
| Sales | | 386,530 | | 378,311 |
| Issued to shareholders electing to | | | | |
| receive payments of distributions | | |
| in Fund shares | | 63,054 | | 70,353 |
| Redemptions | | (384,207) | | (477,282) |
| Exchange to Class A shares | | (408,603) | | (205,711) |
| Net decrease | | (343,226) | | (234,329) |
91
Eaton Vance Municipals Funds a s o f S e p t e m b e r 3 0 , 2 0 0 7
N O T E S T O F I N A N C I A L S T A T E M E N T S C O N T ’ D |
| Ohio Fund (continued) | | | | |
| | | Year Ended | | Year Ended |
| Class C | | September 30, 2007 | | September 30, 2006(3) |
| Sales | | 2,722,016 | | 914,054 |
| Issued to shareholders electing to | | | | |
| receive payments of distributions | | |
| in Fund shares | | 48,003 | | 5,388 |
| Redemptions | | (313,379) | | (40,771) |
| Net increase | | 2,456,640 | | 878,671 |
| |
| Rhode Island Fund | | | | |
| | | Year Ended | | Year Ended |
| Class A | | September 30, 2007 | | September 30, 2006 |
| Sales | | 1,080,629 | | 1,027,155 |
| Issued to shareholders electing to | | | | |
| receive payments of distributions | | |
| in Fund shares | | 104,753 | | 70,976 |
| Redemptions | | (610,471) | | (375,107) |
| Exchange from Class B shares | | 288,787 | | 214,473 |
| Net increase | | 863,698 | | 937,497 |
| |
| | | Year Ended | | Year Ended |
| Class B | | September 30, 2007 | | September 30, 2006 |
| Sales | | 82,892 | | 86,760 |
| Issued to shareholders electing to | | | | |
| receive payments of distributions | | |
| in Fund shares | | 34,062 | | 45,979 |
| Redemptions | | (257,356) | | (365,523) |
| Exchange to Class A shares | | (282,319) | | (209,611) |
| Net decrease | | (422,721) | | (442,395) |
| |
| | | Year Ended | | Year Ended |
| Class C | | September 30, 2007 | | September 30, 2006(4) |
| Sales | | 296,468 | | 42,251 |
| Issued to shareholders electing to | | | | |
| receive payments of distributions | | |
| in Fund shares | | 3,460 | | 180 |
| Redemptions | | (9,991) | | — |
| Net increase | | 289,937 | | 42,431 |
| West Virginia Fund | | | | |
| | | Year Ended | | Year Ended |
| Class A | | September 30, 2007 | | September 30, 2006 |
| Sales | | 540,963 | | 262,500 |
| Issued to shareholders electing to | | | | |
| receive payments of distributions | | |
| in Fund shares | | 63,524 | | 55,037 |
| Redemptions | | (306,467) | | (252,069) |
| Exchange from Class B shares | | 44,047 | | 66,082 |
| Net increase | | 342,067 | | 131,550 |
| |
| | | Year Ended | | Year Ended |
| Class B | | September 30, 2007 | | September 30, 2006 |
| Sales | | 20,491 | | 14,412 |
| Issued to shareholders electing to | | | | |
| receive payments of distributions | | |
| in Fund shares | | 13,462 | | 15,352 |
| Redemptions | | (74,169) | | (102,973) |
| Exchange to Class A shares | | (43,214) | | (64,802) |
| Net decrease | | (83,430) | | (138,011) |
| (1) | Class C of the Florida Fund commenced operations on March 13, 2006. |
| |
| (2) | Class C of the Massachusetts Fund commenced operations on May 2, 2006. |
| |
| (3) | Class C of the Ohio Fund commenced operations on February 3, 2006. |
| |
| (4) | Class C of the Rhode Island Fund commenced operations on March 20, 2006. |
| |
8 Federal Income Tax Basis of Unrealized Appreciation (Depreciation)
The cost and unrealized appreciation (depreciation) of investments by each Fund at September 30, 2007, as determined on a federal income tax basis, were as follows:
| California | | | | |
| Aggregate cost | | $ 259,344,503 |
| Gross unrealized appreciation | | $ | | 17,352,137 |
| Gross unrealized depreciation | | | | (2,377,788) |
| Net unrealized appreciation | | $ | | 14,974,349 |
92
Eaton Vance Municipals Funds a s o f S e p t e m b e r 3 0 , 2 0 0 7
N O T E S T O F I N A N C I A L S T A T E M E N T S C O N T ’ D |
| Florida | | | | |
| Aggregate cost | | $ 222,383,737 |
| Gross unrealized appreciation | | $ | | 17,768,076 |
| Gross unrealized depreciation | | | | (1,857,880) |
| Net unrealized appreciation | | $ | | 15,910,196 |
| |
| Massachusetts | | | | |
| Aggregate cost | | $ 320,151,797 |
| Gross unrealized appreciation | | $ | | 14,403,143 |
| Gross unrealized depreciation | | | | (3,468,991) |
| Net unrealized appreciation | | $ | | 10,934,152 |
| |
| Mississippi | | | | |
| Aggregate cost | | $ | | 16,123,064 |
| Gross unrealized appreciation | | $ | | 1,144,779 |
| Gross unrealized depreciation | | | | (285,699) |
| Net unrealized appreciation | | $ | | 859,080 |
| |
| New York | | | | |
| Aggregate cost | | $ 416,122,077 |
| Gross unrealized appreciation | | $ | | 25,222,677 |
| Gross unrealized depreciation | | | | (3,692,351) |
| Net unrealized appreciation | | $ | | 21,530,326 |
| |
| Ohio | | | | |
| Aggregate cost | | $ 324,284,401 |
| Gross unrealized appreciation | | $ | | 9,854,776 |
| Gross unrealized depreciation | | | | (1,678,838) |
| Net unrealized appreciation | | $ | | 8,175,938 |
| |
| Rhode Island | | | | |
| Aggregate cost | | $ | | 61,308,694 |
| Gross unrealized appreciation | | $ | | 2,419,513 |
| Gross unrealized depreciation | | | | (678,295) |
| Net unrealized appreciation | | $ | | 1,741,218 |
| |
| West Virginia | | | | |
| Aggregate cost | | $ | | 30,236,246 |
| Gross unrealized appreciation | | $ | | 1,339,955 |
| Gross unrealized depreciation | | | | (382,132) |
| Net unrealized appreciation | | $ | | 957,823 |
9 Line of Credit
The Funds participate with other portfolios and funds managed by EVM and its affiliates in a $200 million unsecured line of credit agreement with a group of banks. Borrowings will be made by the Funds solely to facilitate the handling of unusual and/or unanticipated short-term cash requirements. Interest is charged to each Fund based on its borrowings at an amount above either the Eurodollar rate or Federal Funds rate. In addition, a fee computed at an annual rate of 0.07% on the daily unused portion of the line of credit is allocated among the participating portfolios and funds at the end of each quarter. Average borrowings by the Mississippi Fund and the average interest rate for the year ended September 30, 2007 were $52,055 and 5.76%, respectively. Each of the other Funds did not have any significant borrowings or allocated fees during the year ended September 30, 2007.
10 Financial Instruments
The Funds may trade in financial instruments with off-balance sheet risk in the normal course of their investing activities to assist in managing exposure to various market risks. These financial instruments may include financial futures contracts and interest rate swaps and may involve, to a varying degree, elements of risk in excess of the amounts recognized for financial statement purposes. The notional or contractual amounts of these instruments represent the investment a Fund has in particular classes of financial instruments and does not necessarily represent the amounts potentially subject to risk. The measurement of the risks associated with these instruments is meaningful only when all related and offsetting transactions are considered.
A summary of obligations under these financial instruments at September 30, 2007 is as follows:
| Futures Contracts | | | | | | | | | | |
| | | | | | | | | | | | | Net |
| | | | | | | | | | | | | Unrealized |
| | | Expiration | | | | | | Aggregate | | | | Appreciation |
| Fund | | Date | | Contracts | | Position Cost | | Value | | (Depreciation) |
| |
| California | | 12/07 | | 236 | | | | | | | | |
| | | | | U.S. Treasury Bond Short | | $(26,385,080) | | $(26,277,125) | | $107,955 |
| |
| Florida | | 12/07 | | 243 | | | | | | | | |
| | | | | U.S. Treasury Bond Short | | $(27,167,688) | | $(27,056,531) | | $111,157 |
| |
| Massachusetts 12/07 | | 643 | | | | | | | | |
| | | | | U.S. Treasury Bond Short | | $(71,890,274) | | $(71,594,031) | | $296,243 |
93
Eaton Vance Municipals Funds a s o f S e p t e m b e r 3 0 , 2 0 0 7
N O T E S T O F I N A N C I A L S T A T E M E N T S C O N T ’ D |
| | | | | | | | | | | | | | | | | | | Net |
| | | | | | | | | | | | | | | | | | | Unrealized |
| | | Expiration | | | | | | | | Aggregate | | | | | | Appreciation |
| Fund | | Date | | Contracts | | Position Cost | | | | Value | | | | (Depreciation) |
| |
| Mississippi | | 12/07 | | 8 | | | | | | | | | | | | | | |
| | | | | U.S. Treasury Bond Short | | $ (893,832) | | $ (890,750) | | $ 3,082 |
| |
| New York | | 12/07 | | 550 | | | | | | | | | | | | | | |
| | | | | U.S. Treasury Bond Short | | $(61,450,952) | | $(61,239,063) | | $211,889 |
| |
| Ohio | | 12/07 | | 323 | | | | | | | | | | | | | | |
| | | | | U.S. Treasury Bond Short | | $(35,924,494) | | $(35,964,031) | | $(39,537) |
| |
| Rhode Island | | 12/07 | | 36 | | | | | | | | | | | | | | |
| | | | | U.S. Treasury Bond Short | | $(4,024,961) | | $ (4,008,375) | | $ 16,586 |
| |
| West Virginia | | 12/07 | | 27 | | | | | | | | | | | | | | |
| | | | | U.S. Treasury Bond Short | | $(3,018,720) | | $ (3,006,281) | | $ 12,439 |
| |
| |
| Interest Rate Swaps | | | | | | | | | | | | | | |
| |
| California | | | | | | | | | | | | | | | | | | |
| | | | | Annual | | | | Floating | | Effective Date/ | | Net Unrealized |
| | | Notional | | Fixed Rate | | Rate | | | | Termination | | | | Appreciation |
| Counterparty Amount | | Paid By Fund | | Paid To Fund | | Date | | | | (Depreciation) |
| Lehman | | | | | | | | 3-month | | September 28, 2008/ | | |
| Brothers, Inc. | | $11,175,000 5.503% | | | | USD-LIBOR-BBA | | September 28, 2038 | | $(30,584) |
| Merrill Lynch | | | | | | | | | | | | | | | | | | |
| Capital | | | | | | | | 3-month | | July 9, 2008/ | | | | |
| Services, Inc. | | $10,425,000 5.426% | | | | USD-LIBOR-BBA | | July 9, 2038 | | | | $ 58,934 |
| Morgan Stanley | | | | | | | | | | | | | | | | |
| Capital | | | | | | | | 3-month | | September 10, 2008/ | | |
| Service, Inc. | | $3,650,000 5.428% | | | | USD-LIBOR-BBA September 10, 2038 | | $ 25,979 |
| | | | | | | | | | | | | | | | | | | $ 54,329 |
| |
| |
| Florida | | | | | | | | | | | | | | | | | | |
| | | | | Annual | | | | Floating | | Effective Date/ | | Net Unrealized |
| | | Notional | | Fixed Rate | | Rate | | | | Termination | | | | Appreciation |
| Counterparty Amount | | Paid By Fund | | Paid To Fund | | Date | | | | (Depreciation) |
| Lehman | | | | | | | | 3-month | | September 28, 2008/ | | |
| Brothers, Inc. | | $10,025,000 5.503% | | | | USD-LIBOR-BBA | | September 28, 2038 | | $(27,437) |
| Merrill Lynch | | | | | | | | | | | | | | | | | | |
| Capital | | | | | | | | 3-month | | July 9, 2008/ | | | | |
| Services, Inc. | | $10,050,000 5.426% | | | | USD-LIBOR-BBA | | July 9, 2038 | | | | $ 56,815 |
| Morgan Stanley | | | | | | | | | | | | | | | | |
| Capital | | | | | | | | 3-month | | September 10, 2008/ | | |
| Service, Inc. | | $3,800,000 5.428% | | | | USD-LIBOR-BBA September 10, 2038 | | $ 27,046 |
| | | | | | | | | | | | | | | | | | | $ 56,424 |
| Massachusetts | | | | | | | | |
| | | | | Annual | | Floating | | Effective Date/ | | Net Unrealized |
| | | Notional | | Fixed Rate | | Rate | | Termination | | Appreciation |
| Counterparty Amount | | Paid By Fund | | Paid To Fund | | Date | | (Depreciation) |
| Lehman | | | | | | 3-month | | September 28, 2008/ | | |
| Brothers, Inc. | | $12,475,000 5.503% | | USD-LIBOR-BBA | | September 28, 2038 | | $(34,142) |
| Merrill Lynch | | | | | | | | | | |
| Capital | | | | | | 3-month | | July 9, 2008/ | | |
| Services, Inc. | | $11,700,000 5.426% | | USD-LIBOR-BBA | | July 9, 2038 | | $ 66,142 |
| Morgan Stanley | | | | | | | | |
| Capital | | | | | | 3-month | | September 10, 2008/ | | |
| Service, Inc. | | $3,950,000 | | 5.428% | | USD-LIBOR-BBA September 10, 2038 | | $ 28,114 |
| | | | | | | | | | | $ 60,114 |
| |
| |
| |
| Mississippi | | | | | | | | | | |
| | | | | Annual | | Floating | | Effective Date/ | | Net Unrealized |
| | | Notional | | Fixed Rate | | Rate | | Termination | | Appreciation |
| Counterparty | | Amount | | Paid By Fund Paid To Fund | | Date | | (Depreciation) |
| Lehman | | | | | | 3-month | | September 28, 2008/ | | |
| Brothers, Inc. | | $600,000 | | 5.503% | | USD-LIBOR-BBA September 28, 2038 | | $ (1,642) |
| | | | | | | 3-month | | | | |
| Morgan Stanley | | | | USD-BMA | | | | |
| Capital | | | | | | Municipal | | December 20, 2007/ | | |
| Services, Inc. | | $800,000 | | 3.930% | | Swap Index | | December 20, 2037 | | $15,603 |
| Morgan Stanley | | | | | | | | |
| Capital | | | | | | 3-month | | September 10, 2008/ | | |
| Services, Inc. | | $275,000 | | 5.428% | | USD-LIBOR-BBA September 10, 2038 | | $ 1,957 |
| | | | | | | | | | | $15,918 |
| |
| |
| |
| New York | | | | | | | | | | |
| | | | | Annual | | Floating | | Effective Date/ | | Net Unrealized |
| | | Notional | | Fixed Rate | | Rate | | Termination | | Appreciation |
| Counterparty Amount | | PaidBy Fund | | Paid To Fund | | Date | | (Depreciation) |
| Lehman | | | | | | 3-month | | September 28, 2008/ | | |
| Brothers, Inc. | | $17,800,000 5.503% | | USD-LIBOR-BBA | | September 28, 2038 | | $ (48,716) |
| Merrill Lynch | | | | | | | | | | |
| Capital | | | | | | 3-month | | July 9, 2008/ | | |
| Services, Inc. | | S17,500,000 | | 5.426% | | USD-LIBOR-BBA July 9, 2038 | | $ 98,931 |
| Morgan | | | | | | 3-month | | | | |
| Stanley | | | | | | USD-BMA | | | | |
| Capital | | | | | | Municipal | | December 20, 2007/ | | |
| Service, Inc. | | $16,000,000 3.930% | | Swap Index | | December 20, 2037 | | $312,064 |
| Morgan Stanley | | | | | | | | |
| Capital | | | | | | 3-month | | September 10, 2008/ | | |
| Service, Inc. | | $6,200,000 | | 5.428% | | USD-LIBOR-BBA September 10, 2038 | | $ 44,128 |
| | | | | | | | | | | $406,407 |
94
Eaton Vance Municipals Funds a s o f S e p t e m b e r 3 0 , 2 0 0 7
N O T E S T O F I N A N C I A L S T A T E M E N T S C O N T ’ D |
| Ohio | | | | | | | | | | |
| | | | | Annual Fixed | | | | | | Net Unrealized |
| | | Notional | | Rate Paid | | Floating Rate | | Effective Date/ | | Appreciation |
| Counterparty | | Amount | | By Fund | | Paid To Fund | | Termination Date | | (Depreciation) |
| Merrill Lynch | | | | | | | | | | |
| Capital | | | | | | 3-month | | July 9, 2008/ | | |
| Services, Inc. | | $4,300,000 | | 5.426% | | USD-LIBOR-BBA July 9, 2038 | | $ 24,309 |
| | | | | | | | | | | $ 24,309 |
| |
| |
| |
| Rhode Island | | | | | | | | |
| | | | | Annual Fixed | | | | | | Net Unrealized |
| | | Notional | | Rate Paid | | Floating Rate | | Effective Date/ | | Appreciation |
| Counterparty | | Amount | | By Fund | | Paid To Fund | | Termination Date | | (Depreciation) |
| Lehman | | | | | | 3-month | | September 28, 2008/ | | |
| Brothers, Inc. | | $2,525,000 | | 5.503% | | USD-LIBOR-BBA September 28, 2038 | | $ (6,911) |
| Merrill Lynch | | | | | | | | | | |
| Capital | | | | | | 3-month | | July 9, 2008/ | | |
| Services, Inc. | | $2,400,000 | | 5.426% | | USD-LIBOR-BBA July 9, 2038 | | $13,568 |
| Morgan Stanley | | | | | | | | | | |
| Capital | | | | | | 3-month | | September 10, 2008/ |
| Services, Inc. | | $850,000 | | 5.428% | | USD-LIBOR-BBA September 10, 2038 | | $ 6,050 |
| | | | | | | | | | | $12,707 |
| |
| |
| |
| West Virginia | | | | | | | | |
| | | | | Annual Fixed | | | | | | Net Unrealized |
| | | Notional | | Rate Paid | | Floating Rate | | Effective Date/ | | Appreciation |
| Counterparty | | Amount | | By Fund | | Paid To Fund | | Termination Date | | (Depreciation) |
| Lehman | | | | | | 3-month | | September 28, 2008/ | | |
| Brothers, Inc. | | $1,275,000 | | 5.503% | | USD-LIBOR-BBA September 28, 2038 | | $(3,489) |
| Merrill Lynch | | | | | | | | | | |
| Capital | | | | | | 3-month | | July 9, 2008/ | | |
| Services, Inc. | | $1,250,000 | | 5.426% | | USD-LIBOR-BBA July 9, 2038 | | $ 7,066 |
| Morgan Stanley | | | | | | | | | | |
| Capital | | | | | | 3-month | | September 10, 2008/ | | |
| Services, Inc. | | $450,000 | | 5.428% | | USD-LIBOR-BBA September 10, 2038 | | $ 3,203 |
| | | | | | | | | | | $ 6,780 |
The effective date represents the date on which the Fund and the counterparty to the interest rate swap contract begin interest payment accruals.
At September 30, 2007, the Funds had sufficient cash and/or securities to cover commitments under these contracts.
11 Recently Issued Accounting Pronouncements
In June 2006, the FASB issued FASB Interpretation No. 48 (FIN 48), “Accounting for Uncertainty in Income Taxes – an interpretation of FASB Statement No. 109”. FIN 48 clarifies the accounting for uncertainty in income taxes recognized in accordance with FASB Statement No. 109, “Accounting for Income Taxes”. This interpretation prescribes a recognition threshold and measurement attribute for the financial statement recognition and measurement of a tax position taken or expected to be taken in a tax return. It also provides guidance on de-recognition, classification, interest and penalties, accounting in interim periods, disclosure and transition. FIN 48 is effective on the last business day of the first required financial reporting period for fiscal years beginning after December 15, 2006. Management is currently evaluating the impact of applying the various provisions of FIN 48.
In September 2006, the FASB issued Statement of Financial Accounting Standards No. 157 (FAS 157), “Fair Value Measurements”. FAS 157 defines fair value, establishes a framework for measuring fair value in accordance with generally accepted accounting principles and expands disclosure about fair value measurements. FAS 157 is effective for fiscal years beginning after November 15, 2007. Management is currently evaluating the impact the adoption of FAS 157 will have on the Funds’ financial statement disclosures.
95
Eaton Vance Municipals Funds a s o f S e p t e m b e r 3 0 , 2 0 0 7
REPORT OF INDEPENDENT REGISTERED PUBLIC ACCOUNTING FIRM |
To the Trustees of Eaton Vance Municipals Trust and Shareholders of Eaton Vance California Municipals Fund, Eaton Vance Florida Municipals Fund, Eaton Vance Massachusetts Municipals Fund, Eaton Vance Mississippi Municipals Fund, Eaton Vance New York Municipals Fund, Eaton Vance Ohio Municipals Fund, Eaton Vance Rhode Island Municipals Fund and Eaton Vance West Virginia Municipals Fund:
We have audited the accompanying statements of assets and liabilities, including the portfolios of investments, of Eaton Vance California Municipals Fund, Eaton Vance Florida Municipals Fund, Eaton Vance Massachusetts Municipals Fund, Eaton Vance Mississippi Municipals Fund, Eaton Vance New York Municipals Fund, Eaton Vance Ohio Municipals Fund, Eaton Vance Rhode Island Municipals Fund and Eaton Vance West Virginia Municipals Fund (individually, the “Fund”, collectively, the “Funds”) (certain of the series of Eaton Vance Municipals Trust) as of September 30, 2007, and the related statements of operations for the year then ended, the statements of changes in net assets for each of the two years in the period then ended, and the financial highlights for each of the periods presented, and the statement of cash flows of the Eaton Vance Florida Municipals Fund, Eaton Vance Massachusetts Municipals Fund, and Eaton Vance New York Municipals Fund for the year then ended . These financial statements and financial highlights are the responsibility of each Fund’s management. Our responsibility is to express an opinion on the financial statements and financial highlights based on our audits.
We conducted our audits in accordance with standards of the Public Company Accounting Oversight Board (United States). Those standards require that we plan and perform the audits to obtain reasonable assurance about whether the financial statements and financial highlights are free of material misstatement. The Funds are not required to have, nor were we engaged to perform, an audit of their internal control over financial reporting. Our audits included consideration of internal control over financial reporting as a basis for designing audit procedures that are appropriate in the circumstances, but not for the purpose of expressing an opinion on the effectiveness of the Funds’ internal control over financial reporting. Accordingly, we express no such opinion. An audit also includes examining, on a test basis, evidence supporting the amounts and disclosures in the financial statements, assessing the accounting principles used and significant estimates made by management, as wel l as evaluating the
overall financial statement presentation. Our procedures included confirmation of securities owned at September 30, 2007, by correspondence with the custodian and brokers; where replies were not received from brokers, we performed other auditing procedures. We believe that our audits provide a reasonable basis for our opinion.
In our opinion, the financial statements and financial highlights referred to above present fairly, in all material respects, the financial position of each of the aforementioned funds of Eaton Vance Municipals Trust as of September 30, 2007, the results of their operations for the year then ended, the changes in their net assets for each of the two years in the period then ended, their financial highlights for each of the periods presented, and the cash flows of the Eaton Vance Florida Municipals Fund, Eaton Vance Massachusetts Municipals Fund and Eaton Vance New York Municipals Fund for the year then ended, in conformity with accounting principles generally accepted in the United States of America.
DELOITTE & TOUCHE LLP
Boston, Massachusetts
November 15, 2007 |
96
Eaton Vance Municipals Funds a s o f S e p t e m b e r 3 0 , 2 0 0 7
F E D E R A L T A X I N F O R M A T I O N ( U n a u d i t e d ) |
The Form 1099-DIV you receive in January 2008 will show the tax status of all distributions paid to your account in calendar 2007. Shareholders are advised to consult their own tax adviser with respect to the tax consequences of their investment in a Fund. As required by the Internal Revenue Code regulations, shareholders must be notified within 60 days of the Fund’s fiscal year end regarding exempt-interest dividends.
Exempt-Interest Dividends — The Funds designate the following amounts of dividends from net investment income as an exempt-interest dividend.
| Eaton Vance California Municipals Fund | | 99.30% |
| Eaton Vance Florida Municipals Fund | | 100.00% |
| Eaton Vance Massachusetts Municipals Fund | | 99.98% |
| Eaton Vance Mississippi Municipals Fund | | 99.24% |
| Eaton Vance New York Municipals Fund | | 100.00% |
| Eaton Vance Ohio Municipals Fund | | 99.08% |
| Eaton Vance Rhode Island Municipals Fund | | 100.00% |
| Eaton Vance West Virginia Municipals Fund | | 100.00% |
Capital Gains Dividends — The Eaton Vance California Municipals Fund and Eaton Vance New York Municipals Fund designate $4,013,167 and $1,982,319, respectively, as a capital gain dividend.
97
Eaton Vance Municipals Funds
BOARD OF TRUSTEES’ ANNUAL APPROVAL OF THE INVESTMENT ADVISORY AGREEMENTS
Overview of the Contract Review Process
The Investment Company Act of 1940, as amended (the “1940 Act”), provides, in substance, that each investment advisory agreement between a fund and its investment adviser will continue in effect from year to year only if its continuance is approved at least annually by the fund’s board of trustees, including by a vote of a majority of the trustees who are not “interested persons” of the fund (“Independent Trustees”), cast in person at a meeting called for the purpose of considering such approval.
At a meeting of the Boards of Trustees (each a “Board”) of the Eaton Vance group of mutual funds (the “Eaton Vance Funds”) held on April 23, 2007, the Board, including a majority of the Independent Trustees, voted to approve continuation of existing advisory and sub-advisory agreements for the Eaton Vance Funds for an additional one-year period. In voting its approval, the Board relied upon the affirmative recommendation of the Special Committee of the Board, which is a committee comprised exclusively of Independent Trustees. Prior to making its recommendation, the Special Committee reviewed information furnished for a series of meetings of the Special Committee held in February, March and April 2007. Such information included, among other things, the following:
| Information about Fees, Performance and Expenses |
- An independent report comparing the advisory and related fees paid by each fund with fees paid by comparable funds;
- An independent report comparing each fund’s total expense ratio and its components to comparable funds;
- An independent report comparing the investment performance of each fund to the investment performance of comparable funds over various time periods;
- Data regarding investment performance in comparison to relevant peer groups of funds and appropriate indices;
- Comparative information concerning fees charged by each adviser for managing other mutual funds and institutional accounts using investment strategies and techniques similar to those used in managing the fund;
- Profitability analyses for each adviser with respect to each fund;
| Information about Portfolio Management |
- Descriptions of the investment management services provided to each fund, including the investment strategies and processes employed;
- Information concerning the allocation of brokerage and the benefits received by each adviser as a result of brokerage allocation, including information concerning the acquisition of research through “soft dollar” benefits received in connection with the funds’ brokerage, and the implementation of a soft dollar reimbursement program established with respect to the funds;
- Data relating to portfolio turnover rates of each fund;
- The procedures and processes used to determine the fair value of fund assets and actions taken to monitor and test the effectiveness of such procedures and processes;
| Information about each Adviser |
- Reports detailing the financial results and condition of each adviser;
- Descriptions of the qualifications, education and experience of the individual investment professionals whose responsibilities include portfolio management and investment research for the funds, and information relating to their compensation and responsibilities with respect to managing other mutual funds and investment accounts;
- Copies of the Codes of Ethics of each adviser and its affiliates, together with information relating to compliance with and the administration of such codes;
- Copies of or descriptions of each adviser’s proxy voting policies and procedures;
- Information concerning the resources devoted to compliance efforts undertaken by each adviser and its affiliates on behalf of the funds (including descriptions of various compliance programs) and their record of compliance with investment policies and restrictions, including policies with respect to market-timing, late trading and selective portfolio disclosure, and with policies on personal securities transactions;
- Descriptions of the business continuity and disaster recovery plans of each adviser and its affiliates;
| Other Relevant Information |
- Information concerning the nature, cost and character of the administrative and other non-investment management services provided by Eaton Vance Management and its affiliates;
- Information concerning management of the relationship with the custodian, subcustodians and fund accountants by each adviser or the funds’ administrator; and
- The terms of each advisory agreement.
98
Eaton Vance Municipals Funds
BOARD OF TRUSTEES’ ANNUAL APPROVAL OF THE INVESTMENT ADVISORY AGREEMENTS CONT’D
In addition to the information identified above, the Special Committee considered information provided from time to time by each adviser throughout the year at meetings of the Board and its committees. Over the course of the twelve-month period ended April 30, 2007, the Board met ten times and the Special Committee, the Audit Committee and the Governance Committee, each of which is a Committee comprised solely of Independent Trustees, met twelve, fourteen and eight times, respectively. At such meetings, the Trustees received, among other things, presentations by the portfolio managers and other investment professionals of each adviser relating to the investment performance of each fund and the investment strategies used in pursuing the fund’s investment objective.
For funds that invest through one or more underlying portfolios, the Board considered similar information about the portfolio(s) when considering the approval of advisory agreements. In addition, in cases where the fund’s investment adviser has engaged a sub-adviser, the Board considered similar information about the sub-adviser when considering the approval of any sub-advisory agreement.
The Special Committee was assisted throughout the contract review process by Goodwin Procter LLP, legal counsel for the Independent Trustees. The members of the Special Committee relied upon the advice of such counsel and their own business judgment in determining the material factors to be considered in evaluating each advisory and sub-advisory agreement and the weight to be given to each such factor. The conclusions reached with respect to each advisory and sub-advisory agreement were based on a comprehensive evaluation of all the information provided and not any single factor. Moreover, each member of the Special Committee may have placed varying emphasis on particular factors in reaching conclusions with respect to each advisory and sub-advisory agreement.
Based on its consideration of the foregoing, and such other information as it deemed relevant, including the factors and conclusions described below, the Special Committee concluded that the continuance of the investment advisory agreements of the following funds:
- Eaton Vance California Municipals Fund
- Eaton Vance Florida Municipals Fund
- Eaton Vance Massachusetts Municipals Fund
- Eaton Vance Mississippi Municipals Fund
- Eaton Vance New York Municipals Fund
- Eaton Vance Ohio Municipals Fund
- Eaton Vance Rhode Island Municipals Fund
- Eaton Vance West Virginia Municipals Fund
(the “Funds”), each with Boston Management and Research (the “Adviser”), including their fee structures, is in the interests of shareholders and, therefore, the Special Committee recommended to the Board approval of each agreement. The Board accepted the recommendation of the Special Committee as well as the factors considered and conclusions reached by the Special Committee with respect to each agreement. Accordingly, the Board, including a majority of the Independent Trustees, voted to approve continuation of the advisory agreements for each Fund.
| Nature, Extent and Quality of Services |
In considering whether to approve the investment advisory agreements of the Funds, the Board evaluated the nature, extent and quality of services provided to the Funds by the Adviser.
The Board considered the Adviser’s management capabilities and investment process with respect to the types of investments held by each Fund, including the education, experience and number of its investment professionals and other personnel who provide portfolio management, investment research, and similar services to the Funds, and recent changes in the identity of such personnel. In particular, the Board evaluated, where relevant, the abilities and experience of such investment personnel in analyzing factors such as credit risk, tax efficiency, and special considerations relevant to investing in municipal bonds. Specifically, the Board considered the Adviser’s 30-person municipal bond team, which includes six portfolio managers and nine credit specialists who provide services to the Funds. The Board also took into account the resources dedicated to portfolio management and other services, including the compensation paid to recruit and retain investment personnel, and th e time and attention devoted to each Fund by senior management.
The Board reviewed the compliance programs of the Adviser and relevant affiliates thereof. Among other matters, the Board considered compliance and reporting matters relating to personal trading by investment personnel, selective disclosure of portfolio holdings, late trading, frequent trading, portfolio valuation, business continuity and the allocation of investment opportunities. The Board also evaluated the responses of the Adviser and its affiliates to requests from regulatory authorities such as the Securities and Exchange Commission and the National Association of Securities Dealers.
99
Eaton Vance Municipals Funds
BOARD OF TRUSTEES’ ANNUAL APPROVAL OF THE INVESTMENT ADVISORY AGREEMENTS CONT’D
The Board also considered shareholder and other administrative services provided or managed by Eaton Vance Management and its affiliates, including transfer agency and accounting services. The Board evaluated the benefits to shareholders of investing in a fund that is a part of a large family of funds, including the ability, in many cases, to exchange an investment among different funds without incurring additional sales charges.
After consideration of the foregoing factors, among others, the Board concluded that the nature, extent and quality of services provided by the Adviser, taken as a whole, are appropriate and consistent with the terms of the respective investment advisory agreements.
The Board compared each Fund’s investment performance to a relevant universe of similarly managed funds identified by an independent data provider and appropriate benchmark indices. The Board reviewed comparative performance data for the one-, three-, five- and ten-year periods ended September 30, 2006 for each Fund in operation over such periods. On the basis of the foregoing and other relevant information, the Board concluded that the performance of each Fund is satisfactory.
| Management Fees and Expenses |
The Board reviewed contractual investment advisory fee rates, including any administrative fee rates, payable by each Fund (referred to as “management fees”). As part of its review, the Board considered each Fund’s management fee and total expense ratio for the year ended September 30, 2006, as compared to a group of similarly managed funds selected by an independent data provider.
After reviewing the foregoing information, and in light of the nature, extent and quality of the services provided by the Adviser, the Board concluded with respect to each Fund that the management fee charged to the Fund for advisory and related services and the total expense ratio of the Fund are reasonable.
The Board reviewed the level of profits realized by the Adviser and, if applicable, its affiliates in providing investment advisory and administrative services to each Fund and to all Eaton Vance Funds as a group. The Board considered the level of profits realized without regard to revenue sharing or other payments by the Adviser and its affiliates to third parties in respect of distribution services. The Board also considered other direct or indirect benefits received by the Adviser and its affiliates in connection with their relationship with the Funds.
The Board concluded that, in light of the foregoing factors and the nature, extent and quality of the services rendered, the profits realized by the Adviser and its affiliates are reasonable.
In reviewing management fees and profitability, the Board also considered the extent to which the Adviser and its affiliates, on the one hand, and each Fund, on the other hand, can expect to realize benefits from economies of scale as the assets of the Fund increase. The Board acknowledged the difficulty in accurately measuring the benefits resulting from the economies of scale with respect to the management of any specific fund or group of funds. The Board reviewed data summarizing the increases and decreases in the assets of each Fund and of all Eaton Vance Funds as a group over various time periods, and evaluated the extent to which the total expense ratio of each Fund and the profitability of the Adviser and its affiliates may have been affected by such increases or decreases. Based upon the foregoing, the Board concluded that the benefits from economies of scale are currently being shared equitably by the Adviser and its affiliates and each Fund. The Board also concluded that, assuming reasonably foreseeable increases in the assets of each Fund, the structure of each advisory fee, which includes breakpoints at several asset levels, can be expected to cause the Adviser and its affiliates and the Fund to continue to share such benefits equitably.
100
| | Eaton Vance Municipals Funds
M A N A G E M E N T A N D O R G A N I Z A T I O N |
Fund Management. The Trustees of Eaton Vance Municipals Trust (the Trust) are responsible for the overall management and supervision of the Trust’s affairs. The Trustees and officers of the Trust are listed below. Except as indicated, each individual has held the office shown or other offices in the same company for the last five years. Trustees and officers of the Trust hold indefinite terms of office. The “noninterested Trustees” consist of those Trustees who are not “interested persons” of the Trust, as that term is defined under the 1940 Act. The business address of each Trustee and officer is The Eaton Vance Building, 255 State Street, Boston, Massachusetts 02109. As used below, “EVC” refers to Eaton Vance Corp., “EV” refers to Eaton Vance, Inc., “EVM” refers to Eaton Vance Management, “BMR” refers to Boston Management and Research a nd “EVD” refers to Eaton Vance Distributors, Inc. EVC and EV are the corporate parent and trustee, respectively, of EVM and BMR. EVD is the Funds’ principal underwriter and a wholly-owned subsidiary of EVM. Each officer affiliated with Eaton Vance may hold a position with other Eaton Vance affiliates that is comparable to his or her position with EVM listed below.
| | | | | Term of | | | | Number of Funds | | |
| | | Position(s) | | Office and | | | | in Fund Complex | | |
| Name and | | with the | | Length of | | Principal Occupation(s) | | Overseen By | | |
| Date of Birth | | Trust | | Service | | During Past Five Years | | Trustee(1) | | Other Directorships Held |
| Interested Trustee | | | | | | | | |
| Thomas E. Faust Jr. | | Trustee | | Since 2007 | | Chairman, Chief Executive Officer and President of EVC, | | 176 | | Director of EVC |
| 5/31/58 | | | | | | President of EV, Chief Executive Officer and President of EVM | | | | |
| | | | | | | and BMR, and Director of EVD. Trustee and/or Officer of 176 | | | | |
| | | | | | | registered investment companies and 5 private investment | | | | |
| | | | | | | companies in the Eaton Vance Fund Complex. Mr. Faust is an | | | | |
| | | | | | | interested person because of his positions with EVM, BMR, | | | | |
| | | | | | | EVC and EV which are affiliates of the Trust. | | | | |
| |
| Noninterested Trustee(s) | | | | | | | | |
| Benjamin C. Esty | | Trustee | | Since 2005 | | Roy and Elizabeth Simmons Professor of Business | | 176 | | None |
| 1/2/63 | | | | | | Administration, Harvard University Graduate School of | | | | |
| | | | | | | Business Administration (since 2003). Formerly, Associate | | | | |
| | | | | | | Professor, Harvard University Graduate School of Business | | | | |
| | | | | | | Administration (2000-2003). | | | | |
| |
| Allen R. Freedman | | Trustee | | Since 2007 | | Former Chairman and Chief Executive Officer of Assurant, Inc. | | 175 | | Director of Assurant, Inc. and Stonemor Partners |
| 4/3/40 | | | | | | (insurance provider) (1978-2000). Formerly, a Director of | | | | L.P. (owner and operator of cemeteries) |
| | | | | | | Loring Ward International (fund distributor) (2005-2007). | | | | |
| |
| William H. Park | | Trustee | | Since 2003 | | Vice Chairman, Commercial Industrial Finance Corp. (specialty | | 176 | | None |
| 9/19/47 | | | | | | finance company) (since 2006). Formerly, President and | | | | |
| | | | | | | Chief Executive Officer, Prizm Capital Management, LLC | | | | |
| | | | | | | (investment management firm) (2002-2005). | | | | |
| |
| Ronald A. Pearlman | | Trustee | | Since 2003 | | Professor of Law, Georgetown University Law Center. | | 176 | | None |
| 7/10/40 | | | | | | | | | | |
| |
| Norton H. Reamer | | Trustee | | Since 1985 | | President, Chief Executive Officer and a Director of Asset | | 176 | | None |
| 9/21/35 | | | | | | Management Finance Corp. (a specialty finance company | | | | |
| | | | | | | serving the investment management industry) (since | | | | |
| | | | | | | October 2003). President, Unicorn Corporation (an | | | | |
| | | | | | | investment and financial advisory services company) (since | | | | |
| | | | | | | September 2000). Formerly, Chairman and Chief Operating | | | | |
| | | | | | | Officer, Hellman, Jordan Management Co., Inc. (an | | | | |
| | | | | | | investment management company) (2000-2003). Formerly, | | | | |
| | | | | | | Advisory Director of Berkshire Capital Corporation (investment | | | | |
| | | | | | | banking firm) (2002-2003). | | | | |
101
| | Eaton Vance Municipals Funds
M A N A G E M E N T A N D O R G A N I Z A T I O N C O N T ’ D |
| | | | | Term of | | | | Number of Funds | | |
| | | Position(s) | | Office and | | | | in Fund Complex | | |
| Name and | | with the | | Length of | | Principal Occupation(s) | | Overseen By | | |
| Date of Birth | | Trust | | Service | | During Past Five Years | | Trustee(1) | | Other Directorships Held |
| Noninterested Trustee(s) (continued) | | | | |
| Heidi L. Steiger | | Trustee | | Since 2007 | | President, Lowenhaupt Global Advisors, LLC (global wealth | | 173 | | Director of Nuclear Electric Insurance Ltd. (nuclear |
| 7/8/53 | | | | | | management firm) (since 2005); Formerly, President and | | | | insurance provider) and Aviva USA |
| | | | | | | Contributing Editor, Worth Magazine (2004); Formerly, | | | | (insurance provider) |
| | | | | | | Executive Vice President and Global Head of Private Asset | | | | |
| | | | | | | Management (and various other positions), Neuberger | | | | |
| | | | | | | Berman (investment firm) (1986-2004). | | | | |
| |
| Lynn A. Stout | | Trustee | | Since 1998 | | Paul Hastings Professor of Corporate and Securities Law, | | 176 | | None |
| 9/14/57 | | | | | | University of California at Los Angeles School of Law. | | | | |
| |
| Ralph F. Verni | | Chairman of | | Chairman of the Board | | Consultant and private investor. | | 176 | | None |
| 1/26/43 | | the Board | | since 2007 and | | | | | | |
| | | and Trustee | | Trustee since 2005 | | | | | | |
Principal Officers who are not Trustees
| | | | | Term of | | |
| | | Position(s) | | Office and | | |
| Name and | | with the | | Length of | | Principal Occupation(s) |
| Date of Birth | | Trust | | Service | | During Past Five Years |
| Robert B. MacIntosh | | President | | Since 2005 | | Vice President of EVM and BMR. Officer of 89 registered investment companies |
| 1/22/57 | | | | | | managed by EVM or BMR. |
| |
| William H. Ahern, Jr. | | Vice President | | Since 2004 | | Vice President of EVM and BMR. Officer of 74 registered investment companies |
| 7/28/59 | | | | | | managed by EVM or BMR. |
| |
| Craig R. Brandon | | Vice President | | Since 2004 | | Vice President of EVM and BMR. Officer of 44 registered investment companies |
| 12/21/66 | | | | | | managed by EVM or BMR. |
| |
| Cynthia J. Clemson | | Vice President | | Since 2004 | | Vice President of EVM and BMR. Officer of 89 registered investment companies |
| 3/2/63 | | | | | | managed by EVM or BMR. |
| |
| Thomas M. Metzold | | Vice President | | Since 2004 | | Vice President of EVM and BMR. Officer of 43 registered investment companies |
| 8/3/58 | | | | | | managed by EVM or BMR. |
| |
| Barbara E. Campbell | | Treasurer | | Since 2005 | | Vice President of EVM and BMR. Officer of 176 registered investment companies |
| 6/19/57 | | | | | | managed by EVM and BMR. |
| |
| Maureen A. Gemma | | Secretary | | Since 2007 | | Deputy Chief Legal Officer of EVC, EVM and BMR and Vice President of EVM and BMR. |
| 5/24/60 | | | | | | Officer of 176 registered investment companies managed by EVM or BMR. |
| |
| Paul M. O’Neil | | Chief Compliance | | Since 2004 | | Vice President of EVM and BMR. Officer of 176 registered investment companies |
| 7/11/53 | | Officer | | | | managed by EVM or BMR. |
(1) Includes both master and feeder funds in a master-feeder structure.
The SAI for the Funds includes additional information about the Trustees and officers of the Funds and can be obtained without charge on Eaton Vance’s website at www.eatonvance.com or by calling 1-800-225-6265.
102
This Page Intentionally Left Blank
This Page Intentionally Left Blank
Investment Adviser
Boston Management and Research
The Eaton Vance Building
255 State Street
Boston, MA 02109
Fund Administrator
Eaton Vance Management
The Eaton Vance Building
255 State Street
Boston, MA 02109
Principal Underwriter
Eaton Vance Distributors, Inc.
The Eaton Vance Building
255 State Street
Boston, MA 02109
(617) 482-8260
Custodian
State Street Bank and Trust Company
200 Clarendon Street
Boston, MA 02116
Transfer Agent
PFPC Inc.
Attn: Eaton Vance Funds
P.O. Box 9653
Providence, RI 02940-9653
(800) 262-1122
Independent Registered Public Accounting Firm
Deloitte & Touche LLP
200 Berkeley Street
Boston, MA 02116-5022 |
Eaton Vance Municipals Trust
The Eaton Vance Building
255 State Street
Boston, MA 02109 |
This report must be preceded or accompanied by a current prospectus. Before investing, investors should consider carefully a Fund’s investment objective(s), risks, and charges and expenses. The Funds’ current prospectus contains this and other information about the Funds and is available through your financial advisor. Please read the prospectus carefully before you invest or send money. For further information please call 1-800-225-6265.
438-11/07
MUNISRC