Exhibit (17)(b)(ii)

A n n u a l R e p o r t S e p t e m b e r 3 0 , 2 0 0 7


EATON VANCE NATIONAL MUNICIPALS
FUND
| | IMPORTANT NOTICES REGARDING PRIVACY,
DELIVERY OF SHAREHOLDER DOCUMENTS,
PORTFOLIO HOLDINGS AND PROXY VOTING |
Privacy. The Eaton Vance organization is committed to ensuring your financial privacy. Each of the financial institutions identified below has in effect the following policy (“Privacy Policy”) with respect to nonpublic personal information about its customers:
- Only such information received from you, through application forms or otherwise, and information about your Eaton Vance fund transactions will be collected. This may include information such as name, address, social security number, tax status, account balances and transactions.
- None of such information about you (or former customers) will be disclosed to anyone, except as permitted by law (which includes disclosure to employees necessary to service your account). In the normal course of servicing a customer’s account, Eaton Vance may share information with unaffiliated third parties that perform various required services such as transfer agents, custodians and broker/dealers.
- Policies and procedures (including physical, electronic and procedural safeguards) are in place that are designed to protect the confidentiality of such information.
- We reserve the right to change our Privacy Policy at any time upon proper notification to you. Customers may want to review our Policy periodically for changes by accessing the link on our homepage: www.eatonvance.com.
Our pledge of privacy applies to the following entities within the Eaton Vance organization: the Eaton Vance Family of Funds, Eaton Vance Management, Eaton Vance Investment Counsel, Boston Management and Research, and Eaton Vance Distributors, Inc.
In addition, our Privacy Policy only applies to those Eaton Vance customers who are individuals and who have a direct relationship with us. If a customer’s account (i.e. fund shares) is held in the name of a third-party financial adviser/ broker-dealer, it is likely that only such adviser’s privacy policies apply to the customer. This notice supersedes all previously issued privacy disclosures.
For more information about Eaton Vance’s Privacy Policy, please call 1-800-262-1122.
Delivery of Shareholder Documents. The Securities and Exchange Commission (the “SEC”) permits funds to deliver only one copy of shareholder documents, including prospectuses, proxy statements and shareholder reports, to fund investors with multiple accounts at the same residential or post office box address. This practice is often called “householding” and it helps eliminate duplicate mailings to shareholders.
Eaton Vance, or your financial adviser, may household the mailing of your documents indefinitely unless you instruct Eaton Vance, or your financial adviser, otherwise.
If you would prefer that your Eaton Vance documents not be householded, please contact Eaton Vance at 1-800-262-1122, or contact your financial adviser.
Your instructions that householding not apply to delivery of your Eaton Vance documents will be effective within 30 days of receipt by Eaton Vance or your financial adviser.
Portfolio Holdings. Each Eaton Vance Fund and its underlying Portfolio (if applicable) will file a schedule of its portfolio holdings on Form N-Q with the SEC for the first and third quarters of each fiscal year. The Form N-Q will be available on the Eaton Vance website www.eatonvance.com, by calling Eaton Vance at 1-800-262-1122 or in the EDGAR database on the SEC’s website at www.sec.gov. Form N-Q may also be reviewed and copied at the SEC’s public reference room in Washington, D.C. (call 1-800-732-0330 for information on the operation of the public reference room).
Proxy Voting. From time to time, funds are required to vote proxies related to the securities held by the funds. The Eaton Vance Funds or their underlying Portfolios (if applicable) vote proxies according to a set of policies and procedures approved by the Funds’ and Portfolios’ Boards. You may obtain a description of these policies and procedures and information on how the Funds or Portfolios voted proxies relating to Portfolio securities during the most recent 12 month period ended June 30, without charge, upon request, by calling 1-800-262-1122. This description is also available on the SEC’s website at www.sec.gov.
Eaton Vance National Municipals Fund a s o f S e p t e m b e r 3 0 , 2 0 0 7
M A N A G E M E N T ' S D I S C U S S I O N O F F U N D P E R F O R M A N C E |
Eaton Vance National Municipals Fund (the “Fund”) is designed to provide current income exempt from regular federal income tax. The Fund invests primarily in investment-grade municipal obligations but also invests in lower-rated municipal obligations.
Economic and Market Conditions
Third quarter economic growth rose 3.1%, following the 3.8% growth rate achieved in the second quarter of 2007, according to preliminary Commerce Department data. During the third quarter ended September 30, 2007, the housing sector continued to struggle, as market concerns related to subprime mortgages caused a number of mortgage lenders to file for bankruptcy protection and others to limit new mortgage originations. Building permits and housing starts have both fallen significantly from their highs in early 2006, while sales of new and existing homes are down from their 2005 peaks. However, the weaker dollar is having a stimulative effect on economic growth in export-related industries and on U.S.-based multinational companies whose foreign profits are translated into more dollars. Overall, we believe the economy appears to be slowing, but in a somewhat controlled manner.
According to the Federal Reserve’s (the “Fed”) preferred inflation indicator, the Personal Consumption Expenditure (PCE) price deflator, both absolute and core (excludes food and energy) inflation is fairly well contained within the upper end of the Fed’s comfort zone. In an unscheduled August 17, 2007 meeting, the Fed lowered its Discount Rate – the rate charged to banks borrowing directly from the Fed – to 5.75% from 6.25% . The move was aimed at providing liquidity during a period of increased uncertainty and tighter credit conditions that surfaced rapidly in mid-August. On September 18, 2007, the Fed lowered its Federal Funds Rate to 4.75% from 5.25% – its first rate cut since the Fed stopped raising rates in June 2006 – and lowered the Discount Rate again to 5.25% from 5.75% .
Municipal market supply rose to record levels in the first half of 2007, resulting in underperformance of the municipal sector. On September 30, 2007, long-term AAA-rated municipal bonds yielded 93.9% of U.S. Treasury bonds with similar maturities.1
For the year ended September 30, 2007, the Lehman Brothers Municipal Bond Index2 (the “Index”), an unmanaged index of municipal bonds, posted a gain of 3.10% . For more information about the Fund’s performance and that of funds in the same Lipper Classification,2 see the Performance Information and Portfolio Composition pages that follow.
Management Discussion
The Fund invests primarily in bonds with stated maturities of 10 years or longer at the time of investment, as longer-maturity bonds historically have provided greater tax-exempt income for investors than shorter-maturity bonds.
The Fund underperformed its benchmark Index during the year ended September 30, 2007. Much of the under-performance can be attributed to the broader-based credit scare that took hold of the fixed-income markets in late August 2007. Yields on some municipal bonds reached 105% of U.S. Treasury yields. We believe that the ratio was not the result of any fundamental problems within the municipal market, but rather reflected the extreme dislocation in the fixed-income marketplace caused by the subprime fears, hedge fund problems, the decentralized municipal marketplace and illiquidity across a range of markets. The Fund's exposure to more liquid, higher-credit quality bonds actually hurt performance as hedge funds and other non-traditional municipal market participants sold large positions of their most liquid bonds in order to raise cash.
Historically, there have been only a few instances of municipals trading at the cheap levels seen in August 2007, and it has generally been a short-term phenomenon. During September 2007, municipals outperformed Treasury bonds, as municipal yields reverted to their more historic relationship to Treasuries. Overall, liquidity has returned to the fixed-income marketplace, with a more rational view of the market and risk assessment.
| 1 | Source: Bloomberg L.P. Yields are a compilation of a representative variety of general obligations and are not necessarily representative of the Fund’s yield. |
| |
| 2 | It is not possible to invest directly in an Index or a Lipper Classification. The Index’s total return does not reflect expenses that would have been incurred if an investor individually purchased or sold the securities represented in the Index. |
| |
| | Past performance is no guarantee of future results. |
| |
Fund shares are not insured by the FDIC and are not deposits or other obligations of, or guaranteed by, any depository institution. Shares are subject to investment risks, including possible loss of principal invested.
The views expressed throughout this report are those of the portfolio manager and are current only through the end of the period of the report as stated on the cover. These views are subject to change at any time based upon market or other conditions, and the investment adviser disclaims any responsibility to update such views. These views may not be relied on as investment advice and, because investment decisions for a fund are based on many factors, may not be relied on as an indication of trading intent on behalf of any Eaton Vance fund.
1
Eaton Vance National Municipals Fund a s o f S e p t e m b e r 3 0 , 2 0 0 7
P E R F O R M A N C E I N F O R M A T I O N A N D P O R T F O L I O C O M P O S I T I O N |
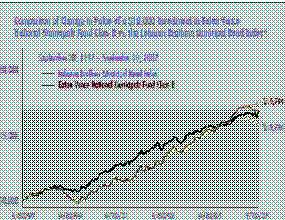
The line graph and table set forth below provide information about the Fund’s performance. The line graph compares the performance of Class B of the Fund with that of the Lehman Brothers Municipal Bond Index, an unmanaged index of municipal bonds. The lines on the graph represent the total returns of a hypothetical investment of $10,000 in each of Class B and the Lehman Brothers Municipal Bond Index. The table includes the total returns of each Class of the Fund at net asset value and maximum public offering price. The performance presented below does not reflect the deduction of taxes, if any, that a shareholder would pay on distributions or redemptions of Fund shares.
| Fund Performance1 As of 9/30/07 | | Class A | | Class B | | Class C | | Class I |
| Share Class Symbol | | EANAX | | EVHMX | | ECHMX | | EIHMX |
|
| Average Annual Total Returns (at net asset value) | | | | | | | | |
|
| One Year | | 1.95% | | 1.20% | | 1.20% | | 2.20% |
| Five Years | | 6.47 | | 5.85 | | 5.71 | | 6.74 |
| Ten Years | | 5.94 | | 5.32 | | 5.13 | | N.A. |
| Life of Fund† | | 7.05 | | 6.59 | | 5.33 | | 6.74 |
| | | | |
| | | | |
| SEC Average Annual Total Returns (including sales charge or applicable CDSC) | | | | |
|
| One Year | | -2.92% | | -3.68% | | 0.22% | | 2.20% |
| Five Years | | 5.45 | | 5.53 | | 5.71 | | 6.74 |
| Ten Years | | 5.43 | | 5.32 | | 5.13 | | N.A. |
| Life of Fund† | | 6.66 | | 6.59 | | 5.33 | | 6.74 |
†Inception Dates – Class A: 4/5/94; Class B: 12/19/85; Class C: 12/3/93; Class I: 7/1/99
| Total Annual | | | | | | | | |
| Operating Expenses2 | | Class A | | Class B | | Class C | | Class I |
|
| Expense Ratio | | 1.33% | | 2.08% | | 2.08% | | 1.08% |
| |
| Distribution Rates/Yields | | Class A | | Class B | | Class C | | Class I |
|
| |
| Distribution Rate3 | | 4.53% | | 3.78% | | 3.78% | | 4.79% |
| Taxable-Equivalent Dist. Rate3,4 | | 6.97 | | 5.82 | | 5.82 | | 7.37 |
| SEC 30-day Yield5 | | 4.16 | | 3.62 | | 3.62 | | 4.63 |
| Taxable-Equivalent SEC 30-day Yield4,5 | | 6.40 | | 5.57 | | 5.57 | | 7.12 |
| | | | | | | | |
| Index Performance6 | | | | | | | | |
|
| Lehman Brothers Municipal Bond Index – Average Annual Total Returns |
|
| One Year | | 3.10% | | | | |
| Five Years | | 4.02 | | | | |
| Ten Years | | 5.32 | | | | |
| | | | | | | | |
| Lipper Averages7 | | | | | | | | |
|
| Lipper General Municipal Debt Funds Classification – Average Annual Total Returns |
|
| One Year | | 1.78% | | | | |
| Five Years | | 3.33 | | | | |
| Ten Years | | 4.33 | | | | |
Portfolio Manager: Thomas M. Metzold, CFA
*Sources: Thomson Financial; Lipper, Inc.
A $10,000 hypothetical investment at net asset value in Class A and Class C on 9/30/97 and Class I on 7/1/99 (commencement of operations), respectively, would have been valued at $17,814 ($16,968 at the maximum offering price), $16,500 and $17,132, respectively, on 9/30/07. It is not possible to invest directly in an Index. The Index’s total return does not reflect the expenses that would have been incurred if an investor individually purchased or sold the securities represented in the Index.
Past performance is no guarantee of future results. Returns are historical and are calculated by determining the percentage change in net asset value or offering price (as applicable) with all distributions reinvested. Investment return and principal value will fluctuate so that shares, when redeemed, may be worth more or less than their original cost. Performance is for the stated time period only; due to market volatility, the Fund’s current performance may be lower or higher than the quoted return. For performance as of the most recent month end, please refer to www.eatonvance.com.
1 Average annual total returns do not include the 4.75% maximum sales charge for Class A shares or the applicable contingent deferred sales charges (CDSC) for Class B and Class C shares. If sales charges were deducted, returns would be lower. SEC Average Annual Total Returns for Class A reflect the maximum 4.75% sales charge. SEC Average Annual Total Returns for Class B reflect the applicable CDSC based on the following schedule: 5% - 1st and 2nd years; 4% - 3rd year; 3% - 4th year; 2% - 5th year; 1% - 6th year. SEC Average Annual Total Returns for Class C reflect a 1% CDSC for the first year. Class I shares are not subject to a sales charge. 2 Source: Prospectus dated 2/1/07, as revised 6/27/07. Includes interest expense of 0.61% relating to the Fund's liability with respect to floating-rate notes held by third parties in conjunction with inverse floater securities transactions by the Fund. The Fund also records offsetting interest income re lating to the municipal obligations underlying such transactions, and, as a result, net asset value and performance have not been affected by this expense. 3 The Fund's distribution rate represents actual distributions paid to shareholders and is calculated by dividing the last distribution per share (annualized) by the net asset value. 4 Taxable-equivalent figure assumes a maximum 35.00% federal income tax rate. A lower tax rate would result in lower tax-equivalent figures. 5 The Fund's SEC yield is calculated by dividing the net investment income per share for the 30-day period by the offering price at the end of the period and annualizing the result. 6 It is not possible to invest directly in an Index. The Index's total return does not reflect the expenses that would have been incurred if an investor individually purchased or sold the securities represented in the Index. Index performance is available as of month end only. 7 The Lipper Averages are the average annual total returns, at net asset value, of the funds that are in the same Lipper Classification as the Fund. It is not possible to invest in a Lipper Classification. Lipper Classifications may include insured and uninsured funds, as well as leveraged and unleveraged funds. The Lipper General Municipal Debt Funds Classification contained 236, 212 and 138 funds for the 1-year, 5-year and 10-year periods, respectively. Lipper Averages are available as of month end only.
2
Eaton Vance National Municipals Fund a s o f S e p t e m b e r 3 0 , 2 0 0 7
P E R F O R M A N C E I N F O R M A T I O N A N D P O R T F O L I O C O M P O S I T I O N |
Rating Distribution*1,2
By total investments
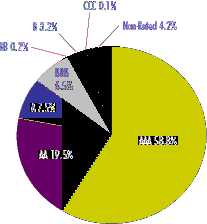
*The rating distribution presented above includes the ratings of securities held by special purpose vehicles in which the Fund holds a residual interest. See Note 11 to the Fund's financial statements. Absent such securities, the Fund's rating distribution at Septemer 30, 2007, is as follows, and the average rating is AA:
| AAA | | 59.6% | | BB | | 0.3% |
| AA | | 14.7% | | B | | 3.6% |
| A | | 8.4% | | CCC | | 0.1% |
| BBB | | 7.5% | | Non-Rated | | 5.8% |
Fund Statistics2,3
| • Number of Issues: | | 271 |
| • Average Maturity: | | 27.6 years |
| • Average Effective Maturity: | | 21.9 years |
| • Average Call Protection: | | 11.4 years |
| • Average Dollar Price: | | $93.13 |
1 Rating Distribution is determined by dividing the total market value of the issues by the total investments of the Fund. 2 As of 9/30/07. Portfolio information may not be representative of the Fund's current or future investments and may change due to active management. 3 Portfolio holdings information excludes securities held by special purpose vehicles in which the Fund holds a residual interest. See Note 1I to the Fund’s financial statements.
| Morningstar RatingsTM3 | | | | | | | | |
|
| |
| NATIONAL MUNICIPALS FUND – CLASS A | | OVERALL | | 3-YEARR | | 5-YEAR | | 10-YEAR |
| | | ***** | | ***** | | ***** | | ***** |
| Load waived | | ***** | | ***** | | ***** | | ***** |
| MUNI NATIONAL LONG CATEGORY | | 256 FUNDS | | 256 FUNDS | | 245 FUNDS | | 189 FUNDS |
|
3Based on risk-adjusted returns. Eaton Vance offers other mutual funds that are not listed here and that do not have similar performance records.
The Overall Morningstar Rating™ for a fund is derived from a weighted average of the performance figures associated with its 3-, 5- and 10-year (if applicable) Morningstar Rating™ metrics.
©2007 Morningstar, Inc. All Rights Reserved. The information contained herein: (1) is proprietary to Morningstar and/or its content providers; (2) may not be copied or distributed; and (3) is not warranted to be accurate, complete or timely. Neither Morningstar nor its content providers is responsible for any damages or losses arising from any use of this information. Past performance is no guarantee of future results. For each fund with at least a three-year history, Morningstar calculates a Morningstar Rating™ based on how a fund ranks on a Morningstar Risk-Adjusted Return measure against other funds in the same category. This measure takes into account variations in a fund’s monthly performance after adjusting for sales loads (except for load-waived A shares), redemption fees, and the risk-free rate, placing more emphasis on downward variations and rewarding consistent performance. The top 10% of funds in each category receive 5 stars; the next 22.5% receive 4 stars; the next 35% receive 3 stars; the next 22.5% receive 2 stars, and the bottom 10% receive 1 star.
Load-waived A share star ratings do not include any front-end sales load and are intended for those investors who have access to such purchase terms (e.g., plan participants of a defined contribution plan). Not all A share mutual funds for which Morningstar calculates a load-waived A share star rating may actually waive their front-end load. Therefore, Morningstar strongly encourages investors to contact their investment professional to determine whether they are eligible to purchase the A share without paying the front load. The Morningstar Rating may differ among share classes of a mutual fund as a result of different sales loads and/or expense structure.
As interest rates rise, the value of fixed-income securities is likely to decrease. Fluctuations in the value of securities may not affect interest income on existing securities, but will be reflected in the funds’ net asset values. A portion of income may be subject to federal alternative minimum tax. Please see the Fund’s prospectus for more information. Consult tax/legal advisor before making any tax-related investment decisions.
3
Eaton Vance National Municipals Fund a s o f S e p t e m b e r 3 0 , 2 0 0 7
F U N D E X P E N S E S |
Example: As a shareholder of the Fund, you incur two types of costs: (1) transaction costs, including sales charges (loads) on purchases and redemption fees (if applicable); and (2) ongoing costs, including management fees; distribution or service fees; and other Fund expenses. This Example is intended to help you understand your ongoing costs (in dollars) of investing in the Fund and to compare these costs with the ongoing costs of investing in other mutual funds. The Example is based on an investment of $1,000 invested at the beginning of the period and held for the entire period (April 1, 2007 – September 30, 2007).
Actual Expenses: The first section of the table below provides information about actual account values and actual expenses. You may use the information in this section, together with the amount you invested, to estimate the expenses that you paid over the period. Simply divide your account value by $1,000 (for example, an $8,600 account value divided by $1,000 = 8.6), then multiply the result by the number in the first line under the heading entitled “Expenses Paid During Period” to estimate the expenses you paid on your account during this period.
Hypothetical Example for Comparison Purposes: The second section of the table below provides information about hypothetical account values and hypothetical expenses based on the actual Fund expense ratio and an assumed rate of return of 5% per year (before expenses), which is not the actual return of the Fund. The hypothetical account values and expenses may not be used to estimate the actual ending account balance or expenses you paid for the period. You may use this information to compare the ongoing costs of investing in your Fund and other funds. To do so, compare this 5% hypothetical example with the 5% hypothetical examples that appear in the shareholder reports of the other funds.
Please note that the expenses shown in the table are meant to highlight your ongoing costs only and do not reflect any transactional costs, such as sales charges (loads) or redemption fees (if applicable). Therefore, the second section of the table is useful in comparing ongoing costs only, and will not help you determine the relative total costs of owning different funds. In addition, if these transactional costs were included, your costs would have been higher.
| | | Eaton Vance National Municipals Fund | | |
| |
| | | Beginning Account Value | | Ending Account Value | | Expenses Paid During Period* |
| | | (4/1/07) | | (9/30/07) | | (4/1/07 – 9/30/07) |
|
| |
| Actual | | | | | | |
| Class A | | $1,000.00 | | $988.30 | | $6.03 |
| Class B | | $1,000.00 | | $984.60 | | $9.75 |
| Class C | | $1,000.00 | | $984.60 | | $9.75 |
| Class I | | $1,000.00 | | $989.50 | | $4.79 |
|
| |
| |
| Hypothetical | | | | | | |
| (5% return per year before expenses) | | | | | | |
| Class A | | $1,000.00 | | $1,019.00 | | $6.12 |
| Class B | | $1,000.00 | | $1,015.20 | | $9.90 |
| Class C | | $1,000.00 | | $1,015.20 | | $9.90 |
| Class I | | $1,000.00 | | $1,020.30 | | $4.86 |
| * | Expenses are equal to the Fund’s annualized expense ratio of 1.21% for Class A shares, 1.96% for Class B shares, 1.96% for Class C shares, and 0.96% for Class I shares multiplied by the average account value over the period, multiplied by 183/365 (to reflect the one-half year period). The Example assumes that the $1,000 was invested at the net asset value per share determined at the close of business on March 31, 2007. |
| |
4
Eaton Vance National Municipals Fund a s o f S e p t e m b e r 3 0 , 2 0 0 7
P O R T F O L I O O F I N V E S T M E N T S |
| Ta x - E x e m p t I n v e s t m e n t s — 1 1 0 . 9 % | | |
| |
| Principal Amount | | | | |
| (000’s omitted) | | Security | | Value |
|
| |
| Cogeneration — 0.9% | | | | |
|
| $ 22,150 | | Maryland Energy Cogeneration, (AES Warrior Run), | | |
| | | (AMT), 7.40%, 9/1/19 | | $ 22,208,254 |
| 6,100 | | Pennsylvania Economic Development Financing Authority, | | |
| | | (Northampton Generating), (AMT), 6.50%, 1/1/13 | | 6,180,337 |
| 21,950 | | Pennsylvania Economic Development Financing Authority, | | |
| | | (Northampton Generating), (AMT), 6.60%, 1/1/19 | | 22,045,921 |
| 4,200 | | Pennsylvania Economic Development Financing Authority, | | |
| | | (Northampton Generating), Junior Liens, (AMT), | | |
| | | 6.875%, 1/1/11 | | | | 4,191,180 |
| 5,000 | | Pennsylvania Economic Development Financing Authority, | | |
| | | (Northampton Generating), Junior Liens, (AMT), | | |
| | | 6.95%, 1/1/21 | | | | 4,955,800 |
|
| | | | | $ 59,581,492 |
|
| |
| Education — 2.6% | | | | |
|
| $ 12,390 | | California Educational Facilities Authority, (Stanford | | |
| | | University), 5.35%, 6/1/27(1) | | $ 12,543,471 |
| 32,055 | | Houston, TX, Higher Education Finance Corp., | | |
| | | 4.50%, 11/15/37 | | | | 30,970,579 |
| 31,200 | | Houston, TX, Higher Education Finance Corp., | | |
| | | 4.50%, 5/15/42 | | | | 29,696,472 |
| 22,035 | | Massachusetts Development Finance Agency, | | |
| | | (Smith College), 5.00%, 7/1/35(1) | | | | 22,668,286 |
| 50,475 | | New Jersey Educational Facilities Authority, | | | | |
| | | (Princeton University), 4.50%, 7/1/37 | | | | 50,340,232 |
| 5,725 | | New York Dormitory Authority, (Vassar College), | | |
| | | 4.25%, 7/1/32 | | | | 5,427,930 |
| 15,265 | | New York Dormitory Authority, (Vassar College), | | |
| | | 4.25%, 7/1/39 | | | | 14,246,367 |
|
| | | | | $ 165,893,337 |
|
| |
| Electric Utilities — 2.0% | | | | |
|
| $ 13,000 | | Brazos River Authority, TX, (Reliant Energy, Inc.), | | |
| | | 7.75%, 12/1/18 | | $ 13,487,630 |
| 9,260 | | Brazos River Authority, TX, PCR, (Texas Energy Co.), | | |
| | | (AMT), 5.40%, 5/1/29 | | | | 8,603,466 |
| 2,000 | | Matagorda County, TX, Navigation District No.1, | | |
| | | (Reliant Energy), 8.00%, 5/1/29 | | | | 2,069,280 |
| 5,000 | | Matagorda County, TX, Navigation District No.1, | | |
| | | (Reliant Energy), (AMT), 5.95%, 5/1/30 | | | | 5,092,800 |
| 8,000 | | North Carolina Municipal Power Agency, (Catawba), | | |
| | | 6.50%, 1/1/20 | | | | 8,501,200 |
| 42,000 | | Salt River Project, AZ, Agricultural Improvements and | | |
| | | Power District, 5.00%, 1/1/31(1) | | | | 43,087,212 |
| Principal Amount | | |
| (000’s omitted) | | Security | | Value |
|
| |
| Electric Utilities (continued) | | |
|
| $ 42,000 | | Salt River Project, AZ, Agricultural Improvements and | | |
| | | Power District, 5.00%, 1/1/31(1) | | $ 43,087,212 |
|
| | | | | $ 123,928,800 |
|
| |
| Escrowed / Prerefunded — 5.3% | | |
|
| $ 3,000 | | ABAG Finance Authority, CA, (Civic Center Drive Apartments), | | |
| | | (AMT), Prerefunded to 9/1/09, 6.375%, 9/1/32 | | $ 3,170,430 |
| 2,400 | | Bexar County, TX, Health Facilities, (St. Luke’s Lutheran), | | |
| | | Escrowed to Maturity, 7.00%, 5/1/21 | | 3,054,456 |
| 1,500 | | Capital Trust Agency, FL, (Seminole Tribe Convention), | | |
| | | Prerefunded to 10/1/12, 8.95%, 10/1/33(2) | | 1,839,255 |
| 11,195 | | Colorado Health Facilities Authority, (Liberty Heights), | | |
| | | Escrowed to Maturity, 0.00%, 7/15/22 | | 5,711,577 |
| 215,825 | | Dawson Ridge, CO, Metropolitan District #1, Series A, | | |
| | | Escrowed to Maturity, 0.00%, 10/1/22 | | 109,060,689 |
| 11,175 | | Dawson Ridge, CO, Metropolitan District #1, Series B, | | |
| | | Escrowed to Maturity, 0.00%, 10/1/22 | | 5,646,951 |
| 101,555 | | Illinois Development Finance Authority, (Regency Park), | | |
| | | Escrowed to Maturity, 0.00%, 7/15/23 | | 48,976,930 |
| 5,690 | | Louisiana Public Facilities Authority, (Southern Baptist | | |
| | | Hospitals, Inc.), Escrowed to Maturity, 8.00%, 5/15/12 | | 6,273,737 |
| 5,675 | | Maricopa County, AZ, Industrial Development Authority, | | |
| | | (Place Five and The Greenery), Escrowed to Maturity, | | |
| | | 6.625%, 1/1/27 | | 6,098,355 |
| 100,000 | | Mississippi Housing Finance Corp., Single Family, | | |
| | | Escrowed to Maturity, 0.00%, 6/1/15 | | 73,655,000 |
| 1,190 | | New York, NY, Prerefunded to | | |
| | | 6/1/13, 5.25%, 6/1/28(1) | | 1,290,681 |
| 11,435 | | North Miami, FL, Health Care Facilities Authority, | | |
| | | (Imperial Club), Prerefunded to 1/1/09, 6.75%, 1/1/33 | | 12,135,051 |
| 10,885 | | Tobacco Settlement Financing Corp., NY, Prerefunded to | | |
| | | 6/1/13, 6.75%, 6/1/39 | | 12,572,719 |
| 36,000 | | Tobacco Settlement Financing Corp., VA, Prerefunded to | | |
| | | 6/1/15, 5.625%, 6/1/37(1) | | 40,328,640 |
| 3,655 | | Wisconsin Health and Educational Facilities Authority, | | |
| | | (Wisconsin Illinois Senior Housing), Prerefunded to | | |
| | | 8/1/09, 7.00%, 8/1/29 | | 3,902,261 |
|
| | | | | $ 333,716,732 |
|
| |
| General Obligations — 7.9% | | |
|
| $ 35,000 | | California, 4.75%, 6/1/35 | | $ 34,651,750 |
| 57,575 | | California, 4.75%, 9/1/35 | | 57,001,553 |
| 20,050 | | California, 5.00%, 6/1/37 | | 20,410,499 |
| 16,000 | | California, 5.25%, 11/1/29 | | 16,732,160 |
| 19,930 | | California, 5.25%, 2/1/30 | | 20,969,549 |
| 9,875 | | California, 5.50%, 11/1/33 | | 10,463,056 |
| 41,130 | | Cypress-Fairbanks, TX, Independent School District, | | |
| | | 4.50%, 2/15/28 | | 40,454,234 |
S e e n o t e s t o f i n a n c i a l s t a t e m e n t s
5
Eaton Vance National Municipals Fund a s o f S e p t e m b e r 3 0 , 2 0 0 7
P O R T F O L I O O F I N V E S T M E N T S C O N T ’ D |
| Principal Amount | | |
| (000’s omitted) | | Security | | Value |
|
| |
| General Obligations (continued) | | |
|
| 34,500 | | Georgia, 1.00%, 3/1/26 | | $ 19,460,760 |
| 88,410 | | Judson, TX, Independent School District, 4.50%, 2/1/35 | | 85,646,303 |
| 13,015 | | New York, NY, 5.25%, 6/1/28(1) | | 13,549,993 |
| 15,000 | | North Carolina, 3.00%, 3/1/28 | | 11,817,600 |
| 37,500 | | San Francisco, CA, Bay Area Rapid Transit District, | | |
| | | 4.75%, 8/1/37 | | 37,806,000 |
| 10,750 | | South Carolina, 3.00%, 8/1/21 | | 9,257,362 |
| 10,000 | | South Carolina, 3.00%, 8/1/22 | | 8,490,500 |
| 115,000 | | Texas (Transportation Commission-Mobility Fund), | | |
| | | 4.50%, 4/1/33 | | 111,852,450 |
|
| | | | | $ 498,563,769 |
|
| |
| Health Care-Miscellaneous — 0.1% | | |
|
| 1,840 | | Tax Revenue Exempt Securities Trust, Community Health | | |
| | | Provider, (Pooled Loan Program Various States Trust | | |
| | | Certificates), 5.50%, 12/1/36(2) | | $ 1,879,011 |
| 1,971 | | Tax Revenue Exempt Securities Trust, Community Health | | |
| | | Provider, (Pooled Loan Program Various States Trust | | |
| | | Certificates), 5.875%, 12/1/36(2) | | 2,016,997 |
|
| | | | | $ 3,896,008 |
|
| |
| Hospital — 11.5% | | |
|
| 34,260 | | Alabama Special Care Facilities Financing Authority, | | |
| | | (Ascension Health), 5.00%, 11/15/39(1) | | $ 34,485,316 |
| 14,000 | | Brevard County, FL, Health Facilities Authority, | | |
| | | (Health First, Inc.), 5.00%, 4/1/36 | | 13,936,720 |
| 30,500 | | California Health Facilities Financing Authority, | | |
| | | (Cedars-Sinai Medical Center), 5.00%, 11/15/34 | | 30,568,930 |
| 13,000 | | California Statewide Communities Development Authority, | | |
| | | (Huntington Memorial Hospital), 5.00%, 7/1/35 | | 13,077,870 |
| 17,295 | | California Statewide Communities Development Authority, | | |
| | | (John Muir Health), 5.00%, 8/15/36 | | 17,312,468 |
| 45,500 | | California Statewide Communities Development Authority, | | |
| | | (Kaiser Permanente), 5.00%, 3/1/41 | | 45,096,415 |
| 77,500 | | California Statewide Communities Development Authority, | | |
| | | (Kaiser Permanente), 5.25%, 3/1/45 | | 78,470,300 |
| 7,100 | | Camden County, NJ, Improvement Authority, | | |
| | | (Cooper Health System), 5.00%, 2/15/25 | | 7,006,351 |
| 13,475 | | Camden County, NJ, Improvement Authority, | | |
| | | (Cooper Health System), 5.00%, 2/15/35 | | 12,846,795 |
| 14,320 | | Camden County, NJ, Improvement Authority, | | |
| | | (Cooper Health System), 5.25%, 2/15/27 | | 14,393,032 |
| 31,520 | | Colorado Health Facilities Authority, | | |
| | | (Catholic Health Initiatives), 4.50%, 9/1/38 | | 29,167,978 |
| 4,000 | | Erie County, OH, Hospital Facilities, (Firelands | | |
| | | Regional Medical Center), 5.00%, 8/15/36 | | 3,981,600 |
| 9,500 | | Erie County, OH, Hospital Facilities, (Firelands | | |
| | | Regional Medical Center), 5.25%, 8/15/46 | | 9,598,800 |
| Principal Amount | | | | |
| (000’s omitted) | | Security | | Value |
|
| |
| Hospital (continued) | | | | |
|
| $ 27,775 | | Highlands County, FL, Health Facilities Authority, | | | | |
| | | (Adventist Health System), 5.00%, 11/15/35 | | $ 27,800,831 |
| 67,700 | | Indiana Health and Educational Facilities Authority, | | | | |
| | | (Ascension Health), 5.00%, 11/15/36 | | | | 68,165,099 |
| 39,025 | | Maryland Health and Higher Educational Facilities Authority, | | | | |
| | | (Medstar Health), 4.75%, 5/15/42 | | | | 35,663,386 |
| 3,660 | | Maryland Health and Higher Educational Facilities Authority, | | | | |
| | | (Peninsula Regional Medical Center), 5.00%, 7/1/36 | | | | 3,663,587 |
| 26,730 | | Michigan Hospital Finance Authority, (McLaren Healthcare), | | | | |
| | | 5.00%, 8/1/35 | | | | 26,857,235 |
| 44,055 | | New York Dormitory Authority, (Memorial Sloan-Kettering | | | | |
| | | Cancer Center), 4.75%, 7/1/28(1) | | | | 44,762,376 |
| 4,000 | | Oneida County, NY, Industrial Development Agency, | | | | |
| | | (Elizabeth Medical Center), 6.00%, 12/1/29 | | | | 4,030,360 |
| 25,000 | | Rochester, MN, Health Care Facilities, (Mayo Clinic), | | | | |
| | | 5.50%, 11/15/27(1) | | | | 25,490,875 |
| 48,205 | | South Miami, FL, Health Facilities Authority, (Baptist | | | | |
| | | Health), 5.00%, 8/15/37 | | | | 48,482,661 |
| 75,725 | | South Miami, FL, Health Facilities Authority, (Baptist | | | | |
| | | Health), 5.00%, 8/15/42 | | | | 75,534,173 |
| 52,400 | | Tarrant County, TX, Cultural Education Facilities Finance Corp., | | |
| | | (Texas Health Resources), 5.00%, 2/15/36 | | | | 52,728,548 |
| 1,365 | | University of Kansas Hospital Authority, 4.50%, 9/1/32 | | | | 1,237,618 |
|
| | | | | $ 724,359,324 |
|
| |
| Housing — 2.1% | | | | |
|
| $ 6,970 | | Arkansas Development Finance Authority, MFMR, | | | | |
| | | (Park Apartments), (AMT), 5.95%, 12/1/28 | | $ 5,708,012 |
| 7,610 | | California Department of Veterans Affairs, Home Purchase | | | | |
| | | Revenue, 5.20%, 12/1/28 | | | | 7,613,348 |
| 16,000 | | Charter Mac Equity Trust, TN, (AMT), | | | | |
| | | 6.625%, 6/30/09(2) | | | | 16,610,080 |
| 9,100 | | Lake Creek, CO, (Affordable Housing Corp.), Multifamily | | | | |
| | | Housing, 6.25%, 12/1/23 | | | | 9,458,267 |
| 14,835 | | New Hampshire Housing Finance Authority, Multifamily | | | | |
| | | Housing, (AMT), 6.20%, 7/1/36 | | | | 15,046,695 |
| 10,640 | | Texas Student Housing Corp., (University of Northern Texas), | | | | |
| | | 6.85%, 7/1/31 | | | | 10,165,243 |
| 65,720 | | Virginia Housing Development Authority, Series A, | | | | |
| | | Subseries A-2, (AMT), 5.10%, 10/1/35 | | | | 65,187,011 |
|
| | | | | $ 129,788,656 |
|
| |
| Housing-Multifamily — 0.2% | | | | |
|
| $ 10,770 | | Florida Capital Projects Finance Authority, Student Housing | | | | |
| Revenue, (Florida University), Prerefunded to 8/15/10, |
| | | 7.85%, 8/15/31 | | $ 12,214,257 |
|
| | | | | $ 12,214,257 |
|
S e e n o t e s t o f i n a n c i a l s t a t e m e n t s
6
Eaton Vance National Municipals Fund a s o f S e p t e m b e r 3 0 , 2 0 0 7
P O R T F O L I O O F I N V E S T M E N T S C O N T ’ D |
| Principal Amount | | | | |
| (000’s omitted) | | Security | | Value |
|
| |
| Industrial Development Revenue — 11.6% | | |
|
| |
| 6,850 | | Austin, TX, (Cargoport Development LLC), (AMT), | | | | |
| | | 8.30%, 10/1/21 | | $ 7,472,322 |
| 10,260 | | Bedford County, VA, Industrial Development Authority, | | | | |
| | | (Nekoosa Packaging), (AMT), 6.55%, 12/1/25 | | | | 10,396,663 |
| 2,250 | | Calhoun County, AR, Solid Waste Disposal Revenue, | | | | |
| | | (Georgia-Pacific Corp.), (AMT), 6.375%, 11/1/26 | | | | 2,261,947 |
| 6,050 | | Carbon County, UT, (Laidlaw Environmental), (AMT), | | | | |
| | | 7.50%, 2/1/10 | | | | 6,092,532 |
| 4,000 | | Courtland, AL, Solid Waste Disposal, (Champion | | | | |
| | | International Corp.), (AMT), 6.70%, 11/1/29 | | | | 4,152,760 |
| 29,090 | | Denver, CO, City and County Special Facilities, | | | | |
| | | (United Airlines), (AMT), 5.25%, 10/1/32 | | | | 26,890,505 |
| 23,590 | | Denver, CO, City and County Special Facilities, | | | | |
| | | (United Airlines), (AMT), 5.75%, 10/1/32 | | | | 23,389,013 |
| 3,500 | | Effingham County, GA, Industrial Development Authority, | | | | |
| | | PCR, (Georgia Pacific Corp.), 6.50%, 6/1/31 | | | | 3,558,660 |
| 13,290 | | Effingham County, GA, Solid Waste Disposal, | | | | |
| | | (Fort James Project), (AMT), 5.625%, 7/1/18 | | | | 12,918,279 |
| 5,905 | | Hardeman County, TN, (Correctional Facilities Corp.), | | | | |
| | | 7.75%, 8/1/17 | | | | 6,028,651 |
| 30,000 | | Houston, TX, Airport System, (Continental Airlines), (AMT), | | | | |
| | | 6.75%, 7/1/29 | | | | 31,242,600 |
| 42,000 | | Liberty, NY, Development Corp., (Goldman Sachs | | | | |
| | | Group, Inc.), 5.25%, 10/1/35(1) | | | | 44,860,760 |
| 98,100 | | Liberty, NY, Development Corp., (Goldman Sachs | | | | |
| | | Group, Inc.), 5.25%, 10/1/35(1) | | | | 104,781,918 |
| 115,730 | | Liberty, NY, Development Corp., (Goldman Sachs | | | | |
| | | Group, Inc.), 5.50%, 10/1/37(3) | | | | 129,235,691 |
| 5,000 | | McMinn County, TN, (Calhoun Newsprint - Bowater, Inc.), | | | | |
| | | (AMT), 7.40%, 12/1/22 | | | | 5,029,850 |
| 10,000 | | Michigan Strategic Fund, (S.D. Warren), (AMT), Series A, | | | | |
| | | 7.375%, 1/15/22 | | | | 10,112,800 |
| 15,000 | | Michigan Strategic Fund, (S.D. Warren), (AMT), Series B, | | | | |
| | | 7.375%, 1/15/22 | | | | 15,169,050 |
| 3,500 | | Michigan Strategic Fund, (S.D. Warren), (AMT), Series C, | | | | |
| | | 7.375%, 1/15/22 | | | | 3,539,445 |
| 5,025 | | New Jersey Economic Development Authority, | | | | |
| | | (American Airlines), (AMT), 7.10%, 11/1/31 | | | | 5,028,266 |
| 18,820 | | New Jersey Economic Development Authority, | | | | |
| | | (Continental Airlines), (AMT), 6.25%, 9/15/29 | | | | 19,122,249 |
| 4,950 | | New Jersey Economic Development Authority, | | | | |
| | | (Continental Airlines), (AMT), 9.00%, 6/1/33 | | | | 5,723,636 |
| 7,000 | | New York City, NY, Industrial Development Agency, | | | | |
| | | (American Airlines, Inc.), (AMT), 7.50%, 8/1/16 | | | | 7,839,020 |
| 15,000 | | New York City, NY, Industrial Development Agency, | | | | |
| | | (American Airlines, Inc.), (AMT), 7.75%, 8/1/31 | | | | 17,157,150 |
| 29,000 | | New York City, NY, Industrial Development Agency, | | | | |
| (American Airlines, Inc. - JFK International Airport), (AMT), |
| | | 7.625%, 8/1/25 | | | | 32,921,670 |
| Principal Amount | | |
| (000’s omitted) | | Security | | Value |
|
| |
| Industrial Development Revenue (continued) |
|
| $ 10,000 | | New York City, NY, Industrial Development Agency, | | |
| (American Airlines, Inc. - JFK International Airport), (AMT), |
| | | 8.00%, 8/1/12 | | $ 11,026,600 |
| 12,500 | | New York City, NY, Industrial Development Agency, | | |
| | | (JFK International Airport), (AMT), 8.50%, 8/1/28 | | 14,073,375 |
| 2,567 | | Savannah, GA, Economic Development Authority, | | |
| | | (Intercat-Savannah), (AMT), 9.00%, 1/1/15 | | 2,572,529 |
| 904 | | Savannah, GA, Economic Development Authority, | | |
| | | (Intercat-Savannah), (AMT), 9.75%, 7/1/10 | | 908,820 |
| 5,000 | | Skowhegan, ME, (S.D. Warren), (AMT), | | |
| | | 6.65%, 10/15/15 | | 5,103,900 |
| 160,425 | | St. John Baptist Parish, LA, (Marathon Oil Corp.), | | |
| | | 5.125%, 6/1/37 | | 160,267,784 |
|
| | | | | $ 728,878,445 |
|
| |
| Insured-Education — 2.0% | | |
|
| $ 4,905 | | Alabama State Board of Education, (Jefferson | | |
| | | State Community College), (MBIA), 4.625%, 10/1/32 | | $ 4,883,369 |
| 43,060 | | Baldwin County, AL, Board of Education, (AMBAC), | | |
| | | 4.50%, 7/1/37 | | 41,517,591 |
| 15,045 | | Broward County, FL, Educational Facilities Authority, | | |
| | | (Nova Southeastern University), (AGC), 4.50%, 4/1/36 | | 13,984,027 |
| 28,695 | | Pennsylvania Higher Educational Facilities Authority, | | |
| | | (Temple University), (MBIA), 4.50%, 4/1/36 | | 27,908,470 |
| 22,675 | | University of California, (MBIA), 4.75%, 5/15/33 | | 22,821,254 |
| 12,720 | | University of California, (MBIA), 4.75%, 5/15/37 | | 12,773,170 |
|
| | | | | $ 123,887,881 |
|
| |
| Insured-Electric Utilities — 3.9% | | |
|
| $ 7,500 | | Burlington, KS, PCR, (Kansas Gas & Electric Co.), (MBIA), | | |
| | | 5.30%, 6/1/31 | | $ 7,873,425 |
| 57,090 | | Hawaii Department of Budget and Finance, (Hawaiian | | |
| | | Electric Company), (FGIC), (AMT), 4.60%, 5/1/26 | | 55,135,238 |
| 27,900 | | Hawaii Department of Budget and Finance, (Hawaiian | | |
| | | Electric Company), (FGIC), (AMT), 4.65%, 3/1/37 | | 26,129,466 |
| 20,000 | | Los Angeles, CA, Department of Water and Power, (FSA), | | |
| | | 4.625%, 7/1/37 | | 19,807,000 |
| 38,190 | | Matagorda County ,TX, Navigation District No.1, | | |
| | | (AEP Texas Central Co.), (MBIA), 5.20%, 5/1/30 | | 39,340,283 |
| 78,990 | | Missouri Joint Municipal Electric Utility Commission, | | |
| | | Series A, (AMBAC), 4.50%, 1/1/37 | | 76,547,629 |
| 18,000 | | Sacramento, CA, Municipal Electric Utility District, (FSA), | | |
| | | 5.00%, 8/15/28(1) | | 18,456,960 |
|
| | | | | $ 243,290,001 |
|
S e e n o t e s t o f i n a n c i a l s t a t e m e n t s
7
Eaton Vance National Municipals Fund a s o f S e p t e m b e r 3 0 , 2 0 0 7
P O R T F O L I O O F I N V E S T M E N T S C O N T ’ D |
| Principal Amount | | |
| (000’s omitted) | | Security | | Value |
|
| |
| Insured-Escrowed / Prerefunded — 2.7% | | |
|
| $ 18,450 | | California Infrastructure and Economic Development, | | |
| | | (Bay Area Toll Bridges), (AMBAC), Prerefunded to | | |
| | | 1/1/28, 5.00%, 7/1/33(1) | | $ 19,987,624 |
| 78,360 | | California Infrastructure and Economic Development, | | |
| | | (Bay Area Toll Bridges), (AMBAC), Prerefunded to | | |
| | | 1/1/28, 5.00%, 7/1/36(1) | | 84,890,522 |
| 19,000 | | Massachusetts Turnpike Authority, (FGIC), Escrowed to | | |
| | | Maturity, 5.00%, 1/1/20(1) | | 20,344,250 |
| 41,010 | | Massachusetts Turnpike Authority, (FGIC), Escrowed to | | |
| | | Maturity, 5.125%, 1/1/23(1) | | 44,987,765 |
|
| | | | | $ 170,210,161 |
|
| |
| Insured-General Obligations — 9.1% | | |
|
| $ 17,670 | | Beaverton, OR, School District, (FSA), 4.125%, 6/1/25 | | $ 16,914,961 |
| 10,085 | | Beaverton, OR, School District, (FSA), 4.125%, 6/1/26 | | 9,557,555 |
| 34,995 | | California, (AMBAC), 5.00%, 2/1/28(1) | | 37,968,875 |
| 9,900 | | California, (AMBAC), Variable Rate, | | |
| | | 8.75%, 5/1/26(2)(4) | | 11,771,298 |
| 49,000 | | California, (FSA), 4.50%, 9/1/36 | | 47,105,170 |
| 12,000 | | California, (MBIA), 4.75%, 3/1/31 | | 12,066,360 |
| 16,980 | | Chicago, IL, Board of Education, (FGIC), 0.00%, 12/1/25 | | 7,363,717 |
| 50,985 | | Detroit, MI, School District, (FSA), 5.25%, 5/1/32 | | 56,595,389 |
| 104,360 | | District of Columbia, (FGIC), 4.50%, 6/1/37 | | 100,901,510 |
| 26,340 | | District of Columbia, (FGIC), Variable Rate, | | |
| | | 6.123%, 6/1/33(2)(4) | | 26,645,544 |
| 26,125 | | Florida Board of Education, Capital Outlay, | | |
| | | (Public Education), Series G, (MBIA), 4.75%, 6/1/37 | | 26,102,794 |
| 12,250 | | Frisco, TX, Independent School District, Series A, (FSA), | | |
| | | 3.75%, 8/15/38(5) | | 10,215,030 |
| 15,380 | | Frisco, TX, Independent School District, Series A, (FSA), | | |
| | | 4.75%, 8/15/35(5) | | 15,397,226 |
| 4,450 | | Geary County, KS, Unified School District #475, (MBIA), | | |
| | | 3.00%, 9/1/26 | | 3,554,171 |
| 8,500 | | Georgia, (MBIA), 2.00%, 9/1/24 | | 6,004,400 |
| 51,625 | | Los Angeles, CA, Unified School District, 4.75%, 7/1/32 | | 52,245,016 |
| 10,000 | | Montgomery County, TX, (Municipal Utility District No. 46 | | |
| | | Waterworks and Sewer), (AMBAC), 4.00%, 3/1/30 | | 9,046,100 |
| 32,340 | | Puerto Rico, (AGC), 5.50%, 7/1/29(1) | | 36,917,188 |
| 90,790 | | Texas (Transportation Commission-Mobility Fund), (FGIC), | | |
| | | 4.50%, 4/1/35 | | 88,070,840 |
|
| | | | | $ 574,443,144 |
|
| |
| Insured-Hospital — 0.7% | | |
|
| $ 15,210 | | Maryland Health and Higher Educational Facilities | | |
| | | Authority, (Medlantic), (AMBAC), 5.25%, 8/15/38(1) | | $ 16,683,950 |
| 7,835 | | Tyler, TX, Health Facility Development Corp., (East Texas | | |
| | | Medical Center), (FSA), 5.375%, 11/1/27 | | 8,122,231 |
| Principal Amount | | |
| (000’s omitted) | | Security | | Value |
|
| |
| Insured-Hospital (continued) | | |
|
| $ 4,195 | | Washington Health Care Facilities Authority, (Providence | | |
| | | Health Care), (FGIC), 4.50%, 10/1/35 | | $ 3,968,260 |
| 7,500 | | Washington Health Care Facilities Authority, (Providence | | |
| | | Health Care), (FGIC), 4.625%, 10/1/34 | | 7,274,850 |
| 5,000 | | Wisconsin Health and Educational Facilities Authority, | | |
| | | (Ministry Health Care), (MBIA), 5.125%, 2/15/22 | | 5,165,700 |
|
| | | | | $ 41,214,991 |
|
| |
| Insured-Housing — 0.7% | | |
|
| $ 40,496 | | Virginia Housing Development Authority, (MBIA), | | |
| | | 5.375%, 7/1/36(1) | | $ 41,473,733 |
|
| | | | | $ 41,473,733 |
|
| |
| Insured-Lease Revenue / Certificates of | | |
| Participation — 1.8% | | |
|
| $ 83,200 | | Hudson, NY, Infrastructure Corp., (MBIA), | | |
| | | 4.50%, 2/15/47 | | $ 80,007,616 |
| 19,715 | | Jackson County, MO, (Harry S. Truman Sports Complex), | | |
| | | (AMBAC), 4.50%, 12/1/31 | | 19,405,475 |
| 6,350 | | Western Regional Jail Authority, VA, (MBIA), | | |
| | | 4.25%, 6/1/34 | | 5,873,179 |
| 8,020 | | Western Regional Jail Authority, VA, (MBIA), | | |
| | | 4.25%, 6/1/39 | | 7,303,894 |
|
| | | | | $ 112,590,164 |
|
| |
| Insured-Other Revenue — 2.7% | | |
|
| $ 71,985 | | Golden State Tobacco Securitization Corp., CA, (AGC), | | |
| | | 5.00%, 6/1/45 | | $ 73,102,927 |
| 25,000 | | Harris County-Houston, TX, Sports Authority, (MBIA), | | |
| | | 0.00%, 11/15/41 | | 3,923,250 |
| 25,470 | | New York City, NY, Industrial Development Agency, | | |
| | | (Queens Baseball Stadium), (AMBAC), 4.75%, 1/1/42 | | 25,477,641 |
| 14,715 | | New York City, NY, Industrial Development Agency, | | |
| | | (Yankee Stadium), (FGIC), 4.50%, 3/1/39 | | 14,406,574 |
| 55,475 | | New York City, NY, Industrial Development Agency, | | |
| | | (Yankee Stadium), (MBIA), 4.75%, 3/1/46 | | 55,036,748 |
|
| | | | | $ 171,947,140 |
|
| |
| Insured-Ports — 0.5% | | |
|
| $ 37,115 | | Alabama State Dock Authority, (MBIA), (AMT), | | |
| | | 4.50%, 10/1/36 | | $ 34,396,326 |
|
| | | | | $ 34,396,326 |
|
S e e n o t e s t o f i n a n c i a l s t a t e m e n t s
8
Eaton Vance National Municipals Fund a s o f S e p t e m b e r 3 0 , 2 0 0 7
P O R T F O L I O O F I N V E S T M E N T S C O N T ’ D |
| Principal Amount | | |
| (000’s omitted) | | Security | | Value |
|
| |
| Insured-Special Tax Revenue — 7.9% | | |
|
| $ 13,305 | | Illinois Sports Facility Authority, (AMBAC), | | |
| | | 0.00%, 6/15/23 | | $ 6,520,914 |
| 31,010 | | Illinois Sports Facility Authority, (AMBAC), | | |
| | | 0.00%, 6/15/24 | | 14,476,708 |
| 10,000 | | Illinois Sports Facility Authority, (AMBAC), | | |
| | | 0.00%, 6/15/25 | | 4,437,300 |
| 43,225 | | Louisiana Gas and Fuels Tax, (FGIC), | | |
| | | 4.50%, 5/1/41 | | 41,488,220 |
| 72,275 | | Louisiana Gas and Fuels Tax, (FSA), | | |
| | | 4.75%, 5/1/39 | | 72,398,590 |
| 20,000 | | Massachusetts School Building Authority, | | |
| | | (AMBAC), 4.50%, 8/15/35 | | 19,426,400 |
| 49,570 | | New York City, NY, Transitional Finance Authority, (FGIC), | | |
| | | 4.25%, 1/15/34 | | 46,697,914 |
| 29,200 | | New York Convention Center Development Corp., | | |
| | | Hotel Occupancy Tax, (AMBAC), 4.75%, 11/15/45 | | 29,075,900 |
| 1,406,680 | | Puerto Rico Sales Tax Financing, (AMBAC), | | |
| | | 0.00%, 8/1/54 | | 138,529,846 |
| 156,320 | | Puerto Rico Sales Tax Financing, (MBIA), | | |
| | | 0.00%, 8/1/44 | | 25,802,179 |
| 310,060 | | Puerto Rico Sales Tax Financing, (MBIA), | | |
| | | 0.00%, 8/1/45 | | 48,682,521 |
| 247,755 | | Puerto Rico Sales Tax Financing, (MBIA), | | |
| | | 0.00%, 8/1/46 | | 36,957,613 |
| 9,185 | | Regional Transportation Authority, LA, (FGIC), | | |
| | | 0.00%, 12/1/15 | | 6,273,079 |
| 9,500 | | Regional Transportation Authority, LA, (FGIC), | | |
| | | 0.00%, 12/1/21 | | 4,656,520 |
|
| | | | | $ 495,423,704 |
|
| |
| Insured-Student Loan — 0.8% | | |
|
| $ 52,030 | | Massachusetts Educational Financing Authority, (AMBAC), | | |
| | | 4.70%, 1/1/33 | | $ 49,600,199 |
|
| | | | | $ 49,600,199 |
|
| |
| Insured-Transportation — 13.8% | | |
|
| $ 29,800 | | Central, TX, Regional Mobility Authority, (FGIC), | | |
| | | 5.00%, 1/1/45 | | $ 30,388,252 |
| 10,000 | | Chicago, IL, O’Hare International Airport, (AMBAC), | | |
| | | (AMT), 5.375%, 1/1/32 | | 10,209,400 |
| 45,355 | | Clark County, NV, Airport Authority, (FGIC), | | |
| | | 5.00%, 7/1/36(6) | | 46,355,531 |
| 2,500 | | Dallas Fort Worth, TX, International Airport Facility | | |
| | | Improvements Corp., (FGIC), (AMT), 5.50%, 11/1/20 | | 2,605,175 |
| 5,000 | | Dallas Fort Worth, TX, International Airport Facility | | |
| | | Improvements Corp., (FGIC), (AMT), 5.625%, 11/1/21 | | 5,239,250 |
| 10,000 | | Dallas Fort Worth, TX, International Airport Facility | | |
| | | Improvements Corp., (FSA), (AMT), 5.50%, 11/1/17(1) | | 10,595,798 |
| Principal Amount | | |
| (000’s omitted) | | Security | | Value |
|
| |
| Insured-Transportation (continued) | | |
|
| $ 12,000 | | Dallas Fort Worth, TX, International Airport Facility | | |
| | | Improvements Corp., (MBIA), (AMT), | | |
| | | 5.50%, 11/1/19(1) | | $ 12,694,880 |
| 10,000 | | E-470 Public Highway Authority, CO, (MBIA), | | |
| | | 0.00%, 9/1/37 | | 2,228,600 |
| 25,720 | | E-470 Public Highway Authority, CO, (MBIA), | | |
| | | 0.00%, 9/1/38 | | 5,451,611 |
| 33,060 | | Harris County, TX, Transportation Project, (MBIA), | | |
| | | 4.75%, 8/15/32 | | 33,174,718 |
| 75,300 | | Indianapolis, IN, Local Public Improvement Bond Bank, | | |
| | | (Indianapolis Airport Authority), (AMBAC), (AMT), | | |
| | | 5.00%, 1/1/36(1) | | 75,772,131 |
| 40,525 | | Maryland Transportation Authority, (FSA), 4.50%, 7/1/41 | | 39,257,378 |
| 17,635 | | Metropolitan Transportation Authority, NY, (FGIC), | | |
| | | 4.75%, 11/15/37 | | 17,739,752 |
| 151,030 | | Minneapolis and St. Paul, MN, Metropolitan Airport | | |
| | | Commission, (AMBAC), 4.50%, 1/1/32 | | 146,633,517 |
| 19,750 | | New Jersey Transportation Trust Fund Authority, (AMBAC), | | |
| | | Variable Rate, 6.835%, 12/15/37(2)(4) | | 20,413,205 |
| 7,410 | | North Texas Tollway Authority, (FSA), 4.50%, 1/1/38 | | 7,131,014 |
| 81,940 | | Orlando and Orange County, FL, Expressway Authority, (FSA), | | |
| | | 4.50%, 7/1/35 | | 78,915,595 |
| 63,145 | | Port Authority of New York and New Jersey, (CIFG), (AMT), | | |
| | | 4.50%, 9/1/35 | | 58,687,594 |
| 29,975 | | Port Authority of New York and New Jersey, (FSA), (AMT), | | |
| | | 4.50%, 12/1/36 | | 27,837,183 |
| 20,995 | | Port Authority of New York and New Jersey, (FSA), (AMT), | | |
| | | 4.25%, 12/1/32 | | 18,769,530 |
| 62,000 | | Puerto Rico Commonwealth Highway and Transportation | | |
| | | Authority, (AGC), 5.25%, 7/1/36 | | 68,439,940 |
| 24,100 | | Regional Transportation Authority, IL, (MBIA), | | |
| | | 4.50%, 7/1/35 | | 23,304,459 |
| 10,000 | | San Francisco, CA, City and County Airport Commission, | | |
| International Airport Revenue, (FGIC), (AMT), Variable Rate, |
| | | 6.876%, 5/1/30(2)(4) | | 10,140,400 |
| 70,950 | | San Jose, CA, Airport Revenue, (AMBAC), (AMT), Series A, | | |
| | | 5.00%, 3/1/37 | | 71,531,081 |
| 15,270 | | Tampa-Hillsborough County, FL, Expressway Authority, | | |
| | | (AMBAC), 4.00%, 7/1/34 | | 13,439,432 |
| 50,000 | | Texas Turnpike Authority, (AMBAC), 0.00%, 8/15/22 | | 25,599,000 |
| 8,735 | | Tri-County, OR, Metropolitan Transportation District, (MBIA), | | |
| | | 4.25%, 9/1/31 | | 8,196,313 |
|
| | | | | $ 870,750,739 |
|
| |
| Insured-Water and Sewer — 5.7% | | |
|
| $ 11,915 | | Atlanta, GA, Water and Wastewater, (FGIC), | | |
| | | 5.00%, 11/1/38 | | $ 12,013,775 |
| 97,765 | | Birmingham, AL, Waterworks and Sewer Board, (AMBAC), | | |
| | | 4.50%, 1/1/39 | | 94,199,510 |
S e e n o t e s t o f i n a n c i a l s t a t e m e n t s
9
Eaton Vance National Municipals Fund a s o f S e p t e m b e r 3 0 , 2 0 0 7
P O R T F O L I O O F I N V E S T M E N T S C O N T ’ D |
| Principal Amount | | |
| (000’s omitted) | | Security | | Value |
|
| |
| Insured-Water and Sewer (continued) | | |
|
| $ 29,865 | | Birmingham, AL, Waterworks and Sewer Board, (AMBAC), | | |
| | | 4.50%, 1/1/43 | | $ 28,458,956 |
| 10,445 | | Castaic Lake, CA, Water Agency Certificates of | | |
| | | Participation, (Water System Improvements), (AMBAC), | | |
| | | 0.00%, 8/1/21 | | 5,672,157 |
| 22,560 | | East Baton Rouge, LA, Sewer Commission, (FSA), | | |
| | | 4.50%, 2/1/31 | | 22,218,893 |
| 15,480 | | East Baton Rouge, LA, Sewer Commission, (FSA), | | |
| | | 4.50%, 2/1/36 | | 15,089,285 |
| 8,175 | | Fort Lauderdale, FL, Water and Sewer, (MBIA), | | |
| | | 4.25%, 9/1/33 | | 7,494,840 |
| 55,655 | | Honolulu, HI, City and County Wastewater System, (MBIA), | | |
| | | 4.50%, 7/1/37 | | 54,269,191 |
| 8,375 | | Houston, TX, Water and Sewer System, (FSA), | | |
| | | 0.00%, 12/1/28 | | 3,061,146 |
| 2,215 | | King County, WA, Sewer Revenue, (MBIA), | | |
| | | 4.50%, 1/1/32 | | 2,155,527 |
| 12,915 | | Los Angeles, CA, Wastewater System, (MBIA), | | |
| | | 4.50%, 6/1/29 | | 12,820,591 |
| 60,665 | | New York City, NY, Municipal Finance Authority, (FSA), | | |
| | | 4.25%, 6/15/39 | | 56,752,714 |
| 31,360 | | San Francisco, CA, City and County Public Utilities | | |
| | | Commission, Water Revenue, (FSA), 4.25%, 11/1/33 | | 29,316,896 |
| 20,805 | | Spartanburg, SC, Sanitation Sewer District, (MBIA), | | |
| | | 4.00%, 3/1/40 | | 18,267,414 |
|
| | | | | $ 361,790,895 |
|
| |
| Lease Revenue / Certificates of Participation — 0.1% |
|
| $ 10,000 | | Orange County, VA, Economic Development Authority, | | |
| | | (Various Projects), 4.50%, 2/1/34 | | $ 9,618,700 |
|
| | | | | $ 9,618,700 |
|
| |
| Nursing Home — 0.9% | | |
|
| $ 4,455 | | Delaware County, PA, Industrial Development Authority, | | |
| | | (Care Institute, Inc.), 9.00%, 8/1/31 | | $ 3,502,744 |
| 9,270 | | Hillsborough County, FL, Industrial Development Authority, | | |
| | | (Tampa Bay Retirement Center), 7.50%, 6/1/25 | | 9,471,344 |
| 2,150 | | Lackawanna County, PA, Industrial Development Authority, | | |
| | | (Edella Street Associates), 8.875%, 9/1/14 | | 2,154,193 |
| 12,965 | | Massachusetts Industrial Finance Agency, (Age Institute of | | |
| | | Massachusetts), 8.05%, 11/1/25 | | 13,226,763 |
| 11,315 | | Mississippi Business Finance Corp., (Magnolia Healthcare), | | |
| | | 7.99%, 7/1/25 | | 11,056,452 |
| 10,375 | | Montgomery, PA, Industrial Development Authority, | | |
| | | (Advancement of Geriatric Health Care Institute), | | |
| | | 8.375%, 7/1/23 | | 10,391,808 |
| 3,500 | | Orange County, FL, Health Facilities Authority, | | |
| | | (Westminster Community Care), 6.75%, 4/1/34 | | 3,598,805 |
| Principal Amount | | |
| (000’s omitted) | | Security | | Value |
|
| |
| Nursing Home (continued) | | |
|
| $ 2,125 | | Westmoreland, PA, (Highland Health Systems, Inc.), | | |
| | | 9.25%, 6/1/22 | | $ 2,129,611 |
|
| | | | | $ 55,531,720 |
|
| |
| Other Revenue — 5.1% | | |
|
| $ 20,000 | | Golden State Tobacco Securitization Corp., CA, | | |
| | | 5.50%, 6/1/33(1) | | $ 21,928,300 |
| 21,900 | | Golden State Tobacco Securitization Corp., CA, | | |
| | | 5.50%, 6/1/43(1) | | 24,011,489 |
| 22,600 | | Golden State Tobacco Securitization Corp., CA, | | |
| | | 5.625%, 6/1/38(1) | | 24,922,828 |
| 91,335 | | Golden State Tobacco Securitization Corp., CA, | | |
| | | 5.75%, 6/1/47 | | 87,157,337 |
| 10,000 | | Main Street National Gas Inc., GA, Series A, | | |
| | | 5.50%, 9/15/28(5) | | 10,531,100 |
| 31,700 | | Michigan Tobacco Settlement Finance Authority, | | |
| | | 6.00%, 6/1/48 | | 31,692,075 |
| 12,000 | | Non-Profit Preferred Funding Trust, Various States, | | |
| | | Series B, 4.47%, 9/15/37(2) | | 11,824,320 |
| 19,000 | | Non-Profit Preferred Funding Trust, Various States, | | |
| | | Series C, 4.72%, 9/15/37(2) | | 18,336,710 |
| 21,350 | | Northern Tobacco Securitization Corp., AK, | | |
| | | 0.00%, 6/1/46 | | 1,647,366 |
| 23,300 | | Silicon Valley Tobacco Securitization Authority, CA, | | |
| | | 0.00%, 6/1/36 | | 3,555,114 |
| 15,000 | | Silicon Valley Tobacco Securitization Authority, CA, | | |
| | | 0.00%, 6/1/41 | | 1,611,900 |
| 27,555 | | Silicon Valley Tobacco Securitization Authority, CA, Class A, | | |
| | | 0.00%, 6/1/47 | | 1,990,022 |
| 14,000 | | Silicon Valley Tobacco Securitization Authority, CA, Class B, | | |
| | | 0.00%, 6/1/47 | | 973,000 |
| 10,000 | | Texas Municipal Gas Acquisition and Supply Corp., Class I, | | |
| | | Variable Rate, 3.384%, 12/15/17(2)(4) | | 8,727,500 |
| 13,000 | | Texas Municipal Gas Acquisition and Supply Corp., Class I, | | |
| | | Variable Rate, 3.384%, 12/15/17(2)(4) | | 11,345,750 |
| 115,180 | | Tobacco Settlement Financing Corp., NJ, 0.00%, 6/1/41 | | 12,912,830 |
| 37,685 | | Tobacco Settlement Financing Corp., NJ, 4.75%, 6/1/34 | | 31,387,460 |
| 102,710 | | Tobacco Settlement Financing Corp., VA, 0.00%, 6/1/47 | | 7,978,513 |
| 2,275 | | Willacy County, TX, Local Government Corp., | | |
| | | 6.00%, 3/1/09 | | 2,325,915 |
| 3,745 | | Willacy County, TX, Local Government Corp., | | |
| | | 6.00%, 9/1/10 | | 3,816,043 |
|
| | | | | $ 318,675,572 |
|
| |
| Pooled Loans — 0.4% | | |
|
| $ 25,530 | | Rickenbacker Port Authority, OH, Oasbo Expanded Asset | | |
| | | Pool Loan, 5.375%, 1/1/32(1) | | $ 27,181,706 |
|
| | | | | $ 27,181,706 |
|
S e e n o t e s t o f i n a n c i a l s t a t e m e n t s
10
Eaton Vance National Municipals Fund a s o f S e p t e m b e r 3 0 , 2 0 0 7
P O R T F O L I O O F I N V E S T M E N T S C O N T ’ D |
| Principal Amount | | |
| (000’s omitted) | | Security | | Value |
|
| |
| Senior Living / Life Care — 1.0% | | |
|
| $ 9,380 | | Albuquerque, NM, Retirement Facilities, (La Vida Liena | | |
| | | Retirement Center), 6.60%, 12/15/28 | | $ 9,696,856 |
| 6,035 | | Arizona Health Facilities Authority, (Care Institute, | | |
| | | Inc. - Mesa), 7.625%, 1/1/26(7) | | 5,759,683 |
| 6,680 | | Glen Cove, NY, Industrial Development Agency, | | |
| | | (The Regency at Glen Cove), 9.50%, 7/1/12(7) | | 6,054,552 |
| 600 | | Kansas City, MO, Industrial Development Authority, | | |
| | | (Kingswood United Methodist Manor), | | |
| | | 5.375%, 11/15/09 | | 595,446 |
| 9,345 | | New Jersey Economic Development Authority, (Forsgate), | | |
| | | (AMT), 8.625%, 6/1/25(7) | | 7,932,223 |
| 12,590 | | North Miami, FL, Health Care Facilities Revenue, | | |
| | | (Imperial Club), 6.125%, 1/1/42 | | 12,143,810 |
| 7,915 | | Roseville, MN, Elder Care Facility, (Care Institute, | | |
| | | Inc. - Roseville), 7.75%, 11/1/23(7) | | 7,382,241 |
| 12,140 | | St. Paul, MN, Housing and Redevelopment Authority, | | |
| | | (Care Institute, Inc. - Highland), 8.75%, 11/1/24(7) | | 11,904,848 |
|
| | | | | $ 61,469,659 |
|
| |
| Special Tax Revenue — 1.0% | | |
|
| $ 6,000 | | New Jersey Economic Development Authority, | | |
| | | (Cigarette Tax), 5.50%, 6/15/24 | | $ 6,148,140 |
| 10,000 | | New Jersey Economic Development Authority, | | |
| | | (Cigarette Tax), 5.75%, 6/15/29 | | 10,471,800 |
| 1,815 | | New Jersey Economic Development Authority, | | |
| | | (Cigarette Tax), 5.75%, 6/15/34 | | 1,906,984 |
| 463,895 | | Puerto Rico Sales Tax Financing, Series A, | | |
| | | 0.00%, 8/1/56 | | 37,440,965 |
| 4,045 | | University Square, FL, Community Development District, | | |
| | | 6.75%, 5/1/20 | | 4,198,427 |
|
| | | | | $ 60,166,316 |
|
| |
| Transportation — 2.0% | | |
|
| $ 101,500 | | Port Authority of New York and New Jersey, | | |
| | | 4.75%, 4/15/37(1) | | $ 98,825,475 |
| 30,345 | | Port Authority of New York and New Jersey, (AMT), | | |
| | | 4.75%, 12/1/34 | | 29,538,733 |
|
| | | | | $ 128,364,208 |
|
| |
| Water and Sewer — 3.9% | | |
|
| $ 27,660 | | Massachusetts Water Resources Authority, | | |
| | | 4.00%, 8/1/46 | | $ 23,865,601 |
| 16,000 | | New York City, NY, Municipal Water Finance Authority, | | |
| | | 4.25%, 6/15/33 | | 15,021,920 |
| 64,280 | | New York City, NY, Municipal Water Finance Authority, | | |
| | | (Water and Sewer System), 4.50%, 6/15/37 | | 62,378,598 |
| Principal Amount | | |
| (000’s omitted) | | Security | | Value |
|
| Water and Sewer (continued) | | |
|
| $ 121,150 | | New York City, NY, Municipal Water Finance Authority, | | |
| | | (Water and Sewer System), 4.75%, 6/15/33(1) | | $ 121,700,021 |
| 23,625 | | New York City, NY, Municipal Water Finance Authority, | | |
| | | (Water and Sewer System), 4.75%, 6/15/38 | | 23,681,936 |
|
| | | | | $ 246,648,076 |
|
| |
| Total Tax-Exempt Investments | | |
| (identified cost $6,873,542,972) | | $6,979,495,855 |
|
| |
| S h o r t - Te r m I n v e s t m e n t s — 0 . 3 % | | |
| |
| Principal Amount | | |
| (000’s omitted) | | Security | | Value |
|
| $ 18,125 | | Massachusetts Development Finance Agency, | | |
| | | (Wentworth Institute), Variable Rate, 6.00%, 10/1/33(8) | | $ 18,125,000 |
|
| |
| Total Short-Term Investments | | |
| (identified cost $18,125,000) | | $ 18,125,000 |
|
| |
| Total Investments — 111.2% | | |
| (identified cost $6,891,667,972) | | $6,997,620,855 |
|
| |
| Other Assets, Less Liabilities — (11.2)% | | $ (703,912,933) |
|
| |
| Net Assets — 100.0% | | $6,293,707,922 |
|
AGC - Assured Guaranty Corp.
AMBAC - AMBAC Financial Group, Inc.
AMT - Interest earned from these securities may be considered a tax preference item for purposes of the Federal Alternative Minimum Tax.
CIFG - CIFG Assurance North America, Inc.
FGIC - Financial Guaranty Insurance Company
FSA - Financial Security Assurance, Inc.
MBIA - Municipal Bond Insurance Association
At September 30, 2007, the concentration of the Fund’s investments in the various states, determined as a percentage of net assets, is as follows:
| New York | | 18.7% |
| California | | 18.0% |
| Texas | | 12.1% |
| Others, representing less than 10% individually | | 62.4% |
S e e n o t e s t o f i n a n c i a l s t a t e m e n t s
11
Eaton Vance National Municipals Fund a s o f S e p t e m b e r 3 0 , 2 0 0 7
P O R T F O L I O O F I N V E S T M E N T S C O N T ’ D |
The Fund invests primarily in debt securities issued by municipalities. The ability of the issuers of the debt securities to meet their obligations may be affected by economic developments in a specific industry or municipality. In order to reduce the risk associated with such economic developments, at September 30, 2007, 47.0% of total investments are backed by bond insurance of various financial institutions and financial guaranty assurance agencies. The aggregate percentage insured by an individual financial institution ranged from 0.8% to 15.7% of total investments.
| (1) | Security represents the underlying municipal obligation of an inverse floating rate obligation held by the Fund. |
| |
| (2) | Security exempt from registration under Rule 144A of the Securities Act of 1933. These securities may be sold in transactions exempt from registration, normally to qualified institutional buyers. At September 30, 2007, the aggregate value of the securities is $141,550,070 or 2.2% of the Fund’s net assets. |
| |
| (3) | Security (or a portion thereof) has been segregated to cover payable for when-issued securities. |
| |
| (4) | Security has been issued as a leveraged inverse floater bond. The stated interest rate represents the rate in effect at September 30, 2007. |
| |
| (5) | When-issued security. |
| |
| (6) | Security (or a portion thereof) has been segregated to cover margin requirements on open financial futures contracts. |
| |
| (7) | Security is in default with respect to scheduled principal payments. |
| |
| (8) | Variable rate demand obligation. The stated interest rate represents the rate in effect at September 30, 2007. |
| |
S e e n o t e s t o f i n a n c i a l s t a t e m e n t s
12
Eaton Vance National Municipals Fund a s o f S e p t e m b e r 3 0 , 2 0 0 7
F I N A N C I A L S T A T E M E N T S |
| S t a t e m e n t o f A s s e t s a n d L i a b i l i t i e s | | |
| |
| As of September 30, 2007 | | | | |
| Assets | | | | |
|
| Investments, at value (identified cost, $6,891,667,972) | | $6,997,620,855 |
| Cash | | | | 810,960 |
| Receivable for investments sold | | | | 64,092,106 |
| Receivable for Fund shares sold | | | | 22,300,660 |
| Interest receivable | | | | 81,023,555 |
| Receivable for open interest rate swap contracts | | | | 2,777,133 |
|
| |
| Total assets | | $7,168,625,269 |
|
| |
| Liabilities | | | | |
|
| Payable for floating rate notes issued | | $ 763,890,950 |
| Payable for investments purchased | | | | 30,605,356 |
| Payable for when-issued securities | | | | 35,421,826 |
| Payable for Fund shares redeemed | | | | 15,268,185 |
| Interest expense and fees payable | | | | 8,594,757 |
| Dividends payable | | | | 8,563,351 |
| Payable for open interest rate swap contracts | | | | 109,884 |
| Payable for closed interest rate swap contracts | | | | 5,991,117 |
| Payable to affiliate for distribution and service fees | | | | 4,145,155 |
| Payable to affiliate for investment advisory fee | | | | 1,593,815 |
| Accrued expenses | | | | 732,951 |
|
| |
| Total liabilities | | $ 874,917,347 |
|
| |
| Net assets | | $6,293,707,922 |
|
| |
| Sources of Net Assets | | | | |
|
| Paid-in capital | | $6,161,072,330 |
| Accumulated undistributed net realized gain | | | | |
| (computed on the basis of identified cost) | | | | 12,130,016 |
| Accumulated undistributed net investment income | | | | 7,463,123 |
| Net unrealized appreciation (computed on the basis of identified cost) | | | | 113,042,453 |
|
| |
| Total | | $6,293,707,922 |
|
| |
| Class A Shares | | | | |
|
| Net Assets | | $4,647,177,131 |
| Shares Outstanding | | | | 404,537,014 |
| Net Asset Value and Redemption Price Per Share | | | | |
| (net assets ÷ shares of beneficial interest outstanding) | | $ 11.49 |
| Maximum Offering Price Per Share | | | | |
| (100 ÷ 95.25 of $11.49) | | $ 12.06 |
|
| |
| Class B Shares | | | | |
|
| Net Assets | | $ 173,175,768 |
| Shares Outstanding | | | | 15,078,003 |
| Net Asset Value and Offering Price Per Share* | | | | |
| (net assets ÷ shares of beneficial interest outstanding) | | $ 11.49 |
|
| |
| Class C Shares | | | | |
|
| Net Assets | | $1,334,054,048 |
| Shares Outstanding | | | | 116,150,637 |
| Net Asset Value and Offering Price Per Share* | | | | |
| (net assets ÷ shares of beneficial interest outstanding) | | $ 11.49 |
|
| |
| Class I Shares | | | | |
|
| Net Assets | | $ 139,300,975 |
| Shares Outstanding | | | | 12,123,471 |
| Net Asset Value, Offering Price and Redemption Price Per Share | | | | |
| (net assets ÷ shares of beneficial interest outstanding) | | $ 11.49 |
|
On sales of $25,000 or more, the offering price of Class A shares is reduced.
* Redemption price per share is equal to the net asset value less any applicable contingent deferred sales charge.
| S t a t e m e n t o f O p e r a t i o n s | | |
| |
| For the Year Ended | | |
| September 30, 2007 | | |
| | |
| Investment Income | | |
|
| Interest | | $ 315,838,164 |
|
| Total investment income | | $ 315,838,164 |
|
| |
| |
| Expenses | | |
|
| Investment adviser fee | | $ 17,648,068 |
| Trustees’ fees and expenses | | 33,013 |
| Distribution and service fees | | |
| Class A | | 10,307,515 |
| Class B | | 1,637,307 |
| Class C | | 11,342,789 |
| Interest expense and fees | | 34,697,607 |
| Transfer and dividend disbursing agent fees | | 1,905,936 |
| Custodian fee | | 827,009 |
| Registration fees | | 367,915 |
| Printing and postage | | 301,386 |
| Legal and accounting services | | 219,836 |
| Miscellaneous | | 164,743 |
|
| Total expenses | | $ 79,453,124 |
|
| Deduct — | | |
| Reduction of custodian fee | | $ 344,590 |
| Allocation of expenses to investment adviser | | 22,477 |
|
| Total expense reductions | | $ 367,067 |
|
| |
| Net expenses | | $ 79,086,057 |
|
| |
| Net investment income | | $ 236,752,107 |
|
| |
| |
| Realized and Unrealized Gain (Loss) | | |
|
| Net realized gain (loss) — | | |
| Investment transactions (identified cost basis) | | $ (27,997,819) |
| Financial futures contracts | | 27,938,831 |
| Interest rate swap contracts | | (10,090,784) |
|
| Net realized loss | | $ (10,149,772) |
|
| Change in unrealized appreciation (depreciation) — | | |
| Investments (identified cost basis) | | $(195,145,880) |
| Financial futures contracts | | 23,790,071 |
| Interest rate swap contracts | | 2,667,249 |
|
| Net change in unrealized appreciation (depreciation) | | $(168,688,560) |
|
| |
| Net realized and unrealized loss | | $(178,838,332) |
|
| |
| Net increase in net assets from operations | | $ 57,913,775 |
|
S e e n o t e s t o f i n a n c i a l s t a t e m e n t s
13
Eaton Vance National Municipals Fund a s o f S e p t e m b e r 3 0 , 2 0 0 7
F I N A N C I A L S T A T E M E N T S C O N T ’ D |
| S t a t e m e n t s o f C h a n g e s i n N e t A s s e t s | | |
| |
| |
| Increase (Decrease) | | Year Ended | | Year Ended |
| in Net Assets | | September 30, 2007 | | September 30, 2006 |
|
| From operations — | | | | | | |
| Net investment income | | $ 236,752,107 | | $ 155,263,037 |
| Net realized gain (loss) | | | | | | |
| from investment transactions, | | | | | | |
| financial futures contracts and | | | | | | |
| interest rate swap contracts | | (10,149,772) | | | | 70,533,392 |
| Net change in unrealized | | | | | | |
| appreciation (depreciation) | | | | | | |
| from investments, financial | | | | | | |
| futures contracts and | | | | | | |
| interest rate swap contracts | | (168,688,560) | | | | 73,862,460 |
|
| |
| Net increase in net assets from operations | | $ 57,913,775 | | $ 299,658,889 |
|
| Distributions to shareholders — | | | | | | |
| From net investment income | | | | | | |
| Class A | | $ (182,156,469) | | $ (118,051,895) |
| Class B | | (6,042,672) | | | | (4,320,365) |
| Class C | | (41,801,397) | | | | (20,894,988) |
| Class I | | (6,290,466) | | | | (2,101,962) |
|
| |
| Total distributions to shareholders | | $ (236,291,004) | | $ (145,369,210) |
|
| Transactions in shares of beneficial interest — | | | | | | |
| Proceeds from sale of shares | | | | | | |
| Class A | | $2,233,505,164 | | $1,268,188,085 |
| Class B | | 56,490,915 | | | | 61,402,718 |
| Class C | | 766,113,589 | | | | 420,877,219 |
| Class I | | 153,566,977 | | | | 71,850,088 |
| Net asset value of shares issued to | | | | | | |
| shareholders in payment of | | | | | | |
| distributions declared | | | | | | |
| Class A | | 111,268,215 | | | | 64,304,849 |
| Class B | | 3,456,739 | | | | 2,334,782 |
| Class C | | 23,191,417 | | | | 10,889,973 |
| Class I | | 5,032,964 | | | | 1,617,446 |
| Cost of shares redeemed | | | | | | |
| Class A | | (830,456,403) | | | | (342,257,371) |
| Class B | | (20,291,846) | | | | (10,711,188) |
| Class C | | (199,151,037) | | | | (63,309,338) |
| Class I | | (96,464,039) | | | | (8,201,000) |
| Net asset value of shares exchanged | | | | | | |
| Class A | | 2,291,497 | | | | 1,388,451 |
| Class B | | (2,291,497) | | | | (1,388,451) |
|
| |
| Net increase in net assets from Fund | | | | | | |
| share transactions | | $2,206,262,655 | | $1,476,986,263 |
|
| |
| |
| Net increase in net assets | | $2,027,885,426 | | $1,631,275,942 |
|
| | | Year Ended | | Year Ended |
| Net Assets | | September 30, 2007 | | September 30, 2006 |
|
| At beginning of year | | $4,265,822,496 | | $2,634,546,554 |
|
| At end of year | | $6,293,707,922 | | $4,265,822,496 |
|
| |
| Accumulated undistributed | | | | |
| net investment income | | | | | | |
| included in net assets | | | | | | |
|
| At end of year | | $ 7,463,123 | | $ 8,037,085 |
|
S e e n o t e s t o f i n a n c i a l s t a t e m e n t s
14
| | Eaton Vance National Municipals Fund a s o f S e p t e m b e r 3 0 , 2 0 0 7
F I N A N C I A L S T A T E M E N T S C O N T ’ D |
| S t a t e m e n t o f C a s h F l o w s | | | | |
| |
| |
| For the Year Ended | | | | |
| September 30, 2007 | | | | |
|
| Cash flows from operating activities | | | | |
| Net increase in net assets from operations | | $ 57,913,775 |
| Adjustments to reconcile net increase in net assets | | | | |
| from operations to net cash used in operating activities: | | | | |
| Investments purchased | | (6,245,954,425) |
| Investments sold | | | | 4,098,870,324 |
| Increase in short-term investments | | | | (18,125,000) |
| Net amortization of premium (discount) | | | | (18,072,290) |
| Increase in interest receivable | | | | (4,061,159) |
| Decrease in payable for investments purchased | | | | (21,815,275) |
| Increase in receivable for investments sold | | | | (63,797,106) |
| Increase in receivable for open interest rate swap contracts | | | | (2,777,133) |
| Decrease in miscellaneous receivable | | | | 19,678 |
| Increase in payable for closed interest rate swap contracts | | | | 3,209,117 |
| Increase in payable for open interest rate swap contracts | | | | 109,884 |
| Increase in payable to affiliate for investment advisory fee | | | | 251,077 |
| Increase in payable to affiliate for distribution and service fees | | | | 1,489,955 |
| Decrease in payable for when-issued securities | | | | (17,515,454) |
| Increase in accrued expenses | | | | 11,222 |
| Increase in interest expense and fees payable | | | | 1,734,052 |
| Net change in unrealized (appreciation) depreciation on investments | | 195,145,880 |
| Net realized (gain) loss on investments | | | | 27,997,819 |
|
| |
| Net cash used in operating activities | | $(2,005,365,059) |
|
| Cash flows from financing activities | | | | |
| Proceeds from shares sold | | $ 3,225,009,625 |
| Shares redeemed | | (1,146,897,441) |
| Cash distributions paid net of reinvestments | | | | (90,869,812) |
| Decrease in demand note payable | | | | (48,100,000) |
| Proceeds from secured borrowings | | | | 455,750,000 |
| Repayment of secured borrowings | | | | (388,777,000) |
|
| |
| Net cash provided by financing activities | | $ 2,006,115,372 |
|
| |
| |
| Net increase in cash | | $ 750,313 |
|
| |
| |
| Cash at beginning of year | | $ 60,647 |
|
| |
| |
| Cash at end of year | | $ 810,960 |
|
| |
| |
| Supplemental disclosure of | | | | |
| cash flow information: | | | | |
|
| Noncash financing activities not included herein consist of | | | | |
| reinvestment of dividends and distributions of : | | $ 142,949,335 |
|
S e e n o t e s t o f i n a n c i a l s t a t e m e n t s
15
Eaton Vance National Municipals Fund a s o f S e p t e m b e r 3 0 , 2 0 0 7
F I N A N C I A L S T A T E M E N T S C O N T ’ D |
| F i n a n c i a l H i g h l i g h t s | | | | | | | | | | |
| |
| | | Class A |
|
| | | Year Ended September 30, |
|
| | | 2007(1) | | 2006(1) | | 2005(1) | | 2004(1) | | 2003(1) |
|
| Net asset value — Beginning of year | | $ 11.780 | | $ 11.270 | | $ 10.920 | | $ 10.840 | | $ 10.920 |
|
| |
| |
| Income (loss) from operations | | | | | | | | | | |
|
| Net investment income | | $ 0.521 | | $ 0.565 | | $ 0.574 | | $ 0.654 | | $ 0.666 |
| Net realized and unrealized gain (loss) | | (0.290) | | 0.478 | | 0.355 | | 0.079 | | (0.105) |
|
| Total income from operations | | $ 0.231 | | $ 1.043 | | $ 0.929 | | $ 0.733 | | $ 0.561 |
|
| |
| |
| Less distributions | | | | | | | | | | |
|
| From net investment income | | $ (0.521) | | $ (0.533) | | $ (0.579) | | $ (0.653) | | $ (0.641) |
|
| Total distributions | | $ (0.521) | | $ (0.533) | | $ (0.579) | | $ (0.653) | | $ (0.641) |
|
| |
| Net asset value — End of year | | $ 11.490 | | $ 11.780 | | $ 11.270 | | $ 10.920 | | $ 10.840 |
|
| |
| Total Return(2) | | 1.95% | | 9.50% | | 8.69% | | 6.94% | | 5.46% |
|
| |
| |
| Ratios/Supplemental Data | | | | | | | | | | |
|
| Net assets, end of year (000’s omitted) | | $4,647,177 | | $3,259,363 | | $2,147,435 | | $1,769,191 | | $236,885 |
| Ratios (As a percentage of average daily net assets): | | | | | | | | | | |
| Expenses excluding interest and fees | | 0.64%(3) | | 0.72% | | 0.77%(4) | | 0.79%(4) | | 0.78%(4) |
| Interest and fee expense(5) | | 0.62% | | 0.61% | | 0.44%(4) | | 0.33%(4) | | 0.27%(4) |
| Total expenses before custodian fee reduction | | 1.26%(3) | | 1.33% | | 1.21%(4) | | 1.12%(4) | | 1.05%(4) |
| Expenses after custodian fee reduction excluding interest and fees | | 0.63%(3) | | 0.71% | | 0.76%(4) | | 0.79%(4) | | 0.78%(4) |
| Net investment income | | 4.44% | | 4.93% | | 5.14% | | 6.05% | | 6.29% |
| Portfolio Turnover of the Portfolio(6) | | — | | — | | — | | 9% | | 22% |
| Portfolio Turnover of the Fund | | 65% | | 58% | | 54% | | — | | — |
|
| (1) | Net investment income per share was computed using average shares outstanding. |
| |
| (2) | Returns are historical and are calculated by determining the percentage change in net asset value with all distributions reinvested. |
| |
| (3) | The investment adviser was allocated a portion of the Fund’s operating expenses (equal to less than 0.005% of average daily net assets for the year ended September 30, 2007). Absent this allocation, total return would be lower. |
| |
| (4) | Includes the Fund’s share of the Portfolio’s allocated expenses while the Fund was making investments directly into the Portfolio. |
| |
| (5) | Interest and fee expense primarily relates to the liability for floating rate notes issued in conjunction with inverse floater securities transactions (See Note 1I). |
| |
| (6) | Portfolio turnover represents the rate of portfolio activity for the period while the Fund was making investments directly into the Portfolio. |
| |
| S e e n o t e s t o f i n a n c i a l s t a t e m e n t s |
16
Eaton Vance National Municipals Fund a s o f S e p t e m b e r 3 0 , 2 0 0 7
F I N A N C I A L S T A T E M E N T S C O N T ’ D |
| F i n a n c i a l H i g h l i g h t s | | | | | | | | | | |
| |
| | | Class B |
|
| | | Year Ended September 30, |
|
| | | 2007(1) | | 2006(1) | | 2005(1) | | 2004(1) | | 2003(1) |
|
| Net asset value — Beginning of year | | $ 11.780 | | $ 11.270 | | $10.920 | | $10.850 | | $ 10.920 |
|
| |
| |
| Income (loss) from operations | | | | | | | | | | |
|
| Net investment income | | $ 0.434 | | $ 0.478 | | $ 0.482 | | $ 0.598 | | $ 0.622 |
| Net realized and unrealized gain (loss) | | (0.290) | | 0.480 | | 0.364 | | 0.063 | | (0.097) |
|
| Total income from operations | | $ 0.144 | | $ 0.958 | | $ 0.846 | | $ 0.661 | | $ 0.525 |
|
| |
| |
| Less distributions | | | | | | | | | | |
|
| From net investment income | | $ (0.434) | | $ (0.448) | | $ (0.496) | | $ (0.595) | | $ (0.601) |
|
| Total distributions | | $ (0.434) | | $ (0.448) | | $ (0.496) | | $ (0.595) | | $ (0.601) |
|
| |
| Contingent deferred sales charges | | $ — | | $ — | | $ — | | $ 0.004 | | $ 0.006 |
|
| |
| Net asset value — End of year | | $ 11.490 | | $ 11.780 | | $11.270 | | $10.920 | | $ 10.850 |
|
| |
| Total Return(2) | | 1.20% | | 8.69% | | 8.15%(3) | | 6.25% | | 5.17% |
|
| |
| |
| Ratios/Supplemental Data | | | | | | | | | | |
|
| Net assets, end of year (000’s omitted) | | $173,176 | | $140,593 | | $83,629 | | $29,577 | | $1,553,297 |
| Ratios (As a percentage of average daily net assets): | | | | | | | | | | |
| Expenses excluding interest and fees | | 1.39%(4) | | 1.47% | | 1.52%(5) | | 1.17%(5) | | 1.20%(5) |
| Interest and fee expense(6) | | 0.62% | | 0.61% | | 0.44%(5) | | 0.33%(5) | | 0.27%(5) |
| Total expenses before custodian fee reduction | | 2.01%(4) | | 2.08% | | 1.96%(5) | | 1.50%(5) | | 1.47%(5) |
| Expenses after custodian fee reduction excluding interest and fees | | 1.38%(4) | | 1.46% | | 1.51%(5) | | 1.17%(5) | | 1.20%(5) |
| Net investment income | | 3.69% | | 4.17% | | 4.30% | | 5.44% | | 5.88% |
| Portfolio Turnover of the Portfolio(7) | | — | | — | | — | | 9% | | 22% |
| Portfolio Turnover of the Fund | | 65% | | 58% | | 54% | | — | | — |
|
| (1) | Net investment income per share was computed using average shares outstanding. |
| |
| (2) | Returns are historical and are calculated by determining the percentage change in net asset value with all distributions reinvested. |
| |
| (3) | Total return reflects an increase of 0.19% due to a change in the timing of the payment and reinvestment of distributions. |
| |
| (4) | The investment adviser was allocated a portion of the Fund’s operating expenses (equal to less than 0.005% of average daily net assets for the year ended September 30, 2007). Absent this allocation, total return would be lower. |
| |
| (5) | Includes the Fund’s share of the Portfolio’s allocated expenses while the Fund was making investments directly into the Portfolio. |
| |
| (6) | Interest and fee expense primarily relates to the liability for floating rate notes issued in conjunction with inverse floater securities transactions (See Note 1I). |
| |
| (7) | Portfolio turnover represents the rate of portfolio activity for the period while the Fund was making investments directly into the Portfolio. |
| |
| S e e n o t e s t o f i n a n c i a l s t a t e m e n t s |
17
Eaton Vance National Municipals Fund a s o f S e p t e m b e r 3 0 , 2 0 0 7
F I N A N C I A L S T A T E M E N T S C O N T ’ D |
| F i n a n c i a l H i g h l i g h t s | | | | | | | | | | |
| |
| | | Class C |
|
| | | Year Ended September 30, |
|
| | | 2007(1) | | 2006(1) | | 2005(1) | | 2004(1) | | 2003(1) |
|
| Net asset value — Beginning of year | | $ 11.780 | | $ 11.270 | | $ 10.920 | | $ 10.840 | | $ 10.920 |
|
| |
| |
| Income (loss) from operations | | | | | | | | | | |
|
| Net investment income | | $ 0.431 | | $ 0.480 | | $ 0.486 | | $ 0.565 | | $ 0.587 |
| Net realized and unrealized gain (loss) | | (0.287) | | 0.478 | | 0.360 | | 0.087 | | (0.101) |
|
| Total income from operations | | $ 0.144 | | $ 0.958 | | $ 0.846 | | $ 0.652 | | $ 0.486 |
|
| |
| |
| Less distributions | | | | | | | | | | |
|
| From net investment income | | $ (0.434) | | $ (0.448) | | $ (0.496) | | $ (0.572) | | $ (0.566) |
|
| Total distributions | | $ (0.434) | | $ (0.448) | | $ (0.496) | | $ (0.572) | | $ (0.566) |
|
| |
| Net asset value — End of year | | $ 11.490 | | $ 11.780 | | $ 11.270 | | $ 10.920 | | $ 10.840 |
|
| |
| Total Return(2) | | 1.20% | | 8.69% | | 7.99%(3) | | 6.15% | | 4.71% |
|
| |
| |
| Ratios/Supplemental Data | | | | | | | | | | |
|
| Net assets, end of year (000’s omitted) | | $1,334,054 | | $783,143 | | $388,276 | | $224,955 | | $200,310 |
| Ratios (As a percentage of average daily net assets): | | | | | | | | | | |
| Expenses excluding interest and fees | | 1.39%(4) | | 1.47% | | 1.52%(5) | | 1.53%(5) | | 1.53%(5) |
| Interest and fee expense(6) | | 0.62% | | 0.61% | | 0.44%(5) | | 0.33%(5) | | 0.27%(5) |
| Total expenses before custodian fee reduction | | 2.01%(4) | | 2.08% | | 1.96%(5) | | 1.86%(5) | | 1.80%(5) |
| Expenses after custodian fee reduction excluding interest and fees | | 1.38%(4) | | 1.46% | | 1.51%(5) | | 1.53%(5) | | 1.53%(5) |
| Net investment income | | 3.68% | | 4.18% | | 4.35% | | 5.19% | | 5.54% |
| Portfolio Turnover of the Portfolio(7) | | — | | — | | — | | 9% | | 22% |
| Portfolio Turnover of the Fund | | 65% | | 58% | | 54% | | — | | — |
|
| (1) | Net investment income per share was computed using average shares outstanding. |
| |
| (2) | Returns are historical and are calculated by determining the percentage change in net asset value with all distributions reinvested. |
| |
| (3) | Total return reflects an increase of 0.10% due to a change in the timing of the payment and reinvestment of distributions. |
| |
| (4) | The investment adviser was allocated a portion of the Fund’s operating expenses (equal to less than 0.005% of average daily net assets for the year ended September 30, 2007). Absent this allocation, total return would be lower. |
| |
| (5) | Includes the Fund’s share of the Portfolio’s allocated expenses while the Fund was making investments directly into the Portfolio. |
| |
| (6) | Interest and fee expense primarily relates to the liability for floating rate notes issued in conjunction with inverse floater securities transactions (See Note 1I). |
| |
| (7) | Portfolio turnover represents the rate of portfolio activity for the period while the Fund was making investments directly into the Portfolio. |
| |
| S e e n o t e s t o f i n a n c i a l s t a t e m e n t s |
18
Eaton Vance National Municipals Fund a s o f S e p t e m b e r 3 0 , 2 0 0 7
F I N A N C I A L S T A T E M E N T S C O N T ’ D |
| F i n a n c i a l H i g h l i g h t s | | | | | | | | | | |
| |
| | | Class I |
|
| | | Year Ended September 30, |
|
| | | 2007(1) | | 2006(1) | | 2005(1) | | 2004(1) | | 2003(1) |
|
| Net asset value — Beginning of year | | $ 11.780 | | $11.270 | | $10.920 | | $10.850 | | $10.910 |
|
| |
| |
| Income (loss) from operations | | | | | | | | | | |
|
| Net investment income | | $ 0.549 | | $ 0.601 | | $ 0.590 | | $ 0.673 | | $ 0.693 |
| Net realized and unrealized gain (loss) | | (0.289) | | 0.471 | | 0.368 | | 0.078 | | (0.088) |
|
| Total income from operations | | $ 0.260 | | $ 1.072 | | $ 0.958 | | $ 0.751 | | $ 0.605 |
|
| |
| |
| Less distributions | | | | | | | | | | |
|
| From net investment income | | $ (0.550) | | $ (0.562) | | $ (0.608) | | $ (0.681) | | $ (0.665) |
|
| Total distributions | | $ (0.550) | | $ (0.562) | | $ (0.608) | | $ (0.681) | | $ (0.665) |
|
| |
| Net asset value — End of year | | $ 11.490 | | $11.780 | | $11.270 | | $10.920 | | $10.850 |
|
| |
| Total Return(2) | | 2.20% | | 9.77% | | 8.92% | | 7.17% | | 5.84% |
|
| |
| |
| Ratios/Supplemental Data | | | | | | | | | | |
|
| Net assets, end of year (000’s omitted) | | $139,301 | | $82,723 | | $15,208 | | $ 5,400 | | $ 2,414 |
| Ratios (As a percentage of average daily net assets): | | | | | | | | | | |
| Expenses excluding interest and fees | | 0.39%(3) | | 0.47% | | 0.52%(4) | | 0.53%(4) | | 0.53%(4) |
| Interest and fee expense(5) | | 0.62% | | 0.61% | | 0.44%(4) | | 0.33%(4) | | 0.27%(4) |
| Total expenses before custodian fee reduction | | 1.01%(3) | | 1.08% | | 0.96%(4) | | 0.86%(4) | | 0.80%(4) |
| Expenses after custodian fee reduction excluding interest and fees | | 0.38%(3) | | 0.46% | | 0.51%(4) | | 0.53%(4) | | 0.53%(4) |
| Net investment income | | 4.68% | | 5.22% | | 5.27% | | 6.18% | | 6.54% |
| Portfolio Turnover of the Portfolio(6) | | — | | — | | — | | 9% | | 22% |
| Portfolio Turnover of the Fund | | 65% | | 58% | | 54% | | — | | — |
|
| (1) | Net investment income per share was computed using average shares outstanding. |
| |
| (2) | Returns are historical and are calculated by determining the percentage change in net asset value with all distributions reinvested. |
| |
| (3) | The investment adviser was allocated a portion of the Fund’s operating expenses (equal to less than 0.005% of average daily net assets for the year ended September 30, 2007). Absent this allocation, total return would be lower. |
| |
| (4) | Includes the Fund’s share of the Portfolio’s allocated expenses while the Fund was making investments directly into the Portfolio. |
| |
| (5) | Interest and fee expense primarily relates to the liability for floating rate notes issued in conjunction with inverse floater securities transactions (See Note 1I). |
| |
| (6) | Portfolio turnover represents the rate of portfolio activity for the period while the Fund was making investments directly into the Portfolio. |
| |
| S e e n o t e s t o f i n a n c i a l s t a t e m e n t s |
19
Eaton Vance National Municipals Fund a s o f S e p t e m b e r 3 0 , 2 0 0 7
N O T E S T O F I N A N C I A L S T A T E M E N T S |
1 Significant Accounting Policies
Eaton Vance National Municipals Fund (the Fund) is a diversified series of Eaton Vance Municipals Trust (the Trust). The Trust is an entity of the type commonly known as a Massachusetts business trust and is registered under the Investment Company Act of 1940, as amended (the 1940 Act), as an open-end management investment company. The Fund’s investment objective is to provide current income exempt from regular federal income tax. The Fund offers four classes of shares. Class A shares are generally sold subject to a sales charge imposed at time of purchase. Class B and Class C shares are sold at net asset value and are subject to a contingent deferred sales charge (see Note 5). Class B shares of the Fund automatically convert to Class A shares eight years after their purchase as described in the Fund’s prospectus. Class I shares are sold at net asset value. Each class represents a pro-rata interest in the Fund, but votes separately on class-specific matters and (as noted below) is sub ject to different expenses. Realized and unrealized gains and losses are allocated daily to each class of shares based on the relative net assets of each class to the total net assets of the Fund. Net investment income, other than class-specific expenses, is allocated daily to each class of shares based upon the ratio of the value of each class’s paid shares to the total value of all paid shares. Each class of shares differs in its distribution plan and certain other class-specific expenses.
The following is a summary of significant accounting policies of the Fund. The policies are in conformity with accounting principles generally accepted in the United States of America.
A Investment Valuation — Municipal bonds and taxable obligations, if any, are generally valued on the basis of valuations furnished by a pricing service. Financial futures contracts and options on financial futures contracts listed on commodity exchanges are valued at closing settlement prices. Interest rate swaps are generally valued on the basis of valuations furnished by a pricing service. Short-term obligations, maturing in sixty days or less, are valued at amortized cost, which approximates market value. Investments for which valuations or market quotations are not readily available, and investments for which the price of a security is not believed to represent its fair market value, are valued at fair value using methods determined in good faith by or at the direction of the Trustees.
B Investment Transactions and Related Income — Investment transactions for financial statement purposes are accounted for on a trade date basis. Realized gains and losses on investments sold are determined on the basis of identified cost. Interest income is recorded on the basis of interest accrued, adjusted for amortization of premium or accretion of discount.
C Federal Taxes —The Fund's policy is to comply with the provisions of the Internal Revenue Code applicable to regulated investment companies and to distribute to shareholders each year substantially all of its taxable, if any, and tax-exempt net investment income, and all or substantially all of its net realized capital gains. Accordingly, no provision for federal income or excise tax is necessary. The Fund intends to satisfy conditions which will enable it to designate distributions from the interest income generated by its investments in municipal obligations, which are exempt from regular federal income taxes when received by the Fund, as exempt-interest dividends. The portion of such interest, if any, earned on private activity bonds issued after August 7, 1986, may be considered a tax preference item to shareholders.
At September 30, 2007, the Fund, for federal income tax purposes, had a capital loss carryforward of $2,604,551 which will reduce taxable income arising from future net realized gains on investment transactions, if any, to the extent permitted by the Internal Revenue Code, and thus will reduce the amount of the distributions to shareholders which would otherwise be necessary to relieve the Fund of any liability for federal income or excise tax. Such capital loss carryforward will expire on September 30, 2013. During the year ended September 30, 2007, capital loss carryforwards of $5,084,175 were utilized to offset net realized gains.
D Expenses — The majority of expenses of the Trust are directly identifiable to an individual fund. Expenses which are not readily identifiable to a specific fund are allocated taking into consideration, among other things, the nature and type of expense and the relative size of the funds.
E Expense Reduction — State Street Bank and Trust Company (SSBT) serves as custodian of the Fund. Pursuant to the custodian agreement, SSBT receives a fee reduced by credits, which are determined based on the average daily cash balance the Fund maintains with SSBT. All credit balances, if any, used to reduce the Fund’s custodian fees are reported as a reduction of expenses in the Statement of Operations.
20
Eaton Vance National Municipals Fund a s o f S e p t e m b e r 3 0 , 2 0 0 7
N O T E S T O F I N A N C I A L S T A T E M E N T S C O N T ’ D |
F Legal Fees — Legal fees and other related expenses incurred as part of negotiations of the terms and requirement of capital infusions, or that are expected to result in the restructuring of, or a plan of reorganization for, an investment are recorded as realized losses. Ongoing expenditures to protect or enhance an investment are treated as operating expenses.
G Use of Estimates — The preparation of the financial statements in conformity with accounting principles generally accepted in the United States of America requires management to make estimates and assumptions that affect the reported amounts of assets and liabilities at the date of the financial statements and the reported amounts of income and expense during the reporting period. Actual results could differ from those estimates.
H Indemnifications — Under the Trust's organizational documents, its officers and Trustees may be indemnified against certain liabilities and expenses arising out of the performance of their duties to the Fund, and shareholders are indemnified against personal liability for obligations of the Trust. Additionally, in the normal course of business, the Fund enters into agreements with service providers that may contain indemnification clauses. The Fund’s maximum exposure under these arrangements is unknown as this would involve future claims that may be made against the Fund that have not yet occurred.
I Floating Rate Notes Issued in Conjunction with Securities Held — The Fund may invest in inverse floating rate securities, whereby the Fund may sell a fixed rate bond to a broker for cash. At the same time, the Fund buys a residual interest in the assets and cash flows of a Special Purpose Vehicle (which is generally organized as a trust), (the SPV) set up by the broker, often referred to as an inverse floating rate obligation (Inverse Floater). The broker deposits a fixed rate bond into the SPV with the same CUSIP number as the fixed rate bond sold to the broker by the Fund, and which may have been, but is not required to be, the fixed rate bond purchased from the Fund (the Fixed Rate Bond). The SPV also issues floating rate notes (Floating Rate Notes) which are sold to third-parties. The Fund may enter into shortfall and forbearance agreements with the broker by which the Fund agrees to reimburse the broker, in certain circumstances, for the difference between the liquidation val ue of the Fixed Rate Bond held by the SPV and the liquidation value of the Floating Rate Notes, as well as any shortfalls in interest cash flows. The Inverse Floater held by the Fund gives the Fund the right (1) to cause the holders of the Floating Rate Notes to tender their notes at par, and (2) to have the broker transfer the Fixed Rate Bond held by the SPV to the Fund, thereby collapsing the SPV. Pursuant to Financial Accounting Standards Board (FASB) Statement No. 140, “Accounting for Transfers and Servicing of Financial Assets and Extinguishment of Liabilities” (FAS 140), the Fund accounts for the transaction described above as a secured borrowing by including the Fixed Rate Bond in its Portfolio of Investments, and the Floating Rate Notes as a liability under the caption “Payable for floating rate notes issued” in its Statement of Assets and Liabilities. The Floating Rate Notes have interest rates that generally reset weekly and their holders have the option to tender their notes to the broker for redemption at par at each reset date. Interest expense related to the Fund’s liability with respect to Floating Rate Notes is recorded as incurred. At September 30, 2007, the amount of the Fund’s Floating Rate Notes outstanding and the related collateral were $763,890,950 and $1,170,280,235, respectively. The range of interest rates on the Floating Rate Notes outstanding for the year ended September 30, 2007 was 3.84% to 4.01% .
The Fund’s investment policies and restrictions expressly permit investments in Inverse Floaters. Inverse floating rate securities typically offer the potential for yields exceeding the yields available on fixed rate bonds with comparable credit quality and maturity. The Fund’s investment policies do not allow the Fund to borrow money for purposes of making investments. Management believes that the Fund’s restrictions on borrowings do not apply to the secured borrowings deemed to have occurred for accounting purposes pursuant to FAS 140, which is distinct from a legal borrowing of the Fund to which the policies apply. Inverse Floaters held by the Fund are securities exempt from registration under Rule 144A of the Securities Act of 1933.
J Financial Futures Contracts — The Fund may enter into financial futures contracts. The Fund’s investment in financial futures contracts is designed for hedging against changes in interest rates or as a substitute for the purchase of securities. Upon entering into a financial futures contract, the Fund is required to deposit with the broker, either in cash or securities an amount equal to a certain percentage of the purchase price (initial margin). Subsequent payments, known as variation margin, are made or received by the Fund each business day, depending on the daily fluctuations in the value of the underlying security, and are recorded as unrealized
21
Eaton Vance National Municipals Fund a s o f S e p t e m b e r 3 0 , 2 0 0 7
N O T E S T O F I N A N C I A L S T A T E M E N T S C O N T ’ D |
gains or losses by the Fund. Gains (losses) are realized upon the expiration or closing of the financial futures contracts. Should market conditions change unexpectedly, the Fund may not achieve the anticipated benefits of the financial futures contracts and may realize a loss. In entering such contracts, the Fund bears the risk if the counterparties do not perform under the contracts’ terms.
K Interest Rate Swaps — The Fund may enter into interest rate swap agreements to enhance return, to hedge against fluctuations in securities prices or interest rates, or as substitution for the purchase or sale of securities. Pursuant to these agreements, the Fund makes periodic payments at a fixed interest rate and, in exchange, receives payments based on the interest rate of a benchmark industry index. During the term of the outstanding swap agreement, changes in the underlying value of the swap are recorded as unrealized gains or losses. The value of the swap is determined by changes in the relationship between two rates of interest. The Fund is exposed to credit loss in the event of non-performance by the swap counterparty. Risk may also arise from movements in interest rates.
L When-Issued Securities and Delayed Delivery Transactions — The Fund may purchase or sell securities on a delayed delivery or when-issued basis. Payment and delivery may take place after the customary settlement period for that security. At the time the transaction is negotiated, the price of the security that will be delivered is fixed. The Fund maintains security positions for these commitments such that sufficient liquid assets will be available to make payments upon settlement. Securities purchased on a delayed delivery or when-issued basis are marked-to-market daily and begin earning interest on settlement date. Losses may arise due to changes in the market value of the underlying securities or if the counterparty does not perform under the contract.
M Statement of Cash Flows — The cash amount shown in the Statement of Cash Flows is the amount included in the Fund’s Statement of Assets and Liabilities and represents cash on hand at its custodian and does not include any short-term investments.
2 Distributions to Shareholders
The net income of the Fund is determined daily and substantially all of the net income so determined is declared as a dividend to shareholders of record at the time of declaration. Distributions are declared separately for each class of shares. Distributions are paid monthly. Distributions of realized capital gains, if any, are made at least annually. Shareholders may reinvest income and capital gain distributions in additional shares of the same class of the Fund at the net asset value as of the reinvestment date. Distributions are paid in the form of additional shares of the same class or, at the election of the shareholder, in cash. The Fund distinguishes between distributions on a tax basis and a financial reporting basis. Accounting principles generally accepted in the United States of America require that only distributions in excess of tax basis earnings and profits be reported in the financial statements as a return of capital. Permanent differences between book and tax accounting relat ing to distributions are reclassified to paid-in capital.
The tax character of distributions paid for the years ended September 30, 2007 and September 30, 2006 was as follows:
| | | Year Ended September 30, |
| |
|
| | | 2007 | | 2006 |
|
| Distributions declared from: | | | | |
| Tax-exempt income | | $236,019,090 | | $145,271,981 |
| Ordinary Income | | $ 271,914 | | $ 97,229 |
During the year ended September 30, 2007, accumulated undistributed net realized gain was increased by $1,035,065 and accumulated undistributed net investment income was decreased by $1,035,065 due to differences between book and tax accounting, primarily for accretion of market discount. These reclassifications had no effect on the net assets or net asset value per share of the Fund.
As of September 30, 2007, the components of distributable earnings (accumulated losses) and unrealized appreciation (depreciation) on a tax basis were as follows:
| Undistributed income | | $ 16,026,474 |
| Capital loss carryforwards | | $ (2,604,551) |
| Unrealized appreciation (depreciation) | | $ 127,777,020 |
| Other temporary differences | | $ (8,563,351) |
The differences between components of distributable earnings (accumulated losses) on a tax basis and the amounts reflected in the Statement of Assets and Liabilities are primarily due to wash sales, dividends payable, and differences between book and tax accounting for futures contracts, accretion of market discount and inverse floaters.
22
Eaton Vance National Municipals Fund a s o f S e p t e m b e r 3 0 , 2 0 0 7
N O T E S T O F I N A N C I A L S T A T E M E N T S C O N T ’ D |
3 Investment Adviser Fee and Other Transactions with Affiliates
The investment adviser fee is earned by Boston Management and Research (BMR), a subsidiary of Eaton Vance Management (EVM), as compensation for management and investment advisory services rendered to the Fund. The fee is based upon a percentage of average daily net assets plus a percentage of gross income (i.e., income other than gains from the sale of securities) and is payable monthly. For the year ended September 30, 2007, the advisory fee amounted to $17,648,068 representing 0.32% of the Fund’s average daily net assets. Pursuant to a voluntary expense reimbursement, BMR was allocated $22,477 of the Fund’s operating expenses. EVM serves as the Administrator of the Fund, but receives no compensation. EVM serves as the sub-transfer agent of the Fund and receives from the transfer agent an aggregate fee based upon the actual expenses incurred by EVM in the performance of these services. For the year ended September 30, 2007, EVM earned $106,046 in sub-transfer agent fees. The Fund was informed that Eaton Vance Distributors, Inc. (EVD), the Fund’s principal underwriter and a subsidiary of EVM, received $1,176,886 as its portion of the sales charge on sales of Class A shares for the year ended September 30, 2007. EVD also received distribution and service fees from Class A, Class B and Class C shares (see Note 4) and contigent deferred sales charges (see Note 5).
Except as to Trustees of the Fund who are not members of EVM’s or BMR’s organizations, officers and Trustees receive remuneration for their services to the Fund out of the investment advisory fee. Trustees of the Fund who are not affiliated with the investment adviser may elect to defer receipt of all or a percentage of their annual fees in accordance with the terms of the Trustee Deferred Compensation Plan. For the year ended September 30, 2007, no significant amounts have been deferred. Certain officers and Trustees of the Fund are officers of the above organizations.
4 Distribution Plans
The Fund has in effect a distribution plan for Class A shares (Class A Plan) pursuant to Rule 12b-1 under the 1940 Act. The Class A Plan provides that the Fund will pay EVD a distribution and service fee of 0.25% per annum of its average daily net assets attributable to Class A shares for distribution services and facilities provided to the Fund by EVD, as well as for personal services and/or the maintenance of shareholder accounts. Distribution and service fees paid or accrued for the year ended September 30, 2007 amounted to $10,307,515 for Class A shares. The Fund also has in effect distribution plans for Class B shares (Class B Plan) and Class C shares (Class C Plan) pursuant to Rule 12b-1 under the 1940 Act. The Class B and Class C Plans require the Fund to pay EVD amounts equal to 0.75% per annum of its average daily net assets attributable to Class B and Class C shares for providing ongoing distribution services and facilities to the Fund. The Fund will automatically discontinue payments to EVD during any period in which there are no outstanding Uncovered Distribution Charges, which are equivalent to the sum of (i) 5% and 6.25% of the aggregate amount received by the Fund for the Class B and Class C shares sold, respectively, plus (ii) interest calculated by applying the rate of 1% over the prevailing prime rate to the outstanding balance of Uncovered Distribution Charges of EVD of each respective class, reduced by the aggregate amount of contingent deferred sales charges (see Note 5) and amounts theretofore paid or payable to EVD by each respective class. For the year ended September 30, 2007, the Fund paid or accrued $1,227,980 and $8,507,092 for Class B and Class C shares, respectively, to or payable to EVD, representing 0.75% of the average daily net assets for Class B and Class C shares. At September 30, 2007, the amount of Uncovered Distribution Charges of EVD calculated under the Plans was approximately $6,060,000 and $108,405,000 for Class B and Class C shares, respectively. The Cla ss B and Class C Plans also authorize the Fund to make payments of service fees to EVD, investment dealers and other persons in amounts not exceeding 0.25% per annum of the average daily net assets attributable to that Class. Service fees paid or accrued are for personal services and/or the maintenance of shareholder accounts. They are separate and distinct from the Class B and Class C sales commissions and distribution fees and, as such, are not subject to automatic discontinuance when there are no outstanding Uncovered Distribution Charges of EVD. Service fees paid or accrued for the year ended September 30, 2007 amounted to $409,327 and $2,835,697 for Class B and Class C shares, respectively.
5 Contingent Deferred Sales Charges
A contingent deferred sales charge (CDSC) generally is imposed on redemptions of Class B shares made within six years of purchase and on redemptions of Class C shares within one year of purchase. Class A shares may be subject to a 1% CDSC if redeemed within eighteen months of purchase (depending upon the circumstances of purchase) or a 1% or 0.50% CDSC if redeemed within
23
Eaton Vance National Municipals Fund a s o f S e p t e m b e r 3 0 , 2 0 0 7
N O T E S T O F I N A N C I A L S T A T E M E N T S C O N T ’ D |
one year or two years, respectively, on purchases through the Eaton Vance Supplemental Retirement Account. Generally, the CDSC is based upon the lower of the net asset value at date of redemption or date of purchase. No charge is levied on shares acquired by reinvestment of dividends or capital gains distributions. The CDSC for Class B is imposed at declining rates that begin at 5% in the case of redemptions in the first and second year after purchase, declining one percentage point each subsequent year. Class C shares are subject to a 1% CDSC if redeemed within one year of purchase. No CDSC is levied on shares which have been sold to EVM or its affiliates or to their respective employees or clients and may be waived under certain other limited conditions. CDSCs received on Class B and Class C redemptions are paid to EVD to reduce the amount of Uncovered Distribution Charges calculated under the Fund’s Class B and Class C Plans. CDSCs received on Class B and Class C redemptions when no Unc overed Distribution Charges exist will be credited to the Fund. For the year ended September 30, 2007, the Fund was informed that EVD received approximately $476,000, $441,000 and $479,000 of CDSCs paid by Class A, Class B and Class C shareholders, respectively.
6 Purchases and Sales of Investments
Purchases and sales of investments, other than short-term obligations, aggregated $6,245,954,425 and $4,098,870,324, respectively, for the year ended September 30, 2007.
7 Shares of Beneficial Interest
The Fund’s Declaration of Trust permits the Trustees to issue an unlimited number of full and fractional shares of beneficial interest (without par value). Such shares may be issued in a number of different series (such as the Fund) and classes. Transactions in Fund shares were as follows:
| | | Year Ended September 30, |
| |
|
| Class A | | 2007 | | 2006 |
|
| Sales | | 189,691,358 | | 110,289,109 |
| Issued to shareholders electing | | | | |
| to receive payments of | | | | |
| distributions in Fund shares | | 9,476,225 | | 5,604,798 |
| Redemptions | | (71,518,537) | | (29,882,391) |
| Exchange from Class B shares | | 194,923 | | 120,481 |
|
| Net increase | | 127,843,969 | | 86,131,997 |
|
| | | Year Ended September 30, |
| |
|
| Class B | | 2007 | | 2006 |
|
| Sales | | 4,783,820 | | 5,366,218 |
| Issued to shareholders electing | | | | |
| to receive payments of | | | | |
| distributions in Fund shares | | 294,204 | | 203,492 |
| Redemptions | | (1,741,522) | | (933,733) |
| Exchange to Class A shares | | (194,824) | | (121,217) |
|
| Net increase | | 3,141,678 | | 4,514,760 |
|
| |
| | | Year Ended September 30, |
| |
|
| Class C | | 2007 | | 2006 |
|
| Sales | | 64,875,259 | | 36,607,877 |
| Issued to shareholders electing | | | | |
| to receive payments of | | | | |
| distributions in Fund shares | | 1,976,652 | | 948,550 |
| Redemptions | | (17,186,330) | | (5,524,603) |
|
| Net increase | | 49,665,581 | | 32,031,824 |
|
| |
| | | Year Ended September 30, |
| |
|
| Class I | | 2007 | | 2006 |
|
| Sales | | 13,051,397 | | 6,247,874 |
| Issued to shareholders electing | | | | |
| to receive payments of | | | | |
| distributions in Fund shares | | 428,041 | | 140,108 |
| Redemptions | | (8,376,899) | | (716,111) |
|
| Net increase | | 5,102,539 | | 5,671,871 |
|
8 Federal Income Tax Basis of Unrealized Appreciation (Depreciation)
The cost and unrealized appreciation (depreciation) of investments at September 30, 2007, as determined on a federal income tax basis, were as follows:
| Aggregate cost | | $6,108,620,134 |
|
| Gross unrealized appreciation | | $ 222,897,807 |
| Gross unrealized depreciation | | (97,788,036) |
|
| Net unrealized appreciation | | $ 125,109,771 |
|
9 Line of Credit
The Fund participates with other portfolios and funds managed by EVM and its affiliates in a $200 million unsecured line of credit agreement with a group of banks. Borrowings will be made by the Fund solely to facilitate the handling of unusual and/or unanticipated
24
Eaton Vance National Municipals Fund a s o f S e p t e m b e r 3 0 , 2 0 0 7
N O T E S T O F I N A N C I A L S T A T E M E N T S C O N T ’ D |
short-term cash requirements. Interest is charged to the Fund based on its borrowings at an amount above either the Eurodollar rate or Federal Funds rate. In addition, a fee computed at an annual rate of 0.07% on the daily unused portion of the line of credit is allocated among the participating portfolios and funds at the end of each quarter. The average borrowings by the Fund and the average interest rate for the year ended September 30, 2007 were $17,022,192 and 5.75%, respectively.
10 Financial Instruments
The Fund may trade in financial instruments with off-balance sheet risk in the normal course of its investing activities to assist in managing exposure to various market risks. These financial instruments include financial futures contracts and interest rate swaps and may involve, to a varying degree, elements of risk in excess of the amounts recognized for financial statement purposes. The notional or contractual amounts of these instruments represent the investment the Fund has in particular classes of financial instruments and does not necessarily represent the amounts potentially subject to risk. The measurement of the risks associated with these instruments is meaningful only when all related and offsetting transactions are considered.
A summary of obligations under these financial instruments at September 30, 2007 is as follows:
| Futures Contracts | | | | | | | | | | | | |
|
| | | | | | | | | | | | | | | Net |
| Expiration | | | | | | | | Aggregate | | | | | | Unrealized |
| Date | | Contracts | | Position | | Cost | | Value | | | | Appreciation |
|
| |
| 12/07 | | 22,000 U.S. | | | | | | | | | | | | |
| | | Treasury Bond | | Short | | $(2,453,984,821) | | $(2,449,562,500) | | | | $4,422,321 |
|
| |
| |
| Interest Rate Swaps | | | | | | | | | | | | |
|
| | | | | | | Annual | | | | | | | | |
| | | | | | | Fixed | | | | | | Net Unrealized |
| | | Notional | | | | Rate Paid | | Floating Rate | | Effective Date/ | | Appreciation |
| Counterparty | | Amount | | | | By Fund | | Paid To Fund | | Termination Date | | (Depreciation) |
|
| Lehman | | | | | | | | 3-month | | September 28, 2008/ | | | | |
| Brothers, Inc. | | $ 40,150,000 | | 5.503% | | USD-LIBOR-BBA | | September 28, 2038 | | $ (109,884) |
|
| | | | | | | | USD-BMA | | | | | | |
| Lehman | | | | | | | | Municipal | | October 23, 2007/ | | | | |
| Brothers, Inc. | | $ 55,000,000 | | 3.896% | | Swap Index | | October 23, 2037 | | $1,500,069 |
|
| Merrill Lynch | | | | | | | | | | | | | | |
| Capital | | | | | | | | 3-month | | July 9, 2008/ | | | | |
| Services, Inc. | | $100,000,000 | | 5.426% | | USD-LIBOR-BBA | | July 9, 2038 | | $ 565,319 |
|
| Morgan Stanley | | | | | | | | | | | | |
| Capital | | | | | | | | 3-month | | September 10, 2008/ | | | | |
| Services, Inc. | | $100,000,000 | | 5.428% | | USD-LIBOR-BBA | | September 10, 2038 | | $ 711,745 |
|
| | | | | | | | | | | | | $2,667,249 |
|
The effective date represents the date on which the Fund and the counterparty to the interest rate swap contract begin interest payment accruals.
At September 30, 2007, the Fund had sufficient cash and/or securities to cover commitments under these contracts.
11 Recently Issued Accounting Promouncements
In June 2006, the FASB issued FASB Interpretation No. 48 (FIN 48), “Accounting for Uncertainty in Income Taxes – an interpretation of FASB Statement No. 109”. FIN 48 clarifies the accounting for uncertainty in income taxes recognized in accordance with FASB Statement No. 109, “Accounting for Income Taxes”. This interpretation prescribes a recognition threshold and measurement attribute for the financial statement recognition and measurement of a tax position taken or expected to be taken in a tax return. It also provides guidance on de-recognition, classification, interest and penalties, accounting in interim periods, disclosure and transition. FIN 48 is effective on the last business day of the first required financial reporting period for fiscal years beginning after December 15, 2006. Management is currently evaluating the impact of applying the various provisions of FIN 48.
In September 2006, the FASB issued Statement of Financial Accounting Standards No. 157 (FAS 157), “Fair Value Measurements”. FAS 157 defines fair value, establishes a framework for measuring fair value in accordance with generally accepted accounting principles and expands disclosure about fair value measurements. FAS 157 is effective for fiscal years beginning after November 15, 2007. Management is currently evaluating the impact the adoption of FAS 157 will have on the Fund’s financial statement disclosures.
25
Eaton Vance National Municipals Fund a s o f S e p t e m b e r 3 0 , 2 0 0 7
REPORT OF INDEPENDENT REGISTERED PUBLIC ACCOUNTING FIRM |
To the Trustees of Eaton Vance Municipals
Trust and Shareholders of Eaton Vance National
Municipals Fund
We have audited the accompanying statement of assets and
liabilities, including the portfolio of investments, of Eaton Vance
National Municipals Fund (one of the series of Eaton Vance
Municipals Trust) (“the Fund”) as of September 30, 2007, and
the related statement of operations and cash flows for the year
then ended, the statements of changes in net assets for each of
the two years in the period then ended, and the financial
highlights for each of the five years in the period then ended.
These financial statements and financial highlights are the
responsibility of the Fund’s management. Our responsibility is to
express an opinion on the financial statements and financial
highlights based on our audits.
We conducted our audits in accordance with the standards of
the Public Company Accounting Oversight Board (United
States). Those standards require that we plan and perform the
audit to obtain reasonable assurance about whether the
financial statements and financial highlights are free of material
misstatement. The Fund is not required to have, nor were we
engaged to perform, an audit of its internal control over
financial reporting. Our audits included consideration of internal
control over financial reporting as a basis for designing audit
procedures that are appropriate in the circumstances, but not for
the purpose of expressing an opinion on the effectiveness of the
Fund’s internal control over financial reporting. Accordingly, we
express no such opinion. An audit also includes examining, on a
test basis, evidence supporting the amounts and disclosures in
the financial statements, assessing the accounting principles
used and significant estimates made by management, as well as
evaluating the overall financial statement presentation. Our
procedures included confirmation of securities owned at
September 30, 2007, by correspondence with the custodian and
brokers; where replies were not received from brokers, we
performed other auditing procedures. We believe that our audits
provide a reasonable basis for our opinion.
In our opinion, the financial statements and financial highlights
referred to above present fairly, in all material respects, the
financial position of the Eaton Vance National Municipals Fund
as of September 30, 2007, the results of its operations and cash
flows for the year then ended, the changes in its net assets for
each of the two years in the period then ended, and its financial
highlights for each of the five years in the period then ended, in
conformity with accounting principles generally accepted in the
United States of America. |
DELOITTE & TOUCHE LLP
Boston, Massachusetts
November 15, 2007 |
26
Eaton Vance National Municipals Fund a s o f S e p t e m b e r 3 0 , 2 0 0 7
F E D E R A L T A X I N F O R M A T I O N ( U n a u d i t e d ) |
The Form 1099-DIV you receive in January 2008 will show the tax status of all distributions paid to your account in calendar 2007. Shareholders are advised to consult their own tax adviser with respect to the tax consequences of their investment in the Fund. As required by the Internal Revenue Code regulations, shareholders must be notified within 60 days of the Fund’s fiscal year-end regarding exempt-interest dividends and capital gains dividends.
Exempt-Interest Dividends — The Fund designated 99.88% of dividends from net investment income as an exempt-interest dividend.
27
Eaton Vance National Municipals Fund
BOARD OF TRUSTEES’ ANNUAL APPROVAL OF THE INVESTMENT ADVISORY AGREEMENT |
Overview of the Contract Review Process
The Investment Company Act of 1940, as amended (the “1940 Act”), provides, in substance, that each investment advisory agreement between a fund and its investment adviser will continue in effect from year to year only if its continuance is approved at least annually by the fund’s board of trustees, including by a vote of a majority of the trustees who are not “interested persons” of the fund (“Independent Trustees”), cast in person at a meeting called for the purpose of considering such approval.
At a meeting of the Boards of Trustees (each a “Board”) of the Eaton Vance group of mutual funds (the “Eaton Vance Funds”) held on April 23, 2007, the Board, including a majority of the Independent Trustees, voted to approve continuation of existing advisory and sub-advisory agreements for the Eaton Vance Funds for an additional one-year period. In voting its approval, the Board relied upon the affirmative recommendation of the Special Committee of the Board, which is a committee comprised exclusively of Independent Trustees. Prior to making its recommendation, the Special Committee reviewed information furnished for a series of meetings of the Special Committee held in February, March and April 2007. Such information included, among other things, the following:
Information about Fees, Performance and Expenses
- An independent report comparing the advisory and related fees paid by each fund with fees paid by comparable funds;
- An independent report comparing each fund’s total expense ratio and its components to comparable funds;
- An independent report comparing the investment performance of each fund to the investment performance of comparable funds over various time periods;
- Data regarding investment performance in comparison to relevant peer groups of funds and appropriate indices;
- Comparative information concerning fees charged by each adviser for managing other mutual funds and institutional accounts using investment strategies and techniques similar to those used in managing the fund;
- Profitability analyses for each adviser with respect to each fund;
| | Information about Portfolio Management |
- Descriptions of the investment management services provided to each fund, including the investment strategies and processes employed;
- Information concerning the allocation of brokerage and the benefits received by each adviser as a result of brokerage allocation, including information concerning the acquisition of research through “soft dollar” benefits received in connection with the funds’ brokerage, and the implementation of a soft dollar reimbursement program established with respect to the funds;
- Data relating to portfolio turnover rates of each fund;
- The procedures and processes used to determine the fair value of fund assets and actions taken to monitor and test the effectiveness of such procedures and processes;
| | Information about each Adviser |
- Reports detailing the financial results and condition of each adviser;
- Descriptions of the qualifications, education and experience of the individual investment professionals whose responsibilities include portfolio management and investment research for the funds, and information relating to their compensation and responsibilities with respect to managing other mutual funds and investment accounts;
- Copies of the Codes of Ethics of each adviser and its affiliates, together with information relating to compliance with and the administration of such codes;
- Copies of or descriptions of each adviser’s proxy voting policies and procedures;
- Information concerning the resources devoted to compliance efforts undertaken by each adviser and its affiliates on behalf of the funds (including descriptions of various compliance programs) and their record of compliance with investment policies and restrictions, including policies with respect to market-timing, late trading and selective portfolio disclosure, and with policies on personal securities transactions;
- Descriptions of the business continuity and disaster recovery plans of each adviser and its affiliates;
| | Other Relevant Information |
- Information concerning the nature, cost and character of the administrative and other non-investment management services provided by Eaton Vance Management and its affiliates;
- Information concerning management of the relationship with the custodian, subcustodians and fund accountants by each adviser or the funds’ administrator; and
- The terms of each advisory agreement.
28
Eaton Vance National Municipals Fund
BOARD OF TRUSTEES’ ANNUAL APPROVAL OF THE INVESTMENT ADVISORY AGREEMENT CONT’D |
In addition to the information identified above, the Special Committee considered information provided from time to time by each adviser throughout the year at meetings of the Board and its committees. Over the course of the twelve-month period ended April 30, 2007, the Board met ten times and the Special Committee, the Audit Committee and the Governance Committee, each of which is a Committee comprised solely of Independent Trustees, met twelve, fourteen and eight times, respectively. At such meetings, the Trustees received, among other things, presentations by the portfolio managers and other investment professionals of each adviser relating to the investment performance of each fund and the investment strategies used in pursuing the fund’s investment objective.
For funds that invest through one or more underlying portfolios, the Board considered similar information about the portfolio(s) when considering the approval of advisory agreements. In addition, in cases where the fund’s investment adviser has engaged a sub-adviser, the Board considered similar information about the sub-adviser when considering the approval of any sub-advisory agreement.
The Special Committee was assisted throughout the contract review process by Goodwin Procter LLP, legal counsel for the Independent Trustees. The members of the Special Committee relied upon the advice of such counsel and their own business judgment in determining the material factors to be considered in evaluating each advisory and sub-advisory agreement and the weight to be given to each such factor. The conclusions reached with respect to each advisory and sub-advisory agreement were based on a comprehensive evaluation of all the information provided and not any single factor. Moreover, each member of the Special Committee may have placed varying emphasis on particular factors in reaching conclusions with respect to each advisory and sub-advisory agreement.
Results of the Process
Based on its consideration of the foregoing, and such other information as it deemed relevant, including the factors and conclusions described below, the Special Committee concluded that the continuance of the investment advisory agreement of the Eaton Vance National Municipals Fund (the “Fund”) with Boston Management and Research (the “Adviser”), including its fee structure, is in the interests of shareholders and, therefore, the Special Committee recommended to the Board approval of the agreement. The Board accepted the recommendation of the Special Committee as well as the factors considered and conclusions reached by the Special Committee with respect to the agreement. Accordingly, the Board, including a majority of the Independent Trustees, voted to approve continuation of the advisory agreement for the Fund.
Nature, Extent and Quality of Services
In considering whether to approve the investment advisory agreement of the Fund, the Board evaluated the nature, extent and quality of services provided to the Fund by the Adviser.
The Board considered the Adviser’s management capabilities and investment process with respect to the types of investments held by the Fund, including the education, experience and number of its investment professionals and other personnel who provide portfolio management, investment research, and similar services to the Fund, including recent changes to such personnel. In particular, the Board evaluated, where relevant, the abilities and experience of such investment personnel in analyzing factors such as credit risk, tax efficiency, and special considerations relevant to investing in municipal bonds. Specifically, the Board considered the Adviser’s 30-person municipal bond team, which includes six portfolio managers and nine credit specialists who provide services to the Funds. The Board also took into account the resources dedicated to portfolio management and other services, including the compensation paid to recruit and retain investment personnel, and the time and attention devo ted to the Fund by senior management.
The Board reviewed the compliance programs of the Adviser and relevant affiliates thereof. Among other matters, the Board considered compliance and reporting matters relating to personal trading by investment personnel, selective disclosure of portfolio holdings, late trading, frequent trading, portfolio valuation, business continuity and the allocation of investment opportunities. The Board also evaluated the responses of the Adviser and its affiliates to requests from regulatory authorities such as the Securities and Exchange Commission and the National Association of Securities Dealers.
The Board considered shareholder and other administrative services provided or managed by Eaton Vance Management and its affiliates, including transfer agency and accounting services. The Board evaluated the benefits to shareholders of investing in a fund that is a part of a large family of funds, including the ability, in many cases, to exchange an investment among different funds without incurring additional sales charges.
After consideration of the foregoing factors, among others, the Board concluded that the nature, extent and quality of services provided by the Adviser, taken as a whole, are appropriate and consistent with the terms of the investment advisory agreement.
29
| | Eaton Vance National Municipals Fund
BOARD OF TRUSTEES’ ANNUAL APPROVAL OF THE INVESTMENT ADVISORY AGREEMENT CONT’D |
Fund Performance
The Board compared the Fund’s investment performance to a relevant universe of similarly managed funds identified by an independent data provider and appropriate benchmark indices. The Board reviewed comparative performance data for the one-, three-, five- and ten- year periods ended September 30, 2006 for the Fund. On the basis of the foregoing and other relevant information, the Board concluded that the performance of the Fund was satisfactory.
Management Fees and Expenses
The Board reviewed contractual investment advisory fee rates, including any administrative fee rates, payable by the Fund (referred to collectively as “management fees”). As part of its review, the Board considered the Fund’s management fee and total expense ratio for the year ended September 30, 2006, as compared to a group of similarly managed funds selected by an independent data provider.
After reviewing the foregoing information, and in light of the nature, extent and quality of the services provided by the Adviser, the Board concluded with respect to the Fund that the management fees charged to the Fund for advisory and related services and the total expense ratio of the Fund are reasonable.
Profitability
The Board reviewed the level of profits realized by the Adviser and, if applicable, its affiliates in providing investment advisory and administrative services to the Fund and to all Eaton Vance Funds as a group. The Board considered the level of profits realized without regard to revenue sharing or other payments by the Adviser and its affiliates to third parties in respect of distribution services. The Board also considered other direct or indirect benefits received by the Adviser in connection with its relationship with the Fund.
The Board concluded that, in light of the foregoing factors and the nature, extent and quality of the services rendered, the profits realized by the Adviser and its affiliates are reasonable.
Economies of Scale
In reviewing management fees and profitability, the Board also considered the extent to which the Adviser and its affiliates, on the one hand, and the Fund, on the other hand, can expect to realize benefits from economies of scale as the assets of the Fund increase. The Board acknowledged the difficulty in accurately measuring the benefits resulting from the economies of scale with respect to the management of any specific fund or group of funds. The Board reviewed data summarizing the increases and decreases in the assets of the Fund and of all Eaton Vance Funds as a group over various time periods, and evaluated the extent to which the total expense ratio of the Fund and the Adviser’s profitability may have been affected by such increases or decreases. Based upon the foregoing, the Board concluded that the benefits from economies of scale are currently being shared equitably by the Adviser and the Fund. The Board also concluded that the structure of the advisory fee, which includes break points at several asset levels, can be expected to cause the Adviser and its affiliates and the Fund to continue to share such benefits equitably.
30
Eaton Vance National Municipals Fund
M A N A G E M E N T A N D O R G A N I Z A T I O N |
Fund Management. The Trustees of Eaton Vance Municipals Trust (the Trust) are responsible for the overall management and supervision of the Trust’s affairs. The Trustees and officers of the Trust are listed below. Except as indicated, each individual has held the office shown or other offices in the same company for the last five years. Trustees and officers of the Trust hold indefinite terms of office. The “noninterested Trustees” consist of those Trustees who are not “interested persons” of the Trust, as that term is defined under the 1940 Act. The business address of each Trustee and officer is The Eaton Vance Building, 255 State Street, Boston, Massachusetts 02109. As used below, “EVC” refers to Eaton Vance Corp., “EV” refers to Eaton Vance, Inc., “EVM” refers to Eaton Vance Management, “BMR” refers to Boston Management and Research and “EVD” refers to Eaton Vance Distributors, Inc. EVC and EV are the corporat e parent and trustee, respectively, of EVM and BMR. EVD is the Fund’s principal underwriter and a wholly-owned subsidiary of EVM. Each officer affiliated with Eaton Vance may hold a position with other Eaton Vance affiliates that is comparable to his or her position with EVM listed below.
| | | | | Term of | | | | Number of Funds | | |
| | | Position(s) | | Office and | | | | in Fund Complex | | |
| Name and | | with the | | Length of | | Principal Occupation(s) | | Overseen By | | |
| Date of Birth | | Trust | | Service | | During Past Five Years | | Trustee(1) | | Other Directorships Held |
|
| Interested Trustee | | | | | | | | |
| | | | | | | | | | |
| Thomas E. Faust Jr. | | Trustee | | Since 2007 | | Chairman, Chief Executive Officer and President of EVC, | | 176 | | Director of EVC |
| 5/31/58 | | | | | | President of EV, Chief Executive Officer and President of EVM | | | | |
| | | | | | | and BMR, and Director of EVD. Trustee and/or Officer of 176 | | | | |
| | | | | | | registered investment companies and 5 private investment | | | | |
| | | | | | | companies in the Eaton Vance Fund Complex. Mr. Faust is an | | | | |
| | | | | | | interested person because of his positions with EVM, BMR, | | | | |
| | | | | | | EVC and EV which are affiliates of the Trust. | | | | |
| |
| Noninterested Trustee(s) | | | | | | | | |
| | | | | | | | | | |
| Benjamin C. Esty | | Trustee | | Since 2005 | | Roy and Elizabeth Simmons Professor of Business | | 176 | | None |
| 1/2/63 | | | | | | Administration, Harvard University Graduate School of | | | | |
| | | | | | | Business Administration (since 2003). Formerly, Associate | | | | |
| | | | | | | Professor, Harvard University Graduate School of Business | | | | |
| | | | | | | Administration (2000-2003). | | | | |
| |
| Allen R. Freedman | | Trustee | | Since 2007 | | Former Chairman and Chief Executive Officer of Assurant, Inc. | | 175 | | Director of Assurant, Inc. and Stonemor Partners |
| 4/3/40 | | | | | | (insurance provider) (1978-2000). Formerly, a Director of | | | | L.P. (owner and operator of cemeteries) |
| | | | | | | Loring Ward International (fund distributor) (2005-2007). | | | | |
| |
| William H. Park | | Trustee | | Since 2003 | | Vice Chairman, Commercial Industrial Finance Corp. (specialty | | 176 | | None |
| 9/19/47 | | | | | | finance company) (since 2006). Formerly, President and | | | | |
| | | | | | | Chief Executive Officer, Prizm Capital Management, LLC | | | | |
| | | | | | | (investment management firm) (2002-2005). | | | | |
| |
| Ronald A. Pearlman | | Trustee | | Since 2003 | | Professor of Law, Georgetown University Law Center. | | 176 | | None |
| 7/10/40 | | | | | | | | | | |
| |
| Norton H. Reamer | | Trustee | | Since 1985 | | President, Chief Executive Officer and a Director of Asset | | 176 | | None |
| 9/21/35 | | | | | | Management Finance Corp. (a specialty finance company | | | | |
| | | | | | | serving the investment management industry) (since | | | | |
| | | | | | | October 2003). President, Unicorn Corporation (an | | | | |
| | | | | | | investment and financial advisory services company) (since | | | | |
| | | | | | | September 2000). Formerly, Chairman and Chief Operating | | | | |
| | | | | | | Officer, Hellman, Jordan Management Co., Inc. (an | | | | |
| | | | | | | investment management company) (2000-2003). Formerly, | | | | |
| | | | | | | Advisory Director of Berkshire Capital Corporation (investment | | | | |
| | | | | | | banking firm) (2002-2003). | | | | |
31
Eaton Vance National Municipals Fund
M A N A G E M E N T A N D O R G A N I Z A T I O N C O N T ’ D |
| | | | | Term of | | | | Number of Funds | | |
| | | Position(s) | | Office and | | | | in Fund Complex | | |
| Name and | | with the | | Length of | | Principal Occupation(s) | | Overseen By | | |
| Date of Birth | | Trust | | Service | | During Past Five Years | | Trustee(1) | | Other Directorships Held |
|
| Noninterested Trustee(s) (continued) | | | | |
| Heidi L. Steiger | | Trustee | | Since 2007 | | President, Lowenhaupt Global Advisors, LLC (global wealth | | 173 | | Director of Nuclear Electric Insurance Ltd. (nuclear |
| 7/8/53 | | | | | | management firm) (since 2005); Formerly, President and | | | | insurance provider) and Aviva USA |
| | | | | | | Contributing Editor, Worth Magazine (2004); Formerly, | | | | (insurance provider) |
| | | | | | | Executive Vice President and Global Head of Private Asset | | | | |
| | | | | | | Management (and various other positions), Neuberger | | | | |
| | | | | | | Berman (investment firm) (1986-2004). | | | | |
| |
| Lynn A. Stout | | Trustee | | Since 1998 | | Paul Hastings Professor of Corporate and Securities Law, | | 176 | | None |
| 9/14/57 | | | | | | University of California at Los Angeles School of Law. | | | | |
| |
| Ralph F. Verni | | Chairman of the | | Chairman of the Board | | Consultant and private investor. | | 176 | | None |
| 1/26/43 | | Board and Trustee | | since 2007 and Trustee | | | | | | |
| | | | | since 2005 | | | | | | |
| Principal Officers who are not Trustees |
| | | | | Term of | | |
| | | Position(s) | | Office and | | |
| Name and | | with the | | Length of | | Principal Occupation(s) |
| Date of Birth | | Trust | | Service | | During Past Five Years |
|
| Robert B. MacIntosh | | President | | Since 2005 | | Vice President of EVM and BMR. Officer of 89 registered investment companies |
| 1/22/57 | | | | | | managed by EVM or BMR. |
| |
| William H. Ahern, Jr. | | Vice President | | Since 2004 | | Vice President of EVM and BMR. Officer of 74 registered investment companies |
| 7/28/59 | | | | | | managed by EVM or BMR. |
| |
| Craig R. Brandon | | Vice President | | Since 2004 | | Vice President of EVM and BMR. Officer of 44 registered investment companies |
| 12/31/66 | | | | | | managed by EVM or BMR. |
| |
| Cynthia J. Clemson | | Vice President | | Since 2004 | | Vice President of EVM and BMR. Officer of 89 registered investment companies |
| 3/2/63 | | | | | | managed by EVM or BMR. |
| |
| Thomas M. Metzold | | Vice President | | Since 2004 | | Vice President of EVM and BMR. Officer of 43 registered investment companies |
| 8/5/58 | | | | | | managed by EVM or BMR. |
| |
| Adam A. Weigold | | Vice President | | Since 2007 | | Vice President of EVM and BMR. Officer of 70 registered investment companies |
| 3/22/75 | | | | | | managed by EVM and BMR. |
| |
| Barbara E. Campbell | | Treasurer | | Since 2005 | | Vice President of EVM and BMR. Officer of 176 registered investment companies |
| 6/19/57 | | | | | | managed by EVM and BMR. |
| |
| Maureen A. Gemma | | Secretary | | Since 2007 | | Deputy Chief Legal Officer of EVC, EVM and BMR, and Vice President of EVM and BMR. |
| 5/24/60 | | | | | | Officer of 176 registered investment companies managed by EVM or BMR. |
| |
| Paul M. O’Neil | | Chief | | Since 2004 | | Vice President of EVM and BMR. Officer of 176 registered investment companies |
| 7/11/53 | | Compliance Officer | | | | managed by EVM and BMR. |
(1) Includes both master and feeder funds in a master-feeder structure.
The SAI for the Fund includes additional information about the Trustees and officers of the Fund and the Portfolio and can be obtained without charge on Eaton Vance’s website at www.eatonvance.com or by calling 1-800-225-6265.
32
Investment Adviser of Eaton Vance National Municipals Fund
Boston Management and Research |
The Eaton Vance Building
255 State Street
Boston, MA 02109 |
Administrator of Eaton Vance National Municipals Fund
Eaton Vance Management |
The Eaton Vance Building
255 State Street
Boston, MA 02109 |
Principal Underwriter
Eaton Vance Distributors, Inc. |
The Eaton Vance Building
255 State Street
Boston, MA 02109
(617) 482-8260 |
Custodian
State Street Bank and Trust Company |
200 Clarendon Street
Boston, MA 02116 |
Transfer Agent
PFPC Inc.
Attn: Eaton Vance Funds
P.O. Box 9653
Providence, RI 02940-9653
(800) 262-1122 |
Independent Registered Public Accounting Firm
Deloitte & Touche LLP |
200 Berkeley Street
Boston, MA 02116-5022 |
Eaton Vance Municipals Trust
The Eaton Vance Building
255 State Street
Boston, MA 02109 |
This report must be preceded or accompanied by a current prospectus. Before investing, investors should consider carefully the Fund’s investment objective(s), risks, and charges and expenses. The Fund’s current prospectus contains this and other information about the Fund and is available through your financial advisor. Please read the prospectus carefully before you invest or send money. For further information please call 1-800-225-6265.