Exhibit (17)(a)(i)
EATON VANCE FLORIDA PLUS MUNICIPALS FUND
Supplement to Prospectus dated December 1, 2007 |
On June 16, 2008, the Board of Trustees of Eaton Vance Municipals Trust (the "Trust") voted to recommend that shareholders approve the merger of Eaton Vance Florida Plus Municipals Fund ("Florida Fund") into Eaton Vance National Municipals Fund ("National Fund"), a diversified national municipal bond fund with substantially similar investment objectives and policies to the Florida Fund. Specifically, the Board approved an Agreement and Plan of Reorganization ("Plan of Reorganization") with respect to the merger (the "Reorganization") as discussed in more detail below, subject to the approval of shareholders.
Under the terms of the Plan of Reorganization, Florida Fund will transfer all of its assets to National Fund in exchange for shares of National Fund, and National Fund will assume the liabilities of Florida Fund. Immediately following the exchange, which will be effected on the basis of the relative net asset values of the Funds, Florida Fund will distribute shares of National Fund to its shareholders pro rata in liquidation of Florida Fund. Shareholders of Florida Fund will become shareholders of National Fund by effectively having their Florida Fund shares exchanged for corresponding Class A, B or C shares of National Fund equal in value to their Florida Fund shares.
Shareholders of Florida Fund will be asked to approve the Reorganization at a meeting scheduled to be held on October 31, 2008. Approximately 60 days before the meeting, a Proxy Statement/Prospectus describing the Reorganization will be delivered to Florida Fund shareholders of record as of August 22, 2008.
It is expected that the Reorganization will be treated as a tax-free reorganization for federal tax purposes. Shareholders should consult their tax advisers regarding possible tax consequences of the Reorganization, including possible state and local tax consequences.
| June 30, 2008 &nbs p; | | TFC2/1PS |
EATON VANCE FLORIDA PLUS INSURED MUNICIPALS FUND
EATON VANCE HAWAII MUNICIPALS FUND
EATON VANCE HIGH YIELD MUNICIPALS FUND
EATON VANCE KANSAS MUNICIPALS FUND
Supplement to Prospectuses dated April 1, 2007 |
EATON VANCE HIGH YIELD MUNICIPALS FUND - CLASS I SHARES
Supplement to Prospectus dated May 8, 2007 |
EATON VANCE CALIFORNIA LIMITED MATURITY MUNICIPALS FUND
EATON VANCE FLORIDA PLUS LIMITED MATURITY MUNICIPALS FUND
EATON VANCE MASSACHUSETTS LIMITED MATURITY MUNICIPALS FUND
EATON VANCE NATIONAL LIMITED MATURITY MUNICIPALS FUND
EATON VANCE NEW JERSEY LIMITED MATURITY MUNICIPALS FUND
EATON VANCE NEW YORK LIMITED MATURITY MUNICIPALS FUND
EATON VANCE OHIO LIMITED MATURITY MUNICIPALS FUND
EATON VANCE PENNSYLVANIA LIMITED MATURITY MUNICIPALS FUND
Supplement to Prospectuses dated August 1, 2007 |
EATON VANCE ARIZONA MUNICIPALS FUND
EATON VANCE COLORADO MUNICIPALS FUND
EATON VANCE CONNECTICUT MUNICIPALS FUND
EATON VANCE MICHIGAN MUNICIPALS FUND
EATON VANCE MINNESOTA MUNICIPALS FUND
EATON VANCE NEW JERSEY MUNICIPALS FUND
EATON VANCE PENNSYLVANIA MUNICIPALS FUND
Supplement to Prospectus dated October 5, 2007 |
EATON VANCE ALABAMA MUNICIPALS FUND
EATON VANCE ARKANSAS MUNICIPALS FUND
EATON VANCE CALIFORNIA MUNICIPALS FUND
EATON VANCE FLORIDA PLUS MUNICIPALS FUND
EATON VANCE GEORGIA MUNICIPALS FUND
EATON VANCE KENTUCKY MUNICIPALS FUND
EATON VANCE LOUISIANA MUNICIPALS FUND
EATON VANCE MARYLAND MUNICIPALS FUND
EATON VANCE MASSACHUSETTS MUNICIPALS FUND
EATON VANCE MISSISSIPPI MUNICIPALS FUND
EATON VANCE MISSOURI MUNICIPALS FUND
EATON VANCE NEW YORK MUNICIPALS FUND
EATON VANCE NORTH CAROLINA MUNICIPALS FUND
EATON VANCE OHIO MUNICIPALS FUND
EATON VANCE OREGON MUNICIPALS FUND
EATON VANCE RHODE ISLAND MUNICIPALS FUND
EATON VANCE SOUTH CAROLINA MUNICIPALS FUND
EATON VANCE TENNESSEE MUNICIPALS FUND
EATON VANCE VIRGINIA MUNICIPALS FUND
EATON VANCE WEST VIRGINIA MUNICIPALS FUND
Supplement to Prospectuses dated December 1, 2007 |
EATON VANCE NATIONAL MUNICIPALS FUND
Supplement to Prospectus dated February 1, 2008 |
1. The following replaces the last two paragraphs under "Restrictions on Excessive Trading and Market Timing" under "Purchasing Shares":
The Boards of Trustees of the Eaton Vance funds have adopted policies to discourage short-term trading and market timing and to seek to minimize their potentially detrimental effects. Pursuant to these policies, if an investor (through one or more accounts) makes more than one round-trip exchange (exchanging from one fund to another fund and back again) within
90 days, it will be deemed to constitute market timing or excessive trading. Under the policies, each Fund or its principal underwriter will reject or cancel a purchase order, suspend or terminate the exchange privilege or terminate the ability of an investor to invest in the Eaton Vance funds if the Fund or the principal underwriter determines that a proposed transaction involves market timing or excessive trading that it believes is likely to be detrimental to the Fund. Each Fund and its principal underwriter use reasonable efforts to detect market timing and excessive trading activity, but they cannot ensure that they will be able to identify all cases of market timing and excessive trading. Each Fund or its principal underwriter may also reject or cancel any purchase order (including an exchange) from an investor or group of investors for any other reason. Decisions to reject or cancel purchase orders (including exchanges) in a Fund are inherently subjective and will be made in a manner bel ieved to be in the best interest of a Fund’s shareholders. No Eaton Vance fund has any arrangement to permit market timing.
The following fund share transactions generally are exempt from the market timing and excessive trading policy described above because each Fund and the principal underwriter believe they generally do not raise market timing or excessive trading concerns:
• transactions made pursuant to a systematic purchase plan or as the result of automatic reinvestment of dividends or distributions, or initiated by the Fund (e.g. for failure to meet applicable account minimums);
• transactions made by participants in employer sponsored retirement plans involving participant payroll or employer contributions or loan repayments, redemptions as part of plan terminations or at the direction of the plan, mandatory retirement distributions, or rollovers;
• transactions made by asset allocation and wrap programs where the adviser to the program directs transactions in the accounts participating in the program in concert with changes in a model portfolio; or
• transactions in shares of Eaton Vance Cash Management Fund, Eaton Vance Money Market Fund, Eaton Vance Tax Free Reserves, Eaton Vance Institutional Short Term Income Fund and Eaton Vance Institutional Short Term Treasury Fund.
It may be difficult for a Fund or the principal underwriter to identify market timing or excessive trading in omnibus accounts traded through financial intermediaries. The Funds and the principal underwriter have provided guidance to financial intermediaries (such as banks, broker-dealers, insurance companies and retirement administrators) concerning the application of the Eaton Vance funds’ market timing and excessive trading policies to Fund shares held in omnibus accounts maintained and administered by such intermediaries, including guidance concerning situations where market timing or excessive trading is considered to be detrimental to a Fund. Each Fund or its principal underwriter may rely on a financial intermediary’s policy to restrict market timing and excessive trading if it believes that policy is likely to prevent market timing that is likely to be detrimental to each Fund. Such policy may be more or less restrictive than a Fund’s policy. Although each Fund or the pri ncipal underwriter review trading activity at the omnibus account level for activity that indicates potential market timing or excessive trading activity, the Funds and the principal underwriter typically will not request or receive individual account data unless suspicious trading activity is identified. Each Fund and the principal underwriter generally rely on the financial intermediaries to monitor trading activity in good faith in accordance with their own or Fund policies. Each Fund and the principal underwriter cannot ensure that these financial intermediaries will in all cases apply the policies of the Funds or their own policies, as the case may be, to accounts under their control.
EATON VANCE CONNECTICUT MUNICIPALS FUND
EATON VANCE NEW JERSEY MUNICIPALS FUND
EATON VANCE PENNSYLVANIA MUNICIPALS FUND
Supplement to Prospectus dated October 5, 2007 |
EATON VANCE ALABAMA MUNICIPALS FUND
EATON VANCE CALIFORNIA MUNICIPALS FUND
EATON VANCE GEORGIA MUNICIPALS FUND
EATON VANCE MARYLAND MUNICIPALS FUND
EATON VANCE NEW YORK MUNICIPALS FUND
EATON VANCE NORTH CAROLINA MUNICIPALS FUND
EATON VANCE SOUTH CAROLINA MUNICIPALS FUND
EATON VANCE VIRGINIA MUNICIPALS FUND
Supplement to Prospectuses dated December 1, 2007 |
1. As of the date of this Supplement the Funds now offer Class I shares.
2. "Performance Information": No performance is shown for Class I shares because they have not been offered prior to the date of this Supplement.
3. The following is added to each Fund’s Shareholder Fees, Annual Fund Operating Expenses and Examples tables that appear in "Fund Fees and Expenses" under "Fund Summaries":
| Shareholder Fees (fees paid directly from your investment) | | Class I |
|
| Maximum Sales Charge (Load) (as a percentage of offering price) | | None |
| Maximum Deferred Sales Charge (Load) (as a percentage of the lower of net asset value at time of purchase or time of redemption) | | None |
| Maximum Sales Charge (Load) Imposed on Reinvested Distributions | | None |
| Exchange Fee | | None |
Annual Fund Operating Expenses (expenses that are deducted from Fund assets)
| Alabama Fund | | Class I | | California Fund | | Class I |
|
| Management Fees | | 0.29% | | Management Fees | | 0.45% |
| Distribution and Service (12b-1) Fees | | n/a | | Distribution and Service (12b-1) Fees | | n/a |
| Other Expenses (total including Interest Expense)* | | 0.42% | | Other Expenses (total including Interest Expense)* | | 0.47% |
| Interest Expense | | 0.16% | | Interest Expense | | 0.33% |
| Other Expenses (excluding Interest Expense) | | 0.26% | | Other Expenses (excluding Interest Expense) | | 0.14% |
| Total Annual Fund Operating Expenses | | 0.71% | | Total Annual Fund Operating Expenses | | 0.92% |
| Connecticut Fund | | Class I | | Georgia Fund | | Class I |
|
| Management Fees | | 0.38% | | Management Fees | | 0.33% |
| Distribution and Service (12b-1) Fees | | n/a | | Distribution and Service (12b-1) Fees | | n/a |
| Other Expenses (total including Interest Expense)* | | 0.47% | | Other Expenses (total including Interest Expense)* | | 0.52% |
| Interest Expense | | 0.27% | | Interest Expense | | 0.29% |
| Other Expenses (excluding Interest Expense) | | 0.20% | | Other Expenses (excluding Interest Expense) | | 0.23% |
| Total Annual Fund Operating Expenses | | 0.85% | | Total Annual Fund Operating Expenses | | 0.85% |
1
| Maryland Fund | | Class I | | New Jersey Fund | | Class I |
|
| Management Fees | | 0.34% | | Management Fees | | 0.43% |
| Distribution and Service (12b-1) Fees | | n/a | | Distribution and Service (12b-1) Fees | | n/a |
| Other Expenses (total including Interest Expense)* | | 0.65% | | Other Expenses (total including Interest Expense)* | | 0.58% |
| Interest Expense | | 0.41% | | Interest Expense | | 0.42% |
| Other Expenses (excluding Interest Expense) | | 0.24% | | Other Expenses (excluding Interest Expense) | | 0.16% |
| Total Annual Fund Operating Expenses | | 0.99% | | Total Annual Fund Operating Expenses | | 1.01% |
| New York Fund | | Class I | | North Carolina Fund | | Class I |
|
| Management Fees | | 0.43% | | Management Fees | | 0.35% |
| Distribution and Service (12b-1) Fees | | n/a | | Distribution and Service (12b-1) Fees | | n/a |
| Other Expenses (total including Interest Expense)* | | 0.62% | | Other Expenses (total including Interest Expense)* | | 0.80% |
| Interest Expense | | 0.48% | | Interest Expense | | 0.58% |
| Other Expenses (excluding Interest Expense) | | 0.14% | | Other Expenses (excluding Interest Expense) | | 0.22% |
| Total Annual Fund Operating Expenses | | 1.05% | | Total Annual Fund Operating Expenses | | 1.15% |
| Pennsylvania Fund | | Class I | | South Carolina Fund | | Class I |
|
| Management Fees | | 0.42% | | Management Fees | | 0.37% |
| Distribution and Service (12b-1) Fees | | n/a | | Distribution and Service (12b-1) Fees | | n/a |
| Other Expenses (total including Interest Expense)* | | 0.72% | | Other Expenses (total including Interest Expense)* | | 0.64% |
| Interest Expense | | 0.54% | | Interest Expense | | 0.45% |
| Other Expenses (excluding Interest Expense) | | 0.18% | | Other Expenses (excluding Interest Expense) | | 0.19% |
| Total Annual Fund Operating Expenses | | 1.14% | | Total Annual Fund Operating Expenses | | 1.01% |
| Virginia Fund | | Class I |
|
| Management Fees | | 0.37% |
| Distribution and Service (12b-1) Fees | | n/a |
| Other Expenses (total including Interest Expense)* | | 0.78% |
| Interest Expense | | 0.57% |
| Other Expenses (excluding Interest Expense) | | 0.21% |
| Total Annual Fund Operating Expenses | | 1.15% |
| * | "Other Expenses" for Class I is estimated. “Other Expenses” includes interest expense relating to each Fund’s liability with respect to floating rate notes held by third parties in conjunction with inverse floater securities transactions by the Fund. Each Fund also records offsetting interest income in an amount equal to this expense relating to the municipal obligations underlying such transactions, and as a result net asset value and performance have not been affected by this expense. Had these expenses not been included, total “Other Expenses” would have been in the amounts described in the table above as “Other Expenses (excluding Interest Expense)”. See “Investment Objectives & Principal Policies and Risks” for a description of these transactions. |
| |
Example. These Examples are intended to help you compare the cost of investing in a Fund with the cost of investing in other mutual funds. Each Example assumes that you invest $10,000 in a Fund for the time periods indicated and then redeem all of your shares at the end of those periods. Each Example also assumes that your investment has a 5% return each year and that the operating expenses remain the same as stated in the Fund Fees and Expenses tables above. Although your actual costs may be higher or lower, based on these assumptions your costs would be:
| | | | | 1 Year | | 3 Years | | 5 Years | | 10 Years |
|
| Alabama Fund | | Class I shares | | $ 73 | | $227 | | $395 | | $ 883 |
|
| California Fund | | Class I shares | | $ 94 | | $293 | | $509 | | $1,131 |
|
| Connecticut Fund | | Class I shares | | $ 87 | | $271 | | $471 | | $1,049 |
|
| Georgia Fund | | Class I shares | | $ 87 | | $271 | | $471 | | $1,049 |
|
| Maryland Fund | | Class I shares | | $101 | | $315 | | $547 | | $1,213 |
|
| New Jersey Fund | | Class I shares | | $103 | | $322 | | $558 | | $1,236 |
|
| New York Fund | | Class I shares | | $107 | | $334 | | $579 | | $1,283 |
2
| | | | | 1 Year | | 3 Years | | 5 Years | | 10 Years |
|
| North Carolina Fund | | Class I shares | | $117 | | $365 | | $633 | | $1,398 |
|
| Pennsylvania Fund | | Class I shares | | $116 | | $362 | | $628 | | $1,386 |
|
| South Carolina Fund | | Class I shares | | $103 | | $322 | | $558 | | $1,236 |
|
| Virginia Fund | | Class I shares | | $117 | | $365 | | $633 | | $1,398 |
4. The following is added to "Purchasing Shares":
Class I Shares
Class I shares are offered to clients of financial intermediaries who (i) charge such clients an ongoing fee for advisory, investment, consulting or similar services, or (ii) have entered into an agreement with the principal underwriter to offer Class I shares through a no-load network or platform. Such clients may include individuals, corporations, endowments, foundations and qualified plans (including tax-deferred retirement plans and profit sharing plans). Class I shares are also offered to investment and institutional clients of Eaton Vance and its affiliates and certain persons affiliated with Eaton Vance and certain fund service providers. Your initial investment must be at least $250,000. Subsequent investments of any amount may be made at any time. The minimum initial investment is waived for persons affiliated with Eaton Vance, its affiliates and certain Fund service providers (as described in the Statement of Additional Information). The initial minimum investment also is waived for i ndividual accounts of a financial intermediary that charges an ongoing fee for its services or offers Class I shares through a no-load network or platform (in each case, as described above), provided the aggregate value of such accounts invested in Class I shares of the Fund is at least $250,000 (or is anticipated by the principal underwriter to reach $250,000) and for corporations, endowments, foundations and qualified plans with assets of at least $100 million.
Class I shares may be purchased through an investment dealer or by requesting your bank to transmit immediately available funds (Federal Funds) by wire. To make an initial investment by wire, you must telephone the Fund Order Department at 1-800-262-1122 to advise of your action and to be assigned an account number. An account application form then must be promptly forwarded to the transfer agent (see back cover for address). You may request a current account application by calling 1-800-262-1122. Additional investments may be made at any time through the same wire procedure. The Fund Order Department must be advised by telephone of each transmission.
Purchases will be executed at the net asset value next determined after their receipt in good order by the Fund’s transfer agent. The Fund’s transfer agent or your investment dealer must receive your purchase in good order no later than the close of regular trading on the New York Stock Exchange (normally 4:00 p.m. eastern time) for your purchase to be effected at that day’s net asset value. If you purchase shares through an investment dealer, that dealer may charge you a fee for executing the purchase for you. The Fund may suspend the sale of its shares at any time and any purchase order may be refused.
5. The following is added to "Choosing a Share Class" under "Purchasing Shares":
Class I shares are offered to clients of financial intermediaries who (i) charge such clients an ongoing fee for advisory, investment, consulting or similar services, or (ii) have entered into an agreement with the principal underwriter to offer Class I shares through a no-load network or platform. Such clients may include individuals, corporations, endowments, foundations and qualified plans (as described above). Class I shares are also offered to investment and institutional clients of Eaton Vance and its affiliates and certain persons affiliated with Eaton Vance and certain fund service providers. Class I shares do not pay distribution or service fees. Returns on Class I shares generally are higher than returns on other classes because Class I has lower annual expenses.
3
EATON VANCE FLORIDA MUNICIPALS FUND
Supplement to Prospectus dated December 1, 2007 |
EATON VANCE FLORIDA INSURED MUNICIPALS FUND
Supplement to Prospectus dated April 1, 2007 |
EATON VANCE FLORIDA LIMITED MATURITY MUNICIPALS FUND
Supplement to Prospectus dated August 1, 2007 |
The investment objective of Eaton Vance Florida Municipals Fund and Eaton Vance Florida Insured Municipals Fund is to provide current income exempt from regular federal income tax. The investment objective of Eaton Vance Florida Limited Maturity Municipals Fund is to provide a high level of current income exempt from regular federal income tax and limited principal fluctuation. Consistent with these objectives, each of the Funds (the “Florida Funds”) has an investment policy to invest substantially all of its net assets (at least 80%) in municipal obligations, the interest on which is exempt from regular federal income tax. Eaton Vance Florida Insured Municipals Fund primarily invests in high grade municipal obligations that are insured as to the timely payment of principal and interest.
Effective January 1, 2008, each Florida Fund will eliminate its investment policy that at least 65% of its total assets normally will be invested in municipal obligations issued by the State of Florida or its political subdivisions, agencies, authorities and instrumentalities. The Florida Funds’ other investment policies will remain unchanged. The Florida Funds will continue to invest pursuant to the objectives and policy described in the first paragraph above, but will be increasing their exposure to municipal obligations of issuers outside the State of Florida, transforming the Florida Funds in an orderly manner over time into diversified, national municipal bond funds. In connection with this change, as of January 1, 2008 the Florida Funds will change their names to “Eaton Vance Florida Plus Municipals Fund,” “Eaton Vance Florida Plus Insured Municipals Fund” and “Eaton Vance Florida Plus Limited Maturity Municipals Fund.”

Eaton Vance California Municipals Fund
Eaton Vance Florida Municipals Fund
Eaton Vance Massachusetts Municipals Fund
Eaton Vance Mississippi Municipals Fund
Eaton Vance New York Municipals Fund
Eaton Vance Ohio Municipals Fund
Eaton Vance Rhode Island Municipals Fund
Eaton Vance West Virginia Municipals Fund |
| Mutual funds providing tax-exempt income |
Prospectus Dated
December 1, 2007 |
The Securities and Exchange Commission has not approved or disapproved these securities or determined whether this prospectus is truthful or complete. Any representation to the contrary is a criminal offense.
This prospectus contains important information about the Funds and the services available to shareholders. Please save it for reference.
| Table of Contents | | |
| |
| Fund Summaries | | 3 |
| California Fund | | 4 |
| Florida Fund | | 5 |
| Massachusetts Fund | | 6 |
| Mississippi Fund | | 7 |
| New York Fund | | 8 |
| Ohio Fund | | 9 |
| Rhode Island Fund | | 10 |
| West Virginia Fund | | 11 |
| Fund Fees and Expenses | | 12 |
| Investment Objectives & Principal Policies and Risks | | 15 |
| Management and Organization | | 17 |
| Valuing Shares | | 18 |
| Purchasing Shares | | 18 |
| Sales Charges | | 21 |
| Redeeming Shares | | 23 |
| Shareholder Account Features | | 23 |
| Tax Information | | 25 |
| Financial Highlights | | 28 |
| California Fund | | 28 |
| Florida Fund | | 30 |
| Massachusetts Fund | | 32 |
| Mississippi Fund | | 34 |
| New York Fund | | 35 |
| Ohio Fund | | 37 |
| Rhode Island Fund | | 38 |
| West Virginia Fund | | 39 |
2
Fund Summaries
This section summarizes the investment objectives, and principal strategies and risks of investing in an Eaton Vance Municipals Fund. You will find more specific information about each Fund in the pages that follow.
Investment Objectives and Principal Strategies
The investment objective of each Fund is to provide current income exempt from regular federal income tax and from particular state or local income or other taxes, as applicable. Under normal market circumstances, each Fund will invest at least 80% of its net assets in municipal obligations that are exempt from such taxes. Each Fund primarily invests in investment grade municipal obligations (those rated BBB or Baa or higher), but may also invest in lower rated obligations. Each Fund normally acquires municipal obligations with maturities of ten years or more.
Each Fund may concentrate in certain types of municipal obligations (such as industrial development bonds, housing bonds, hospital bonds or utility bonds), so Fund shares could be affected by events that adversely affect a particular sector. Each Fund may purchase derivative instruments (such as inverse floaters, futures contracts and options thereon, interest rate swaps, and forward rate contracts), bonds that do not make regular payments of interest, bonds issued on a when-issued basis and municipal leases. The portfolio managers may also trade securities to minimize taxable capital gains to shareholders. A portion of each Fund’s distributions generally will be subject to alternative minimum tax.
Principal Risk Factors
Obligations with maturities of ten years or more may offer higher yields than obligations with shorter maturities, but they are subject to greater fluctuations in value when interest rates change. When interest rates rise or when the supply of suitable bonds exceeds the market demand, the value of Fund shares typically will decline. The Fund’s yield will also fluctuate over time. Each Fund invests a significant portion of assets in obligations of issuers located in a single state and is sensitive to factors affecting that state, such as changes in the economy, decreases in tax collection or the tax base, legislation which limits taxes and changes in issuer credit ratings.
Because obligations rated BBB or Baa and obligations rated below BBB or Baa (so-called “junk bonds”) are more sensitive to the financial soundness of their issuers than higher quality obligations, Fund shares may fluctuate more in value than shares of a fund investing solely in higher quality obligations. Obligations rated BBB or Baa have speculative characteristics, while lower rated obligations are predominantly speculative. The credit ratings assigned a state’s general obligations (if any) by Standard & Poor’s Ratings Group (“S&P”), Moody’s Investors Service, Inc. (“Moody’s”) and Fitch Ratings (“Fitch”) are described in the Fund-specific summaries that follow this page.
A Fund’s use of derivatives may expose the Fund to increased risk of principal loss due to imperfect correlation, failure of the counterparty or unexpected price or interest rate movements. Inverse floaters are volatile and involve leverage risk. Bonds that do not make regular interest payments may experience greater volatility in response to interest rate changes. When-issued securities are subject to the risk that when delivered to the Fund they will be worth less than the price the Fund agreed to pay for them. Municipal leases often require a legislative appropriation of funds for payment. If the necessary appropriation is not made, the issuer of the lease may not be able to meet its obligations.
As a non-diversified fund, a Fund may invest a larger portion of its assets in the obligations of a limited number of issuers than may a diversified fund. This makes a Fund more susceptible to adverse economic, business or other developments affecting such issuers. A Fund may invest, with respect to 50% of its total assets, more than 5% (but not more than 25%) of its total assets in securities of any one issuer (such limitations do not apply to U.S. Government securities).
No Fund is a complete investment program and you may lose money by investing in a Fund. An investment in a Fund is not a deposit in a bank and is not insured or guaranteed by the Federal Deposit Insurance Corporation or any other government agency.
3
| Eaton Vance California Municipals Fund |
The California Fund’s investment objective is to provide current income exempt from regular federal income tax and California state personal income taxes. California general obligations currently are rated Baa1, BBB and A by Moody’s, S&P and Fitch, respectively.
Performance Information. The following bar chart and table provide information about the California Fund’s performance for each calendar year through December 31, 2006. The returns in the bar chart are for Class B shares and do not reflect a sales charge. If the sales charge was reflected, the returns would be lower. The table contains returns for each Class of shares and a comparison to the performance of a national index of municipal bonds. Returns in the table for Class B shares are shown before and after the reduction of taxes. Although past performance (both before and after taxes) is no guarantee of future results, this performance information demonstrates the risk that the value of your investment will change.
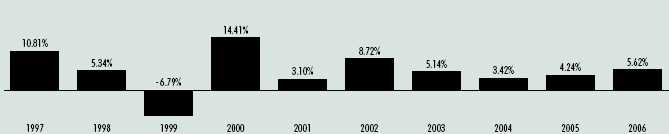
During the ten years ended December 31, 2006, the highest quarterly total return for Class B was 6.45% for the quarter ended September 30, 2002, and the lowest quarterly return was –2.82% for the quarter ended June 30, 1999. The Fund’s year-to-date total return through the end of the most recent calendar quarter (December 31, 2006 to September 30, 2007) was –0.42% . For the 30 days ended September 30, 2007, the SEC yield and SEC tax-equivalent yield (assuming a combined state and federal income tax rate of 41.05%) for Class A shares were 3.80% and 6.45%, respectively, for Class B shares were 3.25% and 5.51%, respectively, and for Class C shares were 3.25% and 5.51%, respectively. A lower tax rate would result in lower tax-equivalent yields. For current yield information call 1-800-225-6265.
| | | One | | Five | | Ten |
| Average Annual Total Return as of December 31, 2006 | | Year | | Years | | Years |
|
| Class A Return Before Taxes | | 1.44% | | 4.86% | | 5.23% |
| Class B Return Before Taxes | | 0.62% | | 5.08% | | 5.26% |
| Class B Return After Taxes on Distributions | | 0.35% | | 5.02% | | 5.21% |
| Class B Return After Taxes on Distributions and the Sale of Class B Shares | | 2.07% | | 4.99% | | 5.16% |
| Class C Return Before Taxes | | 4.72% | | 5.38% | | 5.25% |
| Lehman Brothers Municipal Bond Index (reflects no deduction for fees, expenses or taxes) | | 4.84% | | 5.53% | | 5.76% |
These returns reflect the maximum sales charge for Class A (4.75%) and any applicable contingent deferred sales charge ("CDSC") for Class B and Class C. The Class C performance shown above for the period prior to August 31, 2004 is the performance of Class B shares, adjusted for the sales charge that applies to Class C shares (but not adjusted for any other differences in the expenses of the two classes). The Lehman Brothers Municipal Bond Index is an unmanaged index of municipal bonds. Investors cannot invest directly in an index. (Source for Lehman Brothers Municipal Bond Index: Lipper Inc.)
Total returns are historical and are calculated by determining the percentage change in net asset value or public offering price with all distributions reinvested. The Fund's past performance (both before and after taxes) is no guarantee of future results. Investment return and principal value of Fund shares will fluctuate so that shares, when redeemed, may be worth more or less than their original cost. Performance is for the stated time period only; due to market volatility, the Fund's current performance may be lower or higher than the quoted return. The Fund’s performance during certain periods reflects the strong bond market performance and/or the strong performance of bonds held during those periods. This performance is not typical and may not be repeated. For the Fund’s performance as of the most recent month-end, please refer to www.eatonvance.com.
After-tax returns are calculated using certain assumptions. After-tax returns are calculated using the highest historical individual federal income tax rates and do not reflect the impact of state and local taxes. Actual after-tax returns depend on a shareholder’s tax situation and the actual characterization of distributions, and may differ from those shown. After-tax returns are not relevant to shareholders who hold shares in tax-deferred accounts or to shares held by non-taxable entities. After-tax returns for other Classes of shares will vary from the after-tax returns presented for Class B shares. Return After Taxes on Distributions for a period may be the same as Return Before Taxes for that period because no taxable distributions were made during that period. Also, Return After Taxes on Distributions and the Sale of Fund Shares for a period may be greater than or equal to Return After Taxes on Distributions for the same period because of losses realized on the sale of Fund shares.
4
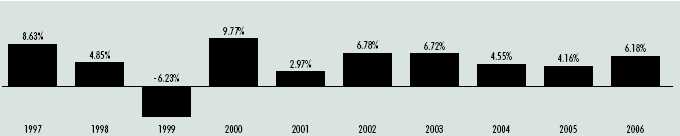
| Eaton Vance Florida Municipals Fund |
The Florida Fund’s investment objective is to provide current income exempt from regular federal income tax. Florida general obligations currently are rated Aa1, AAA and AA+ by Moody’s, S&P and Fitch, respectively.
Performance Information. The following bar chart and table provide information about the Florida Fund’s performance for each calendar year through December 31, 2006. The returns in the bar chart are for Class B shares and do not reflect a sales charge. If the sales charge was reflected, the returns would be lower. The table contains returns for each Class of shares and a comparison to the performance of a national index of municipal bonds. No performance is shown for Class C shares because they did not have a full calendar year of operations as of December 31, 2006. Returns in the table for Class B shares are shown before and after the reduction of taxes. Although past performance (both before and after taxes) is no guarantee of future results, this performance information demonstrates the risk that the value of your investment will change.
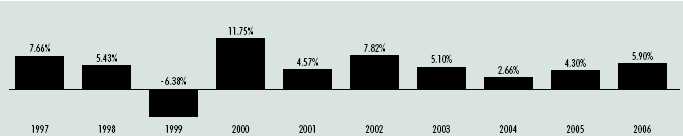
During the ten years ended December 31, 2006, the highest quarterly total return for Class B was 5.08% for the quarter ended December 31, 2000, and the lowest quarterly return was –2.92% for the quarter ended September 30, 1999. The Fund’s year-to-date total return through the end of the most recent calendar quarter (December 31, 2006 to September 30, 2007) was 0.15% . For the 30 days ended September 30, 2007, the SEC yield and SEC tax-equivalent yield (assuming a federal income tax rate of 35.00%) for Class A shares were 3.97% and 6.11%, respectively, for Class B shares were 3.42% and 5.26%, respectively, and for Class C shares were 3.43% and 5.28%, respectively. A lower tax rate would result in lower tax-equivalent yields. For current yield information call 1-800-225-6265.
| | | One | | Five | | Ten |
| Average Annual Total Return as of December 31, 2006 | | Year | | Years | | Years |
|
| Class A Return Before Taxes | | 1.60% | | 4.87% | | 5.06% |
| Class B Return Before Taxes | | 0.90% | | 4.81% | | 4.78% |
| Class B Return After Taxes on Distributions | | 0.90% | | 4.80% | | 4.76% |
| Class B Return After Taxes on Distributions and the Sale of Class B Shares | | 1.93% | | 4.73% | | 4.71% |
| Lehman Brothers Municipal Bond Index (reflects no deduction for fees, expenses or taxes) | | 4.84% | | 5.53% | | 5.76% |
These returns reflect the maximum sales charge for Class A (4.75%) and any applicable CDSC for Class B. The Lehman Brothers Municipal Bond Index is an unmanaged index of municipal bonds. Investors cannot invest directly in an index. (Source for Lehman Brothers Municipal Bond Index: Lipper Inc.)
Total returns are historical and are calculated by determining the percentage change in net asset value or public offering price with all distributions reinvested. The Fund's past performance (both before and after taxes) is no guarantee of future results. Investment return and principal value of Fund shares will fluctuate so that shares, when redeemed, may be worth more or less than their original cost. Performance is for the stated time period only; due to market volatility, the Fund's current performance may be lower or higher than the quoted return. The Fund’s performance during certain periods reflects the strong bond market performance and/or the strong performance of bonds held during those periods. This performance is not typical and may not be repeated. For the Fund’s performance as of the most recent month-end, please refer to www.eatonvance.com.
After-tax returns are calculated using certain assumptions. After-tax returns are calculated using the highest historical individual federal income tax rates and do not reflect the impact of state and local taxes. Actual after-tax returns depend on a shareholder’s tax situation the actual characterization of distributions, and may differ from those shown. After-tax returns are not relevant to shareholders who hold shares in tax-deferred accounts or to shares held by non-taxable entities. After-tax returns for other Classes of shares will vary from the after-tax returns presented for Class B shares. Return After Taxes on Distributions for a period may be the same as Return Before Taxes for that period because no taxable distributions were made during that period. Also, Return After Taxes on Distributions and the Sale of Fund Shares for a period may be greater than or equal to Return After Taxes on Distributions for the same period because of losses realized on the sale of Fund shares.
5
| Eaton Vance Massachusetts Municipals Fund |
The Massachusetts Fund’s investment objective is to provide current income exempt from regular federal income tax and Massachusetts state personal income taxes. Massachusetts general obligations currently are rated Aa2, AA- and AA- by Moody’s, S&P and Fitch, respectively.
Performance Information. The following bar chart and table provide information about the Massachusetts Fund’s performance for each calendar year through December 31, 2006. The returns in the bar chart are for Class B shares and do not reflect a sales charge. If the sales charge was reflected, the returns would be lower. The table contains returns for each Class of shares and a comparison to the performance of a national index of municipal bonds. No performance is shown for Class C shares because they did not have a full calendar year of operations as of December 31, 2006. Returns in the table for Class B shares are shown before and after the reduction of taxes. Although past performance (both before and after taxes) is no guarantee of future results, this performance information demonstrates the risk that the value of your investment will change.
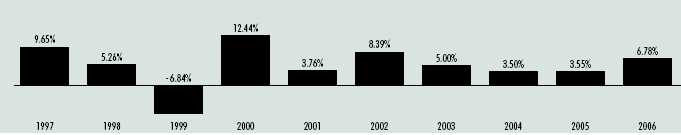
During the ten years ended December 31, 2006, the highest quarterly total return for Class B was 5.56% for the quarter ended December 31, 2000, and the lowest quarterly return was –2.72% for the quarter ended June 30, 2004. The Fund’s year-to-date total return through the end of the most recent calendar quarter (December 31, 2006 to September 30, 2007) was –1.68% . For the 30 days ended September 30, 2007, the SEC yield and SEC tax-equivalent yield (assuming a combined state and federal income tax rate of 38.45%) for Class A shares were 3.79% and 6.16%, respectively, for Class B shares were 3.23% and 5.25%, respectively, and for Class C shares were 3.23% and 5.25%, respectively. A lower tax rate would result in lower tax-equivalent yields. For current yield information call 1-800-225-6265.
| | | One | | Five | | Ten |
| Average Annual Total Return as of December 31, 2006 | | Year | | Years | | Years |
|
| Class A Return Before Taxes | | 2.56% | | 5.17% | | 5.34% |
| Class B Return Before Taxes | | 1.78% | | 5.10% | | 5.03% |
| Class B Return After Taxes on Distributions | | 1.78% | | 5.10% | | 5.02% |
| Class B Return After Taxes on Distributions and the Sale of Class B Shares | | 2.49% | | 4.98% | | 4.93% |
| Lehman Brothers Municipal Bond Index (reflects no deduction for fees, expenses or taxes) | | 4.84% | | 5.53% | | 5.76% |
These returns reflect the maximum sales charge for Class A (4.75%) and any applicable CDSC for Class B. The Lehman Brothers Municipal Bond Index is an unmanaged index of municipal bonds. Investors cannot invest directly in an index. (Source for Lehman Brothers Municipal Bond Index: Lipper Inc.)
Total returns are historical and are calculated by determining the percentage change in net asset value or public offering price with all distributions reinvested. The Fund's past performance (both before and after taxes) is no guarantee of future results. Investment return and principal value of Fund shares will fluctuate so that shares, when redeemed, may be worth more or less than their original cost. Performance is for the stated time period only; due to market volatility, the Fund's current performance may be lower or higher than the quoted return. The Fund’s performance during certain periods reflects the strong bond market performance and/or the strong performance of bonds held during those periods. This performance is not typical and may not be repeated. For the Fund’s performance as of the most recent month-end, please refer to www.eatonvance.com.
After-tax returns are calculated using certain assumptions. After-tax returns are calculated using the highest historical individual federal income tax rates and do not reflect the impact of state and local taxes. Actual after-tax returns depend on a shareholder’s tax situation and the actual characterization of distributions, and may differ from those shown. After-tax returns are not relevant to shareholders who hold shares in tax-deferred accounts or to shares held by non-taxable entities. After-tax returns for other Classes of shares will vary from the after-tax returns presented for Class B shares. Return After Taxes on Distributions for a period may be the same as Return Before Taxes for that period because no taxable distributions were made during that period. Also, Return After Taxes on Distributions and the Sale of Fund Shares for a period may be greater than or equal to Return After Taxes on Distributions for the same period because of losses realized on the sale of Fund shares.
6
| Eaton Vance Mississippi Municipals Fund |
The Mississippi Fund’s investment objective is to provide current income exempt from regular federal income tax and Mississippi state personal income taxes. Mississippi general obligations currently are rated Aa3, AA and AA by Moody’s, S&P and Fitch, respectively.
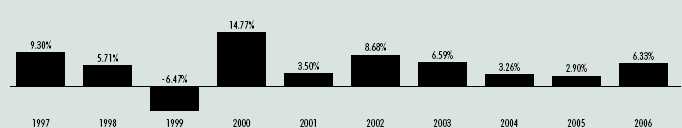
Performance Information. The following bar chart and table provide information about the Mississippi Fund’s performance for each calendar year through December 31, 2006. The returns in the bar chart are for Class B shares and do not reflect a sales charge. If the sales charge was reflected, the returns would be lower. The table contains returns for each Class of shares and a comparison to the performance of a national index of municipal bonds. No performance is shown for Class C shares because they have not been offered prior to the date of this prospectus. Returns in the table for Class B shares are shown before and after the reduction of taxes. Although past performance (both before and after taxes) is no guarantee of future results, this performance information demonstrates the risk that the value of your investment will change.

During the ten years ended December 31, 2006, the highest quarterly total return for Class B was 3.85% for the quarter ended September 30, 2002, and the lowest quarterly return was –1.96% for the quarter ended June 30, 1999. The Fund’s year-to-date total return through the end of the most recent calendar quarter (December 31, 2006 to September 30, 2007) was 0.85% . For the 30 days ended September 30, 2007, the SEC yield and SEC tax-equivalent yield (assuming a combined state and federal income tax rate of 38.25%) for Class A shares were 3.54% and 5.73%, respectively, and for Class B shares were 2.97% and 4.81%, respectively. A lower tax rate would result in lower tax-equivalent yields. For current yield information call 1-800-225-6265.
| | | One | | Five | | Ten |
| Average Annual Total Return as of December 31, 2006 | | Year | | Years | | Years |
|
| Class A Return Before Taxes | | 0.62% | | 3.98% | | 4.63% |
| Class B Return Before Taxes | | –0.16% | | 3.90% | | 4.40% |
| Class B Return After Taxes on Distributions | | –0.17% | | 3.89% | | 4.39% |
| Class B Return After Taxes on Distributions and the Sale of Class B Shares | | 1.14% | | 3.90% | | 4.36% |
| Lehman Brothers Municipal Bond Index (reflects no deduction for fees, expenses or taxes) | | 4.84% | | 5.53% | | 5.76% |
These returns reflect the maximum sales charge for Class A (4.75%) and any applicable CDSC for Class B. The Lehman Brothers Municipal Bond Index is an unmanaged index of municipal bonds. Investors cannot invest directly in an index. (Source for Lehman Brothers Municipal Bond Index: Lipper Inc.)
Total returns are historical and are calculated by determining the percentage change in net asset value or public offering price with all distributions reinvested. The Fund's past performance (both before and after taxes) is no guarantee of future results. Investment return and principal value of Fund shares will fluctuate so that shares, when redeemed, may be worth more or less than their original cost. Performance is for the stated time period only; due to market volatility, the Fund's current performance may be lower or higher than the quoted return. For the Fund’s performance as of the most recent month-end, please refer to www.eatonvance.com.
After-tax returns are calculated using certain assumptions. After-tax returns are calculated using the highest historical individual federal income tax rates and do not reflect the impact of state and local taxes. Actual after-tax returns depend on a shareholder’s tax situation and the actual characterization of distributions, and may differ from those shown. After-tax returns are not relevant to shareholders who hold shares in tax-deferred accounts or to shares held by non-taxable entities. After-tax returns for other Classes of shares will vary from the after-tax returns presented for Class B shares. Return After Taxes on Distributions for a period may be the same as Return Before Taxes for that period because no taxable distributions were made during that period. Also, Return After Taxes on Distributions and the Sale of Fund Shares for a period may be greater than or equal to Return After Taxes on Distributions for the same period because of losses realized on the sale of Fund shares.
7
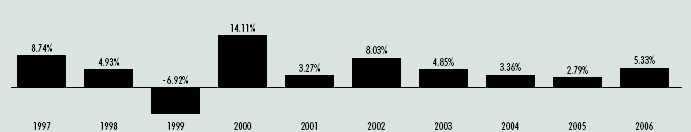
| Eaton Vance New York Municipals Fund |
The New York Fund’s investment objective is to provide current income exempt from regular federal income tax and New York state and New York City personal income taxes. New York’s general obligations currently are rated A2, AA and AA by Moody’s, S&P and Fitch, respectively. New York City’s general obligations currently are rated A2, A and A+ by Moody’s, S&P and Fitch, respectively.
Performance Information. The following bar chart and table provide information about the New York Fund’s performance for each calendar year through December 31, 2006. The returns in the bar chart are for Class B shares and do not reflect a sales charge. If the sales charge was reflected, the returns would be lower. The table contains returns for each Class of shares and a comparison to the performance of a national index of municipal bonds. Returns in the table for Class B shares are shown before and after the reduction of taxes. Although past performance (both before and after taxes) is no guarantee of future results, this performance information demonstrates the risk that the value of your investment will change.
During the ten years ended December 31, 2006, the highest quarterly total return for Class B was 6.57% for the quarter ended December 31, 2000, and the lowest quarterly return was –2.57 for the quarter ended June 30, 1999. The Fund’s year-to-date total return through the end of the most recent calendar quarter (December 31, 2006 to September 30, 2007) was –0.66% . For the 30 days ended September 30, 2007, the SEC yield and SEC tax-equivalent yield (assuming a combined state and federal income tax rate of 39.45%) for Class A shares were 3.87% and 6.39%, respectively, for Class B shares were 3.31% and 5.47%, respectively, and for Class C shares were 3.31% and 5.47%, respectively. A lower tax rate would result in lower tax-equivalent yields. For current yield information call 1-800-225-6265.
| | | One | | Five | | Ten |
| Average Annual Total Return as of December 31, 2006 | | Year | | Years | | Years |
|
| Class A Return Before Taxes | | 2.00% | | 5.08% | | 5.52% |
| Class B Return Before Taxes | | 1.33% | | 5.20% | | 5.32% |
| Class B Return After Taxes on Distributions | | 1.24% | | 5.13% | | 5.27% |
| Class B Return After Taxes on Distributions and the Sale of Class B Shares | | 2.28% | | 5.08% | | 5.20% |
| Class C Return Before Taxes | | 5.33% | | 5.03% | | 5.07% |
| Lehman Brothers Municipal Bond Index (reflects no deduction for fees, expenses or taxes) | | 4.84% | | 5.53% | | 5.76% |
These returns reflect the maximum sales charge for Class A (4.75%) and any applicable CDSC for Class B and Class C. The Class C performance shown above for the period prior to September 30, 2003 is the performance of Class B shares, adjusted for the sales charge that applies to Class C shares (but not adjusted for any other differences in the expenses of the two classes). The Lehman Brothers Municipal Bond Index is an unmanaged index of municipal bonds. Investors cannot invest directly in an index. (Source for Lehman Brothers Municipal Bond Index: Lipper Inc.)
Total returns are historical and are calculated by determining the percentage change in net asset value or public offering price with all distributions reinvested. The Fund's past performance (both before and after taxes) is no guarantee of future results. Investment return and principal value of Fund shares will fluctuate so that shares, when redeemed, may be worth more or less than their original cost. Performance is for the stated time period only; due to market volatility, the Fund's current performance may be lower or higher than the quoted return. The Fund’s performance during certain periods reflects the strong bond market performance and/or the strong performance of bonds held during those periods. This performance is not typical and may not be repeated. For the Fund’s performance as of the most recent month-end, please refer to www.eatonvance.com.
After-tax returns are calculated using certain assumptions. After-tax returns are calculated using the highest historical individual federal income tax rates and do not reflect the impact of state and local taxes. Actual after-tax returns depend on a shareholder’s tax situation and the actual characterization of distributions, and may differ from those shown. After-tax returns are not relevant to shareholders who hold shares in tax-deferred accounts or to shares held by non-taxable entities. After-tax returns for other Classes of shares will vary from the after-tax returns presented for Class B shares. Return After Taxes on Distributions for a period may be the same as Return Before Taxes for that period because no taxable distributions were made during that period. Also, Return After Taxes on Distributions and the Sale of Fund Shares for a period may be greater than or equal to Return After Taxes on Distributions for the same period because of losses realized on the sale of Fund shares.
8
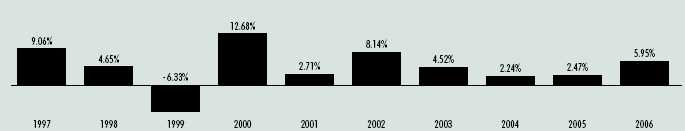
| Eaton Vance Ohio Municipals Fund |
The Ohio Fund’s investment objective is to provide current income exempt from regular federal income tax and Ohio state personal income taxes. Ohio general obligations currently are rated Aa1, AA+ and AA+ by Moody’s, S&P and Fitch, respectively.
Performance Information. The following bar chart and table provide information about the Ohio Fund’s performance for each calendar year through December 31, 2006. The returns in the bar chart are for Class B shares and do not reflect a sales charge. If the sales charge was reflected, the returns would be lower. The table contains returns for each Class of shares and a comparison to the performance of a national index of municipal bonds. No performance is shown for Class C shares because they did not have a full calendar year of operations as of December 31, 2006. Returns in the table for Class B shares are shown before and after the reduction of taxes. Although past performance (both before and after taxes) is no guarantee of future results, this performance information demonstrates the risk that the value of your investment will change.
During the ten years ended December 31, 2006, the highest quarterly total return for Class B was 3.92% for the quarter ended September 30, 2006, and the lowest quarterly return was –2.89% for the quarter ended June 30, 2004. The Fund’s year-to-date total return through the end of the most recent calendar quarter (December 31, 2006 to September 30, 2007) was –0.14% . For the 30 days ended September 30, 2007, the SEC yield and SEC tax-equivalent yield (assuming a combined state and federal income tax rate of 39.26%) for Class A shares were 3.64% and 5.99%, respectively, for Class B shares were 3.07% and 5.05%, respectively, and for Class C shares were 3.07% and 5.05%, respectively. A lower tax rate would result in lower tax-equivalent yields. For current yield information call 1-800-225-6265.
| | | One | | Five | | Ten |
| Average Annual Total Return as of December 31, 2006 | | Year | | Years | | Years |
|
| Class A Return Before Taxes | | 1.82% | | 5.40% | | 5.04% |
| Class B Return Before Taxes | | 1.18% | | 5.35% | | 4.75% |
| Class B Return After Taxes on Distributions | | 1.18% | | 5.34% | | 4.75% |
| Class B Return After Taxes on Distributions and the Sale of Class B Shares | | 2.12% | | 5.23% | | 4.73% |
| Lehman Brothers Municipal Bond Index (reflects no deduction for fees, expenses or taxes) | | 4.84% | | 5.53% | | 5.76% |
These returns reflect the maximum sales charge for Class A (4.75%) and any applicable CDSC for Class B. The Lehman Brothers Municipal Bond Index is an unmanaged index of municipal bonds. Investors cannot invest directly in an index. (Source for Lehman Brothers Municipal Bond Index: Lipper Inc.)
Total returns are historical and are calculated by determining the percentage change in net asset value or public offering price with all distributions reinvested. The Fund's past performance (both before and after taxes) is no guarantee of future results. Investment return and principal value of Fund shares will fluctuate so that shares, when redeemed, may be worth more or less than their original cost. Performance is for the stated time period only; due to market volatility, the Fund's current performance may be lower or higher than the quoted return. For the Fund’s performance as of the most recent month-end, please refer to www.eatonvance.com.
After-tax returns are calculated using certain assumptions. After-tax returns are calculated using the highest historical individual federal income tax rates and do not reflect the impact of state and local taxes. Actual after-tax returns depend on a shareholder’s tax situation and the actual characterization of distributions, and may differ from those shown. After-tax returns are not relevant to shareholders who hold shares in tax-deferred accounts or to shares held by non-taxable entities. After-tax returns for other Classes of shares will vary from the after-tax returns presented for Class B shares. Return After Taxes on Distributions for a period may be the same as Return Before Taxes for that period because no taxable distributions were made during that period. Also, Return After Taxes on Distributions and the Sale of Fund Shares for a period may be greater than or equal to Return After Taxes on Distributions for the same period because of losses realized on the sale of Fund shares.
9
| Eaton Vance Rhode Island Municipals Fund |
The Rhode Island Fund’s investment objective is to provide current income exempt from regular federal income tax and Rhode Island state personal income taxes. Rhode Island general obligations currently are rated Aa3, AA- and AA by Moody’s, S&P and Fitch, respectively.
Performance Information. The following bar chart and table provide information about the Rhode Island Fund’s performance for each calendar year through December 31, 2006. The returns in the bar chart are for Class B shares and do not reflect a sales charge. If the sales charge was reflected, the returns would be lower. The table contains returns for each Class of shares and a comparison to the performance of a national index of municipal bonds. No performance is shown for Class C shares because they did not have a full calendar year of operations as of December 31, 2006. Returns in the table for Class B shares are shown before and after the reduction of taxes. Although past performance (both before and after taxes) is no guarantee of future results, this performance information demonstrates the risk that the value of your investment will change.
During the ten years ended December 31, 2006, the highest quarterly total return for Class B was 6.03% for the quarter ended December 31, 2000, and the lowest quarterly return was –2.80% for the quarter ended September 30, 1999. The Fund’s year-to-date total return through the end of the most recent calendar quarter (December 31, 2006 to September 30, 2007) was 0.01% . For the 30 days ended September 30, 2007, the SEC yield and SEC tax-equivalent yield (assuming a combined state and federal income tax rate of 41.44%) for Class A shares were 3.85% and 6.57%, respectively, for Class B shares were 3.30% and 5.64%, respectively, and for Class C shares were 3.29% and 5.62%, respectively. A lower tax rate would result in lower tax-equivalent yields. For current yield information call 1-800-225-6265.
| | | One | | Five | | Ten |
| Average Annual Total Return as of December 31, 2006 | | Year | | Years | | Years |
|
| Class A Return Before Taxes | | 1.15% | | 4.61% | | 4.93% |
| Class B Return Before Taxes | | 0.33% | | 4.52% | | 4.72% |
| Class B Return After Taxes on Distributions | | 0.32% | | 4.52% | | 4.71% |
| Class B Return After Taxes on Distributions and the Sale of Class B Shares | | 1.50% | | 4.46% | | 4.64% |
| Lehman Brothers Municipal Bond Index (reflects no deduction for fees, expenses or taxes) | | 4.84% | | 5.53% | | 5.76% |
These returns reflect the maximum sales charge for Class A (4.75%) and any applicable CDSC for Class B. The Lehman Brothers Municipal Bond Index is an unmanaged index of municipal bonds. Investors cannot invest directly in an index. (Source for Lehman Brothers Municipal Bond Index: Lipper Inc.)
Total returns are historical and are calculated by determining the percentage change in net asset value or public offering price with all distributions reinvested. The Fund's past performance (both before and after taxes) is no guarantee of future results. Investment return and principal value of Fund shares will fluctuate so that shares, when redeemed, may be worth more or less than their original cost. Performance is for the stated time period only; due to market volatility, the Fund's current performance may be lower or higher than the quoted return. The Fund’s performance during certain periods reflects the strong bond market performance and/or the strong performance of bonds held during those periods. This performance is not typical and may not be repeated. For the Fund’s performance as of the most recent month-end, please refer to www.eatonvance.com.
After-tax returns are calculated using certain assumptions. After-tax returns are calculated using the highest historical individual federal income tax rates and do not reflect the impact of state and local taxes. Actual after-tax returns depend on a shareholder’s tax situation and the actual characterization of distributions, and may differ from those shown. After-tax returns are not relevant to shareholders who hold shares in tax-deferred accounts or to shares held by non-taxable entities. After-tax returns for other Classes of shares will vary from the after-tax returns presented for Class B shares. Return After Taxes on Distributions for a period may be the same as Return Before Taxes for that period because no taxable distributions were made during that period. Also, Return After Taxes on Distributions and the Sale of Fund Shares for a period may be greater than or equal to Return After Taxes on Distributions for the same period because of losses realized on the sale of Fund shares.
10
| Eaton Vance West Virginia Municipals Fund |
The West Virginia Fund’s investment objective is to provide current income exempt from regular federal income tax and West Virginia state personal income taxes. West Virginia general obligations currently are rated Aa3, AA- and AA- by Moody’s, S&P and Fitch, respectively.
Performance Information. The following bar chart and table provide information about the West Virginia Fund’s performance for each calendar year through December 31, 2006. The returns in the bar chart are for Class B shares and do not reflect a sales charge. If the sales charge was reflected, the returns would be lower. The table contains returns for each Class of shares and a comparison to the performance of a national index of municipal bonds. No performance is shown for Class C shares because they have not been offered prior to the date of this prospectus. Returns in the table for Class B shares are shown before and after the reduction of taxes. Although past performance (both before and after taxes) is no guarantee of future results, this performance information demonstrates the risk that the value of your investment will change.
During the ten years ended December 31, 2006, the highest quarterly total return for Class B was 5.44% for the quarter ended December 31, 2000, and the lowest quarterly return was –2.88% for the quarter ended June 30, 2004. The Fund’s year-to-date total return through the end of the most recent calendar quarter (December 31, 2006 to September 30, 2007) was –0.02% . For the 30 days ended September 30, 2007, the SEC yield and SEC tax-equivalent yield (assuming a combined state and federal income tax rate of 39.23%) for Class A shares were 3.63% and 5.97%, respectively, and for Class B shares were 3.07% and 5.05%, respectively. A lower tax rate would result in lower tax-equivalent yields. For current yield information call 1-800-225-6265.
| | | One | | Five | | Ten |
| Average Annual Total Return as of December 31, 2006 | | Year | | Years | | Years |
|
| Class A Return Before Taxes | | 1.75% | | 4.37% | | 4.78% |
| Class B Return Before Taxes | | 0.95% | | 4.30% | | 4.49% |
| Class B Return After Taxes on Distributions | | 0.95% | | 4.29% | | 4.48% |
| Class B Return After Taxes on Distributions and the Sale of Class B Shares | | 1.83% | | 4.24% | | 4.43% |
| Lehman Brothers Municipal Bond Index (reflects no deduction for fees, expenses or taxes) | | 4.84% | | 5.53% | | 5.76% |
These returns reflect the maximum sales charge for Class A (4.75%) and any applicable CDSC for Class B. The Lehman Brothers Municipal Bond Index is an unmanaged index of municipal bonds. Investors cannot invest directly in an index. (Source for Lehman Brothers Municipal Bond Index: Lipper Inc.)
Total returns are historical and are calculated by determining the percentage change in net asset value or public offering price with all distributions reinvested. The Fund's past performance (both before and after taxes) is no guarantee of future results. Investment return and principal value of Fund shares will fluctuate so that shares, when redeemed, may be worth more or less than their original cost. Performance is for the stated time period only; due to market volatility, the Fund's current performance may be lower or higher than the quoted return. The Fund’s performance during certain periods reflects the strong bond market performance and/or the strong performance of bonds held during those periods. This performance is not typical and may not be repeated. For the Fund’s performance as of the most recent month-end, please refer to www.eatonvance.com.
After-tax returns are calculated using certain assumptions. After-tax returns are calculated using the highest historical individual federal income tax rates and do not reflect the impact of state and local taxes. Actual after-tax returns depend on a shareholder’s tax situation and the actual characterization of distributions, and may differ from those shown. After-tax returns are not relevant to shareholders who hold shares in tax-deferred accounts or to shares held by non-taxable entities. After-tax returns for other Classes of shares will vary from the after-tax returns presented for Class B shares. Return After Taxes on Distributions for a period may be the same as Return Before Taxes for that period because no taxable distributions were made during that period. Also, Return After Taxes on Distributions and the Sale of Fund Shares for a period may be greater than or equal to Return After Taxes on Distributions for the same period because of losses realized on the sale of Fund shares.
11
Fund Fees and Expenses. These tables describe the fees and expenses that you may pay if you buy and hold shares.
Shareholder Fees (fees paid directly from your investment)
| | | Class A | | Class B | | Class C |
|
| Maximum Sales Charge (Load) (as a percentage of offering price) | | 4.75% | | None | | None |
| Maximum Deferred Sales Charge (Load) | | None | | 5.00% | | 1.00% |
| (as a percentage of the lower of net asset value at time of purchase or time of redemption) | | | | | | |
| Maximum Sales Charge (Load) Imposed on Reinvested Distributions | | None | | None | | None |
| Exchange Fee | | None | | None | | None |
Annual Fund Operating Expenses (expenses that are deducted from Fund assets)
| California Fund | | Class A | | Class B | | Class C |
|
| Management Fees | | 0.45% | | 0.45% | | 0.45% |
| Distribution and Service (12b-1) Fees | | 0.25% | | 1.00% | | 1.00% |
| Other Expenses (total including Interest Expense)* | | 0.47% | | 0.47% | | 0.47% |
| Interest Expense | | 0.33% | | 0.33% | | 0.33% |
| Other Expenses (excluding Interest Expense) | | 0.14% | | 0.14% | | 0.14% |
| Total Annual Fund Operating Expenses | | 1.17% | | 1.92% | | 1.92% |
| | | | | | |
| | | | | | | |
| Florida Fund | | Class A | | Class B | | Class C |
|
| Management Fees | | 0.42% | | 0.42% | | 0.42% |
| Distribution and Service (12b-1) Fees | | 0.20% | | 0.95% | | 0.95% |
| Other Expenses (total including Interest Expense)* | | 0.72% | | 0.72% | | 0.72% |
| Interest Expense | | 0.55% | | 0.55% | | 0.55% |
| Other Expenses (excluding Interest Expense) | | 0.17% | | 0.17% | | 0.17% |
| Total Annual Fund Operating Expenses | | 1.34% | | 2.09% | | 2.09% |
| | | | | | |
| | | | | | | |
| Massachusetts Fund | | Class A | | Class B | | Class C |
|
| Management Fees | | 0.42% | | 0.42% | | 0.42% |
| Distribution and Service (12b-1) Fees | | 0.20% | | 0.95% | | 0.95% |
| Other Expenses (total including Interest Expense)* | | 0.62% | | 0.62% | | 0.61% |
| Interest Expense | | 0.47% | | 0.47% | | 0.47% |
| Other Expenses (excluding Interest Expense) | | 0.15% | | 0.15% | | 0.14% |
| Total Annual Fund Operating Expenses | | 1.24% | | 1.99% | | 1.98% |
| | | | | | |
| | | | | | | |
| Mississippi Fund | | Class A | | Class B | | Class C |
|
| Management Fees | | 0.15% | | 0.15% | | 0.15% |
| Distribution and Service (12b-1) Fees | | 0.20% | | 0.95% | | 0.95% |
| Other Expenses (total including Interest Expense)* | | 0.72% | | 0.72% | | 0.72% |
| Interest Expense | | 0.24% | | 0.24% | | 0.24% |
| Other Expenses (excluding Interest Expense) | | 0.48% | | 0.48% | | 0.48% |
| Total Annual Fund Operating Expenses | | 1.07% | | 1.82% | | 1.82% |
| | | | | | | |
| New York Fund | | Class A | | Class B | | Class C |
|
| Management Fees | | 0.43% | | 0.43% | | 0.43% |
| Distribution and Service (12b-1) Fees | | 0.20% | | 0.95% | | 0.95% |
| Other Expenses (total including Interest Expense)* | | 0.62% | | 0.61% | | 0.61% |
| Interest Expense | | 0.48% | | 0.48% | | 0.48% |
| Other Expenses (excluding Interest Expense) | | 0.14% | | 0.13% | | 0.13% |
| Total Annual Fund Operating Expenses | | 1.25% | | 1.99% | | 1.99% |
|
| |
| Ohio Fund | | Class A | | Class B | | Class C |
|
| Management Fees | | 0.41% | | 0.41% | | 0.41% |
| Distribution and Service (12b-1) Fees | | 0.20% | | 0.95% | | 0.95% |
| Other Expenses (total including Interest Expense)* | | 0.47% | | 0.47% | | 0.47% |
| Interest Expense | | 0.31% | | 0.31% | | 0.31% |
| Other Expenses (excluding Interest Expense) | | 0.16% | | 0.16% | | 0.16% |
| Total Annual Fund Operating Expenses | | 1.08% | | 1.83% | | 1.83% |
|
| | | | | | | |
| Rhode Island Fund | | Class A | | Class B | | Class C |
|
| Management Fees | | 0.30% | | 0.30% | | 0.30% |
| Distribution and Service (12b-1) Fees | | 0.20% | | 0.95% | | 0.95% |
| Other Expenses (total including Interest Expense)* | | 0.64% | | 0.64% | | 0.63% |
| Interest Expense | | 0.40% | | 0.40% | | 0.40% |
| Other Expenses (excluding Interest Expense) | | 0.24% | | 0.24% | | 0.23% |
| Total Annual Fund Operating Expenses | | 1.14% | | 1.89% | | 1.88% |
|
| | | | | | | |
| West Virginia Fund | | Class A | | Class B | | Class C |
|
| Management Fees | | 0.20% | | 0.20% | | 0.20% |
| Distribution and Service (12b-1) Fees | | 0.20% | | 0.95% | | 0.95% |
| Other Expenses (total including Interest Expense)* | | 0.60% | | 0.59% | | 0.59% |
| Interest Expense | | 0.25% | | 0.25% | | 0.25% |
| Other Expenses (excluding Interest Expense) | | 0.35% | | 0.34% | | 0.34% |
| Total Annual Fund Operating Expenses | | 1.00% | | 1.74% | | 1.74% |
| * | "Other Expenses" for Class C shares of the Mississippi and West Virginia Funds is estimated. "Other Expenses" includes interest expense relating to each Fund’s liability with respect to floating rate notes held by third parties in conjunction with inverse floater securities transactions by the Fund. Each Fund also records offsetting interest income in an amount equal to this expense relating to the municipal obligations underlying such transactions, and as a result net asset value and performance have not been affected by this expense. Had this expense not been included, total "Other Expenses" would have been in the amounts described in each table above as "Other Expenses (excluding Interest Expense)". See "Investment Objectives & Principal Strategies and Risks" for a description of these transactions. |
| |
12
Examples. These Examples are intended to help you compare the cost of investing in a Fund with the cost of investing in other mutual funds. Each Example assumes that you invest $10,000 in a Fund for the time periods indicated and then redeem all of your shares at the end of those periods. Each Example also assumes that your investment has a 5% return each year and that the operating expenses remain the same as stated in the Fund Fees and Expenses tables above. Although your actual costs may be higher or lower, based on these assumptions your costs would be:
| | | | | 1 Year | | 3 Years | | 5 Years | | 10 Years |
|
| California Fund | | Class A shares | | $589 | | $ 829 | | $1,088 | | $1,828 |
| | | Class B shares* | | $695 | | $1,003 | | $1,237 | | $2,048 |
| | | Class C shares | | $295 | | $ 603 | | $1,037 | | $2,243 |
|
| Florida Fund | | Class A shares | | $605 | | $ 879 | | $1,174 | | $2,011 |
| | | Class B shares* | | $712 | | $1,055 | | $1,324 | | $2,229 |
| | | Class C shares | | $312 | | $ 655 | | $1,124 | | $2,421 |
|
| Massachusetts Fund | | Class A shares | | $595 | | $ 850 | | $1,124 | | $1,904 |
| | | Class B shares* | | $702 | | $1,024 | | $1,273 | | $2,123 |
| | | Class C shares | | $301 | | $ 621 | | $1,068 | | $2,306 |
|
| Mississippi Fund | | Class A shares | | $579 | | $ 799 | | $1,037 | | $1,719 |
| | | Class B shares* | | $685 | | $ 973 | | $1,185 | | $1,940 |
| | | Class C shares | | $285 | | $ 573 | | $ 985 | | $2,137 |
|
| New York Fund | | Class A shares | | $596 | | $ 853 | | $1,129 | | $1,915 |
| | | Class B shares* | | $702 | | $1,024 | | $1,273 | | $2,126 |
| | | Class C shares | | $302 | | $ 624 | | $1,073 | | $2,317 |
|
| Ohio Fund | | Class A shares | | $580 | | $ 802 | | $1,042 | | $1,730 |
| | | Class B shares* | | $686 | | $ 976 | | $1,190 | | $1,951 |
| | | Class C shares | | $286 | | $ 576 | | $ 990 | | $2,148 |
|
| Rhode Island Fund | | Class A shares | | $586 | | $ 820 | | $1,073 | | $1,795 |
| | | Class B shares* | | $692 | | $ 994 | | $1,221 | | $2,016 |
| | | Class C shares | | $291 | | $ 591 | | $1,016 | | $2,201 |
|
| West Virginia Fund | | Class A shares | | $572 | | $ 778 | | $1,001 | | $1,641 |
| | | Class B shares* | | $677 | | $ 948 | | $1,144 | | $1,856 |
| | | Class C shares | | $277 | | $ 548 | | $ 944 | | $2,052 |
* Reflects the expenses of Class A shares after eight years because Class B shares automatically convert to Class A shares after eight years.
13
You would pay the following expenses if you did not redeem your shares:
| | | | | 1 Year | | 3 Years | | 5 Years | | 10 Years |
|
| California Fund | | Class A shares | | $589 | | $829 | | $1,088 | | $1,828 |
| | | Class B shares* | | $195 | | $603 | | $1,037 | | $2,048 |
| | | Class C shares | | $195 | | $603 | | $1,037 | | $2,243 |
|
| Florida Fund | | Class A shares | | $605 | | $879 | | $1,174 | | $2,011 |
| | | Class B shares* | | $212 | | $655 | | $1,124 | | $2,229 |
| | | Class C shares | | $212 | | $655 | | $1,124 | | $2,421 |
|
| Massachusetts Fund | | Class A shares | | $595 | | $850 | | $1,124 | | $1,904 |
| | | Class B shares* | | $202 | | $624 | | $1,073 | | $2,123 |
| | | Class C shares | | $201 | | $621 | | $1,068 | | $2,306 |
|
| Mississippi Fund | | Class A shares | | $579 | | $799 | | $1,037 | | $1,719 |
| | | Class B shares* | | $185 | | $573 | | $ 985 | | $1,940 |
| | | Class C shares | | $185 | | $573 | | $ 985 | | $2,137 |
|
| New York Fund | | Class A shares | | $596 | | $853 | | $1,129 | | $1,915 |
| | | Class B shares* | | $202 | | $624 | | $1,073 | | $2,126 |
| | | Class C shares | | $202 | | $624 | | $1,073 | | $2,317 |
|
| Ohio Fund | | Class A shares | | $580 | | $802 | | $1,042 | | $1,730 |
| | | Class B shares* | | $186 | | $576 | | $ 990 | | $1,951 |
| | | Class C shares | | $186 | | $576 | | $ 990 | | $2,148 |
|
| Rhode Island Fund | | Class A shares | | $586 | | $820 | | $1,073 | | $1,795 |
| | | Class B shares* | | $192 | | $594 | | $1,021 | | $2,016 |
| | | Class C shares | | $191 | | $591 | | $1,016 | | $2,201 |
|
| West Virginia Fund | | Class A shares | | $572 | | $778 | | $1,001 | | $1,641 |
| | | Class B shares* | | $177 | | $548 | | $ 944 | | $1,856 |
| | | Class C shares | | $177 | | $548 | | $ 944 | | $2,052 |
* Reflects the expenses of Class A shares after eight years because Class B shares automatically convert to Class A shares after eight years.
14
Investment Objectives & Principal Policies and Risks
The investment objective of each Fund is to provide current income exempt from regular federal income tax and particular state or local income or other taxes as applicable. Each Fund seeks to achieve its objective by investing primarily (i.e., at least 80% of its net assets during periods of normal market conditions) in municipal obligations, the interest on which is exempt from regular federal income tax and from the state taxes which, in accordance with the Fund’s investment objective, the Fund seeks to avoid. This is a fundamental policy of each Fund which only may be changed with shareholder approval. For purposes of the policy, “net assets” includes any borrowings for investment purposes. Each Fund’s investment objective and certain other policies may be changed by the Trustees without shareholder approval. There is no present intention to make any such change and shareholders will receive 60 days’ notice of any material change in a Fund’s investment objective .
At least 75% of net assets will normally be invested in municipal obligations rated at least investment grade at the time of investment (which are those rated Baa or higher by Moody’s, or BBB or higher by either S&P or Fitch) or, if unrated, determined by the investment adviser to be of at least investment grade quality. The balance of net assets may be invested in municipal obligations rated below investment grade and in unrated municipal obligations considered to be of comparable quality by the investment adviser. Municipal obligations rated Baa or BBB have speculative characteristics, while lower quality obligations are predominantly speculative. Also, changes in economic conditions or other circumstances are more likely to reduce the capacity of issuers of lower-rated obligations to make principal and interest payments. Lower rated obligations also may be subject to greater price volatility than higher rated obligations. No Fund will invest more than 10% of its net assets in obliga tions rated below B by Moody’s, S&P or Fitch, or in unrated obligations considered to be of comparable quality by the investment adviser.
Municipal obligations include bonds, notes and commercial paper issued by a municipality, a group of municipalities or participants in qualified issues of tax-exempt debt for a wide variety of both public and private purposes. Municipal obligations also include municipal leases and participations in municipal leases. The obligation of the issuer to meet its obligations under such leases is often subject to the appropriation by the appropriate legislative body, on an annual or other basis, of funds for the payment of the obligations. Certain municipal obligations may be purchased on a “when-issued” basis, which means that payment and delivery occur on a future settlement date. The price and yield of such securities are generally fixed on the date of commitment to purchase.
The investment adviser’s process for selecting securities for purchase and sale is research intensive and emphasizes the creditworthiness of the issuer or other person obligated to repay the obligation.
The interest on municipal obligations is (in the opinion of the issuer’s counsel) exempt from regular federal income tax. Interest income from certain types of municipal obligations generally will be subject to the federal alternative minimum tax (the “AMT”) for individuals. Distributions to corporate investors may also be subject to the AMT. The Funds may not be suitable for investors subject to the AMT.
Although each Fund may invest in securities of any maturity, it is expected that a Fund will normally acquire securities with maturities of ten years or more at the time of investment. Many obligations permit the issuer at its option to “call,” or redeem, its securities. As such, the effective maturity of an obligation may be less than ten years as the result of call provisions. The effective maturity of an obligation is its likely redemption date after consideration of any call or redemption features. If an issuer calls securities during a time of declining interest rates, it may not be possible to reinvest the proceeds in securities providing the same investment return as the securities redeemed. The average maturity of a Fund’s holdings may vary depending on market conditions.
Under normal conditions, each Fund invests at least 65% of its total assets in obligations issued by its respective state or its political subdivisions, agencies, authorities and instrumentalities. Municipal obligations of issuers in a single state may be adversely affected by economic developments (including insolvency of an issuer) and by legislation and other governmental activities in that state. Each Fund may also invest up to 35% of its net assets in municipal obligations issued by the governments of Puerto Rico, the U.S. Virgin Islands and Guam. Moody’s currently rates Puerto Rico general obligations Baa3 and S&P rates them BBB-. S&P currently rates Guam general obligations B. Obligations issued by the U.S. Virgin Islands are not currently rated.
Each Fund may invest 25% or more of its total assets in municipal obligations in the same sector (such as leases, housing finance, public housing, municipal utilities, hospital and health facilities or industrial development). This may make a Fund more susceptible to adverse economic, political or regulatory occurrences or adverse court decisions affecting a particular sector.
15
The net asset value of the Fund’s shares will change in response to changes in prevailing interest rates and changes in the value of securities held by the Fund. The value of securities held will be affected by the credit quality of the issuer of the obligation, and general economic and business conditions that affect the specific economic sector of the issuer, as well as any change to the tax treatment of securities held by a Fund. Changes by rating agencies in the rating assigned to an obligation may also affect the value of that obligation. To the extent that securities held by a Fund are insured as to principal and interest payments by insurers whose claims-paying ability rating is downgraded by Moody’s, S&P or Fitch, the value of such securities may be affected. The increased presence of non-traditional participants in the municipal markets may lead to greater volatility in the markets.
A Fund may purchase derivative instruments, which derive their value from another instrument, security or index. For example, a Fund may invest in residual interests of a trust (the ”trust”) that holds municipal securities (“inverse floaters”). The trust will also issue floating rate notes to third parties that may be senior to the Fund’s inverse floaters. The Fund receives interest payments on inverse floaters that bear an inverse relationship to the interest rate paid on the floating rate notes. As a result of Financial Accounting Standards Statement No. 140 (“FAS 140”), interest paid by the trust to the floating rate note holders may be reflected as income in the Fund’s financial statements with an offsetting expense for the interest paid by the trust to the floating rate note holders. Inverse floaters involve leverage risk and will involve greater risk than an investment in a fixed rate bond. Because changes in the interest rate paid to the floating r ate note holders inversely affects the interest paid on the inverse floater, the value and income of an inverse floater are generally more volatile than that of a fixed rate bond. Inverse floaters have varying degrees of liquidity, and the market for these securities is relatively volatile. These securities tend to underperform the market for fixed rate bonds in a rising long-term interest rate environment, but tend to outperform the market for fixed rate bonds when long-term interest rates decline. While inverse floaters expose a Fund to leverage risk, they do not constitute borrowings for purposes of a Fund’s restrictions on borrowings.
Each Fund may also purchase and sell various kinds of financial futures contracts and options thereon to hedge against changes in interest rates or as a substitute for the purchase of portfolio securities. Each Fund may also enter interest rate swaps, forward rate contracts and credit derivatives, which may include credit default swaps, total return swaps or credit options, as well as purchase an instrument that has greater or lesser credit risk than the municipal bonds underlying the instrument. The use of derivative instruments for both hedging and investment purposes involves a risk of loss or depreciation due to a variety of factors including counterparty risk, unexpected market, interest rate or securities price movements, and tax and regulatory constraints. The use of derivatives is highly specialized and engaging in derivative transactions for purposes other than hedging is speculative. Derivative hedging transactions may not be effective because of imperfect correlations, i.e. of fsetting markets which do not experience price changes in perfect correlation with each other, and other factors.
Each Fund may invest in zero coupon bonds, which do not require the issuer to make periodic interest payments. The values of these bonds are subject to greater fluctuation in response to changes in market interest rates than bonds which pay interest currently. Each Fund accrues income on these investments and is required to distribute that income each year. Each Fund may be required to sell securities to obtain cash needed for income distributions.
The limited liquidity of certain securities in which each Fund may invest (including those eligible for resale under Rule 144A of the Securities Act of 1933) could affect their market prices, thereby adversely affecting net asset value and the ability to pay income. The amount of publicly available information about certain municipal obligations may be limited and the investment performance of a Fund may be more dependent on the portfolio manager’s analysis than if this were not the case.
Each Fund may borrow amounts up to one-third of the value of its total assets (including borrowings), but it will not borrow more than 5% of the value of its total assets except to satisfy redemption requests or for other temporary purposes. Such borrowings would result in increased expense to a Fund and, while they are outstanding, would magnify increases or decreases in the value of Fund shares. No Fund will purchase additional investment securities while outstanding borrowings exceed 5% of the value of its total assets.
During unusual market conditions, each Fund may temporarily invest up to 50% of its total assets in cash or cash equivalents, which is not consistent with a Fund’s investment objectives. While temporarily invested, a Fund may not achieve its objective, and interest income from temporary investments may be taxable. Each Fund might not use all of the strategies and techniques or invest in all of the types of securities described in this Prospectus or the Statement of Additional Information. While at times a Fund may use alternative investment strategies in an effort to limit its losses, it may choose not to do so.
16
Each Fund’s investment policies include a fundamental investment provision allowing the Fund to invest substantially all of its investable assets in one or more open-end management investment companies having substantially the same investment policies and restrictions as the Fund. Any such company or companies would be advised by the Fund’s investment adviser (or an affiliate) and the Fund would not pay directly any advisory fee with respect to the assets so invested. The Fund will indirectly bear its proportionate share of any management fees paid by investment companies in which it invests in addition to the advisory fee paid by the Fund. The Fund may initiate investments in one or more investment companies at any time without shareholder approval.
Management and Organization
Management. Each Fund’s investment adviser is Boston Management and Research (“BMR”), a subsidiary of Eaton Vance Management (“Eaton Vance”), with offices at The Eaton Vance Building, 255 State Street, Boston, MA 02109. Eaton Vance has been managing assets since 1924 and managing mutual funds since 1931. Eaton Vance and its subsidiaries currently manage over $160 billion on behalf of mutual funds, institutional clients and individuals.
The investment adviser manages the investments of each Fund. Under its investment advisory agreement with each Fund, BMR receives a monthly advisory fee equal to the aggregate of a daily asset based fee and a daily income based fee. The fees are applied on the basis of the following categories. Categories (1) and (2) below do not apply to the California Fund and Category (3) is for daily net assets of the California Fund of up to $500 million.
| | | | | Annual | | Daily |
| Category | | Daily Net Assets | | Asset Rate | | Income Rate |
|
| 1 | | up to $20 million | | 0.100% | | 1.00% |
| 2 | | $20 million but less than $40 million | | 0.200% | | 2.00% |
| 3 | | $40 million but less than $500 million | | 0.300% | | 3.00% |
| 4 | | $500 million but less than $1 billion | | 0.275% | | 2.75% |
| 5 | | $1 billion but less than $1.5 billion | | 0.250% | | 2.50% |
| 6 | | $1.5 billion but less than $2 billion | | 0.225% | | 2.25% |
| 7 | | $2 billion but less than $3 billion | | 0.200% | | 2.00% |
| 8 | | $3 billion and over | | 0.175% | | 1.75% |
For the fiscal year ended September 30, 2007, BMR earned advisory fees equivalent to the percentage of average daily net assets stated below.
| | | Net Assets on | | |
| Fund | | September 30, 2007 | | Advisory Fee |
|
| California | | $276,263,859 | | 0.45% |
| Florida | | $241,694,941 | | 0.42% |
| Massachusetts | | $329,616,889 | | 0.42% |
| Mississippi | | $ 17,261,258 | | 0.15% |
| New York | | $443,240,375 | | 0.43% |
| Ohio | | $334,279,728 | | 0.41% |
| Rhode Island | | $ 64,033,341 | | 0.30% |
| West Virginia | | $ 31,752,328 | | 0.20% |
Each Fund’s most recent shareholder report provides information regarding the basis for the Trustees’ approval of each Fund’s investment advisory agreement.
Craig Brandon is the portfolio manager of the Mississippi Fund (since September 13, 2004) and the New York Fund (since October 17, 2005). Cynthia J. Clemson is the portfolio manager of the Florida Fund (since November 2, 1998) and the California Fund (since February 1, 1996). William H. Ahern, Jr. is the portfolio manager of the Ohio Fund (since October 17, 2005). Robert B. MacIntosh is the portfolio manager of the Massachusetts Fund (since it commenced operations), and the Rhode Island Fund (since November 24, 1997). Adam A. Weigold is the portfolio manager of the West Virginia Fund (since October 1, 2007). Each portfolio manager is a Vice President of Eaton Vance and BMR and also manages other Eaton Vance portfolios, and Ms. Clemson, Mr. Ahern and Mr. MacIntosh have managed Eaton Vance portfolios for more than five years. Mr. Brandon was appointed portfolio manager in 2004 and has been a municipal credit analyst at Eaton Vance for more t han five years. Mr. Weigold was appointed a portfolio manager in 2007 and has been a Vice President of Eaton Vance and BMR since 2003 and a municipal credit analyst at Eaton Vance for more than five years.
17
The Statement of Additional Information provides additional information about each portfolio manager’s compensation, other accounts managed by each portfolio manager, and each portfolio manager’s ownership of Fund shares with respect to which that portfolio manager has management responsibilities.
Eaton Vance serves as the administrator of each Fund, providing each Fund with administrative services and related office facilities. Eaton Vance does not currently receive a fee for serving as administrator.
Eaton Vance also serves as the sub-transfer agent for each Fund. For the sub-transfer agency services it provides, Eaton Vance receives an aggregate fee based upon the actual expenses it incurs in the performance of sub-transfer agency services. This fee is paid to Eaton Vance by a Fund’s transfer agent from the fees the transfer agent receives from the Eaton Vance funds.
Organization. Each Fund is a series of Eaton Vance Municipals Trust (the "Trust"), a Massachusetts business trust. Each Fund offers multiple classes of shares. Each Class represents a pro rata interest in a Fund but is subject to different expenses and rights. The Funds do not hold annual shareholder meetings but may hold special meetings for matters that require shareholder approval (such as electing or removing trustees, approving management or advisory contracts or changing investment policies that may only be changed with shareholder approval).
Because the Funds use this combined prospectus, a Fund could be held liable for a misstatement or omission made about another Fund. The Trust’s Trustees considered this risk in approving the use of a combined prospectus.
Valuing Shares
Each Fund values its shares once each day only when the New York Stock Exchange is open for trading (typically Monday through Friday), as of the close of regular trading on the Exchange (normally 4:00 p.m. eastern time). The purchase price of Fund shares is their net asset value (plus a sales charge for Class A shares), which is derived from the value of Fund holdings. When purchasing or redeeming Fund shares through an investment dealer, your investment dealer must communicate your order to the principal underwriter by a specific time each day in order for the purchase price or the redemption price to be based on that day’s net asset value per share. It is the investment dealer’s responsibility to transmit orders promptly. Each Fund may accept purchase and redemption orders as of the time of their receipt by certain investment dealers (or their designated intermediaries).
The Trustees have adopted procedures for valuing investments and have delegated to the investment adviser the daily valuation of such investments. Municipal obligations owned by the Funds are normally valued on the basis of valuations furnished by a pricing service. The pricing service considers various factors relating to bonds and market transactions to determine value. In certain situations, the investment adviser may use the fair value of a security if market prices are unavailable or deemed unreliable. A security that is fair valued may be valued at a price higher or lower than actual market quotations or the value determined by other funds using their own fair valuation procedures. The investment adviser expects to use fair value pricing for municipal obligations under limited circumstances, such as when an obligation is not priced by the pricing service or is in default. Eaton Vance has established a Valuation Committee that oversees the valuation of investments.
Purchasing Shares
You may purchase shares through your investment dealer or by mailing an account application form to the transfer agent (see back cover for address). You may request an account application by calling 1-800-262-1122. Your initial investment must be at least $1,000.
After your initial investment, additional investments may be made at any time by sending a check payable to the order of the Fund or the transfer agent directly to the transfer agent (see back cover for address). Please include your name and account number and the name of the Fund and Class of shares with each investment.
You may make automatic investments of $50 or more each month or each quarter from your bank account. You can establish bank automated investing on the account application or by calling 1-800-262-1122. The minimum initial investment amount and Fund policy of redeeming accounts with low account balances are waived for bank automated investing accounts, certain group purchase plans (including proprietary fee-based programs sponsored by broker-dealers) and for persons affiliated with Eaton Vance and certain Fund service providers (as described in the Statement of Additional Information).
Purchases will be executed at the net asset value next determined after their receipt in good order by a Fund’s transfer agent. A Fund’s transfer agent or your investment dealer must receive your purchase in good order no later than the close
18
of regular trading on the New York Stock Exchange (normally 4:00 p.m. eastern time) for your purchase to be effected at that day’s net asset value. If you purchase shares through an investment dealer (which includes brokers, dealers and other financial institutions), that dealer may charge you a fee for executing the purchase for you. Each Fund may suspend the sale of its shares at any time and any purchase order may be refused.
Restrictions on Excessive Trading and Market Timing. The Funds are not intended for excessive trading or market timing. Market timers seek to profit by rapidly switching money into a fund when they expect the share price of the fund to rise and taking money out of the fund when they expect those prices to fall. By realizing profits through short-term trading, shareholders that engage in rapid purchases and sales or exchanges of a fund’s shares may dilute the value of shares held by long-term shareholders. Volatility resulting from excessive purchases and sales or exchanges of fund shares, especially involving large dollar amounts, may disrupt efficient portfolio management. In particular, excessive purchases and sales or exchanges of a fund’s shares may cause a fund to have difficulty implementing its investment strategies, may force the fund to sell portfolio securities at inopportune times to raise cash or may cause increased expenses (such as increased brokerage costs, reali zation of taxable capital gains without attaining any investment advantage or increased administrative costs).
A fund that invests in securities that are, among other things, thinly traded, traded infrequently or relatively illiquid (including certain municipal obligations) is susceptible to the risk that the current market price for such securities may not accurately reflect current market values. A shareholder may seek to engage in short-term trading to take advantage of these pricing differences (commonly referred to as “price arbitrage”). The investment adviser is authorized to use the fair value of a security if prices are unavailable or are deemed unreliable (see “Valuing Shares”). The use of fair value pricing and the restrictions on excessive trading and market timing described below are intended to reduce a shareholder’s ability to engage in price arbitrage to the detriment of the Funds.
The Boards of Trustees of the Eaton Vance funds have adopted policies to discourage short-term trading and market timing and to seek to minimize their potentially detrimental effects. Pursuant to these policies, if an investor (through one or more accounts) makes more than two round-trip exchanges (exchanging from one fund to another fund and back again) within 12 months, it will be deemed to constitute market timing or excessive trading. Under the policies, each Fund or its principal underwriter will reject or cancel a purchase order, suspend or terminate the exchange privilege or terminate the ability of an investor to invest in the Eaton Vance funds if the Fund or the principal underwriter determines that a proposed transaction involves market timing or excessive trading that it believes is likely to be detrimental to the Fund. Each Fund and its principal underwriter cannot ensure that they will be able to identify all cases of market timing and excessive trading, although they believe they have adequate procedures in place to attempt to do so. Each Fund or its principal underwriter may also reject or cancel any purchase order (including an exchange) from an investor or group of investors for any other reason. Decisions to reject or cancel purchase orders (including exchanges) in each Fund are inherently subjective and will be made in a manner believed to be in the best interest of a Fund’s shareholders. No Eaton Vance fund has any arrangement to permit market timing.
The Funds and the principal underwriter have provided guidance to financial intermediaries (such as banks, broker-dealers, insurance companies and retirement administrators) concerning the application of the Eaton Vance funds’ market timing and excessive trading policies to Fund shares held in omnibus accounts maintained and administered by such intermediaries, including guidance concerning situations where market timing or excessive trading is considered to be detrimental to a Fund. Each Fund or its principal underwriter may rely on a financial intermediary’s policy to restrict market timing and excessive trading if it believes that policy is likely to prevent market timing that is likely to be detrimental to each Fund. Such policy may be more or less restrictive than a Fund’s policy. Each Fund and the principal underwriter cannot ensure that these financial intermediaries will in all cases apply the policies of the Funds or their own policies, as the case may be, to accounts un der their control.
Choosing a Share Class. Each Fund offers different classes of shares. The different classes of shares represent investments in the same portfolio of securities, but the classes are subject to different sales charges and expenses and will likely have different share prices due to differences in class expenses. In choosing the class of shares that suits your investment needs, you should consider:
- how long you expect to own your shares;
- how much you intend to invest;
- the sales charge and total operating expenses associated with owning each class; and
- whether you qualify for a reduction or waiver of any applicable sales charges (see “Reducing or Eliminating Class A Sales Charges” under “Sales Charges” below).
19
Each investor’s considerations are different. You should speak with your investment dealer to help you decide which class of shares is best for you. Set forth below is a brief description of each class of shares offered by the Funds.
Class A shares are offered at net asset value plus a front-end sales charge of up to 4.75% . This charge is deducted from the amount you invest. The Class A sales charge is reduced for purchases of $25,000 or more. The sales charge applicable to your purchase may be reduced under the right of accumulation or a statement of intention, which are described in “Reducing or Eliminating Class A Sales Charges” under “Sales Charges” below. Some investors may be eligible to purchase Class A shares at net asset value under certain circumstances, which are also described below. Class A shares pay distribution and service fees equal to 0.20% (0.25% for the California Fund) annually of average daily net assets. Returns on Class A shares are generally higher than returns on Class B and Class C shares because Class A has lower annual expenses than those classes.
Class B shares are offered at net asset value with no front-end sales charge. If you sell your Class B shares within six years of purchase, you generally will be subject to a contingent deferred sales charge or “CDSC”. The amount of the CDSC applicable to a redemption of Class B shares decreases over six years, as described in the CDSC schedule in “Contingent Deferred Sales Charge” under “Sales Charges” below. The CDSC is deducted from your redemption proceeds. Under certain circumstances, the Class B CDSC may be waived (such as in the case of the death of the shareholder). See “CDSC Waivers” under “Sales Charges” below. Class B shares pay distribution fees and service fees equal to 0.95% (1.00% for the California Fund) annually of average daily net assets. Returns on Class B shares are generally lower than returns on Class A shares because Class B has higher annual expenses than Class A. Class B Shares automatically convert to Class A sh ares after eight years. Because the sales charge applicable to Class A shares is reduced for larger purchases and Class A has lower operating expenses, purchasing Class B shares may not be appropriate if you are investing a large amount.
Orders for Class B shares of one or more Eaton Vance funds will be refused when the total value of the purchase (including the aggregate value of all Eaton Vance fund shares held within the purchasing shareholder’s account) is $100,000 or more. Investors considering cumulative purchases of $100,000 or more, or who, after a purchase of shares, would own shares of Eaton Vance funds with a current market value of $100,000 or more, should consider whether Class A shares would be more advantageous and consult their investment dealer.
Class C shares are offered at net asset value with no front-end sales charge. If you sell your Class C shares within 12 months of purchase, you generally will be subject to a CDSC. The CDSC is deducted from your redemption proceeds. Under certain circumstances, the Class C CDSC may be waived (such as certain redemptions from tax-deferred retirement plan accounts). See “CDSC Waivers” under “Sales Charges” below. Class C shares pay distribution fees and service fees equal to 0.95% (1.00% for the California Fund) annually of average daily net assets. Returns on Class C shares are generally lower than returns on Class A shares because Class C has higher annual expenses than Class A.
Orders for Class C shares of one or more Eaton Vance funds will be refused when the total value of the purchase (including the aggregate value of all Eaton Vance fund shares held within the purchasing shareholder’s account) is $1,000,000 or more. Investors considering cumulative purchases of $1,000,000 or more, or who, after a purchase of shares, would own shares of Eaton Vance funds with a current market value of $1,000,000 or more, should consider whether Class A shares would be more advantageous and consult their investment dealer.
Payments to Investment Dealers. In addition to payments disclosed under "Sales Charges" below, the principal underwriter, out of its own resources, may make cash payments to certain investment dealers who provide marketing support, transaction processing and/or administrative services and, in some cases, include some or all Eaton Vance funds in preferred or specialized selling programs. Payments made by the principal underwriter to an investment dealer may be significant and are typically in the form of fees based on Fund sales, assets, transactions processed and/or accounts attributable to that investment dealer. Investment dealers also may receive amounts from the principal underwriter in connection with educational or due diligence meetings that include information concerning Eaton Vance funds. The principal underwriter may pay or allow other promotional incentives or payments to investment dealers to the extent permitted by applicable laws and regulations.
Certain investment dealers that maintain “street name” or omnibus accounts provide sub-accounting, recordkeeping and/ or administrative services to the Eaton Vance funds and are compensated for such services by the funds. As used in this prospectus, the term “investment dealer” includes any broker, dealer, bank (including bank trust departments), registered investment adviser, financial planner, retirement plan administrator, their designated intermediaries and any other firm having a selling, administration or similar agreement with the principal underwriter or its affiliates.
20
Sales Charges
Class A Front-End Sales Charge. Class A shares are offered at net asset value per share plus a sales charge that is determined by the amount of your investment. The current sales charge schedule is:
| | | Sales Charge* | | Sales Charge* | | Dealer Commission |
| | | as Percentage of | | as Percentage of Net | | as Percentage of |
| Amount of Purchase | | Offering Price | | Amount Invested | | Offering Price |
|
| Less than $25,000 | | 4.75% | | 4.99% | | 4.50% |
| $25,000 but less than $100,000 | | 4.50% | | 4.71% | | 4.25% |
| $100,000 but less than $250,000 | | 3.75% | | 3.90% | | 3.50% |
| $250,000 but less than $500,000 | | 3.00% | | 3.09% | | 2.75% |
| $500,000 but less than $1,000,000 | | 2.00% | | 2.04% | | 2.00% |
| $1,000,000 or more | | 0.00** | | 0.00** | | 0.75% |
| * | Because the offering price per share is rounded to two decimal places, the actual sales charge you pay on a purchase of Class A shares may be more or less than your total purchase amount multiplied by the applicable sales charge percentage. |
| |
| ** | No sales charge is payable at the time of purchase on investments of $1 million or more. A CDSC of 1.00% will be imposed on such investments (as described below) in the event of redemptions within 18 months of purchase. |
| |
The principal underwriter may pay commissions of up to 1.00% on sales of Class A shares made at net asset value through the Eaton Vance Supplemental Retirement Account.
Reducing or Eliminating Class A Sales Charges. Front-end sales charges on purchases of Class A shares may be reduced under the right of accumulation or under a statement of intention. To receive a reduced sales charge, you must inform your investment dealer or a Fund at the time you purchase shares that you qualify for such a reduction. If you do not let your investment dealer or the Fund know you are eligible for a reduced sales charge at the time of purchase, you will not receive the discount to which you may otherwise be entitled.
Under the right of accumulation, the sales charge you pay is reduced if the current market value of your holdings in a Fund or any other Eaton Vance fund (based on the current maximum public offering price) plus your new purchase total $25,000 or more. Class A, Advisers Class, Class B, Class C, Class I and/or Class R shares of a Fund or other Eaton Vance funds, as well as shares of Eaton Vance Money Market Fund, owned by you may be included for this purpose. Shares of Eaton Vance Cash Management Fund and Eaton Vance Tax Free Reserves cannot be included under the right of accumulation. Shares owned by you, your spouse and children under age twenty-one may be combined for purposes of the right of accumulation, including shares held for the benefit of any of you in omnibus or “street name” accounts. In addition, shares held in a trust or fiduciary account of which any of the foregoing persons is the sole beneficiary (including retirement accounts) may be combined for purposes of the righ t of accumulation. Shares purchased and/or owned in a SEP, SARSEP and SIMPLE IRA plan also may be combined for purposes of the right of accumulation for the plan and its participants. You may be required to provide documentation to establish your ownership of shares included under the right of accumulation (such as account statements for you, your spouse and children or marriage certificates, birth certificates and/or trust or other fiduciary-related documents).
Under a statement of intention, purchases of $25,000 or more made over a 13-month period are eligible for reduced sales charges. Shares eligible under the right of accumulation (other than those included in employer-sponsored retirement plans) may be included to satisfy the amount to be purchased under a statement of intention. Under a statement of intention, the principal underwriter may hold 5% of the dollar amount to be purchased in escrow in the form of shares registered in your name until you satisfy the statement or the 13-month period expires. A statement of intention does not obligate you to purchase (or a Fund to sell) the full amount indicated in the statement.
Class A shares are offered at net asset value (without a sales charge) to clients of financial intermediaries who (i) charge an ongoing fee for advisory, investment, consulting or similar services, or (ii) have entered into an agreement with the principal underwriter to offer Class A shares through a no-load network or platform. Such clients may include individuals, corporations, foundations and endowments. Class A shares also are offered at net asset value to investment and institutional clients of Eaton Vance and its affiliates; certain persons affiliated with Eaton Vance; to certain fund service providers as described in the Statement of Additional Information. Class A shares may also be purchased at net asset value
21
pursuant to the reinvestment privilege and exchange privilege and when distributions are reinvested. See “Shareholder Account Features” for details.
Contingent Deferred Sales Charge. Each Class of shares is subject to a CDSC on certain redemptions. Class A shares purchased at net asset value in amounts of $1 million or more are subject to a 1.00% CDSC if redeemed within 18 months of purchase. In addition, Class A shares purchased through the Eaton Vance Supplemental Retirement Account (regardless of the amount of the purchase) are subject to a CDSC equal to 1% if redeemed within one year of purchase and a CDSC of 0.50% if redeemed within two years of purchase. Class C shares are subject to a 1.00% CDSC if redeemed within 12 months of purchase. Class B shares are subject to the following CDSC schedule:
| Year of Redemption After Purchase | | CDSC | | |
| | |
| | | | CDSCs are based on the lower of the net asset value at |
| First or Second | | 5% | | the time of purchase or at the time of redemption. |
| | | | | Shares acquired through the reinvestment of |
| Third | | 4% | | distributions are exempt from the CDSC. Redemptions |
| Fourth | | 3% | | are made first from shares that are not subject to a |
| Fifth | | 2% | | CDSC. |
| Sixth | | 1% | | |
| Seventh or following | | 0% | | |
The sales commission payable to investment dealers in connection with sales of Class B and Class C shares is described under “Distribution and Service Fees” below.
CDSC Waivers. CDSCs are waived for certain redemptions pursuant to a Withdrawal Plan (see “Shareholder Account Features”). The CDSC is also waived following the death of a beneficial owner of shares (a death certificate and other applicable documents may be required).
Conversion Feature. After eight years, Class B shares automatically convert to Class A shares. Class B shares acquired through the reinvestment of distributions convert in proportion to shares not so acquired.
Distribution and Service Fees. Class A, Class B and Class C shares have in effect plans under Rule 12b-1 that allows each Fund to pay distribution fees for the sale and distribution of shares (so-called “12b-1 fees”) and service fees for personal and/or shareholder account services. Class B and Class C shares pay distribution fees to the principal underwriter of 0.75% of average daily net assets annually. Because these fees are paid from Fund assets on an ongoing basis, they will increase your cost over time and may cost you more than paying other types of sales charges. The principal underwriter compensates investment dealers on sales of Class B and Class C shares (except exchange transactions and reinvestments) in an amount equal to 4% and 1%, respectively, of the purchase price of the shares. After the first year, investment dealers also receive 0.75% of the value of Class C shares in annual distribution fees. Class B and Class C also pay service fees to the principal underw riter equal to 0.20% (0.25% for California Class B and C shares) of average daily net assets annually. Class A shares pay distribution and service fees equal to 0.20% (0.25% for California Class A shares) of average daily net assets annually. After the sale of shares, the principal underwriter receives the Class A distribution and service fees and the Class B and Class C service fees for one year and thereafter investment dealers generally receive them based on the value of shares sold by such dealers for shareholder servicing performed by such investment dealers. Although there is no present intention to do so, (except with respect to California Fund Class A, B and C shares) each Class of each Fund could pay service fees of up to 0.25% annually upon Trustee approval. Distribution and service fees are subject to limitations contained in the sales charge rule of the Financial Industry Regulatory Authority.
More information about sales charges is available free of charge on the Eaton Vance website at www.eatonvance.com and in the Statement of Additional Information. Please consult the Eaton Vance website for any updates to sales charge information before making a purchase of Fund shares.
22
Redeeming Shares
You can redeem shares in any of the following ways:
| By Mail | | Send your request to the transfer agent along with any certificates and stock |
| | | powers. The request must be signed exactly as your account is registered and |
| | | signature guaranteed. You can obtain a signature guarantee at certain banks, |
| | | savings and loan institutions, credit unions, securities dealers, securities |
| | | exchanges, clearing agencies and registered securities associations. You may be |
| | | asked to provide additional documents if your shares are registered in the name of |
| | | a corporation, partnership or fiduciary. |
| | |
| By Telephone | | You can redeem up to $100,000 per account (which may include shares of one or |
| | | more Eaton Vance funds) per day by calling 1-800-262-1122 Monday through |
| | | Friday, 8:00 a.m. to 7:00 p.m. (eastern time). Proceeds of a telephone redemption |
| | | can be mailed only to the account address. Shares held by corporations, trusts or |
| | | certain other entities and shares that are subject to fiduciary arrangements cannot |
| | | be redeemed by telephone. |
| | |
| Through an Investment Dealer | | Your investment dealer is responsible for transmitting the order promptly. An |
| | | investment dealer may charge a fee for this service. |
If you redeem shares, your redemption price will be based on the net asset value per share next computed after the redemption request is received in good order by each Fund’s transfer agent. Your redemption proceeds will be paid in cash within seven days, reduced by the amount of any applicable CDSC and any federal income tax required to be withheld. Payments will be sent by mail. However, if you have given complete written authorization in advance, you may request that the redemption proceeds be wired directly to your bank account. The bank designated may be any bank in the United States. The request may be made by calling 1-800-262-1122 or by sending a signature guaranteed letter of instruction to the transfer agent (see back cover for address). You may be required to pay the costs of such transaction by each Fund or your bank. No costs are currently charged by the Fund. Each Fund may suspend or terminate the expedited payment procedure upon at least 30 days notice.
If you recently purchased shares, the proceeds of a redemption will not be sent until the purchase check (including a certified or cashier’s check) has cleared. If the purchase check has not cleared, redemption proceeds may be delayed up to 15 days from the purchase date. If your account value falls below $750 (other than due to market decline), you may be asked either to add to your account or redeem it within 60 days. If you take no action, your account will be redeemed and the proceeds sent to you.
While redemption proceeds are normally paid in cash, redemptions may be paid by distributing marketable securities. If you receive securities, you could incur brokerage or other charges in converting the securities to cash.
Shareholder Account Features
Once you purchase shares, the transfer agent establishes an account for you.
Distributions. You may have your Fund distributions paid in one of the following ways:
| •Full Reinvest Option | | Dividends and capital gains are reinvested in additional shares. This option will be |
| | | assigned if you do not specify an option. |
| | |
| •Partial Reinvest Option | | Dividends are paid in cash and capital gains are reinvested in additional shares. |
| | |
| •Cash Option | | Dividends and capital gains are paid in cash. |
| | |
| •Exchange Option | | Dividends and/or capital gains are reinvested in additional shares of any class of |
| | | another Eaton Vance fund chosen by you, subject to the terms of that fund’s |
| | | prospectus. Before selecting this option, you must obtain a prospectus of the other |
| | | fund and consider its objectives, risks, and charges and expenses carefully. |
23
Information about the Funds. From time to time, you may be mailed the following:
• Semiannual and annual reports containing a list of portfolio holdings as of the end of the second and fourth fiscal quarters, respectively, performance information and financial statements.
• Periodic account statements, showing recent activity and total share balance.
• Form 1099 and tax information needed to prepare your income tax returns.
• Proxy materials, in the event a shareholder vote is required.
• Special notices about significant events affecting your Fund.
Each Fund will file with the Securities and Exchange Commission (“SEC”) a list of its portfolio holdings as of the end of the first and third fiscal quarters on Form N-Q. Each Fund’s annual and semiannual reports (as filed on Form N-CSR) and each Form N-Q may be viewed on the SEC’s website (www.sec.gov). The most recent fiscal quarter end holdings may also be viewed on the Eaton Vance website (www.eatonvance.com). Portfolio holdings information that is filed with the SEC is posted on the Eaton Vance website approximately 60 days after the end of the quarter to which it relates. Portfolio holdings information as of each calendar quarter end is posted to the website 30 days after such quarter end. Each Fund also posts information about certain portfolio characteristics (such as top ten holdings and asset allocation) as of the most recent calendar quarter end on the Eaton Vance website approximately ten business days after the calendar quarter end.
The Eaton Vance funds have established policies and procedures with respect to the disclosure of portfolio holdings and other information concerning Fund characteristics. A description of these policies and procedures is provided in the Statement of Additional Information. Such policies and procedures regarding disclosure of portfolio holdings are designed to prevent the misuse of material, non-public information about the funds.
Withdrawal Plan. You may redeem shares on a regular monthly or quarterly basis by establishing a systematic withdrawal plan. Withdrawals will not be subject to any applicable CDSC if they are, in the aggregate, less than or equal to 12% annually of the greater of either the initial account balance or the current account balance. Because purchases of Class A shares are generally subject to an initial sales charge, Class A shareholders should not make withdrawals from their accounts while also making purchases.
Exchange Privilege. You may exchange your Fund shares for shares of the same Class of another Eaton Vance fund or, in the case of Class B and Class C shares, Eaton Vance Money Market Fund. Exchanges are made at net asset value. If your shares are subject to a CDSC, the CDSC will continue to apply to your new shares at the same CDSC rate. For purposes of the CDSC, your shares will continue to age from the date of your original purchase of Fund shares.
Before exchanging, you should read the prospectus of the new fund carefully. If you wish to exchange shares, write to the transfer agent (see back cover for address) or call 1-800-262-1122. Periodic automatic exchanges are also available. The exchange privilege may be changed or discontinued at any time. You will receive 60 days’ notice of any material change to the privilege. This privilege may not be used for “market timing”. If an account (or group of accounts) makes more than two round-trip exchanges (exchanged from one fund to another and back again) within 12 months, it will be deemed to be market timing. As described under “Purchasing Shares”, the exchange privilege may be terminated for market timing accounts or for other reasons.
Reinvestment Privilege. If you redeem shares, you may reinvest at net asset value all or any portion of the redemption proceeds in the same class of shares of a Fund you redeem from, provided that the reinvestment occurs within 60 days of the redemption, and the privilege has not been used more than once in the prior 12 months. Under these circumstances your account will be credited with any CDSC paid in connection with the redemption. Any CDSC period applicable to the shares you acquire upon reinvestment will run from the date of your original share purchase. Reinvestment requests must be in writing. If you reinvest, your purchase will be at the next determined net asset value following receipt of your request.
Telephone and Electronic Transactions. You can redeem or exchange shares by telephone as described in this prospectus. In addition, certain transactions may be conducted through the Internet. The transfer agent and the principal underwriter have procedures in place to authenticate telephone and electronic instructions (such as using security codes or verifying personal account information). As long as the transfer agent and principal underwriter follow reasonable procedures, they will not be responsible for unauthorized telephone or electronic transactions and you bear the risk of possible loss resulting from these transactions. You may decline the telephone redemption option on the account application. Telephone instructions are recorded.
“Street Name” Accounts. If your shares are held in a “street name” account at an investment dealer, that dealer (and not the Fund or its transfer agent) will perform all recordkeeping, transaction processing and distribution payments. Because the Fund will have no record of your transactions, you should contact your investment dealer to purchase, redeem or exchange shares, to make changes in your account, or to obtain account information. You will not be able to utilize a
24
number of shareholder features, such as telephone transactions, directly with a Fund. If you transfer shares in a “street name” account to an account with another investment dealer or to an account directly with a Fund, you should obtain historical information about your shares prior to the transfer.
Procedures for Opening New Accounts. To help the government fight the funding of terrorism and money laundering activities, federal law requires each Fund to obtain, verify and record information that identifies each person who opens a Fund account, and each Fund has designated an anti-money laundering compliance officer. When you open an account, the transfer agent or your investment dealer will ask you for your name, address, date of birth and other identifying information. You also may be asked to produce a copy of your driver’s license and other identifying documents. If a person fails to provide the information requested, any application by that person to open a new account will be rejected. Moreover, if the transfer agent or the investment dealer is unable to verify the identity of a person based on information provided by that person, it may take additional steps including, but not limited to, requesting additional information from the person, closing the person’s accoun t or reporting the matter to the appropriate federal authorities. If your account is closed for this reason, your shares may be automatically redeemed. If the Fund’s net asset value has decreased since your purchase, you will lose money as a result of this redemption.
Account Questions. If you have any questions about your account or the services available, please call Eaton Vance Shareholder Services at 1-800-262-1122, or write to the transfer agent (see back cover for address).
Tax Information
Each Fund declares dividends daily and ordinarily pays distributions monthly. Different Classes of a Fund will distribute different dividend amounts. Your account will be credited with dividends beginning on the business day after the day when the funds used to purchase your Fund shares are collected by the transfer agent. For tax purposes, the entire monthly distribution of the Fund’s daily dividends ordinarily will constitute tax-exempt income to you. Distributions of any net realized gains, if any, will be made at least annually (usually in December). The exemption of “exempt-interest dividend” income from regular federal income taxation does not necessarily result in similar exemptions from such income under the state or local tax laws.
A Fund may invest a portion of its assets in securities that generate income that is not exempt from federal income tax. Taxes on distributions of capital gains are determined by how long the Fund owned the investments that generated them, rather than how long a shareholder has owned his or her shares in the Fund. Distributions of any taxable income and net short-term capital gains will be taxable as ordinary income. Distributions of any long-term capital gains are taxable as long-term capital gains. Distributions of interest on certain municipal obligations are a tax preference item under the AMT provisions applicable to individuals and corporations, and all tax-exempt distributions may affect a corporation’s AMT liability. Each Fund’s distributions will be treated as described above for federal income tax purposes whether they are paid in cash or reinvested in additional shares. A redemption of Fund shares, including an exchange for shares of another fund, is a taxable transaction.
In January 2006, the Kentucky Court of Appeals held, in Davis v. Department of Revenue, that Kentucky’s exemption of interest on its own bonds and those of its political subdivisions and its taxation of interest on the bonds of other states and their political subdivisions unlawfully discriminates against interstate commerce. The Kentucky Supreme Court declined to review this decision. In May 2007, the U.S. Supreme Court granted Kentucky’s petition to review the Davis decision and oral arguments were heard on November 5, 2007. The Court is expected to issue a ruling by the end of its current term in June 2008. In 1994, the Ohio Court of Appeals had reached the opposite conclusion on this legal issue, upholding a similar Ohio statute, in Shaper v. Tracy.
If the U.S. Supreme Court affirms the Davis decision in Kentucky, other states’ current tax treatment of their own state and local government bonds may also be challenged. With only a few exceptions, every state besides Kentucky that imposes an income tax likewise exempts from taxation the interest on bonds issued by the state and its political subdivisions (“instate municipal bonds”) while taxing the interest on bonds issued by other states and their political subdivisions (“out-of-state municipal bonds”). If the U.S. Supreme Court affirms the decision of the Kentucky court in the Davis case, and the U.S. Congress does not exercise its power under the Commerce Clause of the U.S. Constitution to enact legislation allowing states to tax the interest on out-of-state municipal bonds while exempting from taxation the interest on in-state municipal bonds, these states would need to either extend the same tax exemption to out-of-state municipal bonds or begin ta xing the interest on in-state municipal bonds as well as out-of-state municipal bonds. If a state begins to tax the interest on all municipal bonds, in-state as well as out-of-state, the result would be a decline in the value of all in-state municipal bonds held by taxpayers of that state, either directly or indirectly through ownership of shares in a Fund.
25
Shareholders, particularly corporations, recipients of social security or railroad retirement benefits and those subject to alternative minimum tax, should consult with their advisers concerning the applicability of federal, state, local and other taxes to an investment. Additional information about state taxes is provided below.
California. Under California law, dividends paid by the California Fund and designated by it as tax-exempt are exempt from California personal income tax on individuals who reside in California to the extent such dividends are derived from interest payments on municipal obligations exempt from California state personal income taxes and provided that at least 50% of the assets of the California Fund at the close of each quarter of its taxable year are invested in obligations the interest on which is exempt under either federal or California law from taxation by the state of California. Distributions of short-term capital gains are treated as ordinary income, and distributions of long-term capital gains are treated as long-term capital gains taxable at ordinary income rates under the California personal income tax.
Florida. Until January 1, 2007, Florida imposed a tax on intangible personal property owned by Florida residents. Shares of a Florida fund owned by a Florida resident were exempt from the Florida intangible personal property tax as long as at least ninety percent (90%) of the net asset value of the portfolio was invested in assets exempt from the Florida intangible personal property tax. Because the Florida Fund normally invests in tax-exempt obligations of Florida, the United States, the U.S. Territories or political subdivisions of the United States or Florida, Florida Fund shares were, under normal circumstances, exempt from the Florida intangibles tax. In mid-2006, Florida passed a law repealing the intangible personal property tax which became effective on January 1, 2007.
Massachusetts. The Massachusetts Fund’s interest distributions attributable to Massachusetts obligations (debt obligations issued by The Commonwealth of Massachusetts or its political subdivisions, including agencies or instrumentalities thereof), Possessions obligations (debt obligations issued by the Governments of Puerto Rico, Guam, or the United States Virgin Islands) or United States obligations can be excluded from Massachusetts gross income for Massachusetts personal income tax purposes. Distributions properly designated as capital gain dividends and attributable to gains realized on the sale of certain Massachusetts tax-exempt obligations issued pursuant to statutes that specifically exempt such gains from Massachusetts taxation will also be exempt from Massachusetts personal income tax. Other distributions from the Massachusetts Fund that are included in a shareholder’s federal gross income, including distributions of net long-term capital gains not described in the pr eceding sentence and net short-term capital gains, are generally not exempt from Massachusetts personal income tax.
Distributions from the Massachusetts Fund and the value of the shares of the Massachusetts Fund will be subject to the Massachusetts excise tax on corporations.
Mississippi. Under existing Mississippi income tax law, interest received by a Mississippi resident individual upon the obligations of the State of Mississippi or political subdivisions thereof (“Mississippi obligations”) is exempt from Mississippi income tax. In 1993, the Mississippi State Tax Commission issued a ruling stating that a Mississippi resident taxpayer’s pro rata portion of interest dividends distributed by the Mississippi Fund will be non-taxable to the extent that such pro rata portion represents interest received by the Mississippi Fund, either directly or through the Mississippi Portfolio, from Mississippi tax-exempt obligations that would be exempt from Mississippi income tax purposes if such tax-exempt obligations were directly held by the taxpayer. In 2004, the Mississippi Fund redeemed its investment in and dissolved the Mississippi Portfolio thereby becoming the direct owner of the investment assets previously owned indirectly through the Missi ssippi Portfolio. In the opinion of special tax counsel to the Mississippi Fund, a Mississippi resident individual’s pro rata portion of interest dividends distributed by the Mississippi Fund will be exempt from Mississippi income tax to the extent that such pro rata portion (i) is excluded from gross income under the Internal Revenue Code and (ii) represents interest the Mississippi Fund receives from investments in Mississippi tax-exempt obligations.
New York. In the opinion of special tax counsel to the New York Fund, under New York law, dividends paid by the New York Fund are exempt from New York State and New York City personal income tax applicable to individuals who reside in New York State and/or City to the extent such dividends are excluded from gross income for federal income tax purposes and are derived from interest payments on tax-exempt obligations issued by or on behalf of New York State and its political subdivisions and agencies, and the governments of Puerto Rico, the U.S. Virgin Islands and Guam. Other distributions from the New York Fund, including distributions derived from taxable ordinary income and net short-term and long-term capital gains, are generally not exempt from New York State or City personal income tax.
Ohio. In the opinion of special tax counsel to the Ohio Fund, under Ohio law individuals who are otherwise subject to the Ohio personal income tax will not be subject to such tax on dividends paid by the Ohio Fund to the extent such dividends are properly attributable to interest on obligations issued by or on behalf of the State of Ohio or its political subdivisions, or the agencies or instrumentalities thereof (“Ohio obligations”). Dividends paid by the Ohio Fund also will be excluded from the net income base of the Ohio corporation franchise tax to the extent such dividends are excluded from gross
26
income for federal income tax purposes or are properly attributable to interest on Ohio obligations. However, the Ohio Fund’s shares will be included in the tax base for purposes of computing the Ohio corporation franchise tax on the net worth basis. These conclusions regarding Ohio taxation are based on the assumption that the Ohio Fund will continue to qualify as a regulated investment company under the Internal Revenue Code and that at all times at least 50% of the value of the total assets of the Ohio Fund will consist of Ohio obligations or similar obligations of other states or their subdivisions.
Rhode Island. The Rhode Island Fund obtained an opinion from special tax counsel to the Rhode Island Fund, that under Rhode Island law, dividends paid by the Rhode Island Fund are exempt from Rhode Island state income tax for individuals who reside in Rhode Island to the extent such dividends are excluded from gross income for federal income tax purposes and are derived from interest payments on obligations of Rhode Island, its political subdivisions, the United States and its Territories (“Rhode Island Obligations”). Other distributions from the Rhode Island Fund, including distributions from capital gains, are generally not exempt from Rhode Island state personal income tax.
West Virginia. In the opinion of special tax counsel to the West Virginia Fund, under existing West Virginia law, in 1991 the West Virginia Department of Tax and Revenue issued Technical Assistance Advisory 91-002 which was declared to be of precedential value. This Technical Assistance Advisory addresses liability for West Virginia personal income tax on interest and dividend income received by investors in regulated investment companies. Accordingly, under existing law, as long as the West Virginia Fund qualifies as a separate “regulated investment company” under the Internal Revenue Code, that portion of exempt-interest dividends that represents interest income received by the West Virginia Fund from obligations of the United States and its possessions and interest or dividend income received by the West Virginia Fund on obligations or securities of any authority, commission or instrumentality of the United States or of the State of West Virginia, which is exempt from West V irginia State income tax by federal or West Virginia law, is exempt from West Virginia personal income tax. This exemption does not apply to any portion of interest income on obligations of any state other than West Virginia, regardless of any exemption provided under federal law. In the event the West Virginia Fund fails to qualify as a separate “regulated investment company”, the foregoing exemption may be unavailable or substantially limited.
The Technical Assistance Advisory contains a more specific, although nonexclusive, list of obligations and authorities which are exempt from taxation. The Technical Assistance Advisory also confirms that interest on indebtedness incurred (directly or indirectly) by a shareholder of the West Virginia Fund to purchase or carry shares of the West Virginia Fund will not be deductible for West Virginia income purposes.
27
Financial Highlights
The financial highlights are intended to help you understand a Fund’s financial performance for the past five years. Certain information in the tables reflects the financial results for a single Fund share. The total returns in the tablesrepresent the rate an investor would have earned (or lost) on an investment in a Fund (assuming reinvestment of all distributions and not taking into account a sales charge). This information has been audited by Deloitte & Touche LLP, an independent registered public accounting firm. The report of Deloitte & Touche LLP and each Fund’s financial statements are incorporated herein by reference and included in the Fund’s annual report, which is available on request.
| | | California Fund |
| |
|
| | | Year Ended September 30, |
| |
|
| | | 2007(1) | | 2006(1) | | 2005(1) |
| |
|
| | | Class A | | Class B | | Class C | | Class A | | Class B | | Class C | | Class A | | Class B | | Class C |
|
| |
| Net asset value - Beginning of year | | $ 11.080 | | $10.260 | | $10.250 | | $ 10.900 | | $10.090 | | $10.090 | | $ 10.860 | | $10.060 | | $10.060 |
| |
| Income (loss) from operations | | | | | | | | | | | | | | | | | | |
| Net investment income | | $ 0.458 | | $ 0.350 | | $ 0.348 | | $ 0.486 | | $ 0.374 | | $ 0.366 | | $ 0.515 | | $ 0.399 | | $ 0.384 |
| Net realized and unrealized gain (loss) | | (0.280) | | (0.273) | | (0.261) | | 0.181 | | 0.171 | | 0.169 | | 0.037 | | 0.030 | | 0.045 |
| Total income from operations | | $ 0.178 | | $ 0.077 | | $ 0.087 | | $ 0.667 | | $ 0.545 | | $ 0.535 | | $ 0.552 | | $ 0.429 | | $ 0.429 |
| |
| Less distributions | | | | | | | | | | | | | | | | | | |
| From net investment income | | $ (0.462) | | $ (0.351) | | $ (0.351) | | $ (0.487) | | $ (0.375) | | $ (0.375) | | $ (0.512) | | $ (0.399) | | $ (0.399) |
| From net realized gain | | (0.176) | | (0.176) | | (0.176) | | — | | — | | — | | — | | — | | — |
| Total distributions | | $ (0.638) | | $ (0.527) | | $ (0.527) | | $ (0.487) | | $ (0.375) | | $ (0.375) | | $ (0.512) | | $ (0.399) | | $ (0.399) |
| Contingent deferred sales charges | | $ — | | $ — | | $ — | | $ — | | $ — | | $ — | | $ — | | $ — | | $ — |
| Net asset value - End of year | | $ 10.620 | | $ 9.810 | | $ 9.810 | | $ 11.080 | | $10.260 | | $10.250 | | $ 10.900 | | $10.090 | | $10.090 |
| Total return (2) | | 1.61% | | 0.73% | | 0.83% | | 6.28% | | 5.52% | | 5.42% | | 5.18% | | 4.50%(3) | | 4.42%(3) |
| |
| Ratios/Supplemental Data | | | | | | | | | | | | | | | | | | |
| Net assets, end of year (000’s omitted) | | $261,254 | | $ 3,545 | | $11,465 | | $233,618 | | $ 4,090 | | $ 4,933 | | $223,528 | | $ 3,655 | | $ 1,725 |
| Ratios (As a percentage of average daily net | | | | | | | | | | | | | | | | | | |
| assets): | | | | | | | | | | | | | | | | | | |
| Expenses excluding interest and fees | | 0.84%(12) | | 1.59%(12) | | 1.59%(12) | | 0.86% | | 1.61% | | 1.61% | | 0.88%(9) | | 1.63%(9) | | 1.63%(9) |
| Interest and fee expense(10) | | 0.33% | | 0.33% | | 0.33% | | 0.37% | | 0.37% | | 0.37% | | 0.23%(9) | | 0.23%(9) | | 0.23%(9) |
| Total expenses before custodian fee reduction | | 1.17%(12) | | 1.92%(12) | | 1.92%(12) | | 1.23% | | 1.98% | | 1.98% | | 1.11%(9) | | 1.86%(9) | | 1.86%(9) |
| Expenses after custodian fee reduction excluding | | | | | | | | | | | | | | | | | | |
| interest and fees | | 0.82%(12) | | 1.57%(12) | | 1.57%(12) | | 0.85% | | 1.60% | | 1.60% | | 0.87%(9) | | 1.62%(9) | | 1.62%(9) |
| Net investment income | | 4.22% | | 3.48% | | 3.49% | | 4.45% | | 3.70% | | 3.62% | | 4.71% | | 3.94% | | 3.78% |
| Portfolio Turnover of the Portfolio (8) | | — | | — | | — | | — | | — | | — | | — | | — | | — |
| Portfolio Turnover of the Fund | | 41% | | 41% | | 41% | | 30% | | 30% | | 30% | | 23% | | 23% | | 23% |
(See footnotes on last page.)
28
Financial Highlights (continued)
| | | California Fund |
| |
|
| | | Year Ended September 30, |
| |
|
| | | 2004(1)(6) | | 2003(1) |
| |
|
| | | Class A | | Class B | | Class C | | Class A | | Class B |
|
| |
| Net asset value - Beginning of year | | $ 10.920 | | $10.110 | | $10.000 | | $11.250 | | $ 10.400 |
| |
| Income (loss) from operations | | | | | | | | | | | | |
| Net investment income | | $ 0.548 | | $ 0.483 | | $ 0.033 | | $ 0.542 | | $ 0.481 |
| Net realized and unrealized gain (loss) | | (0.078) | | (0.083) | | 0.062 | | (0.342) | | (0.317) |
| Total income from operations | | $ 0.470 | | $ 0.400 | | $ 0.095 | | $ 0.200 | | $ 0.164 |
| |
| Less distributions | | | | | | | | | | | | |
| From net investment income | | $ (0.530) | | $ (0.455) | | $ (0.035) | | $ (0.530) | | $ (0.459) |
| From net realized gain | | | | | | | | | | | | |
| Total distributions | | $ (0.530) | | $ (0.455) | | $ (0.035) | | $ (0.530) | | $ (0.459) |
| Contingent deferred sales charges | | $ — | | $ 0.005 | | $ — | | $ — | | $ 0.005 |
| Net asset value - End of year | | $ 10.860 | | $10.060 | | $10.060 | | $10.920 | | $ 10.110 |
| Total return (2) | | 4.42% | | 4.14% | | 0.86%(13) | | 1.89% | | | | 1.73% |
| |
| Ratios/Supplemental Data | | | | | | | | | | | | |
| Net assets, end of year (000’s omitted) | | $227,878 | | $ 1,983 | | $ 96 | | $34,753 | | $212,145 |
| Ratios (As a percentage of average daily net assets): | | | | | | | | | | | | |
| Expenses excluding interest and fees | | 0.90%(9) | | 1.10%(9) | | 1.65%(5)(9) | | 0.88%(9) | | | | 1.09%(9) |
| Interest and fee expense(10) | | 0.15%(9) | | 0.15%(9) | | 0.15%(5)(9) | | 0.12%(9) | | | | 0.12%(9) |
| Total expenses before custodian fee reduction | | 1.05%(9) | | 1.25%(9) | | 1.80%(5)(9) | | 1.00%(9) | | | | 1.21%(9) |
| Expenses after custodian fee reduction excluding interest and fees | | 0.90%(9) | | 1.10%(9) | | 1.65%(5)(9) | | 0.87%(9) | | | | 1.08%(9) |
| Net investment income | | 5.09% | | 4.75% | | 4.24%(5) | | 4.97% | | | | 4.79% |
| Portfolio Turnover of the Portfolio (8) | | 18% | | 18% | | 18% | | 21% | | | | 21% |
| Portfolio Turnover of the Fund | | — | | — | | — | | — | | | | — |
(See footnotes on last page.)
29
Financial Highlights (continued)
| | | Florida Fund |
| |
|
| | | Year Ended September 30, |
| |
|
| | | 2007(1) | | 2006(1)(7) | | 2005(1) |
| |
|
| | | Class A | | Class B | | Class C | | Class A | | Class B | | Class C | | Class A | | Class B |
|
| |
| Net asset value - Beginning of year | | $ 10.820 | | $11.090 | | $11.080 | | $ 10.640 | | $10.910 | | $10.970 | | $ 10.580 | | $10.840 |
| |
| Income (loss) from operations | | | | | | | | | | | | | | | | |
| Net investment income | | $ 0.486 | | $ 0.416 | | $ 0.416 | | $ 0.490 | | $ 0.421 | | $ 0.215 | | $ 0.506 | | $ 0.437 |
| Net realized and unrealized gain (loss) | | (0.246) | | (0.247) | | (0.237) | | 0.174 | | 0.172 | | 0.118 | | 0.065 | | 0.075 |
| Total income from operations | | $ 0.240 | | $ 0.169 | | $ 0.179 | | $ 0.664 | | $ 0.593 | | $ 0.333 | | $ 0.571 | | $ 0.512 |
| |
| Less distributions | | | | | | | | | | | | | | | | |
| From net investment income | | $ (0.480) | | $ (0.409) | | $ (0.409) | | $ (0.484) | | $ (0.413) | | $ (0.223) | | $ (0.511) | | $ (0.442) |
| Total distributions | | $ (0.480) | | $ (0.409) | | $ (0.409) | | $ (0.484) | | $ (0.413) | | $ (0.223) | | $ (0.511) | | $ (0.442) |
| Net asset value - End of year | | $ 10.580 | | $10.850 | | $10.850 | | $ 10.820 | | $11.090 | | $11.080 | | $ 10.640 | | $10.910 |
| Total return (2) | | 2.23% | | 1.53% | | 1.62% | | 6.40% | | 5.55% | | 3.08%(13) | | 5.50% | | 4.98%(3) |
| |
| Ratios/Supplemental Data | | | | | | | | | | | | | | | | |
| Net assets, end of year (000’s omitted) | | $212,898 | | $25,845 | | $ 2,952 | | $222,008 | | $35,969 | | $ 643 | | $196,300 | | $42,074 |
| Ratios (As a percentage of average daily net | | | | | | | | | | | | | | | | |
| assets): | | | | | | | | | | | | | | | | |
| Expenses excluding interest and fees | | 0.79%(12) | | 1.54%(12) | | 1.54%(12) | | 0.79% | | 1.54% | | 1.54%(5) | | 0.82%(9) | | 1.57%(9) |
| Interest and fee expense(10) | | 0.55% | | 0.55% | | 0.55% | | 0.44% | | 0.44% | | 0.44%(5) | | 0.26%(9) | | 0.26%(9) |
| Total expenses before custodian fee | | | | | | | | | | | | | | | | |
| reduction | | 1.34%(12) | | 2.09%(12) | | 2.09%(12) | | 1.23% | | 1.98% | | 1.98%(5) | | 1.08%(9) | | 1.83%(9) |
| Expenses after custodian fee reduction | | | | | | | | | | | | | | | | |
| excluding interest and fees | | 0.78%(12) | | 1.53%(12) | | 1.53%(12) | | 0.78% | | 1.53% | | 1.53%(5) | | 0.81%(9) | | 1.56%(9) |
| Net investment income | | 4.51% | | 3.76% | | 3.78% | | 4.59% | | 3.85% | | 3.53%(5) | | 4.75% | | 4.01% |
| Portfolio Turnover of the Portfolio (8) | | — | | — | | — | | — | | — | | — | | — | | — |
| Portfolio Turnover of the Fund | | 19% | | 19% | | 19% | | 42% | | 42% | | 42%(11) | | 16% | | 16% |
(See footnotes on last page.)
30
Financial Highlights (continued)
| | | Florida Fund |
| |
|
| | | Year Ended September 30, |
| |
|
| | | 2004(1) | | 2003(1) |
| |
|
| | | Class A | | Class B | | Class A | | Class B |
|
| |
| Net asset value - Beginning of year | | $ 10.680 | | $10.950 | | $10.940 | | $ 11.220 |
| |
| Income (loss) from operations | | | | | | | | | | | | |
| Net investment income | | $ 0.536 | | $ 0.469 | | $ 0.548 | | $ 0.482 |
| Net realized and unrealized gain (loss) | | (0.098) | | (0.110) | | (0.259) | | (0.272) |
| Total income from operations | | $ 0.438 | | $ 0.359 | | $ 0.289 | | $ 0.210 |
| |
| Less distributions | | | | | | | | | | | | |
| From net investment income | | $ (0.538) | | $ (0.469) | | $ (0.549) | | $ (0.480) |
| Total distributions | | $ (0.538) | | $ (0.469) | | $ (0.549) | | $ (0.480) |
| Net asset value - End of year | | $ 10.580 | | $10.840 | | $10.680 | | $ 10.950 |
| Total return (2) | | 4.18% | | 3.34% | | 2.76% | | | | 1.93% |
| |
| Ratios/Supplemental Data | | | | | | | | | | | | |
| Net assets, end of year (000’s omitted) | | $193,379 | | $51,162 | | $25,996 | | $236,914 |
| Ratios (As a percentage of average daily net assets): | | | | | | | | | | | | |
| Expenses excluding interest and fees | | 0.82%(9) | | 1.57%(9) | | 0.79%(9) | | | | 1.54%(9) |
| Interest and fee expense(10) | | 0.13%(9) | | 0.13%(9) | | 0.20%(9) | | | | 0.20%(9) |
| Total expenses before custodian fee reduction | | 0.95%(9) | | 1.70%(9) | | 0.99%(9) | | | | 1.74%(9) |
| Expenses after custodian fee reduction excluding interest and fees | | 0.82%(9) | | 1.57%(9) | | 0.78%(9) | | | | 1.53%(9) |
| Net investment income | | 5.09% | | 4.26% | | 5.12% | | | | 4.39% |
| Portfolio Turnover of the Portfolio (8) | | 9% | | 9% | | 23% | | | | 23% |
| Portfolio Turnover of the Fund | | — | | — | | — | | | | — |
(See footnotes on last page.)
31
Financial Highlights (continued)
| | | Massachusetts Fund |
| |
|
| | | Year Ended September 30, |
| |
|
| | | 2007(1) | | 2006(1)(7) | | 2005(1) |
| |
|
| | | Class A | | Class B | | Class C | | Class A | | Class B | | Class C | | Class A | | Class B |
|
| |
| Net asset value - Beginning of year | | $ 9.850 | | $ 9.850 | | $ 9.850 | | $ 9.670 | | $ 9.670 | | $ 9.610 | | $ 9.660 | | $ 9.650 |
| |
| Income (loss) from | | | | | | | | | | | | | | | | |
| operations | | | | | | | | | | | | | | | | |
| Net investment income | | $ 0.415 | | $ 0.343 | | $ 0.342 | | $ 0.432 | | $ 0.362 | | $ 0.136 | | $ 0.449 | | $ 0.378 |
| Net realized and unrealized gain (loss) | | (0.356) | | (0.347) | | (0.346) | | 0.180 | | 0.179 | | 0.254 | | 0.017 | | 0.026 |
| Total income (loss) from operations | | $ 0.059 | | $ (0.004) | | $ (0.004) | | $ 0.612 | | $ 0.541 | | $ 0.390 | | $ 0.466 | | $ 0.404 |
| |
| Less distributions | | | | | | | | | | | | | | | | |
| From net investment income | | $ (0.419) | | $ (0.346) | | $ (0.346) | | $ (0.432) | | $ (0.361) | | $(0.150) | | $ (0.456) | | $ (0.384) |
| Total distributions | | $ (0.419) | | $ (0.346) | | $ (0.346) | | $ (0.432) | | $ (0.361) | | $(0.150) | | $ (0.456) | | $ (0.384) |
| Net asset value - End of year | | $ 9.490 | | $ 9.500 | | $ 9.500 | | $ 9.850 | | $ 9.850 | | $ 9.850 | | $ 9.670 | | $ 9.670 |
| Total return (2) | | 0.57% | | (0.07)% | | (0.07)% | | 6.51% | | 5.73% | | 4.10%(13) | | 4.90% | | 4.39%(3) |
| |
| Ratios/Supplemental Data | | | | | | | | | | | | | | | | |
| Net assets, end of year (000’s omitted) | | $254,366 | | $40,938 | | $17,583 | | $197,580 | | $48,991 | | $ 2,825 | | $156,382 | | $54,708 |
| Ratios (As a percentage of average | | | | | | | | | | | | | | | | |
| daily net assets): | | | | | | | | | | | | | | | | |
| Expenses excluding interest and fees | | 0.77%(12) | | 1.52%(12) | | 1.51%(12) | | 0.79% | | 1.54% | | 1.54%(5) | | 0.79%(12) | | 1.54%(12) |
| Interest and fee expense(10) | | 0.47% | | 0.47% | | 0.47% | | 0.42% | | 0.42% | | 0.42%(5) | | 0.28%(12) | | 0.28%(12) |
| Total expenses before custodian fee | | | | | | | | | | | | | | | | |
| reduction | | 1.24%(12) | | 1.99%(12) | | 1.98%(12) | | 1.21% | | 1.96% | | 1.96%(5) | | 1.07%(12) | | 1.82%(12) |
| Expenses after custodian fee | | | | | | | | | | | | | | | | |
| reduction excluding interest and fees | | 0.76%(12) | | 1.51%(12) | | 1.50%(12) | | 0.77% | | 1.52% | | 1.52%(5) | | 0.78%(12) | | 1.53%(12) |
| Net investment income | | 4.26% | | 3.52% | | 3.53% | | 4.48% | | 3.75% | | 3.40%(5) | | 4.62% | | 3.88% |
| Portfolio Turnover of the Portfolio (8) | | — | | — | | — | | — | | — | | — | | — | | — |
| Portfolio Turnover of the Fund | | 65% | | 65% | | 65% | | 28% | | 28% | | 28%(11) | | 15% | | 15% |
(See footnotes on last page.)
32
Financial Highlights (continued)
| | | Massachusetts Fund |
| |
|
| | | Year Ended September 30, |
| |
|
| | | 2004(1) | | 2003(1) |
| |
|
| | | Class A | | Class B | | Class A | | Class B |
|
| |
| Net asset value - Beginning of year | | $ 9.680 | | $ 9.680 | | $ 9.850 | | $ 9.860 |
| |
| Income (loss) from operations | | | | | | | | | | |
| Net investment income | | $ 0.484 | | $ 0.414 | | $ 0.492 | | $ 0.421 |
| Net realized and unrealized gain (loss) | | (0.020) | | (0.031) | | (0.180) | | (0.188) |
| Total income (loss) from operations | | $ 0.464 | | $ 0.383 | | $ 0.312 | | $ 0.233 |
| |
| Less distributions | | | | | | | | | | |
| From net investment income | | $ (0.484) | | $ (0.413) | | $ (0.482) | | $ (0.413) |
| Total distributions | | $ (0.484) | | $ (0.413) | | $ (0.482) | | $ (0.413) |
| Net asset value - End of year | | $ 9.660 | | $ 9.650 | | $ 9.680 | | $ 9.680 |
| Total return (2) | | 4.92% | | 4.07% | | 3.29% | | 2.43% |
| |
| Ratios/Supplemental Data | | | | | | | | | | |
| Net assets, end of year (000’s omitted) | | $143,086 | | $59,036 | | $41,413 | | $160,416 |
| Ratios (As a percentage of average daily net assets): | | | | | | | | | | |
| Expenses excluding interest and fees | | 0.81%(9) | | 1.56%(9) | | 0.81%(9) | | 1.56%(9) |
| Interest and fee expense(10) | | 0.11%(9) | | 0.11%(9) | | 0.10%(9) | | 0.10%(9) |
| Total expenses before custodian fee reduction | | 0.92%(9) | | 1.67%(9) | | 0.91%(9) | | 1.66%(9) |
| Expenses after custodian fee reduction excluding interest and fees | | 0.81%(9) | | 1.56%(9) | | 0.80%(9) | | 1.55%(9) |
| Net investment income | | 5.05% | | 4.26% | | 5.09% | | 4.35% |
| Portfolio Turnover of the Portfolio (8) | | 27% | | 27% | | 16% | | 16% |
| Portfolio Turnover of the Fund | | — | | — | | — | | — |
(See footnotes on last page.)
33
Financial Highlights (continued)
| | | Mississippi Fund |
| |
|
| | | Year Ended September 30, |
| |
|
| | | 2007(1) | | 2006(1) | | 2005(1) | | 2004(1) | | 2003(1) |
| |
|
| | | Class A | | Class B | | Class A | | Class B | | Class A | | Class B | | Class A | | Class B | | Class A | | Class B |
|
| |
| Net asset value - Beginning of year | | $ 9.690 | | $ 9.910 | | $ 9.610 | | $ 9.830 | | $ 9.720 | | $ 9.940 | | $ 9.840 | | $10.060 | | $10.000 | | $10.220 |
| |
| Income (loss) from operations | | | | | | | | | | | | | | | | | | | | | | |
| Net investment income | | $ 0.410 | | $ 0.345 | | $ 0.417 | | $ 0.354 | | $ 0.428 | | $ 0.365 | | $ 0.455 | | $ 0.393 | | $ 0.473 | | $ 0.409 |
| Net realized and unrealized gain (loss) | | (0.155) | | (0.155) | | 0.075 | | 0.073 | | (0.099) | | (0.100) | | (0.116) | | (0.119) | | (0.163) | | (0.163) |
| Total income from operations | | $ 0.255 | | $ 0.190 | | $ 0.492 | | $ 0.427 | | $ 0.329 | | $ 0.265 | | $ 0.339 | | $ 0.274 | | $ 0.310 | | $ 0.246 |
| |
| Less distributions | | | | | | | | | | | | | | | | | | | | | | |
| From net investment income | | $ (0.405) | | $(0.340) | | $ (0.412) | | $(0.347) | | $ (0.439) | | $(0.375) | | $ (0.459) | | $ (0.394) | | $ (0.470) | | $ (0.406) |
| Total distributions | | $ (0.405) | | $(0.340) | | $ (0.412) | | $(0.347) | | $ (0.439) | | $(0.375) | | $ (0.459) | | $ (0.394) | | $ (0.470) | | $ (0.406) |
| Net asset value - End of year | | $ 9.540 | | $ 9.760 | | $ 9.690 | | $ 9.910 | | $ 9.610 | | $ 9.830 | | $ 9.720 | | $ 9.940 | | $ 9.840 | | $10.060 |
| Total return (2) | | 2.67% | | 1.94% | | 5.26% | | 4.44% | | 3.44% | | 2.86%(3) | | 3.54% | | 2.79% | | 3.21% | | 2.47% |
| |
| Ratios/Supplemental Data | | | | | | | | | | | | | | | | | | | | | | |
| Net assets, end of year (000’s omitted) | | $14,635 | | $ 2,626 | | $15,154 | | $ 4,077 | | $12,901 | | $ 5,291 | | $11,379 | | $ 6,013 | | $ 2,727 | | $15,018 |
| Ratios (As a percentage of average daily net assets): | | | | | | | | | | | | | | | | | | | | | | |
| Expenses excluding interest and fees | | 0.81%(12) | | 1.56%(12) | | 0.81% | | 1.56% | | 0.86%(9) | | 1.61%(9) | | 0.84%(9) | | 1.59%(9) | | 0.81%(9) | | 1.56%(9) |
| Interest and fee expense(10) | | 0.26% | | 0.26% | | 0.19% | | 0.19% | | 0.12%(9) | | 0.12%(9) | | 0.06%(9) | | 0.06%(9) | | 0.03%(9) | | 0.03%(9) |
| Total expenses before custodian fee reduction | | 1.07%(12) | | 1.82%(12) | | 1.00% | | 1.75% | | 0.98%(9) | | 1.73%(9) | | 0.90%(9) | | 1.65%(9) | | 0.84%(9) | | 1.59%(9) |
| Expenses after custodian fee reduction excluding interest and fees | | 0.79%(12) | | 1.54%(12) | | 0.78% | | 1.53% | | 0.84%(9) | | 1.59%(9) | | 0.83%(9) | | 1.58%(9) | | 0.79%(9) | | 1.54%(9) |
| Net investment income | | 4.26% | | 3.50% | | 4.34% | | 3.61% | | 4.41% | | 3.68% | | 4.70% | | 3.93% | | 4.81% | | 4.07% |
| Portfolio Turnover of the Portfolio (8) | | — | | — | | — | | — | | — | | — | | 15% | | 15% | | 11% | | 11% |
| Portfolio Turnover of the Fund | | 16% | | 16% | | 22% | | 22% | | 21% | | 21% | | — | | — | | — | | — |
(See footnotes on last page.)
34
Financial Highlights (continued)
| | | New York Fund |
| |
|
| | | Year Ended September 30, |
| |
|
| | | 2007(1) | | 2006(1) | | 2005(1) |
| |
|
| | | Class A | | Class B | | Class C | | Class A | | Class B | | Class C | | Class A | | Class B | | Class C |
|
| |
| Net asset value - Beginning of year | | $ 10.750 | | $10.760 | | $10.750 | | $ 10.700 | | $10.700 | | $10.700 | | $ 10.800 | | $10.800 | | $10.800 |
| |
| Income (loss) from operations | | | | | | | | | | | | | | | | | | |
| Net investment income | | $ 0.466 | | $ 0.386 | | $ 0.383 | | $ 0.476 | | $ 0.396 | | $ 0.391 | | $ 0.502 | | $ 0.415 | | $ 0.408 |
| Net realized and unrealized gain (loss) | | (0.305) | | (0.295) | | (0.302) | | 0.170 | | 0.181 | | 0.176 | | (0.090) | | (0.083) | | (0.077) |
| Total income from operations | | $ 0.161 | | $ 0.091 | | $ 0.081 | | $ 0.646 | | $ 0.577 | | $ 0.567 | | $ 0.412 | | $ 0.332 | | $ 0.331 |
| |
| Less distributions | | | | | | | | | | | | | | | | | | |
| From net investment income | | $ (0.458) | | $ (0.378) | | $ (0.378) | | $ (0.473) | | $ (0.394) | | $ (0.394) | | $ (0.512) | | $ (0.432) | | $ (0.431) |
| From net realized gain | | (0.053) | | (0.053) | | $ (0.053) | | (0.123) | | (0.123) | | (0.123) | | — | | — | | — |
| Total distributions | | $ (0.511) | | $ (0.431) | | $ (0.431) | | $ (0.596) | | $ (0.517) | | $ (0.517) | | $ (0.512) | | $ (0.432) | | $ (0.431) |
| Contingent deferred sales charges | | $ — | | $ — | | $ — | | $ — | | $ — | | $ — | | $ — | | $ — | | $ — |
| Net asset value - End of year | | $ 10.400 | | $10.420 | | $10.400 | | $ 10.750 | | $10.760 | | $10.750 | | $ 10.700 | | $10.700 | | $10.700 |
| Total return (2) | | 1.50% | | 0.83% | | 0.73% | | 6.29% | | 5.59% | | 5.50% | | 3.88% | | 3.27%(3) | | 3.20%(3) |
| |
| Ratios/Supplemental Data | | | | | | | | | | | | | | | | | | |
| Net assets, end of year (000’s omitted) | | $400,671 | | $11,439 | | $31,131 | | $393,479 | | $ 9,488 | | $13,889 | | $357,652 | | $ 6,189 | | $ 4,702 |
| Ratios (As a percentage of average daily | | | | | | | | | | | | | | | | | | |
| net assets): | | | | | | | | | | | | | | | | | | |
| Expenses excluding interest and fees | | 0.77%(12) | | 1.51%(12) | | 1.51%(12) | | 0.79% | | 1.54% | | 1.54% | | 0.80%(9) | | 1.55%(9) | | 1.54%(9) |
| Interest and fee expense(10) | | 0.48% | | 0.48% | | 0.48% | | 0.48% | | 0.48% | | 0.48% | | 0.35%(9) | | 0.35%(9) | | 0.35%(9) |
| Total expenses before custodian fee reduction | | 1.25%(12) | | 1.99%(12) | | 1.99%(12) | | 1.27% | | 2.02% | | 2.02% | | 1.15%(9) | | 1.90%(9) | | 1.89%(9) |
| Expenses after custodian fee reduction excluding | | | | | | | | | | | | | | | | | | |
| interest and fees | | 0.75%(12) | | 1.50%(12) | | 1.50%(12) | | 0.78% | | 1.53% | | 1.53% | | 0.79%(9) | | 1.54%(9) | | 1.53%(9) |
| Net investment income | | 4.39% | | 3.63% | | 3.62% | | 4.50% | | 3.74% | | 3.70% | | 4.65% | | 3.84% | | 3.78% |
| Portfolio Turnover of the Portfolio (8) | | — | | — | | — | | — | | — | | — | | — | | — | | — |
| Portfolio Turnover of the Fund | | 35% | | 35% | | 35% | | 34% | | 34% | | 34% | | 45% | | 45% | | 45% |
(See footnotes on last page.)
35
Financial Highlights (continued)
| | | New York Fund |
| |
|
| | | Year Ended September 30, |
| |
|
| | | 2004(1) | | 2003(1)(4) |
| |
|
| | | Class A | | Class B | | Class C | | Class A | | Class B | | Class C |
|
| |
| Net asset value - Beginning of year | | $ 10.920 | | $10.910 | | $11.070 | | $11.070 | | $ 11.050 | | $11.020 |
| |
| Income (loss) from operations | | | | | | | | | | | | |
| Net investment income | | $ 0.542 | | $ 0.533 | | $ 0.448 | | $ 0.539 | | $ 0.494 | | $ 0.002 |
| Net realized and unrealized gain (loss) | | (0.049) | | (0.084) | | (0.222) | | (0.165) | | (0.169) | | 0.049 |
| Total income (loss) from operations | | $ 0.493 | | 0.449 | | $ 0.226 | | $ 0.374 | | $ 0.325 | | $ 0.051 |
| |
| Less distributions | | | | | | | | | | | | |
| From net investment income | | $ (0.587) | | $ (0.540) | | $ (0.467) | | $ (0.518) | | $ (0.463) | | $ (0.001) |
| From net realized gain | | (0.026) | | (0.024) | | (0.029) | | (0.006) | | (0.006) | | — |
| Total distributions | | $ (0.613) | | $ (0.564) | | $ (0.496) | | $ (0.524) | | $ (0.469) | | $ (0.001) |
| Contingent deferred sales charges | | $ — | | $ 0.005 | | $ — | | $ — | | $ 0.004 | | — |
| Net asset value - End of year | | $ 10.800 | | $10.800 | | $10.800 | | $10.920 | | $ 10.910 | | $11.070 |
| Total return (2) | | 4.66% | | 4.28% | | 1.99% | | 3.54% | | 3.08% | | 0.50% |
| |
| Ratios/Supplemental Data | | | | | | | | | | | | |
| Net assets, end of year (000’s omitted) | | $335,153 | | $ 2,984 | | $ 940 | | $42,481 | | $307,299 | | $ 11 |
| Ratios (as a percentage of average daily | | | | | | | | | | | | |
| net assets): | | | | | | | | | | | | |
| Expenses excluding interest and fees | | 0.82%(9) | | 0.93%(9) | | 1.56%(9) | | 0.80%(9) | | 1.23%(9) | | 1.89%(5)(9) |
| Interest and fee expense(10) | | 0.19%(9) | | 0.19%(9) | | 0.19%(9) | | 0.09%(9) | | 0.09%(9) | | 0.09%(5)(9) |
| Total expenses | | 1.01%(9) | | 1.12%(9) | | 1.75%(9) | | 0.89%(9) | | 1.32%(9) | | 1.98%(5)(9) |
| Expenses after custodian fee reduction excluding interest and fees | | 0.82%(9) | | 0.93%(9) | | 1.56%(9) | | 0.80%(9) | | 1.23%(9) | | 1.89%(5)(9) |
| Net investment income | | 5.07% | | 4.86% | | 4.17% | | 4.99% | | 4.58% | | 6.41%(5) |
| Portfolio Turnover of the Portfolio (8) | | 26% | | 26% | | 26% | | 19% | | 19% | | 19% |
| Portfolio Turnover of the Fund | | — | | — | | — | | — | | — | | — |
(See footnotes on last page.)
36
Financial Highlights (continued)
| | | Ohio Fund |
| |
|
| | | Year Ended September 30, |
| |
|
| | | 2007(1) | | 2006(1)(7) | | 2005(1) | | 2004(1) | | 2003(1) |
| |
|
| | | Class A | | Class B | | Class C | | Class A | | Class B | | Class C | | Class A | | Class B | | Class A | | Class B | | Class A | | Class B |
|
| |
| Net asset value - Beginning of year | | $ 9.450 | | $ 9.440 | | $ 9.440 | | $ 9.320 | | $ 9.320 | | $ 9.300 | | $ 9.180 | | $ 9.180 | | $ 9.230 | | $ 9.240 | | $ 9.290 | | $ 9.290 |
| |
| Income (loss) from | | | | | | | | | | | | | | | | | | | | | | | | |
| operations | | | | | | | | | | | | | | | | | | | | | | | | |
| Net investment income | | $ 0.382 | | $ 0.315 | | $ 0.310 | | $ 0.420 | | $ 0.353 | | $ 0.211 | | $ 0.464 | | $ 0.394 | | $ 0.491 | | $ 0.423 | | $ 0.499 | | $ 0.433 |
| Net realized and unrealized gain (loss) | | (0.197) | | (0.191) | | (0.186) | | 0.137 | | 0.124 | | 0.160 | | 0.142 | | 0.143 | | (0.034) | | (0.046) | | (0.077) | | (0.068) |
| Total income from operations | | $ 0.185 | | $ 0.124 | | $ 0.124 | | $ 0.557 | | $ 0.477 | | $ 0.371 | | $ 0.606 | | $ 0.537 | | $ 0.457 | | $ 0.377 | | $ 0.422 | | $ 0.365 |
| |
| Less distributions | | | | | | | | | | | | | | | | | | | | | | | | |
| From net investment income | | $ (0.395) | | $ (0.324) | | $ (0.324) | | $ (0.427) $ (0.357) $(0.231) | | $ (0.466) | | $ (0.397) | | $ (0.507) | | $ (0.437) | | $ (0.482) | | $ (0.415) |
| From net realized gain | | — | | — | | — | | — | | — | | — | | — | | — | | — | | — | | — | | — |
| Total distributions | | $ (0.395) | | $ (0.324) | | $ (0.324) | | $ (0.427) | | $ (0.357) | | $(0.231) | | $ (0.466) | | $ (0.397) | | $ (0.507) | | $ (0.437) | | $ (0.482) | | $ (0.415) |
| Net asset value - End of year | | $ 9.240 | | $ 9.240 | | $ 9.240 | | $ 9.450 | | $ 9.440 | | $ 9.440 | | $ 9.320 | | $ 9.320 | | $ 9.180 | | $ 9.180 | | $ 9.230 | | $ 9.240 |
| Total return (2) | | 1.98% | | 1.32% | | 1.32% | | 6.15% | | 5.25% | | 4.06%(13) | | 6.71% | | 6.14%(3) | | 5.07% | | 4.14% | | 4.73% | | 4.01% |
| |
| Ratios/Supplemental Data | | | | | | | | | | | | | | | | | | | | | | | | |
| Net assets, end of year (000’s omitted) | | $274,850 | | $28,626 | | $30,804 | | $182,719 | | $32,512 | | $ 8,294 | | $140,355 | | $34,257 | | $126,212 | | $36,545 | | $15,612 | | $157,077 |
| Ratios (As a percentage of average daily | | | | | | | | | | | | | | | | | | | | | | | | |
| net assets): | | | | | | | | | | | | | | | | | | | | | | | | |
| Expenses excluding interest and fees | | 0.77%(12) | | 1.52%(12) | | 1.52%(12) | | 0.78% | | 1.53% | | 1.53%(5) | | 0.82%(9) | | 1.57%(9) | | 0.85%(9) | | 1.60%(9) | | 0.81%(9) | | 1.56%(9) |
| Interest and fee expense(10) | | 0.31% | | 0.31% | | 0.31% | | 0.47% | | 0.47% | | 0.47%(5) | | 0.35%(9) | | 0.35%(9) | | 0.25%(9) | | 0.25%(9) | | 0.25%(9) | | 0.25%(9) |
| Total expenses before custodian fee | | | | | | | | | | | | | | | | | | | | | | | | |
| reduction | | 1.08%(12) | | 1.83%(12) | | 1.83%(12) | | 1.25% | | 2.00% | | 2.00%(5) | | 1.17%(9) | | 1.92%(9) | | 1.10%(9) | | 1.85%(9) | | 1.06%(9) | | 1.81%(9) |
| Expenses after custodian fee | | | | | | | | | | | | | | | | | | | | | | | | |
| reduction excluding interest and fees | | 0.74%(12) | | 1.49%(12) | | 1.49%(12) | | 0.75% | | 1.50% | | 1.50%(5) | | 0.81%(9) | | 1.56%(9) | | 0.85%(9) | | 1.60%(9) | | 0.80%(9) | | 1.55%(9) |
| Net investment income | | 4.09% | | 3.36% | | 3.33% | | 4.53% | | 3.80% | | 3.45%(5) | | 4.97% | | 4.23% | | 5.38% | | 4.56% | | 5.46% | | 4.73% |
| Portfolio Turnover of the Portfolio (8) | | — | | — | | — | | — | | — | | — | | — | | — | | 9% | | 9% | | 15% | | 15% |
| Portfolio Turnover of the Fund | | 39% | | 39% | | 39% | | 24% | | 24% | | 24%(11) | | 28% | | 28% | | — | | — | | — | | — |
(See footnotes on last page.)
37
Financial Highlights (continued)
| | | Rhode Island Fund |
| |
|
| | | Year Ended September 30, |
| |
|
| | | 2007(1) | | 2006(1)(7) | | 2005(1) | | 2004(1) | | 2003(1) |
| |
|
| | | Class A | | Class B | | Class C | | Class A | | Class B | | Class C | | Class A | | Class B | | Class A | | Class B | | Class A | | Class B |
|
| |
| Net asset value - Beginning of | | | | | | | | | | | | | | | | | | | | | | | | |
| year | | $ 9.860 | | $10.080 | | $10.090 | | $ 9.760 | | $ 9.980 | | $10.040 | | $ 9.780 | | $10.000 | | $ 9.760 | | $ 9.990 | | $10.010 | | $10.250 |
| |
| Income (loss) from | | | | | | | | | | | | | | | | | | | | | | | | |
| operations | | | | | | | | | | | | | | | | | | | | | | | | |
| Net investment income | | $ 0.411 | | $ 0.345 | | $ 0.344 | | $ 0.423 | | $ 0.361 | | $ 0.173 | | $ 0.441 | | $ 0.377 | | $ 0.462 | | $ 0.401 | | $ 0.472 | | $ 0.409 |
| Net realized and unrealized gain | | | | | | | | | | | | | | | | | | | | | | | | |
| (loss) | | (0.225) | | (0.224) | | (0.223) | | 0.106 | | 0.103 | | 0.065 | | (0.014) | | (0.015) | | 0.028 | | 0.016 | | (0.253) | | (0.262) |
| Total income from operations | | $ 0.186 | | $ 0.121 | | $ 0.121 | | $ 0.529 | | $ 0.464 | | $ 0.238 | | $ 0.427 | | $ 0.362 | | $ 0.490 | | $ 0.417 | | $ 0.219 | | $ 0.147 |
| |
| Less distributions | | | | | | | | | | | | | | | | | | | | | | | | |
| From net investment income | | $ (0.406) | | $ (0.341) | | $ (0.341) | | $ (0.429) | | $ (0.364) | | $ (0.188) | | $ (0.447) | | $ (0.382) | | $ (0.470) | | $ (0.407) | | $ (0.469) | | $ (0.407) |
| Total distributions | | $ (0.406) | | $ (0.341) | | $ (0.341) | | $ (0.429) | | $ (0.364) | | $ (0.188) | | $ (0.447) | | $ (0.382) | | $ (0.470) | | $ (0.407) | | $ (0.469) | | $ (0.407) |
| Net asset value - End of year | | $ 9.640 | | $ 9.860 | | $ 9.870 | | $ 9.860 | | $10.080 | | $10.090 | | $ 9.760 | | $ 9.980 | | $ 9.780 | | $10.000 | | $ 9.760 | | $ 9.990 |
| Total return (2) | | 1.91% | | 1.20% | | 1.20% | | 5.56% | | 4.76% | | 2.40%(13) | | 4.44% | | 3.83%(3) | | 5.13% | | 4.25% | | 2.29% | | 1.48% |
| |
| Ratios/Supplemental Data | | | | | | | | | | | | | | | | | | | | | | | | |
| Net assets, end of year (000's omitted) | | $46,764 | | $13,989 | | $ 3,281 | | $39,291 | | $18,564 | | $ 428 | | $29,745 | | $22,793 | | $26,558 | | $25,084 | | $11,701 | | $42,930 |
| Ratios (As a percentage of average | | | | | | | | | | | | | | | | | | | | | | | | |
| daily net assets): | | | | | | | | | | | | | | | | | | | | | | | | |
| Expenses excluding interest and fees | | 0.74%(12) | | 1.49%(12) | | 1.48%(12) | | 0.75% | | 1.50% | | 1.50%(5) | | 0.77%(9) | | 1.52%(9) | | 0.77%(9) | | 1.52%(9) | | 0.74%(9) | | 1.49%(9) |
| Interest and fee expense(10) | | 0.40% | | 0.40% | | 0.40% | | 0.35% | | 0.35% | | 0.35%(5) | | 0.18%(9) | | 0.18%(9) | | 0.10%(9) | | 0.10%(9) | | 0.09%(9) | | 0.09%(9) |
| Total expenses before custodian | | | | | | | | | | | | | | | | | | | | | | | | |
| fee reduction | | 1.14%(12) | | 1.89%(12) | | 1.88%(12) | | 1.10% | | 1.85% | | 1.85%(5) | | 0.95%(9) | | 1.70%(9) | | 0.87%(9) | | 1.62%(9) | | 0.83%(9) | | 1.58%(9) |
| Expenses after custodian fee | | | | | | | | | | | | | | | | | | | | | | | | |
| reduction excluding interest and fees | | 0.69%(12) | | 1.44%(12) | | 1.44%(12) | | 0.72% | | 1.47% | | 1.47%(5) | | 0.75%(9) | | 1.50%(9) | | 0.77%(9) | | 1.52%(9) | | 0.73%(9) | | 1.48%(9) |
| Net investment income | | 4.20% | | 3.45% | | 3.45% | | 4.34% | | 3.62% | | 3.23% | | 4.49% | | 3.76% | | 4.74% | | 4.00% | | 4.82% | | 4.08% |
| Portfolio Turnover of the Portfolio (8) | | — | | — | | — | | — | | — | | — | | — | | — | | 16% | | 16% | | 19% | | 19% |
| Portfolio Turnover of the Fund | | 14% | | 14% | | 14% | | 19% | | 19% | | 19%(11) | | 15% | | 15% | | — | | — | | — | | — |
(See footnotes on last page.)
38
Financial Highlights (continued)
| | | West Virginia Fund |
| |
|
| | | Year Ended September 30, |
| |
|
| | | 2007(1) | | 2006(1) | | 2005(1) | | 2004(1) | | 2003(1) |
| |
|
| | | Class A | | Class B | | Class A | | Class B | | Class A | | Class B | | Class A | | Class B | | Class A | | Class B |
|
| |
| Net asset value - Beginning of year | | $ 9.870 | | $10.060 | | $ 9.750 | | $ 9.930 | | $ 9.810 | | $10.000 | | $ 9.880 | | $10.080 | | $10.130 | | $10.340 |
| |
| Income (loss) from operations | | | | | | | | | | | | | | | | | | | | |
| Net investment income | | $ 0.402 | | $ 0.335 | | $ 0.415 | | $ 0.350 | | $ 0.434 | | $ 0.378 | | $ 0.462 | | $ 0.395 | | $ 0.468 | | $ 0.402 |
| Net realized and unrealized gain (loss) | | (0.181) | | (0.191) | | 0.110 | | 0.118 | | (0.053) | | (0.073) | | (0.081) | | (0.087) | | (0.253) | | (0.261) |
| Total income from operations | | $ 0.221 | | $ 0.144 | | $ 0.525 | | $ 0.468 | | $ 0.381 | | $ 0.305 | | $ 0.381 | | $ 0.308 | | $ 0.215 | | $ 0.141 |
| |
| Less distributions | | | | | | | | | | | | | | | | | | | | |
| From net investment income | | $ (0.401) | | $ (0.334) | | $ (0.405) | | $ (0.338) | | $ (0.441) | | $ (0.375) | | $ (0.451) | | $ (0.388) | | $ (0.465) | | $ (0.401) |
| Total distributions | | $ (0.401) | | $ (0.334) | | $ (0.405) | | $ (0.338) | | $ (0.441) | | $ (0.375) | | $ (0.451) | | $ (0.388) | | $ (0.465) | | $ (0.401) |
| Net asset value - End of year | | $ 9.690 | | $ 9.870 | | $ 9.870 | | $10.060 | | $ 9.750 | | $ 9.930 | | $ 9.810 | | $10.000 | | $ 9.880 | | $10.080 |
| Total return (2) | | 2.26% | | 1.43% | | 5.53% | | 4.82% | | 3.95% | | 3.26%(3) | | 3.94% | | 3.09% | | 2.23% | | 1.41% |
| |
| Ratios/Supplemental Data | | | | | | | | | | | | | | | | | | | | |
| Net assets, end of year (000’s omitted) | | $25,703 | | $ 6,049 | | $22,812 | | $ 7,002 | | $21,249 | | $ 8,287 | | $18,670 | | $ 8,550 | | $ 3,522 | | $23,634 |
| Ratios (As a percentage of average daily net assets): | | | | | | | | | | | | | | | | | | | | |
| Expenses excluding interest and fees | | 0.75%(12) | | 1.49%(12) | | 0.75% | | 1.50% | | 0.79%(9) | | 1.54%(9) | | 0.79%(9) | | 1.55%(9) | | 0.73%(9) | | 1.48%(9) |
| Interest and fee expense(10) | | 0.25% | | 0.25% | | 0.18% | | 0.18% | | 0.06%(9) | | 0.06%(9) | | 0.03%(9) | | 0.03%(9) | | 0.04%(9) | | 0.04%(9) |
| Total expenses before custodian fee reduction | | 1.00%(12) | | 1.74%(12) | | 0.93% | | 1.68% | | 0.85%(9) | | 1.60%(9) | | 0.82%(9) | | 1.58%(9) | | 0.77%(9) | | 1.52%(9) |
| Expenses after custodian fee reduction excluding interest and fees | | 0.71%(12) | | 1.46%(12) | | 0.72% | | 1.47% | | 0.78%(9) | | 1.53%(9) | | 0.78%(9) | | 1.54%(9) | | 0.71%(9) | | 1.46%(9) |
| Net investment income | | 4.10% | | 3.35% | | 4.26% | | 3.53% | | 4.42% | | 3.78% | | 4.73% | | 3.91% | | 4.74% | | 3.99% |
| Portfolio Turnover of the Portfolio (8) | | — | | — | | — | | — | | — | | — | | 12% | | 12% | | 21% | | 21% |
| Portfolio Turnover of the Fund | | 31% | | 31% | | 20% | | 20% | | 21% | | 21% | | — | | — | | — | | — |
| (1) | Net investment income per share was computed using average shares outstanding. |
| |
| (2) | Returns are historical and are calculated by determining the percentage change in net asset value with all distributions reinvested. |
| |
| (3) | Total returns reflect an increase of 0.17% for the California Fund Class B and the Florida Fund Class B, 0.09% for the California Fund Class C and the New York Fund Class C, 0.16% for the Massachusetts Fund Class B, the Mississippi Fund Class B, the New York Fund Class B and the West Virginia Fund Class B, 0.18% for the Ohio Fund Class B and 0.15% for the Rhode Island Fund Class B due to a change in the timing of payment and reinvestment of distributions. |
| |
| (4) | Class C shares of the New York Fund commenced operations on September 30, 2003. |
| |
| (5) | Annualized. |
| |
| (6) | For the period from the California Fund’s Class C shares commencement of operations, August 31, 2004 to September 30, 2004. |
| |
| (7) | For the period from the Florida Fund’s, Massachusetts Fund’s, Ohio Fund’s and Rhode Island Fund’s Class C shares commencement of operations, March 13, 2006, May 2, 2006, February 3, 2006 and March 20, 2006, respectively, to September 30, 2006. |
| |
| (8) | Prior to October 1, 2004, each Fund invested its assets in a corresponding Portfolio. Portfolio turnover represents the rate of portfolio activity for the period while each Fund was making investments directly in its corresponding Portfolio. |
| |
| (9) | Includes the Fund’s share of its corresponding Portfolio’s allocated expenses while the Fund was making investments directly into the Portfolio. |
| |
| (10) | Interest and fee expense relates to the liability for floating rate notes issued in conjunction with inverse floater securities transactions (see Note 1I to the Fund’s audited financial statements). |
| |
| (11) | For the year ended September 30, 2006. |
| |
| (12) | The investment adviser was allocated (or reduced its investment adviser fee in the case of the Massachusetts Fund) a portion of the Fund’s operating expenses (equal to, less than 0.005% for the California, Florida, Massachusetts, Ohio and New York Funds, 0.02% for the Mississippi Fund and 0.01% for the Rhode Island and West Virginia Funds of average daily net assets for the year ended September 30, 2007). Absent this allocation (or reduction in the case of the Massachusetts Fund), total return would be lower. |
| |
| (13) | Not annualized. |
| |
39

More Information
About the Funds: More information is available in the statement of additional information. The statement of additional information is incorporated by reference into this prospectus. Additional information about each Fund’s investments is available in the annual and semiannual reports to shareholders. In the annual report, you will find a discussion of the market conditions and investment strategies that significantly affected each Fund’s performance during the past fiscal year. You may obtain free copies of the statement of additional information and the shareholder reports on Eaton Vance’s website at www.eatonvance.com or by contacting the principal underwriter:
Eaton Vance Distributors, Inc.
The Eaton Vance Building
255 State Street
Boston, MA 02109
1-800-225-6265
website: www.eatonvance.com |
You will find and may copy information about each Fund (including the statement of additional information and shareholder reports): at the Securities and Exchange Commission’s public reference room in Washington, DC (call 1-202-942-8090 for information on the operation of the public reference room); on the EDGAR Database on the SEC’s Internet site (http://www.sec.gov); or, upon payment of copying fees, by writing to the SEC’s public reference section, 100 F Street NE, Washington, DC 20549-0102, or by electronic mail at publicinfo@sec.gov.
About Shareholder Accounts: You can obtain more information from Eaton Vance Shareholder Services (1-800-262-1122). If you own shares and would like to add to, redeem or change your account, please write or call the transfer agent:
PFPC Inc.
P.O. Box 9653
Providence, RI 02940-9653
1-800-262-1122 |
| The Funds’ SEC File No. is 811-04409. | | | | TFC2/1P |
| | | | |
| | | | |
| | | | |
| 197-12/07 | | © 2007 Eaton Vance Management | | |
EATON VANCE FLORIDA PLUS INSURED MUNICIPALS FUND
EATON VANCE HAWAII MUNICIPALS FUND
EATON VANCE HIGH YIELD MUNICIPALS FUND
EATON VANCE KANSAS MUNICIPALS FUND
Supplement to Statements of Additional Information dated April 1, 2007
EATON VANCE HIGH YIELD MUNICIPALS FUND - CLASS I SHARES
Supplement to Statement of Additional Information dated May 8, 2007
EATON VANCE CALIFORNIA LIMITED MATURITY MUNICIPALS FUND
EATON VANCE FLORIDA PLUS LIMITED MATURITY MUNICIPALS FUND
EATON VANCE MASSACHUSETTS LIMITED MATURITY MUNICIPALS FUND
EATON VANCE NATIONAL LIMITED MATURITY MUNICIPALS FUND
EATON VANCE NEW JERSEY LIMITED MATURITY MUNICIPALS FUND
EATON VANCE NEW YORK LIMITED MATURITY MUNICIPALS FUND
EATON VANCE OHIO LIMITED MATURITY MUNICIPALS FUND
EATON VANCE PENNSYLVANIA LIMITED MATURITY MUNICIPALS FUND
Supplement to Statements of Additional Information dated August 1, 2007
EATON VANCE ARIZONA MUNICIPALS FUND
EATON VANCE COLORADO MUNICIPALS FUND
EATON VANCE CONNECTICUT MUNICIPALS FUND
EATON VANCE MICHIGAN MUNICIPALS FUND
EATON VANCE MINNESOTA MUNICIPALS FUND
EATON VANCE NEW JERSEY MUNICIPALS FUND
EATON VANCE PENNSYLVANIA MUNICIPALS FUND
Supplement to Statement of Additional Information dated October 5, 2007
EATON VANCE TAX-MANAGED EMERGING MARKETS FUND
Supplement to Statement of Additional Information dated November 1, 2007
EATON VANCE ALABAMA MUNICIPALS FUND
EATON VANCE ARKANSAS MUNICIPALS FUND
EATON VANCE CALIFORNIA MUNICIPALS FUND
EATON VANCE FLORIDA PLUS MUNICIPALS FUND
EATON VANCE GEORGIA MUNICIPALS FUND
EATON VANCE KENTUCKY MUNICIPALS FUND
EATON VANCE LOUISIANA MUNICIPALS FUND
EATON VANCE MARYLAND MUNICIPALS FUND
EATON VANCE MASSACHUSETTS MUNICIPALS FUND
EATON VANCE MISSISSIPPI MUNICIPALS FUND
EATON VANCE MISSOURI MUNICIPALS FUND
EATON VANCE NEW YORK MUNICIPALS FUND
EATON VANCE NORTH CAROLINA MUNICIPALS FUND
EATON VANCE OHIO MUNICIPALS FUND
EATON VANCE OREGON MUNICIPALS FUND
EATON VANCE RHODE ISLAND MUNICIPALS FUND
EATON VANCE SOUTH CAROLINA MUNICIPALS FUND
EATON VANCE TENNESSEE MUNICIPALS FUND
EATON VANCE VIRGINIA MUNICIPALS FUND
EATON VANCE WEST VIRGINIA MUNICIPALS FUND
Supplement to Statements of Additional Information dated December 1, 2007
EATON VANCE ASIAN SMALL COMPANIES FUND
EATON VANCE GLOBAL GROWTH FUND
EATON VANCE GREATER CHINA GROWTH FUND
EATON VANCE MULTI-CAP GROWTH FUND |
EATON VANCE WORLDWIDE HEALTH SCIENCES FUND
Supplement to Statements of Additional Information dated January 1, 2008
EATON VANCE-ATLANTA CAPITAL LARGE-CAP GROWTH FUND
EATON VANCE-ATLANTA CAPITAL SMID-CAP FUND
Supplement to Statement of Additional Information dated February 1, 2008
EATON VANCE NATIONAL MUNICIPALS FUND
Supplement to Statement of Additional Information dated February 1, 2008
EATON VANCE ENHANCED EQUITY OPTION INCOME FUND
EATON VANCE RISK-MANAGED EQUITY OPTION INCOME FUND
Supplement to Statement of Additional Information dated February 29, 2008
EATON VANCE CASH MANAGEMENT FUND
EATON VANCE DIVERSIFIED INCOME FUND
EATON VANCE DIVIDEND INCOME FUND
EATON VANCE EMERGING MARKETS LOCAL INCOME FUND
EATON VANCE EQUITY RESEARCH FUND
EATON VANCE FLOATING-RATE FUND
EATON VANCE FLOATING-RATE & HIGH INCOME FUND
EATON VANCE GLOBAL MACRO FUND
EATON VANCE GOVERNMENT OBLIGATIONS FUND
EATON VANCE HIGH INCOME OPPORTUNITIES FUND
EATON VANCE INCOME FUND OF BOSTON
EATON VANCE INTERNATIONAL EQUITY FUND
EATON VANCE INTERNATIONAL INCOME FUND
EATON VANCE LOW DURATION FUND
EATON VANCE MONEY MARKET FUND
EATON VANCE STRATEGIC INCOME FUND
EATON VANCE STRUCTURED EMERGING MARKETS FUND
EATON VANCE TAX-MANAGED DIVIDEND INCOME FUND
EATON VANCE TAX-MANAGED EQUITY ASSET ALLOCATION FUND
EATON VANCE TAX-MANAGED INTERNATIONAL EQUITY FUND
EATON VANCE TAX-MANAGED MID-CAP CORE FUND
EATON VANCE TAX-MANAGED MULTI-CAP GROWTH FUND
EATON VANCE TAX-MANAGED SMALL-CAP GROWTH FUND
EATON VANCE TAX-MANAGED SMALL-CAP VALUE FUND
EATON VANCE TAX-MANAGED VALUE FUND
Supplement to Statements of Additional Information dated March 1, 2008
EATON VANCE FLOATING-RATE ADVANTAGE FUND
Supplement to Statement of Additional Information dated March 14, 2008 |
1. The Special Committee is now known as the Contract Review Committee.
2. The following is added as the last two paragraphs under "Fund Mangement" under "Mangement and Organization":
Messrs. Esty (Chair), Freedman and Park are currently members of the Portfolio Management Committee of the Board of Trustees of the Trust and each Portfolio. The purposes of the Portfolio Management Committee are to: (i) assist the Board of Trustees in its oversight of the portfolio management process employed by the Funds and the Portfolios and their investment adviser and sub-adviser(s), if applicable, relative to the Funds’ and the Portfolios’ stated objective(s), strategies and restrictions; (ii) assist the Board of Trustees in its oversight of the trading policies and procedures and risk management techniques applicable to the Funds and the Portfolios; and (iii) assist the Board of Trustees in its monitoring of the performance results of all Funds and Portfolios, giving special attention to the performance of certain Funds and Portfolios that it or the Board of Trustees identifies from time to time.
Mr. Pearlman (Chair) and Mmes. Steiger and Stout are currently members of the Compliance Reports and Regulatory Matters Committee of the Board of Trustees of the Trust and each Portfolio. The purposes of the Compliance Reports and Regulatory Matters Committee are to: (i) assist the Board of Trustees in its oversight role with respect to compliance issues and certain other regulatory matters affecting the Funds and the Portfolios; (ii) serve as a liaison between the Board of Trustees and the Funds’ and the Portfolios’ Chief Compliance Officer (the “CCO”); and (iii) serve as a “qualified legal compliance committee” within the rules promulgated by the SEC.
3. The following applies to all Funds with the exception of Eaton Vance Cash Management Fund and Eaton Vance Money Market Fund:
Investments in a Fund by ReFlow in connection with the ReFlow liquidity program are not subject to the round trip limitation described in "Restrictions on Excessive Trading and Market Timing" under "Purchasing Shares" in the prospectus.
| | STATEMENT OF
ADDITIONAL INFORMATION
December 1, 2007 |
Eaton Vance California Municipals Fund
Eaton Vance Florida Municipals Fund
Eaton Vance Massachusetts Municipals Fund
Eaton Vance Mississippi Municipals Fund
Eaton Vance New York Municipals Fund
Eaton Vance Ohio Municipals Fund
Eaton Vance Rhode Island Municipals Fund
Eaton Vance West Virginia Municipals Fund
The Eaton Vance Building
255 State Street
Boston, Massachusetts 02109
1-800-262-1122 |
This Statement of Additional Information (“SAI”) provides general information about the Funds. Each Fund is a non-diversified, open-end management investment company. Each Fund is a series of Eaton Vance Municipals Trust (the “Trust”). Capitalized terms used in this SAI and not otherwise defined have the meanings given to them in the prospectus. This SAI contains additional information about:
| | | | | Page | | | | Page |
| Strategies and Risks | | 2 | | Purchasing and Redeeming Shares | | 20 |
| Investment Restrictions | | 9 | | Sales Charges | | 21 |
| Management and Organization | | 10 | | Performance | | 23 |
| Investment Advisory and Administrative Services | | 15 | | Taxes | | 25 |
| Other Service Providers | | 19 | | Portfolio Securities Transactions | | 28 |
| Calculation of Net Asset Value | | 19 | | Financial Statements | | 31 |
| |
| Appendix A: | | Class A Fees, Performance and Ownership | | 32 | | Appendix E: State Specific Information | | 44 |
| Appendix B: | | Class B Fees, Performance and Ownership | | 36 | | Appendix F: Ratings | | 74 |
| Appendix C: | | Class C Fees, Performance and Ownership | | 40 | | Appendix G: Eaton Vance Funds Proxy Voting Policy and Procedures | | 79 |
| Appendix D: | | Class I Fees, Performance and Ownership | | 43 | | Appendix H: Adviser Proxy Voting Policies | | 81 |
Although each Fund offers only its shares of beneficial interest, it is possible that a Fund (or Class) might become liable for a misstatement or omission in this SAI regarding another Fund (or Class) because the Funds use this combined SAI. The Trustees of the Trust have considered this factor in approving the use of a combined SAI.
This SAI is NOT a prospectus and is authorized for distribution to prospective investors only if preceded or accompanied by the Funds’ relevant prospectus dated December 1, 2007, as supplemented from time to time, which is incorporated herein by reference. This SAI should be read in conjunction with the prospectus, which may be obtained by calling 1-800-225-6265.
© 2007 Eaton Vance Management
The following defined terms may be used herein: “SEC” for the Securities and Exchange Commission; “CFTC” for the Commodities Futures Trading Commission; “Code” for the Internal Revenue Code of 1986, as amended; “1940 Act” for the Investment Company Act of 1940, as amended; and “FINRA” for the Financial Industry Regulatory Authority.
Primary strategies are defined in the prospectus. The following is a description of the various investment practices that may be engaged in, whether as a primary or secondary strategy, and a summary of certain attendant risks. The investment adviser(s) may not buy any of the following instruments or use any of the following techniques unless it believes that doing so will help achieve the investment objective(s).
Municipal Obligations. Municipal obligations are issued to obtain funds for various public and private purposes. Municipal obligations include bonds as well as tax-exempt commercial paper, project notes and municipal notes such as tax, revenue and bond anticipation notes of short maturity, generally less than three years. While most municipal bonds pay a fixed rate of interest semiannually in cash, there are exceptions. Some bonds pay no periodic cash interest, but rather make a single payment at maturity representing both principal and interest. Bonds may be issued or subsequently offered with interest coupons materially greater or less than those then prevailing, with price adjustments reflecting such deviation.
In general, there are three categories of municipal obligations, the interest on which is exempt from federal income tax and is not a tax preference item for purposes of the AMT: (i) certain “public purpose” obligations (whenever issued), which include obligations issued directly by state and local governments or their agencies to fulfill essential governmental functions; (ii) certain obligations issued before August 8, 1986 for the benefit of non-governmental persons or entities; and (iii) certain “private activity bonds” issued after August 7, 1986 which include “qualified Section 501(c)(3) bonds” or refundings of certain obligations included in the second category. In assessing the federal income tax treatment of interest on any municipal obligation, each Fund will rely on an opinion of the issuer’s counsel (when available) and will not undertake any independent verification of the basis for the opinion.
Interest on certain “private activity bonds” issued after August 7, 1986 is exempt from regular federal income tax, but such interest (including a distribution by a Fund derived from such interest) is treated as a tax preference item which could subject the recipient to or increase the recipient’s liability for the AMT. For corporate shareholders, a Fund’s distributions derived from interest on all municipal obligations (whenever issued) are included in “adjusted current earnings” for purposes of the AMT as applied to corporations (to the extent not already included in alternative minimum taxable income as income attributable to private activity bonds).
The two principal classifications of municipal bonds are “general obligation” and “revenue” bonds. Issuers of general obligation bonds include states, counties, cities, towns and regional districts. The proceeds of these obligations are used to fund a wide range of public projects, including the construction or improvement of schools, highways and roads, water and sewer systems and a variety of other public purposes. The basic security of general obligation bonds is the issuer’s pledge of its faith, credit, and taxing power for the payment of principal and interest. The taxes that can be levied for the payment of debt service may be limited or unlimited as to rate and amount.
Revenue bonds are generally secured by the net revenues derived from a particular facility or group of facilities or, in some cases, from the proceeds of a special excise or other specific revenue source. Revenue bonds have been issued to fund a wide variety of capital projects including: electric, gas, water, sewer and solid waste disposal systems; highways, bridges and tunnels; port, airport and parking facilities; transportation systems; housing facilities, colleges and universities and hospitals. Although the principal security behind these bonds varies widely, many provide additional security in the form of a debt service reserve fund whose monies may be used to make principal and interest payments on the issuer’s obligations. Housing finance authorities have a wide range of security including partially or fully insured, rent subsidized and/or collateralized mortgages, and/or the net revenues from housing or other public projects. In addition to a debt service reserve fund, some autho rities provide further security in the form of a state’s ability (without legal obligation) to make up deficiencies in the debt service reserve fund. Lease rental revenue bonds issued by a state or local authority for capital projects are normally secured by annual lease rental payments from the state or locality to the authority sufficient to cover debt service on the authority’s obligations. Such payments are usually subject to annual appropriations by the state or locality. Industrial development and pollution control bonds, although nominally issued by municipal authorities, are in most cases revenue bonds and are generally not secured by the taxing power of the municipality, but are usually secured by the revenues derived by the authority from payments of the industrial user or users. The Fund may on occasion acquire revenue bonds which carry warrants or similar rights covering equity securities. Such warrants or rights may be held indefinitely, but if exercised, each Fund anticipates that it would, under normal circumstances, dispose of any equity securities so acquired within a reasonable period of time.
2
The obligations of any person or entity to pay the principal of and interest on a municipal obligation are subject to the provisions of bankruptcy, insolvency and other laws affecting the rights and remedies of creditors, such as the Federal Bankruptcy Act, and laws, if any, which may be enacted by Congress or state legislatures extending the time for payment of principal or interest, or both, or imposing other constraints upon enforcement of such obligations. Certain bond structures may be subject to the risk that a taxing authority may issue an adverse ruling regarding tax-exempt status. There is also the possibility that as a result of adverse economic conditions (including unforeseen financial events, natural disasters and other conditions that may affect an issuer’s ability to pay its obligations), litigation or other conditions, the power or ability of any person or entity to pay when due principal of and interest on a municipal obligation may be materially affected or interest and p rincipal previously paid may be required to be refunded. There have been recent instances of defaults and bankruptcies involving municipal obligations which were not foreseen by the financial and investment communities. The Fund will take whatever action it considers appropriate in the event of anticipated financial difficulties, default or bankruptcy of either the issuer of any municipal obligation or of the underlying source of funds for debt service. Such action may include retaining the services of various persons or firms (including affiliates of the investment adviser) to evaluate or protect any real estate, facilities or other assets securing any such obligation or acquired by a Fund as a result of any such event, and a Fund may also manage (or engage other persons to manage) or otherwise deal with any real estate, facilities or other assets so acquired. The Fund anticipates that real estate consulting and management services may be required with respect to properties securing various municipal obliga tions in its portfolio or subsequently acquired by each Fund. The Fund will incur additional expenditures in taking protective action with respect to portfolio obligations in (or anticipated to be in) default and assets securing such obligations.
The yields on municipal obligations will be dependent on a variety of factors, including purposes of issue and source of funds for repayment, general money market conditions, general conditions of the municipal bond market, size of a particular offering, maturity of the obligation and rating of the issue. The ratings of Moody’s, S&P and Fitch represent their opinions as to the quality of the municipal obligations which they undertake to rate. It should be emphasized, however, that ratings are based on judgment and are not absolute standards of quality. Consequently, municipal obligations with the same maturity, coupon and rating may have different yields while obligations of the same maturity and coupon with different ratings may have the same yield. In addition, the market price of such obligations will normally fluctuate with changes in interest rates, and therefore the net asset value of a Fund will be affected by such changes.
State-Specific Concentration. For a discussion of the risks associated with investing in municipal obligations of a particular state’s issuers, see “Risks of Concentration” in Appendix E. The Fund may also invest a total of up to 35% of its net assets in the obligations of Puerto Rico, the U.S. Virgin Islands and Guam. Accordingly, a Fund may be adversely affected by local political and economic conditions and developments within Puerto Rico, the U.S. Virgin Islands and Guam affecting the issuers of such obligations. The Fund may also invest to a limited extent in obligations issued by the N. Marianna Territories and American Samoa. Information about some of these conditions and developments is included in Appendix E.
Sector Concentration. The Fund may invest 25% or more of its total assets in municipal obligations in certain sectors. There could be economic, business or political developments or court decisions that adversely affect all municipal obligations in the same sector. In particular, investments in revenue bonds might involve (without limitation) the following risks.
Hospital bond ratings are often based on feasibility studies which contain projections of expenses, revenues and occupancy levels. Among the influences affecting a hospital’s gross receipts and net income available to service its debt are demand for hospital services, the ability of the hospital to provide the services required, management capabilities, economic developments in the service area, efforts by insurers and government agencies to limit rates and expenses, confidence in the hospital, service area economic developments, competition, availability and expense of malpractice insurance, Medicaid and Medicare funding and possible federal legislation limiting the rates of increase of hospital charges.
Electric utilities face problems in financing large construction programs in an inflationary period, cost increases and delay occasioned by safety and environmental considerations (particularly with respect to nuclear facilities), difficulty in obtaining fuel at reasonable prices, and in achieving timely and adequate rate relief from regulatory commissions, effects of energy conservation and limitations on the capacity of the capital market to absorb utility debt.
Industrial development bonds (“IDBs”) are normally secured only by the revenues from the project and not by state or local government tax payments, they are subject to a wide variety of risks, many of which relate to the nature of the specific project. Generally, IDBs are sensitive to the risk of a slowdown in the economy.
Standard tobacco bonds are secured by a single source of revenue, installment payments made by tobacco companies stemming from the settlement of lawsuits brought against them by various states (the “Master Settlement Agreement”). Appropriation backed tobacco bonds are supported by the same Master Settlement Agreement payments as standard
3
tobacco bonds, but are also subject to a state’s pledge that the governor will request an appropriation of funds in its annual budget for debt service if Master Settlement Agreement revenues are insufficient. These payments are not generally fixed but rather are tied to the volume of the company’s U.S. sales of cigarettes. Tobacco bonds are subject to several risks, including the risk that cigarette consumption declines or that a tobacco company defaults on its obligation to make payments to the state. Escrowed tobacco bonds no longer rely on Master Settlement Agreement revenue as security, and are backed by a variety of government securities.
In addition, the airline industry continues to evolve. A number of major carriers have either emerged from bankruptcy or are currently in bankruptcy. Recent problems include, but are not limited to, increased competition, labor and union conflicts, greater security costs and fluctuating jet fuel prices. Court rulings have given some guidance to the viability of collateral structures. However, there is still uncertainty as to the strength of collateral pledged under various security systems.
Certain tax-exempt bonds issued by Native American tribes may be subject to the risk that a taxing authority would determine that the income from such bonds is not eligible for tax-exempt status. In the event of any final adverse ruling to this effect, holders of such bonds may be subject to penalties.
Insured Obligations. The Fund may purchase municipal obligations insured as to their scheduled payment of principal and interest or municipal obligations that are additionally secured by bank credit agreements or escrow accounts.
The credit quality of companies which provide such credit enhancements will affect the value of those securities. Although the insurance feature reduces certain financial risks, the premiums for insurance and the higher market price sometimes paid for insured obligations may reduce a Fund’s current yield. Insurance generally will be obtained from insurers with a claims-paying ability rated Aaa by Moody’s or AAA by S&P or Fitch. See Appendix F for a description of the claims-paying ability ratings of S&P and Moody’s. The insurance does not guarantee the market value of the insured obligation or the net asset value of a Fund’s shares. To the extent that securities held by a Fund are insured as to principal and interest payments by insurers whose claims-paying ability rating is downgraded by Moody’s, S&P or Fitch, the value of such securities may be affected.
Credit Quality. While municipal obligations rated investment grade or below and comparable unrated municipal obligations may have some quality and protective characteristics, these characteristics can be expected to be offset or outweighed by uncertainties or major risk exposures to adverse conditions. Lower rated and comparable unrated municipal obligations are subject to the risk of an issuer’s inability to meet principal and interest payments on the obligations (credit risk) and may also be subject to greater price volatility due to such factors as interest rate sensitivity, market perception of the creditworthiness of the issuer and general market liquidity (market risk). Lower rated or unrated municipal obligations are also more likely to react to real or perceived developments affecting market and credit risk than are more highly rated obligations, which react primarily to movements in the general level of interest rates.
Municipal obligations held by a Fund which are rated below investment grade but which, subsequent to the assignment of such rating, are backed by escrow accounts containing U.S. Government obligations may be determined by the investment adviser to be of investment grade quality for purposes of the Fund’s investment policies. A Fund may retain in its portfolio an obligation whose rating drops after its acquisition, including defaulted obligations, if such retention is considered desirable by the investment adviser; provided, however, that holdings of obligations rated below Baa or BBB will be less than 35% of net assets and holdings rated below B will be less than 10% of net assets. In the event the rating of an obligation held by a Fund is downgraded, causing the Fund to exceed this limitation, the investment adviser will (in an orderly fashion within a reasonable period of time) dispose of such obligations as it deems necessary in order to comply with each Fund’s credit quality limit ations. In the case of a defaulted obligation, a Fund may incur additional expense seeking recovery of its investment. See “Portfolio of Investments” in the “Financial Statements” incorporated by reference into this SAI with respect to any defaulted obligations held by a Fund.
When a Fund invests in lower rated or unrated municipal obligations, the achievement of the Fund’s goals is more dependent on the investment adviser’s ability than would be the case if the Fund were investing in municipal obligations in the higher rating categories. In evaluating the credit quality of a particular issue, whether rated or unrated, the investment adviser may take into consideration, among other things, the financial resources of the issuer (or, as appropriate, of the underlying source of funds for debt service), its sensitivity to economic conditions and trends, any operating history of and the community support for the facility financed by the issue, the ability of the issuer’s management and regulatory matters. The investment adviser may also purchase structured derivative products with greater or lesser credit risk than the underlying bonds. Such bonds may be rated investment grade, as well as below investment grade. For a description of municipal bond ratings, see Appendix F.
4
Municipal Leases. The Fund may invest in municipal leases and participations therein, which arrangements frequently involve special risks. Municipal leases are obligations in the form of a lease, installment purchase or conditional sales contract (which typically provide for the title to the leased asset to pass to the governmental issuer) which is issued by state or local governments to acquire equipment and facilities. Interest income from such obligations is generally exempt from local and state taxes in the state of issuance. “Participations” in such leases are undivided interests in a portion of the total obligation. Participations entitle their holders to receive a pro rata share of all payments under the lease. The obligation of the issuer to meet its obligations under such leases is often subject to the appropriation by the appropriate legislative body, on an annual or other basis, of funds for the payment of the obligations. Investments in municipal leases are thus sub ject to the risk that the legislative body will not make the necessary appropriation and the issuer will not otherwise be willing or able to meet its obligation.
Certain municipal lease obligations owned by a Fund may be deemed illiquid for the purpose of the Fund’s 15% limitation on investments in illiquid securities, unless determined by the investment adviser, pursuant to guidelines adopted by the Trustees, to be liquid securities for the purpose of such limitation. In determining the liquidity of municipal lease obligations, the investment adviser will consider the factors it believes are relevant to the marketability of the obligation, to the extent that information regarding such factor is available to the investment adviser and pertinent to the liquidity determination, which may include: (1) the willingness of dealers to bid for the obligation; (2) the number of dealers willing to purchase or sell the obligation and the number of other potential buyers; (3) the frequency of trades and quotes for the obligation; (4) the nature of the marketplace trades, including the time needed to dispose of the obligation, the method of soliciting offers, a nd the mechanics of transfer; (5) the willingness of the governmental issuer to continue to appropriate funds for the payment of the obligation; (6) how likely or remote an event of nonappropriation may be, which depends in varying degrees on a variety of factors, including those relating to the general creditworthiness of the governmental issuer, its dependence on its continuing access to the credit markets, and the importance to the issuer of the equipment, property or facility covered by the lease or contract; (7) the rating, if any, assigned to the obligation and/or the governmental issuer by any nationally recognized statistical rating organization; (8) whether the obligation is insured as to the timely payment of principal and interest; and (9) all factors and information unique to the obligation in determining its liquidity. If the municipal lease obligation is insured as to the timely payment of principal and interest, or if the obligation has an investment grade rating (rated BBB or Baa or higher), the investment adviser will consider the obligation to be liquid. In the event a Fund acquires an unrated municipal lease obligation, the investment adviser will be responsible for determining the credit quality of such obligation on an ongoing basis, including an assessment of the likelihood that the lease may or may not be cancelled.
Zero Coupon Bonds. Zero coupon bonds are debt obligations which do not require the periodic payment of interest and are issued at a significant discount from face value. The discount approximates the total amount of interest the bonds will accrue and compound over the period until maturity at a rate of interest reflecting the market rate of the security at the time of issuance. The Fund is required to accrue income from zero coupon bonds on a current basis, even though it does not receive that income currently in cash, and each Fund is required to distribute that income for each taxable year. Thus, a Fund may have to sell other investments to obtain cash needed to make income distributions.
When-Issued Securities. New issues of municipal obligations are sometimes offered on a “when-issued” basis, that is, delivery and payment for the securities normally take place within a specified number of days after the date of a Fund’s commitment and are subject to certain conditions such as the issuance of satisfactory legal opinions. The Fund may also purchase securities on a when-issued basis pursuant to refunding contracts in connection with the refinancing of an issuer’s outstanding indebtedness. Refunding contracts generally require the issuer to sell and a Fund to buy such securities on a settlement date that could be several months or several years in the future. The Fund may also purchase instruments that give the Fund the option to purchase a municipal obligation when and if issued.
The Fund will make commitments to purchase when-issued securities only with the intention of actually acquiring the securities, but may sell such securities before the settlement date if it is deemed advisable as a matter of investment strategy. The payment obligation and the interest rate that will be received on the securities are fixed at the time a Fund enters into the purchase commitment. When a Fund commits to purchase a security on a when-issued basis it records the transaction and reflects the value of the security in determining its net asset value. Securities purchased on a when-issued basis and the securities held by a Fund are subject to changes in value based upon the perception of the creditworthiness of the issuer and changes in the level of interest rates (i.e., appreciation when interest rates decline and depreciation when interest rates rise). Therefore, to the extent that a Fund remains substantially fully invested at the same time that it has purchased securities on a when-issued basis, there will be greater fluctuations in the Fund’s net asset value than if it solely set aside cash to pay for when-issued securities.
5
Credit Derivatives. The Fund may invest in credit default swaps, total return swaps or credit options. In a credit default swap, the buyer of credit protection (or seller of credit risk) agrees to pay the counterparty a fixed, periodic premium for a specified term. In return, the counterparty agrees to pay a contingent payment to the buyer in the event of an agreed upon credit occurrence with respect to a particular reference entity. In a total return swap, the buyer receives a periodic return equal to the total economic return of a specified security, securities or index, for a specified period of time. In return, the buyer pays the counterparty a variable stream of payments, typically based upon short term interest rates, possibly plus or minus an agreed upon spread. Credit options are options whereby the purchaser has the right, but not the obligation, to enter into a transaction involving either an asset with inherent credit risk or a credit derivative, at terms specified at the init iation of the option. Transactions in derivative instruments involve a risk of loss or depreciation due to: unanticipated adverse changes in securities prices, interest rates, indices, the other financial instruments’ prices or currency exchange rates; the inability to close out a position; default by the counterparty; imperfect correlation between a position and the desired hedge; tax constraints on closing out positions; and portfolio management constraints on securities subject to such transactions. Derivative instruments may sometimes increase or leverage exposure to a particular market risk, thereby increasing price volatility.
Redemption, Demand and Put Features and Put Options. Issuers of municipal obligations reserve the right to call (redeem) the bond. If an issuer redeems securities held by a Fund during a time of declining interest rates, the Fund may not be able to reinvest the proceeds in securities providing the same investment return as the securities redeemed. Also, some bonds may have “put” or “demand” features that allow early redemption by the bondholder. Longer term fixed-rate bonds may give the holder a right to request redemption at certain times (often annually after the lapse of an intermediate term). These bonds are more defensive than conventional long term bonds (protecting to some degree against a rise in interest rates) while providing greater opportunity than comparable intermediate term bonds, because a Fund may retain the bond if interest rates decline.
Liquidity and Protective Put Options. The Fund may enter into a separate agreement with the seller of the security or some other person granting the Fund the right to put the security to the seller thereof or the other person at an agreed upon price. The Fund intends to limit this type of transaction to institutions (such as banks or securities dealers) which the investment adviser believes present minimal credit risks and would engage in this type of transaction to facilitate portfolio liquidity or (if the seller so agrees) to hedge against rising interest rates. There is no assurance that this kind of put option will be available to a Fund or that selling institutions will be willing to permit a Fund to exercise a put to hedge against rising interest rates. A Fund does not expect to assign any value to any separate put option which may be acquired to facilitate portfolio liquidity, inasmuch as the value (if any) of the put will be reflected in the value assigned to the associated secur ity; any put acquired for hedging purposes would be valued in good faith under methods or procedures established by the Trustees after consideration of all relevant factors, including its expiration date, the price volatility of the associated security, the difference between the market price of the associated security and the exercise price of the put, the creditworthiness of the issuer of the put and the market prices of comparable put options. Interest income generated by certain bonds having put or demand features may be taxable.
OTC Options. The Fund may enter into an agreement with a potential buyer of a municipal obligation that gives the buyer the right, but not the obligation, to purchase a municipal obligation held by the Fund at a particular price in the future and is commonly referred to as an over-the-counter option or OTC option. Such agreements will be entered solely to help facilitate the selling of municipal obligations, for instance, if the buyer wishes to lock in a price for a particular municipal obligation subject to performing due diligence on the issue or issuer. The buyer may not pay a premium for such option. The Fund may enter into such arrangements on up to 5% of the value of such Fund’s assets. There is a risk that the value of a municipal obligation underlying an option may appreciate above the value that the buyer has agreed to pay for the municipal obligation and therefore the Fund would not be entitled to the appreciation above such price.
Variable Rate Obligations. The Fund may purchase variable rate obligations. Variable rate instruments provide for adjustments in the interest rate at specified intervals (weekly, monthly, semiannually, etc.). The revised rates are usually set at the issuer’s discretion in which case the investor normally enjoys the right to “put” the security back to the issuer or his agent. Rate revisions may alternatively be determined by formula or in some other contractual fashion. Variable rate obligations normally provide that the holder can demand payment of the obligation on short notice at par with accrued interest and which are frequently secured by letters of credit or other support arrangements provided by banks. To the extent that such letters of credit or other arrangements constitute an unconditional guarantee of the issuer’s obligations, a bank may be treated as the issuer of a security for the purposes of complying with the diversification requirements set forth in Se ction 5(b) of the 1940 Act and Rule 5b-2 thereunder. A Fund would anticipate using these bonds as cash equivalents pending longer term investment of its funds.
6
Inverse Floaters. The Fund may invest in residual interests in a trust that holds municipal securities (“inverse floaters”). The interest rate payable on an inverse floater bears an inverse relationship to the interest rate on another security issued by the trust. Because changes in the interest rate on the other security inversely affect the interest paid on the inverse floater, the value and income of an inverse floater is generally more volatile than that of a fixed rate bond. Inverse floaters have interest rate adjustment formulas which generally reduce or, in the extreme, eliminate the interest paid to a Fund when short-term interest rates rise, and increase the interest paid to a Fund when short-term interest rates fall. Inverse floaters have varying degrees of liquidity, and the market for these securities is relatively volatile. These securities tend to underperform the market for fixed rate bonds in a rising long-term interest rate environment, but tend to outperform t he market for fixed rate bonds when long-term interest rates decline. Although volatile, inverse floaters typically offer the potential for yields exceeding the yields available on fixed rate bonds with comparable credit quality and maturity. These securities usually permit the investor to convert the floating rate to a fixed rate (normally adjusted downward), and this optional conversion feature may provide a partial hedge against rising rates if exercised at an opportune time. While inverse floaters expose a Fund to leverage risk because they provide two or more dollars of bond market exposure for every dollar invested, they are not subject to a Fund’s restrictions on borrowings.
Under certain circumstances, a Fund may enter into a so-called shortfall and forbearance agreement with the sponsor of an inverse floater held by the Fund. Such agreements commit a Fund to reimburse the sponsor of such inverse floater, upon the termination of the trust issuing the inverse floater, the difference between the liquidation value of the underlying security (which is the basis of the inverse floater) and the principal amount due to the holders of the floating rate security issued in conjunction with the inverse floater. Absent a shortfall and forebearance agreement, a Fund would not be required to make such a reimbursement. If a Fund chooses not to enter into such an agreement, the inverse floater could be terminated and the Fund could incur a loss.
Interest Rate Swaps and Forward Rate Contracts. Interest rate swaps involve the exchange by a Fund with another party of their respective commitments to pay or receive interest, e.g., an exchange of fixed rate payments for floating rate payments. A Fund will only enter into interest rate swaps on a net basis, i.e., the two payment streams are netted out with the Fund receiving or paying, as the case may be, only the net amount of the two payments. The Fund may also enter forward rate contracts. Under these contracts, the buyer locks in an interest rate at a future settlement date. If the interest rate on the settlement date exceeds the lock rate, the buyer pays the seller the difference between the two rates. If the lock rate exceeds the interest rate on the settlement date, the seller pays the buyer the difference between the two rates. Any such gain received by the Fund would be taxable.
If the other party to an interest rate swap or forward rate contract defaults, a Fund’s risk of loss consists of the net amount of payments that the Fund is contractually entitled to receive. The net amount of the excess, if any, of a Fund’s obligations over its entitlements will be maintained in a segregated account by the Fund’s custodian. No Fund will enter into any interest rate swap or forward rate contract unless the claims-paying ability of the other party thereto is considered to be investment grade by the investment adviser. If there is a default by the other party to such a transaction, a Fund will have contractual remedies pursuant to the agreements related to the transaction. These instruments are traded in the over-the-counter market.
Illiquid Obligations. At times, a substantial portion of a Fund’s assets may be invested in securities as to which the Fund, by itself or together with other accounts managed by the investment adviser and its affiliates, holds a major portion or all of such securities. Under adverse market or economic conditions or in the event of adverse changes in the financial condition of the issuer, a Fund could find it more difficult to sell such securities when the investment adviser believes it advisable to do so or may be able to sell such securities only at prices lower than if such securities were more widely held. Under such circumstances, it may also be more difficult to determine the fair value of such securities for purposes of computing a Fund’s net asset value. Illiquid securities may also include those legally restricted as to resale, and securities eligible for resale pursuant to Rule 144A thereunder. Rule 144A securities may be treated as liquid securities if the investment adviser determines that such treatment is warranted. Even if determined to be liquid, holdings of these securities may increase the level of Fund illiquidity if eligible buyers become uninterested in purchasing them.
The secondary market for some municipal obligations issued within a state (including issues which are privately placed with a Fund) is less liquid than that for taxable debt obligations or other more widely traded municipal obligations. No Fund will own illiquid securities if more than 15% of its net assets would be invested in securities that are not readily marketable. No established resale market exists for certain of the municipal obligations in which a Fund may invest. The market for obligations rated below investment grade is also likely to be less liquid than the market for higher rated obligations. As a result, a Fund may be unable to dispose of these municipal obligations at times when it would otherwise wish to do so at the prices at which they are valued.
7
Futures Contracts and Options on Futures Contracts. A change in the level of interest rates may affect the value of the securities held by a Fund (or of securities that a Fund expects to purchase). To hedge against changes in rates or as a substitute for the purchase of securities, a Fund may enter into (i) futures contracts for the purchase or sale of debt securities and (ii) futures contracts on securities indices. All futures contracts entered into by a Fund are traded on exchanges or boards of trade that are licensed and regulated by the CFTC and must be executed through a futures commission merchant or brokerage firm which is a member of the relevant exchange. The Fund may purchase and write call and put options on futures contracts which are traded on a United States exchange or board of trade. The Fund will be required, in connection with transactions in futures contracts and the writing of options on futures, to make margin deposits, which will be held by the futures commission m erchant through whom the Fund engages in such futures and options transactions.
Some futures contracts and options thereon may become illiquid under adverse market conditions. In addition, during periods of market volatility, a commodity exchange may suspend or limit transactions in an exchange-traded instrument, which may make the instrument temporarily illiquid and difficult to price. Commodity exchanges may also establish daily limits on the amount that the price of a futures contract or futures option can vary from the previous day’s settlement price. Once the daily limit is reached, no trades may be made that day at a price beyond the limit. This may prevent a Fund from closing out positions and limiting its losses.
The Fund will engage in futures and related options transactions for either hedging or non-hedging purposes. The Fund will determine that the price fluctuations in the futures contracts and options on futures used for hedging purposes are substantially related to price fluctuations in securities held by the Fund or which it expects to purchase. The Fund will engage in transactions in futures and related options contracts only to the extent such transactions are consistent with the requirements of the Code, for maintaining qualification of a Fund as a regulated investment company for federal income tax purposes. The Fund has claimed an exclusion from the definition of a Commodity Pool Operator (“CPO”) under the Commodity Exchange Act and therefore is not subject to registration or regulation as a CPO.
Asset Coverage. To the extent required by SEC guidelines, each Fund will only engage in transactions that expose it to an obligation to another party if it owns either (1) an offsetting (“covered”) position for the same type of financial asset, or (2) cash or liquid securities, segregated with its custodian, with a value sufficient at all times to cover its potential obligations not covered as provided in (1). Assets used as cover or segregated with the custodian cannot be sold while the position(s) requiring cover is open unless replaced with other appropriate assets. As a result, if a large portion of assets is segregated or committed as cover, it could impede portfolio management or the ability to meet redemption requests or other current obligations.
ReFlow Liquidity Program. The Fund may participate in the ReFlow liquidity program, which is designed to provide an alternative liquidity source for mutual funds experiencing net redemptions of their shares. Pursuant to the program, ReFlow Fund, LLC ("ReFlow") provides participating mutual funds with a source of cash to meet net shareholder redemptions by standing ready each business day to purchase fund shares up to the value of the net shares redeemed by other shareholders that are to settle the next business day. Following purchases of fund shares, ReFlow then generally redeems those shares when the fund experiences net sales, at the end of a maximum holding period determined by ReFlow (currently 28 days) or at other times at ReFlow’s discretion. While ReFlow holds fund shares, it will have the same rights and privileges with respect to those shares as any other shareholder. For use of the ReFlow service, a fund pays a fee to ReFlow each time it purchases fund shares, calculated by applying to the purchase amount a fee rate determined through an automated daily auction among participating mutual funds. The current minimum fee rate is 0.15% of the value of the fund shares purchased by ReFlow although the fund may submit a bid at a higher fee rate if it determines that doing so is in the best interest of fund shareholders. Such fee is allocated among a fund’s share classes based on relative net assets. ReFlow’s purchases of fund shares through the liquidity program are made on an investment-blind basis without regard to the fund’s objective, policies or anticipated performance. ReFlow will purchase Class A shares (or Class I shares for the Massachusetts Fund) at net asset value and will not be subject to any sales charge, investment minimum or redemption fee applicable to such shares. Investments in a Fund by ReFlow in connection with the ReFlow liquidity program are not subject to the two round trip limitation described in "Restrictions on Excessive Trading and Market Timing" under "Purchasing Shares" in the prospectus. In accordance with federal securities laws, ReFlow is prohibited from acquiring more than 3% of the outstanding voting securities of a fund. The investment adviser believes that the program assists in stabilizing a Fund’s net assets to the benefit of the Fund and its shareholders. To the extent a Fund’s net assets do not decline, the investment adviser may also benefit.
Temporary Investments. Cash equivalents are highly liquid, short-term securities such as commercial paper, time deposits, certificates of deposit, short-term notes and short-term U.S. Government obligations. These securities may be subject to federal income, state income and/or other taxes.
8
Portfolio Turnover. The Fund may sell (and later purchase) securities in anticipation of a market decline (a rise in interest rates) or purchase (and later sell) securities in anticipation of a market rise (a decline in interest rates). Securities may also be purchased and sold based on their relative value in the marketplace. A Fund cannot accurately predict its portfolio turnover rate, but it is anticipated that the annual portfolio turnover rate will generally not exceed 100% (excluding turnover of securities having a maturity of one year or less). A 100% annual turnover rate could occur, for example, if all the securities held by a Fund were replaced once in a period of one year. A high turnover rate (100% or more) necessarily involves greater expenses to a Fund. Historical turnover rate(s) are included in the Financial Highlights table(s) in the Prospectus.
The following investment restrictions of each Fund are designated as fundamental policies and as such cannot be changed without the approval of the holders of a majority of a Fund’s outstanding voting securities, which as used in this SAI means the lesser of: (a) 67% of the shares of a Fund present or represented by proxy at a meeting if the holders of more than 50% of the outstanding shares are present or represented at the meeting; or (b) more than 50% of the outstanding shares of a Fund. Accordingly, each Fund may not:
| (1) | Borrow money or issue senior securities except as permitted by the 1940 Act; |
| |
| (2) | Purchase securities on margin (but the Fund may obtain such short-term credits as may be necessary for the clearance of purchases and sales of securities). The deposit or payment by the Fund of initial or maintenance margin in connection with futures contracts or related options transactions is not considered the purchase of a security on margin; |
| |
| (3) | Underwrite or participate in the marketing of securities of others, except insofar as it may technically be deemed to be an underwriter in selling a portfolio security under circumstances which may require the registration of the same under the Securities Act of 1933; |
| |
| (4) | Purchase or sell real estate (including limited partnership interests in real estate but excluding readily marketable interests in real estate investment trusts or readily marketable securities of companies which invest or deal in real estate or securities which are secured by real estate); |
| |
| (5) | Purchase or sell physical commodities or contracts for the purchase or sale of physical commodities; or |
| |
| (6) | Make loans to any person except by (a) the acquisition of debt instruments and making portfolio investments, (b) entering into repurchase agreements and (c) lending portfolio securities. |
| |
In connection with Restriction (1) above, the 1940 Act currently permits investment companies to borrow money so long as there is 300% asset coverage of the borrowing (i.e., borrowings do not exceed one-third of the investment company’s total assets after subtracting liabilities other than the borrowings). There is no current intent to borrow money, except for the limited purposes described in the prospectus.
Notwithstanding the investment policies and restrictions of each Fund, the Fund may invest all of its investable assets in an open-end management investment company with substantially the same investment objective, policies and restrictions as the Fund.
The following nonfundamental investment policies have been adopted by each Fund. A nonfundamental investment policy may be changed by the Trustees with respect to a Fund without approval by the Fund’s shareholders. The Fund will not:
- make short sales of securities or maintain a short position, unless at all times when a short position is open (i) it owns an equal amount of such securities or securities convertible into or exchangeable, without payment of any further consideration, for securities of the same issue as, and equal in amount to, the securities sold short or (ii) it holds in a segregated account cash or other liquid securities (to the extent required under the 1940 Act) in an amount equal to the current market value of the securities sold short, and unless not more than 25% of its net assets (taken at current value) is held as collateral for such sales at any one time; or
- invest more than 15% of net assets in investments which are not readily marketable, including restricted securities and repurchase agreements maturing in more than seven days. Restricted securities for the purposes of this limitation do not include securities eligible for resale pursuant to Rule 144A under the Securities Act of 1933 and commercial paper issued pursuant to Section 4(2) of said Act that the Board of Trustees, or its delegate, determines to be liquid. Any such determination by a delegate will be made pursuant to procedures adopted by
9
the Board. When investing in Rule 144A securities, the level of portfolio illiquidity may be increased to the extent
that eligible buyers become uninterested in purchasing such securities.
No Fund will invest 25% or more of its total assets in any one industry. For purposes of the foregoing policy, securities of the U.S. Government, its agencies, or instrumentalities are not considered to represent industries. Municipal obligations backed by the credit of a governmental entity are also not considered to represent industries. However, municipal obligations backed only by the assets and revenues of non-governmental users may for this purpose be deemed to be issued by such non-governmental users. The foregoing 25% limitation would apply to these issuers. As discussed in the prospectus and this SAI, a Fund may invest more than 25% of its total assets in certain economic sectors, such as revenue bonds, housing, hospitals and other health care facilities, utilities and industrial development bonds. The Fund reserves the right to invest more than 25% of total assets in each of these sectors.
For purposes of a Fund’s investment restrictions and diversification status, the determination of the “issuer” of any obligation, including inverse floaters, will be made by the Fund’s investment adviser on the basis of the characteristics of the obligation and other relevant factors, the most significant of which is the source of funds committed to meeting interest and principal payments of such obligations. A Fund’s investments in inverse floaters and similar securities described in the prospectus and this SAI will not be considered borrowing for purposes of a Fund’s restrictions on borrowing described herein and in the prospectus.
Whenever an investment policy or investment restriction set forth in the prospectus or this SAI states a maximum percentage of assets that may be invested in any security or other asset, or describes a policy regarding quality standards, such percentage limitation or standard shall be determined immediately after and as a result of the acquisition by a Fund of such security or asset. Accordingly, any later increase or decrease resulting from a change in values, assets or other circumstances or any subsequent rating change made by a rating service (or as determined by the investment adviser if the security is not rated by a rating agency), will not compel a Fund to dispose of such security or other asset. However, a Fund must always be in compliance with the borrowing policy and limitation on investing in illiquid securities set forth above. If a sale of securities is required to comply with the 15% limit on illiquid securities, such sales will be made in an orderly manner with consideration of the best interests of shareholders.
| MANAGEMENT AND ORGANIZATION |
Fund Management. The Trustees of the Trust are responsible for the overall management and supervision of the affairs of the Trust. The Trustees and officers of the Trust are listed below. Except as indicated, each individual has held the office shown or other offices in the same company for the last five years. Trustees and officers of the Trust hold indefinite terms of office. The “noninterested Trustees” consist of those Trustees who are not “interested persons” of the Trust, as that term is defined under the 1940 Act. The business address of each Trustee and officer is The Eaton Vance Building, 255 State Street, Boston, Massachusetts 02109. As used in this SAI, “EVC” refers to Eaton Vance Corp., “EV” refers to Eaton Vance Inc. and “EVD” refers to Eaton Vance Distributors, Inc. EVC and EV are the corporate parent and trustee, respectively, of Eaton Vance and BMR. EVD is the principal underwriter of each Fund (see "Principal Underwriter" under "Other Service Providers") Each officer affiliated with Eaton Vance may hold a position with other Eaton Vance affiliates that is comparable to his or her position with Eaton Vance listed below.
| | | | | | | | | Number of Portfolios | | |
| | | | | | | | | in Fund Complex | | |
| | | Position(s) with | | Term of Office and | | | | Overseen By | | |
| Name and Date of Birth | | the Trust | | Length of Service | | Principal Occupation(s) During Past Five Years | | Trustee(1) | | Other Directorships Held |
| |
| Interested Trustee | | | | | | | | | | |
| |
| THOMAS E. FAUST JR. | | Trustee | | Since 2007 | | Chairman, Chief Executive Officer and President of EVC, President of EV, | | 176 | | Director of EVC |
| 5/31/58 | | | | | | Chief Executive Officer and President of EVM and BMR, and Director of | | | | |
| | | | | | | EVD. Trustee and/or officer of 176 registered investment companies | | | | |
| | | | | | | and 5 private investment companies managed by Eaton Vance or BMR. | | | | |
| | | | | | | Mr. Faust is an interested person because of his positions with BMR, | | | | |
| | | | | | | Eaton Vance, EVC, EVD and EV, which are affiliates of the Trust. | | | | |
| |
| Noninterested Trustees | | | | | | | | | | |
| |
| BENJAMIN C. ESTY | | Trustee | | Since 2005 | | Roy and Elizabeth Simmons Professor of Business Administration, | | 176 | | None |
| 1/2/63 | | | | | | Harvard University Graduate School of Business Administration (since | | | | |
| | | | | | | 2003). Formerly, Associate Professor, Harvard University Graduate | | | | |
| | | | | | | School of Business Administration (2000-2003). | | | | |
| |
| ALLEN R. FREEDMAN | | Trustee | | Since 2007 | | Former Chairman and Chief Executive Officer of Assurant, Inc. | | 175 | | Director of Assurant, Inc., and |
| 4/3/40 | | | | | | (insurance provider) (1978-2000). Formerly, a Director of Loring | | | | Stonemor Partners L.P. (owner |
| | | | | | | Ward International (fund distributor) (2005-2007). | | | | and operator of cemeteries) |
10
| | | | | | | | | Number of Portfolios | | |
| | | | | | | | | in Fund Complex | | |
| | | Position(s) with | | Term of Office and | | | | Overseen By | | |
| Name and Date of Birth | | the Trust | | Length of Service | | Principal Occupation(s) During Past Five Years | | Trustee(1) | | Other Directorships Held |
| |
| WILLIAM H. PARK | | Trustee | | Since 2003 | | Vice Chairman, Commercial Industrial Finance Corp. (specialty finance | | 176 | | None |
| 9/19/47 | | | | | | company) (since 2006). Formerly, President and Chief Executive | | | | |
| | | | | | | Officer, Prizm Capital Management, LLC (investment management | | | | |
| | | | | | | firm) (2002-2005). | | | | |
| |
| RONALD A. PEARLMAN | | Trustee | | Since 2003 | | Professor of Law, Georgetown University Law Center. | | 176 | | None |
| 7/10/40 | | | | | | | | | | |
| |
| NORTON H. REAMER | | Trustee | | Since 1986 | | President, Chief Executive Officer and a Director of Asset Management | | 176 | | None |
| 9/21/35 | | | | | | Finance Corp. (a specialty finance company serving the investment | | | | |
| | | | | | | management industry) (since October 2003). President, Unicorn | | | | |
| | | | | | | Corporation (an investment and financial advisory services company) | | | | |
| | | | | | | (since September 2000). Formerly, Chairman and Chief Operating | | | | |
| | | | | | | Officer, Hellman, Jordan Management Co., Inc. (an investment | | | | |
| | | | | | | management company) (2000-2003). Formerly, Advisory Director of | | | | |
| | | | | | | Berkshire Capital Corporation (investment banking firm) (2002- | | | | |
| | | | | | | 2003). | | | | |
| |
| HEIDI L. STEIGER | | Trustee | | Since 2007 | | President, Lowenhaupt Global Advisors, LLC (global wealth | | 173 | | Director of Nuclear Electric |
| 7/8/53 | | | | | | management firm) (since 2005). Formerly, President and | | | | Insurance Ltd. (nuclear |
| | | | | | | Contributing Editor, Worth Magazine (2004). Formerly, Executive Vice | | | | insurance provider) and Aviva |
| | | | | | | President and Global Head of Private Asset Management (and various | | | | USA (insurance provider) |
| | | | | | | other positions), Neuberger Berman (investment firm) (1986-2004). | | | | |
| |
| LYNN A. STOUT | | Trustee | | Since 1998 | | Paul Hastings Professor of Corporate and Securities Law, University of | | 176 | | None |
| 9/14/57 | | | | | | California at Los Angeles School of Law. | | | | |
| |
| RALPH F. VERNI | | Chairman of the | | Chairman of Board | | Consultant and private investor. | | 176 | | None |
| 1/26/43 | | Board and Trustee | | since 2007 and | | | | | | |
| | | | | Trustee since 2005 | | | | | | |
(1)Includes both master and feeder funds in a master-feeder structure.
Principal Officers who are not Trustees
| | | Position(s) with | | Term of Office and | | | | |
| Name and Date of Birth | | the Trust | | Length of Service | | Principal Occupation(s) During Past Five Years |
| |
| |
| ROBERT B. MACINTOSH | | President | | Since 2005* | | Vice President of Eaton Vance and BMR. Officer of 89 registered investment companies managed
by Eaton Vance or BMR. |
| 1/22/57 | | | | | |
| |
| |
| WILLIAM H. AHERN, JR. | | Vice President | | Since 2004 | | Vice President of Eaton Vance and BMR. Officer of 74 registered investment companies managed
by Eaton Vance or BMR. |
| 7/28/59 | | | | | |
| |
| |
| CRAIG R. BRANDON | | Vice President | | Since 2004 | | Vice President of Eaton Vance and BMR. Officer of 44 registered investment companies managed
by Eaton Vance or BMR. |
| 12/21/66 | | | | | |
| |
| |
| CYNTHIA J. CLEMSON | | Vice President | | Since 2004 | | Vice President of Eaton Vance and BMR. Officer of 89 registered investment companies managed
by Eaton Vance or BMR. |
| 3/2/63 | | | | | |
| |
| |
| THOMAS M. METZOLD | | Vice President | | Since 2004 | | Vice President of Eaton Vance and BMR. Officer of 43 registered investment companies managed
by Eaton Vance or BMR. |
| 8/3/58 | | | | | |
| |
| |
| ADAM A. WEIGOLD | | Vice President | | Since 2007 | | Vice President of Eaton Vance and BMR. Officer of 70 registered investment companies managed
by Eaton Vance or BMR. |
| 3/22/75 | | | | | |
11
| | | Position(s) with | | Term of Office and | | |
| Name and Date of Birth | | the Trust | | Length of Service | | Principal Occupation(s) During Past Five Years |
| |
| BARBARA E. CAMPBELL | | Treasurer | | Since 2005* | | Vice President of Eaton Vance and BMR. Officer of 176 registered investment companies managed |
| 6/19/57 | | | | | | by Eaton Vance or BMR. |
| |
| |
| MAUREEN A. GEMMA | | Secretary | | Since 2007 | | Deputy Chief Legal Officer of EVC, Eaton Vance and BMR and Vice President of Eaton Vance and |
| 5/24/60 | | | | | | BMR. Officer of 176 registered investment companies managed by Eaton Vance or BMR. |
| |
| |
| PAUL M. O’NEIL | | Chief Compliance Officer | | Since 2004 | | Vice President of Eaton Vance and BMR. Officer of 176 registered investment companies managed |
| 7/11/53 | | | | | | by Eaton Vance or BMR. |
The Board of Trustees of the Trust have several standing Committees, including the Governance Committee, the Audit Committee and the Special Committee. The Governance, the Audit and the Special Committees are each comprised of only noninterested Trustees.
Mmes. Stout (Chair) and Steiger and Messrs Esty, Freedman, Park, Pearlman, Reamer and Verni are members of the Governance Committee of the Board of Trustees of the Trust. The purpose of the Governance Committee is to consider, evaluate and make recommendations to the Board of Trustees with respect to the structure, membership and operation of the Board of Trustees and the Committees thereof, including the nomination and selection of noninterested Trustees and a Chairperson of the Board of Trustees and the compensation of such persons. During the fiscal year ended September 30, 2007, the Governance Committee convened seven times.
The Governance Committee will, when a vacancy exists or is anticipated, consider any nominee for noninterested Trustee recommended by a shareholder if such recommendation is submitted in writing to the Governance Committee, contains sufficient background information concerning the candidate, including evidence the candidate is willing to serve as a noninterested Trustee if selected for the position, and is received in a sufficiently timely manner.
Messrs. Reamer (Chair), Park and Verni and Mmes. Steiger and Stout are members of the Audit Committee of the Board of Trustees of the Trust. The Board of Trustees has designated Messrs. Park and Reamer, each a noninterested Trustee, as audit committee financial experts. The Audit Committee’s purposes are to (i) oversee each Fund’s accounting and financial reporting processes, its internal control over financial reporting, and, as appropriate, the internal control over financial reporting of certain service providers; (ii) oversee or, as appropriate, assist Board oversight of the quality and integrity of each Fund’s financial statements and the independent audit thereof; (iii) oversee, or, as appropriate, assist Board oversight of, each Fund’s compliance with legal and regulatory requirements that relate to each Fund’s accounting and financial reporting, internal control over financial reporting and independent audits; (iv) approve prior to appointment the engagement and , when appropriate, replacement of the independent registered public accounting firm, and, if applicable, nominate the independent registered public accounting firm to be proposed for shareholder ratification in any proxy statement of a Fund; (v) evaluate the qualifications, independence and performance of the independent registered public accounting firm and the audit partner in charge of leading the audit; and (vi) prepare, as necessary, audit committee reports consistent with the requirements of Rule 306 of Regulation S-K for inclusion in the proxy statement of a Fund. During the fiscal year ended September 30, 2007, the Audit Committee convened four times.
Messrs. Verni (Chair), Esty, Freedman, Park, Pearlman and Reamer are currently members of the Special Committee of the Board of Trustees of the Trust. The purposes of the Special Committee are to consider, evaluate and make recommendations to the Board of Trustees concerning the following matters: (i) contractual arrangements with each service provider to the Funds, including advisory, sub-advisory, transfer agency, custodial and fund accounting, distribution services and administrative services; (ii) any and all other matters in which any service provider (including Eaton Vance or any affiliated entity thereof) has an actual or potential conflict of interest with the interests of the Funds, or investors therein; and (iii) any other matter appropriate for review by the noninterested Trustees, unless the matter is within the responsibilities of the Audit Committee or the Governance Committee. During the fiscal year ended September 30, 2007, the Special Committee convened eleven times.
12
Share Ownership. The following table shows the dollar range of equity securities beneficially owned by each Trustee in each Fund and in all Eaton Vance Funds overseen by the Trustee as of December 31, 2006.
| | | | | | | | | Dollar Range of Equity Securities Owned by | | | | | | |
| | | Benjamin C. | | Thomas E. | | Allen R. | | William H. | | Ronald A. | | Norton H. | | Heidi L. | | Lynn A. | | Ralph F. |
| Fund Name | | Esty(2) | | Faust Jr.(1) | | Freedman(2)(4) | | Park(2) | | Pearlman(2) | | Reamer(2) | | Steiger(2)(4) | | Stout(2) | | Verni(2) |
| California Fund | | None | | None | | None | | None | | None | | None | | None | | None | | None |
| Florida Fund | | None | | None | | None | | None | | None | | None | | None | | None | | None |
| Massachusetts | | $10,001 - | | | | | | | | | | | | | | | | $10,001 - |
| Fund | | $50,000 | | None | | None | | None | | None | | None | | None | | None | | $50,000 |
| Mississippi Fund | | None | | None | | None | | None | | None | | None | | None | | None | | None |
| New York Fund | | None | | None | | None | | None | | None | | None | | None | | None | | None |
| Ohio Fund | | None | | None | | None | | None | | None | | None | | None | | None | | None |
| Rhode Island Fund | | None | | None | | None | | None | | None | | None | | None | | None | | None |
| West Virginia Fund | | None | | None | | None | | None | | None | | None | | None | | None | | None |
| Aggregate Dollar | | | | | | | | | | | | | | | | | | |
| Range of Equity | | | | | | | | | | | | | | | | | | |
| Securities Owned | | | | | | | | | | | | | | | | | | |
| in all Registered | | | | | | | | | | | | | | | | | | |
| Funds Overseen by | | | | | | | | | | | | | | | | | | |
| Trustee in the | | | | | | | | | | | | | | | | | | |
| Eaton Vance | | | | | | | | | | | | | | $50,001- | | | | |
| Family of Funds | | over $100,000 | | over $100,000 | | over $100,000 | | over $100,000 | | over $100,000 | | over $100,000 | | $100,000 | | over $100,000(3) over $100,000(3) |
| (1) | Interested Trustee |
| (2) | Noninterested Trustees |
| (3) | Includes shares which may be deemed to be beneficially owned through the Trustee Deferred Compensation Plan. |
| (4) | Mr. Freedman and Ms. Steiger were appointed Trustees on April 23, 2007. Their beneficial ownership information is as of October 31, 2007. |
As of December 31, 2006, no noninterested Trustee or any of their immediate family members owned beneficially or of record any class of securities of EVC, EVD or any person controlling, controlled by or under common control with EVC or EVD.
During the calendar years ended December 31, 2005 and December 31, 2006, no noninterested Trustee (or their immediate family members) had:
| 1. | Any direct or indirect interest in Eaton Vance, EVC, EVD or any person controlling, controlled by or under common control with EVC or EVD; |
| |
| 2. | Any direct or indirect material interest in any transaction or series of similar transactions with (i) the Trust or any Fund; (ii) another fund managed by EVC, distributed by EVD or a person controlling, controlled by or under common control with EVC or EVD; (iii) EVC or EVD; (iv) a person controlling, controlled by or under common control with EVC or EVD; or (v) an officer of any of the above; or |
| |
| 3. | Any direct or indirect relationship with (i) the Trust or any Fund; (ii) another fund managed by EVC, distributed by EVD or a person controlling, controlled by or under common control with EVC or EVD; (iii) EVC or EVD; (iv) a person controlling, controlled by or under common control with EVC or EVD; or (v) an officer of any of the above. |
| |
During the calendar years ended December 31, 2005 and December 31, 2006, no officer of EVC, EVD or any person controlling, controlled by or under common control with EVC or EVD served on the Board of Directors of a company where a noninterested Trustee of the Trust or any of their immediate family members served as an officer.
Trustees of each Fund who are not affiliated with the investment adviser may elect to defer receipt of all or a percentage of their annual fees in accordance with the terms of a Trustees Deferred Compensation Plan (the “Trustees’ Plan”). Under the Trustees’ Plan, an eligible Trustee may elect to have his or her deferred fees invested by a Fund in the shares of one or more funds in the Eaton Vance Family of Funds, and the amount paid to the Trustees under the Trustees’ Plan will be determined based upon the performance of such investments. Deferral of Trustees’ fees in accordance with the Trustees’ Plan will have a negligible effect on a Fund’s assets, liabilities, and net income per share, and will not obligate a Fund to retain the services of any Trustee or obligate a Fund to pay any particular level of compensation to the Trustee. The Trust does not have a retirement plan for Trustees.
13
The fees and expenses of the Trustees of the Trust are paid by the Funds (and other series of the Trust). (A Trustee of the Trust who is a member of the Eaton Vance organization receives no compensation from the Trust.) During the fiscal year ended September 30, 2007, the Trustees of the Trust earned the following compensation in their capacities as Trustees from the Trust. For the year ended December 31, 2006, the Trustees earned the following compensation in their capacities as Trustees of the funds in the Eaton Vance fund complex(1):
| | | Benjamin C. | | Allen R. | | William H. | | Ronald A. | | Norton H. | | Heidi L. | | Lynn A. | | Ralph F. |
| Source of Compensation | | Esty | | Freedman(1) | | Park | | Pearlman | | Reamer | | Steiger(1) | | Stout | | Verni |
| Trust(2) | | $ 33,268 | | $ 16,863 | | $ 34,240 | | $ 27,237 | | $ 37,193 | | $ 16,097 | | $ 34,605 | | $ 38,461 |
| Trust and Fund Complex(1) | | $185,000 | | $185,000 | | $185,000(3) | | $185,000 | | $195,000 | | $185,000 | | $195,000(4) | | $185,000(5) |
| (1) | As of December 1, 2007, the Eaton Vance fund complex consists of 176 registered investment companies or series thereof. Mr. Freedman and Ms. Steiger were appointed as Trustees on April 23, 2007, and thus the compensation figures listed for the Trust and Fund Complex are estimated for the calendar year ending December 31, 2006 based on amounts they would have received if they had been Trustees for the 2006 calendar year. Samuel L. Hayes, III retired as a Trustee on July 1, 2007. For the fiscal year ended September 30, 2007, Mr. Hayes received Trustee fees of $40,982 from the Trust. |
| | For the calendar year ended December 31, 2006, he received $300,000 from the Trust and Fund Complex. |
| (2) | The Trust consisted of 28 Funds as of September 30, 2007. |
| (3) | Includes $133,680 of deferred compensation. |
| (4) | Includes $45,000 of deferred compensation. |
| (5) | Includes $92,500 of deferred compensation. |
Each Fund is a series of the Trust, which was organized under Massachusetts law on September 30, 1985 and is operated as an open-end management investment company. The Trust may issue an unlimited number of shares of beneficial interest (no par value per share) in one or more series (such as a Fund). The Trustees of the Trust have divided the shares of each Fund into multiple classes. Each class represents an interest in a Fund, but is subject to different expenses, rights and privileges. The Trustees have the authority under the Declaration of Trust to create additional classes of shares with differing rights and privileges. When issued and outstanding, shares are fully paid and nonassessable by the Trust. Shareholders are entitled to one vote for each full share held. Fractional shares may be voted proportionately. Shares of a Fund will be voted together except that only shareholders of a particular class may vote on matters affecting only that class. Shares have no preemptive or conversion r ights and are freely transferable. In the event of the liquidation of a Fund, shareholders of each class are entitled to share pro rata in the net assets attributable to that class available for distribution to shareholders.
As permitted by Massachusetts law, there will normally be no meetings of shareholders for the purpose of electing Trustees unless and until such time as less than a majority of the Trustees of the Trust holding office have been elected by shareholders. In such an event the Trustees then in office will call a shareholders’ meeting for the election of Trustees. Except for the foregoing circumstances and unless removed by action of the shareholders in accordance with the Trust’s By-laws, the Trustees shall continue to hold office and may appoint successor Trustees. The Trust’s By-laws provide that no person shall serve as a Trustee if shareholders holding two-thirds of the outstanding shares have removed him or her from that office either by a written declaration filed with the Trust’s custodian or by votes cast at a meeting called for that purpose. The By-laws further provide that under certain circumstances the shareholders may call a meeting to remove a Trustee and that the Trust is required to provide assistance in communication with shareholders about such a meeting.
The Trust’s Declaration of Trust may be amended by the Trustees when authorized by vote of a majority of the outstanding voting securities of the Trust, the financial interests of which are affected by the amendment. The Trustees may also amend the Declaration of Trust without the vote or consent of shareholders to change the name of the Trust or any series or to make such other changes (such as reclassifying series or classes of shares or restructuring the Trust) as do not have a materially adverse effect on the financial interests of shareholders or if they deem it necessary to conform it to applicable federal or state laws or regulations. The Trust’s By-laws provide that the Trust will indemnify its Trustees and officers against liabilities and expenses incurred in connection with any litigation or proceeding in which they may be involved because of their offices with the Trust. However, no indemnification will be provided to any Trustee or officer for any liability to the Trust or shareholders by reason of willful misfeasance, bad faith, gross negligence or reckless disregard of the duties involved in the conduct of his or her office.
The Trust or any series or class thereof may be terminated by: (1) the affirmative vote of the holders of not less than two-thirds of the shares outstanding and entitled to vote at any meeting of shareholders of the Trust or the appropriate series or class thereof, or by an instrument or instruments in writing without a meeting, consented to by the holders of two-thirds of the shares of the Trust or a series or class thereof, provided, however, that, if such termination is recommended by the Trustees, the vote of a majority of the outstanding voting securities of the Trust or a series or class thereof entitled to vote thereon shall be sufficient authorization; or (2) by means of an instrument in writing signed by a majority of the Trustees,
14
to be followed by a written notice to shareholders stating that a majority of the Trustees has determined that the continuation of the Trust or a series or a class thereof is not in the best interest of the Trust, such series or class or of their respective shareholders.
Under Massachusetts law, if certain conditions prevail, shareholders of a Massachusetts business trust (such as the Trust) could be deemed to have personal liability for the obligations of the Trust. Numerous investment companies registered under the 1940 Act have been formed as Massachusetts business trusts, and management is not aware of an instance where such liability has been imposed. The Trust’s Declaration of Trust contains an express disclaimer of liability on the part of Fund shareholders and the Trust’s By-laws provide that the Trust shall assume the defense on behalf of any Fund shareholders. The Declaration of Trust also contains provisions limiting the liability of a series or class to that series or class. Moreover, the Trust’s By-laws also provide for indemnification out of Fund property of any shareholder held personally liable solely by reason of being or having been a shareholder for all loss or expense arising from such liability. The assets of each Fund are re adily marketable and will ordinarily substantially exceed its liabilities. In light of the nature of each Fund’s business and the nature of its assets, management believes that the possibility of the Fund’s liability exceeding its assets, and therefore the shareholder’s risk of personal liability, is remote.
Proxy Voting Policy. The Board of Trustees of the Trust have adopted a proxy voting policy and procedures (the “Fund Policy”), pursuant to which the Trustees have delegated proxy voting responsibility to the investment adviser and adopted the proxy voting policies and procedures of the investment adviser (the “Policies”). An independent proxy service has been retained to assist in the voting of Fund proxies through the provision of vote analysis, implementation and recordkeeping and disclosure services. The Trustees will review each Fund’s proxy voting records from time to time and will annually consider approving the Policies for the upcoming year. For a copy of the Fund Policy and investment adviser Policies, see Appendix G and Appendix H, repsectively. Information on how each Fund voted proxies relating to portfolio securities during the most recent 12-month period ended June 30 is available (1) without charge, upon request, by calling 1-800-262-1122, and (2) on the SEC’s website at http://www.sec.gov.
INVESTMENT ADVISORY AND ADMINISTRATIVE SERVICES
Investment Advisory Services. The investment adviser manages the investments and affairs of each Fund and provides related office facilities and personnel subject to the supervision of the Trust’s Board of Trustees. The investment adviser furnishes investment research, advice and supervision, furnishes an investment program and determines what securities will be purchased, held or sold by the Fund and what portion, if any, of the Fund’s assets will be held uninvested. The Investment Advisory Agreement requires the investment adviser to pay the salaries and fees of all officers and Trustees of the Trust who are members of the investment adviser’s organization and all personnel of the investment adviser performing services relating to research and investment activities.
For a description of the compensation that each Fund pays the investment adviser, see the prospectus. The following table sets forth the net assets of each Fund and the advisory fees for the three fiscal years ended September 30, 2007.
| | | | | | | Advisory Fee for Fiscal Years Ended | | |
| Fund | | Net Assets at 9/30/07 | | 9/30/07 | | 9/30/06 | | 9/30/05 |
| California | | $276,263,859 | | $1,198,210 | | $1,050,891 | | $1,070,116 |
| Florida | | 241,694,941 | | 1,073,101 | | 1,052,340 | | 1,028,260 |
| Massachusetts* | | 329,616,889 | | 1,246,654 | | 996,816 | | 912,280 |
| Mississippi | | 17,261,258 | | 27,854 | | 28,376 | | 27,497 |
| New York | | 443,240,375 | | 1,901,120 | | 1,648,860 | | 1,553,287 |
| Ohio | | 334,279,728 | | 1,182,720 | | 781,859 | | 687,955 |
| Rhode Island | | 64,033,341 | | 185,604 | | 147,289 | | 145,965 |
| West Virginia | | 31,752,328 | | 63,083 | | 57,714 | | 54,313 |
| * | The investment adviser has agreed to reduce the investment adviser fee by an amount equal to that portion of commissions paid to broker dealers in execution of fund portfolio transactions that is consideration for third-party research services. For the year ended September 30, 2005, the investment adviser waived $230 of its advisory fee for the Massachusetts Fund. |
| |
The Investment Advisory Agreement with the investment adviser continues in effect from year to year so long as such continuance is approved at least annually (i) by the vote of a majority of the noninterested Trustees of the Trust cast in person at a meeting specifically called for the purpose of voting on such approval and (ii) by the Board of Trustees of the Trust or by vote of a majority of the outstanding voting securities of the Fund. The Agreement may be terminated at any time without penalty on sixty (60) days’ written notice by the Board of Trustees of either party, or by vote of the majority of the outstanding voting securities of the Fund, and the Agreement will terminate automatically in the event of its
15
assignment. The Agreement provides that the investment adviser may render services to others. The Agreement also provides that the investment adviser shall not be liable for any loss incurred in connection with the performance of its duties, or action taken or omitted under the Agreement, in the absence of willful misfeasance, bad faith, gross negligence in the performance of its duties or by reason of its reckless disregard of its obligations and duties thereunder, or for any losses sustained in the acquisition, holding or disposition of any security or other investment.
Information About BMR and Eaton Vance. BMR and Eaton Vance are business trusts organized under the laws of The Commonwealth of Massachusetts. Eaton Vance, Inc. (“EV”) serves as trustee of BMR and Eaton Vance. EV and Eaton Vance are wholly-owned subsidiaries of Eaton Vance Corporation (“EVC”), a Maryland corporation and publicly-held holding company. BMR is an indirect subsidiary of EVC. EVC through its subsidiaries and affiliates engages primarily in investment management, administration and marketing activities. The Directors of EVC are Thomas E. Faust Jr., Ann E. Berman, Leo I. Higdon, Jr., Vincent M. O’Reilly, Dorothy E. Puhy and Winthrop H. Smith, Jr. All shares of the outstanding Voting Common Stock of EVC are deposited in a Voting Trust, the Voting Trustees of which are Mr. Faust, Jeffrey P. Beale, Cynthia J. Clemson, Lisa Jones, Michael R. Mach, Robert B. MacIntosh, Thomas M. Metzold, Scott H. Page, John E. Pelletier, Duncan W. Richardson, Walter R. Row, I II, G. West Saltonstall, Judith A. Saryan, Payson F. Swaffield, Michael W. Weilheimer, Robert J. Whelan and Matthew J. Witkos (all of whom are officers of Eaton Vance). The Voting Trustees have unrestricted voting rights for the election of Directors of EVC. All of the outstanding voting trust receipts issued under said Voting Trust are owned by certain of the officers of BMR and Eaton Vance who are also officers, or officers and Directors of EVC and EV. As indicated under “Management and Organization,” all of the officers of the Trust (as well as Mr. Faust who is also a Trustee) hold positions in the Eaton Vance organization.
Code of Ethics. The investment adviser, principal underwriter, and each Fund have adopted Codes of Ethics governing personal securities transactions. Under the Codes, employees of Eaton Vance and the principal underwriter may purchase and sell securities (including securities held or eligible for purchase by a Fund) subject to the provisions of the Codes and certain employees are also subject to pre-clearance, reporting requirements and other procedures.
Portfolio Managers. The portfolio manager of each Fund is listed below. Each portfolio manager manages other investment companies and/or investment accounts in addition to a Fund. The following tables show, as of a Fund’s most recent fiscal year end, the number of accounts each portfolio manager managed in each of the listed categories and the total assets in the accounts managed within each category. The table also shows the number of accounts with respect to which the advisory fee is based on the performance of the account, if any, and the total assets in those accounts.
| | | Number of | | Total Assets of | | Number of Accounts | | Total Assets of Accounts |
| California and Florida Funds | | All Accounts | | All Accounts* | | Paying a Performance Fee | | Paying a Performance Fee |
| Cynthia J. Clemson | | | | | | | | |
| Registered Investment Companies | | 10 | | $3,648.2 | | 0 | | $0 |
| Other Pooled Investment Vehicles | | 0 | | $ 0 | | 0 | | $0 |
| Other Accounts | | 0 | | $ 0 | | 0 | | $0 |
| | | Number of | | Total Assets of | | Number of Accounts | | Total Assets of Accounts |
| Massachusetts and Rhode Island Funds | | All Accounts | | All Accounts* | | Paying a Performance Fee | | Paying a Performance Fee* |
| Robert B. MacIntosh | | | | | | | | |
| Registered Investment Companies | | 10 | | $2,635.7 | | 0 | | $0 |
| Other Pooled Investment Vehicles | | 0 | | $ 0 | | 0 | | $0 |
| Other Accounts | | 224 | | $ 181.8 | | 0 | | $0 |
| | | Number of | | Total Assets of | | Number of Accounts | | Total Assets of Accounts |
| Mississippi and New York Funds | | All Accounts | | All Accounts* | | Paying a Performance Fee | | Paying a Performance Fee |
| Craig Brandon | | | | | | | | |
| Registered Investment Companies | | 12 | | $1,481.7 | | 0 | | $0 |
| Other Pooled Investment Vehicles | | 0 | | $ 0 | | 0 | | $0 |
| Other Accounts | | 0 | | $ 0 | | 0 | | $0 |
16
| | | Number of | | Total Assets of | | Number of Accounts | | Total Assets of Accounts |
| Ohio Fund | | All Accounts | | All Accounts* | | Paying a Performance Fee | | Paying a Performance Fee |
| William H. Ahern, Jr. | | | | | | | | |
| Registered Investment Companies | | 14 | | $1,848.3 | | 0 | | $0 |
| Other Pooled Investment Vehicles | | 0 | | $ 0 | | 0 | | $0 |
| Other Accounts | | 0 | | $ 0 | | 0 | | $0 |
| | | Number of | | Total Assets of | | Number of Accounts | | Total Assets of Accounts |
| West Virginia Fund | | All Accounts | | All Accounts* | | Paying a Performance Fee | | Paying a Performance Fee |
| Adam A. Weigold | | | | | | | | |
| Registered Investment Companies | | 12 | | $1,013.8 | | 0 | | $0 |
| Other Pooled Investment Vehicles | | 0 | | $ 0 | | 0 | | $0 |
| Other Accounts | | 0 | | $ 0 | | 0 | | $0 |
*In millions of dollars. For registered investment companies, assets represent net assets of all open-end investment companies and gross assets of all closed-end investment companies.
The following table shows the dollar value of shares of a Fund beneficially owned by its portfolio manager as of the Fund’s most recent fiscal year ended September 30, 2007 and in all Eaton Vance Funds as of December 31, 2006. The purpose of each Fund is to provide tax-exempt income to persons subject to taxation in a particular state. In most cases, a Fund’s portfolio manger is not subject to such taxation. In addition, in most cases, Fund shares are not registered for sale in the state of the portfolio manager’s residence.
| | | | | Aggregate Dollar Range of Equity |
| | | Dollar Range of Equity Securities | | Securities Owned in all Registered Funds in |
| Fund Name and Portfolio Manager | | Owned in the Fund | | the Eaton Vance Family of Funds |
| California Fund | | | | |
| Cynthia J. Clemson | | None | | $500,001 - $1,000,000 |
| Florida Fund | | | | |
| Cynthia J. Clemson | | None | | $500,001 - $1,000,000 |
| Massachusetts Fund | | | | |
| Robert B. MacIntosh | | None | | over $1,000,000 |
| Mississippi Fund | | | | |
| Craig R. Brandon | | None | | $100,001 - $500,000 |
| New York Fund | | | | |
| Craig R. Brandon | | None | | $100,001 - $500,000 |
| Ohio Fund | | | | |
| William H. Ahern, Jr. | | None | | $500,001 - $1,000,000 |
| Rhode Island Fund | | | | |
| Robert B. MacIntosh | | None | | over $1,000,000 |
| West Virginia Fund | | | | |
| Adam A. Weigold | | None | | $100,001 - $500,000 |
It is possible that conflicts of interest may arise in connection with a portfolio manager’s management of a Fund’s investments on the one hand and the investments of other accounts for which the portfolio manager is responsible on the other. For example, a portfolio manager may have conflicts of interest in allocating management time, resources and investment opportunities among the Fund and other accounts he or she advises. In addition, due to differences in the investment strategies or restrictions between a Fund and the other accounts, a portfolio manager may take action with respect to another account that differs from the action taken with respect to the Fund. In some cases, another account managed by a portfolio manager may compensate the investment adviser based on the performance of the securities held by that account. The existence of such a performance based fee may create additional conflicts of interest for the portfolio
17
manager in the allocation of management time, resources and investment opportunities. Whenever conflicts of interest arise, the portfolio manager will endeavor to exercise his or her discretion in a manner that he or she believes is equitable to all interested persons.
Compensation Structure for BMR. Compensation of the investment adviser’s portfolio managers and other investment professionals has three primary components: (1) a base salary, (2) an annual cash bonus, and (3) annual stock-based compensation consisting of options to purchase shares of EVC’s nonvoting common stock and/or restricted shares of EVC’s nonvoting common stock. The investment adviser’s investment professionals also receive certain retirement, insurance and other benefits that are broadly available to all the investment adviser’s employees. Compensation of the investment adviser’s investment professionals is reviewed primarily on an annual basis. Cash bonuses, stock-based compensation awards, and adjustments in base salary are typically paid or put into effect at or shortly after the October 31st fiscal year end of EVC.
Method to Determine Compensation. The investment adviser compensates its portfolio managers based primarily on the scale and complexity of their portfolio responsibilities and the total return performance of managed funds and accounts versus appropriate peer groups or benchmarks. Performance is normally based on periods ending on the September 30th preceding fiscal year end. Fund performance is evaluated primarily versus peer groups of funds as determined by Lipper Inc. and/or Morningstar, Inc. In evaluating the performance of a fund and its manager, primary emphasis is normally placed on three-year performance, with secondary consideration of performance over longer and shorter periods. For funds that are tax-managed or otherwise have an objective of after-tax returns, performance is measured net of taxes. For other funds, performance is evaluated on a pre-tax basis. In addition to rankings within peer groups of funds on the basis of absolute performance, consideration may also be given to risk-adjusted performance. For funds with an investment objective other than total return (such as current income), consideration will also be given to the fund’s success in achieving its objective. For managers responsible for multiple funds and accounts, investment performance is evaluated on an aggregate basis, based on averages or weighted averages among managed funds and accounts. Funds and accounts that have performance-based advisory fees are not accorded disproportionate weightings in measuring aggregate portfolio manager performance.
The compensation of portfolio managers with other job responsibilities (such as heading an investment group or providing analytical support to other portfolios) will include consideration of the scope of such responsibilities and the managers’ performance in meeting them.
The investment adviser seeks to compensate portfolio managers commensurate with their responsibilities and performance, and competitive with other firms within the investment management industry. The investment adviser participates in investment-industry compensation surveys and utilizes survey data as a factor in determining salary, bonus and stock-based compensation levels for portfolio managers and other investment professionals. Salaries, bonuses and stock-based compensation are also influenced by the operating performance of the investment adviser and its parent company. The overall annual cash bonus pool is based on a substantially fixed percentage of pre-bonus operating income. While the salaries of the investment adviser’s portfolio managers are comparatively fixed, cash bonuses and stock-based compensation may fluctuate significantly from year to year, based on changes in manager performance and other factors as described herein. For a high performing portfolio manager, cash bonus es and stock-based compensation may represent a substantial portion of total compensation.
Administrative Services. As indicated in the prospectus, Eaton Vance serves as administrator of each Fund, but currently receives no compensation for providing administrative services to the Fund. Under its Administrative Services Agreement, Eaton Vance has been engaged to administer each Fund’s affairs, subject to the supervision of the Trustees of the Trust, and shall furnish office space and all necessary office facilities, equipment and personnel for administering the affairs of each Fund.
Sub-Transfer Agency Services. Eaton Vance also serves as sub-transfer agent for each Fund. As sub-transfer agent, Eaton Vance performs the following services directly on behalf of each Fund: (1) provides call center services to financial intermediaries and shareholders; (2) answers written inquiries related to shareholder accounts (matters relating to portfolio management, distribution of shares and other management policy questions will be referred to each Fund); (3) furnishes an SAI to any shareholder who requests one in writing or by telephone from each Fund; and (4) processes transaction requests received via telephone. For the transfer agency services it provides, Eaton Vance receives an aggregate annual fee equal to the lesser of $2.5 million or the actual expenses incurred by Eaton Vance in the performance of those services. This fee is paid to Eaton Vance by a Fund’s transfer agent from fees it receives from the Eaton Vance funds. The Fund will
18
pay a pro rata share of such fee. For the fiscal year ended September 30, 2007, Eaton Vance was paid or accrued as follows by the transfer agent for sub-transfer agency services performed on behalf of each Fund:
| California | | Florida | | Massachusetts | | Mississippi | | New York | | Ohio | | Rhode Island | | West Virginia |
| $5,410 | | $5,930 | | $7,482 | | $601 | | $10,505 | | $7,871 | | $1,740 | | $1,134 |
Expenses. The Fund is responsible for all expenses not expressly stated to be payable by another party (such as expenses required to be paid pursuant to an agreement with the investment adviser, the principal underwriter or the administrator). In the case of expenses incurred by the Trust, each Fund is responsible for its pro rata share of those expenses. The only expenses of a Fund allocated to a particular class are those incurred under the Distribution Plan applicable to that class, the fee paid to the principal underwriter for handling repurchase transactions and certain other class-specific expenses.
Principal Underwriter. Eaton Vance Distributors, Inc. (“EVD”), The Eaton Vance Building, 255 State Street, Boston, MA 02109, is the principal underwriter of each Fund. The principal underwriter acts as principal in selling shares under a Distribution Agreement with the Trust. The expenses of printing copies of prospectuses used to offer shares and other selling literature and of advertising are borne by the principal underwriter. The fees and expenses of qualifying and registering and maintaining qualifications and registrations of a Fund and its shares under federal and state securities laws are borne by the Fund. The Distribution Agreement is renewable annually by the Trust’s Board of Trustees (including a majority of the noninterested Trustees who have no direct or indirect financial interest in the operation of the Distribution Plan or the Distribution Agreement), may be terminated on sixty days’ notice either by such Trustees or by vote of a majority of the outst anding Class A, Class B and Class C shares or on six months’ notice by the principal underwriter and is automatically terminated upon assignment. The principal underwriter distributes shares on a “best efforts” basis under which it is required to take and pay for only such shares as may be sold. EVD is an indirect, wholly-owned subsidiary of EVC. Mr. Faust is a Director of EVD.
Custodian. State Street Bank & Trust Company (“State Street“), 200 Clarendon Street, Boston, MA 02116, serves as custodian to each Fund. State Street has custody of all cash and securities of a Fund, maintains the general ledger of each Fund and computes the daily net asset value of shares of each Fund. In such capacity it attends to details in connection with the sale, exchange, substitution, transfer or other dealings with each Fund’s investments, receives and disburses all funds and performs various other ministerial duties upon receipt of proper instructions from the Trust. State Street provides services in connection with the preparation of shareholder reports and the electronic filing of such reports with the SEC. EVC and its affiliates and their officers and employees from time to time have transactions with various banks, including State Street. It is Eaton Vance’s opinion that the terms and conditions of such transactions were not and will not be influenc ed by existing or potential custodial or other relationships between each Fund and such banks.
Independent Registered Public Accounting Firm. Deloitte & Touche LLP, 200 Berkeley Street, Boston, MA 02116, is the independent registered public accounting firm of each Fund, providing audit services and assistance and consultation with respect to the preparation of filings with the SEC.
Transfer Agent. PFPC Inc., P.O. Box 9653, Providence, RI 02940-9653, serves as transfer and dividend disbursing agent for each Fund.
| CALCULATION OF NET ASSET VALUE |
The net asset value of each Fund is computed by State Street (as agent and custodian for each Fund) by subtracting the liabilities of the Fund from the value of its total assets. The Fund will be closed for business and will not price their respective shares on the following business holidays: New Year’s Day, Martin Luther King, Jr. Day, Presidents’ Day, Good Friday, Memorial Day, Independence Day, Labor Day, Thanksgiving Day and Christmas Day.
Inasmuch as the market for municipal obligations is a dealer market with no central trading location or continuous quotation system, it is not feasible to obtain last transaction prices for most municipal obligations held by a Fund, and such obligations, including those purchased on a when-issued basis, will normally be valued on the basis of valuations furnished by a pricing service. The pricing service uses information with respect to transactions in bonds, quotations from bond dealers, market transactions in comparable securities, various relationships between securities, and yield to maturity in determining value. Taxable obligations, if any, are normally valued on the basis of valuations furnished by a pricing service. Open futures positions on debt securities are valued at the most recent settlement prices, unless such price does not reflect the fair value of the contract, in which case the positions will be valued by or at the direction of the Trustees. Other assets are valued at fair va lue using methods determined in good faith by or at the direction of the Trustees considering relevant factors, data and information including the market value of freely tradable securities of the same class in the principal market on which such securities are normally traded.
19
| PURCHASING AND REDEEMING SHARES |
Additional Information About Purchases. Fund shares are offered for sale only in states where they are registered. Fund shares are continuously offered through investment dealers which have entered into agreements with the principal underwriter. Shares of a Fund are sold at the offering price, which is the net asset value plus the initial sales charge, if any. The Fund receives the net asset value. The principal underwriter receives the sales charge, all or a portion of which may be reallowed to the investment dealers responsible for selling Fund shares. The sales charge table in the prospectus is applicable to purchases of a Fund alone or in combination with purchases of certain other funds offered by the principal underwriter, made at a single time by (i) an individual, or an individual, his or her spouse and their children under the age of twenty-one, purchasing shares for his or their own account, and (ii) a trustee or other fiduciary purchasing shares for a single trust estate or a single fiduciary account. The table is also presently applicable to (1) purchases of Class A shares pursuant to a written Statement of Intention; or (2) purchases of Class A shares pursuant to the Right of Accumulation and declared as such at the time of purchase. See “Sales Charges”.
In connection with employee benefit or other continuous group purchase plans, a Fund may accept initial investments of less than the minimum investment amount on the part of an individual participant. In the event a shareholder who is a participant of such a plan terminates participation in the plan, his or her shares will be transferred to a regular individual account. However, such account will be subject to the right of redemption by a Fund as described below.
Suspension of Sales. The Trust may, in its absolute discretion, suspend, discontinue or limit the offering of one or more of its classes of shares at any time. In determining whether any such action should be taken, the Trust’s management intends to consider all relevant factors, including (without limitation) the size of a Fund or class, the investment climate and market conditions, the volume of sales and redemptions of shares, and (if applicable) the amount of uncovered distribution charges of the principal underwriter. The Class A, Class B and Class C Distribution Plans may continue in effect and payments may be made under the Plans following any such suspension, discontinuance or limitation of the offering of shares; however, there is no contractual obligation to continue any Plan for any particular period of time. Suspension of the offering of shares would not, of course, affect a shareholder’s ability to redeem shares.
Additional Information About Redemptions. The right to redeem shares of a Fund can be suspended and the payment of the redemption price deferred when the Exchange is closed (other than for customary weekend and holiday closings), during periods when trading on the Exchange is restricted as determined by the SEC, or during any emergency as determined by the SEC which makes it impracticable for a Fund to dispose of its securities or value its assets, or during any other period permitted by order of the SEC for the protection of investors.
Due to the high cost of maintaining small accounts, the Trust reserves the right to redeem accounts with balances of less than $750. Prior to such a redemption, shareholders will be given 60 days’ written notice to make an additional purchase. However, no such redemption would be required by the Trust if the cause of the low account balance was a reduction in the net asset value of shares. No CDSC will be imposed with respect to such involuntary redemptions.
While normally payments will be made in cash for redeemed shares, the Trust, subject to compliance with applicable regulations, has reserved the right to pay the redemption price of shares of a Fund, either totally or partially, by a distribution in kind of readily marketable securities. The securities so distributed would be valued pursuant to the valuation procedures described in this SAI. If a shareholder received a distribution in kind, the shareholder could incur brokerage or other charges in converting the securities to cash.
Systematic Withdrawal Plan. The transfer agent will send to the shareholder regular monthly or quarterly payments of any permitted amount designated by the shareholder based upon the value of the shares held. The checks will be drawn from share redemptions and hence, may require the recognition of taxable gain or loss. Income dividends and capital gains distributions in connection with withdrawal plan accounts will be credited at net asset value as of the record date for each distribution. Continued withdrawals in excess of current income will eventually use up principal, particularly in a period of declining market prices. A shareholder may not have a withdrawal plan in effect at the same time he or she has authorized Bank Automated Investing or is otherwise making regular purchases of Fund shares. The shareholder, the transfer agent or the principal underwriter may terminate the withdrawal plan at any time without penalty.
Other Information. A Fund’s net asset value per share is normally rounded to two decimal places. In certain situations (such as a merger, share split or a purchase or sale of shares that represents a significant portion of a share class), the administrator may determine to extend the calculation of the net asset value per share to additional decimal places to ensure that neither the value of the Fund nor a shareholder’s shares is diluted materially as the result of a purchase or sale or other transaction.
20
Dealer Commissions. The principal underwriter may, from time to time, at its own expense, provide additional incentives to investment dealers which employ registered representatives who sell Fund shares and/or shares of other funds distributed by the principal underwriter. In some instances, such additional incentives may be offered only to certain investment dealers whose representatives sell or are expected to sell significant amounts of shares. In addition, the principal underwriter may from time to time increase or decrease the sales commissions payable to investment dealers. The principal underwriter may allow, upon notice to all investment dealers with whom it has agreements, discounts up to the full sales charge during the periods specified in the notice. During periods when the discount includes the full sales charge, such investment dealers may be deemed to be underwriters as that term is defined in the Securities Act of 1933.
Sales Charge Waivers. Class A shares and Class I shares may be sold at net asset value to current and retired Directors and Trustees of Eaton Vance funds and portfolios; to clients (including custodial, agency, advisory and trust accounts) and current and retired officers and employees of Eaton Vance, its affiliates and other investment advisers and sub-advisers of Eaton Vance sponsored funds; and to such persons’ spouses, parents, siblings and lineal descendants and their beneficial accounts. Such shares may also be issued at net asset value (1) in connection with the merger (or similar transaction) of an investment company (or series or class thereof) or personal holding company with a Fund (or class thereof), (2) to investors making an investment as part of a fixed fee program whereby an entity unaffiliated with the investment adviser provides investment services, such as management, brokerage and custody, (3) to investment advisors, financial planners or other intermediaries who place trades for their own accounts or the accounts of their clients and who charge a management, consulting or similar ongoing fee for their services; clients of such investment advisors, financial planners or other intermediaries who place trades for their own accounts if the accounts are linked to the master account of such investment advisor, financial planner or other intermediary on the books and records of the broker or agent, (4) to officers and employees of the Fund custodian and the transfer agent and (5) in connection with the ReFlow liquidity program. Class A shares may also be sold at net asset value to registered representatives and employees of investment dealers. Class A shares and Class I shares are offered at net asset value to the foregoing persons and in the foregoing situations because either (i) there is no sales effort involved in the sale of shares or (ii) the investor is paying a fee (other than the sales charge) to the investment dealer involved in the sale. Any new or revised sale s charge or CDSC waiver will be prospective only.
Waiver of Investment Minimums. In addition to waivers described in the prospectus, minimum investment amounts are waived for current and retired Directors and Trustees of Eaton Vance funds and portfolios, clients (including custodial, agency, advisory and trust accounts), current and retired officers and employees of Eaton Vance, its affiliates and other investment advisers and sub-advisers of Eaton Vance sponsored funds, and for such persons’ spouses, parents, siblings and lineal descendants and their beneficial accounts. The minimum initial investment amount is also waived for officers and employees of a Fund’s custodian and transfer agent. Investments in the Fund by ReFlow in connection with the ReFlow liquidity program are also not subject to the minimum investment amount.
Statement of Intention. If it is anticipated that $25,000 or more of Class A shares and shares of other funds exchangeable for Class A shares of another Eaton Vance fund will be purchased within a 13-month period, the Statement of Intention section of the account application should be completed so that shares may be obtained at the same reduced sales charge as though the total quantity were invested in one lump sum. Shares eligible for the right of accumulation (see below) as of the date of the Statement and purchased during the 13-month period will be included toward the completion of the Statement. If you make a Statement of Intention, the transfer agent is authorized to hold in escrow sufficient shares (5% of the dollar amount specified in the Statement) which can be redeemed to make up any difference in sales charge on the amount intended to be invested and the amount actually invested. A Statement of Intention does not obligate the shareholder to purchase or the Fund to sell the ful l amount indicated in the Statement.
If the amount actually purchased during the 13-month period is less than that indicated in the Statement, the shareholder will be requested to pay the difference between the sales charge applicable to the shares purchased and the sales charge paid under the Statement of Intention. If the payment is not received in 20 days, the appropriate number of escrowed shares will be redeemed in order to realize such difference. If the total purchases during the 13-month period are large enough to qualify for a lower sales charge than that applicable to the amount specified in the Statement, all transactions will be computed at the expiration date of the Statement to give effect to the lower sales charge. Any difference will be refunded to the shareholder in cash or applied to the purchase of additional shares, as specified by the shareholder. This refund will be made by the investment dealer and the principal underwriter. If at the time of the recomputation, the investment dealer for the account has chang ed, the adjustment will be made only on those shares purchased through the current investment dealer for the account.
Right of Accumulation. Under the right of accumulation, the applicable sales charge level is calculated by aggregating the dollar amount of the current purchase and the value (calculated at the maximum current offering price) of any Class A,
21
Advisers Class, Class B, Class C, Class I and/or Class R shares of a Fund or other Eaton Vance funds, as well as shares of Eaton Vance Money Market Fund, owned by the shareholder. Shares of Eaton Vance Cash Management Fund and Eaton Vance Tax Free Reserves cannot be accumulated for purposes of this privilege. The sales charge on the shares being purchased will then be applied at the rate applicable to the aggregate. Share purchases eligible for the right of accumulation are described under "Sales Charges" in the prospectus. For any such discount to be made available at the time of purchase a purchaser or his or her investment dealer must provide the principal underwriter (in the case of a purchase made through an investment dealer) or the transfer agent (in the case of an investment made by mail) with sufficient information to permit verification that the purchase order qualifies for the accumulation privilege. Confirmation of the order is subject to such verification. The right of accumulation privilege may be amended or terminated at any time as to purchases occurring thereafter.
Conversion Feature. Class B shares held for eight years will automatically convert to Class A shares. For purposes of this conversion, all distributions paid on Class B shares which the shareholder elects to reinvest in Class B shares will be considered to be held in a separate sub-account. Upon the conversion of Class B shares not acquired through the reinvestment of distributions, a pro rata portion of the Class B shares held in the sub-account will also convert to Class A shares. This portion will be determined by the ratio that the Class B shares being converted bears to the total of Class B shares (excluding shares acquired through reinvestment) in the account. This conversion feature is subject to the continuing availability of a ruling from the Internal Revenue Service or an opinion of counsel that the conversion is not taxable for federal income tax purposes.
Exchange Privilege. In addition to exchanges into the same class of another Eaton Vance fund, Class B shares may be exchanged for shares of a money market fund sponsored by an investment dealer and approved by the principal underwriter (an “investment dealer fund”). The CDSC will not be charged to the shareholder when the shares are exchanged for shares of the investment dealer fund; however, the shareholder will receive no credit toward the completion of the CDSC period for the time that the shareholder holds the exchanged shares of the investment dealer fund. If a shareholder redeems the exchanged shares of the investment dealer fund and does not invest the proceeds into Class B shares of an Eaton Vance fund, the shareholder will be subject to any CDSC applicable at the time the shareholder received the exchanged shares of the investment dealer fund.
The Trust has in effect a compensation-type Distribution Plan (the “Class A Plan”) pursuant to Rule 12b-1 under the 1940 Act for Class A shares. The Class A Plan is designed to (i) finance activities which are primarily intended to result in the distribution and sales of Class A shares and to make payments in connection with the distribution of such shares and (ii) pay service fees for personal services and/or the maintenance of shareholder accounts to the principal underwriter, investment dealers and other persons. The distribution and service fees payable under the Class A Plan shall not exceed 0.25% of the average daily net assets attributable to Class A shares for any fiscal year. Class A distribution and service fees are paid quarterly in arrears. For the distribution and service fees paid by Class A shares, see Appendix A.
The Trust also has in effect compensation-type Distribution Plans (the “Class B and Class C Plans“) pursuant to Rule 12b-1 under the 1940 Act for each Fund’s Class B and Class C shares. On each sale of shares (excluding reinvestment of distributions) a Class will pay the principal underwriter amounts representing (i) sales commissions equal to 5% for Class B shares and 6.25% for Class C shares of the amount received by a Fund for each Class share sold and (ii) interest at the rate of 1% over the prime rate then reported in The Wall Street Journal applied to the outstanding amounts owed to the principal underwriter, so-called “uncovered distribution charges”. Each Class pays the principal underwriter a distribution fee, accrued daily and paid monthly, at an annual rate not exceeding 0.75% of its average daily net assets to finance the distribution of its shares. Such fees compensate the principal underwriter for the sales commissions paid by it to investmen t dealers on the sale of shares, for other distribution expenses (such as personnel, overhead, travel, printing and postage) and for interest expenses. The principal underwriter currently pays an up-front sales commission (except on exchange transactions and reinvestments) of 4% of the purchase price of Class B shares and 0.80% (0.75% for the California Fund) of the purchase price of Class C shares and an up-front service fee of 0.20% (0.25% for the California Fund) on Class C shares. Distribution fees paid by the Class and CDSCs paid to the Fund by redeeming Class shareholders reduce the outstanding uncovered distribution charges of the Class. Whenever there are no outstanding uncovered distribution charges of the Class, the Class discontinues payment of distribution fees.
The Trustees of the Trust believe that each Plan will be a significant factor in the expected growth of each Fund’s assets, and will result in increased investment flexibility and advantages which have benefitted and will continue to benefit the Fund and its shareholders. The Eaton Vance organization will profit by reason of the operation of each Class B and Class C Plan through an increase in Fund assets and if at any point in time the aggregate amounts received by the principal underwriter pursuant to the Plans and from CDSCs have exceeded the total expenses incurred in distributing Class B and Class C shares.
22
Because payments to the principal underwriter under the Class B and Class C Plans are limited, uncovered distribution charges (sales expenses of the principal underwriter plus interest, less the above fees and CDSCs received by it) may exist indefinitely. For sales commissions, CDSCs and uncovered distribution charges, see Appendix B and Appendix C.
The Class B and Class C Plans also authorize the payment of service fees to the principal underwriter, investment dealers and other persons in amounts not exceeding an annual rate of 0.25% of its average daily net assets for personal services, and/or the maintenance of shareholder accounts. For Class B, this fee is paid monthly in arrears based on the value of shares sold by such persons. For Class C, investment dealers currently receive (a) a service fee (except on exchange transactions and reinvestments) at the time of sale equal to 0.20% (0.25% for the California Fund) of the purchase price of Class C shares sold by such dealer, and (b) monthly service fees approximately equivalent to 1/12 of 0.20% (0.25% for the California Fund) of the value of Class C shares sold by such dealer. During the first year after a purchase of Class C shares, the principal underwriter will retain the service fee as reimbursement for the service fee payment made to investment dealers at the time of sale. For the s ervice fees paid, see Appendix B and Appendix C.
The Plans continue in effect from year to year so long as such continuance is approved at least annually by the vote of both a majority of (i) the noninterested Trustees of the Trust who have no direct or indirect financial interest in the operation of the Plan or any agreements related to the Plan (the “Plan Trustees”) and (ii) all of the Trustees then in office. Each Plan may be terminated at any time by vote of a majority of the Plan Trustees or by a vote of a majority of the outstanding voting securities of the applicable Class. Each Plan requires quarterly Trustee review of a written report of the amount expended under the Plan and the purposes for which such expenditures were made. The Plans may not be amended to increase materially the payments described therein without approval of the shareholders of the affected Class and the Trustees. So long as a Plan is in effect, the selection and nomination of the noninterested Trustees shall be committed to the discretion of such Truste es. The current Plans were initially approved by the Trustees, including the Plan Trustees, on June 23, 1997 (in the case of the Class C Plans on June16, 2003 for the California and New York Funds, on November 14, 2005 for the Florida, Ohio and Rhode Island Funds and on August 6, 2007 for the Mississippi and West Virginia Funds). The Trustees of the Trust who are “interested” persons of the Trust have an indirect financial interest in the Plans because their employers (or affiliates thereof) receive distribution and/or service fees under the Plans or agreements related thereto.
Performance Calculations. Average annual total return before deduction of taxes (“pre-tax return”) is determined by multiplying a hypothetical initial purchase order of $1,000 by the average annual compound rate of return (including capital appreciation/depreciation, and distributions paid and reinvested) for the stated period and annualizing the result. The calculation assumes (i) that all distributions are reinvested at net asset value on the reinvestment dates during the period, (ii) the deduction of the maximum of any initial sales charge from the initial $1,000 purchase, (iii) a complete redemption of the investment at the end of the period, and (iv) the deduction of any applicable CDSC at the end of the period.
Average annual total return after the deduction of taxes on distributions is calculated in the same manner as pre-tax return except the calculation assumes that any federal income taxes due on distributions are deducted from the distributions before they are reinvested. Average annual total return after the deduction of taxes on distributions and taxes on redemption also is calculated in the same manner as pre-tax return except the calculation assumes that (i) any federal income taxes due on distributions are deducted from the distributions before they are reinvested and (ii) any federal income taxes due upon redemption are deducted at the end of the period. After-tax returns are based on the highest federal income tax rates in effect for individual taxpayers as of the time of each assumed distribution and redemption (taking into account their tax character), and do not reflect the impact of state and local taxes. In calculating after-tax returns, the net value of any federal income tax credits available to shareholders is applied to reduce federal income taxes payable on distributions at or near year-end and, to the extent the net value of such credits exceeds such distributions, is then assumed to be reinvested in additional Fund shares at net asset value on the last day of the fiscal year in which the credit was generated or, in the case of certain tax credits, on the date on which the year-end distribution is paid. For pre-tax and after-tax total return information, see Appendix A, Appendix B, Appendix C and Appendix D.
In addition to the foregoing total return figures, each Fund may provide pre-tax and after-tax annual and cumulative total return, as well as the ending redeemable cash value of a hypothetical investment. If shares are subject to a sales charge, total return figures may be calculated based on reduced sales charges or at net asset value. These returns would be lower if the full sales charge was imposed. After-tax returns may also be calculated using different tax rate assumptions and taking into account state and local income taxes as well as federal taxes.
Yield is computed pursuant to a standardized formula by dividing the net investment income per share earned during a recent thirty-day period by the maximum offering price (including the maximum of any initial sales charge) per share on
23
the last day of the period and annualizing the resulting figure. Net investment income per share is calculated from the yields to maturity of all debt obligations held based on prescribed methods, reduced by accrued expenses for the period with the resulting number being divided by the average daily number of shares outstanding and entitled to receive distributions during the period. Yield figures do not reflect the deduction of any applicable CDSC, but assume the maximum of any initial sales charge. (Actual yield may be affected by variations in sales charges on investments.) A tax-equivalent yield is computed by using the tax-exempt yield and dividing by one minus a stated tax rate. The stated tax rate will reflect the federal income and certain state (if any) taxes applicable to investors in a particular tax bracket and may reflect certain assumptions relating to tax exemptions and deductions. The tax-equivalent yield will differ for investors in other tax brackets or for whom the assumed ex emptions and deductions are not available. Tax-equivalent yield is designed to show the approximate yield a taxable investment would have to earn to produce an after-tax yield equal to the tax-exempt yield.
Disclosure of Portfolio Holdings and Related Information. The Board of Trustees has adopted policies and procedures (the “Policies”) with respect to the disclosure of information about portfolio holdings of each Fund. Pursuant to the Policies, information about portfolio holdings of a Fund may not be disclosed to any party except as follows:
- Disclosure made in filings with the SEC and posted on the Eaton Vance website: In accordance with rules established by the SEC, each Fund sends semiannual and annual reports to shareholders that contain a complete list of portfolio holdings as of the end of the second and fourth fiscal quarters, respectively, within 60 days of quarter-end. The Fund also discloses complete portfolio holdings as of the end of the first and third fiscal quarters on Form N-Q, which is filed with the SEC within 60 days of quarter-end. The Fund’s complete portfolio holdings as reported in annual and semiannual reports and on Form N-Q are available for viewing on the SEC website at http:// www.sec.gov and may be reviewed and copied at the SEC’s public reference room (information on the operation and terms of usage of the SEC public reference room is available at http://www.sec.gov/info/edgar/prrrules.htm or by calling 1-800-SEC-0330). Generally within five business days of filing with the SEC, each Fund’s portfolio holdings as reported in annual and semiannual reports and on Form N-Q also are available on Eaton Vance’s website at www.eatonvance.com and are available upon request at no cost by contacting Eaton Vance at 1-800- 225-6265.
- Disclosure of certain portfolio characteristics: The Fund may also post information about certain portfolio characteristics (such as top ten holdings and asset allocation information) as of the most recent calendar quarter end on the Eaton Vance website approximately ten business days after the calendar quarter end. Such information is also available upon request by contacting Eaton Vance at 1-800-225-6265.
- Confidential disclosure for a legitimate Fund purpose: Portfolio holdings may be disclosed, from time to time as necessary, for a legitimate business purpose of a Fund, believed to be in the best interests of the Fund and its shareholders, provided there is a duty or an agreement that the information be kept confidential. Any such confidentiality agreement includes provisions intended to impose a duty not to trade on the non-public information. The Policies permit disclosure of portfolio holdings information to the following: 1) affiliated and unaffiliated service providers (including the investment adviser, custodian, transfer agent, principal underwriter, etc. described herein and in the prospectus) that have a legal or contractual duty to keep such information confidential; 2) other persons who owe a fiduciary or other duty of trust or confidence to the Fund (such as Fund legal counsel and independent registered public accounting firm); or 3) persons to whom the disclosure is made in advancemen t of a legitimate business purpose of a Fund and who have expressly agreed in writing to maintain the disclosed information in confidence and to use it only in connection with the legitimate business purpose underlying the arrangement. Such persons may include securities lending agents which may receive information from time to time regarding selected holdings which may be loaned by a Fund, credit rating agencies (such as Moody’s Investor Services, Inc. and Standard & Poor’s Ratings Group), statistical ratings agencies (such as Morningstar, Inc.), analytical service providers engaged by the investment adviser (such as Advent, Bloomberg L.P., Evare, Factset and The Yield Book, Inc.), proxy evaluation vendors (such as Institutional Shareholder Servicing Inc.), pricing services (such as LSTA/LPC Mark-to-Market Pricing Service, WM Company Reuters Information Services, Pricing Direct, State Street Derivatives Pricing Service, FT Interactive Data Corp. and
24
Standard & Poor’s Securities Evaluation Service, Inc.), which receive information as needed to price a particular holding, translation services, lenders under Fund credit facilities (such as Citibank, N.A.), consultants and, for purposes of facilitating portfolio transactions, investment dealers and other intermediaries (such as national and regional municipal bond dealers and mortgage-backed securities dealers). These entities receive portfolio information on an as needed basis in order to perform the service for which they are being engaged. If required in order to perform their duties, this information will be provided in real time or as soon as practical thereafter. Additional categories of disclosure involving a legitimate business purpose may be added to this list upon the authorization of a Fund’s Board of Trustees. In addition, in connection with a redemption in kind, the redeeming shareholder may be required to agree to keep the information about the securities to be so distributed confidential, except to the extent necessary to dispose of the securities.- Historical portfolio holdings information: From time to time, each Fund may be requested to provide historic portfolio holdings information. In such case, the requested information may be provided if: the information is requested for due diligence or another legitimate purpose; the requested portfolio holdings are for a period that is no more recent than the date of the portfolio holdings posted to the Eaton Vance website; a Fund’s portfolio manager and Eaton Vance’s Chief Equity or Chief Income Investment Officer (as appropriate) have reviewed the request and do not believe the dissemination of the information requested would disadvantage Fund shareholders; and the Chief Compliance Officer has reviewed the request to ensure that the disclosure of the requested information does not give rise to a conflict of interest between Fund shareholders and an affiliated service provider.
The Funds, the investment adviser and principal underwriter will not receive any monetary or other consideration in connection with the disclosure of information concerning a Fund’s portfolio holdings.
The Policies may not be waived, or exception made, without the consent of the Chief Compliance Officer (“CCO”) of the Funds. The CCO may not waive or make exception to the Policies unless such waiver or exception is consistent with the intent of the Policies, which is to ensure that disclosure of portfolio information is in the best interest of Fund shareholders. In determining whether to permit a waiver of or exception to the Policies, the CCO will consider whether the proposed disclosure serves a legitimate purpose of a Fund, whether it could provide the recipient with an advantage over Fund shareholders or whether the proposed disclosure gives rise to a conflict of interest between a Fund’s shareholders and its investment adviser, principal underwriter or other affiliated person. The CCO will report all waivers of or exceptions to the Policies to the Trustees at their next meeting. The Trustees may impose additional restrictions on the disclosure of portfolio holdings informat ion at any time.
The Policies are designed to provide useful information concerning a Fund to existing and prospective Fund shareholders while at the same time inhibiting the improper use of portfolio holdings information in trading Fund shares and/or portfolio securities held by a Fund. However, there can be no assurance that the provision of any portfolio holdings information is not susceptible to inappropriate uses (such as the development of “market timing” models), particularly in the hands of highly sophisticated investors, or that it will not in fact be used in such ways beyond the control of the Funds.
Each series of the Trust is treated as a separate entity for federal income tax purposes. The Fund has elected to be treated and intends to qualify each year as a regulated investment company (“RIC”) under Subchapter M of the Code. Accordingly, each Fund intends to satisfy certain requirements relating to sources of its income and diversification of its assets and to distribute substantially all of its net investment income (including tax-exempt income) and net short-term and long-term capital gains (after reduction by any available capital loss carryforwards) in accordance with the timing requirements imposed by the Code, so as to maintain its RIC status and to avoid paying any federal income tax. If a Fund qualifies for treatment as a RIC and satisfies the above-mentioned distribution requirements, a Fund will not be subject to federal income tax on income paid to its shareholders in the form of dividends or capital gain distributions. Each Fund qualified as a RIC for its fiscal yea r ended September 30, 2007. The Fund also seeks to avoid payment of federal excise tax. However, if a Fund fails to distribute in a calendar year substantially all of its ordinary income for such year and substantially all of its capital gain net income for the one-year period ending October 31 (or later if the Fund is permitted so to elect and so elects), plus any retained amount from the prior year, the Fund will be subject to a 4% excise tax on the undistributed amounts.
In order to avoid incurring a federal excise tax obligation, the Code requires that a Fund distribute (or be deemed to have distributed) by December 31 of each calendar year (i) at least 98% of its ordinary income (not including tax-exempt income) for such year, (ii) at least 98% of its capital gain net income (which is the excess of its realized capital gains over its realized capital losses), generally computed on the basis of the one-year period ending on October 31 of such year, after reduction by any available capital loss carryforwards and (iii) 100% of any income and capital gains from the prior year (as previously computed) that was not paid out during such year and on which the Fund paid no federal income tax. If a Fund
25
fails to meet these requirements it will be subject to a nondeductible 4% excise tax on the undistributed amounts. Under current law, provided that a Fund qualifies as a RIC for federal tax purposes, the Fund should not be liable for any income, corporate excise or franchise tax in the Commonwealth of Massachusetts.
If a Fund does not qualify as a RIC for any taxable year, the Fund’s taxable income will be subject to corporate income taxes, and all distributions from earnings and profits, including distributions of net capital gain (if any), will be taxable to the shareholder as ordinary income. However, such distributions will be eligible (i) to be treated as qualified dividend income in the case of shareholders taxed as individuals and (ii) for the dividends received deduction in the case of corporate shareholders. In addition, in order to requalify for taxation as a RIC, the Fund may be required to recognize unrealized gains, pay substantial taxes and interest, and make substantial distributions.
Fund’s investment in zero coupon and certain other securities will cause it to realize income prior to the receipt of cash payments with respect to these securities. Such income will be accrued daily by the Fund and, in order to avoid a tax payable by the Fund, the Fund may be required to liquidate securities that it might otherwise have continued to hold in order to generate cash so that the Fund may make required distributions to its shareholders.
A Fund may invest to a significant extent in debt obligations that are in the lowest rating categories or are unrated, including debt obligations of issuers not currently paying interest or who are in default. Investments in debt obligations that are at risk of or in default present special tax issues for a Fund. Tax rules are not entirely clear about issues such as when a Fund may cease to accrue interest, original issue discount or market discount, when and to what extent deductions may be taken for bad debts or worthless securities and how payments received on obligations in default should be allocated between principal and income.
Distributions by a Fund of net tax-exempt interest income that are properly designated as “exempt-interest dividends” may be treated by shareholders as interest excludable from gross income for federal income tax purposes under Section 103(a) of the Code. In order for a Fund to be entitled to pay the tax-exempt interest income as exempt-interest dividends to its shareholders, the Fund must and intends to satisfy certain requirements, including the requirement that, at the close of each quarter of its taxable year, at least 50% of the value of its total assets consists of obligations the interest on which is exempt from regular federal income tax under Code Section 103(a). Interest on certain municipal obligations may be taxable for purposes of the federal AMT and for state and local purposes. In addition, corporate shareholders must include the full amount of exempt-interest dividends in computing the preference items for the purposes of the AMT. Shareholders of a Fund are required to report tax-exempt interest on their federal income tax returns.
For taxable years beginning on or before December 31, 2010, distributions of investment income designated by a Fund as derived from “qualified dividend income” will be taxed in the hands of individual shareholders at the rates applicable to long-term capital gains, provided holding period and other requirements are met at both the shareholder and Fund level. It is not expected a significant portion of Fund distributions would be derived from qualified dividend income.
Tax-exempt distributions received from a Fund are taken into account in determining, and may increase, the portion of social security and certain railroad retirement benefits that may be subject to federal income tax.
Interest on indebtedness incurred or continued by a shareholder to purchase or carry shares of a Fund is not deductible to the extent it is deemed related to the Fund’s distributions of tax-exempt interest. Further, entities or persons who are “substantial users” (or persons related to “substantial users”) of facilities financed by industrial development or private activity bonds should consult their tax advisers before purchasing shares of a Fund. “Substantial user” is defined in applicable Treasury regulations to include a “non-exempt person” who regularly uses in its trade or business a part of a facility financed from the proceeds of industrial development bonds, and the same definition should apply in the case of private activity bonds.
Any recognized gain or income attributable to market discount on long-term tax-exempt municipal obligations (i.e., obligations with a term of more than one year) purchased after April 30, 1993 (except to the extent of a portion of the discount attributable to original issue discount), is taxable as ordinary income. A long-term debt obligation is generally treated as acquired at a market discount if purchased after its original issue at a price less than (i) the stated principal amount payable at maturity, in the case of an obligation that does not have original issue discount or (ii) in the case of an obligation that does have original issue discount, the sum of the issue price and any original issue discount that accrued before the obligation was purchased, subject to a de minimis exclusion.
From time to time proposals have been introduced before Congress for the purpose of restricting or eliminating the federal income tax exemption for interest on certain types of municipal obligations, and it can be expected that similar proposals may be introduced in the future. Under federal tax legislation enacted in 1986, the federal income tax exemption for interest on certain municipal obligations was eliminated or restricted. As a result of any such future legislation, the
26
availability of municipal obligations for investment by a Fund and the value of the securities held by it may be affected. It is possible that events occurring after the date of issuance of municipal obligations, or after a Fund’s acquisition of such an obligation, may result in a determination that the interest paid on that obligation is taxable, even retroactively.
In the course of managing its investments, a Fund may realize some short-term and long-term capital gains (and/or losses) as well as other taxable income. Any distributions by a Fund of its share of such capital gains (after reduction by any capital loss carryforwards) or other taxable income would be taxable to shareholders of the Fund. However, it is expected that such amounts, if any, would normally be insubstantial in relation to the tax-exempt interest earned by the Fund.
In January 2006, the Kentucky Court of Appeals held, in Davis v. Department of Revenue, that the state’s exemption of interest on its own bonds and those of its political subdivisions and its taxation of interest on the bonds of other states and their political subdivisions unlawfully discriminates against interstate commerce. The Kentucky Supreme Court declined to review this decision. In May 2007, the U.S. Supreme Court granted Kentucky’s petition to review the Davis decision and oral arguments were heard on November 5, 2007. The Court is expected to issue a ruling by the end of its current term in June 2008. In 1994, the Ohio Court of Appeals had reached the opposite conclusion on this legal issue, upholding a similar Ohio statute, in Shaper v. Tracy.
If the U.S. Supreme Court affirms the Davis decision in Kentucky, other states’ current tax treatment of their own state and local government bonds may also be challenged. With only a few exceptions, every state besides Kentucky that imposes an income tax likewise exempts from taxation the interest on bonds issued by the state and its political subdivisions (“instate municipal bonds”) while taxing the interest on bonds issued by other states and their political subdivisions (“out-of-state municipal bonds”). If the U.S. Supreme Court affirms the decision of the Kentucky court in the Davis case, and the U.S. Congress does not exercise its power under the Commerce Clause of the U.S. Constitution to enact legislation allowing states to tax the interest on out-of-state municipal bonds while exempting from taxation the interest on in-state municipal bonds, these states would need to either extend the same tax exemption to out-of-state municipal bonds or begin ta xing the interest on in-state municipal bonds as well as out-of-state municipal bonds. If a state begins to tax the interest on all municipal bonds, in-state as well as out-of-state, the result would be a decline in the value of all in-state municipal bonds held by taxpayers of that state, either directly or indirectly through ownership of shares in a Fund.
A Fund’s investments in options, futures contracts, hedging transactions, forward contracts (to the extent permitted) and certain other transactions will be subject to special tax rules (including mark-to-market, constructive sale, straddle, wash sale, short sale and other rules), the effect of which may be to accelerate income to a Fund, defer Fund losses, cause adjustments in the holding periods of Fund securities, convert capital gain into ordinary income and convert short-term capital losses into long-term capital losses. These rules could therefore affect the amount, timing and character of distributions to investors.
As a result of entering into swap contracts, a Fund may make or receive periodic net payments. A Fund may also make or receive a payment when a swap is terminated prior to maturity through an assignment of the swap or other closing transaction. Periodic net payments will generally constitute ordinary income or deductions, while termination of a swap will generally result in capital gain or loss (which will be a long-term capital gain or loss if a Fund has been a party to a swap for more than one year). The tax treatment of many types of credit default swaps is uncertain.
Any loss realized upon the sale or exchange of Fund shares with a tax holding period of six months or less will be disallowed to the extent of any distributions treated as tax-exempt interest with respect to such shares and if the loss exceeds the disallowed amount, will be treated as a long-term capital loss to the extent of any distributions treated as long-term capital gain with respect to such shares. In addition, all or a portion of a loss realized on a redemption or other disposition of Fund shares may be disallowed under “wash sale” rules to the extent the shareholder acquired other shares of the same Fund (whether through the reinvestment of distributions or otherwise) within the period beginning 30 days before the redemption of the loss shares and ending 30 days after such date. Any disallowed loss will result in an adjustment to the shareholder’s tax basis in some or all of the other shares acquired.
Sales charges paid upon a purchase of shares subject to a front-end sales charge cannot be taken into account for purposes of determining gain or loss on a redemption or exchange of the shares before the 91st day after their purchase to the extent a sales charge is reduced or eliminated in a subsequent acquisition of Fund shares (or shares of another fund) pursuant to the reinvestment or exchange privilege. Any disregarded amounts will result in an adjustment to the shareholder’s tax basis in some or all of any other shares acquired.
Dividends and distributions on a Fund’s shares are generally subject to federal income tax as described herein to the extent they do not exceed the Fund’s realized income and gains, even though such dividends and distributions may economically represent a return of a particular shareholder’s investment. Such distributions are likely to occur in respect of shares purchased at a time when the Fund’s net asset value reflects gains that are either unrealized, or realized but not distributed.
27
Such realized gains may be required to be distributed even when a Fund’s net asset value also reflects unrealized losses. Certain distributions declared in October, November or December and paid in the following January will be taxed to shareholders as if received on December 31 of the year in which they were declared.
In general, dividends (other than capital gain dividends and exempt-interest dividends) paid to a shareholder that is not a “U.S. person” within the meaning of the Code (a “foreign person”), are subject to withholding of U.S. federal income tax at a rate of 30% (or lower applicable treaty rate). For taxable years beginning before January 1, 2008, a Fund generally will not be required to withhold any amounts with respect to distributions of (i) U.S.-source interest income that would not be subject to U.S. federal income tax if earned directly by an individual foreign person, and (ii) net short-term capital gains in excess of net long-term capital losses, in each case to the extent such distributions are properly designated by a Fund.
Until December 31, 2007, if a Fund makes a distribution to a foreign shareholder that is attributable to interests in U.S. real property or in corporations for which direct or indirect interests in U.S. real property exceed certain levels and if such foreign shareholder owned more than 5% of a Fund’s outstanding shares at any time during the preceding one year, the distribution will be subject to a 35% withholding tax and will obligate such foreign shareholder to file a U.S. tax return. If a foreign person who owned more than 5% of a Fund’s outstanding shares at any time during the preceding one year redeems shares of the Fund within the 30 days prior to an ex-dividend date of a distribution subject to the 35% tax and within 30 days before or after the ex-dividend date acquires or contracts to acquire a substantially identical interest in the Fund, such foreign person may be subject to the 35% tax and a U.S. filing requirement. After December 31, 2007, these rules apply only to Fund d istributions attributable to distributions received by a Fund from real estate investment trusts.
If a Fund’s direct or indirect interests in U.S. real property were to exceed certain levels, a foreign shareholder realizing gains upon redemption from a Fund could be subject to the 35% withholding tax and U.S. filing requirements unless more than 50% of the Fund’s shares were owned by U.S. persons at such time or unless the foreign person had not held more than 5% of the Fund’s outstanding shares throughout either such person’s holding period for the redeemed shares or, if shorter, the previous five years. It is not expected that a significant portion of the Fund’s distributions will be attributable to gains from sale or exchange of U.S. real property interests.
Amounts paid by a Fund to individuals and certain other shareholders who have not provided the Fund with their correct taxpayer identification number (“TIN”) and certain certifications required by the Internal Revenue Service (the “IRS”) as well as shareholders with respect to whom the Fund has received certain information from the IRS or a broker, may be subject to “backup” withholding of federal income tax arising from the Fund’s taxable dividends and other distributions as well as the proceeds of redemption transactions (including repurchases and exchanges), at a rate of 28% for amounts paid through 2010. The backup withholding rate will be 31% for amounts paid thereafter. An individual’s TIN is generally his or her social security number. Backup withholding is not an additional tax and any amount withheld may be credited against a shareholder’s U.S. federal income tax liability.
Under Treasury regulations, if a shareholder realizes a loss on disposition of a Fund’s shares of $2 million or more for an individual shareholder or $10 million or more for a corporate shareholder, the shareholder must file with the IRS a disclosure statement on Form 8886. Direct shareholders of portfolio securities are in many cases excepted from this reporting requirement, but under current guidance, shareholders of a RIC are not excepted. The fact that a loss is reportable under these regulations does not affect the legal determination of whether the taxpayer’s treatment of the loss is proper. Shareholders should consult their tax advisors to determine the applicability of these regulations in light of their individual circumstances. Under recently enacted legislation, certain tax-exempt entities and their managers may be subject to excise tax if they are parties to certain reportable transactions.
The foregoing discussion does not address the special tax rules applicable to certain classes of investors, such as tax-exempt entities, foreign investors, insurance companies and financial institutions. Shareholders should consult their own tax advisers with respect to special tax rules that may apply in their particular situations, as well as the federal, state, local, and, where applicable, foreign tax consequences of investing in a Fund.
| See Appendix E for state tax information for certain states. |
| PORTFOLIO SECURITIES TRANSACTIONS |
Decisions concerning the execution of portfolio security transactions, including the selection of the market and the executing firm, are made by BMR, each Fund’s investment adviser. Each Fund is responsible for the expenses associated with portfolio transactions. The investment adviser is also responsible for the execution of transactions for all other accounts managed by it. The investment adviser places the portfolio security transactions for execution with many firms. The investment adviser uses its best efforts to obtain execution of portfolio security transactions at prices which are
28
advantageous and at reasonably competitive spreads or (when a disclosed commission is being charged) at reasonably competitive commission rates. In seeking such execution, the investment adviser will use its best judgment in evaluating the terms of a transaction, and will give consideration to various relevant factors, including without limitation the full range and quality of the executing firm’s services including the responsiveness of the firm to the investment adviser, the size and type of the transaction, the nature and character of the market for the security, the confidentiality, speed and certainty of effective execution required for the transaction, the general execution and operational capabilities of the executing firm, the reputation, reliability, experience and financial condition of the firm, the value and quality of the services rendered by the firm in other transactions, and the reasonableness of the spread or commission, if any. In addition, the investment adviser may cons ider the receipt of Proprietary Research Services (as defined below), provided it does not compromise the investment adviser’s obligation to seek best overall execution for a Fund. The investment adviser may engage in portfolio brokerage transactions with a broker-dealer firm that sells shares of Eaton Vance funds, provided such transactions are not directed to that firm as compensation for the promotion or sale of such shares.
Municipal obligations, including state obligations, purchased and sold by each Fund are generally traded in the over-the-counter market on a net basis (i.e., without commission) through broker-dealers and banks acting for their own account rather than as brokers, or otherwise involve transactions directly with the issuer of such obligations. Such firms attempt to profit from such transactions by buying at the bid price and selling at the higher asked price of the market for such obligations, and the difference between the bid and asked price is customarily referred to as the spread. The Fund may also purchase municipal obligations from underwriters, and dealers in fixed-price offerings, the cost of which may include undisclosed fees and concessions to the underwriters. On occasion it may be necessary or appropriate to purchase or sell a security through a broker on an agency basis, in which case the Fund will incur a brokerage commission. Although spreads or commissions on portfolio secu rity transactions will, in the judgment of the investment adviser, be reasonable in relation to the value of the services provided, spreads or commissions exceeding those which another firm might charge may be paid to firms who were selected to execute transactions on behalf of each Fund and the investment adviser’s other clients for providing brokerage and research services to the investment adviser.
As authorized in Section 28(e) of the Securities Exchange Act of 1934, as amended, a broker or dealer who executes a portfolio transaction may receive a commission that is in excess of the amount of commission another broker or dealer would have charged for effecting that transaction if the investment adviser determines in good faith that such compensation was reasonable in relation to the value of the brokerage and research services provided. This determination may be made either on the basis of that particular transaction or on the basis of overall responsibilities which the investment adviser and its affiliates have for accounts over which they exercise investment discretion. Brokerage and research services may include advice as to the value of securities, the advisability of investing in, purchasing, or selling securities, and the availability of securities or purchasers or sellers of securities; furnishing analyses and reports concerning issuers, industries, securities, economic factors an d trends, portfolio strategy and the performance of accounts; effecting securities transactions and performing functions incidental thereto (such as clearance and settlement); and the “Research Services” referred to in the next paragraph. The investment adviser may also receive Research Services from underwriters and dealers in fixed-price offerings.
It is a common practice of the investment advisory industry and of the advisers of investment companies, institutions and other investors to receive research, analytical, statistical and quotation services, data, information and other services, products and materials which assist such advisers in the performance of their investment responsibilities (“Research Services”) from broker-dealer firms that execute portfolio transactions for the clients of such advisers and from affiliates of executing broker-dealers. Investment advisers also commonly receive Research Services from research providers that are not affiliated with an executing broker-dealer, but which have entered into payment arrangements involving an executing broker-dealer (“Third Party Research Services”). In a typical Third Party Research Services arrangement involving transactions in municipal obligations, an executing broker-dealer enters into an arrangement with an investment adviser pursuant to which the inve stment adviser receives a credit for portfolio transactions executed for its clients through that broker-dealer. These credits are referred to herein as “research credits” and are primarily generated as the result of acquisitions of new issuances of municipal obligations in fixed-price offerings. The amount of the research credit generated as the result of a particular transaction is typically a negotiated percentage of the offering price of the municipal obligations. The investment adviser may use research credits to acquire Third Party Research Services, which are then paid for by the executing broker-dealer. The investment adviser may receive Research Services and Third Party Research Services consistent with the foregoing.
Research Services received by the investment adviser may include, but are not limited to, such matters as general economic, political, business and market information, industry and company reviews, evaluations of securities and portfolio strategies and transactions, certain proxy voting data and analysis services, technical analysis of various aspects of the securities markets, recommendations as to the purchase and sale of securities and other portfolio transactions, certain financial,
29
industry and trade publications, news and information services, certain pricing and quotation equipment and services, and certain research oriented computer software, data bases and services. Any particular Research Service obtained through a broker-dealer may be used by the investment adviser in connection with client accounts other than those accounts which pay commissions to such broker-dealer. Any such Research Service may be broadly useful and of value to the investment adviser in rendering investment advisory services to all or a significant portion of its clients, or may be relevant and useful for the management of only one client’s account or of a few clients’ accounts, or may be useful for the management of merely a segment of certain clients’ accounts, regardless of whether any such account or accounts paid commissions to the broker-dealer through which such Research Service was obtained. The investment adviser evaluates the nature and quality of the various Research Se rvices obtained through broker-dealer firms and may attempt to allocate sufficient portfolio security transactions to such firms to ensure the continued receipt of Research Services which the investment adviser believes are useful or of value to it in rendering investment advisory services to its clients.
Since May 1, 2004, the investment adviser uses research credits generated from a Fund securities transactions to pay for Third Party Research Services (as described above), the investment adviser has agreed to reduce the advisory fee payable by a Fund by the amount of such research credits. However, the investment adviser generally does not expect to acquire Third Party Research Services with research credits.
Some executing broker-dealers develop and make available directly to their brokerage customers proprietary Research Services (“Proprietary Research Services”). As a general matter, broker-dealers bundle the cost of Proprietary Research Services with trade execution services rather than charging separately for each. In such circumstances, the cost or other value of the Proprietary Research Services cannot be determined. The advisory fee paid by a Fund will not be reduced in connection with the receipt of Proprietary Research Services by the investment adviser.
The investment companies sponsored by the investment adviser or its affiliates may allocate trades in such offerings to acquire information relating to the performance, fees and expenses of such companies and other mutual funds, which information is used by the Trustees of such companies to fulfill their responsibility to oversee the quality of the services provided by various entities, including the investment adviser, to such companies. Such companies may also pay cash for such information.
Municipal obligations considered as investments for a Fund may also be appropriate for other investment accounts managed by the investment adviser or its affiliates. Whenever decisions are made to buy or sell securities by a Fund and one or more of such other accounts simultaneously, the investment adviser will allocate the security transactions (including “hot” issues) in a manner which it believes to be equitable under the circumstances. As a result of such allocations, there may be instances where a Fund will not participate in a transaction that is allocated among other accounts. If an aggregated order cannot be filled completely, allocations will generally be made on a pro rata basis. An order may not be allocated on a pro rata basis where, for example: (i) consideration is given to portfolio managers who have been instrumental in developing or negotiating a particular investment; (ii) consideration is given to an account with specialized investment policies that coincide with th e particulars of a specific investment; (iii) pro rata allocation would result in odd-lot or de minimis amounts being allocated to a portfolio or other client; or (iv) where the investment adviser reasonably determines that departure from a pro rata allocation is advisable. While these aggregation and allocation policies could have a detrimental effect on the price or amount of the securities available to a Fund from time to time, it is the opinion of the Trustees of the Trust that the benefits from the investment adviser organization outweigh any disadvantage that may arise from exposure to simultaneous transactions.
30
The following table shows brokerage commissions paid during the three fiscal years ended September 30, 2007, as well as the amount of Fund security transactions for the most recent fiscal year (if any) that were directed to firms that provided some Research Services to the investment adviser or its affiliates, and the commissions paid in connection therewith. As described above, the investment adviser may consider the receipt of Research Services in selecting a broker-dealer firm, provided it does not compromise the investment adviser’s obligation to seek best overall execution.
| | | | | | | | | | | Commissions Paid on |
| | | | | | | | | Amount of Transactions | | Transactions |
| | | | | | | | | Directed to Firms | | Directed to Firms |
| | | Brokerage Commissions Paid for the Fiscal Year Ended | | Providing Research | | Providing Research |
| Fund | | 9/30/07 | | 9/30/06 | | 9/30/05 | | 9/30/07 | | 9/30/07 |
| California | | $14,470 | | $21,280 | | $22,916 | | $0 | | $0 |
| Florida | | 15,112 | | 27,808 | | 29,410 | | 0 | | 0 |
| Massachusetts | | 23,215 | | 25,883 | | 23,690 | | 0 | | 0 |
| Mississippi | | 548 | | 1,492 | | 1,105 | | 0 | | 0 |
| New York | | 27,510 | | 34,485 | | 43,992 | | 0 | | 0 |
| Ohio | | 11,208 | | 10,107 | | 8,713 | | 0 | | 0 |
| Rhode Island | | 2,967 | | 5,100 | | 5,534 | | 0 | | 0 |
| West Virginia | | 2,615 | | 2,933 | | 3,039 | | 0 | | 0 |
As of September 30, 2007, each Fund held no securities of its “regular brokers or dealers”, as that term is defined in Rule 10b-1 of the 1940 Act.
The audited financial statements of, and the report of the independent registered public accounting firm for the Funds, appear in the Funds’ most recent annual report to shareholders and are incorporated by reference into this SAI. A copy of the annual report accompanies this SAI.
Householding. Consistent with applicable law, duplicate mailings of shareholder reports and certain other Fund information to shareholders residing at the same address may be eliminated.
31
| Class A Fees, Performance & Ownership |
Sales Charges and Distribution and Service Fees. For the fiscal year ended September 30, 2007, the following table shows (1) total sales charges paid by each Fund, (2) sales charges paid to investment dealers, (3) sales charges paid to the principal underwriter, (4) CDSC payments to the principal underwriter, (5) total distribution and service fees paid by each Fund, and (6) distribution and service fees paid to investment dealers. Distribution and service fees that were not paid to investment dealers were retained by the principal underwriter.
| | | | | | | | | CDSC to | | | | Distribution and |
| | | Total Sales | | Sales Charges to | | Sales Charges to | | Principal | | Total Distribution | | Service Fees Paid to |
| Fund | | Charges Paid | | Investment Dealers | | Principal Underwriter | | Underwriter | | and Service Fees Paid | | Investment Dealers |
| California | | $ 612,453 | | $ 591,833 | | $20,620 | | $19,000 | | $611,697 | | $467,802 |
| Florida | | 316,659 | | 298,764 | | 17,895 | | 8,000 | | 445,654 | | 345,210 |
| Massachusetts | | 1,384,593 | | 1,312,460 | | 71,133 | | 3,000 | | 422,164 | | 285,594 |
| Mississippi | | 39,351 | | 37,444 | | 1,907 | | 0 | | 30,136 | | 23,898 |
| New York | | 978,721 | | 932,249 | | 46,472 | | 11,000 | | 801,204 | | 620,964 |
| Ohio | | 2,108,807 | | 1,998,940 | | 109,867 | | 21,000 | | 419,409 | | 265,192 |
| Rhode Island | | 202,977 | | 194,009 | | 8,968 | | 500 | | 81,478 | | 57,193 |
| West Virginia | | 159,329 | | 149,244 | | 10,085 | | 2,000 | | 47,959 | | 39,167 |
For the fiscal years ended September 30, 2006 and September 30, 2005, the following total sales charges were paid on sales of Class A, of which the principal underwriter received the following amounts. The balance of such amounts was paid to investment dealers.
| | | September 30, 2006 | | September 30, 2006 | | September 30, 2005 | | September 30, 2005 |
| | | Total Sales | | Sales Charges to | | Total Sales | | Sales Charges to |
| Fund | | Charges Paid | | Principal Underwriter | | Charges Paid | | Principal Underwriter |
| California | | $419,449 | | $21,213 | | $393,092 | | $30,481 |
| Florida | | 566,524 | | 26,506 | | 342,335 | | 18,575 |
| Massachusetts | | 660,903 | | 33,855 | | 471,225 | | 24,334 |
| Mississippi | | 62,430 | | 2,663 | | 52,015 | | 2,741 |
| New York | | 905,676 | | 38,326 | | 860,013 | | 59,210 |
| Ohio | | 977,208 | | 51,631 | | 533,534 | | 31,486 |
| Rhode Island | | 110,312 | | 5,066 | | 124,881 | | 6,350 |
| West Virginia | | 96,131 | | 5,330 | | 119,183 | | 5,866 |
Performance Information. The tables below indicate the average annual total return (both before and after taxes) on a hypothetical investment of $1,000 in this Class of shares for the periods shown in each table. Any performance presented with an asterisk (*) includes the effect of subsidizing expenses. Performance would have been lower without subsidies.
Total returns are historical and are calculated by determining the percentage change in net asset value or public offering price with all distributions reinvested. The Fund’s past performance (both before and after taxes) is no guarantee of future results. Investment return and principal value of Fund shares will fluctuate so that shares, when redeemed, may be worth more or less than their original cost. Performance is for the stated time period only; due to market volatility, a Fund’s current performance may be lower or higher than the quoted return. For the Fund’s performance as of the most recent month-end, please refer to www.eatonvance.com.
About Returns After Taxes. After-tax returns are calculated using certain assumptions. After-tax returns are calculated using the highest historical individual federal income tax rates and do not reflect the impact of state and local taxes. Actual after-tax returns depend on a shareholder’s tax situation and the actual characterization of distributions, and may differ from those shown. After-tax returns are not relevant to shareholders who hold shares in tax-deferred accounts or to shares held by non-taxable entities. Return After Taxes on Distributions for a period may be the same as Return Before Taxes for that period because no taxable distributions were made during that period, or because the taxable portion of distributions made during the period was insignificant. Also, Return After Taxes on Distributions and Redemption of Fund Shares for a period may be greater than or equal to Return After Taxes on Distributions for the same period because of losses realized on the
32
sale of Fund shares. A portion of the distributions made in the current year may be recharacterized as taxable after year-end.
| California Fund | | Length of Period Ended September 30, 2007 |
| Average Annual Total Return: | | One Year | | Five Years | | Ten Years |
| Before Taxes and Excluding Maximum Sales Charge | | 1.61% | | 3.86% | | 4.91% |
| Before Taxes and Including Maximum Sales Charge | | –3.19% | | 2.86% | | 4.40% |
| After Taxes on Distributions and Excluding Maximum Sales Charge | | 1.37% | | 3.80% | | 4.86% |
| After Taxes on Distributions and Including Maximum Sales Charge | | –3.42% | | 2.80% | | 4.36% |
| After Taxes on Distributions and Redemption and Excluding Maximum Sales Charge | | 2.87% | | 3.97% | | 4.90% |
| After Taxes on Distributions and Redemption and Including Maximum Sales Charge | | –0.34% | | 3.09% | | 4.44% |
| |
| Florida Fund | | Length of Period Ended September 30, 2007 |
| Average Annual Total Return: | | One Year | | Five Years | | Ten Years |
| Before Taxes and Excluding Maximum Sales Charge | | 2.23% | | 4.20% | | 5.15% |
| Before Taxes and Including Maximum Sales Charge | | –2.63% | | 3.18% | | 4.64% |
| After Taxes on Distributions and Excluding Maximum Sales Charge | | 2.23% | | 4.20% | | 5.13% |
| After Taxes on Distributions and Including Maximum Sales Charge | | –-2.64% | | 3.18% | | 4.62% |
| After Taxes on Distributions and Redemption and Excluding Maximum Sales Charge | | 3.03% | | 4.29% | | 5.14% |
| After Taxes on Distributions and Redemption and Including Maximum Sales Charge | | –0.21% | | 3.40% | | 4.68% |
| |
| Massachusetts Fund | | Length of Period Ended September 30, 2007 |
| Average Annual Total Return: | | One Year | | Five Years | | Ten Years |
| Before Taxes and Excluding Maximum Sales Charge | | 0.57% | | 4.02% | | 4.97% |
| Before Taxes and Including Maximum Sales Charge | | –4.20% | | 3.01% | | 4.46% |
| After Taxes on Distributions and Excluding Maximum Sales Charge | | 0.57% | | 4.01% | | 4.96% |
| After Taxes on Distributions and Including Maximum Sales Charge | | –4.20% | | 3.01% | | 4.45% |
| After Taxes on Distributions and Redemption and Excluding Maximum Sales Charge | | 1.89% | | 4.13% | | 4.98% |
| After Taxes on Distributions and Redemption and Including Maximum Sales Charge | | –1.28% | | 3.25% | | 4.51% |
| |
| Mississippi Fund | | Length of Period Ended September 30, 2007 |
| Average Annual Total Return: | | One Year | | Five Years | | Ten Years |
| Before Taxes and Excluding Maximum Sales Charge | | 2.67% | | 3.62% | | 4.61% |
| Before Taxes and Including Maximum Sales Charge | | –2.18% | | 2.61% | | 4.10% |
| After Taxes on Distributions and Excluding Maximum Sales Charge | | 2.66% | | 3.60% | | 4.60% |
| After Taxes on Distributions and Including Maximum Sales Charge | | –2.19% | | 2.60% | | 4.09% |
| After Taxes on Distributions and Redemption and Excluding Maximum Sales Charge | | 3.21% | | 3.74% | | 4.63% |
| After Taxes on Distributions and Redemption and Including Maximum Sales Charge | | –0.01% | | 2.86% | | 4.17% |
33
| New York Fund | | Length of Period Ended September 30, 2007 |
| Average Annual Total Return: | | One Year | | Five Years | | Ten Years |
| Before Taxes and Excluding Maximum Sales Charge | | 1.50% | | 3.96% | | 5.30% |
| Before Taxes and Including Maximum Sales Charge | | –3.35% | | 2.96% | | 4.79% |
| After Taxes on Distributions and Excluding Maximum Sales Charge | | 1.42% | | 3.89% | | 5.21% |
| After Taxes on Distributions and Including Maximum Sales Charge | | –3.43% | | 2.89% | | 4.71% |
| After Taxes on Distributions and Redemption and Excluding Maximum Sales Charge | | 2.59% | | 4.07% | | 5.24% |
| After Taxes on Distributions and Redemption and Including Maximum Sales Charge | | –0.64% | | 3.20% | | 4.78% |
| |
| Ohio Fund | | Length of Period Ended September 30, 2007 |
| Average Annual Total Return: | | One Year | | Five Years | | Ten Years |
| Before Taxes and Excluding Maximum Sales Charge | | 1.98% | | 4.91% | | 4.93% |
| Before Taxes and Including Maximum Sales Charge | | –2.85% | | 3.91% | | 4.43% |
| After Taxes on Distributions and Excluding Maximum Sales Charge | | 1.98% | | 4.91% | | 4.93% |
| After Taxes on Distributions and Including Maximum Sales Charge | | –2.85% | | 3.91% | | 4.42% |
| After Taxes on Distributions and Redemption and Excluding Maximum Sales Charge | | 2.78% | | 4.93% | | 4.98% |
| After Taxes on Distributions and Redemption and Including Maximum Sales Charge | | –0.43% | | 4.04% | | 4.52% |
| |
| Rhode Island Fund | | Length of Period Ended September 30, 2007 |
| Average Annual Total Return: | | One Year | | Five Years* | | Ten Years |
| Before Taxes and Excluding Maximum Sales Charge | | 1.91% | | 3.85% | | 4.88% |
| Before Taxes and Including Maximum Sales Charge | | –2.92% | | 2.85% | | 4.37% |
| After Taxes on Distributions and Excluding Maximum Sales Charge | | 1.90% | | 3.85% | | 4.87% |
| After Taxes on Distributions and Including Maximum Sales Charge | | –2.92% | | 2.84% | | 4.36% |
| After Taxes on Distributions and Redemption and Excluding Maximum Sales Charge | | 2.70% | | 3.95% | | 4.87% |
| After Taxes on Distributions and Redemption and Including Maximum Sales Charge | | –0.50% | | 3.07% | | 4.41% |
| |
| West Virginia Fund | | Length of Period Ended September 30, 2007 |
| Average Annual Total Return: | | One Year | | Five Years | | Ten Years |
| Before Taxes and Excluding Maximum Sales Charge | | 2.26% | | 3.57% | | 4.68% |
| Before Taxes and Including Maximum Sales Charge | | –2.58% | | 2.56% | | 4.17% |
| After Taxes on Distributions and Excluding Maximum Sales Charge | | 2.26% | | 3.56% | | 4.67% |
| After Taxes on Distributions and Including Maximum Sales Charge | | –2.58% | | 2.55% | | 4.16% |
| After Taxes on Distributions and Redemption and Excluding Maximum Sales Charge | | 2.92% | | 3.68% | | 4.68% |
| After Taxes on Distributions and Redemption and Including Maximum Sales Charge | | –0.29% | | 2.80% | | 4.22% |
Control Persons and Principal Holders of Securities. At November 1, 2007, the Trustees and officers of the Trust, as a group, owned in the aggregate less than 1% of the outstanding shares of this Class of a Fund. In addition, as of the same date, the following person(s) held the share percentage indicated below, which was owned either (i) beneficially by such
34
person(s) or (ii) of record by such person(s) on behalf of customers who are the beneficial owners of such shares and as to which such record owner(s) may exercise voting rights under certain limited circumstances:
| California Fund | | Morgan Stanley | | Jersey City, NJ | | 11.3% |
| | | Citigroup Global Markets, Inc. | | New York, NY | | 10.1% |
| | | Merrill Lynch, Pierce, Fenner & Smith, Inc. | | Jacksonville, FL | | 9.0% |
| Florida Fund | | Citigroup Global Markets, Inc. | | New York, NY | | 13.0% |
| | | Merrill Lynch, Pierce, Fenner & Smith, Inc. | | Jacksonville, FL | | 10.0% |
| | | Morgan Stanley | | Jersey City, NJ | | 6.0% |
| Massachusetts Fund | | Citigroup Global Markets, Inc. | | New York, NY | | 8.1% |
| | | Merrill Lynch, Pierce, Fenner & Smith, Inc. | | Jacksonville, FL | | 7.6% |
| | | Stifel Nicolaus & Co., Inc. | | ST. Louis, MO | | 6.0% |
| Mississippi Fund | | Morgan Keegan & Company, Inc. | | Jackson, MS | | 15.0% |
| | | Merrill Lynch, Pierce, Fenner & Smith, Inc. | | Jacksonville, FL | | 9.6% |
| | | Morgan Keegan & Company, Inc. | | Madison, MS | | 7.1% |
| New York Fund | | Citigroup Global Markets, Inc. | | New York, NY | | 16.5% |
| | | Merrill Lynch, Pierce, Fenner & Smith, Inc. | | Jacksonville, FL | | 11.0% |
| Ohio Fund | | Merrill Lynch, Pierce, Fenner & Smith, Inc. | | Jacksonville, FL | | 14.1% |
| | | Citigroup Global Markets, Inc. | | New York, NY | | 6.4% |
| Rhode Island Fund | | Merrill Lynch, Pierce, Fenner & Smith, Inc. | | Jacksonville, FL | | 14.0% |
| | | First Clearing, LLC | | Portsmouth, RI | | 10.5% |
| West Virginia Fund | | Citigroup Global Markets, Inc. | | New York, NY | | 15.1% |
| | | Merrill Lynch, Pierce, Fenner & Smith, Inc. | | Jacksonville, FL | | 8.4% |
| | | Special Custody Acct for the exclusive benefit of customers Omnibus | | | | |
| | | Account | | Louisiville, KY | | 5.3% |
To the knowledge of the Trust, no other person owned of record or beneficially 5% or more of the outstanding shares of this Class of a Fund as of such date.
35
| Class B Fees, Performance & Ownership |
Distribution and Service Fees. For the fiscal year ended September 30, 2007, the following table shows (1) sales commissions paid by the principal underwriter to investment dealers on sales of Class B shares, (2) distribution fees paid to the principal underwriter under the Distribution Plan, (3) CDSC payments to the principal underwriter, (4) uncovered distribution charges under the Distribution Plan (dollar amount and as a percentage of net assets attributable to Class B), (5) service fees paid under the Distribution Plan, and (6) service fees paid to investment dealers. The service fees paid by the Funds that were not paid to investment dealers were retained by the principal underwriter.
| | | Commission Paid | | | | | | | | | | | | |
| | | by Principal | | Distribution Fee | | | | | | | | | | Service Fees |
| | | Underwriter to | | Paid to | | CDSC Paid to | | Uncovered | | Service | | Paid to |
| Fund | | Investment Dealers | | Principal Underwriter | | Principal Underwriter | | DistributionCharges | | Fees | | Investment Dealers |
| California | | $11,008 | | $29,837 | | $24,000 | | $ 68,000 (1.9%) | | $10,052 | | $7,930 |
| Florida | | 20,264 | | 230,199 | | 68,000 | | 660,000 (2.6%) | | 66,441 | | 62,122 |
| Massachusetts | | 53,594 | | 336,336 | | 77,000 | | 455,000 (1.1%) | | 93,808 | | 86,503 |
| Mississippi | | 5,657 | | 26,343 | | 7,000 | | 495,000 (18.9%) | | 7,874 | | 7,334 |
| New York | | 106,529 | | 81,497 | | 19,000 | | 352,000 (3.1%) | | 20,744 | | 14,863 |
| Ohio | | 124,376 | | 233,619 | | 68,000 | | 78,000 | | (0.3%) | | 63,999 | | 54,703 |
| Rhode Island | | 28,998 | | 121,427 | | 40,000 | | 1,030,000 | | (7.4%) | | 34,667 | | 32,268 |
| West Virginia | | 7,372 | | 48,633 | | 8,000 | | 549,000 | | (9.1%) | | 13,458 | | 12,683 |
Performance Information. The tables below indicate the average annual total return (both before and after taxes) on a hypothetical investment of $1,000 in this Class of shares for the periods shown in each table. Any performance presented with an asterisk (*) includes the effect of subsidizing expenses. Performance would have been lower without subsidies.
Total returns are historical and are calculated by determining the percentage change in net asset value or public offering price with all distributions reinvested. The Fund’s past performance (both before and after taxes) is no guarantee of future results. Investment return and principal value of Fund shares will fluctuate so that shares, when redeemed, may be worth more or less than their original cost. Performance is for the stated time period only; due to market volatility, a Fund’s current performance may be lower or higher than the quoted return. For the Fund’s performance as of the most recent month-end, please refer to www.eatonvance.com.
About Returns After Taxes. After-tax returns are calculated using certain assumptions. After-tax returns are calculated using the highest historical individual federal income tax rates and do not reflect the impact of state and local taxes. Actual after-tax returns depend on a shareholder’s tax situation and the actual characterization of distributions, and may differ from those shown. After-tax returns are not relevant to shareholders who hold shares in tax-deferred accounts or to shares held by non-taxable entities. Return After Taxes on Distributions for a period may be the same as Return Before Taxes for that period because no taxable distributions were made during that period, or because the taxable portion of distributions made during the period was insignificant. Also, Return After Taxes on Distributions and Redemption of Fund Shares for a period may be greater than or equal to Return After Taxes on Distributions for the same period because of losses realized on the sale of F und shares. A portion of the distributions made in the current year may be recharacterized as taxable after year-end.
| California Fund | | Length of Period Ended September 30, 2007 |
| Average Annual Total Return: | | One Year | | Five Years | | Ten Years |
| Before Taxes and Excluding Maximum Sales Charge | | 0.73% | | 3.31% | | 4.45% |
| Before Taxes and Including Maximum Sales Charge | | –4.05% | | 2.97% | | 4.45% |
| After Taxes on Distributions and Excluding Maximum Sales Charge | | 0.47% | | 3.25% | | 4.40% |
| After Taxes on Distributions and Including Maximum Sales Charge | | –4.31% | | 2.92% | | 4.40% |
| After Taxes on Distributions and Redemption and Excluding Maximum Sales Charge | | 2.05% | | 3.42% | | 4.43% |
| After Taxes on Distributions and Redemption and Including Maximum Sales Charge | | –1.06% | | 3.14% | | 4.43% |
36
| Florida Fund | | Length of Period Ended September 30, 2007 |
| Average Annual Total Return: | | One Year | | Five Years | | Ten Years |
| Before Taxes and Excluding Maximum Sales Charge | | 1.53% | | 3.45% | | 4.38% |
| Before Taxes and Including Maximum Sales Charge | | –3.36% | | 3.11% | | 4.38% |
| After Taxes on Distributions and Excluding Maximum Sales Charge | | 1.52% | | 3.45% | | 4.36% |
| After Taxes on Distributions and Including Maximum Sales Charge | | –3.37% | | 3.11% | | 4.36% |
| After Taxes on Distributions and Redemption and Excluding Maximum Sales Charge | | 2.30% | | 3.54% | | 4.36% |
| After Taxes on Distributions and Redemption and Including Maximum Sales Charge | | –0.88% | | 3.26% | | 4.36% |
| |
| Massachusetts Fund | | Length of Period Ended September 30, 2007 |
| Average Annual Total Return: | | One Year | | Five Years | | Ten Years |
| Before Taxes and Excluding Maximum Sales Charge | | –0.07% | | 3.29% | | 4.19% |
| Before Taxes and Including Maximum Sales Charge | | –4.90% | | 2.95% | | 4.19% |
| After Taxes on Distributions and Excluding Maximum Sales Charge | | –0.07% | | 3.29% | | 4.18% |
| After Taxes on Distributions and Including Maximum Sales Charge | | –4.90% | | 2.94% | | 4.18% |
| After Taxes on Distributions and Redemption and Excluding Maximum Sales Charge | | 1.20% | | 3.40% | | 4.19% |
| After Taxes on Distributions and Redemption and Including Maximum Sales Charge | | –1.93% | | 3.11% | | 4.19% |
| |
| Mississippi Fund | | Length of Period Ended September 30, 2007 |
| Average Annual Total Return: | | One Year | | Five Years | | Ten Years |
| Before Taxes and Excluding Maximum Sales Charge | | 1.94% | | 2.89% | | 3.85% |
| Before Taxes and Including Maximum Sales Charge | | –2.99% | | 2.55% | | 3.85% |
| After Taxes on Distributions and Excluding Maximum Sales Charge | | 1.93% | | 2.88% | | 3.84% |
| After Taxes on Distributions and Including Maximum Sales Charge | | –3.00% | | 2.54% | | 3.84% |
| After Taxes on Distributions and Redemption and Excluding Maximum Sales Charge | | 2.47% | | 3.01% | | 3.87% |
| After Taxes on Distributions and Redemption and Including Maximum Sales Charge | | –0.73% | | 2.72% | | 3.87% |
| |
| New York Fund | | Length of Period Ended September 30, 2007 |
| Average Annual Total Return: | | One Year | | Five Years | | Ten Years |
| Before Taxes and Excluding Maximum Sales Charge | | 0.83% | | 3.39% | | 4.61% |
| Before Taxes and Including Maximum Sales Charge | | –4.01% | | 3.06% | | 4.61% |
| After Taxes on Distributions and Excluding Maximum Sales Charge | | 0.75% | | 3.33% | | 4.56% |
| After Taxes on Distributions and Including Maximum Sales Charge | | –4.09% | | 3.00% | | 4.56% |
| After Taxes on Distributions and Redemption and Excluding Maximum Sales Charge | | 1.89% | | 3.50% | | 4.57% |
| After Taxes on Distributions and Redemption and Including Maximum Sales Charge | | –1.26% | | 3.22% | | 4.57% |
37
| Ohio Fund | | Length of Period Ended September 30, 2007 |
| Average Annual Total Return: | | One Year | | Five Years | | Ten Years |
| Before Taxes and Excluding Maximum Sales Charge | | 1.32% | | 4.16% | | 4.14% |
| Before Taxes and Including Maximum Sales Charge | | –3.57% | | 3.82% | | 4.14% |
| After Taxes on Distributions and Excluding Maximum Sales Charge | | 1.32% | | 4.16% | | 4.14% |
| After Taxes on Distributions and Including Maximum Sales Charge | | –3.57% | | 3.82% | | 4.14% |
| After Taxes on Distributions and Redemption and Excluding Maximum Sales Charge | | 2.08% | | 4.18% | | 4.19% |
| After Taxes on Distributions and Redemption and Including Maximum Sales Charge | | –1.10% | | 3.89% | | 4.19% |
| |
| Rhode Island Fund | | Length of Period Ended September 30, 2007 |
| Average Annual Total Return: | | One Year | | Five Years | | Ten Years |
| Before Taxes and Excluding Maximum Sales Charge | | 1.20% | | 3.09% | | 4.12% |
| Before Taxes and Including Maximum Sales Charge | | –3.69% | | 2.75% | | 4.12% |
| After Taxes on Distributions and Excluding Maximum Sales Charge | | 1.20% | | 3.09% | | 4.11% |
| After Taxes on Distributions and Including Maximum Sales Charge | | –3.69% | | 2.75% | | 4.11% |
| After Taxes on Distributions and Redemption and Excluding Maximum Sales Charge | | 1.98% | | 3.20% | | 4.11% |
| After Taxes on Distributions and Redemption and Including Maximum Sales Charge | | –1.20% | | 2.91% | | 4.11% |
| West Virginia Fund | | Length of Period Ended September 30, 2007 |
| Average Annual Total Return: | | One Year | | Five Years | | Ten Years |
| Before Taxes and Excluding Maximum Sales Charge | | 1.43% | | 2.79% | | 3.89% |
| Before Taxes and Including Maximum Sales Charge | | –3.48% | | 2.45% | | 3.89% |
| After Taxes on Distributions and Excluding Maximum Sales Charge | | 1.43% | | 2.79% | | 3.88% |
| After Taxes on Distributions and Including Maximum Sales Charge | | –3.48% | | 2.44% | | 3.88% |
| After Taxes on Distributions and Redemption and Excluding Maximum Sales Charge | | 2.11% | | 2.92% | | 3.90% |
| After Taxes on Distributions and Redemption and Including Maximum Sales Charge | | –1.08% | | 2.63% | | 3.90% |
Control Persons and Principal Holders of Securities. At November 1, 2007, the Trustees and officers of the Trust, as a group, owned in the aggregate less than 1% of the outstanding shares of this Class of a Fund. In addition, as of the same date, the following person(s) held the share percentage indicated below, which was owned either (i) beneficially by such person(s) or (ii) of record by such person(s) on behalf of customers who are the beneficial owners of such shares and as to which such record owner(s) may exercise voting rights under certain limited circumstances:
| California | | Merrill Lynch, Pierce, Fenner & Smith, Inc. | | Jacksonville, FL | | 23.0% |
| | | RBC Dain Rauscher FBO Fischgrund Trust | | Beverly Hills, CA | | 7.4% |
| | | Citigroup Global Markets, Inc. | | New York, NY | | 7.2% |
| | | Morgan Stanley | | Jersey City, NJ | | 5.1% |
| | | Charles Schwab & Co., Inc. | | San Francisco, CA | | 5.0% |
| Florida | | Merrill Lynch, Pierce, Fenner & Smith, Inc. | | Jacksonville, FL | | 22.0% |
| | | Citigroup Global Markets, Inc. | | New York, NY | | 12.3% |
| | | Morgan Stanley | | Jersey City, NJ | | 7.5% |
| Massachusetts | | Merrill Lynch, Pierce, Fenner & Smith, Inc. | | Jacksonville, FL | | 11.0% |
| | | Morgan Stanley | | Jersey City, NJ | | 7.6% |
38
| | | Citigroup Global Markets, Inc. | | New York, NY | | 6.0% |
| Mississippi | | Merrill Lynch, Pierce, Fenner & Smith, Inc. | | Jacksonville, FL | | 31.0% |
| | | Morgan Stanley | | Jersey City, NJ | | 13.3% |
| | | Morgan Keegan & Company, Inc. | | Gulfport, MS | | 6.0% |
| New York | | Merrill Lynch, Pierce, Fenner & Smith, Inc. | | Jacksonville, FL | | 12.4% |
| | | Citigroup Global Markets, Inc. | | New York, NY | | 11.0% |
| Ohio | | Merrill Lynch, Pierce, Fenner & Smith, Inc. | | Jacksonville, FL | | 17.0% |
| | | UBS Financial Services Inc. | | | | |
| | | FBO Max T. Miller Living Trust | | New Phladelphia, OH | | 10.0% |
| Rhode Island | | Merrill Lynch, Pierce, Fenner & Smith, Inc. | | Jacksonville, FL | | 10.0% |
| West Virginia | | Merrill Lynch, Pierce, Fenner & Smith, Inc. | | Jacksonville, FL | | 15.5% |
| | | Citigroup Global Markets, Inc. | | New York, NY | | 14.2% |
| | | Morgan Stanley | | Jersey City, NJ | | 5.2% |
To the knowledge of the Trust, no other person owned of record or beneficially 5% or more of the outstanding shares of this Class of a Fund as of such date.
39
| Class C Fees, Performance & Ownership |
Distribution and Service Fees. For the fiscal year ended September 30, 2007, the following table shows (1) sales commissions paid by the principal underwriter to investment dealers on sales of Class C shares, (2) distribution fees paid to the principal underwriter under the Distribution Plan, (3) CDSC payments to the principal underwriter, (4) uncovered distribution charges under the Distribution Plan (dollar amount and as a percentage of net assets attributable to Class C), (5) service fees paid under the Distribution Plan, and (6) service fees paid to investment dealers. The service fees paid by the Funds that were not paid to investment dealers were retained by the principal underwriter.
| | | Commission Paid | | Distribution Fee | | CDSC Paid to | | | | | | Service Fees |
| | | by Principal Underwriter to | | Paid to | | Principal | | Uncovered | | Service | | Paid to |
| Fund | | Investment Dealers | | Principal Underwriter | | Underwriter | | Distribution Charges | | Fees | | Investment Dealers |
| California | | $67,641 | | $58,610 | | $1,000 | | $ 654,000 (5.7%) | | $18,593 | | $22,551 |
| Florida | | 18,324 | | 12,136 | | 2,000 | | 168,000 (5.7%) | | 3,234 | | 6,031 |
| Massachusetts | | 125,892 | | 75,051 | | 7,000 | | 1,166,000 (6.6%) | | 20,009 | | 41,721 |
| New York | | 211,144 | | 161,351 | | 14,000 | | 1,898,000 (6.1%) | | 43,027 | | 54,207 |
| Ohio | | 186,475 | | 143,304 | | 10,000 | | 2,005,000 (6.5%) | | 38,198 | | 61,233 |
| Rhode Island | | 34,477 | | 13,111 | | 300 | | 209,000 (6.4%) | | 3,494 | | 11,483 |
Performance Information. The tables below indicate the average annual total return (both before and after taxes) on a hypothetical investment in shares of $1,000. Total return for the period prior to the date this Class of each Fund was first offered, reflects the total return of Class B, adjusted to reflect the Class C CDSC. The Class B total return has not been adjusted to reflect certain other expenses (such as distribution and service fees). If such adjustments were made, the Class C total return would be different. Any performance presented with an asterisk (*) includes the effect of subsidizing expenses. Performance would have been lower without subsidies.
Total returns are historical and are calculated by determining the percentage change in net asset value or public offering price with all distributions reinvested. The Fund’s past performance (both before and after taxes) is no guarantee of future results. Investment return and principal value of Fund shares will fluctuate so that shares, when redeemed, may be worth more or less than their original cost. Performance is for the stated time period only; due to market volatility, a Fund’s current performance may be lower or higher than the quoted return. For the Fund’s performance as of the most recent month-end, please refer to www.eatonvance.com.
About Returns After Taxes. After-tax returns are calculated using certain assumptions. After-tax returns are calculated using the highest historical individual federal income tax rates and do not reflect the impact of state and local taxes. Actual after-tax returns depend on a shareholder’s tax situation and the actual characterization of distributions, and may differ from those shown. After-tax returns are not relevant to shareholders who hold shares in tax-deferred accounts or to shares held by non-taxable entities. Return After Taxes on Distributions for a period may be the same as Return Before Taxes for that period because no taxable distributions were made during that period, or because the taxable portion of distributions made during the period was insignificant. Also, Return After Taxes on Distributions and Redemption of Fund Shares for a period may be greater than or equal to Return After Taxes on Distributions for the same period because of losses realized on the sale of F und shares. A portion of the distributions made in the current year may be recharacterized as taxable after year-end.
| California Fund | | Length of Period Ended September 30, 2007 |
| Average Annual Total Return: | | One Year | | Five Years | | Ten Years |
| Before Taxes and Excluding Maximum Sales Charge | | 0.83% | | 3.27% | | 4.43% |
| Before Taxes and Including Maximum Sales Charge | | –0.13% | | 3.27% | | 4.43% |
| After Taxes on Distributions and Excluding Maximum Sales Charge | | 0.57% | | 3.22% | | 4.38% |
| After Taxes on Distributions and Including Maximum Sales Charge | | –0.39% | | 3.22% | | 4.38% |
| After Taxes on Distributions and Redemption and Excluding Maximum Sales Charge | | 2.12% | | 3.39% | | 4.41% |
| After Taxes on Distributions and Redemption and Including Maximum Sales Charge | | 1.49% | | 3.39% | | 4.41% |
| Class C commenced operations August 31, 2004. | | | | | | |
40
| Florida Fund | | Length of Period Ended September 30, 2007 |
| Average Annual Total Return: | | One Year | | Five Years | | Ten Years |
| Before Taxes and Excluding Maximum Sales Charge | | 1.62% | | 3.42% | | 4.36% |
| Before Taxes and Including Maximum Sales Charge | | 0.64% | | 3.42% | | 4.36% |
| After Taxes on Distributions and Excluding Maximum Sales Charge | | 1.61% | | 3.42% | | 4.32% |
| After Taxes on Distributions and Including Maximum Sales Charge | | 0.64% | | 3.42% | | 4.32% |
| After Taxes on Distributions and Redemption and Excluding Maximum Sales Charge | | 2.36% | | 3.51% | | 4.32% |
| After Taxes on Distributions and Redemption and Including Maximum Sales Charge | | 1.73% | | 3.51% | | 4.32% |
| Class C commenced operations March 13, 2006. | | | | | | |
| |
| Massachusetts Fund | | Length of Period Ended September 30, 2007 |
| Average Annual Total Return: | | One Year | | Five Years | | Ten Years |
| Before Taxes and Excluding Maximum Sales Charge | | –0.07% | | 3.29% | | 4.19% |
| Before Taxes and Including Maximum Sales Charge | | –1.04% | | 3.29% | | 4.19% |
| After Taxes on Distributions and Excluding Maximum Sales Charge | | –0.07% | | 3.28% | | 4.18% |
| After Taxes on Distributions and Including Maximum Sales Charge | | –1.04% | | 3.28% | | 4.18% |
| After Taxes on Distributions and Redemption and Excluding Maximum Sales Charge | | 1.20% | | 3.39% | | 4.19% |
| After Taxes on Distributions and Redemption and Including Maximum Sales Charge | | 0.58% | | 3.39% | | 4.19% |
| Class C commenced operations May 2, 2006. | | | | | | |
| |
| New York Fund | | Length of Period Ended September 30, 2007 |
| Average Annual Total Return: | | One Year | | Five Years | | Ten Years |
| Before Taxes and Excluding Maximum Sales Charge | | 0.73% | | 2.89% | | 4.35% |
| Before Taxes and Including Maximum Sales Charge | | –0.24% | | 2.89% | | 4.35% |
| After Taxes on Distributions and Excluding Maximum Sales Charge | | 0.65% | | 2.81% | | 4.27% |
| After Taxes on Distributions and Including Maximum Sales Charge | | –0.32% | | 2.81% | | 4.27% |
| After Taxes on Distributions and Redemption and Excluding Maximum Sales Charge | | 1.82% | | 3.03% | | 4.30% |
| After Taxes on Distributions and Redemption and Including Maximum Sales Charge | | 1.19% | | 3.03% | | 4.30% |
| Class C commenced operations September 30, 2003. | | | | | | |
| |
| Ohio Fund | | Length of Period Ended September 30, 2007 |
| Average Annual Total Return: | | One Year | | Five Years | | Ten Years |
| Before Taxes and Excluding Maximum Sales Charge | | 1.32% | | 4.18% | | 4.15% |
| Before Taxes and Including Maximum Sales Charge | | 0.34% | | 4.18% | | 4.15% |
| After Taxes on Distributions and Excluding Maximum Sales Charge | | 1.32% | | 4.18% | | 4.13% |
| After Taxes on Distributions and Including Maximum Sales Charge | | 0.34% | | 4.18% | | 4.13% |
| After Taxes on Distributions and Redemption and Excluding Maximum Sales Charge | | 2.08% | | 4.19% | | 4.18% |
| After Taxes on Distributions and Redemption and Including Maximum Sales Charge | | 1.44% | | 4.19% | | 4.18% |
| Class C commenced operations February 3, 2006. | | | | | | |
41
| Rhode Island Fund | | Length of Period Ended September 30, 2007 |
| Average Annual Total Return: | | One Year | | Five Years | | Ten Years |
| Before Taxes and Excluding Maximum Sales Charge | | 1.20% | | 3.07% | | 4.10% |
| Before Taxes and Including Maximum Sales Charge | | 0.22% | | 3.07% | | 4.10% |
| After Taxes on Distributions and Excluding Maximum Sales Charge | | 1.20% | | 3.06% | | 4.10% |
| After Taxes on Distributions and Including Maximum Sales Charge | | 0.22% | | 3.06% | | 4.10% |
| After Taxes on Distributions and Redemption and Excluding Maximum Sales Charge | | 1.98% | | 3.17% | | 4.09% |
| After Taxes on Distributions and Redemption and Including Maximum Sales Charge | | 1.34% | | 3.17% | | 4.09% |
| Class C commenced operations March 20, 2006. | | | | | | |
Control Persons and Principal Holders of Securities. At November 1, 2007, the Trustees and officers of the Trust, as a group, owned in the aggregate less than 1% of the outstanding shares of this Class of a Fund. In addition, as of the same date, the following person(s) held the share percentage indicated below, which was owned either (i) beneficially by such person(s) or (ii) of record by such person(s) on behalf of customers who are the beneficial owners of such shares and as to which such record owner(s) may exercise voting rights under certain limited circumstances:
| California | | Merrill Lynch, Pierce, Fenner & Smith Incorporated | | Jacksonville, FL | | 33.5% |
| | | Citigroup Global Markets, Inc. | | New York, NY | | 12.6% |
| Florida | | Merrill Lynch, Pierce, Fenner & Smith Incorporated | | Jacksonville, FL | | 31.3% |
| | | Citigroup Global Markets, Inc. | | New York, NY | | 6.5% |
| | | A G Edwards & Sons, Inc. | | ST. Louis, MO | | 6.0% |
| | | UBS Financial Services Inc. | | | | |
| | | FBO Stanley Dirzis | | Naples, FL | | 5.0% |
| Massachusetts | | Citigroup Global Markets, Inc. | | New York, NY | | 12.6% |
| | | Merrill Lynch, Pierce, Fenner & Smith Incorporated | | Jacksonville, FL | | 7.1% |
| New York | | Citigroup Global Markets, Inc. | | New York, NY | | 20.0% |
| | | Merrill Lynch, Pierce, Fenner & Smith Incorporated | | Jacksonville, FL | | 19.5% |
| Ohio | | Merrill Lynch, Pierce, Fenner & Smith Incorporated | | Jacksonville, FL | | 21.5% |
| Rhode Island | | Merrill Lynch, Pierce, Fenner & Smith Incorporated | | Jacksonville, FL | | 36.0% |
| | | NFS LLC FBO Florence A. Dulgarian | | Cranston, RI | | 12.1% |
To the knowledge of the Trust, no other person owned of record or beneficially 5% or more of the outstanding shares of this Class of a Fund as of such date.
42
| Class I Fees, Performance & Ownership |
The Trustees of the Trust have determined that Class I shares of the Massachusetts Fund shall only be available to employees of Eaton Vance Corp. (and its affiliates, including subsidiaries), clients of Eaton Vance Corp. (and its affiliates, including subsidiaries) and certain institutional investors. The Massachusetts Fund and/or the principal underwriter reserve the right to permit purchases by other than affiliates, subsidiaries or clients of Eaton Vance Corp.
Performance Information. The tables below indicate the average annual total return (both before and after taxes) on a hypothetical investment of $1,000 in this Class of shares for the periods shown in each table. Any performance presented with an asterisk (*) includes the effect of subsidizing expenses. Performance would have been lower without subsidies.
Total returns are historical and are calculated by determining the percentage change in net asset value or public offering price with all distributions reinvested. The Fund’s past performance (both before and after taxes) is no guarantee of future results. Investment return and principal value of Fund shares will fluctuate so that shares, when redeemed, may be worth more or less than their original cost. Performance is for the stated time period only; due to market volatility, a Fund’s current performance may be lower or higher than the quoted return. For the Fund’s performance as of the most recent month-end, please refer to www.eatonvance.com.
About Returns After Taxes. After-tax returns are calculated using certain assumptions. After-tax returns are calculated using the highest historical individual federal income tax rates and do not reflect the impact of state and local taxes. Actual after-tax returns depend on a shareholder’s tax situation and the actual characterization of distributions, and may differ from those shown. After-tax returns are not relevant to shareholders who hold shares in tax-deferred accounts or to shares held by non-taxable entities. Return After Taxes on Distributions for a period may be the same as Return Before Taxes for that period because no taxable distributions were made during that period, or because the taxable portion of distributions made during the period was insignificant. Also, Return After Taxes on Distributions and Redemption of Fund Shares for a period may be greater than or equal to Return After Taxes on Distributions for the same period because of losses realized on the sale of F und shares. A portion of the distributions made in the current year may be recharacterized as taxable after year-end.
| Massachusetts Fund | | Length of Period Ended September 30, 2007 |
| Average Annual Total Return: | | One Year | | Five Years | | Ten Years |
| Before Taxes | | 6.72% | | 5.84% | | 6.03% |
| After Taxes on Distributions | | 6.72% | | 5.83% | | 6.02% |
| After Taxes on Distributions and Redemption | | 6.04% | | 5.74% | | 5.94% |
Control Persons and Principal Holders of Securities. At November 1, 2007, the Trustees and officers of the Trust, as a group, owned in the aggregate less than 1% of the outstanding shares of this Class of a Fund. In addition, as of the same date, the following person(s) held the share percentage indicated below, which was owned either (i) beneficially by such person(s) or (ii) of record by such person(s) on behalf of customers who are the beneficial owners of such shares and as to which such record owner(s) may exercise voting rights under certain limited circumstances:
| Massachusetts | | NFS LLC FEBO | | Boston, MA | | 18.5% |
| | | Max T. Makowsky TTEE Wharton P. Whitaker Trust | | South Orleans, MA | | 15.0% |
| | | Mars & Co. c/o Investors Bank & Trust Co. | | Boston, MA | | 12.0% |
| | | Mercury & Co. c/o Investors Bank & Trust Co. | | Boston, MA | | 9.0% |
| | | M. Dozier Gardner | | Brookline, MA | | 7.7% |
To the knowledge of the Trust, no other person owned of record or beneficially 5% or more of the outstanding shares of this Class of a Fund as of such date.
43
| STATE SPECIFIC INFORMATION |
Risks of Concentration. The following information as to certain state specific considerations is given to investors in view of a Fund’s policy of concentrating its investments in particular state issuers. Such information supplements the information in the prospectus. It is derived from sources that are generally available to investors and is believed to be accurate. Such information constitutes only a brief summary, does not purport to be a complete description and is based on information from official statements relating to securities offerings of issuers of each particular state. The Trust has not independently verified this information.
The bond ratings provided in the prospectus are current as of the date of the prospectus and are based on economic conditions which may not continue; moreover, there can be no assurance that particular bond issues may not be adversely affected by changes in economic, political or other conditions. Unless stated otherwise, the ratings indicated are for obligations of the state. A state’s political subdivisions may have different ratings which are unrelated to the ratings assigned to state obligations.
| General Economic Conditions |
The economy of the State of California (referred to herein as the “State” or “California”) is the largest among the 50 states and is one of the largest in the world, having major components in high technology, trade, entertainment, agriculture, manufacturing, tourism, construction and services. California’s economy slipped into a recession in early 2001, losing 362,000 jobs between January 2001 and July 2003. The recession was concentrated in the State’s high-tech sector and, geographically in the San Francisco Bay Area. The economy has since stabilized with 887,100 jobs gained between July 2003 and March 2007. In May 2007, the State Department of Finance projected that the California economy will decelerate in calendar year 2007 before improving in calendar years 2008 and 2009 largely because of declines in residential construction and real estate markets. Recent projections of the State Department of Finance forecast further deterioration in the housing sector th at will last longer than anticipated in May 2007 and will continue to slow the California economy. As of August 2007, there was little evidence that the housing sector downturns were abating. The problems with subprime mortgages and the related financial market volatility and credit tightening have worsened the housing sector downturns and raised the risk of further deterioration.
On November 14, 2007, the State Department of Finance reported actual General Fund receipts for the month of October 2007 and year-to-date from July 1-October 31, 2007 were about $1.1 billion, or 3.8 percent, below the total of $29.205 billion forecasted amount for such receipts. The State Department of Finance also reported that recent economic date confirmed ongoing effects of the housing slump in the State, with notable weakness in the construction and finance sectors. The State’s economy may also be impacted noticeably by a series of large wildfires that occurred in seven counties in Southern California in late October 2007. While there has been significant loss of buildings, it is too early to estimate total damages or the ultimate impact on the State’s economy. Total costs to the State’s primary fire fighting fund are currently estimated to be about $124 million, exceeding the $82 million included in the 2007 Budget Act. Costs above the budgeted amount will be paid from Gen eral Fund budget reserves. Because these fires have been declared a federal disaster, an estimated 75 percent of the State’s fire fighting costs should eventually be reimbursed by the Federal Emergency Management Agency.
California’s July 1, 2006 population of approximately 37.4 million represented over 12% of the total United States population. California’s population is concentrated in metropolitan areas. As of the April 1, 2000 census, 97 percent of the State’s population resided in the 25 Metropolitan Statistical Areas in the State. As of July 1, 2006, the 5-county Los Angeles area accounted for 49 percent of the State’s population with over 18.0 million residents and the 11-county San Francisco Bay Area represented 21% of the State’s population with a population of nearly 8.0 million.
California total personal income grew by an estimated 6.4% in 2006, up from 5.4% growth in 2005. Per capita personal income grew by an estimated 5.5% in 2006, up from the 4.4% gain in 2005. Statewide taxable sales fell to 3.9% in 2006 from 7.4% in 2005. California exports increased by 13.7% in 2006, up from the 5.6% gain in 2005. The average level of nonfarm payroll employment grew by 1.8% in 2006, after growing by 1.8% in 2005. The State unemployment rate was 4.9% in 2006 and was 5.3% in July 2007 before increasing to 5.1% in April 2007. The national unemployment rate in 2006 was 4.6% .
Existing home sales in the State fell by 23% from July 2006. Residential construction, measured by the number of residential units for which permits were issued, were down 30 % from July 2006, while the value of private sector
44
nonresidential permits rose by 4.5 percent from June 2006, although the value of public works construction was down 12 percent.
| Prior Fiscal Years’ Budgets |
The California economy grew strongly between 1994 and 2000, generally outpacing the nation, and as a result, for the five fiscal years from 1995-96 to 1999-00, the General Fund tax revenues exceeded the estimates made at the time the budgets were enacted. The State ended the 2000-01 fiscal year with a budget reserve of $5.39 billion. However, during fiscal year 2001-02, the State experienced an unprecedented drop in revenues compared to the prior year largely due to reduced personal income taxes from stock option and capital gains activity. During the three fiscal years between 2001-02 and 2003-04, the State encountered severe budgetary difficulties because of reduced revenues and failure to make equivalent reductions in expenditures, resulting in successive budget deficits. The budgets for these years included substantial reliance on one-time measures, internal borrowing and external borrowing. The State also faced a cash flow crisis during this period which was relieved by the issuance of rev enue anticipation warrants in June 2002 and June 2003 and economic recovery bonds in the spring of 2004.
The fiscal year 2004-05 Budget Act (the “2004 Budget Act”) was adopted by the Legislature on July 29, 2004, along with a number of implementing measures, and signed by then Governor Schwarzenegger on July 31, 2004. In approving the budget, the Governor vetoed $116 million in appropriations (including $80 million in General Fund appropriations). The 2004 Budget Act addressed a projected $13.9 billion budget shortfall through expenditure cuts, cost avoidance, fund shifts loans or borrowing, and transfers and other revenue, including the application for budgetary purposes of $2 billion of proceeds of the economic recovery bonds issued in fiscal year 2003-04. As of the release of the 2006-07 Governor’s Budget, the State ended fiscal year 2004-05 with a reserve of $9.1 billion.
The fiscal year 2005-06 Budget Act (the “2005 Budget Act”) was adopted by the Legislature on July 7, 2005, along with a number of implementing measures, and signed by Governor Schwarzenegger on July 11, 2005. In approving the budget, the Governor vetoed $190 million in appropriations (including $115 million in General Fund appropriations). The 2005 Budget Act contained General Fund appropriations of $90.0 billion, compared to $81.7 billion in 2004-05. The difference between revenues and expenditures in fiscal year 2005-06 were funded by using a part of the $7.5 billion fund balance at June 30, 2005. Under the 2005 Budget Act, the June 30, 2006 reserve was projected to be $1.302 billion. About $900 million of this reserve was set aside for payment in fiscal year 2006-07 of tax refunds and other adjustments related to the tax amnesty program implemented in early 2005.
The fiscal year 2006-07 Budget Act (the “2006 Budget Act”) was adopted by the Legislature on June 27, 2006, along with a number of implementing measures, and signed by the Governor on June 30, 2006. In approving the budget, the Governor vetoed $112 million in appropriations. Under the 2006 Budget Act, General Fund revenues were projected to increase 1.2 percent from $92.7 billion in fiscal year 2005–06 to $93.9 billion in fiscal year 2006–07, of which $944 million will be transferred to the Budget Stabilization Account established pursuant to State Proposition 58 approved by State voters in 2004. The revenue projections assumed continued but moderating growth in California’s economy as reflected in several key indicators. The 2006 Budget Act contains General Fund expenditures of $101.3 billion, compared to $92.7 billion in 2005-06. The June 30, 2007 reserve was projected to be $2.1 billion, compared to an estimated June 30, 2006 reserve of $9.5 billion.
2007 Budget Act. The 2007 Budget Act was adopted by the Legislature on August 21, 2007, along with a number of implementing measures, and signed by the Governor on August 24, 2007. In approving the 2007 Budget Act the Governor vetoed $943 million in appropriations from the General Fund, special funds, and bond funds (including $703 million in General Fund appropriations).
The 2007 Budget Act signed by Governor Schwarzenegger includes the largest reserve of any budget act in the State’s history. The 2007-08 May Revision proposed a total reserve of $2.2 billion. Due to the shortfall in revenue collections that came to light in June 2007, and in recognition of the State’s continuing structural deficit and other potential threats, the Legislature took actions to reduce spending and increase funds available, thereby increasing the total reserve to an unprecedented $3.4 billion. The Governor further reduced spending with $703 million in General Fund vetoes, raising the total reserve to $4.1 billion. See “Budget Risks and Structural Deficit” below. As a result, General Fund spending growth in this budget is held to $0.6 billion, or 0.6 percent.
Under the 2007 Budget Act, General Fund revenues and transfers are projected to increase 6.0 percent, from $95.5 billion in fiscal year 2006-07 to $101.2 billion in fiscal year 2007-08. The 2007 Budget Act contains General Fund appropriations
45
of $102.3 billion, compared to $101.7 billion in 2006-07. The June 30, 2008 total reserve was projected to be $4.1 billion, similar to the estimated June 30, 2007 reserve.
The 2007 Budget Act contains the following major General Fund components:
1. Maximizing the Value of the State’s Student Loan Guarantee Function — The 2007 Budget Act assumes the sale of, or other contractual arrangement for the operation of, California’s student loan guarantee function, generating $1 billion in one-time revenue. The State’s student loan guarantee function is operated through a contract between the California Student Aid Commission (“CSAC”) and EdFund, a non-profit public benefit corporation established by CSAC. EdFund, the second largest guaranty operator in the nation, services student loans for students attending schools in California and throughout the nation. Over half of all loans serviced by EdFund are held by non-California students. This proposal will not adversely affect students’ access to loans or the interest rates students pay for loans (which are set by the federal government). Neither CSAC nor EdFund sets loan interest rates or charge students fees.
2. Repayments and prepayments of prior obligations — The 2007 Budget Act includes $1 billion in prepayments of the Economic Recovery Bonds from moneys transferred to the Budget Stabilization Account, and $5 million of other budgetary debt repayments. This brings the total set aside to repay the Economic Recovery Bonds to $6.8 billion in four years since the bonds were issued. As a result, the Department of Finance projects that the Economic Recovery Bonds will be fully retired in February, 2010, which is 14 years ahead of schedule.
3. Budget Stabilization Account — The 2007 Budget Act fully funds the transfer of $2.045 billion to the Budget Stabilization Account, the full amount pursuant to Proposition 58. Half of this amount, or $1.023 billion, will remain in the Budget Stabilization Account as a rainy-day reserve, and is reported as a reduction of revenues. The other half will be transferred for the purpose of early retirement of Economic Recovery Bonds.
4. Operating Deficit in 2007-08 — Prior to the adjustment for the $1.023 billion transfer to the Budget Stabilization Account, the 2007 Budget Act does not have an operating deficit. However, events subsequent to the 2007 Budget Act have reduced the reserve, and other developments may further require use of the reserves.
5. Proposition 98 — The 2007 Budget Act includes Proposition 98 General Fund expenditures of $41.5 billion, which is an increase of $712 million, or 1.7 percent, compared to the revised 2006-07 estimate. When property taxes are taken into account, the total Proposition 98 guarantee is $57.1 billion, which is an increase of $2.2 billion, or 3.9 percent. The 2007 Budget Act also continues to include $426 million above the 2006-07 Proposition 98 guarantee level to implement Proposition 49.
6. K-12 Education — The 2007 Budget Act includes $66.8 billion ($41.4 billion General Fund and $25.4 billion other funds) for K-12 education programs in 2007-08. This reflects an increase of $3.5 billion ($1.6 billion General Fund and $1.9 billion other funds). Total per-pupil expenditures are projected to increase by $378 to $11,541 in 2007-08, which includes funds for prior year settle-up obligations.
7. Higher Education — The 2007 Budget Act Revision reflects total funding of $19.7 billion, including $14 billion General Fund and Proposition 98 sources for all major segments of higher education (excluding infrastructure and stem cell research), which reflects an increase of $1.1 billion ($853 million General Fund and Proposition 98 sources) above the revised 2006 07 level. This includes funding for the compacts signed in 2004 with the University of California and the California State University.
8. Health and Human Services — The 2007 Budget Act includes $29.7 billion General Fund for Health and Human Services programs, which is an increase of $301 million from the revised 2006-07 estimate. Total funding from all State funds for Health and Human Services programs is $38.0 billion, which is an increase of $1.6 billion from the revised 2006-07 estimate.
9. Transportation Funding — The 2007 Budget Act includes $1.48 billion to fully fund Proposition 42 in 2007-08.
Proposition lA was passed in November 2006 and provides for the repayment of any remaining Proposition 42 debt by the year 2015-16. Pursuant to Proposition 1A, the Budget repays $83 million from the 2003-04 and 2004-05 Proposition 42 suspensions. Because the issuance of tribal gaming bonds continues to be delayed, the 2007 Budget Act also provides for the use of $100 million in tribal gaming compact revenues that will be received in 2006-07, 2007-08, and any future years until the bonds are sold, to repay past loans made from the State Highway Account, the Traffic Congestion Relief Fund, and the Public Transportation Account (“PTA”). Proposition 1B was also passed in November 2006, providing $19.925 billion in bonding authority for a total of 16 programs intended to address a broad range of transportation priorities including rehabilitation and expansion of highways, transit and transit security, port security, and air quality. The authority for the use of any bond funds must be provi ded for in the Budget Act. The 2007 Budget Act provides a total of $4.2 billion in Proposition 1B funding.
46
On September 6, 2007, the California Transit Association filed a lawsuit with the Superior Court of Sacramento seeking an injunction to prohibit the use of $1.188 billion in 2007-08 revenues for a number of public transit related programs provided in the 2007 Budget Act and related legislation. The suit also seeks to prohibit similar uses of lesser amounts of these funds in future years. No date has been set for the trial. The 2007 Budget Act uses funding that otherwise would have been transferred to the PTA or used to fund other transit-related costs that had been funded from the General Fund in prior years, including $948 million for payment of debt service on transportation bonds and $228 million for transportation services provided to public school students and Developmental Services Regional Center clients. If successful, the lawsuit would result in more funds being available in the PTA, but would not result in additional expenditure authority for public transportation programs in the curr ent year due to an appropriations cap.
10. Lease of State Lottery — In the 2007-08 May Revision, the Governor proposed an examination of the potential benefits which could be derived from a lease of the State Lottery to private operators. The Governor indicated the belief that if private operators could substantially improve the returns from the Lottery – which currently operates below the national average in per capita receipts – the State may be able to realize substantial new income while still providing a guaranteed payment to schools. The Governor did not include any specific proposal in the 2007-08 May Revision, and the 2007 Budget Act does not include any increased revenue estimate based on such a transaction.
11. Revenue Actions — The 2007 Budget Act includes several revenue proposals that were in the 2007-08 Governor’s Budget. The most significant changes included the repeal of the teacher tax credit, resulting in an estimated revenue gain of $170 million in 2007-08, and additional efforts to reduce the “tax gap,” which tax professionals define as the difference between what taxpayers should pay and what is actually paid, which is estimated to result in $77.5 million in additional personal income tax and corporation tax revenues in 2007-08.
12. Pension Obligation Bonds — The Court of Appeal for the Third Appellate District ruled that legislation authorizing the issuance of bonds to finance a portion of the State’s pension obligation is invalid. The State is not planning to appeal this decision. The 2007 Budget Act does not include pension obligation bonds for 2007-08 and the current Administration has stated that it will not be using pension obligation bonds in the future.
Budget Risks and Structural Deficit. For fiscal year 2007-08, the State faces a number of issues and risks that may impact the General Fund, and reduce the budget reserves included in the 2007 Budget Act (originally $4.1 billion). Some of the larger risk items include the following:
1. Delay in sale of, or other contractual arrangement for the operation of, the State’s student loan guarantee function operated through a non-profit entity, EdFund, past the current fiscal year, and/or lower sale price than was estimated in the 2007 Budget Act. If only delayed, this would not be a permanent revenue loss. The 2007 Budget Act assumes $1 billion in receipts from this sale.
2. The budget reserve has already been reduced by $500 million as a result of an adverse court ruling in a case involving delayed payments to the State Teachers’ Retirement Fund. The respondents have determined not to seek review of the direction to make the delayed payment, and that payment has already been made. Payment of prejudgment and post judgment interest will be required, and those costs could be determined to be up to $200 million.
3. Additional Proposition 98 spending if the State Controller’s Office’s property tax audit does not validate assumptions in the 2007 Budget Act about property tax growth.
4. Delay in implementation of new procedures for handling of unclaimed property. Transfer of unclaimed property to the General Fund has been enjoined by a court decision; the 2007 Budget Act assumes new procedures approved by the Legislature can be implemented this year which will result in approximately $700 million of receipts. This is also likely to be a timing issue, not a permanent loss of revenue.
5. Deterioration of revenues below 2007-08 May Revision estimates, primarily as a result of weaker economic conditions in 2007 and early 2008.
6. Additional costs for employee contracts.
7. There are a variety of individual budget decisions in the area of health, welfare and social services, including litigation, each having an impact of $100 million or more, which may not meet expectations.
8. Potential impact on the General Fund reserve if the lawsuit challenging use of funds in the Public Transportation Account is successful.
Approximately $3.5 billion of the budget solutions included in the 2007 Budget Act were one-time actions, which cannot be repeated in 2008-09. Some of the larger one-time actions include sale or other arrangements to maximize value of the
47
State’s student loan guarantee function operated through a nonprofit entity, EdFund, estimated at $1 billion, transfer of $657 million of proceeds from refinancing tobacco securitization bonds, use of $663 million of Public Transportation Account Funds to reimburse the General Fund primarily for debt service on transportation bonds and $437 million of Proposition 98 savings. In part because of these one-time actions, and estimates of program growth based on existing statutory and constitutional requirements, the Administration projects that, absent additional corrective measures, the 2008-09 fiscal year budget will be about $6.1 billion out of balance. The Governor will release his proposals for a balanced 2008-09 budget in January 2008.
Complete text of the 2007 Budget Act may be found at the website of the Department of Finance (www.dof.ca.gov), under the heading “California Budget.” Information on the website is not incorporated herein by reference.
LAO Assessment. The Legislative Analyst’s Office (the “LAO”) has released several reports which include their estimates and assessments of State budget acts and associated fiscal and economic projections. These include a report titled “California Fiscal Outlook – LAO Projections 2006-07 through 2011-12” dated November 15, 2006, a report titled “Overview of the Governor’s Budget” dated January 12, 2007, a report titled “The 2007-08 Budget: Perspectives and Issues” released on February 21, 2007, a report dated May 15, 2007 titled “Overview of the 2007-08 May Revision,” a report dated August 31, 2007 titled “Major Features of the 2007 California Budget” and a report dated October 15, 2007 titled “California Spending Plan 2007-08: The Budget Act and Related Legislation.”
In the “Major Features” report, the LAO has the following statements in its “Budget Overview”: “The budget assumes the State ended the 2006-07 fiscal year with a reserve of $4.1 billion. It projects $102.3 billion in budget-year revenues, an increase of 6.5 percent from 2006-07. The budget authorizes expenditures of an equal amount, an increase of 0.6 percent from 2006-07. Thus, the plan leaves the General Fund with a year-end reserve of $4.1 billion…”
“2007-08 budget expenditures do not exceed revenues. By comparison, State spending exceeded revenues by more than $5 billion in 2006-07. Based on the 2007-08 budget plan’s policies, however, the State would once again face operating shortfalls of more than $5 billion in both 2008-09 and 2009-10. This is because … many of the solutions enacted in the budget plan are of a one-time nature. We will be updating our fiscal projections in November 2007, when we release our
California Fiscal Outlook.”
In the “California Spending Plan 2007-08” report, the LAO notes that there have been a number of budget-related developments since the enactment of the 2007 Budget Act in August 2007, that will potentially reduce the reserve, including a one-time payment to the State teachers’ retirement system of $500 million in response to a court decision.
Publications from the LAO can be read in full by accessing the LAO’s website (www.lao.ca.gov) or by contacting the LAO at (916) 445-4656.
Treasurer’s Report. On October 1, 2007, the State Treasurer issued a report entitled “Looking Beyond the Horizon: Investment Planning for the 21st Century” (the “Treasurer’s Report”), which provides a 20-year planning horizon and bifurcates the projected State General Fund spending between debt service payments and operating expenditures. According to the Treasurer’s Report, the State has a structural budget deficit that could grow up to $14.6 billion, or an average annual revenue deficit of 3.5%, by Fiscal Year 2027-28. The Treasurer’s Report proposes various measures to address the structural budget imbalance, including lessening the life-cycle costs of government facilities by increasing energy efficiency, reducing criminal recidivism, broadening the sales tax base by extending it to certain services, funding infrastructure development and operation through user-pays financing and financing transportation infrastructure with revenue bonds. The T reasurer’s Report can be read in full by accessing the Treasurer’s website (www.treasurer.ca.gov) or by contacting the State Treasurer’s Office at (800) 900-3873.
Future Budgets
It cannot be predicted what actions will be taken in the future by the State Legislature and the Governor to deal with changing State revenues and expenditures. The State budget will be affected by national and State economic conditions and other factors.
Ratings
Currently, the following ratings for the State of California general obligation bonds have been received from Moody’s Investors Service, Inc. (“Moody’s”), Standard & Poor’s, a division of The McGraw-Hill Companies, Inc. (“S&P”) and Fitch, Inc. (“Fitch”):
| Fitch | | Moody’s | | S&P |
| A+ | | A1 | | A+ |
48
These ratings apply to the State only and are not indicative of the ratings assigned to local governments, such as counties, cities, school districts and other local agencies.
Any explanation of the significance of such ratings may be obtained only from the rating agency furnishing such ratings. There is no assurance that such ratings will continue for any given period of time or that they will not be revised downward or withdrawn entirely if, in the judgment of the particular rating agency, circumstances so warrant.
General. The primary units of local government in the State are 58 counties, ranging in population from 1,200 in Alpine County to approximately 10 million in Los Angeles County. Counties are responsible for providing many basic services, including indigent healthcare, welfare, jails and public safety in unincorporated areas. There are also 478 incorporated cities in the State and thousands of special districts formed for education, utility and other services. The fiscal condition of local governments has been constrained since the enactment of Proposition 13, which added Article XIIIA to the State Constitution, was approved by State voters in 1978. Proposition 13 reduced and limited the future growth of property taxes and limited the ability of local governments to impose “special taxes” (those devoted to a specific purpose) without two-thirds voter approval. Proposition 218, another constitutional amendment enacted by initiative in 1996, further limited the ability of local go vernments to raise taxes, fees and other exactions. Counties, in particular, have had fewer options to raise revenues than many other local governmental entities, and have been required to maintain many services.
In the aftermath of Proposition 13, the State provided aid to local governments from the General Fund to make up some of the loss of property tax moneys, including assuming the principal responsibility for funding K-12 schools and community colleges. During the recession of the early 1990s, the Legislature reduced the post-Proposition 13 aid to local government entities other than K-12 schools and community colleges, by requiring cities and counties to transfer some of their property tax revenues to school districts. However, the Legislature also provided additional funding sources such as sales taxes and reduced certain mandates for local services funded by cities and counties.
The 2004 State Budget Act, related legislation and the enactment of Proposition 1A in 2004 (described below) dramatically changed the State-local fiscal relationship. These constitutional and statutory changes implemented an agreement negotiated between the Governor and local government officials (the “State–local agreement”) in connection with the 2004 Budget Act. One change relates to the reduction of the vehicle license fee (“VLF”) rate from 2% to 0.65% of the market value of the vehicle. In order to protect local governments, which have previously received all VLF revenues, the reduction in VLF revenue to cities and counties from this rate change will be replaced by an increase in the amount of property tax they receive.
As part of the State-local agreement, Proposition 1A ("Proposition 1A") was approved by the voters at the November 2004 election. Proposition 1A amended the State Constitution to, among other things, reduce the Legislature’s authority over local government revenue sources by placing restrictions on the State’s access to local governments’ property, sales, and vehicle license fee revenues as of November 3, 2004. Beginning with fiscal year 2008–09, the State will be able to borrow up to 8% of local property tax revenues, but only if the Governor proclaims such action is necessary due to a severe State fiscal hardship, two–thirds of both houses of the Legislature approves the borrowing and the amount borrowed is required to be paid back within three years. The State also will not be able to borrow from local property tax revenues for more than two fiscal years within a period of ten fiscal years, and only if previous borrowings have been repaid. In addition, the State cann ot reduce the local sales tax rate or restrict the authority of the local governments to impose or change the distribution of the statewide local sales tax. Proposition 1A also prohibits the State from mandating activities on cities, counties or special districts without providing the funding needed to comply with the mandates. Beginning in fiscal year 2005–06, if the State does not provide funding for the mandated activity, the requirement on cities, counties or special districts to abide by the mandate is suspended. In addition, Proposition 1A expanded the definition of what constitutes a mandate to encompass State action that transfers to cities, counties and special districts financial responsibility for a required program for which the State previously had partial or complete responsibility. The State mandate provisions of Proposition 1A do not apply to schools or community colleges or to mandates relating to employee rights.
Welfare. The entire Statewide welfare system was changed in response to the change in federal welfare law in 1996. The Personal Responsibility and Work Opportunity Reconciliation Act of 1996 (P.L. 104–193) fundamentally reformed the nation’s welfare system. The Law included, among other things, provisions to convert Aid to Families with Dependent Children, an entitlement program, to Temporary Assistance for Needy Families (“TANF”), a block grant program with lifetime time limits on TANF recipients, work requirements and other changes. The revised basic State welfare system, California Work Opportunity and Responsibility to Kids (“CalWORKs”) which embodies the State’s response to the federal welfare system, contains time limits on the receipt of welfare aid and the linkage of eiligibility to work participation requirements. Under the CalWORKs program, counties are give flexibility to develop their own plans, consistent with State
49
law to implement the program and to administer many of its elements. Counties are still required to provide “general assistance” aid to certain persons who cannot obtain welfare from other programs.
Caseload under CalWORKs is projected to decrease by 12.3% in 2007-08 from the 2006-07 projection. The revised CalWORKs caseload projections are 461,200 cases in fiscal year 2006–07 and 457,500 cases in fiscal year 2007–08. This represents a major decline in caseload from the rapid growth of the early 1990s, when caseload peaked at 921,000 cases in fiscal year 1994–95. Since CalWORKs’ inception in January 1998, caseload has declined by over 35%.
The 2007 Budget Act includes total CalWORKs-related expenditures of $7.2 billion for fiscal year 2007-08, compared to $7 billion for the revised 2006-07 level. In an effort to address the State’s structural deficit, the 2007 Budget Act includes several measures that will provide substantial General Fund relief without reducing CalWORKs benefits, including suspending the fiscal year 2007-08 cost-of-living adjustment, utilizing available Proposition 98 resources in lieu of federal TANF funds to fully fund child care, and allocating a portion of TANF reserve funds on a one-time basis to offset General Fund costs in the program. These and several other measures are projected to generate over $546 million in General Fund savings in fiscal year 2007-08.
The federal Deficit Reduction Act of 2005 included legislation that reauthorized and extended the TANF program until September 30, 2010. The federal reauthorization legislation modifies countable work activities under TANF and applies new federal work participation rates to separate state programs. In addition, because reauthorization legislation effectively eliminates the State’s caseload reduction credit, the bulk of the CalWORKS caseload will be subject to the 50% work participation rate beginning in federal fiscal year 2007. Considerable improvement in work participation rates must be achieved to avoid federal penalties, which could cost the State and counties more than $1.5 billion from the General Fund over a five-year period beginning in fiscal year 2009-10.
Although California’s policy to date has been to limit total CalWORKs spending to only the available federal TANF Block Grant and combined State and county maintenance of effort (“MOE”) funds, the 2007-08 Budget Act identifies MOE expenditures in excess of the required level. By identifying expenditures of $385.5 million in fiscal year 2007-08 to be counted toward the MOE in excess of the required level, the State’s caseload reduction credit will increase by an estimated 10 percent in federal fiscal year 2009.
Trial Courts. Prior to legislation enacted in 1997, local governments provided the majority of funding for the State’s trial court system. The legislation consolidated the trial court funding at the State level in order to streamline the operation of the courts, provide a dedicated revenue source and relieve fiscal pressure on the counties. For fiscal years 2006-07 and 2007-08, the State’s trial court system will receive approximately $2.6 billion in each fiscal year, and $499 million in resources from the counties in each fiscal year.
Constitutional and Statutory Limitations on Taxes and Appropriations; Constraints on the State Budget Process; Future Initiatives
Over the years, a number of laws and constitutional amendments have been enacted, often through voter initiatives, which have increased the difficulty of raising State taxes, restricted the use of the State’s General Fund or special fund revenues, or otherwise limited the State Legislature and the Governor’s discretion in enacting budgets. Historic examples of provisions that make it more difficult to raise taxes include Article XIIIA of the State Constitution, which resulted from the voter-approved Proposition 13 passed in 1978, which, among other things, required that any change in State taxes enacted for the purpose of increasing revenues collected pursuant thereto, whether by increased rates or changes in computation, be approved by a two-thirds vote in each house of the Legislature. Examples of provisions restricting the use of General Fund revenues are Article XIIIB of the State Constitution, which limits the amount of appropriations (not including expenditures for voter-approve d debt service) of the State and of the local governments to the amount of appropriations of the entity for the prior year, adjusted for changes in the cost of living, population and the services that local governments have financial responsibility for providing, Proposition 98, passed in 1988, which mandates that a minimum amount of General Fund revenues be spent on local education, and Proposition 10, passed in 1988, which raised taxes on tobacco products and mandated how the additional revenues would be expended.
More recently, a new series of constitutional amendments sponsored by Governor Schwarzenegger and approved by the voters, have also affected the budget process. These include Proposition 1A (described under "Local Governments" above) and Proposition 58, approved in 2004, which requires the adoption of a balanced budget and restricts future borrowing to cover budget deficits. Proposition 58 and other voter initiatives affecting the budget process are described below.
Proposition 58, approved by the voters in 2004, requires the State to enact a balanced budget, establish a special reserve in the General Fund and restricts future borrowing to cover fiscal year end deficits. As a result of the provisions requiring the enactment of a balanced budget and restricting borrowing, the State would in some cases have to take more immediate
50
actions to correct budgetary shortfalls. Beginning with the budget for fiscal year 2004-05, Proposition 58 requires the Legislature to pass a balanced budget and provides for mid-year adjustments in the event that the budget falls out of balance and the Governor calls a special legislative session to address the shortfall. The balanced budget determination is made by subtracting expenditures from all available resources, including prior-year balances.
If the Governor determines that the State is facing substantial revenue shortfalls or spending increases, the Governor is authorized to declare a fiscal emergency. He or she would then be required to propose legislation to address the emergency, and call the Legislature into special session for that purpose. If the Legislature fails to pass and send to the Governor legislation to address the fiscal emergency within 45 days, the Legislature would be prohibited from: (i) acting on any other bills or (ii) adjourning in joint recess until such legislation is passed.
Proposition 58 also requires that a special reserve (the “Budget Stabilization Account”) be established in the State’s General Fund. Beginning with fiscal year 2006-07, a specified portion of estimated annual General Fund revenues (reaching a ceiling of 3 percent by fiscal year 2008-09) will be transferred by the State Controller into the Budget Stabilization Account no later than September 30 of each fiscal year. These transfers would continue until the balance in the Budget Stabilization Account reaches $8 billion or 5% of the estimated General Fund revenues for that fiscal year, whichever is greater. The annual transfer requirement would be in effect whenever the balance falls below the $8 billion or 5% target. The annual transfers can be suspended or reduced for a fiscal year by an executive order issued by the Governor no later than June 1 of the preceding fiscal year. Proposition 58 also provides that one-half of the annual transfers shall be used to retire the State’s Economic Recovery Bonds, until a total of $5 billion has been used for that purpose. The 2007 Budget Act funds the full transfer of $2.045 billion to the Budget Stabilization Account, of which $1.023 billion will be used to retire Economic Recovery Bonds. A total of $1.495 billion of the $5 billion amount has now been allocated for retirement of the Economic Recovery Bonds.
Proposition 58 also prohibits certain future borrowing to cover fiscal year-end deficits. This restriction applies to general obligation bonds, revenue bonds, and certain other forms of long-term borrowing. The restriction does not apply to certain other types of borrowing, such as: (i) short-term borrowing to cover cash shortfalls in the General Fund (including revenue anticipation notes or revenue anticipation warrants currently used by the State), or (ii) inter-fund borrowings.
An initiative statute, Proposition 49, called the “After School Education and Safety Program of 2002,” was approved by the voters on November 5, 2002, and requires the State to expand funding for before and after school programs in the State’s public (including charter) elementary, middle and junior high schools. This increase was first required in fiscal year 2006-07, and the 2006 Budget Act provided $550 million for these programs. The 2007-08 budget bill proposed to continue providing $550 million, allocating $547 million for grants for before- and after-school programs, and $3.0 million for administrative costs for the California State Department of Education. The additional funds are added to the Proposition 98 minimum funding guarantee for K-14 education and, in accordance with the initiative, cannot be reduced in future years unless the Proposition 98 guarantee is suspended.
On November 2, 2004, the voters approved Proposition 63, which imposes a 1% tax surcharge on taxpayers with annual taxable income of more than $1 million for purposes of funding and expanding mental health services. In addition, Proposition 63 prohibits the Legislature or the Governor from redirecting funds now used for mental health services to other purposes or from reducing General Fund support for mental health services below the levels provided in fiscal year 2003-04.
On November 7, 2006, voters approved Proposition 1A, which was placed on the ballot by the Legislature as Senate Constitutional Amendment No. 7 (“SCA 7”), to protect Proposition 42 transportation funds from any further suspensions. Provisions of the State Constitution enacted as Proposition 42 in 2002, permit the suspension of the annual transfer of motor vehicle fuel sales tax revenues from the General Fund to the Transportation Investment Fund if the Governor declares that the transfer will result in a “significant negative fiscal impact” on the General Fund and the Legislature agrees with a two-thirds vote of each house. SCA 7 modified the constitutional provisions in a manner similar to Proposition 1A of 2004, so that if such a suspension occurs, the amount owed to the General Fund must be repaid to the Transportation Investment Fund within three years, and only two such suspensions can be made within any ten-year period. In 2003-04, the scheduled Proposition 42 transfer of $868 million was suspended, and in 2004-05 the full transfer of $1.258 billion was suspended. The Proposition 42 transfer was fully funded in 2005-06 at $1.359 billion. The 2006 Budget Act fully funded the Proposition 42 transfer at $1.428 billion for 2006-07, and also included $1.415 ($1.215 billion from the Gernal Fund) for advance repayment of a portion of the 2003-04 and 2004-05 suspensions. The 2007 Budget Act fully funds the Proposition 42 transfer at $1.481 billion and the required repayment for remaining Proposition 42 debts at $83 million for 2007-08.
51
A proposed initiative measure has qualified for the February 5, 2008 Statewide election, which would, among other things, modify Proposition 98 to create a separate funding guarantee for community colleges, different from the funding guarantee for K-12 schools.
The Fund cannot predict the impact of legislation on the bonds in the Fund’s portfolios. Other Constitutional amendments affecting State and local taxes and appropriations have been proposed from time to time. If any such initiatives are adopted, the State could be pressured to provide additional financial assistance to local governments or appropriate revenues as mandated by such initiatives, potentially reducing resources available for other State programs, especially to the extent the Article XIII B spending limit would restrain the State’s ability to fund such programs by raising taxes.
The State of California is a party to numerous legal proceedings, many of which normally occur in governmental operations. Information regarding some of the more significant litigation pending against the State would ordinarily be included in various public documents issued thereby, such as the official statements prepared in connection with the issuance of general obligation bonds of California. Such official statements may be obtained by contacting the State Treasurer’s Office at 800-900-3873 or at www.treasurer.ca.gov. Information on the website is not incorporated herein by reference.
Revenue Distribution. Certain Debt Obligations in the Portfolio may be obligations of issuers which rely in whole or in part on California state revenues for payment of these obligations. Property tax revenues and a portion of the state’s General Fund is distributed to counties, cities, school districts and other local agencies. Whether and to what extent a portion of the state’s General Fund will be distributed in the future to counties, cities and their various entities is unclear.
Health Care Legislation. Certain Debt Obligations in the Portfolio may be obligations which are payable solely from the revenues of health care institutions. Certain provisions under federal and California law may adversely affect these revenues and, consequently, payment on those Debt Obligations.
Medicare is a federal governmental health insurance system under which health care institutions and other providers are paid directly for services provided to eligible elderly and disabled persons. General acute care hospitals are generally reimbursed for inpatient and other services provided to Medicare patients under the prospective payment system, under which Medicare pays a predetermined rate for each covered service. The actual cost of care may be more or less than such reimbursement rates.
Medicaid is a program of medical assistance, funded jointly by the federal government and the states, for certain needy individuals and their dependents. Under Medicaid, the federal government provides grants to states that have medical assistance programs that are consistent with federal standards. Medi-Cal is the Medicaid program in California. The state of California selectively contracts with general acute care hospitals to provide acute inpatient services to Medi-Cal patients. Except in areas of the state that have been excluded from contracting, a general acute care hospital generally will not qualify for payment for non-emergency acute inpatient services rendered to a Medi-Cal beneficiary unless it is a contracting hospital.
The financial challenges faced at the federal and the state levels and the resulting attempts to balance the federal and the state budgets have negatively impacted the reimbursement rates received by health care institutions under the Medicare and Med-Cal programs. No assurance can be given that reimbursement rates will cover the actual costs of providing services to Medicare and Medi-Cal patients.
In California, private health plans and insurers are permitted to contract directly with hospitals for services to beneficiaries on negotiated terms. Many PPOs and HMOs currently pay providers on a negotiated fee-for-service basis, or, for institutional care, on a fixed rate per day basis, which, in each case, is discounted from the typical charges for the care provided. The discounts offered are typically premised on a certain pattern and volume of utilization of the provider’s services. Discounts offered to HMOs and PPOs may result in payment to the contracting hospital of less than actual cost and the volume of patients directed to a hospital under an HMO or PPO contract may vary significantly from projections. Often, HMO or PPO contracts are enforceable for a stated term, regardless of provider losses or of bankruptcy of the respective HMO or PPO. It is expected that failure to execute and maintain such PPO and HMO contracts would reduce a hospital’s patient base or gross revenues . Conversely, participation may maintain or increase the patient base, but may result in reduced payment and lower net income to the contracting hospitals.
These Debt Obligations may also be insured by the state pursuant to an insurance program implemented by the Office of Statewide Health Planning and Development for health facility construction loans. If a default occurs on insured Debt Obligations, the state Treasurer will issue debentures payable out of a reserve fund established under the insurance program or will pay principal and interest on an unaccelerated basis from such reserve fund. In the event the reserve fund is unable
52
to pay the principal of or interest on the debenture, the state Treasurer shall pay such amounts out of any unappropriated state funds. In the event of a default in payment of the debentures, such debentures shall be paid on a par with state general obligation bonds. The Office of Statewide Health Planning and Development commissioned various studies commencing in December 1983, to evaluate the adequacy of the reserve fund established under the insurance program and based on certain formulations and assumptions found the reserve fund substantially underfunded. The most recent study, prepared in February 2003 by Milliman & Robertson, Inc., concluded, among other things, that the amounts on deposit in the fund were sufficient, assuming "normal and expected" conditions, and that the Health Facility Construction Loan Insurance Fund, as of June 30, 2002, should maintain a positive balance over the projection period of fifteen years.
In recent years, Florida (referred to herein as the "state" or "Florida") has emerged as one of the world’s fastest growing markets, experiencing an explosion of international growth as a major economic hub of the southeastern United States. In 20056, Florida’s gross domestic product was $713.5 billion, ranking it the 4th largest in the nation and largest in the Southeast. Florida’s GDP grew 4.2% in 2006, outpacing the 3.4% growth of the national GDP. In 2006, Florida’s total personal income related reached nearly $647.6 billion, ranking Florida 4th in the nation and first in the Southeast. Florida’s population growth slowedconsiderably last year as the housing boom went bust, but it remained relatively strong and likely will stay that way for the next few years. Florida’s population grew by 323,800 between 2006 and 2007, compared with 422,600 between 2005 and 2006; 404,700 between 2004 and 2005; 448,000 between 2003 and 2004. Florida’s total population was es timated at 18,680,367 as of April 1, 2007. Based on recent trends, it is expected that Florida will add about 300,000 residents a year during the next two to three years unless there is a recession. Florida’s economy is characterized by a large service sector, a dependence on the tourism and construction industries, and a large retirement population. The management of rapid growth has been the major challenge facing state and local governments. While attracting many senior citizens, Florida also offers a favorable business environment and growing employment opportunities that have continued to generate working age population immigration. As this growth continues, particularly within the retirement population, the demand for both public and private services will increase, which may strain the service sector's capacity and impede the state’s budget balancing efforts.
Florida has a proportionally greater number of persons of retirement age, a factor that makes Florida’s property and transfer payment taxes a relatively more important source of state funding. Because transfer payments are typically less sensitive to the business cycle than employment income, they may act as a stabilizing force in weak economic periods.
Florida’s tourism grew during the greater part of the 1990’s and the year 2000 by 5 to 8% annually. The events of September 11, 2001 led to a decline in Florida’s tourism for 2001, but Florida’s tourism staged a recovery in 2002, and since has then has drawn record numbers of visitors. In 2006, it drew a historic 83.9 million visitors. Tourism spending in 2006 was estimated to be $65 billion and the industry employed 964,700 people. The state sales tax revenue from tourism in 2006 was $3.9 billion. Based on preliminary official estimates of visitors to Florida for the first half of 2007 Florida drew an estimated 46.3 million visitors. Final 2007 numbers will be released in mid 2008.
The construction sector is also an important element of Florida’s economic outlook. In the early part of the decade, the housing market experienced significant growth. However, the housing market is forecasted to weaken significantly in the near future. For the fiscal year 2004-05, private housing starts reached over 268,000 units, and in 2005-06, they increased by 1.1% to reach 271,700 units. However, in fiscal year 2006-07, housing starts fell 39.7% to 163,900 units. For the fiscal year 2007-08, the private housing starts are projected to fall to 92,900 units, or a decrease of 43.9% over the previous fiscal period. Due to the weakening housing market, the construction industry is projected to lose jobs in the near future. In the fiscal year 2006-07, the construction industry employed an estimated 633,400 persons. It is projected that construction-related employment will decrease by 8.5% in the fiscal year 2007-08, and by 12.7% in the fiscal year 2008-09.
Florida’s economy continues to diversify and attract high-technology companies in the information technology, life sciences, and defense/homeland security sectors. Florida ranks third among all US states in the value of its high-tech exports and fourth in its employment in the high-tech industry.
The ability of the state and its local units of government to satisfy its debt obligations may be affected by numerous factors which impact on the economic vitality of the state in general and the particular region of the state in which the issuer of the debt obligations is located. South Florida is particularly susceptible to international trade and currency imbalances and to economic dislocations in Central and South America, due to its geographical location and its involvement with foreign trade, tourism and investment capital. North and Central Florida are impacted by problems in the agricultural sector, particularly with regard to the citrus and sugar industries. Short-term adverse economic conditions may be created in these areas, and in the state as a whole, due to crop failures, severe weather conditions or other agriculture-related problems.
53
The state economy also has historically been dependent on the tourism and construction industries and is, therefore, sensitive to trends in those sectors.
The Commonwealth of Massachusetts has a highly developed economy with a large service sector, particularly in health care, high technology, financial services and education. The economic downturn that began in 2001 affected the high technology and financial services industries in Massachusetts and resulted in increased unemployment and reduced tax revenue to the Commonwealth. More recently the economy has recovered. For fiscal 2004 through 2006, Commonwealth budgeted revenues increased by margins outpacing increases in Commonwealth budgeted expenditures. The rate of revenue increases appears to have slowed in fiscal 2007, however, and fiscal 2007 budgeted expenditures are estimated by the Commonwealth to have exceed budgeted revenues. The projected expenditures for fiscal 2008 are expected to exceed budgeted revenues.
The Commonwealth collects a variety of taxes and receives revenues from other non-tax sources, including the federal government and various fees, fines, court revenues, assessments, reimbursements, interest earnings and transfers from its non-budgeted funds. In fiscal 2006 on a statutory accounting basis, approximately 62.5% of the Commonwealth’s annual budgeted revenues were derived from state taxes. In addition, the federal government provided approximately 18.9% of such revenues, with the remaining 18.6% provided from departmental revenues and transfers from non-budgeted funds.
Major components of state tax revenue are the income tax, projected to account for 57.6% of total tax revenues in fiscal 2007, and the sales and use tax, projected to account for approximately 21.22% of such tax revenues. Dedicated portions of the Commonwealth’s sales tax revenues are pledged to provide financial support for the Massachusetts Bay Transportation Authority and the Massachusetts School Building Authority. The financial statements of the Commonwealth are available at the web site of the Comptroller of the Commonwealth located at http:://www.massgov.com/osc (click on Financial Reports/Audits).
Municipal revenues consist of taxes on real and personal property, distributions from the Commonwealth under a variety of programs and formulas, local receipts (including motor vehicle excise taxes, local option taxes, fines, licenses and permits, charges for utility and other services and investment income) and appropriations from other available funds (including general and dedicated reserve funds). Following the enactment in 1980 of the tax limitation initiative petition commonly known as Proposition 2½, local governments have become increasingly reliant on distribution of revenues from the Commonwealth to support local programs and services, although the amount of aid received varies significantly among municipalities. As a result of comprehensive education reform legislation enacted in June 1993, a large portion of local aid general revenue sharing funds is earmarked for public education and distributed through a formula designed to provide more aid to the Commonwealth’s poorer c ommunities. There are also several specific local aid programs, such as public libraries, police education incentives, and property tax abatement for certain elderly or disabled residents.
The Commonwealth incorporates the periodic use of commercial paper borrowing to meet cash flow needs for both capital and operating expenditures. The overall capacity of the Commonwealth’s commercial paper program is currently $1.0 billion. The Commonwealth periodically makes several cash flow borrowings for operating purposes. The pattern of the Commonwealth’s cash flow borrowings is largely the result of temporary cash imbalances caused by quarterly local aid payments to cities and towns, which total approximately $1 billion on the last day of each calendar quarter. All commercial paper of the Commonwealth issued for operating purposes in a fiscal year is required by state finance law to be paid not later than June 30 of such year.
The Commonwealth is authorized to issue three types of debt directly – general obligation debt, special obligation debt and federal grant anticipation notes. General obligation debt is secured by a pledge of the full faith and credit of the Commonwealth. Special obligation debt may be secured either with a pledge of receipts credited to the Highway Fund or with a pledge of receipts credited to the Convention Center Fund. Federal grant anticipation notes are secured by a pledge of federal highway construction reimbursements. As of June 30, 2007, the amount of Commonwealth long-term debt was approximately $18.945 billion, consisting of approximately $16.021 billion of general obligation debt, $1.258 billion of special obligation debt, and $1.666 billion of federal grant anticipation notes. Based on the United States census resident population estimate for Massachusetts for 2006, the per capita amount of such debt as of June 30, 2007 was $2,942.
The largest single component of the Commonwealth’s capital program in recent years has been the Central Artery/Ted Williams Tunnel Project, a major construction project substantial completion of which occurred in January, 2006. The total cost of the Central Artery/Ted Williams Tunnel Project was most recently estimated to be $14.798 billion. The federal government has capped its contribution to the project, and the Commonwealth projects a funding shortfall of $210 million, payment of which will be shared by the Commonwealth and the Massachusetts Turnpike Authority. A series of events have raised concerns relating to the quality of the CA/T Project. Water infiltration in the project's tunnels became a focus
54
of public concern following a slurry wall breach on September 15, 2004. On July 10, 2006 panels in the ceiling of the eastbound I-90 Connector Tunnel that leads to the Ted Williams Tunnel fell, causing the death of an automobile passenger. As a result, project cost increases are anticipated. Repairs and other work related to the July 2006 incident are expected to cost $54 million. The Commonwealth and the Massachusetts Turnpike Authority anticipate additional recoverable costs, although the amount of such recovery is unknown at this time. On July 10, 2007 the National Transportation Safety Board released its findings pertaining to the collapse of the ceiling panels, citing failure in the epoxy anchoring system. Subsequent to the collapse a full inspection of the tunnel project was conducted, and continues, inspecting all aspects of the project’s design, construction and life safety systems.
In addition to the long-term liabilities described above, the Commonwealth is also authorized to pledge its credit in aid of and provide contractual support for certain independent authorities and political subdivisions within the Commonwealth. These Commonwealth liabilities are classified as either general obligation contract assistance liabilities, budgetary contractual assistance liabilities or contingent liabilities. General obligation contract assistance liabilities arise from statutory requirements for payments by the Commonwealth to the Massachusetts Convention Center Authority, the Massachusetts Development Finance Agency and the Foxborough Industrial Development Financing Authority of 100% of the debt service of certain bonds issued by those authorities, as well as payments to the Massachusetts Water Pollution Abatement Trust and the Massachusetts Turnpike Authority that are not explicitly tied to debt service. Such liabilities constitute a pledge of the Commonwealth’s credit for which a two-thirds vote of the Legislature is required. Budgetary contractual assistance liabilities arise from statutory requirements for payments by the Commonwealth under capital leases, including leases supporting certain bonds issued by the Chelsea Industrial Development Financing Authority and the Route 3 North Transportation Improvements Association, and other contractual agreements, including a contract supporting certain certificates of participation issued for Plymouth County. Such liabilities do not constitute a pledge of the Commonwealth’s credit. Contingent liabilities relate to debt obligations of independent authorities and agencies of the Commonwealth that are expected to be paid without Commonwealth assistance, but for which the Commonwealth has some kind of liability if expected payment sources do not materialize. On May 30, 2007, the Commonwealth issued general obligation bonds to defease all outstanding Massachusetts Convention Center Authority and Foxborough Industrial Development F inancing Authority bonds with respect to which the Commonwealth was liable for general contract assistance. In addition, on May 30, 2007, the Commonwealth reduced it budgetary contract assistance liability for lease revenue bonds issued by the Route 3 North Transportation Improvements Association by issuing general obligation bonds to defease approximately $53.4 million of such bonds.
On August 29, 2005, Hurricane Katrina struck the State of Mississippi’s Gulf Coast region as a Category 4 Hurricane and continued inland throughout the Southern and Eastern parts of the State of Mississippi (the "State") resulting in loss of life, substantial destruction and damage to infrastructure, buildings, residences and other structures in Southern and Eastern Mississippi. A significant portion of the State was declared a federal disaster area. Recovery efforts continue throughout the State. The United States Congress adopted legislation that appropriated in excess of $21 billion for the State for disaster assistance, disaster recovery, rebuilding infrastructure systems and other public facilities and related activities. Additionally, the United States Congress has adopted the Gulf Opportunity Zone Act of 2005 (the "GO Zone Act"), which establishes tax benefits for businesses and individuals in the Hurricane Katrina, Rita and Wilma disaster areas.
It is not possible to quantify at present with any certainty the long-term impact of Hurricane Katrina on the State and its economy, any offsetting economic benefit that may result from recovery and rebuilding activities and the amount of additional resources from federal, State and other local sources which will be required.
At present, the State has not experienced any Event Notice specified in any of its respective Continuing Disclosure Agreements related to its outstanding obligations.
All state indebtedness must be authorized by legislation governing the specific programs or projects to be financed. Such debt may include short-and long-term indebtedness, self-supporting general obligation bonds, revenue bonds, highway bonds and other types of indebtedness. As of September 1, 2007, the state’s total bond indebtedness was $3,191,895.00. The state’s constitutional debt limit was $10,930,261,350.00 for the fiscal year ended June 30, 2006, and was $11,312,820,500.00 for the fiscal year ended June 30, 2007. The state’s constitutional debt limit is forcasted to be approximately $11,708,769,200.00 for the fiscal year ended June 30, 2008. The state’s General Fund has an unaudited ending fund balance of $477,523,760.00 for fiscal year 2007 and the State’s fiscal year 2008 budget projects an ending fund balance of $397,953,776.00.
The State Bond Commission has the authority to establish lines of credit to provide temporary financing for certain projects for which the State Bond Commission is authorized to issue bonds. In October 2005, the authority to establish a line of
55
credit was expanded by the State Legislature so as to provide the State Bond Commission with the authority to obtain a line of credit in an amount not to exceed $500,000,000 in the event it is determined by the State Fiscal Officer and the State Treasurer that there are insufficient funds to cover deficiencies in the General Fund, the State is unable to repay its special fund borrowing or there are insufficient funds for disaster support and/or assistance due to Hurricanes Katrina and/or Rita. At present, the State Bond Commission has not obtained such a line of credit.
In April 2006, the State Bond Commission established the framework for an ongoing $250 million Commercial Paper Program (the “CP Program”) in the form of a capital asset program term extendible note shelf (CAPTENS). The extendible notes are secured by the full faith and credit pledge of the State. Note proceeds will be used to fund hurricane recovery (in an amount not to exceed $150 million), capital improvement projects and economic development projects (in a combined amount not to exceed $100 million). As of July 1, 2007, the State has $0.00 in CAPTENS outstanding.
There are no actions against the state that are reported by the Attorney General's office to be significant cases in which the state is the defendant and wherein the state's financial resources may be incurred. It should be noted that there is litigation pending against the state which could obligate the state's financial resources. The examples of such litigation include, but are not limited to, Title VII (employment discrimination) actions, contract disputes and actions seeking injunctions against various state agencies.
The following information is a brief summary of factors affecting the economy of New York State or New York City and does not purport to be a complete description of such factors. Other factors will affect issuers. The summary is based primarily upon the most recent publicly available offering statements relating to debt offerings of state and local issuers and other financial and demographic information available as of November 15, 2007, with respect to New York State, and November 16, 2007, with respect to New York City and it does not reflect recent developments since the dates of such offering statements and other information. The Fund has not independently verified this information.
New York State (referred to herein as “state” or “New York”) ended its 2006-2007 fiscal year on March 31, 2007 in balance on a cash basis, with a reported closing balance in the General Fund of $3.0 billion. The Governor’s Executive Budget for the 2007-2008 fiscal year projected ending the 2007-2008 fiscal year in balance on a cash basis, with a closing balance in the General Fund of $3.0 billion, and projected gaps of $2.3 billion in fiscal year 2008-2009, $4.5 billion in fiscal year 2009-2010, and $6.3 billion in fiscal year 2010-2011, assuming that all of the Governor’s Executive Budget savings proposals were implemented. The State Legislature completed action on the budget for the 2007-2008 fiscal year on April 1, 2007 (the ‘‘Enacted Budget’’).
New York released its Annual Information Statement on May 8, 2007 (the ‘‘Annual Information Statement’’), which reflected the State Legislature’s modifications to the Governor’s Executive Budget for the 2007-2008 fiscal year, and revisions to spending estimates in the Enacted Budget through April 19, 2007, the date of the state financial plan. In the Annual Information Statement, the New York Division of the Budget (“DOB”) noted that the Enacted Budget, similar to the Governor’s Executive Budget, also projected ending the 2007-2008 fiscal year in balance on a cash basis, but that the Enacted Budget projected a closing balance in the General Fund of $3.0 billion and projected gaps of approximately $3.1 billion in fiscal year 2008-2009, $4.8 billion in fiscal year 2009-2010 and $6.6 billion in fiscal year 2010-2011.
New York updates the Annual Information Statement quarterly, and released updates to the Annual Information Statement dated August 3, 2007 (the “August AIS Update”) and November 15, 2007 (the ‘‘November AIS Update’’). The November AIS Update contains information regarding changes to the Enacted Budget, revisions to the state financial plan projections for fiscal years 2007-2008 through 2010-2011, operating results for the first half of fiscal year 2007-2008, an updated economic forecast for the nation and State, GAAP basis projections for fiscal year 2007-2008, a summary on debt and capital management, a discussion of special considerations related to the state financial plan for fiscal year 2007-2008, a summary of GAAP-basis results for the 2006-2007 fiscal year, state retirement system information, updated information on the activities of certain public authorities and localities and the status of certain litigation with the potential to adversely affect the stat e’s finances. The November AIS Update also contains extracts from the Mid-Year Update to the 2007-2008 Financial Plan (the ‘‘Mid-Year Financial Plan Update’’) which the state issued on October 30, 2007. The Mid-Year Financial Plan Update projects ending fiscal year 2007-2008 in balance on a cash basis, with a closing balance in the General Fund of $2.8 billion, and projected gaps of $4.3 billion in fiscal year 2008-2009, $6.2 billion in fiscal year 2009-2010 and $7.9 billion in fiscal year 2010-2011.
The Annual Information Statement, the August AIS Update, the November AIS Update and the Mid-Year Financial Plan Update identify a number of risks inherent in the implementation of the Enacted Budget and the state financial plan. Such risks include court actions affecting the receipts and disbursements included in the Enacted Budget; costs that could materialize as a result of adverse rulings in pending litigation; federal disallowances or other federal actions that could
56
produce adverse effects on the state’s projections of receipts and disbursements; costs that may materialize in connection with the state’s negotiation of future collective bargaining agreements with the state’s employee unions and salary increases to the judiciary and other elected officials; potential lower lottery revenue estimates and risks relating to the national and local economies that can increase the demand for means-tested programs like Medicaid and welfare, including large increases in energy prices, national security concerns and financial sector performances.
In any year, the state financial plan is subject to risks that, if they were to materialize, could affect operating results. Many complex political, social, and economic forces influence the state’s economy and finances. Such forces may affect the state financial plan unpredictably from fiscal year to fiscal year. For example, the financial plan is necessarily based on forecasts of national and state economic activity. Economic forecasts have frequently failed to accurately predict the timing and magnitude of specific and cyclical changes to the national and state economies. The Mid-Year Financial Year Update also relies on estimates and assumptions concerning Federal aid, law changes, and audit activity.
The November AIS Update identified the following as the most significant risks to the state financial plan:
The most significant short-term risks include the potential cost of collective bargaining agreements for state employees (each 1 percent increase is valued at $93 million in the General Fund and $135 million in All Funds, which includes both state and Federal Funds) and salary increases for the Judiciary (and possibly other elected officials) in 2007-2008 and beyond; potential Federal disallowances arising from audits related to Medicaid claims under the School Supportive Health Services program; proposed Federal rule changes concerning Medicaid payments; and underperformance of the national and state economies that can affect state revenues and increase the demand for means-tested programs such as Medicaid and welfare.
Although the profile of risks has not changed materially since the August AIS Update, there have been some changes in risks associated with Video Lottery Terminal (“VLT”) revenues discussed below. In addition, the Mid-Year Financial Plan Update estimates now incorporate a prior risk by assuming that Belmont will open in 2010-2011 and has removed revenues from new facilities that have not yet been authorized by the Legislature.
New York’s four-year financial plan includes VLT revenue estimates from currently operating gaming facilities. The Mid-Year Financial Plan Update counts on VLT revenues from existing facilities of $475 million in 2007-2008 and $514 million in 2008-2009. Revenues are projected to increase to $644 million in 2009-2010 and $850 million in 2010-2011, reflecting the expected opening of the Aqueduct facility in 2009-2010 and the Belmont facility in 2010-2011. VLT revenues support K-12 education spending and any shortfall is expected to be covered by the General Fund.
In addition, the most significant risks to the revised revenue forecast are as follows:
• A significant downside risk remains with respect to the performance of financial sector firms. Continued poor performance in fourth quarter results for Wall Street companies could reduce bonus payouts more than expected.
• The housing market could become a more significant drag on the economy, especially if the foreclosure rate on subprime mortgages is higher than expected. This could erode consumer confidence leading to reduced consumption on taxable goods.
• A reduction in the number of large commercial real estate transactions in New York City presents the risk of a loss in real estate related tax receipts that have fueled a significant portion of the large growth in receipts over the past three fiscal years.
• A large portion of the growth in the estimated revenue base is dependent on loophole closing actions put in place with the 2007-2008 Budget. There are preliminary indications that these changes are not producing the receipts anticipated at the time of the Enacted Budget.
• The cigarette tax collections could be significantly impacted by changes in the Federal cigarette tax associated with State Children’s Health Insurance Program funding.
• Both the cigarette and motor fuel taxes are impacted by Native American enforcement efforts. The 2007-2008 estimates have been reduced to reflect enforcement delays.
The November AIS Update also identified the certain special considerations noting that many complex political, social, and economic forces influence the state’s economy and finances. Such forces may affect the state financial plan unpredictably from fiscal year to fiscal year. For example, the financial plan is necessarily based on forecasts of national and state economic activity. Economic forecasts have frequently failed to accurately predict the timing and magnitude of specific and cyclical changes to the national and state economies. The state financial plan also relies on estimates and assumptions concerning Federal aid, law changes and audit activity.
57
Budget Process Reform: Chapter 1 of the Laws of 2007, enacted in January 2007, reinstituted and expanded the “quick start" budget process to require each house of the Legislature, the State Comptroller, and the Executive to separately prepare detailed reports containing multi-year cash projections of receipts and disbursements by November 5 of each year. The reports must include, at a minimum, detailed projections of state receipts (for major tax categories, lottery receipts, and miscellaneous receipts) and disbursements for major program areas (for Medicaid, public assistance, and school aid) for the current year and ensuing fiscal years, as well as a description of the underlying factors and data assumptions. The Executive, Legislature and State Comptroller are then required to meet publicly shortly thereafter to discuss their reports. By November 15, the Executive and the Legislature must issue a joint report on the actual, estimated and projected state receipts and disbursements for all funds of the state of the prior, current and ensuing fiscal years.
From November 7 through November 12, meetings were held among the parties to review the reports and identify and evaluate differences. This effort was followed by a public meeting on the reports that took place on November 13, and a joint report was released to the public on November 15 and is available on the DOB website at www.budget.state.ny.us. The joint report reflects a consensus of the anticipated slowdown in national economic growth as well as the considerable economic uncertainties surrounding credit conditions, the housing market, employment growth, Federal monetary policy and oil prices. Estimates by the various parties of total receipts and spending for major program areas resulted in a narrow range around Executive estimates and are explained in greater detail in the joint report available on the DOB website. The current DOB estimated budget gap of $4.3 billion in 2008-2009 is in the middle of a narrow range of budget gap estimates made public during the "quick start" process by th e Senate Minority ($4.0 billion) and the Assembly Minority ($4.8 billion).
Davis v. Kentucky: On May 21, 2007, the United States Supreme Court agreed to review the decision of the Court of Appeals of Kentucky in Davis v. Kentucky Dep’t of Revenue of the Finance and Admin. Cabinet, 97 S.W.3d 557 (2007), which held that the disparate state tax treatment of interest income on obligations issued by the State of Kentucky or its political subdivisions and obligations issued by other states or their political subdivisions violated the Commerce Clause of the United States Constitution. Currently, the vast majority of states employ a tax system that provides a preferential treatment that exempts the interest income earned on in-state municipal bonds from state taxation while subjecting the interest income earned on extraterritorially–issued bonds to state taxation.
If the Kentucky decision is affirmed by the United States Supreme Court, a state, including New York, could be required to eliminate any disparity between the tax treatment of obligations issued by such state and its political subdivisions or instrumentalities and the tax treatment of obligations issued by other states and their respective political subdivisions or instrumentalities. The Supreme Court decision could result in an estimated potential impact of up to $200 million in claims for tax refunds arising out of income tax payments made in prior years. The preliminary estimate of the financial impact on the state of discontinuing the practice of subjecting extraterritorially-issued municipal bonds to state income taxation is approximately $70 million of lost tax revenues annually.
On November 5, 2007, the Supreme Court heard oral arguments in the Davis case.
Governmental Accounting Standards Board Statement No. 45: The net positive asset condition is before the state reflects the impact of Governmental Accounting Standards Board Statement No. 45 "Accounting and Financial Reporting by Employers for Post-employment Benefits Other than Pensions” ("GASBS 45"). GASBS 45 requires state and local governments to reflect the value of post-employment benefits, predominantly health care, for current employees and retirees beginning with the financial statements for the 2007-2008 fiscal year.
New York used an independent actuarial consulting firm to calculate retiree health care liabilities. Assuming there is no pre-funding of this liability, the analysis indicates that the present value of the actuarial accrued total liability for benefits as of April 1, 2006 would be roughly $49.7 billion, using the level percentage of projected payroll approach under the Frozen Entry Age actuarial cost method. This is the actuarial methodology recommended to be used to implement GASBS 45. The actuarial accrued liability was calculated using a 4.2 percent annual discount rate.
New York’s total unfunded liability will be disclosed in the 2007-2008 basic financial statements. While the total liability is substantial, Governmental Accounting Standards Board (“GASB”) rules indicate it may be amortized over a 30-year period; therefore, only the annual amortized liability above the current pay-as-you-go costs would be recognized in the financial statements. Assuming no pre-funding, the 2007-2008 liability would total roughly $3.8 billion under the Frozen Entry Age actuarial cost method amortized based on a level percent of salary, or roughly $2.9 billion above the current pay-as-you-go retiree costs. This difference between the state’s pay-as-you-go costs and the actuarially determined required annual contribution under GASBS 45 would reduce the state’s currently positive net asset condition of roughly $49 billion at the end of 2006-2007.
58
GASB does not require the additional costs to be funded on the state’s budgetary basis, and no funding is assumed for this purpose in the state financial plan. On a budgetary (cash) basis, the state continues to finance these costs, along with all other employee health care expenses, on a pay-as-you-go basis.
As noted, the Mid-Year Financial Plan Update does not assume pre-funding of the GASBS 45 liability. If such liability were pre-funded at this time, the additional cost above the pay-as-you-go amounts would be lowered. The State’s Health Insurance Council, which consists of the Governor’s Office of Employee Relations, Civil Service, and DOB will continue to review this matter, seek input from the State Comptroller, the legislative fiscal committees and other outside parties.
The Debt Reform Act of 2000 imposed statutory limitations which restricted the issuance of state-supported debt to capital purposes only and established a maximum term of 30 years for such debt. The statute also imposed phased-in caps that ultimately limit the amount of new state-supported debt to 4 percent of state personal income and new state-supported debt service costs to 5 percent of All Funds receipts. The restrictions apply to all new state-supported debt issued on and after April 1, 2000.
The Debt Reform Act requires that the limitations on the amount of state-supported debt and debt service costs be calculated by October 31 of each year and reported in the Mid-Year Financial Plan Update. If the actual new state-supported debt outstanding and debt service costs are below the caps at this time, state-supported debt may continue to be issued. However, if either the debt outstanding or the debt service cap is met or exceeded, the state would be precluded from issuing new state-supported debt until the next annual cap calculation is made and debt is found to be within the applicable limitations.
For the 2006-2007 fiscal year, the cumulative debt outstanding and debt service caps are 2.98 percent each. In the Mid-Year Financial Plan Update, DOB reported that the actual level of debt outstanding and debt service costs continue to remain below the statutory caps. From April 1, 2000 through March 31, 2007 the state has issued new debt resulting in $17.8 billion of debt outstanding applicable to the debt reform cap. This is $7.5 billion below the statutory debt outstanding limitation. In addition, the debt service costs on this new debt totaled $1.4 billion in 2006-2007 – or roughly $1.9 billion below the statutory debt service limitation.
Current projections estimate that debt outstanding and debt service costs will continue to remain below the limits imposed by the Debt Reform Act throughout the current capital plan period. However, the amount of “room” permitted under the cap is projected to decline beginning after 2009-2010.
Public authorities are not subject to the constitutional restrictions on the incurrence of debt that apply to the state itself and may issue bonds and notes within the amounts and restrictions set forth in legislative authorization. The state's access to the public credit markets could be impaired and the market price of its outstanding debt may be materially and adversely affected if certain of its public authorities were to default on their respective obligations, particularly those issuing state-supported or state-related debt. As of December 31, 2006, the 19 public authorities with outstanding debt of $100 million or more had aggregate outstanding debt, including refunding bonds, of approximately $129 billion, only a portion of which constitutes state-supported or state-related debt.
The state has numerous public authorities with various responsibilities, including those which finance, construct and/or operate revenue-producing public facilities. Public authorities generally pay their operating expenses and debt service costs from revenues generated by the projects they finance or operate, such as tolls charged for the use of highways, bridges or tunnels, charges for public power, electric and gas utility services, rentals charged for housing units, and charges for occupancy at medical care facilities.
Also, there are statutory arrangements providing for state local assistance payments otherwise payable to localities to be made under certain circumstances to public authorities. Although the state has no obligation to provide additional assistance to localities whose local assistance payments have been paid to public authorities under these arrangements, the affected localities may seek additional state assistance if local assistance payments are diverted. Some authorities also receive moneys from state appropriations to pay for the operating costs of certain of their programs.
For the 2007 fiscal year, the City’s General Fund had an operating surplus of $4.67 billion, before discretionary and other transfers, and achieved balanced operating results in accordance with GAAP, after discretionary and other transfers. The 2007 fiscal year is the twenty-seventh consecutive year that the City has achieved balanced operating results when reported in accordance with GAAP.
The City’s expense and capital budgets for the 2008 fiscal year were adopted on June 15, 2007. The June Financial Plan, submitted to the New York State Financial Control Board (the “Control Board”) on June 20, 2007 (the “June Financial Plan”) which was consistent with the City’s expense and capital budgets as adopted for the 2008 fiscal year, projected
59
revenues and expenditures for the 2008 fiscal year balanced in accordance with GAAP, and projected gaps of $1.6 billion, $3.4 billion and $4.4 billion in fiscal years 2009 through 2011, respectively.
On October 26, 2007, the City submitted to the Control Board Modification No. 08-1 to the June Financial Plan (the June Financial Plan as so modified, the “Financial Plan”) and projects revenues and expenses for the 2008 fiscal year balanced in accordance with GAAP, and projects gaps of $2.7 billion, $4.8 billion and $6.5 billion in fiscal years 2009 through 2011, respectively.
The Financial Plan reflects decreases in projected net revenues since the June Financial Plan totaling $138 million, $577 million, $638 million and $852 million in fiscal years 2008 through 2011, respectively. The decreases reflect the projected impact of recent developments in the financial markets that are adversely affecting securities industry profitability and the number and value of real estate transactions that are consummated, resulting in reductions in real property transfer and personal and business income tax revenues. They also reflect a reduction in long-term economic growth forecasts for the United States and the City. Changes in projected tax revenues include (i) decreases in real property related transaction tax revenues of $256 million, $181 million, $226 million and $306 million in fiscal years 2008 through 2011, respectively; (ii) decreases in personal income tax revenues of $22 million, $272 million, $281 million and $426 million in fiscal years 2008 through 2011, respective ly; (iii) decreases in business income tax revenues of $75 million, $142 million, $105 million and $90 million in fiscal years 2008 through 2011, respectively; (iv) increases in sales tax revenues of $92 million in fiscal year 2008 and decreases in sales tax revenues of $6 million, $52 million and $58 million in fiscal years 2009 through 2011, respectively; (v) increases of $100 million in tax audit revenues in fiscal year 2008; and (vi) increases in hotel and all other non-property tax revenues of $22 million, $25 million, $25 million and $27 million in fiscal years 2008 through 2011, respectively.
The Financial Plan also reflects, since the June Financial Plan, increases in projected net expenditures totaling $158 million, $307 million, $786 million and $1.2 billion in fiscal years 2008 through 2011, respectively. Changes in projected expenditures include: (i) increases in labor costs totaling $90 million, $436 million, $1.1 billion and $1.6 billion in fiscal years 2008 through 2011, respectively, reflecting settlements of labor negotiations and the provision for similar increases for collective bargaining units not yet settled; (ii) increases in agency spending of $64 million, $28 million, $29 million and $30 million in fiscal years 2008 through 2011, respectively; (iii) an increase in debt service costs of $4 million in fiscal year 2008 and decreases in debt service costs of $32 million, $75 million and $50 million in fiscal years 2009 through 2011, respectively; and (iv) decreases in pension contributions of $125 million, $240 million and $350 million in fiscal years 2009 through 2011 , respectively, as a result of higher-than-assumed rates of return on the investment of pension assets.
The Financial Plan also reflects the enactment of some of the tax programs previously reflected in the tax reduction program in the June Financial Plan, reducing tax revenues by $222 million, $268 million, $292 million and $333 million in fiscal years 2008 through 2011, respectively. The enacted programs include (i) a childcare tax credit with an estimated cost of $42 million, $43 million, $44 million and $45 million in fiscal years 2008 through 2011, respectively, (ii) personal and small business income tax credits and reductions with an estimated cost of $70 million, $108 million, $109 million and $166 million in fiscal years 2008 through 2011, respectively; and (iii) the City sales tax exemption for clothing and footwear purchases with an estimated cost of $110 million, $117 million, $119 million and $122 million in fiscal years 2008 through 2011, respectively.
On July 1, 2008, the local sales tax, which is currently imposed by the State at the rate of 4%, will expire and, absent legislative action, a 3% local sales tax imposed by the City would be in effect. The Financial Plan assumes that the City will receive the legislative authorization to continue the local sales tax at the rate of 4%. If the City did not receive such authorization, sales tax revenues would be reduced by approximately $1.19 billion, $1.25 billion and $1.31 billion in fiscal years 2009 through 2011, respectively.
The Financial Plan also does not reflect additional expense budget costs that would be incurred, unless there is a change in applicable law, as a result of Statement No. 49 of the GASB, which becomes effective on July 1, 2008 relating to the accounting treatment of pollution remediation costs. Currently, many of these costs are included in the City’s capital budget and financed through the issuance of bonds. Preliminary estimates indicate that such additional expense budget costs could be approximately $500 million annually.
On October 30, 2007, the Director of Management and Budget of the City directed City agencies to submit spending reduction programs of 2.5% for fiscal year 2008 and 5% for fiscal year 2009 in controllable City-funded spending, in order to provide overall City budget relief of $500 million in fiscal year 2008 and $1 billion in fiscal year 2009. All City-funded hiring, other than hiring necessary for public health and safety, was frozen until such spending reduction programs are approved.
60
Implementation of the Financial Plan is dependent upon the City’s ability to market its securities successfully. Implementation of the Financial Plan is also dependent upon the ability to market the securities of other financing entities, including the New York City Municipal Water Finance Authority (the ‘‘Water Authority’’) and the New York City Transitional Finance Authority (the "TFA"). In addition, the City may issue revenue and tax anticipation notes to finance its seasonal working capital requirements. The success of projected public sales of City, Water Authority, TFA and other bonds and notes will be subject to prevailing market conditions. Future developments concerning the City and public discussion of such developments, as well as prevailing market conditions, may affect the market for outstanding City general obligation bonds and notes.
As described above, the Ohio Fund will invest most of its net assets in securities issued by or on behalf of (or in certificates of participation in lease-purchase obligations of) the state of Ohio (referred to herein as the "state" or "Ohio"), political subdivisions of the state, or agencies or instrumentalities of the state or its political subdivisions (Ohio Obligations). The Ohio Fund is therefore susceptible to general or particular economic, political or regulatory factors that may affect issuers of Ohio Obligations. The following information constitutes only a brief summary of some of the many complex factors that may have an effect. The information does not apply to “conduit” obligations on which the public issuer itself has no financial responsibility. This information is derived from official statements of certain Ohio issuers published in connection with their issuance of securities and from other publicly available information, and is believed to be accurate. No independen t verification has been made of any of the following information.
Generally, the creditworthiness of Ohio Obligations of local issuers is unrelated to that of obligations of the state itself, and the state has no responsibility to make payments on those local obligations.
There may be specific factors that at particular times apply in connection with investment in particular Ohio Obligations or in those obligations of particular Ohio issuers. It is possible that the investment may be in particular Ohio Obligations, or in those of particular issuers, as to which those factors apply. However, the information below is intended only as a general summary, and is not intended as a discussion of any specific factors that may affect any particular obligation or issuer.
Much of this information is as of September 25, 2007, particularly debt figures and other statistics.
Ohio is the seventh most populous state. The Census count for 2000 was 11,353,100, up from 10,847,100 in 1990.
While diversifying more into the service and other non-manufacturing areas, the Ohio economy continues to rely in part on durable goods manufacturing largely concentrated in motor vehicles and machinery, including electrical machinery. As a result, general economic activity, as in many other industrially-developed states, tends to be more cyclical than in some other states and in the nation as a whole. Agriculture is an important segment of the economy, with over half the state’s area devoted to farming and a significant portion of total employment in agribusiness.
In earlier years, the state’s overall unemployment rate was commonly somewhat higher than the national figure. For example, the reported 1990 average monthly state rate was 5.7%, compared to the 5.5% national figure. However, then through 1998 the annual state rates were below the national rates (4.3% vs. 4.5% in 1998), were again slightly higher in 1999 (4.3% vs. 4.2%) and 2000 (4.0% vs. 4.0%), lower in 2001 (4.2% vs. 4.7%) and in 2002 (5.7% vs. 5.8%) and higher in 2003 (6.2% vs. 6.0%), in 2004 (6.1% vs. 5.5%) and in 2005 (5.9% vs. 5.1%) . In May 2007, the state unemployment rate was higher than the national rate (5.7% vs. 4.5%) . The unemployment rate and its effects vary among geographic areas of the state.
There can be no assurance that future national, regional or state-wide economic difficulties, and the resulting impact on state or local government finances generally, will not adversely affect the market value of Ohio Obligations held in the Ohio Fund or the ability of particular obligors to make timely payments of debt service on (or lease payments relating to) those Obligations.
The state operates on the basis of a fiscal biennium for its appropriations and expenditures, and is precluded by law from ending its July 1 to June 30 fiscal year or fiscal biennium in a deficit position. Most state operations are financed through the General Revenue Fund (GRF), for which the personal income and sales-use taxes are the major sources. Growth and depletion of GRF ending fund balances show a consistent pattern related to national economic conditions, with the ending fiscal year balance reduced during less favorable and increased during more favorable economic periods. The state has well-established procedures for, and has timely taken, necessary actions to ensure resource/expenditure balances during less favorable economic periods such as the current fiscal biennium. Those procedures include general and selected reductions in appropriations spending.
The GRF ending fund balance for Fiscal Year 2007 was $215,534,000.
61
Recent biennium ending GRF balances were:
| | | | Fund Balance Less Designated |
| Biennium | Cash Balance | Fund Balance (a) | Transfers (b) |
| 1996-97 | $1,367,750,000 | $834,933,000 | $149,033,000 |
| 1998-99 | 1,512,528,000 | 976,778,000 | 221,519,000 |
| 2000-01 | 817,069,000 | 219,414,000 | 206,310,000 |
| 2002-03 | 396,539,000 | 52,338,000 | 52,338,000 |
| 2004-05 | 1,209,200,000 | 682,632,000 | 127,800,000 |
| 2006-7 | 1,432,925,000 | 215,534,000 | 215,534,000 |
| (a) | Reflects the ending cash balance less amounts encumbered to cover financial commitments made prior to the end of the fiscal year. |
| |
| (b) | Reflects the ending fund balance less amounts designated for transfer to other funds, including the BSF. |
| |
Actions have been and may be taken by the state during less favorable economic periods to ensure resource/expenditure balances (particularly in the GRF), some of which are described below. None of those actions were or are being applied to appropriations or expenditures needed for debt service or lease payments relating to any state obligations.
The appropriations acts for the 2006-07 biennium include all necessary appropriations for debt service on state obligations and for lease payments relating to lease rental obligations issued by the Ohio Building Authority and the Treasurer of state, and previously by the Ohio Public Facilities Commission.
The following is a selective general discussion of state finances, particularly GRF receipts and expenditures, for recent and current bienniums.
1996-97. From a higher than forecasted mid-biennium GRF fund balance, $100,000,000 was transferred for elementary and secondary school computer network purposes and $30,000,000 to a new State transportation infrastructure fund. Approximately $400,800,000 served as a basis for temporary 1996 personal income tax reductions aggregating that amount. Of the GRF biennium-ending fund balance, $250,000,000 was directed to school buildings, $94,400,000 to the school computer network, $44,200,000 to school textbooks and instructional materials and a distance learning program, $34,400,000 to the BSF, and $262,900,000 to the State Income Tax Reduction Fund (ITRF).
1998-99. GRF appropriations of approximately $36 billion provided for significant increases in funding for primary and secondary education. Of the first Fiscal Year (ended on June 30, 1998) ending fund balance of over $1.08 billion, approximately $701,400,000 was transferred to the ITRF, $200,000,000 into public school assistance programs, and $44,184,200 into the BSF. Of the GRF biennium-ending fund balance, $325,700,000 was transferred to school building assistance, $293,185,000 to the ITRF, $85,400,000 to SchoolNet (a program to supply computers for classrooms), $4,600,000 to interactive video distance learning, and $46,374,000 to the BSF.
2000-01. The State’s financial situation varied substantially in the 2000-01 biennium. The first Fiscal Year of the biennium ended with a GRF cash balance of $1,506,211,000 and a fund balance of $855,845,000. A transfer of $49,200,000 from that balance increased the BSF to $1,002,491,000 (or 5% of GRF revenue for the preceding Fiscal Year). An additional $610,400,000 was transferred to the ITRF.
In the middle of the second year of the biennium, the State enacted supplemental appropriations of $645,300,000 to address shortfalls in its Medicaid and disability assistance programs. The State’s share of this additional funding was $247,600,000, with $125,000,000 coming from Fiscal Year 2001 GRF spending reductions and the remainder from available GRF moneys. The reductions were implemented by OBM prior to March 1, 2001 applying a 1 to 2% cut to most State departments and agencies. Expressly excluded from the reductions were debt service and lease rental payments relating to State obligations, and elementary and secondary education.
In March 2001, new lowered revenue estimates for Fiscal Year 2001 and for Fiscal Years 2002 and 2003 were announced. Based on indications that the Ohio economy continued to be affected by the national economic downturn, GRF revenue estimates for Fiscal Year 2001 were reduced by $288,000,000. In addition, OBM projected higher than previously anticipated Medicaid expenditures. Among the more significant steps taken to ensure the positive GRF ending fund balance at June 30, 2001 were further spending reductions (with the same exceptions noted above for debt service and education) and authorization to transfer from the BSF to the GRF amounts necessary to ensure an ending GRF fund balance of $188,200,000. The State ended Fiscal Year 2001 with a GRF fund balance of $219,414,000, making that transfer unnecessary.
62
2002-03. Ongoing and rigorous consideration has been and continues to be given by the Governor and the General Assembly to revenues and expenditures for fiscal years 2002-03, primarily as a result of continuing weak economic conditions. Budgetary pressures have been primarily due to continuing lower than previously anticipated levels of receipts from certain major revenue sources.
Consideration came in four general time frames – the June 2001 biennial appropriation act, late fall/early winter 2001, late spring and summer 2002 and late winter/spring 2003. Significant remedial steps have included authorization to draw down and use the entire BSF balance, increased cigarette taxes, and use of tobacco settlement moneys previously earmarked for other purposes.
The biennial GRF appropriations act passed in June 2001 provided for biennial GRF expenditures of approximately $45.1 billion without increases in any major state taxes. That Act and the separate appropriations acts for the biennium included all necessary debt service and lease rental payments related to state obligations. That original appropriations act also provided for transfer to the GRF of $160,000,000 from the BSF and $100,000,000 from the Family Services Stabilization Fund, aimed at achieving fiscal year and biennium ending positive GRF fund balances, based on then current estimates and projections:
The Ohio economy continued to be negatively affected by the national economic downturn and by national and international events, and in October 2001 OBM lowered its GRF revenue estimates and projected GRF revenue shortfalls of $709,000,000 for fiscal year 2002 and $763,000,000 for current fiscal year 2003. Executive and legislative actions taken to address those shortfalls, included:
| * | Spending reductions and limits on hiring and major purchases. Governor ordered spending reductions were at the annual rate of 6% for most state agencies, with lesser reductions for correctional and other institutional agencies, and with exemptions for debt service related payments, primary and secondary education and the adjutant general. |
| |
| * | December 2001 legislation, the more significant aspects of which included authorizing the additional transfer of up to $248,000,000 from BSF to the GRF during the current biennium thereby reducing the BSF balance to an estimated $607,000,000; reallocating to the GRF a $260,000,000 portion of tobacco settlement receipts in Fiscal Year 2002 and 2003; and authorizing Ohio’s participation in a multi-state lottery game, estimated to generate $40,000,000 annually beginning in fiscal year 2003. |
| |
Continuing weak economic conditions and lower than anticipated personal income and corporate franchise tax receipts then led OBM in the spring of 2002 to project a higher than previously estimated GRF revenue shortfall with GRF estimated shortfalls of approximately $763,000,000 in fiscal year 2002 and $1.15 billion in fiscal year 2003. Further executive and legislative actions were taken to ensure positive GRF fund balances for Fiscal Year 2002 and the biennium. In addition to further appropriation reductions for certain departments and other management steps, those prior actions included legislation that provides for:
| * | Additional transfers to the GRS from the then remaining BSF balance ($607,000,000) as needed in fiscal years 2002 and 2003, and of $50,800,000 of unclaimed funds. |
| |
| * | A $50,000,000 reduction in the fiscal year 2002 ending GRS balance (to $100,000,000). |
| |
| * | Increased cigarette tax by 31¢ per pack (to a total of 55¢ per pack), estimated by OBM to produce approximately $283,000,000 in fiscal year 2003. |
| |
| * | Additional transfers to the GRF of $345,000,000 from tobacco settlement moniee received in fiscal years 2002 and 2003 previously earmarked for construction of elementary and secondary school facilities and replacing the monies for that in additionally authorized general obligations bonds. |
| |
| * | Extension of the state income tax to Ohio-based trusts, and "decoupling" certain Ohio business taxes from federal tax law “economic stimulus changes” affecting business equipment depreciation schedules to produce approximately $283,000,000 in fiscal year 2003. |
| |
Fiscal year 2002 ended with positive GRF balances of $108,306,000 (fund) and $619,217,000 (cash) based on the remedial steps described above, including transfers of $289,600,000 from tobacco settlement moneys and $534,600,000 from the BSF (leaving fiscal year 2002 ending BSF balance $427,904,000, with all but $65,255,000 of that balance already committed and appropriated to GRF use if needed in fiscal year 2003).
On July 1, 2002, the Governor issued an executive order directing a total of approximately $375,000,000 in GRF spending cutbacks for fiscal year 2003 reflecting prior budget balancing discussions with the General Assembly. Excluded from those
63
department and agency cutbacks ranging up to 15% were elementary and secondary education, higher education, alcohol and drug addiction services, and the adjutant general. Also expressly excluded were debt service and lease rental payments relating to state obligations, and ad valorem property tax relief payments (made to local taxing entities).
Based on continuing reduced revenue collections (particularly, personal income taxes and sales tax receipts for the holidays) and projected additional Medicaid spending, OBM in late January 2003 announced an additional Fiscal Year 2003 GRF revenue shortfall of $720,000,000. The Governor ordered immediate additional reductions in spending expected to aggregate $121,600,000 of GRF savings through the end of the fiscal year (expressly excepted were appropriations for or relating to debt service on state obligations).
The Governor also proposed for the General Assembly’s enactment by March 1, 2003, the following additional revenue enhancements, transfers and expenditure reduction for fiscal year 2003 to achieve a positive GRF fund balance at June 30, 2003 as then estimated by OBM:
| * | An additional 2.5% reduction in local government fund distributions to most subdivisions and local libraries, producing an estimated $30,000,000 savings. |
| |
| * | Transfers of $56,400,000 to the GRF from unclaimed funds and various rotary funds. |
| |
| * | A one-month acceleration in sales tax collections by vendors filing electronically, to produce $286,000,000. |
| |
To offset the General Assembly’s enactment of legislation that did not include the proposed additional taxes on cigarettes and liquor, beer and wine, the Governor on March 25 ordered additional reductions in GRF appropriations spending aggregating $142.5 million for the balance of fiscal year 2003. Included are reductions (generally at an annualized rate of 2.5%) of $90.6 million in state foundation and parity aid to school districts and an additional $9.3 million in Department of Education administration spending, $39.2 million in instructional support to higher education institutions, and other selected reductions totaling $3.4 million. The Governor also identified approximately $20 million in excess food stamp administration funds available to offset the need for further expenditure reductions. Expressly excepted from those reductions are appropriations for or relating to debt service on state obligations.
Based on the Administration’s continuing monitoring of revenues, and as an anticipated step in the 2004-05 biennial budget and appropriations process, OBM reported revised revenue estimates to the Conference Committee on June 11, 2003. Those estimates reduced fiscal year 2003 revenues downward by an additional $200,000,000 from OBM’s January 2003 adjusted baseline, based primarily on updated income and sales tax receipts through May 31. The Governor and OBM are addressing this additional fiscal year 2003 revenue shortfall through additional expenditure controls, and by drawing upon $193,030,000 of federal block grant aid available to the state prior to June 30 under a federal law which took effect on May 28, 2003.
The state ended the 2002-03 biennium with a GRF fund and cash balances of $52,338,000 and $396,539,000, respectively, and a balance in the BSF of $180,705,000.
Additional appropriations actions during the 2002-03 biennium, affecting most subdivisions and local libraries in the state, relate to the various local government assistance funds. The original appropriations act capped the amount to be distributed in fiscal years 2002 and 2003 to essentially the equivalent monthly payment amounts in fiscal years 2000 and 2001. Subsequent legislation amended the level to the lesser of those prior fiscal year amounts or the amount that would have been distributed under the standard formula.
2004-05. The GRF appropriations act for the 2004-05 biennium was passed by the General Assembly and signed (with selective vetoes) by the Governor in June 2003. The Act provided for total GRF biennial revenue of approximately $48.95 billion and total GRF biennial expenditures of approximately $48.79 billion. That Act and the separate appropriations acts for the biennium included all necessary payments related to state obligations.
Among other expenditure controls, the Act included Medicaid cost containment measures including pharmacy cost management initiatives, limited expenditure growth for institutional services and implementation of managed care for higher-cost populations; continued phase-out of certain tangible personal property tax relief payments to local governments; the closing by consolidation of three institutional facilities during the biennium; adjustments in eligibility guidelines for subsidized child care from 185% to 150% of the federal poverty level and freezing certain reimbursement rates; no compensation increases for most State employees in Fiscal Year 2004 and limited one-time increases in Fiscal Year 2005; and continued limitation on local government assistance fund distributions to most subdivisions and local libraries to the lesser of the equivalent monthly payments in Fiscal Year 2003 or the amount that would have been distributed under the standard formula.
64
The GRF expenditure authorizations for the 2004-05 biennium reflected and were supported by revenue enhancement actions contained in the Act including:
- A one-cent increase in the state sales tax (to six percent) for the biennium (expiring June 30, 2005), projected to generate approximately $1.25 billion in each Fiscal Year.
- Expansion of the sales tax base to include dry-cleaning/laundry services, towing, personal care and other services, and satellite television, projected in the aggregate to produce approximately $69,000,000 annually. (The inclu- sion of satellite television in the sales tax base, projected to produce approximately $21,000,000 annually, is sub- ject to an ongoing legal challenge.)
- Moving local telephone companies from the public utility tax base to the corporate franchise and sales tax, pro- jected to produce approximately $29,000,000 annually.
- Elimination of the sales tax exemption for WATS and 800 telecom services coupled with the enactment of a more limited exemption for call centers, projected to produce approximately $64,000,000 annually.
- Adjustments in the corporate franchise tax through the adoption of the Uniform Division of Income for Tax Pur- poses Act (UDITPA) for apportionment of business income among states, and an increase in the corporate alterna- tive minimum tax, projected in the aggregate to produce approximately $35,000,000 annually.
The Act also authorized and June 30, 2004 OBM transferred $234,700,000 of proceeds received from the national tobacco settlement into the GRF. In addition, the Act authorized the draw down during the biennium of federal block grant and Medicaid assistance aid made available to the State under a federal law effective May 28, 2003. OBM drew down $211,600,000 and $316,800,000 of those federal monies in fiscal years 2004 and 2005, respectively.
Based on regular monitoring of revenues and expenditures, OBM on March 8, 2004 announced revised GRF revenue projections for Fiscal Years 2004 and 2005 based primarily on reduced revenue collections from personal income taxes. In response to OBM reducing its GRF revenue projection by $247,100,000 (1.02%) for Fiscal Year 2004 and by $372,700,000 (1.48%) for Fiscal Year 2005, the Governor ordered Fiscal Year 2004 expenditure reductions of approximately $100,000,000. On July 1, the Governor ordered additional Fiscal Year 2005 expenditure cuts of approximately $118,000,000 and a reduction of $50,000,000 in State spending on Medicaid reflecting an increased Federal share of certain Medicaid services. Expressly excluded from those reductions were debt service and lease rental payments relating to state obligations, state basic aid to elementary and secondary education, instructional subsidies and scholarships for public higher education, in-home care for seniors and certain job creation programs. The balance of those revenue reductions were offset by GRF expenditure lapses and, for Fiscal Year 2005, elimination of an anticipated $100,000,000 year-end transfer to the BSF while maintaining a one-half percent year-end GRF fund balance.
The State ended Fiscal Year 2004 with a GRF fund balance of $157,509,000. Improving economic conditions had a positive effect on revenue in Fiscal Year 2005. With GRF revenue receipts modestly outperforming estimates for much of the Fiscal Year, OBM in June 2005 increased its GRF revenue estimates by $470,700,000. Final Fiscal Year 2005 GRF revenue came in $67,400,000 above that revised estimate. With Fiscal Year 2005 spending close to original estimates, the State made the following Fiscal Year-end allocations and transfers: $60,000,000 to address a prior-year liability in the Temporary Assistance to Needy Families program; $40,000,000 to a disaster services contingency fund; $50,000,000 to the State’s share of the school facilities construction program; and $394,200,000 to the BSF. After these and certain smaller transfers, the State ended Fiscal Year 2005 and the biennium with a GRF fund balance of $127,800,000 and a BSF balance of $574,205,000.
2006-07. Consistent with State law, the Governor’s Executive Budget for the 2006-07 biennium was released in February 2005 and introduced in the General Assembly. After extended hearings and review, the GRF appropriations Act for the 2006-07 biennium was passed by the General Assembly and signed (with selective vetoes) by the Governor on June 30, 2005. That Act provided for total GRF biennial revenue of approximately $51.5 billion (a 3.8% increase over the 2004-05 biennial revenue) and total GRF biennial appropriations of approximately $51.3 billion (a 5.0% increase over the 2004-05 biennial expenditures). Spending increases for major program categories over the 2004-05 actual expenditures were: 5.8% for Medicaid (the Act also included a number of Medicaid reform and cost containment initiatives); 3.4% for higher education; 4.2% for elementary and secondary education; 5.5% for corrections and youth services; and 4.8% for mental health and mental retardation. The Executive Budget, th e GRF appropriations Act and the separate appropriations acts for the biennium included all necessary debt service and lease rental payments related to State obligations.
The GRF expenditure authorizations for the 2006-07 biennium reflected and were supported by a significant restructuring of major State taxes, including:
65
- A 21% reduction in State personal income tax rates phased in at 4.2% per year over the 2005 through 2009 tax years.
- Phased elimination of the State corporate franchise tax at a rate of approximately 20% per year over the 2006 through 2010 tax years (except for its continuing application to financial institutions and certain affiliates of insurance companies and financial institutions).
- Implementation of a new commercial activity tax (CAT) on gross receipts from doing business in Ohio that is being phased in over the 2006 through 2010 tax years. When fully phased in, the CAT will be levied at a rate of 0.26% on gross receipts in excess of $1,000,000. (The inclusion of wholesale and retail food sales for off-premise consumption, projected to produce approximately $140,000,000 annually once the CAT is fully-phased in, is subject to a legal challenge.)
- A 5.5% State sales and use tax (decreased from the 6.0% rate for the 2004-05 biennium).
- An increase in the cigarette tax from $0.55 per pack (of 20 cigarettes) to $1.25 per pack.
The then Governor signed into law on June 5, 2006 legislation enacted by the General Assembly imposing a limitation on most GRF appropriations commencing with the 2008-09 biennium. This statutory limitation initially uses Fiscal Year 2007 GRF appropriations as a baseline and then applies an annual growth factor of the greater of 3.5% or the sum of the inflation rates and rate of State population change. Every fourth fiscal year thereafter becomes a new base year. GRF appropriations for State debt service payments are expressly excepted from this statutory limitation. This legislation was enacted as an alternative to a proposed “tax and expenditure limitation” (TEL) amendment to the Ohio Constitution that was withdrawn from the November 2006 general election ballot.
The State ended Fiscal Year 2006 with a GRF cash balance of $1,528,812,000 and a GRF fund balance of $1,025,967,000. Of that ending GFR fund balance, the State carried forward $631,933,000 to cover the expected and planned for variance of Fiscal Year 2007 GFR appropriations over estimated revenue, to offset the one-time cost of accelerating the phase-in of reductions in State personal income tax withholding rates, and to maintain 0.5% of Fiscal Year 2007 GFR revenue as an ending fund balance. The remaining $394,034,000 was deposited into the BSF increasing its balance to $1,012,289,000 (which includes $40,045,000 in receipts collected from a broad tax amnesty initiative and deposited in June 2006). The State ended Fiscal Year 2007 with a GRF cash balance of $1,432,925,000 and a GRF fund balance of $215,534,000.
Current Biennium. Consistent with State law, the Governor’s Executive Budget for the 2008-09 biennium was released in March 2007 and introduced in the General Assembly. After extended hearings and review, the GRF appropriations Act for the biennium was passed by the General Assembly and signed (with selective vetoes) by the Governor on June 30, 2007. Reflecting the continued implementation of the restructuring of State taxes commenced in 2006-07, that Act provides for total GRF biennial revenue of approximately $53.5 billion (a 3.9% increase over the 2006-07 biennial revenue) and total GRF biennial appropriations of approximately$52.4 billion (a 2.1% increase over the 2006-07 biennial expenditures). Spending increases for major program categories over the 2006-07 actual expenditures are: 2.2% for Medicaid (the Act also included a number of Medicaid reform and cost containment initiatives); 13.2% for higher education; 5.25% for elementary and secondary education; 4.92% for correction s and youth services; and 4.7% for mental health and mental retardation. The Executive Budget and the GRF appropriations Act complied with the law discussed above under 2006-07 limiting appropriations for the 2008-09 biennium and all of the Executive Budget, the GRF appropriations Act and the separate appropriations acts for the biennium included all necessary debt service and lease rental payments related to State obligations.
The GRF expenditure authorizations for the 2008-09 biennium reflected and were supported by tax law changes contained in the Act, including:
- Restructure nonresident tax exemption for Ohio motor vehicle purchases projected to produce approximately $54.0 million over the biennium.
- Restored local government fund support by committing a set percent of all tax revenues deposited into the GRF. Local governments will receive 3.7% of total GRF tax revenues annually and local libraries will receive 2.22% of total GRF tax revenues annually.
- Eliminate the $300 per month cigarette and tobacco product importation exemption projected to produce approximately $25.0 million annually.
The GRF appropriations Act also created the Buckeye Tobacco Settlement Financing Authority to securitize of tobacco settlement receipts payable to the State under the November 1998 national tobacco settlement. The Authority is a body both corporate and politic created for the sole purpose of purchasing and receiving any assignment of the tobacco settlement receipts and issuing obligations to fund that purchase. The Authority is authorized to issue up to $6 billion of
66
obligations ($5.5 billion is currently contemplated) to fund capital expenditures for higher education and common school purposes for the next three to five years. Those obligations will be payable solely from tobacco receipts and will replace general obligation bond financing otherwise scheduled to be issued over the next three years to fund those capital expenditures. The resulting debt service savings to the GRF from avoiding the issuance of general obligation bonds is to be applied to funding the homestead exemption property tax relief program in the Act. The Act reprograms all prior General Assembly allocations of those anticipated tobacco receipts to support the payment of debt service on the Authority’s obligations. The State had previously enacted legislation allocating all of its anticipated share of those receipts through Fiscal year 2012 and making a partial allocation thereafter through Fiscal year 2025. Except for Fiscal Years 2002 through 2004, none of the receipts were appli ed to existing operating programs of the State. Under those previously enacted allocations, the largest amount was to be applied to elementary and secondary school capital expenditures, with other amounts allocating for smoking cessation and other health-related purposes, biomedical research and technology transfer, and assistance to the tobacco growing areas in the State.
OBM continually monitors and analyzes revenues and expenditures and prepares a financial report summarizing its analyses at the end of each month. The most recent Monthly Financial Reports are accessible via OBM’s home page on the Internet at http://www.obm.ohio.gov/finrep, and copies are available upon request to OBM.
The incurrence or assumption of debt by the state without a popular vote is, with limited exceptions, prohibited by the state Constitution. The state may incur debt to cover casual deficits or to address failures in revenues or to meet expenses not otherwise provided for, but limited in amount to $750,000. The Constitution expressly precludes the state from assuming the debts of any county, city, town or township, or of any corporation. (An exception in both cases is for debts incurred to repel invasion, suppress insurrection, or defend the state in war.) The Constitution provides that “Except the debts above specified . . . no debt whatever shall hereafter be created by, or on behalf of the state.”
By 18 constitutional amendments approved from 1921 to present, Ohio voters have authorized the incurrence of state general obligation (GO) debt and the pledge of taxes or excises to its payment, all related to capital facilities financing, except for three that funded bonuses for veterans and one that funded coal technology research and development, and one for research and development activities. Currently, tax-supported debt is authorized to be incurred for the following purposes: highways, local infrastructure, coal development, natural resources, higher education, common schools, conservation, research and development, and site development. Although supported by the general obligation pledge, highway debt is backed by a pledge of and has always been paid from the state’s motor fuel taxes and other highway user receipts that are constitutionally restricted in use to highway related purposes.
A 1999 constitutional amendment provides an annual debt service “cap” applicable to future issuances of state general obligation bonds and other state direct obligations payable from the GRF or net state lottery proceeds. Generally, and except for the additional $650,000,000 of general obligation debt approved by the voters at the November 8, 2005 election for research and development and the development of sites and facilities, new obligations may not be issued if future fiscal year debt service on those new and the then outstanding bonds of those categories would exceed 5% of the total estimated GRF revenues plus net state lottery proceeds during the fiscal year of issuance. Those direct obligations of the state include, for example, special obligation bonds that are paid from GRF appropriations, but exclude bonds such as highway bonds that are paid from highway user receipts. Pursuant to the amendment and implementing legislation, the Governor has designated the OBM Director as the state official to make the 5% determinations and certifications. Application of the cap may be waived in a particular instance by a three-fifths vote of each house of the General Assembly and may be changed by future constitutional amendments.
In addition to its issuance of highway bonds, the state has also financed selected highway infrastructure projects by issuing bonds and entering into agreements that call for debt service payments to be made from federal transportation funds allocated to the state, subject to biennial appropriations by the General Assembly. The highest annual State payment under those agreements in the current or any future fiscal year is $98,922,033 in Fiscal Year 2008. In the event of any insufficiency in the anticipated federal allocations to make payments on state bonds, the payments are to be made from any lawfully available moneys appropriated to ODOT for the purpose.
State agencies also have participated in buildings and equipment information systems and non-highway transportation projects that have local as well as state use and benefit, in connection with which the state has entered into lease-purchase agreements with terms ranging from 7 to 20 years. Certificates of participation (COPs) have been issued in connection with those agreements that represent fractionalized interests in and are payable from the state’s anticipated payments. The maximum annual payment under those agreements, made from GRF appropriations, is $15,941,949 in Fiscal Year 2008 and the total GRF-supported principal amount outstanding is $130,130,000. Payments by the state are subject to biennial appropriations by the General Assembly with the lease terms subject to renewal if appropriations are made. The OBM
67
Director’s approval of such agreements is required, particularly if COPs are to be publicly-offered in connection with those agreements.
A statewide economic development program assists the financing of facilities and equipment for industry, commerce, research and distribution, including technology innovation, by providing loans and loan guarantees. The law authorizes the issuance of state bonds and notes secured by a pledge of portions of the state profits from liquor sales. The General Assembly has authorized the issuance of these obligations with a general maximum of $500,000,000 to be outstanding at any one time. The aggregate amount from the liquor profits to be used in any fiscal year in connection with these bonds may not exceed $45,000,000. The total of unpaid guaranteed loan amounts and unpaid principal of direct loans may not exceed $800,000,000. Pursuant to a 2000 constitutional amendment, the state has issued $100,000,000 of bonds for revitalization purposes that are also payable from state liquor profits. The maximum annual debt service on all state bonds payable from state liquor profits is $39,573,516 in Fiscal Ye ar 2008.
Certain state agencies issue revenue bonds that are payable from revenues from or relating to revenue producing facilities, such as those issued by the Ohio Turnpike Commission. By judicial interpretation, such revenue bonds do not constitute “debt” under the constitutional provisions described above. The Constitution authorizes state bonds for certain housing purposes (issued by the Ohio Housing Finance Agency) to which tax moneys may not be obligated or pledged.
Litigation, was commenced in the Ohio courts in 1991 questioning the constitutionality of Ohio’s system of school funding and compliance with the constitutional requirement that the state provide a “thorough and efficient system of common schools”. On December 11, 2002, the Ohio Supreme Court, in a 4-3 decision on a motion to reconsider its own decision rendered in September 2001, concluded (as it had in its 1997 and 2000 opinions in that litigation) that the state did not comply with that requirement, even after again noting and crediting significant state steps in recent years.
In its prior decisions, the Ohio Supreme Court stated as general base threshold requirements that every school district have enough funds to operate, an ample number of teachers, sound and safe buildings, and equipment sufficient for all students to be afforded an educational opportunity.
With particular respect to funding sources, the Court concluded in 1997 and 2000 decisions that property taxes no longer may be the primary means of school funding in Ohio.
On March 4, 2003, the plaintiffs filed with the original trial court a motion to schedule and conduct a conference to address compliance with the orders of the court in that case, the state petitioned the Ohio Supreme Court to issue a writ prohibiting that conference on compliance, and the trial court subsequently petitioned the Ohio Supreme Court for guidance as to the proper course to follow. On May 16, 2003, the Ohio Supreme Court granted that writ and ordered the dismissal of the motion before the trial court. On October 20, 2003, the United States Supreme Court declined to accept the plaintiff’s subsequent petition requesting further review of the case.
The General Assembly has taken several steps, including significantly increasing state funding for public schools. In addition, at the November 1999 election electors approved a constitutional amendment authorizing the issuance of state general obligation debt for school buildings and for higher education facilities. December 2000 legislation addressed certain mandated programs and reserves, characterized by the plaintiffs and the Court as “unfunded mandates.”
Under the current financial structure, Ohio’s 613 public school districts and 49 joint vocational school districts receive a major portion (but less than 50%) of their operating moneys from state subsidy appropriations (the primary portion of which is known as the Foundation Program) distributed in accordance with statutory formulae that take into account both local needs and local taxing capacity. The Foundation Program amounts have steadily increased in recent years, including small aggregate increases even in those fiscal years in which appropriations cutbacks were imposed.
School districts also rely upon receipts from locally voted taxes. In part because of provisions of some state laws, such as that partially limiting the increase (without further vote of the local electorate) in voted property tax collections that would otherwise result from increased assessed valuations, some school districts have expressed varying degrees of difficulty in meeting mandated and discretionary increased costs. Local electorates have largely determined the total moneys available for their schools. Locally elected boards of education and their school administrators are responsible for managing school programs and budgets within statutory requirements.
The state’s present school subsidy formulas are structured to encourage both program quality and local taxing effort. Until the late 1970’s, although there were some temporary school closings, most local financial difficulties that arose were successfully resolved by the local districts themselves by some combination of voter approval of additional property tax levies, adjustments in program offerings, or other measures. For more than 20 years, requirements of law and levels of state funding have sufficed to prevent school closings for financial reasons, which in any case are prohibited by current law.
68
To broaden the potential local tax revenue base, local school districts also may submit for voter approval income taxes on the district income of individuals and estates (and effective July 1, 2005, municipal income taxes that may be shared with school districts). Many districts have submitted the question, and income taxes are currently approved in 145 districts.
Biennial school funding state appropriations from the GRF and Lottery Profits Education Fund (but excluding federal and other special revenue funds) for recent biennia were:
1996-97 – $10.1 billion representing a 13.6% increase over the preceding biennium total.
1998-99 – $11.6 billion (18.3% over the previous biennium).
| 2000-01 – $13.3 billion (15% over the previous biennium). |
2002-03 – $15.2 billion (17% over the previous biennium before the expenditure reductions). 2004-05 – $15.7 billion (3.3% over the previous biennium before the expenditure reductions). 2006-07 – $16.4 billion (4.5% over the previous biennium before the expenditure reductions).
State appropriations for the purpose made for the 2008-09 biennium are $17.2 billion (4.9% over the previous biennium), representing an increase of 1.7% in Fiscal Year 2008 over 2007 and 3.8% in Fiscal Year 2009 over 2008.
Those total state 2008-09 biennial appropriations exclude non-GRF and federal appropriations, but include appropriations from the GRF and the lottery profits education fund (LPEF). The amount of lottery profits transferred to the LPEF totaled $648,106,000 in Fiscal Year 2004, $645,137,000 in Fiscal Year 2005, $646,276,000 in Fiscal Year 2006 (which excludes $5,820,000 transferred to the Deferred Prize Trust Fund) and $669,327,000 in Fiscal Year 2007. Ohio’s participation in the multi-state lottery commenced in May 2002. A constitutional provision requires that net lottery profits be paid into LPEF to be used solely for the support of elementary, secondary, vocational and special education purposes, including application to debt service on general obligation bonds to finance common school facilities.
In response to the 1997 Ohio Supreme Court decision holding certain provisions for local school district borrowing unconstitutional, the General Assembly created the school district solvency assistance program. Beginning in Fiscal Year 1999, local school districts in fiscal emergency status as certified by the Auditor of State could apply for an advancement of future year Foundation Program distributions. The amount advanced was then deducted, interest free, from the district’s foundation payments over the following two-year period. Six school districts received a total of approximately $12,100,000 in solvency assistance advancements during Fiscal Year 1999, with another six districts receiving a total of approximately $8,657,000 in Fiscal Year 2000. This solvency assistance program was held to be not in compliance with the Constitution by the Supreme Court. In Fiscal Year 2001 four districts received approximately $3,800,000 under a restructured solvency assistance program. The program wa s further modified in December 2000 to allow districts that experience an unforeseen catastrophic event to apply for a grant. In Fiscal Year 2006 no districts received catastrophic grants and one district received a solvency advance in the amount of $41,000. In Fiscal Year 2007 two districts received solvency advances in the amount of $16,937,000 and no district received catastrophic grants.
Legislation was enacted in 1996 to address school districts in financial straits. It is similar to that for municipal "fiscal emergencies" and “fiscal watch”, but is particularly tailored to certain school districts and their then existing or potential fiscal problems. There are currently ten school districts in fiscal emergency status and fifteen in fiscal watch status. New legislation has created a third, more preliminary, category of “fiscal caution.” A current listing of school districts in each status is on the Internet at http://www.auditor.state.oh.us.
Ohio’s 943 incorporated cities and villages rely primarily on property and municipal income taxes to finance their operations. With other subdivisions, they also receive local government support and property tax relief moneys from state resources.
For those few municipalities and school districts that on occasion have faced significant financial problems, there are statutory procedures for a commission composed of stat and local officials, and private sector members experienced in business and finance appointed by the Governor to monitor the fiscal affairs and for development of a financial plan to eliminate deficits and cure any defaults. (Similar procedures have recently been extended to counties and townships.) Sixteen municipalities and two townships are in “fiscal emergency” status and four municipalities in preliminary “fiscal watch” status.
At present the state itself does not levy ad valorem taxes on real or tangible personal property. Those taxes are levied by political subdivisions and local taxing districts. The Constitution has since 1934 limited the amount of the aggregate levy of ad valorem property taxes on particular property, without a vote of the electors or a municipal charter provision, to 1% of true value in money, and statutes limit the amount of that aggregate levy without a vote or charter provision to 10 mills
69
per $1 of assessed valuation -- commonly referred to in the context of Ohio local government finance as the "ten-mill limitation."
Over the past decade, the structure of the Rhode Island economy has changed dramatically from a manufacturing based economy to being dominated by health services and tourism, with health services being the largest industry sector in Rhode Island. From FY 1997 to FY 2002, annual increases in expenditures were funded in part by substantial opening surpluses due to general economic conditions. During FY 2002 and FY 2003, the State’s economy and tax revenues were adversely impacted by the regional and national economic slowdown. Accordingly, the FY 2002 and FY 2003 budgets were balanced using increases in personal and corporate income taxes and the State’s gas tax and the one-time proceeds from the tobacco securitization initiative. Similarly, the FY 2004 budget was principally balanced using a one-time $102 million Federal aid grant made available as part of the Jobs and Growth Act of 2003. The General Assembly used these additional funds to finance Medicaid expenditures that would have otherwise been supported with general revenue funds, thereby freeing up the State’s resources to balance the budget. To compensate for the non-recurring Federal funds received in FY 2004 and to balance the FY 2005 budget, the State attempted to control capital expenditures, cut funding to certain State programs and increase business licensing collections through greater statutory enforcement. The State’s attempts to control expenditures persists at present, and are embodied in Governor Carcieri’s “Big Audit” of the state government which is designed to reduce costs, increase efficiency, and improve the delivery of state services. Through the so-called Fiscal Fitness program, this Big Audit is expected to save taxpayers $490 million by the end of this decade. Through FY 2007 the Fiscal Fitness program has resulted in savings of over $275 million. For FY 2008, Governor Carcieri’s most significant proposal is a $200 million “Deficit Reduction Plan: Building a Better Future for Rhode Island” which includes a major workforce reduction and significant reforms involving contract savings in fringe benefits and work-rules aimed at reigning in the costs of this major perennial recipient of the State’s budget expenditures.
The FY 2008 State budget, as enacted, calls for expenditures of $6.977 billion. This amount represents an increase of $312.5 million from the FY 2007 enacted budget, or an increase of 4.7% . As presented, the FY 2008 state budget would grow faster than inflation (2.2%) and personal icome (4.5%) . Grants and benefit programs to individuals continue to represent the largest and fastest growing portion of the State budget. Entitlement spending accounts for roughly 35 cents of every new dollar spent since FY 1998. FY 2008 spending on this category amounts to $2.84 billion, or roughly 40% of total budgeted expenditures. The State’s Medicaid expenditures per capita are among the highest in the nation and the State has also underperformed when compared with the rest of the country in moving people from welfare to the workforce. Personnel expenditures are the second largest portion of the state budget. Personnel costs in FY 2008 equal $1.7 billion, a 7.1% net increase from the FY 2007 revised pers onnel budget. The third major category of state budgetary spending is local aid, totaling $1.31 billion, or roughly 19% of total expenditures.
The FY 2008 State budget, as enacted, includes $238.8 million for general State aid to local governments, as the Governor recommended to fund communities at the same level as FY 2007, with the exception of the car tax reimbursement program. The largest category of State local aid to cities and towns involves assistance programs for school operations and school buildings. In addition to school aid, the State provides a general revenue sharing program for local governments ($65.1 million in FY 2008), which is intended for direct property tax relief and incorporates a distribution formula based upon relative population, tax effort and personal income of each municipality. The State also provides municipal aid programs which include a payment-in-lieu-of-taxes (PILOT) program ($27.8 million for FY 2008) and reimbursement to local governments for their cost of carrying out certain State mandates, including the phase out of the motor vehicle excise tax. In addition to direct aid to municipalities and school districts, in FY 2004 the State established a 1.0% meals and beverage tax to be distributed to municipalities which is expected to generate at least $10 million annually statewide.
Approximately 48.5% of the State’s spending plan under the FY 2008 budget is supported with general unrestricted State revenues generated by personal income, general business and sales and use taxes totaling $3.42 billion, with personal income and sales and use taxes providing roughly $2.0 billion of that amount. Approximately 29.0% of the State’s budget comes from the Federal government, mostly in the form of Medicaid funds, while other funds, primarily university and college funds and employment and training funds, represent about 20.0%, and restricted funds generated by fees and charges dedicated to specific programs represent about 2.2% of resources.
In November 2005, Standard and Poor’s Corporation upgraded its rating of general obligation bonds issued by Rhode Island from an “AA-” rating to “AA”. Fitch Investor’s Service also maintains an “AA” rating for the State while Moody’s has maintained an “Aa3” rating since September 1999. All three ratings were affirmed in August 2007.
Below the level of state government, Rhode Island is divided into 39 cities and towns which exercise the functions of local general government. As provided in the State Constitution, these municipalities have the right of self government in all
70
local matters by adopting a “home rule” charter. Every city or town, however, has the power to levy, assess and collect taxes or borrow money, only as specifically authorized by the General Assembly. Legislation enacted in 1985 limits tax levy or rate increases of greater than 5 ½% over the previous year. However, tax levy or rate increases of greater than 5 ½% are permitted in the event that debt service costs on present and future general obligation debt increase at a rate greater than 5 ½%. This limitation may also be exceeded in the event of loss of non-property tax revenue certified by the State Auditor General. In addition, State statutes require every city and town to adopt a balanced budget for each fiscal year. Local governments rely principally upon state aid, general real and tangible personal property taxes and automobile excise taxes (currently being phased out pursuant to a State mandate) for revenue.
In addition to state aid, one major source of revenues for cities and towns is its real property tax base. Like much of the nation, until recently, Rhode Island experienced rapid appreciation in median home prices. Over calendar year 2005, the median home sales price of existing single-family homes rose 7.5% in Rhode Island. In recent history, this property tax base allowed cities and towns more flexibility in increasing revenue to meet debt and other financial obligations. The rate of home price appreciation, however, has slowed steadily since 2005, and at times during 2006 fell below one percent. As of August, 2007, prices of single-family houses in Rhode Island had declined during twelve of the previous thirteen months. The median price of a single-family house in August dipped 5.6% compared with August, 2006 while sales of single family houses declined 11.7% during that same time period. The inventory of unsold single-family houses climbed to about a 10-month supply as of the last week in A ugust of this year.
Of concern to the State and its cities and towns is the rapid increase in health and other benefit costs, personnel costs, and the slowing housing markets. The FY 2008 budget includes the “Deficit Reduction Plan: Building a Better Future for Rhode Island” which calls for a reduction in the size of the state workforce roughly equivalent to over 400 full-time positions, increasing efficiencies and streamlining the State’s personnel costs all in an attempt to trim approximately $200 million from the State’s budget deficit. Also of concern is the level of spending growth and projected out-year deficits and related fiscal implications. Due to Federal tax cuts, ballooning deficits, and the diversion of funds to the Middle East situation, it will be difficult for states to find fiscal relief from the Federal government. This will, in turn, make it more difficult for cities and towns to seek help from the State. As a result, Rhode Island, as is the case with most other states, is re lying more heavily on prudent fiscal management and reductions in government spending in balancing the budgets of the State and its cities and towns.
The West Virginia Constitution prohibits the issuance of debt, except as authorized by constitutional amendment ratified by the voters. For general obligation bonds, debt limits are established in the constitutional amendment authorizing the debt. For special obligation bonds and mortgages, debt limits are established at the individual issuer level, either by a ceiling on the amount of bonds authorized or the amount of funding for debt service.
The Business and Occupation Tax, the Personal Income Tax, the Consumer Sales and Use Tax, the Minerals Severance Tax, the Corporate Net Income Tax and the Business Franchise Tax together provided nearly 86.25% of the revenue for the General Revenue Fund in the 2005-2006 fiscal year. A commission, appointed by the Governor in July 1997 has recommended certain revenue-neutral reforms. Such reforms would require a constitutional amendment and implementing legislation before taking effect.
The state maintains a rainy day reserve fund into which 50% of annual surplus general fund revenues will be deposited until the reserve fund balance reaches 5% of general fund appropriations. At December 31, 2006, the estimated balance in the fund was $222.69 million. The state has upgraded its financial management and reporting practices through its conversion to GAAP-based accounting. The state also adopted policies to amortize large unfunded accrued liabilities in its workers’ compensation and teachers retirement funds over years.
The federal programs administered in West Virginia are a substantial part of the operation of state government. Historically, federal grants have either been part of an ongoing program, limited to a specific project or structured to institute immediate state action. In all cases, they become due either temporarily or permanently and are a significant feature of state services and the budget process. In fiscal year 2005-2006, state agencies received approximately $4 billion from federal sources. The state budget for fiscal year 2006-2007 reflects anticipated receipts of approximately $4 billion from federal sources. It is anticipated that the state will end the current fiscal year on a break even basis or with a surplus. A portion of any such surplus will be applied to unfunded liabilities.
On January 10, 2007, the Governor delivered his State of the State address. In his remarks the Governor reviewed accomplishments of the past year. Accomplishments included administratively implementing of cost savings resulting in savings of $26 million and tax modernization efforts that legislation designed to cut the food tax in half by 2008; created a low income family tax credit; doubled the Senior Citizen refundable property tax credit; cut the business franchise tax; and
71
reduced the corporate net income tax. The Governor for the second year in a row has introduced a five year budget. The proposed budget for fiscal year 2007-2008 contemplates expenditures of $3.94 billion and a surplus of $118 million. Governor Manchin’s long term projections suggest that state spending will increase by $700 million by fiscal year 2011-2012 with a potential deficit of $132,875,000.
PUERTO RICO, THE U.S. VIRGIN ISLANDS AND GUAM
Puerto Rico. Puerto Rico has a diversified economy dominated by the manufacturing and service sectors. The North American Free Trade Agreement (“NAFTA”), which became effective January 1, 1994, has led to loss of lower wage jobs such as textiles, but economic growth in other areas, particularly tourism, pharmaceuticals, construction and the high technology areas have compensated for that loss.
The Commonwealth of Puerto Rico differs from the states in its relationship with the federal government. Most federal taxes, except those such as social security taxes that are imposed by mutual consent, are not levied in Puerto Rico. Section 936 of the Code has provided a tax credit for certain qualified U.S. corporations electing “possessions corporation” status. However, in 1993, Section 936 was amended to provide for two alternative limitations on the Section 936 credit attributable to certain active business income. The first limitation was based on the economic activity of the Section 936 possessions corporation. The second limited the credit to a specified percentage of the credit allowed under prior law. In 1996, Section 936 credit was repealed except that the credit attributable to possessions source business income with respect to certain existing credit claimants was subjected to a phase out over a ten year period (subject to additional caps).
Also in 1996, a new Section 30A was added to the Code. Section 30A permits a “qualifying domestic corporation” that meets certain gross income tests to claim a credit against the federal income tax in an amount equal to the portion of the tax which is attributable to the taxable income from sources outside of the United States, from the active conduct of a trade or business in Puerto Rico or from the sale of substantially all the assets used in such a trade or business. Section 30A was phased out January 1, 2006.
During the mid and late 1990s the Commonwealth of Puerto Rico benefited from a robust U.S. economy, more aggressive tax collections and low oil prices. This created an expanded employment base, job growth, reduction in unemployment, increase in tourism spending, real GDP growth in the 3.1% to 3.5% range and significant increases in General Fund cash balances from fiscal year end 1997 to fiscal year end 1999. These factors, combined with minimal negative impact from the 1996 federal legislation phasing out Section 936 tax benefits to Puerto Rico subsidiaries of U.S. Corporations, created a positive outlook for the credit in the late 1990s.
In fiscal year 2000, the outlook on the credit turned negative due to the slowdown in the U.S. economy (88% of Puerto Rico’s exports go to the U.S.), uncertainty regarding increasing oil prices, failure of the government to reign in health care costs, expense overruns in education and a decreasing rate of employment growth. As a result, the General Fund recorded a $268 million deficit in fiscal year 2000 due to increased education and health care spending.
A new administration, the Popular Democratic Party that favors Puerto Rico’s commonwealth status over a potential statehood status, took office in January, 2001. It was not long before they realized the presence of continued fiscal stress and estimated a fiscal year 2001 budget shortfall of $700 million. The shortfall was stated to be caused by weakened revenue growth due to the slowing pace of employment and a softening U.S. economy.
On May 30, 2001, S&P downgraded the Commonwealth of Puerto Rico to an A- from an A due to continued years of operating deficits and the use of borrowing to cover the deficits. Puerto Rico continued to use deficit financing and cash transfers from other accounts to fill budget deficits for fiscal years 2002 - 2006. In fiscal year 2006, the Commonwealth hoped to balance the budget with cost saving measures and new excise taxes, but the deficit balloned to $1.1 billion. As a result of continued annual deficits, and the 2 week shut down of non-essential government employees last May, Moody’s lowered the rating on Puerto Rico to Baa3 from Baa2 on May 8, 2006. S&P rates Puerto Rico BBB- after a downgrade from BBB in May 2007 and A- in September 2005. Moody’s still carries a negative outlook on the credit.
The U.S. Virgin Islands. The United States Virgin Islands (“USVI”) is heavily reliant on the tourism industry, with roughly 43% of non-agricultural employment in tourist-related trade and services. The tourism industry is economically sensitive and is adversely affected by the recession in the United States and Europe. The attacks of September 11, 2001 also had an adverse affect on tourism. For 2001, air passengers to the USVI were down 2.9% after increasing 12% in 2000. However, supported by an increase in cruise passengers, total visitors increased by 4.4% in 2001. An important component of the USVI revenue base is the federal excise tax on rum exports. Tax revenues rebated by the federal government to the USVI provide the primary security of many outstanding USVI bonds. Since more than 90% of the rum distilled in the USVI is distilled at one plant, any interruption in its operations (as occurred after Hurricane Hugo in 1989) would adversely affect these revenues. The last ma jor hurricane to impact the USVI was Hurricane Marilyn on September 15, 1995.
72
Consequently, there can be no assurance that rum exports to the United States and the rebate of tax revenues to the USVI will continue at their present levels. The preferential tariff treatment the USVI rum industry currently enjoys could be reduced under NAFTA. Increased competition from Mexican rum producers could reduce USVI rum imported to the U.S., decreasing excise tax revenues generated.
The USVI is periodically hit by hurricanes. Several hurricanes have caused extensive damage, which has had a negative impact on revenue collections. There is currently no rated, unenhanced Virgin Islands debt outstanding (although there is unrated debt and rated special tax debt outstanding). In addition, eventual elimination of the Section 936 tax credit for those companies with operations in USVI may lead to slower growth in the future.
Guam. The U.S. territory of Guam derives a substantial portion of its economic base from Japanese tourism. With a reduced U.S. military presence on the island, Guam has relied more heavily on tourism in past years. During 1998, the Japanese recession combined with the impact of typhoon Paka resulted in a budget deficit of $21 million. Based on these factors, S&P downgraded Guam's rating to BBB- from BBB with a negative outlook on May 26, 1999. Although total visitors improved in 1999 and 2000, they were weakened by economic slowdowns and the effects of the September 11th terrorist attacks in 2001. In 2002 Guam was hit with two major typhoons and impacted by the global economic slowdown. These negative trends have had an unfavorable effect on Guam’s financial position with consistent general fund deficits from 1997-2002 with the exception of a small surplus in 2000. Guam also has a high debt burden with outstanding debt per capita of $2,700 and debt service representing 16% of ex penditures. These factors caused S&P to downgrade Guam’s rating to BB (below investment grade) from BBB– on March 25, 2002. Due to continued economic weakness and the negative effects of the typhoons in 2002, S&P further downgraded Guam’s debt to B from BB on May 6, 2003. Guam is not rated by Moody’s.
73
The ratings indicated herein are believed to be the most recent ratings available at the date of this SAI for the securities listed. Ratings are generally given to securities at the time of issuance. While the rating agencies may from time to time revise such ratings, they undertake no obligation to do so, and the ratings indicated do not necessarily represent ratings which would be given to these securities on a particular date.
Bonds which are unrated expose the investor to risks with respect to capacity to pay interest or repay principal which are similar to the risks of lower-rated speculative bonds. Evaluation of these bonds is dependent on the investment adviser’s judgment, analysis and experience in the evaluation of such bonds.
Investors should note that the assignment of a rating to a bond by a rating service may not reflect the effect of recent developments on the issuer’s ability to make interest and principal payments.
| Moody’s Investors Service, Inc. |
Aaa: Bonds which are rated Aaa are judged to be of the best quality. They carry the smallest degree of investment risk and are generally referred to as “gilt edged.” Interest payments are protected by a large or by an exceptionally stable margin and principal is secure. While the various protective elements are likely to change, such changes as can be visualized are most unlikely to impair the fundamentally strong position of such issues.
Aa: Bonds which are rated Aa are judged to be of high quality by all standards. Together with the Aaa group they comprise what are generally known as high grade bonds. They are rated lower than the best bonds because margins of protection may not be as large as in Aaa securities or fluctuation of protective elements may be of greater amplitude or there may be other elements present which make the long term risk appear somewhat larger than the Aaa securities.
A: Bonds which are rated A possess many favorable investment attributes and are to be considered as upper-medium-grade obligations. Factors giving security to principal and interest are considered adequate, but elements may be present which suggest a susceptibility to impairment sometime in the future.
Baa: Bonds which are rated Baa are considered as medium-grade obligations (i.e., they are neither highly protected nor poorly secured). Interest payments and principal security appear adequate for the present but certain protective elements may be lacking or may be characteristically unreliable over any great length of time. Such bonds lack outstanding investment characteristics and in fact have speculative characteristics as well.
Ba: Bonds which are rated Ba are judged to have speculative elements; their future cannot be considered as well-assured. Often the protection of interest and principal payments may be very moderate and thereby not well safeguarded during other good and bad times over the future. Uncertainty of position characterizes bonds in this class.
B: Bonds which are rated B generally lack characteristics of the desirable investment. Assurance of interest and principal payments or of maintenance of other terms of the contract over any long period of time may be small.
Caa: Bonds which are rated Caa are of poor standing. Such issues may be in default or there may be present elements of danger with respect to principal or interest.
Ca: Bonds which are rated Ca represent obligations which are speculative in a high degree. Such issues are often in default or have other marked shortcomings.
C: Bonds which are rated C are the lowest rated class of bonds, and issues so rated can be regarded as having extremely poor prospects of ever attaining any real investment standing.
Absence of Rating: Where no rating has been assigned or where a rating has been suspended or withdrawn, it may be for reasons unrelated to the quality of the issue.
Should no rating be assigned, the reason may be one of the following:
| 1. | An application for rating was not received or accepted. |
| |
| 2. | The issue or issuer belongs to a group of securities or companies that are not rated as a matter of policy. |
| |
| 3. | There is a lack of essential data pertaining to the issue or issuer. |
| |
| 4. | The issue was privately placed, in which case the rating is not published in Moody's publications. |
| |
74
Suspension or withdrawal may occur if new and material circumstances arise, the effects of which preclude satisfactory analysis; if there is no longer available reasonable up-to-date data to permit a judgment to be formed; if a bond is called for redemption; or for other reasons.
Note: Moody’s applies numerical modifiers, 1, 2, and 3 in each generic rating classification from Aa through B. The modifier 1 indicates that the security ranks in the higher end of its generic rating category; the modifier 2 indicates a midrange ranking; and the modifier 3 indicates that the issue ranks in the lower end of its generic rating category.
| Municipal Short-Term Obligations |
MIG/VMIG Ratings U.S. Short-Term Ratings: In municipal debt issuance, there are three rating categories for short-term obligations that are considered investment grade. These ratings are designated as Moody’s Investment Grade (MIG) and are divided into three levels -- MIG 1 through MIG 3.
In addition, those short-term obligations that are of speculative quality are designated SG, or speculative grade.
In the case of variable rate demand obligations (VRDOs), a two-component rating is assigned. The first element represents Moody’s evaluation of the degree of risk associated with scheduled principal and interest payments. The second element represents Moody’s evaluation of the degree of risk associated with the demand feature, using the MIG rating scale.
The short-term rating assigned to the demand feature of VRDOs is designated as VMIG. When either the long- or short-term aspect of a VRDO is not rated, that piece is designated NR, e.g., Aaa/NR or NR/VMIG 1.
MIG ratings expire at note maturity. By contrast, VMIG rating expirations will be a function of each issue’s specific structural or credit features.
MIG 1/VMIG 1: This designation denotes superior credit quality. Excellent protection is afforded by established cash flows, highly reliable liquidity support, or demonstrated broad-based access to the market for refinancing.
MIG 2/VMIG 2: This designation denotes strong credit quality. Margins of protection are ample, although not as large as in the preceding group.
MIG 3/VMIG 3: This designation denotes acceptable credit quality. Liquidity and cash-flow protection may be narrow, and market access for refinancing is likely to be less well-established.
SG: This designation denotes speculative-grade credit quality. Debt instruments in this category may lack sufficient margins of protection.
Standard & Poor’s Ratings Group
Investment Grade |
AAA: Debt rated AAA has the highest rating assigned by S&P. Capacity to pay interest and repay principal is extremely strong.
AA: Debt rated AA has a very strong capacity to pay interest and repay principal and differs from the highest rated issues only in small degree.
A: Debt rated A has a strong capacity to pay interest and repay principal although it is somewhat more susceptible to the adverse effects of changes in circumstances and economic conditions than debt in higher rated categories.
BBB: Debt rated BBB is regarded as having an adequate capacity to pay interest and repay principal. Whereas it normally exhibits adequate protection parameters, adverse economic conditions or changing circumstances are more likely to lead to a weakened capacity to pay interest and repay principal for debt in this category than in higher rated categories.
Debt rated BB, B, CCC, CC, and C is regarded as having predominantly speculative characteristics with respect to capacity to pay interest and repay principal. BB indicates the least degree of speculation and C the highest. While such debt will likely have some quality and protective characteristics, these are outweighed by large uncertainties or major exposures to adverse conditions.
BB: Debt rated BB has less near-term vulnerability to default than other speculative issues. However, it faces major ongoing uncertainties or exposure to adverse business, financial, or economic conditions which could lead to inadequate capacity to meet timely interest and principal payments.
75
B: Debt rated B has a greater vulnerability to default but currently has the capacity to meet interest payments and principal repayments. Adverse business, financial, or economic conditions will likely impair capacity or willingness to pay interest and repay principal.
CCC: Debt rated CCC has a currently identifiable vulnerability to default, and is dependent upon favorable business, financial, and economic conditions to meet timely payment of interest and repayment of principal. In the event of adverse business, financial, or economic conditions, it is not likely to have the capacity to pay interest and repay principal.
CC: The rating CC is currently highly vulnerable to nonpayment.
C: The C rating may be used to cover a situation where a bankruptcy petition has been filed or similar action has been taken, but debt service payments are continued.
D: Debt rated D is in payment default. The D rating category is used when interest payments or principal payments are not made on the date due even if the applicable grace period has not expired, unless S&P believes that such payments will be made during such grace period. The D rating also will be used upon the filing of a bankruptcy petition or the taking of a similar action if debt service payments are jeopardized.
Plus (+) or Minus (-): The ratings from AA to CCC may be modified by the addition of a plus or minus sign to show relative standing within the major rating categories.
P: The letter “P” indicates that the rating is provisional. A provisional rating assumes the successful completion of the project being financed by the debt being rated and indicates that payment of debt service requirements is largely or entirely dependent upon the successful and timely completion of the project. This rating, however, while addressing credit quality subsequent to completion of the project, makes no comment on the likelihood of, or the risk of default upon failure of such completion. The investor should exercise his own judgment with respect to such likelihood and risk.
L: The letter “L” indicates that the rating pertains to the principal amount of those bonds to the extent that the underlying deposit collateral is insured by the Federal Deposit Insurance Corp. and interest is adequately collateralized. In the case of certificates of deposit, the letter “L” indicates that the deposit, combined with other deposits being held in the same right and capacity, will be honored for principal and accrued pre-default interest up to the federal insurance limits within 30 days after closing of the insured institution or, in the event that the deposit is assumed by a successor insured institution, upon maturity.
NR: NR indicates no rating has been requested, that there is insufficient information on which to base a rating, or that S&P does not rate a particular type of obligation as a matter of policy.
S&P note ratings reflect the liquidity concerns and market access risks unique to notes. Notes due in 3 years or less will likely receive a note rating. Notes maturing beyond 3 years will most likely receive a long-term debt rating. The following criteria will be used in making that assessment:
- Amortization schedule (the larger the final maturity relative to other maturities the more likely it will be treated as a note).
- Sources of payment (the more dependent the issue is on the market for its refinancing, the more likely it will be treated as a note).
| Note rating symbols are as follows: |
SP-1: Strong capacity to pay principal and interest. Those issues determined to possess very strong characteristics will be given a plus(+) designation.
SP-2: Satisfactory capacity to pay principal and interest, with some vulnerability to adverse financial and economic changes over the term of the notes.
| SP-3: Speculative capacity to pay principal and interest. |
| Investment Grade Bond Ratings |
AAA: Bonds considered to be investment grade and of the highest credit quality. The obligor has an exceptionally strong ability to pay interest and repay principal, which is unlikely to be affected by reasonably foreseeable events.
76
AA: Bonds considered to be investment grade and of very high credit quality. The obligor's ability to pay interest and repay principal is very strong, although not quite as strong as bonds rated “AAA”. Because bonds rated in the “AAA” and “AA” categories are not significantly vulnerable to foreseeable future developments, short-term debt of these issuers is generally rated “F-1+”.
A: Bonds considered to be investment grade and of high credit quality. The obligor’s ability to pay interest and repay principal is considered to be strong, but may be more vulnerable to adverse changes in economic conditions and circumstances than bonds with higher ratings.
BBB: Bonds considered to be investment grade and of satisfactory credit quality. The obligor’s ability to pay interest and repay principal is considered to be adequate. Adverse changes in economic conditions and circumstances, however, are more likely to have adverse impact on these bonds, and therefore, impair timely payment. The likelihood that the ratings of these bonds will fall below investment grade is higher than for bonds with higher ratings.
BB: Bonds are considered speculative. The obligor’s ability to pay interest and repay principal may be affected over time by adverse economic changes. However, business and financial alternatives can be identified that could assist the obligor in satisfying its debt service requirements.
B: Bonds are considered highly speculative. While bonds in this class are currently meeting debt service requirements, the probability of continued timely payment of principal and interest reflects the obligor’s limited margin of safety and the need for reasonable business and economic activity throughout the life of the issue.
CCC: Bonds have certain identifiable characteristics which, if not remedied, may lead to default. The ability to meet obligations requires an advantageous business and economic environment.
| CC: | Bonds are minimally protected. Default in payment of interest and/or principal seems probable over time. |
| |
| C: | Bonds are in imminent default in payment of interest or principal. |
| |
DDD, DD, and D: Bonds are in default on interest and/or principal payments. Such bonds are extremely speculative and should be valued on the basis of their ultimate recovery value in liquidation or reorganization of the obligor. “DDD” represents the highest potential for recovery on these bonds, and “D” represents the lowest potential for recovery.
Plus (+) or Minus (-): The ratings from AA to C may be modified by the addition of a plus or minus sign to indicate the relative position of a credit within the rating category.
| NR: Indicates that Fitch does not rate the specific issue. |
Conditional: A conditional rating is premised on the successful completion of a project or the occurrence of a specific event.
| Investment Grade Short-Term Ratings |
Fitch’s short-term ratings apply to debt obligations that are payable on demand or have original maturities of generally up to three years, including commercial paper, certificates of deposit, medium-term notes, and municipal and investment notes.
F-1+: Exceptionally Strong Credit Quality. Issues assigned this rating are regarded as having the strongest degree of assurance for timely payment.
F-1: Very Strong Credit Quality. Issues assigned this rating reflect an assurance of timely payment only slightly less in degree than issues rated “F-1+”.
F-2: Good Credit Quality. Issues carrying this rating have a satisfactory degree of assurance for timely payment, but the margin of safety is not as great as the “F-1+” and “F-1” categories.
F-3: Fair Credit Quality. Issues carrying this rating have characteristics suggesting that the degree of assurance for timely payment is adequate, however, near-term adverse change could cause these securities to be rated below investment grade.
77
Description of the Insurance Claims-Paying
Ability Ratings of
Standard & Poor’s Ratings Group and
Moody’s Investors Service, Inc. |
An S&P insurance claims-paying ability rating is an assessment of an operating insurance company’s financial capacity to meet obligations under an insurance policy in accordance with the terms. An insurer with an insurance claims-paying ability of AAA has the highest rating assigned by S&P. Capacity to honor insurance contracts is adjudged by S&P to be extremely strong and highly likely to remain so over a long period of time. A Moody’s insurance claims-paying ability rating is an opinion of the ability of an insurance company to repay punctually senior policyholder obligations and claims. An insurer with an insurance claims-paying ability rating of Aaa is adjudged by Moody’s to be of the best quality. In the opinion of Moody’s, the policy obligations of an insurance company with an insurance claims-paying ability rating of Aaa carry the smallest degree of credit risk and, while the financial strength of these companies is likely to change, such changes as can be visualized are most unlikely to impair the company’s fundamentally strong position.
An insurance claims-paying ability rating by S&P’s or Moody’s does not constitute an opinion on any specific contract in that such an opinion can only be rendered upon the review of the specific insurance contract. Furthermore, an insurance claims-paying ability rating does not take in account deductibles, surrender or cancellation penalties or the timeliness of payment; nor does it address the ability of a company to meet nonpolicy obligations (i.e., debt contracts).
The assignment of ratings by S&P or Moody’s to debt issues that are fully or partially supported by insurance policies, contracts, or guarantees is a separate process from the determination of claims-paying ability ratings. The likelihood of a timely flow of funds from the insurer to the trustee for the bondholders is a key element in the rating determination of such debt issues.
78
EATON VANCE FUNDS
PROXY VOTING POLICY AND PROCEDURES |
The Boards of Trustees (the “Boards”) of the Eaton Vance Funds (the “Funds”) recognize that it is their fiduciary responsibility to actively monitor the Funds’ operations. The Boards have always placed paramount importance on their oversight of the implementation of the Funds’ investment strategies and the overall management of the Funds’ investments. A critical aspect of the investment management of the Funds continues to be the effective assessment and voting of proxies relating to the Funds’ portfolio securities. While the Boards will continue to delegate the day-to-day responsibilities relating to the management of the proxy-voting process to the relevant investment adviser or sub-adviser, if applicable, of the Fund (or its underlying portfolio in the case of a master-feeder arrangement), the Boards have determined that it is in the interests of the Funds’ shareholders to adopt these written proxy voting policy and procedures (the “Policy� 48;). For purposes of this Policy the term “Fund” shall include a Fund’s underlying portfolio in the case of a master-feeder arrangement and the term “Adviser” shall mean the adviser to a Fund or its sub-adviser if a sub-advisory relationship exists.
| II. Delegation of Proxy Voting Responsibilities |
Pursuant to investment advisory agreements between each Fund and its Adviser, the Adviser has long been responsible for reviewing proxy statements relating to Fund investments and, if the Adviser deems it appropriate to do so, to vote proxies on behalf of the Funds. The Boards hereby formally delegate this responsibility to the Adviser, except as otherwise described in this Policy. In so doing, the Boards hereby adopt on behalf of each Fund the proxy voting policies and procedures of the Adviser(s) to each Fund as the proxy voting policies and procedures of the Fund. The Boards recognize that the Advisers may from time to time amend their policies and procedures. The Advisers will report material changes to the Boards in the manner set forth in Section V below. In addition, the Boards will annually review and approve the Advisers’ proxy voting policies and procedures.
III. Delegation of Proxy Voting Disclosure Responsibilities
The Securities and Exchange Commission (the “Commission”) recently enacted certain new reporting requirements for registered investment companies. The Commission’s new regulations require that funds (other than those which invest exclusively in non-voting securities) make certain disclosures regarding their proxy voting activities. The most significant disclosure requirement for the Funds is the duty pursuant to Rule 30b1-4 promulgated under the Investment Company Act of 1940, as amended (the “1940 Act”), to file Form N-PX no later than August 31st of each year beginning in 2004. Under Form N-PX, each Fund will be required to disclose, among other things, information concerning proxies relating to the Fund’s portfolio investments, whether or not the Fund (or its Adviser) voted the proxies relating to securities held by the Fund and how it voted in the matter and whether it voted for or against management.
The Boards hereby delegate to each Adviser the responsibility for recording, compiling and transmitting in a timely manner all data required to be filed on Form N-PX to Eaton Vance Management, which acts as administrator to each of the Funds (the “Administrator”), for each Fund that such Adviser manages. The Boards hereby delegate the responsibility to file Form N-PX on behalf of each Fund to the Administrator.
| IV. Conflicts of Interest |
The Boards expect each Adviser, as a fiduciary to the Fund(s) it manages, to put the interests of each Fund and its shareholders above those of the Adviser. In the event that in connection with its proxy voting responsibilities a material conflict of interest arises between a Fund’s shareholders and the Fund’s Adviser or the Administrator (or any of their affiliates) or any affiliated person of the Fund, and the Proxy Administrator intends to vote the proxy in a manner inconsistent with the guidelines approved by the Board, the Adviser, to the extent it is aware or reasonably should have been aware of the material conflict, will refrain from voting any proxies related to companies giving rise to such material conflict until it notifies and consults with the appropriate Board(s), or a committee or sub-committee of such Board concerning the material conflict.
Once the Adviser notifies the relevant Board(s), committee or sub-committee of the Board, of the material conflict, the Board(s), committee or sub-committee, shall convene a meeting to review and consider all relevant materials related to the
79
proxies involved. In considering such proxies, the Adviser shall make available all materials requested by the Board, committee or sub-committee and make reasonably available appropriate personnel to discuss the matter upon request. The Board, committee or sub-committee will instruct the Adviser on the appropriate course of action. If the Board, committee or sub-committee is unable to meet and the failure to vote a proxy would have a material adverse impact on the Fund(s) involved, each Adviser will have the right to vote such proxy, provided that it discloses the existence of the material conflict to the Board, committee or sub-committee at its next meeting. Any determination regarding the voting of proxies of each Fund that is made by the committee or sub-committee shall be deemed to be a good faith determination regarding the voting of proxies by the full Board.
The Administrator shall make copies of each Form N-PX filed on behalf of the Funds available for the Boards’ review upon the Boards’ request. The Administrator (with input from the Adviser for the relevant Fund(s)) shall also provide any reports reasonably requested by the Boards regarding the proxy voting records of the Funds.
Each Adviser shall annually report any material changes to such Adviser’s proxy voting policies and procedures to the relevant Board(s) and the relevant Board(s) will annually review and approve the Adviser’s proxy voting policies and procedures. Each Adviser shall report any changes to such Adviser’s proxy voting policies and procedures to the Administrator prior to implementing such changes in order to enable the Administrator to effectively coordinate the Funds’ disclosure relating to such policies and procedures.
80
EATON VANCE MANAGEMENT
BOSTON MANAGEMENT AND RESEARCH
PROXY VOTING POLICIES AND PROCEDURES |
Eaton Vance Management, Boston Management and Research and Eaton Vance Investment Counsel (each an “Adviser” and collectively the “Advisers”) have each adopted and implemented policies and procedures that each Adviser believes are reasonably designed to ensure that proxies are voted in the best interest of clients, in accordance with its fiduciary duties and Rule 206(4)-6 under the Investment Advisers Act of 1940, as amended. The Advisers’ authority to vote the proxies of their clients is established by their advisory contracts or similar documentation, such as the Eaton Vance Funds Proxy Voting Policy and Procedures. These proxy policies and procedures reflect the U.S. Securities and Exchange Commission (“SEC”) requirements governing advisers and the long-standing fiduciary standards and responsibilities for ERISA accounts set out in the Department of Labor Bulletin 94-2 C.F.R. 2509.94 -2 (July 29, 1994).
Each Adviser manages its clients’ assets with the overriding goal of seeking to provide the greatest possible return to such clients consistent with governing laws and the investment policies of each client. In pursuing that goal, each Adviser seeks to exercise its clients’ rights as shareholders of voting securities to support sound corporate governance of the companies issuing those securities with the principle aim of maintaining or enhancing the companies’ economic value.
The exercise of shareholder rights is generally done by casting votes by proxy at shareholder meetings on matters submitted to shareholders for approval (for example, the election of directors or the approval of a company’s stock option plans for directors, officers or employees). Each Adviser is adopting the formal written Guidelines described in detail below and will utilize such Guidelines in voting proxies on behalf of its clients. These Guidelines are designed to promote accountability of a company’s management and board of directors to its shareholders and to align the interests of management with those of shareholders.
Each Adviser will vote any proxies received by a client for which it has sole investment discretion through a third-party proxy voting service (“Agent”) in accordance with customized policies, as approved by the Boards of Trustees of the Eaton Vance Funds and, with respect to proxies referred back to the Adviser by the Agent pursuant to the Guidelines, in a manner that is reasonably designed to eliminate any potential conflicts of interest, as described more fully below. The Agent is currently Institutional Shareholder Services Inc. Proxies will be voted in accordance with client-specific guidelines and an Eaton Vance Fund’s sub-adviser’s proxy voting policies and procedures, if applicable.
No set of guidelines can anticipate all situations that may arise. In special cases, the Proxy Administrator (the person specifically charged with the responsibility to oversee the Agent and coordinate the voting of proxies referred back to the Adviser by the Agent) may seek insight from the Proxy Group established by the Advisers. The Proxy Group will assist in the review of the Agent’s recommendation when a proxy voting issue is referred to the Proxy Group through the Proxy Administrator. The members of the Proxy Group, which may include employees of the Advisers’ affiliates, may change at the Advisers’ discretion.
| III. | Roles and Responsibilities |
| |
| | A. | Proxy Administrator |
| |
| | The Proxy Administrator will assist in the coordination of the voting of each client’s proxy in accordance with the Guidelines below and the Funds’ Proxy Voting Policy and Procedures. The Proxy Administrator is authorized to direct the Agent to vote a proxy in accordance with the Guidelines. Responsibilities assigned herein to the Proxy Administrator, or activities in support thereof, may be performed by such members of the Proxy Group or employees of the Advisers’ affiliates as are deemed appropriate by the Proxy Group. |
| |
| | B. | Agent |
| |
| | An independent proxy voting service (the “Agent”), as approved by the Board of each Fund, shall be engaged to assist
in the voting of proxies. The Agent is currently Institutional Shareholder Services Inc. The Agent is responsible for coordinating with the clients’ custodians and the Advisers to ensure that all proxy materials received by the custodians relating to the portfolio securities are processed in a timely fashion. The Agent is required to vote and/or refer all proxies in accordance with the Guidelines below. The Agent shall retain a record of all proxy votes handled by the Agent. Such record must reflect all of the information required to be disclosed in a Fund’s Form N-PX pursuant |
| |
| |
81
| | to Rule 30b1-4 under the Investment Company Act of 1940. In addition, the Agent is responsible for maintaining copies of all proxy statements received by issuers and to promptly provide such materials to an Adviser upon request. Subject to the oversight of the Advisers, the Agent shall establish and maintain adequate internal controls and policies in connection with the provision of proxy voting services to the Advisers, including methods to reasonably ensure that its analysis and recommendations are not influenced by a conflict of interest, and shall disclose such controls and policies to the Advisers when and as provided for herein. Unless otherwise specified, references herein to recommendations of the Agent shall refer to those in which no conflict of interest has been identified. |
| |
| | C. | Proxy Group |
| |
| | The Adviser shall establish a Proxy Group which shall assist in the review of the Agent’s recommendations when a proxy voting issue has been referred to the Proxy Administrator by the Agent. The members of the Proxy Group, which may include employees of the Advisers’ affiliates, may be amended from time to time at the Advisers’ discretion. |
| |
| | For each proposal referred to the Proxy Group, the Proxy Group will review the (i) Guidelines, (ii) recommendations of the Agent, and (iii) any other resources that any member of the Proxy Group deems appropriate to aid in a determination of the recommendation. |
| |
| | If the Proxy Group recommends a vote in accordance with the Guidelines, or the recommendation of the Agent, where applicable, it shall instruct the Proxy Administrator to so advise the Agent. |
| |
| | If the Proxy Group recommends a vote contrary to the Guidelines, or the recommendation of the Agent, where applicable, or if the proxy statement relates to a conflicted company of the Agent, as determined by the Advisers, it shall follow the procedures for such voting outlined below. |
| |
| | The Proxy Administrator shall use best efforts to convene the Proxy Group with respect to all matters requiring its
consideration. In the event the Proxy Group cannot meet in a timely manner in connection with a voting deadline, the Proxy Administrator shall follow the procedures for such voting outlined below. |
| |
| |
| IV. | Proxy Voting Guidelines (“Guidelines”) |
| |
| | A. | General Policies |
| |
| | It shall generally be the policy of the Advisers to take no action on a proxy for which no client holds a position or otherwise maintains an economic interest in the relevant security at the time the vote is to be cast. |
| |
| | In all cases except those highlighted below, it shall generally be the policy of the Advisers to vote in accordance with the recommendation by the Agent, Institutional Shareholder Services Inc. |
| |
| | When a fund client participates in the lending of its securities and the securities are on loan at the record date, proxies related to such securities generally will not be forwarded to the relevant Adviser by the fund’s custodian and therefore will not be voted. In the event that the Adviser determines that the matters involved would have a material effect on the applicable fund’s investment in the loaned securities, the fund will exercise its best efforts to terminate the loan in time to be able to cast such vote or exercise such consent. |
| |
| | Interpretation and application of these Guidelines is not intended to supersede any law, regulation, binding agreement or other legal requirement to which an issuer may be or become subject. The Guidelines relate to the types of proposals that are most frequently presented in proxy statements to shareholders. Absent unusual circumstances, each Adviser will utilize these Guidelines when voting proxies on behalf of its clients. The Guidelines may be revised at any time, provided such revisions are reported to the Boards of Trustees of the Eaton Vance Funds. |
| |
| | B. | Proposals Regarding Mergers and Corporate Restructurings |
| |
| | The Agent shall be directed to refer proxy proposals accompanied by its written analysis and voting recommendation to the Proxy Administrator for all proposals relating to Mergers and Corporate Restructurings. |
| |
| | C. | Proposals Regarding Mutual Fund Proxies – Disposition of Assets/Termination/Liquidation and Mergers |
| |
| | The Agent shall be directed to refer proxy proposals accompanied by its written analysis and voting recommendation to the Proxy Administrator for all proposals relating to the Disposition of Assets/Termination/Liquidation and Mergers contained in mutual fund proxies. |
| |
| | D. | Corporate Structure Matters/Anti-Takeover Defenses |
| |
| | As a general matter, the Advisers will normally vote against anti-takeover measures and other proposals designed to limit the ability of shareholders to act on possible transactions (except in the case of closed-end management investment companies). |
| |
82
E. Social and Environmental Issues
The Advisers generally support management on social and environmental proposals.
F. Voting Procedures
Upon receipt of a referral from the Agent or upon advice from an Eaton Vance investment professional, the Proxy
Administrator may solicit additional research from the Agent, as well as from any other source or service.
1. WITHIN-GUIDELINES VOTES: Votes in Accordance with the Guidelines and/or, where applicable, Agent
Recommendation
In the event the Proxy Administrator recommends a vote within Guidelines and/or, where applicable, in
accordance with the Agent’s recommendation, the Proxy Administrator will instruct the Agent to vote in this
manner.
2. NON-VOTES: Votes in Which No Action is Taken
The Proxy Administrator may recommend that a client refrain from voting under the following circumstances: (i)
if the economic effect on shareholders' interests or the value of the portfolio holding is indeterminable or
insignificant, e.g., proxies in connection with securities no longer held in the portfolio of a client or proxies being
considered on behalf of a client that is no longer in existence; or (ii) if the cost of voting a proxy outweighs the
benefits, e.g., certain international proxies, particularly in cases in which share blocking practices may impose
trading restrictions on the relevant portfolio security. In such instances, the Proxy Administrator may instruct the
Agent not to vote such proxy.
Reasonable efforts shall be made to secure and vote all other proxies for the clients, but, particularly in markets in
which shareholders' rights are limited, Non-Votes may also occur in connection with a client's related inability to
timely access ballots or other proxy information in connection with its portfolio securities.
Non-Votes may also result in certain cases in which the Agent's recommendation has been deemed to be
conflicted, as provided for herein.
3. OUT-OF-GUIDELINES VOTES: Votes Contrary to Guidelines, or Agent Recommendation, where applicable,
Where No Recommendation is Provided by Agent, or Where Agent's Recommendation is Conflicted
If the Proxy Administrator recommends that a client vote contrary to the Guidelines, or the recommendation of
the Agent, where applicable, if the Agent has made no recommendation on a matter requiring case-by-case
consideration and the Guidelines are silent, or the Agent's recommendation on a matter requiring case-by-case
consideration is deemed to be conflicted, the Proxy Administrator will forward the Agent’s analysis and
recommendation and any research obtained from the Agent or any other source to the Proxy Group. The Proxy
Group may consult with the Agent as it deems necessary. The Proxy Administrator will instruct the Agent to vote
the proxy as recommended by the Proxy Group. The Adviser will provide a report to the Boards of Trustees of the
Eaton Vance Funds reflecting any votes cast contrary to the Guidelines or Agent Recommendation, as applicable,
and shall do so no less than annually.
The Proxy Administrator will maintain a record of all proxy questions that have been referred by the Agent, all applicable
recommendations, analysis and research received and any resolution of the matter.
V. Recordkeeping
The Advisers will maintain records relating to the proxies they vote on behalf of their clients in accordance with Section
204-2 of the Investment Advisers Act of 1940, as amended. Those records will include: |
- A copy of the Advisers’ proxy voting policies and procedures;
- Proxy statements received regarding client securities. Such proxy statements received from issuers are either in the SEC’s EDGAR database or are kept by the Agent and are available upon request;
- A record of each vote cast;
- A copy of any document created by the Advisers that was material to making a decision on how to vote a proxy for a client or that memorializes the basis for such a decision; and
- Each written client request for proxy voting records and the Advisers’ written response to any client request (whether written or oral) for such records.
| | All records described above will be maintained in an easily accessible place for five years and will be maintained in the
offices of the Advisers or their Agent for two years after they are created.
VI. Assessment of Agent and Identification and Resolution of Conflicts with Clients
A. Assessment of Agent |
83
The Advisers shall establish that the Agent (i) is independent from the Advisers, (ii) has resources that indicate it can competently provide analysis of proxy issues, and (iii) can make recommendations in an impartial manner and in the best interests of the clients and, where applicable, their beneficial owners. The Advisers shall utilize, and the Agent shall comply with, such methods for establishing the foregoing as the Advisers may deem reasonably appropriate and shall do so not less than annually as well as prior to engaging the services of any new proxy voting service. The Agent shall also notify the Advisers in writing within fifteen (15) calendar days of any material change to information previously provided to an Adviser in connection with establishing the Agent's independence, competence or impartiality.
B. Conflicts of Interest
As fiduciaries to their clients, each Adviser puts the interests of its clients ahead of its own. In order to ensure that relevant personnel of the Advisers are able to identify potential material conflicts of interest, each Adviser will take the following steps:
| Quarterly, the Eaton Vance Legal and Compliance Department will seek information from the department heads of each department of the Advisers and of Eaton Vance Distributors, Inc. (“EVD”) (an affiliate of the Advisers and principal underwriter of certain Eaton Vance Funds). Each department head will be asked to provide a list of significant clients or prospective clients of the Advisers or EVD. |
| |
| A representative of the Legal and Compliance Department will compile a list of the companies identified (the “Conflicted Companies”) and provide that list to the Proxy Administrator. |
| |
| The Proxy Administrator will compare the list of Conflicted Companies with the names of companies for which he or she has been referred a proxy statement (the “Proxy Companies”). If a Conflicted Company is also a Proxy Company, the Proxy Administrator will report that fact to the Proxy Group. |
| |
| If the Proxy Administrator expects to instruct the Agent to vote the proxy of the Conflicted Company strictly according to the Guidelines contained in these Proxy Voting Policies and Procedures (the “Policies”) or the recommendation of the Agent, as applicable, he or she will (i) inform the Proxy Group of that fact, (ii) instruct the Agent to vote the proxies and (iii) record the existence of the material conflict and the resolution of the matter. |
| |
| If the Proxy Administrator intends to instruct the Agent to vote in a manner inconsistent with the Guidelines contained herein or the recommendation of the Agent, as applicable, the Proxy Group, in consultation with Eaton Vance senior management, will then determine if a material conflict of interest exists between the relevant Adviser and its clients. If the Proxy Group, in consultation with Eaton Vance senior management, determines that a material conflict exists, prior to instructing the Agent to vote any proxies relating to these Conflicted Companies the Adviser will seek instruction on how the proxy should be voted from: |
| |
| | | The client, in the case of an individual or corporate client; |
| |
| | | In the case of a Fund, its board of directors, or any committee or sub-committee identified by the board; or |
| |
| | | The adviser, in situations where the Adviser acts as a sub-adviser to such adviser. |
| |
The Adviser will provide all reasonable assistance to each party to enable such party to make an informed decision.
If the client, Fund board or adviser, as the case may be, fails to instruct the Adviser on how to vote the proxy, the Adviser will generally instruct the Agent, through the Proxy Administrator, to abstain from voting in order to avoid the appearance of impropriety. If however, the failure of the Adviser to vote its clients’ proxies would have a material adverse economic impact on the Advisers’ clients’ securities holdings in the Conflicted Company, the Adviser may instruct the Agent, through the Proxy Administrator, to vote such proxies in order to protect its clients’ interests. In either case, the Proxy Administrator will record the existence of the material conflict and the resolution of the matter.
The Advisers shall also identify and address conflicts that may arise from time to time concerning the Agent. Upon the Advisers’ request, which shall be not less than annually, and within fifteen (15) calendar days of any material change to such information previously provided to an Adviser, the Agent shall provide the Advisers with such information as the Advisers deem reasonable and appropriate for use in determining material relationships of the Agent that may pose a conflict of interest with respect to the Agent’s proxy analysis or recommendations. Such information shall include, but is not limited to, a monthly report from the Agent detailing the Agent’s Corporate Securities Division clients and related revenue data. The Advisers shall review such information on a monthly basis. The Proxy Administrator shall instruct the Agent to refer any proxies for which a material conflict of the Agent is deemed to be present to the Proxy Administrator. Any such proxy referred by the Age nt shall be referred to the Proxy Group for consideration accompanied by the Agent’s written analysis and voting recommendation. The Proxy Administrator will instruct the Agent to vote the proxy as recommended by the Proxy Group.
84