UNITED STATES SECURITIES AND EXCHANGE COMMISSION
Washington, D.C. 20549
FORM N-CSR
CERTIFIED SHAREHOLDER REPORT OF REGISTERED MANAGEMENT
INVESTMENT COMPANIES
| Investment Company Act file number: | 811-05162 |
| Exact name of registrant as specified in charter: | Delaware VIP® Trust |
| Address of principal executive offices: | 2005 Market Street |
| Philadelphia, PA 19103 | |
| Name and address of agent for service: | David F. Connor, Esq. |
| 2005 Market Street | |
| Philadelphia, PA 19103 | |
| Registrant’s telephone number, including area code: | (800) 523-1918 |
| Date of fiscal year end: | December 31 |
| Date of reporting period: | December 31, 2016 |
Item 1. Reports to Stockholders
Table of Contents
Delaware VIP® Trust
|
Delaware VIP Diversified Income Series
|
Annual report
|
December 31, 2016 |
 |
Table of Contents
| 1 | ||||
| 2 | ||||
| 4 | ||||
| 5 | ||||
| 6 | ||||
| 31 | ||||
| 33 | ||||
| 33 | ||||
| 34 | ||||
| 37 | ||||
| 50 | ||||
| 51 | ||||
| 53 | ||||

Neither Delaware Investments nor its affiliates referred to in this document are authorized deposit-taking institutions for the purposes of the Banking Act 1959 (Commonwealth of Australia). The obligations of these entities do not represent deposits or other liabilities of Macquarie Bank Limited (MBL), a subsidiary of Macquarie Group Limited and an affiliate of Delaware Investments. MBL does not guarantee or otherwise provide assurance in respect of the obligations of these entities, unless noted otherwise. The Series is governed by U.S. laws and regulations.
Unless otherwise noted, views expressed herein are current as of Dec. 31, 2016, and subject to change for events occurring after such date.
The Series is not FDIC insured and is not guaranteed. It is possible to lose the principal amount invested.
Mutual fund advisory services provided by Delaware Management Company, a series of Delaware Management Business Trust, which is a registered investment advisor and member of Macquarie Group. Delaware Investments, a member of Macquarie Group, refers to Delaware Management Holdings, Inc. and its subsidiaries, including the Series’ distributor, Delaware Distributors, L.P. Macquarie Group refers to Macquarie Group Limited and its subsidiaries and affiliates worldwide.
This material may be used in conjunction with the offering of shares in Delaware VIP Diversified Income Series only if preceded or accompanied by the Series’ current prospectus or the summary prospectus.
© 2017 Delaware Management Holdings, Inc.
All third-party marks cited are the property of their respective owners.
Table of Contents
| Delaware VIP® Trust — Delaware VIP Diversified Income Series | ||
| Portfolio management review | January 10, 2017 |
For the fiscal year ended Dec. 31, 2016, Delaware VIP Diversified Income Series Standard Class shares returned +3.52% and Service Class shares returned +3.28%. Both figures reflect all dividends reinvested. The Series’ benchmark, the Bloomberg Barclays U.S. Aggregate Index, returned +2.65% for the same period.
The Series’ fiscal year began with slow global growth and somewhat challenged earnings for companies in the United States. Commodity prices, particularly oil, were in a prolonged slump, and the U.S. dollar rallied. In December, a full year after its last move, the U.S. Federal Reserve raised the federal funds rate for just the second time in a decade, and signaled that more frequent increases were likely.
Market volatility picked up significantly in January and February 2016 as financial conditions deteriorated in an already slow-growth environment. The European Central Bank and the Bank of Japan responded by injecting more stimulus, causing a market reversal: Oil prices rose and energy securities rallied, particularly in fixed income. Additionally, yield spreads began to decline significantly.
The summer began with Brexit, the United Kingdom’s unexpected vote to leave the European Union. The period ended with the even more surprising election of Donald J. Trump as the next U.S. president. The ensuing rally in domestic markets was buoyed by the president-elect’s calls for lower taxes, reduced regulation, infrastructure investments, and renegotiated trade deals.
A defensive position in a rapidly changing market that benefited from central bank stimulus in the winter hurt the Series’ performance. The Series had responded to deteriorating market conditions and rising risks before the fiscal year began by moving Series assets from the corporate sector to more defensive agency mortgage-backed securities (MBS). To reduce risk, we also increased the Series’ exposure to Treasurys. As a result, the Series missed the strong rally that resulted from central bank stimuli in February and March. As the markets rebounded, we conservatively added back corporate exposure.
We looked for bonds issued by companies that we viewed as having good balance sheet management and resilient product lineups that could withstand what we saw as a continued slow-growth, earnings-and-revenue-challenged environment. Among these were some midstream energy holdings – pipeline companies – that had been sensitive to oil prices in 2015.
After oil prices stabilized, oil services companies began to look more attractive to us. Holdings included independent energy producers with more stable balance sheets, such as ConocoPhillips and Anadarko Petroleum. Elsewhere in the energy sector, we underperformed as we couldn’t keep up with rallying credit and energy markets.
Investment grade bonds issued by Enbridge in the energy sector and ArcelorMittal in metals and mining, and high yield bonds issued by Immucor in the pharmaceutical industry also detracted.
Exposure to asset-backed securities (ABS) and collateralized loan obligations (CLOs) detracted somewhat from the Series’ performance as they missed the full benefit of the bond rally earlier this year.
On the positive side, the Series benefited from its exposure to finance companies. The Series also benefited from corporate bonds issued by food and beverage and communications firms that were involved in mergers and acquisitions.
An overweight to commercial mortgage-backed securities (CMBS), particularly more defensive investments, including Freddie Mac multifamily securitizations, boosted performance. Individual contributors also included Fannie Mae bonds and 30-year interest rate swaps. The Series’ overweight to utilities was beneficial, compounded by outperformance versus the benchmark. Additionally, the Series benefited from its allocation to emerging market bonds, which are not included in the benchmark.
The Series’ use of derivatives had no material effect on its performance. We used derivatives for a variety of hedging purposes. We employed them either to increase or decrease interest rate sensitivity, to make adjustments in yield curve exposure, or to try to capture the effect of collapsing swap rates, and we recently used credit default swap indices to dial back credit risk. We also used currency futures to reduce currency exposure when it seemed warranted.
The election of Donald Trump underscores the uncertainties and global risks associated with a series of anti-establishment election results, beginning with the U.K. Brexit vote in June, and that could continue next year with national elections in Italy, France, and Germany. The Series is positioned for a possible change in the interest rate environment, with exposure to risk reduced through interest rate futures.
Emerging markets also generally pose a higher risk related to uncertainty regarding trade pacts. A renewed strengthening of the U.S. dollar also presents heightened emerging market bond risks. A stronger U.S. dollar means that the cost for emerging markets to borrow or repay money in U.S. dollars rises. In addition, returns on bonds in non-U.S. denominations will be lower when converted into U.S. dollars. Compounding that, the heightened perceived risk associated with these tendencies may cause investors to sell emerging markets investments when the U.S. dollar rises.
| Unless otherwise noted, views expressed herein are current as of Dec.31, 2016, and subject to change. | ||
| Diversified Income Series-1 |
Table of Contents
Delaware VIP® Trust — Delaware VIP Diversified Income Series
The performance quoted represents past performance and does not guarantee future results. Investment return and principal value of an investment will fluctuate so that shares, when redeemed, may be worth more or less than their original cost. Current performance may be lower or higher than the performance quoted.
Carefully consider the Series’ investment objectives, risk factors, charges, and expenses before investing. This and other information can be found in the Series’ prospectus and its summary prospectus, which may be obtained by calling 800 523-1918. Investors should read the prospectus and the summary prospectus carefully before investing.
Delaware VIP Diversified Income Series Average annual total returns For periods ended Dec. 31, 2016 | 1 year | 3 years | 5 years | 10 years | Lifetime | |||||||||||||||
Standard Class shares (commenced operations on May 16, 2003) | +3.52% | +2.55% | +2.68% | +5.52% | +5.59% | |||||||||||||||
Service Class shares (commenced operations on May 16, 2003) | +3.28% | +2.27% | +2.42% | +5.26% | +5.32% | |||||||||||||||
Bloomberg Barclays U.S. Aggregate Index* | +2.65% | +3.03% | +2.23% | +4.34% | n/a | |||||||||||||||
| * | Formerly known as the Barclays U.S. Aggregate Index. |
Returns reflect the reinvestment of all distributions. Please see page 4 for a description of the index.
As described in the Series’ most recent prospectus, the net expense ratio for Service Class shares of the Series was 0.92%, while total operating expenses for Standard Class and Service Class shares were 0.67% and 0.97%, respectively. The management fee for Standard Class and Service Class shares was 0.58%.
The Series’ distributor has contracted to limit the 12b-1 fees for Service Class shares to no more than 0.25% of average daily net assets from Jan. 1, 2016 through Dec. 31, 2016.*
Earnings from a variable annuity or variable life investment compound tax-free until withdrawal, and as a result, no adjustments were made for income taxes.
Expense limitations were in effect for both classes during certain periods shown in the Series performance table on the previous page and in the Performance of a $10,000 Investment graph below.
Performance data do not reflect insurance fees related to a variable annuity or variable life investment or the deferred sales charge that would apply to certain withdrawals of investments held for fewer than eight years. Performance shown here would have been reduced if such fees were included and the expense limitation removed. For more information about fees, consult your variable annuity or variable life prospectus.
Investments in variable products involve risk.
Fixed income securities and bond funds can lose value, and investors can lose principal, as interest rates rise. They also may be affected by economic conditions that hinder an issuer’s ability to make interest and principal payments on its debt.
The Series may also be subject to prepayment risk, the risk that the principal of a fixed income security that is held by the Series may be prepaid prior to maturity, potentially forcing the Series to reinvest that money at a lower interest rate.
The Series may invest in derivatives, which may involve additional expenses and are subject to risk, including the risk that an underlying security or securities index moves in the opposite direction from what the portfolio manager anticipated. A derivative transaction depends upon the counterparties’ ability to fulfill their contractual obligations.
The Series may experience portfolio turnover in excess of 100%, which could result in higher transaction costs and tax liability.
International investments entail risks not ordinarily associated with U.S. investments including fluctuation in currency values, differences in accounting principles, or economic or political instability in other nations. Investing in emerging markets can be riskier than investing in established foreign markets due to increased volatility and lower trading volume.
High yielding, non-investment-grade bonds (junk bonds) involve higher risk than investment grade bonds. The high yield secondary market is particularly susceptible to liquidity problems when institutional investors, such as mutual funds and certain other financial institutions, temporarily stop buying bonds
Diversified Income Series-2
Table of Contents
Delaware VIP® Diversified Income Series
Performance summary (continued)
for regulatory, financial, or other reasons. In addition, a less liquid secondary market makes it more difficult for the Series to obtain precise valuations of the high yield securities in its portfolio.
If and when the Series invests in forward foreign currency contracts or uses other investments to hedge against currency risks, the Series will be subject to special risks, including counterparty risk.
An investment in asset-backed securities (ABS) may involve risks. ABS are often backed by a pool of assets representing the obligations of a number of different parties. The rate of principal payment on asset-backed securities generally depends on the rate of principal payments received on the underlying assets.
Investments in mortgage-backed securities (MBS) may involve risks. MBS represent an ownership interest in a pool of mortgage loans. The individual mortgage loans are packaged or “pooled” together for sale to investors. These mortgage loans may have either fixed or adjustable interest rates.
Investments in collateralized loan obligations (CLOs) may involve risks. CLOs are securities backed by a pool of debt, often low-rated corporate loans. Investors receive scheduled debt payments from the underlying loans but assume most of the risk in the event that borrowers default.
Please read both the contract and underlying prospectus for specific details regarding the product’s risk profile.
*The aggregate contractual waiver period covering this report is from April 29, 2015 through May 1, 2017.
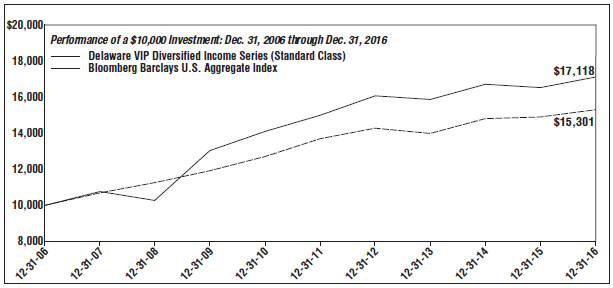
| For period beginning Dec. 31, 2006 through Dec. 31, 2016 | Starting value | Ending value | ||
— Delaware VIP Diversified Income Series (Standard Class) | $10,000 | $17,118 | ||
– – Bloomberg Barclays U.S. Aggregate Index | $10,000 | $15,301 |
The graph shows a $10,000 investment in the Delaware VIP Diversified Income Series Standard Class shares for the period from Dec. 31, 2006, through Dec. 31, 2016.
The graph also shows $10,000 invested in the Bloomberg Barclays U.S. Aggregate Index for the period from Dec. 31, 2006 through Dec. 31, 2016. The Bloomberg Barclays U.S. Aggregate Index (formerly known as the Barclays U.S. Aggregate Index) is a broad composite that tracks the investment grade domestic bond market.
Index performance returns do not reflect any management fees, transaction costs or expenses. Indices are unmanaged and one cannot invest directly in an index.
Performance of Service Class shares will vary due to different charges and expenses.
| Diversified Income Series-3 |
Table of Contents
Delaware VIP® Trust — Delaware VIP Diversified Income Series
For the six-month period from July 1, 2016 to December 31, 2016 (Unaudited)
Past performance is not a guarantee of future results.
As a shareholder of the Series, you incur ongoing costs, which may include management fees; distribution and/or service (12b-1) fees; and other Series expenses. This example is intended to help you understand your ongoing costs (in dollars) of investing in the Series and to compare these costs with the ongoing costs of investing in other mutual funds.
The example is based on an investment of $1,000 invested at the beginning of the period and held for the entire six-month period from July 1, 2016 to Dec. 31, 2016.
Actual expenses
The first section of the table shown, “Actual Series return,” provides information about actual account values and actual expenses. You may use the information in this section of the table, together with the amount you invested, to estimate the expenses that you paid over the period. Simply divide your account value by $1,000 (for example, an $8,600 account value divided by $1,000 = 8.6), then multiply the result by the number in the first section under the heading entitled “Expenses Paid During Period” to estimate the expenses you paid on your account during the period.
Hypothetical example for comparison purposes
The second section of the table shown, “Hypothetical 5% return,” provides information about hypothetical account values and hypothetical expenses based on the Series’ actual expense ratio and an assumed rate of return of 5% per year before expenses, which is not the Series’ actual return. The hypothetical account values and expenses may not be used to estimate the actual ending account balance or expenses you paid for the period. You may use this information to compare the ongoing costs of investing in the Series and other funds. To do so, compare this 5% hypothetical example with the 5% hypothetical examples that appear in the shareholder reports of other funds.
Please note that the expenses shown in the table are meant to highlight your ongoing costs only. As a shareholder of the Series, you do not incur any transaction costs, such as sales charges (loads), redemption fees or exchange fees, but shareholders of other funds may incur such costs. Also, the fees related to the variable annuity investment or the deferred sales charge that could apply have not been included. Therefore, the second section of the table is useful in comparing ongoing costs only, and will not help you determine the relative total costs of owning different funds. The Series’ actual expenses shown in the table reflect fee waivers in effect for Service Class shares. The expenses shown in the table assume reinvestment of all dividends and distributions.
Expense analysis of an investment of $1,000
| Beginning Account Value 7/1/16 | Ending Account Value 12/31/16 | Annualized Expense Ratio | Expenses Paid During Period 7/1/16 to 12/31/16* | |||||||||||||
Actual Series return† |
| |||||||||||||||
Standard Class | $1,000.00 | $ | 985.60 | 0.67 | % | $3.34 | ||||||||||
Service Class | 1,000.00 | 984.60 | 0.92 | % | 4.59 | |||||||||||
Hypothetical 5% return (5% return before expenses) |
| |||||||||||||||
Standard Class | $1,000.00 | $ | 1,021.77 | 0.67 | % | $3.40 | ||||||||||
Service Class | 1,000.00 | 1,020.51 | 0.92 | % | 4.67 | |||||||||||
| * | “Expenses Paid During Period” are equal to the Series’ annualized expense ratio, multiplied by the average account value over the period, multiplied by 184/366 (to reflect the one-half year period). |
| † | Because actual returns reflect only the most recent six-month period, the returns shown may differ significantly from fiscal year returns. |
| Diversified Income Series-4 |
Table of Contents
Delaware VIP® Trust — Delaware VIP Diversified Income Series
Security type / sector allocation
As of December 31, 2016 (Unaudited)
Sector designations may be different than the sector designations presented in other Series materials. The sector designations may represent the investment manager’s internal sector classifications.
| Security type / sector | Percentage of net assets | |
Agency Asset-Backed Securities | 0.01% | |
Agency Collateralized Mortgage Obligations | 3.24% | |
Agency Commercial Mortgage-Backed Securities | 1.19% | |
Agency Mortgage-Backed Securities | 11.89% | |
Collateralized Debt Obligations | 1.85% | |
Convertible Bonds | 1.71% | |
Corporate Bonds | 48.43% | |
Automotive | 0.09% | |
Banking | 9.98% | |
Basic Industry | 3.27% | |
Brokerage | 0.18% | |
Capital Goods | 1.74% | |
Communications | 5.09% | |
Consumer Cyclical | 3.01% | |
Consumer Non-Cyclical | 4.89% | |
Electric | 6.66% | |
Energy | 4.53% | |
Finance Companies | 1.24% | |
Healthcare | 0.25% | |
Insurance | 1.45% | |
Media | 0.89% | |
Natural Gas | 0.51% | |
Real Estate Investment Trusts | 1.28% | |
Services | 0.29% | |
Technology | 1.34% | |
Transportation | 1.51% | |
Utilities | 0.23% | |
Municipal Bonds | 0.60% | |
Non-Agency Asset-Backed Securities | 2.42% | |
Non-Agency Collateralized Mortgage Obligations | 1.16% | |
Non-Agency Commercial Mortgage-Backed Securities | 5.70% | |
Regional Bonds | 0.79% | |
Senior Secured Loans | 9.84% | |
Sovereign Bonds | 3.56% | |
Supranational Banks | 0.41% |
| Security type / sector | Percentage of net assets | |
U.S. Treasury Obligations | 3.08% | |
Common Stock | 0.00% | |
Convertible Preferred Stock | 0.28% | |
Preferred Stock | 0.50% | |
Short-Term Investments | 5.10% | |
Total Value of Securities | 101.76% | |
Liabilities Net of Receivables and Other Assets | (1.76%) | |
Total Net Assets | 100.00% |
Diversified Income Series-5
Table of Contents
Delaware VIP® Trust — Delaware VIP Diversified Income Series
December 31, 2016
Principal | Value (U.S. $) | |||||||||||
Agency Asset-Backed Securities – 0.01% | ||||||||||||
Fannie Mae Grantor Trust | ||||||||||||
Series 2003-T4 2A5 4.98% 9/26/33 f | 235,985 | $ | 258,263 | |||||||||
Fannie Mae REMIC Trust Series 2002-W11 AV1 1.096% 11/25/32 • | 1,017 | 994 | ||||||||||
|
| |||||||||||
Total Agency Asset-Backed Securities (cost $235,970) | 259,257 | |||||||||||
|
| |||||||||||
Agency Collateralized Mortgage Obligations – 3.24% | ||||||||||||
Fannie Mae Grantor Trust | ||||||||||||
Series 1999-T2 A1 7.50% 1/19/39 • | 440 | 495 | ||||||||||
Series 2002-T4 A3 7.50% 12/25/41 | 8,940 | 10,347 | ||||||||||
Series 2004-T1 1A2 6.50% 1/25/44 | 7,031 | 8,130 | ||||||||||
Fannie Mae REMIC Trust Series 2002-W6 2A1 6.135% 6/25/42 • | 17,615 | 20,066 | ||||||||||
Series 2004-W11 1A2 6.50% 5/25/44 . | 29,480 | 33,891 | ||||||||||
Fannie Mae REMICs | ||||||||||||
Series 1996-46 ZA 7.50% 11/25/26 | 26,902 | 30,655 | ||||||||||
Series 2001-50 BA 7.00% 10/25/41 | 40,281 | 45,950 | ||||||||||
Series 2002-90 A1 6.50% 6/25/42 | 6,917 | 8,062 | ||||||||||
Series 2002-90 A2 6.50% 11/25/42 | 19,954 | 22,942 | ||||||||||
Series 2003-38 MP 5.50% 5/25/23 | 301,352 | 326,330 | ||||||||||
Series 2005-70 PA 5.50% 8/25/35 | 159,269 | 177,962 | ||||||||||
Series 2005-110 MB 5.50% 9/25/35 | 58,470 | 61,851 | ||||||||||
Series 2008-15 SB 5.844% | ||||||||||||
8/25/36 S• | 335,187 | 64,006 | ||||||||||
Series 2009-94 AC 5.00% 11/25/39 | 710,304 | 772,104 | ||||||||||
Series 2010-41 PN 4.50% 4/25/40 | 1,675,000 | 1,817,894 | ||||||||||
Series 2010-43 HJ 5.50% 5/25/40 | 255,905 | 285,476 | ||||||||||
Series 2010-96 DC 4.00% 9/25/25 | 1,803,536 | 1,931,445 | ||||||||||
Series 2010-116 Z 4.00% 10/25/40 | 48,900 | 51,103 | ||||||||||
Series 2010-129 SM | ||||||||||||
5.244% 11/25/40 S• | 2,620,480 | 443,025 | ||||||||||
Series 2012-98 MI 3.00% 8/25/31 S | 3,497,786 | 416,814 | ||||||||||
Series 2012-122 SD | ||||||||||||
5.344% 11/25/42 S• | 3,755,929 | 751,984 | ||||||||||
Series 2013-26 ID 3.00% 4/25/33 S | 2,362,307 | 337,634 | ||||||||||
Series 2013-31 MI 3.00% 4/25/33 S | 740,569 | 102,111 | ||||||||||
Series 2013-38 AI 3.00% 4/25/33 S | 2,213,308 | 303,666 | ||||||||||
Series 2013-43 IX 4.00% 5/25/43 S | 10,372,075 | 2,330,159 | ||||||||||
Series 2013-44 DI 3.00% 5/25/33 S | 7,101,607 | 1,130,910 | ||||||||||
Series 2013-55 AI 3.00% 6/25/33 S | 4,196,795 | 599,621 | ||||||||||
Series 2013-7 EI 3.00% 10/25/40 S | 2,038,810 | 287,206 | ||||||||||
Series 2014-36 ZE 3.00% 6/25/44 | 1,719,040 | 1,540,919 | ||||||||||
Series 2014-68 BS | ||||||||||||
5.394% 11/25/44 S• | 3,664,420 | 729,236 | ||||||||||
Series 2014-90 SA | ||||||||||||
5.394% 1/25/45 S• | 10,106,803 | 1,988,642 | ||||||||||
| Principal amount° | Value (U.S. $) | |||||||||||
Agency Collateralized Mortgage Obligations (continued) | ||||||||||||
Fannie Mae REMICs | ||||||||||||
Series 2015-27 SA 5.694% 5/25/45 S• | 1,359,566 | $ | 302,556 | |||||||||
Series 2015-44 Z 3.00% 9/25/43 | 3,476,801 | 3,312,859 | ||||||||||
Series 2015-89 AZ 3.50% 12/25/45 | 333,387 | 319,934 | ||||||||||
Series 2015-95 SH 5.244% 1/25/46 S• | 3,221,836 | 762,869 | ||||||||||
Series 2016-55 SK 5.244% 8/25/46 S• | 2,600,144 | 648,396 | ||||||||||
Series 2016-62 SA 5.244% 9/25/46 S• | 5,102,793 | 1,325,979 | ||||||||||
Series 2016-74 GS 5.244% 10/25/46 S• | 734,103 | 182,009 | ||||||||||
Freddie Mac REMICs | ||||||||||||
Series 1730 Z 7.00% 5/15/24 | 19,889 | 22,229 | ||||||||||
Series 2326 ZQ 6.50% 6/15/31 | 19,755 | 22,380 | ||||||||||
Series 2557 WE 5.00% 1/15/18 | 79,521 | 80,615 | ||||||||||
Series 2809 DC 4.50% 6/15/19 | 68,078 | 69,815 | ||||||||||
Series 3123 HT 5.00% 3/15/26 | 35,009 | 37,439 | ||||||||||
Series 3656 PM 5.00% 4/15/40 | 1,378,847 | 1,508,903 | ||||||||||
Series 4065 DE 3.00% 6/15/32 | 350,000 | 350,637 | ||||||||||
Series 4109 AI 3.00% 7/15/31 S | 6,352,518 | 746,091 | ||||||||||
Series 4120 IK 3.00% 10/15/32 S | 5,433,422 | 763,635 | ||||||||||
Series 4146 IA 3.50% 12/15/32 S | 2,888,769 | 446,243 | ||||||||||
Series 4153 IB 2.50% 1/15/28 S | 1,617,182 | 145,000 | ||||||||||
Series 4156 AI 3.00% 10/15/31 S | 1,537,583 | 153,702 | ||||||||||
Series 4159 KS 5.446% 1/15/43 S• | 2,546,682 | 569,648 | ||||||||||
Series 4181 DI 2.50% 3/15/33 S | 1,661,818 | 209,942 | ||||||||||
Series 4184 GS 5.416% 3/15/43 S• | 2,810,362 | 617,582 | ||||||||||
Series 4185 LI 3.00% 3/15/33 S | 1,726,188 | 241,291 | ||||||||||
Series 4191 CI 3.00% 4/15/33 S | 737,778 | 103,171 | ||||||||||
Series 4342 CI 3.00% 11/15/33 S | 1,002,267 | 124,389 | ||||||||||
Series 4435 DY 3.00% 2/15/35 | 2,810,000 | 2,774,832 | ||||||||||
Series 4453 DI 3.50% 11/15/33 S | 1,314,914 | 181,209 | ||||||||||
Series 4574 AI 3.00% 4/15/31 S | 3,445,469 | 473,002 | ||||||||||
Series 4592 WT 5.50% 6/15/46 | 5,645,412 | 6,272,278 | ||||||||||
Series 4594 SG 5.296% 6/15/46 S• | 7,469,429 | 1,877,372 | ||||||||||
Series 4609 QZ 3.00% 8/15/46 | 918,124 | 800,399 | ||||||||||
Series 4614 HB 2.50% 9/15/46 | 1,330,000 | 1,181,759 | ||||||||||
Series 4623 LZ 2.50% 10/15/46 | 1,129,692 | 955,837 | ||||||||||
Series 4623 MW 2.50% 10/15/46 | 1,330,000 | 1,238,449 | ||||||||||
Series 4631 GS 5.296% 11/15/46 S• | 5,718,139 | 1,171,953 | ||||||||||
Series 4636 NZ 3.00% 12/15/46 | 1,473,000 | 1,229,130 | ||||||||||
Freddie Mac Strips | ||||||||||||
Series 267 S5 5.296% 8/15/42 S• | 3,486,398 | 756,541 | ||||||||||
Series 299 S1 5.296% 1/15/43 S• | 2,632,688 | 547,471 | ||||||||||
Series 326 S2 5.246% 3/15/44 S• | 1,777,218 | 357,662 | ||||||||||
Freddie Mac Structured Agency Credit Risk Debt Notes Series 2014-DN4 M2 3.156% 10/25/24 • | 165,353 | 165,642 | ||||||||||
Diversified Income Series-6
Table of Contents
Delaware VIP® Diversified Income Series
Schedule of investments (continued)
Principal | Value (U.S. $) | |||||||||||
Agency Collateralized Mortgage Obligations (continued) | ||||||||||||
Freddie Mac Structured Agency Credit Risk Debt Notes | ||||||||||||
Series 2015-DNA3 M2 3.606% 4/25/28 • | 1,430,000 | $ | 1,471,269 | |||||||||
Series 2015-HQA1 M2 3.406% 3/25/28 • | 1,130,742 | 1,153,533 | ||||||||||
Series 2015-HQA2 M2 3.556% 5/25/28 • | 1,290,000 | 1,324,077 | ||||||||||
Series 2016-DNA1 M2 3.656% 7/25/28 • | 755,000 | 777,206 | ||||||||||
Series 2016-DNA3 M2 2.756% 12/25/28 • | 640,000 | 645,957 | ||||||||||
Series 2016-DNA4 M2 2.056% 3/25/29 • | 285,000 | 284,458 | ||||||||||
Series 2016-HQA2 M2 3.006% 11/25/28 • | 740,000 | 755,198 | ||||||||||
Freddie Mac Structured Pass Through Certificates | ||||||||||||
Series T-54 2A 6.50% 2/25/43 ◆ | 11,686 | 13,519 | ||||||||||
Series T-58 2A 6.50% 9/25/43 ◆ | 4,496 | 5,143 | ||||||||||
GNMA | ||||||||||||
Series 2010-113 KE 4.50% 9/20/40 | 4,115,000 | 4,464,202 | ||||||||||
Series 2012-136 MX 2.00% 11/20/42 | 520,000 | 468,250 | ||||||||||
Series 2013-113 AZ 3.00% 8/20/43 | 3,368,141 | 3,188,686 | ||||||||||
Series 2013-113 LY 3.00% 5/20/43 | 378,000 | 370,857 | ||||||||||
Series 2015-133 AL 3.00% 5/20/45 | 3,715,000 | 3,526,171 | ||||||||||
Series 2015-64 GZ 2.00% 5/20/45 | 1,359,337 | 1,103,947 | ||||||||||
Series 2016-111 PB 2.50% 8/20/46 | 1,230,000 | 1,098,294 | ||||||||||
Series 2016-134 MW 3.00% 10/20/46 . | 213,000 | 210,529 | ||||||||||
Series 2016-134 MZ 3.00% 10/20/46 | 1,467,309 | 1,381,287 | ||||||||||
Series 2016-156 PB 2.00% 11/20/46 | 794,000 | 634,488 | ||||||||||
|
| |||||||||||
Total Agency Collateralized Mortgage Obligations (cost $76,380,758) | 72,558,557 | |||||||||||
|
| |||||||||||
Agency Commercial Mortgage-Backed Securities—1.19% | ||||||||||||
Freddie Mac Structured Pass Through Certificates | ||||||||||||
Series K055 A2 2.673% 3/25/26 ◆ | 4,170,000 | 4,089,380 | ||||||||||
Series K056 A2 2.525% 5/25/26 ◆ | 1,405,000 | 1,360,103 | ||||||||||
Series K057 A2 2.57% 7/25/26 ◆ | 1,240,000 | 1,203,972 | ||||||||||
Series K059 A2 3.12% 9/25/26 ◆• | 2,215,000 | 2,248,312 | ||||||||||
Series K719 A1 2.53% 12/25/21 ◆ | 967,204 | 977,788 | ||||||||||
Series KS03 A4 3.161% 5/25/25 ◆• | 1,920,000 | 1,941,278 | ||||||||||
FREMF Mortgage Trust | ||||||||||||
Series 2011-K10 B 144A 4.631% 11/25/49 #• | 685,000 | 726,076 | ||||||||||
Series 2011-K13 B 144A 4.61% 1/25/48 #• | 580,000 | 619,451 | ||||||||||
Series 2011-K14 B 144A 5.167% 2/25/47 #• | 820,000 | 896,772 | ||||||||||
Principal | Value (U.S. $) | |||||||||||
Agency Commercial Mortgage-Backed Securities (continued) | ||||||||||||
FREMF Mortgage Trust | ||||||||||||
Series 2011-K15 B 144A 4.948% 8/25/44 #• | 195,000 | $ | 210,362 | |||||||||
Series 2011-K704 B 144A 4.69% 10/25/30 #• | 1,435,000 | 1,485,719 | ||||||||||
Series 2012-K18 B 144A 4.255% 1/25/45 #• | 1,020,000 | 1,073,148 | ||||||||||
Series 2012-K22 B 144A 3.811% 8/25/45 #• | 1,730,000 | 1,773,703 | ||||||||||
Series 2012-K708 B 144A 3.751% 2/25/45 #• | 1,795,000 | 1,841,032 | ||||||||||
Series 2012-K708 C 144A 3.751% 2/25/45 #• | 530,000 | 541,412 | ||||||||||
Series 2013-K33 B 144A 3.502% 8/25/46 #• | 1,315,000 | 1,324,073 | ||||||||||
Series 2013-K712 B 144A 3.365% 5/25/45 #• | 990,000 | 1,005,317 | ||||||||||
Series 2013-K713 B 144A 3.165% 4/25/46 #• | 605,000 | 609,800 | ||||||||||
Series 2013-K713 C 144A 3.165% 4/25/46 #• | 2,640,000 | 2,590,779 | ||||||||||
|
| |||||||||||
Total Agency Commercial Mortgage-Backed Securities | 26,518,477 | |||||||||||
|
| |||||||||||
Agency Mortgage-Backed Securities—11.89% | ||||||||||||
Fannie Mae ARM | ||||||||||||
2.414% 5/1/43 • | 996,174 | 1,007,847 | ||||||||||
2.553% 6/1/43 • | 367,943 | 372,056 | ||||||||||
2.872% 6/1/37 • | 2,931 | 3,113 | ||||||||||
2.897% 4/1/44 • | 476,295 | 488,127 | ||||||||||
2.921% 7/1/45 • | 579,048 | 590,222 | ||||||||||
2.958% 12/1/45 • | 719,038 | 739,550 | ||||||||||
2.966% 4/1/46 • | 89,473 | 91,268 | ||||||||||
3.076% 8/1/35 • | 18,658 | 19,691 | ||||||||||
3.218% 4/1/44 • | 936,893 | 962,682 | ||||||||||
3.226% 3/1/44 • | 1,393,350 | 1,441,573 | ||||||||||
3.274% 9/1/43 • | 817,731 | 840,479 | ||||||||||
6.099% 8/1/37 • | 53,661 | 53,595 | ||||||||||
Fannie Mae S.F. 30 yr | ||||||||||||
4.50% 11/1/39 | 991,454 | 1,076,210 | ||||||||||
4.50% 1/1/40 | 14,230,787 | 15,437,300 | ||||||||||
4.50% 4/1/40 | 1,981,473 | 2,147,896 | ||||||||||
4.50% 6/1/40 | 1,080,915 | 1,173,060 | ||||||||||
4.50% 7/1/40 | 1,320,314 | 1,419,992 | ||||||||||
4.50% 8/1/40 | 316,046 | 341,072 | ||||||||||
4.50% 7/1/41 | 2,751,799 | 2,981,602 | ||||||||||
4.50% 8/1/41 | 2,860,504 | 3,103,016 | ||||||||||
4.50% 1/1/42 | 1,182,219 | 1,281,510 | ||||||||||
| Diversified Income Series-7 |
Table of Contents
Delaware VIP® Diversified Income Series
Schedule of investments (continued)
Principal | Value (U.S. $) | |||||||||||
Agency Mortgage-Backed Securities (continued) | ||||||||||||
Fannie Mae S.F. 30 yr | ||||||||||||
4.50% 8/1/42 | 11,372,415 | $ | 12,299,445 | |||||||||
4.50% 10/1/44 | 874,423 | 946,352 | ||||||||||
4.50% 2/1/46 | 21,857,404 | 23,532,761 | ||||||||||
4.50% 3/1/46 | 1,642,047 | 1,778,264 | ||||||||||
4.50% 7/1/46 | 3,208,249 | 3,458,782 | ||||||||||
5.50% 12/1/32 | 39,802 | 44,643 | ||||||||||
5.50% 2/1/33 | 438,681 | 491,372 | ||||||||||
5.50% 6/1/33 | 309,938 | 347,189 | ||||||||||
5.50% 4/1/34 | 192,724 | 216,085 | ||||||||||
5.50% 7/1/34 | 57,867 | 64,905 | ||||||||||
5.50% 8/1/34 | 29,208 | 32,754 | ||||||||||
5.50% 9/1/34 | 957,706 | 1,074,139 | ||||||||||
5.50% 11/1/34 | 200,821 | 225,207 | ||||||||||
5.50% 12/1/34 | 175,838 | 196,975 | ||||||||||
5.50% 1/1/35 | 510,516 | 571,914 | ||||||||||
5.50% 3/1/35 | 106,938 | 119,833 | ||||||||||
5.50% 5/1/35 | 664,835 | 744,709 | ||||||||||
5.50% 6/1/35 | 141,078 | 158,173 | ||||||||||
5.50% 11/1/35 | 108,465 | 121,141 | ||||||||||
5.50% 1/1/36 | 931,992 | 1,045,290 | ||||||||||
5.50% 4/1/36 | 1,048,201 | 1,172,476 | ||||||||||
5.50% 7/1/36 | 995,665 | 1,115,453 | ||||||||||
5.50% 9/1/36 | 2,357,095 | 2,644,283 | ||||||||||
5.50% 11/1/36 | 169,441 | 189,483 | ||||||||||
5.50% 1/1/37 | 723,531 | 806,011 | ||||||||||
5.50% 2/1/37 | 11,659 | 13,022 | ||||||||||
5.50% 4/1/37 | 1,421,329 | 1,587,270 | ||||||||||
5.50% 8/1/37 | 1,044,665 | 1,170,691 | ||||||||||
5.50% 9/1/37 | 848,382 | 945,751 | ||||||||||
5.50% 1/1/38 | 78,208 | 88,349 | ||||||||||
5.50% 2/1/38 | 567,750 | 635,622 | ||||||||||
5.50% 3/1/38 | 342,220 | 380,894 | ||||||||||
5.50% 6/1/38 | 1,670,106 | 1,863,045 | ||||||||||
5.50% 7/1/38 | 291,217 | 324,352 | ||||||||||
5.50% 9/1/38 | 706,848 | 791,355 | ||||||||||
5.50% 12/1/38 | 708,667 | 808,492 | ||||||||||
5.50% 1/1/39 | 3,435,672 | 3,849,020 | ||||||||||
5.50% 2/1/39 | 2,550,659 | 2,858,870 | ||||||||||
5.50% 6/1/39 | 810,351 | 906,894 | ||||||||||
5.50% 10/1/39 | 1,694,324 | 1,889,350 | ||||||||||
5.50% 12/1/39 | 7,938 | 8,861 | ||||||||||
5.50% 3/1/40 | 3,148,190 | 3,524,862 | ||||||||||
5.50% 7/1/40 | 1,385,381 | 1,552,962 | ||||||||||
5.50% 3/1/41 | 5,190,321 | 5,820,103 | ||||||||||
5.50% 6/1/41 | 2,131,859 | 2,386,781 | ||||||||||
5.50% 9/1/41 | 8,878,376 | 9,932,510 | ||||||||||
6.00% 4/1/35 | 2,906 | 3,313 | ||||||||||
6.00% 3/1/36 | 605,252 | 689,791 | ||||||||||
6.00% 6/1/36 | 68,448 | 77,617 | ||||||||||
6.00% 9/1/36 | 683,712 | 785,217 | ||||||||||
Principal | Value (U.S. $) | |||||||||||
Agency Mortgage-Backed Securities (continued) | ||||||||||||
Fannie Mae S.F. 30 yr | ||||||||||||
6.00% 12/1/36 | 74,294 | $ | 84,763 | |||||||||
6.00% 2/1/37 | 218,417 | 247,466 | ||||||||||
6.00% 3/1/37 | 249,973 | 283,351 | ||||||||||
6.00% 5/1/37 | 511,841 | 580,025 | ||||||||||
6.00% 6/1/37 | 40,648 | 46,656 | ||||||||||
6.00% 7/1/37 | 937,969 | 1,074,857 | ||||||||||
6.00% 8/1/37 | 281,794 | 319,594 | ||||||||||
6.00% 9/1/37 | 74,805 | 84,710 | ||||||||||
6.00% 11/1/37 | 13,088 | 14,821 | ||||||||||
6.00% 5/1/38 | 1,339,206 | 1,517,418 | ||||||||||
6.00% 9/1/38 | 220,224 | 252,119 | ||||||||||
6.00% 10/1/38 | 100,929 | 114,403 | ||||||||||
6.00% 11/1/38 | 176,580 | 202,187 | ||||||||||
6.00% 1/1/39 | 316,801 | 359,010 | ||||||||||
6.00% 9/1/39 | 2,685,020 | 3,042,730 | ||||||||||
6.00% 10/1/39 | 2,770,587 | 3,192,020 | ||||||||||
6.00% 3/1/40 | 309,745 | 351,298 | ||||||||||
6.00% 7/1/40 | 1,185,684 | 1,343,074 | ||||||||||
6.00% 9/1/40 | 264,547 | 299,744 | ||||||||||
6.00% 11/1/40 | 120,572 | 139,014 | ||||||||||
6.00% 5/1/41 | 3,669,301 | 4,156,764 | ||||||||||
6.00% 6/1/41 | 1,322,754 | 1,498,343 | ||||||||||
6.00% 7/1/41 | 6,137,417 | 6,968,266 | ||||||||||
6.50% 2/1/36 | 129,394 | 146,392 | ||||||||||
6.50% 3/1/37 | 266,079 | 312,337 | ||||||||||
6.50% 5/1/40 | 604,702 | 687,581 | ||||||||||
7.50% 3/1/32 | 176 | 202 | ||||||||||
7.50% 4/1/32 | 803 | 919 | ||||||||||
Fannie Mae S.F. 30 yr TBA | ||||||||||||
3.00% 1/1/47 | 46,852,000 | 46,543,423 | ||||||||||
Freddie Mac ARM | ||||||||||||
2.553% 10/1/46• | 1,751,459 | 1,764,268 | ||||||||||
2.759% 10/1/45• | 646,513 | 658,905 | ||||||||||
2.814% 9/1/45• | 4,260,146 | 4,344,843 | ||||||||||
2.817% 12/1/33• | 20,031 | 21,178 | ||||||||||
2.845% 8/1/37• | 2,614 | 2,771 | ||||||||||
2.927% 10/1/45• | 1,149,691 | 1,173,700 | ||||||||||
2.943% 11/1/44• | 374,120 | 383,949 | ||||||||||
2.979% 11/1/45• | 834,191 | 851,536 | ||||||||||
3.114% 3/1/46• | 1,571,595 | 1,611,361 | ||||||||||
3.151% 2/1/37• | 141,898 | 150,264 | ||||||||||
3.151% 10/1/37• | 936 | 990 | ||||||||||
3.23% 6/1/37• | 210,488 | 223,483 | ||||||||||
3.275% 10/1/37• | 12,343 | 12,975 | ||||||||||
Freddie Mac S.F. 30 yr | ||||||||||||
4.50% 4/1/39 | 179,791 | 194,164 | ||||||||||
4.50% 5/1/40 | 3,425,111 | 3,714,267 | ||||||||||
4.50% 7/1/42 | 1,668,404 | 1,803,375 | ||||||||||
4.50% 12/1/43 | 1,662,470 | 1,797,223 | ||||||||||
4.50% 8/1/44 | 2,538,386 | 2,751,984 | ||||||||||
| Diversified Income Series-8 |
Table of Contents
Delaware VIP® Diversified Income Series
Schedule of investments (continued)
Principal | Value (U.S. $) | |||||||||||
Agency Mortgage-Backed Securities (continued) | ||||||||||||
Freddie Mac S.F. 30 yr | ||||||||||||
4.50% 7/1/45 | 10,134,501 | $ | 10,909,936 | |||||||||
5.50% 3/1/34 | 88,521 | 99,603 | ||||||||||
5.50% 12/1/34 | 81,279 | 91,407 | ||||||||||
5.50% 6/1/36 | 48,835 | 54,868 | ||||||||||
5.50% 11/1/36 | 91,539 | 102,634 | ||||||||||
5.50% 12/1/36 | 22,093 | 24,660 | ||||||||||
5.50% 9/1/37 | 104,795 | 116,737 | ||||||||||
5.50% 4/1/38 | 377,190 | 420,635 | ||||||||||
5.50% 6/1/38 | 59,249 | 66,053 | ||||||||||
5.50% 7/1/38 | 388,095 | 432,907 | ||||||||||
5.50% 1/1/39 | 365,068 | 409,445 | ||||||||||
5.50% 6/1/39 | 484,541 | 539,820 | ||||||||||
5.50% 3/1/40 | 260,458 | 289,691 | ||||||||||
5.50% 8/1/40 | 192,053 | 214,125 | ||||||||||
5.50% 1/1/41 | 258,603 | 288,375 | ||||||||||
5.50% 6/1/41 | 5,478,009 | 6,113,005 | ||||||||||
6.00% 2/1/36 | 406,802 | 464,030 | ||||||||||
6.00% 3/1/36 | 258,803 | 295,495 | ||||||||||
6.00% 9/1/37 | 246,764 | 280,369 | ||||||||||
6.00% 1/1/38 | 101,477 | 114,641 | ||||||||||
6.00% 6/1/38 | 277,644 | 315,226 | ||||||||||
6.00% 8/1/38 | 441,615 | 506,595 | ||||||||||
6.00% 5/1/40 | 1,405,884 | 1,594,806 | ||||||||||
6.00% 7/1/40 | 1,334,595 | 1,517,893 | ||||||||||
6.50% 8/1/38 | 69,685 | 78,708 | ||||||||||
6.50% 4/1/39 | 425,685 | 484,228 | ||||||||||
GNMA I S.F. 30 yr | ||||||||||||
5.00% 3/15/40 | 5,808,840 | 6,360,374 | ||||||||||
7.00% 12/15/34 | 122,903 | 144,510 | ||||||||||
GNMA II S.F. 30 yr | ||||||||||||
5.50% 5/20/37 | 504,815 | 559,610 | ||||||||||
5.50% 4/20/40 | 466,023 | 510,219 | ||||||||||
6.00% 2/20/39 | 731,901 | 827,221 | ||||||||||
6.00% 2/20/40 | 2,450,101 | 2,796,474 | ||||||||||
6.00% 4/20/46 | 770,015 | 858,237 | ||||||||||
6.50% 10/20/39 | 871,168 | 986,426 | ||||||||||
|
| |||||||||||
Total Agency Mortgage-Backed Securities (cost $266,836,427) | 266,058,180 | |||||||||||
|
| |||||||||||
Collateralized Debt Obligations—1.85% | ||||||||||||
Anchorage Capital CLO 6 | ||||||||||||
Series 2015-6A A1 144A 2.42% 4/15/27 #• | 1,025,000 | 1,023,749 | ||||||||||
Avery Point III CLO | ||||||||||||
Series 2013-3A A 144A 2.282% 1/18/25 #• | 2,200,000 | 2,198,891 | ||||||||||
Benefit Street Partners CLO IV | ||||||||||||
Series 2014-IVA A1R 144A 2.233% 1/20/29 #• | 5,900,000 | 5,897,050 | ||||||||||
Principal | Value (U.S. $) | |||||||||||
Collateralized Debt Obligations (continued) | ||||||||||||
Benefit Street Partners CLO VI | ||||||||||||
Series 2015-VIA A1A 144A 2.432% 4/18/27 #• | 1,230,000 | $ | 1,231,103 | |||||||||
BlueMountain CLO | ||||||||||||
Series 2014-3A A1 144A 2.36% 10/15/26 #• | 1,270,000 | 1,276,021 | ||||||||||
Series 2015-2A A1 144A 2.312% 7/18/27 #• | 1,090,000 | 1,091,910 | ||||||||||
Carlyle Global Market Strategies CLO | ||||||||||||
Series 2014-2A A 144A 2.376% 5/15/25 #• | 2,750,000 | 2,750,159 | ||||||||||
Cedar Funding III CLO | ||||||||||||
Series 2014-3A A1 144A 2.441% 5/20/26 #• | 2,420,000 | 2,428,233 | ||||||||||
Cedar Funding VI CLO | ||||||||||||
Series 2016-6A A1 144A 2.344% 10/20/28 #• | 2,400,000 | 2,401,824 | ||||||||||
Cent CLO 20 | ||||||||||||
Series 2013-20A A 144A 2.362% 1/25/26 #• | 667,000 | 666,663 | ||||||||||
Cent CLO 21 | ||||||||||||
Series 2014-21A A1B 144A 2.276% 7/27/26 #• | 2,200,000 | 2,198,887 | ||||||||||
Magnetite IX | ||||||||||||
Series 2014-9A A1 144A 2.302% 7/25/26 #• | 6,040,000 | 6,042,488 | ||||||||||
Neuberger Berman CLO XVII | ||||||||||||
Series 2014-17A A 144A 2.346% 8/4/25 #• | 2,535,000 | 2,544,192 | ||||||||||
Neuberger Berman CLO XIX | ||||||||||||
Series 2015-19A A1 144A 2.30% 7/15/27 #• | 3,300,000 | 3,298,337 | ||||||||||
Shackleton CLO | ||||||||||||
Series 2014-5A A 144A 2.381% 5/7/26 #• | 2,985,000 | 2,985,961 | ||||||||||
Venture CDO | ||||||||||||
Series 2016-25A A1 144A 2.49% 4/20/29 #• | 980,000 | 979,510 | ||||||||||
Venture XXIV CLO | ||||||||||||
Series 2016-24A A1D 144A 2.24% 10/20/28 #• | 2,390,000 | 2,392,175 | ||||||||||
|
| |||||||||||
Total Collateralized Debt Obligations (cost $41,267,701) | 41,407,153 | |||||||||||
|
| |||||||||||
Convertible Bonds—1.71% | ||||||||||||
Aerojet Rocketdyne Holdings 144A 2.25% exercise price $26.00, maturity date 12/15/23 # | 120,000 | 117,450 | ||||||||||
| Diversified Income Series-9 |
Table of Contents
Delaware VIP® Diversified Income Series
Schedule of investments (continued)
Principal | Value (U.S. $) | |||||||||
Convertible Bonds (continued) | ||||||||||
Alaska Communications Systems Group 6.25% exercise price $10.28, maturity date 5/1/18 | 1,644,000 | $ | 1,631,670 | |||||||
BioMarin Pharmaceutical 1.50% exercise price $94.15, maturity date 10/15/20 | 485,000 | 570,784 | ||||||||
Blackhawk Network Holdings 144A 1.50% exercise price $49.83, maturity date 1/15/22 # | 963,000 | 991,890 | ||||||||
Blackstone Mortgage Trust 5.25%exercise price $27.99, maturity date 12/1/18 | 1,558,000 | 1,741,065 | ||||||||
Blucora 4.25% exercise price $21.66,maturity date 4/1/19 | 652,000 | 652,000 | ||||||||
Brookdale Senior Living 2.75% exercise price $29.33, maturity date 6/15/18 | 1,449,000 | 1,415,492 | ||||||||
Cardtronics 1.00% exercise price $52.35, maturity date 12/1/20 | 1,072,000 | 1,264,960 | ||||||||
Cemex 3.72% exercise price $11.45, maturity date 3/15/20 | 632,000 | 678,610 | ||||||||
Chart Industries 2.00% exercise price $69.03, maturity date 8/1/18 | 1,234,000 | 1,212,405 | ||||||||
Ciena 144A 3.75% exercise price $20.17, maturity date 10/15/18 # | 632,000 | 856,755 | ||||||||
Clearwire Communications 144A 8.25%exercise price $7.08, maturity date 12/1/40 # | 980,000 | 1,026,550 | ||||||||
DISH Network 144A 3.375% exercise price $65.18, maturity date 8/15/26 # | 236,000 | 269,777 | ||||||||
GAIN Capital Holdings 4.125% exercise price $12.00, maturity date 12/1/18 | 821,000 | 802,527 | ||||||||
General Cable 4.50% exercise price $31.67, maturity date 11/15/29 f | 1,481,000 | 1,163,511 | ||||||||
HealthSouth 2.00% exercise price $37.16, maturity date 12/1/43 | 1,059,000 | 1,258,886 | ||||||||
Helix Energy Solutions Group 4.25%exercise price $13.89, maturity date 5/1/22 | 740,000 | 768,213 | ||||||||
Hologic 2.00% exercise price $31.18, maturity date 3/1/42 f | 553,000 | 751,389 | ||||||||
Infinera 1.75% exercise price $12.58, maturity date 6/1/18 | 826,000 | 861,621 | ||||||||
Insulet 144A 1.25% exercise price $58.37, maturity date 9/15/21 # | 479,000 | 446,069 | ||||||||
Jefferies Group 3.875% exercise price $43.93, maturity date 11/1/29 | 1,121,000 | 1,136,414 | ||||||||
Knowles 144A 3.25% exercise price $18.43, maturity date 11/1/21 # | 690,000 | 803,850 | ||||||||
Liberty Interactive 144A 1.75% exercise price $341.10, maturity date 9/30/46 # | 655,000 | 707,400 | ||||||||
Liberty Media 144A 2.25% exercise price $104.55, maturity date 9/30/46 # | 233,000 | 246,689 | ||||||||
Principal | Value (U.S. $) | |||||||||
Convertible Bonds (continued) | ||||||||||
Medicines 144A 2.75% exercise price $48.97, maturity date 7/15/23 # | 665,000 | $ | 642,972 | |||||||
Meritor 4.00% exercise price $26.73, maturity date 2/15/27 f | 1,521,000 | 1,557,124 | ||||||||
New Mountain Finance 5.00% exercise price $15.80, maturity date 6/15/19 | 750,000 | 768,281 | ||||||||
Novellus Systems 2.625% exercise price $33.85, maturity date 5/15/41 | 488,000 | 1,521,645 | ||||||||
NuVasive 144A 2.25% exercise price $59.82, maturity date 3/15/21 # | 374,000 | 476,616 | ||||||||
NXP Semiconductors 1.00% exercise price $102.84, maturity date 12/1/19 | 1,002,000 | 1,144,785 | ||||||||
ON Semiconductor 1.00% exercise price $18.50, maturity date 12/1/20 | 678,000 | 697,916 | ||||||||
PROS Holdings 2.00% exercise price $33.79, maturity date 12/1/19 | 1,176,000 | 1,159,830 | ||||||||
Spectrum Pharmaceuticals 2.75% exercise price $10.53, maturity date 12/15/18 | 1,241,000 | 1,108,368 | ||||||||
Spirit Realty Capital 3.75% exercise price $13.10, maturity date 5/15/21 | 902,000 | 949,360 | ||||||||
Synchronoss Technologies 0.75% exercise price $53.17, maturity date 8/15/19 | 1,098,000 | 1,158,390 | ||||||||
TPG Specialty Lending 4.50% exercise price $25.83, maturity date 12/15/19 | 1,009,000 | 1,035,486 | ||||||||
Vector Group 1.75% exercise price $23.46, maturity date 4/15/20 • | 1,020,000 | 1,174,913 | ||||||||
Vector Group 2.50% exercise price $15.22, maturity date 1/15/19 • | 408,000 | 637,486 | ||||||||
VEREIT 3.75% exercise price $14.99, maturity date 12/15/20 | 1,545,000 | 1,547,905 | ||||||||
Verint Systems 1.50% exercise price $64.46, maturity date 6/1/21 | 1,342,000 | 1,263,996 | ||||||||
|
| |||||||||
Total Convertible Bonds (cost $36,670,121) | 38,221,050 | |||||||||
|
| |||||||||
Corporate Bonds – 48.43% | ||||||||||
Automotive – 0.09% | ||||||||||
Adient Global Holdings 144A | ||||||||||
4.875% 8/15/26 # | 820,000 | 805,650 | ||||||||
Goodyear Tire & Rubber 5.00% 5/31/26 | 1,165,000 | 1,162,600 | ||||||||
|
| |||||||||
| 1,968,250 | ||||||||||
|
| |||||||||
Banking – 9.98% | ||||||||||
Ally Financial 5.75% 11/20/25 | 1,440,000 | 1,441,800 | ||||||||
ANZ New Zealand International 144A | ||||||||||
2.60% 9/23/19 # | 500,000 | 504,423 | ||||||||
Banco Nacional de Costa Rica 144A | ||||||||||
5.875% 4/25/21 # | 2,020,000 | 2,040,200 | ||||||||
Bank Nederlandse Gemeenten | ||||||||||
5.25% 5/20/24 | AUD | 759,000 | 613,376 | |||||||
| Diversified Income Series-10 |
Table of Contents
Delaware VIP® Diversified Income Series
Schedule of investments (continued)
Principal | Value (U.S. $) | |||||||||||
Corporate Bonds (continued) | ||||||||||||
Banking (continued) | ||||||||||||
Bank of America | ||||||||||||
3.248% 10/21/27 | 1,040,000 | $ | 995,120 | |||||||||
3.30% 8/5/21 | AUD | 660,000 | 466,710 | |||||||||
4.183% 11/25/27 | 3,190,000 | 3,198,457 | ||||||||||
4.45% 3/3/26 | 12,930,000 | 13,349,852 | ||||||||||
Bank of New York Mellon | ||||||||||||
2.15% 2/24/20 | 535,000 | 533,666 | ||||||||||
2.20% 8/16/23 | 2,540,000 | 2,425,593 | ||||||||||
2.50% 4/15/21 | 4,330,000 | 4,337,387 | ||||||||||
2.80% 5/4/26 | 780,000 | 752,064 | ||||||||||
4.625% 12/29/49 • | 3,365,000 | 3,095,194 | ||||||||||
Barclays 3.20% 8/10/21 | 7,335,000 | 7,256,083 | ||||||||||
BB&T | ||||||||||||
2.05% 5/10/21 | 9,290,000 | 9,123,310 | ||||||||||
2.45% 1/15/20 | 1,335,000 | 1,346,032 | ||||||||||
BBVA Bancomer 144A 7.25% 4/22/20 # . | 765,000 | 843,413 | ||||||||||
Branch Banking & Trust | ||||||||||||
3.625% 9/16/25 | 365,000 | 371,505 | ||||||||||
Capital One 2.25% 9/13/21 | 3,850,000 | 3,760,630 | ||||||||||
Capital One Financial 4.20% 10/29/25 | 290,000 | 291,493 | ||||||||||
Citigroup 3.75% 10/27/23 | AUD | 1,486,000 | 1,039,085 | |||||||||
Citizens Bank 2.55% 5/13/21 | 840,000 | 835,698 | ||||||||||
Citizens Financial Group | ||||||||||||
2.375% 7/28/21 | 345,000 | 338,685 | ||||||||||
4.30% 12/3/25 | 2,050,000 | 2,086,232 | ||||||||||
Compass Bank 3.875% 4/10/25 | 2,280,000 | 2,173,519 | ||||||||||
Cooperatieve Rabobank | ||||||||||||
2.50% 9/4/20 | NOK | 5,290,000 | 634,309 | |||||||||
3.75% 7/21/26 | 2,520,000 | 2,475,131 | ||||||||||
Credit Suisse Group 144A | ||||||||||||
6.25% 12/29/49 #• | 5,325,000 | 5,198,265 | ||||||||||
Credit Suisse Group Funding Guernsey | ||||||||||||
3.125% 12/10/20 | 1,985,000 | 1,980,611 | ||||||||||
3.80% 6/9/23 | 250,000 | 250,078 | ||||||||||
4.55% 4/17/26 | 6,255,000 | 6,508,578 | ||||||||||
Fifth Third Bancorp 2.875% 7/27/20 | 975,000 | 988,163 | ||||||||||
Fifth Third Bank | ||||||||||||
2.25% 6/14/21 | 1,530,000 | 1,513,559 | ||||||||||
3.85% 3/15/26 | 2,240,000 | 2,258,469 | ||||||||||
Goldman Sachs Group | ||||||||||||
3.055% 8/21/19 • | AUD | 550,000 | 397,373 | |||||||||
3.50% 11/16/26 | 2,000,000 | 1,958,004 | ||||||||||
3.55% 2/12/21 | CAD | 400,000 | 312,201 | |||||||||
5.15% 5/22/45 | 4,300,000 | 4,539,347 | ||||||||||
5.20% 12/17/19 | NZD | 612,000 | 437,652 | |||||||||
HSBC Holdings | ||||||||||||
2.65% 1/5/22 | 2,615,000 | 2,554,701 | ||||||||||
4.375% 11/23/26 | 1,880,000 | 1,897,734 | ||||||||||
Huntington Bancshares 2.30% 1/14/22 | 1,595,000 | 1,548,786 | ||||||||||
ICICI Bank 144A 4.00% 3/18/26 # | 2,230,000 | 2,168,815 | ||||||||||
JPMorgan Chase & Co. | ||||||||||||
3.50% 12/18/26 | GBP | 264,000 | 359,179 | |||||||||
Principal | Value (U.S. $) | |||||||||||
Corporate Bonds (continued) | ||||||||||||
Banking (continued) | ||||||||||||
JPMorgan Chase & Co. | ||||||||||||
3.625% 12/1/27 | 2,885,000 | $ | 2,805,221 | |||||||||
4.25% 11/2/18 | NZD | 1,840,000 | 1,293,506 | |||||||||
4.25% 10/1/27 | 10,115,000 | 10,414,798 | ||||||||||
KeyBank | ||||||||||||
3.40% 5/20/26 | 3,795,000 | 3,692,531 | ||||||||||
6.95% 2/1/28 | 4,255,000 | 5,236,165 | ||||||||||
KeyCorp 5.00% 12/29/49 • | 4,315,000 | 3,991,375 | ||||||||||
Kreditanstalt fuer Wiederaufbau | ||||||||||||
5.25% 5/19/17 | NOK | 1,000,000 | 117,529 | |||||||||
Lloyds Banking Group 7.50% 4/30/49 • | 1,135,000 | 1,171,888 | ||||||||||
Morgan Stanley | ||||||||||||
2.625% 11/17/21 | 8,320,000 | 8,229,162 | ||||||||||
3.125% 8/5/21 | CAD | 972,000 | 747,194 | |||||||||
3.95% 4/23/27 | 6,390,000 | 6,338,791 | ||||||||||
5.00% 9/30/21 | AUD | 1,087,000 | 819,043 | |||||||||
National City Bank 1.318% 6/7/17 • | 1,905,000 | 1,905,899 | ||||||||||
Nationwide Building Society 144A | ||||||||||||
4.00% 9/14/26 # | 4,430,000 | 4,229,073 | ||||||||||
PNC Bank | ||||||||||||
2.45% 11/5/20 | 250,000 | 250,593 | ||||||||||
6.875% 4/1/18 | 5,710,000 | 6,051,230 | ||||||||||
PNC Financial Services Group | ||||||||||||
5.00% 12/29/49 • | 2,680,000 | 2,592,900 | ||||||||||
Popular 7.00% 7/1/19 | 1,240,000 | 1,284,950 | ||||||||||
Royal Bank of Scotland Group | ||||||||||||
3.875% 9/12/23 | 4,185,000 | 4,024,509 | ||||||||||
8.625% 12/29/49 • | 2,065,000 | 2,111,463 | ||||||||||
Santander UK Group Holdings | ||||||||||||
2.875% 10/16/20 | 1,000,000 | 992,991 | ||||||||||
3.125% 1/8/21 | 1,035,000 | 1,035,518 | ||||||||||
State Street | ||||||||||||
2.55% 8/18/20 | 2,245,000 | 2,268,819 | ||||||||||
3.10% 5/15/23 | 1,360,000 | 1,358,503 | ||||||||||
3.55% 8/18/25 | 2,125,000 | 2,177,902 | ||||||||||
SunTrust Banks | ||||||||||||
2.70% 1/27/22 | 2,525,000 | 2,529,045 | ||||||||||
3.30% 5/15/26 | 1,245,000 | 1,204,061 | ||||||||||
SVB Financial Group 3.50% 1/29/25 | 1,350,000 | 1,303,028 | ||||||||||
Swedbank 144A 2.65% 3/10/21 # | 2,585,000 | 2,588,172 | ||||||||||
Toronto-Dominion Bank | ||||||||||||
2.125% 4/7/21 | 1,755,000 | 1,729,217 | ||||||||||
2.50% 12/14/20 | 1,660,000 | 1,666,954 | ||||||||||
3.625% 9/15/31 • | 2,645,000 | 2,588,085 | ||||||||||
Turkiye Garanti Bankasi 144A | ||||||||||||
6.25% 4/20/21 # | 1,350,000 | 1,375,755 | ||||||||||
U.S. Bancorp | ||||||||||||
3.10% 4/27/26 | 195,000 | 190,072 | ||||||||||
3.60% 9/11/24 | 2,640,000 | 2,693,022 | ||||||||||
UBS Group Funding Jersey | ||||||||||||
144A 2.65% 2/1/22 # | 4,005,000 | 3,897,013 | ||||||||||
| Diversified Income Series-11 |
Table of Contents
Delaware VIP® Diversified Income Series
Schedule of investments (continued)
Principal | Value (U.S. $) | |||||||||||
Corporate Bonds (continued) | ||||||||||||
Banking (continued) | ||||||||||||
UBS Group Funding Jersey | ||||||||||||
144A 3.00% 4/15/21 # | 965,000 | $ | 966,472 | |||||||||
144A 4.125% 9/24/25 # | 2,265,000 | 2,312,850 | ||||||||||
144A 4.125% 4/15/26 # | 2,675,000 | 2,741,043 | ||||||||||
US Bancorp 2.375% 7/22/26 | 2,295,000 | 2,127,318 | ||||||||||
USB Capital IX 3.50% 10/29/49 • | 7,185,000 | 5,909,663 | ||||||||||
Wells Fargo & Co. | ||||||||||||
3.00% 7/27/21 | AUD | 1,788,000 | 1,257,095 | |||||||||
3.50% 9/12/29 | GBP | 654,000 | 880,823 | |||||||||
4.75% 12/7/46 | 1,340,000 | 1,363,175 | ||||||||||
Wells Fargo Bank 2.15% 12/6/19 | 1,470,000 | 1,469,709 | ||||||||||
Wells Fargo Capital X 5.95% 12/15/36 | 175,000 | 182,875 | ||||||||||
Westpac Banking 4.322% 11/23/31 • | 2,110,000 | 2,125,186 | ||||||||||
Woori Bank 144A 4.75% 4/30/24 # | 1,550,000 | 1,568,510 | ||||||||||
Zions Bancorporation 4.50% 6/13/23 | 2,150,000 | 2,178,593 | ||||||||||
|
| |||||||||||
| 223,189,771 | ||||||||||||
|
| |||||||||||
Basic Industry – 3.27% |
| |||||||||||
Air Liquide Finance 144A | ||||||||||||
2.50% 9/27/26 # | 2,140,000 | 2,013,177 | ||||||||||
ArcelorMittal 6.125% 6/1/25 | 735,000 | 808,500 | ||||||||||
BHP Billiton Finance | ||||||||||||
3.00% 3/30/20 | AUD | 630,000 | 450,901 | |||||||||
3.25% 9/25/24 | GBP | 325,000 | 439,524 | |||||||||
BHP Billiton Finance USA 144A | ||||||||||||
6.25% 10/19/75 #• | 2,180,000 | 2,369,006 | ||||||||||
Boise Cascade 144A 5.625% 9/1/24 # | 1,135,000 | 1,132,163 | ||||||||||
Builders FirstSource 144A | ||||||||||||
5.625% 9/1/24 # | 1,110,000 | 1,119,713 | ||||||||||
CCL Industries 144A 3.25% 10/1/26 # | 1,570,000 | 1,499,097 | ||||||||||
CF Industries 6.875% 5/1/18 | 3,830,000 | 4,041,186 | ||||||||||
Crown Americas 144A 4.25% 9/30/26 # | 870,000 | 821,063 | ||||||||||
Dow Chemical 8.55% 5/15/19 | 9,161,000 | 10,504,974 | ||||||||||
Eastman Chemical 4.65% 10/15/44 | 3,470,000 | 3,454,694 | ||||||||||
FMG Resources August 2006 144A | ||||||||||||
9.75% 3/1/22 # | 975,000 | 1,135,943 | ||||||||||
Freeport-McMoRan | ||||||||||||
4.55% 11/14/24 | 1,235,000 | 1,163,987 | ||||||||||
144A 6.50% 11/15/20 # | 560,000 | 578,200 | ||||||||||
Georgia-Pacific 8.00% 1/15/24 | 5,305,000 | 6,780,586 | ||||||||||
HD Supply 144A 5.75% 4/15/24 # | 1,145,000 | 1,211,639 | ||||||||||
International Paper | ||||||||||||
4.40% 8/15/47 | 4,515,000 | 4,284,193 | ||||||||||
5.15% 5/15/46 | 2,305,000 | 2,412,996 | ||||||||||
INVISTA Finance 144A | ||||||||||||
4.25% 10/15/19 # | 2,465,000 | 2,456,114 | ||||||||||
Lennar 4.875% 12/15/23 | 880,000 | 875,600 | ||||||||||
Lundin Mining 144A 7.50% 11/1/20 # | 755,000 | 806,906 | ||||||||||
MMC Norilsk Nickel | ||||||||||||
144A 5.55% 10/28/20 # | 962,000 | 1,026,490 | ||||||||||
144A 6.625% 10/14/22 # | 1,095,000 | 1,223,115 | ||||||||||
Principal | Value (U.S. $) | |||||||||||
Corporate Bonds (continued) | ||||||||||||
Basic Industry (continued) | ||||||||||||
NCI Building Systems 144A | ||||||||||||
8.25% 1/15/23 # | 495,000 | $ | 537,075 | |||||||||
NOVA Chemicals 144A 5.00% 5/1/25 # | 1,117,000 | 1,097,106 | ||||||||||
Novelis 144A 5.875% 9/30/26 # | 1,045,000 | 1,058,063 | ||||||||||
OCP | ||||||||||||
144A 4.50% 10/22/25 # | 2,125,000 | 2,037,480 | ||||||||||
144A 6.875% 4/25/44 # | 640,000 | 646,803 | ||||||||||
PolyOne 5.25% 3/15/23 | 812,000 | 828,240 | ||||||||||
Potash Corp. of Saskatchewan | ||||||||||||
4.00% 12/15/26 | 3,945,000 | 3,977,897 | ||||||||||
PulteGroup 5.00% 1/15/27 | 872,000 | 831,670 | ||||||||||
Southern Copper 5.875% 4/23/45 | 1,735,000 | 1,711,425 | ||||||||||
Steel Dynamics 144A 5.00% 12/15/26 # | 855,000 | 853,931 | ||||||||||
Suzano Austria 144A 5.75% 7/14/26 # | 2,260,000 | 2,183,725 | ||||||||||
Suzano Trading 144A 5.875% 1/23/21 # | 1,505,000 | 1,562,491 | ||||||||||
Teck Resources 144A 8.00% 6/1/21 # | 520,000 | 573,300 | ||||||||||
US Concrete 6.375% 6/1/24 | 55,000 | 58,300 | ||||||||||
Vale Overseas 5.875% 6/10/21 | 1,970,000 | 2,068,500 | ||||||||||
WR Grace & Co-Conn 144A | ||||||||||||
5.625% 10/1/24 # | 392,000 | 413,070 | ||||||||||
|
| |||||||||||
| 73,048,843 | ||||||||||||
|
| |||||||||||
Brokerage – 0.18% | ||||||||||||
Affiliated Managers Group | ||||||||||||
3.50% 8/1/25 | 2,115,000 | 1,999,244 | ||||||||||
Jefferies Group | ||||||||||||
6.45% 6/8/27 | 893,000 | 981,252 | ||||||||||
6.50% 1/20/43 | 585,000 | 603,870 | ||||||||||
Lazard Group 3.625% 3/1/27 | 475,000 | 451,064 | ||||||||||
|
| |||||||||||
| 4,035,430 | ||||||||||||
|
| |||||||||||
Capital Goods – 1.74% | ||||||||||||
Ardagh Packaging Finance | ||||||||||||
144A 4.625% 5/15/23 # | 645,000 | 642,181 | ||||||||||
144A 7.25% 5/15/24 # | 400,000 | 423,000 | ||||||||||
Ball 5.25% 7/1/25 | 1,610,000 | 1,688,487 | ||||||||||
Cemex Finance | ||||||||||||
144A 6.00% 4/1/24 # | 1,600,000 | 1,648,000 | ||||||||||
144A 9.375% 10/12/22 # | 200,000 | 218,500 | ||||||||||
Cia Brasileira de Aluminio 144A | ||||||||||||
6.75% 4/5/21 # | 1,525,000 | 1,597,438 | ||||||||||
Fortune Brands Home & Security | ||||||||||||
3.00% 6/15/20 | 1,310,000 | 1,319,467 | ||||||||||
General Electric | ||||||||||||
2.10% 12/11/19 | 795,000 | 801,159 | ||||||||||
144A 3.80% 6/18/19 # | 1,555,000 | 1,625,868 | ||||||||||
5.55% 5/4/20 | 1,295,000 | 1,432,820 | ||||||||||
6.00% 8/7/19 | 2,675,000 | 2,956,589 | ||||||||||
KLX 144A 5.875% 12/1/22 # | 645,000 | 666,769 | ||||||||||
LafargeHolcim Finance U.S. | ||||||||||||
144A 3.50% 9/22/26 # | 3,505,000 | 3,408,507 | ||||||||||
144A 4.75% 9/22/46 # | 1,365,000 | 1,326,985 | ||||||||||
Lennox International 3.00% 11/15/23 | 3,725,000 | 3,622,145 | ||||||||||
| Diversified Income Series-12 |
Table of Contents
Delaware VIP® Diversified Income Series
Schedule of investments (continued)
| Principal | Value | |||||||||
| amount° | (U.S. $) | |||||||||
Corporate Bonds (continued) | ||||||||||
Capital Goods (continued) | ||||||||||
Masco 3.50% 4/1/21 | 2,785,000 | $ | 2,805,887 | |||||||
Owens-Brockway Glass Container 144A | ||||||||||
5.875% 8/15/23 # | 1,450,000 | 1,514,344 | ||||||||
Roper Technologies | ||||||||||
2.80% 12/15/21 | 1,385,000 | 1,385,927 | ||||||||
3.80% 12/15/26 | 1,200,000 | 1,211,688 | ||||||||
Siemens Financieringsmaatschappij |
| |||||||||
144A 1.70% 9/15/21 # | 3,040,000 | 2,922,474 | ||||||||
St Marys Cement Canada 144A | ||||||||||
5.75% 1/28/27 # | 1,860,000 | 1,792,575 | ||||||||
TransDigm 144A 6.375% 6/15/26 # | 1,110,000 | 1,145,520 | ||||||||
Union Andina de Cementos 144A | ||||||||||
5.875% 10/30/21 # | 985,000 | 1,021,938 | ||||||||
United Technologies 3.75% 11/1/46 | 1,930,000 | 1,841,594 | ||||||||
|
| |||||||||
| 39,019,862 | ||||||||||
|
| |||||||||
Communications – 5.09% | ||||||||||
21st Century Fox America | ||||||||||
4.95% 10/15/45 | 2,955,000 | 3,048,520 | ||||||||
American Tower | ||||||||||
2.25% 1/15/22 | 105,000 | 100,695 | ||||||||
2.80% 6/1/20 | 815,000 | 816,075 | ||||||||
4.00% 6/1/25 | 3,010,000 | 3,022,898 | ||||||||
4.40% 2/15/26 | 1,580,000 | 1,617,478 | ||||||||
American Tower Trust I 144A | ||||||||||
3.07% 3/15/23 # | 2,430,000 | 2,412,636 | ||||||||
AT&T | ||||||||||
4.35% 6/15/45 | 1,745,000 | 1,560,876 | ||||||||
4.50% 3/9/48 | 8,030,000 | 7,244,240 | ||||||||
Bell Canada 3.35% 3/22/23 | CAD | 773,000 | 598,750 | |||||||
Cablevision 144A 6.50% 6/15/21 # | 1,980,000 | 2,017,125 | ||||||||
CC Holdings GS V 3.849% 4/15/23 | 1,710,000 | 1,740,164 | ||||||||
CenturyLink | ||||||||||
5.80% 3/15/22 | 3,230,000 | 3,313,592 | ||||||||
6.75% 12/1/23 | 1,525,000 | 1,565,031 | ||||||||
Charter Communications Operating | ||||||||||
4.908% 7/23/25 | 4,010,000 | 4,233,473 | ||||||||
Columbus Cable Barbados 144A | ||||||||||
7.375% 3/30/21 # | 1,395,000 | 1,489,707 | ||||||||
Communications Sales & Leasing | ||||||||||
8.25% 10/15/23 | 540,000 | 575,100 | ||||||||
Crown Castle International | ||||||||||
5.25% 1/15/23 | 2,190,000 | 2,365,200 | ||||||||
Crown Castle Towers 144A | ||||||||||
4.883% 8/15/20 # | 9,630,000 | 10,263,559 | ||||||||
Deutsche Telekom International Finance | ||||||||||
144A 1.95% 9/19/21 # | 1,360,000 | 1,311,931 | ||||||||
144A 2.485% 9/19/23 # | 6,900,000 | 6,600,913 | ||||||||
6.50% 4/8/22 | GBP | 416,000 | 643,846 | |||||||
Digicel 144A 6.00% 4/15/21 # | 480,000 | 436,546 | ||||||||
Digicel Group 144A 8.25% 9/30/20 # | 2,005,000 | 1,730,255 | ||||||||
| Principal | Value | |||||||||
| amount° | (U.S. $) | |||||||||
Corporate Bonds (continued) | ||||||||||
Communications (continued) | ||||||||||
Frontier Communications |
| |||||||||
8.875% 9/15/20 | 860,000 | $ | 919,125 | |||||||
Grupo Televisa 6.125% 1/31/46 | 970,000 | 967,813 | ||||||||
GTP Acquisition Partners I 144A | ||||||||||
2.35% 6/15/20 # | 1,095,000 | 1,067,121 | ||||||||
Level 3 Financing 5.375% 5/1/25 | 2,839,000 | 2,902,877 | ||||||||
Millicom International Cellular | ||||||||||
144A 6.00% 3/15/25 # | 920,000 | 907,350 | ||||||||
144A 6.625% 10/15/21 # | 1,760,000 | 1,853,773 | ||||||||
Myriad International Holdings 144A | ||||||||||
5.50% 7/21/25 # | 1,590,000 | 1,606,822 | ||||||||
Nexstar Escrow 144A 5.625% 8/1/24 # | 1,220,000 | 1,213,900 | ||||||||
SBA Communications 144A |
| |||||||||
4.875% 9/1/24 # | 1,225,000 | 1,212,750 | ||||||||
SBA Tower Trust | ||||||||||
144A 2.24% 4/16/18 # | 1,800,000 | 1,803,926 | ||||||||
144A 2.898% 10/15/19 # | 1,300,000 | 1,309,866 | ||||||||
Sky 144A 3.75% 9/16/24 # | 4,470,000 | 4,491,635 | ||||||||
Sprint Communications | ||||||||||
144A 7.00% 3/1/20 # | 1,440,000 | 1,566,000 | ||||||||
144A 9.00% 11/15/18 # | 195,000 | 215,475 | ||||||||
Time Warner 3.80% 2/15/27 | 3,675,000 | 3,661,744 | ||||||||
Time Warner Cable 7.30% 7/1/38 | 6,720,000 | 8,291,069 | ||||||||
T-Mobile USA 6.125% 1/15/22 | 1,359,000 | 1,437,143 | ||||||||
Verizon Communications | ||||||||||
3.25% 2/17/26 | EUR | 971,000 | 1,201,576 | |||||||
4.125% 8/15/46 | 11,255,000 | 10,227,700 | ||||||||
4.862% 8/21/46 | 997,000 | 1,014,233 | ||||||||
Viacom 3.45% 10/4/26 | 1,590,000 | 1,472,461 | ||||||||
Vimpel Communications 144A | ||||||||||
7.748% 2/2/21 # | 1,118,000 | 1,248,918 | ||||||||
VimpelCom Holdings 144A | ||||||||||
5.95% 2/13/23 # | 1,080,000 | 1,125,900 | ||||||||
Wind Acquisition Finance 144A | ||||||||||
7.375% 4/23/21 # | 810,000 | 844,425 | ||||||||
WPP Finance 2010 5.625% 11/15/43 | 780,000 | 839,200 | ||||||||
Zayo Group 6.00% 4/1/23 | 1,715,000 | 1,792,175 | ||||||||
|
| |||||||||
| 113,903,587 | ||||||||||
|
| |||||||||
Consumer Cyclical – 3.01% | ||||||||||
Aramark Services 144A 4.75% 6/1/26 # | 2,020,000 | 2,004,850 | ||||||||
Boyd Gaming 144A 6.375% 4/1/26 # | 1,600,000 | 1,731,200 | ||||||||
Cencosud | ||||||||||
144A 5.15% 2/12/25 # | 1,240,000 | 1,255,365 | ||||||||
144A 6.625% 2/12/45 # | 1,115,000 | 1,077,382 | ||||||||
CVS Health | ||||||||||
2.125% 6/1/21 | 725,000 | 711,636 | ||||||||
3.875% 7/20/25 | 3,320,000 | 3,430,971 | ||||||||
Daimler 2.75% 12/10/18 | NOK | 5,560,000 | 660,765 | |||||||
Daimler Finance North America 144A | ||||||||||
2.20% 10/30/21 # | 2,085,000 | 2,038,876 | ||||||||
Ford Motor 4.346% 12/8/26 | 1,620,000 | 1,640,221 | ||||||||
| Diversified Income Series-13 |
Table of Contents
Delaware VIP® Diversified Income Series
Schedule of investments (continued)
| Principal | Value | |||||||||||
| amount° | (U.S. $) | |||||||||||
Corporate Bonds (continued) | ||||||||||||
Consumer Cyclical (continued) | ||||||||||||
Ford Motor Credit 3.096% 5/4/23 | 2,145,000 | $ | 2,074,412 | |||||||||
General Motors Financial | ||||||||||||
3.45% 4/10/22 | 5,890,000 | 5,831,777 | ||||||||||
3.70% 5/9/23 | 1,720,000 | 1,694,828 | ||||||||||
4.00% 10/6/26 | 1,860,000 | 1,791,989 | ||||||||||
5.25% 3/1/26 | 1,045,000 | 1,099,717 | ||||||||||
GLP Capital 5.375% 4/15/26 | 855,000 | 893,817 | ||||||||||
Hanesbrands 144A 4.875% 5/15/26 # | 1,485,000 | 1,459,013 | ||||||||||
Hyundai Capital America |
| |||||||||||
144A 2.125% 10/2/17 # | 1,570,000 | 1,573,250 | ||||||||||
144A 2.55% 2/6/19 # | 685,000 | 689,356 | ||||||||||
144A 3.00% 3/18/21 # | 965,000 | 964,917 | ||||||||||
IHO Verwaltungs 144A PIK 4.75% | ||||||||||||
9/15/26 # | 495,000 | 478,913 | ||||||||||
JD.com 3.125% 4/29/21 | 1,570,000 | 1,553,692 | ||||||||||
KFC Holding | ||||||||||||
144A 5.00% 6/1/24 # | 788,000 | 806,715 | ||||||||||
144A 5.25% 6/1/26 # | 736,000 | 748,880 | ||||||||||
L Brands 6.75% 7/1/36 | 610,000 | 620,675 | ||||||||||
Levi Strauss 5.00% 5/1/25 | 1,030,000 | 1,035,150 | ||||||||||
Lowe’s 3.70% 4/15/46 | 3,605,000 | 3,373,844 | ||||||||||
Marriott International | ||||||||||||
3.125% 6/15/26 | 2,565,000 | 2,432,749 | ||||||||||
3.75% 3/15/25 | 2,230,000 | 2,228,535 | ||||||||||
4.50% 10/1/34 | 410,000 | 402,729 | ||||||||||
Mastercard 3.80% 11/21/46 | 500,000 | 491,397 | ||||||||||
MGM Resorts International | ||||||||||||
4.625% 9/1/26 | 1,205,000 | 1,165,837 | ||||||||||
Penske Automotive Group | ||||||||||||
5.50% 5/15/26 | 850,000 | 841,500 | ||||||||||
Sally Holdings 5.75% 6/1/22 | 47,000 | 49,056 | ||||||||||
Scotts Miracle-Gro 144A | ||||||||||||
5.25% 12/15/26 # | 910,000 | 912,275 | ||||||||||
Starbucks 2.45% 6/15/26 | 1,320,000 | 1,261,315 | ||||||||||
Target 3.625% 4/15/46 | 3,715,000 | 3,461,080 | ||||||||||
Tempur Sealy International | ||||||||||||
5.50% 6/15/26 | 1,050,000 | 1,057,875 | ||||||||||
Toyota Credit Canada 2.05% 5/20/20 | CAD | 400,000 | 300,524 | |||||||||
Toyota Motor Credit 2.80% 7/13/22 | 755,000 | 762,282 | ||||||||||
Walgreens Boots Alliance | ||||||||||||
3.10% 6/1/23 | 8,780,000 | 8,734,555 | ||||||||||
3.45% 6/1/26 | 1,985,000 | 1,952,357 | ||||||||||
|
| |||||||||||
| 67,296,277 | ||||||||||||
|
| |||||||||||
Consumer Non-Cyclical – 4.89% |
| |||||||||||
Abbott Laboratories 4.90% 11/30/46 | 4,385,000 | 4,518,172 | ||||||||||
AbbVie 3.20% 5/14/26 | 2,380,000 | 2,268,913 | ||||||||||
ACCO Brands 144A 5.25% 12/15/24 # | 400,000 | 403,752 | ||||||||||
Albertsons 144A 5.75% 3/15/25 # | 1,165,000 | 1,156,263 | ||||||||||
Altria Group 3.875% 9/16/46 | 3,030,000 | 2,808,295 | ||||||||||
Amgen 4.00% 9/13/29 | GBP | 341,000 | 477,973 | |||||||||
| Principal | Value | |||||||||||
| amount° | (U.S. $) | |||||||||||
Corporate Bonds (continued) | ||||||||||||
Consumer Non-Cyclical (continued) | ||||||||||||
Anheuser-Busch InBev Finance | ||||||||||||
3.65% 2/1/26 | 12,020,000 | $ | 12,225,494 | |||||||||
Arcor SAIC 144A 6.00% 7/6/23 # | 1,240,000 | 1,295,800 | ||||||||||
Becle 144A 3.75% 5/13/25 # | 3,435,000 | 3,279,412 | ||||||||||
Biogen 5.20% 9/15/45 | 1,980,000 | 2,126,948 | ||||||||||
BRF 144A 4.35% 9/29/26 # | 2,615,000 | 2,425,413 | ||||||||||
Celgene 3.25% 8/15/22 | 2,855,000 | 2,884,110 | ||||||||||
Dean Foods 144A 6.50% 3/15/23 # | 1,045,000 | 1,102,475 | ||||||||||
ESAL 144A 6.25% 2/5/23 # | 1,035,000 | 1,043,280 | ||||||||||
Gilead Sciences 4.15% 3/1/47 | 4,885,000 | 4,651,468 | ||||||||||
Gruma 144A 4.875% 12/1/24 # | 1,275,000 | 1,336,200 | ||||||||||
JBS Investments 144A | ||||||||||||
7.75% 10/28/20 # | 315,000 | 335,885 | ||||||||||
JBS USA 144A 5.75% 6/15/25 # | 430,000 | 437,525 | ||||||||||
Lamb Weston Holdings | ||||||||||||
144A 4.625% 11/1/24 # | 500,000 | 502,500 | ||||||||||
144A 4.875% 11/1/26 # | 625,000 | 619,922 | ||||||||||
Live Nation Entertainment 144A | ||||||||||||
4.875% 11/1/24 # | 865,000 | 869,325 | ||||||||||
Mallinckrodt International Finance 144A | ||||||||||||
5.50% 4/15/25 # | 2,137,000 | 1,923,300 | ||||||||||
Marfrig Holdings Europe 144A | ||||||||||||
8.00% 6/8/23 # | 955,000 | 990,908 | ||||||||||
Molson Coors Brewing | ||||||||||||
3.00% 7/15/26 | 3,820,000 | 3,618,472 | ||||||||||
4.20% 7/15/46 | 2,005,000 | 1,876,975 | ||||||||||
Mylan 144A 3.95% 6/15/26 # | 5,295,000 | 4,964,904 | ||||||||||
New York & Presbyterian Hospital | ||||||||||||
4.063% 8/1/56 | 1,630,000 | 1,529,405 | ||||||||||
PepsiCo 2.375% 10/6/26 | 3,250,000 | 3,080,656 | ||||||||||
Pernod Ricard | ||||||||||||
144A 3.25% 6/8/26 # | 4,140,000 | 3,980,415 | ||||||||||
144A 4.45% 1/15/22 # | 4,040,000 | 4,291,171 | ||||||||||
Pfizer 3.00% 12/15/26 | 2,720,000 | 2,688,625 | ||||||||||
Post Holdings 144A 5.00% 8/15/26 # | 1,405,000 | 1,348,800 | ||||||||||
Prestige Brands 144A | ||||||||||||
5.375% 12/15/21 # | 652,000 | 674,820 | ||||||||||
Reynolds American | ||||||||||||
4.00% 6/12/22 | 340,000 | 356,048 | ||||||||||
4.45% 6/12/25 | 2,380,000 | 2,517,148 | ||||||||||
Shire Acquisitions Investments Ireland | ||||||||||||
2.40% 9/23/21 | 2,710,000 | 2,620,716 | ||||||||||
2.875% 9/23/23 | 2,590,000 | 2,465,369 | ||||||||||
Sigma Alimentos 144A 4.125% 5/2/26 # | 1,715,000 | 1,633,538 | ||||||||||
Sysco 3.30% 7/15/26 | 6,480,000 | 6,371,907 | ||||||||||
Teva Pharmaceutical Finance | ||||||||||||
Netherlands III 2.80% 7/21/23 | 5,050,000 | 4,787,334 | ||||||||||
Thermo Fisher Scientific 3.00% 4/15/23 | 4,530,000 | 4,458,702 | ||||||||||
Transurban Finance 144A | ||||||||||||
3.375% 3/22/27 # | 975,000 | 923,224 | ||||||||||
| Diversified Income Series-14 |
Table of Contents
Delaware VIP® Diversified Income Series
Schedule of investments (continued)
Principal amount° | Value (U.S. $) | |||||||
Corporate Bonds (continued) | ||||||||
Consumer Non-Cyclical (continued) | ||||||||
Zimmer Biomet Holdings | ||||||||
3.375% 11/30/21 | 1,715,000 | $ | 1,733,417 | |||||
4.625% 11/30/19 | 3,645,000 | 3,857,711 | ||||||
|
| |||||||
| 109,462,690 | ||||||||
|
| |||||||
| Electric—6.66% | ||||||||
AES Gener | ||||||||
144A 5.00% 7/14/25 # | 1,035,000 | 1,029,199 | ||||||
144A 5.25% 8/15/21 # | 645,000 | 677,623 | ||||||
144A 8.375% 12/18/73 #• | 920,000 | 984,400 | ||||||
Ameren 3.65% 2/15/26 | 2,090,000 | 2,104,381 | ||||||
Ameren Illinois 9.75% 11/15/18 | 5,900,000 | 6,745,712 | ||||||
American Transmission Systems 144A | ||||||||
5.25% 1/15/22 # | 5,410,000 | 5,994,123 | ||||||
Appalachian Power 4.45% 6/1/45 | 1,360,000 | 1,395,176 | ||||||
Berkshire Hathaway Energy | ||||||||
3.75% 11/15/23 | 3,405,000 | 3,565,835 | ||||||
Black Hills | ||||||||
3.15% 1/15/27 | 1,150,000 | 1,102,819 | ||||||
3.95% 1/15/26 | 715,000 | 731,414 | ||||||
Cleveland Electric Illuminating | ||||||||
5.50% 8/15/24 | 365,000 | 413,164 | ||||||
CMS Energy 6.25% 2/1/20 | 2,210,000 | 2,446,315 | ||||||
ComEd Financing III 6.35% 3/15/33 | 2,055,000 | 2,119,529 | ||||||
Commonwealth Edison 4.35% 11/15/45 | 2,205,000 | 2,311,757 | ||||||
Consumers Energy | ||||||||
3.25% 8/15/46 | 2,985,000 | 2,642,403 | ||||||
4.10% 11/15/45 | 640,000 | 662,118 | ||||||
Dominion Resources | ||||||||
2.85% 8/15/26 | 575,000 | 539,448 | ||||||
3.90% 10/1/25 | 3,890,000 | 3,978,618 | ||||||
DTE Energy | ||||||||
2.85% 10/1/26 | 5,120,000 | 4,766,459 | ||||||
3.30% 6/15/22 | 2,180,000 | 2,220,260 | ||||||
Duke Energy | ||||||||
2.65% 9/1/26 | 3,525,000 | 3,296,890 | ||||||
4.80% 12/15/45 | 1,615,000 | 1,713,770 | ||||||
Duke Energy Carolinas 3.875% 3/15/46 . | 900,000 | 882,668 | ||||||
Emera 6.75% 6/15/76 • | 3,545,000 | 3,810,875 | ||||||
Emera U.S. Finance 144A | ||||||||
4.75% 6/15/46 # | 6,710,000 | 6,793,305 | ||||||
Enel 144A 8.75% 9/24/73 #• | 3,057,000 | 3,484,980 | ||||||
Enel Americas 4.00% 10/25/26 | 1,620,000 | 1,548,607 | ||||||
Enel Finance International 144A | ||||||||
6.00% 10/7/39 # | 1,275,000 | 1,429,016 | ||||||
Entergy | ||||||||
2.95% 9/1/26 | 635,000 | 595,235 | ||||||
4.00% 7/15/22 | 1,820,000 | 1,905,425 | ||||||
Entergy Louisiana | ||||||||
4.05% 9/1/23 | 4,045,000 | 4,242,995 | ||||||
4.95% 1/15/45 | 545,000 | 559,985 | ||||||
Entergy Mississippi 2.85% 6/1/28 | 1,835,000 | 1,744,957 | ||||||
Principal amount° | Value (U.S. $) | |||||||
Corporate Bonds (continued) | ||||||||
| Electric (continued) | ||||||||
Exelon 3.95% 6/15/25 | 2,445,000 | $ | 2,517,937 | |||||
Fortis 144A 3.055% 10/4/26 # | 4,800,000 | 4,498,646 | ||||||
Great Plains Energy 4.85% 6/1/21 | 1,195,000 | 1,274,291 | ||||||
Indiana Michigan Power | ||||||||
3.20% 3/15/23 | 1,455,000 | 1,470,945 | ||||||
4.55% 3/15/46 | 590,000 | 614,414 | ||||||
IPALCO Enterprises 5.00% 5/1/18 | 1,365,000 | 1,416,187 | ||||||
ITC Holdings 3.25% 6/30/26 | 700,000 | 681,386 | ||||||
Kansas City Power & Light | ||||||||
3.65% 8/15/25 | 3,445,000 | 3,455,328 | ||||||
LG&E & KU Energy 4.375% 10/1/21 | 3,765,000 | 4,011,009 | ||||||
Louisville Gas & Electric | ||||||||
4.375% 10/1/45 | 630,000 | 663,723 | ||||||
Massachusetts Electric 144A | ||||||||
4.004% 8/15/46 # | 7,410,000 | 7,132,562 | ||||||
Metropolitan Edison 144A | ||||||||
4.00% 4/15/25 # | 2,270,000 | 2,289,320 | ||||||
MidAmerican Energy 4.25% 5/1/46 | 2,920,000 | 3,014,947 | ||||||
National Rural Utilities Cooperative | ||||||||
Finance | ||||||||
2.70% 2/15/23 | 2,530,000 | 2,515,847 | ||||||
4.75% 4/30/43 • | 2,840,000 | 2,862,643 | ||||||
5.25% 4/20/46 • | 980,000 | 1,022,758 | ||||||
New York State Electric & Gas 144A | ||||||||
3.25% 12/1/26 # | 2,495,000 | 2,487,280 | ||||||
NextEra Energy Capital Holdings | ||||||||
2.40% 9/15/19 | 3,380,000 | 3,401,277 | ||||||
3.625% 6/15/23 | 1,320,000 | 1,343,916 | ||||||
NV Energy 6.25% 11/15/20 | 2,380,000 | 2,701,376 | ||||||
Pennsylvania Electric 5.20% 4/1/20 | 3,235,000 | 3,466,930 | ||||||
Perusahaan Listrik Negara 144A | ||||||||
5.50% 11/22/21 # | 2,560,000 | 2,752,000 | ||||||
Public Service of Oklahoma | ||||||||
5.15% 12/1/19 | 3,700,000 | 3,981,381 | ||||||
SCANA 4.125% 2/1/22 | 2,300,000 | 2,326,418 | ||||||
Southern | ||||||||
3.25% 7/1/26 | 3,415,000 | 3,330,301 | ||||||
4.40% 7/1/46 | 135,000 | 134,078 | ||||||
Southwestern Public Service | ||||||||
3.40% 8/15/46 | 945,000 | 850,535 | ||||||
Trans-Allegheny Interstate Line 144A | ||||||||
3.85% 6/1/25 # | 1,190,000 | 1,207,606 | ||||||
Wisconsin Electric Power | ||||||||
4.30% 12/15/45 | 1,280,000 | 1,325,830 | ||||||
Xcel Energy 3.30% 6/1/25 | 1,850,000 | 1,853,707 | ||||||
|
| |||||||
| 149,044,039 | ||||||||
|
| |||||||
| Energy – 4.53% | ||||||||
AmeriGas Partners 5.875% 8/20/26 | 1,085,000 | 1,106,700 | ||||||
Anadarko Petroleum 6.60% 3/15/46 | 5,020,000 | 6,213,661 | ||||||
Antero Resources 144A 5.00% 3/1/25 # | 1,230,000 | 1,209,102 | ||||||
| Diversified Income Series-15 |
Table of Contents
Delaware VIP® Diversified Income Series
Schedule of investments (continued)
Principal amount° | Value (U.S. $) | |||||||
Corporate Bonds (continued) | ||||||||
| Energy (continued) | ||||||||
BP Capital Markets | ||||||||
3.216% 11/28/23 | 1,830,000 | $ | 1,849,951 | |||||
3.561% 11/1/21 | 1,025,000 | 1,070,678 | ||||||
3.723% 11/28/28 | 1,610,000 | 1,638,199 | ||||||
Buckeye Partners 3.95% 12/1/26 | 1,945,000 | 1,896,723 | ||||||
Cheniere Corpus Christi Holdings 144A | ||||||||
5.875% 3/31/25 # | 320,000 | 327,699 | ||||||
CNOOC Finance 2015 Australia | ||||||||
2.625% 5/5/20 | 1,530,000 | 1,526,264 | ||||||
ConocoPhillips 4.95% 3/15/26 | 4,790,000 | 5,297,826 | ||||||
Diamondback Energy 144A | ||||||||
4.75% 11/1/24 # | 785,000 | 773,225 | ||||||
Dominion Gas Holdings | ||||||||
4.60% 12/15/44 | 1,580,000 | 1,578,202 | ||||||
Ecopetrol | ||||||||
5.875% 9/18/23 | 1,805,000 | 1,915,105 | ||||||
7.375% 9/18/43 | 1,055,000 | 1,073,463 | ||||||
Empresa Nacional del Petroleo 144A | ||||||||
4.75% 12/6/21 # | 2,090,000 | 2,163,211 | ||||||
Enbridge | ||||||||
4.25% 12/1/26 | 1,205,000 | 1,236,224 | ||||||
6.00% 1/15/77 • | 2,040,000 | 2,040,000 | ||||||
Energy Transfer Equity 7.50% 10/15/20 . | 1,105,000 | 1,237,600 | ||||||
Energy Transfer Partners | ||||||||
6.125% 12/15/45 | 2,280,000 | 2,434,192 | ||||||
9.70% 3/15/19 | 2,189,000 | 2,513,764 | ||||||
EnLink Midstream Partners | ||||||||
4.85% 7/15/26 | 1,175,000 | 1,187,460 | ||||||
Enterprise Products Operating | ||||||||
7.034% 1/15/68 • | 465,000 | 477,097 | ||||||
Genesis Energy 6.75% 8/1/22 | 745,000 | 777,780 | ||||||
Gulfport Energy 144A 6.00% 10/15/24 # . | 520,000 | 531,700 | ||||||
Hilcorp Energy I 144A 5.00% 12/1/24 # | 585,000 | 583,537 | ||||||
Kunlun Energy 144A 2.875% 5/13/20 # | 850,000 | 848,402 | ||||||
Murphy Oil 6.875% 8/15/24 | 1,045,000 | 1,115,538 | ||||||
Murphy Oil USA 6.00% 8/15/23 | 1,485,000 | 1,555,538 | ||||||
Nabors Industries 144A | ||||||||
5.50% 1/15/23 # | 602,000 | 628,338 | ||||||
Newfield Exploration 5.75% 1/30/22 | 1,140,000 | 1,206,975 | ||||||
Noble Energy 5.05% 11/15/44 | 1,790,000 | 1,801,921 | ||||||
Pertamina Persero | ||||||||
144A 4.875% 5/3/22 # | 320,000 | 329,680 | ||||||
144A 5.25% 5/23/21 # | 1,640,000 | 1,729,847 | ||||||
144A 5.625% 5/20/43 # | 1,060,000 | 980,584 | ||||||
Petrobras Global Finance | ||||||||
6.25% 3/17/24 | 945,000 | 908,807 | ||||||
7.875% 3/15/19 | 1,145,000 | 1,230,119 | ||||||
8.375% 5/23/21 | 1,170,000 | 1,263,600 | ||||||
8.75% 5/23/26 | 215,000 | 232,469 | ||||||
Petroleos Mexicanos | ||||||||
144A 4.607% 3/11/22 #• | 870,000 | 898,275 | ||||||
| Principal amount° | Value (U.S. $) | |||||||||||
Corporate Bonds (continued) | ||||||||||||
| Energy (continued) | ||||||||||||
Petroleos Mexicanos | ||||||||||||
144A 6.50% 3/13/27 # | 3,750,000 | $ | 3,872,813 | |||||||||
6.625% 6/15/35 | 1,470,000 | 1,455,300 | ||||||||||
144A 6.75% 9/21/47 # | 560,000 | 530,488 | ||||||||||
Petronas Global Sukuk 144A | ||||||||||||
2.707% 3/18/20 # | 1,885,000 | 1,884,996 | ||||||||||
Plains All American Pipeline | ||||||||||||
4.50% 12/15/26 | 1,185,000 | 1,204,468 | ||||||||||
8.75% 5/1/19 | 3,490,000 | 3,975,330 | ||||||||||
QEP Resources 5.25% 5/1/23 | 585,000 | 589,388 | ||||||||||
Regency Energy Partners | ||||||||||||
5.00% 10/1/22 | 2,665,000 | 2,827,490 | ||||||||||
5.50% 4/15/23 | 623,000 | 646,363 | ||||||||||
Shell International Finance | ||||||||||||
2.875% 5/10/26 | 1,560,000 | 1,510,030 | ||||||||||
3.75% 9/12/46 | 4,298,000 | 3,965,043 | ||||||||||
4.00% 5/10/46 | 1,330,000 | 1,275,051 | ||||||||||
Southwestern Energy 6.70% 1/23/25 | 855,000 | 878,513 | ||||||||||
Targa Resources Partners 144A | ||||||||||||
5.375% 2/1/27 # | 1,185,000 | 1,179,075 | ||||||||||
Tengizchevroil Finance International | ||||||||||||
144A 4.00% 8/15/26 # | 2,290,000 | 2,158,039 | ||||||||||
Tesoro Logistics 5.25% 1/15/25 | 790,000 | 809,750 | ||||||||||
Transcanada Trust 5.875% 8/15/76 • | 2,260,000 | 2,356,050 | ||||||||||
Transocean Proteus 144A | ||||||||||||
6.25% 12/1/24 # | 280,000 | 284,026 | ||||||||||
Trinidad Generation 144A | ||||||||||||
5.25% 11/4/27 # | 1,620,000 | 1,579,144 | ||||||||||
Williams Partners 7.25% 2/1/17 | 2,815,000 | 2,826,049 | ||||||||||
Woodside Finance | ||||||||||||
144A 3.65% 3/5/25 # | 1,105,000 | 1,081,343 | ||||||||||
144A 3.70% 9/15/26 # | 455,000 | 445,840 | ||||||||||
144A 8.75% 3/1/19 # | 3,220,000 | 3,635,464 | ||||||||||
YPF | ||||||||||||
144A 8.50% 3/23/21 # | 605,000 | 650,436 | ||||||||||
144A 8.50% 7/28/25 # | 475,000 | 482,838 | ||||||||||
144A 26.333% 7/7/20 #• | 1,510,000 | 1,728,950 | ||||||||||
|
| |||||||||||
| 101,221,733 | ||||||||||||
|
| |||||||||||
| Finance Companies – 1.24% | ||||||||||||
AerCap Global Aviation Trust 144A | ||||||||||||
6.50% 6/15/45 #• | 3,920,000 | 3,973,900 | ||||||||||
AerCap Ireland Capital 3.95% 2/1/22 | 5,040,000 | 5,096,700 | ||||||||||
Air Lease 3.00% 9/15/23 | 2,330,000 | 2,229,386 | ||||||||||
Aviation Capital Group | ||||||||||||
144A 2.875% 9/17/18 # | 155,000 | 157,131 | ||||||||||
144A 4.875% 10/1/25 # | 2,480,000 | 2,631,900 | ||||||||||
E*TRADE Financial 5.875% 12/29/49 • | 2,655,000 | 2,646,371 | ||||||||||
Equate Petrochemical | ||||||||||||
144A 3.00% 3/3/22 # | 1,370,000 | 1,309,761 | ||||||||||
144A 4.25% 11/3/26 # | 845,000 | 809,121 | ||||||||||
General Electric 4.25% 1/17/18 | NZD | 420,000 | 295,190 | |||||||||
| Diversified Income Series-16 |
Table of Contents
Delaware VIP® Diversified Income Series
Schedule of investments (continued)
Principal | Value (U.S. $) | |||||||||||
Corporate Bonds (continued) | ||||||||||||
Finance Companies (continued) | ||||||||||||
Lazard Group 3.75% 2/13/25 | 1,495,000 | $ | 1,462,330 | |||||||||
Peachtree Corners Funding Trust 144A | ||||||||||||
3.976% 2/15/25 # | 2,405,000 | 2,350,611 | ||||||||||
SMBC Aviation Capital Finance 144A | ||||||||||||
2.65% 7/15/21 # | 1,835,000 | 1,768,358 | ||||||||||
SUAM Finance 144A 4.875% 4/17/24 # | 1,405,000 | 1,426,075 | ||||||||||
Temasek Financial I 144A | ||||||||||||
2.375% 1/23/23 # | 1,615,000 | 1,580,263 | ||||||||||
|
| |||||||||||
| 27,737,097 | ||||||||||||
|
| |||||||||||
Healthcare – 0.25% | ||||||||||||
DaVita 5.00% 5/1/25 | 1,241,000 | 1,223,936 | ||||||||||
HCA 5.25% 6/15/26 | 1,255,000 | 1,300,494 | ||||||||||
HealthSouth | ||||||||||||
5.125% 3/15/23 | 595,000 | 592,025 | ||||||||||
5.75% 11/1/24 | 455,000 | 462,963 | ||||||||||
5.75% 9/15/25 | 485,000 | 485,000 | ||||||||||
Hill-Rom Holdings 144A 5.75% 9/1/23 # . | 1,050,000 | 1,089,375 | ||||||||||
Universal Health Services 144A | ||||||||||||
5.00% 6/1/26 # | 485,000 | 475,300 | ||||||||||
|
| |||||||||||
| 5,629,093 | ||||||||||||
|
| |||||||||||
Insurance —1.45% | ||||||||||||
Allstate 3.28% 12/15/26 | 1,815,000 | 1,824,785 | ||||||||||
Berkshire Hathaway 2.75% 3/15/23 | 1,365,000 | 1,361,031 | ||||||||||
Berkshire Hathaway Finance | ||||||||||||
2.90% 10/15/20 | 2,260,000 | 2,315,831 | ||||||||||
Five Corners Funding Trust 144A | ||||||||||||
4.419% 11/15/23 # | 1,110,000 | 1,175,250 | ||||||||||
Highmark 144A 6.125% 5/15/41 # | 145,000 | 134,593 | ||||||||||
MetLife | ||||||||||||
3.60% 4/10/24 | 2,525,000 | 2,594,453 | ||||||||||
6.40% 12/15/36 | 110,000 | 119,075 | ||||||||||
6.817% 8/15/18 | 225,000 | 242,629 | ||||||||||
MetLife Capital Trust X 144A | ||||||||||||
9.25% 4/8/38 # | 2,655,000 | 3,617,437 | ||||||||||
Principal Life Global Funding II 144A | ||||||||||||
3.00% 4/18/26 # | 1,700,000 | 1,654,498 | ||||||||||
Prudential Financial | ||||||||||||
4.50% 11/15/20 | 795,000 | 852,621 | ||||||||||
5.375% 5/15/45 • | 1,730,000 | 1,773,250 | ||||||||||
TIAA Asset Management Finance | ||||||||||||
144A 2.95% 11/1/19 # | 1,885,000 | 1,918,832 | ||||||||||
144A 4.125% 11/1/24 # | 8,145,000 | 8,240,402 | ||||||||||
USI 144A 7.75% 1/15/21 # | 268,000 | 273,528 | ||||||||||
XLIT | ||||||||||||
4.45% 3/31/25 | 1,385,000 | 1,375,668 | ||||||||||
5.50% 3/31/45 | 2,045,000 | 1,947,186 | ||||||||||
6.50% 12/29/49 • | 1,410,000 | 1,103,325 | ||||||||||
|
| |||||||||||
| 32,524,394 | ||||||||||||
|
| |||||||||||
Media – 0.89% | ||||||||||||
CCO Holdings 144A 5.50% 5/1/26 # | 1,025,000 | 1,048,063 | ||||||||||
Principal | Value (U.S. $) | |||||||||||
Corporate Bonds (continued) | ||||||||||||
Media (continued) | ||||||||||||
CSC Holdings 144A 5.50% 4/15/27 # | 1,780,000 | $ | 1,806,700 | |||||||||
DISH DBS 7.75% 7/1/26 | 530,000 | 598,900 | ||||||||||
Gray Television 144A | ||||||||||||
5.125% 10/15/24 # | 1,135,000 | 1,100,950 | ||||||||||
Lamar Media 5.75% 2/1/26 | 919,000 | 970,694 | ||||||||||
Midcontinent Communications 144A | ||||||||||||
6.875% 8/15/23 # | 820,000 | 877,400 | ||||||||||
SFR Group 144A 6.00% 5/15/22 # | 1,840,000 | 1,895,200 | ||||||||||
Sinclair Television Group 144A | ||||||||||||
5.125% 2/15/27 # | 1,200,000 | 1,146,000 | ||||||||||
Sirius XM Radio 144A 5.375% 4/15/25 # | 2,281,000 | 2,275,298 | ||||||||||
Tribune Media 5.875% 7/15/22 | 1,347,000 | 1,375,624 | ||||||||||
Unitymedia 144A 6.125% 1/15/25 # | 790,000 | 815,675 | ||||||||||
UPCB Finance IV 144A | ||||||||||||
5.375% 1/15/25 # | 1,198,000 | 1,212,975 | ||||||||||
Virgin Media Secured Finance 144A | ||||||||||||
5.25% 1/15/26 # | 1,895,000 | 1,878,419 | ||||||||||
VTR Finance 144A 6.875% 1/15/24 # | 2,775,000 | 2,872,125 | ||||||||||
|
| |||||||||||
| 19,874,023 | ||||||||||||
|
| |||||||||||
Natural Gas – 0.51% | ||||||||||||
KeySpan Gas East 144A | ||||||||||||
2.742% 8/15/26 # | 2,510,000 | 2,385,820 | ||||||||||
NiSource Finance 6.125% 3/1/22 | 2,120,000 | 2,447,671 | ||||||||||
Southern Gas Capital | ||||||||||||
3.25% 6/15/26 | 1,565,000 | 1,530,191 | ||||||||||
3.95% 10/1/46 | 5,540,000 | 5,147,956 | ||||||||||
|
| |||||||||||
| 11,511,638 | ||||||||||||
|
| |||||||||||
Real Estate Investment Trusts – 1.28% | ||||||||||||
Alexandria Real Estate Equities | ||||||||||||
3.95% 1/15/27 | 750,000 | 748,218 | ||||||||||
AvalonBay Communities 2.95% 5/11/26 . | 3,185,000 | 3,044,099 | ||||||||||
Corporate Office Properties | ||||||||||||
3.60% 5/15/23 | 1,750,000 | 1,686,279 | ||||||||||
5.25% 2/15/24 | 1,755,000 | 1,831,042 | ||||||||||
CubeSmart 3.125% 9/1/26 | 2,200,000 | 2,077,616 | ||||||||||
DDR | ||||||||||||
7.50% 4/1/17 | 1,075,000 | 1,089,879 | ||||||||||
7.875% 9/1/20 | 1,015,000 | 1,182,946 | ||||||||||
Education Realty Operating Partnership | ||||||||||||
4.60% 12/1/24 | 2,190,000 | 2,186,494 | ||||||||||
ESH Hospitality 144A 5.25% 5/1/25 # | 1,150,000 | 1,147,125 | ||||||||||
Hospitality Properties Trust | ||||||||||||
4.50% 3/15/25 | 2,025,000 | 1,977,204 | ||||||||||
Host Hotels & Resorts | ||||||||||||
3.75% 10/15/23 | 710,000 | 698,050 | ||||||||||
4.50% 2/1/26 | 1,680,000 | 1,704,620 | ||||||||||
Kite Realty Group 4.00% 10/1/26 | 795,000 | 762,232 | ||||||||||
Lifestorage 3.50% 7/1/26 | 1,620,000 | 1,557,948 | ||||||||||
MGM Growth Properties Operating Partnership 144A 4.50% 9/1/26 # | 1,550,000 | 1,495,750 | ||||||||||
| Diversified Income Series-17 |
Table of Contents
Delaware VIP® Diversified Income Series
Schedule of investments (continued)
Principal | Value (U.S. $) | |||||||||||
Corporate Bonds (continued) | ||||||||||||
Real Estate Investment Trusts (continued) | ||||||||||||
PLA Administradora Industrial 144A | ||||||||||||
5.25% 11/10/22 # | 1,590,000 | $ | 1,530,375 | |||||||||
Trust F/1401 144A 5.25% 1/30/26 # | 1,470,000 | 1,414,875 | ||||||||||
UDR 4.00% 10/1/25 | 710,000 | 728,055 | ||||||||||
WP Carey 4.60% 4/1/24 | 1,680,000 | 1,705,173 | ||||||||||
|
| |||||||||||
| 28,567,980 | ||||||||||||
|
| |||||||||||
Services – 0.29% | ||||||||||||
GEO Group 5.125% 4/1/23 | 390,000 | 376,350 | ||||||||||
Herc Rentals 144A 7.50% 6/1/22 # | 770,000 | 815,237 | ||||||||||
Iron Mountain U.S. Holdings 144A | ||||||||||||
5.375% 6/1/26 # | 660,000 | 641,850 | ||||||||||
NES Rentals Holdings 144A | ||||||||||||
7.875% 5/1/18 # | 620,000 | 620,000 | ||||||||||
Prime Security Services Borrower 144A | ||||||||||||
9.25% 5/15/23 # | 1,100,000 | 1,200,375 | ||||||||||
ServiceMaster 144A 5.125% 11/15/24 # . | 1,115,000 | 1,134,513 | ||||||||||
United Rentals North America | ||||||||||||
5.50% 7/15/25 | 1,755,000 | 1,796,681 | ||||||||||
|
| |||||||||||
| 6,585,006 | ||||||||||||
|
| |||||||||||
Technology – 1.34% | ||||||||||||
Analog Devices | ||||||||||||
2.50% 12/5/21 | 425,000 | 421,584 | ||||||||||
3.50% 12/5/26 | 1,835,000 | 1,821,797 | ||||||||||
Apple | ||||||||||||
3.45% 2/9/45 | 955,000 | 845,100 | ||||||||||
3.85% 8/4/46 | 1,940,000 | 1,863,620 | ||||||||||
CDK Global 5.00% 10/15/24 | 1,870,000 | 1,823,250 | ||||||||||
Cisco Systems 1.85% 9/20/21 | 2,270,000 | 2,216,930 | ||||||||||
Diamond 1 Finance 144A | ||||||||||||
6.02% 6/15/26 # | 4,185,000 | 4,541,658 | ||||||||||
Fidelity National Information Services | ||||||||||||
3.00% 8/15/26 | 2,040,000 | 1,919,361 | ||||||||||
5.00% 10/15/25 | 3,195,000 | 3,485,870 | ||||||||||
First Data | ||||||||||||
144A 5.75% 1/15/24 # | 1,195,000 | 1,237,578 | ||||||||||
144A 7.00% 12/1/23 # | 725,000 | 773,937 | ||||||||||
NXP 144A 4.625% 6/1/23 # | 1,830,000 | 1,926,075 | ||||||||||
Oracle 4.00% 7/15/46 | 1,425,000 | 1,366,477 | ||||||||||
Quintiles IMS 144A 5.00% 10/15/26 # | 945,000 | 949,725 | ||||||||||
Samsung Electronics America 144A | ||||||||||||
1.75% 4/10/17 # | 3,005,000 | 3,006,472 | ||||||||||
Tencent Holdings 144A | ||||||||||||
3.375% 5/2/19 # | 1,130,000 | 1,156,155 | ||||||||||
Western Digital 144A 7.375% 4/1/23 # | 555,000 | 611,888 | ||||||||||
|
| |||||||||||
| 29,967,477 | ||||||||||||
|
| |||||||||||
Transportation – 1.51% | ||||||||||||
Air Canada 2015-1 Class A Pass Through Trust 144A 3.60% 3/15/27 #◆ | 1,262,720 | 1,259,564 | ||||||||||
Principal | Value (U.S. $) | |||||||||||
Corporate Bonds (continued) | ||||||||||||
Transportation (continued) | ||||||||||||
American Airlines 2014-1 Class A Pass | ||||||||||||
Through Trust 3.70% 10/1/26 ◆ | 996,068 | $ | 986,107 | |||||||||
American Airlines 2015-1 Class A Pass | ||||||||||||
Through Trust 3.375% 5/1/27 ◆ | 650,459 | 641,515 | ||||||||||
American Airlines 2015-2 Class AA Pass | ||||||||||||
Through Trust 3.60% 9/22/27 ◆ | 463,765 | 461,446 | ||||||||||
American Airlines 2016-1 Class AA Pass | ||||||||||||
Through Trust 3.575% 1/15/28 ◆ | 743,175 | 744,104 | ||||||||||
Autoridad del Canal de Panama 144A | ||||||||||||
4.95% 7/29/35 # | 1,620,000 | 1,717,200 | ||||||||||
Burlington Northern Santa Fe | ||||||||||||
4.70% 9/1/45 | 4,510,000 | 4,948,214 | ||||||||||
CSX | ||||||||||||
2.60% 11/1/26 | 1,740,000 | 1,632,322 | ||||||||||
3.80% 11/1/46 | 4,520,000 | 4,208,522 | ||||||||||
ERAC USA Finance | ||||||||||||
144A 3.30% 12/1/26 # | 3,315,000 | 3,187,442 | ||||||||||
144A 4.20% 11/1/46 # | 1,170,000 | 1,073,541 | ||||||||||
Penske Truck Leasing | ||||||||||||
144A 3.30% 4/1/21 # | 1,815,000 | 1,837,168 | ||||||||||
144A 3.375% 2/1/22 # | 3,565,000 | 3,599,195 | ||||||||||
144A 3.40% 11/15/26 # | 775,000 | 743,032 | ||||||||||
United Airlines 2014-1 Class A Pass | ||||||||||||
Through Trust 4.00% 4/11/26 ◆ | 773,357 | 789,790 | ||||||||||
United Airlines 2014-2 Class A Pass | ||||||||||||
Through Trust 3.75% 9/3/26 ◆ | 1,342,810 | 1,351,202 | ||||||||||
United Airlines 2016-1 Class AA Pass | ||||||||||||
Through Trust 3.10% 7/7/28 ◆ | 1,110,000 | 1,072,538 | ||||||||||
United Parcel Service 5.125% 4/1/19 | 2,180,000 | 2,341,839 | ||||||||||
XPO Logistics 144A 6.125% 9/1/23 # | 1,045,000 | 1,095,944 | ||||||||||
|
| |||||||||||
| 33,690,685 | ||||||||||||
|
| |||||||||||
Utilities – 0.23% | ||||||||||||
AES 5.50% 4/15/25 | 1,532,000 | 1,539,660 | ||||||||||
AES Andres 144A 7.95% 5/11/26 # | 1,200,000 | 1,242,564 | ||||||||||
Calpine | ||||||||||||
144A 5.25% 6/1/26 # | 1,135,000 | 1,123,650 | ||||||||||
5.50% 2/1/24 | 588,000 | 570,360 | ||||||||||
Dynegy 7.625% 11/1/24 | 662,000 | 614,005 | ||||||||||
|
| |||||||||||
| 5,090,239 | ||||||||||||
|
| |||||||||||
Total Corporate Bonds | 1,083,368,114 | |||||||||||
|
| |||||||||||
Municipal Bonds – 0.60% | ||||||||||||
Bay Area Toll Authority (Taxable Build America Bonds) 6.907% 10/1/50 | 2,115,000 | 2,976,228 | ||||||||||
Commonwealth of Massachusetts Series C 5.00% 10/1/25 | 1,090,000 | 1,321,603 | ||||||||||
New Jersey Turnpike Authority | ||||||||||||
(Taxable Build America Bonds) | ||||||||||||
Series A 7.102% 1/1/41 | 1,160,000 | 1,624,603 | ||||||||||
| Diversified Income Series-18 |
Table of Contents
Delaware VIP® Diversified Income Series
Schedule of investments (continued)
Principal amount° | Value (U.S. $) | |||||||
Municipal Bonds (continued) | ||||||||
New Jersey Turnpike Authority | ||||||||
Series F 7.414% 1/1/40 | 555,000 | $ | 801,437 | |||||
New York City, New York | ||||||||
Series C 5.00% 8/1/26 | 390,000 | 467,867 | ||||||
Series C 5.00% 8/1/27 | 450,000 | 535,487 | ||||||
Oregon State Taxable Pension | ||||||||
(Taxable Build America Bonds) | ||||||||
5.892% 6/1/27 | 5,000 | 6,087 | ||||||
South Carolina Public Service Authority | ||||||||
(Taxable) Series D 4.77% 12/1/45 | 680,000 | 700,148 | ||||||
State of California Various Purposes | ||||||||
(Taxable Build America Bonds) | ||||||||
7.55% 4/1/39 | 1,685,000 | 2,508,662 | ||||||
Texas Water Development Board | ||||||||
Series A 5.00% 10/15/45 | 580,000 | 657,053 | ||||||
(Taxable Build America Bonds) | ||||||||
5.00% 10/15/46 | 1,590,000 | 1,823,126 | ||||||
|
| |||||||
Total Municipal Bonds (cost $14,285,513) | 13,422,301 | |||||||
|
| |||||||
Non-Agency Asset-Backed Securities – 2.42% | ||||||||
AEP Texas Central Transition Funding II | ||||||||
Series 2006-A A4 5.17% 1/1/18 | 668,642 | 680,514 | ||||||
Ally Master Owner Trust | ||||||||
Series 2012-5 A 1.54% 9/15/19 | 1,915,000 | 1,917,724 | ||||||
Series 2014-4 A2 1.43% 6/17/19 | 3,450,000 | 3,452,038 | ||||||
American Express Credit Account Master | ||||||||
Trust | ||||||||
Series 2013-2 A 1.124% 5/17/21 • | 960,000 | 962,947 | ||||||
Avis Budget Rental Car Funding AESOP | ||||||||
Series 2013-1A A 144A | ||||||||
1.92% 9/20/19 # | 1,850,000 | 1,840,698 | ||||||
Series 2014-1A A 144A | ||||||||
2.46% 7/20/20 # | 2,775,000 | 2,768,316 | ||||||
Bank of America Credit Card Trust | ||||||||
Series 2014-A3 A 0.994% 1/15/20 • | 1,745,000 | 1,746,211 | ||||||
California Republic Auto Receivables | ||||||||
Trust | ||||||||
Series 2013-1 A2 144A | ||||||||
1.41% 9/17/18 # | 49,342 | 49,340 | ||||||
Capital One Multi-Asset Execution Trust | ||||||||
Series 2007-A5 A5 0.744% 7/15/20 • | 2,900,000 | 2,896,936 | ||||||
Series 2016-A1 A1 1.154% 2/15/22 • | 1,000,000 | 1,004,062 | ||||||
Chase Issuance Trust | ||||||||
Series 2007-C1 C1 1.164% 4/15/19 • . | 1,500,000 | 1,499,876 | ||||||
CNH Equipment Trust | ||||||||
Series 2016-B A2B | ||||||||
1.104% 10/15/19 • | 415,000 | 415,533 | ||||||
Discover Card Execution Note Trust | ||||||||
Series 2013-A1 A1 1.004% 8/17/20 • | 1,010,000 | 1,010,827 | ||||||
Principal amount° | Value (U.S. $) | |||||||
Non-Agency Asset-Backed Securities (continued) | ||||||||
Ford Credit Auto Lease Trust | ||||||||
Series 2015-A A3 1.13% 6/15/18 | 1,565,630 | $ | 1,565,813 | |||||
Ford Credit Auto Owner Trust | ||||||||
Series 2016-2 A 144A | ||||||||
2.03% 12/15/27 # | 4,135,000 | 4,066,691 | ||||||
Golden Credit Card Trust | ||||||||
Series 2014-2A A 144A | ||||||||
1.154% 3/15/21 #• | 1,195,000 | 1,196,363 | ||||||
Series 2015-2A A 144A | ||||||||
2.02% 4/15/22 # | 1,485,000 | 1,475,202 | ||||||
HOA Funding | ||||||||
Series 2014-1A A2 144A | ||||||||
4.846% 8/20/44 # | 2,912,750 | 2,578,561 | ||||||
Honda Auto Receivables Owner Trust | ||||||||
Series 2015-3 A3 1.27% 4/18/19 | 525,000 | 524,830 | ||||||
Hyundai Auto Lease Securitization Trust | ||||||||
Series 2015-A A3 144A | ||||||||
1.42% 9/17/18 # | 3,179,252 | 3,183,614 | ||||||
Mercedes-Benz Auto Lease Trust | ||||||||
Series 2016-A A2B 1.264% 7/16/18 • . | 1,069,167 | 1,070,440 | ||||||
Mercedes-Benz Master Owner Trust | ||||||||
Series 2016-AA A 144A | ||||||||
1.284% 5/15/20 #• | 1,665,000 | 1,670,322 | ||||||
Morgan Stanley ABS Capital I Trust | ||||||||
Series 2005-HE5 M1 | ||||||||
1.386% 9/25/35 • | 770,048 | 768,105 | ||||||
Navistar Financial Dealer Note Master | ||||||||
Owner Trust II | ||||||||
Series 2016-1 A 144A | ||||||||
2.106% 9/27/21 #• | 1,125,000 | 1,128,016 | ||||||
New Century Home Equity Loan Trust | ||||||||
Series 2005-2 M1 1.401% 6/25/35 • | 403,910 | 403,143 | ||||||
Nissan Auto Lease Trust | ||||||||
Series 2015-B A2B | ||||||||
1.234% 12/15/17 • | 805,337 | 806,113 | ||||||
Penarth Master Issuer | ||||||||
Series 2015-1A A1 144A | ||||||||
1.136% 3/18/19 #• | 885,000 | 884,800 | ||||||
PFS Financing | ||||||||
Series 2015-AA A 144A | ||||||||
1.324% 4/15/20 #• | 750,000 | 748,459 | ||||||
Porsche Innovative Lease Owner Trust | ||||||||
Series 2015-1 A3 144A | ||||||||
1.19% 7/23/18 # | 1,656,017 | 1,656,229 | ||||||
Synchrony Credit Card Master Note | ||||||||
Trust | ||||||||
Series 2012-6 A 1.36% 8/17/20 | 1,865,000 | 1,866,040 | ||||||
Series 2015-2 A 1.60% 4/15/21 | 1,730,000 | 1,731,460 | ||||||
| Diversified Income Series-19 |
Table of Contents
Delaware VIP® Diversified Income Series
Schedule of investments (continued)
| Principal amount° | Value (U.S. $) | |||||||||||
Non-Agency Asset-Backed Securities (continued) | ||||||||||||
Verizon Owner Trust | ||||||||||||
Series 2016-2A A 144A 1.68% 5/20/21 # | 1,490,000 | $ | 1,483,997 | |||||||||
Volkswagen Credit Auto Master Trust | ||||||||||||
Series 2014-1A A2 144A 1.40% 7/22/19 # | 5,050,000 | 5,046,518 | ||||||||||
|
| |||||||||||
Total Non-Agency Asset-Backed Securities (cost $54,517,432) | 54,099,738 | |||||||||||
|
| |||||||||||
Non-Agency Collateralized Mortgage Obligations – 1.16% | ||||||||||||
American Home Mortgage Investment Trust | ||||||||||||
Series 2005-2 5A1 5.064% 9/25/35 f | 55,648 | 55,045 | ||||||||||
Bank of America Alternative Loan Trust | ||||||||||||
Series 2005-1 2A1 5.50% 2/25/20 | 76,163 | 76,043 | ||||||||||
Series 2005-6 7A1 5.50% 7/25/20 | 60,014 | 57,785 | ||||||||||
Citicorp Mortgage Securities Trust | ||||||||||||
Series 2006-3 1A9 5.75% 6/25/36 | 102,571 | 100,019 | ||||||||||
Citicorp Residential Mortgage Trust | ||||||||||||
Series 2006-3 A5 5.836% 11/25/36 f | 1,800,000 | 1,844,812 | ||||||||||
JPMorgan Mortgage Trust | ||||||||||||
Series 2014-2 B1 144A 3.431% 6/25/29 #• | 837,307 | 828,264 | ||||||||||
Series 2014-2 B2 144A 3.431% 6/25/29 #• | 312,974 | 306,265 | ||||||||||
Series 2014-IVR6 2A4 144A 2.50% 7/25/44 #• | 1,050,000 | 1,034,096 | ||||||||||
Series 2015-1 B1 144A | ||||||||||||
2.64% 12/25/44 #• | 1,433,470 | 1,419,377 | ||||||||||
Series 2015-4 B1 144A 3.629% 6/25/45 #• | 1,114,001 | 1,082,185 | ||||||||||
Series 2015-4 B2 144A 3.629% 6/25/45 #• | 799,175 | 762,867 | ||||||||||
Series 2015-5 B2 144A 2.896% 5/25/45 #• | 1,103,658 | 1,039,428 | ||||||||||
Series 2015-6 B1 144A 3.631% 10/25/45 #• | 775,635 | 764,796 | ||||||||||
Series 2015-6 B2 144A 3.631% 10/25/45 #• | 751,397 | 729,939 | ||||||||||
Series 2016-4 B1 144A 3.914% 10/25/46 #• | 543,880 | 551,386 | ||||||||||
Series 2016-4 B2 144A 3.914% 10/25/46 #• | 933,079 | 901,413 | ||||||||||
JPMorgan Trust | ||||||||||||
Series 2015-1 B2 144A 2.64% 12/25/44 #• | 1,192,095 | 1,163,405 | ||||||||||
Principal | Value (U.S. $) | |||||||||||
Non-Agency Collateralized Mortgage Obligations (continued) | ||||||||||||
New Residential Mortgage Loan Trust | ||||||||||||
Series 2015-2A A1 144A 3.75% 8/25/55 #• | 1,527,405 | $ | 1,577,087 | |||||||||
Series 2016-4A A1 144A 3.75% 11/25/56 #• | 596,021 | 614,056 | ||||||||||
Sequoia Mortgage Trust | ||||||||||||
Series 2013-11 B1 144A 3.666% 9/25/43 #• | 1,033,253 | 1,036,290 | ||||||||||
Series 2014-2 A4 144A 3.50% 7/25/44 #• | 977,662 | 975,600 | ||||||||||
Series 2015-1 B2 144A 3.881% 1/25/45 #• | 860,736 | 850,866 | ||||||||||
Towd Point Mortgage Trust | ||||||||||||
Series 2015-5 A1B 144A 2.75% 5/25/55 #• | 1,447,635 | 1,451,145 | ||||||||||
Series 2015-6 A1B 144A 2.75% 4/25/55 #• | 1,494,967 | 1,495,880 | ||||||||||
Series 2016-1 A1B 144A 2.75% 2/25/55 #• | 1,023,836 | 1,026,245 | ||||||||||
Series 2016-2 A1 144A 3.00% 8/25/55 #• | 915,203 | 919,999 | ||||||||||
Series 2016-3 A1 144A 2.25% 8/25/55 #• | 1,297,523 | 1,287,087 | ||||||||||
Washington Mutual Mortgage Pass Through Certificates | ||||||||||||
Series 2005-1 5A2 6.00% 3/25/35 ◆ | 61,891 | 26,154 | ||||||||||
Wells Fargo Mortgage-Backed Securities Trust | ||||||||||||
Series 2006-2 3A1 5.75% 3/25/36 | 274,612 | 277,128 | ||||||||||
Series 2006-3 A11 5.50% 3/25/36 | 305,320 | 309,994 | ||||||||||
Series 2006-AR5 2A1 3.154% 4/25/36 • | 266,918 | 249,671 | ||||||||||
WinWater Mortgage Loan Trust | ||||||||||||
Series 2015-3 B1 144A 3.91% 3/20/45 #• | 1,158,040 | 1,151,520 | ||||||||||
|
| |||||||||||
Total Non-Agency Collateralized Mortgage Obligations (cost $25,728,265) | 25,965,847 | |||||||||||
|
| |||||||||||
Non-Agency Commercial Mortgage-Backed Securities – 5.70% | ||||||||||||
Banc of America Commercial Mortgage Trust | ||||||||||||
Series 2007-4 AM 5.814% 2/10/51 • | 1,330,000 | 1,354,485 | ||||||||||
Bear Stearns Commercial Mortgage Securities Trust | ||||||||||||
Series 2007-PW18 A4 5.70% 6/11/50 | 1,019,126 | 1,040,983 | ||||||||||
| Diversified Income Series-20 |
Table of Contents
Delaware VIP® Diversified Income Series
Schedule of investments (continued)
Principal | Value (U.S. $) | |||||||||||
Non-Agency Commercial Mortgage-Backed Securities (continued) | ||||||||||||
CD Mortgage Trust | ||||||||||||
Series 2016-CD2 A3 3.248% 11/10/49 | 5,000,000 | $ | 5,042,305 | |||||||||
Series 2016-CD2 A4 | ||||||||||||
3.526% 11/10/49 • | 1,365,000 | 1,403,426 | ||||||||||
CFCRE Commercial Mortgage Trust | ||||||||||||
Series 2016-C7 A3 3.839% 12/10/54 | 3,010,000 | 3,109,763 | ||||||||||
Citigroup Commercial Mortgage Trust | ||||||||||||
Series 2007-C6 AM 5.711% 12/10/49 • | 1,230,000 | 1,247,643 | ||||||||||
Series 2014-GC25 A4 3.635% 10/10/47 | 2,275,000 | 2,355,713 | ||||||||||
Series 2015-GC27 A5 3.137% 2/10/48 | 5,210,000 | 5,201,918 | ||||||||||
Series 2016-P3 A4 3.329% 4/15/49 | 1,745,000 | 1,752,970 | ||||||||||
Series 2016-P5 A4 2.941% 10/10/49 | 1,640,000 | 1,590,391 | ||||||||||
COMM Mortgage Trust | ||||||||||||
Series 2013-CR6 AM 144A 3.147% 3/10/46 # | 1,765,000 | 1,764,184 | ||||||||||
Series 2014-CR19 A5 | ||||||||||||
3.796% 8/10/47 | 9,707,000 | 10,170,228 | ||||||||||
Series 2014-CR20 AM 3.938% 11/10/47 | 7,775,000 | 8,039,817 | ||||||||||
Series 2015-3BP A 144A 3.178% 2/10/35 # | 3,960,000 | 3,959,278 | ||||||||||
Series 2015-CR23 A4 3.497% 5/10/48 | 3,450,000 | 3,534,432 | ||||||||||
Commercial Mortgage Trust | ||||||||||||
Series 2007-GG9 AM 5.475% 3/10/39 | 863,570 | 863,261 | ||||||||||
DB-JPM | ||||||||||||
Series 2016-C1 A4 3.276% 5/10/49 | 3,305,000 | 3,336,212 | ||||||||||
Series 2016-C3 A5 2.89% 9/10/49 | 1,985,000 | 1,935,166 | ||||||||||
DB-UBS Mortgage Trust | ||||||||||||
Series 2011-LC1A A3 144A 5.002% 11/10/46 # | 1,910,000 | 2,072,189 | ||||||||||
Series 2011-LC1A C 144A 5.685% 11/10/46 #• | 2,000,000 | 2,207,209 | ||||||||||
GRACE Mortgage Trust | ||||||||||||
Series 2014-GRCE A 144A 3.369% 6/10/28 # | 5,605,000 | 5,814,715 | ||||||||||
Series 2014-GRCE B 144A 3.52% 6/10/28 # | 1,765,000 | 1,819,801 | ||||||||||
GS Mortgage Securities Trust | ||||||||||||
Series 2010-C1 C 144A 5.635% 8/10/43 #• | 1,010,000 | 1,076,810 | ||||||||||
Series 2014-GC24 A5 3.931% 9/10/47 | 2,970,000 | 3,134,813 | ||||||||||
Principal | Value (U.S. $) | |||||||||||
Non-Agency Commercial Mortgage-Backed Securities (continued) | ||||||||||||
GS Mortgage Securities Trust | ||||||||||||
Series 2015-GC32 A4 3.764% 7/10/48 | 1,240,000 | $ | 1,295,307 | |||||||||
Houston Galleria Mall Trust | ||||||||||||
Series 2015-HGLR A1A2 144A 3.087% 3/5/37 # | 2,655,000 | 2,594,672 | ||||||||||
JPM-BB Commercial Mortgage Securities Trust | ||||||||||||
Series 2015-C33 A4 3.77% 12/15/48 | 4,160,000 | 4,322,653 | ||||||||||
JPM-DB Commercial Mortgage Securities Trust | ||||||||||||
Series 2016-C2 A4 3.144% 6/15/49 | 3,385,000 | 3,371,157 | ||||||||||
Series 2016-C4 B 3.638% 12/15/49 • | 1,715,000 | 1,707,324 | ||||||||||
JPMorgan Chase Commercial Mortgage Securities Trust | ||||||||||||
Series 2005-CB11 E 5.524% 8/12/37 • | 600,000 | 630,499 | ||||||||||
Series 2005-LDP5 D 5.524% 12/15/44 • | 1,110,000 | 1,107,845 | ||||||||||
Series 2011-C5 C 144A 5.408% 8/15/46 #• | 1,100,000 | 1,171,023 | ||||||||||
Series 2013-LC11 B 3.499% 4/15/46 | 1,565,000 | 1,580,601 | ||||||||||
Series 2015-JP1 A5 3.914% 1/15/49 | 1,590,000 | 1,675,975 | ||||||||||
Series 2016-JP2 A4 2.822% 8/15/49 | 2,100,000 | 2,035,425 | ||||||||||
Series 2016-JP3 B 3.397% 8/15/49 • | 700,000 | 683,530 | ||||||||||
Series 2016-WIKI A 144A 2.798% 10/5/31 # | 800,000 | 803,238 | ||||||||||
Series 2016-WIKI B 144A 3.201% 10/5/31 # | 1,490,000 | 1,499,710 | ||||||||||
LB-UBS Commercial Mortgage Trust | ||||||||||||
Series 2004-C1 A4 4.568% 1/15/31 | 54,493 | 54,479 | ||||||||||
Series 2006-C6 AJ 5.452% 9/15/39 • | 2,021,887 | 1,814,239 | ||||||||||
Morgan Stanley Bank of America Merrill Lynch Trust | ||||||||||||
Series 2014-C17 A5 3.741% 8/15/47 | 1,640,000 | 1,710,079 | ||||||||||
Series 2015-C23 A4 3.719% 7/15/50 | 5,490,000 | 5,693,336 | ||||||||||
Series 2015-C26 A5 3.531% 10/15/48 | 2,390,000 | 2,447,998 | ||||||||||
Series 2016-C29 A4 3.325% 5/15/49 | 1,620,000 | 1,622,987 | ||||||||||
Morgan Stanley Capital I Trust | ||||||||||||
Series 2006-HQ10 B | ||||||||||||
5.448% 11/12/41 • | 2,910,000 | 2,937,722 | ||||||||||
Series 2006-TOP21 B 144A | ||||||||||||
5.237% 10/12/52 #• | 800,000 | 799,721 | ||||||||||
UBS Commercial Mortgage Trust | ||||||||||||
Series 2012-C1 A3 3.40% 5/10/45 | 1,758,796 | 1,832,433 | ||||||||||
Wells Fargo Commercial Mortgage Trust | ||||||||||||
Series 2014-LC18 A5 | ||||||||||||
3.405% 12/15/47 | 570,000 | 579,453 | ||||||||||
| Diversified Income Series-21 |
Table of Contents
Delaware VIP® Diversified Income Series
Schedule of investments (continued)
| Principal amount° | Value (U.S. $) | |||||||||||
Non-Agency Commercial Mortgage-Backed Securities (continued) | ||||||||||||
Wells Fargo Commercial Mortgage Trust Series 2015-NXS3 A4 | ||||||||||||
3.617% 9/15/57 | 3,120,000 | $ | 3,213,586 | |||||||||
Series 2016-BNK1 A3 2.652% 8/15/49 | 2,575,000 | 2,461,364 | ||||||||||
WF-RBS Commercial Mortgage Trust Series 2012-C10 A3 2.875% 12/15/45 | 3,905,000 | 3,949,679 | ||||||||||
|
| |||||||||||
Total Non-Agency Commercial Mortgage-Backed Securities (cost $129,672,238) | 127,423,747 | |||||||||||
|
| |||||||||||
Regional Bonds – 0.79% D | ||||||||||||
Argentina – 0.16% | ||||||||||||
City of Buenos Aires Argentina 144A 7.50% 6/1/27 # | 2,300,000 | 2,357,500 | ||||||||||
Provincia de Buenos Aires 144A 7.875% 6/15/27 # | 1,155,000 | 1,141,949 | ||||||||||
|
| |||||||||||
| 3,499,449 | ||||||||||||
|
| |||||||||||
Australia – 0.12% | ||||||||||||
New South Wales Treasury 4.00% 5/20/26 | AUD | 1,087,500 | 851,976 | |||||||||
Queensland Treasury 144A 2.75% 8/20/27 # | AUD | 1,228,000 | 844,922 | |||||||||
144A 3.25% 7/21/28 # | AUD | 1,291,000 | 922,336 | |||||||||
|
| |||||||||||
| 2,619,234 | ||||||||||||
|
| |||||||||||
Canada – 0.30% | ||||||||||||
Province of British Columbia 2.25% 6/2/26 | 3,290,000 | 3,133,584 | ||||||||||
Province of Manitoba 2.125% 6/22/26 | 2,455,000 | 2,293,056 | ||||||||||
Province of Ontario Canada 3.45% 6/2/45 | CAD | 1,488,000 | 1,154,770 | |||||||||
Province of Quebec Canada 6.00% 10/1/29 | CAD | 224,000 | 222,252 | |||||||||
|
| |||||||||||
| 6,803,662 | ||||||||||||
|
| |||||||||||
Japan – 0.21% | ||||||||||||
Japan Finance Organization For Municipalities 144A 2.125% 4/13/21 # | 3,326,000 | 3,255,166 | ||||||||||
Japan International Cooperation Agency 2.125% 10/20/26 | 1,656,000 | 1,544,248 | ||||||||||
|
| |||||||||||
| 4,799,414 | ||||||||||||
|
| |||||||||||
Total Regional Bonds | 17,721,759 | |||||||||||
|
| |||||||||||
Senior Secured Loans - 9.84% « | ||||||||||||
Accudyne Industries Borrower 1st Lien 4.00% 12/13/19 | 2,673,058 | 2,534,393 | ||||||||||
Air Medical Group Holdings Tranche B 1st Lien 4.25% 4/28/22 | 5,171,820 | 5,164,063 | ||||||||||
| Principal amount° | Value (U.S. $) | |||||||||||
Senior Secured Loans « (continued) | ||||||||||||
Albertsons Tranche B 1st Lien 3.77% 8/23/21 | 1,811,028 | $ | 1,833,807 | |||||||||
Allied Universal Holdco Tranche DD 1st Lien 4.50% 7/28/22 | 218,968 | 221,048 | ||||||||||
Amaya Holdings 1st Lien 5.00% 8/1/21 | 3,803,786 | 3,825,182 | ||||||||||
American Airlines Tranche B 1st Lien 3.25% 12/15/23 | 2,848,969 | 2,864,550 | ||||||||||
Applied Systems 2nd Lien 7.50% 1/23/22 | 3,673,751 | 3,717,377 | ||||||||||
Ardagh Holdings USA Tranche B 1st Lien 4.00% 12/17/21 | 1,289,412 | 1,305,731 | ||||||||||
ATI Holdings Acquisition 1st Lien 7.25% 5/10/23 | 1,633,159 | 1,648,130 | ||||||||||
Avago Technologies Cayman Finance Tranche B3 1st Lien 3.704% 2/1/23 | 2,459,918 | 2,497,587 | ||||||||||
BJ’s Wholesale Club 2nd Lien 8.50% 3/31/20 | 2,766,140 | 2,805,903 | ||||||||||
Blue Ribbon 1st Lien 5.00% 11/13/21 | 2,245,307 | 2,228,468 | ||||||||||
Boyd Gaming Tranche B 1st Lien 3.756% 9/15/23 | 663,338 | 670,800 | ||||||||||
Builders FirstSource Tranche B 1st Lien 4.75% 7/31/22 | 4,481,325 | 4,526,699 | ||||||||||
BWAY Holding Tranche B 1st Lien 4.75% 9/9/23 | 2,591,523 | 2,605,777 | ||||||||||
Caesars Growth Properties Holdings | ||||||||||||
Tranche B 1st Lien 6.25% 5/8/21 | 2,873,591 | 2,900,979 | ||||||||||
Calpine Construction Finance Tranche B 1st Lien 3.02% 5/3/20 | 445,000 | 445,556 | ||||||||||
Calpine Tranche B 1st Lien 2.75% 1/15/23 | 435,600 | 438,486 | ||||||||||
Change Healthcare Holdings 1st Lien 3.75% 11/2/18 | 1,791,607 | 1,797,392 | ||||||||||
Charter Communications Operating 1st Lien 2.25% 1/15/24 | 979,598 | 988,169 | ||||||||||
Charter Communications Operating Tranche H 1st Lien 2.00% 1/15/22 | 327,355 | 329,401 | ||||||||||
CityCenter Holdings Tranche B 1st Lien 4.25% 10/16/20 | 1,063,133 | 1,075,426 | ||||||||||
Communications Sale & Leasing Tranche B 1st Lien 4.50% 10/24/22 | 3,020,000 | 3,059,260 | ||||||||||
Community Health Systems Tranche G 1st Lien 3.75% 12/31/19 | 703,033 | 682,711 | ||||||||||
Community Health Systems Tranche H 1st Lien 4.00% 1/27/21 | 1,150,759 | 1,115,208 | ||||||||||
CSC Holdings Tranche B 1st Lien 3.876% 10/11/24 | 809,211 | 819,199 | ||||||||||
DaVita Tranche B 1st Lien 3.52% 6/24/21 | 3,997,500 | 4,044,139 | ||||||||||
Dell International Tranche B 1st Lien 4.02% 9/7/23 | 2,200,000 | 2,240,104 | ||||||||||
| Diversified Income Series-22 |
Table of Contents
Delaware VIP® Diversified Income
Series Schedule of investments (continued)
| Principal amount° | Value (U.S. $) | |||||||||||
Senior Secured Loans « (continued) | ||||||||||||
Dynegy Finance IV Tranche 1st Lien 5.00% 6/27/23 | 1,220,000 | $ | 1,236,993 | |||||||||
ESH Hospitality Tranche B 1st Lien 3.77% 8/30/23 | 553,613 | 561,110 | ||||||||||
ExamWorks Group 1st Lien 4.75% 7/27/23 | 2,276,200 | 2,292,987 | ||||||||||
First Data 1st Lien 3.756% 3/24/21 | 2,837,547 | 2,868,879 | ||||||||||
First Data Tranche 1st Lien 3.756% 7/10/22 | 1,040,243 | 1,052,986 | ||||||||||
First Eagle Holdings 1st Lien 4.998% 12/1/22 | 1,727,300 | 1,746,732 | ||||||||||
Flex Acquisition 1st Lien 4.25% 12/29/23 | 465,000 | 469,650 | ||||||||||
Flying Fortress Tranche B 1st Lien 3.00% 10/20/22 | 772,500 | 776,845 | ||||||||||
FMG Resources August 2006 1st Lien 3.75% 6/30/19 | 3,144,099 | 3,154,211 | ||||||||||
Forterra Finance 1st Lien 4.50% 10/25/23 | 3,537,913 | 3,582,872 | ||||||||||
Frank Russell Tranche B 1st Lien 6.75% 6/1/23 | 3,499,415 | 3,537,692 | ||||||||||
Gardner Denver 1st Lien 4.25% 7/30/20 | 3,411,192 | 3,381,344 | ||||||||||
Gates Global 1st Lien 4.25% 7/6/21 | 3,143,186 | 3,150,063 | ||||||||||
Genesys Telecommunications Laboratories Tranche B 1st Lien 6.25% 12/2/23 | 1,720,000 | 1,746,158 | ||||||||||
Genoa a QoL Healthcare 1st Lien 4.75% 10/28/23 | 1,820,438 | 1,832,574 | ||||||||||
Green Energy Partners Tranche B 1st Lien 6.50% 11/13/21 | 1,001,000 | 995,995 | ||||||||||
HCA Tranche B6 1st Lien 4.02% 3/17/23 | 403,948 | 409,091 | ||||||||||
Hilton Worldwide Finance Tranche B 1st Lien 3.50% 10/26/20 | 219,163 | 221,263 | ||||||||||
Hilton Worldwide Finance Tranche B2 1st Lien 3.256% 10/25/23 | 2,979,777 | 3,017,823 | ||||||||||
Houghton International 1st Lien 4.25% 12/20/19 | 398,400 | 402,882 | ||||||||||
Hyperion Insurance Group Tranche B 1st Lien 5.50% 4/29/22 | 2,453,375 | 2,466,255 | ||||||||||
IASIS Healthcare Tranche B 1st Lien 4.50% 5/3/18 | 1,186,520 | 1,179,104 | ||||||||||
Immucor Tranche B2 1st Lien 5.00% 8/17/18 | 1,402,381 | 1,358,557 | ||||||||||
Ineos U.S. Finance Tranche B 1st Lien 3.75% 12/15/20 | 2,189,398 | 2,203,669 | ||||||||||
4.25% 3/31/22 | 505,983 | 511,500 | ||||||||||
inVentiv Group Holdings Tranche B 1st Lien 4.75% 11/9/23 | 3,500,000 | 3,512,579 | ||||||||||
J.C. Penney Tranche B 1st Lien 5.25% 6/23/23 | 2,722,436 | 2,742,843 | ||||||||||
| Principal amount° | Value (U.S. $) | |||||||||||
Senior Secured Loans « (continued) | ||||||||||||
Keurig Green Mountain Tranche B 1st Lien 5.25% 3/3/23 | 1,135,156 | $ | 1,154,775 | |||||||||
KIK Custom Products 1st Lien 6.00% 8/26/22 | 3,250,867 | 3,287,439 | ||||||||||
Kinetic Concepts Tranche B 1st Lien 5.00% 11/4/20 | 1,059,027 | 1,063,528 | ||||||||||
kraton Polymers Tranche B 1st Lien 6.00% 1/6/22 | 2,445,000 | 2,476,709 | ||||||||||
Kronos 2nd Lien 9.25% 11/1/24 | 1,220,000 | 1,259,269 | ||||||||||
Kronos Tranche B 1st Lien 5.00% 11/1/23 | 890,000 | 899,345 | ||||||||||
Landry’s 1st Lien 4.00% 10/4/23 | 1,185,000 | 1,199,516 | ||||||||||
Las Vegas Sands Tranche B 1st Lien 2.25% 12/19/20 | 1,160,000 | 1,167,250 | ||||||||||
Level 3 Financing 1st Lien 4.00% 1/15/20 | 570,000 | 578,461 | ||||||||||
Lightstone Generation Tranche B 1st Lien 6.50% 12/15/23 | 821,739 | 834,065 | ||||||||||
Lightstone Generation Tranche C 1st Lien 6.50% 12/14/23 | 78,261 | 79,435 | ||||||||||
MGM Growth Properties Operating Partnership Tranche B 1st Lien 3.50% 4/25/23 | 2,208,313 | 2,227,980 | ||||||||||
Micron Technology Tranche B 1st Lien 4.52% 4/26/22 | 432,825 | 440,237 | ||||||||||
Mohegan Tribal Gaming Authority Tranche B 1st Lien 5.50% 10/13/23 | 3,113,106 | 3,139,374 | ||||||||||
Moran Foods Tranche B 1st Lien 7.00% 12/5/23 | 2,855,000 | 2,846,078 | ||||||||||
MPH Acquisition Holdings Tranche B 1st Lien 5.00% 6/7/23 | 1,749,193 | 1,782,928 | ||||||||||
Nature’s Bounty Tranche B 1st Lien 5.00% 5/5/23 | 2,199,598 | 2,220,908 | ||||||||||
NXP Tranche B 1st Lien 3.405% 12/7/20 | 1,250,913 | 1,259,122 | ||||||||||
ON Semiconductor Tranche B 1st Lien 4.02% 3/31/23 | 1,930,163 | 1,955,629 | ||||||||||
Panda Hummel Tranche B1 1st Lien 7.00% 10/27/22 | 540,000 | 511,650 | ||||||||||
Panda Liberty Tranche B 1st Lien 7.50% 8/21/20 | 977,589 | 960,481 | ||||||||||
Petco Animal Supplies Tranche B 1st Lien 5.00% 1/26/23 | 2,193,425 | 2,213,074 | ||||||||||
PQ Tranche 1st Lien 5.25% 11/4/22 | 3,360,136 | 3,397,037 | ||||||||||
Prime Security Services Borrower 1st Lien 4.25% 5/2/22 | 2,978,411 | 3,027,742 | ||||||||||
Prospect Medical Holdings Tranche B 1st Lien 7.00% 6/30/22 | 1,751,200 | 1,724,932 | ||||||||||
Radiate Holdco 1st Lien 3.75% 12/9/23 . | 3,315,000 | 3,339,518 | ||||||||||
Republic of Angola 1st Lien 7.57% 12/16/23 | 3,836,875 | 3,184,606 | ||||||||||
| Diversified Income Series-23 |
Table of Contents
Delaware VIP® Diversified Income Series
Schedule of investments (continued)
| Principal amount° | Value (U.S. $) | |||||||||||
Senior Secured Loans « (continued) | ||||||||||||
Revlon Consumer Products Tranche B 1st Lien 4.27% 9/7/23 | 3,317,188 | $ | 3,352,847 | |||||||||
Reynolds Group Holdings Tranche 1st Lien 4.25% 2/5/23 | 2,322,874 | 2,351,118 | ||||||||||
Sable International Finance Tranche B1 1st Lien 5.588% 1/3/23 | 2,105,000 | 2,131,313 | ||||||||||
Sable International Finance Tranche B2 1st Lien 5.83% 1/3/23 | 1,720,000 | 1,741,500 | ||||||||||
SAM Finance Lux Sarl Tranche B 1st Lien 4.25% 12/17/20 | 2,836,788 | 2,858,064 | ||||||||||
Scientific Games International 1st Lien 6.00% 10/18/20 | 2,602,461 | 2,641,173 | ||||||||||
SFR Group Tranche B 1st Lien 5.137% 1/15/24 | 2,810,875 | 2,842,497 | ||||||||||
SFR Group Tranche B10 1st Lien 4.038% 1/31/25 | 1,690,000 | 1,707,429 | ||||||||||
Sinclair Television Group Tranche B1 1st Lien 3.52% 7/31/21 | 768,014 | 770,414 | ||||||||||
Sinclair Television Group Tranche B2 1st Lien 2.25% 1/31/24 | 675,000 | 677,109 | ||||||||||
Solera Tranche B 1st Lien 5.75% 3/3/23 | 2,252,975 | 2,286,925 | ||||||||||
Spectrum Brands Tranche B 1st Lien 3.25% 6/23/22 | 760,876 | 770,591 | ||||||||||
Standard Aero Aviation Holdings 1st Lien 5.25% 7/7/22 | 1,123,542 | 1,131,794 | ||||||||||
Summit Materials Tranche B 1st Lien 4.00% 7/17/22 | 1,078,575 | 1,088,181 | ||||||||||
Telenet Financing USD Tranche B 1st Lien 3.704% 1/31/25 | 3,120,000 | 3,145,350 | ||||||||||
T-Mobile USA Tranche B 1st Lien 3.52% 11/9/22 | 4,070,575 | 4,122,186 | ||||||||||
TransDigm Tranche E 1st Lien 3.998% 5/14/22 | 394,096 | 397,329 | ||||||||||
TransDigm Tranche F 1st Lien 3.77% 6/9/23 | 3,284,175 | 3,319,752 | ||||||||||
Tribune Media Tranche B 1st Lien 3.77% 12/27/20 | 1,078,575 | 1,088,678 | ||||||||||
Univar USA Tranche B 1st Lien 4.25% 7/1/22 | 2,610,613 | 2,632,291 | ||||||||||
Univision Communications 1st Lien 4.00% 3/1/20 | 480,829 | 483,496 | ||||||||||
Univision Communications Tranche C4 1st Lien 4.00% 3/1/20 | 3,452,581 | 3,472,961 | ||||||||||
USAGM HoldCo 1st Lien 5.50% 7/28/22 | 2,172,436 | 2,193,074 | ||||||||||
USI 1st Lien 4.25% 12/27/19 | 3,439,816 | 3,457,730 | ||||||||||
USIC Holdings 1st Lien 4.75% 12/9/23 | 1,725,000 | 1,742,250 | ||||||||||
Virgin Media Bristol 1st Lien 2.75% 1/31/25 | 1,470,000 | 1,478,575 | ||||||||||
Vistra Operations Tranche B2 1st Lien 4.00% 8/4/23 | 475,000 | 481,531 | ||||||||||
| Principal amount° | Value (U.S. $) | |||||||||||
Senior Secured Loans |
| |||||||||||
Western Digital Tranche B 1st Lien 4.52% 4/29/23 | 1,321,360 | $ | 1,341,417 | |||||||||
WideOpenWest Finance Tranche B 1st Lien 4.50% 8/19/23 | 2,104,385 | 2,122,506 | ||||||||||
Windstream Services 1st Lien 4.75% 3/30/21 | 1,459,165 | 1,468,741 | ||||||||||
Windstream Services Tranche 1st Lien 4.75% 12/2/23 | 870,000 | 875,710 | ||||||||||
Wireco WorldGroup Tranche 1st Lien 6.50% 9/30/23 | 1,097,250 | 1,106,393 | ||||||||||
Wireco Worldgroup Tranche 2nd Lien 10.00% 9/30/24 | 660,000 | 665,500 | ||||||||||
Zekelman Industries Tranche B 1st Lien 5.00% 6/14/21 | 1,099,475 | 1,113,218 | ||||||||||
|
| |||||||||||
Total Senior Secured Loans | 220,088,933 | |||||||||||
|
| |||||||||||
Sovereign Bonds – 3.56% D | ||||||||||||
Argentina – 0.08% | ||||||||||||
Argentine Republic Government International Bond 144A 7.125% 7/6/36 # | 1,790,000 | 1,707,213 | ||||||||||
|
| |||||||||||
| 1,707,213 | ||||||||||||
|
| |||||||||||
Australia – 0.03% | ||||||||||||
Australia Government Bond 3.75% 4/21/37 | AUD | 900,000 | 673,889 | |||||||||
|
| |||||||||||
| 673,889 | ||||||||||||
|
| |||||||||||
Azerbaijan – 0.04% | ||||||||||||
Republic of Azerbaijan International Bond 144A 4.75% 3/18/24 # | 800,000 | 797,824 | ||||||||||
|
| |||||||||||
| 797,824 | ||||||||||||
|
| |||||||||||
Bahrain – 0.05% | ||||||||||||
Bahrain Government International Bond 144A 7.00% 10/12/28 # | 1,000,000 | 1,024,196 | ||||||||||
|
| |||||||||||
| 1,024,196 | ||||||||||||
|
| |||||||||||
Bermuda – 0.07% | ||||||||||||
Bermuda Government International Bond 144A 3.717% 1/25/27 # | 1,600,000 | 1,520,000 | ||||||||||
|
| |||||||||||
| 1,520,000 | ||||||||||||
|
| |||||||||||
Brazil – 0.12% | ||||||||||||
Brazil Notas do Tesouro Nacional Series F 10.00% 1/1/25 | BRL | 3,955,000 | 1,132,496 | |||||||||
Brazilian Government International Bond 5.00% 1/27/45 | 1,995,000 | 1,628,319 | ||||||||||
|
| |||||||||||
| 2,760,815 | ||||||||||||
|
| |||||||||||
Canada – 0.02% | ||||||||||||
Canadian Government Bond 2.75% 12/1/48 | CAD | 496,000 | 406,028 | |||||||||
|
| |||||||||||
| 406,028 | ||||||||||||
|
| |||||||||||
| Diversified Income Series-24 |
Table of Contents
Delaware VIP® Diversified Income Series
Schedule of investments (continued)
| Principal amount° | Value (U.S. $) | |||||||||||
Sovereign Bonds D (continued) |
| |||||||||||
Colombia – 0.02% |
| |||||||||||
Colombia Government International Bond 5.00% 6/15/45 |
| 531,000 | $ | 506,441 | ||||||||
|
| |||||||||||
| 506,441 | ||||||||||||
|
| |||||||||||
Croatia – 0.07% |
| |||||||||||
Croatia Government International Bond 144A 6.375% 3/24/21 # |
| 1,545,000 | 1,683,828 | |||||||||
|
| |||||||||||
| 1,683,828 | ||||||||||||
|
| |||||||||||
Dominican Republic – 0.04% |
| |||||||||||
Dominican Republic International Bond 144A 6.875% 1/29/26 # |
| 895,000 | 932,653 | |||||||||
|
| |||||||||||
| 932,653 | ||||||||||||
|
| |||||||||||
Hungary – 0.12% |
| |||||||||||
Hungary Government International Bond 5.75% 11/22/23 |
| 2,360,000 | 2,621,311 | |||||||||
|
| |||||||||||
| 2,621,311 | ||||||||||||
|
| |||||||||||
India – 0.13% |
| |||||||||||
Export-Import Bank of India 144A 3.375% 8/5/26 # |
| 3,000,000 | 2,807,763 | |||||||||
|
| |||||||||||
| 2,807,763 | ||||||||||||
|
| |||||||||||
Indonesia – 0.38% |
| |||||||||||
Indonesia Government International Bond 144A 3.70% 1/8/22 # |
| 1,400,000 | 1,406,646 | |||||||||
144A 5.125% 1/15/45 # |
| 600,000 | 600,364 | |||||||||
144A 5.25% 1/8/47 # |
| 2,000,000 | 2,001,744 | |||||||||
Indonesia Treasury Bond 9.00% 3/15/29 | IDR | 57,139,000,000 | 4,485,024 | |||||||||
|
| |||||||||||
| 8,493,778 | ||||||||||||
|
| |||||||||||
Jamaica – 0.07% |
| |||||||||||
Jamaica Government International Bond 8.00% 3/15/39 |
| 1,500,000 | 1,673,055 | |||||||||
|
| |||||||||||
| 1,673,055 | ||||||||||||
|
| |||||||||||
Jordan – 0.08% |
| |||||||||||
Jordan Government International Bond 144A 5.75% 1/31/27 # |
| 1,830,000 | 1,738,116 | |||||||||
|
| |||||||||||
| 1,738,116 | ||||||||||||
|
| |||||||||||
Mexico – 0.58% |
| |||||||||||
Mexican Bonos 5.75% 3/5/26 | MXN | 148,204,900 | 6,354,323 | |||||||||
8.00% 6/11/20 | MXN | 94,280,000 | 4,682,689 | |||||||||
Mexico Government International Bond 3.60% 1/30/25 | 531,000 | 513,212 | ||||||||||
4.35% 1/15/47 | 1,700,000 | 1,462,000 | ||||||||||
|
| |||||||||||
| 13,012,224 | ||||||||||||
|
| |||||||||||
Mongolia – 0.05% | ||||||||||||
Mongolia Government International Bond 144A 10.875% 4/6/21 # | 1,025,000 | 1,080,163 | ||||||||||
|
| |||||||||||
| 1,080,163 | ||||||||||||
|
| |||||||||||
| Principal amount° | Value (U.S. $) | |||||||||||
Sovereign Bonds D (continued) |
| |||||||||||
New Zealand – 0.11% | ||||||||||||
New Zealand Government Bond 2.75% 4/15/25 | NZD | 3,525,000 | $ | 2,363,082 | ||||||||
4.50% 4/15/27 | NZD | 206,000 | 157,446 | |||||||||
|
| |||||||||||
| 2,520,528 | ||||||||||||
|
| |||||||||||
Peru – 0.11% |
| |||||||||||
Peruvian Government International Bond 6.95% 8/12/31 | PEN | 8,129,000 | 2,474,861 | |||||||||
|
| |||||||||||
| 2,474,861 | ||||||||||||
|
| |||||||||||
Poland – 0.26% |
| |||||||||||
Republic of Poland Government Bond 2.50% 7/25/26 | PLN | 17,759,000 | 3,862,959 | |||||||||
3.25% 7/25/25 | PLN | 3,319,000 | 778,932 | |||||||||
4.00% 10/25/23 | PLN | 4,843,000 | 1,205,065 | |||||||||
|
| |||||||||||
| 5,846,956 | ||||||||||||
|
| |||||||||||
Portugal – 0.03% |
| |||||||||||
Portugal Government International Bond 144A 5.125% 10/15/24 # |
| 600,000 | 583,577 | |||||||||
|
| |||||||||||
| 583,577 | ||||||||||||
|
| |||||||||||
Republic of Korea – 0.13% |
| |||||||||||
Export-Import Bank of Korea 144A 3.00% 5/22/18 # | NOK | 1,100,000 | 129,722 | |||||||||
Inflation Linked Korea Treasury Bond |
| |||||||||||
1.125% 6/10/23 | KRW | 3,336,245,231 | 2,760,672 | |||||||||
|
| |||||||||||
| 2,890,394 | ||||||||||||
|
| |||||||||||
Russia - 0.08% |
| |||||||||||
Russian Foreign Bond - Eurobond 144A 5.625% 4/4/42 # |
| 1,600,000 | 1,725,898 | |||||||||
|
| |||||||||||
| 1,725,898 | ||||||||||||
|
| |||||||||||
Saudi Arabia – 0.08% |
| |||||||||||
Saudi Government International Bond 144A 2.375% 10/26/21 # |
| 1,765,000 | 1,715,368 | |||||||||
|
| |||||||||||
| 1,715,368 | ||||||||||||
|
| |||||||||||
Serbia – 0.07% | ||||||||||||
Serbia International Bond 144A 4.875% 2/25/20 # | 1,635,000 | 1,666,488 | ||||||||||
|
| |||||||||||
| 1,666,488 | ||||||||||||
|
| |||||||||||
South Africa – 0.30% | ||||||||||||
Republic of South Africa Government Bond 8.00% 1/31/30 | ZAR | 62,735,000 | 4,114,909 | |||||||||
Republic of South Africa Government International Bond 5.875% 5/30/22 | 2,315,000 | 2,529,172 | ||||||||||
|
| |||||||||||
| 6,644,081 | ||||||||||||
|
| |||||||||||
Sri Lanka – 0.13% | ||||||||||||
Sri Lanka Government International Bond 144A 6.00% 1/14/19 # | 900,000 | 927,546 | ||||||||||
144A 6.125% 6/3/25 # | 2,020,000 | 1,910,510 | ||||||||||
|
| |||||||||||
| 2,838,056 | ||||||||||||
|
| |||||||||||
| Diversified Income Series-25 |
Table of Contents
Delaware VIP® Diversified Income Series
Schedule of investments (continued)
| Principal amount° | Value (U.S. $) | |||||||||||
Sovereign Bonds (continued) |
| |||||||||||
Turkey – 0.11% | ||||||||||||
Export Credit Bank of Turkey | 1,895,000 | $ | 1,859,181 | |||||||||
144A 5.375% 10/24/23 # | 655,000 | 609,559 | ||||||||||
|
| |||||||||||
| 2,468,740 | ||||||||||||
|
| |||||||||||
Ukraine – 0.09% | ||||||||||||
Ukraine Government International Bond | 2,000,000 | 2,017,080 | ||||||||||
|
| |||||||||||
| 2,017,080 | ||||||||||||
|
| |||||||||||
United Kingdom – 0.02% | ||||||||||||
United Kingdom Gilt 3.50% 1/22/45 | GBP | 340,300 | 568,332 | |||||||||
|
| |||||||||||
| 568,332 | ||||||||||||
|
| |||||||||||
Uruguay – 0.09% | ||||||||||||
Uruguay Government International Bond | 2,335,000 | 2,107,338 | ||||||||||
|
| |||||||||||
| 2,107,338 | ||||||||||||
|
| |||||||||||
Total Sovereign Bonds | 79,506,994 | |||||||||||
|
| |||||||||||
Supranational Banks – 0.41% | ||||||||||||
International Bank for Reconstruction & Development | 1,507,000 | 1,505,026 | ||||||||||
2.50% 11/25/24 | 1,507,000 | 1,505,023 | ||||||||||
3.50% 1/22/21 | NZD | 5,142,000 | 3,586,182 | |||||||||
3.75% 2/10/20 | NZD | 1,200,000 | 848,266 | |||||||||
4.625% 10/6/21 | NZD | 1,119,000 | 815,254 | |||||||||
International Finance | NZD | 790,000 | 538,517 | |||||||||
3.625% 5/20/20 | NZD | 472,000 | 331,668 | |||||||||
|
| |||||||||||
Total Supranational Banks | 9,129,936 | |||||||||||
|
| |||||||||||
U.S. Treasury Obligations – 3.08% | ||||||||||||
U.S. Treasury Bonds | 6,585,000 | 6,358,772 | ||||||||||
U.S. Treasury Inflation Indexed Bonds | 22,035,403 | 22,316,597 | ||||||||||
U.S. Treasury Inflation Indexed Bonds | 7,873,782 | 7,923,994 | ||||||||||
U.S. Treasury Notes | 12,700,000 | 12,316,524 | ||||||||||
1.50% 8/15/26 | 21,780,000 | 20,032,503 | ||||||||||
|
| |||||||||||
Total U.S. Treasury Obligations | 68,948,390 | |||||||||||
|
| |||||||||||
| Number of shares | Value (U.S. $) | |||||||||||
Common Stock – 0.00% |
| |||||||||||
Adelphia Recovery Trust =† | 1 | $ | 0 | |||||||||
Century Communications =† | 2,500,000 | 0 | ||||||||||
|
| |||||||||||
Total Common Stock | 0 | |||||||||||
|
| |||||||||||
Convertible Preferred Stock – 0.28% | ||||||||||||
A Schulman 6.00% exercise price $52.33, expiration date 12/31/49 | 719 | 613,875 | ||||||||||
Bank of America 7.25% exercise price $50.00, expiration date 12/31/49 | 525 | 612,570 | ||||||||||
DTE Energy 6.50% exercise price $116.31, expiration date 10/1/19 | 13,034 | 690,802 | ||||||||||
Exelon 6.50% exercise price $43.75, expiration date 6/1/17 | 14,850 | 718,889 | ||||||||||
Huntington Bancshares 8.50% exercise price $11.95, expiration date 12/31/49 | 714 | 1,035,300 | ||||||||||
Teva Pharmaceutical Industries 7.00% exercise price $75.00, expiration date 12/15/18 | 435 | 280,575 | ||||||||||
T-Mobile U.S. 5.50% exercise price $31.02, expiration date 12/15/17 | 7,467 | 705,183 | ||||||||||
Wells Fargo & Co. 7.50% exercise price $156.71, expiration date 12/31/49 | 829 | 986,510 | ||||||||||
Welltower 6.50% exercise price $57.68, expiration date 12/31/49 | 11,507 | 692,491 | ||||||||||
|
| |||||||||||
Total Convertible Preferred Stock | 6,336,195 | |||||||||||
|
| |||||||||||
Preferred Stock – 0.50% | ||||||||||||
General Electric 5.00% • | 4,996,000 | 5,190,594 | ||||||||||
Integrys Energy Group 6.00% • | 84,450 | 2,200,978 | ||||||||||
PNC Preferred Funding Trust II 144A 2.186% #• | 3,700,000 | 3,579,750 | ||||||||||
USB Realty 144A 2.027% #• | 300,000 | 264,750 | ||||||||||
|
| |||||||||||
Total Preferred Stock | 11,236,072 | |||||||||||
|
| |||||||||||
Principal | ||||||||||||
Short-Term Investments – 5.10% | ||||||||||||
Discount Notes – 2.59% | ||||||||||||
Federal Home Loan Bank 0.366% 1/27/17 | 19,856,845 | 19,851,941 | ||||||||||
0.379% 2/3/17 | 9,928,423 | 9,924,233 | ||||||||||
0.483% 1/30/17 | 14,029,176 | 14,025,276 | ||||||||||
0.499% 2/15/17 | 3,507,294 | 3,505,242 | ||||||||||
0.501% 2/6/17 | 10,521,882 | 10,517,010 | ||||||||||
|
| |||||||||||
| 57,823,702 | ||||||||||||
|
| |||||||||||

| Diversified Income Series-26 |
Table of Contents
Delaware VIP® Diversified Income Series
Schedule of investments (continued)
| Principal amount° | Value (U.S. $) | |||||||||||
Short-Term Investments (continued) | ||||||||||||
Repurchase | ||||||||||||
Bank of America Merrill Lynch 0.41%, dated 12/30/16, to be repurchased on 1/3/17, repurchase price $18,961,373 (collateralized by U.S. government obligations 2.00% 8/15/25; market value $19,339,720) | 18,960,509 | $ | 18,960,509 | |||||||||
Bank of Montreal 0.30%, dated 12/30/16, to be repurchased on 1/3/17, repurchase price $22,121,332 (collateralized by U.S. government obligations 0.00%-4.375% 5/15/18-11/15/44; market value $22,563,016) | 22,120,594 | 22,120,594 | ||||||||||
| Principal amount° | Value (U.S. $) | |||||||||||
Short-Term Investments (continued) | ||||||||||||
Repurchase | ||||||||||||
BNP Paribas 0.48%, dated 12/30/16, to be repurchased on 1/3/17, repurchase price $15,145,704 (collateralized by U.S. government obligations 2.125% 12/31/22; market value $15,447,803) | 15,144,896 | $ | 15,144,897 | |||||||||
|
| |||||||||||
| 56,226,000 | ||||||||||||
|
| |||||||||||
Total Short-Term | 114,049,702 | |||||||||||
|
| |||||||||||
Total Value of Securities – 101.76% | $2,276,320,402 |
| # | Security exempt from registration under Rule 144A of the Securities Act of 1933, as amended. At Dec. 31, 2016, the aggregate value of Rule 144A securities was $527,652,239, which represents 23.59% of the Series’ net assets. See Note 11 in “Notes to financial statements.” |
| ◆ | Pass Through Agreement. Security represents the contractual right to receive a proportionate amount of underlying payments due to the counterparty pursuant to various agreements related to the rescheduling of obligations and the exchange of certain notes. |
| T | PIK. 100% of the income received was in the form of cash. |
| = | Security is being fair valued in accordance with the Series’ fair valuation policy. At Dec. 31, 2016, the aggregate value of fair valued securities was $0, which represents 0.00% of the Series’ net assets. See Note 1 in “Notes to financial statements.” |
| ≠ | The rate shown is the effective yield at the time of purchase. |
| « | Senior secured loans generally pay interest at rates which are periodically reset by reference to a base lending rate plus a premium. These base lending rates are generally: (i) the prime rate offered by one or more U.S. banks, (ii) the lending rate offered by one or more European banks such as the London Interbank Offered Rate (LIBOR), and (iii) the certificate of deposit rate. Senior secured loans may be subject to restrictions on resale. Stated rate in effect at Dec. 31, 2016. |
| ° | Principal amount shown is stated in U.S. dollars unless noted that the security is denominated in another currency. |
| D | Securities have been classified by country of origin. |
| S | Interest only security. An interest only security is the interest only portion of a fixed income security, which is separated and sold individually from the principal portion of the security. |
| † | Non-income-producing security. |
| • | Variable rate security. Each rate shown is as of Dec. 31, 2016. Interest rates reset periodically. |
| f | Step coupon bond. Coupon increases or decreases periodically based on a predetermined schedule. Stated rate in effect at Dec. 31, 2016. |
Unfunded Commitments
The Series may invest in floating rate loans. In connection with these investments, the Series may also enter into unfunded corporate loan commitments (commitments). Commitments may obligate the Series to furnish temporary financing to a borrower until permanent financing can be arranged. In connection with these commitments, the Series earns a commitment fee, typically set as a percentage of the commitment amount. As of Dec. 31, 2016, the Series had the following unfunded loan commitments:
Borrower | Unfunded Amount | Cost | Value | Unrealized Appreciation (Depreciation) | ||||
Allied Universal Holdco Tranche DD 1st Lien 4.50% 7/28/22 | $212,602 | $210,476 | $214,622 | $4,146 |
| Diversified Income Series-27 |
Table of Contents
Delaware VIP® Diversified Income Series
Schedule of investments (continued)
The following foreign currency exchange contracts, futures contracts, and swap contracts were outstanding at Dec. 31, 2016:1
Foreign Currency Exchange Contracts
Counterparty | Contracts to Receive (Deliver) | In Exchange For | Settlement Date | Unrealized Appreciation (Depreciation) | ||||||||||||||||||
BAML | AUD | (8,008,264) | USD | 5,961,912 | 1/27/17 | $ 187,167 | ||||||||||||||||
BAML | CAD | (4,206,621) | USD | 3,168,639 | 1/27/17 | 34,454 | ||||||||||||||||
BAML | EUR | 6,543,468 | USD | (7,009,777) | 1/27/17 | (111,087) | ||||||||||||||||
BAML | JPY | 24,310,881 | USD | (213,386) | 1/27/17 | (5,027) | ||||||||||||||||
BAML | NZD | (8,912,358) | USD | 6,309,326 | 1/27/17 | 124,316 | ||||||||||||||||
BNP | AUD | 1,180,466 | USD | (874,332) | 1/27/17 | (23,101) | ||||||||||||||||
BNP | BRL | 8,973,916 | USD | (2,638,999) | 1/27/17 | 94,335 | ||||||||||||||||
BNP | NOK | (2,314,977) | USD | 277,349 | 1/27/17 | 9,192 | ||||||||||||||||
BNP | ZAR | (30,944,392) | USD | 2,231,320 | 1/27/17 | (8,965) | ||||||||||||||||
HSBC | GBP | (250,245) | USD | 318,859 | 1/27/17 | 10,203 | ||||||||||||||||
JPMC | KRW | (3,144,599,940) | USD | 2,685,007 | 1/26/17 | 80,517 | ||||||||||||||||
JPMC | PLN | (2,476,620) | USD | 589,384 | 1/27/17 | (2,120) | ||||||||||||||||
JPMC | SEK | 2,366,400 | USD | (259,413) | 1/27/17 | 834 | ||||||||||||||||
TD | EUR | (2,426,230) | USD | 2,610,698 | 1/27/17 | 52,757 | ||||||||||||||||
TD | JPY | 442,141,131 | USD | (3,850,872) | 1/27/17 | (61,445) | ||||||||||||||||
|
| |||||||||||||||||||||
| $382,030 | ||||||||||||||||||||||
|
| |||||||||||||||||||||
Futures Contracts
Contracts to Buy (Sell) | Notional Cost (Proceeds) | Notional Value | Expiration Date | Unrealized Appreciation (Depreciation) | ||||||||||||||||
(57) U.S. Treasury 10 yr Notes | $ | (7,003,714 | ) | $ | (7,084,031 | ) | 3/23/17 | $ | (80,317 | ) | ||||||||||
117 U.S. Treasury Long Bonds | 17,407,401 | 17,626,781 | 3/23/17 | 219,380 | ||||||||||||||||
|
|
|
| |||||||||||||||||
| $ | 10,403,687 | $ | 139,063 | |||||||||||||||||
|
|
|
| |||||||||||||||||
Swap Contracts
CDS Contracts2
Counterparty | Swap Referenced Obligation | Notional Value3 | Annual Protection Payments | Termination Date | Upfront Payments Paid (Received) | Unrealized Appreciation (Depreciation)4 | ||||||||||||||||
| Protection Purchased: | ||||||||||||||||||||||
| ICE | CITI - CDX.EM.265 | 5,035,000 | 1.00% | 12/20/21 | $333,080 | $(17,000) | ||||||||||||||||
Interest Rate Swap Contracts6
Counterparty & Referenced Obligation | Notional Value3 | Fixed Interest Rate Received (Paid) | Floating Interest Rate Received (Paid) | Termination Date | Unrealized Appreciation (Depreciation) | |||||||||||||||||||
| CME-CITI—IRS 30 yr-LIBOR | 4,415,000 | 2.767 | % | 0.998 | % | 12/21/46 | $ | (131,706 | ) | |||||||||||||||
| LCH-MSC—IRS 30 yr-LIBOR | 2,215,000 | 2.716 | % | 0.000 | % | 12/22/46 | (63,675 | ) | ||||||||||||||||
|
| |||||||||||||||||||||||
| $ | (195,381 | ) | ||||||||||||||||||||||
|
| |||||||||||||||||||||||
The use of foreign currency exchange contracts, futures contracts and swap contracts involves elements of market risk and risks in excess of the amounts disclosed in these financial statements. The notional values and foreign currency exchange contracts presented above represent the Series’ total exposure in such contracts, whereas only the net unrealized appreciation (depreciation) is reflected in the Series’ net assets.
1See Note 8 in “Notes to financial statements.”
2A CDS contract is a risk-transfer instrument through which one party (purchaser of protection) transfers to another party (seller of protection) the financial risk of a credit event (as defined in the CDS agreement), as it relates to a particular reference security or basket of securities (such as an index). Periodic payments (receipts) on such contracts are accrued daily and recorded as unrealized losses (gains) on swap contracts. Upon payment (receipt), such amounts are recorded as realized losses (gains) on swap contracts. Upfront
| Diversified Income Series-28 |
Table of Contents
Delaware VIP® Diversified Income Series
Schedule of investments (continued)
payments made or received in connection with CDS contracts are amortized over the expected life of the CDS contracts as unrealized losses (gains) on swap contracts. The change in value of CDS contracts is recorded daily as unrealized appreciation or depreciation. A realized gain or loss is recorded upon a credit event (as defined in the CDS agreement) or the maturity or termination of the agreement.
3Notional value shown is stated in U.S. Dollars unless noted that the swap is denominated in another currency.
4Unrealized appreciation (depreciation) does not include periodic interest payments (receipt) on swap contracts accrued daily in the amount of $(5,123). 5Markit’s CDX.EM Index is composed of fourteen sovereign issuers from the following regions: Latin America, Middle East, Eastern Europe, Africa and Asia.
6An interest rate swap agreement is an exchange of interest rates between counterparties. Periodic payments (receipt) on such contracts are accrued daily and recorded as unrealized appreciation (depreciation) on swap contracts. Upon periodic payment (receipt) or termination of the contract, such amounts are recorded as realized gains (losses) on swap contracts.
Summary of abbreviations:
ABS – Asset-Backed Security
ARM – Adjustable Rate Mortgage
AUD – Australian Dollar
BAML – Bank of America Merrill Lynch
BNP – BNP Paribas
BRL – Brazilian Real
CAD – Canadian Dollar
CDS – Credit Default Swap
CITI – Citigroup Global Markets
CLO – Collateralized Loan Obligation
CME – Chicago Mercantile Exchange Inc.
DB-JPM – Deutsche Bank JPMorgan
DB-UBS – Deutsche Bank Union Bank of Switzerland
ETF – Exchange Traded Fund
EUR – European Monetary Unit
GBP – British Pound Sterling
GNMA – Government National Mortgage Association
GS – Goldman Sachs
HSBC – Hong Kong Shanghai Bank
ICE – Intercontinental Exchange, Inc.
IDR – Indonesian Rupiah
INR – Indian Rupee
IRS – Interest Rate Swap
JPM-BB – JPMorgan Barclays Bank
JPMC – JPMorgan Chase Bank
JPM-DB – JPMorgan Deutsche Bank
JPY – Japanese Yen
KRW – South Korean Won
LB-UBS – Lehman Brothers Union Bank of Switzerland
LCH – London Clearing House
MSC – Morgan Stanley Capital
MXN – Mexican Peso
NOK – Norwegian Krone
NZD – New Zealand Dollar
PEN – Peruvian Nuevo Sol
PIK – Payment-in-Kind
PLN – Polish Zloty
RBS – Royal Bank of Scotland
| Diversified Income Series-29 |
Table of Contents
Delaware VIP® Diversified Income Series
Schedule of investments (continued)
Summary of abbreviations (continued):
REMIC – Real Estate Mortgage Investment Conduit
SEK – Swedish Krona
S.F. – Single Family
TBA – To be announced
TD – Toronto Dominion Bank
UBS – Union Bank of Switzerland
USD – U.S.Dollar
yr – Year
WF – Wells Fargo
ZAR – South African Rand
See accompanying notes, which are an integral part of the financial statements.
| Diversified Income Series-30 |
Table of Contents
| Delaware VIP® Trust—Delaware VIP Diversified Income Series | ||
| Statement of assets and liabilities | ||
| December 31, 2016 |
Assets: | ||||
Investments, at value1 | $ | 2,162,270,700 | ||
Short-term investments, at value2 | 114,049,702 | |||
Foreign currencies, at value3 | 3,943,410 | |||
Cash | 2,976,055 | |||
Cash collateral due from brokers | 2,149,554 | |||
Receivable for securities sold | 83,252,577 | |||
Dividends and interest receivable | 16,367,315 | |||
Unrealized appreciation on foreign currency exchange contracts | 593,775 | |||
Receivable for series shares sold | 386,804 | |||
Upfront payments paid on credit default swap contracts | 333,080 | |||
Variation margin due from broker on futures contracts | 68,156 | |||
Other assets4 | 1,305,392 | |||
|
| |||
Total assets | 2,387,696,520 | |||
|
| |||
Liabilities: | ||||
Payable for securities purchased | 142,580,669 | |||
Bonds proceeds payable4 | 4,351,308 | |||
Investment management fees payable to affiliates | 1,096,281 | |||
Cash collateral due to brokers | 946,000 | |||
Payable for series shares redeemed | 576,731 | |||
Other accrued expenses | 407,266 | |||
Distribution fees payable to affiliates | 401,231 | |||
Unrealized depreciation on foreign currency exchange contracts | 211,745 | |||
Unrealized depreciation on interest rate swap contracts | 125,908 | |||
Variation margin due to broker on centrally cleared interest rate swap contracts | 69,473 | |||
Unrealized depreciation on credit default swap contracts | 17,000 | |||
Dividend disbursing and transfer agent fees and expenses payable to affiliates | 14,083 | |||
Accounting and administration expenses payable to affiliates | 8,832 | |||
Trustees’ fees and expenses payable to affiliates | 5,491 | |||
Legal fees payable to affiliates | 4,015 | |||
Swap payments payable | 2,697 | |||
Reports and statements to shareholders payable to affiliates | 1,974 | |||
|
| |||
Total liabilities | 150,820,704 | |||
|
| |||
Total Net Assets | $ | 2,236,875,816 | ||
|
|
Diversified Income Series-31
Table of Contents
Delaware VIP® Trust—Delaware VIP Diversified Income Series
Statement of assets and liabilities (continued)
Net Assets Consist of: | ||||
Paid-in capital | $ | 2,242,105,232 | ||
Undistributed net investment income | 56,253,746 | |||
Accumulated net realized loss on investments | (42,935,558 | ) | ||
Net unrealized depreciation of investments | (18,829,967 | ) | ||
Net unrealized depreciation of foreign currencies | (21,226 | ) | ||
Net unrealized appreciation of foreign currency exchange contracts | 382,030 | |||
Net unrealized appreciation of futures contracts | 139,063 | |||
Net unrealized depreciation of swap contracts | (217,504 | ) | ||
|
| |||
Total Net Assets | $ | 2,236,875,816 | ||
|
| |||
Net Asset Value: | ||||
Standard Class: | ||||
Net assets | $ | 322,535,357 | ||
Shares of beneficial interest outstanding, unlimited authorization, no par | 31,334,231 | |||
Net asset value per share | $ | 10.29 | ||
Service Class: | ||||
Net assets | $ | 1,914,340,459 | ||
Shares of beneficial interest outstanding, unlimited authorization, no par | 187,266,677 | |||
Net asset value per share | $ | 10.22 | ||
1 Investments, at cost | $ | 2,181,107,202 | ||
| 2 Short-term investments, at cost | 114,047,313 | |||
3 Foreign currencies, at cost | 3,942,909 | |||
4 See Note 11 in “Notes to financial statements.” | ||||
See accompanying notes, which are an integral part of the financial statements.
| Diversified Income Series-32 |
Table of Contents
Delaware VIP® Trust —
Delaware VIP Diversified Income Series Statement of operations
Year ended December 31, 2016
Investment Income: | ||||
Interest | $ | 72,307,128 | ||
Dividends | 508,540 | |||
Foreign tax withheld | (6,747 | ) | ||
|
| |||
| 72,808,921 | ||||
|
| |||
Expenses: | ||||
Management fees | 12,915,009 | |||
Distribution expenses – Service Class | 5,635,218 | |||
Accounting and administration expenses | 709,169 | |||
Reports and statements to shareholders expenses | 371,000 | |||
Dividend disbursing and transfer agent fees and expenses | 184,319 | |||
Legal fees | 145,460 | |||
Custodian fees | 134,080 | |||
Trustees’ fees and expenses | 108,289 | |||
Audit and tax | 50,196 | |||
Registration fees | 1,954 | |||
Other | 125,471 | |||
|
| |||
| 20,380,165 | ||||
Less waived distribution expenses – Service Class | (939,203 | ) | ||
Less expense paid indirectly | (1 | ) | ||
|
| |||
Total operating expenses | 19,440,961 | |||
|
| |||
Net Investment Income | 53,367,960 | |||
|
| |||
Net Realized and Unrealized Gain (Loss): | ||||
Net realized gain (loss) on: | ||||
Investments1 | 14,426,543 | |||
Foreign currencies | (1,920,182 | ) | ||
Foreign currency exchange contracts | (961,344 | ) | ||
Futures contracts | (4,067,920 | ) | ||
Options purchased | 345,789 | |||
Options written | (576,071 | ) | ||
Swap contracts | 2,529,195 | |||
|
| |||
Net realized gain | 9,776,010 | |||
|
| |||
Net change in unrealized appreciation (depreciation) of: | ||||
Investments2 | 5,938,864 | |||
Foreign currencies | 2,849 | |||
Foreign currency exchange contracts | 562,987 | |||
Futures contracts | 1,355,294 | |||
Swap contracts | (492,919 | ) | ||
|
| |||
Net change in unrealized appreciation (depreciation) | 7,367,075 | |||
|
| |||
Net Realized and Unrealized Gain | 17,143,085 | |||
|
| |||
Net Increase in Net Assets Resulting from Operations | $ | 70,511,045 | ||
|
| |||
1Includes $54,731 capital gains taxes paid.
2Includes $1,905 capital gains taxes accrued.
Delaware VIP Trust —
Delaware VIP Diversified Income Series Statements of changes in net assets
| Year ended | ||||||||
| 12/31/16 | 12/31/15 | |||||||
Increase (Decrease) in Net Assets from Operations: | ||||||||
Net investment income | $ | 53,367,960 | $ | 72,128,322 | ||||
Net realized gain (loss) | 9,776,010 | (46,184,143 | ) | |||||
Net change in unrealized appreciation (depreciation) | 7,367,075 | (56,329,941 | ) | |||||
|
|
|
| |||||
Net increase (decrease) in net assets resulting from operations | 70,511,045 | (30,385,762 | ) | |||||
|
|
|
| |||||
Dividends and Distributions to Shareholders from: | ||||||||
Net investment income: | ||||||||
Standard Class | (11,261,327 | ) | (14,156,454 | ) | ||||
Service Class | (58,403,940 | ) | (52,370,637 | ) | ||||
Net realized gain: | ||||||||
Standard Class | — | (5,195,029 | ) | |||||
Service Class | — | (20,948,255 | ) | |||||
|
|
|
| |||||
| (69,665,267 | ) | (92,670,375 | ) | |||||
|
|
|
| |||||
Capital Share Transactions: | ||||||||
Proceeds from shares sold: | ||||||||
Standard Class | 17,237,247 | 23,335,358 | ||||||
Service Class | 128,123,758 | 161,193,132 | ||||||
Net asset value of shares issued upon reinvestment of dividends and distributions: | ||||||||
Standard Class | 11,261,327 | 14,864,954 | ||||||
Service Class | 58,403,940 | 73,318,892 | ||||||
|
|
|
| |||||
| 215,026,272 | 272,712,336 | |||||||
|
|
|
| |||||
Cost of shares redeemed: | ||||||||
Standard Class | (45,534,410 | ) | (149,390,421 | ) | ||||
Service Class | (103,873,311 | ) | (123,233,742 | ) | ||||
|
|
|
| |||||
| (149,407,721 | ) | (272,624,163 | ) | |||||
|
|
|
| |||||
Increase in net assets derived from capital share transactions | 65,618,551 | 88,173 | ||||||
|
|
|
| |||||
Net Increase (Decrease) in Net Assets | 66,464,329 | (122,967,964 | ) | |||||
Net Assets: | ||||||||
Beginning of year | 2,170,411,487 | 2,293,379,451 | ||||||
|
|
|
| |||||
End of year | $ | 2,236,875,816 | $ | 2,170,411,487 | ||||
|
|
|
| |||||
Undistributed net investment income | $ | 56,253,746 | $ | 68,203,416 | ||||
|
|
|
| |||||
See accompanying notes, which are an integral part of the financial statements.
Diversified Income Series-33
Table of Contents
Delaware VIP Trust —
Delaware VIP Diversified Income Series Statements of changes in net assets
| Year ended | ||||||||
Increase (Decrease) in Net Assets from Operations: | 12/31/16 | 12/31/15 | ||||||
Net investment income | $ | 53,367,960 | $ | 72,128,322 | ||||
Net realized gain (loss) | 9,776,010 | (46,184,143 | ) | |||||
Net change in unrealized appreciation | ||||||||
(depreciation) | 7,367,075 | (56,329,941 | ) | |||||
Net increase (decrease) in net assetsresulting from operations | 70,511,045 | (30,385,762 | ) | |||||
Dividends and Distributions to | ||||||||
Shareholders from: | ||||||||
Net investment income: | ||||||||
Standard Class | (11,261,327 | ) | (14,156,454 | ) | ||||
Service Class | (58,403,940 | ) | (52,370,637 | ) | ||||
Net realized gain: | ||||||||
Standard Class | — | (5,195,029 | ) | |||||
Service Class | — | (20,948,255 | ) | |||||
| (69,665,267 | ) | (92,670,375 | ) | |||||
Capital Share Transactions: | ||||||||
Proceeds from shares sold: | ||||||||
Standard Class | 17,237,247 | 23,335,358 | ||||||
Service Class | 128,123,758 | 161,193,132 | ||||||
Net asset value of shares issued uponreinvestment of dividends anddistributions: | ||||||||
Standard Class | 11,261,327 | 14,864,954 | ||||||
Service Class | 58,403,940 | 73,318,892 | ||||||
| 215,026,272 | 272,712,336 | |||||||
Cost of shares redeemed: | ||||||||
Standard Class | (45,534,410 | ) | (149,390,421 | ) | ||||
Service Class | (103,873,311 | ) | (123,233,742 | ) | ||||
| (149,407,721 | ) | (272,624,163 | ) | |||||
Increase in net assets derived from capitalshare transactions | 65,618,551 | 88,173 | ||||||
Net Increase (Decrease) in Net Assets | 66,464,329 | (122,967,964 | ) | |||||
Net Assets: | ||||||||
Beginning of year | 2,170,411,487 | 2,293,379,451 | ||||||
End of year | $ | 2,236,875,816 | $ | 2,170,411,487 | ||||
Undistributed net investment income | $ | 56,253,746 | $ | 68,203,416 | ||||
See accompanying notes, which are an integral part of the financial statements.
Diversified Income Series-34
Diversified Income Series-34
Table of Contents
Delaware VIP® Trust — Delaware VIP Diversified Income Series
Selected data for each share of the Series outstanding throughout each period were as follows:
Delaware VIP Diversified Income Series Standard Class Year ended | ||||||||||||||||||||
| 12/31/16 | 12/31/15 | 12/31/14 | 12/31/13 | 12/31/12 | ||||||||||||||||
Net asset value, beginning of period | $ | 10.290 | $ | 10.840 | $ | 10.530 | $ | 11.070 | $ | 11.020 | ||||||||||
Income (loss) from investment operations: | ||||||||||||||||||||
Net investment income1 | 0.274 | 0.349 | 0.333 | 0.331 | 0.376 | |||||||||||||||
Net realized and unrealized gain (loss) | 0.086 | (0.452 | ) | 0.221 | (0.460 | ) | 0.384 | |||||||||||||
|
|
|
|
|
|
|
|
|
| |||||||||||
Total from investment operations | 0.360 | (0.103 | ) | 0.554 | (0.129 | ) | 0.760 | |||||||||||||
|
|
|
|
|
|
|
|
|
| |||||||||||
Less dividends and distributions from: | ||||||||||||||||||||
Net investment income | (0.360 | ) | (0.327 | ) | (0.244 | ) | (0.260 | ) | (0.359 | ) | ||||||||||
Net realized gain | — | (0.120 | ) | — | (0.151 | ) | (0.351 | ) | ||||||||||||
|
|
|
|
|
|
|
|
|
| |||||||||||
Total dividends and distributions | (0.360 | ) | (0.447 | ) | (0.244 | ) | (0.411 | ) | (0.710 | ) | ||||||||||
|
|
|
|
|
|
|
|
|
| |||||||||||
Net asset value, end of period | $ | 10.290 | $ | 10.290 | $ | 10.840 | $ | 10.530 | $ | 11.070 | ||||||||||
|
|
|
|
|
|
|
|
|
| |||||||||||
Total return2 | 3.52% | (1.08% | ) | 5.32% | (1.26% | ) | 7.20% | |||||||||||||
Ratios and supplemental data: | ||||||||||||||||||||
Net assets, end of period (000 omitted) | $ | 322,535 | $ | 339,023 | $ | 473,568 | $ | 489,953 | $ | 531,992 | ||||||||||
Ratio of expenses to average net assets | 0.67% | 0.67% | 0.67% | 0.67% | 0.68% | |||||||||||||||
Ratio of net investment income to average net assets | 2.63% | 3.29% | 3.09% | 3.10% | 3.43% | |||||||||||||||
Portfolio turnover | 247% | 250% | 252% | 260% | 216% | |||||||||||||||
| 1 | The average shares outstanding method has been applied for per share information. |
| 2 | Total investment return is based on the change in net asset value of a share during the period and assumes reinvestment of dividends and distributions at net asset value. Total investment return does not include fees, charges, or expenses imposed by the variable annuity and life insurance contracts for which Delaware VIP Trust serves as an underlying investment vehicle. |
See accompanying notes, which are an integral part of the financial statements.
Diversified Income Series-35
Table of Contents
Delaware VIP® Diversified Income Series
Financial highlights (continued)
Selected data for each share of the Series outstanding throughout each period were as follows:
Delaware VIP Diversified Income Series Service Class Year ended | ||||||||||||||||||||
| 12/31/16 | 12/31/15 | 12/31/14 | 12/31/13 | 12/31/12 | ||||||||||||||||
Net asset value, beginning of period | $ | 10.220 | $ | 10.770 | $ | 10.470 | $ | 11.000 | $ | 10.960 | ||||||||||
Income (loss) from investment operations: | ||||||||||||||||||||
Net investment income1 | 0.246 | 0.321 | 0.305 | 0.303 | 0.347 | |||||||||||||||
Net realized and unrealized gain (loss) | 0.088 | (0.451 | ) | 0.212 | (0.449 | ) | 0.376 | |||||||||||||
|
|
|
|
|
|
|
|
|
| |||||||||||
Total from investment operations | 0.334 | (0.130 | ) | 0.517 | (0.146 | ) | 0.723 | |||||||||||||
|
|
|
|
|
|
|
|
|
| |||||||||||
Less dividends and distributions from: | ||||||||||||||||||||
Net investment income | (0.334 | ) | (0.300 | ) | (0.217 | ) | (0.233 | ) | (0.332 | ) | ||||||||||
Net realized gain | — | (0.120 | ) | — | (0.151 | ) | (0.351 | ) | ||||||||||||
|
|
|
|
|
|
|
|
|
| |||||||||||
Total dividends and distributions | (0.334 | ) | (0.420 | ) | (0.217 | ) | (0.384 | ) | (0.683 | ) | ||||||||||
|
|
|
|
|
|
|
|
|
| |||||||||||
Net asset value, end of period | $ | 10.220 | $ | 10.220 | $ | 10.770 | $ | 10.470 | $ | 11.000 | ||||||||||
|
|
|
|
|
|
|
|
|
| |||||||||||
Total return2 | 3.28% | (1.34% | ) | 4.98% | (1.42% | ) | 6.87% | |||||||||||||
Ratios and supplemental data: | ||||||||||||||||||||
Net assets, end of period (000 omitted) | $ | 1,914,341 | $ | 1,831,388 | $ | 1,819,811 | $ | 1,536,240 | $ | 1,519,853 | ||||||||||
Ratio of expenses to average net assets | 0.92% | 0.92% | 0.92% | 0.92% | 0.93% | |||||||||||||||
Ratio of expenses to average net assetsprior to fees waived | 0.97% | 0.97% | 0.97% | 0.97% | 0.98% | |||||||||||||||
Ratio of net investment income to average net assets | 2.38% | 3.04% | 2.84% | 2.85% | 3.18% | |||||||||||||||
Ratio of net investment income to average net assets prior to fees waived | 2.33% | 2.99% | 2.79% | 2.80% | 3.13% | |||||||||||||||
Portfolio turnover | 247% | 250% | 252% | 260% | 216% | |||||||||||||||
| 1 | The average shares outstanding method has been applied for per share information. |
| 2 | Total investment return is based on the change in net asset value of a share during the period and assumes reinvestment of dividends and distributions at net asset value. Total investment return during all of the periods shown reflects a waiver by the distributor. Performance would have been lower had the waiver not been in effect. Total investment return does not include fees, charges, or expenses imposed by the variable annuity and life insurance contracts for which Delaware VIP Trust serves as an underlying investment vehicle. |
See accompanying notes, which are an integral part of the financial statements.
Diversified Income Series-36
Table of Contents
Delaware VIP® Trust — Delaware VIP Diversified Income Series
December 31, 2016
Delaware VIP Trust (Trust) is organized as a Delaware statutory trust and offers 10 series: Delaware VIP Diversified Income Series, Delaware VIP Emerging Markets Series, Delaware VIP High Yield Series, Delaware VIP International Value Equity Series, Delaware VIP Limited-Term Diversified Income Series, Delaware VIP REIT Series, Delaware VIP Small Cap Value Series, Delaware VIP Smid Cap Growth Series, Delaware VIP U.S. Growth Series, and Delaware VIP Value Series. These financial statements and the related notes pertain to Delaware VIP Diversified Income Series (Series). The Trust is an open-end investment company. The Series is considered diversified under the Investment Company Act of 1940 (1940 Act), as amended, and offers Standard Class and Service Class shares. The Standard Class shares do not carry a 12b-1 fee and the Service Class shares carry a 12b-1 fee. The shares of the Series are sold only to separate accounts of life insurance companies.
The investment objective of the Series is to seek maximum long-term total return consistent with reasonable risk.
1. Significant Accounting Policies
The following accounting policies are in accordance with U.S. generally accepted accounting principles (U.S. GAAP) and are consistently followed by the Series.
Security Valuation—Equity securities, except those traded on the Nasdaq Stock Market LLC (Nasdaq), are valued at the last quoted sales price as of the time of the regular close of the New York Stock Exchange on the valuation date. Equity securities traded on the Nasdaq are valued in accordance with the Nasdaq Official Closing Price, which may not be the last sales price. If, on a particular day, an equity security does not trade, the mean between the bid and ask prices will be used, which approximates fair value. U.S. government and agency securities are valued at the mean between the bid and ask prices, which approximates fair value. Securities listed on a foreign exchange are normally valued at the last quoted sales price on the valuation date. Other debt securities, credit default swap (CDS) contracts, and interest rate swap contracts are valued based upon valuations provided by an independent pricing service or broker/counterparty and reviewed by management. To the extent current market prices are not available, the pricing service may take into account developments related to the specific security, as well as transactions in comparable securities. Valuations for fixed income securities utilize matrix systems, which reflect such factors as security prices, yields, maturities, and ratings, and are supplemented by dealer and exchange quotations. For asset-backed securities, collateralized mortgage obligations, commercial mortgage securities, and U.S. government agency mortgage securities, pricing vendors utilize matrix pricing which considers prepayment speed, attributes of the collateral, yield or price of bonds of comparable quality, coupon, maturity, and type as well as broker/dealer-supplied prices. Swap prices are derived using daily swap curves and models that incorporate a number of market data factors, such as discounted cash flows, trades, and values of the underlying reference instruments. Foreign currency exchange contracts and foreign cross currency exchange contracts are valued at the mean between the bid and ask prices, which approximates fair value. Interpolated values are derived when the settlement date of the contract is an interim date for which quotations are not available. Futures contracts and options on futures contracts are valued at the daily quoted settlement prices. Exchange-traded options are valued at the last reported sale price or, if no sales are reported, at the mean between the last reported bid and ask prices, which approximates fair value. Generally, other securities and assets for which market quotations are not readily available are valued at fair value as determined in good faith under the direction of the Trust’s Board of Trustees (Board). In determining whether market quotations are readily available or fair valuation will be used, various factors will be taken into consideration, such as market closures or suspension of trading in a security.
Federal and Foreign Income Taxes—No provision for federal income taxes has been made as the Series intends to continue to qualify for federal income tax purposes as a regulated investment company under Subchapter M of the Internal Revenue Code of 1986, as amended, and make the requisite distributions to shareholders. The Series evaluates tax positions taken or expected to be taken in the course of preparing the Series’ tax returns to determine whether the tax positions are “more-likely-than-not” of being sustained by the applicable tax authority. Tax positions not deemed to meet the “more-likely-than-not” threshold are recorded as a tax benefit or expense in the current year. Management has analyzed the Series’ tax positions taken for all open federal income tax years (Dec. 31, 2013–Dec. 31, 2016), and has concluded that no provision for federal income tax is required in the Series’ financial statements. In regard to foreign taxes only, the Series has open tax years in certain foreign countries in which it invests that may date back to the inception of the Series.
Class Accounting—Investment income, common expenses, and realized and unrealized gain (loss) on investments are allocated to the classes of the Series on the basis of daily net assets of each class. Distribution expenses relating to a specific class are charged directly to that class.
Repurchase Agreements—The Series may purchase certain U.S. government securities subject to the counterparty’s agreement to repurchase them at an agreed upon date and price. The counterparty will be required on a daily basis to maintain the value of the collateral subject to the agreement at not less than the repurchase price (including accrued interest). The agreements are conditioned upon the collateral being deposited under the Federal Reserve book-entry system with the Series’ custodian or a third-party sub-custodian. In the event of default or bankruptcy by the other party to the agreement, retention of the collateral may be subject to legal proceedings. All open repurchase agreements as of the date of this report were entered into on Dec. 30, 2016 and matured on the next business day.
To Be Announced Trades (TBA)—The Series may contract to purchase or sell securities for a fixed price at a transaction date beyond the customary settlement period (examples: when issued, delayed delivery, forward commitment, or TBA transactions) consistent with the Series’ ability to manage its investment portfolio and meet redemption requests. These transactions involve a commitment by the Series to purchase or sell securities for a predetermined price or yield with payment and delivery taking place more than three days in the future, or after a period longer than the customary settlement period for that type of security. No interest will be earned by the Series on such purchases until the securities are delivered or the transaction is completed; however, the market value may change prior to delivery. At Dec. 31, 2016, the Series received $111,000 in cash and posted $1,008,000 in cash as collateral for TBA transactions as of Dec. 31, 2016, which is shown as “Cash collateral due from brokers” and “Cash collateral due to brokers”, respectively on the “Statement of assets and liabilities.”
Diversified Income Series-37
Table of Contents
Delaware VIP® Diversified Income Series
Notes to financial statements (continued)
1. Significant Accounting Policies (continued)
Foreign Currency Transactions—Transactions denominated in foreign currencies are recorded at the prevailing exchange rates on the valuation date in accordance with the Series’ prospectus. The value of all assets and liabilities denominated in foreign currencies is translated daily into U.S. dollars at the exchange rate of such currencies against the U.S. dollar. Transaction gains or losses resulting from changes in exchange rates during the reporting period or upon settlement of the foreign currency transaction are reported in operations for the current period. The Series generally bifurcates that portion of realized gains and losses on investments in debt securities which is due to changes in foreign exchange rates from that which is due to changes in market prices of debt securities. That portion of gains (losses), which is due to changes to foreign exchange rates, is included on the “Statement of operations” under “Net realized gain (loss) on foreign currencies.” The Series reports certain foreign currency related transactions as components of realized gains (losses) for financial reporting purposes, whereas such components are treated as ordinary income (loss) for federal income tax purposes.
Use of Estimates—The Series is an investment company, whose financial statements are prepared in conformity with U.S. GAAP. Therefore, the Series follows the accounting and reporting guidelines for investment companies. The preparation of financial statements in conformity with U.S. GAAP requires management to make estimates and assumptions that affect the fair value of investments, the reported amounts of assets and liabilities and disclosure of contingent assets and liabilities at the date of the financial statements, and the reported amounts of revenues and expenses during the reporting period. Actual results could differ from those estimates and the differences could be material.
Other—Expenses directly attributable to the Series are charged directly to the Series. Other expenses common to various funds within the Delaware Investments® Family of Funds are generally allocated among such funds on the basis of average net assets. Management fees and certain other expenses are paid monthly. Security transactions are recorded on the date the securities are purchased or sold (trade date) for financial reporting purposes. Costs used in calculating realized gains and losses on the sale of investment securities are those of the specific securities sold. Dividend income is recorded on the ex-dividend date and interest income is recorded on the accrual basis. Discounts and premiums on debt securities are accreted or amortized to interest income, respectively, over the lives of the respective securities using the effective interest method. Realized gains (losses) on paydowns of asset- and mortgage-backed securities are classified as interest income. Withholding taxes and reclaims on foreign interest have been recorded in accordance with the Series’ understanding of the applicable country’s tax rules and rates. The Series may pay foreign capital gain taxes on certain foreign securities held, which are reported as components of realized losses for financial reporting purposes, whereas such components are treated as ordinary loss for federal income tax purposes. The Series declares and pays dividends from net investment income and distributions from net realized gain on investments, if any, following the close of the fiscal year. The Series may distribute more frequently, if necessary for tax purposes. Dividends and distributions, if any, are recorded on the ex-dividend date.
The Series may receive earnings credits from its custodian when positive cash balances are maintained, which may be used to offset custody fees. There were no such earnings credits for the year ended Dec. 31, 2016.
The Series receives earnings credits from its transfer agent when positive cash balances are maintained, which may be used to offset transfer agent fees. If the amount earned is greater than $1.00, the expense paid under this arrangement is included on the “Statement of operations” under “Dividend disbursing and transfer agent fees and expenses” with the corresponding expense offset shown under “Less expense paid indirectly.” For the year ended Dec. 31, 2016, the Series earned $1 under this agreement.
2. Investment Management, Administration Agreements, and Other Transactions with Affiliates
In accordance with the terms of its investment management agreement, the Series pays Delaware Management Company (DMC), a series of Delaware Management Business Trust and the investment manager, an annual fee which is calculated daily at the rate of 0.65% on the first $500 million of average daily net assets of the Series, 0.60% on the next $500 million, 0.55% on the next $1.5 billion, and 0.50% on average daily net assets in excess of $2.5 billion.
Delaware Investments Fund Services Company (DIFSC), an affiliate of DMC, provides fund accounting and financial administration oversight services to the Series. For these services, DIFSC’s fees are calculated based on the aggregate daily net assets of the Delaware Investments Family of Funds at the following annual rate: 0.0050% of the first $30 billion; 0.0045% of the next $10 billion; 0.0040% of the next $10 billion; and 0.0025% of aggregate average daily net assets in excess of $50 billion. The fees payable to DIFSC under the service agreement described above are allocated among all funds in the Delaware Investments Family of Funds on a relative net asset value (NAV) basis. For the year ended Dec. 31, 2016, the Series was charged $104,673 for these services. This amount is included on the “Statement of operations” under “Accounting and administration expenses.”
DIFSC is also the transfer agent and dividend disbursing agent of the Series. For these services, DIFSC’s fees are calculated at the annual rate of 0.0075% of the Series’ average daily net assets. This amount is included on the “Statement of operations” under “Dividend disbursing and transfer agent fees and expenses.” For the year ended Dec. 31, 2016, the Series was charged $165,886 for these services. Pursuant to a sub-transfer agency agreement between DIFSC and BNY Mellon Investment Servicing (US) Inc. (BNYMIS), BNYMIS provides certain sub-transfer agency services to the Series. Sub-transfer agency fees are paid by the Series and are also included on the “Statement of operations” under “Dividend disbursing and transfer agent fees and expenses.”
Pursuant to a distribution agreement and distribution plan, the Series pays Delaware Distributors, L.P. (DDLP), the distributor and an affiliate of DMC, an annual distribution and service fee of 0.30% of the average daily net assets of the Service Class shares. DDLP has contracted to waive distribution and service fee from Jan. 1, 2016 through December 31, 2016* in order to limit distribution and service fee of the Service Class shares to 0.25% of average daily net assets. Standard Class shares pay no distribution and service expenses.
Diversified Income Series-38
Table of Contents
Delaware VIP® Diversified Income Series
Notes to financial statements (continued)
2. Investment Management, Administration Agreements, and Other Transactions with Affiliates (continued)
As provided in the investment management agreement, the Series bears a portion of the cost of resources shared with DMC, including the cost of internal personnel of DMC and/or its affiliates that provide legal, tax, and regulatory reporting services to the Series. For the year ended Dec. 31, 2016, the Series was charged $46,278 for internal legal, tax, and regulatory reporting services provided by DMC and/or its affiliates’ employees. This amount is included on the “Statement of operations” under “Legal fees.”
Trustees’ fees include expenses accrued by the Series for each Trustee’s retainer and meeting fees. Certain officers of DMC, DIFSC, and DDLP are officers and/or Trustees of the Trust. These officers and Trustees are paid no compensation by the Series.
Cross trades for the year ended Dec. 31, 2016 were executed by the Series pursuant to procedures adopted by the Board designed to ensure compliance with Rule 17a-7 under the 1940 Act. Cross trading is the buying or selling of portfolio securities between series of investment companies, or between a series of an investment company and another entity, that are or could be considered affiliates by virtue of having a common investment adviser (or affiliated investment advisers), common directors/trustees and/or common officers. At its regularly scheduled meetings, the Board reviews such transactions for compliance with the procedures adopted by the Board. Pursuant to these procedures, for the year ended Dec. 31, 2016, the Series engaged in securities purchases of $22,811,650 and securities sales of $25,277,908, which resulted in net realized gains of $712.
*The aggregate contractual waiver period covering this report is from April 29, 2015 through May 1, 2017.
3. Investments
For the year ended Dec. 31, 2016, the Series made purchases and sales of investment securities other than short-term investments as follows:
Purchases other than U.S. government securities | $ | 4,250,498,727 | ||
Purchases of U.S. government securities | 1,160,456,103 | |||
Sales other than U.S. government securities | 3,942,213,672 | |||
Sales of U.S. government securities | 1,389,414,866 |
At Dec. 31, 2016, the cost and unrealized appreciation (depreciation) of investments for federal income tax purpose for the Fund were as follows:
| Cost of Investments | Aggregate Unrealized Appreciation of Investments | Aggregate Unrealized Depreciation of Investments | Net Unrealized Depreciation of Investments | |||||
| $2,298,739,988 | $28,509,349 | $(50,928,935) | $(22,419,586) |
U.S. GAAP defines fair value as the price that the Series would receive to sell an asset or pay to transfer a liability in an orderly transaction between market participants at the measurement date under current market conditions. A three-level hierarchy for fair value measurements has been established based upon the transparency of inputs to the valuation of an asset or liability. Inputs may be observable or unobservable and refer broadly to the assumptions that market participants would use in pricing the asset or liability. Observable inputs reflect the assumptions market participants would use in pricing the asset or liability based on market data obtained from sources independent of the reporting entity. Unobservable inputs reflect the reporting entity’s own assumptions about the assumptions that market participants would use in pricing the asset or liability based on the best information available under the circumstances. The Series’ investment in its entirety is assigned a level based upon the observability of the inputs which are significant to the overall valuation. The three-level hierarchy of inputs is summarized below.
| Level 1 — | Inputs are quoted prices in active markets for identical investments. (Examples: equity securities, open-end investment companies, futures contracts, exchange-traded options contracts) | |
| Level 2 — | Other observable inputs, including, but not limited to: quoted prices for similar assets or liabilities in markets that are active, quoted prices for identical or similar assets or liabilities in markets that are not active, inputs other than quoted prices that are observable for the assets or liabilities (such as interest rates,yield curves, volatilities, prepayment speeds, loss severities, credit risks, and default rates), or other market-corroborated inputs. (Examples: debt securities, government securities, swap contracts, foreign currency exchange contracts, foreign securities utilizing international fair value pricing, broker-quoted securities, fair valued securities) | |
| Level 3 — | Significant unobservable inputs, including the Series’ own assumptions used to determine the fair value of investments. (Examples: broker-quoted securities, fair valued securities) |
Level 3 investments are valued using significant unobservable inputs. The Series may also use an income-based valuation approach in which the anticipated future cash flows of the investment are discounted to calculate fair value. Discounts may also be applied due to the nature or duration of any restrictions on the disposition of the investments. Valuations may also be based upon current market prices of securities that are comparable in coupon, rating, maturity, and industry. The derived value of a Level 3 investment may not represent the value which is received upon disposition and this could impact the results of operations.
Diversified Income Series-39
Table of Contents
Delaware VIP® Diversified Income Series
Notes to financial statements (continued)
3. Investments (continued)
The following table summarizes the valuation of the Series’ investments by fair value hierarchy levels as of Dec. 31, 2016:
| Securities | Level 1 | Level 2 | Level 3 | Total | ||||||||||||
Agency, Asset- & Mortgage-Backed Securities1 | $ | — | $ | 572,332,417 | $ | 551,386 | $ | 572,883,803 | ||||||||
Collateralized Debt Obligations | — | 41,407,153 | — | 41,407,153 | ||||||||||||
Corporate Debt | — | 1,121,589,164 | — | 1,121,589,164 | ||||||||||||
Foreign Debt | — | 106,358,689 | — | 106,358,689 | ||||||||||||
Municipal Bonds | — | 13,422,301 | — | 13,422,301 | ||||||||||||
Senior Secured Loans1 | — | 214,183,400 | 5,905,533 | 220,088,933 | ||||||||||||
Common Stock | — | — | — | — | ||||||||||||
Convertible Preferred Stock | — | 6,336,195 | — | 6,336,195 | ||||||||||||
Preferred Stock | — | 11,236,072 | — | 11,236,072 | ||||||||||||
U.S. Treasury Obligations | — | 68,948,390 | — | 68,948,390 | ||||||||||||
Short-Term Investments | — | 114,049,702 | — | 114,049,702 | ||||||||||||
|
|
|
|
|
|
|
| |||||||||
Total Value of Securities | $ | — | $ | 2,269,863,483 | $ | 6,456,919 | $ | 2,276,320,402 | ||||||||
|
|
|
|
|
|
|
| |||||||||
Foreign Currency Exchange Contracts | $ | — | $ | 382,030 | $ | — | $ | 382,030 | ||||||||
Futures Contracts | 139,063 | — | — | 139,063 | ||||||||||||
Swap Contracts | — | (212,381 | ) | — | (212,381 | ) | ||||||||||
The securities that have been valued at zero on the “Schedule of investments” are considered to be Level 3 investments in this table.
1Security type is valued across multiple levels. Level 1 investments represent exchange-traded investments, Level 2 investments represent investments with observable inputs or matrix-priced investments, and Level 3 investments represent investments without observable inputs. The amounts attributed to Level 1 investments, Level 2 investments, and Level 3 investments represent the following percentages of the total market value of these security types:
| Level 2 | Level 3 | Total | ||||
Agency, Asset- & Mortgage-Backed Securities | 99.90% | 0.10% | 100.00% | |||
Senior Secured Loans | 97.32% | 2.68% | 100.00% |
During the year ended Dec. 31, 2016, there were no transfers between Level 1 investments, Level 2 investments, or Level 3 investments that had a significant impact to the Series. The Series’ policy is to recognize transfers between levels at the beginning of the reporting period.
A reconciliation of Level 3 investments is presented when the Series has a significant amount of Level 3 investments at the beginning, interim, or end of period in relation to the Series’ net assets. Management has determined not to provide a reconciliation of Level 3 investments as they are not considered significant to the Series’ net assets at the beginning, interim, or end of the year. Management has determined to provide additional disclosure on Level 3 inputs since the Level 3 investments are not considered significant to the Series’ net assets at the end of the year.
4. Dividend and Distribution Information
Income and long-term capital gain distributions are determined in accordance with federal income tax regulations, which may differ from U.S. GAAP. Additionally, distributions from net gains on foreign currency transactions and net short-term gains on sales of investment securities are treated as ordinary income for federal income tax purposes. The tax character of dividends and distributions paid during the years ended Dec. 31, 2016 and 2015 was as follows:
Year ended | Year ended | |||||||
Ordinary income | $ | 69,665,267 | $ | 81,693,074 | ||||
Long-term capital gains | — | 10,977,301 | ||||||
|
|
|
| |||||
Total | $ | 69,665,267 | $ | 92,670,375 | ||||
|
|
|
| |||||
Diversified Income Series-40
Table of Contents
Delaware VIP�� Diversified Income Series
Notes to financial statements (continued)
5. Components of Net Assets on a Tax Basis
As of Dec. 31, 2016, the components of net assets on a tax basis were as follows:
Shares of beneficial interest | $ | 2,242,105,232 | ||
Undistributed ordinary income | 58,342,745 | |||
Other temporary differences | (3,053,935 | ) | ||
Capital loss carryforwards | (37,886,179 | ) | ||
Net unrealized depreciation on investments, foreign currencies,and derivatives | (22,632,047 | ) | ||
|
| |||
Net assets | $ | 2,236,875,816 | ||
|
|
The differences between book basis and tax basis components of net assets are primarily attributable to tax deferral of losses on wash sales, mark-to-market of futures contracts, mark-to-market of foreign currency exchange contracts, straddle losses, amortization on convertible bonds, contingent payment debt instruments, tax treatment of CDS contracts and troubled debt.
For financial reporting purposes, capital accounts are adjusted to reflect the tax character of permanent book/tax differences. Reclassifications are primarily due to tax treatment of gain (loss) on foreign currency transactions, CDS contracts, contingent payment debt instruments, amortization on convertible bonds, foreign capital gains tax and paydowns of asset-and mortgage-backed securities. Results of operations and net assets were not affected by these reclassifications. For the year ended Dec. 31, 2016, the Series recorded the following reclassifications:
Undistributed Net Investment | Accumulated Net Realized Loss | |||
| $4,347,637 | $ | (4,347,637 | ) | |
Under the Regulated Investment Company Modernization Act of 2010 (Act), net capital losses recognized for tax years beginning after Dec. 22, 2010 maybe carried forward indefinitely, and their character is retained as short-term and/or long-term losses. Losses incurred that will be carried forward under the Act are as follows:
| Loss carryforward character | ||||||||
| No Expiration | ||||||||
Short-term | Long-term | Total | ||||||
| $14,754,875 | $ | 23,131,304 | $ | 37,886,179 | ||||
For federal income tax purposes, $7,933,661 of capital loss carryforward was utilized in the year ended Dec. 31, 2016.
Diversified Income Series-41
Table of Contents
Delaware VIP® Diversified Income Series
Notes to financial statements (continued)
6. Capital Shares
Transactions in capital shares were as follows:
Year ended | Year ended | |||||||
Shares sold: | ||||||||
Standard Class | 1,659,239 | 2,178,028 | ||||||
Service Class | 12,404,945 | 15,136,868 | ||||||
Shares issued upon reinvestment of dividends and distributions: | ||||||||
Standard Class | 1,101,891 | 1,398,396 | ||||||
Service Class | 5,742,767 | 6,929,952 | ||||||
|
|
|
| |||||
| 20,908,842 | 25,643,244 | |||||||
|
|
|
| |||||
Shares redeemed: | ||||||||
Standard Class | (4,371,189 | ) | (14,303,180 | ) | ||||
Service Class | (10,044,572 | ) | (11,808,731 | ) | ||||
|
|
|
| |||||
| (14,415,761 | ) | (26,111,911 | ) | |||||
|
|
|
| |||||
Net increase (decrease) | 6,493,081 | (468,667 | ) | |||||
|
|
|
| |||||
7. Line of Credit
The Series, along with certain other funds in the Delaware Investments® Family of Funds (Participants), was a participant in a $155,000,000 revolving line of credit intended to be used for temporary or emergency purposes as an additional source of liquidity to fund redemptions of investor shares. Under the agreement, the Participants were charged an annual commitment fee of 0.10%, which was allocated across the Participants on the basis of relative net assets of each Participant’s allocation of the entire facility. The Participants were permitted to borrow up to a maximum of one-third of their net assets under the agreement. Each Participant was individually, and not jointly, liable for its particular advances, if any, under the line of credit. The line of credit available under the agreement expired on Nov. 7, 2016.
On Nov. 7, 2016, the Series, along with the other Participants, entered into an amendment to the agreement for a $155,000,000 revolving line of credit. The line of credit is to be used as described above and operates in substantially the same manner as the original agreement, with the exception of the annual commitment fee. Under theamendment to the agreement, the Participants are charged an annual commitment fee of 0.15%, which is allocated across the Participants on the basis of relative net assets of each Participant’s allocation of the entire facility. The line of credit available under the agreement expires on Nov. 6, 2017.
The Series had no amount outstanding as of Dec. 31, 2016, or at any time during the year then ended.
8. Derivatives
U.S. GAAP requires disclosures that enable investors to understand: (1) how and why an entity uses derivatives; (2) how they are accounted for; and (3) how they affect an entity’s results of operations and financial position.
Foreign Currency Exchange Contracts – The Series may enter into foreign currency exchange contracts and foreign cross currency exchange contracts as a way of managing foreign exchange rate risk. The Series may enter into these contracts to fix the U.S. dollar value of a security that it has agreed to buy or sell for the period between the date the trade was entered into and the date the security is delivered and paid for. The Series may also use these contracts to hedge the U.S. dollar value of securities it already owns that are denominated in foreign currencies. In addition, the Series may enter into these contracts to facilitate or expedite the settlement of portfolio transactions. The change in value is recorded as an unrealized gain or loss. When the contract is closed, a realized gain or loss is recorded equal to the difference between the value of the contract at the time it was opened and the value at the time it was closed.
The use of foreign currency exchange contracts and foreign cross currency exchange contracts does not eliminate fluctuations in the underlying prices of the securities, but does establish a rate of exchange that can be achieved in the future. Although foreign currency exchange contracts and foreign cross currency exchange contracts limit the risk of loss due to an unfavorable change in the value of the hedged currency, they also limit any potential gain that might result should the value of the currency change favorably. In addition, the Series could be exposed to risks if the counterparties to the contracts are unable to meet the terms of their contracts. The Series’ maximum risk of loss from counterparty credit risk is the value of its currency exchanged with the counterparty. The risk is generally mitigated by having a netting arrangement between the Series and the counterparty and by the posting of collateral by the counterparty to the Series to cover the Series’ exposure to the counterparty. The Fund received $125,000 in security collateral for closed foreign currency exchange contracts.
Diversified Income Series-42
Table of Contents
Delaware VIP® Diversified Income Series
Notes to financial statements (continued)
8. Derivatives (continued)
During the year ended Dec. 31, 2016, the Series entered into foreign currency exchange contracts to hedge the U.S. dollar value of securities it already owns that were denominated in foreign currencies.
Futures Contracts – A futures contract is an agreement in which the writer (or seller) of the contract agrees to deliver to the buyer an amount of cash or securities equal to a specific dollar amount times the difference between the value of a specific security or index at the close of the last trading day of the contract and the price at which the agreement is made. The Series may use futures contracts in the normal course of pursuing its investment objective. The Series may invest in futures contracts to hedge its existing portfolio securities against fluctuations in value caused by changes in interest rates or market conditions. Upon entering into a futures contract, the Series deposits cash or pledges U.S. government securities to a broker, equal to the minimum “initial margin” requirements of the exchange on which the contract is traded. Subsequent payments are received from the broker or paid to the broker each day, based on the daily fluctuation in the market value of the contract. These receipts or payments are known as “variation margin” and are recorded daily by the Series as unrealized gains or losses until the contracts are closed. When the contracts are closed, the Series records a realized gain or loss equal to the difference between the value of the contract at the time it was opened and the value at the time it was closed. Risks of entering into futures contracts include potential imperfect correlation between the futures contracts and the underlying securities and the possibility of an illiquid secondary market for these instruments. When investing in futures, there is reduced counterparty credit risk to the Series because futures are exchange-traded and the exchange’s clearinghouse, as counterparty to all exchange-traded futures, guarantees against default. At Dec. 31, 2016, the Series posted $457,000 as margin for open futures contracts, which is presented on the “Statement of assets and liabilities” as “Cash collateral due from brokers.”
During the year ended Dec. 31, 2016, the Series used futures contracts to hedge the Series’ existing portfolio securities against fluctuations in value caused by changes in interest rates or market conditions.
Options Contracts – During the year ended Dec. 31, 2016, the Series entered into options contracts in the normal course of pursuing its investment objective. The Series may buy or write options contracts for any number of reasons, including without limitation: to manage the Series’ exposure to changes in securities prices caused by interest rates or market conditions and foreign currencies; as an efficient means of adjusting the Series’ overall exposure to certain markets; to protect the value of portfolio securities; and as a cash management tool. The Series may buy or write call or put options on securities, futures, swaps, swaptions, financial indices, and foreign currencies. When the Series buys an option, a premium is paid and an asset is recorded and adjusted on a daily basis to reflect the current market value of the option purchased. When the Series writes an option, a premium is received and a liability is recorded and adjusted on a daily basis to reflect the current market value of the option written. Premiums received from writing options that expire unexercised are treated by the Series on the expiration date as realized gains. The difference between the premium received and the amount paid on effecting a closing purchase transaction, including brokerage commissions, is treated as realized gain or loss. If a call option is exercised, the premium is added to the proceeds from the sale of the underlying security in determining whether the Series has a realized gain or loss. If a put option is exercised, the premium reduces the cost basis of the securities purchased by the Series. The Series, as writer of an option, bears the market risk of an unfavorable change in the price of the security underlying the written option. When writing options, the Series is subject to minimal counterparty risk because the counterparty is only obligated to pay premiums and does not bear the market risk of an unfavorable market change.
Transactions in options written during the year ended Dec. 31, 2016 for the Series were as follows:
| Number of | ||||||||
Call Options | Contracts | Premiums | ||||||
Options outstanding at Dec. 31, 2015 | — | $ | — | |||||
Options written | 2,567,849 | 195,079 | ||||||
Options expired | (2,567,000 | ) | (62,423 | ) | ||||
Options exercised | (849 | ) | (132,656 | ) | ||||
|
|
|
| |||||
Options outstanding at Dec. 31, 2016 | — | $ | — | |||||
|
|
|
| |||||
| Number of | ||||||||
Put Options | Contracts | Premiums | ||||||
Options outstanding at Dec. 31, 2015 | — | $ | — | |||||
Options written | 2,567,000 | 24,072 | ||||||
Options expired | (2,567,000 | ) | (24,072 | ) | ||||
|
|
|
| |||||
Options outstanding at Dec. 31, 2016 | — | $ | — | |||||
|
|
|
| |||||
During the year ended Dec. 31, 2016, the Series used options contracts to manage the Series’ exposure to changes in securities prices caused by interest rates or market conditions.
Swap Contracts — The Series may enter into interest rate swap contracts and CDS contracts in the normal course of pursuing its investment objective. The Series may invest in interest swaps to manage the Series’ sensitivity to interest rates or to hedge against changes in interest rates. The Series may enter into CDS contracts in order to hedge against a credit event, to enhance total return or to gain exposure to certain securities or markets. The Series will not be permitted to enter into any swap transactions unless, at the time of entering into such transactions, the unsecured long-term debt of the actual counterparty, combined with any credit enhancements, is rated at least BBB- by Standard & Poor’s Financial Services LLC. (S&P) or Baa3 by Moody’s Investors Service, Inc. (Moody’s) or is determined to be of equivalent credit quality by DMC.
Diversified Income Series-43
Table of Contents
Delaware VIP® Diversified Income Series
Notes to financial statements (continued)
8. Derivatives (continued)
Interest Rate Swaps. An interest rate swap contract is an exchange of interest rates between counterparties. In one instance, an interest rate swap involves payments received by the Series from another party based on a variable or floating interest rate, in return for making payments based on a fixed interest rate. An interest rate swap can also work in reverse with the Series receiving payments based on a fixed interest rate and making payments based on a variable or floating interest rate. Interest rate swaps may be used to adjust the Series’ sensitivity to interest rates or to hedge against changes in interest rates. Periodic payments on such contracts are accrued daily and recorded as unrealized appreciation (depreciation) on swap contracts. Upon periodic payment (receipt) or termination of the contract, such amounts are recorded as realized gains or losses on swap contracts. The Series’ maximum risk of loss from counterparty credit risk is the discounted net value of the cash flows to be received from/paid to the counterparty over the interest rate swap contract’s remaining life, to the extent that the amount is positive. This risk is mitigated by (1) for bilateral swap contracts, having a netting arrangement between the Series and the counterparty and by the posting of collateral by the counterparty to the Series to cover the Series’ exposure to the counterparty and (2) for cleared swaps, trading these instruments through a central counterparty.
During the year ended Dec. 31, 2016, the Series entered into interest rate swap contracts to manage the Series’ sensitivity to interest rate or to hedge against changes in interest rates.
Credit Default Swaps. A CDS contract is a risk-transfer instrument through which one party (purchaser of protection) transfers to another party (seller of protection) the financial risk of a credit event (as defined in the CDS agreement), as it relates to a particular reference security or basket of securities (such as an index). In exchange for the protection offered by the seller of protection, the purchaser of protection agrees to pay the seller of protection a periodic amount at a stated rate that is applied to the notional amount of the CDS contract. In addition, an upfront payment may be made or received by the Series in connection with an unwinding or assignment of a CDS contract. Upon the occurrence of a credit event, the seller of protection would pay the par (or other agreed-upon) value of the reference security (or basket of securities) to the counterparty. Credit events generally include, among others, bankruptcy, failure to pay, and obligation default.
During the year ended Dec. 31, 2016, the Series entered into CDS contracts as a purchaser and seller of protection, as a hedge against credit events. Periodic payments (receipts) on such contracts are accrued daily and recorded as unrealized losses (gains) on swap contracts. Upon payment (receipt), such amounts are recorded as realized losses (gains) on swap contracts. Upfront payments made or received in connection with CDS contracts are amortized over the expected life of the CDS contracts as unrealized losses (gains) on swap contracts. The change in value of CDS contracts is recorded daily as unrealized appreciation or depreciation. A realized gain or loss is recorded upon a credit event (as defined in the CDS agreement) or the maturity or termination of the agreement. Initial margin and variation margin is posted to central counterparties for central cleared CDS basket trades, as determined by the applicable central counterparty.
CDS contracts may involve greater risks than if the Series had invested in the reference obligation directly. CDS contracts are subject to general market risk, liquidity risk, counterparty risk, and credit risk. The Series’ maximum risk of loss from counterparty credit risk, either as the seller of protection or the buyer of protection, is the fair value of the contract. This risk is mitigated by (1) for bilateral swap contracts, having a netting arrangement between the Series and the counterparty and by the posting of collateral by the counterparty to the Series to cover the Series’ exposure to the counterparty, and (2) for cleared swaps, trading these instruments through a central counterparty.
During the year ended Dec. 31, 2016, the Series used CDS contracts to hedge against credit events.
Swaps Generally. The value of open swaps may differ from that which would be realized in the event the Series terminated its position in the contract on a given day. Risks of entering into these contracts include the potential inability of the counterparty to meet the terms of the contracts. This type of risk is generally limited to the amount of favorable movement in the value of the underlying security, instrument, or basket of instruments, if any, at the day of default. Risks also arise from potential losses from adverse market movements and such losses could exceed the unrealized amounts shown on the “Schedule of investments.”
At Dec. 31, 2016, the Series posted $684,554 in cash as collateral for open centrally cleared swap contracts, which is presented as “Cash collateral due from brokers” on the “Statement of assets and liabilities.” At Dec. 31, 2016, the Series received $835,000 in cash as collateral for certain open derivatives, which is presented as “Cash collateral due to brokers” on the “Statement of assets and liabilities.”
Diversified Income Series-44
Table of Contents
Delaware VIP® Diversified Income Series
Notes to financial statements (continued)
8. Derivatives (continued)
Fair values of derivative instruments as of Dec. 31, 2016 were as follows:
| Asset Derivatives Fair Value | |||||||||||||||||||||||||
| Statement of Assets and Liabilities Location | Currency Contracts | Equity Contracts | Interest Rate Contracts | Credit Contracts | Total | ||||||||||||||||||||
| Unrealized appreciation on foreign currency exchange contracts | $593,775 | $— | $ — | $ — | $593,775 | ||||||||||||||||||||
Variation margin due to broker from futures contracts* | — | — | 219,380 | — | 219,380 | ||||||||||||||||||||
Total | $593,775 | $— | $219,380 | $ — | $813,155 | ||||||||||||||||||||
| Liability Derivatives Fair Value | |||||||||||||||||||||||||
| Statement of Assets and Liabilities Location | Currency Contracts | Equity Contracts | Interest Contracts | Credit Contracts | Total | ||||||||||||||||||||
| Unrealized depreciation on foreign currency exchange contracts | $211,745 | $ — | $ — | $ — | $211,745 | ||||||||||||||||||||
Variation margin due to broker from futures contracts* | — | — | 80,317 | — | 80,317 | ||||||||||||||||||||
Unrealized depreciation on credit default swap contracts | — | — | 17,000 | 17,000 | |||||||||||||||||||||
Unrealized depreciation on interest rate swap contracts | — | — | 125,908 | — | 125,908 | ||||||||||||||||||||
| Variation margin due to brokers on centrally cleared interest rate swap contracts | — | — | 69,473 | — | 69,473 | ||||||||||||||||||||
Total | $211,745 | $— | $275,698 | $17,000 | $504,443 | ||||||||||||||||||||
*Includes cumulative appreciation / depreciation of futures contracts from the date the contracts were opened through Dec. 31, 2016. Only current day variation margin is reported on the “Statement of assets and liabilities.”
The effect of derivative instruments on the “Statement of operations” for the year ended Dec. 31, 2016 was as follows:
| Net Realized Gain (Loss) on: | ||||||||||||||||||||||
| Foreign Currency Exchange Contracts | | Futures Contracts |
| | Options Purchased |
| | Options Written |
| | Swap Contracts |
| Total | |||||||||
Currency contracts | $(961,344) | $ — | $ — | $86,495 | $ — | $(874,849) | ||||||||||||||||
Equity contracts | — | (2,698,306) | — | — | — | (2,698,306) | ||||||||||||||||
Interest rate contracts | — | (1,369,614) | 345,789 | — | — | (1,023,825) | ||||||||||||||||
Credit contracts | — | — | — | (662,566) | 2,529,195 | 1,866,629 | ||||||||||||||||
Total | $(961,344) | $(4,067,920) | $345,789 | $(576,071) | $2,529,195 | $(2,730,351) | ||||||||||||||||
| Net Change in Unrealized Appreciation (Depreciation) of: | ||||||||||||||||||||||
| Foreign Currency Exchange Contracts | | Futures Contracts |
| | Swaps Contracts | | Total | |||||||||||||||
Currency contracts | $562,987 | $ — | $ — | $ 562,987 | ||||||||||||||||||
Equity contracts | — | (184,052) | — | (184,052) | ||||||||||||||||||
Interest rate contracts | — | 1,539,346 | (195,381) | 1,343,965 | ||||||||||||||||||
Credit contracts | — | — | (297,538) | (297,538) | ||||||||||||||||||
Total | $562,987 | $1,355,294 | $(492,919) | $1,425,362 | ||||||||||||||||||
Diversified Income Series-45
Table of Contents
Delaware VIP® Diversified Income Series
Notes to financial statements (continued)
8. Derivatives (continued)
Derivatives Generally. The table below summarizes the average balance of derivative holdings by the Series during the year ended Dec. 31, 2016:
| Long | Short | |||||||
| Derivatives Volume | Derivatives Volume | |||||||
Foreign currency exchange contracts (average cost) | USD 35,958,459 | USD 56,872,419 | ||||||
Futures contracts (average notional value) | 77,809,826 | 73,284,554 | ||||||
Options contracts (average notional value) | 74,086 | 2,944 | ||||||
CDS contracts (average notional value)* | 19,482,598 | 1,962,282 | ||||||
CDS contracts (average notional value)* | EUR 3,138,968 | — | ||||||
Interest rate swap contracts (average notional value)** | USD 19,970,853 | — | ||||||
* Long represents buying protection and short represents selling protection.
** Long represents receiving fixed interest payments and short represents paying fixed interest payments.
9. Offsetting
In December 2011, the Financial Accounting Standards Board (FASB) issued guidance that expanded disclosure requirements on the offsetting of certain assets and liabilities. The disclosures are required for investments and derivative financial instruments subject to master netting or similar agreements which are eligible for offset on the “Statement of assets and liabilities” and require an entity to disclose both gross and net information about such investments and transactions in the financial statements. In January 2013, the FASB issued guidance that clarified which investments and transactions are subject to the offsetting disclosure requirements. The scope of the disclosure requirements for offsetting is limited to derivative instruments, repurchase agreements and reverse repurchase agreements, and securities borrowing.
In order to better define its contractual rights and to secure rights that will help the Series mitigate its counterparty risk, the Series entered into an International Swaps and Derivatives Association, Inc. Master Agreement (ISDA Master Agreement) or a similar agreement with certain of its derivative contract counterparties. An ISDA Master Agreement is a bilateral agreement between the Series and a counterparty that governs certain over-the-counter (OTC) derivatives and foreign exchange contracts and typically contains, among other things, collateral posting items and netting provisions in the event of a default and/or termination event. Under an ISDA Master Agreement, the Series may, under certain circumstances, offset with the counterparty certain derivative financial instruments’ payables and/or receivables with collateral held and/or posted and create one single net payment. The provisions of the ISDA Master Agreement typically permit a single net payment in the event of default (close-out), including the bankruptcy or insolvency of the counterparty. However, bankruptcy or insolvency laws of a particular jurisdiction may impose restrictions on or prohibitions against the right of offset in bankruptcy, insolvency, or other events.
For financial reporting purposes, the Series does not offset derivative assets and derivative liabilities that are subject to netting arrangements on the “Statement of assets and liabilities.”
At Dec. 31, 2016, the Series had the following assets and liabilities subject to offsetting provisions:
Offsetting of Financial Assets and Liabilities and Derivative Assets and Liabilities
Counterparty | Gross Value of Derivative Asset | Gross Value of Derivative Liability | Net Position | ||||||||||||||||
Bank of America Merrill Lynch | $345,937 | $(116,114) | $229,823 | ||||||||||||||||
BNP Paribas | 103,527 | (32,066) | 71,461 | ||||||||||||||||
Hong Kong Shanghai Bank | 10,203 | — | 10,203 | ||||||||||||||||
JPMorgan Chase Bank | 81,351 | (2,120) | 79,231 | ||||||||||||||||
Toronto Dominion Bank | 52,757 | (61,445) | (8,688) | ||||||||||||||||
|
|
|
|
|
| ||||||||||||||
Total | $ | 593,775 | $ | (211,745) | $ | 382,030 | |||||||||||||
|
|
|
|
|
| ||||||||||||||
Diversified Income Series-46
Table of Contents
Delaware VIP® Diversified Income Series
Notes to financial statements (continued)
9. Offsetting (continued)
Offsetting of Financial Assets and Liabilities and Derivative Assets and Liabilities (continued)
| Counterparty | Net Position | Fair Value of Non-Cash Collateral Received | Cash Collateral Received | Fair Value of Collateral Pledged | Cash Collateral Pledged | Net Exposure(a) | ||||||||||||||||||||||||
Bank of America Merrill Lynch | $229,823 | $— | $(229,823) | $— | $— | $ — | ||||||||||||||||||||||||
BNP Paribas | 71,461 | — | — | — | — | 71,461 | ||||||||||||||||||||||||
Hong Kong Shanghai Bank | 10,203 | — | (10,203) | — | — | — | ||||||||||||||||||||||||
JPMorgan Chase Bank | 79,231 | — | — | — | — | 79,231 | ||||||||||||||||||||||||
Toronto Dominion Bank | (8,688) | — | — | — | — | (8,688) | ||||||||||||||||||||||||
Total | $382,030 | $— | $(240,026) | $— | $— | $142,004 | ||||||||||||||||||||||||
Master Repurchase Agreements
| Counterparty | Repurchase Agreements | Fair Value of Non-Cash Collateral Received | Cash Collateral Received(b) | Net Collateral | Net Exposure(a) | |||||||||||
Bank of America Merrill Lynch | $18,960,509 | $(18,960,509) | $— | $(18,960,509) | $— | |||||||||||
Bank of Montreal | 22,120,594 | (22,120,594) | — | (22,120,594) | — | |||||||||||
BNP Paribas | 15,144,897 | (15,144,897) | — | (15,144,897) | — | |||||||||||
Total | $56,226,000 | $(56,226,000) | $— | $(56,226,000) | $— | |||||||||||
(a)Net exposure represents the receivable (payable) that would be due from (to) the counterparty in an event of default.
(b)The value of the related collateral exceeded the value of the net position and repurchase agreements as of Dec. 31, 2016.
10. Securities Lending
The Series, along with other funds in the Delaware Investments® Family of Funds, may lend its securities pursuant to a security lending agreement (Lending Agreement) with The Bank of New York Mellon. At the time a security is loaned, the borrower must post collateral equal to the required percentage of the market value of the loaned security, including any accrued interest. The required percentage is: (1) 102% with respect to U.S. securities and foreign securities that are denominated and payable in U.S. dollars; and (2) 105% with respect to foreign securities. With respect to each loan, if on any business day, the aggregate market value of securities collateral plus cash collateral held is less than the aggregate market value of the securities which are the subject of such loan, the borrower will be notified to provide additional collateral by the end of the following business day which, together with the collateral already held, will be not less than the applicable initial collateral requirements for such security loan. If the aggregate market value of securities collateral and cash collateral held with respect to a security loan exceeds the applicable initial collateral requirement, upon request of the borrower, BNY Mellon must return enough collateral to the borrower by the end of the following business day to reduce the value of the remaining collateral to the applicable initial collateral requirement for such security loan. As a result of the foregoing, the value of the collateral held with respect to a loaned security on any particular day may be more or less than the value of the security on loan.
Cash collateral received by each Series of the Trust is generally invested in a series of individual separate accounts, each corresponding to a Series. The investment guidelines permit each separate account to hold certain securities that would be considered eligible securities for a money market fund. Cash collateral received is generally invested in government securities; certain obligations issued by government sponsored enterprises; repurchase agreements collateralized by U.S. Treasury securities; obligations issued by the central government of any Organization for Economic Cooperation and Development (OECD) country or its agencies, instrumentalities ,or establishments; obligations of supranational organizations; commercial paper, notes, bonds, and other debt obligations; certificates of deposit, time deposits, and other bank obligations; and asset-backed securities.
In the event of default or bankruptcy by the lending agent, realization and/or retention of the collateral may be subject to legal proceedings. In the event the borrower fails to return loaned securities and the collateral received is insufficient to cover the value of the loaned securities and provided such collateral shortfall is not the result of investment losses, the lending agent has agreed to pay the amount of the shortfall to the Series or, at the discretion of the lending agent, replace the loaned securities. The Series continues to record dividends or interest, as applicable, on the securities loaned and is subject to changes in value of the securities loaned that may occur during the term of the loan. The Series has the right under the Lending Agreement to recover the securities from the borrower on demand. With respect to security loans collateralized by non-cash collateral, the Series receives loan premiums paid by the borrower. With respect to security loans collateralized by cash collateral, the earnings from the collateral investments are shared among the Series, the security lending agent, and the borrower. The Series records security lending income net of allocations to the security lending agent, and the borrower.
Diversified Income Series-47
Table of Contents
Delaware VIP® Diversified Income Series
Notes to financial statements (continued)
10. Securities Lending (continued)
The Series may incur investment losses as a result of investing securities lending collateral. This could occur if an investment in the collateral investment account defaulted or became impaired. Under those circumstances, the value of the Series’ cash collateral account may be less than the amount the Series would be required to return to the borrowers of the securities and the Series would be required to make up for this shortfall.
During the year ended Dec. 31, 2016, the Series had no securities out on loan.
11. Credit and Market Risk
Some countries in which the Series may invest require governmental approval for the repatriation of investment income, capital, or the proceeds of sales of securities by foreign investors. In addition, if there is deterioration in a country’s balance of payments or for other reasons, a country may impose temporary restrictions on foreign capital remittances abroad.
The securities exchanges of certain foreign markets are substantially smaller, less liquid, and more volatile than the major securities markets in the United States. Consequently, acquisition and disposition of securities by the Series may be inhibited. In addition, a significant portion of the aggregate market value of securities listed on the major securities exchanges in emerging markets is held by a smaller number of investors. This may limit the number of shares available for acquisition or disposition by the Series.
The Series invests in bank loans and other securities that may subject it to direct indebtedness risk, the risk that the Series will not receive payment of principal, interest, and other amounts due in connection with these investments and will depend primarily on the financial condition of the borrower. Loans that are fully secured offer the Series more protection than unsecured loans in the event of nonpayment of scheduled interest or principal, although there is no assurance that the liquidation of collateral from a secured loan would satisfy the corporate borrower’s obligation, or that the collateral can be liquidated. Some loans or claims may be in default at the time of purchase. Certain of the loans and the other direct indebtedness acquired by the Series may involve revolving credit facilities or other standby financing commitments that obligate the Series to pay additional cash on a certain date or on demand. These commitments may require the Series to increase its investment in a company at a time when the Series might not otherwise decide to do so (including at a time when the company’s financial condition makes it unlikely that such amounts will be repaid). To the extent that the Series is committed to advance additional funds, it will at all times hold and maintain cash or other high grade debt obligations in an amount sufficient to meet such commitments.
As the Series may be required to rely upon another lending institution to collect and pass on to the Series amounts payable with respect to the loan and to enforce the Series’ rights under the loan and other direct indebtedness, an insolvency, bankruptcy, or reorganization of the lending institution may delay or prevent the Series from receiving such amounts. The highly leveraged nature of many loans may make them especially vulnerable to adverse changes in economic or market conditions. Investments in such loans and other direct indebtedness may involve additional risk to the Series.
The Series invests in fixed income securities whose value is derived from an underlying pool of mortgages or consumer loans. The value of these securities is sensitive to changes in economic conditions, including delinquencies and/or defaults, and may be adversely affected by shifts in the market’s perception of the issuers and changes in interest rates. Investors receive principal and interest payments as the underlying mortgages or consumer loans are paid back. Some of these securities are collateralized mortgage obligations (CMOs). CMOs are debt securities issued by U.S. government agencies or by financial institutions and other mortgage lenders, which are collateralized by a pool of mortgages held under an indenture. Prepayment of mortgages may shorten the stated maturity of the obligations and can result in a loss of premium, if any has been paid. Certain of these securities may be stripped (securities which provide only the principal or interest feature of the underlying security). The yield to maturity on an interest-only CMO is extremely sensitive not only to changes in prevailing interest rates, but also to the rate of principal payments (including prepayments) on the related underlying mortgage assets. A rapid rate of principal payments may have a material adverse effect on the Series’ yield to maturity. If the underlying mortgage assets experience greater than anticipated prepayments of principal, the Series may fail to fully recoup its initial investment in these securities even if the securities are rated in the highest rating categories.
The Series invests a portion of its assets in high yield fixed income securities, which are securities rated lower than BBB- by S&P and lower than Baa3 by Moody’s, or similarly rated by another nationally recognized statistical rating organization. Investments in these higher yielding securities are generally accompanied by a greater degree of credit risk than higher rated securities. Additionally, lower rated securities may be more susceptible to adverse economic and competitive industry conditions than investment grade securities.
The Series invests in certain obligations that may have liquidity protection to ensure that the receipt of payments due on the underlying security is timely. Such protection may be provided through guarantees, insurance policies, or letters of credit obtained by the issuer or sponsor through third parties, through various means of structuring the transaction or through a combination of such approaches. The Series will not pay any additional fees for such credit support, although the existence of credit support may increase the price of the security.
The Series may invest up to 15% of its net assets in illiquid securities, which may include securities with contractual restrictions on resale, securities exempt from registration under Rule 144A promulgated under of the Securities Act of 1933, as amended, and other securities which may not be readily marketable. The relative illiquidity of these securities may impair the Series from disposing of them in a timely manner and at a fair price when it is necessary or desirable to do so. While maintaining oversight, the Series’ Board has delegated to DMC, the day-to-day functions of determining whether individual securities are liquid for purposes of the Series’ limitation on investments in illiquid securities. Securities eligible
Diversified Income Series-48
Table of Contents
Delaware VIP® Diversified Income Series
Notes to financial statements (continued)
11. Credit and Market Risk (continued)
for resale pursuant to Rule 144A, which are determined to be liquid, are not subject to the Series’ 15% limit on investments in illiquid securities. Rule 144A securities have been identified on the “Schedule of investments.”
12. Contractual Obligations
The Series enters into contracts in the normal course of business that contain a variety of indemnifications. The Series’ maximum exposure under these arrangements is unknown. However, the Series has not had prior claims or losses pursuant to these contracts. Management has reviewed the Series’ existing contracts and expects the risk of loss to be remote.
13. General Motors Term Loan Litigation
The Series received notice of a litigation proceeding related to a General Motors Corporation (G.M.) term loan participation previously held by the Series in 2009. We believe the matter subject to the litigation notice will likely lead to a recovery from the Series of certain amounts received by the Series because a U.S. Court of Appeals has ruled that the Series and similarly situated investors were unsecured creditors rather than secured lenders of G.M. as a result of an erroneous Uniform Commercial Code filing made by a third party. The Series received the full principal on the loans in 2009 after the G.M. bankruptcy. However, based upon the court ruling the estate is seeking to recover such amounts arguing that, as unsecured creditors, the Series should not have received payment in full. Based upon currently available information related to the litigation and the Series’ potential exposure, the Series recorded a liability of $4,351,308 and an asset of $1,305,392 based on the expected recoveries to unsecured creditors as of Dec. 31, 2016 that resulted in a net decrease in the Series’ NAV to reflect this likely recovery.
14. Recent Accounting Pronouncements
On Oct. 13, 2016, the Securities and Exchange Commission amended existing rules intended to modernize reporting and disclosure of information. These amendments relate to Regulation S-X which sets forth the form and content of financial statements. At this time, management is evaluating the implications of adopting these amendments and their impact on the financial statements and accompanying notes.
15. Subsequent Events
Management has determined that no material events or transactions occurred subsequent to Dec. 31, 2016 that would require recognition or disclosure in the Series’ financial statements.
Diversified Income Series-49
Table of Contents
Delaware VIP® Trust — Delaware VIP Diversified Income Series
Report of independent registered public accounting firm
To the Board of Trustees of Delaware VIP Trust and Shareholders of Delaware VIP Diversified Income Series:
In our opinion, the accompanying statement of assets and liabilities, including the schedule of investments, and the related statements of operations and of changes in net assets and the financial highlights present fairly, in all material respects, the financial position of Delaware VIP Diversified Income Series (one of the series constituting Delaware VIP Trust, hereafter referred to as the “Series”) as of December 31, 2016, the results of its operations for the year then ended, the changes in its net assets for each of the two years in the period then ended and the financial highlights for each of the five years in the period then ended, in conformity with accounting principles generally accepted in the United States of America. These financial statements and financial highlights (hereafter referred to as “financial statements”) are the responsibility of the Series’ management. Our responsibility is to express an opinion on these financial statements based on our audits. We conducted our audits of these financial statements in accordance with the standards of the Public Company Accounting Oversight Board (United States). Those standards require that we plan and perform the audit to obtain reasonable assurance about whether the financial statements are free of material misstatement. An audit includes examining, on a test basis, evidence supporting the amounts and disclosures in the financial statements, assessing the accounting principles used and significant estimates made by management, and evaluating the overall financial statement presentation. We believe that our audits, which included confirmation of securities as of December 31, 2016 by correspondence with the custodian and brokers, provide a reasonable basis for our opinion.
PricewaterhouseCoopers LLP
Philadelphia, Pennsylvania
February 16, 2017
Diversified Income Series-50
Table of Contents
Delaware VIP® Trust — Delaware VIP Diversified Income Series
Other Series information (Unaudited)
Board consideration of Delaware VIP Diversified Income Series investment management agreement
At a meeting held on Aug. 16–18, 2016 (the “Annual Meeting”), the Board of Trustees (the “Board”), including a majority of disinterested or independent Trustees, approved the renewal of the Investment Advisory Agreement for Delaware VIP Diversified Income Series (the “Series”). In making its decision, the Board considered information furnished at regular quarterly Board meetings, including reports detailing Series performance, investment strategies, and expenses, as well as information prepared specifically in connection with the renewal of the investment advisory and sub-advisory contracts. Information furnished specifically in connection with the renewal of the Investment Management Agreement with Delaware Management Company (“DMC”) included materials provided by DMC and its affiliates (“Delaware Investments”) concerning, among other things, the nature, extent, and quality of services provided to the Series; the costs of such services to the Series; economies of scale; and the investment manager’s financial condition and profitability. In addition, in connection with the Annual Meeting, reports were provided to the Trustees in May 2016 and included reports provided by Broadridge Financial Solutions (“Broadridge”). The Broadridge reports compared the Series’ investment performance and expenses with those of other comparable mutual funds. The Independent Trustees reviewed and discussed the Broadridge reports with independent legal counsel to the Independent Trustees. In addition to the information noted above, the Board also requested and received information regarding DMC’s policy with respect to advisory fee levels and its breakpoint philosophy; the structure of portfolio manager compensation; comparative client fee information; and any constraints or limitations on the availability of securities for certain investment styles, which had in the past year inhibited, or which were likely in the future to inhibit, the investment manager’s ability to invest fully in accordance with Series policies.
In considering information relating to the approval of the Series’ advisory agreement, the Independent Trustees received assistance and advice from and met separately with independent legal counsel to the Independent Trustees. Although the Board gave attention to all information furnished, the following discussion identifies, under separate headings, the primary factors taken into account by the Board during its contract renewal considerations.
Nature, extent, and quality of service. The Board considered the services provided by DMC to the Series and its shareholders. In reviewing the nature, extent, and quality of services, the Board considered reports furnished to it throughout the year, which covered matters such as the relative performance of the Series; compliance of portfolio managers with the investment policies, strategies, and restrictions for the Series; compliance by DMC and Delaware Distributors, L.P. (together, “Management”) personnel with the Code of Ethics adopted throughout the Delaware Investments® Family of Funds complex; and adherence to fair value pricing procedures as established by the Board. The Board was pleased with the current staffing of the Series’ investment adviser and the emphasis placed on research in the investment process. The Board recognized DMC’s receipt of several industry distinctions during the past several years. The Board gave favorable consideration to DMC’s efforts to control expenditures while maintaining service levels committed to Series matters. The Board was satisfied with the nature, extent, and quality of the overall services provided by DMC.
Investment performance. The Board placed significant emphasis on the investment performance of the Series in view of the importance of investment performance to shareholders. Although the Board gave appropriate consideration to performance reports and discussions with portfolio managers at Board meetings throughout the year, the Board gave particular weight to the Broadridge reports furnished for the 15(c) Meeting. The Broadridge reports prepared for the Series showed the investment performance of its Standard Class shares in comparison to a group of similar funds as selected by Broadridge (the “Performance Universe”). A fund with the best performance ranked first, and a fund with the poorest performance ranked last. The highest/best performing 25% of funds in the Performance Universe make up the first quartile; the next 25%, the second quartile; the next 25%, the third quartile; and the poorest/worst performing 25% of funds in the Performance Universe make up the fourth quartile. Comparative annualized performance for the Series was shown for the past 1-, 3-, 5-, and 10-year periods, as applicable, ended Jan. 31, 2016. The Board’s objective is that the Series’ performance for the periods considered be at or above the median of its Performance Universe.
Lipper currently classifies the Series as a core plus bond fund. Management believes that it would be more appropriate to include the Series in the general bond funds category. Accordingly, the Broadridge report prepared for the Series compares the Series’ performance to two separate Performance Universes — one, consisting of all underlying variable insurance product core plus bond funds, and the other, consisting of all underlying variable insurance product general bond funds. When compared to other core plus bond funds, the Broadridge report comparison showed that the Series’ total return for the 1-year period was in the fourth quartile of its Performance Universe. The report further showed that the Series’ total return for the 3-, 5-, and 10-year periods was in the third quartile, second quartile and first quartile, respectively, of its Performance Universe. When compared to other general bond funds, the Broadridge report comparison showed that the Series’ total return for the 1- and 5-year periods was in the second quartile of its Performance Universe. The report further showed that Series’ total return for the 3- and 10-year periods was in the first quartile of its Performance Universe. The Board was satisfied with performance.
Comparative expenses. The Board considered expense comparison data for the Delaware Investments® Family of Funds. Management provided the Board with information on pricing levels and fee structures for the Series as of its most recently completed fiscal year. The Board also focused on the comparative analysis of effective management fees and total expense ratios of the Series versus effective management fees and expense ratios of a group of similar funds as selected by Broadridge (the “Expense Group”). In reviewing comparative costs, the Series’ contractual management fee and the actual management fee incurred by the Series were compared with the contractual management fees (assuming all funds in the Expense Group were similar in size to the Series) and actual management fees (as reported by each fund) within the Expense Group, taking into account any applicable breakpoints and fee waivers. The Series’ total expenses were also compared with those of its Expense Group. The Broadridge total expenses, for comparative consistency, were shown by Broadridge for Standard Class shares which do not charge 12b-1 and non-12b-1 service fees. The Board’s objective is to limit the Series’ total expense ratio to be competitive with that of the Expense Group.
Diversified Income Series-51
Table of Contents
Delaware VIP® Diversified Income Series
Other Series information (Unaudited)
Board consideration of Delaware VIP Diversified Income Series investment management
agreement (continued)
When compared to other core plus bond funds, the expense comparisons for the Series showed that the actual management fee and total expenses were in the quartile with the highest expenses of its Expense Group. When compared to other core plus bond/general bond/ high yield funds, the expense comparisons for the Series showed that the actual management fee and total expenses were in the quartile with the second highest expenses of its Expense Group. The Series’ total expenses were not in line with the Board’s objective. In evaluating total expenses, the Board considered 12b-1 waivers in place through May 1, 2017 and various initiatives implemented by Management. The Board was satisfied with Management’s efforts to improve the Series’ total expense ratio and to bring it in line with the Board’s objective.
Management profitability. The Board considered the level of profits realized by DMC in connection with the operation of the Series. In this respect, the Board reviewed the Investment Management Profitability Analysis that addressed the overall profitability of DMC’s business in providing management and other services to each of the individual funds and the Delaware Investments® Family of Funds as a whole. Specific attention was given to the methodology followed in allocating costs for the purpose of determining profitability. Management stated that the level of profits of DMC, to a certain extent, reflects recent operational cost savings and efficiencies initiated by DMC. The Board considered DMC’s efforts to improve services provided to fund shareholders and to meet additional regulatory and compliance requirements resulting from recent industry-wide Securities and Exchange Commission initiatives. The Board also considered the extent to which DMC might derive ancillary benefits from fund operations, including the potential for procuring additional business as a result of the prestige and visibility associated with its role as service provider to the Delaware Investments Family of Funds and the benefits from allocation of fund brokerage to improve trading efficiencies. The Board found that the management fees were reasonable in light of the services rendered and the profitability of DMC.
Economies of scale. The Trustees considered whether economies of scale are realized by DMC as the Series’ assets increase and the extent to which any economies of scale are reflected in the level of management fees charged. The Trustees reviewed the standardized advisory fee pricing and structure approved by the Board and shareholders, which includes breakpoints, and which applies to most funds in the Delaware Investments Family of Funds complex. Breakpoints in the advisory fee occur when the advisory fee rate is reduced on assets in excess of specified levels. Breakpoints result in a lower advisory fee, than would otherwise be the case in the absence of breakpoints, when the asset levels specified in the breakpoints are exceeded. The Board noted that the fee under the Series’ management contract fell within the standardized fee pricing structure. The Board also noted that, as of May 31, 2016, the Series’ assets exceeded the second breakpoint level. The Board believed that, given the extent to which economies of scale might be realized by the advisor and its affiliates, the schedule of fees under the Investment Management Agreement provides a sharing of benefits with the Series and its shareholders.
Tax Information
All disclosures are based on financial information available as of the date of this annual report and, accordingly are subject to change. For any and all items requiring reporting, it is the intention of the Series to report the maximum amount permitted under the Internal Revenue Code and the regulations thereunder.
For the year ended Dec. 31, 2016, the Series reports distributions paid during the year as follows:
(A) Ordinary Income Distributions (Tax Basis) |
100.00% |
(A) is based on a percentage of the Series’ total distributions.
Diversified Income Series-52
Table of Contents
Delaware Investments® Family of Funds
Board of trustees/directors and officers addendum
A mutual fund is governed by a Board of Trustees/Directors (“Trustees”), which has oversight responsibility for the management of a fund’s business affairs. Trustees establish procedures and oversee and review the performance of the investment manager, the distributor, and others who perform services for the fund. The independent fund trustees, in particular, are advocates for shareholder interests. Each trustee has served in that capacity since he or she was elected to or appointed to the Board of Trustees, and will continue to serve until his or her retirement or the election of a new trustee in his or her place. The following is a list of the Trustees and Officers with certain background and related information.
Name, Address, and Birth Date | Position(s) Held with Fund(s) | Length of Time Served | Principal Occupation(s) During the Past Five Years | Number of Portfolios in Fund by Trustee or Officer | Other Directorships Held by Trustee or Officer | |||||
| INTERESTED TRUSTEE | ||||||||||
Shawn K. Lytle1, 3 2005 Market Street Philadelphia, PA 19103
February 1970 | President, Chief Executive Officer, and Trustee | Trustee since September 2015
President and | Shawn K. Lytle has served as President of Delaware Investments2 since June 2015 and was the Regional Head of Americas for UBS Global Asset Management from 2010 through 2015. | 62 | Trustee — UBS Relationship SMA Relationship and UBS Funds (May 2010–April 2015) | |||||
| INDEPENDENT TRUSTEES | ||||||||||
Thomas L. Bennett 2005 Market Street Philadelphia, PA 19103 | Chairman and Trustee | Trustee since March 2005 | Private Investor (March 2004–Present) | 62 | None | |||||
October 1947 |
Chairman since March | |||||||||
Ann D. Borowiec 2005 Market Street Philadelphia, PA 19103
November 1958 | Trustee | Since March 2015 | Chief Executive Officer Private Wealth Management (2011–2013) and Manager, New Jersey Private Bank (2005– 2011) —J.P. Morgan Chase & Co. | 62 | Director — Banco Santander Director — Santander Bank, N.A. | |||||
Joseph W. Chow 2005 Market Street Philadelphia, PA 19103
January 1953 | Trustee | Since January 2013 | Executive Vice President (Emerging Economies Strategies, Risks, and Corporate Administration) State Street Corporation (July 2004–March 2011) | 62 | Director and Audit Committee Member — Hercules Technology Growth Capital, Inc. (2004–2014) | |||||
John A. Fry 2005 Market Street Philadelphia, PA 19103
May 1960 | Trustee | Since January 2001 |
President — Drexel University (August 2010–Present)
President — Franklin & Marshall College (July 2002–July 2010) | 62 | Director, Audit Committee and Governance Committee Member — Community Health Systems
Director — Drexel Morgan & Co.
Director, Audit Committee Member — vTv Therapeutics LLC
| |||||
Lucinda S. Landreth 2005 Market Street Philadelphia, PA 19103
June 1947
| Trustee | Since March 2005 | Private Investor (2004–Present) | 62 | None | |||||
| Diversified Income Series-53 |
Table of Contents
Name, Address, and Birth Date | Position(s) Held with Fund(s) | Length of Time Served | Principal Occupation(s) During the Past Five Years | Number of Portfolios in Fund by Trustee or Officer | Other Directorships Held by Trustee or Officer | |||||
Frances A. Sevilla-Sacasa 2005 Market Street Philadelphia, PA 19103
January 1956 | Trustee | Since September 2011 | Chief Executive Officer — Banco Itaú International
Executive Advisor to Dean August 2011–March 2012) and Interim Dean) (January 2011–July 2011) —University of Miami School of Business Administration
President — U.S. Trust,Bank of Management (Private Banking) (July 2007–December 2008) | 62 | Trust Manager and Audit Committee | |||||
Thomas K. Whitford 2005 Market Street Philadelphia, PA 19103
March 1956 | Trustee | Since January 2013 | Vice Chairman (2010–April 2013) — PNC Financial | 62 | Director — HSBC Finance Corporation and Holdings Inc.
Director — HSBC
| |||||
Janet L. Yeomans 2005 Market Street Philadelphia, PA 19103
July 1948 | Trustee | Since April 1999 | Vice President and Treasurer (January 2006–July 2012)
Vice President — Mergers & President and Treasurer (July 1995–January 2003) 3M Company — | 62 | Director, Personnel and Compensation Chair, and Audit Member — Company | |||||
| OFFICERS | ||||||||||
David F. Connor 2005 Market Street Philadelphia, PA 19103
December 1963 | Senior Vice President, General Counsel, and Secretary | Senior Vice President, since May 2013; General Counsel since May 2015; Secretary since October 2005
| David F. Connor has served in various capacities at different times at Delaware Investments. | 62 | None3 | |||||
Daniel V. Geatens 2005 Market Street Philadelphia, PA 19103
October 1972 | Vice President and Treasurer | Treasurer since October 2007 | Daniel V. Geatens has served in various capacities at different times at Delaware Investments. | 62 | None3 | |||||
Richard Salus 2005 Market Street Philadelphia, PA 19103
October 1963 | Senior Vice President and chief Financial Officer | Chief Financial Officer since | Richard Salus has served in 62 various capacities at different times at Delaware Investments. | 62 | None3 | |||||
| 1 | Shawn K. Lytle is considered to be an “Interested Trustee” because he is an executive officer of the Fund’s(s’) investment advisor. |
| 2 | Delaware Investments is the marketing name for Delaware Management Holdings, Inc. and its subsidiaries, including the Fund’s(s’) investment advisor, principal underwriter, and its transfer agent. |
| 3 | Shawn K. Lytle, David F. Connor, Daniel V. Geatens, and Richard Salus serve in similar capacities for the six portfolios of the Optimum Fund Trust, which have the same investment advisor, principal underwriter, and transfer agent as the registrant. |
The Statement of Additional Information for the Series includes additional information about the Trustees and Officers and is available, without charge, upon request by calling 800 523-1918.
Diversified Income Series-54
Table of Contents
The Series files its complete schedule of portfolio holdings with the Securities and Exchange Commission (Commission) for the first and third quarters of each fiscal year on Form N-Q. The Series’ Forms N-Q, as well as a description of the policies and procedures that the Series uses to determine how to vote proxies (if any) relating to portfolio securities are available without charge (i) upon request, by calling 800 523-1918; and (ii) on the Commission’s website at sec.gov. In addition, a description of the policies and procedures that the Series uses to determine how to vote proxies (if any) relating to portfolio securities and the Schedule of Investments included in the Series’ most recent Form N-Q are available without charge on the Delaware Investments® Funds’ website at delawareinvestments.com/vip/literature. The Series’ Forms N-Q may be reviewed and copied at the Commission’s Public Reference Room in Washington, DC; information on the operation of the Public Reference Room may be obtained by calling 800 SEC-0330.
Information (if any) regarding how the Series voted proxies relating to portfolio securities during the most recently disclosed 12-month period ended June 30 is available without charge (i) through the
Delaware Investments Funds’ website at delawareinvestments.com/proxy; and (ii) on the Commission’s website at sec.gov.
|
| AR-VIPDIVINC[12/16]BNY21382(2/17)(18579) | Diversified Income Series-55 |
Table of Contents
Delaware VIP® Trust
|
Delaware VIP Emerging Markets Series
|
Annual report
|
December 31, 2016
|

Table of Contents

Neither Delaware Investments nor its affiliates referred to in this document are authorized deposit-taking institutions for the purposes of the Banking Act 1959 (Commonwealth of Australia). The obligations of these entities do not represent deposits or other liabilities of Macquarie Bank Limited (MBL), a subsidiary of Macquarie Group Limited and an affiliate of Delaware Investments. MBL does not guarantee or otherwise provide assurance in respect of the obligations of these entities, unless noted otherwise. The Series is governed by U.S. laws and regulations.
Unless otherwise noted, views expressed herein are current as of Dec. 31, 2016, and subject to change for events occurring after such date.
The Series is not FDIC insured and is not guaranteed. It is possible to lose the principal amount invested.
Mutual fund advisory services provided by Delaware Management Company, a series of Delaware Management Business Trust, which is a registered investment advisor and member of Macquarie Group. Delaware Investments, a member of Macquarie Group, refers to Delaware Management Holdings, Inc. and its subsidiaries, including the Series’ distributor, Delaware Distributors, L.P. Macquarie Group refers to Macquarie Group Limited and its subsidiaries and affiliates worldwide.
This material may be used in conjunction with the offering of shares in Delaware VIP Emerging Markets Series only if preceded or accompanied by the Series’ current prospectus or the summary prospectus.
© 2017 Delaware Management Holdings, Inc.
All third-party marks cited are the property of their respective owners.
Table of Contents
| Delaware VIP® Trust — Delaware VIP Emerging Markets Series | ||
| Portfolio management review | January 10, 2017 |
For the fiscal year ended Dec. 31, 2016, Delaware VIP Emerging Markets Series returned +13.93% for Standard Class shares and +13.68% for Service Class shares (both returns reflect reinvestment of all dividends). By comparison, the Series’ benchmark, the MSCI Emerging Markets Index, returned +11.60% (gross) and +11.19% (net) for the same period.
The Series’ fiscal year got off to a volatile start, plagued by pervasive concerns about the Chinese economy. Markets rebounded, however, as expectations moderated for further interest rate hikes in the United States, and the European Central Bank lowered interest rates and expanded its quantitative easing program. Depreciation of the U.S. dollar against many emerging market currencies, coupled with a rally in commodity prices, bolstered emerging market equity returns.
As the fiscal year progressed, the impeachment and removal of Brazil’s President Dilma Rousseff and the continued rebound in commodity prices drove performance higher. Concern about the economic outlook in China and Europe tempered these positives. The United Kingdom’s vote to leave the European Union had little effect on emerging market equities.
Emerging markets lost some momentum late in 2016 as the U.S. presidential election in November – that resulted in a surprise victory for Donald Trump – triggered a rise in U.S. bond yields and appreciation of the dollar. These developments negatively affected emerging market equities and currencies. Oil prices rose in the wake of an Organization of the Petroleum Exporting Countries (OPEC) agreement to cut production.
During the fiscal year, Brazil was the main contributor to the Series’ performance. Shares of Petrobras rose as the company executed on its plan to reduce debt through asset sales. Financial stocks including Itau Unibanco and Banco Santander Brasil posted strong returns buoyed by some signs of stabilization in the economy. Shares of Eletrobras rallied primarily due to expectations for improved operating performance following asset divestments and the appointment of new management.
In Russia, the Series’ overweight position was favorable, particularly in stocks such as Rosneft, Transneft, and Lukoil, which rose in sympathy with oil prices. In addition, the market responded positively to the partial sale of the Russian government’s stake in Rosneft to Glencore and the Qatari government. Sberbank of Russia rallied on improving sentiment toward Russia.
Elsewhere, the Series’ holdings in Argentina also contributed to performance. IRSA Inversiones y Representaciones outperformed after shares recovered from a large selloff in 2015 as investors believed the company’s acquisition in Israel could create value. Shares of Cresud rose on the back of improving investor sentiment toward the economy. Additionally, shares of Arcos Dorados Holdings rose due to improving quarterly results and recovering traffic in Brazil.
In contrast, in Mexico, the Series’ positions in Grupo Televisa and Femsa detracted from performance due to currency depreciation and concern that Donald Trump’s presidency may have a negative effect on Mexico’s economy. We believe that both companies appear well-positioned to benefit if long-term growth in consumption and income continues.
In China, underperformance primarily stemmed from the Series’ overweight position in the Internet sector. Shares of Sohu.com declined after the company disclosed that its online video business had further losses and funding requirements. Despite these concerns, we believe that the company’s overall portfolio of assets, particularly its search business, appears undervalued. Baidu underperformed as the company’s search advertising business remains subdued amid tighter regulations. We believe this slowdown is temporary, and we remain optimistic about the company’s potential for long-term growth. This underperformance was somewhat offset by SINA, which operates an online portal and owns a majority stake in Weibo, a leading Internet social-media platform. Shares of Weibo have risen as the company has shown progress in generating advertising revenue on its platform, and this in turn has boosted SINA’s valuation.
Elsewhere, in South Korea, shares of Samsung Electronics outperformed on expectations for improving shareholder return policies. However, the scandal surrounding Korea’s President Park raised questions about her relationship with large conglomerate groups, which appeared to affect sentiment toward stocks such as CJ Corp. We believe that the underlying franchises remain strong, the company is well-positioned if long-term consumption growth in South Korea and China continues, and valuations are, in our view, inexpensive. In India, shares of Reliance Industries declined in the second quarter as refining margins contracted, while the company’s launch of 4G telecom services was further delayed. Our conviction in this stock lies primarily in the company’s refining and petrochemical assets, which have some of the lowest costs globally. We do not believe that the stock’s valuation fully reflects the potential for growth coming from capacity expansions in these businesses.
Among sectors, financials contributed the most to performance mainly due to the Series’ positions in Itau Unibanco and Banco Santander Brasil and Sberbank of Russia. On the negative side, the technology sector detracted the most from performance due to Sohu.com and Baidu in China.
Despite a challenging macroeconomic backdrop, we believe that there are pockets of opportunities for long-term stock appreciation driven by structural demographic shifts, technology adoption, implementation of government policy, improvement in corporate governance, and industry consolidation. Our
Emerging Markets Series-1
Table of Contents
| Delaware VIP® Trust — Delaware VIP Emerging Markets Series | ||
| Portfolio management review (continued) |
investment approach remains centered on identifying individual companies that we believe possess sustainable franchises and favorable long-term growth prospects and that trade at significant discounts to our estimates of their intrinsic value. We are particularly focused on companies that we expect to benefit from long-term changes in how people in emerging markets live and work. Sectors we currently favor include technology and telecommunications.
| Unless otherwise noted, views expressed herein are current as of Dec. 31, 2016, and subject to change. | ||
| Emerging Markets Series-2 |
Table of Contents
Delaware VIP® Trust — Delaware VIP Emerging Markets Series
The performance quoted represents past performance and does not guarantee future results. Investment return and principal value of an investment will fluctuate so that shares, when redeemed, may be worth more or less than their original cost. Current performance may be lower or higher than the performance quoted.
Carefully consider the Series’ investment objectives, risk factors, charges, and expenses before investing. This and other information can be found in the Series’ prospectus and its summary prospectus, which may be obtained by calling 800 523-1918. Investors should read the prospectus and the summary prospectus carefully before investing.
| Delaware VIP Emerging Markets Series | ||||||||||||
| Average annual total returns | ||||||||||||
| For periods ended Dec. 31, 2016 | 1 year | 3 years | 5 years | 10 years | Lifetime | |||||||
Standard Class shares (commenced operations on May 1, 1997) | +13.93% | -3.61% | +2.45% | +2.54% | +6.68% | |||||||
|
|
|
|
|
| |||||||
|
|
|
|
|
| |||||||
Service Class shares (commenced operations on May 1, 2000) | +13.68% | -3.85% | +2.20% | +2.29% | +9.04% | |||||||
|
|
|
|
|
| |||||||
|
|
|
|
|
| |||||||
MSCI Emerging Markets Index (gross) | +11.60% | -2.19% | +1.64% | +2.17% | n/a | |||||||
|
|
|
|
|
| |||||||
|
|
|
|
|
| |||||||
MSCI Emerging Markets Index (net) | +11.19% | -2.55% | +1.28% | +1.84% | n/a | |||||||
Returns reflect the reinvestment of all distributions. Please see page 4 for a description of the index.
As described in the Series’ most recent prospectus, the net expense ratio for Service Class shares of the Series was 1.60%, while total operating expenses for Standard Class and Service Class shares were 1.37% and 1.67%, respectively. The management fee for Standard Class and Service Class shares was 1.25%. The Series’ investment manager, Delaware Management Company (Manager), has contractually agreed to waive all or a portion of its investment advisory fees and/or pay/reimburse expenses (excluding any 12b-1 fees, acquired fund fees and expenses, taxes, interest, short sale and dividend interest expenses, brokerage fees, certain insurance costs, and nonroutine expenses or costs, including, but not limited to, those relating to reorganizations, litigation, conducting shareholder meetings, and liquidations) in order to prevent annual series operating expenses from exceeding 1.35% of the Series’ average daily net assets from April 29, 2016 through Dec. 31, 2016.* These waivers and reimbursements may only be terminated by agreement of the Manager and the Series.
The Series’ distributor has contracted to limit the 12b-1 fees for Service Class shares to no more than 0.25% of average daily net assets from Jan. 1, 2016 through Dec. 31, 2016.**
Earnings from a variable annuity or variable life investment compound tax-free until withdrawal, and as a result, no adjustments were made for income taxes.
Expense limitations were in effect for both classes during certain periods shown in the Series performance table above and in the Performance of a $10,000 Investment graph on the next page.
Performance data do not reflect insurance fees related to a variable annuity or variable life investment or the deferred sales charge that would apply to certain withdrawals of investments held for fewer than eight years. Performance shown here would have been reduced if such fees were included and the expense limitation removed. For more information about fees, consult your variable annuity or variable life prospectus.
Investments in variable products involve risk.
International investments entail risks not ordinarily associated with U.S. investments including fluctuation in currency values, differences in accounting principles, or economic or political instability in other nations. Investing in emerging markets can be riskier than investing in established foreign markets due to increased volatility and lower trading volume.
Investments in small and/or medium sized companies typically exhibit greater risk and higher volatility than larger, more established companies.
Please read both the contract and underlying prospectus for specific details regarding the product’s risk profile.
| * | The aggregate contractual waiver period covering this report is from April 29, 2016 through May 1, 2017. Prior to April 29, 2016 there was no waiver for the Series. |
| ** | The aggregate contractual waiver period covering this report is from April 29, 2015 through May 1, 2017. |
Emerging Markets Series-3
Table of Contents
Delaware VIP® Emerging Markets Series
Performance summary (continued)
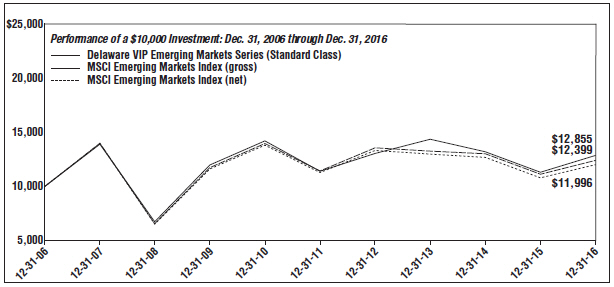
| For period beginning Dec. 31, 2006 through Dec. 31, 2016 | Starting value | Ending value | ||
— Delaware VIP Emerging Markets Series (Standard Class) | $10,000 | $12,855 | ||
––MSCI Emerging Markets Index (gross) | $10,000 | $12,399 | ||
---MSCI Emerging Markets Index (net) | $10,000 | $11,996 |
The graph shows a $10,000 investment in the Delaware VIP Emerging Markets Series Standard Class shares for the period from Dec. 31, 2006 through Dec. 31, 2016.
The graph also shows $10,000 invested in the MSCI Emerging Markets Index for the period from Dec. 31, 2006 through Dec. 31, 2016. The MSCI Emerging Markets Index measures equity market performance across emerging market countries worldwide. Index “gross” return approximates the maximum possible dividend reinvestment. Index “net” return approximates the minimum possible dividend reinvestment, after deduction of withholding tax at the highest possible rate.
Index performance returns do not reflect any management fees, transaction costs or expenses. Indices are unmanaged and one cannot invest directly in an index.
Performance of Service Class shares will vary due to different charges and expenses.
Past performance is not a guarantee of future results.
| Emerging Markets Series-4 |
Table of Contents
Delaware VIP® Trust — Delaware VIP Emerging Markets Series
For the six-month period from July 1, 2016 to December 31, 2016 (Unaudited)
As a shareholder of the Series, you incur ongoing costs, which may include management fees; distribution and/or service (12b-1) fees; and other Series expenses. This Example is intended to help you understand your ongoing costs (in dollars) of investing in the Series and to compare these costs with the ongoing costs of investing in other mutual funds.
The Example is based on an investment of $1,000 invested at the beginning of the period and held for the entire six-month period from July 1, 2016 to Dec. 31, 2016.
Actual expenses
The first section of the table shown, “Actual Series Return,” provides information about actual account values and actual expenses. You may use the information in this section of the table, together with the amount you invested, to estimate the expenses that you paid over the period. Simply divide your account value by $1,000 (for example, an $8,600 account value divided by $1,000 = 8.6), then multiply the result by the number in the first section under the heading entitled “Expenses Paid During Period” to estimate the expenses you paid on your account during the period.
Hypothetical example for comparison purposes
The second section of the table shown, “Hypothetical 5% Return,” provides information about hypothetical account values and hypothetical expenses based on the Series’ actual expense ratio and an assumed rate of return of 5% per year before expenses, which is not the Series’ actual return. The hypothetical account values and expenses may not be used to estimate the actual ending account balance or expenses you paid for the period. You may use this information to compare the ongoing costs of investing in the Series and other funds. To do so, compare this 5% hypothetical example with the 5% hypothetical examples that appear in the shareholder reports of other funds.
Please note that the expenses shown in the table are meant to highlight your ongoing costs only. As a shareholder of the Series, you do not incur any transaction costs, such as sales charges (loads), redemption fees or exchange fees, but shareholders of other funds may incur such costs. Also, the fees related to the variable annuity investment or the deferred sales charge that could apply have not been included. Therefore, the second section of the table is useful in comparing ongoing costs only, and will not help you determine the relative total costs of owning different funds. The Series’ actual expenses shown in the table reflect fee waivers in effect for Service Class shares. The expenses shown in the table assume reinvestment of all dividends and distributions.
Expense analysis of an investment of $1,000
| Beginning Account Value 7/1/16 | Ending Account Value 12/31/16 | Annualized Expense Ratio | Expenses Paid During Period 7/1/16 to 12/31/16* | |||||||||
Actual Series return† | ||||||||||||
Standard Class | $1,000.00 | $ | 1,070.40 | 1.35% | $7.03 | |||||||
Service Class | 1,000.00 | 1,068.70 | 1.60% | 8.32 | ||||||||
Hypothetical 5% return (5% return before expenses) | ||||||||||||
Standard Class | $1,000.00 | $ | 1,018.35 | 1.35% | $6.85 | |||||||
Service Class | 1,000.00 | 1,017.09 | 1.60% | 8.11 | ||||||||
| * | “Expenses Paid During Period” are equal to the Series’ annualized expense ratio, multiplied by the average account value over the period, multiplied by 184/366 (to reflect the one-half year period). |
| † | Because actual returns reflect only the most recent six-month period, the returns shown may differ significantly from fiscal year returns. |
| Emerging Markets Series-5 |
Table of Contents
Delaware VIP® Trust — Delaware VIP Emerging Markets Series
Security type / country and sector allocations
As of December 31, 2016 (Unaudited)
Sector designations may be different than the sector designations presented in other Series materials. The sector designations may represent the investment manager’s internal sector classifications.
| Security type / country | Percentage of net assets | |||
| ||||
Common Stock by Country | 92.29% | |||
| ||||
Argentina | 4.76% | |||
Bahrain | 0.08% | |||
Brazil | 13.58% | |||
Chile | 0.85% | |||
China/Hong Kong | 22.19% | |||
France | 1.59% | |||
India | 6.09% | |||
Indonesia | 0.41% | |||
Malaysia | 1.14% | |||
Mexico | 5.46% | |||
Peru | 0.28% | |||
Poland | 0.03% | |||
Republic of Korea | 16.58% | |||
Russia | 7.00% | |||
South Africa | 1.67% | |||
Taiwan | 7.07% | |||
Thailand | 0.89% | |||
Turkey | 0.83% | |||
United Kingdom | 0.35% | |||
United States | 1.44% | |||
| ||||
Exchange-Traded Fund | 1.53% | |||
| ||||
Preferred Stock by Country | 7.51% | |||
| ||||
Brazil | 2.36% | |||
Republic of Korea | 2.68% | |||
Russia | 2.47% | |||
| ||||
Participation Notes | 0.00% | |||
| ||||
Total Value of Securities | 101.33% | |||
| ||||
Liabilities Net of Receivables and Other Assets | (1.33%) | |||
| ||||
Total Net Assets | 100.00% | |||
| ||||
Common stock, preferred stock, participation notes and rights by | Percentage of net assets | |||
| ||||
Consumer Discretionary | 8.56% | |||
Consumer Staples | 9.24% | |||
Energy | 15.32% | |||
Financials | 9.99% | |||
Healthcare | 1.59% | |||
Industrials | 3.34% | |||
Information Technology* | 30.78% | |||
Materials | 5.97% | |||
Real Estate | 2.81% | |||
Telecommunication Services | 11.79% | |||
Utilities | 1.94% | |||
| ||||
Total | 101.33% | |||
| ||||
à Narrow industries are utilized for compliance purposes for diversification whereas broad sectors are used for financial reporting.
* To monitor compliance with the Series’ concentration guidelines, the Information Technology sector (as disclosed herein for financial reporting purposes) is divided into various sub-categories or “industries,” in this case, Internet, semiconductors, and software. As of Dec. 31, 2016, such amounts, as a percentage of total net assets, were 16.16%, 12.10%, and 2.52%, respectively. The percentage in any such single industry will comply with the Series’ concentration policy even if the percentage in the “Information Technology sector” for financial reporting purposes may exceed 25%.
| Emerging Markets Series-6 |
Table of Contents
Delaware VIP® Trust — Delaware VIP Emerging Markets Series
December 31, 2016
Number of shares | Value (U.S. $) | |||||||
Common Stock – 92.29% D | ||||||||
| Argentina – 4.76% | ||||||||
Arcos Dorados Holdings Class A † | 449,841 | $ | 2,429,141 | |||||
Cresud ADR † | 328,977 | 5,187,967 | ||||||
Grupo Clarin Class B GDR 144A # | 209,100 | 5,283,978 | ||||||
IRSA Inversiones y Representaciones ADR † | 430,000 | 7,929,200 | ||||||
Pampa Energia ADR † | 44,500 | 1,549,045 | ||||||
YPF ADR | 106,800 | 1,762,200 | ||||||
|
| |||||||
| 24,141,531 | ||||||||
|
| |||||||
| Bahrain – 0.08% | ||||||||
Aluminum Bahrain BCS GDR 144A # | 91,200 | 387,007 | ||||||
|
| |||||||
| 387,007 | ||||||||
|
| |||||||
| Brazil – 13.58% | ||||||||
Aes Tiete Energia | 330,193 | 1,420,316 | ||||||
B2W Cia Digital † | 1,927,799 | 6,041,586 | ||||||
Banco Bradesco ADR | 660,000 | 5,748,600 | ||||||
Banco Santander Brasil ADR | 235,000 | 2,089,150 | ||||||
Braskem ADR | 78,499 | 1,664,964 | ||||||
BRF ADR | 341,500 | 5,040,540 | ||||||
Centrais Eletricas | 711,800 | 4,988,527 | ||||||
Cia Brasileira de Distribuicao ADR | 395,790 | 6,550,326 | ||||||
Cia Hering | 514,500 | 2,390,156 | ||||||
Cyrela Brazil Realty Empreendimentos e Participacoes | 266,900 | 842,186 | ||||||
Gerdau | 389,400 | 945,175 | ||||||
Gerdau ADR | 444,900 | 1,396,986 | ||||||
Hypermarcas | 553,000 | 4,439,700 | ||||||
Itau Unibanco Holding ADR | 732,050 | 7,525,474 | ||||||
JBS | 393,784 | 1,379,278 | ||||||
Petroleo Brasileiro ADR † | 488,906 | 4,942,840 | ||||||
Rumo Logistica Operadora Multimodal † | 166,548 | 314,193 | ||||||
Telefonica Brasil ADR | 392,181 | 5,247,382 | ||||||
TIM Participacoes ADR | 500,000 | 5,900,000 | ||||||
|
| |||||||
| 68,867,379 | ||||||||
|
| |||||||
| Chile – 0.85% | ||||||||
Sociedad Quimica y Minera de Chile ADR | 150,000 | 4,297,500 | ||||||
|
| |||||||
| 4,297,500 | ||||||||
|
| |||||||
| China/Hong Kong – 22.19% | ||||||||
Alibaba Group Holding ADR † | 75,000 | 6,585,750 | ||||||
Baidu ADR † | 130,000 | 21,373,300 | ||||||
China Mengniu Dairy | 1,448,000 | 2,776,473 | ||||||
China Mobile ADR | 200,000 | 10,486,000 | ||||||
China Petroleum & Chemical | 2,260,000 | 1,591,645 | ||||||
China Petroleum & Chemical ADR | 42,234 | 2,999,459 | ||||||
Ctrip.com International ADR † | 319,400 | 12,776,000 | ||||||
First Pacific | 3,185,195 | 2,222,001 | ||||||
JD.com ADR † | 91,700 | 2,332,848 | ||||||
Kunlun Energy | 4,622,900 | 3,444,256 | ||||||
PetroChina Class H | 3,000,000 | 2,228,038 | ||||||
Qunar Cayman Islands | 42,500 | 1,280,525 | ||||||
SINA † | 200,000 | 12,158,000 | ||||||
Number of shares | Value (U.S. $) | |||||||
Common Stock D (continued) |
| |||||||
| China/Hong Kong (continued) | ||||||||
Sohu.com † | 491,279 | $ | 16,649,445 | |||||
Tencent Holdings | 412,500 | 10,001,935 | ||||||
Tianjin Development Holdings | 35,950 | 18,806 | ||||||
Tingyi Cayman Islands Holding | 1,706,000 | 2,068,231 | ||||||
Weibo ADR † | 20,000 | 812,000 | ||||||
ZTO Express Cayman | 62,100 | 749,547 | ||||||
|
| |||||||
| 112,554,259 | ||||||||
|
| |||||||
| France – 1.59% | ||||||||
Sanofi ADR | 200,000 | 8,088,000 | ||||||
|
| |||||||
| 8,088,000 | ||||||||
|
| |||||||
| India – 6.09% | ||||||||
Cairn India | 473,000 | 1,680,191 | ||||||
Indiabulls Real Estate | 44,628 | 46,831 | ||||||
Makemytrip † | 100,000 | 2,220,000 | ||||||
RattanIndia Infrastructure GDR =† | 131,652 | 5,819 | ||||||
Reliance Communications † | 1,194,362 | 596,856 | ||||||
Reliance Industries | 800,000 | 12,725,426 | ||||||
Reliance Industries GDR 144A # | 430,000 | 13,566,500 | ||||||
Sify Technologies ADR | 91,200 | 66,576 | ||||||
|
| |||||||
| 30,908,199 | ||||||||
|
| |||||||
| Indonesia – 0.41% | ||||||||
Tambang Batubara Bukit Asam Persero | 2,241,097 | 2,066,882 | ||||||
|
| |||||||
| 2,066,882 | ||||||||
|
| |||||||
| Malaysia – 1.14% | ||||||||
Hong Leong Bank | 1,549,790 | 4,653,154 | ||||||
UEM Sunrise | 4,748,132 | 1,107,250 | ||||||
|
| |||||||
| 5,760,404 | ||||||||
|
| |||||||
| Mexico – 5.46% | ||||||||
America Movil Class L ADR | 213,290 | 2,681,053 | ||||||
Cemex ADR † | 486,720 | 3,908,362 | ||||||
Fomento Economico Mexicano ADR | 98,307 | 7,491,976 | ||||||
Grupo Financiero Banorte Class O | 754,700 | 3,717,133 | ||||||
Grupo Lala | 606,200 | 881,681 | ||||||
Grupo Televisa ADR | 432,500 | 9,034,925 | ||||||
|
| |||||||
| 27,715,130 | ||||||||
|
| |||||||
| Peru – 0.28% | ||||||||
Cia de Minas Buenaventura ADR | 125,440 | 1,414,963 | ||||||
|
| |||||||
| 1,414,963 | ||||||||
|
| |||||||
| Poland – 0.03% | ||||||||
Jastrzebska Spolka Weglowa † | 9,501 | 151,892 | ||||||
|
| |||||||
| 151,892 | ||||||||
|
| |||||||
| Republic of Korea – 16.58% | ||||||||
CJ | 45,695 | 7,066,166 | ||||||
Hite Jinro | 150,000 | 2,618,910 | ||||||
KB Financial Group ADR | 134,209 | 4,736,236 | ||||||
KCC | 3,272 | 972,423 | ||||||
LG Display ADR | 188,309 | 2,419,771 | ||||||
LG Electronics | 62,908 | 2,685,693 | ||||||
LG Uplus | 500,000 | 4,738,949 | ||||||
Lotte Chilsung Beverage | 8 | 9,676 | ||||||
Emerging Markets Series-7
Table of Contents
Delaware VIP® Emerging Markets Series
Schedule of investments (continued)
Number of shares | Value (U.S. $) | |||||||
Common Stock D (continued) |
| |||||||
| Republic of Korea (continued) | ||||||||
Lotte Confectionery | 29,040 | $ | 4,290,089 | |||||
Samsung Electronics | 19,654 | 29,251,306 | ||||||
Samsung Life Insurance | 71,180 | 6,625,106 | ||||||
Samsung SDI | 17,625 | 1,586,662 | ||||||
SK Communications † | 95,525 | 219,870 | ||||||
SK Telecom | 16,491 | 3,056,459 | ||||||
SK Telecom ADR | 660,000 | 13,794,000 | ||||||
|
| |||||||
| 84,071,316 | ||||||||
|
| |||||||
| Russia – 7.00% | ||||||||
Chelyabinsk Zinc Plant | 69,200 | 740,246 | ||||||
Enel OGK-5 GDR † | 15,101 | 12,295 | ||||||
Etalon Group GDR 144A #= | 354,800 | 1,133,586 | ||||||
Gazprom ADR | 783,900 | 3,954,894 | ||||||
LUKOIL ADR (London International Exchange) | 133,500 | 7,478,082 | ||||||
MegaFon GDR | 234,178 | 2,212,982 | ||||||
Mobile TeleSystems ADR | 154,402 | 1,406,602 | ||||||
Sberbank of Russia = | 3,308,402 | 9,343,559 | ||||||
Surgutneftegas ADR | 294,652 | 1,485,440 | ||||||
T Plus =† | 25,634 | 0 | ||||||
VimpelCom ADR | 963,900 | 3,711,015 | ||||||
Yandex Class A † | 200,000 | 4,026,000 | ||||||
|
| |||||||
| 35,504,701 | ||||||||
|
| |||||||
| South Africa – 1.67% | ||||||||
ArcelorMittal South Africa † | 374,610 | 313,681 | ||||||
Impala Platinum Holdings † | 135,751 | 417,672 | ||||||
Sun International | 168,124 | 1,061,818 | ||||||
Tongaat-Hulett | 182,915 | 1,741,946 | ||||||
Vodacom Group | 444,868 | 4,928,448 | ||||||
|
| |||||||
| 8,463,565 | ||||||||
|
| |||||||
| Taiwan – 7.07% | ||||||||
Formosa Chemicals & Fibre | 2,128,998 | 6,340,460 | ||||||
Hon Hai Precision Industry | 1,105,707 | 2,876,041 | ||||||
MediaTek | 1,045,000 | 6,981,376 | ||||||
President Chain Store | 890,000 | 6,361,928 | ||||||
Taiwan Semiconductor Manufacturing | 2,375,864 | 13,307,822 | ||||||
|
| |||||||
| 35,867,627 | ||||||||
|
| |||||||
| Thailand – 0.89% | ||||||||
Bangkok Bank-Foreign | 638,091 | 2,868,292 | ||||||
PTT Exploration & Production – Foreign | 617,051 | 1,658,484 | ||||||
|
| |||||||
| 4,526,776 | ||||||||
|
| |||||||
| Turkey – 0.83% | ||||||||
Turkcell Iletisim Hizmetleri † | 368,462 | 1,017,399 | ||||||
Turkiye Sise ve Cam Fabrikalari | 2,955,292 | 3,204,366 | ||||||
|
| |||||||
| 4,221,765 | ||||||||
|
| |||||||
| United Kingdom – 0.35% | ||||||||
Anglo American ADR † | 92,815 | 654,346 | ||||||
Griffin Mining † | 1,642,873 | 1,098,438 | ||||||
|
| |||||||
| 1,752,784 | ||||||||
|
| |||||||
Number of shares | Value (U.S. $) | |||||||
Common Stock D (continued) |
| |||||||
United States - 1.44% | ||||||||
Avon Products † | 241,200 | $ | 1,215,648 | |||||
Yahoo † | 157,300 | 6,082,791 | ||||||
|
| |||||||
| 7,298,439 | ||||||||
|
| |||||||
Total Common Stock (cost $513,202,758) | 468,060,119 | |||||||
|
| |||||||
Exchange-Traded Fund – 1.53% |
| |||||||
iShares MSCI Turkey | 240,000 | 7,792,800 | ||||||
|
| |||||||
Total Exchange-Traded Fund (cost $10,144,639) | 7,792,800 | |||||||
|
| |||||||
Preferred Stock – 7.51% | ||||||||
Brazil – 2.36% | ||||||||
Braskem Class A 3.59% | 288,768 | 3,038,776 | ||||||
Centrais Eletricas Brasileiras Class B † | 233,700 | 1,859,002 | ||||||
Petroleo Brasileiro Class A ADR † | 403,795 | 3,557,434 | ||||||
Vale Class A † | 489,400 | 3,509,570 | ||||||
|
| |||||||
| 11,964,782 | ||||||||
|
| |||||||
Republic of Korea – 2.68% |
| |||||||
CJ 1.83% | 28,030 | 1,730,561 | ||||||
Samsung | 9,995 | 11,834,440 | ||||||
|
| |||||||
| 13,565,001 | ||||||||
|
| |||||||
Russia – 2.47% | ||||||||
AK Transneft =† | 3,887 | 12,542,695 | ||||||
|
| |||||||
| 12,542,695 | ||||||||
|
| |||||||
Total Preferred Stock (cost $28,454,111) | 38,072,478 | |||||||
|
| |||||||
| Emerging Markets Series-8 |
Table of Contents
Delaware VIP® Emerging Markets Series
Schedule of investments (continued)
Number of shares | Value (U.S. $) | |||||||
Participation Notes – 0.00% | ||||||||
Lehman Indian Oil CW 12 LEPO 144A #=† | 100,339 | $ | 0 | |||||
Lehman Oil & Natural Gas CW 12 LEPO =† | 146,971 | 0 | ||||||
|
| |||||||
Total Participation Notes | 0 | |||||||
|
| |||||||
Total Value of Securities – 101.33% | $ | 513,925,397 | ||||||
|
|
|
|
| # | Security exempt from registration under Rule 144A of the Securities Act of 1933, as amended. At Dec. 31, 2016, the aggregate value of Rule 144A securities was $20,371,071, which represents 4.02% of the Series’ net assets. See Note 11 in “Notes to financial statements.” |
| = | Security is being fair valued in accordance with the Series’ fair valuation policy. At Dec. 31, 2016, the aggregate value of fair valued securities was $23,025,659, which represents 4.54% of the Series’ net assets. See Note 1 in “Notes to financial statements.” |
| D | Securities have been classified by country of origin. Aggregate classification by business sectors has been presented on page 6 in “Security type / country and sector allocations.” |
| † | Non-income-producing security. |
Summary of Abbreviations:
ADR – American Depositary Receipt
GDR – Global Depositary Receipt
LEPO – Low Exercise Price Option
See accompanying notes, which are an integral part of the financial statements.
| Emerging Markets Series-9 |
Table of Contents
Delaware VIP® Trust — Delaware VIP Emerging Markets Series
Assets: | ||||
Investments, at value1 | $ | 513,925,397 | ||
Foreign currencies, at value2 | 1,289,853 | |||
Receivable for securities sold | 1,159,004 | |||
Dividends and interest receivable | 563,843 | |||
Receivable for series shares sold | 317,348 | |||
Foreign tax reclaims receivable | 50,697 | |||
|
| |||
Total assets | 517,306,142 | |||
|
| |||
Liabilities: | ||||
Cash due to custodian | 8,193,759 | |||
Payable for series shares redeemed | 319,015 | |||
Investment management fees payable | 521,048 | |||
Other accrued expenses | 256,941 | |||
Distribution fees payable to affiliates | 65,361 | |||
Dividend disbursing and transfer agent fees and expenses payable to affiliates | 3,196 | |||
Accounting and administration expenses payable to affiliates | 2,004 | |||
Trustees’ fees and expenses payable | 1,243 | |||
Legal fees payable to affiliates | 908 | |||
Reports and statements to shareholders payable to affiliates | 448 | |||
Deferred capital gains tax | 766,080 | |||
|
| |||
Total liabilities | 10,130,003 | |||
|
| |||
Total Net Assets | $ | 507,176,139 | ||
|
| |||
Net Assets Consist of: | ||||
Paid-in capital | $ | 561,191,506 | ||
Distributions in excess of net investment income | (1,316,393 | ) | ||
Accumulated net realized loss on investments | (9,028,123 | ) | ||
Net unrealized depreciation of investments | (43,594,388 | ) | ||
Net unrealized depreciation of foreign currencies | (76,463 | ) | ||
|
| |||
Total Net Assets | $ | 507,176,139 | ||
|
| |||
Standard Class: | ||||
Net assets | $ | 196,918,118 | ||
Shares of beneficial interest outstanding, unlimited authorization, no par | 10,978,210 | |||
Net asset value per share | $ | 17.94 | ||
Service Class: | ||||
Net assets | $ | 310,258,021 | ||
Shares of beneficial interest outstanding, unlimited authorization, no par | 17,352,900 | |||
Net asset value per share | $ | 17.88 | ||
| ||||
1 Investments, at cost | $ | 556,753,705 | ||
2 Foreign currencies, at cost | 1,366,748 | |||
See accompanying notes, which are an integral part of the financial statements.
Emerging Markets Series-10
Table of Contents
Delaware VIP® Trust —
Delaware VIP Emerging Markets Series
Year ended December 31, 2016
Investment Income: | ||||
Dividends | $ | 10,553,674 | ||
Interest | 171 | |||
Foreign tax withheld | (1,076,858 | ) | ||
|
| |||
| 9,476,987 | ||||
|
| |||
Expenses: | ||||
Management fees | 6,213,500 | |||
Distribution expenses - Service Class | 931,731 | |||
Custodian fees | 300,318 | |||
Accounting and administration expenses | 159,385 | |||
Reports and statements to shareholders | 67,184 | |||
Legal fees | 63,435 | |||
Audit and tax | 46,139 | |||
Dividend disbursing and transfer agent fees and expenses | 42,657 | |||
Trustees’ fees and expenses | 24,674 | |||
Registration fees | 634 | |||
Other | 22,448 | |||
|
| |||
| 7,872,105 | ||||
Less waived distribution expenses - Service Class | (155,122 | ) | ||
Less expenses waived | (146,069 | ) | ||
Less expense paid indirectly | (2 | ) | ||
|
| |||
Total operating expenses | 7,570,912 | |||
|
| |||
Net Investment Income | 1,906,075 | |||
|
| |||
Net Realized and Unrealized Gain (Loss): | ||||
Net realized gain (loss) on: | ||||
Investments | (8,174,813 | ) | ||
Foreign currencies | 259,620 | |||
Foreign currency exchange contracts | 192,163 | |||
|
| |||
Net realized loss | (7,723,030 | ) | ||
|
| |||
Net change in unrealized appreciation (depreciation) of: | ||||
Investments* | 72,060,893 | |||
Foreign currencies | (56,909 | ) | ||
Foreign currency exchange contracts | (5,788 | ) | ||
|
| |||
Net change in unrealized appreciation (depreciation) | 71,998,196 | |||
|
| |||
Net Realized and Unrealized Gain | 64,275,166 | |||
|
| |||
Net Increase in Net Assets Resulting from Operations | $ | 66,181,241 | ||
|
| |||
* Includes $645,677 increase in capital gains tax accrued.
Delaware VIP Trust —
Delaware VIP Emerging Markets Series
Statements of changes in net assets
| Year ended | ||||||||
| 12/31/16 | 12/31/15 | |||||||
Increase (Decrease) in Net Assets from Operations: |
| |||||||
Net investment income | $ | 1,906,075 | $ | 2,798,248 | ||||
Net realized gain (loss) | (7,723,030 | ) | 10,873,179 | |||||
Net change in unrealized appreciation (depreciation) | 71,998,196 | (92,838,362 | ) | |||||
|
|
|
| |||||
Net increase (decrease) in net assets resulting from operations | 66,181,241 | (79,166,935 | ) | |||||
|
|
|
| |||||
Dividends and Distributions to Shareholders from: | ||||||||
Net investment income: |
| |||||||
Standard Class | (2,030,270 | ) | (1,532,363 | ) | ||||
Service Class | (2,640,795 | ) | (2,026,629 | ) | ||||
Net realized gain: | ||||||||
Standard Class | (4,039,055 | ) | (3,597,723 | ) | ||||
Service Class | (6,943,628 | ) | (7,093,200 | ) | ||||
|
|
|
| |||||
| (15,653,748 | ) | (14,249,915 | ) | |||||
|
|
|
| |||||
Capital Share Transactions: | ||||||||
Proceeds from shares sold: |
| |||||||
Standard Class | 27,763,272 | 46,941,160 | ||||||
Service Class | 20,375,722 | 40,578,196 | ||||||
Net asset value of shares issued upon reinvestment of dividends and distributions: | ||||||||
Standard Class | 6,069,325 | 5,130,086 | ||||||
Service Class | 9,584,423 | 9,119,829 | ||||||
|
|
|
| |||||
| 63,792,742 | 101,769,271 | |||||||
|
|
|
| |||||
Cost of shares redeemed: | ||||||||
Standard Class | (28,056,005 | ) | (19,407,226 | ) | ||||
Service Class | (61,248,819 | ) | (41,453,614 | ) | ||||
|
|
|
| |||||
| (89,304,824 | ) | (60,860,840 | ) | |||||
|
|
|
| |||||
Increase (decrease) in net assets derived from capital share transactions | (25,512,082 | ) | 40,908,431 | |||||
|
|
|
| |||||
Net Increase (Decrease) in Net Assets | 25,015,411 | (52,508,419 | ) | |||||
Net Assets: | ||||||||
Beginning of year | 482,160,728 | 534,669,147 | ||||||
|
|
|
| |||||
End of year | $ | 507,176,139 | $ | 482,160,728 | ||||
|
|
|
| |||||
Undistributed (distributions in excess of) net investment income | $ | (1,316,393 | ) | $ | 1,020,895 | |||
|
|
|
| |||||
See accompanying notes, which are an integral part of the financial statements.
Emerging Markets Series-11
Table of Contents
Delaware VIP® Trust — Delaware VIP Emerging Markets Series
Selected data for each share of the Series outstanding throughout each period were as follows:
| Delaware VIP Emerging Markets Series Standard Class | ||||||||||||||||||||||||||||
| Year ended | ||||||||||||||||||||||||||||
| 12/31/16 | 12/31/15 | 12/31/14 | 12/31/13 | 12/31/12 | ||||||||||||||||||||||||
Net asset value, beginning of period | $ | 16.270 | $ | 19.540 | $ | 21.470 | $ | 19.840 | $ | 17.510 | ||||||||||||||||||
Income (loss) from investment operations: | ||||||||||||||||||||||||||||
Net investment income1 | 0.092 | 0.127 | 0.133 | 0.138 | 0.205 | |||||||||||||||||||||||
Net realized and unrealized gain (loss) | 2.143 | (2.858 | ) | (1.849 | ) | 1.839 | 2.316 | |||||||||||||||||||||
|
|
|
|
|
|
|
|
|
| |||||||||||||||||||
Total from investment operations | 2.235 | (2.731 | ) | (1.716 | ) | 1.977 | 2.521 | |||||||||||||||||||||
|
|
|
|
|
|
|
|
|
| |||||||||||||||||||
Less dividends and distributions from: | ||||||||||||||||||||||||||||
Net investment income | (0.189 | ) | (0.161 | ) | (0.135 | ) | (0.347 | ) | (0.191 | ) | ||||||||||||||||||
Net realized gain | (0.376 | ) | (0.378 | ) | (0.079 | ) | — | — | ||||||||||||||||||||
|
|
|
|
|
|
|
|
|
| |||||||||||||||||||
Total dividends and distributions | (0.565 | ) | (0.539 | ) | (0.214 | ) | (0.347 | ) | (0.191 | ) | ||||||||||||||||||
|
|
|
|
|
|
|
|
|
| |||||||||||||||||||
Net asset value, end of period | $ | 17.940 | $ | 16.270 | $ | 19.540 | $ | 21.470 | $ | 19.840 | ||||||||||||||||||
|
|
|
|
|
|
|
|
|
| |||||||||||||||||||
Total return2 | 13.93% | (14.51% | ) | (8.06% | ) | 10.14% | 14.44% | |||||||||||||||||||||
Ratios and supplemental data: | ||||||||||||||||||||||||||||
Net assets, end of period (000 omitted) | $ | 196,918 | $ | 172,098 | $ | 172,200 | $ | 175,134 | $ | 140,966 | ||||||||||||||||||
Ratio of expenses to average net assets | 1.37% | 1.37% | 1.38% | 1.41% | 1.40% | |||||||||||||||||||||||
Ratio of expenses to average net assets prior to fees waived | 1.40% | 1.37% | 1.38% | 1.41% | 1.40% | |||||||||||||||||||||||
Ratio of net investment income to average net assets | 0.53% | 0.70% | 0.62% | 0.68% | 1.11% | |||||||||||||||||||||||
Ratio of net investment income to average net assets prior to fees waived | 0.50% | 0.70% | 0.62% | 0.68% | 1.11% | |||||||||||||||||||||||
Portfolio turnover | 8% | 6% | 5% | 16% | 22% | |||||||||||||||||||||||
| 1 | The average shares outstanding method has been applied for per share information. |
| 2 | Total investment return is based on the change in net asset value of a share during the period and assumes reinvestment of dividends and distributions at net asset value. Total investment return during some of the periods shown reflects a waiver by the manager. Performance would have been lower had the waiver not been in effect. Total investment return does not include fees, charges, or expenses imposed by the variable annuity and life insurance contracts for which Delaware VIP Trust serves as an underlying investment vehicle. |
See accompanying notes, which are an integral part of the financial statements.
Emerging Markets Series-12
Table of Contents
Delaware VIP® Emerging Markets Series
Financial highlights (continued)
Selected data for each share of the Series outstanding throughout each period were as follows:
| Delaware VIP Emerging Markets Series Service Class | ||||||||||||||||||||||||||||
| Year ended | ||||||||||||||||||||||||||||
| 12/31/16 | 12/31/15 | 12/31/14 | 12/31/13 | 12/31/12 | ||||||||||||||||||||||||
Net asset value, beginning of period | $ | 16.210 | $ | 19.480 | $ | 21.400 | $ | 19.780 | $ | 17.450 | ||||||||||||||||||
Income (loss) from investment operations: | ||||||||||||||||||||||||||||
Net investment income1 | 0.049 | 0.081 | 0.079 | 0.087 | 0.158 | |||||||||||||||||||||||
Net realized and unrealized gain (loss) | 2.140 | (2.865 | ) | (1.836 | ) | 1.834 | 2.312 | |||||||||||||||||||||
|
|
|
|
|
|
|
|
|
| |||||||||||||||||||
Total from investment operations | 2.189 | (2.784 | ) | (1.757 | ) | 1.921 | 2.470 | |||||||||||||||||||||
|
|
|
|
|
|
|
|
|
| |||||||||||||||||||
Less dividends and distributions from: | ||||||||||||||||||||||||||||
Net investment income | (0.143 | ) | (0.108 | ) | (0.084 | ) | (0.301 | ) | (0.140 | ) | ||||||||||||||||||
Net realized gain | (0.376 | ) | (0.378 | ) | (0.079 | ) | — | — | ||||||||||||||||||||
|
|
|
|
|
|
|
|
|
| |||||||||||||||||||
Total dividends and distributions | (0.519 | ) | (0.486 | ) | (0.163 | ) | (0.301 | ) | (0.140 | ) | ||||||||||||||||||
|
|
|
|
|
|
|
|
|
| |||||||||||||||||||
Net asset value, end of period | $ | 17.880 | $ | 16.210 | $ | 19.480 | $ | 21.400 | $ | 19.780 | ||||||||||||||||||
|
|
|
|
|
|
|
|
|
| |||||||||||||||||||
Total return2 | 13.68% | (14.77% | ) | (8.26% | ) | 9.86% | 14.19% | |||||||||||||||||||||
Ratios and supplemental data: | ||||||||||||||||||||||||||||
Net assets, end of period (000 omitted) | $ | 310,258 | $ | 310,063 | $ | 362,469 | $ | 406,571 | $ | 389,349 | ||||||||||||||||||
Ratio of expenses to average net assets | 1.62% | 1.62% | 1.63% | 1.66% | 1.65% | |||||||||||||||||||||||
Ratio of expenses to average net assets prior to fees waived | 1.70% | 1.67% | 1.68% | 1.71% | 1.70% | |||||||||||||||||||||||
Ratio of net investment income to average net assets | 0.28% | 0.45% | 0.37% | 0.43% | 0.86% | |||||||||||||||||||||||
Ratio of net investment income to average net assets prior to fees waived | 0.20% | 0.40% | 0.32% | 0.38% | 0.81% | |||||||||||||||||||||||
Portfolio turnover | 8% | 6% | 5% | 16% | 22% | |||||||||||||||||||||||
| 1 | The average shares outstanding method has been applied for per share information. |
| 2 | Total investment return is based on the change in net asset value of a share during the period and assumes reinvestment of dividends and distributions at net asset value. Total investment return during all of the periods shown reflects waivers by the manager and/or distributor. Performance would have been lower had the waivers not been in effect. Total investment return does not include fees, charges, or expenses imposed by the variable annuity and life insurance contracts for which Delaware VIP Trust serves as an underlying investment vehicle. |
See accompanying notes, which are an integral part of the financial statements.
Emerging Markets Series-13
Table of Contents
Delaware VIP® Trust — Delaware VIP Emerging Markets Series
December 31, 2016
Delaware VIP Trust (Trust) is organized as a Delaware statutory trust and offers 10 series: Delaware VIP Diversified Income Series, Delaware VIP Emerging Markets Series, Delaware VIP High Yield Series, Delaware VIP International Value Equity Series, Delaware VIP Limited-Term Diversified Income Series, Delaware VIP REIT Series, Delaware VIP Small Cap Value Series, Delaware VIP Smid Cap Growth Series, Delaware VIP U.S. Growth Series, and Delaware VIP Value Series. These financial statements and the related notes pertain to Delaware VIP Emerging Markets Series (Series). The Trust is an open-end investment company. The Series is considered diversified under the Investment Company Act of 1940, as amended, and offers Standard Class and Service Class shares. The Standard Class shares do not carry a 12b-1 fee and the Service Class shares carry a 12b-1 fee. The shares of the Series are sold only to separate accounts of life insurance companies.
The investment objective of the Series is to seek long-term capital appreciation.
1. Significant Accounting Policies
The following accounting policies are in accordance with U.S. generally accepted accounting principles (U.S. GAAP) and are consistently followed by the Series.
Security Valuation — Equity securities and exchange-traded funds (ETFs), except those traded on the Nasdaq Stock Market LLC (Nasdaq), are valued at the last quoted sales price as of the time of the regular close of the New York Stock Exchange on the valuation date. Equity securities and ETFs traded on the Nasdaq are valued in accordance with the Nasdaq Official Closing Price, which may not be the last sales price. If, on a particular day, an equity security or ETF does not trade, the mean between the bid and ask prices will be used, which approximates fair value. Securities listed on a foreign exchange are normally valued at the last quoted sales price on the valuation date. U.S. government and agency securities are valued at the mean between the bid and ask prices, which approximates fair value. Foreign currency exchange contracts and foreign cross currency exchange contracts are valued at the mean between the bid and ask prices, which approximates fair value. Interpolated values are derived when the settlement date of the contract is an interim date for which quotations are not available. Generally, other securities and assets for which market quotations are not readily available are valued at fair value as determined in good faith under the direction of the Trust’s Board of Trustees (Board). In determining whether market quotations are readily available or fair valuation will be used, various factors will be taken into consideration, such as market closures or suspension of trading in a security. The Series may use fair value pricing more frequently for securities traded primarily in non-U.S. markets because, among other things, most foreign markets close well before the Series values its securities, generally as of 4:00 p.m. Eastern time. The earlier close of these foreign markets gives rise to the possibility that significant events, including broad market moves, government actions or pronouncements, aftermarket trading, or news events may have occurred in the interim. Whenever such a significant event occurs, the Series may value foreign securities using fair value prices based on third-party vendor modeling tools (international fair value pricing).
Federal and Foreign Income Taxes — No provision for federal income taxes has been made as the Series intends to continue to qualify for federal income tax purposes as a regulated investment company under Subchapter M of the Internal Revenue Code of 1986, as amended, and make the requisite distributions to shareholders. The Series evaluates tax positions taken or expected to be taken in the course of preparing the Series’ tax returns to determine whether the tax positions are “more-likely-than-not” of being sustained by the applicable tax authority. Tax positions not deemed to meet the “more-likely-than-not” threshold are recorded as a tax benefit or expense in the current year. Management has analyzed the Series’ tax positions taken for all open federal income tax years (Dec. 31, 2013–Dec. 31, 2016), and has concluded that no provision for federal income tax is required in the Series’ financial statements. In regard to foreign taxes only, the Series has open tax years in certain foreign countries in which it invests that may date back to the inception of the Series.
Class Accounting — Investment income, common expenses, and realized and unrealized gain (loss) on investments are allocated to the classes of the Series on the basis of daily net assets of each class. Distribution expenses relating to a specific class are charged directly to that class.
Repurchase Agreements — The Series may purchase certain U.S. government securities subject to the counterparty’s agreement to repurchase them at an agreed upon date and price. The counterparty will be required on a daily basis to maintain the value of the collateral subject to the agreement at not less than the repurchase price (including accrued interest). The agreements are conditioned upon the collateral being deposited under the Federal Reserve book-entry system with the Series’ custodian or a third party sub-custodian. In the event of default or bankruptcy by the other party to the agreement, retention of the collateral may be subject to legal proceedings. At Dec. 31, 2016, the Series had no open repurchase agreements.
Foreign Currency Transactions — Transactions denominated in foreign currencies are recorded at the prevailing exchange rates on the valuation date in accordance with the Series’ prospectus. The value of all assets and liabilities denominated in foreign currencies is translated daily into U.S. dollars at the exchange rate of such currencies against the U.S. dollar. Transaction gains or losses resulting from changes in exchange rates during the reporting period or upon settlement of the foreign currency transaction are reported in operations for the current period. The Series generally does not bifurcate that portion of realized gains and losses on investments which is due to changes in foreign exchange rates from that which is due to changes in market prices. The realized gains and losses are included on the “Statement of operations” under “Net realized and unrealized gain (loss) on investments.” The Series reports certain foreign currency related transactions as components of realized gains (losses) for financial reporting purposes, whereas such components are treated as ordinary income (loss) for federal income tax purposes.
Use of Estimates — The Series is an investment company, whose financial statements are prepared in conformity with U.S. GAAP. Therefore, the Series follows the accounting and reporting guidelines for investment companies. The preparation of financial statements in conformity with U.S. GAAP requires management to make estimates and assumptions that affect the fair value of investments, the reported amounts of assets and liabilities and disclosure of contingent assets and liabilities at the date of the financial statements, and the reported amounts of revenues and expenses during the reporting period. Actual results could differ from those estimates and the differences could be material.
Emerging Markets Series-14
Table of Contents
Delaware VIP® Emerging Markets Series
Notes to financial statements (continued)
1. Significant Accounting Policies (continued)
Other — Expenses directly attributable to the Series are charged directly to the Series. Other expenses common to various funds within the Delaware Investments® Family of Funds are generally allocated among such funds on the basis of average net assets. Management fees and certain other expenses are paid monthly. Security transactions are recorded on the date the securities are purchased or sold (trade date) for financial reporting purposes. Costs used in calculating realized gains and losses on the sale of investment securities are those of the specific securities sold. Dividend income is recorded on the ex-dividend date and interest income is recorded on the accrual basis. Taxable non-cash dividends are recorded as dividend income. Foreign dividends are also recorded on the ex-dividend date or as soon after the ex-dividend date that the Series is aware of such dividends, net of all tax withholdings, a portion of which may be reclaimable. Withholding taxes and reclaims on foreign dividends have been recorded in accordance with the Series’ understanding of the applicable country’s tax rules and rates. The Series may pay foreign capital gains taxes on certain foreign securities held, which are reported as components of realized losses for financial reporting purposes, whereas such components are treated as ordinary loss for federal income tax purposes.
The Series declares and pays dividends from net investment income and distributions from net realized gain on investments, if any, following the close of the fiscal year. The Series may distribute more frequently, if necessary for tax purposes. Dividends and distributions, if any, are recorded on the ex-dividend date.
The Series may receive earnings credits from its custodian when positive cash balances are maintained, which may be used to offset custody fees. There were no such earnings credits for the year ended Dec. 31, 2016.
The Series may receive earnings credits from its transfer agent when positive cash balances are maintained, which may be used to offset transfer agent fees. If the amount earned is greater than $1.00, the expense paid under this arrangement is included on the “Statement of operations” under “Dividend disbursing and transfer agent fees and expenses” with the corresponding expense offset shown under “Less expense paid indirectly.” For the year ended Dec. 31, 2016, the Series earned $2 under this agreement.
During the year ended Dec. 31, 2016, the Series frequently maintained a negative cash balance with its custodian, which is considered a form of borrowing or leverage. If the Series maintains a negative cash balance and the Series’ investments decrease in value, the Series’ losses will be greater than if the Series did not maintain a negative cash balance. The Series is required to pay interest to the custodian on negative cash balances. During the year ended Dec. 31, 2016, the Series had an average outstanding overdraft balance equal to 3.20% of its average net assets for which it was charged interest of $49,140, which is included on the “Statement of operations” under “Custodian fees.” The average borrowing rate charged on the overdraft was 0.62%.
2. Investment Management, Administration Agreements, and Other Transactions with Affiliates
In accordance with the terms of its investment management agreement, the Series pays Delaware Management Company (DMC), a series of Delaware Management Business Trust and the investment manager, an annual fee which is calculated daily at the rate of 1.25% on the first $500 million of average daily net assets of the Series, 1.20% on the next $500 million, 1.15% on the next $1.5 billion, and 1.10% on average daily net assets in excess of $2.5 billion.
DMC has contractually agreed to waive that portion, if any, of its management fee and reimburse the Series to the extent necessary to ensure that annual operating expenses (excluding any 12b-1 fees, taxes, interest, short sale dividend and interest expenses, acquired fund fees and expenses, brokerage fees, certain insurance costs, and nonroutine expenses or costs, including, but not limited to, those relating to reorganizations, litigation, conducting shareholder meetings, and liquidations), do not exceed 1.35% of the Series’ average daily net assets from April 29, 2016 through Dec. 31, 2016.* Prior to April 29, 2016, the Series’ had no management fee waiver. These expense waivers and reimbursements may only be terminated by agreement of DMC and the Series.
Delaware Investments Fund Services Company (DIFSC), an affiliate of DMC, provides fund accounting and financial administration oversight services to the Series. For these services, DIFSC’s fees are calculated based on the aggregate daily net assets of the Delaware Investments Family of Funds at the following annual rate: 0.0050% of the first $30 billion; 0.0045% of the next $10 billion; 0.0040% of the next $10 billion; and 0.0025% of aggregate average daily net assets in excess of $50 billion. The fees payable to DIFSC under the service agreement described above are allocated among all funds in the Delaware Investments Family of Funds on a relative net asset value basis. This amount is included on the “Statement of operations” under “Accounting and administration expenses.” For the year ended Dec. 31, 2016, the Series was charged $23,539 for these services.
DIFSC is also the transfer agent and dividend disbursing agent of the Series. For these services, DIFSC’s fees are calculated at the annual rate of 0.0075% of the Series’ average daily net assets. This amount is included on the “Statement of operations” under “Dividend disbursing and transfer agent fees and expenses.” For the year ended Dec. 31, 2016, the Series was charged $37,312 for these services. Pursuant to a sub-transfer agency agreement between DIFSC and BNY Mellon Investment Servicing (US) Inc. (BNYMIS), BNYMIS provides certain sub-transfer agency services to the Series. Sub-transfer agency fees are paid directly by the Series and are also included on the “Statement of operations” under “Dividend disbursing and transfer agent fees and expenses.”
Pursuant to a distribution agreement and distribution plan, the Series pays Delaware Distributors, L.P. (DDLP), the distributor and an affiliate of DMC, an annual distribution and service fee of 0.30% of the average daily net assets of the Service Class shares. DDLP has contracted to waive distribution and service fees from Jan. 1, 2016 through Dec. 31, 2016** in order to limit distribution and service fees of the Service Class shares to 0.25% of average daily net assets. Standard Class shares pay no distribution and service expenses.
Emerging Markets Series-15
Table of Contents
Delaware VIP® Emerging Markets Series
Notes to financial statements (continued)
2. Investment Management, Administration Agreements, and Other Transactions with Affiliates (continued)
As provided in the investment management agreement, the Series bears a portion of the cost of resources shared with DMC, including the cost of internal personnel of DMC and/or its affiliates that provide legal, tax, and regulatory reporting services to the Series. These amounts are included on the “Statement of operations” under “Legal fees.” For the year ended Dec. 31, 2016, the Series was charged $10,465 for internal legal, tax, and regulatory reporting services provided by DMC and/or its affiliates’ employees.
Trustees’ fees include expenses accrued by the Series for each Trustee’s retainer and meeting fees. Certain officers of DMC, DIFSC, and DDLP are officers and/or Trustees of the Trust. These officers and Trustees are paid no compensation by the Series.
* The aggregate contractual waiver period covering this report is from April 29, 2016 through May 1, 2017.
**The aggregate contractual waiver period covering this report is from April 29, 2015 through May 1, 2017.
3. Investments
For the year ended Dec. 31, 2016, the Series made purchases and sales of investment securities other than short-term investments as follows:
Purchases | $ | 38,644,262 | ||
Sales | 77,502,811 |
At Dec. 31, 2016, the cost of investments and unrealized appreciation (depreciation) for federal income tax purposes for the Series were as follows:
Cost of | Aggregate Unrealized Appreciation of Investments | Aggregate Unrealized Depreciation of Investments | Net Unrealized Depreciation of Investments | |||||||||||
$561,608,871 | $112,470,397 | $(160,153,871) | $(47,683,474) |
U.S.GAAP defines fair value as the price that the Series would receive to sell an asset or pay to transfer a liability in an orderly transaction between market participants at the measurement date under current market conditions. A three-level hierarchy for fair value measurements has been established based upon the transparency of inputs to the valuation of an asset or liability. Inputs may be observable or unobservable and refer broadly to the assumptions that market participants would use in pricing the asset or liability. Observable inputs reflect the assumptions that market participants would use in pricing the asset or liability based on market data obtained from sources independent of the reporting entity. Unobservable inputs reflect the reporting entity’s own assumptions about the assumptions that market participants would use in pricing the asset or liability based on the best information available under the circumstances. The Series’ investment in its entirety is assigned a level based upon the observability of the inputs which are significant to the overall valuation. The three-level hierarchy of inputs is summarized below.
| Level 1 | – | Inputs are quoted prices in active markets for identical investments. (Examples: equity securities, open-end investment companies, futures contracts, exchange-traded options contracts) | ||
| Level 2 | – | Other observable inputs, including, but not limited to: quoted prices for similar assets or liabilities in markets that are active, quoted prices for identical or similar assets or liabilities in markets that are not active, inputs other than quoted prices that are observable for the assets or liabilities (such as interest rates, yield curves, volatilities, prepayment speeds, loss severities, credit risks, and default rates) or other market corroborated inputs. (Examples: debt securities, government securities, swap contracts, foreign currency exchange contracts, foreign securities utilizing international fair value pricing, broker-quoted securities, fair valued securities) | ||
| Level 3 | – | Significant unobservable inputs, including the Series’ own assumptions used to determine the fair value of investments. (Examples: broker-quoted securities, fair valued securities) |
Level 3 investments are valued using significant unobservable inputs. The Series may also use an income-based valuation approach in which the anticipated future cash flows of the investment are discounted to calculate fair value. Discounts may also be applied due to the nature or duration of any restrictions on the disposition of the investments. Valuations may also be based upon current market prices of securities that are comparable in coupon, rating, maturity, and industry. The derived value of a Level 3 investment may not represent the value which is received upon disposition and this could impact the results of operations.
Emerging Markets Series-16
Table of Contents
Delaware VIP® Emerging Markets Series
Notes to financial statements (continued)
3. Investments (continued)
The following table summarizes the valuation of the Series’ investments by fair value hierarchy levels as of Dec. 31, 2016:
| Securities | Level 1 | Level 2 | Level 3 | Total | ||||||||||||||||
Common Stock | ||||||||||||||||||||
Argentina | $18,857,553 | $5,283,978 | $— | $24,141,531 | ||||||||||||||||
Bahrain | — | 387,007 | — | 387,007 | ||||||||||||||||
Brazil | 68,867,379 | — | — | 68,867,379 | ||||||||||||||||
Chile | 4,297,500 | — | — | 4,297,500 | ||||||||||||||||
China/Hong Kong | 88,202,874 | 24,351,385 | — | 112,554,259 | ||||||||||||||||
France | 8,088,000 | — | — | 8,088,000 | ||||||||||||||||
India | 15,899,907 | 15,008,292 | — | 30,908,199 | ||||||||||||||||
Indonesia | — | 2,066,882 | — | 2,066,882 | ||||||||||||||||
Malaysia | — | 5,760,404 | — | 5,760,404 | ||||||||||||||||
Mexico | 27,715,130 | — | — | 27,715,130 | ||||||||||||||||
Peru | 1,414,963 | — | — | 1,414,963 | ||||||||||||||||
Poland | 151,892 | — | — | 151,892 | ||||||||||||||||
Republic of Korea | 21,169,877 | 62,901,439 | — | 84,071,316 | ||||||||||||||||
Russia | 12,096,845 | 23,407,856 | — | 35,504,701 | ||||||||||||||||
South Africa | 2,055,627 | 6,407,938 | — | 8,463,565 | ||||||||||||||||
Taiwan | — | 35,867,627 | — | 35,867,627 | ||||||||||||||||
Thailand | 1,658,484 | 2,868,292 | — | 4,526,776 | ||||||||||||||||
Turkey | — | 4,221,765 | — | 4,221,765 | ||||||||||||||||
United Kingdom | 1,752,784 | — | — | 1,752,784 | ||||||||||||||||
United States | 7,298,439 | — | — | 7,298,439 | ||||||||||||||||
Exchange-Traded Fund | 7,792,800 | — | — | 7,792,800 | ||||||||||||||||
Preferred Stock1 | 11,964,782 | 26,107,696 | — | 38,072,478 | ||||||||||||||||
Participation Notes | — | — | — | — | ||||||||||||||||
|
|
|
|
|
|
|
| |||||||||||||
Total Value of Securities | $299,284,836 | $214,640,561 | $— | $513,925,397 | ||||||||||||||||
|
|
|
|
|
|
|
| |||||||||||||
1Security type is valued across multiple levels. The amounts attributed to Level 1 investments and Level 2 investments represent 31.43% and 68.57%, respectively, of the total market value of this security type. Level 1 investments represent exchange traded investments and Level 2 investments represent investments with observable inputs.
As a result of utilizing international fair value pricing at Dec. 31, 2016, a portion of the common stock in the portfolio was categorized as Level 2.
The securities that have been valued at zero on the “Schedule of investments” are considered to be Level 3 investments.
During the year ended Dec. 31, 2016, there were no transfers between Level 1 investments, Level 2 investments, or Level 3 investments that had a significant impact to the Series. This does not include transfers between Level 1 investments and Level 2 investments due to the Series utilizing international fair value pricing during the period. In accordance with the fair valuation procedures described in Note 1, international fair value pricing of securities occurs when market volatility exceeds an established rolling threshold. If the threshold is exceeded on a given date, then prices of international securities (those that traded on exchanges that close at a different time than the time that the Series’ net asset value is determined) are established using a separate pricing feed from a third party vendor designed to establish a price for each such security as of the time that the Series’ net asset value is determined. Further, international fair value pricing uses other observable market-based inputs in place of the closing exchange price due to the events occurring after the close of the exchange or market on which the investment is principally traded, causing a change in classification between levels. The Series’ policy is to recognize transfers between levels at the beginning of the reporting period.
A reconciliation of Level 3 investments is presented when the Series has a significant amount of Level 3 investments at the beginning, interim, or end of the period in relation to net assets. Management has determined not to provide additional disclosure on Level 3 inputs since the Level 3 investments are not considered significant to the Series’ net assets at the end of the period.
Emerging Markets Series-17
Table of Contents
Delaware VIP® Emerging Markets Series
Notes to financial statements (continued)
4. Dividend and Distribution Information
Income and long-term capital gain distributions are determined in accordance with federal income tax regulations, which may differ from U.S. GAAP. Additionally, distributions from net gains on foreign currency transactions and net short-term gains on sales of investment securities are treated as ordinary income for federal income tax purposes. The tax character of dividends and distributions paid during the years ended Dec. 31, 2016 and 2015 was as follows:
Year ended 12/31/16 | Year ended 12/31/15 | |||||||
Ordinary income | $ | 4,695,146 | $ | 4,256,776 | ||||
Long-term capital gain | 10,958,602 | 9,993,139 | ||||||
|
|
|
| |||||
| $ | 15,653,748 | $ | 14,249,915 | |||||
|
|
|
| |||||
5. Components of Net Assets on a Tax Basis
As of Dec. 31, 2016, the components of net assets on a tax basis were as follows:
Shares of beneficial interest | $561,191,506 | |||
Undistributed ordinary income | 2,766,043 | |||
Capital loss carryforwards | (8,255,393 | ) | ||
Unrealized depreciation on investments, foreign currencies, and derivatives | (48,526,017 | ) | ||
|
| |||
Net assets | $507,176,139 | |||
|
|
The differences between book basis and tax basis components of net assets are primarily attributable to tax deferral of losses on wash sales and tax treatment of unrealized gain on investments in passive foreign investment companies.
For financial reporting purposes, capital accounts are adjusted to reflect the tax character of permanent book/tax differences. Reclassifications are primarily due to tax treatment of gain (loss) on foreign currency transactions and redesignation of dividends and distributions. Results of operations and net assets were not affected by these classification. For the year ended Dec. 31, 2016, the Series recorded the following reclassifications:
Distributions in Excess of Net Investment Income | Accumulated Net Realized Loss | |||
$427,702 |
$(427,702) |
Under the Regulated Investment Company Modernization Act of 2010 (Act), net capital losses for tax years beginning after Dec. 22, 2010 may be carried forward indefinitely, and their character is retained as short-term and/or long-term losses.
The Series has capital loss carryforwards available to offset future realized gains as follows:
Loss carryforward character
Short-term | Long-term | |||
| $— | $ | 8,255,393 | ||
Emerging Markets Series-18
Table of Contents
Delaware VIP® Emerging Markets Series
Notes to financial statements (continued)
6. Capital Shares
Transactions in capital shares were as follows:
Year ended 12/31/16 | Year ended 12/31/15 | |||||||
Shares sold: | ||||||||
Standard Class | 1,626,179 | 2,613,870 | ||||||
Service Class | 1,201,505 | 2,337,333 | ||||||
Shares issued upon reinvestment of dividends and distributions: | ||||||||
Standard Class | 357,439 | 254,848 | ||||||
Service Class | 565,453 | 453,722 | ||||||
|
|
|
| |||||
| 3,750,576 | 5,659,773 | |||||||
|
|
|
| |||||
Shares redeemed: | ||||||||
Standard Class | (1,584,591 | ) | (1,100,029 | ) | ||||
Service Class | (3,537,319 | ) | (2,275,226 | ) | ||||
|
|
|
| |||||
| (5,121,910 | ) | (3,375,255 | ) | |||||
|
|
|
| |||||
Net increase (decrease) | (1,371,334 | ) | 2,284,518 | |||||
|
|
|
| |||||
7. Line of Credit
The Series, along with certain other funds in the Delaware Investments® Family of Funds (Participants), was a participant in a $155,000,000 revolving line of credit intended to be used for temporary or emergency purposes as an additional source of liquidity to fund redemptions of investor shares. Under the agreement, the Participants were charged an annual commitment fee of 0.10%, which was allocated across the Participants on the basis of relative net assets of each Participant’s allocation of the entire facility. The Participants were permitted to borrow up to a maximum of one third of their net assets under the agreement. Each Participant was individually, and not jointly, liable for its particular advances, if any, under the line of credit. The line of credit available under the agreement expired on Nov. 7, 2016.
On Nov. 7, 2016, the Series, along with the other Participants, entered into an amendment to the agreement for a $155,000,000 revolving line of credit. The line of credit is to be used as described above and operates in substantially the same manner as the original agreement, with the exception of the annual commitment fee. Under the amendment to the agreement, the Participants are charged an annual commitment fee of 0.15%, which is allocated across the Participants on the basis of relative net assets of each Participant’s allocation of the entire facility. The line of credit available under the agreement expires on Nov. 6, 2017.
The Series had no amounts outstanding as of Dec. 31, 2016 or at any time during the year then ended.
8. Derivatives
U.S. GAAP requires disclosures that enable investors to understand: (1) how and why an entity uses derivatives; (2) how they are accounted for; and (3) how they affect an entity’s results of operations and financial position.
Foreign Currency Exchange Contracts
The Series may enter into foreign currency exchange contracts and foreign cross currency exchange contracts as a way of managing foreign exchange rate risk. The Series may enter into these contracts to fix the U.S. dollar value of a security that it has agreed to buy or sell for the period between the date the trade was entered into and the date the security is delivered and paid for. The Series may also use these contracts to hedge the U.S. dollar value of securities it already owns that are denominated in foreign currencies. In addition, the Series may enter into these contracts to facilitate or expedite the settlement of portfolio transactions. The change in value is recorded as an unrealized gain or loss. When the contract is closed, a realized gain or loss is recorded equal to the difference between the value of the contract at the time it was opened and the value at the time it was closed.
The use of foreign currency exchange contracts and foreign cross currency exchange contracts does not eliminate fluctuations in the underlying prices of the securities, but does establish a rate of exchange that can be achieved in the future. Although foreign currency exchange contracts and foreign cross currency exchange contracts limit the risk of loss due to an unfavorable change in the value of the hedged currency, they also limit any potential gain that might result should the value of the currency change favorably. In addition, the Series could be exposed to risks if the counterparties to the contracts are unable to meet the terms of their contracts. The Series’ maximum risk of loss from counterparty credit risk is the value of its currency exchanged with the counterparty. The risk is generally mitigated by having a netting arrangement between the Series and the counterparty and by the posting of collateral by the counterparty to the Series to cover the Series’ exposure to the counterparty.
During the year ended Dec. 31, 2016, the Series entered into foreign currency exchange contracts and foreign cross currency exchange contracts to facilitate or expedite the settlement of portfolio transactions.
Emerging Markets Series-19
Table of Contents
Delaware VIP® Emerging Markets Series
Notes to financial statements (continued)
8. Derivatives (continued)
At Dec. 31, 2016, the Series experienced net realized and unrealized gains or losses attributable to foreign currency holdings, which are disclosed as “Net realized gain on foreign currency exchange contracts” on the “Statement of operations.”
Derivatives Generally. The table below summarizes the average balance of derivative holdings by the Series during the year ended Dec. 31, 2016.
| Long Derivatives Volume | Short Derivatives Volume | |||
Foreign currency exchange contracts (average cost) | $5,614 | $137,448 |
9. Offsetting
In December 2011, the Financial Accounting Standards Board (FASB) issued guidance that expanded disclosure requirements on the offsetting of certain assets and liabilities. The disclosures are required for investments and derivative financial instruments subject to master netting or similar agreements which are eligible for offset on the “Statement of assets and liabilities” and requires an entity to disclose both gross and net information about such investments and transactions in the financial statements. In January 2013, the FASB issued guidance that clarified which investments and transactions are subject to the offsetting disclosure requirements. The scope of the disclosure requirements for offsetting is limited to derivative instruments, repurchase agreements and reverse repurchase agreements, and securities borrowing. The guidance is effective for financial statements with fiscal years beginning on or after Jan. 1, 2013, and interim periods within those fiscal years.
In order to better define its contractual rights and to secure rights that will help the Series mitigate its counterparty risk, the Series entered into an International Swaps and Derivatives Association, Inc. Master Agreement (ISDA Master Agreement) or a similar agreement with certain of their derivative contract counterparties. An ISDA Master Agreement is a bilateral agreement between the Series and a counterparty that governs over-the-counter (OTC) derivatives and foreign exchange contracts and typically contains, among other things, collateral posting items and netting provisions in the event of a default and/or termination event. Under an ISDA Master Agreement, the Series may, under certain circumstances, offset with the counterparty certain derivative financial instrument’s payables and/or receivables with collateral held and/or posted and create one single net payment. The provisions of the ISDA Master Agreement typically permit a single net payment in the event of default (close-out), including the bankruptcy or insolvency of the counterparty. However, bankruptcy or insolvency laws of a particular jurisdiction may impose restrictions on or prohibitions against the right of offset in bankruptcy, insolvency, or other events.
For financial reporting purposes, the Series does not offset derivative assets and derivative liabilities that are subject to netting arrangements on the “Statement of assets and liabilities.”
At Dec. 31, 2016, the Series had the no assets and liabilities subject to offsetting provisions.
10. Securities Lending
The Series, along with other funds in the Delaware Investments® Family of Funds, may lend its securities pursuant to a security lending agreement (Lending Agreement) with The Bank of New York Mellon (BNY Mellon). At the time a security is loaned, the borrower must post collateral equal to the required percentage of the market value of the loaned security, including any accrued interest. The required percentage is: (1) 102% with respect to U.S. securities and foreign securities that are denominated and payable in U.S. dollars; and (2) 105% with respect to foreign securities. With respect to each loan, if on any business day the aggregate market value of securities collateral plus cash collateral held is less than the aggregate market value of the securities that are the subject of such loan, the borrower will be notified to provide additional collateral by the end of the following business day, which, together with the collateral already held, will be not less than the applicable initial collateral requirements for such security loan. If the aggregate market value of securities collateral and cash collateral held with respect to a security loan exceeds the applicable initial collateral requirement, upon the request of the borrower, BNY Mellon must return enough collateral to the borrower by the end of the following business day to reduce the value of the remaining collateral to the applicable initial collateral requirement for such security loan. As a result of the foregoing, the value of the collateral held with respect to a loaned security on any particular day may be more or less than the value of the security on loan.
Cash collateral received by each series of the Trust is generally invested in a series of individual separate accounts, each corresponding to a Series. The investment guidelines permit each separate account to hold certain securities that would be considered eligible securities for a money market fund. Cash collateral received is generally invested in government securities; certain obligations issued by government sponsored enterprises; repurchase agreements collateralized by U.S. Treasury securities; obligations issued by the central government of any Organization for Economic Cooperation and Development (OECD) country or its agencies, instrumentalities, or establishments; obligations of supranational organizations; commercial paper, notes, bonds, and other debt obligations; certificates of deposit, time deposits, and other bank obligations; and asset-backed securities.
In the event of default or bankruptcy by the lending agent, realization and/or retention of the collateral may be subject to legal proceedings. In the event the borrower fails to return loaned securities and the collateral received is insufficient to cover the value of the loaned securities and provided such collateral shortfall is not the result of investment losses, the lending agent has agreed to pay the amount of the shortfall to the Series or, at the discretion of the lending agent, replace the loaned securities. The Series continues to record dividends or interest, as applicable, on the securities loaned and are subject to changes in value of the securities loaned that may occur during the term of the loan. The Series has the right under the Lending Agreement to recover the securities from the borrower on demand. With respect to security loans collateralized by non-cash collateral, the Series receives loan
Emerging Markets Series-20
Table of Contents
Delaware VIP® Emerging Markets Series
Notes to financial statements (continued)
10. Securities Lending (continued)
premiums paid by the borrower. With respect to security loans collateralized by cash collateral, the earnings from the collateral investments are shared among the Series, the security lending agent, and the borrower. The Series records security lending income net of allocations to the security lending agent and the borrower.
The Series may incur investment losses as a result of investing securities lending collateral. This could occur if an investment in the collateral investment account defaulted or became impaired. Under those circumstances, the value of a Series’ cash collateral account may be less than the amount the Series would be required to return to the borrowers of the securities and the Series would be required to make up for this shortfall.
During the year ended Dec. 31, 2016, the Series had no securities out on loan.
11. Credit and Market Risk
Some countries in which the Series may invest require governmental approval for the repatriation of investment income, capital, or the proceeds of sales of securities by foreign investors. In addition, if there is deterioration in a country’s balance of payments or for other reasons, a country may impose temporary restrictions on foreign capital remittances abroad.
The securities exchanges of certain foreign markets are substantially smaller, less liquid, and more volatile than the major securities markets in the United States. Consequently, acquisition and disposition of securities by the Series may be inhibited. In addition, a significant portion of the aggregate market value of equity securities listed on the major securities exchanges in emerging markets is held by a smaller number of investors. This may limit the number of shares available for acquisition or disposition by the Series.
The Series may invest up to 10% of its net assets in illiquid securities, which may include securities with contractual restrictions on resale, securities exempt from registration under Rule 144A promulgated under the Securities Act of 1933, as amended, and other securities which may not be readily marketable. The relative illiquidity of these securities may impair the Series from disposing of them in a timely manner and at a fair price when it is necessary or desirable to do so. While maintaining oversight, the Series’ Board has delegated to DMC the day-to-day functions of determining whether individual securities are liquid for purposes of the Series’ limitation on investments in illiquid securities. Securities eligible for resale pursuant to Rule 144A, which are determined to be liquid, are not subject to the Series’ 10% limit on investments in illiquid securities. Rule 144A securities have been identified on the “Schedule of investments.”
12. Contractual Obligations
The Series enters into contracts in the normal course of business that contain a variety of indemnifications. The Series’ maximum exposure under these arrangements is unknown. However, the Series has not had prior claims or losses pursuant to these contracts. Management has reviewed the Series’ existing contracts and expects the risk of loss to be remote.
13. Recent Accounting Pronouncements
On Oct. 13, 2016, the Securities and Exchange Commission amended existing rules intended to modernize reporting and disclosure of information. These amendments relate to Regulation S-X which sets forth the form and content of financial statements. At this time, management is evaluating the implications of adopting these amendments and their impact on the financial statements and accompanying notes.
14. Subsequent Events
Management has determined that no material events or transactions occurred subsequent to Dec. 31, 2016 that would require recognition or disclosure in the Series’ financial statements.
Emerging Markets Series-21
Table of Contents
Delaware VIP® Trust — Delaware VIP Emerging Markets Series
Report of independent registered public accounting firm
To the Board of Trustees of Delaware VIP Trust and Shareholders of Delaware VIP Emerging Markets Series:
In our opinion, the accompanying statement of assets and liabilities, including the schedule of investments, and the related statements of operations and of changes in net assets and the financial highlights present fairly, in all material respects, the financial position of Delaware VIP Emerging Markets Series (one of the series constituting Delaware VIP Trust, hereafter referred to as the “Series”) as of December 31, 2016, the results of its operations for the year then ended, the changes in its net assets for each of the two years in the period then ended and the financial highlights for each of the five years in the period then ended, in conformity with accounting principles generally accepted in the United States of America. These financial statements and financial highlights (hereafter referred to as “financial statements”) are the responsibility of the Series’ management. Our responsibility is to express an opinion on these financial statements based on our audits. We conducted our audits of these financial statements in accordance with the standards of the Public Company Accounting Oversight Board (United States). Those standards require that we plan and perform the audit to obtain reasonable assurance about whether the financial statements are free of material misstatement. An audit includes examining, on a test basis, evidence supporting the amounts and disclosures in the financial statements, assessing the accounting principles used and significant estimates made by management, and evaluating the overall financial statement presentation. We believe that our audits, which included confirmation of securities as of December 31, 2016 by correspondence with the custodian, provide a reasonable basis for our opinion.
PricewaterhouseCoopers LLP
Philadelphia, Pennsylvania
February 16, 2017
Emerging Markets Series-22
Table of Contents
Delaware VIP® Trust — Delaware VIP Emerging Markets Series
Other Series information (Unaudited)
Board consideration of Delaware VIP Emerging Markets Series investment advisory agreement
At a meeting held on Aug. 16–18, 2016 (the “Annual Meeting”), the Board of Trustees (the “Board”), including a majority of disinterested or independent Trustees, approved the renewal of the Investment Advisory Agreement for Delaware VIP Emerging Markets Series (the “Series”). In making its decision, the Board considered information furnished at regular quarterly Board meetings, including reports detailing Series performance, investment strategies, and expenses, as well as information prepared specifically in connection with the renewal of the investment advisory and sub-advisory contracts. Information furnished specifically in connection with the renewal of the Investment Management Agreement with Delaware Management Company (“DMC”) included materials provided by DMC and its affiliates (“Delaware Investments”) concerning, among other things, the nature, extent, and quality of services provided to the Series; the costs of such services to the Series; economies of scale; and the investment manager’s financial condition and profitability. In addition, in connection with the Annual Meeting, reports were provided to the Trustees in May 2016 and included reports provided by Broadridge Financial Solutions (“Broadridge”). The Broadridge reports compared the Series’ investment performance and expenses with those of other comparable mutual funds. The Independent Trustees reviewed and discussed the Broadridge reports with independent legal counsel to the Independent Trustees. In addition to the information noted above, the Board also requested and received information regarding DMC’s policy with respect to advisory fee levels and its breakpoint philosophy; the structure of portfolio manager compensation; comparative client fee information; and any constraints or limitations on the availability of securities for certain investment styles, which had in the past year inhibited, or which were likely in the future to inhibit, the investment manager’s ability to invest fully in accordance with Series policies.
In considering information relating to the approval of the Series’ advisory agreement, the Independent Trustees received assistance and advice from and met separately with independent legal counsel to the Independent Trustees. Although the Board gave attention to all information furnished, the following discussion identifies, under separate headings, the primary factors taken into account by the Board during its contract renewal considerations.
Nature, extent, and quality of service. The Board considered the services provided by DMC to the Series and its shareholders. In reviewing the nature, extent, and quality of services, the Board considered reports furnished to it throughout the year, which covered matters such as the relative performance of the Series; compliance of portfolio managers with the investment policies, strategies, and restrictions for the Series; compliance by DMC and Delaware Distributors, L.P. (together, “Management”) personnel with the Code of Ethics adopted throughout the Delaware Investments® Family of Funds complex; and adherence to fair value pricing procedures as established by the Board. The Board was pleased with the current staffing of the Series’ investment advisor and the emphasis placed on research in the investment process. The Board recognized DMC’s receipt of several industry distinctions during the past several years. The Board gave favorable consideration to DMC’s efforts to control expenditures while maintaining service levels committed to Series matters. The Board was satisfied with the nature, extent, and quality of the overall services provided by DMC.
Investment performance. The Board placed significant emphasis on the investment performance of the Series in view of the importance of investment performance to shareholders. Although the Board gave appropriate consideration to performance reports and discussions with portfolio managers at Board meetings throughout the year, the Board gave particular weight to the Broadridge reports furnished for the Annual Meeting. The Broadridge reports prepared for the Series showed the investment performance of its Standard Class shares in comparison to a group of similar funds as selected by Broadridge (the “Performance Universe”). A fund with the best performance ranked first, and a fund with the poorest performance ranked last. The highest/best performing 25% of funds in the Performance Universe make up the first quartile; the next 25%, the second quartile; the next 25%, the third quartile; and the poorest/worst performing 25% of funds in the Performance Universe make up the fourth quartile. Comparative annualized performance for the Series was shown for the past 1-, 3-, 5-, and 10-year periods, as applicable, ended Jan. 31, 2016. The Board’s objective is that the Series’ performance for the periods considered be at or above the median of its Performance Universe.
The Performance Universe for the Series consisted of the Series and all emerging markets funds underlying variable insurance products as selected by Broadridge. The Broadridge report comparison showed that the Series’ total return for the 1-, 3-, and 10-year periods was in the second quartile of its Performance Universe. The report further showed that the Series’ total return for the 5-year period was in the third quartile of its Performance Universe. The Board was satisfied with performance.
Comparative expenses. The Board considered expense comparison data for the Delaware Investments Family of Funds. Management provided the Board with information on pricing levels and fee structures for the Series as of its most recently completed fiscal year. The Board also focused on the comparative analysis of effective management fees and total expense ratios of the Series versus effective management fees and expense ratios of a group of similar funds as selected by Broadridge (the “Expense Group”). In reviewing comparative costs, the Series’ contractual management fee and the actual management fee incurred by the Series were compared with the contractual management fees (assuming all funds in the Expense Group were similar in size to the Series) and actual management fees (as reported by each fund) within the Expense Group, taking into account any applicable breakpoints and fee waivers. The Series’ total expenses were also compared with those of its Expense Group. The Broadridge total expenses, for comparative consistency, were shown by Broadridge for Standard Class shares which do not charge 12b-1 and non-12b-1 service fees. The Board’s objective is to limit the Series’ total expense ratio to be competitive with that of the Expense Group.
The expense comparisons for the Series showed that the actual management fee and total expenses were in the quartile with the highest expenses of its Expense Group. The Series’ total expenses were not in line with the Board’s objective. In evaluating total expenses, the Board considered 12b-1 waivers in place through May 1, 2017 and various initiatives implemented by Management. The Board was satisfied with Management’s efforts to improve the Series’ total expense ratio and to bring it in line with the Board’s objective.
Emerging Markets Series-23
Table of Contents
Delaware VIP® Emerging Markets Series
Other Series information (Unaudited)
Board consideration of Delaware VIP Emerging Markets Series investment management agreement (continued)
Management profitability. The Board considered the level of profits realized by DMC in connection with the operation of the Series. In this respect, the Board reviewed the Investment Management Profitability Analysis that addressed the overall profitability of DMC’s business in providing management and other services to each of the individual funds and the Delaware Investments® Family of Funds as a whole. Specific attention was given to the methodology followed in allocating costs for the purpose of determining profitability. Management stated that the level of profits of DMC, to a certain extent, reflects recent operational cost savings and efficiencies initiated by DMC. The Board considered DMC’s efforts to improve services provided to fund shareholders and to meet additional regulatory and compliance requirements resulting from recent industry-wide Securities and Exchange Commission initiatives. The Board also considered the extent to which DMC might derive ancillary benefits from fund operations, including the potential for procuring additional business as a result of the prestige and visibility associated with its role as service provider to the Delaware Investments Family of Funds and the benefits from allocation of fund brokerage to improve trading efficiencies. The Board found that the management fees were reasonable in light of the services rendered and the profitability of DMC.
Economies of scale. The Trustees considered whether economies of scale are realized by DMC as the Series’ assets increase and the extent to which any economies of scale are reflected in the level of management fees charged. The Trustees reviewed the standardized advisory fee pricing and structure approved by the Board and shareholders, which includes breakpoints, and which applies to most funds in the Delaware Investments Family of Funds complex. Breakpoints in the advisory fee occur when the advisory fee rate is reduced on assets in excess of specified levels. Breakpoints result in a lower advisory fee, than would otherwise be the case in the absence of breakpoints, when the asset levels specified in the breakpoints are exceeded. The Board noted that the fee under the Series’ management contract fell within the standardized fee pricing structure. The Board also noted that, as of May 31, 2016, the Series’ assets exceeded the first breakpoint level. The Board believed that, given the extent to which economies of scale might be realized by the advisor and its affiliates, the schedule of fees under the Investment Management Agreement provides a sharing of benefits with the Series and its shareholders.
Tax Information
For the year ended Dec. 31, 2016, the Series reports distributions paid during the year as follows:
(A) Long-Term Capital Gain Distributions Tax Basis | (B) Ordinary Income Distributions (Tax Basis) | Total Distributions (Tax Basis) | ||
| 70.01% | 29.99% | 100.00% |
All disclosures are based on financial information available as of the date of this annual report and, accordingly are subject to change. For any and all items requiring reporting, it is the intention of the Series to report the maximum amount permitted under the Internal Revenue Code and the regulations thereunder.
(A) and (B) are based on a percentage of the Series’ total distributions.
The Series intends to pass through foreign tax credits in the maximum amount of $668,729. The gross foreign source income earned during the fiscal year 2016 by the Series was $10,388,032.
Emerging Markets Series-24
Table of Contents
Delaware Investments® Family of Funds
Board of trustees/directors and officers addendum
A mutual fund is governed by a Board of Trustees/Directors (“Trustees”), which has oversight responsibility for the management of a fund’s business affairs. Trustees establish procedures and oversee and review the performance of the investment manager, the distributor, and others who perform services for the fund. The independent fund trustees, in particular, are advocates for shareholder interests. Each trustee has served in that capacity since he or she was elected to or appointed to the Board of Trustees, and will continue to serve until his or her retirement or the election of a new trustee in his or her place. The following is a list of the Trustees and Officers with certain background and related information.
Name, Address, and Birth Date | Position(s) Held with Fund(s) | Length of Time Served | Principal Occupation(s) During the Past Five Years | Number of Portfolios in Fund Complex Overseen by Trustee or Officer | Other Directorships Held by Trustee or Officer | |||||
| INTERESTED TRUSTEE | ||||||||||
Shawn K. Lytle1, 3 2005 Market Street Philadelphia, PA 19103
February 1970 | President, Chief Executive Officer, and Trustee | Trustee since September 2015
President and Chief Executive Officer since August 2015 | Shawn K. Lytle has served as President of Delaware Investments2 since June 2015 and was the Regional Head of Americas for UBS Global Asset Management from 2010 through 2015. | 62 | Trustee — UBS Relationship Funds, SMA Relationship Trust, and UBS Funds (May 2010–April 2015) | |||||
| INDEPENDENT TRUSTEES | ||||||||||
Thomas L. Bennett 2005 Market Street Philadelphia, PA 19103
October 1947 | Chairman and Trustee | Trustee since March 2005
Chairman since March 2015 | Private Investor (March 2004–Present) | 62 | None | |||||
Ann D. Borowiec 2005 Market Street Philadelphia, PA 19103
November 1958 | Trustee | Since March 2015 | Chief Executive Officer Private Wealth Management (2011–2013) and Market Manager, New Jersey Private Bank (2005–2011) — J.P. Morgan Chase & Co. | 62 | Director — Banco Santander International
Director — Santander Bank, N.A. | |||||
Joseph W. Chow 2005 Market Street Philadelphia, PA 19103
January 1953 | Trustee | Since January 2013 | Executive Vice President (Emerging Economies Strategies, Risks, and Corporate Administration) State Street Corporation (July 2004–March 2011) | 62 | Director and Audit Committee Member — Hercules Technology Growth Capital, Inc. (2004–2014) | |||||
John A. Fry 2005 Market Street Philadelphia, PA 19103
May 1960 | Trustee | Since January 2001 | President — Drexel University (August 2010–Present)
President — Franklin & Marshall College (July 2002–July 2010) | 62 | Director, Audit Committee and Governance Committee Member — Community Health Systems
Director — Drexel Morgan & Co.
Director, Audit Committee Member — vTv Therapeutics LLC | |||||
Lucinda S. Landreth 2005 Market Street Philadelphia, PA 19103
June 1947 | Trustee | Since March 2005 | Private Investor (2004–Present) | 62 | None | |||||
Emerging Markets Series-25
Table of Contents
Name, Address, and Birth Date | Position(s) Held with Fund(s) | Length of Time Served | Principal Occupation(s) During the Past Five Years | Number of Portfolios in Fund Complex Overseen by Trustee or Officer | Other Directorships Held by Trustee or Officer | |||||
| Frances A. Sevilla-Sacasa | Trustee | Since | Chief Executive Officer — | 62 | Trust Manager and | |||||
| 2005 Market Street | September 2011 | Banco Itaú | Audit Committee | |||||||
| Philadelphia, PA 19103 | International | Member — Camden | ||||||||
| (April 2012–December 2016) | Property Trust | |||||||||
| January 1956 | ||||||||||
Executive Advisor to Dean (August 2011–March 2012) and Interim Dean (January 2011–July 2011) — University of Miami School of Business Administration | ||||||||||
President — U.S. Trust, Bank of America Private Wealth Management (Private Banking) (July 2007–December 2008)
| ||||||||||
Thomas K. Whitford 2005 Market Street Philadelphia, PA 19103
March 1956 | Trustee | Since January 2013 | Vice Chairman (2010–April 2013) — PNC Financial Services Group | 62 | Director — HSBC Finance Corporation and HSBC North America Holdings Inc.
Director — HSBC Bank | |||||
Janet L. Yeomans 2005 Market Street Philadelphia, PA 19103
July 1948 | Trustee | Since April 1999 | Vice President and Treasurer (January 2006–July 2012)
Vice President — Mergers & Acquisitions (January 2003–January 2006), and Vice President and Treasurer (July 1995–January 2003) — 3M Company | 62 | Director, Personnel and Compensation Committee Chair, and Audit Committee Member — Okabena Company | |||||
| OFFICERS | ||||||||||
David F. Connor 2005 Market Street Philadelphia, PA 19103
December 1963
| Senior Vice President, General Counsel, and Secretary | Senior Vice President, since May 2013; General Counsel since May 2015; Secretary since October 2005 | David F. Connor has served in various capacities at different times at Delaware Investments. | 62 | None3 | |||||
Daniel V. Geatens 2005 Market Street Philadelphia, PA 19103
October 1972
| Vice President and Treasurer | Treasurer since October 2007 | Daniel V. Geatens has served in various capacities at different times at Delaware Investments. | 62 | None3 | |||||
Richard Salus 2005 Market Street Philadelphia, PA 19103
October 1963 | Senior Vice President and Chief Financial Officer | Chief Financial Officer since November 2006 | Richard Salus has served in various capacities at different times at Delaware Investments. | 62 | None3 | |||||
| 1 | Shawn K. Lytle is considered to be an “Interested Trustee” because he is an executive officer of the Fund’s(s’) investment advisor. |
| 2 | Delaware Investments is the marketing name for Delaware Management Holdings, Inc. and its subsidiaries, including the Fund’s(s’) investment advisor, principal underwriter, and its transfer agent. |
| 3 | Shawn K. Lytle, David F. Connor, Daniel V. Geatens, and Richard Salus serve in similar capacities for the six portfolios of the Optimum Fund Trust, which have the same investment advisor, principal underwriter, and transfer agent as the registrant. |
The Statement of Additional Information for the Fund(s) includes additional information about the Trustees and Officers and is available, without charge, upon request by calling 800 523-1918.
Emerging Markets Series-26
Table of Contents
The Series files its complete schedule of portfolio holdings with the Securities and Exchange Commission (Commission) for the first and third quarters of each fiscal year on Form N-Q. The Series’ Forms N-Q, as well as a description of the policies and procedures that the Series uses to determine how to vote proxies (if any) relating to portfolio securities are available without charge (i) upon request, by calling 800 523-1918; and (ii) on the Commission’s website at sec.gov. In addition, a description of the policies and procedures that the Series uses to determine how to vote proxies (if any) relating to portfolio securities and the Schedule of Investments included in the Series’ most recent Form N-Q are available without charge on the Delaware Investments® Funds’ website at delawareinvestments.com/vip/literature. The Series’ Forms N-Q may be reviewed and copied at the Commission’s Public Reference Room in Washington, DC; information on the operation of the Public Reference Room may be obtained by calling 800 SEC-0330.
Information (if any) regarding how the Series voted proxies relating to portfolio securities during the most recently disclosed 12-month period ended June 30 is available without charge (i) through the Delaware Investments Funds’ website at delawareinvestments.com/proxy; and (ii) on the Commission’s website at sec.gov.
| ||||
| AR-VIPEM [12/16] BNY 21383 (2/17) (18579) | Emerging Markets Series-27 |
Table of Contents
Delaware VIP® Trust
|
Delaware VIP High Yield Series
|
Annual report
|
December 31, 2016
|

Table of Contents

Neither Delaware Investments nor its affiliates referred to in this document are authorized deposit-taking institutions for the purpose of the Banking Act 1959 (Commonwealth of Australia). The obligations of these entities do not represent deposits or other liabilities of Macquarie Bank Limited (MBL), a subsidiary of Macquarie Group Limited and an affiliate of Delaware Investments. MBL does not guarantee or otherwise provide assurance in respect of the obligations of these entities, unless noted otherwise. The Series is governed by U.S. laws and regulations.
Unless otherwise noted, views expressed herein are current as of Dec. 31, 2016, and subject to change for events occurring after such date.
The Series is not FDIC insured and is not guaranteed. It is possible to lose the principal amount invested.
Mutual fund advisory services provided by Delaware Management Company, a series of Delaware Management Business Trust, which is a registered investment advisor. Delaware Investments, a member of Macquarie Group, refers to Delaware Management Holdings, Inc. and its subsidiaries, including the Series’ distributor, Delaware Distributors, L.P. Macquarie Group refers to Macquarie Group Limited and its subsidiaries and affiliates worldwide.
This material may be used in conjunction with the offering of shares in Delaware VIP High Yield Series only if preceded or accompanied by the Series’ current prospectus or the summary prospectus.
© 2017 Delaware Management Holdings, Inc.
All third-party marks cited are the property of their respective owners.
Table of Contents
For the fiscal year ended Dec. 31, 2016, Delaware VIP High Yield Series Standard Class shares returned +13.16%, and Service Class shares returned +12.91%. Both figures reflect all dividends reinvested. For the same period, the Series’ benchmark, the BofA Merrill Lynch U.S. High Yield Constrained Index, returned +17.49%.
The opening weeks of the Series’ fiscal year were marked by a steep fall in commodity prices, especially oil. In February 2016, a rebound in commodity prices, combined with the U.S. Federal Reserve’s assurance of continued monetary accommodation, sparked a rally in high yield bond prices that persisted throughout the fiscal period. In the closing months of 2016, notable events included the election of Donald Trump as the next U.S. president, the post-election rally, and a hike in interest rates, just the Fed’s second in a decade. As a result, credit spreads finished inside their historical averages and nearly 2% tighter than where they were at the start of the fiscal year.
Importantly, the recovery in oil prices — coupled with a global search for yield — reopened capital markets to energy companies. This backdrop allowed many distressed businesses to extend maturity profiles by accessing both debt and equity markets, despite an oil price environment that, in our view, was not supportive of business models and balance sheets. Given the weak pricing environment, defaults among high yield energy companies climbed to the low double digits, versus low single digits for the rest of the high yield sector. Nevertheless, it was the meaningful recovery in oil prices that allowed the energy sector to return 39.4% at the end of the fiscal year.
More broadly, domestic high yield bonds benefited from a global search for income. Almost three-quarters of developed-market debt now trades at a negative yield, and global central banks gave no indication that a new monetary tightening cycle was close at hand. In that environment, most industry groups performed relatively well, with gaming, consumer products, chemicals, and technology all outperforming the BofA Merrill Lynch U.S. High Yield Constrained Index.
Shifting currents within the high yield market created significant managerial challenges for the Series. As the fiscal year began, we trimmed exposure to the energy sector; at one point, the Series’ allocation to the group fell to just 3% of assets. Though we subsequently increased the Series’ energy holdings, we finished the fiscal period about 4 percentage points below the sector’s 13% weighting in the benchmark.
Elsewhere, we added marginally to the Series’ metals and mining allocation as the recovery in commodity prices gained traction. We also added so-called “fallen angels” (that is, bonds that were downgraded from investment grade to high yield) whose credit ratings had dropped below investment grade after the plunge in oil prices. Finally, we added holdings that fit our up-in-quality criteria.
Among individual holdings, the Series’ overweight position in Builders FirstSource contributed to relative performance. The company owns and operates 55 distribution centers and manufacturing facilities for building materials throughout the United States. In our view, the company benefited from a healthy environment for residential home construction, strong free cash flow, a U.S.-centric clientele, and a plan for shedding debt.
After several difficult years, U.S. steelmaker AK Steel recovered strongly in 2016 due to several favorable trade rulings and continued strength in the U.S. auto industry. Another basic materials company, Australia-based FMG Resources, gained from a recovery in iron ore prices, positive free cash flow, a reduction in debt, and a favorable cost structure. As a result, we added to the Series’ position.
Most of the Series’ underperforming positions suffered from weak free cash flows and overleveraged balance sheets, exacerbated by a difficult business environment. Among the primary detractors from relative performance was Immucor, whose products are designed to support immune system health. Given the near-term challenges posed by, in our view, an overlevered balance sheet, we reduced the Series’ position.
The Series also experienced underperformance due to negative market reaction surrounding Deutsche Bank’s perceived inability to pay coupons on its Alternative Tier 1 (AT1) securities. Portfolio names such as CS, RBS and SOCGEN experienced weakness in their respective AT1 securities. Given our view of further downside risks we exited the Series’ opportunistic AT1 securities.
Neiman Marcus bonds likewise reduced returns. The luxury products retailer suffered material same-store sales declines despite generally robust consumer spending. Neiman Marcus announced stronger earnings toward the end of the fiscal year, however, and the Series retains a decreased position.
We believe the Series may be positioned to benefit from a bottom-up, bond-by-bond approach that, if accurate, would play to our strength as fundamental credit analysts. However, given the resilience of the U.S. economy (compared with much of the developed world) we continue to favor companies with a domestic focus. As noted earlier, the Series continues to be overweight businesses that we view as having healthy free cash flows, a disciplined strategy of capital allocation, and a commitment to deleveraging. We are generally satisfied with the Series’ current yield profile, though we may look to add income to the portfolio if opportunities present themselves.
| Unless otherwise noted, views expressed herein are current as of Dec. 31, 2016, and subject to change. | ||
| High Yield Series-1 |
Table of Contents
Delaware VIP® Trust — Delaware VIP High Yield Series
The performance quoted represents past performance and does not guarantee future results. Investment return and principal value of an investment will fluctuate so that shares, when redeemed, may be worth more or less than their original cost. Current performance may be lower or higher than the performance quoted.
Carefully consider the Series’ investment objectives, risk factors, charges, and expenses before investing. This and other information can be found in the Series’ prospectus and its summary prospectus, which may be obtained by calling 800 523-1918. Investors should read the prospectus and the summary prospectus carefully before investing.
| Delaware VIP High Yield Series | ||||||||||||
| Average annual total returns | ||||||||||||
| For period ended Dec. 31, 2016 | 1 year | 3 years | 5 years | 10 years | Lifetime | |||||||
Standard Class shares (commenced operations on July 28, 1988) | +13.16% | +1.77% | +6.28% | +6.40% | +6.82% | |||||||
|
|
|
|
|
| |||||||
|
|
|
|
|
| |||||||
Service Class shares (commenced operations on May 1, 2000) | +12.91% | +1.51% | +5.99% | +6.12% | +6.11% | |||||||
|
|
|
|
|
| |||||||
|
|
|
|
|
| |||||||
BofA Merrill Lynch U.S. High Yield Constrained Index | +17.49% | +4.73% | +7.35% | +7.45% | n/a | |||||||
Returns reflect the reinvestment of all distributions. Please see page 3 for a description of the index.
As described in the Series’ most recent prospectus, the net expense ratio for Service Class shares of the Series was 0.99%, while total operating expenses for Standard Class and Service Class shares were 0.75% and 1.05%, respectively. The management fee for Standard Class and Service Class shares was 0.65%. The Series’ investment manager, Delaware Management Company (Manager), has contractually agreed to waive all or a portion of its investment advisory fees and/or pay/reimburse expenses (excluding any 12b-1 fees, acquired fund fees and expenses, taxes, interest, short sale and dividend interest expenses, brokerage fees, certain insurance costs, and nonroutine expenses or costs, including, but not limited to, those relating to reorganizations, litigation, conducting shareholder meetings, and liquidations) in order to prevent annual series operating expenses from exceeding 0.74% of the Series’ average daily net assets from Jan. 1, 2016 through Dec. 31, 2016.* These waivers and reimbursements may only be terminated by agreement of the Manager and the Series.
The Series’ distributor has contracted to limit the 12b-1 fees for Service Class shares to no more than 0.25% of average daily net assets from Jan. 1, 2016 through Dec. 31, 2016.*
Earnings from a variable annuity or variable life investment compound tax-free until withdrawal, and as a result, no adjustments were made for income taxes.
Expense limitations were in effect for both classes during certain periods shown in the Series performance table above and in the Performance of a $10,000 Investment graph on the next page.
Performance data do not reflect insurance fees related to a variable annuity or variable life investment or the deferred sales charge that would apply to certain withdrawals of investments held for fewer than eight years. Performance shown here would have been reduced if such fees were included and the expense limitation removed. For more information about fees, consult your variable annuity or variable life prospectus.
Investments in variable products involve risk.
Fixed income securities and bond funds can lose value, and investors can lose principal, as interest rates rise. They also may be affected by economic conditions that hinder an issuer’s ability to make interest and principal payments on its debt.
The Series may also be subject to prepayment risk, the risk that the principal of a fixed income security that is held by the Series may be prepaid prior to maturity, potentially forcing the Series to reinvest that money at a lower interest rate.
High yielding, non-investment-grade bonds (junk bonds) involve higher risk than investment grade bonds. The high yield secondary market is particularly susceptible to liquidity problems when institutional investors, such as mutual funds and certain other financial institutions, temporarily stop buying bonds for regulatory, financial, or other reasons. In addition, a less liquid secondary market makes it more difficult for the Series to obtain precise valuations of the high yield securities in its portfolio.
The Series may experience portfolio turnover in excess of 100%, which could result in higher transaction costs and tax liability.
High Yield Series-2
Table of Contents
Delaware VIP High Yield Series
Performance summary (continued)
International investments entail risks not ordinarily associated with U.S. investments including fluctuation in currency values, differences in accounting principles, or economic or political instability in other nations. Investing in emerging markets can be riskier than investing in established foreign markets due to increased volatility and lower trading volume.
The Series may invest in derivatives, which may involve additional expenses and are subject to risk, including the risk that an underlying security or securities index moves in the opposite direction from what the portfolio manager anticipated. A derivatives transaction depends upon the counterparties’ ability to fulfill their contractual obligations.
Please read both the contract and underlying prospectus for specific details regarding the product’s risk profile.
* The aggregate contractual waiver period covering this report is from April 29, 2015 through May 1, 2017.
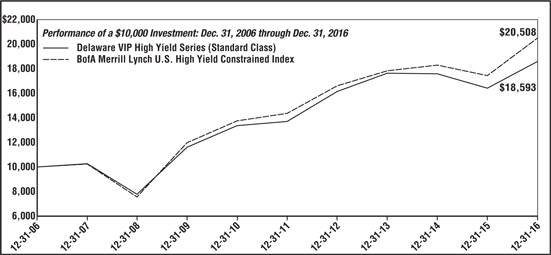
| For period beginning Dec. 31, 2006 through Dec. 31, 2016 | Starting value | Ending value | ||
-- BofA Merrill Lynch U.S. High Yield Constrained Index | $10,000 | $20,508 | ||
-- Delaware VIP High Yield Series (Standard Class) | $10,000 | $18,593 |
The graph shows a $10,000 investment in the Delaware VIP High Yield Series Standard Class shares for the period from Dec. 31, 2006 through Dec. 31, 2016.
The graph also shows $10,000 invested in the BofA Merrill Lynch U.S. High Yield Constrained Index for the period from Dec. 31, 2006 through Dec. 31, 2016. The BofA Merrill Lynch U.S. High Yield Constrained Index tracks the performance of U.S. dollar-denominated high yield corporate debt publicly issued in the U.S. domestic market, but caps individual issuer exposure at 2% of the benchmark.
Index performance returns do not reflect any management fees, transaction costs or expenses. Indices are unmanaged and one cannot invest directly in an index. Performance of Service Class shares will vary due to different charges and expenses.
| High Yield Series-3 |
Table of Contents
Delaware VIP® Trust — Delaware VIP High Yield Series
For the six-month period July 1, 2016 to December 31, 2016 (Unaudited)
Past performance is not a guarantee of future results.
As a shareholder of the Series, you incur ongoing costs, which may include management fees; distribution and/or service (12b-1) fees; and other Series expenses. This example is intended to help you understand your ongoing costs (in dollars) of investing in the Series and to compare these costs with the ongoing costs of investing in other mutual funds.
The example is based on an investment of $1,000 invested at the beginning of the period and held for the entire six-month period from July 1, 2016 to Dec. 31, 2016.
Actual expenses
The first section of the table shown, “Actual Series Return,” provides information about actual account values and actual expenses. You may use the information in this section of the table, together with the amount you invested, to estimate the expenses that you paid over the period. Simply divide your account value by $1,000 (for example, an $8,600 account value divided by $1,000 = 8.6), then multiply the result by the number in the first section under the heading entitled “Expenses Paid During Period” to estimate the expenses you paid on your account during the period.
Hypothetical example for comparison purposes
The second section of the table shown, “Hypothetical 5% Return,” provides information about hypothetical account values and hypothetical expenses based on the Series’ actual expense ratio and an assumed rate of return of 5% per year before expenses, which is not the Series’ actual return. The hypothetical account values and expenses may not be used to estimate the actual ending account balance or expenses you paid for the period. You may use this information to compare the ongoing costs of investing in the Series and other funds. To do so, compare the 5% hypothetical example with the 5% hypothetical examples that appear in the shareholder reports of other funds.
Please note that the expenses shown in the table are meant to highlight your ongoing costs only. As a shareholder of the Series, you do not incur any transaction costs, such as sales charges (loads), redemption fees or exchange fees, but shareholders of other funds may incur such costs. Also, the fees related to the variable annuity investment or the deferred sales charge that could apply have not been included. Therefore, the second section of the table is useful in comparing ongoing costs only, and will not help you determine the relative total costs of owning different funds. The Series’ actual expenses shown in the table reflect fee waivers in effect for Service Class shares. The expenses shown in the table assume reinvestment of all dividends and distributions.
Expense analysis of an investment of $1,000
| Beginning Account Value 7/1/16 | Ending Account Value 12/31/16 | Annualized Expense Ratio | Expenses Paid During Period 7/1/16 to 12/31/16* | |||||||||
Actual Series return† | ||||||||||||
Standard Class | $1,000.00 | $1,066.40 | 0.74% | $3.84 | ||||||||
Service Class | 1,000.00 | 1,064.50 | 0.99% | 5.14 | ||||||||
Hypothetical 5% return (5% return before expenses) | ||||||||||||
Standard Class | $1,000.00 | $1,021.42 | 0.74% | $3.76 | ||||||||
Service Class | 1,000.00 | 1,020.16 | 0.99% | 5.03 | ||||||||
| * | “Expenses Paid During Period” are equal to the Series’ annualized expense ratio, multiplied by the average account value over the period, multiplied by 184/366 (to reflect the one-half year period). |
| † | Because actual returns reflect only the most recent six-month period, the returns shown may differ significantly from fiscal year returns. |
| High Yield Series-4 |
Table of Contents
Delaware VIP® Trust — Delaware VIP High Yield Series
Security type / sector allocation
As of December 31, 2016 (Unaudited)
Sector designations may be different than the sector designations presented in other Series materials. The sector designations may represent the investment manager’s internal sector classifications.
| Security type / sector | Percentage of net assets | |||
| ||||
Corporate Bonds | 88.84% | |||
Automotive | 0.81% | |||
Banking | 3.48% | |||
Basic Industry | 14.37% | |||
Capital Goods | 4.83% | |||
Consumer Cyclical | 5.44% | |||
Consumer Non-Cyclical | 3.40% | |||
Energy | 13.60% | |||
Financial Services | 1.01% | |||
Healthcare | 7.13% | |||
Insurance | 1.79% | |||
Media | 9.92% | |||
Real Estate | 0.73% | |||
Services | 5.05% | |||
Technology & Electronics | 5.76% | |||
Telecommunications | 7.54% | |||
Transportation | 0.52% | |||
Utilities | 3.46% | |||
| ||||
Senior Secured Loans | 6.71% | |||
| ||||
Common Stock | 0.00% | |||
| ||||
Preferred Stock | 1.01% | |||
| ||||
Short-Term Investments | 3.33% | |||
| ||||
Total Value of Securities | 99.89% | |||
| ||||
Receivables and Other Assets Net of Liabilities | 0.11% | |||
| ||||
Total Net Assets | 100.00% | |||
| ||||
| High Yield Series-5 |
Table of Contents
Delaware VIP® Trust — Delaware VIP High Yield Series
December 31, 2016
| Principal amount° | Value (U.S. $) | |||||||
Corporate Bonds - 88.84% |
| |||||||
| Automotive - 0.81% | ||||||||
American Tire Distributors 144A 10.25% 3/1/22 # | 1,580,000 | $ | 1,523,641 | |||||
Gates Global 144A 6.00% 7/15/22 # | 710,000 | 697,930 | ||||||
|
| |||||||
| 2,221,571 | ||||||||
|
| |||||||
| Banking - 3.48% | ||||||||
Ally Financial 5.75% 11/20/25 | 1,740,000 | 1,742,175 | ||||||
Credit Suisse Group 144A 6.25% | 1,515,000 | 1,478,943 | ||||||
Lloyds Banking Group 7.50% 4/30/49 • | 1,450,000 | 1,497,125 | ||||||
Popular 7.00% 7/1/19 | 1,895,000 | 1,963,694 | ||||||
Royal Bank of Scotland Group 8.625% 12/29/49 • | 1,395,000 | 1,426,387 | ||||||
UBS Group 6.875% 12/29/49 • | 1,425,000 | 1,411,514 | ||||||
|
| |||||||
| 9,519,838 | ||||||||
|
| |||||||
| Basic Industry - 14.37% | ||||||||
AK Steel | ||||||||
7.625% 5/15/20 | 954,000 | 977,850 | ||||||
7.625% 10/1/21 | 485,000 | 521,981 | ||||||
Beacon Roofing Supply 6.375% 10/1/23 | 1,030,000 | 1,104,036 | ||||||
BMC East 144A 5.50% 10/1/24 # | 855,000 | 855,000 | ||||||
Boise Cascade 144A 5.625% 9/1/24 # | 1,465,000 | 1,461,337 | ||||||
Builders FirstSource | ||||||||
144A 5.625% 9/1/24 # | 730,000 | 736,387 | ||||||
144A 10.75% | 1,790,000 | 2,062,975 | ||||||
Cemex 144A 7.75% 4/16/26 # | 1,880,000 | 2,086,800 | ||||||
Cemex Finance 144A 6.00% 4/1/24 # | 785,000 | 808,550 | ||||||
Cliffs Natural Resources | ||||||||
144A 7.75% 3/31/20 # | 334,000 | 344,855 | ||||||
144A 8.00% 9/30/20 # | 325,000 | 339,625 | ||||||
FMG Resources August 2006 | ||||||||
144A 6.875% 4/1/22 # | 2,290,000 | 2,387,325 | ||||||
144A 9.75% 3/1/22 # | 255,000 | 297,093 | ||||||
Freeport-McMoRan | ||||||||
4.55% 11/14/24 | 900,000 | 848,250 | ||||||
144A 6.50% | 1,500,000 | 1,548,750 | ||||||
144A 6.875% | 1,020,000 | 1,076,100 | ||||||
Grinding Media 144A 7.375% 12/15/23 # | 375,000 | 394,913 | ||||||
Hudbay Minerals | ||||||||
144A 7.25% | 140,000 | 145,250 | ||||||
144A 7.625% 1/15/25 # | 700,000 | 729,316 | ||||||
James Hardie International Finance 144A 5.875% | 1,120,000 | 1,164,800 | ||||||
Joseph T Ryerson & Son 144A 11.00% | 595,000 | 655,987 | ||||||
Kraton Polymers 144A 10.50% 4/15/23 # | 1,270,000 | 1,438,275 | ||||||
Lennar 4.75% 5/30/25 | 703,000 | 688,940 | ||||||
M/I Homes 6.75% 1/15/21 | 1,101,000 | 1,153,297 | ||||||
| Principal amount° | Value (U.S. $) | |||||||
Corporate Bonds (continued) |
| |||||||
| Basic Industry (continued) | ||||||||
NCI Building Systems 144A 8.25% 1/15/23 # | 1,214,000 | $ | 1,317,190 | |||||
New Gold | ||||||||
144A 6.25% | 465,000 | 478,950 | ||||||
144A 7.00% 4/15/20 # | 560,000 | 576,800 | ||||||
NOVA Chemicals 144A 5.00% 5/1/25 # | 835,000 | 820,129 | ||||||
Novelis | ||||||||
144A 5.875% | 180,000 | 182,250 | ||||||
144A 6.25% 8/15/24 # | 1,795,000 | 1,907,187 | ||||||
PQ 144A 6.75% 11/15/22 # | 1,415,000 | 1,517,587 | ||||||
PulteGroup 5.00% 1/15/27 | 710,000 | 677,163 | ||||||
Steel Dynamics 144A 5.00% 12/15/26 # | 1,375,000 | 1,373,281 | ||||||
Summit Materials | ||||||||
6.125% 7/15/23 | 1,540,000 | 1,588,110 | ||||||
8.50% 4/15/22 | 380,000 | 421,800 | ||||||
US Concrete 6.375% 6/1/24 | 1,430,000 | 1,515,800 | ||||||
Vale Overseas 6.25% 8/10/26 | 1,265,000 | 1,318,763 | ||||||
Zekelman Industries 144A 9.875% | 1,580,000 | 1,773,550 | ||||||
|
| |||||||
| 39,296,252 | ||||||||
|
| |||||||
| Capital Goods - 4.83% | ||||||||
Ardagh Packaging Finance 144A 7.25% 5/15/24 # | 1,920,000 | 2,030,400 | ||||||
BWAY Holding 144A 9.125% 8/15/21 # | 2,190,000 | 2,321,400 | ||||||
Gardner Denver 144A 6.875% 8/15/21 # . | 2,245,000 | 2,245,000 | ||||||
KLX 144A 5.875% 12/1/22 # | 1,380,000 | 1,426,575 | ||||||
Reynolds Group Issuer 8.25% 2/15/21 | 664,109 | 685,889 | ||||||
Signode Industrial Group 144A 6.375% 5/1/22 # | 1,380,000 | 1,383,450 | ||||||
StandardAero Aviation Holdings 144A 10.00% 7/15/23 # | 615,000 | 650,363 | ||||||
TransDigm 144A 6.375% 6/15/26 # | 2,385,000 | 2,461,320 | ||||||
|
| |||||||
| 13,204,397 | ||||||||
|
| |||||||
| Consumer Cyclical - 5.44% | ||||||||
Boyd Gaming 144A 6.375% 4/1/26 # | 2,925,000 | 3,164,850 | ||||||
Golden Nugget 144A 8.50% 12/1/21 # | 420,000 | 448,350 | ||||||
JC Penney 8.125% 10/1/19 | 1,410,000 | 1,529,850 | ||||||
L Brands 6.875% 11/1/35 | 1,270,000 | 1,301,750 | ||||||
Landry’s 144A 6.75% 10/15/24 # | 1,330,000 | 1,353,275 | ||||||
Live Nation Entertainment 144A 4.875% 11/1/24 # | 1,337,000 | 1,343,685 | ||||||
MGM Resorts International 4.625% 9/1/26 | 1,445,000 | 1,398,037 | ||||||
Mohegan Tribal Gaming Authority 144A 7.875% 10/15/24 # | 1,470,000 | 1,504,913 | ||||||
Penske Automotive Group 5.50% 5/15/26 | 1,395,000 | 1,381,050 | ||||||
High Yield Series-6
Table of Contents
Delaware VIP® High Yield Series
Schedule of investments (continued)
| Principal amount° | Value (U.S. $) | |||||||
Corporate Bonds (continued) |
| |||||||
Consumer Cyclical (continued) |
| |||||||
Scientific Games International 10.00% 12/1/22 | 1,460,000 | $ | 1,460,000 | |||||
|
| |||||||
| 14,885,760 | ||||||||
|
| |||||||
Consumer Non-Cyclical - 3.40% |
| |||||||
Albertsons 144A 6.625% 6/15/24 # | 1,385,000 | 1,447,325 | ||||||
Dean Foods 144A 6.50% 3/15/23 # | 1,095,000 | 1,155,225 | ||||||
JBS USA 144A 5.75% 6/15/25 # | 1,415,000 | 1,439,763 | ||||||
Kronos Acquisition Holdings 144A 9.00% 8/15/23 # | 2,375,000 | 2,380,937 | ||||||
Nature’s Bounty 144A 7.625% 5/15/2 # | 1,400,000 | 1,452,500 | ||||||
Revlon Consumer Products 6.25% 8/1/24 | 1,375,000 | 1,412,813 | ||||||
|
| |||||||
| 9,288,563 | ||||||||
|
| |||||||
Energy - 13.60% | ||||||||
Alta Mesa Holdings 144A 7.875% 12/15/24 # | 1,355,000 | 1,409,200 | ||||||
AmeriGas Partners 5.875% 8/20/26 | 1,810,000 | 1,846,200 | ||||||
Antero Resources 5.625% 6/1/23 | 2,042,000 | 2,100,707 | ||||||
Baytex Energy 144A 5.625% 6/1/24 # | 1,140,000 | 1,011,750 | ||||||
Cheniere Corpus Christi Holdings | ||||||||
144A 5.875% 3/31/25 # | 615,000 | 629,797 | ||||||
144A 7.00% 6/30/24 # | 690,000 | 750,375 | ||||||
Chesapeake Energy 144A 8.00% 1/15/25 # | 930,000 | 952,087 | ||||||
Energy Transfer Equity 5.50% 6/1/27 | 840,000 | 823,200 | ||||||
Genesis Energy | ||||||||
5.75% 2/15/21 | 1,155,000 | 1,172,325 | ||||||
6.00% 5/15/23 | 290,000 | 296,525 | ||||||
6.75% 8/1/22 | 977,000 | 1,019,988 | ||||||
Gulfport Energy 144A 6.00% 10/15/24 # | 1,420,000 | 1,451,950 | ||||||
Hilcorp Energy I | ||||||||
144A 5.00% 12/1/24 # | 742,000 | 740,145 | ||||||
144A 5.75% 10/1/25 # | 691,000 | 703,093 | ||||||
Holly Energy Partners 144A 6.00% 8/1/24 # | 785,000 | 822,287 | ||||||
Laredo Petroleum 6.25% 3/15/23 | 2,290,000 | 2,381,600 | ||||||
Murphy Oil 6.875% 8/15/24 | 1,895,000 | 2,022,913 | ||||||
Murphy Oil USA 6.00% 8/15/23 | 1,320,000 | 1,382,700 | ||||||
Noble Holding International | ||||||||
5.25% 3/16/18 | 755,000 | 754,056 | ||||||
7.75% 1/15/24 | 555,000 | 523,421 | ||||||
NuStar Logistics 6.75% 2/1/21 | 1,325,000 | 1,437,625 | ||||||
Oasis Petroleum 6.875% 3/15/22 | 750,000 | 772,500 | ||||||
QEP Resources 5.25% 5/1/23 | 2,040,000 | 2,055,300 | ||||||
Sabine Pass Liquefaction 144A 5.00% 3/15/27 # | 600,000 | 607,500 | ||||||
Southwestern Energy 6.70% 1/23/25 | 2,155,000 | 2,214,263 | ||||||
Targa Resources Partners | ||||||||
144A 5.375% 2/1/27 # | 1,420,000 | 1,412,900 | ||||||
6.75% 3/15/24 | 1,330,000 | 1,433,075 | ||||||
Tesoro Logistics 5.25% 1/15/25 | 1,360,000 | 1,394,000 | ||||||
| Principal amount° | Value (U.S. $) | |||||||
Corporate Bonds (continued) |
| |||||||
Energy (continued) |
| |||||||
Transocean | ||||||||
5.55% 10/15/22 | 1,205,000 | $ | 1,063,413 | |||||
144A 9.00% 7/15/23 # | 635,000 | 654,050 | ||||||
Transocean Proteus 144A 6.25% 12/1/24 # | 625,000 | 633,987 | ||||||
WPX Energy 7.50% 8/1/20 | 665,000 | 718,200 | ||||||
|
| |||||||
| 37,191,132 | ||||||||
|
| |||||||
Financial Services - 1.01% |
| |||||||
AerCap Global Aviation Trust 144A 6.50% 6/15/45 #• | 1,370,000 | 1,388,837 | ||||||
E*TRADE Financial 5.875% 12/29/49 • | 1,365,000 | 1,360,564 | ||||||
|
| |||||||
| 2,749,401 | ||||||||
|
| |||||||
Healthcare - 7.13% | ||||||||
Air Medical Group Holdings 144A 6.375% 5/15/23 # | 2,150,000 | 2,074,750 | ||||||
DaVita | ||||||||
5.00% 5/1/25 | 1,610,000 | 1,587,863 | ||||||
5.125% 7/15/24 | 15,000 | 14,991 | ||||||
Envision Healthcare 144A 6.25% 12/1/24 # | 55,000 | 58,163 | ||||||
HCA | ||||||||
5.375% 2/1/25 | 1,885,000 | 1,892,069 | ||||||
5.875% 2/15/26 | 745,000 | 769,213 | ||||||
7.58% 9/15/25 | 580,000 | 627,850 | ||||||
HealthSouth | ||||||||
5.75% 11/1/24 | 1,265,000 | 1,287,137 | ||||||
5.75% 9/15/25 | 740,000 | 740,000 | ||||||
Hill-Rom Holdings 144A 5.75% 9/1/23 # | 1,430,000 | 1,483,625 | ||||||
IASIS Healthcare 8.375% 5/15/19 | 1,834,000 | 1,604,750 | ||||||
inVentiv Group Holdings 144A 7.50% 10/1/24 # | 755,000 | 794,562 | ||||||
Mallinckrodt International Finance | ||||||||
4.75% 4/15/23 | 690,000 | 603,750 | ||||||
144A 5.50% 4/15/25 # | 270,000 | 243,000 | ||||||
144A 5.625% 10/15/23 # | 865,000 | 810,937 | ||||||
MPH Acquisition Holdings 144A 7.125% 6/1/24 # | 2,020,000 | 2,131,302 | ||||||
Team Health 144A 7.25% 12/15/23 # | 1,195,000 | 1,362,300 | ||||||
Tenet Healthcare 8.125% 4/1/22 | 1,485,000 | 1,408,523 | ||||||
|
| |||||||
| 19,494,785 | ||||||||
|
| |||||||
Insurance - 1.79% | ||||||||
HUB International | ||||||||
144A 7.875% 10/1/21 # | 1,800,000 | 1,906,038 | ||||||
144A 9.25% 2/15/21 # | 395,000 | 409,319 | ||||||
USI 144A 7.75% 1/15/21 # | 1,425,000 | 1,454,391 | ||||||
XLIT 6.50% 12/29/49 • | 1,443,000 | 1,129,147 | ||||||
|
| |||||||
| 4,898,895 | ||||||||
|
| |||||||
Media - 9.92% | ||||||||
Altice Luxembourg 144A 7.75% 5/15/22 # | 1,295,000 | 1,385,650 | ||||||
| High Yield Series-7 |
Table of Contents
Delaware VIP® High Yield Series
Schedule of investments (continued)
| Principal amount° | Value (U.S. $) | |||||||
Corporate Bonds (continued) |
| |||||||
Media (continued) |
| |||||||
CCO Holdings | ||||||||
144A 5.50% 5/1/26 # | 160,000 | $ | 163,600 | |||||
144A 5.75% 2/15/26 # | 845,000 | 876,687 | ||||||
144A 5.875% 5/1/27 # | 1,355,000 | 1,409,200 | ||||||
Cequel Communications Holdings I 144A 7.75% 7/15/25 # | 1,275,000 | 1,408,875 | ||||||
CSC Holdings | ||||||||
144A 5.50% 4/15/27 # | 776,000 | 787,640 | ||||||
144A 10.875% 10/15/25 # | 1,735,000 | 2,068,987 | ||||||
DISH DBS 7.75% 7/1/26 | 1,261,000 | 1,424,930 | ||||||
Gray Television 144A 5.875% 7/15/26 # | 2,060,000 | 2,049,700 | ||||||
Lamar Media 5.75% 2/1/26 | 1,282,000 | 1,354,113 | ||||||
Nexstar Escrow 144A 5.625% 8/1/24 # | 1,925,000 | 1,915,375 | ||||||
SFR Group 144A 7.375% 5/1/26 # | 2,985,000 | 3,070,819 | ||||||
Sinclair Television Group 144A 5.125% 2/15/27 # | 1,440,000 | 1,375,200 | ||||||
Sirius XM Radio 144A 5.375% 4/15/25 # | 1,360,000 | 1,356,600 | ||||||
Tribune Media 5.875% 7/15/22 | 1,360,000 | 1,388,900 | ||||||
Virgin Media Secured Finance 144A 5.25% 1/15/26 # | 1,470,000 | 1,457,137 | ||||||
VTR Finance 144A 6.875% 1/15/24 # | 1,895,000 | 1,961,325 | ||||||
WideOpenWest Finance 10.25% 7/15/19 | 1,571,000 | 1,661,333 | ||||||
|
| |||||||
| 27,116,071 | ||||||||
|
| |||||||
Real Estate - 0.73% | ||||||||
ESH Hospitality 144A 5.25% 5/1/25 # | 2,015,000 | 2,009,963 | ||||||
|
| |||||||
| 2,009,963 | ||||||||
|
| |||||||
Services - 5.05% | ||||||||
Advanced Disposal Services 144A 5.625% 11/15/24 # | 1,410,000 | 1,406,475 | ||||||
Avis Budget Car Rental 144A 6.375% 4/1/24 # | 1,115,000 | 1,119,181 | ||||||
GEO Group | ||||||||
5.875% 10/15/24 | 460,000 | 455,975 | ||||||
6.00% 4/15/26 | 1,005,000 | 992,437 | ||||||
Herc Rentals | ||||||||
144A 7.50% 6/1/22 # | 390,000 | 412,913 | ||||||
144A 7.75% 6/1/24 # | 1,575,000 | 1,663,594 | ||||||
Iron Mountain US Holdings 144A 5.375% 6/1/26 # | 1,485,000 | 1,444,163 | ||||||
NES Rentals Holdings 144A 7.875% 5/1/18 # | 1,455,000 | 1,455,000 | ||||||
Prime Security Services Borrower 144A 9.25% 5/15/23 # | 3,135,000 | 3,421,069 | ||||||
United Rentals North America 5.50% 5/15/27 | 1,435,000 | 1,426,031 | ||||||
|
| |||||||
| 13,796,838 | ||||||||
|
| |||||||
Technology & Electronics - 5.76% | ||||||||
CDK Global 5.00% 10/15/24 | 1,280,000 | 1,248,000 | ||||||
CommScope 144A 5.50% 6/15/24 # | 815,000 | 846,581 | ||||||
| Principal amount° | Value (U.S. $) | |||||||
Corporate Bonds (continued) |
| |||||||
Technology & Electronics (continued) |
| |||||||
CommScope Technologies Finance 144A 6.00% 6/15/25 # | 590,000 | $ | 628,350 | |||||
Diamond 1 Finance 144A 8.10% 7/15/36 # | 1,090,000 | 1,300,029 | ||||||
Entegris 144A 6.00% 4/1/22 # | 1,340,000 | 1,398,625 | ||||||
First Data 144A 7.00% 12/1/23 # | 2,625,000 | 2,802,187 | ||||||
Genesys Telecommunications | ||||||||
Laboratories 144A 10.00% 11/30/24 # | 675,000 | 718,875 | ||||||
Infor Software Parent 144A PIK 7.125% 5/1/21 #T | 905,000 | 936,675 | ||||||
Infor US 6.50% 5/15/22 | 1,210,000 | 1,267,475 | ||||||
Micron Technology 144A 7.50% 9/15/23 # | 635,000 | 704,850 | ||||||
Microsemi 144A 9.125% 4/15/23 # | 805,000 | 941,850 | ||||||
Sensata Technologies UK Financing 144A 6.25% 2/15/26 # | 1,270,000 | 1,333,500 | ||||||
Solera 144A 10.50% 3/1/24 # | 910,000 | 1,028,300 | ||||||
Western Digital 144A 10.50% 4/1/24 # | 500,000 | 592,500 | ||||||
|
| |||||||
| 15,747,797 | ||||||||
|
| |||||||
Telecommunications - 7.54% | ||||||||
CenturyLink | ||||||||
6.75% 12/1/23 | 1,335,000 | 1,370,044 | ||||||
7.50% 4/1/24 | 665,000 | 699,913 | ||||||
Cincinnati Bell 144A 7.00% 7/15/24 # | 1,300,000 | 1,378,000 | ||||||
Cogent Communications Finance 144A 5.625% 4/15/21 # | 810,000 | 820,125 | ||||||
Cogent Communications Group 144A 5.375% 3/1/22 # | 705,000 | 731,437 | ||||||
Columbus Cable Barbados 144A 7.375% 3/30/21 # | 735,000 | 784,899 | ||||||
Communications Sales & Leasing | ||||||||
144A 7.125% 12/15/24 # | 695,000 | 703,687 | ||||||
8.25% 10/15/23 | 1,275,000 | 1,357,875 | ||||||
Frontier Communications 10.50% 9/15/22 | 1,255,000 | 1,324,088 | ||||||
Level 3 Financing 5.375% 5/1/25 | 1,200,000 | 1,227,000 | ||||||
Sprint | ||||||||
7.125% 6/15/24 | 1,820,000 | 1,879,150 | ||||||
7.875% 9/15/23 | 505,000 | 540,350 | ||||||
Sprint Communications | ||||||||
144A 7.00% 3/1/20 # | 645,000 | 701,437 | ||||||
7.00% 8/15/20 | 1,055,000 | 1,121,053 | ||||||
T-Mobile USA | ||||||||
6.00% 3/1/23 | 220,000 | 232,925 | ||||||
6.00% 4/15/24 | 305,000 | 322,156 | ||||||
6.375% 3/1/25 | 710,000 | 760,587 | ||||||
6.50% 1/15/26 | 1,105,000 | 1,197,544 | ||||||
Wind Acquisition Finance 144A 7.375% 4/23/21 # | 2,000,000 | 2,085,000 | ||||||
Zayo Group 6.375% 5/15/25 | 1,325,000 | 1,389,594 | ||||||
|
| |||||||
| 20,626,864 | ||||||||
|
| |||||||
| High Yield Series-8 |
Table of Contents
Delaware VIP® High Yield Series
Schedule of investments (continued)
Principal amount° | Value (U.S. $) | |||||||
Corporate Bonds (continued) |
| |||||||
Transportation - 0.52% | ||||||||
XPO Logistics | ||||||||
144A 6.125% 9/1/23 # | 565,000 | $ 592,544 | ||||||
144A 6.50% 6/15/22 # | 790,000 | 832,463 | ||||||
|
| |||||||
| 1,425,007 | ||||||||
|
| |||||||
Utilities - 3.46% | ||||||||
AES | ||||||||
5.50% 4/15/25 | 1,200,000 | 1,206,000 | ||||||
6.00% 5/15/26 | 205,000 | 209,100 | ||||||
Calpine | ||||||||
5.50% 2/1/24 | 835,000 | 809,950 | ||||||
5.75% 1/15/25 | 1,800,000 | 1,746,000 | ||||||
Dynegy | ||||||||
7.625% 11/1/24 | 1,850,000 | 1,715,875 | ||||||
144A 8.00% 1/15/25 # | 1,415,000 | 1,333,637 | ||||||
Emera 6.75% 6/15/76 • | 1,380,000 | 1,483,500 | ||||||
Enel 144A 8.75% 9/24/73 #• | 834,000 | 950,760 | ||||||
|
| |||||||
| 9,454,822 | ||||||||
|
| |||||||
Total Corporate Bonds | 242,927,956 | |||||||
|
| |||||||
Senior Secured Loans - 6.71% « | ||||||||
Accudyne Industries Borrower 1st Lien | 1,110,173 | 1,052,582 | ||||||
Amaya Holdings 1st Lien 5.00% 8/1/21 | 1,415,628 | 1,423,591 | ||||||
Applied Systems 2nd Lien 7.50% 1/23/22 | 2,669,576 | 2,701,277 | ||||||
BJ’s Wholesale Club 2nd Lien 8.50% 3/31/20 | 1,475,936 | 1,497,152 | ||||||
Blue Ribbon 1st Lien 5.00% 11/13/21 | 503,288 | 499,514 | ||||||
Flex Acquisition (Unsecured) 8.00% 12/6/17 | 930,000 | 931,163 | ||||||
Flint Group 2nd Lien 8.25% 9/7/22 | 1,375,000 | 1,361,250 | ||||||
FMG Resources August 2006 Pty 1st Lien 3.75% 6/30/19 | 1,202,402 | 1,206,310 | ||||||
Frank Russell Tranche B 1st Lien 6.75% 6/1/23 | 796,995 | 805,712 | ||||||
Genesys Telecommunications Laboratories Tranche B 1st Lien 6.25% 12/2/23 | 690,000 | 700,493 | ||||||
Immucor 5.00% 8/17/18 | 986,930 | 956,089 | ||||||
KIK Custom Products 1st Lien 6.00% 8/26/22 | 429,831 | 434,667 | ||||||
Kronos 2nd Lien 9.25% 11/1/24 | 1,420,000 | 1,465,707 | ||||||
Lightstone Generation Tranche B 1st Lien 6.50% 12/15/23 | 630,000 | 639,450 | ||||||
Lightstone Generation Tranche C 1st Lien 6.50% 12/14/23 | 60,000 | 60,900 | ||||||
Mohegan Tribal Gaming Authority Tranche B 1st Lien 5.50% 10/13/23 | 714,963 | 720,996 | ||||||
Principal amount° | Value (U.S. $) | |||||||
Senior Secured Loans « (continued) |
| |||||||
Moran Foods Tranche B 1st Lien 7.00% 12/5/23 | 700,000 | $ 697,813 | ||||||
Solera Tranche B 1st Lien 5.75% 3/3/23 . | 491,288 | 498,691 | ||||||
Windstream Services Tranche B6 1st Lien 4.75% 3/30/21 | 682,849 | 687,330 | ||||||
|
| |||||||
Total Senior Secured Loans | 18,340,687 | |||||||
|
| |||||||
Number of shares | ||||||||
Common Stock - 0.00% | ||||||||
Century Communications =† | 2,820,000 | 0 | ||||||
|
| |||||||
Total Common Stock | 0 | |||||||
|
| |||||||
Preferred Stock - 1.01% | ||||||||
Bank of America 6.50% • | 1,655,000 | 1,731,544 | ||||||
GMAC Capital Trust I 6.691% • | 40,000 | 1,016,000 | ||||||
|
| |||||||
Total Preferred Stock | 2,747,544 | |||||||
|
| |||||||
Principal amount° | ||||||||
Short-Term Investments - 3.33% | ||||||||
Repurchase Agreements - 3.33% | ||||||||
Bank of America Merrill Lynch 0.41%, dated 12/30/16, to be repurchased on 1/3/17, repurchase price $3,074,908 (collateralized by U.S. government obligations 2.00% 8/15/25; market value $3,136,264) | 3,074,768 | 3,074,768 | ||||||
Bank of Montreal 0.30%, dated 12/30/16, to be repurchased on 1/3/17, repurchase price $3,587,349 (collateralized by U.S. government obligations 0.00%-4.375% 5/15/18-11/15/44; market value $3,658,976) | 3,587,230 | 3,587,230 | ||||||
BNP Paribas 0.48%, dated 12/30/16, to be repurchased on 1/3/17, repurchase price $2,456,133 (collateralized by U.S. government obligations 2.125% 12/31/22; market value $2,505,123) | 2,456,002 | 2,456,002 | ||||||
|
| |||||||
Total Short-Term Investments (cost $9,118,000) | 9,118,000 | |||||||
|
| |||||||
| High Yield Series-9 |
Table of Contents
Delaware VIP® High Yield Series
Schedule of investments (continued)
Total Value of Securities - 99.89% | $ | 273,134,187 | ||
|
|
| # | Security exempt from registration under Rule 144A of the Securities Act of 1933, as amended. At Dec. 31, 2016, the aggregate value of Rule 144A securities was $144,651,916, which represents 52.90% of the Series’ net assets. See Note 10 in “Notes to financial statements.” |
| T | PIK. 100% of the income received was in the form of cash. |
| = | Security is being fair valued in accordance with the Series’ fair valuation policy. At Dec. 31, 2016, the aggregate value of fair valued securities was $0, which represents 0.00% of the Series’ net assets. See Note 1 in “Notes to financial statements.” |
| « | Senior secured loans generally pay interest at rates which are periodically reset by reference to a base lending rate plus a premium. These base lending rates are generally: (i) the prime rate offered by one or more U.S. banks, (ii) the lending rate offered by one or more European banks such as the London Interbank Offered Rate (LIBOR), and (iii) the certificate of deposit rate. Senior secured loans may be subject to restrictions on resale. Stated rate in effect at Dec. 31, 2016. |
| ° | Principal amount shown is stated in U.S. dollars unless noted that the security is denominated in another currency. |
| † | Non-income-producing security. |
| • | Variable rate security. Each rate shown is as of Dec. 31, 2016. Interest rates reset periodically. |
PIK – Payment-in-kind
Unfunded Commitments
The Series may invest in floating rate loans. In connection with these investments, the Series may also enter into unfunded corporate loan commitments (commitments). Commitments may obligate the Series to furnish temporary financing to a borrower until permanent financing can be arranged. In connection with these commitments, the Series earns a commitment fee, typically set as a percentage of the commitment amount. The following unfunded loan commitment was outstanding at Dec. 31, 2016:
Borrower | Unfunded Amount | Cost | Value | |||||||||
Grande Communications Networks 7.75% 10/19/17 | $ | 1,420,000 | $ | 1,420,000 | $ | 1,420,000 | ||||||
See accompanying notes, which are an integral part of the financial statements.
| High Yield Series-10 |
Table of Contents
| Delaware VIP® Trust — Delaware VIP High Yield Series | ||
| Statement of assets and liabilities | December 31, 2016 |
Assets: | ||||
Investments, at value1 | $ | 264,016,187 | ||
Short-term investments, at value2 | 9,118,000 | |||
Cash | 253,840 | |||
Dividend and interest receivable | 4,170,544 | |||
Receivable for securities sold | 979,044 | |||
Other assets3 | 920,913 | |||
Receivable for series shares sold | 71,615 | |||
|
| |||
Total assets | 279,530,143 | |||
|
| |||
Liabilities: | ||||
Bonds proceeds payable3 | 3,069,708 | |||
Payable for securities purchased | 2,584,752 | |||
Investment management fees payable to affiliates | 170,481 | |||
Payable for series shares redeemed | 167,820 | |||
Other accrued expenses | 54,119 | |||
Distribution fees payable to affiliates | 33,985 | |||
Dividend disbursing and transfer agent fees and expenses payable to affiliates | 1,732 | |||
Accounting and administration expenses payable to affiliates | 1,086 | |||
Trustees’ fees and expenses payable | 674 | |||
Legal fees payable to affiliates | 490 | |||
Reports and statements to shareholders expenses payable to affiliates | 241 | |||
|
| |||
Total liabilities | 6,085,088 | |||
|
| |||
Total Net Assets | $ | 273,445,055 | ||
|
| |||
Net Assets Consist of: | ||||
Paid-in capital | $ | 287,194,116 | ||
Undistributed net investment income | 15,703,041 | |||
Accumulated net realized loss on investments | (36,912,992 | ) | ||
Net unrealized appreciation of investments | 7,460,890 | |||
|
| |||
Total Net Assets | $ | 273,445,055 | ||
|
| |||
Standard Class: | ||||
Net assets | $ | 112,613,968 | ||
Shares of beneficial interest outstanding, unlimited authorization, no par | 21,914,207 | |||
Net asset value per share | $ | 5.14 | ||
Service Class: | ||||
Net assets | $ | 160,831,087 | ||
Shares of beneficial interest outstanding, unlimited authorization, no par | 31,415,034 | |||
Net asset value per share | $ | 5.12 | ||
| ||||
1 Investments, at cost | $ | 256,555,297 | ||
2 Short-term investments, at cost | 9,118,000 | |||
3 See Note 12 in “Notes to financial statements.” | ||||
See accompanying notes, which are an integral part of the financial statements.
High Yield Series-11
Table of Contents
Delaware VIP® Trust —
Delaware VIP High Yield Series
Statement of operations
Year ended December 31, 2016
Investment Income: | ||||
Interest | $ | 18,422,619 | ||
Dividends | 102,645 | |||
|
| |||
| 18,525,264 | ||||
|
| |||
Expenses: | ||||
Management fees | 1,798,899 | |||
Distribution expenses - Service Class | 484,405 | |||
Accounting and administration expenses | 88,740 | |||
Reports and statements to shareholders expenses | 47,503 | |||
Audit and tax fees | 41,861 | |||
Dividend disbursing and transfer agent fees and expenses | 23,643 | |||
Legal fees | 17,939 | |||
Custodian fees | 17,187 | |||
Trustees’ fees and expenses | 13,551 | |||
Registration fees | 634 | |||
Other | 20,522 | |||
|
| |||
| 2,554,884 | ||||
Less expenses waived | (21,192 | ) | ||
Less waived distribution expenses - Service Class | (80,734 | ) | ||
Less expense paid indirectly | (1 | ) | ||
|
| |||
Total operating expenses | 2,452,957 | |||
|
| |||
Net Investment Income | 16,072,307 | |||
|
| |||
Net Realized and Unrealized Gain (Loss): | ||||
Net realized loss on investments | (5,041,243 | ) | ||
Net change in unrealized appreciation (depreciation) of investments | 22,928,480 | |||
|
| |||
Net Realized and Unrealized Gain | 17,887,237 | |||
|
| |||
Net Increase in Net Assets Resulting from Operations | $ | 33,959,544 | ||
|
|
Delaware VIP Trust —
Delaware VIP High Yield Series
Statements of changes in net assets
| Year ended | ||||||||
| 12/31/16 | 12/31/15 | |||||||
Increase (Decrease) in Net Assets from Operations: | ||||||||
Net investment income | $ | 16,072,307 | $ | 19,869,559 | ||||
Net realized loss | (5,041,243 | ) | (32,247,661 | ) | ||||
Net change in unrealized appreciation (depreciation) | 22,928,480 | (7,507,504 | ) | |||||
|
|
|
| |||||
Net increase (decrease) in net assets resulting from operations | 33,959,544 | (19,885,606 | ) | |||||
|
|
|
| |||||
Dividends and Distributions to Shareholders from: | ||||||||
Net investment income: | ||||||||
Standard Class | (8,340,632 | ) | (8,984,307 | ) | ||||
Service Class | (11,240,941 | ) | (12,848,401 | ) | ||||
Net realized gain: | ||||||||
Standard Class | — | (1,883,806 | ) | |||||
Service Class | — | (2,807,214 | ) | |||||
|
|
|
| |||||
| (19,581,573 | ) | (26,523,728 | ) | |||||
|
|
|
| |||||
Capital Share Transactions: | ||||||||
Proceeds from shares sold: | ||||||||
Standard Class | 16,768,971 | 14,266,248 | ||||||
Service Class | 16,200,727 | 17,113,206 | ||||||
Net asset value of shares issued upon reinvestment of dividends and distributions: | ||||||||
Standard Class | 8,340,632 | 10,868,113 | ||||||
Service Class | 11,240,941 | 15,655,615 | ||||||
|
|
|
| |||||
| 52,551,271 | 57,903,182 | |||||||
|
|
|
| |||||
Cost of shares redeemed: | ||||||||
Standard Class | (30,302,987 | ) | (34,167,382 | ) | ||||
Service Class | (37,441,907 | ) | (50,908,596 | ) | ||||
|
|
|
| |||||
| (67,744,894 | ) | (85,075,978 | ) | |||||
|
|
|
| |||||
Decrease in net assets derived from capital share transactions | (15,193,623 | ) | (27,172,796 | ) | ||||
|
|
|
| |||||
Net Decrease in Net Assets | (815,652 | ) | (73,582,130 | ) | ||||
Net Assets: | ||||||||
Beginning of year | 274,260,707 | 347,842,837 | ||||||
|
|
|
| |||||
End of year | $ | 273,445,055 | $ | 274,260,707 | ||||
|
|
|
| |||||
Undistributed net investment income | $ | 15,703,041 | $ | 19,545,886 | ||||
|
|
|
| |||||
See accompanying notes, which are an integral part of the financial statements.
| High Yield Series-12 |
Table of Contents
Delaware VIP® Trust — Delaware VIP High Yield Series
Selected data for each share of the Series outstanding throughout each period were as follows:
| Delaware VIP High Yield Series Standard Class | ||||||||||||||||||||||||||||
| Year ended | ||||||||||||||||||||||||||||
| 12/31/16 | 12/31/15 | 12/31/14 | 12/31/13 | 12/31/12 | ||||||||||||||||||||||||
Net asset value, beginning of period | $ 4.890 | $ 5.670 | $ 6.190 | $ 6.110 | $ 5.680 | |||||||||||||||||||||||
Income (loss) from investment operations: | ||||||||||||||||||||||||||||
Net investment income1 | 0.294 | 0.336 | 0.341 | 0.385 | 0.440 | |||||||||||||||||||||||
Net realized and unrealized gain (loss) | 0.319 | (0.666) | (0.341) | 0.157 | 0.519 | |||||||||||||||||||||||
Total from investment operations | 0.613 | (0.330) | — | 0.542 | 0.959 | |||||||||||||||||||||||
Less dividends and distributions from: | ||||||||||||||||||||||||||||
Net investment income | (0.363) | (0.372) | (0.420) | (0.462) | (0.529) | |||||||||||||||||||||||
Net realized gain | — | (0.078) | (0.100) | — | — | |||||||||||||||||||||||
Total dividends and distributions | (0.363) | (0.450) | (0.520) | (0.462) | (0.529) | |||||||||||||||||||||||
Net asset value, end of period | $ 5.140 | $ 4.890 | $ 5.670 | $ 6.190 | $ 6.110 | |||||||||||||||||||||||
Total return2 | 13.16% | (6.60%) | (0.29%) | 9.22% | 17.82% | |||||||||||||||||||||||
Ratios and supplemental data: | ||||||||||||||||||||||||||||
Net assets, end of period (000 omitted) | $112,614 | $111,748 | $139,666 | $151,253 | $147,293 | |||||||||||||||||||||||
Ratio of expenses to average net assets | 0.74% | 0.75% | 0.75% | 0.74% | 0.74% | |||||||||||||||||||||||
Ratio of expenses to average net assets prior to fees waived | 0.75% | 0.76% | 0.75% | 0.74% | 0.74% | |||||||||||||||||||||||
Ratio of net investment income to average net assets | 5.95% | 6.25% | 5.67% | 6.34% | 7.52% | |||||||||||||||||||||||
Ratio of net investment income to average net assets prior to fees waived | 5.94% | 6.24% | 5.67% | 6.34% | 7.52% | |||||||||||||||||||||||
Portfolio turnover | 112% | 99% | 103% | 88% | 76% | |||||||||||||||||||||||
| 1 | The average shares outstanding method has been applied for per share information. |
| 2 | Total investment return is based on the change in net asset value of a share during the period and assumes reinvestment of dividends and distributions at net asset value. Total investment return during some of the periods shown reflects a waiver by the manager. Performance would have been lower had the waiver not been in effect. Total investment return does not include fees, charges, or expenses imposed by the variable annuity and life insurance contracts for which Delaware VIP Trust serves as an underlying investment vehicle. |
See accompanying notes, which are an integral part of the financial statements.
| High Yield Series-13 |
Table of Contents
Delaware VIP® High Yield Series
Financial highlights (continued)
Selected data for each share of the Series outstanding throughout each period were as follows:
| Delaware VIP High Yield Series Service Class | ||||||||||||||||||||||||||||
| Year ended | ||||||||||||||||||||||||||||
| 12/31/16 | 12/31/15 | 12/31/14 | 12/31/13 | 12/31/12 | ||||||||||||||||||||||||
Net asset value, beginning of period | $ 4.870 | $ 5.650 | $ 6.170 | $ 6.090 | $ 5.670 | |||||||||||||||||||||||
Income (loss) from investment operations: | ||||||||||||||||||||||||||||
Net investment income1 | 0.281 | 0.322 | 0.325 | 0.369 | 0.424 | |||||||||||||||||||||||
Net realized and unrealized gain (loss) | 0.319 | (0.667) | (0.340) | 0.158 | 0.510 | |||||||||||||||||||||||
Total from investment operations | 0.600 | (0.345) | (0.015) | 0.527 | 0.934 | |||||||||||||||||||||||
Less dividends and distributions from: | ||||||||||||||||||||||||||||
Net investment income | (0.350) | (0.357) | (0.405) | (0.447) | (0.514) | |||||||||||||||||||||||
Net realized gain | — | (0.078) | (0.100) | — | — | |||||||||||||||||||||||
Total dividends and distributions | (0.350) | (0.435) | (0.505) | (0.447) | (0.514) | |||||||||||||||||||||||
Net asset value, end of period | $ 5.120 | $ 4.870 | $ 5.650 | $ 6.170 | $ 6.090 | |||||||||||||||||||||||
Total return2 | 12.91% | (6.87%) | (0.54%) | 8.98% | 17.35% | |||||||||||||||||||||||
Ratios and supplemental data: | ||||||||||||||||||||||||||||
Net assets, end of period (000 omitted) | $160,831 | $162,513 | $208,177 | $250,979 | $274,221 | |||||||||||||||||||||||
Ratio of expenses to average net assets | 0.99% | 1.00% | 1.00% | 0.99% | 0.99% | |||||||||||||||||||||||
Ratio of expenses to average net assets prior to fees waived | 1.05% | 1.06% | 1.05% | 1.04% | 1.04% | |||||||||||||||||||||||
Ratio of net investment income to average net assets | 5.70% | 6.00% | 5.42% | 6.09% | 7.27% | |||||||||||||||||||||||
Ratio of net investment income to average net assets prior to fees waived | 5.64% | 5.94% | 5.37% | 6.04% | 7.22% | |||||||||||||||||||||||
Portfolio turnover | 112% | 99% | 103% | 88% | 76% | |||||||||||||||||||||||
| 1 | The average shares outstanding method has been applied for per share information. |
| 2 | Total investment return is based on the change in net asset value of a share during the period and assumes reinvestment of dividends and distributions at net asset value. Total investment return during all of the periods shown reflects waivers by the manager and/or distributor. Performance would have been lower had the waivers not been in effect. Total investment return does not include fees, charges, or expenses imposed by the variable annuity and life insurance contracts for which Delaware VIP Trust serves as an underlying investment vehicle. |
See accompanying notes, which are an integral part of the financial statements.
| High Yield Series-14 |
Table of Contents
Delaware VIP® Trust — Delaware VIP High Yield Series
December 31, 2016
Delaware VIP Trust (Trust) is organized as a Delaware statutory trust and offers 10 series: Delaware VIP Diversified Income Series, Delaware VIP Emerging Markets Series, Delaware VIP High Yield Series, Delaware VIP International Value Equity Series, Delaware VIP Limited-Term Diversified Income Series, Delaware VIP REIT Series, Delaware VIP Small Cap Value Series, Delaware VIP Smid Cap Growth Series, Delaware VIP U.S. Growth Series, and Delaware VIP Value Series. These financial statements and the related notes pertain to Delaware VIP High Yield Series (Series). The Trust is an open-end investment company. The Series is considered diversified under the Investment Company Act of 1940 (1940 Act), as amended, and offers Standard Class and Service Class shares. The Standard Class shares do not carry a 12b-1 fee and the Service Class shares carry a 12b-1 fee. The shares of the Series are sold only to separate accounts of life insurance companies.
The investment objective of the Series is to seek total return and, as a secondary objective, high current income.
1. Significant Accounting Policies
The following accounting policies are in accordance with U.S. generally accepted accounting principles (U.S. GAAP) and are consistently followed by the Series.
Security Valuation — Equity securities, except those traded on the Nasdaq Stock Market LLC (Nasdaq), are valued at the last quoted sales price as of the time of the regular close of the New York Stock Exchange on the valuation date. Equity securities traded on the Nasdaq are valued in accordance with the Nasdaq Official Closing Price, which may not be the last sales price. If, on a particular day, an equity security does not trade, the mean between the bid and ask prices will be used, which approximates fair value. U.S. government and agency securities are valued at the mean between the bid and ask prices, which approximates fair value. Other debt securities are valued based upon valuations provided by an independent pricing service or broker and reviewed by management. To the extent current market prices are not available, the pricing service may take into account developments related to the specific security, as well as transactions in comparable securities. Valuations for fixed income securities utilize matrix systems, which reflect such factors as security prices, yields, maturities, and ratings, and are supplemented by dealer and exchange quotations. Generally, other securities and assets for which market quotations are not readily available are valued at fair value as determined in good faith under the direction of the Trust’s Board of Trustees (the Board). In determining whether market quotations are readily available or fair valuation will be used, various factors will be taken into consideration, such as market closures or suspension of trading in a security.
Federal Income Taxes — No provision for federal income taxes has been made as the Series intends to continue to qualify for federal income tax purposes as a regulated investment company under Subchapter M of the Internal Revenue Code of 1986, as amended, and make the requisite distributions to shareholders. The Series evaluates tax positions taken or expected to be taken in the course of preparing the Series’ tax returns to determine whether the tax positions are “more-likely-than-not” of being sustained by the applicable tax authority. Tax positions not deemed to meet the “more-likely-than-not” threshold are recorded as a tax benefit or expense in the current year. Management has analyzed the Series’ tax positions taken for all open federal income tax years (Dec. 31, 2013–Dec. 31, 2016), and has concluded that no provision for federal income tax is required in the Series’ financial statements.
Class Accounting — Investment income, common expenses, and realized and unrealized gain (loss) on investments are allocated to the classes of the Series on the basis of daily net assets of each class. Distribution expenses relating to a specific class are charged directly to that class.
Repurchase Agreements — The Series may purchase certain U.S. government securities subject to the counterparty’s agreement to repurchase them at an agreed upon date and price. The counterparty will be required on a daily basis to maintain the value of the collateral subject to the agreement at not less than the repurchase price (including accrued interest). The agreements are conditioned upon the collateral being deposited under the Federal Reserve book-entry system with the Series’ custodian or a third-party sub-custodian. In the event of default or bankruptcy by the other party to the agreement, retention of the collateral may be subject to legal proceedings. All open repurchase agreements as of the date of this report were entered into on Dec. 30, 2016, and matured on the next business day.
Use of Estimates — The Series is an investment company, whose financial statements are prepared in conformity with U.S. GAAP. Therefore, the Series follows the accounting and reporting guidelines for investment companies. The preparation of financial statements in conformity with U.S. GAAP requires management to make estimates and assumptions that affect the fair value of investments, the reported amounts of assets and liabilities and disclosure of contingent assets and liabilities at the date of the financial statements, and the reported amounts of revenues and expenses during the reporting period. Actual results could differ from those estimates and the differences could be material.
Other — Expenses directly attributable to the Series are charged directly to the Series. Other expenses common to various funds within the Delaware Investments® Family of Funds are generally allocated among such funds on the basis of average net assets. Management fees and certain other expenses are paid monthly. Security transactions are recorded on the date the securities are purchased or sold (trade date) for financial reporting purposes. Costs used in calculating realized gains and losses on the sale of investment securities are those of the specific securities sold. Dividend income is recorded on the ex-dividend date and interest income is recorded on the accrual basis. Discounts and premiums on debt securities are accreted or amortized to interest income, respectively over the lives of the respective securities using the effective interest method. The Series declares and pays dividends from net investment income and distributions from net realized gain on investments, if any, following the close of the fiscal year. The Series may distribute more frequently, if necessary for tax purposes. Dividends and distributions, if any, are recorded on the ex-dividend date.
The Series may receive earnings credits from its custodian when positive cash balances are maintained, which may be used to offset custody fees. There were no such earnings credits for the year ended Dec. 31, 2016.
High Yield Series-15
Table of Contents
Delaware VIP® High Yield Series
Notes to financial statements (continued)
1. Significant Accounting Policies (continued)
The Series receives earnings credits from its transfer agent when positive cash balances are maintained, which may be used to offset transfer agent fees. If the amount earned is greater than $1.00, the expense paid under this arrangement is included on the “Statement of operations” under “Dividend disbursing and transfer agent fees and expenses” with the corresponding expense offset shown under “Less expense paid indirectly.” For the year ended Dec. 31, 2016, the Series earned $1 under this agreement.
2. Investment Management, Administration Agreements, and Other Transactions with Affiliates
In accordance with the terms of its investment management agreement, the Series pays Delaware Management Company (DMC), a series of Delaware Management Business Trust and the investment manager, an annual fee which is calculated daily at the rate of 0.65% on the first $500 million of average daily net assets of the Series, 0.60% on the next $500 million, 0.55% on the next $1.5 billion, and 0.50% on average daily net assets in excess of $2.5 billion.
DMC has contractually agreed to waive all or a portion of its investment advisory fees and/or pay/reimburse expenses (excluding any distribution and service (12b-1) fees, acquired fund fees and expenses, taxes, interest, short sale and dividend interest expenses, brokerage fees, certain insurance costs, and nonroutine expenses or costs, including, but not limited to, those relating to reorganizations, litigation, conducting shareholder meetings, and liquidations) in order to prevent annual series operating expenses from exceeding 0.74% of the Series’ average daily net assets from Jan. 1, 2016 through Dec. 31, 2016.* This waiver and reimbursement may only be terminated by agreement of DMC and the Series.
Delaware Investments Fund Services Company (DIFSC), an affiliate of DMC, provides fund accounting and financial administration oversight services to the Series. For these services, DIFSC’s fees are calculated based on the aggregate daily net assets of the Delaware Investments Family of Funds at the following annual rate: 0.0050% of the first $30 billion; 0.0045% of the next $10 billion; 0.0040% of the next $10 billion; and 0.0025% of aggregate average daily net assets in excess of $50 billion. The fees payable to DIFSC under the service agreement described above are allocated among all funds in the Delaware Investments Family of Funds on a relative net asset value (NAV) basis. For the year ended Dec. 31, 2016, the Series was charged $13,097 for these services. This amount is included on the “Statement of operations” under “Accounting and administration expenses.”
DIFSC is also the transfer agent and dividend disbursing agent of the Series. For these services, DIFSC’s fees are calculated at the annual rate of 0.0075% of the Series’ average daily net assets. This amount is included on the “Statement of operations” under “Dividend disbursing and transfer agent fees and expenses.” For the year ended Dec. 31, 2016, the Series was charged $20,757 for these services. Pursuant to a sub-transfer agency agreement between DIFSC and BNY Mellon Investment Servicing (US) Inc. (BNYMIS), BNYMIS provides certain sub-transfer agency services to the Series. Sub-transfer agency fees are paid by the Series and are also included on the “Statement of operation” under “Dividend disbursing and transfer agent fees and expenses.”
Pursuant to a distribution agreement and distribution plan, the Series pays Delaware Distributors, L.P. (DDLP), the distributor and an affiliate of DMC, an annual 12b-1 fee of 0.30% of the average daily net assets of the Service Class shares. DDLP has contracted to waive distribution and service fees from Jan. 1, 2016 through Dec. 31, 2016* in order to limit 12b-1 fees of the Service Class shares to 0.25% of average daily net assets. This waiver and reimbursement may only be terminated by agreement of DDLP and the Series. Standard Class shares pay no distribution and service expenses.
As provided in the investment management agreement, the Series bears a portion of the cost of certain resources shared with DMC, including the cost of internal personnel of DMC and/or its affiliates that provide legal, tax, and regulatory reporting services to the Series. For the year ended Dec. 31, 2016, the Series was charged $5,810 for internal legal, tax, and regulatory reporting services provided by DMC and/or its affiliates’ employees. This amount is included on the “Statement of operations” under “Legal fees.”
Trustees’ fees include expenses accrued by the Series for each Trustee’s retainer and meeting fees. Certain officers of DMC, DIFSC, and DDLP are officers and/or Trustees of the Trust. These officers and Trustees are paid no compensation by the Series.
*The aggregate contractual waiver period covering this report is from April 29, 2015 through May 1, 2017.
Cross trades for the year ended Dec. 31, 2016 were executed by the Series pursuant to procedures adopted by the Board designed to ensure compliance with Rule 17a-7 under the 1940 Act. Cross trading is the buying or selling of portfolio securities between series of investment companies, or between a series of an investment company and another entity, that are or could be considered affiliates by virtue of having a common investment advisor (or affiliated investment advisors), common directors/trustees and/or common officers. At its regularly scheduled meetings, the Board reviews such transactions for compliance with the procedures adopted by the Board. Pursuant to these procedures, for the year ended Dec. 31, 2016, the Series engaged in securities purchases of $1,520,379 and securities sales of $13,191,657, which resulted in net realized gains of $70,038.
3. Investments
For the year ended Dec. 31, 2016, the Series made purchases and sales of investment securities other than short-term investments as follows:
Purchases | $ | 295,491,411 | ||
Sales | 312,341,046 |
High Yield Series-16
Table of Contents
Delaware VIP® High Yield Series
Notes to financial statements (continued)
3. Investments (continued)
At Dec. 31, 2016, the cost and unrealized appreciation (depreciation) of investments for federal income tax purposes for the Series were as follows:
| Cost of Investments | Aggregate Unrealized Appreciation of Investments | Aggregate Unrealized Depreciation of Investments | Net Unrealized Appreciation of Investments | |||||||||||||||||
| $265,481,977 | $8,813,252 | $(1,161,042) | $7,652,210 | |||||||||||||||||
U.S. GAAP defines fair value as the price that the Series would receive to sell an asset or pay to transfer a liability in an orderly transaction between market participants at the measurement date under current market conditions. A three-level hierarchy for fair value measurements has been established based upon the transparency of inputs to the valuation of an asset or liability. Inputs may be observable or unobservable and refer broadly to the assumptions that market participants would use in pricing the asset or liability. Observable inputs reflect the assumptions market participants would use in pricing the asset or liability based on market data obtained from sources independent of the reporting entity. Unobservable inputs reflect the reporting entity’s own assumptions about the assumptions that market participants would use in pricing the asset or liability based on the best information available under the circumstances. The Series’ investment in its entirety is assigned a level based upon the observability of the inputs which are significant to the overall valuation. The three-level hierarchy of inputs is summarized below.
| Level 1 | - | Inputs are quoted prices in active markets for identical investments. (Examples: equity securities, open-end investment companies, futures contracts, exchange-traded options contracts) | ||
| Level 2 | - | Other observable inputs, including, but not limited to: quoted prices for similar assets or liabilities in markets that are active, quoted prices for identical or similar assets or liabilities in markets that are not active, inputs other than quoted prices that are observable for the assets or liabilities (such as interest rates, yield curves, volatilities, prepayment speeds, loss severities, credit risks, and default rates), or other market-corroborated inputs. (Examples: debt securities, government securities, swap contracts, foreign currency exchange contracts, foreign securities utilizing international fair value pricing, broker-quoted securities, fair valued securities) | ||
| Level 3 | - | Significant unobservable inputs, including the Series’ own assumptions used to determine the fair value of investments. (Examples: broker-quoted securities, fair valued securities) |
Level 3 investments are valued using significant unobservable inputs. The Series may also use an income-based valuation approach in which the anticipated future cash flows of the investment are discounted to calculate fair value. Discounts may also be applied due to the nature or duration of any restrictions on the disposition of the investments. Valuations may also be based upon current market prices of securities that are comparable in coupon, rating, maturity, and industry. The derived value of a Level 3 investment may not represent the value which is received upon disposition and this could impact the results of operations.
The following table summarizes the valuation of the Series’ investments by fair value hierarchy levels as of Dec. 31, 2016:
| Securities | Level 2 | Level 3 | Total | ||||||||||||
Corporate Debt | $242,927,956 | $ — | $242,927,956 | ||||||||||||
Senior Secured Loans1 | 17,409,524 | 931,163 | 18,340,687 | ||||||||||||
Common Stock | — | — | — | ||||||||||||
Preferred Stock | 2,747,544 | — | 2,747,544 | ||||||||||||
Short-Term Investments | 9,118,000 | — | 9,118,000 | ||||||||||||
Total Value of Securities | $272,203,024 | $931,163 | $273,134,187 | ||||||||||||
|
|
|
|
|
| ||||||||||
1Security type is valued across multiple levels. The amount attributed to Level 1 investments and Level 2 investments represents the following percentages of the total market value of these security types for the Series. Level 1 investments represent exchange-traded investments, while Level 2 investments represent investments with observable inputs or matrix priced investments.
| Level 2 | Level 3 | Total | ||||||||
Senior Secured Loans | 94.92 | % | 5.08% | 100.00 | % | |||||
A security that has been valued at zero on the “Schedule of investments” is considered to be Level 3 investments in this table.
During the year ended Dec. 31, 2016, there were no transfers between Level 1 investments, Level 2 investments, or Level 3 investments that had a significant impact to the Series. The Series’ policy is to recognize transfers between levels at the beginning of the reporting period.
High Yield Series-17
Table of Contents
Delaware VIP® High Yield Series
Notes to financial statements (continued)
3. Investments (continued)
A reconciliation of Level 3 investments is presented when the Series has a significant amount of Level 3 investments at the beginning, interim, or end of the year in relation to net assets. Management has determined not to provide a reconciliation of Level 3 investments as they were not considered significant to the Series’ net assets at the beginning, interim, or end of the year. Management has determined not to provide additional disclosure on Level 3 inputs since the Level 3 investments are not considered significant to the Series’ net assets at the end of the year.
4. Dividend and Distribution Information
Income and long-term capital gain distributions are determined in accordance with federal income tax regulations, which may differ from U.S. GAAP. Additionally, distributions from net short-term gains on sales of investment securities are treated as ordinary income for federal income tax purposes. The tax character of dividends and distributions paid during the years ended Dec. 31, 2016 and 2015 was as follows:
| Year ended | ||||||||
| 12/31/16 | 12/31/15 | |||||||
Ordinary Income income | $19,581,573 | $21,886,803 | ||||||
Long-term capital gain | — | 4,636,925 | ||||||
Total | $19,581,573 | $26,523,728 | ||||||
5. Components of Net Assets on a Tax Basis
As of Dec. 31, 2016, the components of net assets on a tax basis were as follows:
Shares of beneficial interest | $287,194,116 | |||
Undistributed ordinary income | 15,708,182 | |||
Other temporary differences | (2,148,795 | ) | ||
Capital loss carryforwards | (34,960,658 | ) | ||
Net unrealized appreciation of investments | 7,652,210 | |||
|
| |||
Net assets | $273,445,055 | |||
|
|
The differences between book basis and tax basis components of net assets are primarily attributable to tax deferral of losses on wash sales, tax treatment of market discount and premium on debt instruments, troubled debt and trust preferred securities.
For financial reporting purposes, capital accounts are adjusted to reflect the tax character of permanent book/tax differences. Reclassifications are primarily due to tax treatment of market discount and premium on debt instruments. Results of operations and net assets were not affected by these reclassifications. For the year ended Dec. 31, 2016 the Series recorded the following reclassifications:
| Undistributed Net Investment Income | Accumulated Net Realized Loss | |||
| $(333,579) | $333,579 |
Under the Regulated Investment Company Modernization Act of 2010 (Act), net capital losses recognized for tax years beginning after Dec. 22, 2010 may be carried forward indefinitely, and their character is retained as short-term and/or long-term losses.
The Fund has capital loss carryovers available to offset future realized capital gains as follows:
Loss carryforward character No Expiration | ||||||||||
Short-term | Long-term | Total | ||||||||
| $ | 13,258,383 | $ | 21,702,275 | $ | 34,960,658 | |||||
High Yield Series-18
Table of Contents
Delaware VIP® High Yield Series
Notes to financial statements (continued)
6. Capital Shares
Transactions in capital shares were as follows:
Year ended
| ||||||||
12/31/16 | 12/31/15 | |||||||
Shares sold: | ||||||||
Standard Class | 3,403,817 | 2,683,525 | ||||||
Service Class | 3,320,262 | 3,177,996 | ||||||
Shares issued upon reinvestment of dividends and distributions: | ||||||||
Standard Class | 1,759,627 | 2,005,187 | ||||||
Service Class | 2,376,520 | 2,893,829 | ||||||
|
|
|
| |||||
| 10,860,226 | 10,760,537 | |||||||
|
|
|
| |||||
Shares redeemed: | ||||||||
Standard Class | (6,115,481 | ) | (6,467,748 | ) | ||||
Service Class | (7,657,285 | ) | (9,562,322 | ) | ||||
|
|
|
| |||||
| (13,772,766 | ) | (16,030,070 | ) | |||||
|
|
|
| |||||
Net decrease | (2,912,540 | ) | (5,269,533 | ) | ||||
|
|
|
| |||||
7. Line of Credit
The Series, along with certain other funds in the Delaware Investments® Family of Funds (Participants), was a participant in a $155,000,000 revolving line of credit intended to be used for temporary or emergency purposes as an additional source of liquidity to fund redemptions of investor shares. Under the agreement, the Participants were charged an annual commitment fee of 0.10%, which was allocated across the Participants on the basis of relative net assets of each Participant’s allocation of the entire facility. The Participants were permitted to borrow up to a maximum of one third of their net assets under the agreement. Each Participant was individually, and not jointly, liable for its particular advances, if any, under the line of credit. The line of credit under the agreement expired on Nov. 7, 2016.
On Nov. 7, 2016, the Series, along with the other Participants, entered into an amendment to the agreement for a $155,000,000 revolving line of credit. The line of credit is to be used as described above and operates in substantially the same manner as the original agreement, with the exception of the annual commitment fee.Under the amendment to the agreement, the Participants are charged an annual commitment fee of 0.15%, which is allocated across the Participants on the basis of relative net assets of each Participant’s allocation of the entire facility. The line of credit available under the agreement expires on Nov. 6, 2017.
The Series had no amount outstanding as of Dec. 31, 2016 or at any time during the year then ended.
8. Offsetting
In December 2011, the Financial Accounting Standards Board (FASB) issued guidance that expanded disclosure requirements on the offsetting of certain assets and liabilities. The disclosures are required for investments and derivative financial instruments subject to master netting or similar agreements which are eligible for offset on the “Statement of assets and liabilities,” and require an entity to disclose both gross and net information about such investments and transactions in the financial statements. In January 2013, the FASB issued guidance that clarified which investments and transactions are subject to the offsetting disclosure requirements.The scope of the disclosure requirements for offsetting is limited to derivative instruments, repurchase agreements and reverse repurchase agreements, and securities borrowing.
In order to better define its contractual rights and to secure rights that will help the Series mitigate its counterparty risk, the Series entered into an International Swaps and Derivatives Association, Inc. Master Agreement (ISDA Master Agreement) or a similar agreement with certain of its derivative contract counterparties. An ISDA Master Agreement is a bilateral agreement between the Series and a counterparty that governs certain over-the-counter (OTC) derivatives and foreign exchange contracts and typically contains, among other things, collateral posting items and netting provisions in the event of a default and/or termination event. Under an ISDA Master Agreement, the Series may, under certain circumstances, offset with the counterparty certain derivative financial instruments payables and/or receivables with collateral held and/or posted and create one single net payment. The provisions of the ISDA Master Agreement typically permit a single net payment in the event of default (close-out), including the bankruptcy or insolvency of the counterparty. However, bankruptcy or insolvency laws of a particular jurisdiction may impose restrictions on or prohibitions against the right of offset in bankruptcy, insolvency, or other events.
For financial reporting purposes, the Series does not offset derivative assets and derivatives liabilities that are subject to netting arrangements on the “Statement of assets and liabilities.”
High Yield Series-19
Table of Contents
Delaware VIP® High Yield Series
Notes to financial statements (continued)
8. Offsetting (continued)
At Dec. 31, 2016, the Series had the following assets and liabilities subject to offsetting provisions:
Master Repurchase Agreements
| Fair Value of | ||||||||||||||||
Counterparty | Repurchase Agreements | Non-Cash Collateral Received(a) | Cash Collateral Received | Net Collateral Received | Net Exposure(b) | |||||||||||
Bank of America Merrill Lynch | $3,074,768 | $(3,074,768) | $— | $(3,074,768) | $— | |||||||||||
Bank of Montreal | 3,587,230 | (3,587,230) | — | (3,587,230) | — | |||||||||||
BNP Paribas | 2,456,002 | (2,456,002) | — | (2,456,002) | — | |||||||||||
|
|
|
|
|
|
|
| |||||||||
Total | $9,118,000 | $(9,118,000) | $— | $(9,118,000) | $— | |||||||||||
|
|
|
|
|
|
|
| |||||||||
(a)The value of the related collateral received exceeded the value of the repurchase agreements as of Dec. 31, 2016.
(b)Net exposure represents the receivable (payable) that would be due from (to) the counterparty in the event of default.
9. Securities Lending
The Series, along with other funds in the Delaware Investments® Family of Funds, may lend its securities pursuant to a security lending agreement (Lending Agreement) with The Bank of New York Mellon (BNY Mellon). At the time a security is loaned, the borrower must post collateral equal to the required percentage of the market value of the loaned security, including any accrued interest. The required percentage is: (1) 102% with respect to U.S. securities and foreign securities that are denominated and payable in U.S. dollars; and (2) 105% with respect to foreign securities. With respect to each loan, if on any business day the aggregate market value of securities collateral plus cash collateral held is less than the aggregate market value of the securities that are the subject of such loan, the borrower will be notified to provide additional collateral by the end of the following business day, which, together with the collateral already held, will be not less than the applicable initial collateral requirements for such security loan. If the aggregate market value of securities collateral and cash collateral held with respect to a security loan exceeds the applicable initial collateral requirement, upon the request of the borrower, BNY Mellon must return enough collateral to the borrower by the end of the following business day to reduce the value of the remaining collateral to the applicable initial collateral requirement for such security loan. As a result of the foregoing, the value of the collateral held with respect to a loaned security on any particular day may be more or less than the value of the security on loan.
Cash collateral received by each series of the Trust is generally invested in a series of individual separate accounts, each corresponding to a Series. The investment guidelines permit each separate account to hold certain securities that would be considered eligible securities for a money market fund. Cash collateral received is generally invested in government securities; certain obligations issued by government sponsored enterprises; repurchase agreements collateralized by U.S. Treasury securities; obligations issued by the central government of any Organization for Economic Cooperation and Development (OECD) country or its agencies, instrumentalities, or establishments; obligations of supranational organizations; commercial paper, notes, bonds, and other debt obligations; certificates of deposit, time deposits, and other bank obligations; and asset-backed securities.
In the event of default or bankruptcy by the lending agent, realization and/or retention of the collateral may be subject to legal proceedings. In the event the borrower fails to return loaned securities and the collateral received is insufficient to cover the value of the loaned securities and provided such collateral shortfall is not the result of investment losses, the lending agent has agreed to pay the amount of the shortfall to the Series or, at the discretion of the lending agent, replace the loaned securities. The Series continues to record dividends or interest, as applicable, on the securities loaned and is subject to changes in value of the securities loaned that may occur during the term of the loan. The Series has the right under the Lending Agreement to recover the securities from the borrower on demand. With respect to security loans collateralized by non-cash collateral, the Series receives loan premiums paid by the borrower. With respect to security loans collateralized by cash collateral, the earnings from the collateral investments are shared among the Series, the security lending agent, and the borrower. The Series records security lending income net of allocations to the security lending agent and the borrower.
The Series may incur investment losses as a result of investing securities lending collateral. This could occur if an investment in the collateral investment account defaulted or became impaired. Under those circumstances, the value of the Series’ cash collateral account may be less than the amount the Series would be required to return to the borrowers of the securities and the Series would be required to make up for this shortfall.
During the year ended Dec. 31, 2016, the Series had no securities out on loan.
10. Credit and Market Risk
The Series invests in high yield fixed income securities, which are securities rated lower than BBB- by Standard & Poor’s Financial Services LLC and lower than Baa3 by Moody’s Investors Service, Inc., or similarly rated by another nationally recognized statistical rating organization. Investments in these higher yielding securities are generally accompanied by a greater degree of credit risk than higher rated securities. Additionally, lower rated securities may be more susceptible to adverse economic and competitive industry conditions than investment grade securities.
High Yield Series-20
Table of Contents
Delaware VIP® High Yield Series
Notes to financial statements (continued)
10. Credit and Market Risk (continued)
The Series invests in certain obligations that may have liquidity protection designed to ensure that the receipt of payments due on the underlying security is timely. Such protection may be provided through guarantees, insurance policies or letters of credit obtained by the issuer or sponsor through third parties, through various means of structuring the transaction or through a combination of such approaches. The Series will not pay any additional fees for such credit support, although the existence of credit support may increase the price of the security.
The Series invests in bank loans and other securities that may subject it to direct indebtedness risk, the risk that the Series will not receive payment of principal, interest, and other amounts due in connection with these investments and will depend primarily on the financial condition of the borrower. Loans that are fully secured offer the Series more protection than unsecured loans in the event of nonpayment of scheduled interest or principal, although there is no assurance that the liquidation of collateral from a secured loan would satisfy the corporate borrower’s obligation, or that the collateral can be liquidated. Some loans or claims may be in default at the time of purchase. Certain of the loans and the other direct indebtedness acquired by the Series may involve revolving credit facilities or other standby financing commitments that obligate the Series to pay additional cash on a certain date or on demand. These commitments may require the Series to increase its investment in a company at a time when the Series might not otherwise decide to do so (including at a time when the company’s financial condition makes it unlikely that such amounts will be repaid). To the extent that the Series is committed to advance additional funds, it will at all times hold and maintain cash or other high grade debt obligations in an amount sufficient to meet such commitments.
As the Series may be required to rely upon another lending institution to collect and pass on to the Series amounts payable with respect to the loan and to enforce the Series’ rights under the loan and other direct indebtedness, an insolvency, bankruptcy, or reorganization of the lending institution may delay or prevent the Series from receiving such amounts. The highly leveraged nature of many loans may make them especially vulnerable to adverse changes in economic or market conditions. Investments in such loans and other direct indebtedness may involve additional risk to the Series.
The Series may invest up to 15% of its net assets in illiquid securities, which may include securities with contractual restrictions on resale, securities exempt from registration under Rule 144A, promulgated under the Securities Act of 1933, as amended, and other securities which may not be readily marketable. The relative illiquidity of these securities may impair the Series from disposing of them in a timely manner and at a fair price when it is necessary or desirable to do so. While maintaining oversight, the Board has delegated to DMC, the day-to-day functions of determining whether individual securities are liquid for purposes of the Series’ limitation on investments in illiquid securities. Securities eligible for resale pursuant to Rule 144A, which are determined to be liquid, are not subject to the Series’ 15% limit on investments in illiquid securities. Rule 144A securities have been identified on the “Schedule of investments.”
11. Contractual Obligations
The Series enters into contracts in the normal course of business that contain a variety of indemnifications. The Series’ maximum exposure under these arrangements is unknown. However, the Series has not had prior claims or losses pursuant to these contracts. Management has reviewed the Series’ existing contracts and expects the risk of loss to be remote.
12. General Motors Term Loan Litigation
The Series received notice of a litigation proceeding related to a General Motors Corporation (G.M.) term loan participation previously held by the Series in 2009. We believe the matter subject to the litigation notice will likely lead to a recovery from the Series of certain amounts received by the Series because a U.S. Court of Appeals has ruled that the Series and similarly situated investors were unsecured creditors rather than secured lenders of G.M. as a result of an erroneous Uniform Commercial Code filing made by a third party. The Series received the full principal on the loans in 2009 after the G.M. bankruptcy. However, based upon the court ruling the estate is seeking to recover such amounts arguing that, as unsecured creditors, the Series should not have received payment in full. Based upon currently available information related to the litigation and the Series’ potential exposure, the Series recorded a liability of $3,069,708 and an asset of $920,913 based on the expected recoveries to unsecured creditors as of Dec. 31, 2016 that resulted in a net decrease in the Series’ NAV to reflect this likely recovery.
13. Recent Accounting Pronouncements
On Oct. 13, 2016, the Securities and Exchange Commission amended existing rules intended to modernize reporting and disclosure of information. These amendments relate to Regulation S-X which sets forth the form and content of financial statements. At this time, management is evaluating the implications of adopting these amendments and their impact on the financial statements and accompanying notes.
14. Subsequent Events
Management has determined that no material events or transactions occurred subsequent to Dec. 31, 2016 that would require recognition or disclosure in the Series’ financial statements.
High Yield Series-21
Table of Contents
Delaware VIP® Trust — Delaware VIP High Yield Series
Report of independent registered public accounting firm
To the Board of Trustees of Delaware VIP Trust and Shareholders of Delaware VIP High Yield Series:
In our opinion, the accompanying statement of assets and liabilities, including the schedule of investments, and the related statements of operations and of changes in net assets and the financial highlights present fairly, in all material respects, the financial position of Delaware VIP High Yield Series (one of the series constituting Delaware VIP Trust, hereafter referred to as the “Series”) as of December 31, 2016, the results of its operations for the year then ended, the changes in its net assets for each of the two years in the period then ended and the financial highlights for each of the five years in the period then ended, in conformity with accounting principles generally accepted in the United States of America. These financial statements and financial highlights (hereafter referred to as “financial statements”) are the responsibility of the Series’ management. Our responsibility is to express an opinion on these financial statements based on our audits. We conducted our audits of these financial statements in accordance with the standards of the Public Company Accounting Oversight Board (United States). Those standards require that we plan and perform the audit to obtain reasonable assurance about whether the financial statements are free of material misstatement. An audit includes examining, on a test basis, evidence supporting the amounts and disclosures in the financial statements, assessing the accounting principles used and significant estimates made by management, and evaluating the overall financial statement presentation. We believe that our audits, which included confirmation of securities as of December 31, 2016 by correspondence with the custodian and brokers, provide a reasonable basis for our opinion.
PricewaterhouseCoopers LLP
Philadelphia, Pennsylvania
February 16, 2017
High Yield Series-22
Table of Contents
Delaware VIP® Trust — Delaware VIP High Yield Series
Other Series information (Unaudited)
Board consideration of Delaware VIP High Yield Series investment management agreement
At a meeting held on Aug. 16–18, 2016 (the “Annual Meeting”), the Board of Trustees (the “Board”), including a majority of disinterested or independent Trustees, approved the renewal of the Investment Advisory Agreement for Delaware VIP High Yield Series (the “Series”). In making its decision, the Board considered information furnished at regular quarterly Board meetings, including reports detailing Series performance, investment strategies, and expenses, as well as information prepared specifically in connection with the renewal of the investment advisory and sub-advisory contracts. Information furnished specifically in connection with the renewal of the Investment Management Agreement with Delaware Management Company (“DMC”) included materials provided by DMC and its affiliates (“Delaware Investments”) concerning, among other things, the nature, extent, and quality of services provided to the Series; the costs of such services to the Series; economies of scale; and the investment manager’s financial condition and profitability. In addition, in connection with the Annual Meeting, reports were provided to the Trustees in May 2016 and included reports provided by Broadridge Financial Solutions (“Broadridge”). The Broadridge reports compared the Series’ investment performance and expenses with those of other comparable mutual funds. The Independent Trustees reviewed and discussed the Broadridge reports with independent legal counsel to the Independent Trustees. In addition to the information noted above, the Board also requested and received information regarding DMC’s policy with respect to advisory fee levels and its breakpoint philosophy; the structure of portfolio manager compensation; comparative client fee information; and any constraints or limitations on the availability of securities for certain investment styles, which had in the past year inhibited, or which were likely in the future to inhibit, the investment manager’s ability to invest fully in accordance with Series policies.
In considering information relating to the approval of the Series’ advisory agreement, the Independent Trustees received assistance and advice from and met separately with independent legal counsel to the Independent Trustees. Although the Board gave attention to all information furnished, the following discussion identifies, under separate headings, the primary factors taken into account by the Board during its contract renewal considerations.
Nature, extent, and quality of service. The Board considered the services provided by DMC to the Series and its shareholders. In reviewing the nature, extent, and quality of services, the Board considered reports furnished to it throughout the year, which covered matters such as the relative performance of the Series; compliance of portfolio managers with the investment policies, strategies, and restrictions for the Series; compliance by DMC and Delaware Distributors, L.P. (together, “Management”) personnel with the Code of Ethics adopted throughout the Delaware Investments® Family of Funds complex; and adherence to fair value pricing procedures as established by the Board. The Board was pleased with the current staffing of the Series’ investment advisor and the emphasis placed on research in the investment process. The Board recognized DMC’s receipt of several industry distinctions during the past several years. The Board gave favorable consideration to DMC’s efforts to control expenditures while maintaining service levels committed to Series matters. The Board was satisfied with the nature, extent, and quality of the overall services provided by DMC.
Investment performance. The Board placed significant emphasis on the investment performance of the Series in view of the importance of investment performance to shareholders. Although the Board gave appropriate consideration to performance reports and discussions with portfolio managers at Board meetings throughout the year, the Board gave particular weight to the Broadridge reports furnished for the Annual Meeting. The Broadridge reports prepared for the Series showed the investment performance of its Standard Class shares in comparison to a group of similar funds as selected by Broadridge (the “Performance Universe”). A fund with the best performance ranked first, and a fund with the poorest performance ranked last. The highest/best performing 25% of funds in the Performance Universe make up the first quartile; the next 25%, the second quartile; the next 25%, the third quartile; and the poorest/worst performing 25% of funds in the Performance Universe make up the fourth quartile. Comparative annualized performance for the Series was shown for the past 1-, 3-, 5-, and 10-year periods, as applicable, ended Jan. 31, 2016. The Board’s objective is that the Series’ performance for the periods considered be at or above the median of its Performance Universe.
The Performance Universe for the Series consisted of the Series and all high yield funds underlying variable insurance products as selected by Broadridge. The Broadridge report comparison showed that the Series’ total return for the 1- and 3-year periods was in the fourth quartile of its Performance Universe. The report further showed that the Series’ total return for the 5- and 10-year periods was in the third quartile and second quartile, respectively, of its Performance Universe. The Board observed that the Series’ short and intermediate term performance was not in line with the Board’s objective. In evaluating the Series’ performance, the Board considered the Series’ long term performance results, which were strong, and consequently, the Board was satisfied with performance.
Comparative expenses. The Board considered expense comparison data for the Delaware Investments® Family of Funds. Management provided the Board with information on pricing levels and fee structures for the Series as of its most recently completed fiscal year. The Board also focused on the comparative analysis of effective management fees and total expense ratios of the Series versus effective management fees and expense ratios of a group of similar funds as selected by Broadridge (the “Expense Group”). In reviewing comparative costs, the Series’ contractual management fee and the actual management fee incurred by the Series were compared with the contractual management fees (assuming all funds in the Expense Group were similar in size to the Series) and actual management fees (as reported by each fund) within the Expense Group, taking into account any applicable breakpoints and fee waivers. The Series‘ total expenses were also compared with those of its Expense Group.The Broadridge total expenses, for comparative consistency,were shown by Broadridge for Standard Class shares which do not charge 12b-1 and non-12b-1 service fees. The Board’s objective is to limit the Series’ total expense ratio to be competitive with that of the Expense Group.
High Yield Series-23
Table of Contents
Delaware VIP® High Yield Series
Other Series information (Unaudited)
Board consideration of Delaware VIP High Yield Series investment management agreement (continued)
The expense comparisons for the Series showed that the actual management fee and total expenses were in the quartile with the second highest expenses of its Expense Group. The Series’ total expenses were not in line with the Board’s objective. In evaluating total expenses, the Board considered 12b-1 waivers in place through May 1, 2017 and various initiatives implemented by Management. The Board was satisfied with Management’s efforts to improve the Series’ total expense ratio and to bring it in line with the Board’s objective.
Management profitability. The Board considered the level of profits realized by DMC in connection with the operation of the Series. In this respect, the Board reviewed the Investment Management Profitability Analysis that addressed the overall profitability of DMC’s business in providing management and other services to each of the individual funds and the Delaware Investments® Family of Funds as a whole. Specific attention was given to the methodology followed in allocating costs for the purpose of determining profitability. Management stated that the level of profits of DMC, to a certain extent, reflects recent operational cost savings and efficiencies initiated by DMC. The Board considered DMC’s efforts to improve services provided to fund shareholders and to meet additional regulatory and compliance requirements resulting from recent industry-wide Securities and Exchange Commission initiatives. The Board also considered the extent to which DMC might derive ancillary benefits from fund operations, including the potential for procuring additional business as a result of the prestige and visibility associated with its role as service provider to the Delaware Investments Family of Funds and the benefits from allocation of fund brokerage to improve trading efficiencies. The Board found that the management fees were reasonable in light of the services rendered and the profitability of DMC.
Economies of scale. The Trustees considered whether economies of scale are realized by DMC as the Series’ assets increase and the extent to which any economies of scale are reflected in the level of management fees charged. The Trustees reviewed the standardized advisory fee pricing and structure approved by the Board and shareholders, which includes breakpoints, and which applies to most funds in the Delaware Investments Family of Funds complex. Breakpoints in the advisory fee occur when the advisory fee rate is reduced on assets in excess of specified levels. Breakpoints result in a lower advisory fee, than would otherwise be the case in the absence of breakpoints, when the asset levels specified in the breakpoints are exceeded. The Board noted that the fee under the Series’ management contract fell within the standardized fee pricing structure. Although, as of May 31, 2016, the Series has not reached a size at which the advantages of any breakpoints in the applicable fee schedule, the Board recognized that the fee was structured so that if the Series grows, economies of scale may be shared.
Tax Information
All disclosures are based on financial information available as of the date of this annual report and, accordingly are subject to change. For any and all items requiring reporting, it is the intention of the Series to report the maximum amount permitted under the Internal Revenue Code and the regulations thereunder.
For the year ended Dec. 31, 2016, the Series reports distributions paid during the year as follows:
(A) Ordinary Income Distributions (Tax Basis) |
| 100.00% |
(A) is based on a percentage of the Series’ total distributions.
High Yield Series-24
Table of Contents
Delaware Investments® Family of Funds
BOARD OF TRUSTEES / DIRECTORS AND OFFICERS ADDENDUM
A mutual fund is governed by a Board of Trustees/Directors (“Trustees”), which has oversight responsibility for the management of a fund’s business affairs. Trustees establish procedures and oversee and review the performance of the investment manager, the distributor, and others who perform services for the fund. The independent fund trustees, in particular, are advocates for shareholder interests. Each trustee has served in that capacity since he or she was elected to or appointed to the Board of Trustees, and will continue to serve until his or her retirement or the election of a new trustee in his or her place. The following is a list of the Trustees and Officers with certain background and related information.
Name, Address, and Birth Date | Position(s) Held with Fund(s) | Length of Time Served | Principal Occupation(s) During the Past Five Years | Number of Portfolios in Fund by Trustee or Officer | Other Directorships Held by Trustee or Officer | |||||
| INTERESTED TRUSTEE | ||||||||||
Shawn K. Lytle1, 3 2005 Market Street Philadelphia, PA 19103
February 1970 | President, Chief Executive Officer, and Trustee | Trustee since September 2015
President and Chief Executive Officer since August 2015
| Shawn K. Lytle has served as President of Delaware Investments2 since June 2015 and was the Regional Head of Americas for UBS Global Asset Management from 2010 through 2015. | 62 | Trustee — UBS Relationship Funds, SMA Relationship Trust, and UBS Funds (May 2010–April 2015) | |||||
| INDEPENDENT TRUSTEES | ||||||||||
Thomas L. Bennett 2005 Market Street Philadelphia, PA 19103
October 1947
| Chairman and Trustee | Trustee since March 2005
Chairman since March 2015 | Private Investor (March 2004–Present) | 62 | None | |||||
Ann D. Borowiec 2005 Market Street Philadelphia, PA 19103
November 1958 | Trustee | Since March 2015 | Chief Executive Officer Private Wealth Management (2011–2013) and Market Manager, New Jersey Private Bank (2005–2011) — J.P. Morgan Chase & Co. | 62 | Director — Banco Santander International
Director — Santander Bank, N.A. | |||||
Joseph W. Chow 2005 Market Street Philadelphia, PA 19103
January 1953 | Trustee | Since January 2013 | Executive Vice President (Emerging Economies Strategies, Risks, and Corporate Administration) State Street Corporation (July 2004–March 2011) | 62 | Director and Audit Committee Member — Hercules Technology Growth Capital, Inc. (2004–2014) | |||||
John A. Fry 2005 Market Street Philadelphia, PA 19103
May 1960 | Trustee | Since January 2001 | President — Drexel University (August 2010–Present)
President — Franklin & Marshall College (July 2002–July 2010)
| 62 | Director, Audit Committee and Governance Committee Member — Community Health Systems
Director — Drexel Morgan & Co.
Director, Audit Committee Member — vTv Therapeutics LLC | |||||
Lucinda S. Landreth 2005 Market Street Philadelphia, PA 19103
June 1947 | Trustee | Since March 2005 | Private Investor (2004–Present) | 62 | None | |||||
High Yield Series-25
Table of Contents
Name, Address, and Birth Date | Position(s) Held with Fund(s) | Length of Time Served | Principal Occupation(s) During the Past Five Years | Number of Portfolios in Fund by Trustee or Officer | Other Directorships Held by Trustee or Officer | |||||
Frances A. Sevilla-Sacasa 2005 Market Street Philadelphia, PA 19103
January 1956 | Trustee | Since September 2011 | Chief Executive Officer — Banco Itaú International (April 2012–December 2016)
Executive Advisor to Dean (August 2011–March 2012) and Interim Dean (January 2011–July 2011) — University of Miami School of Business Administration
President — U.S. Trust, Bank of America Private Wealth Management (Private Banking) (July 2007–December 2008) | 62 | Trust Manager and Audit Committee Member —Camden Property Trust | |||||
Thomas K. Whitford 2005 Market Street Philadelphia, PA 19103
March 1956 | Trustee | Since January 2013 | Vice Chairman (2010–April 2013) — PNC Financial Services Group | 62 | Director — HSBC Finance Corporation and HSBC North America Holdings Inc.
Director — HSBC Bank | |||||
Janet L. Yeomans 2005 Market Street Philadelphia, PA 19103
July 1948 | Trustee | Since April 1999 | Vice President and Treasurer (January 2006–July 2012)
Vice President — Mergers & Acquisitions (January 2003–January 2006), and Vice President and Treasurer (July 1995–January 2003) — 3M Company | 62 | Director, Personnel and Compensation Committee Chair, and Audit Committee Member — Okabena Company | |||||
| OFFICERS | ||||||||||
David F. Connor 2005 Market Street Philadelphia, PA 19103
December 1963 | Senior Vice President, General Counsel, and Secretary | Senior Vice President, since May 2013; General Counsel since May 2015; Secretary since October 2005 | David F. Connor has served in various capacities at different times at Delaware Investments. | 62 | None3 | |||||
Daniel V. Geatens 2005 Market Street Philadelphia, PA 19103
October 1972 | Vice President and Treasurer | Treasurer since October 2007 | Daniel V. Geatens has served in various capacities at different times at Delaware Investments. | 62 | None3 | |||||
Richard Salus 2005 Market Street Philadelphia, PA 19103
October 1963 | Senior Vice President and Chief Financial Officer | Chief Financial Officer since November 2006 | Richard Salus has served in various capacities at different times at Delaware Investments. | 62 | None3 | |||||
| 1 | Shawn K. Lytle is considered to be an “Interested Trustee” because he is an executive officer of the Fund’s(s’) investment advisor. |
| 2 | Delaware Investments is the marketing name for Delaware Management Holdings, Inc. and its subsidiaries, including the Fund’s(s’) investment advisor, principal underwriter, and its transfer agent. |
| 3 | Shawn K. Lytle, David F. Connor, Daniel V. Geatens, and Richard Salus serve in similar capacities for the six portfolios of the Optimum Fund Trust, which have the same investment advisor, principal underwriter, and transfer agent as the registrant. |
The Statement of Additional Information for the Fund(s) includes additional information about the Trustees and Officers and is available, without charge, upon request by calling 800 523-1918.
High Yield Series-26
Table of Contents
The Series files its complete schedule of portfolio holdings with the Securities and Exchange Commission (Commission) for the first and third quarters of each fiscal year on Form N-Q. The Series’ Forms N-Q, as well as a description of the policies and procedures that the Series uses to determine how to vote proxies (if any) relating to portfolio securities are available without charge (i) upon request, by calling 800 523-1918; and (ii) on the Commission’s website at sec.gov. In addition, a description of the policies and procedures that the Series uses to determine how to vote proxies (if any) relating to portfolio securities and the Schedule of Investments included in the Series’ most recent Form N-Q are available without charge on the Delaware Investments® Funds’ website at delawareinvestments.com/vip/literature. The Series’ Forms N-Q may be reviewed and copied at the Commission’s Public Reference Room in Washington, DC; information on the operation of the Public Reference Room may be obtained by calling 800 SEC-0330.
Information (if any) regarding how the Series voted proxies relating to portfolio securities during the most recently disclosed 12-month period ended June 30 is available without charge (i) through the Delaware Investments Funds’ website at delawareinvestments.com/proxy; and (ii) on the Commission’s website at sec.gov.
| ||||
| AR-VIPHY [12/16] BNY 21384 (2/17) (18579) | High Yield Series-27 |
Table of Contents
Delaware VIP® Trust
|
Delaware VIP International Value Equity Series
|
Annual report
|
December 31, 2016 |
|
Table of Contents
| 1 | |||||
| 3 | |||||
| 5 | |||||
| 6 | |||||
| 7 | |||||
| 10 | |||||
| 11 | |||||
| 11 | |||||
| 12 | |||||
| 14 | |||||
| 22 | |||||
| 23 | |||||
| 25 | |||||

Neither Delaware Investments nor its affiliates referred to in this document are authorized deposit-taking institutions for the purpose of the Banking Act 1959 (Commonwealth of Australia). The obligations of these entities do not represent deposits or other liabilities of Macquarie Bank Limited (MBL), a subsidiary of Macquarie Group Limited and an affiliate of Delaware Investments. MBL does not guarantee or otherwise provide assurance in respect of the obligations of these entities, unless noted otherwise. The Series is governed by U.S. laws and regulations.
Unless otherwise noted, views expressed herein are current as of Dec. 31, 2016, and subject to change for events occurring after such date.
The Series is not FDIC insured and is not guaranteed. It is possible to lose the principal amount invested.
Mutual fund advisory services provided by Delaware Management Company, a series of Delaware Management Business Trust, which is a registered investment advisor. Delaware Investments, a member of Macquarie Group, refers to Delaware Management Holdings, Inc. and its subsidiaries, including the Series’ distributor, Delaware Distributors, L.P. Macquarie Group refers to Macquarie Group Limited and its subsidiaries and affiliates worldwide.
This material may be used in conjunction with the offering of shares in Delaware VIP International Value Equity Series only if preceded or accompanied by the Series’ current prospectus or the summary prospectus.
© 2017 Delaware Management Holdings, Inc.
All third-party marks cited are the property of their respective owners.
Table of Contents
| Delaware VIP® Trust — Delaware VIP International Value Equity Series | ||
| Portfolio management review | January 10, 2017 | |
For the fiscal year ended Dec. 31, 2016, Delaware VIP International Value Equity Series Standard Class shares returned +4.19%, while Service Class shares returned +3.92% (both figures reflect reinvestment of all dividends). The Series’ benchmark, the MSCI EAFE Index, returned +1.51% (gross) and +1.00% (net) for the same period.
The Series’ fiscal year ended Dec. 31, 2016 may usefully be considered in two halves, each centered on a phase in the shifting perceptions of the cycle of global interest rates and the corresponding implications for economic growth and inflation. These changing trends, with weakening economic expectations and declining bond yields in the first half of the year, followed by a gradual and subsequently more abrupt reversal in the second, were apparent in the pattern of relative performance observed across global equity markets.
Cyclical recoveries from distressed levels in commodity markets and emerging market equities and dramatic political events, such as the Brexit vote in late June and the U.S. elections, contributed to the shifting mindset over the past 12 months. The uncertainty of the fiscal year’s first half, in which stable growers and bond proxies excelled, set up a relatively stressed starting point against which to judge markets’ subsequent reactions, thereby making the relief rally since early July more readily comprehensible. One element of continuity that did support market expectations, however, was the ongoing commitment of monetary authorities to stem any tendencies toward deflation.
Overall, after falling in the first half of 2016, interest rates rose modestly prior to the November election and more dramatically afterward as the U.S. Federal Reserve increased the interest rate. Among stocks, financials, cyclical, and commodity-related segments led while defensive and yield-driven names fell behind.
• In the United Kingdom, the market’s volatile dislocations that followed the Brexit vote in late June quickly eased, but the underlying concerns regarding implementation and the consequences for individual companies and the overall economy remained. As of this writing, the British pound still had not recovered from its dramatic swoon of late June.
• After modest relative performance by U.S. stocks for most of the year, the United States took center stage in November with the election and its aftermath. Dramatic jumps in Treasury bond yields following the surprise result were echoed in other countries, underpinning the strong rally in financial stocks worldwide. The U.S. dollar regained strength after the election, adding to the momentum since the Brexit vote.
• The surge and rapid fade of Japan’s equity performance early in July contrasted with the more Brexit-exposed economies in the U.K. and Europe. From that point onward, however, Japan’s similarities to Europe – its accommodative monetary policy and positive exposure to ease cyclical stress – helped to support strong relative returns into November 2016. Since the U.S. election, though, both Japanese and European stocks have trailed the broader market, despite good returns in local currencies, due to the U.S. dollar’s strong rally.
• Following very weak relative returns in 2015, emerging markets outperformed most of the developed world for much of the 12-month period. This upward momentum survived the Brexit vote, as the brunt of that impact fell on Europe. The U.S. election, though, in raising possible changes for global trade, cut into the emerging markets’ performance advantage significantly.
The Series outperformed the benchmark primarily due to strong stock selection. On a sector basis, strong stock selection in industrials, consumer discretionary, information technology, telecommunications, and materials more than offset weak stock selection in energy, consumer staples, and healthcare. Overall sector allocation was negative, with the adverse effect from an underweight position in materials more than offsetting the favorable effect from an overweight position in industrials. Among regions, strong stock selection in the euro zone, Japan, and the U.K. more than offset weak selection in Europe ex-euro zone. Overall regional allocation was positive, with the favorable effect from exposures to emerging markets and Canada more than offsetting the adverse effect of an underweight exposures to the U.K. Net currency effect was positive, with the favorable effect from an underweight exposure to the British pound and exposure to the Canadian dollar more than offsetting the adverse effect from an underweight exposure to the Australian dollar.
Trading activity during the year centered on paring back some of the Series’ successful investments that were approaching our targets and redeploying the proceeds on what we viewed as more attractively valued stocks. This activity did not result in material changes to overall positioning.
The Series employed foreign currency exchange contracts during the fiscal year, to facilitate the purchase and sale of securities in the Series, which had a minor effect on performance (less than 0.50 percentage points).
While we are encouraged by the market’s strong performance beyond the volatility of February and June, some elements of the global financial picture remain uncertain. Even after the November surge, bond yields remain historically low. This, combined with persistently slow growth, suggest to us an environment in which investment returns may be modest.
Unless otherwise noted, views expressed herein are current as of Dec. 31, 2016, and subject to change.
International Value Equity Series-1
Table of Contents
| Delaware VIP® Trust — Delaware VIP International Value Equity Series | ||
| Portfolio management review (continued) | January 10, 2017 | |
Although recent market action suggests a greater sense of optimism in the air, much remains to be proven. At current equity valuations, the U.S. market is selling at a premium to the rest of the world, while Japan and Europe sell at substantial discounts. For active managers, stocks reflect stakes in dynamic enterprises that can change and adapt to shifting circumstances. While the market presents us with uncertainty, we are confident that individual companies’ success in equity investing reflects the varying ways in which company managements navigate these changes, and how efficient and focused they are in doing so. We believe that the qualities can be recognized. We will seek to do so and seek companies with attractive valuations.
Unless otherwise noted, views expressed herein are current as of Dec. 31, 2016, and subject to change.
International Value Equity Series-2
Table of Contents
The performance quoted represents past performance and does not guarantee future results. Investment return and principal value of an investment will fluctuate so that shares, when redeemed, may be worth more or less than their original cost. Current performance may be lower or higher than the performance quoted.
Carefully consider the Series’ investment objectives, risk factors, charges, and expenses before investing. This and other information can be found in the Series’ prospectus and its summary prospectus, which may be obtained by calling 800 523-1918. Investors should read the prospectus and the summary prospectus carefully before investing.
| Delaware VIP International Value Equity Series | ||||||||||
| Average annual total returns | ||||||||||
| For periods ended Dec. 31, 2016 | 1 year | 3 years | 5 years | 10 years | Lifetime | |||||
Standard Class shares (commenced operations on | +4.19% | -1.48% | +6.22% | +0.47% | +6.38% | |||||
Service Class shares (commenced operations on | +3.92% | -1.70% | +5.95% | +0.22% | +4.41% | |||||
MSCI EAFE Index (gross) | +1.51% | -1.15% | +7.02% | +1.22% | n/a | |||||
MSCI EAFE Index (net) | +1.00% | -1.60% | +6.53% | +0.75% | n/a |
Returns reflect the reinvestment of all distributions. Please see page 4 for a description of the index.
As described in the Series’ most recent prospectus, the net expense ratio for Service Class shares of the Series was 1.27%, while total operating expenses for Standard Class and Service Class shares were 1.02% and 1.32%, respectively. The management fee for Standard Class and Service Class shares was 0.85%.
The Series’ distributor has contracted to limit the 12b-1 fees for Service Class shares to no more than 0.25% of average daily net assets from Jan.1, 2016 through Dec. 31, 2016.*
Earnings from a variable annuity or variable life investment compound tax-free until withdrawal, and as a result, no adjustments were made for income taxes.
Expense limitations were in effect for both classes during certain periods shown in the Series’ performance table above and in the Performance of a $10,000 Investment graph on the next page.
Performance data do not reflect insurance fees related to a variable annuity or variable life investment or the deferred sales charge that would apply to certain withdrawals of investments held for fewer than eight years. Performance shown here would have been reduced if such fees were included and the expense limitation removed. For more information about fees, consult your variable annuity or variable life prospectus.
Investments in variable products involve risk.
International investments entail risks not ordinarily associated with U.S. investments including fluctuation in currency values, differences in accounting principles, or economic or political instability in other nations. Investing in emerging markets can be riskier than investing in established foreign markets due to increased volatility and lower trading volume.
Please read both the contract and underlying prospectus for specific details regarding the product’s risk profile.
*The aggregate contractual waiver period covering this report is from April 29, 2015 through May 1, 2017.
International Value Equity Series-3
Table of Contents
| Delaware VIP® International Value Equity Series |
| Performance summary (continued) |
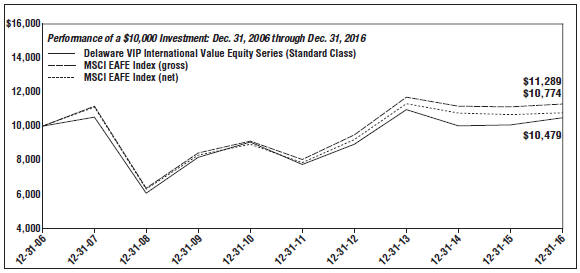
| For period beginning Dec. 31, 2006 through Dec. 31, 2016 | Starting value | Ending value | ||
–– MSCI EAFE Index (gross) | $10,000 | $11,289 | ||
--- MSCI EAFE Index (net) | $10,000 | $10,774 | ||
–– Delaware VIP International Value Equity Series (Standard Class) | $10,000 | $10,479 |
The graph shows a $10,000 investment in the Delaware VIP International Value Equity Series Standard Class shares for the period from Dec. 31, 2006 through Dec. 31, 2016.
The graph also shows $10,000 invested in the MSCI EAFE Index for the period from Dec. 31, 2006 through Dec. 31, 2016. The MSCI EAFE (Europe, Australasia, FarEast) Index is a free float-adjusted market capitalization weighted index designed to measure equity market performance of developed markets, excluding the United States and Canada. Index “gross” return approximates the maximum possible dividend reinvestment. Index “net” return approximates the minimum possible dividend reinvestment, after deduction of withholding tax at the highest possible rate.
Index performance returns do not reflect any management fees, transaction costs or expenses. Indices are unmanaged and one cannot invest directly in an index.
Performance of Service Class shares will vary due to different charges and expenses.
Past performance is not a guarantee of future results.
International Value Equity Series-4
Table of Contents
For the six month period from July 1, 2016 to December 31, 2016 (Unaudited)
As a shareholder of the Series, you incur ongoing costs, which may include management fees; distribution and/or service (12b-1) fees; and other Series expenses. This example is intended to help you understand your ongoing costs (in dollars) of investing in the Series and to compare these costs with the ongoing costs of investing in other mutual funds.
The example is based on an investment of $1,000 invested at the beginning of the period and held for the entire six-month period from July 1, 2016 to Dec. 31, 2016.
Actual expenses
The first section of the table shown, “Actual Series return,” provides information about actual account values and actual expenses. You may use the information in this section of the table, together with the amount you invested, to estimate the expenses that you paid over the period. Simply divide your account value by $1,000 (for example, an $8,600 account value divided by $1,000 = 8.6), then multiply the result by the number in the first section under the heading entitled “Expenses Paid During Period” to estimate the expenses you paid on your account during the period.
Hypothetical example for comparison purposes
The second section of the table shown, “Hypothetical 5% return,” provides information about hypothetical account values and hypothetical expenses based on the Series’ actual expense ratio and an assumed rate of return of 5% per year before expenses, which is not the Series’ actual return. The hypothetical account values and expenses may not be used to estimate the actual ending account balance or expenses you paid for the period. You may use this information to compare the ongoing costs of investing in the Series and other funds. To do so, compare this 5% hypothetical example with the 5% hypothetical examples that appear in the shareholder reports of other funds.
Please note that the expenses shown in the table are meant to highlight your ongoing costs only. As a shareholder of the Series, you do not incur any transaction costs, such as sales charges (loads), redemption fees or exchange fees, but shareholders of other funds may incur such costs. Also, the fees related to the variable annuity investment or the deferred sales charge that could apply have not been included. Therefore, the second section of the table is useful in comparing ongoing costs only, and will not help you determine the relative total costs of owning different funds. The Series’ actual expenses shown in the table reflect fee waivers in effect for Service Class shares. The expenses shown in the table assume reinvestment of all dividends and distributions.
Expense analysis of an investment of $1,000
| Expenses | ||||||||||||||||
| Beginning | Ending | Paid During | ||||||||||||||
| Account | Account | Annualized | Period | |||||||||||||
| Value | Value | Expense | 7/1/16 to | |||||||||||||
| 7/1/16 | 12/31/16 | Ratio | 12/31/16* | |||||||||||||
Actual Series return† |
| |||||||||||||||
Standard Class | $ | 1,000.00 | $ | 1,062.10 | 1.00 | % | $ | 5.18 | ||||||||
Service Class | 1,000.00 | 1,061.30 | 1.25 | % | 6.48 | |||||||||||
Hypothetical 5% return (5% return before expenses) |
| |||||||||||||||
Standard Class | $ | 1,000.00 | $ | 1,020.11 | 1.00 | % | $ | 5.08 | ||||||||
Service Class | 1,000.00 | 1,018.85 | 1.25 | % | 6.34 | |||||||||||
* “Expenses Paid During Period” are equal to the Series’ annualized expense ratio, multiplied by the average account value over the period, multiplied by 184/366 (to reflect the one-half year period).
† Because actual returns reflect only the most recent six-month period, the returns shown may differ significantly from fiscal year returns.
| International Value Equity Series-5 |
Table of Contents
| Delaware VIP® Trust — Delaware VIP International Value Equity Series |
| Security type / country and sector allocations |
As of December 31, 2016 (Unaudited)
Sector designations may be different than the sector designations presented in other Series materials. The sector designations may represent the investment manager’s internal sector classifications.
| Security type / sector | Percentage of net assets | ||||
Common Stock by Country | 96.43% | ||||
Australia | 1.35% | ||||
Canada | 4.78% | ||||
China/Hong Kong | 5.84% | ||||
Denmark | 1.88% | ||||
France | 17.65% | ||||
Germany | 6.30% | ||||
Indonesia | 1.65% | ||||
Israel | 2.19% | ||||
Italy | 1.26% | ||||
Japan | 23.64% | ||||
Netherlands | 4.72% | ||||
Republic of Korea | 3.04% | ||||
Russia | 1.12% | ||||
Sweden | 4.84% | ||||
Switzerland | 4.79% | ||||
United Kingdom | 11.38% | ||||
Short-Term Investments | 3.29% | ||||
Securities Lending Collateral | 2.63% | ||||
Total Value of Securities | 102.35% | ||||
Obligation to Return Securities Lending Collateral | (2.63)% | ||||
Receivables and Other Assets Net of Liabilities | 0.28% | ||||
Total Net Assets | 100.00% | ||||
| Common stock by sector | Percentage of net assets | ||||
Consumer Discretionary | 17.27% | ||||
Consumer Staples | 8.99% | ||||
Energy | 5.53% | ||||
Financials | 17.09% | ||||
Healthcare | 11.53% | ||||
Industrials | 19.73% | ||||
Information Technology | 6.88% | ||||
Materials | 2.38% | ||||
Telecommunication Services | 5.97% | ||||
Utilities | 1.06% | ||||
Total | 96.43% | ||||
International Value Equity Series-6
Table of Contents
December 31, 2016
| Number of | Value | |||||||
| shares | (U.S. $) | |||||||
Common Stock - 96.43% D |
| |||||||
Australia - 1.35% | ||||||||
Coca-Cola Amatil | 122,341 | $ | 892,229 | |||||
|
| |||||||
| 892,229 | ||||||||
|
| |||||||
Canada - 4.78% | ||||||||
Alamos Gold | 60,068 | 414,277 | ||||||
CGI Group Class A † | 27,714 | 1,330,123 | ||||||
Suncor Energy | 36,100 | 1,180,345 | ||||||
Yamana Gold * | 80,683 | 226,548 | ||||||
|
| |||||||
| 3,151,293 | ||||||||
|
| |||||||
China/Hong Kong - 5.84% |
| |||||||
CNOOC | 809,000 | 1,005,373 | ||||||
Techtronic Industries | 298,359 | 1,067,671 | ||||||
Yue Yuen Industrial Holdings | 490,000 | 1,776,107 | ||||||
|
| |||||||
| 3,849,151 | ||||||||
|
| |||||||
Denmark - 1.88% | ||||||||
Carlsberg Class B | 14,433 | 1,243,102 | ||||||
|
| |||||||
| 1,243,102 | ||||||||
|
| |||||||
France - 17.65% | ||||||||
AXA | 71,676 | 1,806,866 | ||||||
Kering | 5,134 | 1,151,575 | ||||||
Publicis Groupe | 8,767 | 604,086 | ||||||
Rexel | 39,679 | 651,922 | ||||||
Sanofi | 26,712 | 2,160,070 | ||||||
Teleperformance | 11,390 | 1,141,914 | ||||||
TOTAL | 28,448 | 1,459,157 | ||||||
Valeo | 13,730 | 788,209 | ||||||
Vinci | 27,662 | 1,881,698 | ||||||
|
| |||||||
| 11,645,497 | ||||||||
|
| |||||||
Germany - 6.30% | ||||||||
Bayerische Motoren Werke | 16,044 | 1,494,274 | ||||||
Deutsche Post | 52,597 | 1,724,920 | ||||||
STADA Arzneimittel | 18,156 | 937,972 | ||||||
|
| |||||||
| 4,157,166 | ||||||||
|
| |||||||
Indonesia - 1.65% | ||||||||
Bank Rakyat Indonesia Persero | 1,256,855 | 1,085,564 | ||||||
|
| |||||||
| 1,085,564 | ||||||||
|
| |||||||
Israel - 2.19% | ||||||||
Teva Pharmaceutical Industries ADR | 39,900 | 1,446,375 | ||||||
|
| |||||||
| 1,446,375 | ||||||||
|
| |||||||
Italy - 1.26% | ||||||||
UniCredit * | 289,873 | 832,437 | ||||||
|
| |||||||
| 832,437 | ||||||||
|
| |||||||
Japan - 23.64% | ||||||||
East Japan Railway | 20,756 | 1,789,556 | ||||||
ITOCHU | 155,735 | 2,062,050 | ||||||
Japan Tobacco | 45,800 | 1,503,323 | ||||||
Minebea | 118,600 | 1,106,683 | ||||||
Mitsubishi UFJ Financial Group | 406,435 | 2,506,616 | ||||||
Nippon Telegraph & Telephone | 50,218 | 2,113,935 | ||||||
Nitori Holdings | 9,458 | 1,078,354 | ||||||
| Number of | Value | |||||||
| shares | (U.S. $) | |||||||
Common Stock D (continued) |
| |||||||
Japan (continued) | ||||||||
Sumitomo Rubber Industries | 77,800 | $ | 1,230,979 | |||||
Toyota Motor | 37,543 | 2,201,087 | ||||||
|
| |||||||
| 15,592,583 | ||||||||
|
| |||||||
Netherlands - 4.72% | ||||||||
ING Groep | 109,571 | 1,542,623 | ||||||
Koninklijke Philips | 51,370 | 1,570,479 | ||||||
|
| |||||||
| 3,113,102 | ||||||||
|
| |||||||
Republic of Korea - 3.04% |
| |||||||
Samsung Electronics | 1,346 | 2,003,269 | ||||||
|
| |||||||
| 2,003,269 | ||||||||
|
| |||||||
Russia - 1.12% | ||||||||
Mobile TeleSystems ADR | 81,200 | 739,732 | ||||||
|
| |||||||
| 739,732 | ||||||||
|
| |||||||
Sweden - 4.84% | ||||||||
Nordea Bank | 189,956 | 2,104,831 | ||||||
Tele2 Class B * | 135,837 | 1,086,151 | ||||||
|
| |||||||
| 3,190,982 | ||||||||
|
| |||||||
Switzerland - 4.79% | ||||||||
Aryzta † | 29,189 | 1,283,625 | ||||||
Novartis | 25,794 | 1,875,830 | ||||||
|
| |||||||
| 3,159,455 | ||||||||
|
| |||||||
United Kingdom - 11.38% |
| |||||||
Meggitt | 192,131 | 1,085,001 | ||||||
National Grid | 59,665 | 697,111 | ||||||
Playtech | 118,536 | 1,205,967 | ||||||
Rio Tinto | 24,302 | 927,802 | ||||||
Shire | 20,793 | 1,187,265 | ||||||
Standard Chartered † | 171,017 | 1,394,630 | ||||||
Tesco † | 394,590 | 1,006,125 | ||||||
|
| |||||||
| 7,503,901 | ||||||||
|
| |||||||
Total Common Stock (cost $62,918,114) | 63,605,838 | |||||||
|
| |||||||
| Principal amount° | ||||||||
Short-Term Investments - 3.29% |
| |||||||
Discount Notes - 1.44% ≠ |
| |||||||
Federal Home Loan Bank | ||||||||
0.345% 1/25/17 | 242,481 | 242,427 | ||||||
0.366% 1/27/17 | 119,613 | 119,583 | ||||||
0.379% 2/3/17 | 59,807 | 59,781 | ||||||
0.483% 1/30/17 | 266,463 | 266,389 | ||||||
0.499% 2/15/17 | 66,616 | 66,577 | ||||||
0.501% 2/6/17 | 199,847 | 199,755 | ||||||
|
| |||||||
| 954,512 | ||||||||
|
| |||||||
International Value Equity Series-7
Table of Contents
| Delaware VIP® International Value Equity Series |
| Schedule of investments (continued) |
| Principal | Value | |||||||
| amount° | (U.S. $) | |||||||
Short-Term Investments (continued) |
| |||||||
Repurchase Agreements - 1.85% |
| |||||||
Bank of America Merrill Lynch | 411,071 | $ | 411,071 | |||||
Bank of Montreal | 479,582 | 479,582 | ||||||
BNP Paribas | 328,347 | 328,347 | ||||||
|
| |||||||
| 1,219,000 | ||||||||
|
| |||||||
Total Short-Term Investments (cost $2,173,461) |
| 2,173,512 | ||||||
|
| |||||||
Total Value of Securities Before Securities Lending Collateral - 99.72% (cost $65,091,575) |
| 65,779,350 | ||||||
|
| |||||||
| Number of | ||||||||
| shares | ||||||||
Securities Lending Collateral - 2.63% ** |
| |||||||
Certificates of Deposit - 0.47% ≠ |
| |||||||
Australia & New Zealand Banking Group (London) 0.70% 1/2/17 | 78,000 | 78,000 | ||||||
Canadian Imperial Bank of Commerce (Cayman) 0.52% 1/3/17 | 78,000 | 78,000 | ||||||
National Australia Bank (Cayman) 0.48% 1/3/17 | 78,000 | 78,000 | ||||||
| Number of | Value | |||||||
| shares | (U.S. $) | |||||||
Securities Lending Collateral ** (continued) |
| |||||||
Certificates of Deposit ≠ (continued) |
| |||||||
Royal Bank of Canada (Toronto) 0.50% 1/3/17 | 78,000 | $ | 78,000 | |||||
|
| |||||||
| 312,000 | ||||||||
|
| |||||||
Repurchase Agreements - 2.16% ≠ |
| |||||||
Bank of Nova Scotia 0.50%, dated 12/30/16 to be repurchased on 1/3/17, repurchase price $403,972 (collateralized by U.S. government obligations 1.75% 12/30/20; market value $412,069) | 403,966 | 403,966 | ||||||
BNP Paribas | 403,966 | 403,966 | ||||||
JP Morgan Securities 0.50%, dated 12/30/16, to be repurchased on 1/3/17, repurchase price $403,972 (collateralized by U.S. government obligations 0.125%-2.375% 1/15/17 -1/15/21; market value $412,066) | 403,966 | 403,966 | ||||||
Merrill Lynch, Pierce, Fenner & Smith 0.47%, dated 12/30/16, to be repurchased on 1/3/17, repurchase price $211,700 (collateralized by U.S. government obligations 0.00% 1/19/17; market value $215,931) | 211,697 | 211,697 | ||||||
|
| |||||||
| 1,423,595 | ||||||||
|
| |||||||
Total Securities Lending Collateral |
| 1,735,595 | ||||||
|
| |||||||
Total Value of Securities - 102.35% | $ | 67,514,945 | ||
|
|
International Value Equity Series-8
Table of Contents
| Delaware VIP® International Value Equity Series |
| Schedule of investments (continued) |
| * | Fully or partially on loan. |
| ** | See Note 10 in “Notes to financial statements” for additional information on securities lending collateral. |
| ≠ | The rate shown is the effective yield at the time of purchase. |
| ∎ | Includes $1,631,995 of securities loaned. |
| ° | Principal amount shown is stated in U.S. dollars unless noted that the security is denominated in another currency. |
| D | Securities have been classified by country of origin. Aggregate classification by business sectors has been presented on page 6 in “Security type / country and sector allocations.” |
| † | Non-income-producing security. |
ADR - American Depositary Receipt
See accompanying notes, which are an integral part of the financial statements.
International Value Equity Series-9
Table of Contents
Delaware VIP® Trust — Delaware VIP International Value Equity Series | ||
| Statement of assets and liabilities | December 31, 2016 | |
Assets: | ||||
Investments, at value1 | $ | 63,605,838 | ||
Short-term investments, at value2 | 2,173,512 | |||
Short-term investments held as collateral for loaned securities, at value3 | 1,735,595 | |||
Foreign currencies, at value4 | 76,780 | |||
Cash | 3,349 | |||
Foreign tax reclaims receivable | 108,354 | |||
Dividends and interest receivable | 59,571 | |||
Receivable for series shares sold | 20,081 | |||
Securities lending income receivable | 285 | |||
|
| |||
Total assets | 67,783,365 | |||
|
| |||
Liabilities: | ||||
Obligation to return securities lending collateral | 1,735,070 | |||
Investment management fees payable | 47,057 | |||
Payable for series shares redeemed | 11,717 | |||
Dividend disbursing and transfer agent fees and expenses payable to affiliates | 415 | |||
Accounting and administration expenses payable to affiliates | 260 | |||
Trustees’ fees and expenses payable | 158 | |||
Legal fees payable to affiliates | 116 | |||
Distribution fees payable to affiliates | 68 | |||
Reports and statements to shareholders expenses payable to affiliates | 58 | |||
Other accrued expenses | 25,333 | |||
Other liabilities | 574 | |||
|
| |||
Total liabilities | 1,820,826 | |||
|
| |||
Total Net Assets | $ | 65,962,539 | ||
|
| |||
Net Assets Consist of: | ||||
Paid-in capital | $ | 78,940,547 | ||
Undistributed net investment income | 1,133,655 | |||
Accumulated net realized loss on investments | (14,791,985 | ) | ||
Net unrealized appreciation of investments | 687,775 | |||
Net unrealized depreciation of foreign currencies | (7,453 | ) | ||
|
| |||
Total Net Assets | $ | 65,962,539 | ||
|
| |||
Net Assets Value: | ||||
Standard Class: | ||||
Net assets | $ | 65,633,259 | ||
Shares of beneficial interest outstanding, unlimited authorization, no par | 5,906,289 | |||
Net asset value per share | $ | 11.11 | ||
Service Class: | ||||
Net assets | $ | 329,280 | ||
Shares of beneficial interest outstanding, unlimited authorization, no par | 29,702 | |||
Net asset value per share | $ | 11.09 | ||
| ||||
1 Investments, at cost | $ | 62,918,114 | ||
2 Short-term investments, at cost | 2,173,461 | |||
3 Short-term investments held as collateral for loaned securities, at cost | 1,735,595 | |||
4 Foreign currencies, at cost | 76,960 | |||
See accompanying notes, which are an integral part of the financial statements.
International Value Equity Series-10
Table of Contents
Delaware VIP® Trust —
Delaware VIP International Value Equity Series
Year ended December 31, 2016
Delaware VIP Trust —
Delaware VIP International Value Equity Series
Investment Income: | ||||
Dividends | $ | 1,933,417 | ||
Securities lending income | 7,740 | |||
Interest | 5,519 | |||
Foreign tax withheld | (195,710 | ) | ||
|
| |||
| 1,750,966 | ||||
|
| |||
Expenses: | ||||
Management fees | 531,433 | |||
Audit and tax fees | 37,707 | |||
Accounting and administration expenses | 20,039 | |||
Reports and statements to shareholders expenses | 15,029 | |||
Custodian fees | 14,813 | |||
Dividend disbursing and transfer agent fees and expenses | 5,446 | |||
Legal fees | 4,615 | |||
Trustees’ fees and expenses | 3,103 | |||
Registration fees | 687 | |||
Distribution expenses - Service Class | 696 | |||
Other | 7,862 | |||
|
| |||
| 641,430 | ||||
Less waived distribution expenses - Service Class | (116 | ) | ||
Less expense paid indirectly | (1 | ) | ||
|
| |||
Total operating expenses | 641,313 | |||
|
| |||
Net Investment Income | 1,109,653 | |||
|
| |||
Net Realized and Unrealized Gain: | ||||
Net realized gain on: | ||||
Investments | 89,467 | |||
Foreign currencies | 1,417 | |||
Foreign currency exchange contracts | 27,721 | |||
|
| |||
Net realized gain | 118,605 | |||
|
| |||
Net change in unrealized appreciation (depreciation) of: | ||||
Investments | 1,354,356 | |||
Foreign currencies | (1,338 | ) | ||
|
| |||
Net change in unrealized appreciation (depreciation) | 1,353,018 | |||
|
| |||
Net Realized and Unrealized Gain | 1,471,623 | |||
|
| |||
Net Increase in Net Assets Resulting from Operations | $ | 2,581,276 | ||
|
| |||
| Year ended | ||||||||
| 12/31/16 | 12/31/15 | |||||||
Increase (Decrease) in Net Assets from Operations: | ||||||||
Net investment income | $ | 1,109,653 | $ | 1,057,346 | ||||
Net realized gain | 118,605 | 2,636,348 | ||||||
Net change in unrealized appreciation (depreciation) | 1,353,018 | (3,582,818 | ) | |||||
|
|
|
| |||||
Net increase in net assets resulting from operations | 2,581,276 | 110,876 | ||||||
|
|
|
| |||||
Dividends and Distributions to Shareholders from: | ||||||||
Net investment income: | ||||||||
Standard Class | (1,045,938 | ) | (1,218,855 | ) | ||||
Service Class | (3,162 | ) | (2,423 | ) | ||||
|
|
|
| |||||
| (1,049,100 | ) | (1,221,278 | ) | |||||
|
|
|
| |||||
Capital Share Transactions: | ||||||||
Proceeds from shares sold: | ||||||||
Standard Class | 9,590,281 | 12,406,523 | ||||||
Service Class | 244,525 | 291,375 | ||||||
Net asset value of shares issued upon reinvestment of dividends and distributions: | ||||||||
Standard Class | 1,045,938 | 1,218,855 | ||||||
Service Class | 3,162 | 2,423 | ||||||
|
|
|
| |||||
| 10,883,906 | 13,919,176 | |||||||
|
|
|
| |||||
Cost of shares redeemed: | ||||||||
Standard Class | (8,812,705 | ) | (8,214,676 | ) | ||||
Service Class | (73,007 | ) | (304,176 | ) | ||||
|
|
|
| |||||
| (8,885,712 | ) | (8,518,852 | ) | |||||
|
|
|
| |||||
Increase in net assets derived from capital share transactions | 1,998,194 | 5,400,324 | ||||||
|
|
|
| |||||
Net Increase in Net Assets | 3,530,370 | 4,289,922 | ||||||
Net Assets: | ||||||||
Beginning of year | 62,432,169 | 58,142,247 | ||||||
|
|
|
| |||||
End of year | $ | 65,962,539 | $ | 62,432,169 | ||||
| �� |
|
|
|
| ||||
Undistributed net investment income | $ | 1,133,655 | $ | 1,043,964 | ||||
|
|
|
| |||||
See accompanying notes, which are an integral part of the financial statements.
International Value Equity Series-11
Table of Contents
Delaware VIP® Trust — Delaware VIP International Value Equity Series
Selected data for each share of the Series outstanding throughout each period were as follows:
| Delaware VIP International Value Equity Series Standard Class | |||||||||||||||||||||||||
| Year ended | |||||||||||||||||||||||||
| 12/31/16 | 12/31/15 | 12/31/14 | 12/31/13 | 12/31/12 | |||||||||||||||||||||
Net asset value, beginning of period | $ | 10.840 | $ | 10.990 | $ | 12.190 | $ | 10.090 | $ | 8.980 | |||||||||||||||
Income (loss) from investment operations: | |||||||||||||||||||||||||
Net investment income1 | 0.190 | 0.189 | 0.254 | 0.176 | 0.177 | ||||||||||||||||||||
Net realized and unrealized gain (loss) | 0.258 | (0.114 | ) | (1.297 | ) | 2.094 | 1.171 | ||||||||||||||||||
|
|
|
|
|
|
|
|
|
| ||||||||||||||||
Total from investment operations | 0.448 | 0.075 | (1.043 | ) | 2.270 | 1.348 | |||||||||||||||||||
|
|
|
|
|
|
|
|
|
| ||||||||||||||||
Less dividends and distributions from: | |||||||||||||||||||||||||
Net investment income | (0.178 | ) | (0.225 | ) | (0.157 | ) | (0.170 | ) | (0.238 | ) | |||||||||||||||
|
|
|
|
|
|
|
|
|
| ||||||||||||||||
Total dividends and distributions | (0.178 | ) | (0.225 | ) | (0.157 | ) | (0.170 | ) | (0.238 | ) | |||||||||||||||
|
|
|
|
|
|
|
|
|
| ||||||||||||||||
Net asset value, end of period | $ | 11.110 | $ | 10.840 | $ | 10.990 | $ | 12.190 | $ | 10.090 | |||||||||||||||
|
|
|
|
|
|
|
|
|
| ||||||||||||||||
Total return2 | 4.19% | 0.49% | (8.67% | ) | 22.78% | 15.20% | |||||||||||||||||||
Ratios and supplemental data: | |||||||||||||||||||||||||
Net assets, end of period (000 omitted) | $ | 65,633 | $ | 62,285 | $ | 57,986 | $ | 57,733 | $ | 47,122 | |||||||||||||||
Ratio of expenses to average net assets | 1.02% | 1.04% | 1.07% | 1.09% | 1.07% | ||||||||||||||||||||
Ratio of net investment income to average net assets | 1.78% | 1.66% | 2.13% | 1.59% | 1.88% | ||||||||||||||||||||
Portfolio turnover | 19% | 11% | 27% | 28% | 36% | ||||||||||||||||||||
| 1 | The average shares outstanding method has been applied for per share information. |
| 2 | Total investment return is based on the change in net asset value of a share during the period and assumes reinvestment of dividends and distributions at net asset value. Total investment return does not include fees, charges, or expenses imposed by the variable annuity and life insurance contracts for which Delaware VIP Trust serves as an underlying investment vehicle. |
See accompanying notes, which are an integral part of the financial statements.
International Value Equity Series-12
Table of Contents
Delaware VIP® International Value Equity Series Financial highlights (continued) | ||
Selected data for each share of the Series outstanding throughout each period were as follows:
| Delaware VIP International Value Equity Series Service Class | |||||||||||||||||||||||||
| Year ended | |||||||||||||||||||||||||
| 12/31/16 | 12/31/15 | 12/31/14 | 12/31/13 | 12/31/12 | |||||||||||||||||||||
Net asset value, beginning of period | $ | 10.820 | $ | 10.970 | $ | 12.160 | $ | 10.070 | $ | 8.970 | |||||||||||||||
Income (loss) from investment operations: | |||||||||||||||||||||||||
Net investment income1 | 0.164 | 0.160 | 0.223 | 0.148 | 0.154 | ||||||||||||||||||||
Net realized and unrealized gain (loss) | 0.256 | (0.115 | ) | (1.284 | ) | 2.088 | 1.158 | ||||||||||||||||||
|
|
|
|
|
|
|
|
|
| ||||||||||||||||
Total from investment operations | 0.420 | 0.045 | (1.061 | ) | 2.236 | 1.312 | |||||||||||||||||||
|
|
|
|
|
|
|
|
|
| ||||||||||||||||
Less dividends and distributions from: | |||||||||||||||||||||||||
Net investment income | (0.150 | ) | (0.195 | ) | (0.129 | ) | (0.146 | ) | (0.212 | ) | |||||||||||||||
|
|
|
|
|
|
|
|
|
| ||||||||||||||||
Total dividends and distributions | (0.150 | ) | (0.195 | ) | (0.129 | ) | (0.146 | ) | (0.212 | ) | |||||||||||||||
|
|
|
|
|
|
|
|
|
| ||||||||||||||||
Net asset value, end of period | $ | 11.090 | $ | 10.820 | $ | 10.970 | $ | 12.160 | $ | 10.070 | |||||||||||||||
|
|
|
|
|
|
|
|
|
| ||||||||||||||||
Total return2 | 3.92% | 0.24% | (8.82% | ) | 22.45% | 14.79% | |||||||||||||||||||
Ratios and supplemental data: | |||||||||||||||||||||||||
Net assets, end of period (000 omitted) | $ | 330 | $ | 147 | $ | 156 | $ | 25 | $ | 30 | |||||||||||||||
Ratio of expenses to average net assets | 1.27% | 1.29% | 1.32% | 1.34% | 1.32% | ||||||||||||||||||||
Ratio of expenses to average net assets prior to fees waived | 1.32% | 1.34% | 1.37% | 1.39% | 1.37% | ||||||||||||||||||||
Ratio of net investment income to average net assets | 1.53% | 1.41% | 1.88% | 1.34% | 1.63% | ||||||||||||||||||||
Ratio of net investment income to average net assets prior to fees waived | 1.48% | 1.36% | 1.83% | 1.29% | 1.58% | ||||||||||||||||||||
Portfolio turnover | 19% | 11% | 27% | 28% | 36% | ||||||||||||||||||||
| 1 | The average shares outstanding method has been applied for per share information. |
| 2 | Total investment return is based on the change in net asset value of a share during the period and assumes reinvestment of dividends and distributions at net asset value. Total investment return during all of the periods shown reflects a waiver by the distributor. Performance would have been lower had the waiver not been in effect. Total investment return does not include fees, charges, or expenses imposed by the variable annuity and life insurance contracts for which Delaware VIP Trust serves as an underlying investment vehicle. |
See accompanying notes, which are an integral part of the financial statements.
International Value Equity Series-13
Table of Contents
Delaware VIP® Trust — Delaware VIP International Value Equity Series
December 31, 2016
Delaware VIP Trust (Trust) is organized as a Delaware statutory trust and offers 10 series: Delaware VIP Diversified Income Series, Delaware VIP Emerging Markets Series, Delaware VIP High Yield Series, Delaware VIP International Value Equity Series, Delaware VIP Limited-Term Diversified Income Series, Delaware VIP REIT Series, Delaware VIP Small Cap Value Series, Delaware VIP Smid Cap Growth Series, Delaware VIP U.S. Growth Series, and Delaware VIP Value Series. These financial statements and the related notes pertain to Delaware VIP International Value Equity Series (Series). The Trust is an open-end investment company. The Series is considered diversified under the Investment Company Act of 1940, as amended, and offers Standard Class and Service Class shares. The Standard Class shares do not carry a 12b-1 fee and the Service Class shares carry a 12b-1 fee. The shares of the Series are sold only to separate accounts of life insurance companies.
The investment objective of the Series is to seek long-term growth without undue risk to principal.
1. Significant Accounting Policies
The following accounting policies are in accordance with U.S. generally accepted accounting principles (U.S. GAAP) and are consistently followed by the Series.
Security Valuation—Equity securities, except those traded on the Nasdaq Stock Market LLC (Nasdaq), are valued at the last quoted sales price as of the time of the regular close of the New York Stock Exchange on the valuation date. Equity securities traded on the Nasdaq are valued in accordance with the Nasdaq Official Closing Price, which may not be the last sales price. If, on a particular day, an equity security does not trade, the mean between the bid and ask prices will be used, which approximates fair value. Equity securities listed on a foreign exchange are normally valued at the last quoted sales price on the valuation date. U.S. government and agency securities are valued at the mean between the bid and ask prices, which approximates fair value. Open-end investment company securities are valued at net asset value (NAV) per share, as reported by the underlying investment company. Foreign currency exchange contracts and foreign cross currency exchange contracts are valued at the mean between the bid and ask prices, which approximates fair value. Interpolated values are derived when the settlement date of the contract is an interim date for which quotations are not available. Generally, other securities and assets for which market quotations are not readily available are valued at fair value as determined in good faith under the direction of the Trust’s Board of Trustees (Board). In determining whether market quotations are readily available or fair valuation will be used, various factors will be taken into consideration, such as market closures or suspension of trading in a security. The Series may use fair value pricing more frequently for securities traded primarily in non-U.S. markets because, among other things, most foreign markets close well before the Series values its securities, generally as of 4:00 p.m. Eastern time. The earlier close of these foreign markets gives rise to the possibility that significant events, including broad market moves, government actions or pronouncements, aftermarket trading, or news events may have occurred in the interim. Whenever such a significant event occurs, the Series may value foreign securities using fair value prices based on third-party vendor modeling tools (international fair value pricing).
Federal and Foreign Income Taxes—No provision for federal income taxes has been made as the Series intends to continue to qualify for federal income tax purposes as a regulated investment company under Subchapter M of the Internal Revenue Code of 1986, as amended, and make the requisite distributions to shareholders. The Series evaluates tax positions taken or expected to be taken in the course of preparing the Series’ tax returns to determine whether the tax positions are “more-likely-than-not” of being sustained by the applicable tax authority. Tax positions not deemed to meet the “more-likely-than-not” threshold are recorded as a tax benefit or expense in the current year. Management has analyzed the Series’ tax positions taken for all open federal income tax years (Dec. 31, 2013–Dec. 31, 2016), and has concluded that no provision for federal income tax is required in the Series’ financial statements. In regard to foreign taxes only, the Series has open tax years in certain foreign countries in which it invests in that may date back to the inception of the Series.
Class Accounting—Investment income, common expenses, and realized and unrealized gain (loss) on investments are allocated to the various classes of the Series on the basis of daily net assets of each class. Distribution expenses relating to a specific class are charged directly to that class.
Repurchase Agreements—The Series may purchase certain U.S. government securities subject to the counterparty’s agreement to repurchase them at an agreed upon date and price. The counterparty will be required on a daily basis to maintain the value of the collateral subject to the agreement at not less than the repurchase price (including accrued interest). The agreements are conditioned upon the collateral being deposited under the Federal Reserve book-entry system with the Series’ custodian or a third-party sub-custodian. In the event of default or bankruptcy by the other party to the agreement, retention of the collateral may be subject to legal proceedings. All open repurchase agreements as of the date of this report were entered into on Dec. 30, 2016, and will mature on the next business day.
Foreign Currency Transactions—Transactions denominated in foreign currencies are recorded at the prevailing exchange rates on the valuation date in accordance with the Series’ prospectus. The value of all assets and liabilities denominated in foreign currencies is translated daily into U.S. dollars at the exchange rate of such currencies against the U.S. dollar. Transaction gains or losses resulting from changes in exchange rates during the reporting period or upon settlement of the foreign currency transaction are reported in operations for the current period. The Series generally does not bifurcate that portion of realized gains and losses on investments which is due to changes in foreign exchange rates from that which is due to changes in market prices. These gains and losses are included on the “Statement of operations” under “Net realized and unrealized gain (loss) on investments.” The Series reports certain foreign currency related transactions as components of realized gains (losses) for financial reporting purposes, whereas such components are treated as ordinary income (loss) for federal income tax purposes.
Use of Estimates—The Series is an investment company, whose financial statements are prepared in conformity with U.S. GAAP. Therefore, the Series follows the accounting and reporting guidelines for investment companies. The preparation of financial statements in conformity with U.S. GAAP requires management to make estimates and assumptions that affect the fair value of investments, the reported amounts of assets and liabilities and disclosure of contingent assets and liabilities at the date of the financial statements, and the reported amounts of revenues and expenses during the reporting period. Actual results could differ from those estimates and the differences could be material.
International Value Equity Series-14
Table of Contents
Delaware VIP® International Value Equity Series Delaware VIP International Value Equity Series
Notes to financial statements (continued)
1. Significant Accounting Policies (continued)
Other—Expenses directly attributable to the Series are charged directly to the Series. Other expenses common to various funds within the Delaware Investments® Family of Funds are generally allocated among such funds on the basis of average net assets. Management fees and certain other expenses are paid monthly. Security transactions are recorded on the date the securities are purchased or sold (trade date) for financial reporting purposes. Costs used in calculating realized gains and losses on the sale of investment securities are those of the specific securities sold. Dividend income is recorded on the ex-dividend date and interest income is recorded on the accrual basis. Discounts and premiums on debt securities are accreted or amortized to interest income, respectively, over the lives of the respective securities using the effective interest method. Taxable non-cash dividends are recorded as dividend income. Foreign dividends are also recorded on the ex-dividend date or as soon after the ex-dividend date that the Series is aware of such dividends, net of all tax withholdings, a portion of which may be reclaimable. Withholding taxes and reclaims on foreign dividends have been recorded in accordance with the Series’ understanding of the applicable country’s tax rules and rates.
The Series declares and pays dividends from net investment income and distributions from net realized gain on investments, if any, following the close of the fiscal year. The Series may distribute more frequently, if necessary for tax purposes. Dividends and distributions, if any, are recorded on the ex-dividend date.
The Series may receive earnings credits from its custodian when positive cash balances are maintained, which may be used to offset custody fees. There were no such earnings credits for the year ended Dec. 31, 2016.
The Series may receive earnings credits from its transfer agent when positive cash balances are maintained, which may be used to offset transfer agent fees. If the amount earned is greater than $1.00, the expense paid under this arrangement is included on the “Statement of operations” under “Dividend disbursing and transfer agent fees and expenses” with the corresponding expense offset shown under “Less expense paid indirectly.” For the year ended Dec. 31, 2016, the Series earned $1 under this agreement.
2. Investment Management, Administration Agreements, and Other Transactions with Affiliates
In accordance with the terms of its investment management agreement, the Series pays Delaware Management Company (DMC), a series of Delaware Management Business Trust and the investment manager, an annual fee which is calculated daily at the rate of 0.85% on the first $500 million of average daily net assets of the Series, 0.80% on the next $500 million, 0.75% on the next $1.5 billion, and 0.70% on average daily net assets in excess of $2.5 billion.
Delaware Investments Fund Services Company (DIFSC), an affiliate of DMC, provides fund accounting and financial administration oversight services to the Series. For these services, DIFSC’s fees are calculated based on the aggregate daily net assets of the Delaware Investments Family of Funds at the following annual rate: 0.0050% of the first $30 billion; 0.0045% of the next $10 billion; 0.0040% of the next $10 billion; and 0.0025% of aggregate average daily net assets in excess of $50 billion. The fees payable to DIFSC under the service agreement described above are allocated among all funds in the Delaware Investments Family of Funds on a relative NAV basis. For the year ended Dec. 31, 2016, the Series was charged $2,958 for these services. This amount is included on the “Statement of operations” under “Accounting and administration expenses.”
DIFSC is also the transfer agent and dividend disbursing agent of the Series. For these services, DIFSC’s fees are calculated at the annual rate of 0.0075% of the Series’ average daily net assets. This amount is included on the “Statement of operations” under “Dividend disbursing and transfer agent fees and expenses.” For the year ended Dec. 31, 2016, the Series was charged $4,689 for these services. Pursuant to a sub-transfer agency agreement between DIFSC and BNY Mellon Investment Servicing (US) Inc. (BNYMIS), BNYMIS provides certain sub-transfer agency services to the Series. Sub-transfer agency fees are paid by the Series and are also included on the “Statement of operations” under “Dividend disbursing and transfer agent fees and expenses.”
Pursuant to a distribution agreement and distribution plan, the Series pays Delaware Distributors, L.P. (DDLP), the distributor and an affiliate of DMC, an annual distribution and service fee of 0.30% of the average daily net assets of the Service Class shares. DDLP has contracted to waive distribution and service fees from Jan. 1, 2016 through Dec. 31, 2016* in order to limit distribution and service fees of the Service Class shares to 0.25% of average daily net assets. Standard Class shares pay no distribution and service expenses.
As provided in the investment management agreement, the Series bears a portion of the cost of certain resources shared with DMC, including the cost of internal personnel of DMC and/or its affiliates that provide legal, tax, and regulatory reporting services to the Series. For the year ended Dec. 31, 2016, the Series was charged $1,310 for internal legal, tax, and regulatory services provided by DMC and/or its affiliates’ employees. This amount is included on the “Statement of operations” under “Legal fees.”
Trustees’ fees include expenses accrued by the Series for each Trustee’s retainer and meeting fees. Certain officers of DMC, DIFSC, and DDLP are officers and/or Trustees of the Trust. These officers and Trustees are paid no compensation by the Series.
*The aggregate contractual waiver period covering this report is from April 29, 2015 through May 1, 2017.
3. Investments
For the year ended Dec. 31, 2016, the Series made purchases and sales of investment securities other than short-term investments as follows:
Purchases | $ | 11,581,763 | ||
Sales | 11,436,159 |
International Value Equity Series-15
Table of Contents
Delaware VIP® International Value Equity Series Delaware VIP International Value Equity Series
Notes to financial statements (continued)
3. Investments (continued)
At Dec. 31, 2016, the cost and unrealized appreciation (depreciation) of investments for federal income tax purposes were as follows:
| Cost of Investments | Aggregate Unrealized Appreciation of Investments | Aggregate Unrealized Depreciation of Investments | Net Unrealized Depreciation of Investments | |||||||||||||||||
| $68,881,363 | $12,478,543 | $(13,844,961) | $(1,366,418) | |||||||||||||||||
U.S. GAAP defines fair value as the price that the Series would receive to sell an asset or pay to transfer a liability in an orderly transaction between market participants at the measurement date under current market conditions. A three-level hierarchy for fair value measurements has been established based upon the transparency of inputs to the valuation of an asset or liability. Inputs may be observable or unobservable and refer broadly to the assumptions that market participants would use in pricing the asset or liability. Observable inputs reflect the assumptions market participants would use in pricing the asset or liability based on market data obtained from sources independent of the reporting entity. Unobservable inputs reflect the reporting entity’s own assumptions about the assumptions that market participants would use in pricing the asset or liability based on the best information available under the circumstances. The Series’ investment in its entirety is assigned a level based upon the observability of the inputs which are significant to the overall valuation. The three-level hierarchy of inputs is summarized below.
| Level 1 | – | Inputs are quoted prices in active markets for identical investments. (Examples: equity securities, open-end investment companies, futures contracts, exchange-traded options contracts) | ||
| Level 2 | – | Other observable inputs, including, but not limited to: quoted prices for similar assets or liabilities in markets that are active, quoted prices for identical or similar assets or liabilities in markets that are not active, inputs other than quoted prices that are observable for the assets or liabilities (such as interest rates, yield curves, volatilities, prepayment speeds, loss severities, credit risks, and default rates), or other market-corroborated inputs. (Examples: debt securities, government securities, swap contracts, foreign currency exchange contracts, foreign securities utilizing international fair value pricing, broker-quoted securities, fair valued securities) | ||
| Level 3 | – | Significant unobservable inputs, including the Series’ own assumptions used to determine the fair value of investments. (Examples: broker-quoted securities, fair valued securities) |
Level 3 investments are valued using significant unobservable inputs. The Series may also use an income-based valuation approach in which the anticipated future cash flows of the investment are discounted to calculate fair value. Discounts may also be applied due to the nature or duration of any restrictions on the disposition of the investments. Valuations may also be based upon current market prices of securities that are comparable in coupon, rating, maturity, and industry. The derived value of a Level 3 investment may not represent the value which is received upon disposition and this could impact the results of operations.
The following table summarizes the valuation of the Series’ investments by fair value hierarchy levels as of Dec. 31, 2016:
| Securities | Level 1 | Level 2 | Total | |||||||||
Common Stock | ||||||||||||
Australia | $ | — | $ | 892,229 | $ | 892,229 | ||||||
Canada | 3,151,293 | — | 3,151,293 | |||||||||
China/Hong Kong | — | 3,849,151 | 3,849,151 | |||||||||
Denmark | — | 1,243,102 | 1,243,102 | |||||||||
France | — | 11,645,497 | 11,645,497 | |||||||||
Germany | — | 4,157,166 | 4,157,166 | |||||||||
Indonesia | — | 1,085,564 | 1,085,564 | |||||||||
Israel | 1,446,375 | — | 1,446,375 | |||||||||
Italy | — | 832,437 | 832,437 | |||||||||
Japan | — | 15,592,583 | 15,592,583 | |||||||||
Netherlands | — | 3,113,102 | 3,113,102 | |||||||||
Republic of Korea | — | 2,003,269 | 2,003,269 | |||||||||
Russia | 739,732 | — | 739,732 | |||||||||
Sweden | — | 3,190,982 | 3,190,982 | |||||||||
Switzerland | — | 3,159,455 | 3,159,455 | |||||||||
United Kingdom | — | 7,503,901 | 7,503,901 | |||||||||
Securities Lending Collateral | — | 1,735,595 | 1,735,595 | |||||||||
Short-Term Investments | — | 2,173,512 | 2,173,512 | |||||||||
|
|
|
|
|
| |||||||
Total Value of Securities | $ | 5,337,400 | $ | 62,177,545 | $ | 67,514,945 | ||||||
|
|
|
|
|
| |||||||
As a result of utilizing international fair value pricing at Dec. 31, 2016, a majority of the common stock in the portfolio was categorized as Level 2.
International Value Equity Series-16
Table of Contents
Delaware VIP® International Value Equity Series Delaware VIP International Value Equity Series
Notes to financial statements (continued)
3. Investments (continued)
During the year ended Dec. 31, 2016, there were no transfers between Level 1 investments, Level 2 investments, or Level 3 investments that had a significant impact to the Series. This does not include transfers between Level 1 investments and Level 2 investments due to the Series utilizing international fair value pricing during the period. In accordance with the fair valuation procedures described in Note 1, international fair value pricing of securities occurs when market volatility exceeds an established rolling threshold. If the threshold is exceeded on a given date, then prices of international securities (those that traded on exchanges that close at a different time than the time that the Series’ NAV is determined) are established using a separate pricing feed from a third-party vendor designed to establish a price for each such security as of the time that the Series’ NAV is determined. Further, international fair value pricing uses other observable market-based inputs in place of the closing exchange price due to the events occurring after the close of the exchange or market on which the investment is principally traded, causing a change in classification between levels. The Series’ policy is to recognize transfers between levels at the beginning of the reporting period.
A reconciliation of Level 3 investments is presented when the Series has a significant amount of Level 3 investments at the beginning, interim, or end of the period in relation to net assets. At Dec. 31, 2016, there were no Level 3 investments.
4. Dividend and Distribution Information
Income and long-term capital gain distributions are determined in accordance with federal income tax regulations, which may differ from U.S. GAAP. Additionally, distributions from net gains on foreign currency transactions and net short-term gains on sales of investment securities are treated as ordinary income for federal income tax purposes. The tax character of dividends and distributions paid during the years ended Dec. 31, 2016 and 2015 was as follows:
| Year | Year | |||||||
| ended | ended | |||||||
| 12/31/16 | 12/31/15 | |||||||
Ordinary income | $ | 1,049,100 | $ | 1,221,278 | ||||
5. Components of Net Assets on a Tax Basis
As of Dec. 31, 2016, the components of net assets on a tax basis were as follows:
Shares of beneficial interest | $ | 78,940,547 | ||
Undistributed ordinary income | 1,133,655 | |||
Capital loss carryforwards | (12,723,821 | ) | ||
Qualified late year capital losses | (13,971 | ) | ||
Net unrealized depreciation on investments, foreign currencies, and derivatives | (1,373,871 | ) | ||
|
| |||
Net assets | $ | 65,962,539 | ||
|
|
The differences between book basis and tax basis components of net assets are primarily attributable to tax deferral of losses on wash sales.
Qualified late year losses represent losses realized on investment transactions from Nov. 1, 2016 through Dec. 31, 2016 that, in accordance with federal income tax regulations, the Series has elected to defer and treat as having arisen in the following fiscal year.
For financial reporting purposes, capital accounts are adjusted to reflect the tax character of permanent book/tax differences. Reclassifications are primarily due to tax treatment of gain (loss) on foreign currency transactions. Results of operations and net assets were not affected by these reclassifications. For the year ended Dec. 31, 2016 the Series recorded the following reclassifications:
Paid-in Capital | Undistributed Net Investment Income | Accumulated Net Realized Loss | ||
| $(3,219,580) | $29,138 | $3,190,442 |
For federal income tax purposes, capital loss carryforwards may be carried forward and applied against future capital gains. $1,441,779 was utilized and $3,219,580 expired in 2016. Capital loss carryforwards remaining at Dec. 31, 2016 will expire as follows: $12,723,821 will expire in 2017.
On Dec. 22, 2010, the Regulated Investment Company Modernization Act of 2010 (Act) was enacted, which changed various technical rules governing the tax treatment of regulated investment companies. The changes were generally effective for taxable years beginning after the date of enactment. Under the Act, the Series is permitted to carry forward capital losses incurred in taxable years beginning after the date of enactment for an unlimited period. However, any losses incurred during those future taxable years will be required to be utilized prior to the losses incurred in pre-enactment taxable years, which carry an expiration date. As a result of this ordering rule, pre-enactment capital loss carryforwards may be
International Value Equity Series-17
Table of Contents
Delaware VIP® International Value Equity Series Delaware VIP International Value Equity Series
Notes to financial statements (continued)
5. Components of Net Assets on a Tax Basis (continued)
more likely to expire unused. Additionally, post-enactment capital loss carryforwards will retain their character as either short-term or long-term capital losses rather than being considered all short-term as permitted under previous regulation. At Dec. 31, 2016, there were no capital loss carryforwards incurred under the Act.
6. Capital Shares
Transactions in capital shares were as follows:
| Year ended 12/31/16 | Year ended 12/31/15 | |||||||
Shares sold: | ||||||||
Standard Class | 894,718 | 1,092,086 | ||||||
Service Class | 22,471 | 26,308 | ||||||
Shares issued upon reinvestment of dividends and distributions: | ||||||||
Standard Class | 97,116 | 101,741 | ||||||
Service Class | 294 | 202 | ||||||
|
|
|
| |||||
| 1,014,599 | 1,220,337 | |||||||
Shares redeemed: | ||||||||
Standard Class | (830,284 | ) | (724,411 | ) | ||||
Service Class | (6,696 | ) | (27,154 | ) | ||||
|
|
|
| |||||
| (836,980 | ) | (751,565 | ) | |||||
|
|
|
| |||||
Net increase | 177,619 | 468,772 | ||||||
|
|
|
| |||||
7. Line of Credit
The Series, along with certain other funds in the Delaware Investments® Family of Funds (Participants), was a participant in a $155,000,000 revolving line of credit intended to be used for temporary or emergency purposes as an additional source of liquidity to fund redemptions of investor shares. Under the agreement, the Participants were charged an annual commitment fee of 0.10%, which was allocated across the Participants on the basis of relative net assets of each Participant’s allocation of the entire facility. The Participants were permitted to borrow up to a maximum of one third of their net assets under the agreement. Each Participant was individually, and not jointly, liable for its particular advances, if any, under the line of credit. The line of credit available under the agreement expired on Nov. 7, 2016.
On Nov. 7, 2016, the Series, along with the other Participants, entered into an amendment to the agreement for a $155,000,000 revolving line of credit. The line of credit is to be used as described above and operates in substantially the same manner as the original agreement, with the exception of the annual commitment fee. Under the amendment to the agreement, the Participants are charged an annual commitment fee of 0.15%, which is allocated across the Participants on the basis of relative net assets of each Participant’s allocation of the entire facility. The line of credit available under the agreement expires on Nov. 6, 2017.
The Series had no amounts outstanding as of Dec. 31, 2016, or at any time during the year then ended.
8. Derivatives
U.S. GAAP requires disclosures that enable investors to understand: (1) how and why an entity uses derivatives; (2) how they are accounted for; and (3) how they affect an entity’s results of operations and financial position.
Foreign Currency Exchange Contracts
The Series may enter into foreign currency exchange contracts and foreign cross currency exchange contracts as a way of managing foreign exchange rate risk. The Series may enter into these contracts to fix the U.S. dollar value of a security that it has agreed to buy or sell for the period between the date the trade was entered into and the date the security is delivered and paid for. The Series may also use these contracts to hedge the U.S. dollar value of securities it already owns that are denominated in foreign currencies. In addition, the Series may enter into these contracts to facilitate or expedite the settlement of portfolio transactions. The change in value is recorded as an unrealized gain or loss. When the contract is closed, a realized gain or loss is recorded equal to the difference between the value of the contract at the time it was opened and the value at the time it was closed.
The use of foreign currency exchange contracts and foreign cross currency exchange contracts does not eliminate fluctuations in the underlying prices of the securities, but does establish a rate of exchange that can be achieved in the future. Although foreign currency exchange contracts and foreign cross currency exchange contracts limit the risk of loss due to an unfavorable change in the value of the hedged currency, they also limit any potential gain that might result should the value of the currency change favorably. In addition, the Series could be exposed to risks if the counterparties to the contracts are unable to meet the terms of their contracts. The Series’ maximum risk of loss from counterparty credit risk is the value of its currency exchanged with the counterparty. The risk is generally mitigated by having a netting arrangement between the Series and the counterparty and by the posting of collateral by the counterparty to the Series to cover the Series’ exposure to the counterparty.
International Value Equity Series-18
Table of Contents
Delaware VIP® International Value Equity Series Delaware VIP International Value Equity Series
Notes to financial statements (continued)
8. Derivatives (continued)
During the year ended Dec. 31, 2016, the Series entered into foreign currency exchange contracts to fix the U.S. dollar value of a security between trade date and settlement date and to facilitate or expedite the settlement of portfolio transactions.
During the year ended Dec. 31, 2016, the Series experienced net realized gains or losses attributable to foreign currency holdings, which is disclosed as “Net realized gain (loss) on foreign currency exchange contracts” on the “Statement of operations.”
Derivatives Generally. The table below summarizes the average balance of derivative holdings by the Series during the year ended Dec. 31, 2016.
| Long Derivatives | Short Derivatives | |||||||||
| Volume | Volume | |||||||||
Foreign currency exchange contracts (Average cost) | $ | 41,390 | $ | 41,116 | ||||||
9. Offsetting
In December 2011, the Financial Accounting Standards Board (FASB) issued guidance that expanded disclosure requirements on the offsetting of certain assets and liabilities. The disclosures are required for investments and derivative financial instruments subject to master netting or similar agreements which are eligible for offset on the “Statement of assets and liabilities” and requires an entity to disclose both gross and net information about such investments and transactions in the financial statements. In January 2013, the FASB issued guidance that clarified which investments and transactions are subject to the offsetting disclosure requirements. The scope of the disclosure requirements for offsetting is limited to derivative instruments, repurchase agreements and reverse repurchase agreements, and securities borrowing.
In order to better define its contractual rights and to secure rights that will help the Series mitigate its counterparty risk, the Series entered into an International Swaps and Derivatives Association, Inc. Master Agreement (ISDA Master Agreement) or a similar agreement with certain of its derivative contract counterparties. An ISDA Master Agreement is a bilateral agreement between the Series and a counterparty that governs certain over-the-counter (OTC) derivatives and foreign exchange contracts and typically contains, among other things, collateral posting items and netting provisions in the event of a default and/or termination event. Under an ISDA Master Agreement, the Series may, under certain circumstances, offset with the counterparty certain derivative financial instrument’s payables and/or receivables with collateral held and/or posted and create one single net payment. The provisions of the ISDA Master Agreement typically permit a single net payment in the event of default (close-out), including the bankruptcy or insolvency of the counterparty. However, bankruptcy or insolvency laws of a particular jurisdiction may impose restrictions on or prohibitions against the right of offset in bankruptcy, insolvency, or other events.
For financial reporting purposes, the Series does not offset derivative assets and derivative liabilities that are subject to netting arrangements on the “Statement of assets and liabilities.”
At Dec. 31, 2016, the Series had the following assets and liabilities subject to offsetting provisions:
Master Repurchase Agreements
| Fair Value of | |||||||||||||||||||||||||
| Repurchase | Non-Cash | Cash Collateral | Net Collateral | ||||||||||||||||||||||
Counterparty | Agreements | Collateral Received(a) | Received | Received | Net Exposure(b) | ||||||||||||||||||||
Bank of America Merrill Lynch | $ | 411,071 | $ | (411,071 | ) | $ | — | $ | (411,071 | ) | $ | — | |||||||||||||
Bank of Montreal | 479,582 | (479,582 | ) | — | (479,582 | ) | — | ||||||||||||||||||
BNP Paribas | 328,347 | (328,347 | ) | — | (328,347 | ) | — | ||||||||||||||||||
�� |
|
|
|
|
|
|
|
|
| ||||||||||||||||
Total | $ | 1,219,000 | $ | (1,219,000 | ) | $ | — | $ | (1,219,000 | ) | $ | — | |||||||||||||
|
|
|
|
|
|
|
|
|
| ||||||||||||||||
Securities Lending
Securities lending transactions are entered into by the Series under Master Securities Lending Agreements (each, an “MSLA”) which provide the right, in the event of default (including bankruptcy or insolvency), for the non-defaulting party to liquidate the collateral and calculate a net exposure to the defaulting party or request additional collateral. In the event that a borrower defaults, the Series, as lender, would offset the market value of the collateral received against the market value of the securities loaned. When the value of the collateral is greater than that of the market value of the securities loaned, the lender is left with a net amount payable to the defaulting party. However, bankruptcy or insolvency laws of a particular jurisdiction may impose restrictions on or prohibitions against such a right of offset in the event of an MLSA counterparty’s bankruptcy or insolvency. Under the MSLA, the borrower can resell or re-pledge the loaned securities, and the Series can reinvest cash collateral, or, upon an event of default, resell, or re-pledge the collateral.
International Value Equity Series-19
Table of Contents
Delaware VIP® International Value Equity Series Delaware VIP International Value Equity Series
Notes to financial statements (continued)
9. Offsetting (continued)
As of Dec. 31, 2016, the following table is a summary of the Series securities lending agreement by counterparty which are subject to offset under an MSLA:
| Fair Value of | ||||||||||||||||||||
| Securities Loaned | Cash Collateral | Non-Cash Collateral | ||||||||||||||||||
Counterparty | at Value | Received(a) | Received | Net Exposure(b) | ||||||||||||||||
BNY Mellon | $1,631,995 | $(1,631,995 | ) | $— | $— | |||||||||||||||
| (a) | The value of the related collateral received exceeded the value of the repurchase agreements and securities lending as of Dec. 31, 2016. |
| (b) | Net exposure represents the receivable (payable) that would be due from (to) the counterparty in the event of default. |
10. Securities Lending
The Series, along with other funds in the Delaware Investments® Family of Funds, may lend its securities pursuant to a security lending agreement (Lending Agreement) with BNY Mellon. At the time a security is loaned, the borrower must post collateral equal to the required percentage of the market value of the loaned security, including any accrued interest. The required percentage is: (1) 102% with respect to U.S. securities and foreign securities that are denominated and payable in U.S. dollars; and (2) 105% with respect to foreign securities. With respect to each loan, if on any business day the aggregate market value of securities collateral plus cash collateral held is less than the aggregate market value of the securities which are the subject of such loan, the borrower will be notified to provide additional collateral by the end of the following business day, which, together with the collateral already held, will be not less than the applicable initial collateral requirements for such security loan. If the aggregate market value of securities collateral and cash collateral held with respect to a security loan exceeds the applicable initial collateral requirement, upon the request of the borrower, BNY Mellon must return enough collateral to the borrower by the end of the following business day to reduce the value of the remaining collateral to the applicable initial collateral requirement for such security loan. As a result of the foregoing, the value of the collateral held with respect to a loaned security on any particular day, may be more or less than the value of the security on loan.
Cash collateral received by each Series of the Trust is generally invested in a series of individual separate accounts, each corresponding to a Series. The investment guidelines permit each separate account to hold certain securities that would be considered eligible securities for a money market fund. Cash collateral received is generally invested in government securities; certain obligations issued by government sponsored enterprises; repurchase agreements collateralized by U.S. Treasury securities; obligations issued by the central government of any Organization for Economic Cooperation and Development (OECD) country or its agencies, instrumentalities, or establishments; obligations of supranational organizations, commercial paper, notes, bonds and other debt obligations; certificates of deposit, time deposits and other bank obligations; and asset-backed securities as disclosed on the “Schedule of Investments.” Securities purchased with cash collateral are valued at the market value.
In the event of default or bankruptcy by the lending agent, realization and/or retention of the collateral may be subject to legal proceedings. In the event the borrower fails to return loaned securities and the collateral received is insufficient to cover the value of the loaned securities and provided such collateral shortfall is not the result of investment losses, the lending agent has agreed to pay the amount of the shortfall to the Series or, at the discretion of the lending agent, replace the loaned securities. The Series continues to record dividends or interest, as applicable, on the securities loaned and are subject to changes in value of the securities loaned that may occur during the term of the loan. The Series has the right under the Lending Agreement to recover the securities from the borrower on demand. With respect to security loans collateralized by non-cash collateral, the Series receives loan premiums paid by the borrower. With respect to security loans collateralized by cash collateral, the earnings from the collateral investments are shared among the Series, the security lending agent, and the borrower. The Series records security lending income net of allocations to the security lending agent and the borrower.
The Series may incur investment losses as a result of investing securities lending collateral. This could occur if an investment in the collateral investment account defaulted or became impaired. Under those circumstances, the value of a Series’ cash collateral account may be less than the amount the Series would be required to return to the borrowers of the securities and the Series would be required to make up for this shortfall.
The following table reflects a breakdown of transactions accounted for as secured borrowings, the gross obligation by the type of collateral pledged, and the remaining contractual maturity of those transactions as of Dec. 31, 2016:
Remaining Contractual Maturity of the Agreements as of Dec. 31, 2016
| Overnight | |||||||||||||||||||||||||
| and | Under | Between | Over | ||||||||||||||||||||||
Securities Lending Transactions | Continuous | 30 days | 30 & 90 days | 90 days | Total | ||||||||||||||||||||
Common stocks | $ | 1,735,595 | $ | — | $ | — | $ | — | $ | 1,735,595 | |||||||||||||||
At Dec. 31, 2016, the value of securities on loan was $1,631,995, for which the Series received cash collateral of $1,735,595. At Dec. 31, 2016, the value of invested collateral was $1,735,595. Investments purchased with cash collateral are presented on the “Schedule of investments” under the caption “Securities Lending Collateral.”
International Value Equity Series-20
Table of Contents
Delaware VIP® International Value Equity Series Delaware VIP International Value Equity Series
Notes to financial statements (continued)
11. Credit and Market Risk
Some countries in which the Series may invest require governmental approval for the repatriation of investment income, capital, or the proceeds of sales of securities by foreign investors. In addition, if there is deterioration in a country’s balance of payments or for other reasons, a country may impose temporary restrictions on foreign capital remittances abroad.
The securities exchanges of certain foreign markets are substantially smaller, less liquid, and more volatile than the major securities markets in the United States. Consequently, acquisition and disposition of securities by the Series may be inhibited. In addition, a significant portion of the aggregate market value of equity securities listed on the major securities exchanges in emerging markets is held by a smaller number of investors. This may limit the number of shares available for acquisition or disposition by the Series.
The Series may invest up to 10% of its net assets in illiquid securities, which may include securities with contractual restrictions on resale, securities exempt from registration under Rule 144A promulgated under the Securities Act of 1933, as amended, and other securities which may not be readily marketable. The relative illiquidity of these securities may impair the Series from disposing of them in a timely manner and at a fair price when it is necessary or desirable to do so. While maintaining oversight, the Series’ Board has delegated to DMC the day-to-day functions of determining whether individual securities are liquid for purposes of the Series’ limitation on investments in illiquid securities. Securities eligible for resale pursuant to Rule 144A, which are determined to be liquid, are not subject to the Series’ 10% limit on investments in illiquid securities. As of Dec. 31, 2016, there were no Rule 144A securities held by the Series.
12. Contractual Obligations
The Series enters into contracts in the normal course of business that contain a variety of indemnifications. The Series’ maximum exposure under these arrangements is unknown. However, the Series has not had prior claims or losses pursuant to these contracts. Management has reviewed the Series’ existing contracts and expects the risk of loss to be remote.
13. Recent Accounting Pronouncements
On Oct. 13, 2016, the Securities and Exchange Commission amended existing rules intended to modernize reporting and disclosure of information. These amendments relate to Regulation S-X which sets forth the form and content of financial statements. At this time, management is evaluating the implications of adopting these amendments and their impact on the financial statements and accompanying notes.
14. Subsequent Events
Management has determined that no material events or transactions occurred subsequent to Dec. 31, 2016 that would require recognition or disclosure in the Series’ financial statements.
International Value Equity Series-21
Table of Contents
Delaware VIP® Trust — Delaware VIP International Value Equity Series
Report of independent registered public accounting firm
To the Board of Trustees of Delaware VIP Trust and Shareholders of Delaware VIP International Value Equity Series:
In our opinion, the accompanying statement of assets and liabilities, including the schedule of investments, and the related statements of operations and of changes in net assets and the financial highlights present fairly, in all material respects, the financial position of Delaware VIP International Value Equity Series (one of the series constituting Delaware VIP Trust, hereafter referred to as the “Series”) as of December 31, 2016, the results of its operations for the year then ended, the changes in its net assets for each of the two years in the period then ended and the financial highlights for each of the five years in the period then ended, in conformity with accounting principles generally accepted in the United States of America. These financial statements and financial highlights (hereafter referred to as “financial statements”) are the responsibility of the Series’ management. Our responsibility is to express an opinion on these financial statements based on our audits. We conducted our audits of these financial statements in accordance with the standards of the Public Company Accounting Oversight Board (United States). Those standards require that we plan and perform the audit to obtain reasonable assurance about whether the financial statements are free of material misstatement. An audit includes examining, on a test basis, evidence supporting the amounts and disclosures in the financial statements, assessing the accounting principles used and significant estimates made by management, and evaluating the overall financial statement presentation. We believe that our audits, which included confirmation of securities as of December 31, 2016 by correspondence with the custodian and brokers, provide a reasonable basis for our opinion.
PricewaterhouseCoopers LLP
Philadelphia, Pennsylvania
February 16, 2017
International Value Equity Series-22
Table of Contents
Delaware VIP® International Value Equity Series
Other Series information (Unaudited)
Board consideration of Delaware VIP International Value Equity Series investment management agreement
At a meeting held on Aug. 16–18, 2016 (the “Annual Meeting”), the Board of Trustees (the “Board”), including a majority of disinterested or independent Trustees, approved the renewal of the Investment Advisory Agreement for Delaware VIP International Value Equity Series (the “Series”). In making its decision, the Board considered information furnished at regular quarterly Board meetings, including reports detailing Series performance, investment strategies, and expenses, as well as information prepared specifically in connection with the renewal of the investment advisory and sub-advisory contracts. Information furnished specifically in connection with the renewal of the Investment Management Agreement with Delaware Management Company (“DMC”) included materials provided by DMC and its affiliates (“Delaware Investments”) concerning, among other things, the nature, extent, and quality of services provided to the Series; the costs of such services to the Series; economies of scale; and the investment manager’s financial condition and profitability. In addition, in connection with the Annual Meeting, reports were provided to the Trustees in May 2016 and included reports provided by Broadridge Financial Solutions (“Broadridge”). The Broadridge reports compared the Series’ investment performance and expenses with those of other comparable mutual funds. The Independent Trustees reviewed and discussed the Broadridge reports with independent legal counsel to the Independent Trustees. In addition to the information noted above, the Board also requested and received information regarding DMC’s policy with respect to advisory fee levels and its breakpoint philosophy; the structure of portfolio manager compensation; comparative client fee information; and any constraints or limitations on the availability of securities for certain investment styles, which had in the past year inhibited, or which were likely in the future to inhibit, the investment manager’s ability to invest fully in accordance with Series policies.
In considering information relating to the approval of the Series’ advisory agreement, the Independent Trustees received assistance and advice from and met separately with independent legal counsel to the Independent Trustees. Although the Board gave attention to all information furnished, the following discussion identifies, under separate headings, the primary factors taken into account by the Board during its contract renewal considerations.
Nature, extent, and quality of service. The Board considered the services provided by DMC to the Series and its shareholders. In reviewing the nature, extent, and quality of services, the Board considered reports furnished to it throughout the year, which covered matters such as the relative performance of the Series; compliance of portfolio managers with the investment policies, strategies, and restrictions for the Series; compliance by DMC and Delaware Distributors, L.P.(together, “Management”) personnel with the Code of Ethics adopted throughout the Delaware Investments® Family of Funds complex; and adherence to fair value pricing procedures as established by the Board. The Board was pleased with the current staffing of the Series’ investment advisor and the emphasis placed on research in the investment process. The Board recognized DMC’s receipt of several industry distinctions during the past several years. The Board gave favorable consideration to DMC’s efforts to control expenditures while maintaining service levels committed to Series matters. The Board was satisfied with the nature, extent, and quality of the overall services provided by DMC.
Investment performance. The Board placed significant emphasis on the investment performance of the Series in view of the importance of investment performance to shareholders. Although the Board gave appropriate consideration to performance reports and discussions with portfolio managers at Board meetings throughout the year, the Board gave particular weight to the Broadridge reports furnished for the Annual Meeting. The Broadridge reports prepared for the Series showed the investment performance of its Standard Class shares in comparison to a group of similar funds as selected by Broadridge (the “Performance Universe”). A fund with the best performance ranked first, and a fund with the poorest performance ranked last. The highest/best performing 25% of funds in the Performance Universe make up the first quartile; the next 25%, the second quartile; the next 25%, the third quartile; and the poorest/worst performing 25% of funds in the Performance Universe make up the fourth quartile. Comparative annualized performance for the Series was shown for the past 1-, 3-, 5-, and 10-year periods, as applicable, ended Jan. 31, 2016. The Board’s objective is that the Series’ performance for the periods considered be at or above the median of its Performance Universe.
The Performance Universe for the Series consisted of the Series and all international multi-cap value funds underlying variable insurance products as selected by Broadridge. The Broadridge report comparison showed that the Series’ total return for the 1-year period was in the first quartile of its Performance Universe. The report further showed that the Series’ total return for the 3-, 5-, and 10-year periods was in the second quartile of its Performance Universe. The Board was satisfied with performance.
Comparative expenses. The Board considered expense comparison data for the Delaware Investments Family of Funds. Management provided the Board with information on pricing levels and fee structures for the Series as of its most recently completed fiscal year. The Board also focused on the comparative analysis of effective management fees and total expense ratios of the Series versus effective management fees and expense ratios of a group of similar funds as selected by Broadridge (the “Expense Group”). In reviewing comparative costs, the Series’ contractual management fee and the actual management fee incurred by the Series were compared with the contractual management fees (assuming all funds in the Expense Group were similar in size to the Series) and actual management fees (as reported by each fund) within the Expense Group, taking into account any applicable breakpoints and fee waivers. The Series’ total expenses were also compared with those of its Expense Group. The Broadridge total expenses, for comparative consistency, were shown by Broadridge for Standard Class shares which do not charge 12b-1 and non-12b-1 service fees. The Board’s objective is to limit the Series’ total expense ratio to be competitive with that of the Expense Group.
The expense comparisons for the Series showed that its actual management fee and total expenses were in the quartile with the second highest expenses of its Expense Group. The Series’ total expenses were not in line with the Board’s objective. In evaluating total expenses, the Board considered 12b-1 waivers in place through May 1, 2017 and various initiatives implemented by Management. The Board was satisfied with Management’s efforts to improve the Series’ total expense ratio and to bring it in line with the Board’s objective.
International Value Equity Series-23
Table of Contents
Delaware VIP® International Value Equity Series
Other Series information (Unaudited)
Board consideration of Delaware VIP International Value Equity Series investment management agreement (continued)
Management profitability. The Board considered the level of profits realized by DMC in connection with the operation of the Series. In this respect, the Board reviewed the Investment Management Profitability Analysis that addressed the overall profitability of DMC’s business in providing management and other services to each of the individual funds and the Delaware Investments® Family of Funds as a whole. Specific attention was given to the methodology followed in allocating costs for the purpose of determining profitability. Management stated that the level of profits of DMC, to a certain extent, reflects recent operational cost savings and efficiencies initiated by DMC. The Board considered DMC’s efforts to improve services provided to fund shareholders and to meet additional regulatory and compliance requirements resulting from recent industry-wide Securities and Exchange Commission initiatives. The Board also considered the extent to which DMC might derive ancillary benefits from fund operations, including the potential for procuring additional business as a result of the prestige and visibility associated with its role as service provider to the Delaware Investments Family of Funds and the benefits from allocation of fund brokerage to improve trading efficiencies. The Board found that the management fees were reasonable in light of the services rendered and the profitability of DMC.
Economies of scale. The Trustees considered whether economies of scale are realized by DMC as the Series’ assets increase and the extent to which any economies of scale are reflected in the level of management fees charged. The Trustees reviewed the standardized advisory fee pricing and structure approved by the Board and shareholders, which includes breakpoints, and which applies to most funds in the Delaware Investments Family of Funds complex. Breakpoints in the advisory fee occur when the advisory fee rate is reduced on assets in excess of specified levels. Breakpoints result in a lower advisory fee, than would otherwise be the case in the absence of breakpoints, when the asset levels specified in the breakpoints are exceeded. The Board noted that the fee under the Series’ management contract fell within the standardized fee pricing structure. Although, as of May 31, 2016, the Series has not reached a size at which the advantages of any breakpoints in the applicable fee schedule, the Board recognized that the fee was structured so that if the Series grows, economies of scale may be shared.
Tax Information
For the year ended Dec. 31, 2016, the Series reports distributions paid during the year as follows:
| (A) | ||||
| Ordinary Income | Total | |||
| Distributions | Distributions | |||
| (Tax Basis) | (Tax Basis) | |||
| 100.00% | 100.00% |
All disclosures are based on financial information available as of the date of this annual report and, accordingly are subject to change. For any and all items requiring reporting, it is the intention of the Series to report the maximum amount permitted under the Internal Revenue Code and the regulations thereunder.
(A) is based on a percentage of the Series’ total distributions.
The Series intends to pass through foreign tax credits in the maximum amount of $118,223. The gross foreign source income earned during the fiscal year 2016 by the Series was $1,933,417.
International Value Equity Series-24
Table of Contents
Delaware Investments® Family of Funds
Board of trustees/directors and officers addendum
A mutual fund is governed by a Board of Trustees/Directors (“Trustees”), which has oversight responsibility for the management of a fund’s business affairs. Trustees establish procedures and oversee and review the performance of the investment manager, the distributor, and others who perform services for the fund. The independent fund trustees, in particular, are advocates for shareholder interests. Each trustee has served in that capacity since he or she was elected to or appointed to the Board of Trustees, and will continue to serve until his or her retirement or the election of a new trustee in his or her place. The following is a list of the Trustees and Officers with certain background and related information.
Name, Address, and Birth Date | Position(s) Held with Fund(s) | Length of Time Served | Principal Past Five Years | Number of Portfolios in Fund Complex Overseen or Officer | Other Directorships Held by Trustee or Officer | |||||
INTERESTED TRUSTEE
| ||||||||||
Shawn K. Lytle1, 3 2005 Market Street Philadelphia, PA 19103
February 1970 | President, Chief Executive Officer, and Trustee | Trustee since September 2015
President and Chief Executive Officer since August 2015
| Shawn K. Lytle has served as President of Delaware Investments2 since June 2015 and was the Regional Head of Americas for UBS Global Asset Management from 2010 through 2015. | 62 | Trustee — UBS Relationship Funds, SMA Relationship Trust, and UBS Funds (May 2010–April 2015) | |||||
INDEPENDENT TRUSTEES
| ||||||||||
Thomas L. Bennett 2005 Market Street Philadelphia, PA 19103
October 1947 | Chairman and Trustee | Trustee since March 2005
Chairman since March 2015 | Private Investor (March 2004–Present) | 62 | None | |||||
Ann D. Borowiec 2005 Market Street Philadelphia, PA 19103
November 1958 | Trustee | Since March 2015 | Chief Executive Officer Private Wealth Management (2011–2013) and Market Manager, New Jersey Private Bank (2005–2011) — J.P. Morgan Chase & Co. | 62 | Director — Banco Santander International Director — Santander Bank, N.A. | |||||
Joseph W. Chow 2005 Market Street Philadelphia, PA 19103
January 1953 | Trustee | Since January 2013 | Executive Vice President (Emerging Economies Strategies, Risks, and Corporate Administration) State Street Corporation (July 2004–March 2011) | 62 | Director and Audit Committee Member — Hercules Technology Growth Capital, Inc. (2004–2014) | |||||
John A. Fry 2005 Market Street Philadelphia, PA 19103
May 1960 | Trustee | Since January 2001 | President — Drexel University (August 2010–Present)
President — Franklin & Marshall College (July 2002–July 2010) | 62 | Director, Audit Committee and Governance Committee Member — Community Health Systems
Director — Drexel Morgan & Co.
Director, Audit Committee Member — vTv Therapeutics LLC | |||||
Lucinda S. Landreth 2005 Market Street Philadelphia, PA 19103
June 1947 | Trustee | Since March 2005 | Private Investor (2004–Present) | 62 | None |
International Value Equity Series-25
Table of Contents
Name, Address, and Birth Date | Position(s) Held with Fund(s) | Length of Time Served | Principal Past Five Years | Number of Portfolios in Fund Complex Overseen or Officer | Other Directorships Held by Trustee or Officer | |||||
Frances A. Sevilla-Sacasa 2005 Market Street Philadelphia, PA 19103
January 1956 | Trustee | Since September 2011 | Chief Executive Officer — Banco Itaú International (April 2012–December 2016)
Executive Advisor to Dean (August 2011–March 2012) and Interim Dean (January 2011–July 2011) — University of Miami School of Business Administration
President — U.S. Trust, Bank of America Private Wealth Management (Private Banking) (July 2007–December 2008) | 62 | Trust Manager and Audit Committee Member — Camden Property Trust | |||||
Thomas K. Whitford 2005 Market Street Philadelphia, PA 19103
March 1956 | Trustee | Since January 2013 | Vice Chairman (2010–April 2013) — PNC Financial Services Group | 62 | Director — HSBC Finance Corporation and HSBC North America Holdings Inc.
Director — HSBC Bank | |||||
Janet L. Yeomans 2005 Market Street Philadelphia, PA 19103
July 1948 | Trustee | Since April 1999 | Vice President and Treasurer (January 2006–July 2012)
Vice President — Mergers & Acquisitions (January 2003–January 2006), and Vice President and Treasurer (July 1995–January 2003) — 3M Company | 62 | Director, Personnel and Compensation Committee Chair, and Audit Committee Member — Okabena Company | |||||
OFFICERS
| ||||||||||
David F. Connor 2005 Market Street Philadelphia, PA 19103
December 1963 | Senior Vice President, General Counsel, and Secretary | Senior Vice President, since May 2013; General Counsel since May 2015; Secretary since October 2005 | David F. Connor has served in various capacities at different times at Delaware Investments. | 62 | None3 | |||||
Daniel V. Geatens 2005 Market Street Philadelphia, PA 19103
October 1972 | Vice President and Treasurer | Treasurer since October 2007 | Daniel V. Geatens has served in various capacities at different times at Delaware Investments. | 62 | None3 | |||||
Richard Salus 2005 Market Street Philadelphia, PA 19103
October 1963 | Senior Vice President and Chief Financial Officer | Chief Financial Officer since November 2006 | Richard Salus has served in various capacities at different times at Delaware Investments. | 62 | None3 |
| 1 | Shawn K. Lytle is considered to be an “Interested Trustee” because he is an executive officer of the Fund’s(s’) investment advisor. |
| 2 | Delaware Investments is the marketing name for Delaware Management Holdings, Inc. and its subsidiaries, including the Fund’s(s’) investment advisor, principal underwriter, and its transfer agent. |
| 3 | Shawn K. Lytle, David F. Connor, Daniel V. Geatens, and Richard Salus serve in similar capacities for the six portfolios of the Optimum Fund Trust, which have the same investment advisor, principal underwriter, and transfer agent as the registrant. |
The Statement of Additional Information for the Fund(s) includes additional information about the Trustees and Officers and is available, without charge, upon request by calling 800 523-1918.
International Value Equity Series-26
Table of Contents
The Series files its complete schedule of portfolio holdings with the Securities and Exchange Commission (Commission) for the first and third quarters of each fiscal year on Form N-Q. The Series’ Forms N-Q, as well as a description of the policies and procedures that the Series uses to determine how to vote proxies (if any) relating to portfolio securities are available without charge (i) upon request, by calling 800 523-1918; and (ii) on the Commission’s website at sec.gov. In addition, a description of the policies and procedures that the Series uses to determine how to vote proxies (if any) relating to portfolio securities and the Schedule of Investments included in the Series’ most recent Form N-Q are available without charge on the Delaware Investments® Funds’ website at delawareinvestments.com/vip/literature. The Series’ Forms N-Q may be reviewed and copied at the Commission’s Public Reference Room in Washington, DC; information on the operation of the Public Reference Room may be obtained by calling 800 SEC-0330.
Information (if any) regarding how the Series voted proxies relating to portfolio securities during the most recently disclosed 12-month period ended June 30 is available without charge (i) through the Delaware Investments Funds’ website at delawareinvestments.com/proxy; and (ii) on the Commission’s website at sec.gov.
|
| AR-VIPIVE [12/16] BNY 21385 (2/17) (18579) | International Value Equity Series-27 |
Table of Contents
Delaware VIP® Trust
|
Delaware VIP Limited-Term Diversified Income Series
|
Annual report
|
December 31, 2016
|

Table of Contents
| 1 | |||||
| 2 | |||||
| 4 | |||||
| 5 | |||||
| 6 | |||||
| 15 | |||||
| 16 | |||||
| 16 | |||||
| 17 | |||||
| 19 | |||||
| 27 | |||||
| 28 | |||||
| 30 | |||||

Neither Delaware Investments nor its affiliates noted in this document are authorized deposit-taking institutions for the purpose of the Banking Act 1959 (Commonwealth of Australia). The obligations of these entities do not represent deposits or other liabilities of Macquarie Bank Limited (MBL), a subsidiary of Macquarie Group Limited and an affiliate of Delaware Investments. MBL does not guarantee or otherwise provide assurance in respect of the obligations of these entities, unless noted otherwise. The Series is governed by U.S. laws and regulations.
Unless otherwise noted, views expressed herein are current as of Dec. 31, 2016, and subject to change for events occurring after such dates.
The Series is not FDIC insured and is not guaranteed. It is possible to lose the principal amount invested.
Mutual fund advisory services provided by Delaware Management Company, a series of Delaware Management Business Trust, which is a registered investment advisor. Delaware Investments, a member of Macquarie Group, refers to Delaware Management Holdings, Inc. and its subsidiaries, including the Series’ distributor, Delaware Distributors, L.P. Macquarie Group refers to Macquarie Group Limited and its subsidiaries and affiliates worldwide.
This material may be used in conjunction with the offering of shares in Delaware VIP Limited-Term Diversified Income Series only if preceded or accompanied by the Series’ current prospectus or the summary prospectus.
© 2017 Delaware Management Holdings, Inc.
All third-party marks cited are the property of their respective owners.
Table of Contents
| Delaware VIP® Trust — Delaware VIP Limited-Term Diversified Income Series | ||
| Portfolio management review | January 10, 2017 | |
For the fiscal year ended Dec. 31, 2016, Delaware VIP Limited-Term Diversified Income Series Standard Class shares returned +2.09%, and Service Class shares returned +1.73%. Both figures reflect all distributions reinvested. For the same period, the Series’ benchmark, the Bloomberg Barclays 1–3 Year U.S. Government/Credit Index, returned +1.28%.
The U.S. economy continued its slow to moderate pace of growth in 2016. After an initial rate hike in December 2015, the U.S. Federal Reserve was expected to continue raising short-term interest rates. However, partly in response to ongoing sluggish global growth, the Fed awaited further signs of economic strength before raising rates again.
In contrast, central banks in the European Union, the United Kingdom, China, and Japan all maintained or increased monetary stimulus programs and set historically low interest rates. These divergent central bank policies — and interest rates — between the United States and the rest of the world increased foreign demand for U.S. risk assets, including investment grade corporate bonds.
U.S. Treasury yields rose sharply after Donald Trump’s election as U.S. president on the market’s assumption that a Trump administration would implement fiscal stimulus through tax cuts, deregulation, and infrastructure spending. The Fed made its long-awaited second rate hike in December 2016 after mounting indications of U.S. economic acceleration.
The robust returns of investment grade corporate bonds drove the Series’ relatively strong performance as returns for corporate bonds were boosted by strong foreign demand, and a general reach for yield. However, corporate financial strength deteriorated throughout 2016 as leverage increased.
The Series was able to capture additional income relative to the Index through our overweight allocation in corporate bonds. This included longer-duration bonds. We accomplished that without taking on, in our view, excess interest rate risk by allocating significantly to AAA-rated asset-backed floating rate bonds in auto loans and credit card receivables as a portfolio anchor.
Although the Fed had indicated it might raise rates three times in 2016, we thought rate hikes would more likely be just one or two. In our view, the Fed was too optimistic about U.S. economic growth. We saw inflation as less of a risk. Our assumption of less Fed action in 2016 helped our positioning and the Series’ performance. The Series’ holdings of both short-term floating rate bonds and longer-term corporate bonds aided performance as the rate curve flattened. However, the Series’ yield curve positioning became a negative factor after the November election when the curve began to steepen.
Modest allocations to high yield (roughly 3% of the portfolio), bank loans (2%), and emerging market bonds (2%) — all out-of-benchmark sectors that did better than the benchmark — contributed to the Series’ outperformance as well. An overweight to BBB-rated corporate bonds (8%) also helped as lower-quality assets outperformed higher quality throughout the year.
An average 8% allocation to agency mortgage-backed securities (MBS) likewise contributed. Within agency MBS, we benefited from exposure to high-coupon, short-duration mortgages that had shown benign prepayments.
Avoiding Treasury securities, which made up just 1% of the portfolio, was also positive in a rate hiking cycle. On the short end of the spectrum, we replaced Treasurys with asset-backed securities and high-coupon agency mortgages.
In contrast, allocating 1% to municipal bonds, another out-of-benchmark sector, detracted as that sector’s returns were negative.
Given our views on the timing of upcoming Fed rate hikes we have maintained our barbell portfolio strategy of purchasing both short- and long-term bonds in an attempt to seek better risk-adjusted returns.
Although credit spreads have narrowed, we believe they’re within historical averages and fairly priced, and we remain confident in our ability to manage idiosyncratic risk through fundamental research. As bottom-up bond pickers focused on fundamental credits of individual companies, we seek to add value by potentially avoiding risks associated with latent problems of individual companies.
The Series used Treasury futures to help manage duration. Treasury futures made up 1.29% of the portfolio on average, while exposure to high yield CDX, a credit derivative, averaged about 3.5%. Neither had a material effect on the portfolio, with high yield CDX holdings having a negative impact, while Treasury futures were positive for the Series.
| Unless otherwise noted, views expressed herein are current as of Dec. 31, 2016, and subject to change. | ||
| Limited-Term Diversified Income Series-1 |
Table of Contents
Delaware VIP® Trust — Delaware VIP Limited-Term Diversified Income Series
The performance quoted represents past performance and does not guarantee future results. Investment return and principal value of an investment will fluctuate so that shares, when redeemed, may be worth more or less than their original cost. Current performance may be lower or higher than the performance quoted.
Carefully consider the Series’ investment objectives, risk factors, charges, and expenses before investing. This and other information can be found in the Series’ prospectus and its summary prospectus, which may be obtained by calling 800 523-1918. Investors should read the prospectus and the summary prospectus carefully before investing.
Delaware VIP Limited-Term Diversified Income Series Average annual total returns For periods ended Dec. 31, 2016 | 1 year | 3 years | 5 years | 10 years | Lifetime | |||||||
Standard Class shares (commenced operations on July 28, 1988) | +2.09% | +1.52% | +1.25% | +3.01% | +4.97% | |||||||
Service Class shares (commenced operations on May 1, 2000) | +1.73% | +1.27% | +0.99% | +2.75% | +3.79% | |||||||
Bloomberg Barclays 1–3 Year U.S. Government/Credit Index* | +1.28% | +0.90% | +0.92% | +2.45% | n/a | |||||||
*Formerly known as the Barclays 1–3 Year U.S. Government/Credit Index.
Returns reflect the reinvestment of all distributions. Please see page 3 for a description of the index.
As described in the Series’ most recent prospectus, the net expense ratio for Service Class shares of the Series was 0.80%, while total operating expenses for Standard Class and Service Class shares were 0.55% and 0.85%, respectively. The management fee for Standard Class and Service Class shares was 0.48%.
The Series’ distributor has contracted to limit the 12b-1 fees for Service Class shares to 0.25% of average daily net assets from Jan. 1, 2016 through Dec. 31, 2016.*
Earnings from a variable annuity or variable life investment compound tax-free until withdrawal, and as a result, no adjustments were made for income taxes.
Expense limitations were in effect for both classes during certain periods shown in the Series’ performance table above and in the Performance of a $10,000 Investment graph on the next page.
Performance data do not reflect insurance fees related to a variable annuity or variable life investment or the deferred sales charge that would apply to certain withdrawals of investments held for fewer than eight years. Performance shown here would have been reduced if such fees were included and the expense limitation removed. For more information about fees, consult your variable annuity or variable life prospectus.
Investments in variable products involve risk.
Fixed income securities and bond funds can lose value, and investors can lose principal, as interest rates rise. They also may be affected by economic conditions that hinder an issuer’s ability to make interest and principal payments on its debt.
The Series may also be subject to prepayment risk, the risk that the principal of a fixed income security that is held by the Series may be prepaid prior to maturity, potentially forcing the Series to reinvest that money at a lower interest rate.
The Series may invest in derivatives, which may involve additional expenses and are subject to risk, including the risk that an underlying security or securities index moves in the opposite direction from what the portfolio manager anticipated. A derivative transaction depends upon the counterparties’ ability to fulfill their contractual obligations.
High yielding, noninvestment grade bonds (junk bonds) involve higher risk than investment grade bonds. The high yield secondary market is particularly susceptible to liquidity problems when institutional investors, such as mutual funds and certain other financial institutions, temporarily stop buying bonds for regulatory, financial, or other reasons. In addition, a less liquid secondary market makes it more difficult for the Series to obtain precise valuations of the high yield securities in its portfolio.
The Series may experience portfolio turnover in excess of 100%, which could result in higher transaction costs and tax liability.
International investments entail risks not ordinarily associated with U.S. investments including fluctuation in currency values, differences in accounting principles, or economic or political instability in other nations. Investing in emerging markets can be riskier than investing in established foreign markets due to increased volatility and lower trading volume.
Limited-Term Diversified Income Series-2
Table of Contents
Delaware VIP® Limited-Term Diversified Income Series
Performance summary (continued)
If and when the Series invests in forward foreign currency contracts or uses other investments to hedge against currency risks, the Series will be subject to special risks, including counterparty risk.
Please read both the contract and underlying prospectus for specific details regarding the product’s risk profile.
*The aggregate contractual waiver period covering this report is from April 29, 2015 through May 1, 2017.
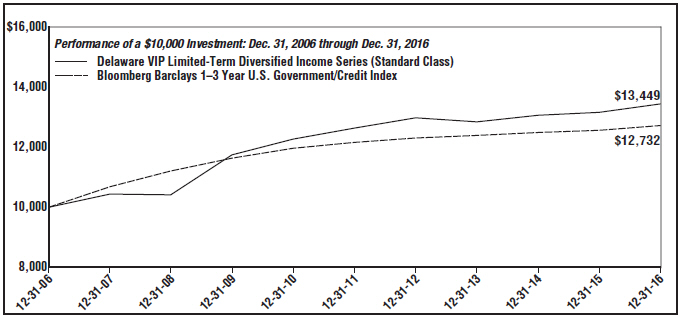
| For period beginning Dec. 31, 2006 through Dec. 31, 2016 | Starting value | Ending value | ||
–– Delaware VIP Limited-Term Diversified Income Series (Standard Class) | $10,000 | $13,449 | ||
– – Bloomberg Barclays 1–3 Year U.S. Government/Credit Index | $10,000 | $12,732 |
The graph shows a $10,000 investment in the Delaware VIP Limited-Term Diversified Income Series Standard Class shares for the period from Dec. 31, 2006 through Dec. 31, 2016.
The graph also shows $10,000 invested in the Bloomberg Barclays 1–3 Year U.S. Government/Credit Index (formerly known as the Barclays 1–3 Year U.S. Government/Credit Index) for the period from Dec. 31, 2006 through Dec. 31, 2016. The Bloomberg Barclays 1–3 Year U.S. Government/Credit Index is a market value-weighted index of government fixed-rate debt securities and investment grade U.S. and foreign fixed-rate debt securities with average maturities of one to three years.
Index performance returns do not reflect any management fees, transaction costs or expenses. Indices are unmanaged and one cannot invest directly in an index.
Performance of Service Class shares will vary due to different charges and expenses.
Past performance is not a guarantee of future results.
| Limited-Term Diversified Income Series-3 |
Table of Contents
Delaware VIP® Trust — Delaware VIP Limited-Term Diversified Income Series
For the six-month period July 1, 2016 to December 31, 2016 (Unaudited)
As a shareholder of the Series, you incur ongoing costs, which may include management fees; distribution and/or service (12b-1) fees; and other Series expenses. This example is intended to help you understand your ongoing costs (in dollars) of investing in the Series and to compare these costs with the ongoing costs of investing in other mutual funds.
The example is based on an investment of $1,000 invested at the beginning of the period and held for the entire six-month period from July 1, 2016 to Dec. 31, 2016.
Actual expenses
The first section of the table shown, “Actual Series return,” provides information about actual account values and actual expenses. You may use the information in this section of the table, together with the amount you invested, to estimate the expenses that you paid over the period. Simply divide your account value by $1,000 (for example, an $8,600 account value divided by $1,000 = 8.6), then multiply the result by the number in the first section under the heading entitled “Expenses Paid During Period” to estimate the expenses you paid on your account during the period.
Hypothetical example for comparison purposes
The second section of the table shown, “Hypothetical 5% return,” provides information about hypothetical account values and hypothetical expenses based on the Series’ actual expense ratio and an assumed rate of return of 5% per year before expenses, which is not the Series’ actual return. The hypothetical account values and expenses may not be used to estimate the actual ending account balance or expenses you paid for the period. You may use this information to compare the ongoing costs of investing in the Series and other funds. To do so, compare the 5% hypothetical example with the 5% hypothetical examples that appear in the shareholder reports of other funds.
Please note that the expenses shown in the table are meant to highlight your ongoing costs only. As a shareholder of the Series, you do not incur any transaction costs, such as sales charges (loads), redemption fees or exchange fees, but shareholders of other funds may incur such costs. Also, the fees related to the variable annuity investment or the deferred sales
charge that could apply have not been included. Therefore, the second section of the table is useful in comparing ongoing costs only, and will not help you determine the relative total costs of owning different funds. The Series’ actual expenses shown in the table reflect fee waivers in effect for Service Class shares. The expenses shown in the table assume reinvestment of all dividends and distributions.
Expense analysis of an investment of $1,000
| Beginning Account Value 7/1/16 | Ending Account Annualized Value 12/31/16 | Expense Ratio | Expenses Paid During Period 7/1/16 to 12/31/16* | |||||||||
Actual Series return† | ||||||||||||
Standard Class | $1,000.00 | $996.30 | 0.54% | $2.71 | ||||||||
Service Class | 1,000.00 | 993.90 | 0.79% | 3.96 | ||||||||
Hypothetical 5% return (5% return before expenses) | ||||||||||||
Standard Class | $1,000.00 | $1,022.42 | 0.54% | $2.75 | ||||||||
Service Class | 1,000.00 | 1,021.17 | 0.79% | 4.01 | ||||||||
| * | “Expenses Paid During Period” are equal to the Series’ annualized expense ratio,multiplied by the average account value over the period, multiplied by 184/366 (to reflect the one-half year period). |
| † | Because actual returns reflect only the most recent six-month period, the returns shown may differ significantly from fiscal year returns. |
| Limited-Term Diversified Income Series-4 |
Table of Contents
Delaware VIP® Trust — Delaware VIP Limited-Term Diversified Income Series
Security type / sector allocation
As of December 31, 2016 (Unaudited)
Sector designations may be different than the sector designations presented in other Series materials. The sector designations may represent the investment manager’s internal sector classifications, which may result in the sector designations for one series being different than another series’ sector designations.
| Security type / sector | Percentage of net assets | ||||
Agency Asset-Backed Security | 0.00% | ||||
Agency Collateralized Mortgage Obligations | 1.35% | ||||
Agency Commercial Mortgage-Backed Securities | 0.39% | ||||
Agency Mortgage-Backed Securities | 13.09% | ||||
Convertible Bond | 0.12% | ||||
Corporate Bonds | 38.32% | ||||
Banking | 15.11% | ||||
Basic Industry | 1.30% | ||||
Brokerage | 0.23% | ||||
Capital Goods | 1.15% | ||||
Communications | 3.52% | ||||
Consumer Cyclical | 2.31% | ||||
Consumer Non-Cyclical | 4.05% | ||||
Electric | 4.85% | ||||
Energy | 2.06% | ||||
Finance Companies | 0.83% | ||||
Insurance | 1.08% | ||||
Natural Gas | 0.49% | ||||
Real Estate | 0.07% | ||||
Technology | 0.58% | ||||
Transportation | 0.69% | ||||
Municipal Bonds | 1.05% | ||||
Non-Agency Asset-Backed Securities | 34.11% | ||||
Non-Agency Collateralized Mortgage Obligations | 0.22% | ||||
Non-Agency Commercial Mortgage-Backed Securities | 0.38% | ||||
U.S. Treasury Obligations | 8.51% | ||||
Preferred Stock | 1.07% | ||||
Short-Term Investments | 1.14% | ||||
Total Value of Securities | 99.75% | ||||
Receivables and Other Assets Net of Liabilities | 0.25% | ||||
Total Net Assets | 100.00% | ||||
Limited-Term Diversified Income Series-5
Table of Contents
Delaware VIP® Trust — Delaware VIP Limited-Term Diversified Income Series
December 31, 2016
Principal amount° | Value (U.S. $) | |||||||
Agency Asset-Backed | ||||||||
Fannie Mae Grantor Trust | ||||||||
Series 2003-T4 2A5 4.98% 9/26/33 f | 18,879 | $ | 20,661 | |||||
|
| |||||||
Total Agency Asset-Backed Security (cost $18,726) | 20,661 | |||||||
|
| |||||||
Agency Collateralized Mortgage Obligations – 1.35% |
| |||||||
Fannie Mae Connecticut Avenue Securities | ||||||||
Series 2015-C03 1M1 2.256% 7/25/25 ● | 1,391,094 | 1,393,694 | ||||||
Series 2015-C03 2M1 2.256% 7/25/25 ● | 1,987,964 | 1,991,866 | ||||||
Series 2015-C04 2M1 2.456% 4/25/28 ● | 1,429,087 | 1,433,371 | ||||||
Series 2016-C03 1M1 2.756% 10/25/28 ● | 1,707,435 | 1,730,555 | ||||||
Series 2016-C04 1M1 2.206% 1/25/29 ● | 961,479 | 967,597 | ||||||
Fannie Mae Grantor Trust | ||||||||
Series 2001-T5 A2 6.985% 6/19/41 ● | 13,970 | 15,636 | ||||||
Fannie Mae REMICs | ||||||||
Series 2002-90 A1 6.50% 6/25/42 | 432 | 504 | ||||||
Series 2003-52 NA 4.00% 6/25/23 | 45,749 | 47,889 | ||||||
Series 2003-120 BL 3.50% 12/25/18 | 52,540 | 53,233 | ||||||
Series 2004-49 EB 5.00% 7/25/24 | 10,015 | 10,747 | ||||||
Series 2005-66 FD 1.056% 7/25/35 ● | 231,696 | 230,607 | ||||||
Series 2005-110 MB 5.50% 9/25/35 | 2,590 | 2,740 | ||||||
Series 2011-88 AB 2.50% 9/25/26 | 38,481 | 38,784 | ||||||
Series 2011-113 MC 4.00% 12/25/40 . | 86,106 | 88,581 | ||||||
Freddie Mac REMICs | ||||||||
Series 2326 ZQ 6.50% 6/15/31 | 14,306 | 16,206 | ||||||
Series 3016 FL 1.094% 8/15/35 ● | 17,527 | 17,557 | ||||||
Series 3027 DE 5.00% 9/15/25 | 10,859 | 11,717 | ||||||
Series 3067 FA 1.054% 11/15/35 ● | 939,690 | 937,159 | ||||||
Series 3232 KF 1.154% 10/15/36 ● | 33,887 | 33,939 | ||||||
Series 3297 BF 0.944% 4/15/37 ● | 360,074 | 357,708 | ||||||
Series 3737 NA 3.50% 6/15/25 | 54,998 | 57,117 | ||||||
Series 3780 LF 1.104% 3/15/29 ● | 70,614 | 70,669 | ||||||
Series 3800 AF 1.204% 2/15/41 ● | 2,002,461 | 2,010,427 | ||||||
Series 3803 TF 1.104% 11/15/28 ● | 70,305 | 70,463 | ||||||
Series 4163 CW 3.50% 4/15/40 | 1,498,682 | 1,534,377 | ||||||
Freddie Mac Strips | ||||||||
Series 19 F 1.474% 6/1/28 ● | 1,654 | 1,635 | ||||||
Freddie Mac Structured Agency Credit | ||||||||
Risk Debt Notes | ||||||||
Series 2014-DN4 M2 3.156% 10/25/24 ● | 110,586 | 110,780 | ||||||
Series 2015-DNA3 M2 3.606% 4/25/28 ● | 920,000 | 946,551 | ||||||
Principal amount° | Value (U.S. $) | |||||||
Agency Collateralized Mortgage Obligations (continued) | ||||||||
Freddie Mac Structured Agency Credit Risk Debt Notes | ||||||||
Series 2015-HQA1 M2 3.406% 3/25/28 ● | 715,367 | $ | 729,786 | |||||
Series 2015-HQA2 M2 3.556% 5/25/28 ● | 775,000 | 795,473 | ||||||
Series 2016-DNA1 M2 3.656% 7/25/28 ● | 470,000 | 483,824 | ||||||
Series 2016-DNA3 M2 2.756% 12/25/28 ● | 410,000 | 413,816 | ||||||
Series 2016-DNA4 M2 2.056% 3/25/29 ● | 250,000 | 249,525 | ||||||
Series 2016-HQA2 M2 3.006% 11/25/28 ● | 480,000 | 489,858 | ||||||
Freddie Mac Structured Pass Through Certificates | ||||||||
Series T-54 2A 6.50% 2/25/43 ◆ | 835 | 966 | ||||||
Series T-58 2A 6.50% 9/25/43 ◆ | 19,106 | 21,859 | ||||||
NCUA Guaranteed Notes Trust 2011-R2 | ||||||||
Series 2011-R2 1A 1.052% 2/6/20 ● | 1,681,852 | 1,681,868 | ||||||
|
| |||||||
Total Agency Collateralized Mortgage Obligations (cost $18,960,569) | 19,049,084 | |||||||
|
| |||||||
Agency Commercial Mortgage-Backed Securities – 0.39% | ||||||||
FREMF Mortgage Trust | ||||||||
Series 2011-K15 B 144A 4.948% 8/25/44 #● | 125,000 | 134,847 | ||||||
Series 2012-K22 B 144A 3.811% 8/25/45 #● | 1,115,000 | 1,143,167 | ||||||
Series 2012-K708 B 144A 3.751% 2/25/45 #● | 1,170,000 | 1,200,004 | ||||||
Series 2013-K712 B 144A 3.365% 5/25/45 #● | 625,000 | 634,670 | ||||||
NCUA Guaranteed Notes Trust | ||||||||
Series 2011-C1 2A 1.182% 3/9/21 ● | 2,392,529 | 2,387,710 | ||||||
|
| |||||||
Total Agency Commercial Mortgage-Backed Securities (cost $5,513,473) | 5,500,398 | |||||||
|
| |||||||
Agency Mortgage-Backed Securities – 13.09% | ||||||||
Fannie Mae ARM | ||||||||
1.999% 8/1/37 ● | 206,587 | 212,798 | ||||||
2.53% 1/1/35 ● | 473,618 | 494,602 | ||||||
2.638% 3/1/38 ● | 2,271 | 2,385 | ||||||
2.657% 12/1/33 ● | 6,668 | 7,075 | ||||||
2.81% 8/1/34 ● | 10,376 | 10,844 | ||||||
2.832% 9/1/38 ● | 420,174 | 450,837 | ||||||
2.834% 4/1/36 ● | 4,477 | 4,729 | ||||||
Limited-Term Diversified Income Series-6
Table of Contents
Delaware VIP® Limited-Term Diversified Income Series
Schedule of investments (continued)
| Principal amount° | Value (U.S. $) | |||||||
Agency Mortgage-Backed |
| |||||||
Fannie Mae ARM | ||||||||
2.898% 8/1/37• | 90,270 | $ | 95,416 | |||||
2.907% 9/1/35• | 105,436 | 111,034 | ||||||
2.907% 8/1/36• | 10,195 | 10,735 | ||||||
2.951% 6/1/36• | 16,653 | 17,572 | ||||||
2.966% 4/1/46• | 4,460,468 | 4,549,956 | ||||||
2.993% 7/1/36• | 13,238 | 13,901 | ||||||
3.018% 7/1/36• | 16,056 | 17,161 | ||||||
3.027% 6/1/34• | 6,668 | 7,024 | ||||||
3.069% 11/1/35• | 55,381 | 58,311 | ||||||
3.076% 8/1/35• | 2,616 | 2,760 | ||||||
3.218% 4/1/44• | 339,461 | 348,805 | ||||||
3.46% 1/1/41• | 89,027 | 92,189 | ||||||
6.099% 8/1/37• | 26,027 | 25,995 | ||||||
Fannie Mae S.F. 30 yr | ||||||||
4.50% 11/1/39 | 661,089 | 717,603 | ||||||
4.50% 1/1/40 | 652,805 | 708,151 | ||||||
4.50% 7/1/40 | 834,989 | 898,027 | ||||||
4.50% 8/1/40 | 204,857 | 221,079 | ||||||
4.50% 8/1/41 | 1,811,775 | 1,965,377 | ||||||
4.50% 1/1/42 | 713,171 | 773,069 | ||||||
4.50% 8/1/42 | 337,042 | 364,517 | ||||||
4.50% 10/1/44 | 155,717 | 168,829 | ||||||
4.50% 2/1/46 | 31,686,856 | 34,115,635 | ||||||
4.50% 7/1/46 | 2,027,603 | 2,185,940 | ||||||
5.00% 4/1/33 | 116,113 | 127,203 | ||||||
5.00% 2/1/35 | 76,204 | 83,399 | ||||||
5.00% 10/1/35 | 104,362 | 113,907 | ||||||
5.00% 2/1/36 | 69,000 | 75,354 | ||||||
5.00% 8/1/37 | 290,475 | 317,601 | ||||||
5.00% 12/1/39 | 313,032 | 345,528 | ||||||
5.00% 1/1/40 | 70,730 | 78,179 | ||||||
5.00% 11/1/44 | 1,386,311 | 1,517,426 | ||||||
5.50% 12/1/32 | 25,760 | 28,894 | ||||||
5.50% 6/1/33 | 88,614 | 99,392 | ||||||
5.50% 11/1/33 | 727,481 | 815,881 | ||||||
5.50% 4/1/34 | 584,029 | 654,820 | ||||||
5.50% 7/1/34 | 37,923 | 42,535 | ||||||
5.50% 9/1/34 | 622,838 | 698,560 | ||||||
5.50% 12/1/34 | 117,002 | 131,066 | ||||||
5.50% 3/1/35 | 130,704 | 146,345 | ||||||
5.50% 5/1/35 | 435,800 | 488,157 | ||||||
5.50% 9/1/35 | 367,621 | 411,102 | ||||||
5.50% 12/1/35 | 129,464 | 144,711 | ||||||
5.50% 1/1/36 | 494,395 | 554,496 | ||||||
5.50% 4/1/36 | 1,387,417 | 1,552,610 | ||||||
5.50% 5/1/36 | 219,337 | 245,815 | ||||||
5.50% 7/1/36 | 38,267 | 42,871 | ||||||
5.50% 9/1/36 | 41,148 | 45,962 | ||||||
5.50% 10/1/36 | 460,797 | 514,750 | ||||||
5.50% 2/1/37 | 2,514,937 | 2,796,138 | ||||||
5.50% 4/1/37 | 339,341 | 378,753 | ||||||
| Principal amount° | Value (U.S. $) | |||||||
Agency Mortgage-Backed |
| |||||||
Fannie Mae S.F. 30 yr | ||||||||
5.50% 6/1/37 | 434,121 | $ | 485,094 | |||||
5.50% 8/1/37 | 512,044 | 573,908 | ||||||
5.50% 9/1/37 | 537,630 | 599,333 | ||||||
5.50% 1/1/38 | 4,589,882 | 5,108,975 | ||||||
5.50% 2/1/38 | 48,035 | 53,864 | ||||||
5.50% 3/1/38 | 716,845 | 806,364 | ||||||
5.50% 4/1/38 | 542,142 | 605,533 | ||||||
5.50% 6/1/38 | 1,030,412 | 1,149,425 | ||||||
5.50% 8/1/38 | 108,663 | 121,792 | ||||||
5.50% 1/1/39 | 444,037 | 497,975 | ||||||
5.50% 6/1/39 | 530,728 | 593,958 | ||||||
5.50% 11/1/39 | 611,022 | 681,643 | ||||||
5.50% 3/1/40 | 1,980,712 | 2,217,470 | ||||||
5.50% 3/1/41 | 22,197,042 | 24,890,271 | ||||||
5.50% 8/1/41 | 1,360,886 | 1,524,243 | ||||||
5.50% 9/1/41 | 3,441,420 | 3,854,404 | ||||||
6.00% 11/1/34 | 892 | 1,009 | ||||||
6.00% 4/1/36 | 4,458 | 5,048 | ||||||
6.00% 9/1/36 | 220,919 | 256,656 | ||||||
6.00% 7/1/37 | 448,694 | 514,237 | ||||||
6.00% 8/1/37 | 193,472 | 219,424 | ||||||
6.00% 1/1/38 | 71,565 | 80,979 | ||||||
6.00% 5/1/38 | 765,502 | 867,447 | ||||||
6.00% 1/1/39 | 217,585 | 246,575 | ||||||
6.00% 2/1/39 | 287,573 | 325,749 | ||||||
6.00% 10/1/39 | 1,845,654 | 2,126,396 | ||||||
6.00% 5/1/41 | 443,469 | 502,870 | ||||||
6.00% 7/1/41 | 4,477,727 | 5,068,324 | ||||||
6.50% 6/1/29 | 622 | 704 | ||||||
6.50% 1/1/34 | 595 | 683 | ||||||
6.50% 6/1/36 | 1,838 | 2,080 | ||||||
6.50% 10/1/36 | 1,572 | 1,778 | ||||||
6.50% 8/1/37 | 128 | 145 | ||||||
6.50% 5/1/40 | 383,373 | 435,918 | ||||||
7.00% 12/1/34 | 295 | 312 | ||||||
7.00% 12/1/35 | 743 | 828 | ||||||
7.00% 12/1/37 | 1,296 | 1,384 | ||||||
7.50% 6/1/31 | 4,492 | 5,435 | ||||||
7.50% 4/1/32 | 213 | 244 | ||||||
7.50% 5/1/33 | 566 | 570 | ||||||
7.50% 6/1/34 | 267 | 305 | ||||||
Freddie Mac ARM | ||||||||
2.553% 10/1/46• | 1,197,528 | 1,206,286 | ||||||
2.681% 10/1/36• | 3,290 | 3,475 | ||||||
2.846% 4/1/33• | 3,089 | 3,196 | ||||||
2.919% 6/1/37• | 147,614 | 154,433 | ||||||
2.943% 11/1/44• | 237,976 | 244,228 | ||||||
3.114% 3/1/46• | 1,041,585 | 1,067,940 | ||||||
3.135% 7/1/38• | 350,667 | 371,349 | ||||||
3.275% 10/1/37• | 37,028 | 38,926 | ||||||
4.899% 8/1/38• | 6,478 | 6,774 | ||||||
Limited-Term Diversified Income Series-7
Table of Contents
Delaware VIP® Limited-Term Diversified Income Series
Schedule of investments (continued)
Principal amount° | Value (U.S. $) | |||||||
Agency Mortgage-Backed |
| |||||||
Freddie Mac S.F. 30 yr | ||||||||
4.00% 6/1/45 | 12,832,127 | $ | 13,568,841 | |||||
4.00% 7/1/46 | 5,756,755 | 6,084,319 | ||||||
4.50% 4/1/39 | 114,464 | 123,615 | ||||||
4.50% 5/1/40 | 4,512,023 | 4,892,938 | ||||||
4.50% 3/1/42 | 1,326,921 | 1,437,017 | ||||||
4.50% 8/1/42 | 13,224,200 | 14,334,273 | ||||||
4.50% 12/1/43 | 537,490 | 581,057 | ||||||
4.50% 8/1/44 | 444,447 | 482,139 | ||||||
4.50% 7/1/45 | 2,650,378 | 2,853,170 | ||||||
5.00% 6/1/36 | 1,109,080 | 1,212,356 | ||||||
5.00% 4/1/44 | 2,136,567 | 2,349,999 | ||||||
5.50% 6/1/36 | 33,540 | 37,683 | ||||||
5.50% 5/1/37 | 286,039 | 321,361 | ||||||
5.50% 3/1/40 | 178,125 | 198,117 | ||||||
5.50% 8/1/40 | 599,671 | 668,733 | ||||||
5.50% 6/1/41 | 6,199,112 | 6,920,160 | ||||||
6.00% 2/1/36 | 453,717 | 517,544 | ||||||
6.00% 3/1/36 | 342,447 | 391,434 | ||||||
6.00% 1/1/38 | 65,791 | 74,326 | ||||||
6.00% 6/1/38 | 180,013 | 204,379 | ||||||
6.00% 8/1/38 | 785,583 | 901,175 | ||||||
6.00% 5/1/40 | 503,119 | 568,387 | ||||||
6.00% 7/1/40 | 452,636 | 515,447 | ||||||
7.00% 11/1/33 | 3,742 | 4,397 | ||||||
GNMA I S.F. 30 yr | ||||||||
5.00% 3/15/40 | 1,877,706 | 2,055,990 | ||||||
7.00% 12/15/34 | 15,363 | 18,064 | ||||||
GNMA II S.F. 30 yr | ||||||||
5.50% 5/20/37 | 328,453 | 364,105 | ||||||
5.50% 4/20/40 | 303,213 | 331,969 | ||||||
6.00% 2/20/39 | 469,739 | 530,916 | ||||||
6.00% 2/20/40 | 1,561,241 | 1,781,955 | ||||||
6.00% 4/20/46 | 497,301 | 554,278 | ||||||
6.50% 10/20/39 | 555,456 | 628,944 | ||||||
|
| |||||||
Total Agency Mortgage-Backed |
| 184,138,858 | ||||||
|
| |||||||
Convertible Bond – 0.12% |
| |||||||
Jefferies Group 3.875% exercise price $43.93, maturity date 11/1/29 | 1,645,000 | 1,667,619 | ||||||
|
| |||||||
Total Convertible Bond |
| 1,667,619 | ||||||
|
| |||||||
Corporate Bonds – 38.32% |
| |||||||
Banking – 15.11% | ||||||||
ANZ New Zealand International 9/23/19 # | 7,290,000 | 7,354,487 | ||||||
Bank of America | ||||||||
2.503% 10/21/22 | 3,195,000 | 3,094,099 | ||||||
4.45% 3/3/26 | 6,110,000 | 6,308,404 | ||||||
Principal amount° | Value (U.S. $) | |||||||
Corporate Bonds (continued) |
| |||||||
Banking (continued) |
| |||||||
Bank of New York Mellon | ||||||||
2.45% 11/27/20 | 5,100,000 | $ | 5,104,687 | |||||
2.50% 4/15/21 | 1,000,000 | 1,001,706 | ||||||
Barclays 3.20% 8/10/21 | 3,905,000 | 3,862,986 | ||||||
BB&T | ||||||||
2.05% 5/10/21 | 7,500,000 | 7,365,427 | ||||||
2.45% 1/15/20 | 2,085,000 | 2,102,230 | ||||||
Branch Banking & Trust | 1,570,000 | 1,597,982 | ||||||
Capital One 2.25% 9/13/21 | 3,015,000 | 2,945,013 | ||||||
Capital One Financial 4.20% 10/29/25 | 1,190,000 | 1,196,126 | ||||||
Citigroup 2.90% 12/8/21 | 3,710,000 | 3,704,209 | ||||||
Citizens Bank | ||||||||
2.30% 12/3/18 | 5,285,000 | 5,314,448 | ||||||
2.45% 12/4/19 | 5,065,000 | 5,085,488 | ||||||
Commonwealth Bank of Australia | 8,600,000 | 8,550,017 | ||||||
Compass Bank 2.75% 9/29/19 | 9,170,000 | 9,126,048 | ||||||
Cooperatieve Rabobank 3.75% 7/21/26 | 1,775,000 | 1,743,396 | ||||||
Credit Suisse | ||||||||
2.30% 5/28/19 | 8,285,000 | 8,308,173 | ||||||
3.00% 10/29/21 | 925,000 | 934,464 | ||||||
Credit Suisse Group Funding Guernsey | 2,640,000 | 2,640,821 | ||||||
Fifth Third Bancorp 2.875% 7/27/20 | 2,345,000 | 2,376,658 | ||||||
Fifth Third Bank | ||||||||
2.25% 6/14/21 | 240,000 | 237,421 | ||||||
2.30% 3/15/19 | 6,090,000 | 6,132,971 | ||||||
3.85% 3/15/26 | 1,190,000 | 1,199,812 | ||||||
HSBC Holdings 2.65% 1/5/22 | 2,785,000 | 2,720,781 | ||||||
Huntington Bancshares 2.30% 1/14/22 | 2,670,000 | 2,592,639 | ||||||
JPMorgan Chase & Co. | ||||||||
2.40% 6/7/21 | 2,820,000 | 2,795,844 | ||||||
2.75% 6/23/20 | 1,180,000 | 1,191,247 | ||||||
4.25% 10/1/27 | 4,610,000 | 4,746,636 | ||||||
JPMorgan Chase Bank 1.65% 9/23/19 | 5,005,000 | 4,957,177 | ||||||
KeyBank | ||||||||
2.35% 3/8/19 | 4,160,000 | 4,185,226 | ||||||
2.50% 11/22/21 | 4,565,000 | 4,538,975 | ||||||
3.18% 5/22/22 | 940,000 | 950,443 | ||||||
KeyCorp 5.00% 12/29/49 • | 1,290,000 | 1,193,250 | ||||||
Morgan Stanley | ||||||||
2.45% 2/1/19 | 7,760,000 | 7,817,214 | ||||||
2.625% 11/17/21 | 740,000 | 731,921 | ||||||
3.95% 4/23/27 | 5,180,000 | 5,138,487 | ||||||
Nationwide Building Society 144A | 1,830,000 | 1,746,999 | ||||||
PNC Bank | ||||||||
2.30% 6/1/20 | 2,645,000 | 2,645,153 | ||||||
2.45% 11/5/20 | 2,985,000 | 2,992,077 | ||||||
PNC Financial Services Group | 2,705,000 | 2,617,088 | ||||||
Limited-Term Diversified Income Series-8
Table of Contents
Delaware VIP® Limited-Term Diversified Income Series
Schedule of investments (continued)
| Principal amount° | Value (U.S. $) | |||||||
Corporate Bonds (continued) |
| |||||||
Banking (continued) |
| |||||||
Royal Bank of Scotland Group | ||||||||
3.875% 9/12/23 | 4,245,000 | $ | 4,082,209 | |||||
8.625% 12/29/49 • | 2,095,000 | 2,142,138 | ||||||
Santander UK Group Holdings | 5,445,000 | 5,406,836 | ||||||
Skandinaviska Enskilda Banken 144A | 7,410,000 | 7,436,431 | ||||||
State Street 2.55% 8/18/20 | 2,220,000 | 2,243,554 | ||||||
SunTrust Banks | ||||||||
2.50% 5/1/19 | 7,305,000 | 7,371,286 | ||||||
2.70% 1/27/22 | 1,325,000 | 1,327,123 | ||||||
SVB Financial Group 3.50% 1/29/25 | 2,430,000 | 2,345,451 | ||||||
Toronto-Dominion Bank 2.25% 11/5/19 . | 6,935,000 | 6,979,127 | ||||||
U.S. Bancorp 2.35% 1/29/21 | 3,365,000 | 3,374,627 | ||||||
U.S. Bank 1.40% 4/26/19 | 3,500,000 | 3,463,117 | ||||||
UBS Group Funding Jersey | ||||||||
144A 2.65% 2/1/22 # | 1,795,000 | 1,746,601 | ||||||
144A 3.00% 4/15/21 # | 5,915,000 | 5,924,020 | ||||||
USB Capital IX 3.50% 10/29/49 • | 2,220,000 | 1,825,950 | ||||||
Wells Fargo Bank 2.15% 12/6/19 | 3,855,000 | 3,854,237 | ||||||
Zions Bancorporation 4.50% 6/13/23 | 2,195,000 | 2,224,191 | ||||||
|
| |||||||
| 212,595,128 | ||||||||
|
| |||||||
Basic Industry – 1.30% | ||||||||
Air Liquide Finance 144A | 2,725,000 | 2,622,992 | ||||||
CF Industries 144A 3.40% 12/1/21 # | 2,845,000 | 2,818,251 | ||||||
Georgia-Pacific | ||||||||
144A 2.539% 11/15/19 # | 4,000,000 | 4,037,756 | ||||||
144A 5.40% 11/1/20 # | 2,365,000 | 2,602,292 | ||||||
INVISTA Finance 144A | 2,525,000 | 2,515,897 | ||||||
WestRock | ||||||||
3.50% 3/1/20 | 1,990,000 | 2,041,752 | ||||||
4.45% 3/1/19 | 1,510,000 | 1,576,455 | ||||||
|
| |||||||
| 18,215,395 | ||||||||
|
| |||||||
Brokerage – 0.23% | ||||||||
Jefferies Group 5.125% 1/20/23 | 3,115,000 | 3,264,202 | ||||||
|
| |||||||
| 3,264,202 | ||||||||
|
| |||||||
Capital Goods – 1.15% | ||||||||
Crane 2.75% 12/15/18 | 420,000 | 425,451 | ||||||
Fortive 144A 1.80% 6/15/19 # | 7,000,000 | 6,960,604 | ||||||
Fortune Brands Home & Security | 1,285,000 | 1,294,287 | ||||||
General Electric 1.261% 5/5/26 • | 305,000 | 295,479 | ||||||
Roper Technologies 2.80% 12/15/21 | 2,635,000 | 2,636,763 | ||||||
Waste Management 2.40% 5/15/23 | 4,705,000 | 4,568,856 | ||||||
|
| |||||||
| 16,181,440 | ||||||||
|
| |||||||
Communications – 3.52% |
| |||||||
21st Century Fox America | 2,945,000 | 3,151,580 | ||||||
| Principal amount° | Value (U.S. $) | |||||||
Corporate Bonds (continued) |
| |||||||
Communications (continued) |
| |||||||
American Tower | ||||||||
2.25% 1/15/22 | 4,600,000 | $ | 4,411,382 | |||||
2.80% 6/1/20 | 2,005,000 | 2,007,645 | ||||||
3.30% 2/15/21 | 945,000 | 956,660 | ||||||
AT&T | ||||||||
2.45% 6/30/20 | 2,890,000 | 2,872,247 | ||||||
2.80% 2/17/21 | 160,000 | 158,882 | ||||||
Charter Communications Operating | 4,830,000 | 5,099,171 | ||||||
Crown Castle International | 2,095,000 | 2,262,600 | ||||||
Crown Castle Towers | 3,785,000 | 3,795,257 | ||||||
Deutsche Telekom International Finance | ||||||||
144A 1.50% 9/19/19 # | 6,675,000 | 6,571,805 | ||||||
144A 1.95% 9/19/21 # | 1,390,000 | 1,340,870 | ||||||
144A 2.485% 9/19/23 # | 2,690,000 | 2,573,399 | ||||||
GTP Acquisition Partners I 144A | 1,080,000 | 1,052,503 | ||||||
SBA Tower Trust | ||||||||
144A 2.24% 4/16/18 # | 1,660,000 | 1,663,620 | ||||||
144A 2.898% 10/15/19 # | 1,520,000 | 1,531,536 | ||||||
Verizon Communications | ||||||||
1.75% 8/15/21 | 3,230,000 | 3,101,940 | ||||||
4.50% 9/15/20 | 3,640,000 | 3,898,538 | ||||||
5.15% 9/15/23 | 2,830,000 | 3,133,721 | ||||||
|
| |||||||
| 49,583,356 | ||||||||
|
| |||||||
Consumer Cyclical – 2.31% |
| |||||||
CVS Health | ||||||||
2.125% 6/1/21 | 2,550,000 | 2,502,996 | ||||||
3.875% 7/20/25 | 1,672,000 | 1,727,887 | ||||||
Daimler Finance North America 144A 2.20% 10/30/21 # | 2,800,000 | 2,738,058 | ||||||
Ford Motor Credit | ||||||||
3.096% 5/4/23 | 5,080,000 | 4,912,827 | ||||||
3.336% 3/18/21 | 720,000 | 725,703 | ||||||
General Motors Financial | ||||||||
2.35% 10/4/19 | 7,000,000 | 6,922,300 | ||||||
3.15% 1/15/20 | 2,455,000 | 2,472,121 | ||||||
Historic TW 6.875% 6/15/18 | 1,340,000 | 1,433,657 | ||||||
Hyundai Capital America | ||||||||
144A 2.125% 10/2/17 # | 260,000 | 260,538 | ||||||
144A 2.55% 2/6/19 # | 3,000,000 | 3,019,077 | ||||||
144A 3.00% 3/18/21 # | 150,000 | 149,987 | ||||||
Toyota Motor Credit 1.375% 1/10/18 | 200,000 | 199,777 | ||||||
Walgreens Boots Alliance 2.60% 6/1/21 . | 5,525,000 | 5,495,983 | ||||||
|
| |||||||
| 32,560,911 | ||||||||
|
| |||||||
Consumer Non-Cyclical – 4.05% |
| |||||||
Abbott Laboratories 2.90% 11/30/21 | 10,105,000 | 10,087,640 | ||||||
AbbVie 2.30% 5/14/21 | 8,495,000 | 8,331,845 | ||||||
Limited-Term Diversified Income Series-9
Table of Contents
Delaware VIP® Limited-Term Diversified Income Series
Schedule of investments (continued)
Principal amount° | Value (U.S. $) | |||||||
Corporate Bonds (continued) |
| |||||||
Consumer Non-Cyclical (continued) |
| |||||||
Anheuser-Busch InBev Finance |
| |||||||
1.90% 2/1/19 | 6,000,000 | $ | 6,011,652 | |||||
2.65% 2/1/21 | 3,455,000 | 3,478,121 | ||||||
Gilead Sciences 1.95% 3/1/22 | 5,480,000 | 5,305,999 | ||||||
Molson Coors Brewing 2.10% 7/15/21 | 3,845,000 | 3,748,702 | ||||||
Reynolds American 4.00% 6/12/22 | 2,765,000 | 2,895,505 | ||||||
Roche Holdings 144A 1.75% 1/28/22 # | 2,370,000 | 2,279,298 | ||||||
Shire Acquisitions Investments Ireland | 7,135,000 | 6,899,930 | ||||||
Sysco 2.50% 7/15/21 | 3,645,000 | 3,609,931 | ||||||
Teva Pharmaceutical Finance Netherlands III 2.80% 7/21/23 | 1,760,000 | 1,668,457 | ||||||
Thermo Fisher Scientific 3.00% 4/15/23 | 2,730,000 | 2,687,033 | ||||||
|
| |||||||
| 57,004,113 | ||||||||
|
| |||||||
Electric – 4.85% | ||||||||
Ameren 2.70% 11/15/20 | 7,615,000 | 7,662,716 | ||||||
Arizona Public Service 2.20% 1/15/20 | 8,255,000 | 8,268,200 | ||||||
CenterPoint Energy 5.95% 2/1/17 | 1,675,000 | 1,680,729 | ||||||
CMS Energy 6.25% 2/1/20 | 2,945,000 | 3,259,909 | ||||||
Dominion Resources 2.00% 8/15/21 | 5,710,000 | 5,543,468 | ||||||
DTE Energy | ||||||||
2.40% 12/1/19 | 3,350,000 | 3,368,810 | ||||||
3.30% 6/15/22 | 2,145,000 | 2,184,614 | ||||||
Duke Energy 1.80% 9/1/21 | 5,640,000 | 5,439,047 | ||||||
Entergy 4.00% 7/15/22 | 6,555,000 | 6,862,672 | ||||||
Exelon 2.85% 6/15/20 | 3,500,000 | 3,540,184 | ||||||
Exelon Generation 4.25% 6/15/22 | 1,675,000 | 1,735,739 | ||||||
Fortis 144A 2.10% 10/4/21 # | 6,715,000 | 6,497,414 | ||||||
IPALCO Enterprises 3.45% 7/15/20 | 4,765,000 | 4,872,213 | ||||||
Kansas City Power & Light 6.375% 3/1/18 | 3,715,000 | 3,904,138 | ||||||
LG&E & KU Energy 3.75% 11/15/20 | 470,000 | 489,242 | ||||||
NV Energy 6.25% 11/15/20 | 2,350,000 | 2,667,325 | ||||||
Pacific Gas & Electric 3.50% 10/1/20 | 250,000 | 259,597 | ||||||
|
| |||||||
| 68,236,017 | ||||||||
|
| |||||||
Energy – 2.06% | ||||||||
BP Capital Markets | ||||||||
3.216% 11/28/23 | 2,435,000 | 2,461,546 | ||||||
3.561% 11/1/21 | 1,050,000 | 1,096,792 | ||||||
3.723% 11/28/28 | 1,085,000 | 1,104,004 | ||||||
Chevron 2.10% 5/16/21 | 5,575,000 | 5,530,634 | ||||||
Regency Energy Partners | ||||||||
5.00% 10/1/22 | 2,130,000 | 2,259,870 | ||||||
Shell International Finance 1.75% 9/12/21 | 6,380,000 | 6,204,065 | ||||||
TransCanada PipeLines 1.625% 11/9/17 | 2,130,000 | 2,128,701 | ||||||
Williams Partners 7.25% 2/1/17 | 3,251,000 | 3,263,760 | ||||||
Woodside Finance 144A 8.75% 3/1/19 # | 4,420,000 | 4,990,295 | ||||||
|
| |||||||
| 29,039,667 | ||||||||
|
| |||||||
Principal amount° | Value (U.S. $) | |||||||
Corporate Bonds (continued) |
| |||||||
Finance Companies – 0.83% |
| |||||||
AerCap Ireland Capital 3.95% 2/1/22 | 7,660,000 | $ | 7,746,175 | |||||
Air Lease 3.00% 9/15/23 | 2,375,000 | 2,272,443 | ||||||
SMBC Aviation Capital Finance 144A 2.65% 7/15/21 # | 1,660,000 | 1,599,714 | ||||||
|
| |||||||
| 11,618,332 | ||||||||
|
| |||||||
Insurance – 1.08% | ||||||||
Aetna 2.40% 6/15/21 | 6,455,000 | 6,432,504 | ||||||
Berkshire Hathaway Finance 2.90% 10/15/20 | 1,530,000 | 1,567,797 | ||||||
Pricoa Global Funding I 144A 1.60% 5/29/18 # | 920,000 | 919,571 | ||||||
Principal Life Global Funding II 144A 1.50% 4/18/19 # | 3,500,000 | 3,457,171 | ||||||
TIAA Asset Management Finance | ||||||||
144A 2.95% 11/1/19 # | 1,910,000 | 1,944,281 | ||||||
144A 4.125% 11/1/24 # | 900,000 | 910,542 | ||||||
|
| |||||||
| 15,231,866 | ||||||||
|
| |||||||
Natural Gas – 0.49% |
| |||||||
Sempra Energy 1.625% 10/7/19 | 7,000,000 | 6,914,369 | ||||||
|
| |||||||
| 6,914,369 | ||||||||
|
| |||||||
Real Estate – 0.07% | ||||||||
Host Hotels & Resorts 3.75% 10/15/23 | 635,000 | 624,312 | ||||||
WEA Finance 144A 3.75% 9/17/24 # | 400,000 | 405,105 | ||||||
|
| |||||||
| 1,029,417 | ||||||||
|
| |||||||
Technology – 0.58% | ||||||||
Analog Devices 2.50% 12/5/21 | 2,305,000 | 2,286,475 | ||||||
Cisco Systems 1.85% 9/20/21 | 2,315,000 | 2,260,878 | ||||||
National Semiconductor 6.60% 6/15/17 | 925,000 | 948,049 | ||||||
NXP | ||||||||
144A 4.125% 6/1/21 # | 2,140,000 | 2,214,900 | ||||||
144A 4.625% 6/1/23 # | 385,000 | 405,213 | ||||||
|
| |||||||
| 8,115,515 | ||||||||
|
| |||||||
Transportation – 0.69% | ||||||||
Penske Truck Leasing | ||||||||
144A 3.30% 4/1/21 # | 1,130,000 | 1,143,802 | ||||||
144A 3.375% 2/1/22 # | 3,470,000 | 3,503,284 | ||||||
Ryder System 3.45% 11/15/21 | 4,240,000 | 4,348,697 | ||||||
United Airlines 2015-1 Class AA | ||||||||
Pass-Through Trust 3.45% 12/1/27 ¨ | 722,111 | 714,890 | ||||||
|
| |||||||
| 9,710,673 | ||||||||
|
| |||||||
Total Corporate Bonds | 539,300,401 | |||||||
|
| |||||||
Municipal Bonds – 1.05% | ||||||||
Commonwealth of Massachusetts 5.00% 10/1/25 | 1,500,000 | 1,818,720 | ||||||
County of Baltimore, Maryland 5.00% 2/1/26 | 3,320,000 | 4,067,664 | ||||||
Limited-Term Diversified Income Series-10
Table of Contents
Delaware VIP® Limited-Term Diversified Income Series
Schedule of investments (continued)
Principal amount° | Value (U.S. $) | |||||||
Municipal Bonds (continued) |
| |||||||
New York City, New York |
| |||||||
Series C 5.00% 8/1/26 | 840,000 | $ | 1,007,714 | |||||
Series C 5.00% 8/1/27 | 1,030,000 | 1,225,669 | ||||||
University of California | 6,670,000 | 6,666,131 | ||||||
|
| |||||||
Total Municipal Bonds | 14,785,898 | |||||||
|
| |||||||
Non-Agency Asset-Backed |
| |||||||
AEP Texas Central Transition Funding II | 528,989 | 538,381 | ||||||
Ally Master Owner Trust | ||||||||
Series 2012-5 A 1.54% 9/15/19 | 8,490,000 | 8,502,076 | ||||||
Series 2014-1 A1 1.174% 1/15/19 ● | 3,220,000 | 3,220,340 | ||||||
Series 2014-4 A2 1.43% 6/17/19 | 2,130,000 | 2,131,258 | ||||||
American Express Credit Account Master Trust | ||||||||
Series 2012-1 A 0.974% 1/15/20 ● | 8,200,000 | 8,204,654 | ||||||
Series 2013-2 A 1.124% 5/17/21 ● | 3,290,000 | 3,300,098 | ||||||
Series 2014-1 A 1.074% 12/15/21 ● | 10,735,000 | 10,754,545 | ||||||
ARI Fleet Lease Trust | 188,513 | 188,167 | ||||||
Avis Budget Rental Car Funding AESOP | 8,750,000 | 8,840,531 | ||||||
Bank of America Credit Card Trust | ||||||||
Series 2007-A4 A4 0.744% 11/15/19 ● | 8,614,000 | 8,608,949 | ||||||
Series 2014-A1 A 1.084% 6/15/21 ● | 1,550,000 | 1,553,897 | ||||||
Series 2014-A2 A 0.974% 9/16/19 ● | 15,072,000 | 15,074,959 | ||||||
Series 2014-A3 A 0.994% 1/15/20 ● | 2,560,000 | 2,561,777 | ||||||
Barclays Dryrock Issuance Trust | ||||||||
Series 2014-2 A 1.044% 3/16/20 ● | 1,090,000 | 1,090,189 | ||||||
BMW Floorplan Master Owner Trust | 1,800,000 | 1,800,016 | ||||||
BMW Vehicle Lease Trust 2016-2 | 1,080,000 | 1,080,443 | ||||||
Cabela’s Credit Card Master Note Trust | ||||||||
Series 2014-1 A 1.054% 3/16/20 ● | 320,000 | 320,029 | ||||||
Series 2014-2 A 1.154% 7/15/22 ● | 3,750,000 | 3,755,076 | ||||||
Series 2015-1A A1 2.26% 3/15/23 | 5,300,000 | 5,307,367 | ||||||
Capital One Multi-Asset Execution Trust | 4,085,000 | 4,085,000 | ||||||
Series 2007-A2 A2 0.784% 12/16/19 ● | 585,000 | 585,000 | ||||||
Series 2007-A5 A5 0.744% 7/15/20 ● | 6,850,000 | 6,842,762 | ||||||
Series 2014-A3 A3 1.084% 1/18/22 ● | 3,850,000 | 3,851,563 | ||||||
Series 2016-A1 A1 1.154% 2/15/22 ● | 10,997,000 | 11,041,672 | ||||||
Principal amount° | Value (U.S. $) | |||||||
Non-Agency Asset-Backed |
| |||||||
Capital One Multi-Asset Execution Trust | 7,500,000 | $ | 7,544,479 | |||||
Chase Issuance Trust | ||||||||
Series 2007-A5 A5 0.744% 3/15/19 ● | 100,000 | 99,982 | ||||||
Series 2007-A12 A12 0.754% 8/15/19 ● | 1,250,000 | 1,249,276 | ||||||
Series 2007-B1 B1 0.954% 4/15/19 ● | 6,100,000 | 6,098,332 | ||||||
Series 2007-C1 C1 1.164% 4/15/19 ● . | 2,490,000 | 2,489,794 | ||||||
Series 2012-A10 A10 0.964% 12/16/19 ● | 16,750,000 | 16,768,326 | ||||||
Series 2013-A3 A3 0.984% 4/15/20 ● | 6,110,000 | 6,119,709 | ||||||
Series 2013-A6 A6 1.124% 7/15/20 ● | 983,000 | 986,311 | ||||||
Series 2013-A7 A 1.134% 9/15/20 ● | 2,800,000 | 2,808,272 | ||||||
Series 2013-A9 A 1.124% 11/16/20 ● | 10,225,000 | 10,255,541 | ||||||
Series 2014-A5 A5 1.074% 4/15/21 ● | 8,890,000 | 8,903,510 | ||||||
Series 2014-A7 A7 1.38% 11/15/19 | 5,500,000 | 5,504,778 | ||||||
Series 2015-A6 A6 0.954% 5/15/19 ● | 15,266,000 | 15,271,459 | ||||||
Series 2016-A1 A 1.114% 5/17/21 ● | 2,290,000 | 2,297,155 | ||||||
Series 2016-A3 A3 1.254% 6/15/23 ● | 7,600,000 | 7,623,175 | ||||||
Chesapeake Funding | 3,156,343 | 3,145,498 | ||||||
Citibank Credit Card Issuance Trust | ||||||||
Series 2008-A7 A7 2.114% 5/20/20 ● | 694,000 | 705,088 | ||||||
Series 2013-A2 A2 1.036% 5/26/20 ● | 5,647,000 | 5,652,614 | ||||||
Series 2013-A4 A4 1.176% 7/24/20 ● | 18,985,000 | 19,045,416 | ||||||
Series 2013-A7 A7 1.094% 9/10/20 ● | 6,632,000 | 6,655,825 | ||||||
Series 2016-A3 A3 1.266% 12/7/23 ● | 3,000,000 | 3,001,406 | ||||||
CNH Equipment Trust | 265,000 | 265,341 | ||||||
Discover Card Execution Note Trust | 2,550,000 | 2,552,531 | ||||||
Series 2013-A1 A1 1.004% 8/17/20 ● | 9,795,000 | 9,803,020 | ||||||
Series 2013-A6 A6 0.988% 4/15/21 ● | 9,350,000 | 9,387,824 | ||||||
Series 2014-A1 A1 1.134% 7/15/21 ● | 12,984,000 | 13,032,433 | ||||||
Series 2015-A1 A1 1.054% 8/17/20 ● | 11,275,000 | 11,291,979 | ||||||
Series 2016-A4 A4 1.39% 3/15/22 | 1,585,000 | 1,566,908 | ||||||
Enterprise Fleet Financing | 133,460 | 133,362 | ||||||
Ford Credit Auto Lease Trust | 963,826 | 963,939 | ||||||
Ford Credit Auto Owner Trust | ||||||||
Series 2016-B A2B 1.014% 3/15/19 ● | 1,092,389 | 1,092,985 | ||||||
Series 2016-C A2B 0.844% 9/15/19 ● | 1,500,000 | 1,500,039 | ||||||
Ford Credit Floorplan Master Owner Trust A | ||||||||
Series 2014-1 A1 1.20% 2/15/19 | 7,068,000 | 7,068,334 | ||||||
Series 2014-1 A2 1.104% 2/15/19 ● | 7,165,000 | 7,166,225 | ||||||
Limited-Term Diversified Income Series-11
Table of Contents
Delaware VIP® Limited-Term Diversified Income Series
Schedule of investments (continued)
Principal amount° | Value (U.S. $) | |||||||
Non-Agency Asset-Backed |
| |||||||
Ford Credit Floorplan Master Owner Trust A | ||||||||
Series 2014-4 A2 1.054% 8/15/19 ● | 2,640,000 | $ | 2,642,844 | |||||
Series 2015-1 A2 1.104% 1/15/20 ● | 15,082,000 | 15,098,221 | ||||||
Series 2015-2 A2 1.274% 1/15/22 ● | 19,155,000 | 19,163,315 | ||||||
Series 2015-4 A2 1.304% 8/15/20 ● | 4,000,000 | 4,017,163 | ||||||
Golden Credit Card Trust | ||||||||
Series 2014-1A A 144A 1.203% 3/15/19 #● | 570,000 | 569,815 | ||||||
Series 2014-2A A 144A 1.154% 3/15/21 #● | 8,195,000 | 8,204,346 | ||||||
Series 2015-1A A 144A 1.144% 2/15/20 #● | 10,175,000 | 10,182,191 | ||||||
GreatAmerica Leasing Receivables | 258,290 | 258,223 | ||||||
Hertz Fleet Lease Funding | 1,459,990 | 1,459,311 | ||||||
HOA Funding | 348,575 | 308,582 | ||||||
Honda Auto Receivables Owner Trust Series 2015-3 A3 1.27% 4/18/19 | 3,000,000 | 2,999,030 | ||||||
Hyundai Auto Lease Securitization Trust | ||||||||
Series 2015-A A3 144A 1.42% 9/17/18 # | 4,955,892 | 4,962,693 | ||||||
Series 2016-A A2B 144A 1.254% 7/16/18 #● | 6,586,422 | 6,592,537 | ||||||
Hyundai Auto Receivables Trust | ||||||||
Series 2015-C A2B 1.074% 11/15/18 ● | 793,733 | 793,936 | ||||||
Series 2016-A A2B 1.074% 6/17/19 ● | 3,515,019 | 3,519,479 | ||||||
Mercedes-Benz Auto Lease Trust | 707,357 | 708,200 | ||||||
Mercedes-Benz Master Owner Trust | ||||||||
Series 2015-AA A 144A 1.024% 4/15/19 #● | 1,500,000 | 1,500,000 | ||||||
Series 2015-BA A 144A 1.084% 4/15/20 #● | 16,600,000 | 16,600,169 | ||||||
Navistar Financial Dealer Note Master Owner Trust II | 715,000 | 716,917 | ||||||
NextGear Floorplan Master Owner Trust | 1,420,000 | 1,419,998 | ||||||
Nissan Auto Lease Trust | 503,335 | 503,820 | ||||||
Principal amount° | Value (U.S. $) | |||||||
Non-Agency Asset-Backed |
| |||||||
Nissan Auto Lease Trust |
| |||||||
Series 2016-A A2B 1.084% 8/15/18 ● . | 1,381,468 | $ | 1,383,098 | |||||
Series 2016-B A2B 0.984% 12/17/18 ● | 3,045,000 | 3,046,753 | ||||||
Nissan Auto Receivables Owner Trust | ||||||||
Series 2015-C A2B 1.054% 11/15/18 ● | 280,472 | 280,753 | ||||||
Series 2016-A A2B 1.054% 2/15/19 ● | 2,789,489 | 2,792,323 | ||||||
Series 2016-B A2B 1.004% 4/15/19 ● | 2,675,000 | 2,676,605 | ||||||
Nissan Master Owner Trust Receivables | 2,855,000 | 2,859,578 | ||||||
Penarth Master Issuer | ||||||||
Series 2015-1A A1 144A 1.136% 3/18/19 #● | 545,000 | 544,877 | ||||||
Series 2015-2A A1 144A 1.136% 5/18/19 #● | 4,200,000 | 4,200,029 | ||||||
PFS Financing | ||||||||
Series 2014-AA A 144A 1.304% 2/15/19 #● | 6,000,000 | 5,996,501 | ||||||
Series 2015-AA A 144A 1.324% 4/15/20 #● | 1,000,000 | 997,946 | ||||||
Popular ABS Mortgage Pass Through Trust | 1,448,398 | 1,403,978 | ||||||
Porsche Innovative Lease Owner Trust | 1,027,873 | 1,028,004 | ||||||
Synchrony Credit Card Master Note Trust | ||||||||
Series 2012-6 A 1.36% 8/17/20 | 1,180,000 | 1,180,658 | ||||||
Series 2015-2 A 1.60% 4/15/21 | 1,120,000 | 1,120,945 | ||||||
Toyota Auto Receivables Trust | 1,000,000 | 1,000,639 | ||||||
Volkswagen Credit Auto Master Trust | 3,130,000 | 3,127,842 | ||||||
Volvo Financial Equipment | 885,197 | 884,623 | ||||||
Wells Fargo Dealer Floorplan Master Note Trust | ||||||||
Series 2012-2 A 1.489% 4/22/19 ● | 16,930,000 | 16,949,434 | ||||||
Series 2014-1 A 1.119% 7/20/19 ● | 6,398,000 | 6,398,675 | ||||||
Series 2015-1 A 1.239% 1/20/20 ● | 7,290,000 | 7,300,770 | ||||||
Wheels | ||||||||
Series 2014-1A A2 144A 0.84% 3/20/23 # | 393,293 | 393,049 | ||||||
Limited-Term Diversified Income Series-12
Table of Contents
Delaware VIP® Limited-Term Diversified Income Series
Schedule of investments (continued)
Principal amount° | Value (U.S. $) | |||||||
Non-Agency Asset-Backed Securities (continued) |
| |||||||
World Financial Network Credit Card Master Trust | 965,000 | $ | 966,862 | |||||
|
| |||||||
Total Non-Agency Asset-Backed Securities | 480,044,347 | |||||||
|
| |||||||
Non-Agency Collateralized Mortgage Obligations – 0.22% |
| |||||||
American Home Mortgage Investment Trust | 10,701 | 10,586 | ||||||
Bank of America Alternative Loan Trust | 11,297 | 10,877 | ||||||
JPMorgan Mortgage Trust | 650,000 | 640,155 | ||||||
Sequoia Mortgage Trust | 602,136 | 600,866 | ||||||
Towd Point Mortgage Trust | ||||||||
Series 2015-5 A1B 144A 2.75% 5/25/55 #• | 915,930 | 918,151 | ||||||
Series 2015-6 A1B 144A 2.75% 4/25/55 #• | 945,877 | 946,455 | ||||||
|
| |||||||
Total Non-Agency Collateralized Mortgage Obligations |
| 3,127,090 | ||||||
|
| |||||||
Non-Agency Commercial Mortgage-Backed Securities – 0.38% |
| |||||||
Banc of America Commercial Mortgage Trust | 205,000 | 208,774 | ||||||
Bear Stearns Commercial Mortgage Securities Trust | 1,619,999 | 1,635,593 | ||||||
Citigroup Commercial Mortgage Trust | 760,000 | 770,902 | ||||||
Commercial Mortgage Trust | 500,806 | 500,627 | ||||||
DB-UBS Mortgage Trust | 1,015,000 | 1,101,190 | ||||||
Principal amount° | Value (U.S. $) | |||||||
Non-Agency Commercial Mortgage-Backed Securities (continued) |
| |||||||
LB-UBS Commercial Mortgage Trust Series 2006-C6 AJ 5.452% 9/15/39 • | 1,311,265 | $ | 1,176,598 | |||||
|
| |||||||
Total Non-Agency Commercial Mortgage-Backed Securities (cost $5,806,235) |
| 5,393,684 | ||||||
|
| |||||||
U.S. Treasury Obligations – 8.51% |
| |||||||
U.S. Treasury Floating Rate Note | ||||||||
0.701% 10/31/18 • | 8,450,000 | 8,453,067 | ||||||
0.705% 7/31/18 • | 84,220,000 | 84,313,568 | ||||||
U.S. Treasury Notes | ||||||||
1.25% 10/31/21 | 2,500,000 | 2,424,513 | ||||||
1.50% 8/15/26 | 26,685,000 | 24,543,956 | ||||||
|
| |||||||
Total U.S. Treasury Obligations |
| 119,735,104 | ||||||
|
| |||||||
Number of shares | ||||||||
Preferred Stock – 1.07% |
| |||||||
General Electric 5.00% • | 5,497,000 | 5,711,108 | ||||||
Morgan Stanley 5.55% • | 2,500,000 | 2,531,250 | ||||||
PNC Preferred Funding Trust II 144A 2.186% #• | 6,900,000 | 6,675,750 | ||||||
USB Realty 144A 2.027% #• | 200,000 | 176,500 | ||||||
|
| |||||||
Total Preferred Stock |
| 15,094,608 | ||||||
|
| |||||||
| Principal amount° | ||||||||
Short-Term Investments – 1.14% |
| |||||||
Discount Note – 0.36% ≠ | ||||||||
Federal Home Loan Bank 0.47% 1/25/17 | 5,085,860 | 5,084,711 | ||||||
|
| |||||||
| 5,084,711 | ||||||||
|
| |||||||
Repurchase Agreements – 0.78% |
| |||||||
Bank of America Merrill Lynch 0.41%, dated 12/30/16, to be repurchased on 1/3/17, repurchase price $3,689,351 (collateralized by U.S. government obligations 2.00% 8/15/25; market value $3,762,966) | 3,689,183 | 3,689,183 | ||||||
Limited-Term Diversified Income Series-13
Table of Contents
Delaware VIP® Limited-Term Diversified Income Series
Schedule of investments (continued)
Principal amount° | Value (U.S. $) | |||||||
Short-Term Investments (continued) | ||||||||
Repurchase Agreements (continued) | ||||||||
Bank of Montreal | 4,304,046 | $ | 4,304,046 | |||||
Principal amount° | Value (U.S. $) | |||||||
Short-Term Investments (continued) | ||||||||
Repurchase Agreements (continued) | ||||||||
BNP Paribas | 2,946,771 | $ | 2,946,771 | |||||
|
| |||||||
| 10,940,000 | ||||||||
|
| |||||||
Total Short-Term Investments | ||||||||
(cost $16,024,199) | 16,024,711 | |||||||
|
| |||||||
Total Value of Securities – 99.75% | $ | 1,403,882,463 | ||
|
|
| # | Security exempt from registration under Rule 144A of the Securities Act of 1933, as amended. At Dec. 31, 2016, the aggregate value of Rule 144A securities was $198,960,552, which represents 14.14% of the Series’ net assets. See Note 11 in “Notes to financial statements.” |
| ◆ | Pass Through Agreement. Security represents the contractual right to receive a proportionate amount of underlying payments due to the counterparty pursuant to various agreements related to the rescheduling of obligations and the exchange of certain notes. |
| ≠ | The rate shown is the effective yield at the time of purchase. |
| ° | Principal amount shown is stated in U.S. dollars unless noted that the security is denominated in another currency. |
| ● | Variable rate security. Each rate shown is as of Dec. 31, 2016. Interest rates reset periodically. |
| f | Step coupon bond. Coupon increases or decreases periodically based on a predetermined schedule. Stated rate in effect at Dec. 31, 2016. |
Summary of abbreviations:
ARM – Adjustable Rate Mortgage
DB – Deutsche Bank
GNMA – Government National Mortgage Association
LB – Lehman Brothers
NCUA – National Credit Union Administration
REMIC – Real Estate Mortgage Investment Conduit
S.F. – Single Family
UBS – Union Bank of Switzerland
yr – Year
See accompanying notes, which are an integral part of the financial statements
| Limited-Term Diversified Income Series-14 |
Table of Contents
Delaware VIP® Trust—Delaware VIP Limited-Term Diversified Income Series
Assets: | ||||
Investments, at value1 | $ | 1,387,857,752 | ||
Short-term investments, at value2 | 16,024,711 | |||
Interest receivable | 5,425,124 | |||
Receivable for series shares sold | 49,170 | |||
Receivable for securities sold | 28,017 | |||
|
| |||
Total assets | 1,409,384,774 | |||
|
| |||
Liabilities: | ||||
Cash due to custodian | 27,706 | |||
Investment management fees payable to affiliates | 568,206 | |||
Income distribution payable | 534,772 | |||
Payable for series shares redeemed | 360,473 | |||
Distribution fees payable to affiliates | 281,044 | |||
Dividend disbursing and transfer agent fees and expenses payable to affiliates | 8,941 | |||
Accounting and administration expenses payable to affiliates | 5,607 | |||
Trustees’ fees and expenses payable | 3,503 | |||
Legal fees payable to affiliates | 2,563 | |||
Reports and statements to shareholders expenses payable to affiliates | 1,242 | |||
Other accrued expenses | 200,125 | |||
|
| |||
Total liabilities | 1,994,182 | |||
|
| |||
Total Net Assets | $ | 1,407,390,592 | ||
|
| |||
Net Assets Consist of: | ||||
Paid-in capital | $ | 1,427,264,902 | ||
Undistributed net investment income | 518,039 | |||
Accumulated net realized loss on investments | (15,840,127 | ) | ||
Net unrealized depreciation of investments | (4,552,222 | ) | ||
|
| |||
Total Net Assets | $ | 1,407,390,592 | ||
|
| |||
Net Asset Value | ||||
Standard Class: | ||||
Net assets | $ | 81,412,214 | ||
Shares of beneficial interest outstanding, unlimited authorization, no par | 8,292,334 | |||
Net asset value per share | $ | 9.82 | ||
Service Class: | ||||
Net assets | $ | 1,325,978,378 | ||
Shares of beneficial interest outstanding, unlimited authorization, no par | 135,967,623 | |||
Net asset value per share | $ | 9.75 | ||
1 Investments, at cost | $ | 1,392,410,486 | ||
2 Short-term investments, at cost | 16,024,199 | |||
See accompanying notes, which are an integral part of the financial statements.
| Limited-Term Diversified Income Series-15 |
Table of Contents
Delaware VIP® Trust—
Delaware VIP Limited-Term Diversified
Income Series
Year ended December 31, 2016
Delaware VIP Trust—
Delaware VIP Limited-Term Diversified Income Series
Investment Income: | ||||
Interest | $ | 24,288,270 | ||
Expenses: | ||||
Management fees | 6,799,830 | |||
Distribution expenses – Service Class | 4,069,799 | |||
Accounting and administration expenses | 457,955 | |||
Reports and statements to shareholders expenses | 152,052 | |||
Dividend disbursing and transfer agent fees and expenses | 121,525 | |||
Legal fees | 93,725 | |||
Trustees’ fees and expenses | 70,787 | |||
Custodian fees | 67,807 | |||
Audit and tax fees | 49,490 | |||
Registration fees | 634 | |||
Other | 61,460 | |||
|
| |||
| 11,945,064 | ||||
Less waived distribution expenses – Service Class | (678,300 | ) | ||
Less expense paid indirectly | (1 | ) | ||
|
| |||
Total operating expenses | 11,266,763 | |||
|
| |||
Net Investment Income | 13,021,507 | |||
|
| |||
Net Realized and Unrealized Gain (Loss) | ||||
Net realized gain on: | ||||
Investments | 13,849,688 | |||
Futures contracts | 1,375,368 | |||
|
| |||
Net realized gain | 15,225,056 | |||
|
| |||
Net change in unrealized appreciation (depreciation) of: | ||||
Investments | (2,565,150 | ) | ||
Futures contracts | 45,311 | |||
|
| |||
Net change in unrealized appreciation (depreciation) | (2,519,839 | ) | ||
|
| |||
Net Realized and Unrealized Gain | 12,705,217 | |||
|
| |||
Net Increase in Net Assets Resulting from Operations | $ | 25,726,724 | ||
|
| |||
| Year ended | ||||||||
| 12/31/16 | 12/31/15 | |||||||
Increase (Decrease) in Net Assets from Operations: | ||||||||
Net investment income | $ | 13,021,507 | $ | 16,337,709 | ||||
Net realized gain | 15,225,056 | 3,334,265 | ||||||
Net change in unrealized appreciation (depreciation) | (2,519,839 | ) | (11,432,409 | ) | ||||
|
|
|
| |||||
Net increase in net assets resulting from operations | 25,726,724 | 8,239,565 | ||||||
|
|
|
| |||||
Dividends and Distributions to Shareholders from: | ||||||||
Net investment income: | ||||||||
Standard Class | (1,186,027 | ) | (1,038,467 | ) | ||||
Service Class | (19,144,703 | ) | (20,222,493 | ) | ||||
|
|
|
| |||||
| (20,330,730 | ) | (21,260,960 | ) | |||||
|
|
|
| |||||
Capital Share Transactions: | ||||||||
Proceeds from shares sold: | ||||||||
Standard Class | 28,294,891 | 14,159,254 | ||||||
Service Class | 62,673,915 | 73,226,858 | ||||||
Net asset value of shares based upon reinvestment of dividends and distributions: | ||||||||
Standard Class | 1,173,457 | 1,039,647 | ||||||
Service Class | 19,063,018 | 20,286,055 | ||||||
|
|
|
| |||||
| 111,205,281 | 108,711,814 | |||||||
|
|
|
| |||||
Cost of shares redeemed: | ||||||||
Standard Class | (10,784,777 | ) | (11,356,366 | ) | ||||
Service Class | (131,971,405 | ) | (115,692,591 | ) | ||||
|
|
|
| |||||
| (142,756,182 | ) | (127,048,957 | ) | |||||
|
|
|
| |||||
Decrease in net assets derived from capital share transactions | (31,550,901 | ) | (18,337,143 | ) | ||||
|
|
|
| |||||
Net Decrease in Net Assets | (26,154,907 | ) | (31,358,538 | ) | ||||
Net Assets: | ||||||||
Beginning of year | 1,433,545,499 | 1,464,904,037 | ||||||
|
|
|
| |||||
End of year | $ | 1,407,390,592 | $ | 1,433,545,499 | ||||
|
|
|
| |||||
Undistributed net investment income | $ | 518,039 | $ | 495,447 | ||||
|
|
|
| |||||
See accompanying notes, which are an integral part of the financial statements.
Limited-Term Diversified Income Series-16
Table of Contents
Delaware VIP® Trust — Delaware VIP Limited-Term Diversified Income Series
Selected data for each share of the Series outstanding throughout each period were as follows:
| Delaware VIP Limited-Term Diversified Income Series Standard Class | ||||||||||||||||||||||||||||||
| Year ended | ||||||||||||||||||||||||||||||
| 12/31/16 | 12/31/15 | 12/31/14 | 12/31/13 | 12/31/12 | ||||||||||||||||||||||||||
Net asset value, beginning of period | $ | 9.780 | $ | 9.870 | $ | 9.860 | $ | 10.120 | $ | 10.090 | ||||||||||||||||||||
Income (loss) from investment operations: | ||||||||||||||||||||||||||||||
Net investment income1 | 0.114 | 0.134 | 0.120 | 0.092 | 0.095 | |||||||||||||||||||||||||
Net realized and unrealized gain (loss) | 0.090 | (0.057 | ) | 0.046 | (0.199 | ) | 0.183 | |||||||||||||||||||||||
|
|
|
|
|
|
|
|
|
| |||||||||||||||||||||
Total from investment operations | 0.204 | 0.077 | 0.166 | (0.107 | ) | 0.278 | ||||||||||||||||||||||||
|
|
|
|
|
|
|
|
|
| |||||||||||||||||||||
Less dividends and distributions from: | ||||||||||||||||||||||||||||||
Net investment income | (0.164 | ) | (0.167 | ) | (0.156 | ) | (0.142 | ) | (0.171 | ) | ||||||||||||||||||||
Net realized gain | — | — | — | (0.007 | ) | (0.077 | ) | |||||||||||||||||||||||
Return of capital | — | — | — | (0.004 | ) | — | ||||||||||||||||||||||||
|
|
|
|
|
|
|
|
|
| |||||||||||||||||||||
Total dividends and distributions | (0.164 | ) | (0.167 | ) | (0.156 | ) | (0.153 | ) | (0.248 | ) | ||||||||||||||||||||
|
|
|
|
|
|
|
|
|
| |||||||||||||||||||||
Net asset value, end of period | $ | 9.820 | $ | 9.780 | $ | 9.870 | $ | 9.860 | $ | 10.120 | ||||||||||||||||||||
|
|
|
|
|
|
|
|
|
| |||||||||||||||||||||
Total return2 | 2.09% | 0.78% | 1.69% | (1.06% | ) | 2.78% | ||||||||||||||||||||||||
Ratios and supplemental data: | ||||||||||||||||||||||||||||||
Net assets, end of period (000 omitted) | $ | 81,412 | $ | 62,646 | $ | 59,362 | $ | 50,161 | $ | 51,194 | ||||||||||||||||||||
Ratio of expenses to average net assets | 0.55% | 0.56% | 0.56% | 0.56% | 0.57% | |||||||||||||||||||||||||
Ratio of net investment income to average net assets | 1.15% | 1.36% | 1.22% | 0.92% | 0.93% | |||||||||||||||||||||||||
Portfolio turnover | 143% | 128% | 113% | 236% | 284% | |||||||||||||||||||||||||
| 1 | The average shares outstanding method has been applied for per share information. |
| 2 | Total investment return is based on the change in net asset value of a share during the period and assumes reinvestment of dividends and distributions at net asset value. Total investment return does not include fees, charges, or expenses imposed by the variable annuity and life insurance contracts for which Delaware VIP Trust serves as an underlying investment vehicle. |
See accompanying notes, which are an integral part of the financial statements.
| Limited-Term Diversified Income Series-17 |
Table of Contents
Delaware VIP® Limited-Term Diversified Income Series
Financial highlights (continued)
Selected data for each share of the Series outstanding throughout each period were as follows:
| Delaware VIP Limited-Term Diversified Income Series Service Class | ||||||||||||||||||||||||||||||
| Year ended | ||||||||||||||||||||||||||||||
| 12/31/16 | 12/31/15 | 12/31/14 | 12/31/13 | 12/31/12 | ||||||||||||||||||||||||||
Net asset value, beginning of period | $ | 9.720 | $ | 9.800 | $ | 9.790 | $ | 10.050 | $ | 10.020 | ||||||||||||||||||||
Income (loss) from investment operations: | ||||||||||||||||||||||||||||||
Net investment income1 | 0.088 | 0.109 | 0.095 | 0.066 | 0.069 | |||||||||||||||||||||||||
Net realized and unrealized gain (loss) | 0.081 | (0.048 | ) | 0.046 | (0.199 | ) | 0.182 | |||||||||||||||||||||||
|
|
|
|
|
|
|
|
|
|
|
| |||||||||||||||||||
Total from investment operations | 0.169 | 0.061 | 0.141 | (0.133 | ) | 0.251 | ||||||||||||||||||||||||
|
|
|
|
|
|
|
|
|
|
|
| |||||||||||||||||||
Less dividends and distributions from: | ||||||||||||||||||||||||||||||
Net investment income | (0.139 | ) | (0.141 | ) | (0.131 | ) | (0.116 | ) | (0.144 | ) | ||||||||||||||||||||
Net realized gain | — | — | — | (0.007 | ) | (0.077 | ) | |||||||||||||||||||||||
Return of capital | — | — | — | (0.004 | ) | — | ||||||||||||||||||||||||
|
|
|
|
|
|
|
|
|
|
|
| |||||||||||||||||||
Total dividends and distributions | (0.139 | ) | (0.141 | ) | (0.131 | ) | (0.127 | ) | (0.221 | ) | ||||||||||||||||||||
|
|
|
|
|
|
|
|
|
|
|
| |||||||||||||||||||
Net asset value, end of period | $ | 9.750 | $ | 9.720 | $ | 9.800 | $ | 9.790 | $ | 10.050 | ||||||||||||||||||||
|
|
|
|
|
|
|
|
|
|
|
| |||||||||||||||||||
Total return2 | 1.73% | 0.62% | 1.44% | (1.33% | ) | 2.53% | ||||||||||||||||||||||||
Ratios and supplemental data: | ||||||||||||||||||||||||||||||
Net assets, end of period (000 omitted) | $ | 1,325,979 | $ | 1,370,899 | $ | 1,405,542 | $ | 1,331,406 | $ | 1,127,086 | ||||||||||||||||||||
Ratio of expenses to average net assets | 0.80% | 0.81% | 0.81% | 0.81% | 0.82% | |||||||||||||||||||||||||
Ratio of expenses to average net assets prior to fees waived | 0.85% | 0.86% | 0.86% | 0.86% | 0.87% | |||||||||||||||||||||||||
Ratio of net investment income to average net assets | 0.90% | 1.11% | 0.97% | 0.67% | 0.68% | |||||||||||||||||||||||||
Ratio of net investment income to average net assets prior to fees waived | 0.85% | 1.06% | 0.92% | 0.62% | 0.63% | |||||||||||||||||||||||||
Portfolio turnover | 143% | 128% | 113% | 236% | 284% | |||||||||||||||||||||||||
| 1 | The average shares outstanding method has been applied for per share information. |
| 2 | Total investment return is based on the change in net asset value of a share during the period and assumes reinvestment of dividends and distributions at net asset value. Total investment return during all of the periods shown reflects a waiver by the distributor. Performance would have been lower had the waiver not been in effect. Total investment return does not include fees, charges, or expenses imposed by the variable annuity and life insurance contracts for which Delaware VIP Trust serves as an underlying investment vehicle. |
See accompanying notes, which are an integral part of the financial statements.
| Limited-Term Diversified Income Series-18 |
Table of Contents
Delaware VIP® Trust — Delaware VIP Limited-Term Diversified Income Series
December 31, 2016
Delaware VIP Trust (Trust) is organized as a Delaware statutory trust and offers 10 series: Delaware VIP Diversified Income Series, Delaware VIP Emerging Markets Series, Delaware VIP High Yield Series, Delaware VIP International Value Equity Series, Delaware VIP Limited-Term Diversified Income Series, Delaware VIP REIT Series, Delaware VIP Small Cap Value Series, Delaware VIP Smid Cap Growth Series, Delaware VIP U.S. Growth Series, and Delaware VIP Value Series. These financial statements and the related notes pertain to Delaware VIP Limited-Term Diversified Income Series (Series). The Trust is an open-end investment company. The Series is considered diversified under the Investment Company Act of 1940, as amended, and offers Standard Class and Service Class shares. The Standard Class shares do not carry a 12b-1 fee and the Service Class shares carry a 12b-1 fee. The shares of the Series are sold only to separate accounts of life insurance companies.
The investment objective of the Series is to seek maximum total return, consistent with reasonable risk.
1. Significant Accounting Policies
The following accounting policies are in accordance with U.S. generally accepted accounting principles (U.S. GAAP) and are consistently followed by the Series.
Security Valuation—Debt securities are valued based upon valuations provided by an independent pricing service or broker and reviewed by management. To the extent current market prices are not available, the pricing service may take into account developments related to the specific security, as well as transactions in comparable securities. U.S. government and agency securities are valued at the mean between the bid and ask prices, which approximates fair value. Valuations for fixed income securities utilize matrix systems, which reflect such factors as security prices, yields, maturities, and ratings, and are supplemented by dealer and exchange quotations. For asset- backed securities,
collateralized mortgage obligations, commercial mortgage securities, and U.S. government agency mortgage securities, pricing vendors utilize matrix pricing which considers prepayment speed, attributes of the collateral, yield or price of bonds of comparable quality, coupon, maturity, and type as well as broker/dealer-supplied prices. Equity securities, except those traded on the Nasdaq Stock Market LLC (Nasdaq), are valued at the last quoted sales price as of the time of the regular close of the New York Stock Exchange on the valuation date. Equity securities traded on the Nasdaq are valued in accordance with the Nasdaq Official Closing Price, which may not be the last sales price. If, on a particular day, an equity security does not trade, the mean between the bid and ask prices will be used, which approximates fair value. Futures contracts are valued at the daily quoted settlement prices. Generally, other securities and assets for which market quotations are not readily available are valued at fair value as determined in good faith under the direction of the Trust’s Board of Trustees (Board). In determining whether market quotations are readily available or fair valuation will be used, various factors will be taken into consideration, such as market closures or suspension of a trading in a security.
Federal and Foreign Income Taxes—No provision for federal income taxes has been made as the Series intends to continue to qualify for federal income tax purposes as a regulated investment company under Subchapter M of the Internal Revenue Code of 1986, as amended, and make the requisite distributions to shareholders. The Series evaluates tax positions taken or expected to be taken in the course of preparing the Series’ tax returns to determine whether the tax positions are “more-likely-than-not” of being sustained by the applicable tax authority. Tax positions not deemed to meet the “more-likely-than-not” threshold are recorded as a tax benefit or expense in the current year. Management has analyzed the Series’ tax positions taken for all open federal income tax years (Dec. 31, 2013–Dec. 31, 2016), and has concluded that no provision for federal income tax is required in the Series’ financial statements. In regard to foreign taxes only, the Series has open tax years in certain foreign countries in which it invests that may date back to the inception of the Series.
Class Accounting—Investment income and common expenses are allocated to the classes of the Series on the basis of “settled shares” of each class in relation to the net assets of the Series. Realized and unrealized gain (loss) on investments is allocated to the classes of the Series on the basis of daily net assets of each class. Distribution expenses relating to a specific class are charged directly to that class.
Repurchase Agreements—The Series may purchase certain U.S. government securities subject to the counterparty’s agreement to repurchase them at an agreed upon date and price. The counterparty will be required on a daily basis to maintain the value of the collateral subject to the agreement at not less than the repurchase price (including accrued interest). The agreements are conditioned upon the collateral being deposited under the Federal Reserve book-entry system with the Series’ custodian or a third-party sub-custodian. In the event of default or bankruptcy by the other party to the agreement, retention of the collateral may be subject to legal proceedings. All open repurchase agreements as of the date of this report were entered into on Dec. 30, 2016, and matured on the next business day.
To Be Announced Trades (TBA)—The Series may contract to purchase or sell securities for a fixed price at a transaction date beyond the customary settlement period (examples: when issued, delayed delivery, forward commitment, or TBA transactions) consistent with the Series’ ability to manage its investment portfolio and meet redemption requests. These transactions involve a commitment by the Series to purchase or sell securities for a predetermined price or yield with payment and delivery taking place more than three days in the future, or after a period longer than the customary settlement period for that type of security. No interest will be earned by the Series on such purchases until the securities are delivered or the transaction is completed; however, the market value may change prior to delivery.
Use of Estimates—The Series is an investment company, whose financial statements are prepared in conformity with U.S. GAAP. Therefore, the Series follows the accounting and reporting guidelines for investment companies. The preparation of financial statements in conformity with U.S. GAAP requires management to make estimates and assumptions that affect the fair value of investments, the reported amounts of assets and liabilities and disclosure of contingent assets and liabilities at the date of the financial statements, and the reported amounts of revenues and expenses during the reporting period. Actual results could differ from those estimates and the differences could be material.
Limited-Term Diversified Income Series-19
Table of Contents
Delaware VIP® Limited-Term Diversified Income Series
Notes to financial statements (continued)
1. Significant Accounting Policies (continued)
Other—Expenses directly attributable to the Series are charged directly to the Series. Other expenses common to various funds within the Delaware Investments® Family of Funds are generally allocated among such funds on the basis of average net assets. Management fees and certain other expenses are paid monthly. Security transactions are recorded on the date the securities are purchased or sold (trade date) for financial reporting purposes. Costs used in calculating realized gains and losses on the sale of investment securities are those of the specific securities sold. Interest income is recorded on the accrual basis. Discounts and premiums on debt securities are accreted or amortized to interest income, respectively, over the lives of the respective securities using the effective interest method. Realized gains (losses) on paydowns of mortgage- and asset-backed securities are classified as interest income. The Series declares dividends daily from net investment income and pays the dividends monthly and declares and pays distributions from net realized gain on investments, if any, following the close of the fiscal year. The Series may distribute more frequently, if necessary for tax purposes. Dividends and distributions, if any, are recorded on the ex-dividend date.
The Series may receive earnings credits from its custodian when positive cash balances are maintained, which may be used to offset custody fees. There were no such earnings credits for the year ended Dec. 31, 2016.
The Series receives earnings credits from its transfer agent when positive cash balances are maintained, which may be used to offset transfer agent fees. If the amount earned is greater than $1.00, the expense paid under this arrangement is included on the “Statement of operations” under “Dividend disbursing and transfer agent fees and expenses” with the corresponding expense offset shown under “Less expense paid indirectly.” For the year ended Dec. 31, 2016, the Series earned $1 under this agreement.
2. Investment Management, Administration Agreements, and Other Transactions with Affiliates
In accordance with the terms of its investment management agreement, the Series pays Delaware Management Company (DMC), a series of Delaware Management Business Trust and the investment manager, an annual fee which is calculated daily at the rate of 0.50% on the first $500 million of average daily net assets of the Series, 0.475% on the next $500 million, 0.45% on the next $1.5 billion, and 0.425% on average daily net assets in excess of $2.5 billion.
Delaware Investments Fund Services Company (DIFSC), an affiliate of DMC, provides fund accounting and financial administration oversight services to the Series. For these services, DIFSC’s fees are calculated based on the aggregate daily net assets of the Delaware Investments Family of Funds at the following annual rate: 0.0050% of the first $30 billion; 0.0045% of the next $10 billion; 0.0040% of the next $10 billion; and 0.0025% of aggregate average daily net assets in excess of $50 billion. The fees payable to DIFSC under the service agreement described above are allocated among all funds in the Delaware Investments Family of Funds on a relative net asset value (NAV) basis. For the year ended Dec. 31, 2016, the Series was charged $67,575 for these services. This amount is included on the “Statement of operations” under “Accounting and administration expenses.”
DIFSC is also the transfer agent and dividend disbursing agent of the Series. For these services, DIFSC’s fees are calculated at the annual rate of 0.0075% of the Series’ average daily net assets. This amount is included on the “Statement of operations” under “Dividend disbursing and transfer agent fees and expenses.” For the year ended Dec. 31, 2016, the Series was charged $107,081 for these services. Pursuant to a sub-transfer agency agreement between DIFSC and BNY Mellon Investment Servicing (US) Inc. (BNYMIS), BNYMIS provides certain sub-transfer agency services to the Series. Sub-transfer agency fees are paid by the Series and are also included on the “Statement of operations” under “Dividend disbursing and transfer agent fees and expenses.”
Pursuant to a distribution agreement and distribution plan, the Series pays Delaware Distributors, L.P. (DDLP), the distributor and an affiliate of DMC, an annual distribution and service fee of 0.30% of the average daily net assets of the Service Class shares. DDLP has contracted to waive distribution and service fees from Jan. 1, 2016 through Dec. 31, 2016* in order to limit distribution and service fees of the Service Class shares to 0.25% of average daily net assets. Standard Class shares pay no distribution and service expenses.
As provided in the investment management agreement, the Series bears a portion of the cost of certain resources shared with DMC, including the cost of internal personnel of DMC and/or its affiliates that provide legal, tax, and regulatory reporting services to the Series. For the year ended Dec. 31, 2016, the Series was charged $29,920 for internal legal, tax, and regulatory reporting services provided by DMC and/or its affiliates’ employees. This amount is included on the “Statement of operations” under “Legal fees.”
Trustees’ fees include expenses accrued by the Series for each Trustee’s retainer and meeting fees. Certain officers of DMC, DIFSC, and DDLP are officers and/or Trustees of the Trust. These officers and Trustees are paid no compensation by the Series.
Cross trades for the year ended Dec. 31, 2016 were executed by the Series pursuant to procedures adopted by the Board designed to ensure compliance with Rule 17a-7 under the 1940 Act. Cross trading is the buying or selling of portfolio securities between funds of investment companies, or between a fund of an investment company and another entity, that are or could be considered affiliates by virtue of having a common investment advisor (or affiliated investment advisors), common directors/trustees and or common officers. At its regularly scheduled meetings, the Board reviews such transactions for compliance with the procedures adopted by the Board. Pursuant to these procedures, for the year ended Dec. 31, 2016, the Series engaged in securities sales of $35,529,895 which resulted in net realized losses of ($79).
*The aggregate contractual waiver period covering this report is from April 29, 2015 through May 1, 2017.
Limited-Term Diversified Income Series-20
Table of Contents
Delaware VIP® Limited-Term Diversified Income Series
Notes to financial statements (continued)
3. Investments
For the year ended Dec. 31, 2016, the Series made purchases and sales of investment securities other than short-term investments as follows:
Purchases other than U.S. government securities | $ | 1,231,487,601 | ||
Purchases of U.S. government securities | 789,016,357 | |||
Sales other than U.S. government securities | 1,258,839,038 | |||
Sales of U.S. government securities | 797,869,652 |
At Dec. 31, 2016, the cost and unrealized appreciation (depreciation) of investments for federal income tax purposes for the Series were as follows:
| Cost of Investments | Aggregate Unrealized Appreciation of Investments | Aggregate Unrealized Depreciation of Investments | Net Unrealized Appreciation of Investments | |||||||||||||||||
| $1,413,283,810 | $8,528,486 | $(17,929,833) | $(9,401,347) | |||||||||||||||||
U.S. GAAP defines fair value as the price that the Series would receive to sell an asset or pay to transfer a liability in an orderly transaction between market participants at the measurement date under current market conditions. A three-level hierarchy for fair value measurements has been established based upon the transparency of inputs to the valuation of an asset or liability. Inputs may be observable or unobservable and refer broadly to the assumptions that market participants would use in pricing the asset or liability. Observable inputs reflect the assumptions market participants would use in pricing the asset or liability based on market data obtained from sources independent of the reporting entity. Unobservable inputs reflect the reporting entity’s own assumptions about the assumptions that market participants would use in pricing the asset or liability based on the best information available under the circumstances. The Series’ investment in its entirety is assigned a level based upon the observability of the inputs which are significant to the overall valuation. The three-level hierarchy of inputs is summarized below.
| Level 1 | – | Inputs are quoted prices in active markets for identical investments. (Examples: equity securities, open-end investment companies, futures contracts, exchange-traded options contracts) | ||
| Level 2 | – | Other observable inputs, including but not limited to: quoted prices for similar assets or liabilities in markets that are active, quoted prices for identical or similar assets or liabilities in markets that are not active, inputs other than quoted prices that are observable for the assets or liabilities (such as interest rates, yield curves, volatilities, prepayment speeds, loss severities, credit risks and default rates), or other market-corroborated inputs. (Examples: debt securities, government securities, swap contracts, foreign currency exchange contracts, foreign securities utilizing international fair value pricing, broker-quoted securities, fair valued securities) | ||
| Level 3 | – | Significant unobservable inputs, including the Series’ own assumptions used to determine the fair value of investments. (Examples: broker-quoted securities, fair valued securities) |
Level 3 investments are valued using significant unobservable inputs. The Series may also use an income-based valuation approach in which the anticipated future cash flows of the investment are discounted to calculate fair value. Discounts may also be applied due to the nature or duration of any restrictions on the disposition of the investments. Valuations may also be based upon current market prices of securities that are comparable in coupon, rating, maturity, and industry. The derived value of a Level 3 investment may not represent the value which is received upon disposition and this could impact the results of operations.
The following table summarizes the valuation of the Series’ investments by fair value hierarchy levels as of Dec. 31, 2016:
| Securities | Level 2 | |||
Agency, asset-backed & mortgage-backed securities | $ | 697,274,122 | ||
Corporate debt | 540,968,020 | |||
Municipal bonds | 14,785,898 | |||
Preferred stock | 15,094,608 | |||
Short-term investments | 16,024,711 | |||
U.S. Treasury obligations | 119,735,104 | |||
|
| |||
Total Value of Securities | $ | 1,403,882,463 | ||
|
| |||
During the year ended Dec. 31, 2016, there were no transfers between Level 1 investments, Level 2 investments, or Level 3 investments that had a significant impact to the Series. The Series’ policy is to recognize transfers between levels at the beginning of the reporting period.
A reconciliation of Level 3 investments is presented when the Series has a significant amount of Level 3 investments at the beginning, interim, or end of the period in relation to net assets. During the year ended, there were no Level 3 investments.
Limited-Term Diversified Income Series-21
Table of Contents
Delaware VIP® Limited-Term Diversified Income Series
Notes to financial statements (continued)
4. Dividend and Distribution Information
Income and long-term capital gain distributions are determined in accordance with federal income tax regulations, which may differ from U.S. GAAP. Additionally, distributions from net short-term gains on sales of investment securities are treated as ordinary income for federal income tax purposes. The tax character of dividends and distributions paid during the years ended Dec. 31, 2016 and 2015 were as follows:
| Year ended 12/31/16 | Year ended 12/31/15 | |||||||
Ordinary | $ | 20,330,730 | $ | 21,260,960 | ||||
5. Components of Net Assets on a Tax Basis
As of Dec. 31, 2016, the components of net assets on a tax basis were as follows:
Shares of beneficial interest | $ | 1,427,264,902 | ||
Undistributed ordinary income | 1,405,092 | |||
Distributions payable | (534,772 | ) | ||
Capital loss carryforwards | (11,343,283 | ) | ||
Unrealized depreciation on investments and derivatives | (9,401,347 | ) | ||
|
| |||
Net assets | $ | 1,407,390,592 | ||
|
|
The differences between book basis and tax basis components of net assets are primarily attributable to tax deferral of losses on wash sales, contingent payment debt instruments (CPDI), dividends payable, and tax treatment of market discount and premium on debt instruments.
For financial reporting purposes, capital accounts are adjusted to reflect the tax character of permanent book/tax differences. Reclassifications are primarily due to tax treatment of market discount and premium on debt instruments and paydowns of asset-and mortgage-backed securities. Results of operations and net assets were not affected by these
reclassifications. For the year ended Dec. 31, 2016, the Series recorded the following reclassifications:
| Undistributed Net Investment | Accumulated Net Realized Loss | |||
| $7,331,815 | $(7,331,815) | |||
Under the Regulated Investment Company Modernization Act of 2010 (Act), net capital losses recognized for tax years beginning after Dec. 22, 2010 may be carried forward indefinitely and their character is retained as short-term and/or long-term losses.
For federal income tax purposes, $7,850,807 of capital loss carryforwards from prior years was utilized in the year ended Dec. 31, 2016.
The Series has capital loss carryforwards available to offset future realized capital gains as follows:
| Loss carryforward character | ||||||
| Short-term | Long-term | |||||
| $ | 3,992,487 | $ | 7,350,796 | |||
| Limited-Term Diversified Income Series-22 |
Table of Contents
Delaware VIP® Limited-Term Diversified Income Series
Notes to financial statements (continued)
6. Capital Shares
Transactions in capital shares were as follows:
| Year ended 12/31/16 | Year ended 12/31/15 | |||||||
Shares sold: | ||||||||
Standard Class | 2,858,109 | 1,433,915 | ||||||
Service Class | 6,385,573 | 7,468,551 | ||||||
Shares issued upon reinvestment of dividends and distributions: | ||||||||
Standard Class | 118,678 | 105,354 | ||||||
Service Class | 1,940,535 | 2,069,058 | ||||||
| 11,302,895 | 11,076,878 | |||||||
Shares redeemed: | ||||||||
Standard Class | (1,089,539 | ) | (1,149,117 | ) | ||||
Service Class | (13,460,353 | ) | (11,809,936 | ) | ||||
| (14,549,892 | ) | (12,959,053 | ) | |||||
Net decrease | (3,246,997 | ) | (1,882,175 | ) | ||||
7. Line of Credit
The Series, along with certain other funds in the Delaware Investments® Family of Funds (Participants), was a participant in a $155,000,000 revolving line of credit intended to be used for temporary or emergency purposes as an additional source of liquidity to fund redemptions of investor shares. Under the agreement, the Participants were charged an annual commitment fee of 0.10%, which was allocated across the Participants on the basis of relative net assets of each Participant’s allocation of the entire facility. The Participants were permitted to borrow up to a maximum of one-third of their net assets under the agreement. Each Participant was individually, and not jointly, liable for its particular advances, if any, under the line of credit. The line of credit available under the agreement expired on Nov. 7, 2016.
On Nov. 7, 2016, the Fund, along with the other Participants, entered into an amendment to the agreement for a $155,000,000 revolving line of credit. The line of credit is to be used as described above and operates in substantially the same manner as the original agreement with the exception of the annual commitment fee. Under the amendment to the agreement, the Participants are charged an annual commitment fee of 0.15%, which is allocated across the Participants on the basis of relative net assets of each Participant’s allocation of the entire facility. The line of credit available under the agreement expires on Nov. 6, 2017.
The Series had no amounts outstanding as of Dec. 31, 2016 or at any time during the period then ended.
8. Derivatives
U.S. GAAP requires disclosures that enable investors to understand: (1) how and why an entity uses derivatives; (2) how they are accounted for; and (3) how they affect an entity’s results of operations and financial position.
Futures Contracts
A futures contract is an agreement in which the writer (or seller) of the contract agrees to deliver to the buyer an amount of cash or securities equal to a specific dollar amount times the difference between the value of a specific security or index at the close of the last trading day of the contract and the price at which the agreement is made. The Series may use futures in the normal course of pursuing its investment objective. The Series may invest in futures contracts to hedge its existing portfolio securities against fluctuations in value caused by changes in interest rates or market conditions. Upon entering into a futures contract, the Series deposits cash or pledges U.S. government securities to a broker, equal to the minimum “initial margin” requirements of the exchange on which the contract is traded. Subsequent payments are received from the broker or paid to the broker each day, based on the daily fluctuation in the market value of the contract. These receipts or payments are known as “variation margin” and are recorded daily by the Series as unrealized gains or losses until the contracts are closed. When the contracts are closed, the Series records a realized gain or loss equal to the difference between the value of the contract at the time it was opened and the value at the time it was closed. Risks of entering into futures contracts include potential imperfect correlation between the futures contracts and the underlying securities and the possibility of an illiquid secondary market for these instruments. When investing in futures, there is reduced counterparty credit risk to the Series because futures are exchange-traded and the exchange’s clearinghouse, as counterparty to all exchange-traded futures, guarantees against default.
There were no open futures contracts at Dec. 31, 2016.
During the year ended Dec. 31, 2016, the Series entered into futures contracts to hedge the Series’ then existing portfolio securities against fluctuations in value caused by changes in interest rates or market conditions.
| Limited-Term Diversified Income Series-23 |
Table of Contents
Delaware VIP® Limited-Term Diversified Income Series
Notes to financial statements (continued)
8. Derivatives (continued)
During the year ended Dec. 31, 2016, the Series experienced net realized gain or losses attributable to interest risk, which is disclosed as “Net realized gain on futures contracts” on the “Statement of operations.”
Derivatives Generally. The table below summarizes the average balance of derivative holdings by the Series during the year ended Dec. 31, 2016.
| Long Derivative Volume | Short Derivative Volume | |||||||
Futures contracts (average notional value) | $ | 2,789,274 | $ | — | ||||
9. Offsetting
In December 2011, the Financial Accounting Standards Board (FASB) issued guidance that expanded disclosure requirements on the offsetting of certain assets and liabilities.The disclosures are required for investments and derivative financial instruments subject to master netting or similar agreements which are eligible for offset on the “Statement of assets and liabilities” and require an entity to disclose both gross and net information about such investments and transactions in the financial statements. In January 2013, the FASB issued guidance that clarified which investments and transactions are subject to the off setting disclosure requirements.The scope of the disclosure requirementsf or
offsettingis limited to derivative instruments, repurchase agreements and reverse repurchase agreements, and securities borrowing.
In order to better define its contractual rights and to secure rights that will help the Series mitigate its counterparty risk, the Series entered into an International Swaps and Derivatives Association, Inc. Master Agreement (ISDA Master Agreement) or a similar agreement with certain of its derivative contract counterparties. An ISDA Master Agreement is a bilateral agreement between the Series and a counterparty that governs certain over-the-counter (OTC) derivatives and foreign exchange contracts and typically contains, among other things, collateral posting items and netting provisions in the event of a default and/or termination event. Under an ISDA Master Agreement, the Series may, under certain circumstances, offset with the counterparty certain derivative financial instruments’ payables and/or receivables with collateral held and/or posted and create one single net payment. The provisions of the ISDA Master Agreement typically permit a single net payment in the event of default (close-out), including the bankruptcy or insolvency of the counterparty. However, bankruptcy or insolvency laws of a particular jurisdiction may impose restrictions on or prohibitions against the right of offset in bankruptcy, insolvency, or other events.
For financial reporting purposes, the Series does not offset derivatives assets and derivatives liabilities that are subject to netting arrangements in the “Statement of assets and liabilities.”
Master Repurchase Agreements
Counterparty | Repurchase Agreements | Fair Value of Non-Cash Collateral Received(a) | Cash Collateral Received | Net Collateral Received | Net Exposure(b) | ||||||||||||||||||||
Bank of America Merrill Lynch | $3,689,183 | $(3,689,183 | ) | $— | $(3,689,183 | ) | $— | ||||||||||||||||||
Bank of Montreal | 4,304,046 | (4,304,046 | ) | — | (4,304,046 | ) | — | ||||||||||||||||||
BNP Paribas | 2,946,771 | (2,946,771 | ) | — | (2,946,771 | ) | — | ||||||||||||||||||
Total | $10,940,000 | $(10,940,000 | ) | $— | $(10,940,000 | ) | $— | ||||||||||||||||||
(a) The value of the related collateral received exceeded the value of the repurchase agreements as of Dec. 31, 2016.
(b) Net exposure represents the receivable (payable) that would be due from (to) the counterparty in the event of default.
10. Securities Lending
The Series, along with other funds in the Delaware Investments® Family of Funds, may lend its securities pursuant to a security lending agreement (Lending Agreement) with The Bank of New York Mellon (BNY Mellon). At the time a security is loaned, the borrower must post collateral equal to the required percentage of the market value of the loaned security, including any accrued interest. The required percentage is: (1) 102% with respect to U.S. securities and foreign securities that are denominated and payable in U.S. dollars; and (2) 105% with respect to foreign securities. With respect to each loan, if on any business day the aggregate market value of securities collateral plus cash collateral held is less than the aggregate market value of the securities that are the subject of such loan, the borrower will be notified to provide additional collateral by the end of the following business day, which, together with the collateral already held, will be not less than the applicable initial collateral requirements for such security loan. If the aggregate market value of securities collateral and cash collateral held with respect to a security loan exceeds the applicable initial collateral requirement, upon the request of the borrower, BNY Mellon must return enough collateral to the borrower by the end of the following business day to reduce the value of the remaining collateral to the applicable initial collateral requirement for such security loan. As a result of the foregoing, the value of the collateral held with respect to a loaned security on any particular day may be more or less than the value of the security on loan.
Cash collateral received by each series of the Trust is generally invested in a series of individual separate accounts, each corresponding to a Series. The investment guidelines permit each separate account to hold certain securities that would be considered eligible securities for a money market fund. Cash collateral received is generally invested in government
Limited-Term Diversified Income Series-24
Limited-Term Diversified Income Series-24
Table of Contents
Delaware VIP® Limited-Term Diversified Income Series
Notes to financial statements (continued)
securities; certain obligations issued by government sponsored enterprises; repurchase agreements collateralized by U.S. Treasury securities; obligations issued by the central government of any Organization for Economic Cooperation and Development (OECD) country or its agencies, in strumentalities, or establishments; obligations of
supranational organizations; commercial paper, notes, bonds, and other debt obligations; certificates of deposit, time deposits, and other bank obligations; and asset-backed securities.
In the event of default or bankruptcy by the lending agent, realization and/or retention of the collateral may be subject to legal proceedings. In the event the borrower fails to return loaned securities and the collateral received is insufficient to cover the value of the loaned securities and provided such collateral shortfall is not the result of investment losses, the lending agent has agreed to pay the amount of the shortfall to the Series or, at the discretion of the lending agent, replace the loaned securities. The Series continues to record dividends or interest, as applicable, on the securities loaned and is subject to changes in value of the securities loaned that may occur during the term of the loan. The Series has the right under the Lending Agreement to recover the securities from the borrower on demand. With respect to security loans collateralized by non-cash collateral, the Series receives loan premiums paid by the borrower. With respect to security loans collateralized by cash collateral, the earnings from the collateral investments are shared among the Series, the security lending agent, and the borrower. The Series records security lending income net of allocations to the security lending agent and the borrower.
The Series may incur investment losses as a result of investing securities lending collateral. This could occur if an investment in the collateral investment account defaulted or became impaired. Under those circumstances, the value of a Series’ cash collateral account may be less than the amount the Series would be required to return to the borrowers of the securities and the Series would be required to make up for this shortfall.
During the year ended Dec. 31, 2016, the Series had no securities out on loan.
11. Credit and Market Risk
The Series invests in fixed income securities whose value is derived from an underlying pool of mortgages or consumer loans. The value of these securities is sensitive to changes in economic conditions, including delinquencies and/or defaults, and may be adversely affected by shifts in the market’s perception of the issuers and changes in interest rates. Investors receive principal and interest payments as the underlying mortgages and consumer loans are paid back. Some of these securities are collateralized mortgage obligations (CMOs). CMOs are debt securities issued by U.S. government agencies or by financial institutions and other mortgage lenders, which are collateralized by a pool of mortgages held under an indenture. Prepayment of mortgages may shorten the stated maturity of the obligations and can result in a loss of premium, if any has been paid. Certain of these securities may be stripped (securities which provide only the principal or interest feature of the underlying security). The yield to maturity on an interest-only CMO is extremely sensitive not only to changes in prevailing interest rates, but also to the rate of principal payments (including prepayments) on the related underlying mortgage assets. A rapid rate of principal payments may have a material adverse effect on the Series’ yield to maturity. If the underlying mortgage assets experience greater than anticipated prepayments of principal, the Series may fail to recoup its initial investment in these securities even if the securities are rated in the highest rating categories.
The Series invests in high yield fixed income securities, which are securities rated lower than BBB- by Standard & Poor’s Financial Services LLC and lower than Baa3 by Moody’s Investors Service, Inc. or similarly rated by another nationally recognized statistical rating organization. Investments in these higher yielding securities are generally accompanied by a greater degree of credit risk than higher rated securities. Additionally, lower rated securities may be more susceptible to adverse economic and competitive industry conditions than investment grade securities.
The Series invests in certain obligations held by the Series that may have liquidity protection designed to ensure that the receipt of payments due on the underlying security is timely. Such protection may be provided through guarantees, insurance policies or letter of credit obtained by the issuer or sponsor through third parties, through various means of structuring the transaction or through a combination of such approaches. The Series will not pay any additional fees for such credit support, although the existence of credit support may increase the price of the security.
The Series may invest up to 15% of its net assets in illiquid securities, which may include securities with contractual restrictions on resale, securities exempt from registration under Rule 144A of the Securities Act of 1933, as amended, and other securities which may not be readily marketable. The relative illiquidity of these securities may impair the Series from disposing of them in a timely manner and at a fair price when it is necessary or desirable to do so. While maintaining oversight, the Board has delegated to DMC the day-to-day functions of determining whether individual securities are liquid for purposes of the Series’ limitation on investments in illiquid securities. Securities eligible for resale pursuant to Rule 144A, which are determined to be liquid, are not subject to the Series’ 15% limit on investments in illiquid securities. Rule 144A securities have been identified on the “Schedule of investments.”
12. Contractual Obligations
The Series enters into contracts in the normal course of business that contain a variety of indemnifications. The Series’ maximum exposure under these arrangements is unknown. However, the Series has not had prior claims or losses pursuant to these contracts. Management has reviewed the Series’ existing contracts and expects the risk of loss to be remote.
| Limited-Term Diversified Income Series-25 |
Table of Contents
Delaware VIP® Limited-Term Diversified Income Series
Notes to financial statements (continued)
13. Recent Accounting Pronouncements
On Oct. 13, 2016, the Securities and Exchange Commission amended existing rules intended to modernize reporting and disclosure of information. These amendments relate to Regulation S-X which sets forth the form and content of financial statements. At this time, management is evaluating the implications of adopting these amendments and their impact on the financial statements and accompanying notes.
14. Subsequent Events
Management has determined that no material events or transactions occurred subsequent to Dec. 31, 2016 that would require recognition or disclosure in the Series’ financial statements.
| Limited-Term Diversified Income Series-26 |
Table of Contents
Delaware VIP® Trust — Delaware VIP Limited-Term Diversified Income Series
Report of independent registered public accounting firm
To the Board of Trustees of Delaware VIP Trust and Shareholders of Delaware VIP Limited-Term Diversified Income Series:
In our opinion, the accompanying statement of assets and liabilities, including the schedule of investments, and the related statements of operations and of changes in net assets and the financial highlights present fairly, in all material respects, the financial position of Delaware VIP Limited-Term Diversified Income Series (one of the series constituting Delaware VIP Trust, hereafter referred to as the “Series”) as of December 31, 2016, the results of its operations for the year then ended, the changes in its net assets for each of the two years in the period then ended and the financial highlights for each of the five years in the period then ended, in conformity with accounting principles generally accepted in the United States of America. These financial statements and financial highlights (hereafter referred to as “financial statements”) are the responsibility of the Series’ management. Our responsibility is to express an opinion on these financial statements based on our audits. We conducted our audits of these financial statements in accordance with the standards of the Public Company Accounting Oversight Board (United States). Those standards require that we plan and perform the audit to obtain reasonable assurance about whether the financial statements are free of material misstatement. An audit includes examining, on a test basis, evidence supporting the amounts and disclosures in the financial statements, assessing the accounting principles used and significant estimates made by management, and evaluating the overall financial statement presentation. We believe that our audits, which included confirmation of securities as of December 31, 2016 by correspondence with the custodian and brokers, provide a reasonable basis for our opinion.
Pricewaterhouse Coopers LLP
Philadelphia, Pennsylvania
February 16, 2017
| Limited-Term Diversified Income Series-27 |
Table of Contents
Delaware VIP® Trust — Delaware VIP Limited-Term Diversified Income Series
Other Series information (Unaudited)
Board consideration of Delaware VIP Limited-Term Diversified Income Series investment advisory agreement
At a meeting held on Aug. 16–18, 2016 (the “Annual Meeting”), the Board of Trustees (the “Board”), including a majority of disinterested or independent Trustees, approved the renewal of the Investment Advisory Agreement for Delaware VIP Limited-Term Diversified Income Series (the “Series”). In making its decision, the Board considered information furnished at regular quarterly Board meetings, including reports detailing Series performance, investment strategies, and expenses, as well as information prepared specifically in connection with the renewal of the investment advisory and sub-advisory contracts. Information furnished specifically in connection with the renewal of the Investment Management Agreement with Delaware Management Company (“DMC”) included materials provided by DMC and its affiliates (“Delaware Investments”) concerning, among other things, the nature, extent, and quality of services provided to the Series; the costs of such services to the Series; economies of scale; and the investment manager’s financial condition and profitability. In addition, in connection with the Annual Meeting, reports were provided to the Trustees in May 2016 and included reports provided by Broadridge Financial Solutions (“Broadridge”). The Broadridge reports compared the Series’ investment performance and expenses with those of other comparable mutual funds. The Independent Trustees reviewed and discussed the Broadridge reports with independent legal counsel to the Independent Trustees. In addition to the information noted above, the Board also requested and received information regarding DMC’s policy with respect to advisory fee levels and its breakpoint philosophy; the structure of portfolio manager compensation; comparative client fee information; and any constraints or limitations on the availability of securities for certain investment styles, which had in the past year inhibited, or which were likely in the future to inhibit, the investment manager’s ability to invest fully in accordance with Series policies.
In considering information relating to the approval of the Series’ advisory agreement, the Independent Trustees received assistance and advice from and met separately with independent legal counsel to the Independent Trustees. Although the Board gave attention to all information furnished, the following discussion identifies, under separate headings, the primary factors taken into account by the Board during its contract renewal considerations.
Nature, extent, and quality of service. The Board considered the services provided by DMC to the Series and its shareholders. In reviewing the nature, extent, and quality of services, the Board considered reports furnished to it throughout the year, which covered matters such as the relative performance of the Series; compliance of portfolio managers with the investment policies, strategies, and restrictions for the Series; compliance by DMC and Delaware Distributors, L.P. (together, “Management”) personnel with the Code of Ethics adopted throughout the Delaware Investments® Family of Funds complex; and adherence to fair value pricing procedures as established by the Board. The Board was pleased with the current staffing of the Series’ investment advisor and the emphasis placed on research in the investment process. The Board recognized DMC’s receipt of several industry distinctions during the past several years. The Board gave favorable consideration to DMC’s efforts to control expenditures while maintaining service levels committed to Series matters. The Board was satisfied with the nature, extent, and quality of the overall services provided by DMC.
Investment performance. The Board placed significant emphasis on the investment performance of the Series in view of the importance of investment performance to shareholders. Although the Board gave appropriate consideration to performance reports and discussions with portfolio managers at Board meetings throughout the year, the Board gave particular weight to the Broadridge reports furnished for the Annual Meeting. The Broadridge reports prepared for the Series showed the investment performance of its Standard Class shares in comparison to a group of similar funds as selected by Broadridge (the “Performance Universe”). A fund with the best performance ranked first, and a fund with the poorest performance ranked last. The highest/best performing 25% of funds in the Performance Universe make up the first quartile; the next 25%, the second quartile; the next 25%, the third quartile; and the poorest/worst performing 25% of funds in the Performance Universe make up the fourth quartile. Comparative annualized performance for the Series was shown for the past 1-, 3-, 5-, and 10-year periods, as applicable, ended Jan. 31, 2016. The Board’s objective is that the Series’ performance for the periods considered be at or above the median of its Performance Universe.
The Performance Universe for the Series consisted of the Series and all short-intermediate investment grade debt funds underlying variable insurance products as selected by Broadridge. The Broadridge report comparison showed that the Series’ total return for the 1- and 3-year periods was in the first quartile of its Performance Universe. The report further showed that the Series’ total return for the 5- and 10-year periods was in the second quartile of its Performance Universe. The Board was satisfied with performance.
Comparative expenses. The Board considered expense comparison data for the Delaware Investments Family of Funds. Management provided the Board with information on pricing levels and fee structures for the Series as of its most recently completed fiscal year. The Board also focused on the comparative analys is of effective management fees and total expense ratios of the Series versus effective management fees and expenseratios of a group of similar funds as selected by Broadridge (the “Expense Group”). Inreviewing comparative costs, the Series’ contractual management fee and the actual management fee incurred by the Series were compared with the contractual management fees (as suming all funds in the Expense Group were similar in size to the Series) and actual management fees (as reported by each fund) within the Expense Group, taking into account any applicable breakpoints and fee waivers. The Series’ total expenses were also compared with those of its Expense Group. The Broadridge total expenses, for comparative consistency, were shown by Broadridge for Standard Class shares which do not charge 12b-1 and non-12b-1 service fees. The Board’s objective is to limit the Series’ total expense ratio to be competitive with that of the Expense Group.
| Limited-Term Diversified Income Series-28 |
Table of Contents
Delaware VIP® Trust — Delaware VIP Limited-Term Diversified Income Series
Other Series information (Unaudited)
Board consideration of Delaware VIP Limited-Term Diversified Income Series investment advisory agreement (continued)
The expense comparisons for the Series showed that the actual management fee was in the quartile with the second highest expenses of its Expense Group and its total expenses were in the quartile with the highest expenses of its Expense Group. The Series’ total expenses were not in line with the Board’s objective. In evaluating total expenses, the Board considered 12b-1 waivers in place through May 1, 2017 and various initiatives implemented by Management. The Board was satisfied with Management’s efforts to improve the Series’ total expense ratio and to bring it in line with the Board’s objective.
Management profitability. The Board considered the level of profits realized by DMC in connection with the operation of the Series. In this respect, the Board reviewed the Investment Management Profitability Analysis that addressed the overall profitability of DMC’s business in providing management and other services to each of the individual funds and the Delaware Investments® Family of Funds as a whole. Specific attention was given to the methodology followed in allocating costs for the purpose of determining profitability. Management stated that the level of profits of DMC, to a certain extent, reflects recent operational cost savings and efficiencies initiated by DMC. The Board considered DMC’s efforts to improve services provided to fund shareholders and to meet additional regulatory and compliance requirements resulting from recent industry-wide Securities and Exchange Commission initiatives. The Board also considered the extent to which DMC might derive ancillary benefits from fund operations, including the potential for procuring additional business as a result of the prestige and visibility associated with its role as service provider to the Delaware Investments Family of Funds and the benefits from allocation of fund brokerage to improve trading efficiencies. The Board found that the management fees were reasonable in light of the services rendered and the profitability of DMC.
Economies of scale. The Trustees considered whether economies of scale are realized by DMC as the Series’ assets increase and the extent to which any economies of scale are reflected in the level of management fees charged. The Trustees reviewed the standardized advisory fee pricing and structure approved by the Board and shareholders, which includes breakpoints, and which applies to most funds in the Delaware Investments Family of Funds complex. Breakpoints in the advisory fee occur when the advisory fee rate is reduced on assets in excess of specified levels. Breakpoints result in a lower advisory fee, than would otherwise be the case in the absence of breakpoints, when the asset levels specified in the breakpoints are exceeded. The Board noted that the fee under the Series’ management contract fell within the standardized fee pricing structure. The Board also noted that, as of May 31, 2016, the Series’ assets exceeded the second breakpoint level. The Board believed that, given the extent to which economies of scale might be realized by the advisor and its affiliates, the schedule of fees under the Investment Management Agreement provides a sharing of benefits with the Series and its shareholders.
Tax Information
All disclosures are based on financial information available as of the date of this annual report and, accordingly are subject to change. For any and all items requiring reporting, it is the intention of the Series to report the maximum amount permitted under the Internal Revenue Code and the regulations thereunder.
For the year ended Dec. 31, 2016, the Series reports distributions paid during the year as follows:
(A) Ordinary Income Distributions (Tax Basis) |
| 100.00% |
(A) is based on a percentage of the Series’ total distributions.
Limited-Term Diversified Income Series-29
Table of Contents
Delaware Investments® Family of Funds
Board of trustees / directors and officers addendum
A mutual fund is governed by a Board of Trustees/Directors (“Trustees”), which has oversight responsibility for the management of a fund’s business affairs. Trustees establish procedures and oversee and review the performance of the investment manager, the distributor, and others who perform services for the fund. The independent fund trustees, in particular, are advocates for shareholder interests. Each trustee has served in that capacity since he or she was elected to or appointed to the Board of Trustees, and will continue to serve until his or her retirement or the election of a new trustee in his or her place. The following is a list of the Trustees and Officers with certain background and related information.
Name, Address, and Birth Date | Position(s) Held with Fund(s) | Length of Time Served | Principal Occupation(s) During the Past Five Years | Number of or Officer | Other Held by Trustee or Officer | |||||
| INTERESTED TRUSTEE | ||||||||||
Shawn K. Lytle1, 3 2005 Market Street Philadelphia, PA 19103
February 1970 | President, Chief Executive Officer, and Trustee | Trustee since September 2015
President and Chief Executive Officer since August 2015 | Shawn K. Lytle has served as President of Delaware Investments2 since June 2015 and was the Regional Head of Americas for UBS Global Asset Management from 2010 through 2015. | 62 | Trustee — UBS Relationship Funds, SMA Relationship Trust, and UBS Funds (May 2010–April 2015) | |||||
| INDEPENDENT TRUSTEES | ||||||||||
Thomas L. Bennett 2005 Market Street Philadelphia, PA 19103
October 1947 | Chairman and Trustee | Trustee since March 2005
Chairman since March 2015 | Private Investor (March 2004–Present) | 62 | None | |||||
Ann D. Borowiec 2005 Market Street Philadelphia, PA 19103
November 1958 | Trustee | Since March 2015 | Chief Executive Officer Private Wealth Management (2011–2013) and Market Manager, New Jersey Private Bank (2005–2011) — J.P. Morgan Chase & Co. | 62 | Director — Banco Santander International
Director — Santander Bank, N.A. | |||||
Joseph W. Chow 2005 Market Street Philadelphia, PA 19103
January 1953 | Trustee | Since January 2013 | Executive Vice President (Emerging Economies Strategies, Risks, and Corporate Administration) State Street Corporation (July 2004–March 2011) | 62 | Director and Audit Committee Member — Hercules Technology Growth Capital, Inc. (2004–2014) | |||||
John A. Fry 2005 Market Street Philadelphia, PA 19103
May 1960 | Trustee | Since January 2001 | President — Drexel University (August 2010–Present)
President — Franklin & Marshall College (July 2002–July 2010) | 62 | Director, Audit Committee and Governance Committee Member — Community Health Systems
Director — Drexel Morgan & Co.
Director, Audit Committee Member — vTv Therapeutics LLC | |||||
Lucinda S. Landreth 2005 Market Street Philadelphia, PA 19103
June 1947 | Trustee | Since March 2005 | Private Investor (2004–Present) | 62 | None | |||||
Limited-Term Diversified Income Series-30
Table of Contents
Name, Address, and Birth Date | Position(s) Held with Fund(s) | Length of Time Served | Principal Occupation(s) During the Past Five Years | Number of or Officer | Other Held by Trustee or Officer | |||||
Frances A. Sevilla-Sacasa 2005 Market Street Philadelphia, PA 19103
January 1956 | Trustee | Since September 2011 | Chief Executive Officer — Banco Itaú International (April 2012–December 2016)
Executive Advisor to Dean (August 2011–March 2012) and Interim Dean (January 2011–July 2011) — University of Miami School of Business Administration
President — U.S. Trust, Bank of America Private Wealth Management (Private Banking) (July 2007–December 2008) | 62 | Trust Manager and Audit Committee Member — Camden Property Trust | |||||
Thomas K. Whitford 2005 Market Street Philadelphia, PA 19103
March 1956 | Trustee | Since January 2013 | Vice Chairman (2010–April 2013) — PNC Financial Services Group | 62 | Director — HSBC Finance Corporation and HSBC North America Holdings Inc. Director — HSBC Bank | |||||
Janet L. Yeomans 2005 Market Street Philadelphia, PA 19103
July 1948 | Trustee | Since April 1999 | Vice President and Treasurer (January 2006–July 2012)
Vice President — Mergers & Acquisitions (January 2003–January 2006), and Vice President and Treasurer (July 1995–January 2003) — 3M Company | 62 | Director, Personnel and Compensation Committee Chair, and Audit Committee Member — Okabena Company | |||||
| OFFICERS | ||||||||||
David F. Connor 2005 Market Street Philadelphia, PA 19103
December 1963 | Senior Vice President, General Counsel, and Secretary | Senior Vice President, since May 2013; General Counsel since May 2015; Secretary since October 2005 | David F. Connor has served in various capacities at different times at Delaware Investments. | 62 | None3 | |||||
Daniel V. Geatens 2005 Market Street Philadelphia, PA 19103
October 1972 | Vice President and Treasurer | Treasurer since October 2007 | Daniel V. Geatens has served in various capacities at different times at Delaware Investments. | 62 | None3 | |||||
Richard Salus 2005 Market Street Philadelphia, PA 19103
October 1963 | Senior Vice President and Chief Financial Officer | Chief Financial Officer since November 2006 | Richard Salus has served in various capacities at different times at Delaware Investments. | 62 | None3 | |||||
| 1 | Shawn K. Lytle is considered to be an “Interested Trustee” because he is an executive officer of the Fund’s(s’) investment advisor. |
| 2 | Delaware Investments is the marketing name for Delaware Management Holdings, Inc. and its subsidiaries, including the Fund’s(s’) investment advisor, principal underwriter, and its transfer agent. |
| 3 | Shawn K. Lytle, David F. Connor, Daniel V. Geatens, and Richard Salus serve in similar capacities for the six portfolios of the Optimum Fund Trust, which have the same investment advisor, principal underwriter, and transfer agent as the registrant. |
The Statement of Additional Information for the Fund(s) includes additional information about the Trustees and Officers and is available, without charge, upon request by calling 800 523-1918.
Limited-Term Diversified Income Series-31
Table of Contents
The Series files its complete schedule of portfolio holdings with the Securities and Exchange Commission (Commission) for the first and third quarters of each fiscal year on Form N-Q. The Series’ Forms N-Q, as well as a description of the policies and procedures that the Series uses to determine how to vote proxies (if any) relating to portfolio securities are available without charge (i) upon request, by calling 800 523-1918; and (ii) on the Commission’s website at sec.gov. In addition, a description of the policies and procedures that the Series uses to determine how to vote proxies (if any) relating to portfolio securities and the Schedule of Investments included in the Series’ most recent Form N-Q are available without charge on the Delaware Investments® Funds’ website at delawareinvestments.com/vip/literature. The Series’ Forms N-Q may be reviewed and copied at the Commission’s Public Reference Room in Washington, DC; information on the operation of the Public Reference Room may be obtained by calling 800 SEC-0330.
Information (if any) regarding how the Series voted proxies relating to portfolio securities during the most recently disclosed 12-month period ended June 30 is available without charge (i) through the Delaware Investments Funds’ website at delawareinvestments.com/proxy; and (ii) on the Commission’s website at sec.gov.
|
| AR-VIPLTD [12/16] BNY 21386 (2/17) (18579) | Limited-Term Diversified Income Series-32 |
Table of Contents
Delaware VIP® Trust
|
Delaware VIP REIT Series
|
Annual report
|
December 31, 2016
|

Table of Contents

Neither Delaware Investments nor its affiliates referred to in this document are authorized deposit-taking institutions for the purpose of the Banking Act 1959 (Commonwealth of Australia). The obligations of these entities do not represent deposits or other liabilities of Macquarie Bank Limited (MBL), a subsidiary of Macquarie Group Limited and an affiliate of Delaware Investments. MBL does not guarantee or otherwise provide assurance in respect of the obligations of these entities, unless noted otherwise. The Series is governed by U.S. laws and regulations.
Unless otherwise noted, views expressed herein are current as of Dec. 31, 2016, and subject to change for events occurring after such date.
The Series is not FDIC insured and is not guaranteed. It is possible to lose the principal amount invested.
Mutual fund advisory services provided by Delaware Management Company, a series of Delaware Management Business Trust, which is a registered investment advisor and member of Macquarie Group. Delaware Investments, a member of Macquarie Group, refers to Delaware Management Holdings, Inc. and its subsidiaries, including the Series’ distributor, Delaware Distributors, L.P. Macquarie Group refers to Macquarie Group Limited and its subsidiaries and affiliates worldwide.
This material may be used in conjunction with the offering of shares in Delaware VIP REIT Series only if preceded or accompanied by the Series’ current prospectus or the summary prospectus.
© 2017 Delaware Management Holdings, Inc.
All third-party marks cited are the property of their respective owners.
Table of Contents
For the fiscal year ended Dec. 31, 2016, Delaware VIP REIT Series Standard Class shares returned +5.87% and Service Class shares returned +5.62% (both figures reflect returns with all dividends reinvested). The Series’ benchmark, the FTSE NAREIT Equity REITs Index, returned +8.52% for the same period.
Economic growth in the United States was sluggish, and financial markets struggled as the 2016 fiscal year began, just weeks after the U.S. Federal Reserve had raised rates for the first time in nine years. When volatility persisted into February, the Fed indicated that it would delay additional rate hikes that had been widely anticipated just weeks before. With higher rates seemingly off the table, real estate investment trusts (REITs) and other equities rallied through the end of July.
As 2016 progressed and the economy continued to produce solid if unspectacular growth, investors once again began to anticipate higher rates. Although that expectation put pressure on REIT valuations, leading to a sharp correction over the next several months, REITs still finished the fiscal year in positive territory. Near the end of the fiscal period, on Dec. 14, 2016, with signs that economic growth was improving, the Fed did raise rates again.
During the period, REIT sectors characterized by shorter-duration leases, such as lodging, encountered some difficulty in conjunction with slowing corporate profits. Mall REITs also struggled amid more difficult business conditions for retailers. On the positive side, industrial REITs performed particularly well, as increased reliance on e-commerce has boosted demand for specialized warehouse and distribution facilities.
Stock selection among apartment REITs hampered the Series’ performance relative to the benchmark. In particular, our overweighting in Equity Residential weighed on results. Weakness in coastal markets led to a negative return well short of the sector’s overall performance. We continued to hold the shares in the Series’ portfolio, believing they were selling below the underlying real estate value and that management could close the gap.
Another weak-performing sector was freestanding retail, where our lack of exposure to Realty Income, the largest stock in the category, hurt performance. We chose instead to hold other freestanding REITs that we liked for their diversified property portfolios. Although these other names did add value, their contribution failed to compensate for our decision on Realty Income.
Stock selection among lodging REITs also weighed on relative performance. A significant overweighting in Host Hotels & Resorts detracted, as this stock lagged both the market and the overall lodging sector. In addition, within regional malls, relative overweightings in Simon Property Group and General Growth Properties hurt results. Both stocks were weak performers throughout the fiscal year, reflecting the ongoing struggles of retailers around the country. That said, we believe they are high-quality companies and appear likely to be good long-term investments.
As discussed earlier, industrial REITs enjoyed especially strong results during the fiscal year. Accordingly, the Series’ overweight in two such names, Duke Realty and First Industrial Realty Trust, added to relative performance.
Among healthcare REITs, Alexandria Real Estate Equities, an owner and operator of laboratory space for pharmaceutical and biotechnology companies, added value. In addition, a lack of investment in HCP, the owner of medical office buildings and senior housing facilities, was beneficial. We avoided the stock due to concerns about Medicare reimbursement rates and the company’s management. HCP shares declined during the period, significantly trailing the results of the average healthcare REIT.
The Series’ underweight on average in Public Storage also contributed to relative performance. Along with other self-storage REITs, shares of Public Storage struggled amid slowing cash flow growth and high equity valuations.
During the fiscal year, we followed the same management strategy that we follow in all market environments. We emphasized those areas of the REIT market that, in our view, would benefit from a strong fundamental backdrop and where we believed we saw attractive valuations. We likewise kept our focus on real estate companies with the potential to continue growing cash flow and to prudently raise capital.
We maintained the Series’ underweight in the healthcare sector, given our persistent concerns about the senior housing industry. As the period progressed, we also became more cautious about self-storage, given increased supply weighing on industry fundamentals. Meanwhile, we continued to overweight the industrial sector, drawn by its potential to benefit from continued strong demand for warehouse and distribution facilities.
At fiscal year end, we sought out opportunities in lodging and retail. In both sectors, various REITs have struggled, providing what we believed were favorable opportunities to invest in stocks we liked at more favorable prices. The inclusion of real estate as the 11th sector in the S&P 500® Index should help broaden awareness of real estate securities over time. In light of that and recent market volatility, we encourage investors to continue to view the real estate asset class as a potential long-term investment.
| Unless otherwise noted, views expressed herein are current as of Dec. 31, 2016, and subject to change. | ||
| REIT Series-1 |
Table of Contents
Delaware VIP® Trust — Delaware VIP REIT Series
The performance quoted represents past performance and does not guarantee future results. Investment return and principal value of an investment will fluctuate so that shares, when redeemed, may be worth more or less than their original cost. Current performance may be lower or higher than the performance quoted.
Carefully consider the Series’ investment objectives, risk factors, charges, and expenses before investing. This and other information can be found in the Series’ prospectus and its summary prospectus, which may be obtained by calling 800 523-1918. Investors should read the prospectus and the summary prospectus carefully before investing.
| Delaware VIP REIT Series | ||||||||||||
| Average annual total returns | ||||||||||||
| For periods ended Dec. 31, 2016 | 1 year | 3 years | 5 years | 10 years | Lifetime | |||||||
Standard Class shares (commenced operations on May 4, 1998) | +5.87% | +12.45% | +11.18% | +5.13% | +9.53% | |||||||
|
|
|
|
|
| |||||||
|
|
|
|
|
| |||||||
Service Class shares (commenced operations on May 1, 2000) | +5.62% | +12.18% | +10.90% | +4.87% | +10.68% | |||||||
|
|
|
|
|
| |||||||
|
|
|
|
|
| |||||||
FTSE NAREIT Equity REITs Index | +8.52% | +13.38% | +12.01% | +5.08% | n/a | |||||||
Returns reflect the reinvestment of all distributions. Please see page 3 for a description of the index.
As described in the Series’ most recent prospectus, the net expense ratio for Service Class shares of the Series was 1.09%, while total operating expenses for Standard Class and Service Class shares were 0.84% and 1.14%, respectively. The management fee for Standard Class and Service Class shares was 0.75%.
The Series’ distributor has contracted to limit the 12b-1 fees for Service Class shares to 0.25% of average daily net assets from Jan. 1, 2016 through Dec. 31, 2016.*
Earnings from a variable annuity or variable life investment compound tax-free until withdrawal, and as a result, no adjustments were made for income taxes.
Expense limitations were in effect for both classes during certain periods shown in the Series’ performance chart above and in the Performance of a $10,000 Investment graph on the next page.
Performance data do not reflect insurance fees related to a variable annuity or variable life investment or the deferred sales charge that would apply to certain withdrawals of investments held for fewer than eight years. Performance shown here would have been reduced if such fees were included and the expense limitation removed. For more information about fees, consult your variable annuity or variable life prospectus.
Investments in variable products involve risk.
Narrowly focused investments may exhibit higher volatility than investments in multiple industry sectors.
REIT investments are subject to many of the risks associated with direct real estate ownership, including changes in economic conditions, credit risk, and interest rate fluctuations.
A REIT fund’s tax status as a regulated investment company could be jeopardized if it holds real estate directly, as a result of defaults, or receives rental income from real estate holdings.
The Series may invest in derivatives, which may involve additional expenses and are subject to risk, including the risk that an underlying security or securities index moves in the opposite direction from what the portfolio manager anticipated. A derivative transaction depends upon the counterparties’ ability to fulfill their contractual obligations.
The Series may experience portfolio turnover in excess of 100%, which could result in higher transaction costs and tax liability.
Please read both the contract and underlying prospectus for specific details regarding the product’s risk profile.
*The aggregate contractual waiver period covering this report is from April 29, 2015 through May 1, 2017.
REIT Series-2
Table of Contents
Delaware VIP® REIT Series
Performance summary (continued)
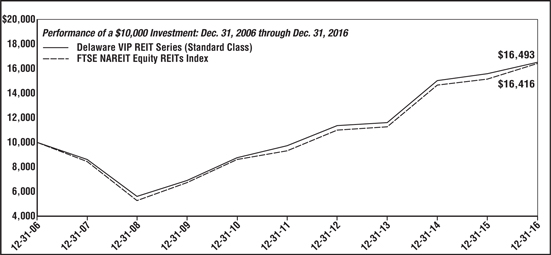
| For period beginning Dec. 31, 2006 through Dec. 31, 2016 | Starting value | Ending value | ||
-- Delaware VIP REIT Series (Standard Class) | $10,000 | $16,493 | ||
-- FTSE NAREIT Equity REITs Index | $10,000 | $16,416 |
The chart shows a $10,000 investment in the Delaware VIP REIT Series Standard Class shares for the period from Dec. 31, 2006 through Dec. 31, 2016.
The chart also shows $10,000 invested in the FTSE NAREIT Equity REITs Index for the period from Dec. 31, 2006 through Dec. 31, 2016. The FTSE NAREIT Equity REITs Index measures the performance of all publicly traded equity real estate investment trusts (REITs) traded on U.S. exchanges, excluding timber and infrastructure REITs.
The S&P 500 Index, mentioned on page 1, measures the performance of 500 mostly large-cap stocks weighted by market value, and is often used to represent performance of the U.S. stock market.
Index performance returns do not reflect any management fees, transaction costs or expenses. Indices are unmanaged and one cannot invest directly in an index.
Performance of Service Class shares will vary due to different charges and expenses.
Past performance is not a guarantee of future results.
| REIT Series-3 |
Table of Contents
Delaware VIP® Trust — Delaware VIP REIT Series
For the six-month period from July 1, 2016 to December 31, 2016 (Unaudited)
As a shareholder of the Series, you incur ongoing costs, which may include management fees; distribution and/or service (12b-1) fees; and other Series expenses. This example is intended to help you understand your ongoing costs (in dollars) of investing in the Series and to compare these costs with the ongoing costs of investing in other mutual funds.
The example is based on an investment of $1,000 invested at the beginning of the period and held for the entire six-month period from July 1, 2016 to Dec. 31, 2016.
Actual expenses
The first section of the table shown, “Actual Series return,” provides information about actual account values and actual expenses. You may use the information in this section of the table, together with the amount you invested, to estimate the expenses that you paid over the period. Simply divide your account value by $1,000 (for example, an $8,600 account value divided by $1,000 = 8.6), then multiply the result by the number in the first section under the heading entitled “Expenses Paid During Period” to estimate the expenses you paid on your account during the period.
Hypothetical example for comparison purposes
The second section of the table shown, “Hypothetical 5% return,” provides information about hypothetical account values and hypothetical expenses based on the Series’ actual expense ratio and an assumed rate of return of 5% per year before expenses, which is not the Series’ actual return. The hypothetical account values and expenses may not be used to estimate the actual ending account balance or expenses you paid for the period. You may use this information to compare the ongoing costs of investing in the Series and other funds. To do so, compare this 5% hypothetical example with the 5% hypothetical examples that appear in the shareholder reports of other funds.
Please note that the expenses shown in the table are meant to highlight your ongoing costs only. As a shareholder of the Series, you do not incur any transaction costs, such as sales charges (loads), redemption fees or exchange fees, but shareholders of other funds may incur such costs. Also, the fees related to the variable annuity investment or the deferred sales charge that could apply have not been included. Therefore, the second section of the table is useful in comparing ongoing costs only, and will not help you determine the relative total costs of owning different funds. The Series’ actual expenses shown in the table reflect fee waivers in effect for Service Class shares. The expenses shown in the table assume reinvestment of all dividends and distributions.
Expense analysis of an investment of $1,000
| Beginning Account Value 7/1/16 | Ending Account Value 12/31/16 | Annualized Expense Ratio | Expenses Paid During Period 7/1/16 to 12/31/16* | |||||||||||||
Actual Series return† |
| |||||||||||||||
Standard Class | $1,000.00 | $ 958.10 | 0.82 | % | $4.04 | |||||||||||
Service Class | 1,000.00 | 956.90 | 1.07 | % | 5.26 | |||||||||||
Hypothetical 5% return (5% return before expenses) |
| |||||||||||||||
Standard Class | $1,000.00 | $1,021.01 | 0.82 | % | $4.17 | |||||||||||
Service Class | 1,000.00 | 1,019.76 | 1.07 | % | 5.43 | |||||||||||
| * | “Expenses Paid During Period” are equal to the Series’ annualized expense ratio, multiplied by the average account value over the period, multiplied by 184/366 (to reflect the one-half year period). |
| † | Because actual returns reflect only the most recent six-month period, the returns shown may differ significantly from fiscal year returns. |
REIT Series-4
Table of Contents
Delaware VIP® Trust — Delaware VIP REIT Series
Security type / sector allocation and top 10 equity holdings
As of December 31, 2016 (Unaudited)
Sector designations may be different than the sector designations presented in other Series materials. The sector designations may represent the investment manager’s internal sector classifications.
| Security type / sector | Percentage of net assets | |||
Convertible Bond | 0.06% | |||
Common Stock | 95.93% | |||
Diversified REITs | 7.73% | |||
Healthcare REITs | 8.86% | |||
Healthcare Services | 0.78% | |||
Hotel REITs | 4.78% | |||
Industrial REITs | 6.69% | |||
Information Technology REITs | 8.13% | |||
Mall REITs | 11.33% | |||
Manufactured Housing REIT | 1.31% | |||
Multifamily REITs | 15.49% | |||
Office REITs | 9.47% | |||
Office/Industrial REIT | 2.24% | |||
Self-Storage REITs | 5.12% | |||
Shopping Center REITs | 9.78% | |||
Single Tenant REITs | 4.22% | |||
Short-Term Investments | 3.23% | |||
Total Value of Securities | 99.22% | |||
Receivables and Other Assets Net of Liabilities | 0.78% | |||
Total Net Assets | 100.00% | |||
Holdings are for informational purposes only and are subject to change at any time. They are not a recommendation to buy, sell, or hold any security.
| Top 10 equity holdings | Percentage of net assets | |||
Simon Property Group | 7.25% | |||
Equinix | 4.57% | |||
Vornado Realty Trust | 4.23% | |||
Equity Residential | 4.19% | |||
Prologis | 3.78% | |||
Public Storage | 3.77% | |||
AvalonBay Communities | 3.73% | |||
Host Hotels & Resorts | 3.26% | |||
General Growth Properties | 2.86% | |||
Welltower
|
| 2.73%
|
| |
REIT Series-5
Table of Contents
Delaware VIP® Trust — Delaware VIP REIT Series
December 31, 2016
| Principal amount° | Value (U.S. $) | |||||||
Convertible Bond – 0.06% |
| |||||||
VEREIT 3.75% exercise price $14.99,maturity date 12/15/20 | 284,000 | $ | 284,534 | |||||
|
| |||||||
Total Convertible Bond | 284,534 | |||||||
|
| |||||||
| Number of shares | ||||||||
Common Stock – 95.93% |
| |||||||
Diversified REITs – 7.73% |
| |||||||
EPR Properties | 76,475 | 5,488,611 | ||||||
Gramercy Property Trust | 356,725 | 3,274,735 | ||||||
Vornado Realty Trust | 195,993 | 20,455,789 | ||||||
Washington Real Estate Investment Trust | 248,363 | 8,118,986 | ||||||
|
| |||||||
| 37,338,121 | ||||||||
|
| |||||||
Healthcare REITs – 8.86% |
| |||||||
Alexandria Real Estate Equities | 70,158 | 7,796,658 | ||||||
HCP | 324,725 | 9,650,827 | ||||||
Healthcare Realty Trust | 175,750 | 5,328,740 | ||||||
National Health Investors | 92,400 | 6,853,308 | ||||||
Welltower | 196,720 | 13,166,470 | ||||||
|
| |||||||
| 42,796,003 | ||||||||
|
| |||||||
Healthcare Services – 0.78% |
| |||||||
Brookdale Senior Living † | 302,725 | 3,759,845 | ||||||
|
| |||||||
| 3,759,845 | ||||||||
|
| |||||||
Hotel REITs – 4.78% |
| |||||||
Host Hotels & Resorts | 837,268 | 15,774,129 | ||||||
Sunstone Hotel Investors | 480,851 | 7,332,978 | ||||||
|
| |||||||
| 23,107,107 | ||||||||
|
| |||||||
Industrial REITs – 6.69% |
| |||||||
DCT Industrial Trust | 117,941 | 5,647,015 | ||||||
First Industrial Realty Trust | 300,200 | 8,420,610 | ||||||
Prologis | 346,122 | 18,271,780 | ||||||
|
| |||||||
| 32,339,405 | ||||||||
|
| |||||||
Information Technology REITs – 8.13% |
| |||||||
Crown Castle International | 83,925 | 7,282,172 | ||||||
Digital Realty Trust | 100,550 | 9,880,043 | ||||||
Equinix | 61,825 | 22,096,873 | ||||||
|
| |||||||
| 39,259,088 | ||||||||
|
| |||||||
Mall REITs – 11.33% |
| |||||||
General Growth Properties | 553,011 | 13,814,215 | ||||||
Simon Property Group | 197,028 | 35,005,965 | ||||||
Taubman Centers | 79,875 | 5,905,159 | ||||||
|
| |||||||
| 54,725,339 | ||||||||
|
| |||||||
Manufactured Housing REIT – 1.31% |
| |||||||
Equity LifeStyle Properties | 88,053 | 6,348,621 | ||||||
|
| |||||||
| 6,348,621 | ||||||||
|
| |||||||
Multifamily REITs – 15.49% |
| |||||||
American Campus Communities | 137,350 | 6,835,909 | ||||||
Apartment Investment & Management | 276,675 | 12,574,879 | ||||||
| Number of shares | Value (U.S. $) | |||||||
Common Stock (continued) | ||||||||
Multifamily REITs (continued) | ||||||||
AvalonBay Communities | 101,739 | $ | 18,023,064 | |||||
Equity Residential | 314,275 | 20,226,739 | ||||||
Essex Property Trust | 24,170 | 5,619,525 | ||||||
UDR | 317,350 | 11,576,928 | ||||||
|
| |||||||
| 74,857,044 | ||||||||
|
| |||||||
Office REITs – 9.47% |
| |||||||
Boston Properties | 37,890 | 4,765,804 | ||||||
Brandywine Realty Trust | 398,517 | 6,579,516 | ||||||
Empire State Realty Trust | 350,175 | 7,070,033 | ||||||
Equity Commonwealth † | 176,750 | 5,344,920 | ||||||
Hudson Pacific Properties | 161,261 | 5,608,658 | ||||||
Kilroy Realty | 94,200 | 6,897,324 | ||||||
Mack-Cali Realty | 248,600 | 7,214,372 | ||||||
SL Green Realty | 21,243 | 2,284,685 | ||||||
|
| |||||||
| 45,765,312 | ||||||||
|
| |||||||
Office/Industrial REIT – 2.24% |
| |||||||
Duke Realty | 406,850 | 10,805,936 | ||||||
|
| |||||||
| 10,805,936 | ||||||||
|
| |||||||
Self-Storage REITs – 5.12% |
| |||||||
CubeSmart | 188,495 | 5,046,011 | ||||||
Extra Space Storage | 18,900 | 1,459,836 | ||||||
Public Storage | 81,586 | 18,234,471 | ||||||
|
| |||||||
| 24,740,318 | ||||||||
|
| |||||||
Shopping Center REITs – 9.78% |
| |||||||
Brixmor Property Group | 319,500 | 7,802,190 | ||||||
DDR | 379,382 | 5,793,163 | ||||||
Equity One | 336,075 | 10,314,142 | ||||||
Kimco Realty | 198,690 | 4,999,040 | ||||||
Regency Centers | 84,914 | 5,854,820 | ||||||
Retail Properties of America | 304,050 | 4,661,087 | ||||||
Urban Edge Properties | 284,700 | 7,832,097 | ||||||
|
| |||||||
| 47,256,539 | ||||||||
|
| |||||||
Single Tenant REITs – 4.22% |
| |||||||
National Retail Properties | 165,050 | 7,295,210 | ||||||
Spirit Realty Capital | 533,107 | 5,789,542 | ||||||
STORE Capital | 295,700 | 7,306,747 | ||||||
|
| |||||||
| 20,391,499 | ||||||||
|
| |||||||
Total Common Stock | 463,490,177 | |||||||
|
| |||||||
| Principal amount° | ||||||||
Short-Term Investments – 3.23% |
| |||||||
Discount Notes – 1.18% ≠ |
| |||||||
Federal Home Loan Bank | ||||||||
0.47% 1/25/17 | 5,354,857 | 5,353,647 | ||||||
0.483% 1/30/17 | 163,854 | 163,808 | ||||||
0.499% 2/15/17 | 40,964 | 40,940 | ||||||
REIT Series-6
Table of Contents
Delaware VIP® REIT Series
Schedule of investments (continued)
| Principal amount° | Value (U.S. $) | |||||||
Short-Term Investments (continued) |
| |||||||
Discount Notes≠ (continued) | ||||||||
Federal Home Loan Bank 0.501% 2/6/17 | 122,891 | $ | 122,834 | |||||
|
| |||||||
| 5,681,229 | ||||||||
|
| |||||||
Repurchase Agreements – 2.05% | ||||||||
Bank of America Merrill Lynch 0.41%, dated 12/30/16, to be repurchased on 1/3/17, repurchase price $3,344,359 (collateralized by U.S. government obligations 2.00% 8/15/25; market value $3,411,091) | 3,344,207 | 3,344,207 | ||||||
Bank of Montreal | 3,901,575 | 3,901,574 | ||||||
| Principal amount° | Value (U.S. $) | |||||||
Short-Term Investments (continued) | ||||||||
Repurchase Agreements (continued) | ||||||||
BNP Paribas 0.48%, dated 12/30/16, to be repurchased on 1/3/17, repurchase price $2,671,361 (collateralized by U.S. government obligations 2.125% 12/31/22; market value $2,724,644) | 2,671,219 | $ | 2,671,219 | |||||
|
| |||||||
| 9,917,000 | ||||||||
|
| |||||||
Total Short-Term Investments |
| 15,598,229 | ||||||
|
| |||||||
Total Value of Securities – 99.22% | $ | 479,372,940 | ||
|
|
≠The rate shown is the effective yield at the time of purchase.
°Principal amount shown is stated in U.S. dollars unless noted that the security is denominated in another currency.
†Non-income-producing security.
REIT – Real Estate Investment Trust
See accompanying notes, which are an integral part of the financial statements.
REIT Series-7
Table of Contents
| Delaware VIP® Trust — Delaware VIP REIT Series | ||||
| Statement of assets and liabilities | December 31, 2016 | |||
Assets: | ||||
Investments, at value1 | $ | 463,774,711 | ||
Short-term investments, at value2 | 15,598,229 | |||
Cash | 508,203 | |||
Receivable for securities sold | 2,475,275 | |||
Dividends and interest receivable | 2,223,421 | |||
Receivable for series shares sold | 74,270 | |||
|
| |||
Total assets | 484,654,109 | |||
|
| |||
Liabilities: | ||||
Payable for securities purchased | 589,164 | |||
Payable for series shares redeemed | 488,472 | |||
Investment management fees payable to affiliates | 301,569 | |||
Other accrued expenses | 74,885 | |||
Distribution fees payable to affiliates | 48,084 | |||
Dividend disbursing and transfer agent fees and expenses payable to affiliates | 3,016 | |||
Accounting and administration expenses payable to affiliates | 1,891 | |||
Trustees’ fees and expenses payable to affiliates | 1,156 | |||
Legal fees payable to affiliates | 845 | |||
Reports and statements to shareholders expenses payable to affiliates | 427 | |||
|
| |||
Total liabilities | 1,509,509 | |||
|
| |||
Total Net Assets | $ | 483,144,600 | ||
|
| |||
Net Assets Consist of: | ||||
Paid-in capital | $ | 412,706,218 | ||
Undistributed net investment income | 6,808,445 | |||
Accumulated net realized gain on investments | 55,340,070 | |||
Net unrealized appreciation of investments | 8,289,867 | |||
|
| |||
Total Net Assets | $ | 483,144,600 | ||
|
| |||
Net Asset Value: | ||||
Standard Class: | ||||
Net assets | $ | 251,083,254 | ||
Shares of beneficial interest outstanding, unlimited authorization, no par | 16,127,028 | |||
Net asset value per share | $ | 15.57 | ||
Service Class: | ||||
Net assets | $ | 232,061,346 | ||
Shares of beneficial interest outstanding, unlimited authorization, no par | 14,937,720 | |||
Net asset value per share | $ | 15.54 | ||
| ||||
1Investments, at cost | $ | 455,485,413 | ||
2Short-term investments, at cost | 15,597,660 | |||
See accompanying notes, which are an integral part of the financial statements.
REIT Series-8
Table of Contents
Delaware VIP® Trust —
Delaware VIP REIT Series
Year ended December 31, 2016
Investment Income: | ||||
Dividends | $ | 10,618,989 | ||
Interest | 221,422 | |||
|
| |||
| 10,840,411 | ||||
|
| |||
Expenses: | ||||
Management fees | 3,662,585 | |||
Distribution expenses – Service Class | 714,889 | |||
Accounting and administration expenses | 156,660 | |||
Reports and statements to shareholders expenses | 70,688 | |||
Dividend disbursing and transfer agent fees and expenses | 41,719 | |||
Audit and tax fees | 34,452 | |||
Legal fees | 27,760 | |||
Trustees’ fees and expenses | 24,290 | |||
Custodian fees | 21,833 | |||
Registration fees | 872 | |||
Other | 14,039 | |||
|
| |||
| 4,769,787 | ||||
Less waived distribution expenses – Service Class | (119,148 | ) | ||
|
| |||
Total operating expenses | 4,650,639 | |||
|
| |||
Net Investment Income | 6,189,772 | |||
|
| |||
Net Realized and Unrealized Gain: | ||||
Net realized gain on: | ||||
Investments | 60,176,402 | |||
Options written | 129,790 | |||
|
| |||
Net realized gain | 60,306,192 | |||
|
| |||
Net change in unrealized appreciation (depreciation) of investments | (39,477,985 | ) | ||
|
| |||
Net Realized and Unrealized Gain | 20,828,207 | |||
|
| |||
Net Increase in Net Assets Resulting from Operations | $ | 27,017,979 | ||
|
| |||
Delaware VIP Trust —
Delaware VIP REIT Series
Statements of changes in net assets
| Year ended | ||||||||
| 12/31/16 | 12/31/15 | |||||||
Increase (Decrease) in Net Assets from Operations: | ||||||||
Net investment income | $ | 6,189,772 | $ | 5,981,129 | ||||
Net realized gain | 60,306,192 | 43,445,286 | ||||||
Net change in unrealized appreciation (depreciation) | (39,477,985 | ) | (33,412,258 | ) | ||||
|
|
|
| |||||
Net increase in net assets resulting from operations | 27,017,979 | 16,014,157 | ||||||
|
|
|
| |||||
Dividends and Distributions to Shareholders from: | ||||||||
Net investment income: | ||||||||
Standard Class | (3,173,253 | ) | (3,142,659 | ) | ||||
Service Class | (2,494,399 | ) | (2,450,241 | ) | ||||
Net realized gain: | ||||||||
Standard Class | (15,210,259 | ) | — | |||||
Service Class | (14,715,477 | ) | — | |||||
|
|
|
| |||||
| (35,593,388 | ) | (5,592,900 | ) | |||||
|
|
|
| |||||
Capital Share Transactions: | ||||||||
Proceeds from shares sold: | ||||||||
Standard Class | 16,237,473 | 18,864,753 | ||||||
Service Class | 21,238,794 | 20,431,862 | ||||||
Net asset value of shares issued upon reinvestment of dividends and distributions: | ||||||||
Standard Class | 18,383,512 | 3,142,659 | ||||||
Service Class | 17,209,876 | 2,450,241 | ||||||
|
|
|
| |||||
| 73,069,655 | 44,889,515 | |||||||
|
|
|
| |||||
Cost of shares redeemed: | ||||||||
Standard Class | (23,555,980 | ) | (42,778,685 | ) | ||||
Service Class | (40,514,599 | ) | (41,736,004 | ) | ||||
|
|
|
| |||||
| (64,070,579 | ) | (84,514,689 | ) | |||||
|
|
|
| |||||
Increase (decrease) in net assets derived from capital share transactions | 8,999,076 | (39,625,174 | ) | |||||
|
|
|
| |||||
Net Increase (Decrease) in Net Assets | 423,667 | (29,203,917 | ) | |||||
Net Assets: | ||||||||
Beginning of year | 482,720,933 | 511,924,850 | ||||||
|
|
|
| |||||
End of year | $ | 483,144,600 | $ | 482,720,933 | ||||
|
|
|
| |||||
Undistributed net investment income | $ | 6,808,445 | $ | 6,286,325 | ||||
|
|
|
| |||||
See accompanying notes, which are an integral part of the financial statements.
| REIT Series-9 |
Table of Contents
Delaware VIP® Trust — Delaware VIP REIT Series
Selected data for each share of the Series outstanding throughout each period were as follows:
| Delaware VIP REIT Series Standard Class | ||||||||||||||||||||
| Year ended | ||||||||||||||||||||
| 12/31/16 | 12/31/15 | 12/31/14 | 12/31/13 | 12/31/12 | ||||||||||||||||
Net asset value, beginning of period | $ | 15.890 | $ | 15.500 | $ | 12.140 | $ | 12.060 | $ | 10.470 | ||||||||||
Income from investment operations: | ||||||||||||||||||||
Net investment income1 | 0.217 | 0.205 | 0.195 | 0.180 | 0.189 | |||||||||||||||
Net realized and unrealized gain | 0.668 | 0.373 | 3.353 | 0.095 | 1.576 | |||||||||||||||
|
|
|
|
|
|
|
|
|
| |||||||||||
Total from investment operations | 0.885 | 0.578 | 3.548 | 0.275 | 1.765 | |||||||||||||||
|
|
|
|
|
|
|
|
|
| |||||||||||
Less dividends and distributions from: | ||||||||||||||||||||
Net investment income | (0.208 | ) | (0.188 | ) | (0.188 | ) | (0.195 | ) | (0.175 | ) | ||||||||||
Net realized gain | (0.997 | ) | — | — | — | — | ||||||||||||||
|
|
|
|
|
|
|
|
|
| |||||||||||
Total dividends and distributions | (1.205 | ) | (0.188 | ) | (0.188 | ) | (0.195 | ) | (0.175 | ) | ||||||||||
|
|
|
|
|
|
|
|
|
| |||||||||||
Net asset value, end of period | $ | 15.570 | $ | 15.890 | $ | 15.500 | $ | 12.140 | $ | 12.060 | ||||||||||
|
|
|
|
|
|
|
|
|
| |||||||||||
Total return2 | 5.87 | % | 3.75 | % | 29.46 | % | 2.14 | % | 16.94 | % | ||||||||||
Ratios and supplemental data: | ||||||||||||||||||||
Net assets, end of period (000 omitted) | $ | 251,083 | $ | 244,618 | $ | 260,182 | $ | 198,950 | $ | 210,618 | ||||||||||
Ratio of expenses to average net assets | 0.83 | % | 0.85 | % | 0.84 | % | 0.84 | % | 0.84 | % | ||||||||||
Ratio of net investment income to average net assets | 1.39 | % | 1.32 | % | 1.41 | % | 1.42 | % | 1.64 | % | ||||||||||
Portfolio turnover | 130 | % | 75 | % | 84 | % | 97 | % | 91 | % | ||||||||||
| 1 | The average shares outstanding method has been applied for per share information. |
| 2 | Total investment return is based on the change in net asset value of a share during the period and assumes reinvestment of dividends and distributions at net asset value. Total investment return does not include fees, charges, or expenses imposed by the variable annuity and life insurance contracts for which Delaware VIP Trust serves as an underlying investment vehicle. |
See accompanying notes, which are an integral part of the financial statements.
REIT Series-10
Table of Contents
Delaware VIP® REIT Series
Financial highlights (continued)
Selected data for each share of the Series outstanding throughout each period were as follows:
| Delaware VIP REIT Series Service Class | ||||||||||||||||||||
| Year ended | ||||||||||||||||||||
| 12/31/16 | 12/31/15 | 12/31/14 | 12/31/13 | 12/31/12 | ||||||||||||||||
Net asset value, beginning of period | $ 15.860 | $ 15.470 | $ 12.120 | $ 12.040 | $ 10.460 | |||||||||||||||
Income from investment operations: | ||||||||||||||||||||
Net investment income1 | 0.178 | 0.166 | 0.160 | 0.148 | 0.160 | |||||||||||||||
Net realized and unrealized gain | 0.668 | 0.377 | 3.346 | 0.098 | 1.570 | |||||||||||||||
|
|
|
|
|
|
|
|
|
| |||||||||||
Total from investment operations | 0.846 | 0.543 | 3.506 | 0.246 | 1.730 | |||||||||||||||
|
|
|
|
|
|
|
|
|
| |||||||||||
Less dividends and distributions from: | ||||||||||||||||||||
Net investment income | (0.169) | (0.153) | (0.156) | (0.166) | (0.150) | |||||||||||||||
Net realized gain | (0.997) | — | — | — | — | |||||||||||||||
|
|
|
|
|
|
|
|
|
| |||||||||||
Total dividends and distributions | (1.166) | (0.153) | (0.156) | (0.166) | (0.150) | |||||||||||||||
|
|
|
|
|
|
|
|
|
| |||||||||||
Net asset value, end of period | $ 15.540 | $ 15.860 | $ 15.470 | $ 12.120 | $ 12.040 | |||||||||||||||
|
|
|
|
|
|
|
|
|
| |||||||||||
Total return2 | 5.62% | 3.52% | 29.12% | 1.92% | 16.61% | |||||||||||||||
Ratios and supplemental data: | ||||||||||||||||||||
Net assets, end of period (000 omitted) | $232,062 | $238,103 | $251,743 | $198,530 | $209,023 | |||||||||||||||
Ratio of expenses to average net assets | 1.08% | 1.10% | 1.09% | 1.09% | 1.09% | |||||||||||||||
Ratio of expenses to average net assets prior to fees waived | 1.13% | 1.15% | 1.14% | 1.14% | 1.14% | |||||||||||||||
Ratio of net investment income to average net assets | 1.14% | 1.07% | 1.16% | 1.17% | 1.39% | |||||||||||||||
Ratio of net investment income to average net assets prior to fees waived | 1.09% | 1.02% | 1.11% | 1.12% | 1.34% | |||||||||||||||
Portfolio turnover | 130% | 75% | 84% | 97% | 91% | |||||||||||||||
| 1 | The average shares outstanding method has been applied for per share information. |
| 2 | Total investment return is based on the change in net asset value of a share during the period and assumes reinvestment of dividends and distributions at net asset value. Total investment return during all of the periods shown reflects a waiver by the distributor. Performance would have been lower had the waiver not been in effect. Total investment return does not include fees, charges, or expenses imposed by the variable annuity and life insurance contracts for which Delaware VIP Trust serves as an underlying investment vehicle. |
See accompanying notes, which are an integral part of the financial statements.
| REIT Series-11 |
Table of Contents
Delaware VIP® Trust — Delaware VIP REIT Series
December 31, 2016
Delaware VIP Trust (Trust) is organized as a Delaware statutory trust and offers 10 series: Delaware VIP Diversified Income Series, Delaware VIP Emerging Markets Series, Delaware VIP High Yield Series, Delaware VIP International Value Equity Series, Delaware VIP Limited-Term Diversified Income Series, Delaware VIP REIT Series, Delaware VIP Small Cap Value Series, Delaware VIP Smid Cap Growth Series, Delaware VIP U.S. Growth Series, and Delaware VIP Value Series. These financial statements and the related notes pertain to Delaware VIP REIT Series (Series). The Trust is an open-end investment company. The Series is considered diversified under the Investment Company Act of 1940, as amended, and offers Standard Class and Service Class shares. The Standard Class shares do not carry a 12b-1 fee and the Service Class shares carry a 12b-1 fee. The shares of the Series are sold only to separate accounts of life insurance companies.
The investment objectives of the Series are to seek maximum long-term total return, with capital appreciation as a secondary objective.
1. Significant Accounting Policies
The following accounting policies are in accordance with U.S. generally accepted accounting principles (U.S. GAAP) and are consistently followed by the Series.
Security Valuation—Equity securities, except those traded on the Nasdaq Stock Market LLC (Nasdaq), are valued at the last quoted sales price as of the time of the regular close of the New York Stock Exchange on the valuation date. Equity securities traded on the Nasdaq are valued in accordance with the Nasdaq Official Closing Price, which may not be the last sales price. If, on a particular day, an equity security does not trade, the mean between the bid and ask prices will be used, which approximates fair value. U.S. government and agency securities are valued at the mean between the bid and ask prices, which approximates fair value. Debt securities are valued based upon valuations provided by an independent pricing service and reviewed by management. Exchange-traded options are valued at the last reported sale price or, if no sales are reported, at the mean between the last reported bid and ask prices, which approximates fair value. Generally, other securities and assets for which market quotations are not readily available are valued at fair value as determined in good faith under the direction of the Trust’s Board of Trustees (Board). In determining whether market quotations are readily available or fair valuation will be used, various factors will be taken into consideration, such as market closures or suspension of trading in a security.
Federal Income Taxes—No provision for federal income taxes has been made as the Series intends to continue to qualify for federal income tax purposes as a regulated investment company under Subchapter M of the Internal Revenue Code of 1986, as amended, and make the requisite distributions to shareholders. The Series evaluates tax positions taken or expected to be taken in the course of preparing the Series’ tax returns to determine whether the tax positions are “more-likely-than-not” of being sustained by the applicable tax authority. Tax positions not deemed to meet the “more-likely-than-not” threshold are recorded as a tax benefit or expense in the current year. Management has analyzed the Series’ tax positions taken for all open federal income tax years (Dec. 31, 2013–Dec. 31, 2016), and has concluded that no provision for federal income tax is required in the Series’ financial statements.
Class Accounting—Investment income, common expenses, and realized and unrealized gain (loss) on investments are allocated to the classes of the Series on the basis of daily net assets of each class. Distribution expenses relating to a specific class are charged directly to that class.
Repurchase Agreements—The Series may purchase certain U.S. government securities subject to the counterparty’s agreement to repurchase them at an agreed upon date and price. The counterparty will be required on a daily basis to maintain the value of the collateral subject to the agreement at not less than the repurchase price (including accrued interest). The agreements are conditioned upon the collateral being deposited under the Federal Reserve book-entry system with the Series’ custodian or a third party sub-custodian. In the event of default or bankruptcy by the other party to the agreement, retention of the collateral may be subject to legal proceedings. All open repurchase agreements as of the date of this report were entered into on Dec. 30, 2016 and matured on the next business day.
Use of Estimates—The Series is an investment company, whose financial statements are prepared in conformity with U.S. GAAP. Therefore, the Series follows the accounting and reporting guidelines for investment companies. The preparation of financial statements in conformity with U.S. GAAP requires management to make estimates and assumptions that affect the fair value of investments, the reported amounts of assets and liabilities and disclosure of contingent assets and liabilities at the date of the financial statements, and the reported amounts of revenues and expenses during the reporting period. Actual results could differ from those estimates and the differences could be material.
Other—Expenses directly attributable to the Series are charged directly to the Series. Other expenses common to various funds within the Delaware Investments® Family of Funds are generally allocated among such funds on the basis of average net assets. Management fees and certain other expenses are paid monthly. Security transactions are recorded on the date the securities are purchased or sold (trade date) for financial reporting purposes. Costs used in calculating realized gains and losses on the sale of investment securities are those of the specific securities sold. Dividend income is recorded on the ex-dividend date and interest income is recorded on the accrual basis. Discounts and premiums on debt securities are accreted or amortized to interest income, respectively, over the lives of the respective securities using the effective interest method. Distributions received from investments in real estate investment trusts (REITs) are recorded as dividend income on the ex-dividend date, subject to reclassification upon notice of the character of such distributions by the issuer. The Series declares and pays dividends from net investment income and distributions from net realized gain on investments, if any, following the close of the fiscal year. The Series may distribute more frequently, if necessary for tax purposes. Dividends and distributions, if any, are recorded on the ex-dividend date.
REIT Series-12
Table of Contents
Delaware VIP® REIT Series
Notes to financial statements (continued)
1. Significant Accounting Policies (continued)
Subject to seeking best execution, the Series may direct certain security trades to brokers who have agreed to rebate a portion of the related brokerage commission to the Series in cash. In general, best execution refers to many factors, including the price paid or received for a security, the commission charged, the promptness and reliability of execution, the confidentiality and placement accorded the order, and other factors affecting the overall benefit obtained by the Series on the transaction. There were no commission rebates for the year ended Dec. 31, 2016.
The Series may receive earnings credits from its custodian when positive cash balances are maintained, which may be used to offset custody fees. There were no such earnings credits for the year ended Dec. 31, 2016.
The Series receives earnings credits from its transfer agent when positive cash balances are maintained, which may be used to offset transfer agent fees. If the amount earned is greater than $1.00, the expense paid under this arrangement is included on the “Statement of operations” under “Dividend disbursing and transfer agent fees and expenses” with the corresponding expense offset shown under “Less expense paid indirectly.” There were no such earnings credits for the year ended Dec. 31, 2016.
2. Investment Management, Administration Agreements, and Other Transactions with Affiliates
In accordance with the terms of its investment management agreement, the Series pays Delaware Management Company (DMC), a series of Delaware Management Business Trust and the investment manager, an annual fee which is calculated daily at the rate of 0.75% on the first $500 million of average daily net assets of the Series, 0.70% on the next $500 million, 0.65% on the next $1.5 billion, and 0.60% on average daily net assets in excess of $2.5 billion.
Delaware Investments Fund Services Company (DIFSC), an affiliate of DMC, provides fund accounting and financial administration oversight services to the Series. For these services, DIFSC’s fees are calculated based on the aggregate daily net assets of the Delaware Investments® Family of Funds at the following annual rate:0.0050% of the first $30 billion;0.0045% of the next $10 billion; 0.0040% of the next $10 billion; and 0.0025% of aggregate average daily net assets in excess of $50 billion. The fees payable to DIFSC under the service agreement described above are allocated among all funds in the Delaware Investments Family of Funds on a relative net asset value (NAV) basis. For the year ended Dec. 31, 2016, the Series was charged $23,127 for these services. This amount is included on the “Statement of operations” under “Accounting and administration expenses.”
DIFSC is also the transfer agent and dividend disbursing agent of the Series. For these services, DIFSC’s fees are calculated at the annual rate of 0.0075% of the Series’ average daily net assets. This amount is included on the “Statement of operations” under “Dividend disbursing and transfer agent fees and expenses.” For the year ended Dec. 31, 2016, the Series was charged $36,655 for these services. Pursuant to a sub-transfer agency agreement between DIFSC and BNY Mellon Investment Servicing (US) Inc. (BNYMIS), BNYMIS provides certain sub-transfer agency services to the Series. Sub-transfer agency fees are paid by the Series and are also included on the “Statement of operations” under “Dividend disbursing and transfer agent fees and expenses.”
Pursuant to a distribution agreement and distribution plan, the Series pays Delaware Distributors, L.P. (DDLP), the distributor and an affiliate of DMC, an annual distribution and service fee of 0.30% of the average daily net assets of the Service Class shares. DDLP has contracted to waive distribution and service fee from Jan. 1, 2016 to Dec. 31, 2016,* in order to limit distribution and service fee of the Service Class shares to 0.25% of average daily net assets. Standard Class shares pay no distribution and service expenses.
As provided in the investment management agreement, the Series bears a portion of the cost of resources shared with DMC, including the cost of internal personnel of DMC and/or its affiliates that provide legal, tax, and regulatory reporting services to the Series. For the year ended Dec. 31, 2016, the Series was charged $10,289 for internal legal, tax, and regulatory reporting services provided by DMC and/or its affiliates’ employees. This amount is included on the “Statement of operations” under “Legal fees.”
Trustees’ fees include expenses accrued by the Series for each Trustee’s retainer and meeting fees. Certain officers of DMC, DIFSC, and DDLP are officers and/or Trustees of the Trust. These officers and Trustees are paid no compensation by the Series.
Cross trades for the year ended Dec. 31, 2016, were executed by the Series pursuant to procedures adopted by the Board designed to ensure compliance with Rule 17a-7 under the 1940 Act. Cross trading is the buying or selling of portfolio securities between funds of investment companies, or between a fund of an investment company and another entity, that are or could be considered affiliates by virtue of having a common investment advisor (or affiliated investment advisors), common directors/trustees and/or common officers. At its regularly scheduled meetings, the Board reviews such transactions for compliance with the procedures adopted by the Board. Pursuant to these procedures, for the year ended Dec. 31, 2016, the Series engaged in securities sales of $11,855,495, which resulted in net realized losses of $(29).
*The aggregate contractual waiver period covering this report is from April 29, 2015 through May 1, 2017.
3. Investments
For the year ended Dec. 31, 2016, the Series made purchases and sales of investment securities other than short-term investments as follows:
Purchases | $ | 606,452,284 | ||
Sales | 627,958,702 |
REIT Series-13
Table of Contents
Delaware VIP® REIT Series
Notes to financial statements (continued)
3. Investments (continued)
At Dec. 31, 2016, the cost and unrealized appreciation (depreciation) of investments for federal income tax purposes were as follows:
| Cost of Investments | Aggregate Unrealized Appreciation of Investments | Aggregate Unrealized Depreciation of Investments | Net Unrealized Appreciation of Investments | |||||||||||||||
$478,468,819 | $19,287,676 | $ | (18,383,555 | ) | $ | 904,121 | ||||||||||||
U.S. GAAP defines fair value as the price that the Series would receive to sell an asset or pay to transfer a liability in an orderly transaction between market participants at the measurement date under current market conditions. A three-level hierarchy for fair value measurements has been established based upon the transparency of inputs to the valuation of an asset or liability. Inputs may be observable or unobservable and refer broadly to the assumptions that market participants would use in pricing the asset or liability. Observable inputs reflect the assumptions market participants would use in pricing the asset or liability based on market data obtained from sources independent of the reporting entity. Unobservable inputs reflect the reporting entity’s own assumptions about the assumptions that market participants would use in pricing the asset or liability based on the best information available under the circumstances. The Series’ investment in its entirety is assigned a level based upon the observability of the inputs which are significant to the overall valuation. The three-level hierarchy of inputs is summarized below.
| Level 1 | – | Inputs are quoted prices in active markets for identical investments. (Examples: equity securities, open-end investment companies, futures contracts, exchange-traded options contracts) | ||
| Level 2 | – | Other observable inputs, including, but not limited to: quoted prices for similar assets or liabilities in markets that are active, quoted prices for identical or similar assets or liabilities in markets that are not active, inputs other than quoted prices that are observable for the assets or liabilities (such as interest rates, yield curves, volatilities, prepayment speeds, loss severities, credit risks, and default rates), or other market-corroborated inputs. (Examples: debt securities, government securities, swap contracts, foreign currency exchange contracts, foreign securities utilizing international fair value pricing, broker-quoted securities, fair valued securities) | ||
| Level 3 | – | Significant unobservable inputs, including the Series’ own assumptions used to determine the fair value of investments. (Examples: broker-quoted securities, fair valued securities) |
Level 3 investments are valued using significant unobservable inputs. The Series may also use an income-based valuation approach in which the anticipated future cash flows of the investment are discounted to calculate fair value. Discounts may also be applied due to the nature or duration of any restrictions on the disposition of the investments. Valuations may also be based upon current market prices of securities that are comparable in coupon, rating, maturity, and industry. The derived value of a Level 3 investment may not represent the value which is received upon disposition and this could impact the results of operations.
The following table summarizes the valuation of the Series’ investments by fair value hierarchy levels as of Dec. 31, 2016:
| Securities | Level 1 | Level 2 | Total | |||||||||
Convertible Bond | $ | — | $ | 284,534 | $ | 284,534 | ||||||
Common Stock | 463,490,177 | — | 463,490,177 | |||||||||
Short-Term Investments | — | 15,598,229 | 15,598,229 | |||||||||
|
|
|
|
|
| |||||||
Total Value of Securities | $ | 463,490,177 | $ | 15,882,763 | $ | 479,372,940 | ||||||
|
|
|
|
|
| |||||||
During the year ended Dec. 31, 2016, there were no transfers between Level 1 investments, Level 2 investments, or Level 3 investments that had a significant impact to the Series. The Series’ policy is to recognize transfers between levels at the beginning of the reporting period.
A reconciliation of Level 3 investments is presented when the Series has a significant amount of Level 3 investments at the beginning, interim, or end of the period in relation to the Series’ net assets. During the year ended Dec. 31, 2016, there were no Level 3 investments.
REIT Series-14
Table of Contents
Delaware VIP® REIT Series
Notes to financial statements (continued)
4. Dividend and Distribution Information
Income and long-term capital gain distributions are determined in accordance with federal income tax regulations, which may differ from U.S. GAAP. Additionally, distributions from net short-term gains on sales of investment securities are treated as ordinary income for federal income tax purposes. The tax character of dividends and distributions paid during the years ended Dec. 31, 2016 and 2015 was as follows:
Year ended | Year ended 12/31/15 | |||||||
Ordinary income | $ | 5,667,652 | $ | 5,592,900 | ||||
Long-term capital gains | 29,925,736 | — | ||||||
|
|
|
| |||||
Total | $ | 35,593,388 | $ | 5,592,900 | ||||
|
|
|
| |||||
5. Components of Net Assets on a Tax Basis
As of Dec. 31, 2016, the components of net assets on a tax basis were as follows:
Shares of beneficial interest | $ | 412,706,218 | ||
Undistributed ordinary income* | 18,899,322 | |||
Undistributed long-term capital gains | 50,634,939 | |||
Net unrealized appreciation on investments | 904,121 | |||
|
| |||
Net assets | $ | 483,144,600 | ||
|
|
*The undistributed earnings for the Series are estimated pending final notification of the tax character of distributions received from investments in REITs.
The differences between book basis and tax basis components of net assets are primarily attributable to tax deferral of losses on wash sales.
6. Capital Shares
Transactions in capital shares were as follows:
| Year ended 12/31/16 | Year ended 12/31/15 | |||||||
Shares sold: | ||||||||
Standard Class | 1,018,352 | 1,195,116 | ||||||
Service Class | 1,350,012 | 1,295,509 | ||||||
Shares issued upon reinvestment of dividends and distributions: | ||||||||
Standard Class | 1,227,204 | 200,680 | ||||||
Service Class | 1,149,624 | 156,465 | ||||||
|
|
|
| |||||
| 4,745,192 | 2,847,770 | |||||||
|
|
|
| |||||
Shares redeemed: | ||||||||
Standard Class | (1,512,263 | ) | (2,788,833 | ) | ||||
Service Class | (2,576,127 | ) | (2,708,577 | ) | ||||
|
|
|
| |||||
| (4,088,390 | ) | (5,497,410 | ) | |||||
|
|
|
| |||||
Net increase (decrease) | 656,802 | (2,649,640 | ) | |||||
|
|
|
| |||||
7. Line of Credit
The Series, along with certain other funds in the Delaware Investments® Family of Funds (Participants), was a participant in a $155,000,000 revolving line of credit intended to be used for temporary or emergency purposes as an additional source of liquidity to fund redemptions of investor shares. Under the agreement, the Participants were charged an annual commitment fee of 0.10%, which was allocated across the Participants on the basis of relative net assets of each Participant’s allocation of the entire facility. The Participants were permitted to borrow up to a maximum of one-third of their net assets under the agreement. Each Participant was individually, and not jointly, liable for its particular advances, if any, under the line of credit. The line of credit available under the agreement expired on Nov. 7, 2016.
On Nov. 7, 2016, the Series, along with the other Participants, entered into an amendment to the agreement for a $155,000,000 revolving line of credit. The line of credit is to be used as described above and operates in substantially the same manner as the original agreement, with the exception of the annual commitment fee. Under the amendment to the agreement,
REIT Series-15
Table of Contents
Delaware VIP® REIT Series
Notes to financial statements (continued)
7. Line of Credit (continued)
the Participants are charged an annual commitment fee of 0.15%, which is allocated across the Participants on the basis of each Participant’s allocation of the entire facility. The line of credit available under the agreement expires on Nov. 6, 2017.
The Series had no amounts outstanding as of Dec. 31, 2016, or at any time during the year then ended.
8. Derivatives
U. S. GAAP requires disclosures that enable investors to understand: (1) how and why an entity uses derivatives; (2) how they are accounted for; and (3) how they affect an entity’s results of operations and financial position.
Options Contracts – During the year ended Dec. 31, 2016, the Series entered into options contracts in the normal course of pursuing its investment objectives. The Series may buy or write options contracts for any number of reasons, including without limitation: to manage the Series’ exposure to changes in securities prices caused by interest rates or market conditions and foreign currencies; as an efficient means of adjusting the Series’ overall exposure to certain markets; to protect the value of portfolio securities; and as a cash management tool. The Series may buy or write call or put options on securities. When the Series buys an option, a premium is paid and an asset is recorded and adjusted on a daily basis to reflect the current market value of the option purchased. When the Series writes an option, a premium is received and a liability is recorded and adjusted on a daily basis to reflect the current market value of the option written. Premiums received from writing options that expire unexercised are treated by the Series on the expiration date as realized gains. The difference between the premium received and the amount paid on effecting a closing purchase transaction, including brokerage commissions, is treated as realized gain or loss. If a call option is exercised, the premium is added to the proceeds from the sale of the underlying security in determining whether the Series has a realized gain or loss. If a put option is exercised, the premium reduces the cost basis of the securities purchased by the Series. The Series, as writer of an option, bears the market risk of an unfavorable change in the price of the security underlying the written option. When writing options, the Series is subject to minimal counterparty risk because the counterparty is only obligated to pay premiums and does not bear the market risk of an unfavorable market change.
Transactions in options written during the year ended Dec. 31, 2016 were as follows:
| Number of Contracts | Premiums | |||
Options outstanding December 31, 2015 | — | $— | ||
Options written | 660 | 129,790 | ||
Options expired | (660) | (129,790) | ||
|
| |||
Options outstanding December 31, 2016 | — | $— | ||
|
|
During the year ended Dec. 31, 2016, the Series entered into option contracts to manage the Series’ exposure to changes in security prices caused by interest rates or market conditions.
During the year ended Dec. 31, 2016, the Series experienced net realized gains attributable to options written, which are reflected on the “Statement of operations” under “Net realized gain on options written.”
Derivatives generally. The table below summarizes the average balance of derivative holdings by the Series during the year ended Dec. 31, 2016:
| Long Derivative Volume | Short Derivative Volume | |||||||
Options contracts (average notional value) | $— | $3,530 | ||||||
9. Offsetting
In December 2011, the Financial Accounting Standards Board (FASB) issued guidance that expanded disclosure requirements on the offsetting of certain assets and liabilities. The disclosures are required for investments and derivative financial instruments subject to master netting or similar agreements which are eligible for offset on the “Statement of assets and liabilities” and require an entity to disclose both gross and net information about such investments and transactions in the financial statements. In January 2013, the FASB issued guidance that clarified which investments and transactions are subject to the offsetting disclosure requirements. The scope of the disclosure requirements for offsetting is limited to derivative instruments, repurchase agreements and reverse repurchase agreements, and securities borrowing.
In order to better define its contractual rights and to secure rights that will help the Series mitigate its counterparty risk, the Series entered into an International Swaps and Derivatives Association, Inc. Master Agreement (ISDA Master Agreement) or a similar agreement with certain of its derivative contract counterparties. An ISDA Master Agreement is a bilateral agreement between the Series and a counterparty that governs certain over-the-counter (OTC) derivatives and foreign exchange contracts and typically contains, among other things, collateral posting items and netting provisions in the event of a default and/or termination event. Under an ISDA Master Agreement, the Series may, under certain circumstances, offset with the counterparty certain derivative financial instruments’ payables and/or receivables with collateral held and/or posted and create one single net payment. The provisions of the ISDA Master Agreement typically permit a single net payment in the event of default (close-out), including the bankruptcy or insolvency of the counterparty. However, bankruptcy or insolvency laws of a particular jurisdiction may impose restrictions on or prohibitions against the right of offset in bankruptcy, insolvency, or other events.
REIT Series-16
Table of Contents
Delaware VIP® REIT Series
Notes to financial statements (continued)
9. Offsetting (continued)
For financial reporting purposes, the Series does not offset derivative assets and derivative liabilities that are subject to netting arrangements on the “Statement of assets and liabilities.”
At Dec. 31, 2016, the Series had the following assets and liabilities subject to offsetting provisions:
Master Repurchase Agreements
Counterparty | Repurchase Agreements | Fair Value of Non-Cash Collateral Received(a) | Cash Collateral Received | Net Collateral Received | Net Exposure(b) | |||||
Bank of America Merrill Lynch | $3,344,207 | $(3,344,207) | $— | $(3,344,207) | $— | |||||
Bank of Montreal | 3,901,574 | (3,901,574) | — | (3,901,574) | — | |||||
BNP Paribas | 2,671,219 | (2,671,219) | — | (2,671,219) | — | |||||
Total | $9,917,000 | $(9,917,000) | $— | $(9,917,000) | $— |
(a) The value of the related collateral received exceeded the value of the repurchase agreements of Dec. 31, 2016.
(b) Net exposure represents the receivable (payable) that would be due from (to) the counterparty in an event of default.
10. Securities Lending
The Series, along with other funds in the Delaware Investments® Family of Funds, may lend its securities pursuant to a security lending agreement (Lending Agreement) with The Bank of New York Mellon (BNY Mellon). At the time a security is loaned, the borrower must post collateral equal to the required percentage of the market value of the loaned security, including any accrued interest. The required percentage is: (1) 102% with respect to U.S. securities and foreign securities that are denominated and payable in U.S. dollars; and (2) 105% with respect to foreign securities. With respect to each loan, if on any business day, the aggregate market value of securities collateral plus cash collateral held is less than the aggregate market value of the securities which are the subject of such loan, the borrower will be notified to provide additional collateral by the end of the following business day which, together with the collateral already held, will be not less than the applicable initial collateral requirements for such security loan. If the aggregate market value of securities collateral and cash collateral held with respect to a security loan exceeds the applicable initial collateral requirement, upon the request of the borrower, BNY Mellon must return enough collateral to the borrower by the end of the following business day to reduce the value of the remaining collateral to the applicable initial collateral requirement for such security loan. As a result of the foregoing, the value of the collateral held with respect to a loaned security on any particular day may be more or less than the value of the security on loan.
Cash collateral received by each Series of the Trust is generally invested in a series of individual separate accounts, each corresponding to a Series. The investment guidelines permit each separate account to hold certain securities that would be considered eligible securities for a money market fund. Cash collateral received is generally invested in government securities; certain obligations issued by government sponsored enterprises; repurchase agreements collateralized by U.S. Treasury securities; obligations issued by the central government of any Organization for Economic Cooperation and Development (OECD) country or its agencies, instrumentalities, or establishments; obligations of supranational organizations; commercial paper, notes, bonds, and other debt obligations; certificates of deposit, time deposits, and other bank obligations; and asset-backed securities.
In the event of default or bankruptcy by the lending agent, realization and/or retention of the collateral may be subject to legal proceedings. In the event the borrower fails to return loaned securities and the collateral received is insufficient to cover the value of the loaned securities and provided such collateral shortfall is not the result of investment losses, the lending agent has agreed to pay the amount of the shortfall to the Series or, at the discretion of the lending agent, replace the loaned securities. The Series continues to record dividends or interest, as applicable, on the securities loaned and is subject to changes in value of the securities loaned that may occur during the term of the loan. The Series has the right under the Lending Agreement to recover the securities from the borrower on demand. With respect to security loans collateralized by non-cash collateral, the Series receives loan premiums paid by the borrower. With respect to security loans collateralized by cash collateral, the earnings from the collateral investments are shared among the Series, the security lending agent, and the borrower. The Series records security lending income net of allocations to the security lending agent and the borrower.
The Series may incur investment losses as a result of investing securities lending collateral. This could occur if an investment in the collateral investment account defaulted or became impaired. Under those circumstances, the value of a Series’ cash collateral account may be less than the amount the Series would be required to return to the borrowers of the securities and the Series would be required to make up for this shortfall.
During the year ended Dec. 31, 2016, the Series had no securities out on loan.
REIT Series-17
Table of Contents
Delaware VIP® REIT Series
Notes to financial statements (continued)
11. Credit and Market Risk
The Series concentrates its investments in the real estate industry and is subject to the risks associated with that industry. If the Series holds real estate directly as a result of defaults or receives rental income directly from real estate holdings, its tax status as a regulated investment company may be jeopardized. The Series is also affected by interest rate changes, particularly if the REITs it holds use floating rate debt to finance their ongoing operations. Its investments may also tend to fluctuate more widely than that of a fund that invests in a broader range of industries.
The Series may invest up to 10% of its net assets in illiquid securities, which may include securities with contractual restrictions on resale, securities exempt from registration under Rule 144A, promulgated under Securities Act of 1933, as amended, and other securities which may not be readily marketable. The relative illiquidity of these securities may impair the Series from disposing of them in a timely manner and at a fair price when it is necessary or desirable to do so. While maintaining oversight, the Series’ Board has delegated to DMC, the day-to-day functions of determining whether individual securities are liquid for purposes of the Series’ limitation on investments in illiquid securities. Securities eligible for resale pursuant to Rule 144A, which are determined to be liquid, are not subject to the Series’ 10% limit on investments in illiquid securities. As of Dec. 31, 2016, there were no Rule 144A securities held by the Series.
12. Contractual Obligations
The Series enters into contracts in the normal course of business that contain a variety of indemnifications. The Series’ maximum exposure under these arrangements is unknown. However, the Series has not had prior claims or losses pursuant to these contracts. Management has reviewed the Series’ existing contracts and expects the risk of loss to be remote.
13. Recent Accounting Pronouncements
On Oct. 13, 2016, the Securities and Exchange Commission amended existing rules intended to modernize reporting and disclosure of information. These amendments relate to Regulation S-X which sets forth the form and content of financial statements. At this time, management is evaluating the implications of adopting these amendments and their impact on the financial statements and accompanying notes.
14. Subsequent Events
Management has determined that no material events or transactions occurred subsequent to Dec. 31, 2016 that would require recognition or disclosure in the Series’ financial statements.
REIT Series-18
Table of Contents
Delaware VIP® Trust — Delaware VIP REIT Series
Report of independent registered public accounting firm
To the Board of Trustees of Delaware VIP Trust and Shareholders of Delaware VIP REIT Series:
In our opinion, the accompanying statement of assets and liabilities, including the schedule of investments, and the related statements of operations and of changes in net assets and the financial highlights present fairly, in all material respects, the financial position of Delaware VIP REIT Series (one of the series constituting Delaware VIP Trust, hereafter referred to as the “Series”) as of December 31, 2016, the results of its operations for the year then ended, the changes in its net assets for each of the two years in the period then ended and the financial highlights for each of the five years in the period then ended, in conformity with accounting principles generally accepted in the United States of America. These financial statements and financial highlights (hereafter referred to as “financial statements”) are the responsibility of the Series’ management. Our responsibility is to express an opinion on these financial statements based on our audits. We conducted our audits of these financial statements in accordance with the standards of the Public Company Accounting Oversight Board (United States). Those standards require that we plan and perform the audit to obtain reasonable assurance about whether the financial statements are free of material misstatement. An audit includes examining, on a test basis, evidence supporting the amounts and disclosures in the financial statements, assessing the accounting principles used and significant estimates made by management, and evaluating the overall financial statement presentation. We believe that our audits, which included confirmation of securities as of December 31, 2016 by correspondence with the custodian and brokers, provide a reasonable basis for our opinion.
PricewaterhouseCoopers LLP
Philadelphia, Pennsylvania
February 16, 2017
REIT Series-19
Table of Contents
Delaware VIP® Trust — Delaware VIP REIT Series
Other Series information (Unaudited)
Board consideration of Delaware VIP REIT Series investment management agreement
At a meeting held on Aug. 16–18, 2016 (the “Annual Meeting”), the Board of Trustees (the “Board”), including a majority of disinterested or independent Trustees, approved the renewal of the Investment Advisory Agreement for Delaware VIP REIT Series (the “Series”). In making its decision, the Board considered information furnished at regular quarterly Board meetings, including reports detailing Series performance, investment strategies, and expenses, as well as information prepared specifically in connection with the renewal of the investment advisory and sub-advisory contracts. Information furnished specifically in connection with the renewal of the Investment Management Agreement with Delaware Management Company (“DMC”) included materials provided by DMC and its affiliates (“Delaware Investments”) concerning, among other things, the nature, extent, and quality of services provided to the Series; the costs of such services to the Series; economies of scale; and the investment manager’s financial condition and profitability. In addition, in connection with the Annual Meeting, reports were provided to the Trustees in May 2016 and included reports provided by Broadridge Financial Solutions (“Broadridge”). The Broadridge reports compared the Series’ investment performance and expenses with those of other comparable mutual funds. The Independent Trustees reviewed and discussed the Broadridge reports with independent legal counsel to the Independent Trustees. In addition to the information noted above, the Board also requested and received information regarding DMC’s policy with respect to advisory fee levels and its breakpoint philosophy; the structure of portfolio manager compensation; comparative client fee information; and any constraints or limitations on the availability of securities for certain investment styles, which had in the past year inhibited, or which were likely in the future to inhibit, the investment manager’s ability to invest fully in accordance with Series policies.
In considering information relating to the approval of the Series’ advisory agreement, the Independent Trustees received assistance and advice from and met separately with independent legal counsel to the Independent Trustees. Although the Board gave attention to all information furnished, the following discussion identifies, under separate headings, the primary factors taken into account by the Board during its contract renewal considerations.
Nature, extent, and quality of service. The Board considered the services provided by DMC to the Series and its shareholders. In reviewing the nature, extent, and quality of services, the Board considered reports furnished to it throughout the year, which covered matters such as the relative performance of the Series; compliance of portfolio managers with the investment policies, strategies, and restrictions for the Series; compliance by DMC and Delaware Distributors, L.P. (together, “Management”) personnel with the Code of Ethics adopted throughout the Delaware Investments® Family of Funds complex; and adherence to fair value pricing procedures as established by the Board. The Board was pleased with the current staffing of the Series’ investment advisor and the emphasis placed on research in the investment process. The Board recognized DMC’s receipt of several industry distinctions during the past several years. The Board gave favorable consideration to DMC’s efforts to control expenditures while maintaining service levels committed to Series matters. The Board was satisfied with the nature, extent, and quality of the overall services provided by DMC.
Investment performance. The Board placed significant emphasis on the investment performance of the Series in view of the importance of investment performance to shareholders. Although the Board gave appropriate consideration to performance reports and discussions with portfolio managers at Board meetings throughout the year, the Board gave particular weight to the Broadridge reports furnished for the Annual Meeting. The Broadridge reports prepared for the Series showed the investment performance of its Standard Class shares in comparison to a group of similar funds as selected by Broadridge (the “Performance Universe”). A fund with the best performance ranked first, and a fund with the poorest performance ranked last. The highest/best performing 25% of funds in the Performance Universe make up the first quartile; the next 25%, the second quartile; the next 25%, the third quartile; and the poorest/worst performing 25% of funds in the Performance Universe make up the fourth quartile. Comparative annualized performance for the Series was shown for the past 1-, 3-, 5-, and 10-year periods, as applicable, ended Jan. 31, 2016. The Board’s objective is that the Series’ performance for the periods considered be at or above the median of its Performance Universe.
The Performance Universe for the Series consisted of the Series and all real estate funds underlying variable insurance products as selected by Broadridge. The Broadridge report comparison showed that the Series’ total return for the 1- and 5-year periods was in the first quartile of its Performance Universe. The report further showed that the Series’ total return for the 3- and 10-year periods was in the second quartile of its Performance Universe. The Board was satisfied with performance.
Comparative expenses. The Board considered expense comparison data for the Delaware Investments Family of Funds. Management provided the Board with information on pricing levels and fee structures for the Series as of its most recently completed fiscal year. The Board also focused on the comparative analysis of effective management fees and total expense ratios of the Series versus effective management fees and expense ratios of a group of similar funds as selected by Broadridge (the “Expense Group”). In reviewing comparative costs, the Series’ contractual management fee and the actual management fee incurred by the Series were compared with the contractual management fees (assuming all funds in the Expense Group were similar in size to the Series) and actual management fees (as reported by each fund) within the Expense Group, taking into account any applicable breakpoints and fee waivers. The Series’ total expenses were also compared with those of its Expense Group. The Broadridge total expenses, for comparative consistency, were shown by Broadridge for Standard Class shares which do not charge 12b-1 and non-12b-1 service fees. The Board’s objective is to limit the Series’ total expense ratio to be competitive with that of the Expense Group.
The expense comparisons for the Series showed that the actual management fee and total expenses were in the quartile with the second highest expenses of its Expense Group. The Series’ total expenses were not in line with the Board’s objective. In evaluating total expenses, the Board considered 12b-1 waivers in place through May 1, 2017 and various initiatives implemented by Management. The Board was satisfied with Management’s efforts to improve the Series’ total expense ratio and to bring it in line with the Board’s objective.
REIT Series-20
Table of Contents
Delaware VIP® Trust — Delaware VIP REIT Series
Other Series information (Unaudited)
Board consideration of Delaware VIP REIT Series investment management agreement (continued)
Management profitability. The Board considered the level of profits realized by DMC in connection with the operation of the Series. In this respect, the Board reviewed the Investment Management Profitability Analysis that addressed the overall profitability of DMC’s business in providing management and other services to each of the individual funds and the Delaware Investments® Family of Funds as a whole. Specific attention was given to the methodology followed in allocating costs for the purpose of determining profitability. Management stated that the level of profits of DMC, to a certain extent, reflects recent operational cost savings and efficiencies initiated by DMC. The Board considered DMC’s efforts to improve services provided to fund shareholders and to meet additional regulatory and compliance requirements resulting from recent industry-wide Securities and Exchange Commission initiatives. The Board also considered the extent to which DMC might derive ancillary benefits from fund operations, including the potential for procuring additional business as a result of the prestige and visibility associated with its role as service provider to the Delaware Investments Family of Funds and the benefits from allocation of fund brokerage to improve trading efficiencies. The Board found that the management fees were reasonable in light of the services rendered and the profitability of DMC.
Economies of scale. The Trustees considered whether economies of scale are realized by DMC as the Series’ assets increase and the extent to which any economies of scale are reflected in the level of management fees charged. The Trustees reviewed the standardized advisory fee pricing and structure approved by the Board and shareholders, which includes breakpoints, and which applies to most funds in the Delaware Investments Family of Funds complex. Breakpoints in the advisory fee occur when the advisory fee rate is reduced on assets in excess of specified levels. Breakpoints result in a lower advisory fee, than would otherwise be the case in the absence of breakpoints, when the asset levels specified in the breakpoints are exceeded. The Board noted that the fee under the Series’ management contract fell within the standardized fee pricing structure. Although, as of May 31, 2016, the Series has not reached a size at which the advantages of any breakpoints in the applicable fee schedule, the Board recognized that the fee was structured so that if the Series grows, economies of scale may be shared.
Tax Information
All disclosures are based on financial information available as of the date of this annual report and, accordingly are subject to change. For any and all items requiring reporting, it is the intention of the Series to report the maximum amount permitted under the Internal Revenue Code and the regulations thereunder.
For the year ended Dec. 31, 2016, the Series reports distributions paid during the year as follows:
(A) | (B) Ordinary Income Distributions (Tax Basis) | Total Distributions (Tax Basis) | |||||||||||
| 84.08% | 15.92 | % | 100.00 | % | |||||||||
(A) and (B) are based on a percentage of the Series’ total distributions.
REIT Series-21
Table of Contents
Delaware Investments® Family of Funds
Board of trustees / directors and officers addendum
A mutual fund is governed by a Board of Trustees/Directors (“Trustees”), which has oversight responsibility for the management of a fund’s business affairs. Trustees establish procedures and oversee and review the performance of the investment manager, the distributor, and others who perform services for the fund. The independent fund trustees, in particular, are advocates for shareholder interests. Each trustee has served in that capacity since he or she was elected to or appointed to the Board of Trustees, and will continue to serve until his or her retirement or the election of a new trustee in his or her place. The following is a list of the Trustees and Officers with certain background and related information.
Name, Address, and Birth Date | Position(s) Held with Fund(s) | Length of Time Served | Principal Occupation(s) Past Five Years | Number of Portfolios in Fund Complex Overseen by Trustee or Officer | Other Directorships Held by Trustee or Officer | |||||
| INTERESTED TRUSTEE | ||||||||||
Shawn K. Lytle1,3 2005 Market Street Philadelphia, PA 19103
February 1970 | President, Chief Executive Officer, and Trustee | Trustee since September 2015
President and Chief Executive Officer since August 2015 | Shawn K. Lytle has served as President of Delaware Investments2 since June 2015 and was the Regional Head of Americas for UBS Global Asset Management from 2010 through 2015. | 62 | Trustee — UBS Relationship Funds, SMA Relationship Trust, and UBS Funds (May 2010–April 2015) | |||||
| INDEPENDENT TRUSTEES | ||||||||||
Thomas L. Bennett 2005 Market Street Philadelphia, PA 19103 | Chairman and Trustee | Trustee since March 2005 | Private Investor (March 2004–Present) | 62 | None | |||||
October 1947
|
Chairman since March 2015
| |||||||||
Ann D. Borowiec 2005 Market Street Philadelphia, PA 19103
November 1958 | Trustee | Since March 2015 | Chief Executive Officer
| 62 | Director —
Director — | |||||
Joseph W. Chow 2005 Market Street Philadelphia, PA 19103
January 1953 | Trustee | Since January 2013 | Executive Vice President (Emerging Economies Strategies, Risks, and Corporate Administration) State Street Corporation (July 2004–March 2011)
| 62 | Director and Audit (2004–2014) | |||||
John A. Fry 2005 Market Street Philadelphia, PA 19103
May 1960 | Trustee | Since January 2001 | President —
President — (July 2002–July 2010) | 62 | Director, Audit Committee
Director —
Director, Audit vTv Therapeutics LLC
| |||||
Lucinda S. Landreth 2005 Market Street Philadelphia, PA 19103
June 1947
| Trustee | Since March 2005 | Private Investor (2004–Present) | 62 | None | |||||
REIT Series-22
Table of Contents
Name, Address, and Birth Date | Position(s) Held with Fund(s) | Length of Time Served | Principal Occupation(s) During the Past Five Years | Number of Portfolios in Fund Complex Overseen by Trustee or Officer | Other Directorships Held by Trustee or Officer | |||||
Frances A. Sevilla-Sacasa 2005 Market Street Philadelphia, PA 19103
January 1956 | Trustee | Since September 2011 | Chief Executive Officer —
Executive Advisor to Dean
President — U.S. Trust, (July 2007–December 2008)
| 62 | Trust Manager and Audit Committee Member — Camden Property Trust | |||||
Thomas K. Whitford 2005 Market Street Philadelphia, PA 19103
March 1956 | Trustee | Since January 2013 | Vice Chairman
| 62 | Director — HSBC Finance Corporation and HSBC North America Holdings Inc.
Director — HSBC Bank | |||||
Janet L. Yeomans 2005 Market Street Philadelphia, PA 19103
July 1948 | Trustee | Since April 1999 | Vice President and Treasurer (January 2006–July 2012)
Vice President — | 62 | Director, Personnel and Compensation Committee Chair, and Audit Committee Member — Okabena Company | |||||
| OFFICERS | ||||||||||
David F. Connor 2005 Market Street Philadelphia, PA 19103
December 1963 | Senior Vice President, General Counsel, and Secretary | Senior Vice President, since May 2013; General Counsel since May 2015; Secretary since October 2005 | David F. Connor has served in
| 62 | None3 | |||||
Daniel V. Geatens 2005 Market Street Philadelphia, PA 19103
October 1972 | Vice President and Treasurer | Treasurer since October 2007 | Daniel V. Geatens has served in
| 62 | None3 | |||||
Richard Salus 2005 Market Street Philadelphia, PA 19103
October 1963 | Senior Vice President and Chief Financial Officer | Chief Financial Officer since November 2006 | Richard Salus has served in
| 62 | None3 | |||||
| 1 | Shawn K. Lytle is considered to be an “Interested Trustee” because he is an executive officer of the Fund’s(s’) investment advisor. |
| 2 | Delaware Investments is the marketing name for Delaware Management Holdings, Inc. and its subsidiaries, including the Fund’s(s’) investment advisor, principal underwriter, and its transfer agent. |
| 3 | Shawn K. Lytle, David F. Connor, Daniel V. Geatens, and Richard Salus serve in similar capacities for the six portfolios of the Optimum Fund Trust, which have the same investment advisor, principal underwriter, and transfer agent as the registrant. |
The Statement of Additional Information for the Fund(s) includes additional information about the Trustees and Officers and is available, without charge, upon request by calling 800 523-1918.
REIT Series-23
Table of Contents
The Series files its complete schedule of portfolio holdings with the Securities and Exchange Commission (Commission) for the first and third quarters of each fiscal year on Form N-Q. The Series’ Forms N-Q, as well as a description of the policies and procedures that the Series uses to determine how to vote proxies (if any) relating to portfolio securities are available without charge (i) upon request, by calling 800 523-1918; and (ii) on the Commission’s website at sec.gov. In addition, a description of the policies and procedures that the Series uses to determine how to vote proxies (if any) relating to portfolio securities and the Schedule of Investments included in the Series’ most recent Form N-Q are available without charge on the Delaware Investments® Funds’ website at delawareinvestments.com/vip/literature. The Series’ Forms N-Q may be reviewed and copied at the Commission’s Public Reference Room in Washington, DC; information on the operation of the Public Reference Room may be obtained by calling 800 SEC-0330.
Information (if any) regarding how the Series voted proxies relating to portfolio securities during the most recently disclosed 12-month period ended June 30 is available without charge (i) through the Delaware Investments Funds’ website at delawareinvestments.com/proxy; and (ii) on the Commission’s website at sec.gov.
| ||||
| AR-VIPREIT [12/16] BNY 21387 (2/17) (18579) | REIT Series-24 |
Table of Contents
Delaware VIP® Trust
|
Delaware VIP Small Cap Value Series
|
Annual report
|
December 31, 2016
|

Table of Contents

Neither Delaware Investments nor its affiliates referred to in this document are authorized deposit-taking institutions for the purpose of the Banking Act 1959 (Commonwealth of Australia). The obligations of these entities do not represent deposits or other liabilities of Macquarie Bank Limited (MBL), a subsidiary of Macquarie Group Limited and an affiliate of Delaware Investments. MBL does not guarantee or otherwise provide assurance in respect of the obligations of these entities, unless noted otherwise. The Series is governed by U.S. laws and regulations.
Unless otherwise noted, views expressed herein are current as of Dec. 31, 2016, and subject to change for events occurring after such date.
The Series is not FDIC insured and is not guaranteed. It is possible to lose the principal amount invested.
Mutual fund advisory services provided by Delaware Management Company, a series of Delaware Management Business Trust, which is a registered investment advisor. Delaware Investments, a member of Macquarie Group, refers to Delaware Management Holdings, Inc. and its subsidiaries, including the Series’ distributor, Delaware Distributors, L.P. Macquarie Group refers to Macquarie Group Limited and its subsidiaries and affiliates worldwide.
This material may be used in conjunction with the offering of shares in Delaware VIP Small Cap Value Series only if preceded or accompanied by the Series’ current prospectus or the summary prospectus.
© 2017 Delaware Management Holdings, Inc.
All third-party marks cited are the property of their respective owners.
Table of Contents
| Delaware VIP® Trust — Delaware VIP Small Cap Value Series | January 10, 2017 | |
| Portfolio management review |
For the fiscal year ended Dec. 31, 2016, Delaware VIP Small Cap Value Series Standard Class shares returned +31.41% and Service Class shares returned +31.09%. Both figures reflect all distributions reinvested. For the same period, the Series’ benchmark, the Russell 2000® Value Index, returned +31.74%.
Small-cap value stocks fell sharply early in 2016 along with energy prices, and investors grew concerned about a possible global economic slowdown. As that fear abated, stocks pushed higher throughout spring and summer before rallying again after the U.S. presidential election, as investors speculated that a Trump administration would favor a pro-growth economic agenda comprising reduced regulation and lower corporate taxes.
The U.S. presidential election played out against a backdrop of uncertain monetary policy and an economic expansion that entered its eighth year in mid-2016. After raising benchmark interest rates in December 2015, the U.S. Federal Reserve backed off from further rate hikes until December 2016, citing a variety of risks, including the British vote to leave the European Union in June, a lack of inflationary pressure, and modest economic growth. As the period ended, however, the Fed finally raised rates again, but signaled that monetary policy would remain accommodative for now.
Excluding energy companies, profits for most small-cap stocks grew throughout the fiscal year, although at a slower rate than earlier in the economic recovery. Many companies returned cash to shareholders through dividend increases and share buybacks. For most of the year, relative strength was concentrated in cyclical sectors, such as technology and industrials, as well as those with high rates of capital spending. Late in November, however, financial stocks gained on the post-election expectation of reduced regulation while energy stocks rallied after the Organization of the Petroleum Exporting Countries (OPEC) agreed to cut production. Elsewhere, the healthcare sector pulled back given the Affordable Care Act’s uncertain future, biotechnology stocks encountered a bout of profit taking, and real estate investment trusts (REITs) and utility stocks underperformed on fears of rising interest rates.
The Series benefited from an overweight to asset-sensitive financial stocks, particularly banks with solid loan portfolios. These banks were positioned to gain from a rise in interest rates and a reduction in taxes and regulations. We also benefited from the Series’ underweight to utilities and REITs. Finally, retaining overweights to basic industry and capital spending also helped, given their market leadership during the year. Conversely, the Series’ underweight to metals and mining stocks detracted from performance. It is rare that these stocks meet our investment criteria, and these stocks did well in 2016.
The Series’ stake in onshore contract drilling services firm Patterson-UTI Energy contributed to relative return. We added to the Series’ position at a favorable price point and owned shares at fiscal year end. The Series’ overweight to specialty-chemical company Albemarle also boosted performance. The stock soared amid broad-based strength in the basic materials sector. Additionally, investors applauded management’s decision to shed an underperforming subsidiary and focus on its core business. We subsequently reduced the Series’ allocation to Albemarle as the stock neared our target price. Finally, chip-maker Cirrus Logic contributed to relative performance on strong global demand for its audio products, many of which are used by Apple. Though the company continued to enjoy what we viewed as solid free cash flow and a robust balance sheet, we reduced the Series’ allocation when it approached our target price late in the fiscal year.
Among detractors, the Series’ position in exploration and development firm Whiting Petroleum hurt relative performance. After plunging early in the year, as energy prices fell, the stock recovered somewhat as oil rebounded. The company also took steps to repair its balance sheet. We continue to hold the stock given the company’s improved free-cash flow position. We also see a potential for long-term value of its assets in the Bakken Shale region. The Series’ stake in food distributor Core-Mark detracted. It fell sharply in late July after disappointing earnings results. We continue to like the company, however, and used the pullback to add to the Series’ position. Finally, janitorial and office supply distributor Essendant (formerly United Stationers Supply Company) detracted from relative performance. Its business model depends on high volumes to compensate for low margins, and the absence of pricing power hurt when earnings failed to meet investor expectations, triggering a selloff. We reduced the Series’ allocation to the stock.
At fiscal year end, we positioned the Series to potentially benefit from moderate economic growth through overweights to basic materials, technology, and companies with high rates of capital spending, offset by underweights to defensive areas including utilities and REITs. We remain committed to businesses that we believe are financially solid and shareholder friendly, as evidenced in part by rising dividends and share buybacks.
| Unless otherwise noted, views expressed herein are current as of Dec. 31, 2016, and subject to change. | ||
| Small Cap Value Series-1 |
Table of Contents
Delaware VIP® Trust — Delaware VIP Small Cap Value Series
The performance quoted represents past performance and does not guarantee future results. Investment return and principal value of an investment will fluctuate so that shares, when redeemed, may be worth more or less than their original cost. Current performance may be lower or higher than the performance quoted.
Carefully consider the Series’ investment objectives, risk factors, charges, and expenses before investing. This and other information can be found in the Series’ prospectus and its summary prospectus, which may be obtained by calling 800 523-1918. Investors should read the prospectus and the summary prospectus carefully before investing.
| Delaware VIP Small Cap Value Series | ||||||||||||
| Average annual total returns | ||||||||||||
| For periods ended Dec. 31, 2016 | 1 year | 3 years | 5 years | 10 years | Lifetime | |||||||
Standard Class shares (commenced operations on Dec. 27, 1993) | +31.41% | +9.27% | +14.68% | +8.37% | +11.20% | |||||||
|
|
|
|
|
| |||||||
|
|
|
|
|
| |||||||
Service Class shares (commenced operations on May 1, 2000) | +31.09% | +9.00% | +14.40% | +8.11% | +11.26% | |||||||
|
|
|
|
|
| |||||||
|
|
|
|
|
| |||||||
Russell 2000 Value Index | +31.74% | +8.31% | +15.07% | +6.26% | n/a | |||||||
Returns reflect the reinvestment of all distributions. Please see page 3 for a description of the index.
As described in the Series’ most recent prospectus, the net expense ratio for Service Class shares of the Series was 1.05%, while total operating expenses for Standard Class and Service Class shares were 0.80% and 1.10%, respectively. The management fee for Standard Class and Service Class shares was 0.72%.
The Series’ distributor has contracted to limit the 12b-1 fees for Service Class shares to no more than 0.25% of average daily net assets from Jan. 1, 2016 through Dec. 31, 2016.*
Earnings from a variable annuity or variable life investment compound tax-free until withdrawal, and as a result, no adjustments were made for income taxes.
Expense limitations were in effect for both classes during certain periods shown in the Series performance table above and in the Performance of a $10,000 Investment graph on the next page.
Performance data do not reflect insurance fees related to a variable annuity or variable life investment or the deferred sales charge that would apply to certain withdrawals of investments held for fewer than eight years. Performance shown here would have been reduced if such fees were included and the expense limitation removed. For more information about fees, consult your variable annuity or variable life prospectus.
Investments in variable products involve risk.
Investments in small and/or medium-sized companies typically exhibit greater risk and higher volatility than larger, more established companies.
Narrowly focused investments may exhibit higher volatility than investments in multiple industry sectors.
REIT investments are subject to many of the risks associated with direct real estate ownership, including changes in economic conditions, credit risk, and interest rate fluctuations.
Please read both the contract and underlying prospectus for specific details regarding the product’s risk profile.
* The aggregate contractual waiver period covering this report is from April 29, 2015 through May 1, 2017.
Small Cap Value Series-2
Table of Contents
Delaware VIP® Small Cap Value Series
Performance summary (continued)
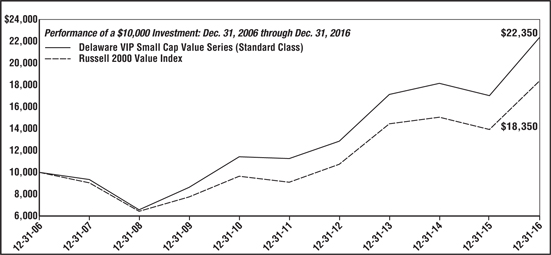
| For period beginning Dec. 31, 2006 through Dec. 31, 2016 | Starting value | Ending value | ||
-- Delaware VIP Small Cap Value Series (Standard Class) | $10,000 | $22,350 | ||
-- Russell 2000 Value Index | $10,000 | $18,350 |
The graph shows a $10,000 investment in the Delaware VIP Small Cap Value Series Standard Class shares for the period from Dec. 31, 2006 through Dec. 31, 2016.
The graph also shows $10,000 invested in the Russell 2000 Value Index for the period from Dec. 31, 2006 through Dec. 31, 2016. The Russell 2000 Value Index measures the performance of the small-cap value segment of the U.S. equity universe. It includes those Russell 2000 companies with lower price-to-book ratios and lower forecasted growth values.
Russell Investment Group is the source and owner of the trademarks, service marks, and copyrights related to the Russell Indexes. Russell® is a trademark of the Russell Investment Group.
Index performance returns do not reflect any management fees, transaction costs or expenses. Indices are unmanaged and one cannot invest directly in an index.
Performance of Service Class shares will vary due to different charges and expenses.
Past performance is not a guarantee of future results.
| Small Cap Value Series-3 |
Table of Contents
Delaware VIP® Trust — Delaware VIP Small Cap Value Series
For the six-month period from July 1, 2016 to December 31, 2016 (Unaudited)
As a shareholder of the Series, you incur ongoing costs, which may include management fees; distribution and/or service (12b-1) fees; and other Series expenses. This example is intended to help you understand your ongoing costs (in dollars) of investing in the Series and to compare these costs with the ongoing costs of investing in other mutual funds.
The example is based on an investment of $1,000 invested at the beginning of the period and held for the entire six-month period from July 1, 2016 to Dec. 31, 2016.
Actual expenses
The first section of the table shown, “Actual Series Return,” provides information about actual account values and actual expenses. You may use the information in this section of the table, together with the amount you invested, to estimate the expenses that you paid over the period. Simply divide your account value by $1,000 (for example, an $8,600 account value divided by $1,000 = 8.6), then multiply the result by the number in the first section under the heading entitled “Expenses Paid During Period” to estimate the expenses you paid on your account during the period.
Hypothetical example for comparison purposes
The second section of the table shown, “Hypothetical 5% Return,” provides information about hypothetical account values and hypothetical expenses based on the Series’ actual expense ratio and an assumed rate of return of 5% per year before expenses, which is not the Series’ actual return. The hypothetical account values and expenses may not be used to estimate the actual ending account balance or expenses you paid for the period. You may use this information to compare the ongoing costs of investing in the Series and other funds. To do so, compare the 5% hypothetical example with the 5% hypothetical examples that appear in the shareholder reports of other funds.
Please note that the expenses shown in the table are meant to highlight your ongoing costs only. As a shareholder of the Series, you do not incur any transaction costs, such as sales charges (loads), redemption fees or exchange fees, but shareholders of other funds may incur such costs. Also, the fees related to the
variable annuity investment or the deferred sales charge that could apply have not been included. Therefore, the second section of the table is useful in comparing ongoing costs only, and will not help you determine the relative total costs of owning different funds. The Series’ actual expenses shown in the table reflect fee waivers in effect for Service class shares. The expenses shown in the table assume reinvestment of all dividends and distributions.
Expense analysis of an investment of $1,000
| Beginning Account Value 7/1/16 | Ending Account Value 12/31/16 | Annualized Expense Ratio | Expenses Paid During Period 7/1/16 to 12/31/16* | |||||||||
Actual Series return† | ||||||||||||
Standard Class | $1,000.00 | $ | 1,216.50 | 0.78% | $4.35 | |||||||
Service Class | 1,000.00 | 1,215.40 | 1.03% | 5.74 | ||||||||
Hypothetical 5% return (5% return before expenses) | ||||||||||||
Standard Class | $1,000.00 | $ | 1,021.22 | 0.78% | $3.96 | |||||||
Service Class | 1,000.00 | 1,019.96 | 1.03% | 5.23 | ||||||||
| * | “Expenses Paid During Period” are equal to the Series’ annualized expense ratio, multiplied by the average account value over the period, multiplied by 184/366 (to reflect the one-half year period). |
| † | Because actual returns reflect only the most recent six-month period, the returns shown may differ significantly from fiscal year returns. |
Small Cap Value Series-4
Table of Contents
Delaware VIP® Trust — Delaware VIP Small Cap Value Series
Security type / sector allocation and top 10 equity holdings
As of December 31, 2016 (Unaudited)
Sector designations may be different than the sector designations presented in other Series materials. The sector designations may represent the investment manager’s internal sector classifications.
| Security type / sector | Percentage of net assets | |||
| ||||
Common Stock² | 98.86% | |||
Basic Industry | 9.38% | |||
Business Services | 1.14% | |||
Capital Spending | 7.62% | |||
Consumer Cyclical | 3.64% | |||
Consumer Services | 7.84% | |||
Consumer Staples | 3.06% | |||
Energy | 6.60% | |||
Financial Services1 | 29.50% | |||
Healthcare | 4.24% | |||
Real Estate | 7.78% | |||
Technology | 13.19% | |||
Transportation | 2.42% | |||
Utilities | 2.45% | |||
| ||||
Short-Term Investments | 1.05% | |||
| ||||
Total Value of Securities | 99.91% | |||
| ||||
Receivables and Other Assets Net of Liabilities | 0.09% | |||
| ||||
Total Net Assets | 100.00% | |||
| ||||
| ² | Narrow industries are utilized for compliance purposes for diversification whereas broad sectors are used for financial reporting. |
| 1 | To monitor compliance with the Series’ concentration guidelines as described in the Series’ Prospectus and Statement of Additional Information, the Financial Services sector (as disclosed herein for financial reporting purposes) is subdivided into a variety of “industries” (in accordance with the requirements of the 1940 Act). The Financial Services sector consisted of diversified financial services, banks, insurance and investment companies. As of Dec. 31, 2016, such amounts, as percentage of total net assets, were 1.09%, 22.19%, 5.53%, and 0.69%, respectively. The percentage in any such single industry will comply with the Series’ concentration policy even if the percentages in the Financial Services sector for financial reporting purposes may exceed 25%. |
Holdings are for informational purposes only and are subject to change at any time. They are not a recommendation to buy, sell, or hold any security.
| Top 10 equity holdings | Percentage of net assets | |||
| ||||
East West Bancorp | 3.16% | |||
Webster Financial | 2.21% | |||
MasTec | 2.14% | |||
Berry Plastics Group | 2.05% | |||
Selective Insurance Group | 1.82% | |||
Hancock Holding | 1.73% | |||
Bank of Hawaii | 1.59% | |||
Synopsys | 1.57% | |||
Great Western Bancorp | 1.54% | |||
Patterson-UTI Energy
|
| 1.45%
|
| |
| ||||
| Small Cap Value Series-5 |
Table of Contents
Delaware VIP® Trust — Delaware VIP Small Cap Value Series
December 31, 2016
| Number of shares | Value (U.S. $) | |||||||
Common Stock –98.86% ² | ||||||||
| Basic Industry – 9.38% | ||||||||
Albemarle | 102,600 | $ | 8,831,808 | |||||
Berry Plastics Group † | 515,900 | 25,139,807 | ||||||
Chemtura † | 196,900 | 6,537,080 | ||||||
Clearwater Paper † | 179,994 | 11,798,607 | ||||||
HB Fuller | 338,700 | 16,362,597 | ||||||
Kaiser Aluminum | 77,600 | 6,028,744 | ||||||
Minerals Technologies | 68,478 | 5,289,925 | ||||||
Olin | 650,200 | 16,651,622 | ||||||
Trinseo | 206,600 | 12,251,380 | ||||||
USG † | 206,400 | 5,960,832 | ||||||
|
| |||||||
| 114,852,402 | ||||||||
|
| |||||||
| Business Services – 1.14% | ||||||||
Deluxe | 121,500 | 8,700,615 | ||||||
Essendant | 6,123 | 127,971 | ||||||
WESCO International † | 76,000 | 5,057,800 | ||||||
|
| |||||||
| 13,886,386 | ||||||||
|
| |||||||
| Capital Spending – 7.62% | ||||||||
Altra Industrial Motion | 266,470 | 9,832,743 | ||||||
EnPro Industries | 93,600 | 6,304,896 | ||||||
H&E Equipment Services | 456,300 | 10,608,975 | ||||||
ITT | 373,200 | 14,394,324 | ||||||
MasTec † | 684,800 | 26,193,600 | ||||||
Primoris Services | 412,100 | 9,387,638 | ||||||
Regal Beloit | 85,900 | 5,948,575 | ||||||
Tetra Tech | 109,200 | 4,711,980 | ||||||
Thermon Group Holdings † | 310,700 | 5,931,263 | ||||||
|
| |||||||
| 93,313,994 | ||||||||
|
| |||||||
| Consumer Cyclical – 3.64% | ||||||||
Barnes Group | 222,800 | 10,565,176 | ||||||
Knoll | 289,793 | 8,093,918 | ||||||
Meritage Homes † | 307,500 | 10,701,000 | ||||||
Standard Motor Products | 117,501 | 6,253,403 | ||||||
Tenneco † | 142,700 | 8,914,469 | ||||||
|
| |||||||
| 44,527,966 | ||||||||
|
| |||||||
| Consumer Services – 7.84% | ||||||||
Asbury Automotive Group † | 78,300 | 4,831,110 | ||||||
Cable One | 12,800 | 7,958,144 | ||||||
Cato Class A | 115,354 | 3,469,848 | ||||||
Cheesecake Factory | 179,600 | 10,754,448 | ||||||
Choice Hotels International | 110,800 | 6,210,340 | ||||||
Cinemark Holdings | 267,613 | 10,265,635 | ||||||
Finish Line Class A | 103,000 | 1,937,430 | ||||||
International Speedway Class A | 218,300 | 8,033,440 | ||||||
Meredith | 166,850 | 9,869,177 | ||||||
Steven Madden † | 236,200 | 8,444,150 | ||||||
Texas Roadhouse | 158,400 | 7,641,216 | ||||||
UniFirst | 61,600 | 8,848,840 | ||||||
Wolverine World Wide | 349,300 | 7,667,135 | ||||||
|
| |||||||
| 95,930,913 | ||||||||
|
| |||||||
| Consumer Staples – 3.06% | ||||||||
Core-Mark Holding Class A | 190,869 | 8,220,728 | ||||||
J&J Snack Foods | 80,200 | 10,701,086 | ||||||
| Number of shares | Value (U.S. $) | |||||||
Common Stock ² (continued) | ||||||||
| Consumer Staples (continued) | ||||||||
Pinnacle Foods | 185,200 | $ | 9,898,940 | |||||
Scotts Miracle-Gro Class A | 89,600 | 8,561,280 | ||||||
|
| |||||||
| 37,382,034 | ||||||||
|
| |||||||
| Energy – 6.60% | ||||||||
Dril-Quip † | 95,300 | 5,722,765 | ||||||
Helix Energy Solutions Group † | 719,700 | 6,347,754 | ||||||
Jones Energy Class A † | 177,300 | 886,500 | ||||||
Oasis Petroleum † | 682,200 | 10,328,508 | ||||||
Patterson-UTI Energy | 659,800 | 17,761,816 | ||||||
SM Energy | 294,400 | 10,150,912 | ||||||
Southwest Gas | 189,700 | 14,534,814 | ||||||
Western Refining | 302,100 | 11,434,485 | ||||||
Whiting Petroleum † | 303,100 | 3,643,262 | ||||||
|
| |||||||
| 80,810,816 | ||||||||
|
| |||||||
| Financial Services – 29.50% | ||||||||
American Equity Investment Life Holding | 530,300 | 11,952,962 | ||||||
Bank of Hawaii | 220,000 | 19,511,800 | ||||||
Boston Private Financial Holdings | 641,900 | 10,623,445 | ||||||
Community Bank System | 253,900 | 15,688,481 | ||||||
East West Bancorp | 761,636 | 38,713,958 | ||||||
First Financial Bancorp | 558,400 | 15,886,480 | ||||||
First Interstate BancSystem | 208,000 | 8,850,400 | ||||||
First Midwest Bancorp | 504,500 | 12,728,535 | ||||||
Great Western Bancorp | 431,500 | 18,809,085 | ||||||
Hancock Holding | 492,000 | 21,205,200 | ||||||
Independent Bank | 86,400 | 6,086,880 | ||||||
Infinity Property & Casualty | 103,600 | 9,106,440 | ||||||
Main Street Capital | 228,300 | 8,394,591 | ||||||
NBT Bancorp | 362,400 | 15,177,312 | ||||||
ProAssurance | 219,500 | 12,335,900 | ||||||
Prosperity Bancshares | 180,200 | 12,934,756 | ||||||
S&T Bancorp | 248,642 | 9,706,984 | ||||||
Selective Insurance Group | 518,800 | 22,334,340 | ||||||
Stifel Financial † | 266,100 | 13,291,695 | ||||||
Umpqua Holdings | 648,400 | 12,176,952 | ||||||
Validus Holdings | 216,721 | 11,921,822 | ||||||
Valley National Bancorp | 1,162,100 | 13,526,844 | ||||||
Webster Financial | 497,800 | 27,020,584 | ||||||
WesBanco | 302,200 | 13,012,732 | ||||||
|
| |||||||
| 360,998,178 | ||||||||
|
| |||||||
| Healthcare – 4.24% | ||||||||
Haemonetics † | 134,200 | 5,394,840 | ||||||
Owens & Minor | 273,850 | 9,664,166 | ||||||
Service Corp. International | 240,900 | 6,841,560 | ||||||
STERIS | 122,998 | 8,288,835 | ||||||
Teleflex | 48,100 | 7,751,315 | ||||||
VCA † | 91,899 | 6,308,866 | ||||||
VWR † | 306,620 | 7,674,699 | ||||||
|
| |||||||
| 51,924,281 | ||||||||
|
| |||||||
| Real Estate – 7.78% | ||||||||
Alexander & Baldwin | 214,071 | 9,605,366 | ||||||
Small Cap Value Series-6
Table of Contents
Delaware VIP® Small Cap Value Series
Schedule of investments (continued)
| Number of shares | Value (U.S. $) | |||||||
Common Stock ² (continued) | ||||||||
| Real Estate (continued) | ||||||||
Brandywine Realty Trust | 843,033 | $ | 13,918,475 | |||||
Education Realty Trust | 193,700 | 8,193,510 | ||||||
Healthcare Realty Trust | 322,600 | 9,781,232 | ||||||
Highwoods Properties | 282,300 | 14,400,123 | ||||||
Lexington Realty Trust | 1,052,100 | 11,362,680 | ||||||
Ramco-Gershenson Properties Trust | 487,800 | 8,087,724 | ||||||
Summit Hotel Properties | 563,800 | 9,037,714 | ||||||
Washington Real Estate Investment Trust | 332,200 | 10,859,618 | ||||||
|
| |||||||
| 95,246,442 | ||||||||
|
| |||||||
| Technology – 13.19% | ||||||||
Brocade Communications Systems | 526,600 | 6,577,234 | ||||||
Cirrus Logic † | 150,700 | 8,520,578 | ||||||
CommScope Holding † | 429,345 | 15,971,634 | ||||||
Electronics For Imaging † | 271,300 | 11,899,218 | ||||||
MaxLinear Class A † | 308,500 | 6,725,300 | ||||||
NetScout Systems † | 319,263 | 10,056,785 | ||||||
ON Semiconductor † | 1,078,900 | 13,766,764 | ||||||
PTC † | 239,200 | 11,067,784 | ||||||
Super Micro Computer † | 287,800 | 8,072,790 | ||||||
Synopsys † | 327,300 | 19,264,878 | ||||||
Tech Data † | 125,529 | 10,629,796 | ||||||
Teradyne | 484,200 | 12,298,680 | ||||||
Tower Semiconductor † | 333,600 | 6,348,408 | ||||||
TTM Technologies † | 425,900 | 5,805,017 | ||||||
Vishay Intertechnology | 893,400 | 14,473,080 | ||||||
|
| |||||||
| 161,477,946 | ||||||||
|
| |||||||
| Transportation – 2.42% | ||||||||
Kirby † | 96,700 | 6,430,550 | ||||||
Matson | 183,600 | 6,497,604 | ||||||
Saia † | 133,550 | 5,896,233 | ||||||
Werner Enterprises | 402,200 | 10,839,290 | ||||||
|
| |||||||
| 29,663,677 | ||||||||
|
| |||||||
| Utilities – 2.45% | ||||||||
Black Hills | 156,400 | 9,593,576 | ||||||
El Paso Electric | 205,700 | 9,565,050 | ||||||
NorthWestern | 189,500 | 10,776,865 | ||||||
|
| |||||||
| 29,935,491 | ||||||||
|
| |||||||
Total Common Stock (cost $791,538,149) | 1,209,950,526 | |||||||
|
| |||||||
| Principal amount° | Value (U.S. $) | |||||||
Short -Term Investments – 1.05% | ||||||||
Discount Notes – 0.90% ≠ | ||||||||
Federal Home Loan Bank | ||||||||
0.366% 1/27/17 | 4,688,573 | $ | 4,687,415 | |||||
0.499% 2/15/17 | 1,567,040 | 1,566,123 | ||||||
0.501% 2/6/17 | 4,701,121 | 4,698,944 | ||||||
|
| |||||||
| 10,952,482 | ||||||||
|
| |||||||
Repurchase Agreements – 0.15% | ||||||||
Bank of America Merrill Lynch | 637,682 | 637,682 | ||||||
Bank of Montreal | 743,963 | 743,963 | ||||||
BNP Paribas | 509,355 | 509,355 | ||||||
|
| |||||||
| 1,891,000 | ||||||||
|
| |||||||
Total Short-Term Investments (cost $12,843,026) | 12,843,482 | |||||||
|
| |||||||
| Small Cap Value Series-7 |
Table of Contents
Delaware VIP® Small Cap Value Series
Schedule of investments (continued)
Total Value of Securities – 99.91% (cost $804,381,175) | $ | 1,222,794,008 | ||
|
|
| ² | Narrow industries are utilized for compliance purposes for diversification whereas broad sectors are used for financial reporting. |
| ≠ | The rate shown is the effective yield at the time of purchase. |
| ° | Principal amount shown is stated in U.S. dollars unless noted that the security is denominated in another currency. |
| † | Non-income-producing security. |
See accompanying notes, which are an integral part of the financial statements.
| Small Cap Value Series-8 |
Table of Contents
| Delaware VIP® Trust — Delaware VIP Small Cap Value Series | ||
| Statement of assets and liabilities | December 31, 2016 |
Assets: | ||||
Investments, at value1 | $ | 1,209,950,526 | ||
Short-term investments, at value2 | 12,843,482 | |||
Cash | 455,906 | |||
Dividends and interest receivable | 2,720,767 | |||
Receivable for securities sold | 2,227,134 | |||
Receivable for series shares sold | 245,329 | |||
|
| |||
Total assets | 1,228,443,144 | |||
|
| |||
Liabilities: | ||||
Payable for series shares redeemed | 2,689,951 | |||
Investment management fees payable to affiliates | 737,984 | |||
Payable for securities purchased | 720,236 | |||
Distribution fees payable to affiliates | 167,661 | |||
Dividend disbursing and transfer agent fees and expenses payable to affiliates | 7,782 | |||
Accounting and administration expenses payable to affiliates | 4,881 | |||
Trustees’ fees and expenses payable | 2,936 | |||
Legal fees payable to affiliates | 2,153 | |||
Reports and statements to shareholders expenses payable to affiliates | 1,082 | |||
Other accrued expenses | 152,807 | |||
|
| |||
Total liabilities | 4,487,473 | |||
|
| |||
Total Net Assets | $ | 1,223,955,671 | ||
|
| |||
Net Assets Consist of: | ||||
Paid-in capital | $ | 754,745,492 | ||
Undistributed net investment income | 8,869,832 | |||
Accumulated net realized gain on investments | 41,927,514 | |||
Net unrealized appreciation of investments | 418,412,833 | |||
|
| |||
Total Net Assets | $ | 1,223,955,671 | ||
|
| |||
Standard Class: | ||||
Net assets | $ | 429,274,641 | ||
Shares of beneficial interest outstanding, unlimited authorization, no par | 10,774,305 | |||
Net asset value per share | $ | 39.84 | ||
Service Class: | ||||
Net assets | $ | 794,681,030 | ||
Shares of beneficial interest outstanding, unlimited authorization, no par | 20,034,549 | |||
Net asset value per share | $ | 39.67 | ||
| ||||
1Investments, at cost | $ | 791,538,149 | ||
2Short-term investments, at cost | 12,843,026 | |||
See accompanying notes, which are an integral part of the financial statements.
Small Cap Value Series-9
Table of Contents
Delaware VIP® Trust —
Delaware VIP Small Cap Value Series
Year ended December 31, 2016
Investment Income: | ||||
Dividends | $ | 18,957,422 | ||
Interest | 44,204 | |||
|
| |||
| 19,001,626 | ||||
|
| |||
Expenses: | ||||
Management fees | 7,432,140 | |||
Distribution expenses - Service Class | 1,984,403 | |||
Accounting and administration expenses | 329,702 | |||
Reports and statements to shareholders expenses | 114,731 | |||
Dividends disbursing and transfer agent fees and expenses | 87,155 | |||
Legal fees | 57,364 | |||
Trustees’ fees and expenses | 49,245 | |||
Custodian fees | 39,732 | |||
Audit and tax fees | 33,158 | |||
Registration fees | 2,415 | |||
Other | 28,286 | |||
|
| |||
| 10,158,331 | ||||
Less waived distribution expenses – Service Class | (330,734 | ) | ||
Less expense paid indirectly | (4 | ) | ||
|
| |||
Total operating expenses | 9,827,593 | |||
|
| |||
Net Investment Income | 9,174,033 | |||
|
| |||
Net Realized and Unrealized Gain: | ||||
Net realized gain on investments | 42,363,754 | |||
Net change in unrealized appreciation (depreciation) of investments | 241,773,912 | |||
|
| |||
Net Realized and Unrealized Gain | 284,137,666 | |||
|
| |||
Net Increase in Net Assets Resulting from Operations | $ | 293,311,699 | ||
|
| |||
Delaware VIP Trust —
Delaware VIP Small Cap Value Series
Statements of changes in net assets
| Year ended | ||||||||
| 12/31/16 | 12/31/15 | |||||||
Increase (Decrease) in Net Assets from Operations: | ||||||||
Net investment income | $ | 9,174,033 | $ | 7,835,557 | ||||
Net realized gain | 42,363,754 | 92,916,036 | ||||||
Net change in unrealized appreciation (depreciation) | 241,773,912 | (167,091,216 | ) | |||||
|
|
|
| |||||
Net increase (decrease) in net assets resulting from operations | 293,311,699 | (66,339,623 | ) | |||||
|
|
|
| |||||
Dividends and Distributions to Shareholders from: | ||||||||
Net investment income: | ||||||||
Standard Class | (3,599,852 | ) | (2,672,814 | ) | ||||
Service Class | (4,789,432 | ) | (3,234,601 | ) | ||||
Net realized gain: | ||||||||
Standard Class | (33,171,518 | ) | (38,859,324 | ) | ||||
Service Class | (59,630,251 | ) | (72,585,147 | ) | ||||
|
|
|
| |||||
| (101,191,053 | ) | (117,351,886 | ) | |||||
|
|
|
| |||||
Capital Share Transactions: | ||||||||
Proceeds from shares sold: | ||||||||
Standard Class | 37,317,603 | 39,434,777 | ||||||
Service Class | 63,705,456 | 39,076,909 | ||||||
Net asset value of shares based upon reinvestment of dividends and distributions: | ||||||||
Standard Class | 36,771,370 | 41,532,138 | ||||||
Service Class | 64,419,682 | 75,819,748 | ||||||
|
|
|
| |||||
| 202,214,111 | 195,863,572 | |||||||
|
|
|
| |||||
Cost of shares repurchased: | ||||||||
Standard Class | (57,243,833 | ) | (51,838,581 | ) | ||||
Service Class | (78,004,472 | ) | (94,268,839 | ) | ||||
|
|
|
| |||||
| (135,248,305 | ) | (146,107,420 | ) | |||||
|
|
|
| |||||
Increase in net assets derived from capital share transactions | 66,965,806 | 49,756,152 | ||||||
|
|
|
| |||||
Net Increase (Decrease) in Net Assets | 259,086,452 | (133,935,357 | ) | |||||
Net Assets: | ||||||||
Beginning of year | 964,869,219 | 1,098,804,576 | ||||||
|
|
|
| |||||
End of year | $ | 1,223,955,671 | $ | 964,869,219 | ||||
|
|
|
| |||||
Undistributed net investment income | $ | 8,869,832 | $ | 8,096,785 | ||||
|
|
|
| |||||
See accompanying notes, which are an integral part of the financial statements.
| Small Cap Value Series-10 |
Table of Contents
Delaware VIP® Trust — Delaware VIP Small Cap Value Series
Selected data for each share of the Series outstanding throughout each period were as follows:
| Delaware VIP Small Cap Value Series Standard Class | ||||||||||||||||||||
| Year ended | ||||||||||||||||||||
| 12/31/16 | 12/31/15 | 12/31/14 | 12/31/13 | 12/31/12 | ||||||||||||||||
Net asset value, beginning of period | $ | 33.720 | $ | 40.230 | $ | 41.720 | $ | 33.140 | $ | 31.390 | ||||||||||
Income (loss) from investment operations: | ||||||||||||||||||||
Net investment income1 | 0.359 | 0.334 | 0.274 | 0.238 | 0.265 | |||||||||||||||
Net realized and unrealized gain (loss) | 9.377 | (2.431 | ) | 2.058 | 10.368 | 3.982 | ||||||||||||||
|
|
|
|
|
|
|
|
|
| |||||||||||
Total from investment operations | 9.736 | (2.097 | ) | 2.332 | 10.606 | 4.247 | ||||||||||||||
|
|
|
|
|
|
|
|
|
| |||||||||||
Less dividends and distributions from: | ||||||||||||||||||||
Net investment income | (0.354 | ) | (0.284 | ) | (0.233 | ) | (0.276 | ) | (0.195 | ) | ||||||||||
Net realized gain | (3.262 | ) | (4.129 | ) | (3.589 | ) | (1.750 | ) | (2.302 | ) | ||||||||||
|
|
|
|
|
|
|
|
|
| |||||||||||
Total dividends and distributions | (3.616 | ) | (4.413 | ) | (3.822 | ) | (2.026 | ) | (2.497 | ) | ||||||||||
|
|
|
|
|
|
|
|
|
| |||||||||||
Net asset value, end of period | $ | 39.840 | $ | 33.720 | $ | 40.230 | $ | 41.720 | $ | 33.140 | ||||||||||
|
|
|
|
|
|
|
|
|
| |||||||||||
Total return2 | 31.41% | (6.22% | ) | 5.86% | 33.50% | 13.90% | ||||||||||||||
Ratios and supplemental data: | ||||||||||||||||||||
Net assets, end of period (000 omitted) | $ | 429,275 | $ | 343,847 | $ | 379,542 | $ | 354,211 | $ | 271,272 | ||||||||||
Ratio of expenses to average net assets | 0.79% | 0.80% | 0.80% | 0.80% | 0.81% | |||||||||||||||
Ratio of net investment income to average net assets | 1.05% | 0.90% | 0.68% | 0.64% | 0.82% | |||||||||||||||
Portfolio turnover | 11% | 18% | 16% | 23% | 14% | |||||||||||||||
| 1 | The average shares outstanding method has been applied for per share information. |
| 2 | Total investment return is based on the change in net asset value of a share during the period and assumes reinvestment of dividends and distributions at net asset value. Total investment return does not include fees, charges, or expenses imposed by the variable annuity and life insurance contracts for which Delaware VIP Trust serves as an underlying investment vehicle. |
See accompanying notes, which are an integral part of the financial statements.
| Small Cap Value Series-11 |
Table of Contents
Delaware VIP® Small Cap Value Series
Financial highlights (continued)
Selected data for each share of the Series outstanding throughout each period were as follows:
| Delaware VIP Small Cap Value Series Service Class | ||||||||||||||||||||
| Year ended | ||||||||||||||||||||
| 12/31/16 | 12/31/15 | 12/31/14 | 12/31/13 | 12/31/12 | ||||||||||||||||
Net asset value, beginning of period | $ | 33.580 | $ | 40.080 | $ | 41.580 | $ | 33.040 | $ | 31.300 | ||||||||||
Income (loss) from investment operations: | ||||||||||||||||||||
Net investment income1 | 0.272 | 0.241 | 0.173 | 0.145 | 0.184 | |||||||||||||||
Net realized and unrealized gain (loss) | 9.342 | (2.428 | ) | 2.057 | 10.340 | 3.974 | ||||||||||||||
|
|
|
|
|
|
|
|
|
| |||||||||||
Total from investment operations | 9.614 | (2.187 | ) | 2.230 | 10.485 | 4.158 | ||||||||||||||
|
|
|
|
|
|
|
|
|
| |||||||||||
Less dividends and distributions from: | ||||||||||||||||||||
Net investment income | (0.262 | ) | (0.184 | ) | (0.141 | ) | (0.195 | ) | (0.116 | ) | ||||||||||
Net realized gain | (3.262 | ) | (4.129 | ) | (3.589 | ) | (1.750 | ) | (2.302 | ) | ||||||||||
|
|
|
|
|
|
|
|
|
| |||||||||||
Total dividends and distributions | (3.524 | ) | (4.313 | ) | (3.730 | ) | (1.945 | ) | (2.418 | ) | ||||||||||
|
|
|
|
|
|
|
|
|
| |||||||||||
Net asset value, end of period | $ | 39.670 | $ | 33.580 | $ | 40.080 | $ | 41.580 | $ | 33.040 | ||||||||||
|
|
|
|
|
|
|
|
|
| |||||||||||
Total return2 | 31.09% | (6.46% | ) | 5.62% | 33.17% | 13.63% | ||||||||||||||
Ratios and supplemental data: | ||||||||||||||||||||
Net assets, end of period (000 omitted) | $ | 794,681 | $ | 621,022 | $ | 719,263 | $ | 722,548 | $ | 593,021 | ||||||||||
Ratio of expenses to average net assets | 1.04% | 1.05% | 1.05% | 1.05% | 1.06% | |||||||||||||||
Ratio of expenses to average net assets prior to fees waived | 1.09% | 1.10% | 1.10% | 1.10% | 1.11% | |||||||||||||||
Ratio of net investment income to average net assets | 0.80% | 0.65% | 0.43% | 0.39% | 0.57% | |||||||||||||||
Ratio of net investment income to average net assets prior to fees waived | 0.75% | 0.60% | 0.38% | 0.34% | 0.52% | |||||||||||||||
Portfolio turnover | 11% | 18% | 16% | 23% | 14% | |||||||||||||||
| 1 | The average shares outstanding method has been applied for per share information. |
| 2 | Total investment return is based on the change in net asset value of a share during the period and assumes reinvestment of dividends and distributions at net asset value. Total investment return during all of the periods shown reflects a waiver by the distributor. Performance would have been lower had the waiver not been in effect. Total investment return does not include fees, charges, or expenses imposed by the variable annuity and life insurance contracts for which Delaware VIP Trust serves as an underlying investment vehicle. |
See accompanying notes, which are an integral part of the financial statements.
| Small Cap Value Series-12 |
Table of Contents
Delaware VIP® Trust — Delaware VIP Small Cap Value Series
December 31, 2016
Delaware VIP Trust (Trust) is organized as a Delaware statutory trust and offers 10 series: Delaware VIP Diversified Income Series, Delaware VIP Emerging Markets Series, Delaware VIP High Yield Series, Delaware VIP International Value Equity Series, Delaware VIP Limited-Term Diversified Income Series, Delaware VIP REIT Series, Delaware VIP Small Cap Value Series, Delaware VIP Smid Cap Growth Series, Delaware VIP U.S. Growth Series, and Delaware VIP Value Series. These financial statements and the related notes pertain to Delaware VIP Small Cap Value Series (Series). The Trust is an open-end investment company. The Series is considered diversified under the Investment Company Act of 1940, as amended, and offers Standard Class and Service Class shares. The Standard Class shares do not carry a 12b-1 fee and the Service Class shares carry a 12b-1 fee. The shares of the Series are sold only to separate accounts of life insurance companies.
The investment objective of the Series is to seek capital appreciation.
1. Significant Accounting Policies
The following accounting policies are in accordance with U.S. generally accepted accounting principles (U.S. GAAP) and are consistently followed by the Series.
Security Valuation — Equity securities, except those traded on the Nasdaq Stock Market LLC (Nasdaq) are valued at the last quoted sales price as of the time of the regular close of the New York Stock Exchange on the valuation date. Equity securities traded on the Nasdaq are valued in accordance with the Nasdaq Official Closing Price, which may not be the last sales price. If, on a particular, day an equity security does not trade, the mean between the bid and ask prices will be used, which approximates fair value. U.S. government and agency securities are valued at the mean between the bid and ask prices, which approximates fair value. Generally, other securities and assets for which market quotations are not readily available are valued at fair value as determined in good faith under the direction of the Trust’s Board of Trustees (Board). In determining whether market quotations are readily available or fair valuation will be used, various factors will be taken into consideration, such as market closures or suspension of trading in a security.
Federal Income Taxes — No provision for federal income taxes has been made as the Series intends to continue to qualify for federal income tax purposes as a regulated investment company under Subchapter M of the Internal Revenue Code of 1986, as amended, and make the requisite distributions to shareholders. The Series evaluates tax positions taken or expected to be taken in the course of preparing the Series’ tax returns to determine whether the tax positions are “more-likely-than-not” of being sustained by the applicable tax authority. Tax positions not deemed to meet the “more-likely-than-not” threshold are recorded as a tax benefit or expense in the current year. Management has analyzed the Series’ tax positions taken for all open federal income tax years (Dec. 31, 2013 – Dec. 31, 2016), and has concluded that no provision for federal income tax is required in the Series’ financial statements.
Class Accounting — Investment income, common expenses, and realized and unrealized gain (loss) on investments are allocated to the classes of the Series on the basis of daily net assets of each class. Distribution expenses relating to a specific class are charged directly to that class.
Repurchase Agreements—The Series may purchase certain U.S. government securities subject to the counterparty’s agreement to repurchase them at an agreed upon date and price. The counterparty will be required on a daily basis to maintain the value of the collateral subject to the agreement at not less than the repurchase price (including accrued interest). The agreements are conditioned upon the collateral being deposited under the Federal Reserve book-entry system with the Series’ custodian or a third-party sub-custodian. In the event of default or bankruptcy by the other party to the agreement, retention of the collateral may be subject to legal proceedings. All open repurchase agreements as of the date of this report were entered into on Dec. 30, 2016, and matured on the next business day.
Use of Estimates — The Series is an investment company, whose financial statements are prepared in conformity with U.S. GAAP. Therefore, the Series follows the accounting and reporting guidelines for investment companies. The preparation of financial statements in conformity with U.S. GAAP requires management to make estimates and assumptions that affect the fair value of investments, the reported amounts of assets and liabilities and disclosure of contingent assets and liabilities at the date of the financial statements, and the reported amounts of revenues and expenses during the reporting period. Actual results could differ from those estimates and the differences could be material.
Other — Expenses directly attributable to the Series are charged directly to the Series. Other expenses common to various funds within the Delaware Investments® Family of Funds are generally allocated among such funds on the basis of average net assets. Management fees and certain other expenses are paid monthly. Security transactions are recorded on the date the securities are purchased or sold (trade date) for financial reporting purposes. Costs used in calculating realized gains and losses on the sale of investment securities are those of the specific securities sold. Dividend income is recorded on the ex-dividend date and interest income is recorded on the accrual basis. Discounts and premiums on debt securities are accreted or amortized to interest income, respectively over the lives of the respective securities using the effective interest method. Distributions received from investments in real estate investment trusts (REITs) are recorded as dividend income on the ex-dividend date, subject to reclassification upon notice of the character of such distribution by the issuer. The Series declares and pays dividends from net investment income and distributions from net realized gain on investments, if any, following the close of the fiscal year. The Series may distribute more frequently, if necessary for tax purposes. Dividends and distributions, if any, are recorded on the ex-dividend date.
Subject to seeking best execution, the Series may direct certain security trades to brokers who have agreed to rebate a portion of the related brokerage commission to the Series in cash. Such commission rebates are included on the “Statement of operations” under “Net realized gain on investments” and totaled $517 for the year ended Dec. 31, 2016. In general, best execution refers to many factors, including the price paid or received for a security, the commission charged, the promptness and reliability of execution, the confidentiality and placement accorded the order, and other factors affecting the overall benefit obtained by the Series on the transaction.
Small Cap Value Series-13
Table of Contents
Delaware VIP® Small Cap Value Series
Notes to financial statements (continued)
1. Significant Accounting Policies (continued)
The Series may receive earnings credits from its custodian when positive cash balances are maintained, which may be used to offset custody fees. There were no such earnings credits for the year ended Dec. 31, 2016.
The Series receives earnings credits from its transfer agent when positive cash balances are maintained, which may be used to offset transfer agent fees. If the amount earned is greater than $1.00, the expense paid under this arrangement is included on the “Statement of operations” under “Dividend disbursing and transfer agent fees and expenses” with the corresponding expense offset shown under “Less expense paid indirectly.” For the year ended Dec. 31, 2016, the Series earned $4 under this agreement.
2. Investment Management, Administration Agreements, and Other Transactions with Affiliates
In accordance with the terms of its investment management agreement, the Series pays Delaware Management Company (DMC), a series of Delaware Management Business Trust and the investment manager, an annual fee which is calculated daily at the rate of 0.75% on the first $500 million of average daily net assets of the Series, 0.70% on the next $500 million, 0.65% on the next $1.5 billion, and 0.60% on average daily net assets in excess of $2.5 billion.
Delaware Investments Fund Services Company (DIFSC), an affiliate of DMC, provides fund accounting and financial administration oversight services to the Series. For these services, DIFSC’s fees are calculated based on the aggregate daily net assets of the Delaware Investments® Family of Funds at the following annual rate: 0.0050% of the first $30 billion; 0.0045% of the next $10 billion; 0.0040% of the next $10 billion; and 0.0025% of aggregate average daily net assets in excess of $50 billion. The fees payable to DIFSC under the service agreement described above are allocated among all funds in the Delaware Investments Family of Funds on a relative net asset value (NAV) basis. For the year ended Dec. 31, 2016, the Series was charged $48,709 for these services. This amount is included on the “Statement of operations” under “Accounting and administration expenses.”
DIFSC is also the transfer agent and dividend disbursing agent of the Series. For these services, DIFSC’s fees are calculated at the annual rate of 0.0075% of the Series’ average daily net assets. This amount is included on the “Statement of operations” under “Dividend disbursing and transfer agent fees and expenses.” For the year ended Dec. 31, 2016, the Series was charged $77,222 for these services. Pursuant to a sub-transfer agency agreement between DIFSC and BNY Mellon Investment Servicing (US) Inc. (BNYMIS), BNYMIS provides certain sub-transfer agency services to the Series. Sub-transfer agency fees are paid by the Series and are also included on the “Statement of operations” under “Dividend disbursing and transfer agent fees and expenses.”
Pursuant to a distribution agreement and distribution plan, the Series pays Delaware Distributors, L.P. (DDLP), the distributor and an affiliate of DMC, an annual distribution and service (12b-1) fee of 0.30% of the average daily net assets of the Service Class shares. DDLP has contracted to waive 12b-1 fees from Jan. 1, 2016 through Dec. 31, 2016* in order to limit 12b-1 fees of the Service Class shares to 0.25% of average daily net assets. Standard Class shares pay no 12b-1 fees.
As provided in the investment management agreement, the Series bears a portion of the cost of certain resources shared with DMC, including the cost of internal personnel of DMC and/or its affiliates that provide legal, tax and regulatory reporting services to the Series. For the year ended Dec. 31, 2016, the Series was charged $21,446 for internal legal, tax, and regulatory reporting services provided by DMC and/or its affiliates’ employees.
Trustees’ fees include expenses accrued by the Series for each Trustee’s retainer and meeting fees. Certain officers of DMC, DIFSC, and DDLP are officers and/or Trustees of the Trust. These officers and Trustees are paid no compensation by the Series.
Cross trades for the year ended Dec. 31, 2016 were executed by the Series pursuant to procedures adopted by the Board designed to ensure compliance with Rule 17a-7 under the 1940 Act. Cross trading is the buying or selling of portfolio securities between funds of investment companies, or between a fund of an investment company and another entity, that are or could be considered affiliates by virtue of having a common investment advisor (or affiliated investment advisors), common directors/trustees and or common officers. At its regularly scheduled meetings, the Board reviews such transactions for compliance with the procedures adopted by the Board. Pursuant to these procedures, for the year ended Dec. 31, 2016, the Series engaged in securities sales of $9,353,699, which resulted in net realized losses of $(156).
*The aggregate contractual waiver period covering this report is from April 29, 2015 through May 1, 2017.
3. Investments
For the year ended Dec. 31, 2016, the Series made purchases and sales of investment securities other than short-term investments as follows:
| Purchases | $ | 110,744,002 | ||
| Sales | 136,896,484 |
Small Cap Value Series-14
Table of Contents
Delaware VIP® Small Cap Value Series
Notes to financial statements (continued)
3. Investments (continued)
At Dec. 31, 2016, the cost and unrealized appreciation (depreciation) of investments for federal income tax purposes were as follows:
Cost of Investments | Aggregate Unrealized Appreciation of Investments | Aggregate Unrealized Depreciation of Investments | Net Unrealized Appreciation of Investments | |||||||||||
| $804,910,022 | $444,915,154 | $(27,031,168) | $417,883,986 |
U.S.GAAP defines fair value as the price that the Series would receive to sell an asset or pay to transfer a liability in an orderly transaction between market participants at the measurement date under current market conditions. A three-level hierarchy for fair value measurements has been established based upon the transparency of inputs to the valuation of an asset or liability. Inputs may be observable or unobservable and refer broadly to the assumptions that market participants would use in pricing the asset or liability. Observable inputs reflect the assumptions market participants would use in pricing the asset or liability based on market data obtained from sources independent of the reporting entity. Unobservable inputs reflect the reporting entity’s own assumptions about the assumptions that market participants would use in pricing the asset or liability based on the best information available under the circumstances. The Series’ investment in its entirety is assigned a level based upon the observability of the inputs which are significant to the overall valuation. The three-level hierarchy of inputs is summarized below.
| Level 1 – | Inputs are quoted prices in active markets for identical investments. (Examples: equity securities, open-end investment companies, futures contracts, exchange-traded options contracts) | |
| Level 2 – | Other observable inputs, including, but not limited to: quoted prices for similar assets or liabilities in markets that are active, quoted prices for identical or similar assets or liabilities in markets that are not active, inputs other than quoted prices that are observable for the assets or liabilities (such as interest rates, yield curves, volatilities, prepayment speeds, loss severities, credit risks and default rates), or other market-corroborated inputs. (Examples: debt securities, government securities, swap contracts, foreign currency exchange contracts, foreign securities utilizing international fair value pricing, broker-quoted securities, fair valued securities) | |
| Level 3 – | Significant unobservable inputs, including the Series’ own assumptions used to determine the fair value of investments. (Examples: broker-quoted securities, fair valued securities) |
Level 3 investments are valued using significant unobservable inputs. The Series may also use an income-based valuation approach in which the anticipated future cash flows of the investment are discounted to calculate fair value. Discounts may also be applied due to the nature or duration of any restrictions on the disposition of the investments. Valuations may also be based upon current market prices of securities that are comparable in coupon, rating, maturity, and industry. The derived value of a Level 3 investment may not represent the value which is received upon disposition and this could impact the results of operations.
The following table summarizes the valuation of the Series’ investments by fair value hierarchy levels as of Dec. 31, 2016:
Securities | Level 1 | Level 2 | Total | |||||||||
Common Stock | $ | 1,209,950,526 | $ | — | $ | 1,209,950,526 | ||||||
Short-Term Investments | — | 12,843,482 | 12,843,482 | |||||||||
|
|
|
|
|
| |||||||
Total Value of Securities | $ | 1,209,950,526 | $ | 12,843,482 | $ | 1,222,794,008 | ||||||
|
|
|
|
|
| |||||||
During the year ended Dec. 31, 2016, there were no transfers between Level 1 investments, Level 2 investments, or Level 3 investments that had a significant impact to the Series. The Series’ policy is to recognize transfers between levels at the beginning of the reporting period.
A reconciliation of Level 3 investments is presented when the Series has a significant amount of Level 3 investments at the beginning, interim, or end of the period in relation to the Series’ net assets. During the year ended Dec. 31, 2016, there were no Level 3 investments.
4. Dividend and Distribution Information
Income and long-term capital gain distributions are determined in accordance with federal income tax regulations, which may differ from U.S. GAAP. Additionally, distributions from net short-term gains on sales of investment securities are treated as ordinary income for federal income tax purposes. The tax character of dividends and distributions paid during the years ended Dec. 31, 2016 and 2015 was as follows:
| Year ended | ||||||||
| 12/31/16 | 12/31/15 | |||||||
Ordinary income | $ | 9,612,606 | $ | 9,227,267 | ||||
Long-term capital gain | 91,578,447 | 108,124,619 | ||||||
|
|
|
| |||||
Total | $ | 101,191,053 | $ | 117,351,886 | ||||
|
|
|
| |||||
Small Cap Value Series-15
Table of Contents
Delaware VIP® Small Cap Value Series
Notes to financial statements (continued)
5. Components of Net Assets on a Tax Basis
As of Dec. 31, 2016, the components of net assets on a tax basis were as follows:
Shares of beneficial interest | $ | 754,745,492 | ||
Undistributed ordinary income | 8,869,832 | |||
Undistributed long-term capital gains | 42,456,361 | |||
Unrealized appreciation on investments | 417,883,986 | |||
|
| |||
Net assets | $ | 1,223,955,671 | ||
|
|
The differences between book basis and tax basis components of net assets are primarily attributable to tax deferral of losses on wash sales.
For financial reporting purposes, capital accounts are adjusted to reflect the tax character of permanent book/tax differences. Reclassifications are primarily due to tax treatment of dividends and distributions. Results of operations and net assets were not affected by these reclassifications. For the year ended Dec. 31, 2016 the Series recorded the following reclassifications:
Undistributed Net Investment Income | Accumulated Net Realized Gain | |||||||||
| $(11,702) | $11,702 | |||||||||
6. Capital Shares
Transactions in capital shares were as follows:
| Year ended | ||||||||
| 12/31/16 | 12/31/15 | |||||||
Shares sold: | ||||||||
Standard Class | 1,094,235 | 1,054,751 | ||||||
Service Class | 1,812,728 | 1,047,158 | ||||||
Shares issued upon reinvestment of dividends and distributions: | ||||||||
Standard Class | 1,140,905 | 1,118,560 | ||||||
Service Class | 2,003,723 | 2,046,969 | ||||||
|
|
|
| |||||
| 6,051,591 | 5,267,438 | |||||||
|
|
|
| |||||
Shares redeemed: | ||||||||
Standard Class | (1,656,790 | ) | (1,410,812 | ) | ||||
Service Class | (2,275,828 | ) | (2,547,918 | ) | ||||
|
|
|
| |||||
| (3,932,618 | ) | (3,958,730 | ) | |||||
|
|
|
| |||||
Net increase | 2,118,973 | 1,308,708 | ||||||
|
|
|
| |||||
7. Line of Credit
The Series, along with certain other funds in the Delaware Investments® Family of Funds (Participants), was a participant in a $155,000,000 revolving line of credit intended to be used for temporary or emergency purposes as an additional source of liquidity to fund redemptions of investor shares. Under the agreement, the Participants were charged an annual commitment fee of 0.10%, which was allocated across the Participants on the basis of relative net assets of each Participant’s allocation of the entire facility. The Participants were permitted to borrow up to a maximum of one third of their net assets under the agreement. Each Participant was individually, and not jointly, liable for its particular advances, if any, under the line of credit. The line of credit available under the agreement expired on Nov. 7, 2016.
On Nov. 7, 2016, the Series, along with the other Participants, entered into an amendment to the agreement for a $155,000,000 revolving line of credit. The line of credit is to be used as described above and operates in substantially the same manner as the original agreement, with the exception of the annual commitment fee. Under the amendment to the agreement, the Participants are charged an annual commitment fee of 0.15%, which is allocated across the Participants on the basis of relative net assets of each Participant’s allocation of the entire facility. The line of credit available under the agreement expires on Nov. 6, 2017.
The Series had no amounts outstanding as of Dec. 31, 2016 or at any time during the year then ended.
Small Cap Value Series-16
Table of Contents
Delaware VIP® Small Cap Value Series
Notes to financial statements (continued)
8. Offsetting
In December 2011, the Financial Accounting Standards Board (FASB) issued guidance that expanded disclosure requirements on the offsetting of certain assets and liabilities. The disclosures are required for investments and derivative financial instruments subject to master netting or similar agreements which are eligible for offset on the “Statement of assets and liabilities” and requires an entity to disclose both gross and net information about such investments and transactions in the financial statements. In January 2013, the FASB issued guidance that clarified which investments and transactions are subject to the offsetting disclosure requirements. The scope of the disclosure requirements for offsetting is limited to derivative instruments, repurchase agreements and reverse repurchase agreements, and securities borrowing.
In order to better define its contractual rights and to secure rights that will help the Series mitigate its counterparty risk, the Series entered into an International Swaps and Derivatives Association, Inc. Master Agreement (ISDA Master Agreement) or a similar agreement with certain of its derivative contract counterparties. An ISDA Master Agreement is a bilateral agreement between the Series and a counterparty that governs certain over-the-counter (OTC) derivatives and foreign exchange contracts and typically contains, among other things, collateral posting items and netting provisions in the event of a default and/or termination event. Under an ISDA Master Agreement, the Series may, under certain circumstances, offset with the counterparty certain derivative financial instrument’s payables and/or receivables with collateral held and/or posted and create one single net payment. The provisions of the ISDA Master Agreement typically permit a single net payment in the event of default (close-out), including the bankruptcy or insolvency of the counterparty. However, bankruptcy or insolvency laws of a particular jurisdiction may impose restrictions on or prohibitions against the right of offset in bankruptcy, insolvency or other events.
For financial reporting purposes, the Series does not offset derivative assets and derivatives liabilities that are subject to netting arrangements on the “Statement of assets and liabilities.”
At Dec. 31, 2016, the Series had the following assets and liabilities subject to offsetting provisions:
Master Repurchase Agreements
Counterparty | Repurchase | Fair Value of Non-Cash Collateral Received(a) | Cash Collateral Received | Net Collateral Received | Net Exposure(b) | |||||||||||||||
Bank of America Merrill Lynch | $637,682 | $(637,682 | ) | $— | $(637,682 | ) | $— | |||||||||||||
Bank of Montreal | 743,963 | (743,963 | ) | — | (743,963 | ) | — | |||||||||||||
BNP Paribas | 509,355 | (509,355 | ) | — | (509,355 | ) | — | |||||||||||||
|
|
|
|
|
|
|
|
|
| |||||||||||
Total | $1,891,000 | $(1,891,000 | ) | $— | $(1,891,000 | ) | $— | |||||||||||||
|
|
|
|
|
|
|
|
|
| |||||||||||
(a) The value of the related collateral received exceeded the value of the repurchase agreements as of Dec. 31, 2016.
(b) Net exposure represents the receivable (payable) that would be due from (to) the counterparty in the event of default.
9. Securities Lending
The Series, along with other funds in the Delaware Investments® Family of Funds, may lend its securities pursuant to a security lending agreement (Lending Agreement) with The Bank of New York Mellon (BNY Mellon). At the time a security is loaned, the borrower must post collateral equal to the required percentage of the market value of the loaned security, including any accrued interest. The required percentage is: (1) 102% with respect to U.S. securities and foreign securities that are denominated and payable in U.S. dollars; and (2) 105% with respect to foreign securities. With respect to each loan, if on any business day the aggregate market value of securities collateral plus cash collateral held is less than the aggregate market value of the securities that are the subject of such loan, the borrower will be notified to provide additional collateral by the end of the following business day, which, together with the collateral already held, will be not less than the applicable initial collateral requirements for such security loan. If the aggregate market value of securities collateral and cash collateral held with respect to a security loan exceeds the applicable initial collateral requirement, upon the request of the borrower, BNY Mellon must return enough collateral to the borrower by the end of the following business day to reduce the value of the remaining collateral to the applicable initial collateral requirement for such security loan. As a result of the foregoing, the value of the collateral held with respect to a loaned security on any particular day may be more or less than the value of the security on loan.
Cash collateral received by each series of the Trust is generally invested in a series of individual separate accounts, each corresponding to a Series. The investment guidelines permit each separate account to hold certain securities that would be considered eligible securities for a money market fund. Cash collateral received is generally invested in government securities; certain obligations issued by government sponsored enterprises; repurchase agreements collateralized by U.S. Treasury securities; obligations issued by the central government of any Organization for Economic Cooperation and Development (OECD) country or its agencies, instrumentalities, or establishments; obligations of supranational organizations; commercial paper, notes, bonds, and other debt obligations; certificates of deposit, time deposits, and other bank obligations; and asset-backed securities.
In the event of default or bankruptcy by the lending agent, realization and/or retention of the collateral may be subject to legal proceedings. In the event the borrower fails to return loaned securities and the collateral received is insufficient to cover the value of the loaned securities and provided such collateral shortfall is not the result of investment losses, the lending agent has agreed to pay the amount of the shortfall to the Series or, at the discretion of the lending agent, replace the loaned securities. The Series continues to record dividends or interest, as applicable, on the securities loaned and are subject to changes in value of the securities loaned that may occur during the term of the loan. The Series has the right
Small Cap Value Series-17
Table of Contents
Delaware VIP® Small Cap Value Series
Notes to financial statements (continued)
9. Securities Lending (continued)
under the Lending Agreement to recover the securities from the borrower on demand. With respect to security loans collateralized by non-cash collateral, the Series receives loan premiums paid by the borrower. With respect to security loans collateralized by cash collateral, the earnings from the collateral investments are shared among the Series, the security lending agent, and the borrower. The Series records security lending income net of allocations to the security lending agent and the borrower.
The Series may incur investment losses as a result of investing securities lending collateral. This could occur if an investment in the collateral investment account defaulted or became impaired. Under those circumstances, the value of a Series’ cash collateral account may be less than the amount the Series would be required to return to the borrowers of the securities and the Series would be required to make up for this shortfall.
During the year ended Dec. 31, 2016, the Series had no securities out on loan.
10. Credit and Market Risk
The Series invests a significant portion of its assets in small companies and may be subject to certain risks associated with ownership of securities of such companies. Investments in small-sized companies may be more volatile than investments in larger companies for a number of reasons, which include limited financial resources or a dependence on narrow product lines.
The Series invests in REITs and is subject to the risks associated with that industry. If the Series holds real estate directly as a result of defaults or receives rental income directly from real estate holdings, its tax status as a regulated investment company may be jeopardized. There were no direct real estate holdings during the year ended Dec. 31, 2016. The Series’ REIT holdings are also affected by interest rate changes, particularly if the REITs it holds use floating rate debt to finance their ongoing operations.
The Series may invest up to 10% of its net assets in illiquid securities, which may include securities with contractual restrictions on resale, securities exempt from registration under Rule 144A promulgated under the Securities Act of 1933, as amended, and other securities which may not be readily marketable. The relative illiquidity of these securities may impair the Series from disposing of them in a timely manner and at a fair price when it is necessary or desirable to do so. While maintaining oversight, the Board has delegated to DMC the day-to-day functions of determining whether individual securities are liquid for purposes of the Series’ limitation on investments in illiquid securities. Securities eligible for resale pursuant to Rule 144A, which are determined to be liquid, are not subject to the Series’ 10% limit on investments in illiquid securities. As of Dec. 31, 2016, there were no Rule 144A securities held by the Series.
11. Contractual Obligations
The Series enters into contracts in the normal course of business that contain a variety of indemnifications. The Series’ maximum exposure under these arrangements is unknown. However, the Series has not had prior claims or losses pursuant to these contracts. Management has reviewed the Series’ existing contracts and expects the risk of loss to be remote.
12. Recent Accounting Pronouncements
On Oct. 13, 2016, the Securities and Exchange Commission amended existing rules intended to modernize reporting and disclosure of information. These amendments relate to Regulation S-X which sets forth the form and content of financial statements. At this time, management is evaluating the implications of adopting these amendments and their impact on the financial statements and accompanying notes.
13. Subsequent Events
Management has determined that no other material events or transactions occurred subsequent to Dec. 31, 2016 that would require recognition or disclosure in the Series’ financial statements.
Small Cap Value Series-18
Table of Contents
Delaware VIP® Trust — Delaware VIP Small Cap Value Series
Report of independent registered public accounting firm
To the Board of Trustees of Delaware VIP Trust and Shareholders of Delaware VIP Small Cap Value Series:
In our opinion, the accompanying statement of assets and liabilities, including the schedule of investments, and the related statements of operations and of changes in net assets and the financial highlights present fairly, in all material respects, the financial position of Delaware VIP Small Cap Value Series (one of the series constituting Delaware VIP Trust, hereafter referred to as the “Series”) as of December 31, 2016, the results of its operations for the year then ended, the changes in its net assets for each of the two years in the period then ended and the financial highlights for each of the five years in the period then ended, in conformity with accounting principles generally accepted in the United States of America. These financial statements and financial highlights (hereafter referred to as “financial statements”) are the responsibility of the Series’ management. Our responsibility is to express an opinion on these financial statements based on our audits. We conducted our audits of these financial statements in accordance with the standards of the Public Company Accounting Oversight Board (United States). Those standards require that we plan and perform the audit to obtain reasonable assurance about whether the financial statements are free of material misstatement. An audit includes examining, on a test basis, evidence supporting the amounts and disclosures in the financial statements, assessing the accounting principles used and significant estimates made by management, and evaluating the overall financial statement presentation. We believe that our audits, which included confirmation of securities as of December 31, 2016 by correspondence with the custodian and brokers, provide a reasonable basis for our opinion.
PricewaterhouseCoopers LLP
Philadelphia, Pennsylvania
February 16, 2017
Small Cap Value Series-19
Table of Contents
Delaware VIP® Trust — Delaware VIP Small Cap Value Series
Other Series information (Unaudited)
Board consideration of Delaware VIP Small Cap Value Series investment management agreement
At a meeting held on Aug. 16–18, 2016 (the “Annual Meeting”), the Board of Trustees (the “Board”), including a majority of disinterested or independent Trustees, approved the renewal of the Investment Advisory Agreement for Delaware VIP Small Cap Value Series (the “Series”). In making its decision, the Board considered information furnished at regular quarterly Board meetings, including reports detailing Series performance, investment strategies, and expenses, as well as information prepared specifically in connection with the renewal of the investment advisory and sub-advisory contracts. Information furnished specifically in connection with the renewal of the Investment Management Agreement with Delaware Management Company (“DMC”) included materials provided by DMC and its affiliates (“Delaware Investments”) concerning, among other things, the nature, extent, and quality of services provided to the Series; the costs of such services to the Series; economies of scale; and the investment manager’s financial condition and profitability. In addition, in connection with the Annual Meeting, reports were provided to the Trustees in May 2016 and included reports provided by Broadridge Financial Solutions (“Broadridge”). The Broadridge reports compared the Series’ investment performance and expenses with those of other comparable mutual funds. The Independent Trustees reviewed and discussed the Broadridge reports with independent legal counsel to the Independent Trustees. In addition to the information noted above, the Board also requested and received information regarding DMC’s policy with respect to advisory fee levels and its breakpoint philosophy; the structure of portfolio manager compensation; comparative client fee information; and any constraints or limitations on the availability of securities for certain investment styles, which had in the past year inhibited, or which were likely in the future to inhibit, the investment manager’s ability to invest fully in accordance with Series policies.
In considering information relating to the approval of the Series’ advisory agreement, the Independent Trustees received assistance and advice from and met separately with independent legal counsel to the Independent Trustees. Although the Board gave attention to all information furnished, the following discussion identifies, under separate headings, the primary factors taken into account by the Board during its contract renewal considerations.
Nature, extent, and quality of service. The Board considered the services provided by DMC to the Series and its shareholders. In reviewing the nature, extent, and quality of services, the Board considered reports furnished to it throughout the year, which covered matters such as the relative performance of the Series; compliance of portfolio managers with the investment policies, strategies, and restrictions for the Series; compliance by DMC and Delaware Distributors, L.P. (together, “Management”) personnel with the Code of Ethics adopted throughout the Delaware Investments® Family of Funds complex; and adherence to fair value pricing procedures as established by the Board. The Board was pleased with the current staffing of the Series’ investment advisor and the emphasis placed on research in the investment process. The Board recognized DMC’s receipt of several industry distinctions during the past several years. The Board gave favorable consideration to DMC’s efforts to control expenditures while maintaining service levels committed to Series matters. The Board was satisfied with the nature, extent, and quality of the overall services provided by DMC.
Investment performance. The Board placed significant emphasis on the investment performance of the Series in view of the importance of investment performance to shareholders. Although the Board gave appropriate consideration to performance reports and discussions with portfolio managers at Board meetings throughout the year, the Board gave particular weight to the Broadridge reports furnished for the Annual Meeting. The Broadridge reports prepared for the Series showed the investment performance of its Standard Class shares in comparison to a group of similar funds as selected by Broadridge (the “Performance Universe”). A fund with the best performance ranked first, and a fund with the poorest performance ranked last. The highest/best performing 25% of funds in the Performance Universe make up the first quartile; the next 25%, the second quartile; the next 25%, the third quartile; and the poorest/worst performing 25% of funds in the Performance Universe make up the fourth quartile. Comparative annualized performance for the Series was shown for the past 1-, 3-, 5-, and 10-year periods, as applicable, ended Jan. 31, 2016. The Board’s objective is that the Series’ performance for the periods considered be at or above the median of its Performance Universe.
Lipper currently classifies the Series as a small-cap core fund. However, Management believes that, because the Series utilizes a value investment philosophy and process, it would be more appropriate to include the Series in the small-cap value funds category. Accordingly, the Broadridge report prepared for the Series compares the Series’ performance to two separate Performance Universes — one, consisting of all small-cap core funds underlying variable insurance products, and the other, consisting of all small-cap value funds underlying variable insurance products. When compared to other small-cap core funds, the Broadridge report comparison showed that the Series’ total return for the 1- and 10-year periods was in the second quartile of its Performance Universe. The report further showed that the Series’ total return for the 3- and 5-year periods was in the fourth quartile and third quartile, respectively, of its Performance Universe. When compared to other small-cap value funds, the Broadridge report comparison showed that the Series’ total return for the 1-, 5-, and 10-year periods was in the second quartile of its Performance Universe. The report further showed that the Series’ total return for the 3-year period was in the third quartile of its Performance Universe. The Board was satisfied with performance.
Comparative expenses. The Board considered expense comparison data for the Delaware Investments Family of Funds. Management provided the Board with information on pricing levels and fee structures for the Series as of its most recently completed fiscal year. The Board also focused on the comparative analysis of effective management fees and total expense ratios of the Series versus effective management fees and expense ratios of a group of similar funds as selected by Broadridge (the “Expense Group”). In reviewing comparative costs, the Series’ contractual management fee and the actual management fee incurred by the Series were compared with the contractual management fees (assuming all funds in the Expense Group were similar in size to the Series) and actual management fees (as reported by each fund) within the Expense Group, taking into account any applicable breakpoints and fee waivers. The Series’ total expenses were also compared with those of its Expense Group. The Broadridge total expenses, for comparative consistency, were shown by Broadridge for Standard Class shares which do not charge 12b-1 and non-12b-1 service fees. The Board’s objective is to limit the Series’ total expense ratio to be competitive with that of the Expense Group.
Small Cap Value Series-20
Table of Contents
Delaware VIP® Trust — Delaware VIP Small Cap Value Series
Other Series information (Unaudited)
Board consideration of Delaware VIP Small Cap Value Series investment management agreement (continued)
When compared to other small-cap core and small-cap value funds, the expense comparisons for the Series showed that the actual management fee and total expenses were in the quartile with the lowest expenses of its Expense Group. The Board was satisfied with the management fee and total expenses of the Series in comparison to those of its Expense Group.
Management profitability. The Board considered the level of profits realized by DMC in connection with the operation of the Series. In this respect, the Board reviewed the Investment Management Profitability Analysis that addressed the overall profitability of DMC’s business in providing management and other services to each of the individual funds and the Delaware Investments® Family of Funds as a whole. Specific attention was given to the methodology followed in allocating costs for the purpose of determining profitability. Management stated that the level of profits of DMC, to a certain extent, reflects recent operational cost savings and efficiencies initiated by DMC. The Board considered DMC’s efforts to improve services provided to fund shareholders and to meet additional regulatory and compliance requirements resulting from recent industry-wide Securities and Exchange Commission initiatives. The Board also considered the extent to which DMC might derive ancillary benefits from fund operations, including the potential for procuring additional business as a result of the prestige and visibility associated with its role as service provider to the Delaware Investments Family of Funds and the benefits from allocation of fund brokerage to improve trading efficiencies. The Board found that the management fees were reasonable in light of the services rendered and the profitability of DMC.
Economies of scale. The Trustees considered whether economies of scale are realized by DMC as the Series’ assets increase and the extent to which any economies of scale are reflected in the level of management fees charged. The Trustees reviewed the standardized advisory fee pricing and structure approved by the Board and shareholders, which includes breakpoints, and which applies to most funds in the Delaware Investments Family of Funds complex. Breakpoints in the advisory fee occur when the advisory fee rate is reduced on assets in excess of specified levels. Breakpoints result in a lower advisory fee, than would otherwise be the case in the absence of breakpoints, when the asset levels specified in the breakpoints are exceeded. The Board noted that the fee under the Series’ management contract fell within the standardized fee pricing structure. The Board also noted that, as of May 31, 2016, the Series’ assets exceeded the second breakpoint level. The Board believed that, given the extent to which economies of scale might be realized by the advisor and its affiliates, the schedule of fees under the Investment Management Agreement provides a sharing of benefits with the Series and its shareholders.
Tax Information
All disclosures are based on financial information available as of the date of this annual report and, accordingly are subject to change. For any and all items requiring reporting, it is the intention of the Series to report the maximum amount permitted under the Internal Revenue Code and the regulations thereunder.
For the year ended Dec. 31, 2016, the Series reports distributions paid during the year as follows:
(A) Long-Term | (B) Ordinary Income Distributions (Tax Basis) | Total Distributions (Tax Basis) | (C) Qualifying Dividends1 | |||
| 90.50% | 9.50% | 100.00% | 100.00% |
(A) and (B) are based on a percentage of the Series’ total distributions.
(C) is based on a percentage of the Series’ ordinary income distributions.
1Qualifying dividends represent dividends which qualify for the corporate dividends received deduction.
Small Cap Value Series-21
Table of Contents
Delaware Investments® Family of Funds
Board of trustees / directors and officers addendum
A mutual fund is governed by a Board of Trustees/Directors (“Trustees”), which has oversight responsibility for the management of a fund’s business affairs. Trustees establish procedures and oversee and review the performance of the investment manager, the distributor, and others who perform services for the fund. The independent fund trustees, in particular, are advocates for shareholder interests. Each trustee has served in that capacity since he or she was elected to or appointed to the Board of Trustees, and will continue to serve until his or her retirement or the election of a new trustee in his or her place. The following is a list of the Trustees and Officers with certain background and related information.
Name, Address, and Birth Date | Position(s) Held with Fund(s) | Length of Time Served | Principal Occupation(s) During the Past Five Years | Number of Portfolios in Fund by Trustee or Officer | Other Trustee or Officer | |||||
| INTERESTED TRUSTEE | ||||||||||
Shawn K. Lytle1, 3 2005 Market Street Philadelphia, PA 19103
February 1970 | President, Chief Executive Officer, and Trustee | Trustee since September 2015
President and Chief Executive Officer since August 2015 | Shawn K. Lytle has served as President of Delaware Investments2 since June 2015 and was the Regional Head of Americas for UBS Global Asset Management from 2010 through 2015. | 62 | Trustee — UBS Relationship Funds, SMA Relationship Trust, and UBS Funds (May 2010–April 2015) | |||||
| INDEPENDENT TRUSTEES | ||||||||||
Thomas L. Bennett 2005 Market Street Philadelphia, PA 19103
October 1947 | Chairman and Trustee | Trustee since March 2005
Chairman since March 2015 | Private Investor (March 2004–Present) | 62 | None | |||||
Ann D. Borowiec 2005 Market Street Philadelphia, PA 19103
November 1958 | Trustee | Since March 2015 | Chief Executive Officer Private Wealth Management (2011–2013) and Market Manager, New Jersey Private Bank (2005–2011)— J.P. Morgan Chase & Co. | 62 | Director — Banco Santander International
Director —Santander Bank, N.A. | |||||
Joseph W. Chow 2005 Market Street Philadelphia, PA 19103
January 1953 | Trustee | Since January 2013 | Executive Vice President (Emerging Economies Strategies, Risks, and Corporate Administration) State Street Corporation (July 2004–March 2011) | 62 | Director and Audit Committee Member —Hercules Technology Growth Capital, Inc. (2004–2014) | |||||
John A. Fry 2005 Market Street Philadelphia, PA 19103
May 1960 | Trustee | Since January 2001 | President — Drexel University (August 2010–Present)
President — Franklin & Marshall College (July 2002–July 2010) | 62 | Director, Audit Committee and Governance Committee Member — Community Health Systems
Director — Drexel Morgan & Co.
Director, Audit Committee Member — vTv Therapeutics LLC | |||||
Lucinda S. Landreth 2005 Market Street Philadelphia, PA 19103
June 1947 | Trustee | Since March 2005 | Private Investor (2004–Present) | 62 | None | |||||
Small Cap Value Series-22
Table of Contents
Name, Address, and Birth Date | Position(s) Held with Fund(s) | Length of Time Served | Principal Occupation(s) During the Past Five Years | Number of Portfolios in Fund by Trustee or Officer | Other Trustee or Officer | |||||
Frances A. Sevilla-Sacasa 2005 Market Street Philadelphia, PA 19103
January 1956 | Trustee | Since September 2011 | Chief Executive Officer — Banco Itaú International (April 2012–December 2016)
Executive Advisor to Dean (August 2011–March 2012) and Interim Dean (January 2011–July 2011) — University of Miami School of Business Administration
President — U.S. Trust, Bank of America Private Wealth Management (Private Banking) (July 2007–December 2008) | 62 | Trust Manager and Audit Committee Member — Camden Property Trust | |||||
Thomas K. Whitford 2005 Market Street Philadelphia, PA 19103
March 1956 | Trustee | Since January 2013 | Vice Chairman (2010–April 2013) — PNC Financial Services Group | 62 | Director — HSBC Finance Corporation and HSBC North America Holdings Inc.
Director — HSBC Bank | |||||
Janet L. Yeomans 2005 Market Street Philadelphia, PA 19103
July 1948 | Trustee | Since April 1999 | Vice President and Treasurer (January 2006–July 2012)
Vice President — Mergers & Acquisitions (January 2003–January 2006), and Vice President and Treasurer (July 1995–January 2003) — 3M Company | 62 | Director, Personnel and Compensation Committee Chair, and Audit Committee Member — Okabena Company | |||||
| OFFICERS | ||||||||||
David F. Connor 2005 Market Street Philadelphia, PA 19103
December 1963 | Senior Vice President, General Counsel, and Secretary | Senior Vice President, since May 2013; General Counsel since May 2015; Secretary since October 2005 | David F. Connor has served in various capacities at different times at Delaware Investments. | 62 | None3 | |||||
Daniel V. Geatens 2005 Market Street Philadelphia, PA 19103
October 1972 | Vice President and Treasurer | Treasurer since October 2007 | Daniel V. Geatens has served in various capacities at different times at Delaware Investments. | 62 | None3 | |||||
Richard Salus 2005 Market Street Philadelphia, PA 19103
October 1963 | Senior Vice President and Chief Financial Officer
| Chief Financial Officer since November 2006 | Richard Salus has served in various capacities at different times at Delaware Investments. | 62 | None3 | |||||
| 1 | Shawn K. Lytle is considered to be an “Interested Trustee” because he is an executive officer of the Fund’s(s’) investment advisor. |
| 2 | Delaware Investments is the marketing name for Delaware Management Holdings, Inc. and its subsidiaries, including the Fund’s(s’) investment advisor, principal underwriter, and its transfer agent. |
| 3 | Shawn K. Lytle, David F. Connor, Daniel V. Geatens, and Richard Salus serve in similar capacities for the six portfolios of the Optimum Fund Trust, which have the same investment advisor, principal underwriter, and transfer agent as the registrant. |
The Statement of Additional Information for the Fund(s) includes additional information about the Trustees and Officers and is available, without charge, upon request by calling 800 523-1918.
Small Cap Value Series-23
Table of Contents
The Series files its complete schedule of portfolio holdings with the Securities and Exchange Commission (Commission) for the first and third quarters of each fiscal year on Form N-Q. The Series’ Forms N-Q, as well as a description of the policies and procedures that the Series uses to determine how to vote proxies (if any) relating to portfolio securities are available without charge (i) upon request, by calling 800 523-1918; and (ii) on the Commission’s website at sec.gov. In addition, a description of the policies and procedures that the Series uses to determine how to vote proxies (if any) relating to portfolio securities and the Schedule of Investments included in the Series’ most recent Form N-Q are available without charge on the Delaware Investments® Funds’ website at delawareinvestments.com/vip/literature. The Series’ Forms N-Q may be reviewed and copied at the Commission’s Public Reference Room in Washington, DC; information on the operation of the Public Reference Room may be obtained by calling 800 SEC-0330.
Information (if any) regarding how the Series voted proxies relating to portfolio securities during the most recently disclosed 12-month period ended June 30 is available without charge (i) through the Delaware Investments Funds’ website at delawareinvestments.com/proxy; and (ii) on the Commission’s website at sec.gov.
| ||||
| AR-VIPSCV [12/16] BNY 21388 (2/17) (18579) | Small Cap Value Series-24 |
Table of Contents
Delaware VIP® Trust
|
Delaware VIP Smid Cap Growth Series
|
Annual report
|
December 31, 2016
|

Table of Contents

Neither Delaware Investments nor its affiliates referred to in this document are authorized deposit-taking institutions for the purpose of the Banking Act 1959 (Commonwealth of Australia). The obligations of these entities do not represent deposits or other liabilities of Macquarie Bank Limited (MBL), a subsidiary of Macquarie Group Limited and an affiliate of Delaware Investments. MBL does not guarantee or otherwise provide assurance in respect of the obligations of these entities, unless noted otherwise. The Series is governed by U.S. laws and regulations.
Unless otherwise noted, views expressed herein are current as of Dec. 31, 2016, and subject to change for events occurring after such date.
The Series is not FDIC insured and is not guaranteed. It is possible to lose the principal amount invested.
Mutual fund advisory services provided by Delaware Management Company, a series of Delaware Management Business Trust, which is a registered investment advisor. Delaware Investments, a member of Macquarie Group, refers to Delaware Management Holdings, Inc. and its subsidiaries, including the Series’ distributor, Delaware Distributors, L.P. Macquarie Group refers to Macquarie Group Limited and its subsidiaries and affiliates worldwide.
This material may be used in conjunction with the offering of shares in Delaware VIP® Smid Cap Growth Series only if preceded or accompanied by the Series’ current prospectus or the summary prospectus.
© 2017 Delaware Management Holdings, Inc.
All third-party marks cited are the property of their respective owners.
Table of Contents
| Delaware VIP® Trust — Delaware VIP Smid Cap Growth Series | ||
| Portfolio management review | January 10, 2017 |
Jackson Square Partners, LLC (JSP), a U.S. registered investment advisor, is the sub-advisor to the Series. As sub-advisor, JSP is responsible for day-to-day management of the Series’ assets. Although JSP serves as sub-advisor, the investment manager, Delaware Management Company (DMC), a series of Delaware Management Business Trust, has ultimate responsibility for all investment advisory services.
For the fiscal year ended Dec. 31, 2016, Delaware VIP Smid Cap Growth Series Standard Class shares returned +8.29% and Service Class shares returned +8.02%. Both figures reflect all distributions reinvested. For the same period, the Series’ benchmark, the Russell 2500™ Growth Index, returned +9.73%.
U.S. markets set the stage for shifting monetary policies during the Series’ fiscal year after the U.S. Federal Reserve raised the federal funds rate in December 2015 for the first time in nearly a decade. Despite stabilizing energy prices and robust U.S. job growth, geopolitical concerns and a fractious election campaign led to increased economic uncertainty.
Short-term interest rates remained stable throughout the year, despite an uptick in wages and a first-half year decline in gasoline prices. Concern about global growth, a correction in foreign trade, and worries over a possible recession muted American investors’ enthusiasm during the spring.
Domestic consumers opened their pocketbooks midyear, easing some concerns over choppy payroll numbers. After a tumultuous presidential election cycle led to an unexpected result, U.S. markets rallied. The S&P 500® Index jumped in the final weeks of the year, gaining a healthy 12% for 2016. Meanwhile, the Fed increased interest rates again in December 2016.
Across the globe, China suffered stock market losses early in the year, as the government bolstered the yuan, which it had devalued in 2015. Brazil struggled to recover from a wide-spread, decade-long public scandal that uncovered a longstanding trend toward government and corporate cronyism.
Toward year end, several emerging market economies reacted sharply to the U.S. election result. Mexican stocks tumbled while Russian stocks rallied. Overall, emerging markets gained 11% during the year as measured by the MSCI Emerging Markets Index (net).
Developed international markets, meanwhile, didn’t fare as well. In June, the United Kingdom unexpectedly voted to leave the European Union, leading to a temporary rise in market volatility. The populist movements that swept first through the U.K. and then the United States have left many investors watching for potential further political changes in upcoming elections in Italy, France, Germany, and the Netherlands. Japan continued its long-standing battle against deflation and stagnant growth. Toward fall, policy meetings at the Fed, European Central Bank, and Bank of Japan led to positive outcomes for international bond markets. International developed markets lagged global markets overall as the MSCI EAFE Index (net) gained just 1% for the fiscal period.
While the Series’ performance was largely driven by our stock selection, on a sector level, consumer discretionary and financials detracted the most from performance versus the benchmark index.
Logitech contributed to the Series’ performance. The company continued to beat earnings expectations and raised guidance for future growth. Its restructuring to divest less profitable business segments, reduce costs, and focus on more profitable product-lines continued to drive benefits. As the PC market is in secular decline, Logitech is increasing its focus on tablets and smartphone accessories. We believe this has the potential to help the company create additional value.
Shutterstock also contributed to performance. The company beat revenue guidance and reported an increase in paid downloads year over year. First-time user growth and uploaded images growth were at record highs. The company also announced an image licensing deal with Google’s digital and mobile advertising products that broadens access to Shutterstock’s image library. We believe Shutterstock provides an attractive alternative to traditional licensed digital image and sound providers by providing a pure-pricing model and transparent terms at a lower cost. Image and sound licensing has historically been very expensive and often under excessively complex terms. Therefore, we feel Shutterstock appears poised to gain considerable market share.
VeriFone Systems detracted from the Series’ performance. The company remains under pressure due to the slower conversion rate of customers to adopt new technology for fraud prevention. However, we continue to believe VeriFone is well positioned and may be a key beneficiary if the trend toward electronic forms of payments continues. We continue to hold the position in the Series’ portfolio.
Liberty TripAdvisor Holdings also detracted from performance. Last year, the company launched InstantBook, which allows Liberty TripAdvisor visitors to book travel directly within the site. This business model transition to more transaction-oriented revenue is critical as we believe it has the potential to lead to more attractive financial metrics than the company’s legacy business. While utilization trends for InstantBook are improving, user behavior has been more difficult to change than expected. Management plans to increase its marketing to grow user awareness of Liberty TripAdvisor’s new direct booking
Unless otherwise noted, views expressed herein are current as of Dec. 31, 2016, and subject to change.
Smid Cap Growth Series-1
Table of Contents
| Delaware VIP® Trust — Delaware VIP Smid Cap Growth Series | January 10, 2017 | |
| Portfolio management review (continued) |
capabilities. Although consumer response has been slow, we believe Liberty TripAdvisor appears likely to benefit from combining its core legacy franchise in travel search with a growing transaction business.
We continue to believe the quality of a company’s business model, competitive position, and management are of utmost importance in our fundamental, bottom-up investment approach. We will monitor the macroeconomic implications of Donald Trump’s policies and how they affect the Series’ holdings, while maintaining our long-term investment philosophy: We want to own what we view as strong secular-growth companies with solid business models and competitive positions that we believe can grow market share and potentially deliver shareholder value in a variety of market environments.
| Unless otherwise noted, views expressed herein are current as of Dec. 31, 2016, and subject to change. | ||
| Smid Cap Growth Series-2 |
Table of Contents
Delaware VIP ® Trust — Delaware VIP Smid Cap Growth Series
Performance summary
The performance quoted represents past performance and does not guarantee future results. Investment return and principal value of an investment will fluctuate so that shares, when redeemed, may be worth more or less than their original cost. Current performance may be lower or higher than the performance quoted.
Carefully consider the Series’ investment objectives, risk factors, charges, and expenses before investing. This and other information can be found in the Series’ prospectus and its summary prospectus, which may be obtained by calling 800 523-1918. Investors should read the prospectus and the summary prospectus carefully before investing.
| Delaware VIP Smid Cap Growth Series | ||||||||||||||||||||
| Average annual total returns | ||||||||||||||||||||
| For periods ended Dec. 31, 2016 | 1 year | 3 years | 5 years | 10 years | Lifetime | |||||||||||||||
Standard Class shares (commenced operations on July 12, 1991) | +8.29% | +6.30% | +13.51% | +10.49% | +10.16% | |||||||||||||||
Service Class shares (commenced operations on May 1, 2000) | +8.02% | +6.04% | +13.23% | +10.23% | +6.04% | |||||||||||||||
Russell 2500 Growth Index | +9.73% | +5.45% | +13.88% | +8.24% | n/a | |||||||||||||||
Returns reflect the reinvestment of all distributions. Please see page 4 for a description of the index.
As described in the Series’ most recent prospectus, the net expense ratio for Service Class shares of the Series was 1.07%, while total operating expenses for Standard Class and Service Class shares were 0.82% and 1.12%, respectively. The management fee for Standard Class and Service Class shares was 0.74%.
The Series’ distributor has contracted to limit the 12b-1 fees for Service Class shares to no more than 0.25% of average daily net assets from Jan. 1, 2016 through Dec. 31, 2016.*
Earnings from a variable annuity or variable life investment compound tax-free until withdrawal, and as a result, no adjustments were made for income taxes.
Expense limitations were in effect for both classes during certain periods shown in the Series performance table above and in the Performance of a $10,000 Investment graph on the next page.
Performance data do not reflect insurance fees related to a variable annuity or variable life investment or the deferred sales charge that would apply to certain withdrawals of investments held for fewer than eight years. Performance shown here would have been reduced if such fees were included and the expense limitation removed. For more information about fees, consult your variable annuity or variable life prospectus.
Investments in variable products involve risk.
Investments in small and/or medium-sized companies typically exhibit greater risk and higher volatility than larger, more established companies.
Holding a relatively concentrated portfolio of a limited number of securities may increase risk because each investment has a greater effect on the Series’ overall performance than would be the case for a more diversified fund.
Please read both the contract and underlying prospectus for specific details regarding the product’s risk profile.
* The aggregate contractual waiver period covering this report is from April 29, 2015 through May 1, 2017 or, if longer, until the Series is offered under new participation agreements or under new contracts with existing insurance companies (other than the update and modification of existing contracts in the normal course of business that may require registration or re-registration under state insurance laws as a new insurance contract, provided the new insurance contract effectively replaces the current insurance contract).
Smid Cap Growth Series-3
Table of Contents
Delaware VIP® Smid Cap Growth Series
Performance summary (continued)
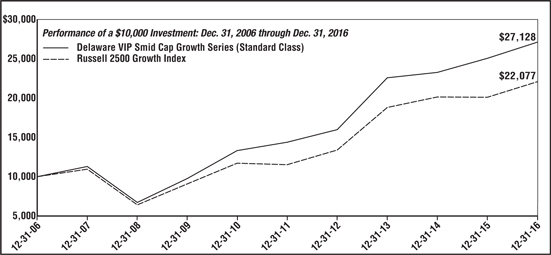
| For period beginning Dec. 31, 2006 through Dec. 31, 2016 | Starting value | Ending value | ||
– Delaware VIP Smid Cap Growth Series (Standard Class) | $10,000 | $27,128 | ||
– – Russell 2500 Growth Index | $10,000 | $22,077 |
The graph shows a $10,000 investment in the Delaware VIP Smid Cap Growth Series Standard Class shares for the period from Dec. 31, 2006 through Dec. 31, 2016.
The graph also shows $10,000 invested in the Russell 2500 Growth Index for the period from Dec. 31, 2006 through Dec. 31, 2016. The Russell 2500 Growth Index measures the performance of the small- to mid-cap growth segment of the U.S. equity universe. It includes those Russell 2500 companies with higher price-to-book ratios and higher forecasted growth values.
Russell Investment Group is the source and owner of the trademarks, service marks, and copyrights related to the Russell Indexes. Russell® is a trademark of the Russell Investment Group.
The S&P 500 Index, mentioned on page 1, measures the performance of 500 most large-cap stocks weighted by market value, and is often used to represent performance of the U.S. stock market.
The MSCI Emerging Markets Index, mentioned on page 1, measures equity market performance across emerging market countries worldwide. Index “net” return approximates the minimum possible dividend reinvestment, after deduction of withholding tax at the highest possible rate.
The MSCI EAFE (Europe, Australasia, Far East) Index, mentioned on page 1, is a free float-adjusted market capitalization weighted index designed to measure equity market performance of developed markets, excluding the United States and Canada. Index “net” return approximates the minimum possible dividend reinvestment, after deduction of withholding tax at the highest possible rate.
Index performance returns do not reflect any management fees, transaction costs or expenses. Indices are unmanaged and one cannot invest directly in an index.
Performance of Service Class shares will vary due to different charges and expenses.
Past performance is not a guarantee of future results.
| Smid Cap Growth Series-4 |
Table of Contents
Delaware VIP® Trust — Delaware VIP Smid Cap Growth Series
For the six-month period from July 1, 2016 to December 31, 2016 (Unaudited)
As a shareholder of the Series, you incur ongoing costs, which may include management fees; distribution and/or service (12b-1) fees; and other Series expenses. This example is intended to help you understand your ongoing costs (in dollars) of investing in the Series and to compare these costs with the ongoing costs of investing in other mutual funds.
The example is based on an investment of $1,000 invested at the beginning of the period and held for the entire six-month period from July 1, 2016 to Dec. 31, 2016.
Actual expenses
The first section of the table shown, “Actual Series return,” provides information about actual account values and actual expenses. You may use the information in this section of the table, together with the amount you invested, to estimate the expenses that you paid over the period. Simply divide your account value by $1,000 (for example, an $8,600 account value divided by $1,000 = 8.6), then multiply the result by the number in the first section under the heading entitled “Expenses Paid During Period” to estimate the expenses you paid on your account during the period.
Hypothetical example for comparison purposes
The second section of the table shown, “Hypothetical 5% Return,” provides information about hypothetical account values and hypothetical expenses based on the Series’ actual expense ratio and an assumed rate of return of 5% per year before expenses, which is not the Series’ actual return. The hypothetical account values and expenses may not be used to estimate the actual ending account balance or expenses you paid for the period. You may use this information to compare the ongoing costs of investing in the Series and other funds. To do so, compare the 5% hypothetical example with the 5% hypothetical examples that appear in the shareholder reports of other funds.
Please note that the expenses shown in the table are meant to highlight your ongoing costs only. As a shareholder of the Series, you do not incur any transaction costs, such as sales charges (loads), redemption fees or exchange fees, but shareholders of other funds may incur such costs. Also, the fees related to the variable annuity investment or the deferred sales charge that could apply have not been included. Therefore, the second section of the table is useful in comparing ongoing costs only, and will not help you determine the relative total costs of owning different funds. The Series’ actual expenses shown in the table reflect fee waivers in effect for Service Class shares. The expenses shown in the table assume reinvestment of all dividends and distributions.
| Expense analysis of an investment of $1,000 | ||||||||||||
| Beginning Account Value 7/1/16 | Ending Account Value 12/31/16 | Annualized Expense Ratio | Expenses Paid During Period 7/1/16 to 12/31/16* | |||||||||
Actual Series return† | ||||||||||||
Standard Class | $1,000.00 | $ | 1,065.70 | 0.81% | $4.21 | |||||||
Service Class | 1,000.00 | 1,064.50 | 1.06% | 5.50 | ||||||||
Hypothetical 5% return (5% return before expenses) | ||||||||||||
Standard Class | $1,000.00 | $ | 1,021.06 | 0.81% | $4.12 | |||||||
Service Class | 1,000.00 | 1,019.81 | 1.06% | 5.38 | ||||||||
| * | “Expenses Paid During Period” are equal to the Series’ annualized expense ratio, multiplied by the average account value over the period, multiplied by 184/366 (to reflect the one-half year period). |
| † | Because actual returns reflect only the most recent six-month period, the returns shown may differ significantly from fiscal year returns. |
Smid Cap Growth Series-5
Table of Contents
Delaware VIP® Trust — Delaware VIP Smid Cap Growth Series
Security type / sector allocation and top 10 equity holdings
As of December 31, 2016 (Unaudited)
Sector designations may be different than the sector designations presented in other Series materials. The sector designations may represent the investment manager’s internal sector classifications, which may result in the sector designations for one series being different than another series’ sector designations.
| Security type / sector | Percentage of net assets | |||
| ||||
Common Stock² | 95.14% | |||
Consumer Discretionary | 17.24% | |||
Energy | 2.90% | |||
Financial Services | 11.67% | |||
Healthcare | 9.56% | |||
Industrials | 6.75% | |||
Real Estate | 9.64% | |||
Technology1 | 37.38% | |||
| ||||
Short-Term Investments | 4.86% | |||
| ||||
Total Value of Securities | 100.00% | |||
| ||||
Liabilities Net of Receivables and Other Assets | 0.00% | |||
| ||||
Total Net Assets | 100.00% | |||
| ||||
| ² | Narrow industries are utilized for compliance purposes for diversification whereas broad sectors are used for financial reporting. |
| 1 | To monitor compliance with the Series’ concentration guidelines as described in the Series’ prospectus, the Technology sector (as disclosed herein for financial reporting purposes) is subdivided into a variety of “industries” (in accordance with the requirements of the 1940 Act). The Technology sector consisted of computers, diversified financial services, Internet, diversified machinery, software and telecommunications. As of Dec. 31, 2016, such amounts, as percentages of total net assets, were 7.27%, 1.12%, 10.37%, 4.78%, 12.29% and 1.55%, respectively. The percentage in any such single industry will comply with the Series’ concentration policy even if the percentage in the “Technology sector” for financial reporting purposes may exceed 25%. |
Holdings are for informational purposes only and are subject to change at any time.
They are not a recommendation to buy, sell, or hold any security.
| Top 10 equity holdings | Percentage of net assets | |||
Equity Commonwealth | 5.75% | |||
Sally Beauty Holdings | 5.39% | |||
j2 Global | 5.26% | |||
Blackbaud | 4.90% | |||
Zebra Technologies | 4.78% | |||
Bio-Techne | 4.69% | |||
Logitech International Class R | 4.55% | |||
Dunkin’ Brands Group | 4.39% | |||
Graco | 4.04% | |||
DineEquity
|
| 3.92%
|
| |
| Smid Cap Growth series-6 | ||
Table of Contents
Delaware VIP® Trust — Delaware VIP Smid Cap Growth Series
December 31, 2016
| Number of shares | Value (U.S. $) | |||||||
Common Stock – 95.14% ² | ||||||||
| Consumer Discretionary – 17.24% | ||||||||
DineEquity | 318,992 | $ | 24,562,384 | |||||
Dunkin’ Brands Group | 524,133 | 27,485,535 | ||||||
Liberty TripAdvisor Holdings Class A † | 1,473,445 | 22,175,347 | ||||||
Sally Beauty Holdings † | 1,277,516 | 33,751,973 | ||||||
|
| |||||||
| 107,975,239 | ||||||||
|
| |||||||
Energy – 2.90% | ||||||||
Core Laboratories | 151,335 | 18,166,253 | ||||||
|
| |||||||
| 18,166,253 | ||||||||
|
| |||||||
Financial Services – 11.67% | ||||||||
Affiliated Managers Group † | 122,752 | 17,835,866 | ||||||
LendingClub † | 1,869,059 | 9,812,560 | ||||||
LendingTree † | 159,942 | 16,210,122 | ||||||
MSCI Class A | 238,927 | 18,822,669 | ||||||
WisdomTree Investments | 933,130 | 10,395,068 | ||||||
|
| |||||||
| 73,076,285 | ||||||||
|
| |||||||
Healthcare – 9.56% | ||||||||
ABIOMED † | 180,895 | 20,383,249 | ||||||
athenahealth † | 96,378 | 10,136,074 | ||||||
Bio-Techne | 285,400 | 29,347,682 | ||||||
|
| |||||||
| 59,867,005 | ||||||||
|
| |||||||
Industrials – 6.75% | ||||||||
Expeditors International of Washington | 320,683 | 16,983,372 | ||||||
Graco | 304,236 | 25,278,969 | ||||||
|
| |||||||
| 42,262,341 | ||||||||
|
| |||||||
Real Estate – 9.64% | ||||||||
Equity Commonwealth † | 1,191,200 | 36,021,888 | ||||||
Outfront Media | 979,882 | 24,369,665 | ||||||
|
| |||||||
| 60,391,553 | ||||||||
|
| |||||||
Technology – 37.38% | ||||||||
Arista Networks † | 100,251 | 9,701,289 | ||||||
Blackbaud | 479,028 | 30,657,792 | ||||||
Ellie Mae † | 83,986 | 7,027,948 | ||||||
j2 Global | 402,635 | 32,935,543 | ||||||
Logitech International Class R | 1,145,636 | 28,513,060 | ||||||
NIC | 421,030 | 10,062,617 | ||||||
Pandora Media † | 1,593,536 | 20,779,709 | ||||||
Paycom Software † | 293,879 | 13,368,556 | ||||||
Quotient Technology † | 596,723 | 6,414,772 | ||||||
Shutterstock † | 254,847 | 12,110,329 | ||||||
VeriFone Systems † | 959,642 | 17,014,453 | ||||||
Yelp † | 407,447 | 15,535,954 | ||||||
Zebra Technologies † | 349,235 | 29,950,394 | ||||||
|
| |||||||
| 234,072,416 | ||||||||
|
| |||||||
Total Common Stock | 595,811,092 | |||||||
|
| |||||||
| Principal amount° | Value (U.S. $) | |||||||
Short-Term Investments – 4.86% |
| |||||||
| Discount Notes – 2.50% ≠ | ||||||||
Federal Home Loan Bank | ||||||||
0.379% 2/3/17 | 2,687,048 | $ | 2,685,914 | |||||
0.483% 1/30/17 | 6,476,121 | 6,474,320 | ||||||
0.499% 2/15/17 | 1,619,030 | 1,618,083 | ||||||
0.501% 2/6/17 | 4,857,090 | 4,854,842 | ||||||
|
| |||||||
| 15,633,159 | ||||||||
|
| |||||||
Repurchase Agreement – 2.36% |
| |||||||
Bank of America Merrill Lynch 0.41%, dated 12/30/16, to be repurchased on 1/3/17, repurchase price $4,989,054 (collateralized by U.S. government obligations | 4,988,827 | 4,988,827 | ||||||
Bank of Montreal | 5,820,298 | 5,820,298 | ||||||
BNP Paribas | 3,984,875 | 3,984,875 | ||||||
|
| |||||||
| 14,794,000 | ||||||||
|
| |||||||
Total Short-Term Investments | 30,427,159 | |||||||
|
| |||||||
| Smid Cap Growth Series-7 |
Table of Contents
Delaware VIP® Smid Cap Growth Series
Schedule of investments (continued)
Total Value of Securities – 100.00% | $ | 626,238,251 | ||
|
|
| ² | Narrow industries are utilized for compliance purposes for diversification whereas broad sectors are used for financial reporting. |
| ≠ | The rate shown is the effective yield at the time of purchase. |
| ° | Principal amount shown is stated in U.S. dollars unless noted that the security is denominated in another currency. |
| † | Non-income-producing security. |
See accompanying notes, which are an integral part of the financial statements.
| Smid Cap Growth Series-8 |
Table of Contents
| Delaware VIP® Trust — Delaware VIP Smid Cap Growth Series | ||
| Statement of assets and liabilities | December 31, 2016 |
Assets: | ||||
Investments, at value1 | $ | 595,811,092 | ||
Short-term investments, at value2 | 30,427,159 | |||
Cash | 334,371 | |||
Foreign tax reclaims receivable | 343,891 | |||
Dividends and interest receivable | 309,739 | |||
Receivable for series shares sold | 11,254 | |||
|
| |||
Total assets | 627,237,506 | |||
|
| |||
Liabilities: | ||||
Payable for series shares redeemed | 443,797 | |||
Investment management fees payable to affiliates | 395,900 | |||
Other accrued expenses | 104,592 | |||
Distribution fees payable to affiliates | 49,418 | |||
Dividend disbursing and transfer agent fees and expenses payable to affiliates | 4,015 | |||
Accounting and administration expenses payable to affiliates | 2,518 | |||
Trustees’ fees and expenses payable | 1,543 | |||
Legal fees payable to affiliates | 1,130 | |||
Reports and statements to shareholders expenses payable to affiliates | 553 | |||
|
| |||
Total liabilities | 1,003,466 | |||
|
| |||
Total Net Assets | $ | 626,234,040 | ||
|
| |||
Net Assets Consist of: | ||||
Paid-in capital | $ | 405,959,623 | ||
Undistributed net investment income | 1,441,761 | |||
Accumulated net realized gain on investments | 42,566,810 | |||
Net unrealized appreciation of investments | 176,283,068 | |||
Net unrealized depreciation of foreign currencies | (17,222 | ) | ||
|
| |||
Total Net Assets | $ | 626,234,040 | ||
|
| |||
Net Asset Value | ||||
Standard Class: | ||||
Net assets | $ | 394,897,989 | ||
Shares of beneficial interest outstanding, unlimited authorization, no par | 14,062,973 | |||
Net asset value per share | $ | 28.08 | ||
Service Class: | ||||
Net assets | $ | 231,336,051 | ||
Shares of beneficial interest outstanding, unlimited authorization, no par | 8,648,297 | |||
Net asset value per share | $ | 26.75 | ||
| ||||
1 Investments, at cost | $ | 419,528,996 | ||
2 Short-term investments, at cost | 30,426,187 | |||
See accompanying notes, which are an integral part of the financial statements.
Smid Cap Growth Series-9
Table of Contents
Delaware VIP® Trust —
Delaware VIP Smid Cap Growth Series
Year ended December 31, 2016
Investment Income: | ||||
Dividends | $ | 7,158,134 | ||
Interest | 79,172 | |||
Foreign tax withheld | (170,454 | ) | ||
|
| |||
| 7,066,852 | ||||
|
| |||
Expenses: | ||||
Management fees | 4,535,634 | |||
Distribution expenses – Service Class | 682,262 | |||
Accounting and administration expenses | 196,238 | |||
Reports and statements to shareholders expenses | 91,000 | |||
Dividend disbursing and transfer agent fees and expenses | 52,392 | |||
Custodian fees | 46,302 | |||
Legal fees | 42,333 | |||
Audit and tax fees | 33,500 | |||
Trustees’ fees and expenses | 30,307 | |||
Registration fees | 1,567 | |||
Other | 17,657 | |||
|
| |||
| 5,729,192 | ||||
Less waived distribution expenses – Service Class | (113,710 | ) | ||
Less expense paid indirectly | (3 | ) | ||
|
| |||
Total operating expenses | 5,615,479 | |||
|
| |||
Net Investment Income | 1,451,373 | |||
|
| |||
Net Realized and Unrealized Gain (Loss): | ||||
Net realized gain (loss) on: | ||||
Investments | 42,869,534 | |||
Foreign currencies | (5,313 | ) | ||
Foreign currency exchange contracts | 2,399 | |||
|
| |||
Net realized gain | 42,866,620 | |||
|
| |||
Net change in unrealized appreciation (depreciation) of: | ||||
Investments | 4,135,086 | |||
Foreign currencies | (13,935 | ) | ||
Foreign currency exchange contracts | 3,639 | |||
|
| |||
Net change in unrealized appreciation (depreciation) | 4,124,790 | |||
|
| |||
Net Realized and Unrealized Gain | 46,991,410 | |||
|
| |||
Net Increase in Net Assets Resulting from Operations | $ | 48,442,783 | ||
|
| |||
Delaware VIP Trust —
Delaware VIP Smid Cap Growth Series
Statements of changes in net assets
| Year ended | ||||||||
| 12/31/16 | 12/31/15 | |||||||
Increase (Decrease) in Net Assets from Operations: | ||||||||
Net investment income | $ | 1,451,373 | $ | 935,995 | ||||
Net realized gain | 42,866,620 | 80,842,112 | ||||||
Net change in unrealized appreciation (depreciation) | 4,124,790 | (38,437,282 | ) | |||||
|
|
|
| |||||
Net increase in net assets resulting from operations | 48,442,783 | 43,340,825 | ||||||
|
|
|
| |||||
Dividends and Distributions to Shareholders from: | ||||||||
Net investment income: | ||||||||
Standard Class | (901,532 | ) | (1,496,727 | ) | ||||
Service Class | — | (344,043 | ) | |||||
Net realized gain: | ||||||||
Standard Class | (49,931,968 | ) | (32,104,787 | ) | ||||
Service Class | (30,966,415 | ) | (17,711,337 | ) | ||||
|
|
|
| |||||
| (81,799,915 | ) | (51,656,894 | ) | |||||
|
|
|
| |||||
Capital Share Transactions: | ||||||||
Proceeds from shares sold: | ||||||||
Standard Class | 11,355,546 | 14,848,678 | ||||||
Service Class | 17,800,251 | 32,603,186 | ||||||
Net asset value of shares based upon reinvestment of dividends and distributions: | ||||||||
Standard Class | 50,833,500 | 33,601,514 | ||||||
Service Class | 30,966,415 | 18,055,380 | ||||||
|
|
|
| |||||
| 110,955,712 | 99,108,758 | |||||||
|
|
|
| |||||
Cost of shares redeemed: | ||||||||
Standard Class | (41,403,985 | ) | (35,294,706 | ) | ||||
Service Class | (34,451,586 | ) | (21,227,620 | ) | ||||
|
|
|
| |||||
| (75,855,571 | ) | (56,522,326 | ) | |||||
|
|
|
| |||||
Increase in net assets derived from capital share transactions | 35,100,141 | 42,586,432 | ||||||
|
|
|
| |||||
Net Increase in Net Assets | 1,743,009 | 34,270,363 | ||||||
Net Assets: | ||||||||
Beginning of year | 624,491,031 | 590,220,668 | ||||||
|
|
|
| |||||
End of year | $ | 626,234,040 | $ | 624,491,031 | ||||
|
|
|
| |||||
Undistributed net investment income | $ | 1,441,761 | $ | 894,834 | ||||
|
|
|
| |||||
See accompanying notes, which are an integral part of the financial statements.
| Smid Cap Growth Series-10 |
Table of Contents
Delaware VIP® Trust — Delaware VIP Smid Cap Growth Series
Selected data for each share of the Series outstanding throughout each period were as follows:
Delaware VIP Smid Cap Growth Series Standard Class | ||||||||||||||||||||||||||||
| Year ended | ||||||||||||||||||||||||||||
| 12/31/16 | 12/31/15 | 12/31/14 | 12/31/13 | 12/31/12 | ||||||||||||||||||||||||
Net asset value, beginning of period | $ 29.790 | $ 30.200 | $ 32.390 | $ 24.370 | $ 23.190 | |||||||||||||||||||||||
Income from investment operations: | ||||||||||||||||||||||||||||
Net investment income1 | 0.091 | 0.073 | 0.116 | 0.040 | 0.026 | |||||||||||||||||||||||
Net realized and unrealized gain | 2.146 | 2.211 | 0.620 | 9.542 | 2.570 | |||||||||||||||||||||||
|
|
|
|
|
|
|
|
|
| |||||||||||||||||||
Total from investment operations | 2.237 | 2.284 | 0.736 | 9.582 | 2.596 | |||||||||||||||||||||||
|
|
|
|
|
|
|
|
|
| |||||||||||||||||||
Less dividends and distributions from: | ||||||||||||||||||||||||||||
Net investment income | (0.070 | ) | (0.120 | ) | (0.021 | ) | (0.007 | ) | (0.060 | ) | ||||||||||||||||||
Net realized gain | (3.877 | ) | (2.574 | ) | (2.905 | ) | (1.555 | ) | (1.356 | ) | ||||||||||||||||||
|
|
|
|
|
|
|
|
|
| |||||||||||||||||||
Total dividends and distributions | (3.947 | ) | (2.694 | ) | (2.926 | ) | (1.562 | ) | (1.416 | ) | ||||||||||||||||||
|
|
|
|
|
|
|
|
|
| |||||||||||||||||||
Net asset value, end of period | $ 28.080 | $ 29.790 | $ 30.200 | $ 32.390 | $ 24.370 | |||||||||||||||||||||||
|
|
|
|
|
|
|
|
|
| |||||||||||||||||||
Total return2 | 8.29% | 7.54% | 3.15% | 41.32% | 11.02% | |||||||||||||||||||||||
Ratios and supplemental data: | ||||||||||||||||||||||||||||
Net assets, end of period (000 omitted) | $394,898 | $394,406 | $386,290 | $422,823 | $318,002 | |||||||||||||||||||||||
Ratio of expenses to average net assets | 0.82% | 0.83% | 0.83% | 0.83% | 0.84% | |||||||||||||||||||||||
Ratio of net investment income to average net assets | 0.33% | 0.24% | 0.40% | 0.14% | 0.11% | |||||||||||||||||||||||
Portfolio turnover | 15% | 23% | 18% | 19% | 23% | |||||||||||||||||||||||
| 1 | The average shares outstanding method has been applied for per share information. |
| 2 | Total investment return is based on the change in net asset value of a share during the period and assumes reinvestment of dividends and distributions at net asset value. Total investment return does not include fees, charges, or expenses imposed by the variable annuity and life insurance contracts for which Delaware VIP Trust serves as an underlying investment vehicle. |
See accompanying notes, which are an integral part of the financial statements.
| Smid Cap Growth Series-11 |
Table of Contents
Delaware VIP® Smid Cap Growth Series
Financial highlights (continued)
Selected data for each share of the Series outstanding throughout each period were as follows:
| Delaware VIP Smid Cap Growth Series Service Class | ||||||||||||||||||||||||
| Year ended | ||||||||||||||||||||||||
| 12/31/16 | 12/31/15 | 12/31/14 | 12/31/13 | 12/31/12 | ||||||||||||||||||||
Net asset value, beginning of period | $ 28.560 | $ 29.060 | $ 31.330 | $ 23.670 | $ 22.570 | |||||||||||||||||||
Income (loss) from investment operations: | ||||||||||||||||||||||||
Net investment income (loss)1 | 0.021 | (0.003 | ) | 0.042 | (0.029 | ) | (0.034 | ) | ||||||||||||||||
Net realized and unrealized gain | 2.046 | 2.127 | 0.593 | 9.244 | 2.492 | |||||||||||||||||||
|
|
|
|
|
|
|
|
|
| |||||||||||||||
Total from investment operations | 2.067 | 2.124 | 0.635 | 9.215 | 2.458 | |||||||||||||||||||
|
|
|
|
|
|
|
|
|
| |||||||||||||||
Less dividends and distributions from: | ||||||||||||||||||||||||
Net investment income | — | (0.050 | ) | — | — | (0.002 | ) | |||||||||||||||||
Net realized gain | (3.877 | ) | (2.574 | ) | (2.905 | ) | (1.555 | ) | (1.356 | ) | ||||||||||||||
|
|
|
|
|
|
|
|
|
| |||||||||||||||
Total dividends and distributions | (3.877 | ) | (2.624 | ) | (2.905 | ) | (1.555 | ) | (1.358 | ) | ||||||||||||||
|
|
|
|
|
|
|
|
|
| |||||||||||||||
Net asset value, end of period | $ 26.750 | $ 28.560 | $ 29.060 | $ 31.330 | $ 23.670 | |||||||||||||||||||
|
|
|
|
|
|
|
|
|
| |||||||||||||||
Total return2 | 8.02% | 7.31% | 2.87% | 40.98% | 10.71% | |||||||||||||||||||
Ratios and supplemental data: | ||||||||||||||||||||||||
Net assets, end of period (000 omitted) | $231,336 | $230,085 | $203,931 | $227,831 | $173,948 | |||||||||||||||||||
Ratio of expenses to average net assets | 1.07% | 1.08% | 1.08% | 1.08% | 1.09% | |||||||||||||||||||
Ratio of expenses to average net assets prior to fees waived | 1.12% | 1.13% | 1.13% | 1.13% | 1.14% | |||||||||||||||||||
Ratio of net investment income (loss) to average net assets | 0.08% | (0.01% | ) | 0.15% | (0.11% | ) | (0.14% | ) | ||||||||||||||||
Ratio of net investment income (loss) to average net assets prior to fees waived | 0.03% | (0.06% | ) | 0.10% | (0.16% | ) | (0.19% | ) | ||||||||||||||||
Portfolio turnover | 15% | 23% | 18% | 19% | 23% | |||||||||||||||||||
| 1 | The average shares outstanding method has been applied for per share information. |
| 2 | Total investment return is based on the change in net asset value of a share during the period and assumes reinvestment of dividends and distributions at net asset value. Total investment return during all of the periods shown reflects a waiver by the distributor. Performance would have been lower had the waiver not been in effect. Total investment return does not include fees, charges, or expenses imposed by the variable annuity and life insurance contracts for which Delaware VP Trust serves as an underlying investment vehicle. |
See accompanying notes, which are an integral part of the financial statements.
| Smid Cap Growth Series-12 |
Table of Contents
Delaware VIP® Trust — Delaware VIP Smid Cap Growth Series
December 31, 2016
Delaware VIP Trust (Trust) is organized as a Delaware statutory trust and offers 10 series: Delaware VIP Diversified Income Series, Delaware VIP Emerging Markets Series, Delaware VIP High Yield Series, Delaware VIP International Value Equity Series, Delaware VIP Limited-Term Diversified Income Series, Delaware VIP REIT Series, Delaware VIP Small Cap Value Series, Delaware VIP Smid Cap Growth Series, Delaware VIP U.S. Growth Series, and Delaware VIP Value Series. These financial statements and the related notes pertain to Delaware VIP Smid Cap Growth Series (Series). The Trust is an open-end investment company. The Series is considered diversified under the Investment Company Act of 1940, as amended, and offers Standard Class and Service Class shares. The Standard Class shares do not carry a 12b-1 fee and the Service Class shares carry a 12b-1 fee. The shares of the Series are sold only to separate accounts of life insurance companies.
The investment objective of the Series is to seek long-term capital appreciation.
1. Significant Accounting Policies
The following accounting policies are in accordance with U.S. generally accepted accounting principles (U.S. GAAP) and are consistently followed by the Series.
Security Valuation — Equity securities, except those traded on the Nasdaq Stock Market LLC (Nasdaq), are valued at the last quoted sales price as of the time of the regular close of the New York Stock Exchange on the valuation date. Equity securities traded on the Nasdaq are valued in accordance with the Nasdaq Official Closing Price, which may not be the last sales price. If, on a particular day, an equity security does not trade, the mean between the bid and ask prices will be used, which approximates fair value. Securities listed on a foreign exchange are normally valued at the last quoted sales price on the valuation date. U.S. government and agency securities are valued at the mean between the bid and ask prices, which approximates fair value. Foreign currency exchange contracts and foreign cross currency exchange contracts are valued at the mean between the bid and ask prices, which approximates fair value. Interpolated values are derived when the settlement date of the contract is an interim date for which quotations are not available. Generally, other securities and assets for which market quotations are not readily available are valued at fair value as determined in good faith under the direction of the Trusts’ Board of Trustees (Board). In determining whether market quotations are readily available or fair valuation will be used,various factors will be taken into consideration,such as market closures or suspension of trading in a security. The Series may use fair value pricing more frequently for securities traded primarily in non-U.S. markets because, among other things, most foreign markets close well before the Series values its securities, generally as of 4:00 p.m. Eastern time. The earlier close of these foreign markets gives rise to the possibility that significant events, including broad market moves, government actions or pronouncements, aftermarket trading, or news events may have occurred in the interim. Whenever such a significant event occurs, the Series may value foreign securities using fair value prices based on third-party vendor modeling tools (international fair value pricing).
Federal and Foreign Income Taxes — No provision for federal income taxes has been made as the Series intends to continue to qualify for federal income tax purposes as a regulated investment company under Subchapter M of the Internal Revenue Code of 1986, as amended, and make the requisite distributions to shareholders. The Series evaluates tax positions taken or expected to be taken in the course of preparing the Series’ tax returns to determine whether the tax positions are “more-likely-than-not” of being sustained by the applicable tax authority. Tax positions not deemed to meet the “more-likely-than-not” threshold are recorded as a tax benefit or expense in the current year. Management has analyzed the Series’ tax positions taken for all open federal income tax years (Dec. 31, 2013–Dec. 31, 2016), and has concluded that no provision for federal income tax is required in the Series’ financial statements. In regard to foreign taxes only, the Series has open tax years in certain foreign countries in which it invests that may date back to the inception of the Series.
Class Accounting — Investment income, common expenses, and realized and unrealized gain (loss) on investments are allocated to the various classes of the Series on the basis of daily net assets of each class. Distribution expenses relating to a specific class are charged directly to that class.
Repurchase Agreements — The Series may purchase certain U.S. government securities subject to the counterparty’s agreement to repurchase them at an agreed upon date and price. The counterparty will be required on a daily basis to maintain the value of the collateral subject to the agreement at not less than the repurchase price (including accrued interest). The agreements are conditioned upon the collateral being deposited under the Federal Reserve book-entry system with the Series’ custodian or a third-party sub-custodian. In the event of default or bankruptcy by the other party to the agreement, retention of the collateral may be subject to legal proceedings. All open repurchase agreements as of the date of this report were entered into on Dec. 30, 2016, and matured on the next business day.
Foreign Currency Transactions — Transactions denominated in foreign currencies are recorded at the prevailing exchange rates on the valuation date in accordance with the Series’ prospectus. The value of all assets and liabilities denominated in foreign currencies is translated daily into U.S. dollars at the exchange rate of such currencies against the U.S. dollar. Transaction gains or losses resulting from changes in exchange rates during the reporting period or upon settlement of the foreign currency transaction are reported in operations for the current period. The Series generally does not bifurcate that portion of realized gains and losses on investments which is due to changes in foreign exchange rates from that which is due to changes in market prices. These gains and losses are included on the “Statement of operations” under “Net realized and unrealized gain (loss) on investments.” The Series reports certain foreign currency related transactions as components of realized gains (losses) for financial reporting purposes, whereas such components are treated as ordinary income (loss) for federal income tax purposes.
Use of Estimates — The Series is an investment company, whose financial statements are prepared in conformity with U.S. GAAP. Therefore, the Series follows the accounting and reporting guidelines for investment companies. The preparation of financial statements in conformity with U.S. GAAP requires management to make estimates and assumptions that affect the fair value of investments, the reported amounts of assets and liabilities and disclosure of contingent assets and liabilities at the date of the financial statements, and the reported amounts of revenues and expenses during the reporting period. Actual results could differ from those estimates and the differences could be material.
Smid Cap Growth Series-13
Table of Contents
Delaware VIP® Smid Cap Growth Series
Notes to financial statements (continued)
1. Significant Accounting Policies (continued)
Other — Expenses directly attributable to the Series are charged directly to the Series. Other expenses common to various funds within the Delaware Investments® Family of Funds are generally allocated among such funds on the basis of average net assets. Management fees and certain other expenses are paid monthly. Security transactions are recorded on the date the securities are purchased or sold (trade date) for financial reporting purposes. Costs used in calculating realized gains and losses on the sale of investment securities are those of the specific securities sold. Dividend income is recorded on the ex-dividend date and interest income is recorded on the accrual basis. Discounts and premiums on debt securities are accreted or amortized to interest income, respectively, over the lives of the respective securities using the effective interest method. Foreign dividends are also recorded on the ex-dividend date or as soon after the ex-dividend date that the Series is aware of such dividends, net of all tax withholdings, a portion of which may be reclaimable. Withholding taxes and reclaims on foreign dividends have been recorded in accordance with the Series’ understanding of the applicable country’s tax rules and rates. The Series declares and pays dividends from net investment income and distributions from net realized gain on investments, if any, following the close of the fiscal year. The Series may distribute more frequently, if necessary for tax purposes. Dividends and distributions, if any, are recorded on the ex-dividend date.
Subject to seeking best execution, the Series may direct certain security trades to brokers who have agreed to rebate a portion of the related brokerage commission to the Series in cash. In general, best execution refers to many factors, including the price paid or received for a security, the commission charged, the promptness and reliability of execution, the confidentiality and placement accorded the order, and other factors affecting the overall benefit obtained by the Series on the transaction. There were no commission rebates for the year ended Dec. 31, 2016.
The Series may receive earnings credits from its custodian when positive cash balances are maintained, which may be used to offset custody fees. There were no such earnings credits for the year ended Dec. 31, 2016.
The Series receives earnings credits from its transfer agent when positive cash balances are maintained, which may be used to offset transfer agent fees. If the amount earned is greater than $1.00, the expense paid under this arrangement is included on the “Statement of operations” under “Dividend disbursing and transfer agent fees and expenses” with the corresponding expense offset shown under “Less expense paid indirectly.” For the year ended Dec. 31, 2016, the Series earned $3 under this agreement.
2. Investment Management, Administration Agreements, and Other Transactions with Affiliates
In accordance with the terms of its investment management agreement, the Series pays Delaware Management Company (DMC), a series of Delaware Management Business Trust and the investment manager, an annual fee which is calculated daily at the rate of 0.75% on the first $500 million of average daily net assets of the Series, 0.70% on the next $500 million, 0.65% on the next $1.5 billion, and 0.60% on average daily net assets in excess of $2.5 billion.
Jackson Square Partners, LLC (JSP), a related party of DMC, furnishes investment sub-advisory services to the Series. Effective June 1, 2016, for these services, DMC, not the Series, pays JSP fees based on the aggregate average daily net assets of the Series at the following annual rate: 0.45% of the first $500 million; 0.42% of the next $500 million; 0.39% of the next $1.5 billion; and 0.36% of aggregate average daily net assets in excess of $2.5 billion. Prior to June 1, 2016, the Series paid JSP fees on the aggregate average daily net assets of the Series at the following annual rate: 0.375% of the first $500 million; 0.350% of the next $500 million; 0.325% of the next $1.5 billion; and 0.300% of aggregate average daily net assets in excess of $2.5 billion.
Delaware Investments Fund Services Company (DIFSC), an affiliate of DMC, provides fund accounting and financial administration oversight services to the Series. For these services, DIFSC’s fees are calculated based on the aggregate daily net assets of the Delaware Investments Family of Funds at the following annual rate: 0.0050% of the first $30 billion; 0.0045% of the next $10 billion; 0.0040% of the next $10 billion; and 0.0025% of aggregate average daily net assets in excess of $50 billion. The fees payable to DIFSC under the service agreement described above are allocated among all funds in the Delaware Investments Family of Funds on a relative net asset value (NAV) basis. For the year ended Dec. 31, 2016, the Series was charged $28,971 for these services. This amount is included on the “Statement of operations” under “Accounting and administration expenses.”
DIFSC is also the transfer agent and dividend disbursing agent of the Series. For these services, DIFSC’s fees are calculated at the annual rate of 0.0075% of the Series’ average daily net assets. This amount is included on the “Statement of operations” under “Dividend disbursing and transfer agent fees and expenses.” For the year ended December 31, 2016, the Series was charged $45,918 for these services. Pursuant to a sub-transfer agency agreement between DIFSC and BNY Mellon Investment Servicing (US) Inc. (BNYMIS), BNYMIS provides certain sub-transfer agency services to the Series. Sub-transfer agency fees are paid by the Series and are also included on the “Statement of operations” under “Dividend disbursing and transfer agent fees and expenses.”
Pursuant to a distribution agreement and distribution plan, the Series pays Delaware Distributors, L.P. (DDLP), the distributor and an affiliate of DMC, an annual distribution and service fee of 0.30% of the average daily net assets of the Service Class shares. DDLP has contracted to waive distribution and service fees from Jan. 1, 2016 through Dec. 31, 2016* in order to limit distribution and service fees of the Service Class shares to 0.25% of average daily net assets. Standard Class shares pay no distribution and service expenses.
As provided in the investment management agreement, the Series bears a portion of the cost of certain resources shared with DMC, including the cost of internal personnel of DMC and/or its affiliates that provide legal, tax, and regulatory reporting services to the Series. For the year ended Dec. 31, 2016, the Series was charged $18,071 for internal legal, tax, and regulatory reporting services provided by DMC and/or its affiliates’ employees. This amount is included on the “Statement of operations” under “Legal fees.”
Smid Cap Growth Series-14
Table of Contents
Delaware VIP® Smid Cap Growth Series
Notes to financial statements (continued)
2. Investment Management, Administration Agreements, and Other Transactions with Affiliates (continued)
Trustees’ fees include expenses accrued by the Series for each Trustee’s retainer and meeting fees. Certain officers of DMC, DIFSC, and DDLP are officers and/or Trustees of the Trust. These officers and Trustees are paid no compensation by the Series.
Cross trades for the year ended Dec. 31, 2016 were executed by the Series pursuant to procedures adopted by the Board designed to ensure compliance with Rule 17a-7 under the 1940 Act. Cross trading is the buying or selling of portfolio securities between funds of investment companies, or between a fund of an investment company and another entity, that are or could be considered affiliates by virtue of having a common investment advisor (or affiliated investment advisors), common directors/trustees and or common officers. At its regularly scheduled meetings, the Board reviews such transactions for compliance with the procedures adopted by the Board. Pursuant to these procedures, for the year ended Dec. 31, 2016, the Series engaged in securities sales of $29,678,659, which resulted in net realized losses of $(105).
*The aggregate contractual waiver period covering this report is from April 29, 2015 through May 1, 2017 or, if longer, until the Series is offered under new participation agreements or under new contracts with existing insurance companies (other than the update and modification of existing contracts in the normal course of business that may require registration or re-registration under state insurance laws as a new insurance contract, provided the new insurance contract effectively replaces the current insurance contract).
3. Investments
For the year ended Dec. 31, 2016, the Series made purchases and sales of investment securities other than short-term investments as follows:
| Purchases | $ 90,177,971 | |||||
Sales | 140,532,529 |
At Dec. 31, 2016, the cost and unrealized appreciation (depreciation) of investments for federal income tax purposes for the Series were as follows:
| Cost of Investments | Aggregate Unrealized Appreciation of Investments | Aggregate Unrealized Depreciation of Investments | Net Unrealized Appreciation of Investments | |||||||
| $450,962,371 | $200,945,223 | $(25,669,343) | $175,275,880 |
U.S.GAAP defines fair value as the price that the Series would receive to sell an asset or pay to transfer aliability in an
orderly transaction between market participants at the measurement date under current market conditions. A three-level hierarchy for fair value measurements has been established based upon the transparency of inputs to the valuation of an asset or liability. Inputs may be observable or unobservable and refer broadly to the assumptions that market participants would use in pricing the asset or liability. Observable inputs reflect the assumptions market participants would use in pricing the asset or liability based on market data obtained from sources independent of the reporting entity. Unobservable inputs reflect the reporting entity’s own assumptions about the assumptions that market participants would use in pricing the asset or liability based on the best information available under the circumstances. The Series’ investment in its entirety is assigned a level based upon the observability of the inputs which are significant to the overall valuation. The three-level hierarchy of inputs is summarized below.
| Level 1 | – | Inputs are quoted prices in active markets for identical investments. (Examples: equity securities, open-end investment companies, futures contracts, exchange-traded options contracts) | ||
| Level 2 | – | Other observable inputs, including, but not limited to: quoted prices for similar assets or liabilities in markets that are active, quoted prices for identical or similar assets or liabilities in markets that are not active,inputs other than quoted prices that are observable for the assets or liabilities (such as interest rates,yield curves,volatilities,prepayment speeds,loss severities, credit risks, and default rates), or other market corroborated inputs. (Examples: debt securities, government securities, swap contracts, foreign currency exchange contracts, foreign securities utilizing international fair value pricing, broker-quoted securities, fair valued securities) | ||
| Level 3 | – | Significant unobservable inputs, including the Series’ own assumptions used to determine the fair value of investments. (Examples: broker-quoted securities, fair valued securities) |
Level 3 investments are valued using significant unobservable inputs. The Series may also use an income-based valuation approach in which the anticipated future cash flows of the investment are discounted to calculate fair value. Discounts may also be applied due to the nature or duration of any restrictions on the disposition of the investments. Valuations may also be based upon current market prices of securities that are comparable in coupon, rating, maturity, and industry. The derived value of a Level 3 investment may not represent the value which is received upon disposition and this could impact the results of operations.
Smid Cap Growth Series-15
Table of Contents
Delaware VIP® Smid Cap Growth Series
Notes to financial statements (continued)
3. Investments (continued)
The following table summarizes the valuation of the Series’ investments by fair value hierarchy levels as of Dec. 31, 2016:
Securities | Level 1 | Level 2 | Total | |||||||||
Common Stock | ||||||||||||
Consumer Discretionary | $ | 107,975,239 | $ | — | $ | 107,975,239 | ||||||
Energy | 18,166,253 | — | 18,166,253 | |||||||||
Financial Services | 73,076,285 | — | 73,076,285 | |||||||||
Healthcare | 59,867,005 | — | 59,867,005 | |||||||||
Industrials | 42,262,341 | — | 42,262,341 | |||||||||
Real Estate | 60,391,553 | — | 60,391,553 | |||||||||
Technology | 205,559,356 | 28,513,060 | 234,072,416 | |||||||||
Short-Term Investments | — | 30,427,159 | 30,427,159 | |||||||||
|
|
|
|
|
| |||||||
Total Value of Securities | $ | 567,298,032 | $ | 58,940,219 | $ | 626,238,251 | ||||||
|
|
|
|
|
| |||||||
As a result of utilizing international fair value pricing at Dec. 31, 2016, a portion of the portfolio was categorized
as Level 2.
During the year ended Dec. 31, 2016, there were no transfers between Level 1 investments, Level 2 investments, or Level 3 investments that had a significant impact to the Series. This does not include transfers between Level 1 investments and Level 2 investments due to the Series utilizing international fair value pricing during the period. In accordance with the fair valuation procedures described in Note 1, international fair value pricing of securities in the Series occurs when market volatility exceeds an established rolling threshold. If the threshold is exceeded on a given date, then prices of international securities (those that traded on exchanges that close at a different time than the time that Series’ NAV is determined) are established using a separate pricing feed from a third-party vendor designed to establish a price for each such security as of the time that the Series’ NAV is determined. Further, international fair value pricing uses other observable market-based inputs in place of the closing exchange price due to the events occurring after the close of the exchange or market on which the investment is principally traded, causing a change in classification between levels. The Series’ policy is to recognize transfers between levels at the beginning of the reporting period.
A reconciliation of Level 3 investments is presented when the Series has a significant amount of Level 3 investments at the beginning, interim, or end of the period in relation to net assets. During the year ended Dec. 31, 2016, there were no Level 3 investments.
4. Dividend and Distribution Information
Income and long-term capital gain distributions are determined in accordance with federal income tax regulations, which may differ from U.S. GAAP. Additionally, distributions from net gains on foreign currency transactions and net short-term gains on sales of investment securities are treated as ordinary income for federal income tax purposes. The tax character of dividends and distributions paid during the years ended Dec. 31, 2016 and 2015 were as follows:
| | Year ended | | | Year ended | | |||
Ordinary income | $ 901,532 | $ 3,969,664 | ||||||
Long-term capital gain | 80,898,383 | 47,687,230 | ||||||
|
|
|
| |||||
| $81,799,915 | $51,656,894 | |||||||
|
|
|
|
5. Components of Net Assets on a Tax Basis
As of Dec. 31, 2016, the components of net assets on a tax basis were as follows:
Shares of beneficial interest | $405,959,623 | |||
Undistributed ordinary income | 1,441,761 | |||
Undistributed long-term capital gains | 43,573,998 | |||
Unrealized appreciation on investments and foreign currencies | 175,258,658 | |||
|
| |||
Net assets | $626,234,040 | |||
|
|
The differences between book basis and tax basis components of net assets are primarily attributable to tax deferral of losses on wash sales.
Smid Cap Growth Series-16
Table of Contents
Delaware VIP® Smid Cap Growth Series
Notes to financial statements (continued)
5. Components of Net Assets on a Tax Basis (continued)
For financial reporting purposes, capital accounts are adjusted to reflect the tax character of permanent book/tax differences. Reclassifications are primarily due to tax treatment of gain (loss) on foreign currency transactions. Results of operations and net assets were not affected by these reclassifications. For the year ended Dec. 31, 2016 the Series recorded the following reclassifications:
Undistributed | Accumulated Net Realized Gain | |||
| $(2,914) | $2,914 |
6. Capital Shares
Transactions in capital shares were as follows:
| Year ended 12/31/16 | Year ended 12/31/15 | |||||||
Shares sold: | ||||||||
Standard Class | 410,393 | 496,149 | ||||||
Service Class | 681,271 | 1,140,929 | ||||||
Shares issued upon reinvestment of dividends and distributions: | ||||||||
Standard Class | 1,917,522 | 1,124,925 | ||||||
Service Class | 1,223,969 | 629,546 | ||||||
|
|
|
| |||||
| 4,233,155 | 3,391,549 | |||||||
|
|
|
| |||||
Shares redeemed: | ||||||||
Standard Class | (1,504,944) | (1,172,481) | ||||||
Service Class | (1,314,448) | (731,606) | ||||||
|
|
|
| |||||
| (2,819,392) | (1,904,087) | |||||||
|
|
|
| |||||
Net increase | 1,413,763 | 1,487,462 | ||||||
|
|
|
| |||||
7. Line of Credit
The Series, along with certain other funds in the Delaware Investments® Family of Funds (Participants) was a participant in a $155,000,000 revolving line of credit intended to be used for temporary or emergency purposes as an additional source of liquidity to fund redemptions of investor shares. Under the agreement, the Participants were charged an annual commitment fee of 0.10%, which was allocated across the Participants on the basis of relative net assets of each Participant’s allocation of the entire facility. The Participants were permitted to borrow up to a maximum of one third of their net assets under the agreement. Each Participant was individually, and not jointly, liable for its particular advances, if any, under the line of credit. The line of credit available under the agreement expired on Nov. 7, 2016.
On Nov. 7, 2016, the Series, along with the other Participants, entered into an amendment to the agreement for a $155,000,000 revolving line of credit. The line of credit is to be used as described above and operates in substantially the same manner as the original agreement,with the exception of the annual commitment fee. Under the amendment to the agreement, the Participants are charged an annual commitment fee of 0.15%, which is allocated across the Participants on the basis of relative net assets of each Participant’s allocation of the entire facility. The line of credit available under the agreement expires on Nov. 6, 2017.
The Series had no amounts outstanding as of Dec. 31, 2016 or at any time during the year then ended.
8. Derivatives
U. S. GAAP requires disclosures that enable investors to understand: (1) how and why an entity uses derivatives; (2) how they are accounted for; and (3) how they affect an entity’s results of operations and financial position.
Foreign Currency Exchange Contracts
The Series enters into foreign currency exchange contracts and foreign cross currency exchange contracts as a way of managing foreign exchange rate risk. The Series may enter into these contracts to fix the U.S. dollar value of a security that it has agreed to buy or sell for the period between the date the trade was entered into and the date the security is delivered and paid for. The Series may also use these contracts to hedge the U.S. dollar value of securities it already owns that are denominated in foreign currencies. In addition, the Series may enter into these contracts to facilitate or expedite the settlement of portfolio transactions. The change in value is recorded as an unrealized gain or loss. When the contract is closed, a realized gain or loss is recorded equal to the difference between the value of the contract at the time it was opened and the value at the time it was closed.
Smid Cap Growth Series-17
Table of Contents
Delaware VIP® Smid Cap Growth Series
Notes to financial statements (continued)
8. Derivatives (continued)
The use of foreign currency exchange contracts and foreign cross currency exchange contracts does not eliminate fluctuations in the underlying prices of the securities, but does establish a rate of exchange that can be achieved in the future. Although foreign currency exchange contracts and foreign cross currency exchange contracts limit the risk of loss due to an unfavorable change in the value of the hedged currency, they also limit any potential gain that might result should the value of the currency change favorably. In addition, the Series could be exposed to risks if the counterparties to the contracts are unable to meet the terms of their contracts. The Series’ maximum risk of loss from counterparty credit risk is the value of its currency exchanged with the counterparty. The risk is generally mitigated by having a netting arrangement between the Series and the counterparty and by the posting of collateral by the counterparty to the Series to cover the Series’ exposure to the counterparty.
There were no foreign currency exchange contracts outstanding at Dec. 31, 2016.
During the year ended Dec. 31, 2016, the Series entered into foreign currency exchange contracts to fix the U.S. dollar value of a security between trade date and settlement date.
During the year ended Dec. 31, 2016, the Series experienced net realized gains or losses attributable to foreign currency holdings, which is disclosed as “Net realized gain (loss) on foreign currency exchange contracts” on the “Statement of operations.”
Derivatives Generally. The table below summarizes the average balance of derivative holdings by the Series during the year ended Dec. 31, 2016.
| Long Derivative Volume | Short Derivative Volume | |||
Forward foreign currency exchange contracts (average cost) | $— | $23,041 |
9. Offsetting
In December 2011, theFinancial Accounting Standards Board(FASB)issued guidance that expanded disclosure requirements on the offsetting of certain assets and liabilities. The disclosures are required for investments and derivative financial instruments subject to master netting or similar agreements which are eligible for offset on the “Statement of assets and liabilities” and requires an entity to disclose both gross and net information about such investments and transactions in the financial statements. In January 2013, the FASB issued guidance that clarified which investments and transactions are subject to the offsetting disclosure requirements. The scope of the disclosure requirements for offsetting is limited to derivative instruments, repurchase agreements and reverse repurchase agreements, and securities borrowing.
In order to better define its contractual rights and to secure rights that will help the Series mitigate its counterparty risk, the Series entered into an International Swaps and Derivatives Association, Inc. Master Agreement (ISDA Master Agreement) or similar agreement with certain of its derivative contract counterparties. An ISDA Master Agreement is a bilateral agreement between the Series and a counterparty that governs certain over-the-counter (OTC) derivatives and foreign exchange contracts and typically contains, among other things, collateral posting items and netting provisions in the event of a default and/or termination event. Under an ISDA Master Agreement, the Series may, under certain circumstances, offset with the counterparty certain derivative financial instruments’ payables and/or receivables with collateral held and/or posted and create one single net payment. The provisions of the ISDA Master Agreement typically permit a single net payment in the event of default (close-out), including the bankruptcy or insolvency of the counterparty. However, bankruptcy or insolvency laws of a particular jurisdiction may impose restrictions on or prohibitions against the right of offset in bankruptcy, insolvency, or other events.
For financial reporting purposes, the Series does not offset derivative assets and derivatives liabilities that are subject to netting arrangements on the “Statement of assets and liabilities.”
At Dec. 31, 2016, the Series had the following assets and liabilities subject to offsetting provisions:
Master Repurchase Agreements
| Fair Value of | |||||||||||||||||||||||||
Counterparty | Repurchase Agreements | Non-Cash Collateral Received(a) | Cash Collateral Received | Net Collateral Received | Net Exposure(b) | ||||||||||||||||||||
Bank of America Merrill Lynch | $ 4,988,827 | $ (4,988,827) | $— | $ (4,988,827) | $— | ||||||||||||||||||||
Bank of Montreal | 5,820,298 | (5,820,298) | — | (5,820,298) | — | ||||||||||||||||||||
BNP Paribas | 3,984,875 | (3,984,875) | — | (3,984,875) | — | ||||||||||||||||||||
|
|
|
|
|
|
|
|
|
| ||||||||||||||||
Total | $14,794,000 | $(14,794,000) | $— | $(14,794,000) | $— | ||||||||||||||||||||
|
|
|
|
|
|
|
|
|
| ||||||||||||||||
(a) The value of the related collateral received exceeded the value of the repurchase agreements as of Dec. 31, 2016.
(b) Net exposure represents the receivable (payable) that would be due from (to) the counterparty in the event of default.
Smid Cap Growth Series-18
Table of Contents
Delaware VIP® Smid Cap Growth Series
Notes to financial statements (continued)
10. Securities Lending
The Series, along with other funds in the Delaware Investments® Family of Funds, may lend its securities pursuant to a security lending agreement (Lending Agreement) with The Bank of New York Mellon (BNY Mellon). At the time a security is loaned, the borrower must post collateral equal to the required percentage of the market value of the loaned security, including any accrued interest. The required percentage is: (1) 102% with respect to U.S. securities and foreign securities that are denominated and payable in U.S. dollars; and (2) 105% with respect to foreign securities. With respect to each loan, if on any business day the aggregate market value of securities collateral plus cash collateral held is less than the aggregate market value of the securities which are the subject of such loan, the borrower will be notified to provide additional collateral by the end of the following business day, which, together with the collateral already held, will be not less than the applicable initial collateral requirements for such security loan. If the aggregate market value of securities collateral and cash collateral held with respect to a security loan exceeds the applicable initial collateral requirement, upon request of the borrower, BNY Mellon must return enough collateral to the borrower by the end of the following business day to reduce the value of the remaining collateral to the applicable initial collateral requirement for such security loan. As a result of the foregoing, the value of the collateral held with respect to a loaned security on any particular day may be more or less than the value of the security on loan.
Cash collateral received by each series of the Trust is generally invested in a series of individual separate accounts, each corresponding to a Series. The investment guidelines permit each separate account to hold certain securities that would be considered eligible securities for a money market fund. Cash collateral received is generally invested in government securities; certain obligations issued by government sponsored enterprises; repurchase agreements collateralized by U.S.Treasury securities; obligations issued by the central government of any Organization for Economic Cooperation and Development (OECD) country or its agencies, instrumentalities, or establishments; obligations of supranational organizations; commercial paper, notes, bonds, and other debt obligations; certificates of deposit, time deposits, and other bank obligations; and asset-backed securities.
In the event of default or bankruptcy by the lending agent, realization and/or retention of the collateral may be subject to legal proceedings. In the event the borrower fails to return loaned securities and the collateral received is insufficient to cover the value of the loaned securities and provided such collateral shortfall is not the result of investment losses, the lending agent has agreed to pay the amount of the shortfall to the Series or, at the discretion of the lending agent, replace the loaned securities. The Series continues to record dividends or interest, as applicable, on the securities loaned and is subject to changes in value of the securities loaned that may occur during the term of the loan. The Series has the right under the Lending Agreement to recover the securities from the borrower on demand. With respect to security loans collateralized by non-cash collateral, the Series receives loan premiums paid by the borrower. With respect to security loans collateralized by cash collateral, the earnings from the collateral investments are shared among the Series, the security lending agent, and the borrower. The Series records security lending income net of allocations to the security lending agent and the borrower.
The Series may incur investment losses as a result of investing securities lending collateral. This could occur if an investment in the collateral investment account defaulted or became impaired. Under those circumstances, the value of a Series’ cash collateral account may be less than the amount the Series would be required to return to the borrowers of the securities and the Series would be required to make up for this shortfall.
During the year ended Dec. 31, 2016, the Series had no securities out on loan.
11. Credit and Market Risk
The Series invests a significant portion of its assets in small- and mid-sized companies and may be subject to certain risks associated with ownership of securities of such companies. Investments in small- or mid-sized companies may be more volatile than investments in larger companies for a number of reasons, which include more limited financial resources or a dependence on narrow product lines.
The Series may invest up to 10% of its net assets in illiquid securities, which may include securities with contractual restrictions on resale, securities exempt from registration under Rule 144A promulgated under the Securities Act of 1933, as amended, and other securities which may not be readily marketable. The relative illiquidity of these securities may impair the Series from disposing of them in a timely manner and at a fair price when it is necessary or desirable to do so. While maintaining oversight, the Trusts’ Board has delegated to DMC the day-to-day functions of determining whether individual securities are liquid for purposes of the Series’ limitation on investments in illiquid securities. Securities eligible for resale pursuant to Rule 144A, which are determined to be liquid, are not subject to the Series’ 10% limit on investments in illiquid securities. As of Dec. 31, 2016, there were no Rule 144A securities held by the Series.
12. Series Closed to New Investors
As of Feb. 24, 2012, the Series is no longer offered (1) under existing participation agreements for use with new insurance products; or (2) under new participation agreements to insurance companies that seek to include the Series in their products, except for certain insurance companies that have initiated negotiations to add the Series to a new product prior to Feb. 9, 2012. Contract holders of existing insurance companies that offer the Series will be able to continue to make purchases of shares, including purchases through reinvestment of dividends or capital gains distributions, and exchanges, regardless of whether they own, or have owned in the past, shares of the Series. The Series reserves the right to modify this policy at any time.
Smid Cap Growth Series-19
Table of Contents
Delaware VIP® Smid Cap Growth Series
Notes to financial statements (continued)
13. Contractual Obligations
The Series enters into contracts in the normal course of business that contain a variety of indemnifications. The Series’ maximum exposure under these arrangements is unknown. However, the Series has not had prior claims or losses pursuant to these contracts. Management has reviewed the Series’ existing contracts and expects the risk of loss to be remote.
14. Recent Accounting Pronouncements
On Oct. 13, 2016, the Securities and Exchange Commission amended existing rules intended to modernize reporting and disclosure of information. These amendments relate to Regulation S-X which sets forth the form and content of financial statements. At this time, management is evaluating the implications of adopting these amendments and their impact on the financial statements and accompanying notes.
15. Subsequent Events
Effective on or about April 28, 2017, the investment strategies for Delaware VIP Smid Cap Growth Series will change and the Series will be repositioned as a diversified small- and mid-capitalization core style fund (the “Repositioning”). In connection with this Repositioning, the Series’ name will change to Delaware VIP Smid Cap Core Series and the Series intends to re-open to new investors on or around April 28, 2017.
Management has determined that no other material events or transactions occurred subsequent to Dec. 31, 2016 that would require recognition or disclosure in the Series’ financial statements.
Smid Cap Growth Series-20
Table of Contents
Delaware VIP® Trust — Delaware VIP Smid Cap Growth Series
Report of independent registered public accounting firm
To the Board of Trustees of Delaware VIP Trust and Shareholders of Delaware VIP Smid Cap Growth Series:
In our opinion, the accompanying statement of assets and liabilities, including the schedule of investments, and the related statements of operations and of changes in net assets and the financial highlights present fairly, in all material respects, the financial position of Delaware VIP Smid Cap Growth Series (one of the series constituting Delaware VIP Trust, hereafter referred to as the “Series”) as of December 31, 2016, the results of its operations for the year then ended, the changes in its net assets for each of the two years in the period then ended and the financial highlights for each of the five years in the period then ended, in conformity with accounting principles generally accepted in the United States of America. These financial statements and financial highlights (hereafter referred to as “financial statements”) are the responsibility of the Series’ management. Our responsibility is to express an opinion on these financial statements based on our audits. We conducted our audits of these financial statements in accordance with the standards of the Public Company Accounting Oversight Board (United States). Those standards require that we plan and perform the audit to obtain reasonable assurance about whether the financial statements are free of material misstatement. An audit includes examining, on a test basis, evidence supporting the amounts and disclosures in the financial statements, assessing the accounting principles used and significant estimates made by management, and evaluating the overall financial statement presentation. We believe that our audits, which included confirmation of securities as of December 31, 2016 by correspondence with the custodian and brokers, provide a reasonable basis for our opinion.
PricewaterhouseCoopers LLP
Philadelphia, Pennsylvania
February 16, 2017
Smid Cap Growth Series-21
Table of Contents
Delaware VIP® Trust — Delaware VIP Smid Cap Growth Series
Other Series information (Unaudited)
Board consideration of Delaware VIP Smid Cap Growth Series investment advisory agreement
At a meeting held on Aug. 16–18, 2016 (the “Annual Meeting”), the Board of Trustees (the “Board”), including a majority of disinterested or independent Trustees, approved the renewal of the Investment Advisory Agreement for Delaware VIP Smid Cap Growth Series (the “Series”). In making its decision, the Board considered information furnished at regular quarterly Board meetings, including reports detailing Series performance, investment strategies, and expenses, as well as information prepared specifically in connection with the renewal of the investment advisory and sub-advisory contracts. Information furnished specifically in connection with the renewal of the Investment Management Agreement with Delaware Management Company (“DMC”) included materials provided by DMC and its affiliates (“Delaware Investments”) concerning, among other things, the nature, extent, and quality of services provided to the Series; the costs of such services to the Series; economies of scale; and the investment manager’s financial condition and profitability. In addition, in connection with the Annual Meeting, reports were provided to the Trustees in May 2016 and included reports provided by Broadridge Financial Solutions (“Broadridge”). The Broadridge reports compared the Series’ investment performance and expenses with those of other comparable mutual funds. The Independent Trustees reviewed and discussed the Broadridge reports with independent legal counsel to the Independent Trustees. In addition to the information noted above, the Board also requested and received information regarding DMC’s policy with respect to advisory fee levels and its breakpoint philosophy; the structure of portfolio manager compensation; comparative client fee information; and any constraints or limitations on the availability of securities for certain investment styles, which had in the past year inhibited, or which were likely in the future to inhibit, the investment manager’s ability to invest fully in accordance with Series policies.
In considering information relating to the approval of the Series’ advisory agreement, the Independent Trustees received assistance and advice from and met separately with independent legal counsel to the Independent Trustees. Although the Board gave attention to all information furnished, the following discussion identifies, under separate headings, the primary factors taken into account by the Board during its contract renewal considerations.
Nature, extent, and quality of service. The Board considered the services provided by DMC to the Series and its shareholders. In reviewing the nature, extent, and quality of services, the Board considered reports furnished to it throughout the year, which covered matters such as the relative performance of the Series; compliance of portfolio managers with the investment policies, strategies, and restrictions for the Series; compliance by DMC and Delaware Distributors, L.P. (together,” Management”) personnel with the Code of Ethics adopted throughout the Delaware Investments® Family of Funds complex; and adherence to fair value pricing procedures as established by the Board. The Board was pleased with the current staffing of the Series’ investment advisor and the emphasis placed on research in the investment process. The Board recognized DMC’s receipt of several industry distinctions during the past several years. The Board gave favorable consideration to DMC’s efforts to control expenditures while maintaining service levels committed to Series matters. The Board was satisfied with the nature, extent, and quality of the overall services provided by DMC.
Investment performance. The Board placed significant emphasis on the investment performance of the Series in view of the importance of investment performance to shareholders. Although the Board gave appropriate consideration to performance reports and discussions with portfolio managers at Board meetings throughout the year, the Board gave particular weight to the Broadridge reports furnished for the Annual Meeting. The Broadridge reports prepared for the Series showed the investment performance of its Standard Class shares in comparison to a group of similar funds as selected by Broadridge (the “Performance Universe”). A fund with the best performance ranked first, and a fund with the poorest performance ranked last. The highest/best performing 25% of funds in the Performance Universe make up the first quartile; the next 25%, the second quartile; the next 25%, the third quartile; and the poorest/worst performing 25% of funds in the Performance Universe make up the fourth quartile. Comparative annualized performance for the Series was shown for the past 1-, 3-, 5-, and 10-year periods, as applicable, ended Jan. 31, 2016. The Board’s objective is that the Series’ performance for the periods considered be at or above the median of its Performance Universe.
The Performance Universe for the Series consisted of the Series and all mid-cap growth funds underlying variable insurance products as selected by Broadridge. The Broadridge report comparison showed that the Series’ total return for the 1-, 3-, 5-, and 10-year periods was in the first quartile of its Performance Universe. The Board was satisfied with performance.
Comparative expenses. The Board considered expense comparison data for the Delaware Investments Family of Funds. Management provided the Board with information on pricing levels and fee structures for the Series as of its most recently completed fiscal year. The Board also focused on the comparative analysis of effective management fees and total expense ratios of the Series versus effective management fees and expense ratios of a group of similar funds as selected by Broadridge (the “Expense Group”). In reviewing comparative costs, the Series’ contractual management fee and the actual management fee incurred by the Series were compared with the contractual management fees (assuming all funds in the Expense Group were similar in size to the Series) and actual management fees (as reported by each fund) within the Expense Group, taking into account any applicable breakpoints and fee waivers. The Series’ total expenses were also compared with those of its Expense Group. The Broadridge total expenses, for comparative consistency, were shown by Broadridge for Standard Class shares which do not charge 12b-1 and non-12b-1 service fees. The Board’s objective is to limit the Series’ total expense ratio to be competitive with that of the Expense Group.
The expense comparisons for the Series showed that the actual management fee was in the quartile with the lowest expenses of its Expense Group and its total expenses were in the quartile with the second lowest expenses of its Expense Group. The Board was satisfied with the management fee and total expenses of the Series in comparison to those of its Expense Group.
Smid Cap Growth Series-22
Table of Contents
Delaware VIP® Trust — Delaware VIP Smid Cap Growth Series
Other Series information (Unaudited)
Board consideration of VIP Smid Cap Growth Series investment advisory agreement (continued)
Management profitability. The Board considered the level of profits realized by DMC in connection with the operation of the Series. In this respect, the Board reviewed the Investment Management Profitability Analysis that addressed the overall profitability of DMC’s business in providing management and other services to each of the individual funds and the Delaware Investments® Family of Funds as a whole. Specific attention was given to the methodology followed in allocating costs for the purpose of determining profitability. Management stated that the level of profits of DMC, to a certain extent, reflects recent operational cost savings and efficiencies initiated by DMC. The Board considered DMC’s efforts to improve services provided to fund shareholders and to meet additional regulatory and compliance requirements resulting from recent industry-wide Securities and Exchange Commission initiatives. The Board also considered the extent to which DMC might derive ancillary benefits from fund operations, including the potential for procuring additional business as a result of the prestige and visibility associated with its role as service provider to the Delaware Investments Family of Funds and the benefits from allocation of fund brokerage to improve trading efficiencies. The Board found that the management fees were reasonable in light of the services rendered and the profitability of DMC.
Economies of Scale. The Trustees considered whether economies of scale are realized by DMC as the Series’ assets increase and the extent to which any economies of scale are reflected in the level of management fees charged. The Trustees reviewed the standardized advisory fee pricing and structure approved by the Board and shareholders, which includes breakpoints, and which applies to most funds in the Delaware Investments Family of Funds complex. Breakpoints in the advisory fee occur when the advisory fee rate is reduced on assets in excess of specified levels. Breakpoints result in a lower advisory fee, than would otherwise be the case in the absence of breakpoints, when the asset levels specified in the breakpoints are exceeded. The Board noted that the fee under the Series’ management contract fell within the standardized fee pricing structure. The Board also noted that, as of May 31, 2016, the Series’ assets exceeded the first breakpoint level. The Board believed that, given the extent to which economies of scale might be realized by the advisor and its affiliates, the schedule of fees under the Investment Management Agreement provides a sharing of benefits with the Series and its shareholders.
Tax Information
All disclosures are based on financial information available as of the date of this annual report and, accordingly is subject to change. For any and all items requiring reporting, it is the intention of the Fund to report the maximum amount permitted under the Internal Revenue Code and the regulations thereunder.
For the year ended Dec. 31, 2016, the Series’ reports distributions paid during the year as follows:
(A) Long-Term | (B) Ordinary Income Distributions (Tax Basis) | Total Distributions (Tax Basis) | (C) Qualifying Dividends1 | |||
| 98.90% | 1.10% | 100.00% | 100.00% |
(A) and (B) are based on a percentage of the Series’ total distributions.
(C)is based on a percentage of the Series’ ordinary income distributions.
1 Qualifying dividends represent dividends which qualify for the corporate dividends received deduction.
Smid Cap Growth Series-23
Table of Contents
Delaware Investments® Family of Funds
Board of trustees/directors and officers addendum
A mutual fund is governed by a Board of Trustees/Directors (“Trustees”), which has oversight responsibility for the management of a fund’s business affairs. Trustees establish procedures and oversee and review the performance of the investment manager, the distributor, and others who perform services for the fund. The independent fund trustees, in particular, are advocates for shareholder interests. Each trustee has served in that capacity since he or she was elected to or appointed to the Board of Trustees, and will continue to serve until his or her retirement or the election of a new trustee in his or her place. The following is a list of the Trustees and Officers with certain background and related information.
Name, Address, and Birth Date | Position(s) Held with Fund(s) | Length of Time Served | Principal Occupation(s) During the Past Five Years | Number of or Officer | Other Directorships Held by Trustee or Officer | |||||
| INTERESTED TRUSTEE | ||||||||||
Shawn K. Lytle1, 3 2005 Market Street Philadelphia, PA 19103
February 1970 | President, Chief Executive Officer, and Trustee | Trustee since September 2015
President and Chief Executive Officer since August 2015 | Shawn K. Lytle has served as President of Delaware Investments2 since June 2015 and was the Regional Head of Americas for UBS Global Asset Management from 2010 through 2015. | 62 | Trustee — UBS Relationship Funds, SMA Relationship Trust, and UBS Funds (May 2010–April 2015) | |||||
| INDEPENDENT TRUSTEES | ||||||||||
Thomas L. Bennett 2005 Market Street Philadelphia, PA 19103 | Chairman and Trustee | Trustee since March 2005 | Private Investor (March 2004–Present) | 62 | None | |||||
October 1947 |
Chairman since March 2015 | |||||||||
Ann D. Borowiec 2005 Market Street Philadelphia, PA 19103
November 1958 | Trustee | Since March 2015 | Chief Executive Officer Private Wealth Management (2011–2013) and Market Manager, New Jersey Private Bank (2005–2011) — J.P. Morgan Chase & Co.
| 62 | Director — Banco Santander International
Director — Santander Bank, N.A. | |||||
Joseph W. Chow 2005 Market Street Philadelphia, PA 19103
January 1953 | Trustee | Since January 2013 | Executive Vice President (Emerging Economies Strategies, Risks, and Corporate Administration) State Street Corporation (July 2004–March 2011)
| 62 | Director and Audit Committee Member — Hercules Technology Growth Capital, Inc. (2004–2014) | |||||
John A. Fry 2005 Market Street Philadelphia, PA 19103
May 1960 | Trustee | Since January 2001 | President — Drexel University (August 2010–Present)
President — Franklin & Marshall College (July 2002–July 2010) | 62 | Director, Audit Committee and Governance Committee Member — Community Health Systems
Director — Drexel Morgan & Co.
Director, Audit Committee Member — vTv Therapeutics LLC | |||||
Lucinda S. Landreth 2005 Market Street Philadelphia, PA 19103
June 1947
| Trustee | Since March 2005 | Private Investor (2004–Present) | 62 | None | |||||
Smid Cap Growth Series-24
Table of Contents
Name, Address, and Birth Date | Position(s) Held with Fund(s) | Length of Time Served | Principal Occupation(s) During the Past Five Years | Number of Portfolios in Fund Complex Overseen by Trustee or Officer | Other Directorships Held by Trustee or Officer | |||||
Frances A. Sevilla-Sacasa 2005 Market Street Philadelphia, PA 19103
January 1956 | Trustee | Since September 2011 | Chief Executive Officer — Banco Itaú International (April 2012–December 2016)
Executive Advisor to Dean (August 2011–March 2012) and Interim Dean (January 2011–July 2011) — University of Miami School of Business Administration
President — U.S. Trust, Bank of America Private Wealth Management (Private Banking) (July 2007–December 2008)
| 62 | Trust Manager and Audit Committee Member — Camden Property Trust | |||||
Thomas K. Whitford 2005 Market Street Philadelphia, PA 19103
March 1956 | Trustee | Since January 2013 | Vice Chairman (2010–April 2013) — PNC Financial Services Group
| 62 | Director — HSBC Finance Corporation and HSBC North America Holdings Inc.
Director — HSBC Bank | |||||
Janet L. Yeomans 2005 Market Street Philadelphia, PA 19103
July 1948 | Trustee | Since April 1999 | Vice President and Treasurer (January 2006–July 2012)
Vice President — Mergers & Acquisitions (January 2003–January 2006), and Vice President and Treasurer (July 1995–January 2003) — 3M Company | 62 | Director, Personnel and Compensation Committee Chair, and Audit Committee Member — Okabena Company | |||||
| OFFICERS | ||||||||||
David F. Connor 2005 Market Street Philadelphia, PA 19103
December 1963 | Senior Vice President, General Counsel, and Secretary | Senior Vice President, since May 2013; General Counsel since May 2015; Secretary since October 2005 | David F. Connor has served in various capacities at different times at Delaware Investments.
| 62 | None3 | |||||
Daniel V. Geatens 2005 Market Street Philadelphia, PA 19103
October 1972 | Vice President and Treasurer | Treasurer since October 2007 | Daniel V. Geatens has served in various capacities at different times at Delaware Investments.
| 62 | None3 | |||||
Richard Salus 2005 Market Street Philadelphia, PA 19103
October 1963 | Senior Vice President and Chief Financial Officer | Chief Financial Officer since November 2006 | Richard Salus has served in various capacities at different times at Delaware Investments.
| 62 | None3 | |||||
| 1 | Shawn K. Lytle is considered to be an “Interested Trustee” because he is an executive officer of the Fund’s(s’) investment advisor. |
| 2 | Delaware Investments is the marketing name for Delaware Management Holdings, Inc. and its subsidiaries, including the Fund’s(s’) investment advisor, principal underwriter, and its transfer agent. |
| 3 | Shawn K. Lytle, David F. Connor, Daniel V. Geatens, and Richard Salus serve in similar capacities for the six portfolios of the Optimum Fund Trust, which have the same investment advisor, principal underwriter, and transfer agent as the registrant. |
The Statement of Additional Information for the Fund(s) includes additional information about the Trustees and Officers and is available, without charge, upon request by calling 800 523-1918.
Smid Cap Growth Series-25
Table of Contents
The Series files its complete schedule of portfolio holdings with the Securities and Exchange Commission (Commission) for the first and third quarters of each fiscal year on Form N-Q. The Series’ Forms N-Q, as well as a description of the policies and procedures that the Series uses to determine how to vote proxies (if any) relating to portfolio securities are available without charge (i) upon request, by calling 800 523-1918; and (ii) on the Commission’s website at sec.gov. In addition, a description of the policies and procedures that the Series uses to determine how to vote proxies (if any) relating to portfolio securities and the Schedule of Investments included in the Series’ most recent Form N-Q are available without charge on the Delaware Investments® Funds’ website at delawareinvestments.com/vip/literature. The Series’ Forms N-Q may be reviewed and copied at the Commission’s Public Reference Room in Washington, DC; information on the operation of the Public Reference Room may be obtained by calling 800 SEC-0330.
Information (if any) regarding how the Series voted proxies relating to portfolio securities during the most recently disclosed 12-month period ended June 30 is available without charge (i) through the Delaware Investments Funds’ website at delawareinvestments.com/proxy; and (ii) on the Commission’s website at sec.gov.
|
| AR-VIPSCG [12/16] 21389 (2/17) (18579) | Smid Cap Growth Series-26 |
Table of Contents
Delaware VIP® Trust
|
Delaware VIP U.S. Growth Series
|
Annual report
|
December 31, 2016
|

Table of Contents

Neither Delaware Investments nor its affiliates referred to in this document are authorized deposit-taking institutions for the purpose of the Banking Act of 1959 (Commonwealth of Australia). The obligations of these entities do not represent deposits or other liabilities of Macquarie Bank Limited (MBL), a subsidiary of Macquarie Group Limited and an affiliate of Delaware Investments. MBL does not guarantee or otherwise provide assurance in respect of the obligations of these entities, unless noted otherwise. The Series is governed by U.S. laws and regulations.
Unless otherwise noted, views expressed herein are current as of Dec. 31, 2016, and subject to change for events occurring after such date.
The Series is not FDIC insured and is not guaranteed. It is possible to lose the principal amount invested.
Mutual fund advisory services provided by Delaware Management Company, a series of Delaware Management Business Trust, which is a registered investment advisor and member of Macquarie Group. Delaware Investments, a member of Macquarie Group, refers to Delaware Management Holdings, Inc. and its subsidiaries, including the Series’ distributor, Delaware Distributors, L.P. Macquarie Group refers to Macquarie Group Limited and its subsidiaries and affiliates worldwide.
This material may be used in conjunction with the offering of shares in Delaware VIP U.S. Growth Series only if preceded or accompanied by the Series’ current prospectus or the summary prospectus.
© 2017 Delaware Management Holdings, Inc.
All third-party marks cited are the property of their respective owners.
Table of Contents
Jackson Square Partners, LLC (JSP), a U.S. registered investment advisor, is the sub-advisor to the Series. As sub-advisor, JSP is responsible for day-to-day management of the Series’ assets. Although JSP serves as sub-advisor, the investment manager, Delaware Management Company (DMC), a series of Delaware Management Business Trust, has ultimate responsibility for all investment advisory services.
For the fiscal year ended Dec. 31, 2016, Delaware VIP U.S. Growth Series Standard Class shares returned -5.17% and Service Class shares returned -5.50%. Both figures reflect all distributions reinvested. For the same period, the Series’ benchmark, the Russell 1000® Growth Index, returned +7.08%.
U.S. markets set the stage for shifting monetary policies during the year after the U.S. Federal Reserve raised the federal funds rate in December 2015 for the first time in nearly a decade. Despite stabilizing energy prices and robust U.S. job growth, geopolitical concerns and a fractious election campaign led to increased economic uncertainty.
Short-term interest rates remained stable throughout the year, despite an uptick in wages and a first-half year decline in gasoline prices. Concern about global growth, a correction in foreign trade, and worries over a possible recession muted American investors’ enthusiasm during the spring.
Domestic consumers opened their pocketbooks midyear, easing some concerns over choppy payroll numbers. After a tumultuous presidential election cycle led to an unexpected result, U.S. markets rallied. The S&P 500® Index jumped in the final weeks of the year, gaining a healthy 12% for 2016. Meanwhile, the Fed increased interest rates again in December 2016.
Across the globe, China suffered stock market losses early in the year, as the government bolstered the yuan, which it had devalued in 2015.
In June, the United Kingdom unexpectedly voted to leave the European Union, leading to a temporary rise in market volatility. The populist movements that swept first through the U.K. and then the United States have left many investors watching for potential further political changes in upcoming elections in Italy, France, Germany, and the Netherlands. Japan continued its long-standing battle against deflation and stagnant growth. Toward fall, policy meetings at the Fed, European Central Bank, and Bank of Japan led to positive outcomes for international bond markets.
The Series struggled during the fiscal year as stock selection mistakes, combined with meaningful systematic headwinds, exacerbated an already challenging period. While stock selection accounted for the majority of the Series’ relative performance, it’s notable that almost half of its underperformance was driven by systematic factors including sector and style exposures. Sector exposures were especially meaningful during the fiscal year as flows rotated to sectors where the Series is typically underweight (for example, energy, materials, industrials, utilities, and telecommunication services).
What could be overlooked in a disappointing fiscal year is that most of the Series’ portfolio holdings performed relatively well from an operating standpoint, even if those fundamentals weren’t being recognized by the market. In our opinion, the Series’ holdings possessed strong growth rates and were consistent with the historical profile of its portfolio. We believe that, in time, stock prices should reflect fundamentals; this keeps us optimistic about most of the holdings in the Series’ portfolio, which we believe is poised for revaluation. The largest contributors and detractors during the fiscal year are included below.
Qualcomm contributed to the Series’ performance. The company reported positive financial results, beating revenue guidance due to recovered royalties from China and improved smartphone demand. We believe Qualcomm has made its way through many of the headwinds that have plagued it. It has made substantial operating expense changes and has begun to see some benefits. Additionally, it recently announced the acquisition of NXP, which was viewed positively by the market.
Equinix also contributed to performance. The company announced further expansion plans that included additional data centers, the divestiture of certain data centers to Digital Realty, and a strategic partnership with Datang Telecom Group in China. Increased globalization, combined with the need for a secure and accessible network to meet the needs of clients’ geographically dispersed workforce, continued to create what we viewed as significant demand for Equinix’s products. We believe the company’s innovative product offerings appear to make it well positioned, particularly in a technology spending environment.
Valeant Pharmaceuticals International detracted from the Series’ performance. The stock was hurt by multiple factors, centered mainly on allegations of wrongdoing at its specialty pharmacy partner, Philidor, and questions over its ability to avoid a technical default on its debt obligations. While the company avoided technical default, we sold out of the Series’ position given the company’s growing list of fundamental challenges.
Allergan also detracted from performance. The stock sold off along with most of the pharmaceutical industry. Additionally, the stock reacted negatively when the proposed merger between Pfizer and Allergan was called off in early April. We continue to believe that Allergan operates at a high level, driven by the core ophthalmology franchise as well as by the broader use of Botox in both cosmetic and other medical indications and continue to hold the position in the Series’ portfolio.
U.S. Growth Series.-1
Table of Contents
| Delaware VIP® Trust — Delaware VIP U.S. Growth Series | ||
| Portfolio management review (continued) | January 10, 2017 | |
We continue to believe the quality of a company’s business model, competitive position, and management are of utmost importance in our fundamental, bottom-up investment approach. We will monitor the macroeconomic implications of Donald Trump’s policies and how they affect the Series’ holdings, while maintaining our long-term investment philosophy: We want to own strong secular-growth companies with solid business models and competitive positions that we believe can grow market share and potentially deliver shareholder value in a variety of market environments.
| Unless otherwise noted, views expressed herein are current as of Dec. 31, 2016, and subject to change. | ||
| U.S. Growth Series.-2 |
Table of Contents
Delaware VIP® Trust — Delaware VIP U.S. Growth Series
Performance summary
The performance quoted represents past performance and does not guarantee future results. Investment return and principal value of an investment will fluctuate so that shares, when redeemed, may be worth more or less than their original cost. Current performance may be lower or higher than the performance quoted.
Carefully consider the Series’ investment objectives, risk factors, charges, and expenses before investing. This and other information can be found in the Series’ prospectus and its summary prospectus, which may be obtained by calling 800 523-1918. Investors should read the prospectus and the summary prospectus carefully before investing.
| Delaware VIP U.S. Growth Series | ||||||||||||
| Average annual total returns | ||||||||||||
| For periods ended Dec. 31, 2016 | 1 year | 3 years | 5 years | 10 years | Lifetime | |||||||
Standard Class shares (commenced operations on Nov. 15, 1999) | –5.17% | +4.07% | +12.04% | +7.19% | +2.89% | |||||||
|
|
|
|
|
| |||||||
|
|
|
|
|
| |||||||
Service Class shares (commenced operations on May 1, 2000) | –5.50% | +3.76% | +11.73% | +6.91% | +2.18% | |||||||
|
|
|
|
|
| |||||||
|
|
|
|
|
| |||||||
Russell 1000 Growth Index | +7.08% | +8.55% | +14.50% | +8.33% | n/a | |||||||
Returns reflect the reinvestment of all distributions. Please see page 4 for a description of the index.
As described in the Series’ most recent prospectus, the net expense ratio for Service Class shares of the Series was 0.99%, while total operating expenses for Standard Class and Service Class shares were 0.74% and 1.04%, respectively. The management fee for Standard Class and Service Class shares was 0.65%.
The Series’ distributor has contracted to limit the 12b-1 fees for Service Class shares to no more than 0.25% of average daily net assets from Jan. 1, 2016 through Dec. 31, 2016.*
Earnings from a variable annuity or variable life investment compound tax-free until withdrawal, and as a result, no adjustments were made for income taxes.
Expense limitations were in effect for both classes during certain periods shown in the Series performance table above and in the Performance of a $10,000 Investment graph on the next page.
Performance data do not reflect insurance fees related to a variable annuity or variable life investment or the deferred sales charge that would apply to certain withdrawals of investments held for fewer than eight years. Performance shown here would have been reduced if such fees were included and the expense limitation removed. For more information about fees, consult your variable annuity or variable life prospectus
Investments in variable products involve risk.
Investments in small and/or medium-sized companies typically exhibit greater risk and higher volatility than larger, more established companies.
Please read both the contract and underlying prospectus for specific details regarding the product’s risk profile.
*The aggregate contractual waiver period covering this report is from April 29, 2015 through May 1, 2017.
U.S. Growth Series-3
Table of Contents
Delaware VIP® U.S. Growth Series
Performance summary (continued)
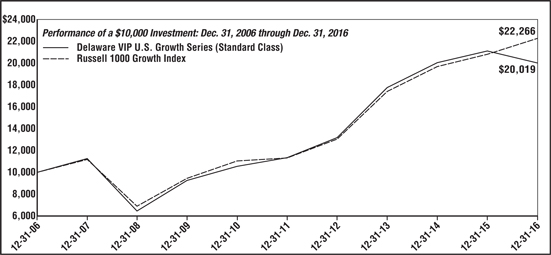
| For period beginning Dec. 31, 2006 through Dec. 31, 2016 | Starting value | Ending value | ||
––Russell 1000 Growth Index | $10,000 | $22,266 | ||
–– Delaware VIP U.S. Growth Series (Standard Class) | $10,000 | $20,019 |
The graph shows a $10,000 investment in the Delaware VIP U.S. Growth Series Standard Class shares for the period from Dec. 31, 2006 through Dec. 31, 2016.
The graph also shows $10,000 invested in the Russell 1000 Growth Index for the period from Dec. 31, 2006 through Dec. 31, 2016. The Russell 1000 Growth Index measures the performance of the large-cap growth segment of the U.S. equity universe. It includes those Russell 1000 companies with higher price-to-book ratios and higher forecasted growth values.
Russell Investment Group is the source and owner of the trademarks, service marks, and copyrights related to the Russell Indexes. Russell® is a trademark of Russell Investment Group.
The S&P 500 Index, mentioned on page 1, measures the performance of 500 mostly large-cap stocks weighted by market value, and is often used to represent performance of the U.S. stock market.
The MSCI Emerging Markets Index, mentioned on page 1, measures equity market performance across emerging market countries worldwide. Index “net” return approximates the minimum possible dividend reinvestment, after deduction of withholding tax at the highest possible rate.
The MSCI EAFE (Europe, Australasia, Far East) Index, mentioned on page 1, is a free float-adjusted market capitalization weighted index designed to measure equity market performance of developed markets, excluding the United States and Canada. Index “net” return approximates the minimum possible dividend reinvestment, after deduction of withholding tax at the highest possible rate.
Index performance returns do not reflect any management fees, transaction costs or expenses. Indices are unmanaged and one cannot invest directly in an index.
Performance of Service Class shares will vary due to different charges and expenses.
Past performance is not a guarantee of future results.
| U.S. Growth Series-4 |
Table of Contents
Delaware VIP® Trust — Delaware VIP U.S. Growth Series
For the six-month period from July 1, 2016 to December 31, 2016 (Unaudited)
As a shareholder of the Series, you incur ongoing costs, which may include management fees; distribution and/or service (12b-1) fees; and other Series expenses. This example is intended to help you understand your ongoing costs (in dollars) of investing in the Series and to compare these costs with the ongoing costs of investing in other mutual funds.
The example is based on an investment of $1,000 invested at the beginning of the period and held for the entire six-month period from July 1, 2016 to Dec. 31, 2016.
Actual expenses
The first section of the table shown, “Actual Series Return,” provides information about actual account values and actual expenses. You may use the information in this section of the table, together with the amount you invested, to estimate the expenses that you paid over the period. Simply divide your account value by $1,000 (for example, an $8,600 account value divided by $1,000 = 8.6), then multiply the result by the number in the first section under the heading entitled “Expenses Paid During Period” to estimate the expenses you paid on your account during the period.
Hypothetical example for comparison purposes
The second section of the table shown, “Hypothetical 5% Return,” provides information about hypothetical account values and hypothetical expenses based on the Series’ actual expense ratio and an assumed rate of return of 5% per year before expenses, which is not the Series’ actual return. The hypothetical account values and expenses may not be used to estimate the actual ending account balance or expenses you paid for the period. You may use this information to compare the ongoing costs of investing in the Series and other funds. To do so, compare the 5% hypothetical example with the 5% hypothetical examples that appear in the shareholder reports of other funds.
Please note that the expenses shown in the table are meant to highlight your ongoing costs only. As a shareholder of the Series, you do not incur any transaction costs, such as sales charges (loads), redemption fees, or exchange fees, but shareholders of other funds may incur such costs. Also, the fees related to the variable annuity investment or the deferred sales charge that could apply have not been included. Therefore, the second section of the table is useful in comparing ongoing costs only, and will not help you determine the relative total costs of owning different funds. The Series’ actual expenses shown in the table reflect fee waivers in effect for Service Class shares. The expenses shown in the table assume reinvestment of all dividends and distributions.
Expense analysis of an investment of $1,000 | ||||||||||||
| Beginning Account Value 7/1/16 | Ending Account Value 12/31/16 | Annualized Expense | Expenses Paid During Period 7/1/16 to 12/31/16* | |||||||||
Actual Series return† | ||||||||||||
Standard Class | $1,000.00 | $ | 1,027.70 | 0.73% | $3.72 | |||||||
Service Class | 1,000.00 | 1,024.80 | 0.98% | 4.99 | ||||||||
Hypothetical 5% return (5% return before expenses) | ||||||||||||
Standard Class | $1,000.00 | $ | 1,021.47 | 0.73% | $3.71 | |||||||
Service Class | 1,000.00 | 1,020.21 | 0.98% | 4.98 | ||||||||
| * | “Expenses Paid During Period” are equal to the Series’ annualized expense ratio, multiplied by the average account value over the period, multiplied by 184/366 (to reflect the one-half year period). |
| † | Because actual returns reflect only the most recent six-month period, the returns shown may differ significantly from fiscal year returns. |
U.S. Growth Series-5
Table of Contents
Delaware VIP® Trust — Delaware VIP U.S. Growth Series
Security type / sector allocation and top 10 equity holdings
As of December 31, 2016 (Unaudited)
Sector designations may be different than the sector designations presented in other series materials. The sector designations may represent the investment manager’s internal sector classifications.
| Security type / sector | Percentage of net assets | |||
Common Stock² | 97.34% | |||
Consumer Discretionary | 22.69% | |||
Consumer Staples | 1.83% | |||
Financial Services1 | 28.42% | |||
Healthcare | 16.06% | |||
Technology1 | 28.34% | |||
| ||||
Short-Term Investments | 2.51% | |||
| ||||
Total Value of Securities | 99.85% | |||
| ||||
Receivables and Other Assets Net of Liabilities | 0.15% | |||
| ||||
Total Net Assets | 100.00% | |||
| ||||
| ² | Narrow industries are utilized for compliance purposes for diversification whereas broad sectors are used for financial reporting. |
| 1 | To monitor compliance with the Series’ concentration guidelines as described in the Series’ prospectus and statement of additional information, the Financial Services and Technology sectors (as disclosed herein for financial reporting purposes) is subdivided into a variety of “industries” (in accordance with the requirements of the Investment Company Act of 1940). The Financial Services sector consisted of commercial services, diversified financial services, and real estate investment trusts. As of Dec. 31, 2016, such amounts, as a percentage of total net assets, were 5.48%, 16.06%, and 6.88%, respectively. The Technology sector consisted of internet, semiconductors, and software. As of Dec. 31, 2016, such amounts, as a percentage of total net assets, were 13.49%, 3.47%, and 11.38%, respectively. The percentage in any such single industry will comply with the Series’ concentration policy even if the percentages in the Financial Services and Technology sectors for financial reporting purposes may exceed 25%. |
Holdings are for informational purposes only and are subject to change at any time. They are not a recommendation to buy, sell, or hold any security.
| Top 10 equity holdings | Percentage of net assets | |
Visa Class A | 5.73% | |
Celgene | 5.70% | |
PayPal Holdings | 5.48% | |
Microsoft | 5.40% | |
Mastercard Class A | 4.66% | |
Crown Castle International | 4.51% | |
Liberty Interactive Corp. QVC Group Class A | 4.23% | |
Allergan | 4.18% | |
eBay | 4.17% | |
Biogen
| 3.97%
|
| U.S. Growth Series-6 |
Table of Contents
Delaware VIP® Trust — Delaware VIP U.S. Growth Series
December 31, 2016
| Number of shares | Value (U.S. $) | |||||||
Common Stock – 97.34% ² |
| |||||||
Consumer Discretionary – 22.69% |
| |||||||
Dollar General | 78,506 | $ | 5,814,939 | |||||
eBay † | 510,735 | 15,163,722 | ||||||
L Brands | 155,387 | 10,230,680 | ||||||
Liberty Global Class A † | 56,865 | 1,739,500 | ||||||
Liberty Global Class C † | 218,745 | 6,496,727 | ||||||
Liberty Interactive Corp. QVC Group Class A † | 771,319 | 15,410,954 | ||||||
Nielsen Holdings | 177,290 | 7,437,315 | ||||||
Quintiles IMS Holdings † | 145,286 | 11,049,000 | ||||||
TripAdvisor † | 199,670 | 9,258,698 | ||||||
|
| |||||||
| 82,601,535 | ||||||||
|
| |||||||
Consumer Staples – 1.83% |
| |||||||
Walgreens Boots Alliance | 80,324 | 6,647,614 | ||||||
|
| |||||||
| 6,647,614 | ||||||||
|
| |||||||
Financial Services – 28.42% |
| |||||||
Charles Schwab | 174,433 | 6,884,870 | ||||||
Crown Castle International | 189,013 | 16,400,658 | ||||||
Equinix | 24,131 | 8,624,661 | ||||||
Intercontinental Exchange | 243,697 | 13,749,385 | ||||||
Mastercard Class A | 164,413 | 16,975,642 | ||||||
PayPal Holdings † | 505,364 | 19,946,717 | ||||||
Visa Class A | 267,344 | 20,858,179 | ||||||
|
| |||||||
| 103,440,112 | ||||||||
|
| |||||||
Healthcare – 16.06% |
| |||||||
Allergan † | 72,500 | 15,225,725 | ||||||
Biogen † | 51,011 | 14,465,699 | ||||||
Celgene † | 179,081 | 20,728,626 | ||||||
DENTSPLY SIRONA | 139,152 | 8,033,245 | ||||||
|
| |||||||
| 58,453,295 | ||||||||
|
| |||||||
Technology – 28.34% |
| |||||||
Alphabet Class A † | 17,767 | 14,079,459 | ||||||
Alphabet Class C † | 14,100 | 10,882,662 | ||||||
Electronic Arts † | 179,652 | 14,149,392 | ||||||
Facebook Class A † | 122,786 | 14,126,529 | ||||||
Intuit | 66,460 | 7,616,981 | ||||||
Microsoft | 316,574 | 19,671,908 | ||||||
QUALCOMM | 193,453 | 12,613,136 | ||||||
Symantec | 418,831 | 10,005,873 | ||||||
|
| |||||||
| 103,145,940 | ||||||||
|
| |||||||
Total Common Stock | 354,288,496 | |||||||
|
| |||||||
| Principal amount° | Value (U.S. $) | |||||||
Short-Term Investments – 2.51% |
| |||||||
Discount Notes – 0.43%≠ |
| |||||||
Federal Home Loan Bank | ||||||||
0.47% 1/25/17 | 451,477 | $ | 451,375 | |||||
0.483% 1/30/17 | 556,464 | 556,309 | ||||||
0.499% 2/15/17 | 139,116 | 139,035 | ||||||
0.501% 2/6/17 | 417,348 | 417,155 | ||||||
|
| |||||||
| 1,563,874 | ||||||||
|
| |||||||
Repurchase Agreements – 2.08% |
| |||||||
Bank of America Merrill Lynch | 2,556,462 | 2,556,462 | ||||||
Bank of Montreal | 2,982,539 | 2,982,539 | ||||||
BNP Paribas 0.48%, dated 12/30/16, to be repurchased on 1/3/17, repurchase price $2,042,108 (collateralized by U.S. government obligations 2.125% 12/31/22; market value $2,082,841) | 2,041,999 | 2,041,999 | ||||||
|
| |||||||
| 7,581,000 | ||||||||
|
| |||||||
Total Short-Term Investments |
| 9,144,874 | ||||||
|
| |||||||
U.S. Growth Series-7
Table of Contents
Delaware VIP® U.S. Growth Series
Schedule of investments(continued)
Total Value of Securities – 99.85% | $ | 363,433,370 | ||
|
|
² Narrow industries are utilized for compliance purposes for diversification whereas broad sectors are used for financial reporting.
≠ The rate shown is the effective yield at the time of purchase.
° Principal amount shown is stated in U.S. dollars unless noted that the security is denominated in another currency.
† Non-income-producing security.
See accompanying notes, which are an integral part of the financial statements.
| U.S. Growth Series-8 |
Table of Contents
| Delaware VIP® Trust — Delaware VIP U.S. Growth Series | ||||
| Statement of assets and liabilities | December 31, 2016 |
Assets: | ||||
Investments, at value1 | $ | 354,288,496 | ||
Short-term investments, at value2 | 9,144,874 | |||
Cash | 221,840 | |||
Receivable for securities sold | 483,764 | |||
Receivable for series shares sold | 104,945 | |||
Foreign tax reclaims receivable | 37,096 | |||
Dividends and interest receivable | 30,573 | |||
|
| |||
Total assets | 364,311,588 | |||
|
| |||
Liabilities: | ||||
Payable for series shares redeemed | 199 | |||
Investment management fees payable to affiliates | 200,922 | |||
Other accrued expenses | 70,880 | |||
Distribution fees payable to affiliates | 67,210 | |||
Dividend disbursing and transfer agent fees and expenses payable to affiliates | 2,319 | |||
Accounting and administration expenses payable to affiliates | 1,454 | |||
Trustees’ fees and expenses payable | 898 | |||
Legal fees payable to affiliates | 659 | |||
Reports and statements to shareholders expense payable to affiliates | 321 | |||
|
| |||
Total liabilities | 344,862 | |||
|
| |||
Total Net Assets | $ | 363,966,726 | ||
|
| |||
Net Assets Consist of: | ||||
Paid-in capital | $ | 290,478,101 | ||
Accumulated net realized gain | 2,990,543 | |||
Net unrealized appreciation of investments | 70,498,082 | |||
|
| |||
Total Net Assets | $ | 363,966,726 | ||
|
| |||
Standard Class: | ||||
Net assets | $ | 47,772,438 | ||
Shares of beneficial interest outstanding, unlimited authorization, no par | 5,363,937 | |||
Net asset value per share | $ | 8.91 | ||
Service Class: | ||||
Net assets | $ | 316,194,288 | ||
Shares of beneficial interest outstanding, unlimited authorization, no par | 36,407,053 | |||
Net asset value per share | $ | 8.68 | ||
| 1 Investments, at cost | $ | 283,790,558 | ||
| 2 Short-term investments, at cost | 9,144,730 | |||
See accompanying notes, which are an integral part of the financial statements.
U.S. Growth Series-9
Table of Contents
Delaware VIP U.S. Growth Series
Statement of operations
Year ended December 31, 2016
Investment Income: |
| |||
Dividends | $ | 3,634,192 | ||
Interest | 15,307 | |||
Foreign tax withheld | (46,370 | ) | ||
|
| |||
| 3,603,129 | ||||
|
| |||
Expenses: | ||||
Management fees | 2,446,824 | |||
Distribution expenses - Service Class | 988,517 | |||
Accounting and administration expenses | 120,730 | |||
Reports and statements to shareholders | 70,869 | |||
Audit and tax fees | 33,129 | |||
Dividend disbursing and transfer agent fees and expenses | 32,115 | |||
Legal fees | 25,991 | |||
Custodian fees | 19,902 | |||
Trustees’ fees and expenses | 18,534 | |||
Registration fees | 2,937 | |||
Other | 11,941 | |||
|
| |||
| 3,771,489 | ||||
Less waived distribution expenses - Service Class | (164,753 | ) | ||
Less expense paid indirectly | (1 | ) | ||
|
| |||
Total operating expenses | 3,606,735 | |||
|
| |||
Net Investment Loss | (3,606 | ) | ||
|
| |||
Net Realized and Unrealized Gain (Loss): | ||||
Net realized gain | 5,300,020 | |||
Net change in unrealized appreciation (depreciation) of investments | (26,965,270 | ) | ||
|
| |||
Net Realized And Unrealized Loss | (21,665,250 | ) | ||
|
| |||
Net Decrease in Net Assets Resulting from Operations | $ | (21,668,856 | ) | |
|
| |||
Delaware VIP U.S. Growth Series
Statements of changes in net assets
| Year ended | ||||||||
| 12/31/16 | 12/31/15 | |||||||
Increase (Decrease) in Net Assets from |
| |||||||
Net investment income (loss) | $ | (3,606 | ) | $ | 1,677,533 | |||
Net realized gain | 5,300,020 | 110,853,775 | ||||||
Net change in unrealized appreciation (depreciation) | (26,965,270 | ) | (86,840,112 | ) | ||||
|
|
|
| |||||
Net increase (decrease) in net assets resulting from operations | (21,668,856 | ) | 25,691,196 | |||||
|
|
|
| |||||
Dividends and Distributions to |
| |||||||
Net investment income: | ||||||||
Standard Class | (315,595 | ) | (720,106 | ) | ||||
Service Class | (1,361,730 | ) | (1,281,789 | ) | ||||
Net realized gain: | ||||||||
Standard Class | (13,642,821 | ) | (9,901,463 | ) | ||||
Service Class | (97,717,762 | ) | (29,374,328 | ) | ||||
|
|
|
| |||||
| (113,037,908 | ) | (41,277,686 | ) | |||||
|
|
|
| |||||
Capital Share Transactions: |
| |||||||
Proceeds from shares sold: | ||||||||
Standard Class | 6,951,016 | 17,136,450 | ||||||
Service Class | 11,860,309 | 20,285,073 | ||||||
Net asset value of shares based upon reinvestment of dividends and distributions: | ||||||||
Standard Class | 13,958,416 | 3,431,786 | ||||||
Service Class | 99,079,492 | 30,656,116 | ||||||
|
|
|
| |||||
| 131,849,233 | 71,509,425 | |||||||
|
|
|
| |||||
Cost of shares redeemed: | ||||||||
Standard Class | (6,700,046 | ) | (127,658,252 | ) | ||||
Service Class | (38,221,680 | ) | (43,233,826 | ) | ||||
|
|
|
| |||||
| (44,921,726 | ) | (170,892,078 | ) | |||||
|
|
|
| |||||
Increase (decrease) in net assets derived from capital share transactions | 86,927,507 | (99,382,653 | ) | |||||
|
|
|
| |||||
Net Decrease in Net Assets | (47,779,257 | ) | (114,969,143 | ) | ||||
Net Assets: | ||||||||
Beginning of year | 411,745,983 | 526,715,126 | ||||||
|
|
|
| |||||
End of year | $ | 363,966,726 | $ | 411,745,983 | ||||
|
|
|
| |||||
Undistributed net investment income | $ | – | $ | 1,652,553 | ||||
|
|
|
| |||||
See accompanying notes, which are an integral part of the financial statements.
| U.S. Growth Series-10 |
Table of Contents
Delaware VIP® Trust – Delaware VIP U.S. Growth Series
Selected data for each share of the Series outstanding throughout each period were as follows:
Delaware VIP U.S. Growth Series Standard Class Year ended | ||||||||||||||||||||
| 12/31/16 | 12/31/15 | 12/31/14 | 12/31/13 | 12/31/12 | ||||||||||||||||
Net asset value, beginning of period | $13.310 | $13.750 | $ 13.140 | $ 10.170 | $ 8.750 | |||||||||||||||
Income (loss) from investment operations: | ||||||||||||||||||||
Net investment income1 | 0.021 | 0.077 | 0.075 | 0.030 | 0.039 | |||||||||||||||
Net realized and unrealized gain (loss) | (0.750 | ) | 0.663 | 1.495 | 3.395 | 1.381 | ||||||||||||||
|
|
|
|
|
|
|
|
|
| |||||||||||
Total from investment operations | (0.729 | ) | 0.740 | 1.570 | 3.425 | 1.420 | ||||||||||||||
|
|
|
|
|
|
|
|
|
| |||||||||||
Less dividends and distributions from: | ||||||||||||||||||||
Net investment income | (0.083 | ) | (0.080 | ) | (0.030 | ) | (0.038 | ) | — | |||||||||||
Net realized gain | (3.588 | ) | (1.100 | ) | (0.930 | ) | (0.417 | ) | — | |||||||||||
|
|
|
|
|
|
|
|
|
| |||||||||||
Total dividends and distributions | (3.671 | ) | (1.180 | ) | (0.960 | ) | (0.455 | ) | — | |||||||||||
|
|
|
|
|
|
|
|
|
| |||||||||||
Net asset value, end of period | $8.910 | $13.310 | $13.750 | $13.140 | $10.170 | |||||||||||||||
|
|
|
|
|
|
|
|
|
| |||||||||||
Total return2 | (5.17% | ) | 5.39% | 12.78% | 34.75% | 16.23% | ||||||||||||||
Ratios and supplemental data: | ||||||||||||||||||||
Net assets, end of period (000 omitted) | $47,773 | $50,055 | $160,730 | $145,086 | $106,069 | |||||||||||||||
Ratio of expenses to average net assets | 0.74% | 0.75% | 0.74% | 0.74% | 0.74% | |||||||||||||||
Ratio of net investment income to average net assets | 0.22% | 0.56% | 0.58% | 0.27% | 0.40% | |||||||||||||||
Portfolio turnover | 22% | 39% | 26% | 20% | 35% | |||||||||||||||
| 1 | The average shares outstanding method has been applied for per share information. |
| 2 | Total investment return is based on the change in net asset value of a share during the period and assumes reinvestment of dividends and distributions at net asset value. Total investment return does not include fees, charges, or expenses imposed by the variable annuity and life insurance contracts for which Delaware VIP Trust serves as an underlying investment vehicle. |
See accompanying notes, which are an integral part of the financial statements.
| U.S. Growth Series-11 |
Table of Contents
Delaware VIP® U.S. Growth Series
Financial highlights (continued)
Selected data for each share of the Series outstanding throughout each period were as follows:
Delaware VIP U.S. Growth Series Service Class Year ended | |||||||||||||||||||||||||
| 12/31/16 | 12/31/15 | 12/31/14 | 12/31/13 | 12/31/12 | |||||||||||||||||||||
Net asset value, beginning of period | $ | 13.070 | $ | 13.530 | $ | 12.940 | $ | 10.030 | $ | 8.650 | |||||||||||||||
Income (loss) from investment operations: | |||||||||||||||||||||||||
Net investment income (loss)1 | (0.003) | 0.041 | 0.042 | 0.002 | 0.014 | ||||||||||||||||||||
Net realized and unrealized gain (loss) | (0.749) | 0.647 | 1.480 | 3.339 | 1.366 | ||||||||||||||||||||
|
|
|
|
|
|
|
|
|
| ||||||||||||||||
Total from investment operations | (0.752) | 0.688 | 1.522 | 3.341 | 1.380 | ||||||||||||||||||||
|
|
|
|
|
|
|
|
|
| ||||||||||||||||
Less dividends and distributions from: | |||||||||||||||||||||||||
Net investment income | (0.050) | (0.048) | (0.002) | (0.014) | — | ||||||||||||||||||||
Net realized gain | (3.588) | (1.100) | (0.930) | (0.417) | — | ||||||||||||||||||||
|
|
|
|
|
|
|
|
|
| ||||||||||||||||
Total dividends and distributions | (3.638) | (1.148) | (0.932) | (0.431) | — | ||||||||||||||||||||
|
|
|
|
|
|
|
|
|
| ||||||||||||||||
Net asset value, end of period | $ | 8.680 | $ | 13.070 | $ | 13.530 | $ | 12.940 | $ | 10.030 | |||||||||||||||
|
|
|
|
|
|
|
|
|
| ||||||||||||||||
Total return2 | (5.50% | ) | 5.08% | 12.48% | 34.44% | 15.95% | |||||||||||||||||||
Ratios and supplemental data: | |||||||||||||||||||||||||
Net assets, end of period (000 omitted) | $ | 316,194 | $ | 361,691 | $ | 365,985 | $ | 343,295 | $ | 281,973 | |||||||||||||||
Ratio of expenses to average net assets | 0.99% | 1.00% | 0.99% | 0.99% | 0.99% | ||||||||||||||||||||
Ratio of expenses to average net assets prior to fees waived | 1.04% | 1.05% | 1.04% | 1.04% | 1.04% | ||||||||||||||||||||
Ratio of net investment income (loss) to average net assets | (0.03% | ) | 0.31% | 0.33% | 0.02% | 0.15% | |||||||||||||||||||
Ratio of net investment income (loss) to average net assets prior to fees waived | (0.08%) | 0.26% | 0.28% | (0.03% | ) | 0.10% | |||||||||||||||||||
Portfolio turnover | 22% | 39% | 26% | 20% | 35% | ||||||||||||||||||||
| 1 | The average shares outstanding method has been applied for per share information. |
| 2 | Total investment return is based on the change in net asset value of a share during the period and assumes reinvestment of dividends and distributions at net asset value. Total investment return during all of the periods shown reflects a waiver by the distributor. Performance would have been lower had the waiver not been in effect. Total investment return does not include fees, charges, or expenses imposed by the variable annuity and life insurance contracts for which Delaware VIP Trust serves as an underlying investment vehicle. |
See accompanying notes, which are an integral part of the financial statements.
| U.S. Growth Series-12 |
Table of Contents
Delaware VIP® Trust — Delaware VIP U.S. Growth Series
December 31, 2016
Delaware VIP Trust (Trust) is organized as a Delaware statutory trust and offers 10 series: Delaware VIP Diversified Income Series, Delaware VIP Emerging Markets Series, Delaware VIP High Yield Series, Delaware VIP International Value Equity Series, Delaware VIP Limited-Term Diversified Income Series, Delaware VIP REIT Series, Delaware VIP Small Cap Value Series, Delaware VIP Smid Cap Growth Series, Delaware VIP U.S. Growth Series, and Delaware VIP Value Series. These financial statements and the related notes pertain to Delaware VIP U.S. Growth Series (Series). The Trust is an open-end investment company. The Series is considered diversified under the Investment Company Act of 1940, as amended, and offers Standard Class and Service Class shares. The Standard Class shares do not carry a 12b-1 fee and the Service Class shares carry a 12b-1 fee. The shares of the Series are sold only to separate accounts of life insurance companies.
The investment objective of the Series is to seek long-term capital appreciation.
1. Significant Accounting Policies
The following accounting policies are in accordance with U.S. generally accepted accounting principles (U.S. GAAP) and are consistently followed by the Series.
Security Valuation—Equity securities, except those traded on the Nasdaq Stock Market LLC (Nasdaq) are valued at the last quoted sales price as of the time of the regular close of the New York Stock Exchange on the valuation date. Equity securities traded on the Nasdaq are valued in accordance with the Nasdaq Official Closing Price, which may not be the last sales price. If, on a particular day, an equity security does not trade, then the mean between the bid and ask prices will be used, which approximates fair value. U.S. government and agency securities are valued at the mean between the bid and ask prices, which approximates fair value. Generally, other securities and assets for which market quotations are not readily available are valued at fair value as determined in good faith under the direction of the Trust’s Board of Trustees (Board). In determining whether market quotations are readily available or fair valuation will be used, various factors will be taken into consideration, such as market closures or suspension of trading in a security. The Series may use fair value pricing more frequently for securities traded primarily in non-U.S. markets because, among other things, most foreign markets close well before the Series values its securities, generally as of 4:00 p.m. Eastern time. The earlier close of these foreign markets gives rise to the possibility that significant events, including broad market moves, government actions or pronouncements, aftermarket trading, or news events may have occurred in the interim. Whenever such a significant event occurs, the Series may value foreign securities using fair value prices based on third-party vendor modeling tools (international fair value pricing).
Federal and Foreign Income Taxes—No provision for federal income taxes has been made as the Series intends to continue to qualify for federal income tax purposes as a regulated investment company under Subchapter M of the Internal Revenue Code of 1986, as amended, and make the requisite distributions to shareholders. The Series evaluates tax positions taken or expected to be taken in the course of preparing the Series’ tax returns to determine whether the tax positions are “more-likely-than-not” of being sustained by the applicable tax authority. Tax positions not deemed to meet the “more-likely-than-not” threshold are recorded as a tax benefit or expense in the current year. Management has analyzed the Series’ tax positions taken for all open federal income tax years (Dec. 31, 2013–Dec. 31, 2016), and has concluded that no provision for federal income tax is required in the Series’ financial statements. In regard to foreign taxes only, the Series has open tax years in certain foreign countries in which it invests that may date back to the inception of the Series.
Class Accounting—Investment income, common expenses, and realized and unrealized gain (loss) on investments are allocated to the classes of the Series on the basis of daily net assets of each class. Distribution expenses relating to a specific class are charged directly to that class.
Repurchase Agreements—The Series may purchase certain U.S. government securities subject to the counterparty’s agreement to repurchase them at an agreed upon date and price. The counterparty will be required on a daily basis to maintain the value of the collateral subject to the agreement at not less than the repurchase price (including accrued interest). The agreements are conditioned upon the collateral being deposited under the Federal Reserve book-entry system with the Series’ custodian or a third-party sub-custodian. In the event of default or bankruptcy by the other party to the agreement, retention of the collateral may be subject to legal proceedings. All open repurchase agreements as of the date of this report were entered into on Dec. 30, 2016 and matured on the next business day.
Use of Estimates—The Series is an investment company, whose financial statements are prepared in conformity with U.S. GAAP. Therefore, the Series follows the accounting and reporting guidelines for investment companies. The preparation of financial statements in conformity with U.S. GAAP requires management to make estimates and assumptions that affect the fair value of investments, the reported amounts of assets and liabilities and disclosure of contingent assets and liabilities at the date of the financial statements, and the reported amounts of revenues and expenses during the reporting period. Actual results could differ from those estimates and the differences could be material.
Other—Expenses directly attributable to the Series are charged directly to the Series. Other expenses common to various funds within the Delaware Investments® Family of Funds are generally allocated among such funds on the basis of average net assets. Management fees and certain other expenses are paid monthly. Security transactions are recorded on the date the securities are purchased or sold (trade date) for financial reporting purposes. Costs used in calculating realized gains and losses on the sale of investment securities are those of the specific securities sold. Dividend income is recorded on the ex-dividend date and interest income is recorded on the accrual basis. Foreign dividends are also recorded on the ex-dividend date or as soon after the ex-dividend date that the Series is aware of such dividends, net of all tax withholdings, a portion of which may be reclaimable. Withholding taxes and reclaims on foreign dividends have been recorded in accordance with the Series’ understanding of the applicable country’s tax rules and rates. The Series declares and pays dividends from net investment income and distributions from net realized gain on investments, if any, following the close of the fiscal year. The Series may distribute more frequently, if necessary for tax purposes. Dividends and distributions, if any, are recorded on the ex-dividend date.
U.S. Growth Series-13
Table of Contents
Delaware VIP® U.S. Growth Series
Notes to financial statements (continued)
1. Significant Accounting Policies (continued)
Subject to seeking best execution, the Series may direct certain security trades to brokers who have agreed to rebate a portion of the related brokerage commission to the Series in cash. In general, best execution refers to many factors, including the price paid or received for a security, the commission charged, the promptness and reliability of execution, the confidentiality and placement accorded the order, and other factors affecting the overall benefit obtained by the Series on the transaction. There were no commission rebates for the year ended December 31, 2016.
The Series may receive earnings credits from its custodian when positive cash balances are maintained, which may be used to offset custody fees. There were no such earnings credits for the year ended Dec. 31, 2016.
The Series receives earnings credits from its transfer agent when positive cash balances are maintained, which may be used to offset transfer agent fees. If the amount earned is greater than $1.00, the expense paid under this arrangement is included on the “Statement of operations” under “Dividend disbursing and transfer agent fees and expenses” with the corresponding expense offset shown under “Less expense paid indirectly.” For the year ended Dec. 31, 2016, the Series earned $1 under this agreement.
2. Investment Management, Administration Agreements, and Other Transactions with Affiliates
In accordance with the terms of its investment management agreement, the Series pays Delaware Management Company (DMC), a series of Delaware Management Business Trust and the investment manager, an annual fee which is calculated daily at the rate of 0.65% on the first $500 million of average daily net assets of the Series, 0.60% on the next $500 million, 0.55% on the next $1.5 billion, and 0.50% on average daily net assets in excess of $2.5 billion.
Jackson Square Partners, LLC (JSP), a related party of DMC, furnishes investment sub-advisory services to the Series. Effective June 1, 2016, for these services, DMC, not the Series, pays JSP fees based on the aggregate average daily net assets of the Series at the following annual rate: 0.39% of the first $500 million; 0.36% of the next $500 million; 0.33% of the next $1.5 billion; and 0.30% of aggregate average daily net assets in excess of $2.5 billion. Prior to June 1, 2016, the Series paid JSP fees on the aggregate average daily net assets of the Series at the following annual rate: 0.325% of the first $500 million; 0.300% of the next $500 million; 0.275% of the next $1.5 billion; and 0.250% of aggregate average daily net assets in excess of $2.5 billion.
Delaware Investments Fund Services Company (DIFSC), an affiliate of DMC, provides fund accounting and financial administration oversight services to the Series. For these services, DIFSC’s fees are calculated based on the aggregate daily net assets of the Delaware Investments® Family of Funds at the following annual rate: 0.0050% of the first $30 billion; 0.0045% of the next $10 billion; 0.0040% of the next $10 billion; and 0.0025% of aggregate average daily net assets in excess of $50 billion. The fees payable to DIFSC under the service agreement described above are allocated among all funds in the Delaware Investments Family of Funds on a relative net asset value (NAV) basis. For the year ended Dec. 31, 2016, the Series was charged $17,816 for these services. This amount is included on the “Statement of operations” under “Accounting and administration expenses.”
DIFSC is also the transfer agent and dividend disbursing agent of the Series. For these services, DIFSC’s fees are calculated at the annual rate of 0.0075% of the Series average daily net assets. This amount is included on the “Statement of operations” under “Dividend disbursing and transfer agent fees and expenses.” For the year ended Dec. 31, 2016, the Series was charged $28,233 for these services. Pursuant to a sub-transfer agency agreement between DIFSC and BNY Mellon Investment Servicing (US) Inc. (BNYMIS), BNYMIS provides certain sub-transfer agency services to the Series. Sub-transfer agency fees are paid by the Series and are also included on the “Statement of operations” under “Dividend disbursing and transfer agent fees and expenses.”
Pursuant to a distribution agreement and distribution plan, the Series pays Delaware Distributors, L.P. (DDLP), the distributor and an affiliate of DMC, an annual distribution and service fee of 0.30% of the average daily net assets of the Service Class shares. DDLP has contracted to waive distribution and service fees from Jan. 1, 2016 through Dec. 31, 2016* in order to limit distribution and service fees of the Service Class shares to 0.25% of average daily net assets. Standard Class shares pay no distribution and service expenses.
As provided in the investment management agreement, the Series bears a portion of the cost of certain resources shared with DMC, including the cost of internal personnel of DMC and/or its affiliates that provide legal, tax, and regulatory reporting services to the Series. For the year ended Dec. 31, 2016, the Series was charged $13,129 for internal legal, tax, and regulatory reporting services provided by DMC and/or its affiliates’ employees. This amount is included on the “Statement of operations” under “Legal fees.”
Trustees’ fees include expenses accrued by the Series for each Trustee’s retainer and meeting fees. Certain officers of DMC, DIFSC, and DDLP are officers and/or Trustees of the Trust. These officers and Trustees are paid no compensation by the Series.
Cross trades for the year ended Dec. 31, 2016 were executed by the Series pursuant to procedures adopted by the Board designed to ensure compliance with Rule 17a-7 under the 1940 Act. Cross trading is the buying or selling of portfolio securities between series of investment companies, or between a series of an investment company and another entity, that are or could be considered affiliates by virtue of having a common investment adviser (or affiliated investment advisers), common directors/trustees and/or common officers. At its regularly scheduled meetings, the Board reviews such transactions for compliance with the procedures adopted by the Board. Pursuant to these procedures, for the year ended Dec. 31, 2016, the Series engaged in securities sales of $1,233,999, which resulted in net realized losses of ($52).
* The aggregate contractual waiver period covering this report is from April 29, 2015 through May 1, 2017.
U.S. Growth Series-14
Table of Contents
Delaware VIP® U.S. Growth Series
Notes to financial statements (continued)
3. Investments
For the year ended Dec. 31, 2016, the Series made purchases and sales of investment securities other than short-term investments as follows:
Purchases | $ | 83,423,718 | ||
Sales | 112,744,510 |
At Dec. 31, 2016, the cost and unrealized appreciation (depreciation) of investments for federal tax purposes for the Series were as follows:
| Cost of Investments | Aggregate Unrealized Appreciation of Investments | Aggregate Unrealized Depreciation of Investments | Net Unrealized Appreciation of Investments | |||
$293,924,374 | $88,852,702 | $(19,343,706) | $69,508,996 |
U.S. GAAP defines fair value as the price that the Series would receive to sell an asset or pay to transfer a liability in an orderly transaction between market participants at the measurement date under current market conditions. A three-level hierarchy for fair value measurements has been established based upon the transparency of inputs to the valuation of an asset or liability. Inputs may be observable or unobservable and refer broadly to the assumptions that market participants would use in pricing the asset or liability. Observable inputs reflect the assumptions market participants would use in pricing the asset or liability based on market data obtained from sources independent of the reporting entity. Unobservable inputs reflect the reporting entity’s own assumptions about the assumptions that market participants would use in pricing the asset or liability based on the best information available under the circumstances. The Series’ investment in its entirety is assigned a level based upon the observability of the inputs which are significant to the overall valuation. The three-level hierarchy of inputs is summarized below.
| Level 1 | – | Inputs are quoted prices in active markets for identical investments. (Examples: equity securities, open-end investment companies, futures contracts, exchange-traded options contracts) | ||
| Level 2 | – | Other observable inputs, including, but not limited to: quoted prices for similar assets or liabilities in markets that are active, quoted prices for identical or similar assets or liabilities in markets that are not active, inputs other than quoted prices that are observable for the assets or liabilities (such as interest rates, yield curves, volatilities, prepayment speeds, loss severities, credit risks, and default rates) or other market-corroborated inputs. (Examples: debt securities, government securities, swap contracts, foreign currency exchange contracts, foreign securities utilizing international fair value pricing, broker-quoted securities, fair valued securities) | ||
| Level 3 | – | Significant unobservable inputs, including the Series’ own assumptions used to determine the fair value of investments) (Examples: broker-quoted securities, fair valued securities) |
Level 3 investments are valued using significant unobservable inputs. The Series may also use an income-based valuation approach in which the anticipated future cash flows of the investment are discounted to calculate fair value. Discounts may also be applied due to the nature or duration of any restrictions on the disposition of the investments. Valuations may also be based upon current market prices of securities that are comparable in coupon, rating, maturity, and industry. The derived value of a Level 3 investment may not represent the value which is received upon disposition and this could impact the results of operations.
The following table summarizes the valuation of the Series’ investments by fair value hierarchy levels as of Dec. 31, 2016:
Securities | Level 1 | Level 2 | Total | |||||||||
Common Stock | $ | 354,288,496 | $ | — | $354,288,496 | |||||||
Short-Term Investments | — | 9,144,874 | 9,144,874 | |||||||||
|
|
|
|
|
| |||||||
Total Value of Securities | $ | 354,288,496 | $ | 9,144,874 | $363,433,370 | |||||||
|
|
|
|
|
| |||||||
During the year ended Dec. 31, 2016, there were no transfers between Level 1 investments, Level 2 investments, or Level 3 investments that had a significant impact to the Series. The Series’ policy is to recognize transfers between levels at the beginning of the reporting period.
A reconciliation of Level 3 investments is presented when the Series has a significant amount of Level 3 investments at the beginning, interim, or end of the period in relation to the Series’ net assets. During the year ended Dec. 31, 2016, there were no Level 3 investments.
U.S. Growth Series-15
Table of Contents
Delaware VIP® U.S. Growth Series
Notes to financial statements (continued)
4. Dividend and Distribution Information
Income and long-term capital gain distributions are determined in accordance with federal income tax regulations, which may differ from U.S. GAAP. Additionally, distributions from net gains on foreign currency transactions and net short-term gains on sales of investment securities are treated as ordinary income for federal income tax purposes. The tax character of dividends and distributions paid during the years ended Dec. 31, 2016 and Dec. 31, 2015 was as follows:
| Year ended 12/31/16 | Year ended 12/31/15 | |||||||
Ordinary income | $ | 1,652,553 | $ | 2,001,895 | ||||
Long-term capital gain | 111,385,355 | 39,275,791 | ||||||
|
|
|
| |||||
| $ | 113,037,908 | $ | 41,277,686 | |||||
|
|
|
| |||||
5. Components of Net Assets on a Tax Basis
As of Dec. 31, 2016, the components of net assets on a tax basis were as follows:
Shares of beneficial interest | $290,478,101 | |||
Undistributed long-term capital gains | 3,979,629 | |||
Unrealized appreciation on investments | 69,508,996 | |||
|
| |||
Net assets | $363,966,726 | |||
|
|
The differences between book basis and tax basis components of net assets are primarily attributable to tax deferral of losses on wash sales.
For financial reporting purposes, capital accounts are adjusted to reflect the tax character of permanent book/tax differences. Reclassifications are primarily due to tax treatment of net operating loss and redesignation of dividends and distributions. Results of operations and net assets were not affected by these classifications. For the year ended Dec. 31, 2016, the Series recorded the following reclassifications:
Undistributed | Accumulated Net Realized Gain | Paid-In Capital | ||
| $28,378 | $(24,772) | $(3,606) |
6. Capital Shares
Transactions in capital shares were as follows:
Year ended | Year ended | |||||||
12/31/16 | 12/31/15 | |||||||
Shares sold: | ||||||||
Standard Class | 685,041 | 1,282,134 | ||||||
Service Class | 1,157,900 | 1,532,091 | ||||||
Shares issued upon reinvestment of dividends and distributions: |
| |||||||
Standard Class | 1,584,383 | 258,029 | ||||||
Service Class | 11,520,871 | 2,343,740 | ||||||
|
|
|
| |||||
| 14,948,195 | 5,415,994 | |||||||
|
|
|
| |||||
Shares redeemed: | ||||||||
Standard Class | (666,128 | ) | (9,465,211 | ) | ||||
Service Class | (3,950,305 | ) | (3,254,991 | ) | ||||
|
|
|
| |||||
| (4,616,433 | ) | (12,720,202 | ) | |||||
|
|
|
| |||||
Net increase (decrease) | 10,331,762 | (7,304,208 | ) | |||||
|
|
|
| |||||
7. Line of Credit
The Series, along with certain other funds in the Delaware Investments® Family of Funds (Participants), was a participant in a $155,000,000 revolving line of credit intended to be used for temporary or emergency purposes as an additional source of liquidity to fund redemptions of investor shares. Under the agreement, the Participants were charged an annual commitment fee of 0.10%, which was allocated across the Participants on the basis of relative net assets of each Participant’s allocation of the entire facility. The Participants were permitted to borrow up to a maximum of one third of their net assets under the agreement. Each Participant was individually, and not jointly, liable for its particular advances, if any, under the line of credit. The line of credit available under the agreement expired on Nov. 7, 2016.
U.S. Growth Series-16
Table of Contents
Delaware VIP® U.S. Growth Series
Notes to financial statements (continued)
7. Line of Credit (continued)
On Nov. 7, 2016, the Series, along with the other Participants, entered into an amendment to the agreement for a $155,000,000 revolving line of credit. The line of credit is to be used as described above and operates in substantially the same manner as the original agreement with the exception of the annual commitment fee. Under the amendment to the agreement, the Participants are charged an annual commitment fee of 0.15%, which is allocated across the Participants on the basis of relative net assets of each Participant’s allocation of the entire facility. The line of credit available under the agreement expires on Nov. 6, 2017.
The Series had no amounts outstanding as of Dec. 31, 2016 or at any time during the year then ended.
8. Offsetting
In December 2011, the Financial Accounting Standards Board (FASB) issued guidance that expanded disclosure requirements on the offsetting of certain assets and liabilities. The disclosures are required for investments and derivative financial instruments subject to master netting or similar agreements which are eligible for offset on the “Statement of assets and liabilities” and require an entity to disclose both gross and net information about such investments and transactions in the financial statements. In January 2013, the FASB issued guidance that clarified which investments and transactions are subject to the offsetting disclosure requirements. The scope of the disclosure requirements for offsetting is limited to derivative instruments, repurchase agreements and reverse repurchase agreements, and securities borrowing.
In order to better define its contractual rights and to secure rights that will help the Series mitigate its counterparty risk, the Series entered into an International Swaps and Derivatives Association, Inc. Master Agreement (ISDA Master Agreement) or a similar agreement with certain of its derivative contract counterparties. An ISDA Master Agreement is a bilateral agreement between the Series and a counterparty that governs certain over-the-counter (OTC) derivatives and foreign exchange contracts and typically contains, among other things, collateral posting items and netting provisions in the event of a default and/or termination event. Under an ISDA Master Agreement, the Series may, under certain circumstances, offset with the counterparty certain derivative financial instruments’ payables and/or receivables with collateral held and/or posted and create one single net payment. The provisions of the ISDA Master Agreement typically permit a single net payment in the event of default (close-out), including the bankruptcy or insolvency of the counterparty. However, bankruptcy or insolvency laws of a particular jurisdiction may impose restrictions on or prohibitions against the right of offset in bankruptcy, insolvency, or other events.
For financial reporting purposes, the Series does not offset derivative assets and derivative liabilities that are subject to
netting arrangements on the “Statement of assets and liabilities.”
At Dec. 31, 2016, the Series had the following assets and liabilities subject to offsetting provisions:
Master Repurchase Agreements
| Counterparty | Repurchase Agreements | Fair Value of Non-Cash | Cash Collateral Received | Net Collateral Received | Net Exposure(b) | |||||||||||
Bank of America Merrill Lynch | $ | 2,556,462 | $ | (2,556,462) | $— | $ | (2,556,462) | $— | ||||||||
Bank of Montreal | 2,982,539 | (2,982,539) | — | $ | (2,982,539) | — | ||||||||||
BNP Paribas | 2,041,999 | (2,041,999) | — | $ | (2,041,999) | — | ||||||||||
|
|
|
|
|
|
|
| |||||||||
Total | $ | 7,581,000 | $ | (7,581,000) | $— | $ | (7,581,000) | $— | ||||||||
|
|
|
|
|
|
|
| |||||||||
(a) The value of the related collateral received exceeded the value of the repurchase agreements as of Dec. 31, 2016.
(b) Net exposure represents the receivable (payable) that would be due from (to) the counterparty in an event of default.
9. Securities Lending
The Series, along with other funds in the Delaware Investments® Family of Funds, may lend its securities pursuant to a security lending agreement (Lending Agreement) with The Bank of New York Mellon (BNY Mellon). At the time a security is loaned, the borrower must post collateral equal to the required percentage of the market value of the loaned security, including any accrued interest. The required percentage is: (1) 102% with respect to U.S. securities and foreign securities that are denominated and payable in U.S. dollars; and (2) 105% with respect to foreign securities. With respect to each loan, if on any business day the aggregate market value of securities collateral plus cash collateral held is less than the aggregate market value of the securities which are the subject of such loan, the borrower will be notified to provide additional collateral by the end of the following business day, which, together with the collateral already held, will be not less than the applicable initial collateral requirements for such security loan. If the aggregate market value of securities collateral and cash collateral held with respect to a security loan exceeds the applicable initial collateral requirement, upon the request of the borrower, BNY Mellon must return enough collateral to the borrower by the end of the following business day to reduce the value of the remaining collateral to the applicable initial collateral requirement for such security loan. As a result of the foregoing, the value of the collateral held with respect to a loaned security on any particular day may be more or less than the value of the security on loan.
Cash collateral received by each Series of the Trust is generally invested in a series of individual separate accounts, each corresponding to a Series. The investment guidelines permit each separate account to hold certain securities that would be considered eligible securities for a money market fund. Cash collateral received is generally invested in government securities; certain obligations issued by government sponsored enterprises; repurchase agreements collateralized by U.S. Treasury securities; obligations issued by the central government
U.S. Growth Series-17
Table of Contents
Delaware VIP® U.S. Growth Series
Notes to financial statements (continued)
9. Securities Lending (continued)
of any Organization for Economic Cooperation and Development (OECD) country or its agencies, instrumentalities, or establishments; obligations of supranational organizations; commercial paper, notes, bonds, and other debt obligations; certificates of deposit, time deposits, and other bank obligations; and asset-backed securities.
In the event of default or bankruptcy by the lending agent, realization and/or retention of the collateral may be subject to legal proceedings. In the event the borrower fails to return loaned securities and the collateral received is insufficient to cover the value of the loaned securities and provided such collateral shortfall is not the result of investment losses, the lending agent has agreed to pay the amount of the shortfall to the Series or, at the discretion of the lending agent, replace
the loaned securities. The Series continues to record dividends or interest, as applicable, on the securities loaned and is subject to changes in value of the securities loaned that may occur during the term of the loan. The Series has the right under the Lending Agreement to recover the securities from the borrower on demand. With respect to security loans collateralized by non-cash collateral, the Series receives loan premiums paid by the borrower. With respect to security loans collateralized by cash collateral, the earnings from the collateral investments are shared among the Series, the security lending agent, and the borrower. The Series records security lending income net of allocations to the security lending agent and the borrower.
The Series may incur investment losses as a result of investing securities lending collateral. This could occur if an investment in the collateral investment account defaulted or became impaired. Under those circumstances, the value of a Series’ cash collateral account may be less than the amount the Series would be required to return to the borrowers of the securities and the Series would be required to make up for this shortfall.
During the year ended Dec. 31, 2016, the Series had no securities out on loan.
10. Credit and Market Risk
The Series may invest up to 15% of its net assets in illiquid securities, which may include securities with contractual restrictions on resale, securities exempt from registration under Rule 144A promulgated under the Securities Act of 1933, as amended, and other securities which may not be readily marketable. The relative illiquidity of these securities may impair the Series from disposing of them in a timely manner and at a fair price when it is necessary or desirable to do so. While maintaining oversight, the Series’ Board has delegated to DMC, the day-to-day functions of determining whether individual securities are liquid for purposes of the Series’ limitation on investments in illiquid securities. Securities eligible for resale pursuant to Rule 144A, which are determined to be liquid, are not subject to the Series’ 15% limit on investments in illiquid securities. As of Dec. 31, 2016, there were no Rule 144A securities held by the Series.
11. Contractual Obligations
The Series enters into contracts in the normal course of business that contain a variety of indemnifications. The Series’ maximum exposure under these arrangements is unknown. However, the Series has not had prior claims or losses pursuant to these contracts. Management has reviewed the Series’ existing contracts and expects the risk of loss to be remote.
12. Recent Accounting Pronouncements
On Oct. 13, 2016, the Securities and Exchange Commission amended existing rules intended to modernize reporting and disclosure of information. These amendments relate to Regulation S-X which sets forth the form and content of financial statements. At this time, management is evaluating the implications of adopting these amendments and their impact on the financial statements and accompanying notes.
13. Subsequent Events
Management has determined that no material events or transactions occurred subsequent to Dec. 31, 2016 that would require recognition or disclosure in the Series’ financial statements.
U.S. Growth Series-18
Table of Contents
Delaware VIP® Trust — Delaware VIP U.S. Growth Series
Report of independent registered public accounting firm
To the Board of Trustees of Delaware VIP Trust and Shareholders of Delaware VIP U.S. Growth Series:
In our opinion, the accompanying statement of assets and liabilities, including the schedule of investments, and the related statements of operations and of changes in net assets and the financial highlights present fairly, in all material respects, the financial position of Delaware VIP U.S. Growth Series (one of the series constituting Delaware VIP Trust, hereafter referred to as the “Series”) as of December 31, 2016, the results of its operations for the year then ended, the changes in its net assets for each of the two years in the period then ended and the financial highlights for each of the five years in the period then ended, in conformity with accounting principles generally accepted in the United States of America. These financial statements and financial highlights (hereafter referred to as “financial statements”) are the responsibility of the Series’ management. Our responsibility is to express an opinion on these financial statements based on our audits. We conducted our audits of these financial statements in accordance with the standards of the Public Company Accounting Oversight Board (United States). Those standards require that we plan and perform the audit to obtain reasonable assurance about whether the financial statements are free of material misstatement. An audit includes examining, on a test basis, evidence supporting the amounts and disclosures in the financial statements, assessing the accounting principles used and significant estimates made by management, and evaluating the overall financial statement presentation. We believe that our audits, which included confirmation of securities as of December 31, 2016 by correspondence with the custodian and brokers, provide a reasonable basis for our opinion.
PricewaterhouseCoopers LLP
Philadelphia, Pennsylvania
February 16, 2017
U.S. Growth Series-19
Table of Contents
This page intentionally left blank.
Table of Contents
Delaware VIP® Trust — Delaware VIP U.S. Growth Series
Other Series information (Unaudited)
Board consideration of Delaware VIP U.S. Growth Series investment advisory agreement
At a meeting held on Aug. 16–18, 2016 (the “Annual Meeting”), the Board of Trustees (the “Board”), including a majority of disinterested or independent Trustees, approved the renewal of the Investment Advisory Agreement for Delaware VIP U.S. Growth Series (the “Series”). In making its decision, the Board considered information furnished at regular quarterly Board meetings, including reports detailing Series performance, investment strategies, and expenses, as well as information prepared specifically in connection with the renewal of the investment advisory and sub-advisory contracts. Information furnished specifically in connection with the renewal of the Investment Management Agreement with Delaware Management Company (“DMC”) included materials provided by DMC and its affiliates (“Delaware Investments”) concerning, among other things, the nature, extent, and quality of services provided to the Series; the costs of such services to the Series; economies of scale; and the investment manager’s financial condition and profitability. In addition, in connection with the Annual Meeting, reports were provided to the Trustees in May 2016 and included reports provided by Broadridge Financial Solutions (“Broadridge”). The Broadridge reports compared the Series’ investment performance and expenses with those of other comparable mutual funds. The Independent Trustees reviewed and discussed the Broadridge reports with independent legal counsel to the Independent Trustees. In addition to the information noted above, the Board also requested and received information regarding DMC’s policy with respect to advisory fee levels and its breakpoint philosophy; the structure of portfolio manager compensation; comparative client fee information; and any constraints or limitations on the availability of securities for certain investment styles, which had in the past year inhibited, or which were likely in the future to inhibit, the investment manager’s ability to invest fully in accordance with Series policies.
In considering information relating to the approval of the Series’ advisory agreement, the Independent Trustees received assistance and advice from and met separately with independent legal counsel to the Independent Trustees. Although the Board gave attention to all information furnished, the following discussion identifies, under separate headings, the primary factors taken into account by the Board during its contract renewal considerations.
Nature, extent, and quality of service. The Board considered the services provided by DMC to the Series and its shareholders. In reviewing the nature, extent, and quality of services, the Board considered reports furnished to it throughout the year, which covered matters such as the relative performance of the Series; compliance of portfolio managers with the investment policies, strategies, and restrictions for the Series; compliance by DMC and Delaware Distributors, L.P. ( together, “Management”) personnel with the Code of Ethics adopted throughout the Delaware Investments® Family of Funds complex; and adherence to fair value pricing procedures as established by the Board. The Board was pleased with the current staffing of the Series’ investment advisor and the emphasis placed on research in the investment process. The Board recognized DMC’s receipt of several industry distinctions during the past several years. The Board gave favorable consideration to DMC’s efforts to control expenditures while maintaining service levels committed to Series matters. The Board was satisfied with the nature, extent, and quality of the overall services provided by DMC.
Investment performance. The Board placed significant emphasis on the investment performance of the Series in view of the importance of investment performance to shareholders. Although the Board gave appropriate consideration to performance reports and discussions with portfolio managers at Board meetings throughout the year, the Board gave particular weight to the Broadridge reports furnished for the Annual Meeting. The Broadridge reports prepared for the Series showed the investment performance of its Standard Class shares in comparison to a group of similar funds as selected by Broadridge (the “Performance Universe”). A fund with the best performance ranked first, and a fund with the poorest performance ranked last. The highest/best performing 25% of funds in the Performance Universe make up the first quartile; the next 25%, the second quartile; the next 25%, the third quartile; and the poorest/worst performing 25% of funds in the Performance Universe make up the fourth quartile. Comparative annualized performance for the Series was shown for the past 1-, 3-, 5-, and 10-year periods, as applicable, ended Jan. 31, 2016. The Board’s objective is that the Series’ performance for the periods considered be at or above the median of its Performance Universe.
The Performance Universe for the Series consisted of the Series and all large-cap growth funds underlying variable insurance products as selected by Broadridge. The Broadridge report comparison showed that the Series’ total return for the 1- and 5-year periods was in the first quartile of its Performance Universe. The report further showed that the Series’ total return for the 3- and 10-year periods was in the second quartile of its Performance Universe. The Board was satisfied with performance.
Comparative expenses. The Board considered expense comparison data for the Delaware Investments Family of Funds. Management provided the Board with information on pricing levels and fee structures for the Series as of its most recently completed fiscal year. The Board also focused on the comparative analysis of effective management fees and total expense ratios of the Series versus effective management fees and expense ratios of a group of similar funds as selected by Broadridge (the “Expense Group”). In reviewing comparative costs, the Series’ contractual management fee and the actual management fee incurred by the Series were compared with the contractual management fees (assuming all funds in the Expense Group were similar in size to the Series) and actual management fees (as reported by each fund) within the Expense Group, taking into account any applicable breakpoints and fee waivers. The Series’ total expenses were also compared with those of its Expense Group. The Broadridge total expenses, for comparative consistency, were shown by Broadridge for Standard Class shares which do not charge 12b-1 and non-12b-1 service fees. The Board’s objective is to limit the Series’ total expense ratio to be competitive with that of the Expense Group.
The expense comparisons for the Series showed that the actual management fee was in the quartile with the second lowest expenses of its Expense Group and its total expenses were in the quartile with the lowest expenses of the Expense Group. The Board was satisfied with the management fee and total expenses of the Series in comparison to those of its Expense Group.
U.S. Growth Series-21
Table of Contents
Delaware VIP® Trust — Delaware VIP U.S. Growth Series
Other Series information (Unaudited)
Management profitability. The Board considered the level of profits realized by DMC in connection with the operation of the Series. In this respect, the Board reviewed the Investment Management Profitability Analysis that addressed the overall profitability of DMC’s business in providing management and other services to each of the individual funds and the Delaware Investments® Family of Funds as a whole. Specific attention was given to the methodology followed in allocating costs for the purpose of determining profitability. Management stated that the level of profits of DMC, to a certain extent, reflects recent operational cost savings and efficiencies initiated by DMC. The Board considered DMC’s efforts to improve services provided to fund shareholders and to meet additional regulatory and compliance requirements resulting from recent industry-wide Securities and Exchange Commission initiatives. The Board also considered the extent to which DMC might derive ancillary benefits from fund operations, including the potential for procuring additional business as a result of the prestige and visibility associated with its role as service provider to the Delaware Investments Family of Funds and the benefits from allocation of fund brokerage to improve trading efficiencies. The Board found that the management fees were reasonable in light of the services rendered and the profitability of DMC.
Economies of Scale. The Trustees considered whether economies of scale are realized by DMC as the Series’ assets increase and the extent to which any economies of scale are reflected in the level of management fees charged. The Trustees reviewed the standardized advisory fee pricing and structure approved by the Board and shareholders, which includes breakpoints, and which applies to most funds in the Delaware Investments Family of Funds complex. Breakpoints in the advisory fee occur when the advisory fee rate is reduced on assets in excess of specified levels. Breakpoints result in a lower advisory fee, than would otherwise be the case in the absence of breakpoints, when the asset levels specified in the breakpoints are exceeded. The Board noted that the fee under the Series’ management contract fell within the standardized fee pricing structure. The Board also noted that, as of May 31, 2016, the Series’ assets exceeded the first breakpoint level. The Board believed that, given the extent to which economies of scale might be realized by the advisor and its affiliates, the schedule of fees under the Investment Management Agreement provides a sharing of benefits with the Series and its shareholders.
Tax Information
All disclosures are based on financial information available as of the date of this annual report and, accordingly are subject to change. For any and all items requiring reporting, it is the intention of the Series to report the maximum amount permitted under the Internal Revenue Code and the regulations thereunder.
For the year ended Dec. 31, 2016, the Series reports distributions paid during the year as follows:
(A) Long-Term | (B) Ordinary Income Distributions* (Tax Basis) | Total Distributions (Tax Basis) | (C) Qualifying Dividends1 | |||||
| 98.54% | 1.46% | 100.00% | 100.00% |
(A) and (B) are based on a percentage of the Series’ total distributions.
(C) is based on the Series’ ordinary income distributions.
1Qualified dividends represent dividends which qualify for the corporate dividends received deduction.
U.S. Growth Series-22
Table of Contents
Delaware Investments® Family of Funds
Board of trustees / directors and officers addendum
A mutual fund is governed by a Board of Trustees/Directors (“Trustees”), which has oversight responsibility for the management of a fund’s business affairs. Trustees establish procedures and oversee and review the performance of the investment manager, the distributor, and others who perform services for the fund. The independent fund trustees, in particular, are advocates for shareholder interests. Each trustee has served in that capacity since he or she was elected to or appointed to the Board of Trustees, and will continue to serve until his or her retirement or the election of a new trustee in his or her place. The following is a list of the Trustees and Officers with certain background and related information.
Name, Address, and Birth Date | Position(s) Held with Fund(s) | Length of Time Served | Principal Occupation(s) During the Past Five Years | Number of Portfolios in Fund Complex Overseen by Trustee or Officer | Other Directorships Held by Trustee or Officer | |||||
INTERESTED TRUSTEE | ||||||||||
Shawn K. Lytle1, 3 2005 Market Street Philadelphia, PA 19103
February 1970 | President, Chief Executive Officer, and Trustee | Trustee since September 2015
President and Chief Executive Officer since August 2015 | Shawn K. Lytle has served as President of Delaware Investments2 since June 2015 and was the Regional Head of Americas for UBS Global Asset Management from 2010 through 2015. | 62 | Trustee — UBS Relationship Funds, SMA Relationship Trust, and UBS Funds (May 2010–April 2015) | |||||
| INDEPENDENT TRUSTEES | ||||||||||
Thomas L. Bennett 2005 Market Street Philadelphia, PA 19103 | Chairman and Trustee | Trustee since March 2005 | Private Investor (March 2004–Present) | 62 | None | |||||
October 1947 |
Chairman since March 2015 | |||||||||
Ann D. Borowiec 2005 Market Street Philadelphia, PA 19103
November 1958 | Trustee | Since March 2015 | Chief Executive Officer Private Wealth Management (2011–2013) and Market Manager, New Jersey Private Bank (2005–2011) — J.P. Morgan Chase & Co. | 62 | Director — Banco Santander International
Director — Santander Bank, N.A. | |||||
Joseph W. Chow 2005 Market Street Philadelphia, PA 19103
January 1953 | Trustee | Since January 2013 | Executive Vice President (Emerging Economies Strategies, Risks, and Corporate Administration) State Street Corporation (July 2004–March 2011) | 62 | Director and Audit Committee Member — Hercules Technology Growth Capital, Inc. (2004–2014) | |||||
John A. Fry 2005 Market Street Philadelphia, PA 19103
May 1960 | Trustee | Since January 2001 | President — Drexel University (August 2010–Present)
President — Franklin & Marshall College (July 2002–July 2010) | 62 | Director, Audit Committee and Governance Committee Member — Community Health Systems
Director — Drexel Morgan & Co.
Director, Audit Committee Member — vTv Therapeutics LLC | |||||
Lucinda S. Landreth 2005 Market Street Philadelphia, PA 19103
June 1947 | Trustee | Since March 2005 | Private Investor (2004–Present) | 62 | None | |||||
U.S. Growth Series-23
Table of Contents
Name, Address, and Birth Date | Position(s) Held with Fund(s) | Length of Time Served | Principal Occupation(s) During the Past Five Years | Number of or Officer | Other Directorships Held by Trustee or Officer | |||||
Frances A. Sevilla-Sacasa 2005 Market Street Philadelphia, PA 19103
January 1956 | Trustee | Since September 2011 | Chief Executive Officer — Banco Itaú International (April 2012–December 2016)
Executive Advisor to Dean (August (January 2011–July 2011) —
President — U.S. Trust, Bank of America Private Wealth (Private Banking) (July 2007–December 2008) | 62 | Trust Manager and Audit Committee Member — Camden Property Trust | |||||
Thomas K. Whitford 2005 Market Street Philadelphia, PA 19103
March 1956 | Trustee | Since January 2013 | Vice Chairman (2010–April 2013) — PNC Financial Services Group | 62 | Director — HSBC Finance Corporation and HSBC North America Holdings Inc.
Director — HSBC Bank | |||||
Janet L. Yeomans 2005 Market Street Philadelphia, PA 19103
July 1948 | Trustee | Since April 1999 | Vice President and Treasurer (January 2006–July 2012)
Vice President — Mergers & Acquisitions (January 2003–January 2006), and (July 1995–January 2003) — 3M Company | 62 | Director, Personnel and Compensation Committee Chair, and Audit Committee Member — Okabena Company | |||||
| OFFICERS | ||||||||||
David F. Connor 2005 Market Street Philadelphia, PA 19103
December 1963 | Senior Vice President, General Counsel, and Secretary | Senior Vice President, since May 2013; General Counsel since May 2015; Secretary since October 2005 |
David F. Connor has served in | 62 | None3 | |||||
Daniel V. Geatens 2005 Market Street Philadelphia, PA 19103
October 1972 | Vice President and Treasurer | Treasurer since October 2007 | Daniel V. Geatens has served in various capacities at different times at Delaware Investments. | 62 | None3 | |||||
Richard Salus 2005 Market Street Philadelphia, PA 19103
October 1963 | Senior Vice President and Chief Financial Officer | Chief Financial Officer since November 2006 | Richard Salus has served in various capacities at different times at Delaware Investments. | 62 | None3 | |||||
| 1 | Shawn K. Lytle is considered to be an “Interested Trustee” because he is an executive officer of the Fund’s(s’) investment advisor. |
| 2 | Delaware Investments is the marketing name for Delaware Management Holdings, Inc. and its subsidiaries, including the Fund’s(s’) investment advisor, principal underwriter, and its transfer agent. |
| 3 | Shawn K. Lytle, David F. Connor, Daniel V. Geatens, and Richard Salus serve in similar capacities for the six portfolios of the Optimum Fund Trust, which have the same investment advisor, principal underwriter, and transfer agent as the registrant. |
The Statement of Additional Information for the Fund(s) includes additional information about the Trustees and Officers and is available, without charge, upon request by calling 800 523-1918.
U.S. Growth Series-24
Table of Contents
The Series files its complete schedule of portfolio holdings with the Securities and Exchange Commission (Commission) for the first and third quarters of each fiscal year on Form N-Q. The Series’ Forms N-Q, as well as a description of the policies and procedures that the Series uses to determine how to vote proxies (if any) relating to portfolio securities are available without charge (i) upon request, by calling 800 523-1918; and (ii) on the Commission’s website at sec.gov. In addition, a description of the policies and procedures that the Series uses to determine how to vote proxies (if any) relating to portfolio securities and the Schedule of Investments included in the Series’ most recent Form N-Q are available without charge on the Delaware Investments® Funds’ website at delawareinvestments.com/vip/literature. The Series’ Forms N-Q may be reviewed and copied at the Commission’s Public Reference Room in Washington, DC; information on the operation of the Public Reference Room may be obtained by calling 800 SEC-0330.
Information (if any) regarding how the Series voted proxies relating to portfolio securities during the most recently disclosed 12-month period ended June 30 is available without charge (i) through the Delaware Investments Funds’ website at delawareinvestments.com/proxy; and (ii) on the Commission’s website at sec.gov.
| ||||
| AR-VIPUSG [12/16] BNY 21390 (2/17) (18579) | U.S. Growth Series-25 |
Table of Contents
Delaware VIP® Trust
|
Delaware VIP Value Series
|
Annual report
|
December 31, 2016
|
|

Table of Contents

Neither Delaware Investments nor its affiliates referred to in this document are authorized deposit-taking institutions for the purpose of the Banking Act 1959 (Commonwealth of Australia). The obligations of these entities do not represent deposits or other liabilities of Macquarie Bank Limited (MBL), a subsidiary of Macquarie Group Limited and an affiliate of Delaware Investments. MBL does not guarantee or otherwise provide assurance in respect of the obligations of these entities, unless noted otherwise. The Series is governed by U.S. laws and regulations.
Unless otherwise noted, views expressed herein are current as of Dec. 31, 2016, and subject to change for events occurring after such date.
The Series is not FDIC insured and is not guaranteed. It is possible to lose the principal amount invested.
Mutual fund advisory services provided by Delaware Management Company, a series of Delaware Management Business Trust, which is a registered investment advisor. Delaware Investments, a member of Macquarie Group, refers to Delaware Management Holdings, Inc. and its subsidiaries, including the Series’ distributor, Delaware Distributors, L.P. Macquarie Group refers to Macquarie Group Limited and its subsidiaries and affiliates worldwide.
This material may be used in conjunction with the offering of shares in Delaware VIP Value Series only if preceded or accompanied by the Series’ current prospectus or the summary prospectus.
© 2017 Delaware Management Holdings, Inc.
All third-party marks cited are the property of their respective owners.
Table of Contents
For the fiscal year ended Dec. 31, 2016, Delaware VIP Value Series Standard Class shares returned +14.65% and Service Class shares returned +14.32%. Both figures reflect all distributions reinvested. For the same period, the Series’ benchmark, the Russell 1000® Value Index, returned +17.34%. The Series’ underperformance was driven mostly by sector allocation, but stock selection also had a negative impact.
The U.S. economy continued to grow slowly early in the period before accelerating in the second half. U.S. gross domestic product (GDP) picked up in the third quarter to an average annual rate of 3.5%, up from 0.8% in the first quarter and 1.4% in the second. The U.S. unemployment rate ended the fiscal period at 4.7% in December, after sitting between 4.9% and 5.0% for most of the year. (Source: Bloomberg.)
The U.S. Federal Reserve increased interest rates by 0.25 percentage points in December 2015, and held off from additional rate hikes until December 2016, as economic conditions appeared to have improved.
Throughout the Series’ fiscal year, stock prices were volatile as investors were concerned about the Fed’s pace of rate hikes, fluctuating oil and commodity prices, the United Kingdom’s late-June “Brexit” vote to leave the European Union, and concerns surrounding the U.S. presidential election.
Weak demand and worldwide overproduction drove the price of Brent crude oil down to $27 a barrel in January 2016, causing equity markets, and energy-related stocks in particular, to sell off. The price of oil had climbed above $55 by the end of the period.
The equity market ended the year well into positive territory, benefiting from two rallies. The first, between February and July, enabled equity markets to bounce back from the energy-induced slump early in 2016. The second rally came after the U.S. presidential election. After a very brief selloff when it became evident that Donald Trump would be the nation’s next president, U.S. equities rebounded as investors focused on Trump’s promises to cut corporate taxes, reduce regulation, and increase infrastructure spending.
The “Trump rally” persisted through fiscal year end, propelling the Dow Jones Industrial Average and the S&P 500® Index to record highs. Banks, in particular, benefited from speculation that financial regulations could be eased.
Holdings in the energy sector contributed the most to performance. Oil and gas services provider Halliburton led the sector higher. Halliburton’s shares have done well amid rising oil prices (Brent crude oil was up 52% in 2016) and the company’s ongoing efforts to reduce costs and improve efficiency. Global integrated energy company Chevron was also a strong contributor. It, too, got a boost from the rebound in oil prices. The shares also benefited from moves made by Chevron reduce spending and control costs.
Investments in biopharmaceuticals manufacturer Baxalta and clinical laboratory-services provider Quest Diagnostics helped in the healthcare sector. Baxalta’s shares performed well on news of its acquisition by Ireland-based Shire. We sold the Series’ position in Baxalta when the transaction closed in June, as our process requires us to invest exclusively in U.S. companies. Shares of Quest gained during the year, as investors appeared to become more optimistic about its longer-term prospects.
Some of the Series’ healthcare investments disappointed. Express Scripts Holding, a pharmacy benefits manager (PBM), was in a protracted contract dispute with Anthem, its largest customer. However, we see good long-term potential for Express Scripts. Cardinal Health, a healthcare products distributor, came under pressure as pricing for generic drugs returned to a more normalized deflationary environment. We think revenue and earnings growth potential remains attractive for Cardinal, as does its valuation. A related detractor was CVS Health, which has a retail pharmacy chain and a PBM division. Although CVS was challenged by lower levels of drug price inflation, market share losses, and higher expenses, we believe it appears well positioned for the long term.
Investments in the information technology sector detracted from relative returns largely because of weak performance from Xerox, a provider of document technology and business process outsourcing services. The company experienced revenue declines, execution challenges in its services business, and higher expenses as it was preparing to split into two separate companies at the end of the year.
Throughout the fiscal period, we maintained generally defensive positioning and continued to seek reasonably valued, higher-quality stocks. In our opinion, this approach was well suited to the current environment of sluggish economic growth and investor uncertainty, especially leading up to the U.S. presidential election in November.
Valuations appear high across the market. As it has become more difficult to find undervalued stocks, our investment focus has shifted to stocks that we believe may offer good relative value.
During the fiscal year, we sold three holdings — Baxalta and Johnson Controls International, both of which were acquired by offshore firms, and Xerox, which was preparing to split into two smaller companies by the end of the year. With the proceeds of the Baxalta sale, we established a new position in Abbott Laboratories, a medical-products company with what we viewed as having a strong competitive position and attractive relative valuation.
Unless otherwise noted, views expressed herein are current as of Dec. 31, 2016, and subject to change. | ||
| Value Series-1 |
Table of Contents
| Delaware VIP® Trust — Delaware VIP Value Series | January 10, 2017 | |
| Portfolio management review (continued) |
Toward the end of the period, we were researching options for a new consumer discretionary position to replace Johnson Controls. We also researched stocks in information technology, a sector that, in our view, had decent relative value, and in real estate, which became the 11th sector in the S&P 500 Index in August.
| Unless otherwise noted, views expressed herein are current as of Dec. 31, 2016, and subject to change. | ||
| Value Series-2 |
Table of Contents
Delaware VIP® Trust — Delaware VIP Value Series
Performance summary
The performance quoted represents past performance and does not guarantee future results. Investment return and principal value of an investment will fluctuate so that shares, when redeemed, may be worth more or less than their original cost. Current performance may be lower or higher than the performance quoted.
Carefully consider the Series’ investment objectives, risk factors, charges, and expenses before investing. This and other information can be found in the Series’ prospectus and its summary prospectus, which may be obtained by calling 800 523-1918. Investors should read the prospectus and the summary prospectus carefully before investing.
Delaware VIP Value Series Average annual total returns For periods ended Dec. 31, 2016 | 1 year | 3 years | 5 years | 10 years | Lifetime | |||||
Standard Class shares (commenced operations on July 28, 1988) | +14.65% | +9.18% | +14.83% | +6.81% | +9.00% | |||||
|
|
|
|
| ||||||
Service Class shares (commenced operations on May 1, 2000) | +14.32% | +8.90% | +14.54% | +6.53% | +7.44% | |||||
|
|
|
|
| ||||||
Russell 1000 Value Index | +17.34% | +8.59% | +14.80% | +5.72% | n/a |
Returns reflect the reinvestment of all distributions. Please see page 4 for a description of the index.
As described in the Series’ most recent prospectus, the net expense ratio for Service Class shares of the Series was 0.96%, while total operating expenses for Standard Class and Service Class shares were 0.71% and 1.01%, respectively. The management fee for Standard Class and Service Class shares was 0.63%.
The Series’ distributor has contracted to limit the 12b-1 fees for Service Class shares to no more than 0.25% of average daily net assets from Jan. 1, 2016 through Dec. 31, 2016.*
Earnings from a variable annuity or variable life investment compound tax-free until withdrawal, and as a result, no adjustments were made for income taxes.
Expense limitations were in effect for both classes during certain periods shown in the Series performance table above and in the Performance of a $10,000 Investment graph on the next page.
Performance data do not reflect insurance fees related to a variable annuity or variable life investment or the deferred sales charge that would apply to certain withdrawals of investments held for fewer than eight years. Performance shown here would have been reduced if such fees were included and the expense limitation removed. For more information about fees, consult your variable annuity or variable life prospectus.
Investments in variable products involve risk.
Please read both the contract and underlying prospectus for specific details regarding the product’s risk profile.
*The aggregate contractual waiver period covering this report is from April 29, 2015 through May 1, 2017.
Value Series-3
Table of Contents
Delaware VIP Value Series
Performance summary (continued)
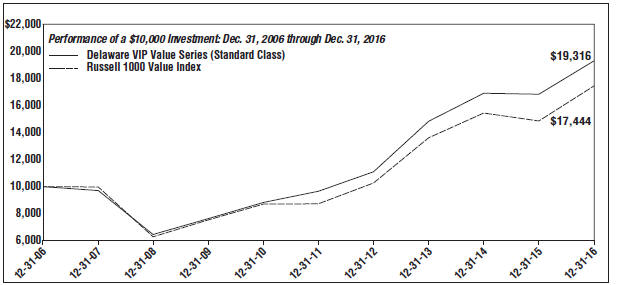
| For period beginning Dec. 31, 2006 through Dec. 31, 2016 | Starting value | Ending value | ||||
— Delaware VIP Value Series (Standard Class) | $10,000 | $19,316 | ||||
– – Russell 1000 Value Index | $10,000 | $17,444 |
The graph shows a $10,000 investment in the Delaware VIP Value Series Standard Class shares for the period from Dec. 31, 2006 through Dec. 31, 2016.
The graph also shows $10,000 invested in the Russell 1000 Value Index for the period from Dec. 31, 2006 through Dec. 31, 2016. The Russell 1000 Value Index measures the performance of the large-cap value segment of the U.S. equity universe. It includes those Russell 1000 companies with lower price-to-book ratios and lower forecasted growth values.
The Dow Jones Industrial Average, mentioned on page 1, is an often-quoted market indicator that comprises 30 widely held blue-chip stocks.
The S&P 500 Index, mentioned on page 1 and 2, measures the performance of 500 mostly large-cap stocks weighted by market value, and is often used to represent performance of the U.S. stock market.
Russell Investment Group is the source and owner of the trademarks, service marks, and copyrights related to the Russell Indexes. Russell® is a trademark of Russell Investment Group.
Index performance returns do not reflect any management fees, transaction costs or expenses. Indices are unmanaged and one cannot invest directly in an index.
Performance of Service Class shares will vary due to different charges and expenses.
Past performance is not a guarantee of future results.
| Value Series-4 |
Table of Contents
Delaware VIP® Trust — Delaware VIP Value Series
Disclosure of Series expenses
For the six-month period from July 1, 2016 to December 31, 2016 (Unaudited)
As a shareholder of the Series, you incur ongoing costs, which may include management fees; distribution and/or service (12b-1) fees; and other Series expenses. This example is intended to help you understand your ongoing costs (in dollars) of investing in the Series and to compare these costs with the ongoing costs of investing in other mutual funds.
The example is based on an investment of $1,000 invested at the beginning of the period and held for the entire six-month period from July 1, 2016 to Dec. 31, 2016.
Actual expenses
The first section of the table shown, “Actual Series Return,” provides information about actual account values and actual expenses. You may use the information in this section of the table, together with the amount you invested, to estimate the expenses that you paid over the period. Simply divide your account value by $1,000 (for example, an $8,600 account value divided by $1,000 = 8.6), then multiply the result by the number in the first section under the heading entitled “Expenses Paid During Period” to estimate the expenses you paid on your account during the period.
Hypothetical example for comparison purposes
The second section of the table shown, “Hypothetical 5% Return,” provides information about hypothetical account values and hypothetical expenses based on the Series’ actual expense ratio and an assumed rate of return of 5% per year before expenses, which is not the Series’ actual return. The hypothetical account values and expenses may not be used to estimate the actual ending account balance or expenses you paid for the period. You may use this information to compare the ongoing costs of investing in the Series and other funds. To do so, compare the 5% hypothetical example with the 5% hypothetical examples that appear in the shareholder reports of other funds.
Please note that the expenses shown in the table are meant to highlight your ongoing costs only. As a shareholder of the Series, you do not incur any transaction costs, such as sales charges (loads), redemption fees or exchange fees, but shareholders of other funds may incur such costs. Also, the fees related to the variable annuity investment or the deferred sales charge that could apply have not been included. Therefore, the second section of the table is useful in comparing ongoing costs only, and will not help you determine the relative total costs of owning different funds. The Series’ actual expenses shown in the table reflect fee waivers in effect for Service Class shares. The expenses shown in the table assume reinvestment of all dividends and distributions.
Expense analysis of an investment of $1,000
| Beginning Account Value 7/1/16 | Ending Account Value 12/31/16 | Annualized Expense Ratio | Expenses Paid During Period 7/1/16 to 12/31/16* | |||||||||||
Actual Series return† | ||||||||||||||
Standard Class | $1,000.00 | $1,035.80 | 0.69% | $3.53 | ||||||||||
Service Class | 1,000.00 | 1,034.10 | 0.94% | 4.81 | ||||||||||
Hypothetical 5% return (5% return before expenses) | ||||||||||||||
Standard Class | $1,000.00 | $1,021.67 | 0.69% | $3.51 | ||||||||||
Service Class | 1,000.00 | 1,020.41 | 0.94% | 4.77 | ||||||||||
| * | “Expenses Paid During Period” are equal to the Series’ annualized expense ratio, multiplied by the average account value over the period, multiplied by 184/366 (to reflect the one-half year period). |
| † | Because actual returns reflect only the most recent six-month period, the returns shown may differ significantly from fiscal year returns. |
Value Series-5
Table of Contents
Delaware VIP® Trust — Delaware VIP Value Series
Security type / sector allocation and top 10 equity holdings
As of December 31, 2016 (Unaudited)
Sector designations may be different than the sector designations presented in other Series materials. The sector designations may represent the investment manager’s internal sector classifications.
| Percentage of | ||||
| Security type / sector | net assets | |||
Common Stock | 95.89% | |||
Consumer Discretionary | 3.05% | |||
Consumer Staples | 12.12% | |||
Energy | 13.93% | |||
Financials | 12.12% | |||
Healthcare | 21.05% | |||
Industrials | 9.29% | |||
Information Technology | 9.20% | |||
Materials | 3.11% | |||
Real Estate | 2.97% | |||
Telecommunications | 6.00% | |||
Utilities | 3.05% | |||
Short-Term Investments | 3.18% | |||
Total Value of Securities | 99.07% | |||
Receivables and Other Assets Net of Liabilities | 0.93% | |||
Total Net Assets | 100.00% | |||
Holdings are for informational purposes only and are subject to change at any time. They are not a recommendation to buy, sell, or hold any security.
| Percentage | ||||
| Top 10 equity holdings | of net assets | |||
Chevron | 3.39% | |||
Intel | 3.25% | |||
Northrop Grumman | 3.20% | |||
Allstate | 3.15% | |||
Archer-Daniels-Midland | 3.12% | |||
EI du Pont de Nemours & Co. | 3.11% | |||
Raytheon | 3.08% | |||
AT&T | 3.07% | |||
Lowe’s | 3.05% | |||
Edison International
|
| 3.05%
|
| |
Value Series-6
Table of Contents
Delaware VIP® Trust — Delaware VIP Value Series
December 31, 2016
Number of shares | Value (U.S. $) | |||||||
Common Stock – 95.89% | ||||||||
Consumer Discretionary – 3.05% |
| |||||||
Lowe’s | 345,400 | $ | 24,564,848 | |||||
|
| |||||||
| 24,564,848 | ||||||||
|
| |||||||
Consumer Staples – 12.12% | ||||||||
Archer-Daniels-Midland | 550,200 | 25,116,630 | ||||||
CVS Health | 306,600 | 24,193,806 | ||||||
Kraft Heinz | 275,833 | 24,085,738 | ||||||
Mondelez International | 545,200 | 24,168,716 | ||||||
|
| |||||||
| 97,564,890 | ||||||||
|
| |||||||
Energy – 13.93% | ||||||||
Chevron | 232,000 | 27,306,400 | ||||||
ConocoPhillips | 477,300 | 23,931,822 | ||||||
Halliburton | 446,300 | 24,140,367 | ||||||
Marathon Oil | 802,500 | 13,891,275 | ||||||
Occidental Petroleum | 320,800 | 22,850,584 | ||||||
|
| |||||||
| 112,120,448 | ||||||||
|
| |||||||
Financials – 12.12% | ||||||||
Allstate | 342,400 | 25,378,688 | ||||||
Bank of New York Mellon | 508,600 | 24,097,468 | ||||||
BB&T | 513,400 | 24,140,068 | ||||||
Marsh & McLennan | 355,000 | 23,994,450 | ||||||
|
| |||||||
| 97,610,674 | ||||||||
|
| |||||||
Healthcare – 21.05% | ||||||||
Abbott Laboratories | 634,100 | 24,355,780 | ||||||
Cardinal Health | 334,000 | 24,037,980 | ||||||
Express Scripts Holding † | 348,650 | 23,983,634 | ||||||
Johnson & Johnson | 210,500 | 24,251,705 | ||||||
Merck & Co. | 412,500 | 24,283,875 | ||||||
Pfizer | 749,141 | 24,332,100 | ||||||
Quest Diagnostics | 264,100 | 24,270,790 | ||||||
|
| |||||||
| 169,515,864 | ||||||||
|
| |||||||
Industrials – 9.29% | ||||||||
Northrop Grumman | 110,700 | 25,746,606 | ||||||
Raytheon | 174,600 | 24,793,200 | ||||||
Waste Management | 341,500 | 24,215,765 | ||||||
|
| |||||||
| 74,755,571 | ||||||||
|
| |||||||
Information Technology – 9.20% |
| |||||||
CA | 758,016 | 24,082,168 | ||||||
Cisco Systems | 789,500 | 23,858,690 | ||||||
Intel | 721,000 | 26,150,670 | ||||||
|
| |||||||
| 74,091,528 | ||||||||
|
| |||||||
Number of shares | Value (U.S. $) | |||||||
Common Stock (continued) | ||||||||
| Materials – 3.11% | ||||||||
EI du Pont de Nemours & Co. | 341,300 | $ | 25,051,420 | |||||
|
| |||||||
| 25,051,420 | ||||||||
|
| |||||||
Real Estate – 2.97% | ||||||||
Equity Residential | 371,326 | 23,898,541 | ||||||
|
| |||||||
| 23,898,541 | ||||||||
|
| |||||||
Telecommunications – 6.00% | ||||||||
AT&T | 580,624 | 24,693,939 | ||||||
Verizon Communications | 442,000 | 23,593,960 | ||||||
|
| |||||||
| 48,287,899 | ||||||||
|
| |||||||
Utilities – 3.05% | ||||||||
Edison International | 340,600 | 24,519,794 | ||||||
|
| |||||||
| 24,519,794 | ||||||||
|
| |||||||
Total Common Stock | 771,981,477 | |||||||
|
| |||||||
Principal amount° | ||||||||
Short-Term Investments – 3.18% |
| |||||||
Discount Notes – 2.31% ≠ | ||||||||
Federal Home Loan Bank | ||||||||
0.379% 2/3/17 | 2,352,075 | 2,351,082 | ||||||
0.483% 1/30/17 | 8,144,370 | 8,142,106 | ||||||
0.499% 2/15/17 | 2,036,092 | 2,034,901 | ||||||
0.501% 2/6/17 | 6,108,277 | 6,105,449 | ||||||
|
| |||||||
| 18,633,538 | ||||||||
|
| |||||||
Repurchase Agreements – 0.87% |
| |||||||
Bank of America Merrill Lynch | 2,353,456 | 2,353,456 | ||||||
Bank of Montreal | 2,745,698 | 2,745,698 | ||||||
Value Series-7
Table of Contents
Delaware VIP® Value Series
Schedule of investments (continued)
Principal amount° | Value (U.S. $) | |||||||
Short-Term Investments (continued) | ||||||||
Repurchase Agreements (continued) | ||||||||
BNP Paribas | 1,879,846 | $ | 1,879,846 | |||||
|
| |||||||
| 6,979,000 | ||||||||
|
| |||||||
Total Short-Term Investments | 25,612,538 | |||||||
|
| |||||||
Total Value of Securities – 99.07% | $ | 797,594,015 | ||
|
|
| ≠ | The rate shown is the effective yield at the time of purchase. |
| ° | Principal amount shown is stated in U.S. dollars unless noted that the security is denominated in another currency. |
| † | Non-income-producing security. |
See accompanying notes, which are an integral part of the financial statements.
| Value Series-8 |
Table of Contents
| Delaware VIP® Trust — Delaware VIP Value Series | ||
| Statement of assets and liabilities | December 31, 2016 | |
Assets: | ||||
Investments, at value1 | $ | 771,981,477 | ||
Short-term investments, at value2 | 25,612,538 | |||
Cash | 999 | |||
Receivable for securities sold | 29,477,689 | |||
Dividends and interest receivable | 1,354,856 | |||
Receivable for series shares sold | 826 | |||
|
| |||
Total assets | 828,428,385 | |||
|
| |||
Liabilities: | ||||
Payable for securities purchased | 21,323,009 | |||
Payable for series shares redeemed | 1,370,379 | |||
Dividend disbursing and transfer agent fees and expenses payable to affiliates | 5,126 | |||
Accounting and administration expenses payable to affiliates | 3,214 | |||
Investment management fees payable to affiliates | 431,216 | |||
Other accrued expenses | 93,499 | |||
Distribution fees payable to affiliates | 77,497 | |||
Trustees’ fees and expenses payable | 1,968 | |||
Legal fees payable to affiliates | 1,442 | |||
Reports and statements to shareholders expenses payable to affiliates | 712 | |||
|
| |||
Total liabilities | 23,308,062 | |||
|
| |||
Total Net Assets | $ | 805,120,323 | ||
|
| |||
Net Assets Consist of: | ||||
Paid-in capital | $ | 479,903,682 | ||
Undistributed net investment income | 13,020,545 | |||
Accumulated net realized gain on investments | 25,414,238 | |||
Net unrealized appreciation of investments | 286,781,858 | |||
|
| |||
Total Net Assets | $ | 805,120,323 | ||
|
| |||
Net Asset Value: | ||||
Standard Class: | ||||
Net assets | $ | 439,264,866 | ||
Shares of beneficial interest outstanding, unlimited authorization, no par | 15,018,957 | |||
Net asset value per share | $ | 29.25 | ||
Service Class: | ||||
Net assets | $ | 365,855,457 | ||
Shares of beneficial interest outstanding, unlimited authorization, no par | 12,548,890 | |||
Net asset value per share | $ | 29.15 | ||
1 Investments, at cost | $ | 485,200,908 | ||
2 Short-term investments, at cost | 25,611,249 | |||
See accompanying notes, which are an integral part of the financial statements.
Value Series-9
Table of Contents
Delaware VIP® Trust —
Statement of operations
Year ended December 31, 2016
Investment Income: | ||||
Dividends | $ | 19,029,575 | ||
Interest | 62,526 | |||
|
| |||
| 19,092,101 | ||||
|
| |||
Expenses: | ||||
Management fees | 4,702,048 | |||
Distribution expenses – Service Class | 996,788 | |||
Accounting and administration expenses | 237,639 | |||
Dividend disbursing and transfer agent fees and expenses | 63,204 | |||
Reports and statements to shareholders expenses | 57,739 | |||
Legal fees | 44,658 | |||
Trustees’ fees and expenses | 35,998 | |||
Audit and tax fees | 33,112 | |||
Custodian fees | 28,328 | |||
Registration fees | 3,018 | |||
Other | 20,659 | |||
|
| |||
| 6,223,191 | ||||
Less waived distribution expenses – Service Class | (166,131 | ) | ||
Less expense paid indirectly | (1 | ) | ||
|
| |||
Total operating expenses | 6,057,059 | |||
|
| |||
Net Investment Income | 13,035,042 | |||
|
| |||
Net Realized and Unrealized Gain: | ||||
Net realized gain on investments | 28,752,645 | |||
Net change in unrealized appreciation (depreciation) of investments | 59,053,056 | |||
|
| |||
Net Realized and Unrealized Gain | 87,805,701 | |||
|
| |||
Net Increase in Net Assets Resulting from Operations | $ | 100,840,743 | ||
|
| |||
Delaware VIP Trust —
Delaware VIP Value Series
Statements of changes in net assets
| Year ended | ||||||||
| 12/31/16 | 12/31/15 | |||||||
Increase (Decrease) in Net |
| |||||||
Net investment income | $ | 13,035,042 | $ | 13,579,859 | ||||
Net realized gain | 28,752,645 | 77,813,693 | ||||||
Net change in unrealized appreciation (depreciation) | 59,053,056 | (94,550,115 | ) | |||||
|
|
|
| |||||
Net increase (decrease) in net assets resulting from operations | 100,840,743 | (3,156,563 | ) | |||||
|
|
|
| |||||
Dividends and Distributions |
| |||||||
Net investment income: | ||||||||
Standard Class | (7,928,234 | ) | (8,223,700 | ) | ||||
Service Class | (5,649,583 | ) | (4,842,691 | ) | ||||
Net realized gain: | ||||||||
Standard Class | (36,394,752 | ) | — | |||||
Service Class | (29,532,407 | ) | — | |||||
|
|
|
| |||||
| (79,504,976 | ) | (13,066,391 | ) | |||||
|
|
|
| |||||
Capital Share Transactions: |
| |||||||
Proceeds from shares sold: | ||||||||
Standard Class | 24,409,045 | 28,402,258 | ||||||
Service Class | 49,349,702 | 26,622,421 | ||||||
Net asset value of shares |
| |||||||
Standard Class | 44,322,986 | 6,824,315 | ||||||
Service Class | 35,181,990 | 4,842,691 | ||||||
|
|
|
| |||||
| 153,263,723 | 66,691,685 | |||||||
|
|
|
| |||||
Cost of shares redeemed: | ||||||||
Standard Class | (30,744,407 | ) | (159,537,651 | ) | ||||
Service Class | (32,874,550 | ) | (50,559,612 | ) | ||||
|
|
|
| |||||
| (63,618,957 | ) | (210,097,263 | ) | |||||
|
|
|
| |||||
Increase (decrease) in net assets derived from capital share transactions | 89,644,766 | (143,405,578 | ) | |||||
|
|
|
| |||||
Net Increase (Decrease) in Net Assets: | 110,980,533 | (159,628,532 | ) | |||||
Net Assets: | ||||||||
Beginning of year | 694,139,790 | 853,768,322 | ||||||
|
|
|
| |||||
End of year | $ | 805,120,323 | $ | 694,139,790 | ||||
|
|
|
| |||||
Undistributed net investment income | $ | 13,020,545 | $ | 13,563,320 | ||||
|
|
|
| |||||
See accompanying notes, which are an integral part of the financial statements.
Value Series-10
Table of Contents
Delaware VIP® Trust — Delaware VIP Value Series
Selected data for each share of the Series outstanding throughout each period were as follows:
| Delaware VIP Value Series Standard Class | ||||||||||||||||||||
| Year ended | ||||||||||||||||||||
| 12/31/16 | 12/31/15 | 12/31/14 | 12/31/13 | 12/31/12 | ||||||||||||||||
Net asset value, beginning of period | $ | 28.640 | $ | 29.240 | $ | 26.090 | $ | 19.880 | $ | 17.730 | ||||||||||
Income (loss) from investment operations: | ||||||||||||||||||||
Net investment income1 | 0.524 | 0.546 | 0.478 | 0.451 | 0.418 | |||||||||||||||
Net realized and unrealized gain (loss) | 3.390 | (0.646 | ) | 3.126 | 6.170 | 2.163 | ||||||||||||||
|
|
|
|
|
|
|
|
|
| |||||||||||
Total from investment operations | 3.914 | (0.100 | ) | 3.604 | 6.621 | 2.581 | ||||||||||||||
|
|
|
|
|
|
|
|
|
| |||||||||||
Less dividends and distributions from: | ||||||||||||||||||||
Net investment income | (0.591 | ) | (0.500 | ) | (0.454 | ) | (0.411 | ) | (0.431 | ) | ||||||||||
Net realized gain | (2.713 | ) | — | — | — | — | ||||||||||||||
|
|
|
|
|
|
|
|
|
| |||||||||||
Total dividends and distributions | (3.304 | ) | (0.500 | ) | (0.454 | ) | (0.411 | ) | (0.431 | ) | ||||||||||
|
|
|
|
|
|
|
|
|
| |||||||||||
Net asset value, end of period | $ | 29.250 | $ | 28.640 | $ | 29.240 | $ | 26.090 | $ | 19.880 | ||||||||||
|
|
|
|
|
|
|
|
|
| |||||||||||
Total return2 | 14.65% | (0.41% | ) | 14.00% | 33.69% | 14.73% | ||||||||||||||
Ratios and supplemental data: | ||||||||||||||||||||
Net assets, end of period (000 omitted) | $ | 439,265 | $ | 389,570 | $ | 523,240 | $ | 473,403 | $ | 350,444 | ||||||||||
Ratio of expenses to average net assets | 0.70% | 0.71% | 0.71% | 0.71% | 0.73% | |||||||||||||||
Ratio of net investment income to average net assets | 1.87% | 1.88% | 1.74% | 1.94% | 2.21% | |||||||||||||||
Portfolio turnover | 17% | 17% | 12% | 14% | 21% | |||||||||||||||
| 1 | The average shares outstanding method has been applied for per share information. |
| 2 | Total investment return is based on the change in net asset value of a share during the period and assumes reinvestment of dividends and distributions at net asset value. Total investment return does not include fees, charges, or expenses imposed by the variable annuity and life insurance contracts for which Delaware VIP Trust serves as an underlying investment vehicle. |
See accompanying notes, which are an integral part of the financial statements.
Value Series-11
Table of Contents
Delaware VIP® Value Series
Financial highlights (continued)
Selected data for each share of the Series outstanding throughout each period were as follows:
| Delaware VIP Value Series Service Class | ||||||||||||||||||||
| Year ended | ||||||||||||||||||||
| 12/31/16 | 12/31/15 | 12/31/14 | 12/31/13 | 12/31/12 | ||||||||||||||||
Net asset value, beginning of period | $ | 28.560 | $ | 29.160 | $ | 26.030 | $ | 19.840 | $ | 17.700 | ||||||||||
Income (loss) from investment operations: | ||||||||||||||||||||
Net investment income1 | 0.453 | 0.472 | 0.409 | 0.393 | 0.370 | |||||||||||||||
Net realized and unrealized gain (loss) | 3.369 | (0.640 | ) | 3.117 | 6.161 | 2.158 | ||||||||||||||
|
|
|
|
|
|
|
|
|
| |||||||||||
Total from investment operations | 3.822 | (0.168 | ) | 3.526 | 6.554 | 2.528 | ||||||||||||||
|
|
|
|
|
|
|
|
|
| |||||||||||
Less dividends and distributions from: | ||||||||||||||||||||
Net investment income | (0.519 | ) | (0.432 | ) | (0.396 | ) | (0.364 | ) | (0.388 | ) | ||||||||||
Net realized gain | (2.713 | ) | — | — | — | — | ||||||||||||||
|
|
|
|
|
|
|
|
|
| |||||||||||
Total dividends and distributions | (3.232 | ) | (0.432 | ) | (0.396 | ) | (0.364 | ) | (0.388 | ) | ||||||||||
|
|
|
|
|
|
|
|
|
| |||||||||||
Net asset value, end of period | $ | 29.150 | $ | 28.560 | $ | 29.160 | $ | 26.030 | $ | 19.840 | ||||||||||
|
|
|
|
|
|
|
|
|
| |||||||||||
Total return2 | 14.32% | (0.64% | ) | 13.70% | 33.37% | 14.44% | ||||||||||||||
Ratios and supplemental data: | ||||||||||||||||||||
Net assets, end of period (000 omitted) | $ | 365,855 | $ | 304,570 | $ | 330,528 | $ | 285,695 | $ | 210,804 | ||||||||||
Ratio of expenses to average net assets | 0.95% | 0.96% | 0.96% | 0.96% | 0.98% | |||||||||||||||
Ratio of expenses to average net assets prior to fees waived | 1.00% | 1.01% | 1.01% | 1.01% | 1.03% | |||||||||||||||
Ratio of net investment income to average net assets | 1.62% | 1.63% | 1.49% | 1.69% | 1.96% | |||||||||||||||
Ratio of net investment income to average net assets prior to fees waived | 1.57% | 1.58% | 1.44% | 1.64% | 1.91% | |||||||||||||||
Portfolio turnover | 17% | 17% | 12% | 14% | 21% | |||||||||||||||
| 1 | The average shares outstanding method has been applied for per share information. |
| 2 | Total investment return is based on the change in net asset value of a share during the period and assumes reinvestment of dividends and distributions at net asset value. Total investment return during all of the periods shown reflects a waiver by the distributor. Performance would have been lower had the waiver not been in effect. Total investment return does not include fees, charges, or expenses imposed by the variable annuity and life insurance contracts for which Delaware VIP Trust serves as an underlying investment vehicle. |
See accompanying notes, which are an integral part of the financial statements.
| Value Series-12 |
Table of Contents
Delaware VIP® Trust — Delaware VIP Value Series
December 31, 2016
Delaware VIP Trust (Trust) is organized as a Delaware statutory trust and offers 10 series: Delaware VIP Diversified Income Series, Delaware VIP Emerging Markets Series, Delaware VIP High Yield Series, Delaware VIP International Value Equity Series, Delaware VIP Limited-Term Diversified Income Series, Delaware VIP REIT Series, Delaware VIP Small Cap Value Series, Delaware VIP Smid Cap Growth Series, Delaware VIP U.S. Growth Series, and Delaware VIP Value Series. These financial statements and the related notes pertain to Delaware VIP Value Series (Series). The Trust is an open-end investment company. The Series is considered diversified under the Investment Company Act of 1940, as amended, and offers Standard Class and Service Class shares. The Standard Class shares do not carry a 12b-1 fee and the Service Class shares carry a 12b-1 fee. The shares of the Series are sold only to separate accounts of life insurance companies.
The investment objective of the Series is to seek long-term capital appreciation.
1. Significant Accounting Policies
The following accounting policies are in accordance with U.S. generally accepted accounting principles (U.S. GAAP) and are consistently followed by the Series.
Security Valuation — Equity securities, except those traded on the Nasdaq Stock Market LLC (Nasdaq), are valued at the last quoted sales price as of the time of the regular close of the New York Stock Exchange on the valuation date. Equity securities traded on the Nasdaq are valued in accordance with the Nasdaq Official Closing Price, which may not be the last sales price. If, on a particular day, an equity security does not trade, the mean between the bid and ask prices will be used, which approximates fair value. U.S. government and agency securities are valued at the mean between the bid and ask prices, which approximates fair value. Generally, other securities and assets for which market quotations are not readily available are valued at fair value as determined in good faith under the direction of the Trust’s Board of Trustees (Board). In determining whether market quotations are readily available or fair valuation will be used, various factors will be taken into consideration, such as market closures or suspension of trading in a security.
Federal Income Taxes — No provision for federal income taxes has been made as the Series intends to continue to qualify for federal income tax purposes as a regulated investment company under Subchapter M of the Internal Revenue Code of 1986, as amended, and make the requisite distributions to shareholders. The Series evaluates tax positions taken or expected to be taken in the course of preparing the Series’ tax returns to determine whether the tax positions are “more-likely-than-not” of being sustained by the applicable tax authority. Tax positions not deemed to meet the “more-likely-than-not” threshold are recorded as a tax benefit or expense in the current year. Management has analyzed the Series’ tax positions taken for all open federal income tax years (Dec. 31, 2013–Dec. 31, 2016), and has concluded that no provision for federal income tax is required in the Series’ financial statements.
Class Accounting — Investment income, common expenses, and realized and unrealized gain (loss) on investments are allocated to the classes of the Series on the basis of daily net assets of each class. Distribution expenses relating to a specific class are charged directly to that class.
Repurchase Agreements — The Series may purchase certain U.S. government securities subject to the counterparty’s agreement to repurchase them at an agreed upon date and price. The counterparty will be required on a daily basis to maintain the value of the collateral subject to the agreement at not less than the repurchase price (including accrued interest). The agreements are conditioned upon the collateral being deposited under the Federal Reserve book-entry system with the Series’ custodian or a third-party sub-custodian. In the event of default or bankruptcy by the other party to the agreement, retention of the collateral may be subject to legal proceedings. All open repurchase agreements as of the date of this report were entered into on Dec. 30, 2016, and matured on the next business day.
Use of Estimates — The Series is an investment company, whose financial statements are prepared in conformity with U.S. GAAP. Therefore, the Series follows the accounting and reporting guidelines for investment companies. The preparation of financial statements in conformity with U.S. GAAP requires management to make estimates and assumptions that affect the fair value of investments, the reported amounts of assets and liabilities and disclosure of contingent assets and liabilities at the date of the financial statements, and the reported amounts of revenues and expenses during the reporting period. Actual results could differ from those estimates and the differences could be material.
Other — Expenses directly attributable to the Series are charged directly to the Series. Other expenses common to various funds within the Delaware Investments® Family of Funds are generally allocated among such funds on the basis of average net assets. Management fees and certain other expenses are paid monthly. Security transactions are recorded on the date the securities are purchased or sold (trade date) for financial reporting purposes. Costs used in calculating realized gains and losses on the sale of investment securities are those of the specific securities sold. Dividend income is recorded on the ex-dividend date and interest income is recorded on the accrual basis. Discounts and premiums on debt securities are accreted or amortized to interest income, respectively, over the lives of the respective securities using the effective interest method. The Series declares and pays distributions from net investment income and distributions from net realized gain on investments, if any, following the close of the fiscal year. The Series may distribute more frequently, if necessary for tax purposes. Dividends and distributions, if any, are recorded on the ex-dividend date.
Subject to seeking best execution, the Series may direct certain security trades to brokers who have agreed to rebate a portion of the related brokerage commission to the Series in cash. In general, best execution refers to many factors, including the price paid or received for a security, the commission charged, the promptness and reliability of execution, the confidentiality and placement accorded the order, and other factors affecting the overall benefit obtained by the Series on the transaction. There were no commission rebates for the year ended Dec. 31, 2016.
Value Series-13
Table of Contents
Delaware VIP® Value Series
Notes to financial statements (continued)
1. Significant Accounting Policies (continued)
The Series may receive earnings credits from its custodian when positive cash balances are maintained, which may be used to offset custody fees. There were no such earnings credits for the year ended Dec. 31, 2016.
The Series receives earnings credits from its transfer agent when positive cash balances are maintained, which may be used to offset transfer agent fees. If the amount earned is greater than $1.00, the expense paid under this arrangement is included on the “Statement of operations” under “Dividend disbursing and transfer agent fees and expenses” with the corresponding expense offset shown under “Less expense paid indirectly.” For the year ended Dec. 31, 2016, the Series earned $1 under this agreement.
2. Investment Management, Administration Agreements, and Other Transactions with Affiliates
In accordance with the terms of its investment management agreement, the Series pays Delaware Management Company (DMC), a series of Delaware Management Business Trust and the investment manager, an annual fee which is calculated daily at the rate of 0.75% on the first $500 million of average daily net assets of the Series, 0.70% on the next $500 million, 0.65% on the next $1.5 billion, and 0.60% on average daily net assets in excess of $2.5 billion.
Delaware Investments Fund Services Company (DIFSC), an affiliate of DMC, provides fund accounting and financial administration oversight services to the Series. For these services, DIFSC’s fees are calculated based on the aggregate daily net assets of the Delaware Investments® Family of Funds at the following annual rate: 0.0050% of the first $30 billion; 0.0045% of the next $10 billion; 0.0040% of the next $10 billion; and 0.0025% of aggregate average daily net assets in excess of $50 billion. The fees payable to DIFSC under the service agreement described above are allocated among all funds in the Delaware Investments Family of Funds on a relative net asset value (NAV) basis. For the year ended Dec. 31, 2016, the Series was charged $35,104 for these services. This amount is included on the “Statement of operations” under “Accounting and administration expenses.”
DIFSC is also the transfer agent and dividend disbursing agent of the Series. For these services, DIFSC’s fees are calculated at the annual rate of 0.0075% of the Series’ average daily net assets. This amount is included on the “Statement of operations” under “Dividend disbursing and transfer agent fees and expenses.” For the year ended Dec. 31, 2016, the Series was charged $55,651 for these services. Pursuant to a sub-transfer agency agreement between DIFSC and BNY Mellon Investment Servicing (US) Inc. (BNYMIS), BNYMIS provides certain sub-transfer agency services to the Series. Sub-transfer agency fees are paid by the Series and are also included on the “Statement of operations” under “Dividend disbursing and transfer agent fees and expenses.”
Pursuant to a distribution agreement and distribution plan, the Series pays Delaware Distributors, L.P. (DDLP), the distributor and an affiliate of DMC, an annual distribution and service (12b-1) fee of 0.30% of the average daily net assets of the Service Class shares. DDLP has contracted to waive 12b-1 fees from Jan. 1, 2016 to Dec. 31, 2016*, in order to limit 12b-1 fees of the Service Class shares to 0.25% of average daily net assets. Standard Class shares pay no 12b-1 fees.
As provided in the investment management agreement, the Series bears a portion of the cost of certain resources shared with DMC, including the cost of internal personnel of DMC and/or its affiliates that provide legal, tax, and regulatory reporting services to the Series. For the year ended Dec. 31, 2016, the Series was charged $16,809 for internal legal, tax, and regulatory reporting services provided by DMC and/or its affiliates’ employees. This amount is included on the “Statement of operations” under “Legal fees.”
Trustees’ fees include expenses accrued by the Series for each Trustee’s retainer and meeting fees. Certain officers of DMC, DIFSC, and DDLP are officers and/or Trustees of the Trust. These officers and Trustees are paid no compensation by the Series.
Cross trades for the year ended Dec. 31, 2016 were executed by the Series pursuant to procedures adopted by the Board designed to ensure compliance with Rule 17a-7 under the 1940 Act. Cross trading is the buying or selling of portfolio securities between funds of investment companies, or between a fund of an investment company and another entity, that are or could be considered affiliates by virtue of having a common investment advisor (or affiliated investment advisors), common directors/trustees and or common officers. At its regularly scheduled meetings, the Board reviews such transactions for compliance with the procedures adopted by the Board. Pursuant to these procedures, for the year ended Dec. 31, 2016, the Series engaged in securities sales of $7,733,545, which resulted in net realized losses of $(783).
*The aggregate contractual waiver period covering this report is from April 29, 2015 through May 1, 2017.
3. Investments
For the year ended Dec. 31, 2016, the Series made purchases and sales of investment securities other than short-term investments as follows:
Purchases | $ | 125,638,198 | ||
Sales | 127,455,509 |
At Dec. 31, 2016, the cost and unrealized appreciation (depreciation) of investments for federal income tax purposes were as follows:
Value Series-14
Table of Contents
Delaware VIP® Value Series
Notes to financial statements (continued)
3. Investments (continued)
Cost of | Aggregate Unrealized Appreciation of Investments | Aggregate Unrealized Depreciation of Investments | Net Unrealized | |||
| $513,299,137 | $304,154,128 | $(19,859,250) | $284,294,878 |
U.S. GAAP defines fair value as the price that the Series would receive to sell an asset or pay to transfer a liability in an orderly transaction between market participants at the measurement date under current market conditions. A three-level hierarchy for fair value measurements has been established based upon the transparency of inputs to the valuation of an asset or liability. Inputs may be observable or unobservable and refer broadly to the assumptions that market participants would use in pricing the asset or liability. Observable inputs reflect the assumptions market participants would use in pricing the asset or liability based on market data obtained from sources independent of the reporting entity. Unobservable inputs reflect the reporting entity’s own assumptions about the assumptions that market participants would use in pricing the asset or liability based on the best information available under the circumstances. The Series’ investment in its entirety is assigned a level based upon the observability of the inputs which are significant to the overall valuation. The three-level hierarchy of inputs is summarized below.
Level 1 – | Inputs are quoted prices in active markets for identical investments. (Examples: equity securities, open-end investment companies, futures contracts, exchange-traded options contracts) | |
Level 2 – | Other observable inputs, including, but not limited to: quoted prices for similar assets or liabilities in markets that are active, quoted prices for identical or similar assets or liabilities in markets that are not active, inputs other than quoted prices that are observable for the assets or liabilities (such as interest rates, yield curves, volatilities, prepayment speeds, loss severities, credit risks and default rates), or other market-corroborated inputs. (Examples: debt securities, government securities, swap contracts, foreign currency exchange contracts, foreign securities utilizing international fair value pricing, broker-quoted securities, fair valued securities) | |
Level 3 – | Significant unobservable inputs including the Series’ own assumptions used to determine the fair value of investments. (Examples: broker-quoted securities, fair valued securities) |
Level 3 investments are valued using significant unobservable inputs. The Series may also use an income-based valuation approach in which the anticipated future cash flows of the investment are discounted to calculate fair value. Discounts may also be applied due to the nature or duration of any restrictions on the disposition of the investments. Valuations may also be based upon current market prices of securities that are comparable in coupon, rating, maturity, and industry. The derived value of a Level 3 investment may not represent the value which is received upon disposition and this could impact the results of operations.
The following table summarizes the valuation of the Series’ investments by fair value hierarchy levels as of Dec. 31, 2016:
Securities | Level 1 | Level 2 | Total | |||||||||
Common Stock | $ | 771,981,477 | $ | — | $ | 771,981,477 | ||||||
Short-Term Investments | — | 25,612,538 | 25,612,538 | |||||||||
|
|
|
|
|
| |||||||
Total Value of Securities | $ | 771,981,477 | $ | 25,612,538 | $ | 797,594,015 | ||||||
|
|
|
|
|
| |||||||
During the year ended Dec. 31, 2016, there were no transfers between Level 1 investments, Level 2 investments, or Level 3 investments that had a significant impact to the Series. The Series’ policy is to recognize transfers between levels at the beginning of the reporting period.
A reconciliation of Level 3 investments is presented when the Series has a significant amount of Level 3 investments at the beginning, interim, or end of the period in relation to the Series’ net assets. During the year ended Dec. 31, 2016, there were no Level 3 investments.
4. Dividend and Distribution Information
Income and long-term capital gain distributions are determined in accordance with federal income tax regulations, which may differ from U.S. GAAP. Additionally, distributions from net short-term gains on sales of investment securities are treated as ordinary income for federal income tax purposes. The tax character of dividends and distributions paid during the years ended Dec. 31, 2016 and 2015 was as follows:
| Year ended | ||||||||
| 12/31/16 | 12/31/15 | |||||||
Ordinary income | $ | 13,577,817 | $ | 13,066,391 | ||||
Long-term capital gain | 65,927,159 | — | ||||||
|
|
|
| |||||
Total | $ | 79,504,976 | $ | 13,066,391 | ||||
|
|
|
| |||||
| Value Series-15 |
Table of Contents
Delaware VIP® Value Series
Notes to financial statements (continued)
5. Components of Net Assets on a Tax Basis
As of Dec. 31, 2016, the components of net assets on a tax basis were as follows:
Shares of beneficial interest | $ | 479,903,682 | ||
Undistributed ordinary income | 19,279,596 | |||
Undistributed long-term capital gains | 21,642,167 | |||
Unrealized appreciation on investments | 284,294,878 | |||
|
| |||
Net assets | $ | 805,120,323 | ||
|
|
The differences between book basis and tax basis components of net assets are primarily attributable to tax deferral of losses on wash sales.
6. Capital Shares
Transactions in capital shares were as follows:
| Year ended | ||||||||
| 12/31/16 | 12/31/15 | |||||||
Shares sold: | ||||||||
Standard Class | 871,243 | 977,560 | ||||||
Service Class | 1,755,795 | 918,920 | ||||||
Shares issued upon reinvestment of dividends and distributions: |
| |||||||
Standard Class | 1,644,028 | 228,391 | ||||||
Service Class | 1,306,909 | 162,288 | ||||||
|
|
|
| |||||
| 5,577,975 | 2,287,159 | |||||||
|
|
|
| |||||
Shares redeemed: | ||||||||
Standard Class | (1,098,047 | ) | (5,498,915 | ) | ||||
Service Class | (1,178,740 | ) | (1,749,877 | ) | ||||
|
|
|
| |||||
| (2,276,787 | ) | (7,248,792 | ) | |||||
|
|
|
| |||||
Net increase (decrease) | 3,301,188 | (4,961,633 | ) | |||||
|
|
|
| |||||
7. Line of Credit
The Series, along with certain other funds in the Delaware Investments® Family of Funds (Participants), was a participant in a $155,000,000 revolving line of credit intended to be used for temporary or emergency purposes as an additional source of liquidity to fund redemptions of investor shares. Under the agreement, the Participants were charged an annual commitment fee of 0.10%, which was allocated across the Participants on the basis of relative net assets of each Participant’s allocation of the entire facility. The Participants were permitted to borrow up to a maximum of one third of their net assets under the agreement. Each Participant was individually, and not jointly, liable for its particular advances, if any, under the line of credit. The line of credit available under the agreement expired on Nov. 7, 2016.
On Nov. 7, 2016, the Series, along with the other Participants, entered into an amendment to the agreement for a $155,000,000 revolving line of credit. The line of credit is to be used as described above and operates in substantially the same manner as the original agreement, with the exception of the annual commitment fee. Under the amendment to the agreement, the Participants are charged an annual commitment fee of 0.15%, which is allocated across the Participants on the basis of relative net assets of each Participant’s allocation of the entire facility. The line of credit available under the agreement expires on Nov. 6, 2017.
The Series had no amounts outstanding as of Dec. 31, 2016 or at any time during the year then ended.
8. Offsetting
In December 2011, the Financial Accounting Standards Board (FASB) issued guidance that expanded disclosure requirements on the offsetting of certain assets and liabilities. The disclosures are required for investments and derivative financial instruments subject to master netting or similar agreements which are eligible for offset on the “Statement of assets and liabilities” and requires an entity to disclose both gross and net information about such investments and transactions in the financial statements. In January 2013, the FASB issued guidance that clarified which investments and transactions are subject to the offsetting disclosure requirements. The scope of the disclosure requirements for offsetting is limited to derivative instruments, repurchase agreements and reverse repurchase agreements, and securities borrowing.
In order to better define its contractual rights and to secure rights that will help the Series mitigate its counterparty risk, the Series entered into an International Swaps and Derivatives Association, Inc. Master Agreement (ISDA Master Agreement) or a similar agreement with certain of its derivative contract counterparties. An ISDA Master Agreement is a bilateral agreement between the Series and a counterparty that governs certain over-the-counter (OTC) derivatives and foreign exchange contracts and typically contains, among other things, collateral posting items and netting provisions in the event of a default and/or termination event. Under an ISDA Master Agreement, the Series may, under certain circumstances, offset
| Value Series-16 |
Table of Contents
Delaware VIP® Value Series
Notes to financial statements (continued)
8. Offsetting (continued)
with the counterparty certain derivative financial instruments payables and/or receivables with collateral held and/or posted and create one single net payment. The provisions of the ISDA Master Agreement typically permit a single net payment in the event of default (close-out), including the bankruptcy or insolvency of the counterparty. However, bankruptcy or insolvency laws of a particular jurisdiction may impose restrictions on or prohibitions against the right of offset in bankruptcy, insolvency, or other events.
For financial reporting purposes, the Series does not offset derivative assets and derivatives liabilities that are subject to netting arrangements on the “Statement of assets and liabilities.”
At Dec. 31, 2016, the Series had the following assets and liabilities subject to offsetting provisions:
Master Repurchase Agreements
Counterparty | Repurchase Agreements | Fair Value of Non-Cash Collateral Received(a) | Cash Collateral Received | Net Collateral Received | Net Exposure(b) | ||||||||||||||||||||
Bank of America Merrill Lynch | $2,353,456 | $(2,353,456 | ) | $— | $(2,353,456 | ) | $— | ||||||||||||||||||
Bank of Montreal | 2,745,698 | (2,745,698 | ) | — | (2,745,698 | ) | — | ||||||||||||||||||
BNP Paribas | 1,879,846 | (1,879,846 | ) | — | (1,879,846 | ) | — | ||||||||||||||||||
Total | $6,979,000 | $(6,979,000 | ) | $— | $(6,979,000 | ) | $— | ||||||||||||||||||
(a) The value of the related collateral received exceeded the value of the repurchase agreements as of Dec. 31, 2016.
(b) Net exposure represents the net receivable (payable) that would be due from (to) the counterparty in an event of default.
9. Securities Lending
The Series, along with other funds in the Delaware Investments® Family of Funds, may lend its securities pursuant to a security lending agreement (Lending Agreement) with The Bank of New York Mellon (BNY Mellon). At the time a security is loaned, the borrower must post collateral equal to the required percentage of the market value of the loaned security, including any accrued interest. The required percentage is: (1) 102% with respect to U.S. securities and foreign securities that are denominated and payable in U.S. dollars; and (2) 105% with respect to foreign securities. With respect to each loan, if on any business day the aggregate market value of securities collateral plus cash collateral held is less than the aggregate market value of the securities that are the subject of such loan, the borrower will be notified to provide additional collateral by the end of the following business day, which, together with the collateral already held, will be not less than the applicable initial collateral requirements for such security loan. If the aggregate market value of securities collateral and cash collateral held with respect to a security loan exceeds the applicable initial collateral requirement, upon the request of the borrower, BNY Mellon must return enough collateral to the borrower by the end of the following business day to reduce the value of the remaining collateral to the applicable initial collateral requirement for such security loan. As a result of the foregoing, the value of the collateral held with respect to a loaned security on any particular day may be more or less than the value of the security on loan.
Cash collateral received by each series of the Trust is generally invested in a series of individual separate accounts, each corresponding to a Series. The investment guidelines permit each separate account to hold certain securities that would be considered eligible securities for a money market fund. Cash collateral received is generally invested in government securities; certain obligations issued by government sponsored enterprises; repurchase agreements collateralized by U.S. Treasury securities; obligations issued by the central government of any Organization for Economic Cooperation and Development (OECD) country or its agencies, instrumentalities, or establishments; obligations of supranational organizations; commercial paper, notes, bonds, and other debt obligations; certificates of deposit, time deposits, and other bank obligations; and asset-backed securities.
In the event of default or bankruptcy by the lending agent, realization and/or retention of the collateral may be subject to legal proceedings. In the event the borrower fails to return loaned securities and the collateral received is insufficient to cover the value of the loaned securities and provided such collateral shortfall is not the result of investment losses, the lending agent has agreed to pay the amount of the shortfall to the Series or, at the discretion of the lending agent, replace the loaned securities. The Series continues to record dividends or interest, as applicable, on the securities loaned and are subject to changes in value of the securities loaned that may occur during the term of the loan. The Series has the right under the Lending Agreement to recover the securities from the borrower on demand. With respect to security loans collateralized by non-cash collateral, the Series receives loan premiums paid by the borrower. With respect to security loans collateralized by cash collateral, the earnings from the collateral investments are shared among the Series, the security lending agent, and the borrower. The Series records security lending income net of allocations to the security lending agent and the borrower.
The Series may incur investment losses as a result of investing securities lending collateral. This could occur if an investment in the collateral investment account defaulted or became impaired. Under those circumstances, the value of a Series’ cash collateral account may be less than the amount the Series would be required to return to the borrowers of the securities and the Series would be required to make up for this shortfall.
During the year ended Dec. 31, 2016, the Series had no securities out on loan.
| Value Series-17 |
Table of Contents
Delaware VIP® Value Series
Notes to financial statements (continued)
10. Credit and Market Risk
The Series may invest up to 10% of its net assets in illiquid securities, which may include securities with contractual restrictions on resale, securities exempt from registration under Rule 144A of the Securities Act of 1933, as amended, and other securities which may not be readily marketable. The relative illiquidity of these securities may impair the Series from disposing of them in a timely manner and at a fair price when it is necessary or desirable to do so. While maintaining oversight, the Series’ Board has delegated to DMC the day-to-day functions of determining whether individual securities are liquid for purposes of the Series’ limitation on investments in illiquid securities. Securities eligible for resale pursuant to Rule 144A, which are determined to be liquid, are not subject to the Series’ 10% limit on investments in illiquid securities. As of Dec. 31, 2016, there were no Rule 144A securities held by the Series.
11. Contractual Obligations
The Series enters into contracts in the normal course of business that contain a variety of indemnifications. The Series’ maximum exposure under these arrangements is unknown. However, the Series has not had prior claims or losses pursuant to these contracts. Management has reviewed the Series’ existing contracts and expects the risk of loss to be remote.
12. Recent Accounting Pronouncements
On Oct. 13, 2016, the Securities and Exchange Commission amended existing rules intended to modernize reporting and disclosure of information. These amendments relate to Regulation S-X which sets forth the form and content of financial statements. At this time, management is evaluating the implications of adopting these amendments and their impact on the financial statements and accompanying notes.
13. Subsequent Events
Management has determined that no other material events or transactions occurred subsequent to Dec. 31, 2016 that would require recognition or disclosure in the Series financial statements.
| Value Series-18 |
Table of Contents
Delaware VIP® Trust — Delaware VIP Value Series
Report of independent registered public accounting firm
To the Board of Trustees of Delaware VIP Trust and Shareholders of Delaware VIP Value Series:
In our opinion, the accompanying statement of assets and liabilities, including the schedule of investments, and the related statements of operations and of changes in net assets and the financial highlights present fairly, in all material respects, the financial position of Delaware VIP Value Series (one of the series constituting Delaware VIP Trust, hereafter referred to as the “Series”) as of December 31, 2016, the results of its operations for the year then ended, the changes in its net assets for each of the two years in the period then ended and the financial highlights for each of the five years in the period then ended, in conformity with accounting principles generally accepted in the United States of America. These financial statements and financial highlights (hereafter referred to as “financial statements”) are the responsibility of the Series’ management. Our responsibility is to express an opinion on these financial statements based on our audits. We conducted our audits of these financial statements in accordance with the standards of the Public Company Accounting Oversight Board (United States). Those standards require that we plan and perform the audit to obtain reasonable assurance about whether the financial statements are free of material misstatement. An audit includes examining, on a test basis, evidence supporting the amounts and disclosures in the financial statements, assessing the accounting principles used and significant estimates made by management, and evaluating the overall financial statement presentation. We believe that our audits, which included confirmation of securities as of December 31, 2016 by correspondence with the custodian and brokers, provide a reasonable basis for our opinion.
PricewaterhouseCoopers LLP
Philadelphia, Pennsylvania
February 16, 2017
| Value Series-19 |
Table of Contents
Delaware VIP® Trust — Delaware VIP Value Series
Other Series information (Unaudited)
Board consideration of Delaware VIP Value Series investment management agreement
At a meeting held on Aug. 16–18, 2016 (the “Annual Meeting”), the Board of Trustees (the “Board”), including a majority of disinterested or independent Trustees, approved the renewal of the Investment Advisory Agreement for Delaware VIP Value Series (the “Series”). In making its decision, the Board considered information furnished at regular quarterly Board meetings, including reports detailing Series performance, investment strategies, and expenses, as well as information prepared specifically in connection with the renewal of the investment advisory and sub-advisory contracts. Information furnished specifically in connection with the renewal of the Investment Management Agreement with DelawareManagement Company (“DMC”) included materials provided by DMC and its affiliates (“Delaware Investments”) concerning, among other things, the nature, extent, and quality of services provided to the Series; the costs of such services to the Series; economies of scale; and the investment manager’s financial condition and profitability. In addition, in connection with the Annual Meeting, reports were provided to the Trustees in May 2016 and included reports provided by Broadridge Financial Solutions (“Broadridge”). The Broadridge reports compared the Series’ investment performance and expenses with those of other comparable mutual funds. The Independent Trustees reviewed and discussed the Broadridge reports with independent legal counsel to the Independent Trustees. In addition to the information noted above, the Board also requested and received information regarding DMC’s policy with respect to advisory fee levels and its breakpoint philosophy; the structure of portfolio manager compensation; comparative client fee information; and any constraints or limitations on the availability of securities for certain investment styles, which had in the past year inhibited, or which were likely in the future to inhibit, the investment manager’s ability to invest fully in accordance with Series policies.
In considering information relating to the approval of the Series’ advisory agreement, the Independent Trustees received assistance and advice fromand met separately with independent legal counsel to the Independent Trustees. Although the Board gave attention to all information furnished, the following discussion identifies, under separate headings, the primary factors taken into account by the Board during its contract renewal considerations.
Nature, extent, and quality of service. The Board considered the services provided by DMC to the Series and its shareholders. In reviewing the nature, extent and quality of services, the Board considered reports furnished to it throughout the year, which covered matters such as the relative performance of the Series; compliance of portfolio managers with the investment policies, strategies, and restrictions for the Series; compliance by DMC and Delaware Distributors, L.P. (together, “Management”) personnel with the Code of Ethics adopted throughout the Delaware Investments® Family of Funds complex; and adherence to fair value pricing procedures as established by the Board. The Board was pleased with the current staffing of the Series’ investment advisor and the emphasis placed on research in the investment process. The Board recognized DMC’s receipt of several industry distinctions during the past several years. The Board gave favorable consideration to DMC’s efforts to control expenditures while maintaining service levels committed to Series matters. The Board was satisfied with the nature, extent and quality of the overall services provided by DMC.
Investment performance. The Board placed significant emphasis on the investment performance of the Series in view of the importance of investment performance to shareholders. Although the Board gave appropriate consideration to performance reports and discussions with portfolio managers at Board meetings throughout the year, the Board gave particular weight to the Broadridge reports furnished for the Annual Meeting. The Broadridge reports prepared for the Series showed the investment performance of its Standard Class shares in comparison to a group of similar funds as selected by Broadridge (the “Performance Universe”). A fund with the best performance ranked first, and a fund with the poorest performance ranked last. The highest/best performing 25% of funds in the Performance Universe make up the first quartile; the next 25%, the second quartile; the next 25%, the third quartile; and the poorest/worst performing 25% of funds in the Performance Universe make up the fourth quartile. Comparative annualized performance for the Series was shown for the past 1-, 3-, 5-, and 10-year periods, as applicable, ended Jan. 31, 2016. The Board’s objective is that the Series’ performance for the periods considered be at or above the median of its Performance Universe.
The Performance Universe for the Series consisted of the Series and all large-cap value funds underlying variable insurance products as selected by Broadridge. The Broadridge report comparison showed that the Series’ total return for the 1-, 3-, 5-, and 10-year periods was in the first quartile of its Performance Universe. The Board was satisfied with performance.
Comparative expenses. The Board considered expense comparison data for the Delaware Investments Family of Funds. Management provided the Board with information on pricing levels and fee structures for the Series as of its most recently completed fiscal year. The Board also focused on the comparative analysis of effective management fees and total expense ratios of the Series versus effective management fees and expense ratios of a group of similar funds as selected by Broadridge (the “Expense Group”). In reviewing comparative costs, the Series’ contractual management fee and the actual management fee incurred by the Series were compared with the contractual management fees (assuming all funds in the Expense Group were similar in size to the Series) and actual management fees (as reported by each fund) within the Expense Group, taking into account any applicable breakpoints and fee waivers. The Series’ total expenses were also comparedwith those of its Expense Group. The Broadridge total expenses, for comparative consistency, were shown by Broadridge for Standard Class shares which do not charge 12b-1 and non-12b-1 service fees. The Board’s objective is to limit the Series’ total expense ratio to be competitive with that of the Expense Group.
The expense comparisons for the Series showed that the actual management fee and total expenses were in the quartile with the second lowest expenses of its Expense Group. The Board was satisfied with the management fee and total expenses of the Series in comparison to those of its Expense Group.
| Value Series-20 |
Table of Contents
Delaware VIP® Trust — Delaware VIP Value Series
Other Series information (Unaudited)
Board consideration of Delaware VIP Value Series investment management agreement (continued)
Management profitability. The Board considered the level of profits realized by DMC in connection with the operation of the Series. In this respect, the Board reviewed the Investment Management Profitability Analysis that addressed the overall profitability of DMC’s business in providing management and other services to each of the individual funds and the Delaware Investments® Family of Funds as a whole. Specific attention was given to the methodology followed in allocating costs for the purpose of determining profitability.Management stated that the level of profits of DMC, to a certain extent, reflects recent operational cost savings and efficiencies initiated by DMC. The Board considered DMC’s efforts to improve services provided to fund shareholders and to meet additional regulatory and compliance requirements resulting from recent industry-wide Securities and Exchange Commission initiatives. The Board also considered the extent to which DMC might derive ancillary benefits from fund operations, including the potential for procuring additional business as a result of the prestige and visibility associated with its role as service provider to the Delaware Investments Family of Funds and the benefits from allocation of fund brokerage to improve trading efficiencies. The Board found that the management fees were reasonable in light of the services rendered and the profitability of DMC.
Economies of scale. The Trustees considered whether economies of scale are realized by DMC as the Series’ assets increase and the extent to which any economies of scale are reflected in the level of management fees charged. The Trustees reviewed the standardized advisory fee pricing and structure approved by the Board and shareholders, which includes breakpoints, and which applies to most funds in the Delaware Investments Family of Funds complex. Breakpoints in the advisory fee occur when the advisory fee rate is reduced on assets in excess of specified levels. Breakpoints result in a lower advisory fee, than would otherwise be the case in the absence of breakpoints, when the asset levels specified in the breakpoints are exceeded. The Board noted that the fee under the Series’ management contract fell within the standardized fee pricing structure. The Board also noted that, as of May 31, 2016, the Series’ assets exceeded the first breakpoint level. The Board believed that, given the extent to which economies of scale might be realized by the advisor and its affiliates, the schedule of fees under the Investment Management Agreement provides a sharing of benefits with the Series and its shareholders.
Tax Information
All disclosures are based on financial information available as of the date of this annual report and, accordingly are subject to change. For any and all items requiring reporting, it is the intention of the Series to report the maximum amount permitted under the Internal Revenue Code and the regulations thereunder.
For the year ended Dec. 31, 2016, the Series reports distributions paid during the year as follows:
| (A) Long-Term Capital Gain Distributions (Tax Basis) | (B) Ordinary Income Distributions (Tax Basis) | Total Distributions (Tax Basis) | (C) Qualifying Dividends1 | |||||||||
| 82.92% | 17.08% | 100.00% | 100.00% | |||||||||
| (A) | and (B) are based on a percentage of the Series total distributions. |
| (C) | is based on a percentage of the Series ordinary income distributions. |
| 1 | Qualifying dividends represent dividends which qualify for the corporate dividends received deduction. |
Value Series-21
Table of Contents
Delaware Investments® Family of Funds
BOARD OF TRUSTEES/DIRECTORS AND OFFICERS ADDENDUM
A mutual fund is governed by a Board of Trustees/Directors (“Trustees”), which has oversight responsibility for the management of a fund’s business affairs. Trustees establish procedures and oversee and review the performance of the investment manager, the distributor, and others who perform services for the fund. The independent fund trustees, in particular, are advocates for shareholder interests. Each trustee has served in that capacity since he or she was elected to or appointed to the Board of Trustees, and will continue to serve until his or her retirement or the election of a new trustee in his or her place. The following is a list of the Trustees and Officers with certain background and related information.
Name, Address, and Birth Date | Position(s) Held with Fund(s) | Length of Time Served | Principal Occupation(s) During the Past Five Years | Number of Portfolios in Fund Complex Overseen by Trustee or Officer | Other Directorships Held by Trustee or Officer | |||||
| INTERESTED TRUSTEE | ||||||||||
Shawn K. Lytle1, 3 2005 Market Street Philadelphia, PA 19103
February 1970 | President, Chief Executive Officer, and Trustee | Trustee since September 2015
President and Chief Executive Officer since August 2015 | Shawn K. Lytle has served as President of Delaware Investments2 since June 2015 and was the Regional Head of Americas for UBS Global Asset Management from 2010 through 2015. | 62 | Trustee — UBS Relationship Funds, SMA Relationship Trust, and UBS Funds (May 2010–April 2015) | |||||
| INDEPENDENT TRUSTEES | ||||||||||
Thomas L. Bennett 2005 Market Street Philadelphia, PA 19103
October 1947 | Chairman and Trustee | Trustee since March 2005
Chairman since March 2015 | Private Investor (March 2004–Present) | 62 | None | |||||
Ann D. Borowiec 2005 Market Street Philadelphia, PA 19103
November 1958 | Trustee | Since March 2015 | Chief Executive Officer Private Wealth Management (2011–2013) and Market Manager, New Jersey Private Bank (2005–2011) — J.P. Morgan Chase & Co. | 62 | Director — Banco Santander International
Director — Santander Bank, N.A. | |||||
Joseph W. Chow 2005 Market Street Philadelphia, PA 19103
January 1953 | Trustee | Since January 2013 | Executive Vice President (Emerging Economies Strategies, Risks, and Corporate Administration) State Street Corporation (July 2004–March 2011) | 62 | Director and Audit Committee Member — Hercules Technology Growth Capital, Inc. (2004–2014) | |||||
John A. Fry 2005 Market Street Philadelphia, PA 19103
May 1960 | Trustee | Since January 2001 | President — Drexel University (August 2010–Present)
President — Franklin & Marshall College (July 2002–July 2010) | 62 | Director, Audit Committee and Governance Committee Member — Community Health Systems
Director — Drexel Morgan & Co.
Director, Audit Committee Member — vTv Therapeutics LLC | |||||
Lucinda S. Landreth 2005 Market Street Philadelphia, PA 19103 June 1947 | Trustee | Since March 2005 | Private Investor (2004–Present) | 62 | None | |||||
| Value Series-22 |
Table of Contents
Name, Address, and Birth Date | Position(s) Held with Fund(s) | Length of Time Served | Principal Occupation(s) During the Past Five Years | Number of Portfolios in Fund Complex Overseen by Trustee or Officer | Other Directorships Held by Trustee or Officer | |||||
| Frances A. Sevilla-Sacasa | Trustee | Since | Chief Executive Officer — | 62 | Trust Manager and | |||||
| 2005 Market Street | September 2011 | Banco Itaú | Audit Committee | |||||||
| Philadelphia, PA 19103 | International | Member — Camden | ||||||||
| (April 2012–December 2016) | Property Trust | |||||||||
| January 1956 | ||||||||||
Executive Advisor to Dean (August 2011–March 2012) and Interim Dean (January 2011–July 2011) — University of Miami School of Business Administration | ||||||||||
President — U.S. Trust, Bank of America Private Wealth Management (Private Banking) (July 2007–December 2008)
| ||||||||||
Thomas K. Whitford 2005 Market Street Philadelphia, PA 19103
March 1956 | Trustee | Since January 2013 | Vice Chairman (2010–April 2013) — PNC Financial Services Group | 62 | Director — HSBC Finance Corporation and HSBC North America Holdings Inc.
Director — HSBC Bank | |||||
Janet L. Yeomans 2005 Market Street Philadelphia, PA 19103
July 1948 | Trustee | Since April 1999 | Vice President and Treasurer (January 2006–July 2012)
Vice President — Mergers & Acquisitions (January 2003–January 2006), and Vice President and Treasurer (July 1995–January 2003) — 3M Company | 62 | Director, Personnel and Compensation Committee Chair, and Audit Committee Member — Okabena Company | |||||
| OFFICERS | ||||||||||
David F. Connor 2005 Market Street Philadelphia, PA 19103
December 1963 | Senior Vice President, General Counsel, and Secretary | Senior Vice President, since May 2013; General Counsel since May 2015; Secretary since October 2005 | David F. Connor has served in various capacities at different times at Delaware Investments. | 62 | None3 | |||||
Daniel V. Geatens 2005 Market Street Philadelphia, PA 19103
October 1972 | Vice President and Treasurer | Treasurer since October 2007 | Daniel V. Geatens has served in various capacities at different times at Delaware Investments. | 62 | None3 | |||||
Richard Salus 2005 Market Street Philadelphia, PA 19103
October 1963 | Senior Vice President and Chief Financial Officer | Chief Financial Officer since November 2006 | Richard Salus has served in various capacities at different times at Delaware Investments. | 62 | None3 | |||||
| 1 | Shawn K. Lytle is considered to be an “Interested Trustee” because he is an executive officer of the Fund’s(s’) investment advisor. |
| 2 | Delaware Investments is the marketing name for Delaware Management Holdings, Inc. and its subsidiaries, including the Fund’s(s’) investment advisor, principal underwriter, and its transfer agent. |
| 3 | Shawn K. Lytle, David F. Connor, Daniel V. Geatens, and Richard Salus serve in similar capacities for the six portfolios of the Optimum Fund Trust, which have the same investment advisor, principal underwriter, and transfer agent as the registrant. |
The Statement of Additional Information for the Fund(s) includes additional information about the Trustees and Officers and is available, without charge, upon request by calling 800 523-1918.
Value Series-23
Table of Contents
The Series files its complete schedule of portfolio holdings with the Securities and Exchange Commission (Commission) for the first and third quarters of each fiscal year on Form N-Q. The Series’ Forms N-Q, as well as a description of the policies and procedures that the Series uses to determine how to vote proxies (if any) relating to portfolio securities are available without charge (i) upon request, by calling 800 523-1918; and (ii) on the Commission’s website at sec.gov. In addition, a description of the policies and procedures that the Series uses to determine how to vote proxies (if any) relating to portfolio securities and the Schedule of Investments included in the Series’ most recent Form N-Q are available without charge on the Delaware Investments® Funds’ website at delawareinvestments.com/vip/literature. The Series’ Forms N-Q may be reviewed and copied at the Commission’s Public Reference Room in Washington, DC; information on the operation of the Public Reference Room may be obtained by calling 800 SEC-0330.
Information (if any) regarding how the Series voted proxies relating to portfolio securities during the most recently disclosed 12-month period ended June 30 is available without charge (i) through the Delaware Investments Funds’ website at delawareinvestments.com/proxy; and (ii) on the Commission’s website at sec.gov.
|
| AR-VIPV [12/16] BNY 213961 (2/17) (18579) | Value Series-24 |
Item 2. Code of Ethics
The registrant has adopted a code of ethics that applies to the registrant’s principal executive officer, principal financial officer, principal accounting officer or controller, or persons performing similar functions, regardless of whether these individuals are employed by the registrant or a third party. A copy of the registrant’s Code of Business Ethics has been posted on the Delaware Investments Internet Web site at www.delawareinvestments.com. Any amendments to the Code of Business Ethics, and information on any waiver from its provisions granted by the registrant, will also be posted on this Web site within five business days of such amendment or waiver and will remain on the Web site for at least 12 months.
Item 3. Audit Committee Financial Expert
The registrant’s Board of Trustees/Directors has determined that certain members of the registrant’s Audit Committee are audit committee financial experts, as defined below. For purposes of this item, an “audit committee financial expert” is a person who has the following attributes:
a. An understanding of generally accepted accounting principles and financial statements;
b. The ability to assess the general application of such principles in connection with the accounting for estimates, accruals, and reserves;
c. Experience preparing, auditing, analyzing, or evaluating financial statements that present a breadth and level of complexity of accounting issues that are generally comparable to the breadth and complexity of issues that can reasonably be expected to be raised by the registrant’s financial statements, or experience actively supervising one or more persons engaged in such activities;
d. An understanding of internal controls and procedures for financial reporting; and
e. An understanding of audit committee functions.
An “audit committee financial expert” shall have acquired such attributes through:
a. Education and experience as a principal financial officer, principal accounting officer, controller, public accountant, or auditor or experience in one or more positions that involve the performance of similar functions;
b. Experience actively supervising a principal financial officer, principal accounting officer, controller, public accountant, auditor, or person performing similar functions;
c. Experience overseeing or assessing the performance of companies or public accountants with respect to the preparation, auditing, or evaluation of financial statements; or
d. Other relevant experience.
The registrant’s Board of Trustees/Directors has also determined that each member of the registrant’s Audit Committee is independent. In order to be “independent” for purposes of this item, the Audit Committee member may not: (i) other than in his or her capacity as a member of the Board of Trustees/Directors or any committee thereof, accept directly or indirectly any consulting, advisory or other compensatory fee from the issuer; or (ii) be an “interested person” of the registrant as defined in Section 2(a)(19) of the Investment Company Act of 1940.
The names of the audit committee financial experts on the registrant’s Audit Committee are set forth below:
Ann D. Borowiec
Joseph W. Chow
Lucinda S. Landreth1
Item 4. Principal Accountant Fees and Services
(a) Audit fees.
PricewaterhouseCoopers LLP (“PwC”), the Independent Accountant to the series portfolios of Delaware VIP Trust (“Funds”), has advised the Audit Committee of the Board of Trustees of the Funds (“Audit Committee”) that, as of the date of the filing of this Annual Report on Form N-CSR, it is in discussions with the staff of the Securities and Exchange Commission (“SEC Staff”), or the SEC, regarding the interpretation and application of Rule 2-01(c)(1)(ii)(A) of Regulation S-X, or the Loan Rule.
The Loan Rule prohibits accounting firms, such as PwC, from having certain financial relationships with their audit clients and affiliated entities. Specifically, the Loan Rule provides, in relevant part, that an accounting firm generally would not be independent if it receives a loan from a lender that is a “record or beneficial owner of more than ten percent of the audit client’s equity securities.” Under the SEC Staff’s interpretation of the Loan Rule, based on information provided to us by PwC, some of PwC’s relationships with its lenders who also own shares of one or more funds within the Delaware Investments Family of Funds investment company complex implicate the Loan Rule, calling into question PwC’s independence with respect to the Funds. PwC believes that, in light of the facts of these lending relationships, its ability to exercise objective judgment with respect to the audit of the Funds have not been impaired.
The Audit Committee has considered the lending relationships described by PwC and has concluded that (1) the lending relationships did not affect PwC’s application of objective judgment in conducting its audits and issuing reports on the Funds’ financial statements; and (2) a reasonable investor with knowledge of the lending relationships described by PwC would reach the same conclusion. In making this determination, the Audit Committee considered, among other things, PwC’s description of the relevant lending relationships and PwC’s representation that its objectivity was not impaired in conducting its audit of the Funds’ financial statements. In connection with this determination, PwC advised the Audit Committee that it believes PwC is independent and it continues to have discussions with the SEC Staff.
If the SEC were ultimately to determine that PwC was not independent with respect to the Funds for certain time periods, the Funds’ filings with the SEC that contain the Funds’ financial statements for such periods would be non-compliant with the applicable securities laws. If the SEC determines that PwC was not independent, among other things, the Funds could be required to have independent audits conducted on the Funds’ previously audited financial statements by another registered public accounting firm for the affected periods. The time involved to conduct such independent audits may impair the Funds’ ability to issue shares. Any of the foregoing possible outcomes potentially could have a material adverse effect on the Funds.
____________________
1 The instructions to Form N-CSR require disclosure on the relevant experience of persons who qualify as audit committee financial experts based on “other relevant experience.” The Board of Trustees/Directors has determined that Ms. Landreth qualifies as an audit committee financial expert by virtue of her experience as a financial analyst, her Chartered Financial Analyst (CFA) designation, and her service as an audit committee chairperson for a non-profit organization.
The aggregate fees billed for services provided to the registrant by its independent auditors for the audit of the registrant’s annual financial statements and for services normally provided by the independent auditors in connection with statutory and regulatory filings or engagements were $327,640 for the fiscal year ended December 31, 2016.
The aggregate fees billed for services provided to the registrant by its independent auditors for the audit of the registrant’s annual financial statements and for services normally provided by the independent auditors in connection with statutory and regulatory filings or engagements were $315,245 for the fiscal year ended December 31, 2015.
(b) Audit-related fees.
The aggregate fees billed by the registrant’s independent auditors for services relating to the performance of the audit of the registrant’s financial statements and not reported under paragraph (a) of this Item were $0 for the fiscal year ended December 31, 2016.
The aggregate fees billed by the registrant’s independent auditors for services relating to the performance of the audit of the financial statements of the registrant’s investment adviser and other service providers under common control with the adviser and that relate directly to the operations or financial reporting of the registrant were $667,000 for the registrant’s fiscal year ended December 31, 2016. The percentage of these fees relating to services approved by the registrant’s Audit Committee pursuant to the de minimis exception from the pre-approval requirement in Rule 2-01(c)(7)(i)(C) of Regulation S-X was 0%. These audit-related services were as follows: year-end audit procedures; group reporting and subsidiary statutory audits.
The aggregate fees billed by the registrant’s independent auditors for services relating to the performance of the audit of the registrant’s financial statements and not reported under paragraph (a) of this Item were $0 for the fiscal year ended December 31, 2015.
The aggregate fees billed by the registrant’s independent auditors for services relating to the performance of the audit of the financial statements of the registrant’s investment adviser and other service providers under common control with the adviser and that relate directly to the operations or financial reporting of the registrant were $612,000 for the registrant’s fiscal year ended December 31, 2015. The percentage of these fees relating to services approved by the registrant’s Audit Committee pursuant to the de minimis exception from the pre-approval requirement in Rule 2-01(c)(7)(i)(C) of Regulation S-X was 0%. These audit-related services were as follows: year-end audit procedures; group reporting and subsidiary statutory audits.
(c) Tax fees.
The aggregate fees billed by the registrant’s independent auditors for tax-related services provided to the registrant were $49,767 for the fiscal year ended December 31, 2016. The percentage of these fees relating to services approved by the registrant’s Audit Committee pursuant to the de minimis exception from the pre-approval requirement in Rule 2-01(c)(7)(i)(C) of Regulation S-X was 0%. These tax-related services were as follows: review of income tax returns and review of annual excise distribution calculations.
The aggregate fees billed by the registrant’s independent auditors for tax-related services provided to the registrant’s investment adviser and other service providers under common control with the adviser and that relate directly to the operations or financial reporting of the registrant were $0 for the registrant’s fiscal year ended December 31, 2016.
The aggregate fees billed by the registrant’s independent auditors for tax-related services provided to the registrant were $56,384 for the fiscal year ended December 31, 2015. The percentage of these fees relating to services approved by the registrant’s Audit Committee pursuant to the de minimis exception from the pre-approval requirement in Rule 2-01(c)(7)(i)(C) of Regulation S-X was 0%. These tax-related services were as follows: review of income tax returns and review of annual excise distribution calculations.
The aggregate fees billed by the registrant’s independent auditors for tax-related services provided to the registrant’s investment adviser and other service providers under common control with the adviser and that relate directly to the operations or financial reporting of the registrant were $0 for the registrant’s fiscal year ended December 31, 2015.
(d) All other fees.
The aggregate fees billed for all services provided by the independent auditors to the registrant other than those set forth in paragraphs (a), (b) and (c) of this Item were $0 for the fiscal year ended December 31, 2016.
The aggregate fees billed for all services other than those set forth in paragraphs (b) and (c) of this Item provided by the registrant’s independent auditors to the registrant’s adviser and other service providers under common control with the adviser and that relate directly to the operations or financial reporting of the registrant were $0 for the registrant’s fiscal year ended December 31, 2016. The percentage of these fees relating to services approved by the registrant’s Audit Committee pursuant to the de minimis exception from the pre-approval requirement in Rule 2-01(c)(7)(i)(C) of Regulation S-X was 0%.
The aggregate fees billed for all services provided by the independent auditors to the registrant other than those set forth in paragraphs (a), (b) and (c) of this Item were $0 for the fiscal year ended December 31, 2015.
The aggregate fees billed for all services other than those set forth in paragraphs (b) and (c) of this Item provided by the registrant’s independent auditors to the registrant’s adviser and other service providers under common control with the adviser and that relate directly to the operations or financial reporting of the registrant were $0 for the registrant’s fiscal year ended December 31, 2015. The percentage of these fees relating to services approved by the registrant’s Audit Committee pursuant to the de minimis exception from the pre-approval requirement in Rule 2-01(c)(7)(i)(C) of Regulation S-X was 0%.
(e) The registrant’s Audit Committee has established pre-approval policies and procedures as permitted by Rule 2-01(c)(7)(i)(B) of Regulation S-X (the “Pre-Approval Policy”) with respect to services provided by the registrant’s independent auditors. Pursuant to the Pre-Approval Policy, the Audit Committee has pre-approved the services set forth in the table below with respect to the registrant up to the specified fee limits. Certain fee limits are based on aggregate fees to the registrant and other registrants within the Delaware Investments Family of Funds.
| Service | Range of Fees |
Audit Services | |
Statutory audits or financial audits for new Funds | up to $40,000 per Fund |
Services associated with SEC registration statements (e.g., Form N-1A, Form N-14, etc.), periodic reports and other documents filed with the SEC or other documents issued in connection with securities offerings (e.g., comfort letters for closed-end Fund offerings, consents), and assistance in responding to SEC comment letters | up to $10,000 per Fund |
Consultations by Fund management as to the accounting or disclosure treatment of transactions or events and/or the actual or potential impact of final or proposed rules, standards or interpretations by the SEC, FASB, or other regulatory or standard-setting bodies (Note: Under SEC rules, some consultations may be considered “audit-related services” rather than “audit services”) | up to $25,000 in the aggregate |
Audit-Related Services | |
Consultations by Fund management as to the accounting or disclosure treatment of transactions or events and /or the actual or potential impact of final or proposed rules, standards or interpretations by the SEC, FASB, or other regulatory or standard-setting bodies (Note: Under SEC rules, some consultations may be considered “audit services” rather than “audit-related services”) | up to $25,000 in the aggregate |
Tax Services | |
U.S. federal, state and local and international tax planning and advice (e.g., consulting on statutory, regulatory or administrative developments, evaluation of Funds’ tax compliance function, etc.) | up to $25,000 in the aggregate |
U.S. federal, state and local tax compliance (e.g., excise distribution reviews, etc.) | up to $5,000 per Fund |
Review of federal, state, local and international income, franchise and other tax returns | up to $5,000 per Fund |
Under the Pre-Approval Policy, the Audit Committee has also pre-approved the services set forth in the table below with respect to the registrant’s investment adviser and other entities controlling, controlled by or under common control with the investment adviser that provide ongoing services to the registrant (the “Control Affiliates”) up to the specified fee limit. This fee limit is based on aggregate fees to the investment adviser and its Control Affiliates.
| Service | Range of Fees |
Non-Audit Services | |
Services associated with periodic reports and other documents filed with the SEC and assistance in responding to SEC comment letters | up to $10,000 in the aggregate |
The Pre-Approval Policy requires the registrant’s independent auditors to report to the Audit Committee at each of its regular meetings regarding all services initiated since the last such report was rendered, including those services authorized by the Pre-Approval Policy.
(f) Not applicable.
(g) The aggregate non-audit fees billed by the registrant’s independent auditors for services rendered to the registrant and to its investment adviser and other service providers under common control with the adviser were $8,665,000 and $11,111,212 for the registrant’s fiscal years ended December 31, 2016 and December 31, 2015, respectively.
(h) In connection with its selection of the independent auditors, the registrant’s Audit Committee has considered the independent auditors’ provision of non-audit services to the registrant’s investment adviser and other service providers under common control with the adviser that were not required to be pre-approved pursuant to Rule 2-01(c)(7)(ii) of Regulation S-X. The Audit Committee has determined that the independent auditors’ provision of these services is compatible with maintaining the auditors’ independence.
Item 5. Audit Committee of Listed Registrants
Not applicable.
Item 6. Investments
(a) Included as part of report to shareholders filed under Item 1 of this Form N-CSR.
(b) Divestment of securities in accordance with Section 13(c) of the Investment Company Act of 1940.
Not applicable.
Item 7. Disclosure of Proxy Voting Policies and Procedures for Closed-End Management Investment Companies
Not applicable.
Item 8. Portfolio Managers of Closed-End Management Investment Companies
Not applicable.
Item 9. Purchases of Equity Securities by Closed-End Management Investment Company and Affiliated Purchasers
Not applicable.
Item 10. Submission of Matters to a Vote of Security Holders
Not applicable.
Item 11. Controls and Procedures
The registrant’s principal executive officer and principal financial officer have evaluated the registrant’s disclosure controls and procedures within 90 days of the filing of this report and have concluded that they are effective in providing reasonable assurance that the information required to be disclosed by the registrant in its reports or statements filed under the Securities Exchange Act of 1934 is recorded, processed, summarized and reported within the time periods specified in the rules and forms of the Securities and Exchange Commission.
There were no significant changes in the registrant’s internal control over financial reporting that occurred during the second fiscal quarter of the period covered by the report to stockholders included herein (i.e., the registrant’s fourth fiscal quarter) that have materially affected, or are reasonably likely to materially affect, the registrant’s internal control over financial reporting.
Item 12. Exhibits
(a) (1) Code of Ethics
Not applicable.
(2) Certifications of Principal Executive Officer and Principal Financial Officer pursuant to Rule 30a-2 under the Investment Company Act of 1940 are attached hereto as Exhibit 99.CERT.
(3) Written solicitations to purchase securities pursuant to Rule 23c-1 under the Securities Exchange Act of 1934.
Not applicable.
(b) Certifications pursuant to Section 906 of the Sarbanes-Oxley Act of 2002 are furnished herewith as Exhibit 99.906CERT.
SIGNATURES
Pursuant to the requirements of the Securities Exchange Act of 1934 and the Investment Company Act of 1940, the registrant has duly caused this report to be signed on its behalf, by the undersigned, thereunto duly authorized.
DELAWARE VIP® TRUST
| /s/ SHAWN K. LYTLE | |
| By: | Shawn K. Lytle |
| Title: | President and Chief Executive Officer |
| Date: | March 3, 2017 |
Pursuant to the requirements of the Securities Exchange Act of 1934 and the Investment Company Act of 1940, this report has been signed below by the following persons on behalf of the registrant and in the capacities and on the dates indicated.
| /s/ SHAWN K. LYTLE | |
| By: | Shawn K. Lytle |
| Title: | President and Chief Executive Officer |
| Date: | March 3, 2017 |
| /s/ RICHARD SALUS | |
| By: | Richard Salus |
| Title: | Chief Financial Officer |
| Date: | March 3, 2017 |