UNITED STATES SECURITIES AND EXCHANGE COMMISSION
Washington, D.C. 20549
FORM N-CSR
CERTIFIED SHAREHOLDER REPORT OF REGISTERED MANAGEMENT
INVESTMENT COMPANIES
| Investment Company Act file number: | | 811-05162 |
| | | |
| Exact name of registrant as specified in charter: | | Delaware VIP®Trust |
| | | |
| Address of principal executive offices: | | 2005 Market Street |
| | Philadelphia, PA 19103 |
| | | |
| Name and address of agent for service: | | David F. Connor, Esq. |
| | 2005 Market Street |
| | Philadelphia, PA 19103 |
| | | |
| Registrant’s telephone number, including area code: | | (800) 523-1918 |
| | | |
| Date of fiscal year end: | | December 31 |
| | | |
| Date of reporting period: | | December 31, 2018 |
Item 1. Reports to Stockholders
| | |
| | |
 | |  |
| | |
| | |
| | |
| | |
| | |
| | |
| | |
| | |
| | |
| | |
| | |
| | |
| | |
| | |
| | |
| | |
| | Annual report |
| | |
Delaware VIP® Trust
Delaware VIP Diversified Income Series
December 31, 2018
Table of contents
Other than Macquarie Bank Limited (MBL), none of the entities noted are authorized deposit-taking institutions for the purpose of the Banking Act 1959 (Commonwealth of Australia). The obligations of these entities do not represent deposits or other liabilities of MBL. MBL does not guarantee or otherwise provide assurance in respect of the obligations of these entities, unless noted otherwise. The Series is governed by US laws and regulations.
Unless other wise noted, views expressed herein are current as of Dec. 31, 2018, and subject to change for events occurring after such date.
The Series is not FDIC insured and is not guaranteed. It is possible to lose the principal amount invested.
Advisory services provided by Delaware Management Company, a series of Macquarie Investment Management Business Trust (MIMBT), a US registered investment advisor.
The Series is distributed byDelaware Distributors, L.P.(DDLP), an affiliate of MIMBT and Macquarie Group Limited. Macquarie Investment Management (MIM) is the marketing name for certain companies comprising the asset management division of Macquarie Group and its subsidiaries and affiliates worldwide.
This material may be used in conjunction with the offering of shares in Delaware VIP Diversified Income Series only if preceded or accompanied by the Series’ current prospectus or the summary prospectus.
© 2019 Macquarie Management Holdings, Inc.
All third-party marks cited are the property of their respective owners.
| | |
| Delaware VIP®Trust — Delaware VIP Diversified Income Series | | January 8, 2019 |
| Portfolio management review |
For the fiscal year ended Dec. 31, 2018, Delaware VIP Diversified Income Series (the “Series”) Standard Class shares declined 2.12% and Service Class shares fell 2.29%. Both figures reflect all dividends reinvested. The Series’ benchmark, the Bloomberg Barclays US Aggregate Index, gained 0.01% for the same period.
Capital markets encountered a volatile 2018 as central banks continued a campaign to normalize monetary policy. The US Federal Reserve raised the federal funds rate four times, to a target range of2.25%-2.50%. The swift pace of monetary tightening was combined with a reduction of approximately $300 billion in the Fed’s balance sheet. In addition, the European Central Bank (ECB) reduced its own bond-buying program.
Volatility hit in earnest in the second quarter of 2018. Central banks diverged on monetary policy, which led to a stronger US dollar. Emerging market countries struggled with inflation, fiscal balance issues, or problems with central bank independence (Turkey and Argentina, for example). A surge in the London interbank offered rate (LIBOR) and a flattening yield curve unnerved capital market participants and pushed credit yield premiums wider.
During the fourth quarter of 2018, markets entered a new phase of heightened volatility and price declines, causing energy prices to collapse and pushing US equity markets into near bear-market territory. As short maturity interest rates further increased, the US yield curve moved toward an even flatter profile. Investors continued to grapple with potential fallout from an ongoingUS-China trade war, Brexit, Italy’s budget negotiations, and an overall slowing of global economic activity. The year ended with a partial shutdown of the US federal government.
The Series’ returns were influenced by the rise in yields as central banks tightened monetary policy. Returns also responded to a significant expansion of credit yield premiums and currency-price declines. The tighter US monetary policy pressured local-currency emerging-market investments early in the period. High yield bond investments declined in the fourth quarter as slowing growth and tighter monetary policy caused price declines. Investments in an agency collateralized mortgage obligation (CMO) barbell — which included interest-only (IO) securities — detracted from the Series’ performance as volatility rose in the second half. Investments in high-quality asset-backed securities (ABS), commercial mortgage-backed securities (CMBS), money market instruments, and rate hedging were the bright spots in a challenging year.
US Treasury yields rose for most of 2018 as the Fed attempted to influence short rates, and better employment and US economic news moved longer-maturity rates higher. The late-year downturn in global economic activity and inflation, and the volatility in equity markets, produced a sharp rate rally.Two-year Treasury note yields climbed 60 basis points (One basis point is a hundredth of a percentage point.) and10-year Treasury note yields increased 28 basis points during the year. We increased US Treasury investments throughout 2018 as corporate sector holdings declined. We attempted to hedge against the rate rise and the flattening curve throughout most of the year with the help of interest rate futures. Portfolio interest rate sensitivity was kept below the Bloomberg Barclays US Aggregate Index for most of the year. As Treasury rates approached 3.25%, we began to increase portfolio rate sensitivity to hedge credit sector volatility. The interest rate futures added to performance.
Investment grade corporate exposure detracted from the Series’ overall performance in 2018. Yield premiums increased throughout the year. Finance and bank paper were the main detractors as heavy supply and pressure on bank stocks were influenced by the increase in rates and the flattening yield curve. Investment grade yield premiums increased significantly in the fourth quarter, and we sought to take advantage of the weaker market environment by increasing investment grade corporate exposure to 29% of the Series’ portfolio at year end.
The Series’ returns in both agency fixed rate mortgage-backed securities (MBS) and CMO structures were quite negative in 2018, detracting from Series’ performance. As the market encountered more volatility in the third and fourth quarters of 2018, the Series’ CMO barbell succumbed to price declines and yield-premium events. We reduced the CMO barbell trade during the fourth quarter.
High yield corporate bond investments detracted from Series’ performance for the fiscal year. Notably, an overweight to the energy sector and insurance brokers influenced returns. Investments inAlta Mesa Holdings LPandCommScope Technologies LLCwere notable underperformers. Despite growing expectations for slowing global growth and volatility in equity markets, we believe that current yields in the sector combined with supportive fundamentals, low default rates, and a positive technical backdrop, should allow for positive returns in 2019. We increased high yield bond exposure slightly in the fourth quarter as yield premiums widened.
The Series’ emerging market investments were notably weak in the second and third quarters, largely the result of the strong US dollar. We did employ risk management with the Series’ emerging markets subportfolio, especially during the second quarter, reducing local currency exposure. We also reduced US dollar holdings of emerging markets assets and used emerging markets credit default swaps to hedge some of this exposure during the year.
The Series’ collateralized loan obligations (CLO) investments contributed to performance for the fiscal year. The CLO market benefited from the demand for an investment with a coupon that floats quarterly with the3-month LIBOR. In addition, the four federal funds rate hikes benefited the sector in 2018. The Series’ CLO sector investments are predominantlyAAA-rated.
| | |
| Unless otherwise noted, views expressed herein are current as of Dec. 31, 2018, and subject to change. | | |
| | Diversified Income Series-1 |
| | |
| Delaware VIP®Trust — Delaware VIP Diversified Income Series | | January 8, 2019 |
| Portfolio management review (continued) |
Convertible bond investments, 3.8% of the Series’ portfolio at fiscal year end, detracted from performance. These investments in the Series have an approximate 60% sensitivity to equity-market moves. The fourth-quarter correction in equity markets erased most of the positive returns that were achieved through the first three quarters of the year.
Investments in CMBS, ABS, and cash made positive contributions to relative returns. CMBS exposure of 8.0% at year end was virtually unchanged during the year. Despite weakness in the retail sector, yield premiums were somewhat stable in the CMBS sector relative to corporate sectors. The combination of seasoned investments and new issues of conservative loans and underwriting contributed to Series returns, as did an overweight to this sector. We marginally increased the Series’ ABS exposure during the fiscal year to increase conservative positioning in the face of tightening monetary conditions.Year-end exposure of 3.1% includedAAA-rated issues of credit card and auto-loan securitizations. Cash exposure helped during a year of rising rates.
We believe that we reduced risk in the Series during the fiscal year. Along with adding high-quality securities, including ABS and Treasury securities, we used derivatives to help manage risk exposure. Because we expect more volatility as the Fed continues to increase rates, we’ve added additional derivative protection. Further, we believe monetary policy could synchronize once again between the Fed and other major central banks in 2019 if the Fed pauses its rate hikes and dials back its monetary tightening pressure.
At various volatile periods during the fiscal year we used derivatives — credit default swaps — to reduce credit exposure and to hedge the Series’ small exposure to convertible bonds. The use of credit derivatives had an immaterial effect on the Series’ returns during the fiscal period.
We also used forward currency hedges to add liquidity and to reduce local currency exposure in developed and emerging markets. Because the Series’ natural duration (interest rate sensitivity) was reduced through exposure to less interest rate sensitive areas such as CLOs and bank loans, we used interest rate futures to add interest rate exposure. However, our bias was to be short, by up to a year, of the benchmark’s interest rate sensitivity measure.
| | |
| Unless otherwise noted, views expressed herein are current as of Dec. 31, 2018, and subject to change. | | |
| | Diversified Income Series-2 |
Delaware VIP® Trust — Delaware VIP Diversified Income Series
Performance summary
The performance quoted represents past performance and does not guarantee future results. Investment return and principal value of an investment will fluctuate so that shares, when redeemed, may be worth more or less than their original cost. Current performance may be lower or higher than the performance quoted.
Carefully consider the Series’ investment objectives, risk factors, charges, and expenses before investing. This and other information can be found in the Series’ prospectus and its summary prospectus, which may be obtained by visiting delawarefunds.com/vip/literature or calling 800523-1918. Investors should read the prospectus and the summary prospectus carefully before investing.
| | | | | | | | | | | | | | | | | | | | |
Delaware VIP Diversified Income Series | | | | | | | | | | | | | | | | | | | | |
Average annual total returns | | | | | | | | | | | | | | | | | | | | |
| For periods ended December 31, 2018 | | 1 year | | | 3 years | | | 5 years | | | 10 years | | | Lifetime | |
Standard Class shares (commenced operations on May 16, 2003) | | | -2.12% | | | | +2.16% | | | | +2.12% | | | | +5.55% | | | | +5.05% | |
| | | | | | | | | | | | | | | | | | | | |
Service Class shares (commenced operations on May 16, 2003) | | | -2.29% | | | | +1.92% | | | | +1.86% | | | | +5.30% | | | | +4.78% | |
| | | | | | | | | | | | | | | | | | | | |
Bloomberg Barclays US Aggregate Index | | | +0.01% | | | | +2.06% | | | | +2.52% | | | | +3.48% | | | | n/a | |
Returns reflect the reinvestment of all distributions. Please see page 4 for a description of the index.
As described in the Series’ most recent prospectus, the net expense ratio for Service Class shares of the Series was 0.94%, while total operating expenses for Standard Class and Service Class shares were 0.66% and 0.96%, respectively. The management fee for Standard Class and Service Class shares was 0.58%.The Series’ investment manager, Delaware Management Company (Manager), has contractually agreed to waive all or a portion of its investment advisory fees and/or pay/reimburse expenses (excluding any12b-1 fees, acquired fund fees and expenses, taxes, interest, short sale and dividend interest expenses, brokerage fees, certain insurance costs, and nonroutine expenses or costs, including, but not limited to, those relating to reorganizations, litigation, conducting shareholder meetings, and liquidations) in order to prevent annual series operating expenses from exceeding 0.67% of the Series’ average daily net assets from April 30, 2018 through Dec. 31, 2018.* Please see the most recent prospectus and any applicable supplement(s) for additional information on these fee waivers and/or reimbursements. Please see the “Financial highlights” section in this report for the most recent expense ratios.
The Series pays Delaware Distributors, L.P. (DDLP), the distributor and an affiliate of DMC, an annual12b-1 fee of 0.30% of the average daily net assets of the Service Class shares. Prior to May 1, 2018, DDLP had contracted to waive12b-1 fees in order to limit12b-1 fees of the Service Class shares to 0.25% of average daily net assets.
Earnings from a variable annuity or variable life investment compoundtax-free until withdrawal, and as a result, no adjustments were made for income taxes.
Expense limitations were in effect for both classes during certain periods shown in the Series performance table on the previous page and in the Performance of a $10,000 Investment graph on the next page.
Performance data do not reflect insurance fees related to a variable annuity or variable life investment or the deferred sales charge that would apply to certain withdrawals of investments held for fewer than eight years. Performance shown here would have been reduced if such fees were included and the expense limitation removed. For more information about fees, consult your variable annuity or variable life prospectus.
Investments in variable products involve risk.
Fixed income securities and bond funds can lose value, and investors can lose principal, as interest rates rise. They also may be affected by economic conditions that hinder an issuer’s ability to make interest and principal payments on its debt.
The Series may also be subject to prepayment risk, the risk that the principal of a bond that is held by a portfolio will be prepaid prior to maturity, at the time when interest rates are lower than what the bond was paying. A portfolio may then have to reinvest that money at a lower interest rate.
The Series may invest in derivatives, which may involve additional expenses and are subject to risk, including the risk that an underlying security or securities index moves in the opposite direction from what the portfolio manager anticipated. A derivatives transaction depends upon the counterparties’ ability to fulfill their contractual obligations.
High yielding,non-investment-grade bonds (junk bonds) involve higher risk than investment grade bonds. The high yield secondary market is particularly susceptible to liquidity problems when institutional investors, such as mutual funds and certain other financial institutions, temporarily stop buying bonds for regulatory, financial, or other reasons. In addition, a less liquid secondary market makes it more difficult for the Fund to obtain precise valuations of the high yield securities in its portfolio.
Diversified Income Series-3
Delaware VIP® Diversified Income Series
Performance summary (continued)
The Series may experience portfolio turnover in excess of 100%, which could result in higher transaction costs and tax liability.
International investments entail risks not ordinarily associated with US investments including fluctuation in currency values, differences in accounting principles, or economic or political instability in other nations. Investing in emerging markets can be riskier than investing in established foreign markets due to increased volatility and lower trading volume.
If and when the Series invests in forward foreign currency contracts or uses other investments to hedge against currency risks, the Series will be subject to special risks, including counterparty risk.
This document may mention bond ratings published by nationally recognized statistical rating organizations (NRSROs) Standard & Poor’s, Moody’s Investors Service, and Fitch, Inc. For securities rated by an NRSRO other than S&P, the rating is converted to the equivalent S&P credit rating. Bonds rated AAA are rated as having the highest quality and are generally considered to have the lowest degree of investment risk. Bonds rated AA are considered to be of high quality, but with a slightly higher degree of risk than bonds rated AAA. Bonds rated A are considered to have many favourable investment qualities, though they are somewhat more susceptible to adverse economic conditions. Bonds rated BBB are believed to be of medium-grade quality and generally riskier over the long term.
Please read both the contract and underlying prospectus for specific details regarding the product’s risk profile.
*The aggregate contractual waiver period covering this report is from April 30, 2018 through April 30, 2019.
| | | | | | |
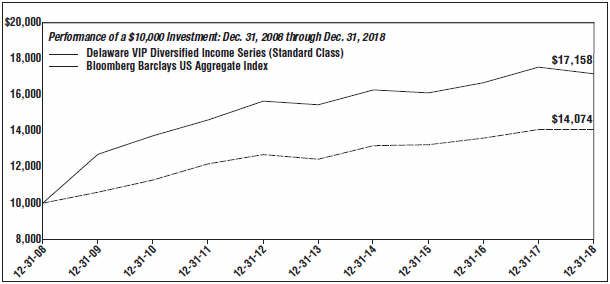
| For period beginning Dec. 31, 2008 through Dec. 31, 2018 | | Starting value | | Ending value |
| — | | Delaware VIP Diversified Income Series (Standard Class) | | $10,000 | | $17,158 |
| – – | | Bloomberg Barclays US Aggregate Index | | $10,000 | | $14,074 |
| |
The graph shows a $10,000 investment in the Delaware VIP Diversified Income Series Standard Class shares for the period from Dec. 31, 2008 through Dec. 31, 2018.
The graph also shows $10,000 invested in the Bloomberg Barclays US Aggregate Index for the period from Dec. 31, 2008 through Dec. 31, 2018. The Bloomberg Barclays US Aggregate Index is a broad composite that tracks the investment grade domestic bond market.
The London interbank offered rate (LIBOR), mentioned on page 1, is a composite of the rates of interest at which banks borrow from one another in the London market, and it is a widely used benchmark for short-term interest rates.
Index performance returns do not reflect any management fees, transaction costs or expenses. Indices are unmanaged and one cannot invest directly in an index.
Performance of Service Class shares will vary due to different charges and expenses.
Past performance is not a guarantee of future results.
| | |
| | Diversified Income Series-4 |
Delaware VIP® Trust — Delaware VIP Diversified Income Series
Disclosure of Series expenses
For thesix-month period from July 1, 2018 to December 31, 2018 (Unaudited)
As a shareholder of the Series, you incur ongoing costs, which may include management fees; distribution and service(12b-1) fees; and other Series expenses. This example is intended to help you understand your ongoing costs (in dollars) of investing in the Series and to compare these costs with the ongoing costs of investing in other mutual funds.
The example is based on an investment of $1,000 invested at the beginning of the period and held for the entiresix-month period from July 1, 2018 to Dec. 31, 2018.
Actual expenses
The first section of the table shown, “Actual Series return,” provides information about actual account values and actual expenses. You may use the information in this section of the table, together with the amount you invested, to estimate the expenses that you paid over the period. Simply divide your account value by $1,000 (for example, an $8,600 account value divided by $1,000 = 8.6), then multiply the result by the number in the first section under the heading entitled “Expenses Paid During Period” to estimate the expenses you paid on your account during the period.
Hypothetical example for comparison purposes
The second section of the table shown, “Hypothetical 5% return,” provides information about hypothetical account values and hypothetical expenses based on the Series’ actual expense ratio and an assumed rate of return of 5% per year before expenses, which is not the Series’ actual return. The hypothetical account values and expenses may not be used to estimate the actual ending account balance or expenses you paid for the period. You may use this information to compare the ongoing costs of investing in the Series and other funds. To do so, compare this 5% hypothetical example with the 5% hypothetical examples that appear in the shareholder reports of other funds.
Please note that the expenses shown in the table are meant to highlight your ongoing costs only. As a shareholder of the Series, you do not incur any transaction costs, such as sales charges (loads), redemption fees or exchange fees, but shareholders of other funds may incur such costs. Also, the fees related to the variable annuity investment or the deferred sales charge that could apply have not been included. Therefore, the second section of the table is useful in comparing ongoing costs only, and will not help you determine the relative total costs of owning different funds. The Series’ expenses shown in the table assume reinvestment of all dividends and distributions.
Expense analysis of an investment of $1,000
| | | | | | | | | | | | | | | | |
| | | | | | | | | | | | Expenses | |
| | | Beginning | | | Ending | | | | | | Paid During | |
| | | Account | | | Account | | | Annualized | | | Period | |
| | | Value | | | Value | | | Expense | | | 7/1/18 to | |
| | | 7/1/18 | | | 12/31/18 | | | Ratio | | | 12/31/18* | |
Actual Series return† | | | | | | | | | | | | | | | | |
Standard Class | | | $1,000.00 | | | $ | 1,001.00 | | | | 0.65 | % | | | $3.28 | |
Service Class | | | 1,000.00 | | | | 1,001.00 | | | | 0.95 | % | | | 4.79 | |
|
Hypothetical 5% return(5% return before expenses) | |
Standard Class | | | $1,000.00 | | | $ | 1,021.93 | | | | 0.65 | % | | | $3.31 | |
Service Class | | | 1,000.00 | | | | 1,020.42 | | | | 0.95 | % | | | 4.84 | |
| * | “Expenses Paid During Period” are equal to the Series’ annualized expense ratio, multiplied by the average account value over the period, multiplied by 184/365 (to reflect theone-half year period). |
| † | Because actual returns reflect only the most recentsix-month period, the returns shown may differ significantly from fiscal year returns. |
Diversified Income Series-5
Delaware VIP® Trust — Delaware VIP Diversified Income Series
Security type / sector allocation
As of December 31, 2018 (Unaudited)
Sector designations may be different than the sector designations presented in other Series materials. The sector designations may represent the investment manager’s internal sector classifications.
| | |
| Security type / sector | | Percentage of
net assets |
Agency Asset-Backed Securities | | 0.01% |
Agency Collateralized Mortgage Obligations | | 4.63% |
Agency Commercial Mortgage-Backed Securities | | 1.16% |
Agency Mortgage-Backed Securities | | 9.05% |
Collateralized Debt Obligations | | 5.10% |
Convertible Bonds | | 3.07% |
Corporate Bonds | | 40.60% |
Banking | | 8.90% |
Basic Industry | | 3.66% |
Brokerage | | 0.68% |
Capital Goods | | 1.54% |
Communications | | 4.16% |
Consumer Cyclical | | 2.04% |
ConsumerNon-Cyclical | | 3.45% |
Electric | | 4.42% |
Energy | | 4.24% |
Finance Companies | | 1.09% |
Healthcare | | 0.62% |
Insurance | | 1.90% |
Media | | 0.48% |
Real Estate Investment Trusts | | 0.76% |
Services | | 0.28% |
Technology | | 1.30% |
Transportation | | 0.83% |
Utilities | | 0.25% |
Loan Agreements | | 7.02% |
Municipal Bonds | | 0.15% |
Non-Agency Asset-Backed Securities | | 3.29% |
Non-Agency Collateralized Mortgage Obligations | | 2.09% |
Non-Agency Commercial Mortgage-Backed Securities | | 6.71% |
Regional Bonds | | 0.34% |
Sovereign Bonds | | 2.04% |
Supranational Banks | | 0.78% |
| | |
| Security type / sector | | Percentage of
net assets |
US Treasury Obligations | | 11.87% |
Common Stock | | 0.01% |
Convertible Preferred Stock | | 0.71% |
Preferred Stock | | 0.27% |
Short-Term Investments | | 2.23% |
Total Value of Securities | | 101.13% |
Liabilities Net of Receivables and Other Assets | | (1.13%) |
Total Net Assets | | 100.00% |
Diversified Income Series-6
Delaware VIP® Trust — Delaware VIP Diversified Income Series
Schedule of investments
December 31, 2018
| | | | | | | | |
| | | Principal amount° | | | Value (US $) | |
| | |
Agency Asset-Backed Securities – 0.01% | | | | | | | | |
Fannie Mae Grantor Trust | | | | | | | | |
Series2003-T4 2A5 4.665% 9/26/33 • | | | 159,838 | | | $ | 173,815 | |
Fannie Mae REMIC Trust | | | | | | | | |
Series2002-W11 AV1 2.846% (LIBOR01M + 0.34%, Floor 0.17%) 11/25/32 • | | | 686 | | | | 672 | |
| | | | | | | | |
Total Agency Asset-Backed Securities (cost $159,825) | | | | | | | 174,487 | |
| | | | | | | | |
| | |
Agency Collateralized Mortgage Obligations – 4.63% | | | | | | | | |
Fannie Mae Connecticut Avenue Securities | | | | | | | | |
Series2017-C04 2M2 5.356% (LIBOR01M + 2.85%) 11/25/29 • | | | 5,050,000 | | | | 5,166,379 | |
Series2018-C01 1M2 4.756% (LIBOR01M + 2.25%, Floor 2.25%) 7/25/30 • | | | 1,690,000 | | | | 1,650,245 | |
Series2018-C02 2M2 4.706% (LIBOR01M + 2.20%, Floor 2.20%) 8/25/30 • | | | 1,530,000 | | | | 1,488,607 | |
Series2018-C03 1M2 4.656% (LIBOR01M + 2.15%, Floor 2.15%) 10/25/30 • | | | 1,330,000 | | | | 1,299,580 | |
Series2018-C05 1M2 4.856% (LIBOR01M + 2.35%, Floor 2.35%) 1/25/31 • | | | 1,295,000 | | | | 1,262,222 | |
Fannie Mae Grantor Trust | | | | | | | | |
Series1999-T2 A1 7.50% 1/19/39 • | | | 302 | | | | 325 | |
Series2002-T4 A3 7.50% 12/25/41 | | | 6,088 | | | | 6,910 | |
Series2004-T1 1A2 6.50% 1/25/44 | | | 5,462 | | | | 6,111 | |
Fannie Mae Interest Strip | | | | | | | | |
Series 417 C24 3.50% 12/25/42S | | | 151,663 | | | | 27,886 | |
Series 418 C12 3.00%
8/25/33S | | | 5,270,182 | | | | 637,721 | |
Series 419 C3 3.00%
11/25/43S | | | 1,142,154 | | | | 199,132 | |
Fannie Mae REMIC Trust | | | | | | | | |
Series2002-W6 2A1 7.00% 6/25/42 • . | | | 13,347 | | | | 14,451 | |
Series2004-W11 1A2 6.50% 5/25/44 | | | 23,239 | | | | 25,928 | |
Fannie Mae REMICs | | | | | | | | |
Series2008-15 SB 4.094% (6.60% minus LIBOR01M, Cap 6.60%) 8/25/36S• | | | 230,486 | | | | 37,949 | |
Series2009-94 AC 5.00% 11/25/39 | | | 459,447 | | | | 497,842 | |
Series2010-116 Z 4.00% 10/25/40 | | | 29,929 | | | | 31,270 | |
Series2012-60 KI 3.00% 9/25/26S | | | 49,636 | | | | 2,662 | |
Series2012-98 MI 3.00% 8/25/31S | | | 2,345,470 | | | | 250,487 | |
Series2012-99 AI 3.50% 5/25/39S | | | 1,260,109 | | | | 110,518 | |
Series2012-115 MI 3.50% 3/25/42S | | | 535,640 | | | | 58,985 | |
Series2012-120 CI 3.50% 12/25/31S | | | 234,954 | | | | 19,020 | |
| | | | | | | | |
| | | Principal | | | Value | |
| | | amount° | | | (US $) | |
| | |
Agency Collateralized Mortgage Obligations (continued) | | | | | | | | |
Fannie Mae REMICs | | | | | | | | |
Series2012-120 WI 3.00% 11/25/27S | | | 2,212,350 | | | $ | 189,055 | |
Series2012-121 ID 3.00% 11/25/27S | | | 98,018 | | | | 8,971 | |
Series2012-125 MI 3.50% 11/25/42S | | | 48,315 | | | | 10,492 | |
Series2012-128 IC 3.00% 11/25/32S | | | 4,553,850 | | | | 581,849 | |
Series2012-132 AI 3.00% 12/25/27S | | | 3,062,829 | | | | 256,811 | |
Series2012-137 AI 3.00% 12/25/27S | | | 1,046,918 | | | | 90,126 | |
Series2012-137 WI 3.50% 12/25/32S | | | 746,882 | | | | 111,131 | |
Series2012-139 NS 4.194% (6.70% minus LIBOR01M, Cap 6.70%) 12/25/42S• | | | 6,122,516 | | | | 1,303,055 | |
Series2012-144 PI 3.50% 6/25/42S | | | 859,398 | | | | 111,718 | |
Series2012-146 IO 3.50% 1/25/43S | | | 4,034,725 | | | | 802,298 | |
Series2012-149 IC 3.50% 1/25/28S | | | 2,790,632 | | | | 273,411 | |
Series2013-1 YI 3.00%
2/25/33S | | | 3,719,795 | | | | 486,600 | |
Series2013-7 EI 3.00% 10/25/40S | | | 1,378,769 | | | | 149,645 | |
Series2013-20 IH 3.00% 3/25/33S | | | 81,172 | | | | 11,247 | |
Series2013-23 IL 3.00% 3/25/33S | | | 67,180 | | | | 9,131 | |
Series2013-26 ID 3.00% 4/25/33S | | | 1,866,480 | | | | 258,617 | |
Series2013-28 YB 3.00% 4/25/43 | | | 52,000 | | | | 49,376 | |
Series2013-31 MI 3.00% 4/25/33S | | | 604,512 | | | | 84,310 | |
Series2013-35 IB 3.00% 4/25/33S | | | 2,630,534 | | | | 340,424 | |
Series2013-35 IG 3.00% 4/25/28S | | | 1,850,408 | | | | 161,435 | |
Series2013-38 AI 3.00% 4/25/33S | | | 1,798,138 | | | | 229,415 | |
Series2013-41 HI 3.00% 2/25/33S | | | 2,946,892 | | | | 316,295 | |
Series2013-44 DI 3.00% 5/25/33S | | | 5,506,672 | | | | 767,406 | |
Series2013-44 Z 3.00% 5/25/43 | | | 71,550 | | | | 68,331 | |
Series2013-45 PI 3.00% 5/25/33S | | | 1,216,842 | | | | 168,520 | |
Series2013-55 AI 3.00% 6/25/33S | | | 3,135,474 | | | | 392,601 | |
Series2013-60 CI 3.00% 6/25/31S | | | 1,012,502 | | | | 77,004 | |
Series2013-69 IJ 3.00% 7/25/33S | | | 1,331,681 | | | | 182,912 | |
Series2013-103 SK 3.414% (5.92% minus LIBOR01M, Cap 5.92%) 10/25/43S• | | | 3,877,643 | | | | 755,934 | |
Series2014-63 KI 3.50% 11/25/33S | | | 632,818 | | | | 67,506 | |
Series2014-64 IT 3.50% 6/25/41S | | | 333,386 | | | | 26,920 | |
Series2014-77 AI 3.00% 10/25/40S | | | 48,644 | | | | 5,322 | |
Series2015-43 PZ 3.50% 6/25/45 | | | 1,110,746 | | | | 1,098,906 | |
Series2015-44 AI 3.50% 1/25/34S | | | 57,434 | | | | 6,204 | |
Series2015-45 AI 3.00% 1/25/33S | | | 60,299 | | | | 5,174 | |
Series2015-56 MI 3.50% 10/25/41S | | | 1,055,269 | | | | 133,309 | |
Series2015-57 LI 3.50% 8/25/35S | | | 3,863,561 | | | | 606,138 | |
Series2015-89 AZ 3.50% 12/25/45 | | | 357,523 | | | | 358,265 | |
Series2016-6 AI 3.50%
4/25/34S | | | 2,220,610 | | | | 269,679 | |
Series2016-23 AI 3.50% 2/25/41S | | | 968,055 | | | | 106,739 | |
Series2016-30 CI 3.00% 5/25/36S | | | 1,741,308 | | | | 238,703 | |
Series2016-33 DI 3.50% 6/25/36S | | | 4,438,671 | | | | 658,388 | |
Series2016-36 SB 3.494% (6.00% minus LIBOR01M, Cap 6.00%) 3/25/43S• | | | 1,507,310 | | | | 192,611 | |
Series2016-40 IO 3.50% 7/25/36S | | | 604,924 | | | | 96,784 | |
| | |
| | Diversified Income Series-7 |
Delaware VIP® Diversified Income Series
Schedule of investments (continued)
| | | | | | | | |
| | | Principal | | | Value | |
| | | amount° | | | (US $) | |
| | |
Agency Collateralized Mortgage Obligations (continued) | | | | | | | | |
Fannie Mae REMICs | | | | | | | | |
Series2016-50 IB 3.00% 2/25/46S | | | 277,043 | | | $ | 41,474 | |
Series2016-51 LI 3.00% 8/25/46S | | | 5,997,429 | | | | 857,627 | |
Series2016-60 LI 3.00% 9/25/46S | | | 2,932,171 | | | | 409,970 | |
Series2016-62 IC 3.00% 3/25/43S | | | 7,931,220 | | | | 868,929 | |
Series2016-62 SA 3.494% (6.00% minus LIBOR01M, Cap 6.00%) 9/25/46S• | | | 4,123,819 | | | | 786,561 | |
Series2016-64 CI 3.50% 7/25/43S | | | 2,178,363 | | | | 271,400 | |
Series2016-71 PI 3.00% 10/25/46S | | | 1,564,450 | | | | 217,522 | |
Series2016-74 GS 3.494% (6.00% minus LIBOR01M, Cap 6.00%) 10/25/46S• | | | 3,026,423 | | | | 543,626 | |
Series2016-77 SA 3.494% (6.00% minus LIBOR01M, Cap 6.00%) 10/25/46S• | | | 286,287 | | | | 51,212 | |
Series2016-95 IO 3.00% 12/25/46S | | | 78,743 | | | | 14,166 | |
Series2016-99 DI 3.50% 1/25/46S | | | 1,298,210 | | | | 234,451 | |
Series2016-105 SA 3.494% (6.00% minus LIBOR01M, Cap 6.00%) 1/25/47S• | | | 2,918,065 | | | | 512,109 | |
Series2017-1 EI 3.50% 9/25/35S | | | 988,555 | | | | 150,572 | |
Series2017-4 AI 3.50% 5/25/41S | | | 2,257,407 | | | | 267,391 | |
Series2017-4 BI 3.50% 5/25/41S | | | 1,342,750 | | | | 179,157 | |
Series2017-6 NI 3.50% 3/25/46S | | | 266,878 | | | | 49,903 | |
Series2017-11 EI 3.00% 3/25/42S | | | 3,989,173 | | | | 566,328 | |
Series2017-12 JI 3.50% 5/25/40S | | | 1,110,829 | | | | 138,021 | |
Series2017-15 NZ 3.50% 3/25/47 | | | 314,520 | | | | 311,106 | |
Series2017-16 SM 3.544% (6.05% minus LIBOR01M, Cap 6.05%) 3/25/47S• | | | 5,007,123 | | | | 1,028,343 | |
Series2017-16 WI 3.00% 1/25/45S | | | 1,106,578 | | | | 127,716 | |
Series2017-24 AI 3.00% 8/25/46S | | | 1,689,459 | | | | 230,709 | |
Series2017-25 BL 3.00% 4/25/47 | | | 389,000 | | | | 369,943 | |
Series2017-40 GZ 3.50% 5/25/47 | | | 856,462 | | | | 857,823 | |
Series2017-77 HZ 3.50% 10/25/47 | | | 1,224,335 | | | | 1,230,164 | |
Series2017-88 EI 3.00% 11/25/47S | | | 2,875,818 | | | | 500,379 | |
Series2017-88 IE 3.00% 11/25/47S | | | 2,052,788 | | | | 292,749 | |
Series2017-94 CZ 3.50% 11/25/47 | | | 767,671 | | | | 727,179 | |
Series2017-99 IE 3.00% 12/25/47S | | | 2,168,182 | | | | 312,061 | |
Freddie Mac REMICs | | | | | | | | |
Series 4050 EI 4.00%
2/15/39S | | | 2,095,242 | | | | 186,371 | |
Series 4101 WI 3.50%
8/15/32S | | | 1,196,996 | | | | 197,321 | |
Series 4109 AI 3.00%
7/15/31S | | | 4,540,419 | | | | 413,371 | |
Series 4120 MI 3.00% 10/15/32S | | | 778,098 | | | | 111,745 | |
Series 4122 LI 3.00%
10/15/27S | | | 40,314 | | | | 3,759 | |
Series 4135 AI 3.50% 11/15/42S | | | 3,662,659 | | | | 764,469 | |
Series 4139 IP 3.50%
4/15/42S | | | 847,345 | | | | 108,137 | |
Series 4146 AI 3.00% 12/15/27S | | | 1,717,640 | | | | 136,472 | |
Series 4146 IA 3.50% 12/15/32S | | | 2,023,983 | | | | 310,999 | |
Series 4150 UI 3.50%
8/15/32S | | | 4,915,545 | | | | 475,318 | |
| | | | | | | | |
| | | Principal | | | Value | |
| | | amount° | | | (US $) | |
| | |
Agency Collateralized Mortgage Obligations (continued) | | | | | | | | |
Freddie Mac REMICs | | | | | | | | |
Series 4153 IB 2.50% 1/15/28S | | | 1,058,036 | | | $ | 80,176 | |
Series 4156 AI 3.00% 10/15/31S | | | 1,080,330 | | | | 114,607 | |
Series 4161 IM 3.50% 2/15/43S | | | 816,827 | | | | 163,493 | |
Series 4171 Z 3.00% 2/15/43 | | | 19,627 | | | | 18,301 | |
Series 4181 DI 2.50% 3/15/33S | | | 1,275,118 | | | | 152,545 | |
Series 4184 GS 3.665% (6.12% minus LIBOR01M, Cap 6.12%) 3/15/43S• | | | 2,106,868 | | | | 429,884 | |
Series 4185 LI 3.00% 3/15/33S | | | 1,497,986 | | | | 210,857 | |
Series 4186 IB 3.00% 3/15/33S | | | 2,128,486 | | | | 272,796 | |
Series 4188 JI 3.00% 4/15/33S | | | 2,988,897 | | | | 336,271 | |
Series 4191 CI 3.00% 4/15/33S | | | 557,065 | | | | 76,106 | |
Series 4342 CI 3.00% 11/15/33S | | | 745,037 | | | | 87,717 | |
Series 4433 DI 3.00% 8/15/32S | | | 45,451 | | | | 4,274 | |
Series 4449 PI 4.00% 11/15/43S | | | 65,880 | | | | 11,145 | |
Series 4453 DI 3.50% 11/15/33S | | | 876,094 | | | | 93,068 | |
Series 4494 SA 3.725% (6.18% minus LIBOR01M, Cap 6.18%) 7/15/45S• | | | 593,707 | | | | 117,630 | |
Series 4504 IO 3.50% 5/15/42S | | | 1,033,760 | | | | 104,300 | |
Series 4527 CI 3.50% 2/15/44S | | | 3,055,928 | | | | 482,391 | |
Series 4543 HI 3.00% 4/15/44S | | | 1,198,035 | | | | 184,518 | |
Series 4574 AI 3.00% 4/15/31S | | | 2,490,833 | | | | 304,913 | |
Series 4580 MI 3.50% 2/15/43S | | | 157,217 | | | | 20,719 | |
Series 4581 LI 3.00% 5/15/36S | | | 1,029,680 | | | | 138,555 | |
Series 4609 QZ 3.00% 8/15/46 | | | 974,825 | | | | 875,078 | |
Series 4610 IB 3.00% 6/15/41S | | | 6,985,024 | | | | 723,440 | |
Series 4618 SA 3.545% (6.00% minus LIBOR01M, Cap 6.00%) 9/15/46S• | | | 1,595,340 | | | | 311,227 | |
Series 4623 MS 3.545% (6.00% minus LIBOR01M, Cap 6.00%) 10/15/46S• | | | 3,429,682 | | | | 585,417 | |
Series 4625 BI 3.50% 6/15/46S | | | 4,253,253 | | | | 794,589 | |
Series 4627 PI 3.50% 5/15/44S | | | 3,967,304 | | | | 482,768 | |
Series 4644 GI 3.50% 5/15/40S | | | 1,678,616 | | | | 231,878 | |
Series 4648 SA 3.545% (6.00% minus LIBOR01M, Cap 6.00%) 1/15/47S• | | | 3,278,895 | | | | 597,936 | |
Series 4655 WI 3.50% 8/15/43S | | | 1,752,464 | | | | 254,275 | |
Series 4656 HI 3.50% 5/15/42S | | | 68,763 | | | | 8,345 | |
Series 4657 PS 3.545% (6.00% minus LIBOR01M, Cap 6.00%) 2/15/47S• | | | 3,639,324 | | | | 649,898 | |
Series 4660 GI 3.00% 8/15/43S | | | 1,273,166 | | | | 183,833 | |
Series 4663 AI 3.00% 3/15/42S | | | 2,603,076 | | | | 349,530 | |
Series 4663 HZ 3.50% 3/15/47 | | | 400,777 | | | | 383,704 | |
Series 4665 NI 3.50% 7/15/41S | | | 6,897,289 | | | | 847,940 | |
Series 4667 CI 3.50% 7/15/40S | | | 143,256 | | | | 13,096 | |
Series 4667 LI 3.50% 10/15/43S | | | 864,136 | | | | 121,927 | |
Series 4669 QI 3.50% 6/15/41S | | | 500,334 | | | | 60,086 | |
Series 4673 WI 3.50% 9/15/43S | | | 1,921,231 | | | | 281,534 | |
Series 4674 GI 3.50% 10/15/40S | | | 126,155 | | | | 11,732 | |
Series 4676 KZ 2.50% 7/15/45 | | | 844,426 | | | | 732,433 | |
Series 4690 WI 3.50% 12/15/43S | | | 2,434,753 | | | | 370,519 | |
Series 4691 LI 3.50% 1/15/41S | | | 1,678,108 | | | | 188,217 | |
| | |
| | Diversified Income Series-8 |
Delaware VIP® Diversified Income Series
Schedule of investments (continued)
| | | | | | | | |
| | | Principal | | | Value | |
| | | amount° | | | (US $) | |
| | |
Agency Collateralized Mortgage Obligations (continued) | | | | | | | | |
Freddie Mac REMICs | | | | | | | | |
Series 4693 EI 3.50%
8/15/42S | | | 1,239,652 | | | $ | 181,191 | |
Series 4703 CI 3.50%
7/15/42S | | | 3,692,996 | | | | 464,988 | |
Freddie Mac Strips | | | | | | | | |
Series 304 C38 3.50% 12/15/27S | | | 1,591,614 | | | | 137,845 | |
Series 319 S2 3.545% (6.00% minus LIBOR01M, Cap 6.00%) 11/15/43S• | | | 1,514,898 | | | | 274,399 | |
Freddie Mac Structured Agency Credit Risk Debt Notes | | | | | | | | |
Series 2015-DNA3 M2 5.356% (LIBOR01M + 2.85%) 4/25/28 • | | | 728,776 | | | | 748,654 | |
Series 2015-HQA1 M2 5.156% (LIBOR01M + 2.65%) 3/25/28 • | | | 359,627 | | | | 364,189 | |
Series 2016-DNA3 M2 4.506% (LIBOR01M + 2.00%) 12/25/28 • | | | 454,060 | | | | 458,151 | |
Series 2016-DNA4 M2 3.806% (LIBOR01M + 1.30%, Floor 1.30%) 3/25/29 • | | | 575,000 | | | | 575,635 | |
Series 2016-HQA2 M2 4.756% (LIBOR01M + 2.25%) 11/25/28 • | | | 524,978 | | | | 533,379 | |
Series 2017-DNA1 M2 5.756% (LIBOR01M + 3.25%, Floor 3.25%) 7/25/29 • | | | 2,250,000 | | | | 2,366,503 | |
Series 2017-DNA3 M2 5.006% (LIBOR01M + 2.50%) 3/25/30 • | | | 6,530,000 | | | | 6,530,016 | |
Series 2017-HQA3 M2 4.856% (LIBOR01M + 2.35%) 4/25/30 • | | | 4,685,000 | | | | 4,650,057 | |
Series 2018-DNA1 M2 4.306% (LIBOR01M + 1.80%) 7/25/30 • | | | 2,555,000 | | | | 2,453,921 | |
Series 2018-HQA1 M2 4.806% (LIBOR01M + 2.30%) 9/25/30 • | | | 2,000,000 | | | | 1,951,147 | |
Freddie Mac Structured Pass Through Certificates | | | | | | | | |
SeriesT-54 2A 6.50% 2/25/43 ¨ | | | 9,727 | | | | 11,121 | |
SeriesT-58 2A 6.50% 9/25/43 ¨ | | | 3,529 | | | | 4,018 | |
GNMA | | | | | | | | |
Series2011-157 SG 4.13% (6.60% minus LIBOR01M, Cap 6.60%) 12/20/41S• | | | 2,197,363 | | | | 436,274 | |
Series2012-61 PI 3.00%
4/20/39S | | | 118,265 | | | | 6,442 | |
Series2013-113 LY 3.00% 5/20/43 | | | 378,000 | | | | 359,684 | |
Series2015-44 AI 3.00%
8/20/41S | | | 145,356 | | | | 14,480 | |
Series2015-74 CI 3.00% 10/16/39S | | | 2,282,128 | | | | 265,372 | |
Series2015-111 IH 3.50% 8/20/45S | | | 3,523,961 | | | | 419,107 | |
Series2015-142 AI 4.00% 2/20/44S | | | 639,922 | | | | 69,441 | |
Series2016-32 MS 3.58% (6.05% minus LIBOR01M, Cap 6.05%) 3/20/46S• | | | 149,833 | | | | 28,089 | |
Series2016-75 JI 3.00%
9/20/43S | | | 9,528,632 | | | | 1,106,572 | |
| | | | | | | | |
| | | Principal | | | Value | |
| | | amount° | | | (US $) | |
| | |
Agency Collateralized Mortgage Obligations (continued) | | | | | | | | |
GNMA | | | | | | | | |
Series2016-89 QS 3.58% (6.05% minus LIBOR01M, Cap 6.05%) 7/20/46S• | | | 2,457,519 | | | $ | 528,996 | |
Series2016-108 SK 3.58% (6.05% minus LIBOR01M, Cap 6.05%) 8/20/46S• | | | 3,596,543 | | | | 726,984 | |
Series2016-108 YL 3.00% 8/20/46 | | | 3,164,000 | | | | 3,080,604 | |
Series2016-115 SA 3.63% (6.10% minus LIBOR01M, Cap 6.10%) 8/20/46S• | | | 6,518,979 | | | | 1,103,666 | |
Series2016-116 GI 3.50% 11/20/44S | | | 4,233,866 | | | | 615,382 | |
Series2016-118 DI 3.50% 3/20/43S | | | 4,761,678 | | | | 638,110 | |
Series2016-118 ES 3.63% (6.10% minus LIBOR01M, Cap 6.10%) 9/20/46S• | | | 2,794,792 | | | | 515,122 | |
Series2016-120 IA 3.00% 2/20/46S | | | 202,717 | | | | 24,817 | |
Series2016-126 NS 3.63% (6.10% minus LIBOR01M, Cap 6.10%) 9/20/46S• | | | 2,667,628 | | | | 483,397 | |
Series2016-134 MZ 3.00% 10/20/46 | | | 1,557,926 | | | | 1,466,773 | |
Series2016-147 ST 3.58% (6.05% minus LIBOR01M, Cap 6.05%) 10/20/46S• | | | 2,554,734 | | | | 446,608 | |
Series2016-149 GI 4.00% 11/20/46S | | | 2,651,275 | | | | 539,983 | |
Series2016-156 PB 2.00% 11/20/46 | | | 794,000 | | | | 640,611 | |
Series2016-159 MI 3.00% 3/20/46S | | | 233,778 | | | | 33,672 | |
Series2016-160 GS 3.63% (6.10% minus LIBOR01M, Cap 6.10%) 11/20/46S• | | | 6,831,660 | | | | 1,419,281 | |
Series2016-163 MI 3.50% 11/20/46S | | | 2,095,682 | | | | 237,736 | |
Series2016-163 XI 3.00% 10/20/46S | | | 3,305,881 | | | | 432,660 | |
Series2016-171 IO 3.00% 7/20/44S | | | 5,447,342 | | | | 643,308 | |
Series2016-171 IP 3.00% 3/20/46S | | | 3,253,369 | | | | 401,594 | |
Series2017-4 WI 4.00% 2/20/44S | | | 1,562,352 | | | | 236,063 | |
Series2017-10 IB 4.00% 1/20/47S | | | 2,848,252 | | | | 619,407 | |
Series2017-18 QI 4.00% 3/16/41S | | | 2,479,866 | | | | 446,722 | |
Series2017-18 QS 3.645% (6.10% minus LIBOR01M, Cap 6.10%) 2/16/47S• | | | 3,053,829 | | | | 527,802 | |
Series2017-34 DY 3.50% 3/20/47 | | | 2,067,000 | | | | 2,047,259 | |
Series2017-56 JZ 3.00% 4/20/47 | | | 742,151 | | | | 669,408 | |
Series2017-80 AS 3.73% (6.20% minus LIBOR01M, Cap 6.20%) 5/20/47S• | | | 4,588,965 | | | | 875,999 | |
Series2017-101 AI 4.00% 7/20/47S | | | 1,954,323 | | | | 339,305 | |
Series2017-101 TI 4.00% 3/20/44S | | | 2,909,228 | | | | 422,976 | |
Series2017-107 QZ 3.00% 8/20/45 | | | 560,285 | | | | 505,126 | |
Series2017-113 LB 3.00% 7/20/47 | | | 1,465,000 | | | | 1,374,763 | |
Series2017-114 IK 4.00% 10/20/44S | | | 4,224,934 | | | | 884,326 | |
| | |
| | Diversified Income Series-9 |
Delaware VIP® Diversified Income Series
Schedule of investments (continued)
| | | | | | | | |
| | | Principal amount° | | | Value (US $) | |
| | |
Agency Collateralized Mortgage Obligations (continued) | | | | | | | | |
GNMA | | | | | | | | |
Series2017-121 IL 3.00% 2/20/42S | | | 164,126 | | | $ | 20,572 | |
Series2017-130 YJ 2.50% 8/20/47 | | | 665,000 | | | | 607,636 | |
Series2017-134 ES 3.73% (6.20% minus LIBOR01M, Cap 6.20%) 9/20/47S• | | | 2,043,770 | | | | 357,089 | |
Series2017-134 KI 4.00% 5/20/44S | | | 2,464,739 | | | | 350,354 | |
Series2017-134 SD 3.73% (6.20% minus LIBOR01M, Cap 6.20%) 9/20/47S• | | | 2,619,884 | | | | 530,254 | |
Series2017-141 JS 3.73% (6.20% minus LIBOR01M, Cap 6.20%) 9/20/47S• | | | 3,097,249 | | | | 594,253 | |
Series2017-144 EI 3.00% 12/20/44S | | | 4,181,538 | | | | 572,874 | |
Series2017-174 HI 3.00% 7/20/45S | | | 3,823,213 | | | | 562,734 | |
Series2018-1 ST 3.73% (6.20% minus LIBOR01M, Cap 6.20%) 1/20/48S• | | | 6,397,127 | | | | 1,190,780 | |
Series2018-8 VZ 3.00% 3/20/47 | | | 1,120,353 | | | | 994,172 | |
Series2018-11 AI 3.00% 1/20/46S | | | 2,527,121 | | | | 319,525 | |
Series2018-13 PZ 3.00% 1/20/48 | | | 544,759 | | | | 511,647 | |
Series2018-14 ZE 3.50% 1/20/48 | | | 294,278 | | | | 282,415 | |
Series2018-24 HZ 3.00% 2/20/48 | | | 278,877 | | | | 252,052 | |
Series2018-34 TY 3.50% 3/20/48 | | | 476,000 | | | | 469,257 | |
Series2018-37 SA 3.73% (6.20% minus LIBOR01M, Cap 6.20%) 3/20/48S• | | | 2,147,094 | | | | 416,814 | |
Series2018-46 AS 3.73% (6.20% minus LIBOR01M, Cap 6.20%) 3/20/48S• | | | 7,631,680 | | | | 1,570,018 | |
| | | | | | | | |
Total Agency Collateralized Mortgage Obligations (cost $111,369,133) | | | | | | | 109,174,800 | |
| | | | | | | | |
| | |
Agency Commercial Mortgage-Backed Securities – 1.16% | | | | | | | | |
Freddie Mac Multifamily Structured Pass Through Certificates | | | | | | | | |
3.43% 1/25/27¨• | | | 800,000 | | | | 810,109 | |
Series X3FX A2FX 3.00% 6/25/27¨ | | | 2,545,000 | | | | 2,509,770 | |
FREMF Mortgage Trust | | | | | | | | |
Series2010-K8 B 144A 5.278% 9/25/43 #• | | | 2,040,000 | | | | 2,094,783 | |
Series2011-K14 B 144A 5.18% 2/25/47 #• | | | 820,000 | | | | 855,441 | |
Series2011-K15 B 144A 4.948% 8/25/44 #• | | | 195,000 | | | | 202,980 | |
Series2012-K18 B 144A 4.255% 1/25/45 #• | | | 2,000,000 | | | | 2,059,251 | |
Series2012-K22 B 144A 3.686% 8/25/45 #• | | | 1,730,000 | | | | 1,755,691 | |
| | | | | | | | |
| | | Principal amount° | | | Value (US $) | |
| | |
Agency Commercial Mortgage-Backed Securities (continued) | | | | | | | | |
FREMF Mortgage Trust | | | | | | | | |
Series2013-K25 C 144A 3.619% 11/25/45 #• | | | 1,500,000 | | | $ | 1,473,429 | |
Series2013-K28 B 144A 3.49% 6/25/46 #• | | | 2,400,000 | | | | 2,392,583 | |
Series2013-K28 C 144A 3.49% 6/25/46 #• | | | 750,000 | | | | 732,126 | |
Series2013-K33 B 144A 3.50% 8/25/46 #• | | | 1,315,000 | | | | 1,305,663 | |
Series2013-K33 C 144A 3.50% 8/25/46 #• | | | 715,000 | | | | 685,343 | |
Series 2013-K712 B 144A 3.358% 5/25/45 #• | | | 990,000 | | | | 989,027 | |
Series 2013-K713 B 144A 3.154% 4/25/46 #• | | | 605,000 | | | | 603,713 | |
Series 2013-K713 C 144A 3.154% 4/25/46 #• | | | 2,275,000 | | | | 2,265,638 | |
Series 2014-K717 B 144A 3.629% 11/25/47 #• | | | 3,205,000 | | | | 3,234,873 | |
Series 2014-K717 C 144A 3.629% 11/25/47 #• | | | 1,055,000 | | | | 1,061,552 | |
Series2016-K53 B 144A 4.019% 3/25/49 #• | | | 530,000 | | | | 536,492 | |
Series 2016-K722 B 144A 3.836% 7/25/49 #• | | | 580,000 | | | | 589,014 | |
Series2017-K71 B 144A 3.753% 11/25/50 #• | | | 1,175,000 | | | | 1,111,938 | |
| | | | | | | | |
Total Agency Commercial Mortgage-Backed Securities
(cost $27,354,030) | | | | | | | 27,269,416 | |
| | | | | | | | |
| | |
Agency Mortgage-Backed Securities – 9.05% | | | | | | | | |
Fannie Mae ARM | | | | | | | | |
4.563% (LIBOR12M + 1.83%, Cap 10.16%) 8/1/35 • | | | 11,070 | | | | 11,617 | |
Fannie Mae S.F. 30 yr | | | | | | | | |
4.50% 11/1/39 | | | 754,253 | | | | 791,109 | |
4.50% 6/1/40 | | | 850,446 | | | | 890,250 | |
4.50% 7/1/40 | | | 879,385 | | | | 927,464 | |
4.50% 8/1/40 | | | 206,196 | | | | 215,317 | |
4.50% 8/1/41 | | | 2,090,074 | | | | 2,193,109 | |
4.50% 10/1/43 | | | 4,725,887 | | | | 4,951,910 | |
4.50% 10/1/44 | | | 563,686 | | | | 589,992 | |
4.50% 3/1/46 | | | 2,837,942 | | | | 2,962,010 | |
4.50% 5/1/46 | | | 1,739,594 | | | | 1,813,329 | |
4.50% 7/1/46 | | | 2,067,851 | | | | 2,150,161 | |
4.50% 8/1/47 | | | 9,817,910 | | | | 10,187,212 | |
5.00% 6/1/44 | | | 2,260,238 | | | | 2,415,433 | |
5.00% 7/1/47 | | | 1,398,908 | | | | 1,486,927 | |
| | |
| | Diversified Income Series-10 |
Delaware VIP® Diversified Income Series
Schedule of investments (continued)
| | | | | | | | |
| | | Principal
amount° | | | Value (US $) | |
| | |
Agency Mortgage-Backed Securities (continued) | | | | | | | | |
Fannie Mae S.F. 30 yr
| | | | | | | | |
5.00% 9/1/48 | | | 10,155,675 | | | $ | 10,668,934 | |
5.50% 5/1/44 | | | 23,087,145 | | | | 24,874,763 | |
5.50% 8/1/48 | | | 1,999,742 | | | | 2,154,365 | |
6.00% 6/1/41 | | | 4,706,842 | | | | 5,132,433 | |
6.00% 7/1/41 | | | 25,471,011 | | | | 27,793,050 | |
6.00% 1/1/42 | | | 4,116,322 | | | | 4,528,222 | |
Fannie Mae S.F. 30 yr TBA | | | | | | | | |
3.50%y | | | 50,125,000 | | | | 50,098,679 | |
5.00%y | | | 915,000 | | | | 956,437 | |
Freddie Mac S.F. 30 yr | | | | | | | | |
4.50% 4/1/39 | | | 123,279 | | | | 128,471 | |
4.50% 7/1/42 | | | 1,107,059 | | | | 1,159,405 | |
4.50% 12/1/43 | | | 1,037,199 | | | | 1,087,213 | |
4.50% 8/1/44 | | | 1,371,614 | | | | 1,434,044 | |
4.50% 7/1/45 | | | 6,853,720 | | | | 7,191,363 | |
4.50% 9/1/46 | | | 1,700,071 | | | | 1,762,689 | |
5.00% 12/1/44 | | | 3,187,152 | | | | 3,376,806 | |
5.50% 6/1/41 | | | 4,444,565 | | | | 4,832,390 | |
5.50% 9/1/41 | | | 7,852,060 | | | | 8,467,560 | |
6.00% 7/1/40 | | | 12,184,593 | | | | 13,365,368 | |
GNMA I S.F. 30 yr
| | | | | | | | |
5.50% 2/15/41 | | | 481,806 | | | | 513,550 | |
GNMA II S.F. 30 yr
| | | | | | | | |
5.00% 9/20/46 | | | 2,481,043 | | | | 2,617,377 | |
5.00% 7/20/48 | | | 2,813,288 | | | | 2,929,330 | |
5.00% 9/20/48 | | | 2,852,979 | | | | 2,976,009 | |
5.50% 5/20/37 | | | 246,879 | | | | 259,586 | |
6.00% 2/20/39 | | | 283,924 | | | | 301,591 | |
6.00% 10/20/39 | | | 1,259,497 | | | | 1,360,785 | |
6.00% 2/20/40 | | | 1,304,516 | | | | 1,398,780 | |
6.00% 4/20/46 | | | 377,203 | | | | 408,917 | |
| | | | | | | | |
Total Agency Mortgage-Backed Securities
(cost $215,978,463) | | | | | | | 213,363,957 | |
| | | | | | | | |
| | |
Collateralized Debt Obligations – 5.10% | | | | | | | | |
AMMC CLO 21 | | | | | | | | |
Series2017-21A A 144A 3.809% (LIBOR03M + 1.25%) 11/2/30 #• | | | 1,250,000 | | | | 1,240,417 | |
AMMC CLO 22 | | | | | | | | |
Series2018-22A A 144A 3.52% (LIBOR03M + 1.03%, Floor 1.03%) 4/25/31 #• | | | 2,600,000 | | | | 2,550,301 | |
AMMC CLO XIII | | | | | | | | |
Series2013-13A A1LR 144A 3.747% (LIBOR03M + 1.26%) 7/24/29 #• | | | 2,500,000 | | | | 2,484,795 | |
Apex Credit CLO | | | | | | | | |
Series2017-1A A1 144A 3.957% (LIBOR03M + 1.47%, Floor 1.47%) 4/24/29 #• | | | 3,405,000 | | | | 3,403,801 | |
| | | | | | | | |
| | | Principal
amount° | | | Value (US $) | |
| | |
Collateralized Debt Obligations (continued) | | | | | | | | |
Apex Credit CLO 2018 | | | | | | | | |
Series2018-1A A2 144A 3.52% (LIBOR03M + 1.03%) 4/25/31 #• | | | 6,200,000 | | | $ | 6,081,692 | |
Atlas Senior Loan Fund X | | | | | | | | |
Series2018-10A A 144A 3.526% (LIBOR03M + 1.09%) 1/15/31 #• | | | 3,400,000 | | | | 3,346,783 | |
Battalion CLO XII | | | | | | | | |
Series2018-12A A1 144A 3.71% (LIBOR03M + 1.07%, Floor 1.07%) 5/17/31 #• | | | 2,600,000 | | | | 2,554,622 | |
Benefit Street Partners CLO II | | | | | | | | |
Series2013-IIA A1R 144A 3.686% (LIBOR03M + 1.25%) 7/15/29 #• | | | 3,000,000 | | | | 2,981,565 | |
Benefit Street Partners CLO IV | | | | | | | | |
Series2014-IVA A1R 144A 3.959% (LIBOR03M + 1.49%) 1/20/29 #• | | | 5,900,000 | | | | 5,897,310 | |
Black Diamond CLO | | | | | | | | |
Series2015-1A A2R 144A 3.858% (LIBOR03M + 1.05%, Floor 1.05%) 10/3/29 #• | | | 2,000,000 | | | | 1,982,006 | |
Series2017-1A A1A 144A 3.777% (LIBOR03M + 1.29%) 4/24/29 #• | | | 2,000,000 | | | | 1,983,032 | |
Cedar Funding IV CLO | | | | | | | | |
Series2014-4A AR 144A 3.707% (LIBOR03M + 1.23%) 7/23/30 #• | | | 3,000,000 | | | | 2,979,123 | |
Cedar Funding VIII CLO | | | | | | | | |
Series2017-8A A1 144A 3.699% (LIBOR03M + 1.25%) 10/17/30 #• | | | 2,420,000 | | | | 2,413,093 | |
CFIP CLO | | | | | | | | |
Series2017-1A A 144A 3.665% (LIBOR03M + 1.22%) 1/18/30 #• | | | 6,300,000 | | | | 6,249,739 | |
ECP CLO | | | | | | | | |
Series2015-7A A1R 144A 3.609% (LIBOR03M + 1.14%) 4/22/30 #• | | | 8,200,000 | | | | 8,066,217 | |
Galaxy XXI CLO | | | | | | | | |
Series2015-21A AR 144A 3.489% (LIBOR03M + 1.02%) 4/20/31 #• | | | 3,000,000 | | | | 2,940,231 | |
GoldenTree Loan Management US CLO 1 | | | | | | | | |
Series2017-1A A 144A 3.689% (LIBOR03M + 1.22%) 4/20/29 #• | | | 2,630,000 | | | | 2,610,646 | |
Hull Street CLO | | | | | | | | |
Series2014-1A AR 144A 3.665% (LIBOR03M + 1.22%) 10/18/26 #• | | | 2,000,000 | | | | 1,999,110 | |
KKR Financial CLO | | | | | | | | |
Series2013-1A A1R 144A 3.726% (LIBOR03M + 1.29%) 4/15/29 #• | | | 3,000,000 | | | | 2,977,500 | |
| | |
| | Diversified Income Series-11 |
Delaware VIP® Diversified Income Series
Schedule of investments (continued)
| | | | | | | | |
| | | Principal amount° | | | Value (US $) | |
| | |
Collateralized Debt Obligations (continued) | | | | | | | | |
Mariner CLO 5 | | | | | | | | |
Series2018-5A A 144A 3.60% (LIBOR03M + 1.11%, Floor 1.11%) 4/25/31 #• | | | 4,600,000 | | | $ | 4,531,055 | |
Midocean Credit CLO IX | | | | | | | | |
Series2018-9A A1 144A 3.397% (LIBOR03M + 1.15%, Floor 1.15%) 7/20/31 #• | | | 3,000,000 | | | | 2,951,316 | |
Midocean Credit CLO VIII | | | | | | | | |
Series2018-8A A1 144A 3.472% (LIBOR03M + 1.15%) 2/20/31 #• | | | 3,000,000 | | | | 2,954,142 | |
MP CLO IV | | | | | | | | |
Series2013-2A ARR 144A 3.77% (LIBOR03M + 1.28%) 7/25/29 #• | | | 2,000,000 | | | | 1,989,796 | |
Northwoods Capital XV | | | | | | | | |
Series2017-15A A 144A 4.092% (LIBOR03M + 1.30%) 6/20/29 #• | | | 2,500,000 | | | | 2,484,635 | |
Northwoods Capital XVII | | | | | | | | |
Series2018-17A A 144A 3.529% (LIBOR03M + 1.06%, Floor 1.06%) 4/22/31 #• | | | 4,500,000 | | | | 4,420,386 | |
OCP CLO | | | | | | | | |
Series2017-13A A1A 144A 3.696% (LIBOR03M + 1.26%) 7/15/30 #• | | | 2,500,000 | | | | 2,483,040 | |
OZLM XVIII | | | | | | | | |
Series2018-18A A 144A 3.456% (LIBOR03M + 1.02%, Floor 1.02%) 4/15/31 #• | | | 3,600,000 | | | | 3,521,966 | |
Saranac CLO VII | | | | | | | | |
Series2014-2A A1AR 144A 3.875% (LIBOR03M + 1.23%) 11/20/29 #• | | | 3,000,000 | | | | 2,978,223 | |
Shackleton CLO | | | | | | | | |
Series2013-3A AR 144A 3.556% (LIBOR03M + 1.12%, Floor 1.12%) 7/15/30 #• | | | 3,000,000 | | | | 2,960,553 | |
Sound Point CLO II | | | | | | | | |
Series2013-1A A1R 144A 3.578% (LIBOR03M + 1.07%, Floor 1.07%) 1/26/31 #• | | | 1,800,000 | | | | 1,769,569 | |
Steele Creek CLO | | | | | | | | |
Series2017-1A A 144A 3.686% (LIBOR03M + 1.25%) 1/15/30 #• | | | 2,000,000 | | | | 1,984,590 | |
TIAA CLO II | | | | | | | | |
Series2017-1A A 144A 3.749% (LIBOR03M + 1.28%) 4/20/29 #• | | | 2,200,000 | | | | 2,189,341 | |
Venture 31 CLO | | | | | | | | |
Series2018-31A A1 144A 3.499% (LIBOR03M + 1.03%, Floor 1.03%) 4/20/31 #• | | | 4,200,000 | | | | 4,118,995 | |
| | | | | | | | |
| | | Principal amount° | | | Value (US $) | |
| | |
Collateralized Debt Obligations (continued) | | | | | | | | |
Venture CDO | | | | | | | | |
Series2016-25A A1 144A 3.959% (LIBOR03M + 1.49%) 4/20/29 #• | | | 980,000 | | | $ | 977,774 | |
Venture XXII CLO | | | | | | | | |
Series2015-22A AR 144A 3.516% (LIBOR03M + 1.08%) 1/15/31 #• | | | 5,000,000 | | | | 4,885,410 | |
Venture XXIV CLO | | | | | | | | |
Series2016-24A A1D 144A 3.889% (LIBOR03M + 1.42%) 10/20/28 #• | | | 2,390,000 | | | | 2,379,534 | |
Venture XXVIII CLO | | | | | | | | |
Series2017-28A A2 144A 3.579% (LIBOR03M + 1.11%) 7/20/30 #• | | | 4,000,000 | | | | 3,919,324 | |
Zais CLO 6 | | | | | | | | |
Series2017-1A A1 144A 3.806% (LIBOR03M + 1.37%) 7/15/29 #• | | | 2,000,000 | | | | 1,993,018 | |
| | | | | | | | |
Total Collateralized Debt Obligations
(cost $121,621,519) | | | | | | | 120,234,650 | |
| | | | | | | | |
| | |
Convertible Bonds – 3.07% | | | | | | | | |
Aerojet Rocketdyne Holdings 2.25% exercise price $26.00, maturity date 12/15/23 | | | 627,000 | | | | 922,945 | |
BioMarin Pharmaceutical 1.50% exercise price $94.15, maturity date 10/15/20 | | | 1,202,000 | | | | 1,340,230 | |
Blackstone Mortgage Trust 4.375% exercise price $35.67, maturity date 5/5/22 | | | 417,000 | | | | 407,870 | |
Blackstone Mortgage Trust 4.75% exercise price $36.23, maturity date 3/15/23 | | | 901,000 | | | | 880,120 | |
Boingo Wireless 144A 1.00% exercise price $42.32, maturity date 10/1/23 # | | | 1,388,000 | | | | 1,178,620 | |
Booking Holdings 0.35% exercise price $1,315.10, maturity date 6/15/20 | | | 1,129,000 | | | | 1,523,432 | |
Cemex 3.72% exercise price $11.01, maturity date 3/15/20 | | | 2,025,000 | | | | 1,979,889 | |
Cemex 3.72% exercise price $11.01, maturity date 3/15/20 | | | 926,000 | | | | 905,815 | |
Chart Industries 144A 1.00% exercise price $58.73, maturity date 11/15/24 # | | | 1,326,000 | | | | 1,651,997 | |
Cheniere Energy 4.25% exercise price $138.38, maturity date 3/15/45 | | | 3,305,000 | | | | 2,315,483 | |
Cree 144A 0.875% exercise price $59.97, maturity date 9/1/23 # | | | 2,337,000 | | | | 2,267,047 | |
CSG Systems International 4.25% exercise price $57.05, maturity date 3/15/36 | | | 1,578,000 | | | | 1,572,060 | |
DISH Network 2.375% exercise price $82.22, maturity date 3/15/24 | | | 1,045,000 | | | | 835,912 | |
| | |
| | Diversified Income Series-12 |
Delaware VIP® Diversified Income Series
Schedule of investments (continued)
| | | | | | | | |
| | | Principal amount° | | | Value (US $) | |
| | |
Convertible Bonds (continued) | | | | | | | | |
DISH Network 3.375% exercise price $65.18, maturity date 8/15/26 | | | 2,448,000 | | | $ | 1,982,919 | |
Dycom Industries 0.75% exercise price $96.89, maturity date 9/15/21 | | | 1,010,000 | | | | 942,812 | |
Empire State Realty OP 144A 2.625% exercise price $19.25, maturity date
8/15/19 # | | | 1,451,000 | | | | 1,446,155 | |
FTI Consulting 144A 2.00% exercise price $101.38, maturity date 8/15/23 # | | | 368,000 | | | | 352,590 | |
GAIN Capital Holdings 5.00% exercise price $8.20, maturity date 8/15/22 | | | 1,874,000 | | | | 1,932,281 | |
GCI Liberty 144A 1.75% exercise price $370.52, maturity date 9/30/46 # | | | 2,058,000 | | | | 2,014,224 | |
Helix Energy Solutions Group 4.125% exercise price $9.47, maturity date 9/15/23 | | | 91,000 | | | | 84,282 | |
Helix Energy Solutions Group 4.25% exercise price $13.89, maturity date 5/1/22 | | | 1,985,000 | | | | 1,841,695 | |
Huron Consulting Group 1.25% exercise price $79.89, maturity date 10/1/19 | | | 1,381,000 | | | | 1,360,133 | |
Insulet 1.25% exercise price $58.37, maturity date 9/15/21 | | | 619,000 | | | | 877,232 | |
Insulet 144A 1.375% exercise price $93.18, maturity date 11/15/24 # | | | 1,121,000 | | | | 1,193,321 | |
Jazz Investments 1.875% exercise price $199.77, maturity date 8/15/21 | | | 1,147,000 | | | | 1,115,203 | |
Knowles 3.25% exercise price $18.43, maturity date 11/1/21 | | | 1,276,000 | | | | 1,318,066 | |
Liberty Media 2.25% exercise price $34.93, maturity date 9/30/46 | | | 2,313,000 | | | | 1,100,063 | |
Ligand Pharmaceuticals 144A 0.75% exercise price $248.48, maturity date 5/15/23 # | | | 1,071,000 | | | | 951,058 | |
Medicines 2.75% exercise price $48.97, maturity date 7/15/23 | | | 2,380,000 | | | | 1,805,575 | |
Medicines 144A 3.50% exercise price $25.19, maturity date 1/15/24 # | | | 360,000 | | | | 357,387 | |
Meritor 3.25% exercise price $39.92, maturity date 10/15/37 | | | 1,242,000 | | | | 1,087,520 | |
Microchip Technology 1.625% exercise price $97.55, maturity date 2/15/27 | | | 1,888,000 | | | | 1,850,085 | |
Neurocrine Biosciences 2.25% exercise price $75.92, maturity date 5/15/24 | | | 978,000 | | | | 1,169,915 | |
New Mountain Finance 5.00% exercise price $15.80, maturity date 6/15/19 | | | 1,131,000 | | | | 1,136,765 | |
Novellus Systems 2.625% exercise price $32.73, maturity date 5/15/41 | | | 341,000 | | | | 1,407,920 | |
NRG Energy 144A 2.75% exercise price $47.74, maturity date 6/1/48 # | | | 1,893,000 | | | | 2,043,266 | |
| | | | | | | | |
| | | Principal amount° | | | Value (US $) | |
| | |
Convertible Bonds (continued) | | | | | | | | |
NXP Semiconductors 1.00% exercise price $102.25, maturity date 12/1/19 | | | 1,028,000 | | | $ | 1,031,090 | |
Pacira Pharmaceuticals 2.375% exercise price $66.89, maturity date 4/1/22 | | | 1,164,000 | | | | 1,157,453 | |
Palo Alto Networks 144A 0.75% exercise price $266.35, maturity date 7/1/23 # | | | 1,516,000 | | | | 1,506,887 | |
Paratek Pharmaceuticals 144A 4.75% exercise price $15.90, maturity date 5/1/24 # | | | 2,685,000 | | | | 2,051,144 | |
PDC Energy 1.125% exercise price $85.39, maturity date 9/15/21 | | | 1,595,000 | | | | 1,421,544 | |
PROS Holdings 2.00% exercise price $48.63, maturity date 6/1/47 | | | 2,230,000 | | | | 2,080,356 | |
Quotient Technology 1.75% exercise price $17.36, maturity date 12/1/22 | | | 1,419,000 | | | | 1,345,354 | |
Retrophin 2.50% exercise price $38.80, maturity date 9/15/25 | | | 408,000 | | | | 366,599 | |
Royal Gold 2.875% exercise price $102.56, maturity date 6/15/19 | | | 2,221,000 | | | | 2,237,746 | |
Spirit Realty Capital 3.75% exercise price $57.48, maturity date 5/15/21 | | | 844,000 | | | | 827,690 | |
Synaptics 0.50% exercise price $73.02, maturity date 6/15/22 | | | 1,542,000 | | | | 1,358,965 | |
Synchronoss Technologies 0.75% exercise price $53.17, maturity date 8/15/19 | | | 739,000 | | | | 714,479 | |
Team 5.00% exercise price $21.70, maturity date 8/1/23 | | | 1,083,000 | | | | 1,081,978 | |
Tesla Energy Operations 1.625% exercise price $759.35, maturity date 11/1/19 | | | 1,567,000 | | | | 1,470,767 | |
Vector Group 1.75% exercise price $21.28, maturity date 4/15/20 • | | | 1,318,000 | | | | 1,327,059 | |
Vector Group 2.50% exercise price $13.81, maturity date 1/15/19 • | | | 1,836,000 | | | | 1,890,621 | |
Verint Systems 1.50% exercise price $64.46, maturity date 6/1/21 | | | 2,090,000 | | | | 2,032,283 | |
Vishay Intertechnology 144A 2.25% exercise price $31.49, maturity date 6/15/25 # | | | 1,534,000 | | | | 1,360,804 | |
| | | | | | | | |
Total Convertible Bonds
(cost $76,317,153) | | | | | | | 72,414,706 | |
| | | | | | | | |
| | |
| | Diversified Income Series-13 |
Delaware VIP® Diversified Income Series
Schedule of investments (continued)
| | | | | | | | | | | | |
| | | | | | Principal | | | Value | |
| | | | | | amount° | | | (US $) | |
| |
Corporate Bonds – 40.60% | | | | | |
Banking – 8.90% | | | | | | | | | |
Akbank T.A.S. 144A 7.20% 3/16/27 #µ | | | | | | | 1,915,000 | | | $ | 1,695,771 | |
ANZ New Zealand International 144A 2.60% 9/23/19 # | | | | | | | 500,000 | | | | 498,420 | |
Banco de Credito e Inversiones 144A 3.50% 10/12/27 # | | | | | | | 1,585,000 | | | | 1,429,472 | |
Banco Santander 3.848% 4/12/23 | | | | | | | 3,600,000 | | | | 3,501,188 | |
Banco Santander Mexico 144A 4.125% 11/9/22 # | | | | | | | 1,915,000 | | | | 1,891,063 | |
Bank of America | | | | | | | | | | | | |
3.30% 8/5/21 | | | AUD | | | | 660,000 | | | | 469,614 | |
3.864% 7/23/24 µ | | | | | | | 6,575,000 | | | | 6,563,005 | |
4.271% 7/23/29 µ | | | | | | | 2,475,000 | | | | 2,467,759 | |
Bank of China 144A 5.00% 11/13/24 # | | | | | | | 1,970,000 | | | | 2,034,387 | |
Bank of Georgia 144A 6.00% 7/26/23 # | | | | | | | 1,625,000 | | | | 1,584,505 | |
Bank of Montreal 3.803% 12/15/32 µ | | | | | | | 1,720,000 | | | | 1,594,870 | |
Barclays 7.75% µy | | | | | | | 1,765,000 | | | | 1,702,201 | |
BB&T 3.75% 12/6/23 | | | | | | | 1,775,000 | | | | 1,790,997 | |
BBVA Bancomer 144A 7.25% 4/22/20 # | | | | | | | 765,000 | | | | 794,070 | |
BNG Bank 3.50% 7/19/27 | | | AUD | | | | 763,000 | | | | 560,712 | |
Branch Banking & Trust | | | | | | | | | | | | |
2.25% 6/1/20 | | | | | | | 2,490,000 | | | | 2,459,191 | |
2.85% 4/1/21 | | | | | | | 1,475,000 | | | | 1,463,828 | |
Citibank 3.40% 7/23/21 | | | | | | | 1,310,000 | | | | 1,312,076 | |
Citigroup | | | | | | | | | | | | |
3.19% (BBSW3M + 1.25%) 8/7/19 • | | | AUD | | | | 1,367,000 | | | | 965,660 | |
3.75% 10/27/23 | | | AUD | | | | 1,493,000 | | | | 1,072,317 | |
Citizens Bank 2.55% 5/13/21 | | | | | | | 840,000 | | | | 822,030 | |
Citizens Financial Group | | | | | | | | | | | | |
2.375% 7/28/21 | | | | | | | 345,000 | | | | 336,298 | |
4.30% 12/3/25 | | | | | | | 2,050,000 | | | | 2,026,169 | |
Compass Bank | | | | | | | | | | | | |
2.875% 6/29/22 | | | | | | | 3,505,000 | | | | 3,361,153 | |
3.875% 4/10/25 | | | | | | | 2,280,000 | | | | 2,189,602 | |
Cooperatieve Rabobank | | | | | | | | | | | | |
2.50% 9/4/20 | | | NOK | | | | 5,290,000 | | | | 623,260 | |
3.375% 4/24/23 | | | NZD | | | | 1,543,000 | | | | 1,061,155 | |
Credit Suisse Group | | | | | | | | | | | | |
144A 6.25% #µy | | | | | | | 5,560,000 | | | | 5,273,827 | |
144A 7.25% #µy | | | | | | | 2,585,000 | | | | 2,445,022 | |
144A 7.50% #µy | | | | | | | 3,235,000 | | | | 3,162,213 | |
DBS Group Holdings 144A 4.52%
12/11/28 #µ | | | | | | | 2,350,000 | | | | 2,406,494 | |
Fifth Third Bancorp | | | | | | | | | | | | |
2.60% 6/15/22 | | | | | | | 1,290,000 | | | | 1,255,848 | |
3.95% 3/14/28 | | | | | | | 5,520,000 | | | | 5,489,701 | |
Fifth Third Bank 2.30% 3/15/19 | | | | | | | 2,165,000 | | | | 2,162,356 | |
Goldman Sachs Group | | | | | | | | | | | | |
3.24% (BBSW3M + 1.30%) 8/21/19 •. | | | AUD | | | | 550,000 | | | | 388,773 | |
3.55% 2/12/21 | | | CAD | | | | 400,000 | | | | 294,969 | |
4.223% 5/1/29 µ | | | | | | | 600,000 | | | | 578,874 | |
5.15% 5/22/45 | | | | | | | 1,305,000 | | | | 1,218,587 | |
5.20% 12/17/19 | | | NZD | | | | 616,000 | | | | 422,402 | |
| | | | | | | | | | | | |
| | | | | | Principal | | | Value | |
| | | | | | amount° | | | (US $) | |
| |
Corporate Bonds (continued) | | | | | |
Banking (continued) | | | | | | | | | |
Goldman Sachs Group 6.00% 6/15/20 | | | | | | | 6,485,000 | | | $ | 6,714,501 | |
HSBC Holdings | | | | | | | | | | | | |
4.292% 9/12/26 µ | | | | | | | 2,490,000 | | | | 2,461,087 | |
6.50% µy | | | | | | | 2,260,000 | | | | 2,056,600 | |
Huntington Bancshares 2.30% 1/14/22 | | | . | | | | 1,595,000 | | | | 1,541,058 | |
Huntington National Bank 2.50% 8/7/22 | | | | | | | 1,505,000 | | | | 1,455,141 | |
ING Groep | | | | | | | | | | | | |
144A 4.625% 1/6/26 # | | | | | | | 2,100,000 | | | | 2,118,298 | |
6.875% µy | | | | | | | 695,000 | | | | 693,263 | |
JPMorgan Chase & Co. | | | | | | | | | | | | |
3.50% 12/18/26 | | | GBP | | | | 264,000 | | | | 365,619 | |
3.797% 7/23/24 µ | | | | | | | 2,025,000 | | | | 2,029,792 | |
4.023% 12/5/24 µ | | | | | | | 1,295,000 | | | | 1,306,812 | |
4.452% 12/5/29 µ | | | | | | | 5,395,000 | | | | 5,497,500 | |
6.75% µy | | | | | | | 4,480,000 | | | | 4,634,560 | |
KeyBank | | | | | | | | | | | | |
2.30% 9/14/22 | | | | | | | 1,990,000 | | | | 1,917,310 | |
3.40% 5/20/26 | | | | | | | 3,545,000 | | | | 3,405,599 | |
6.95% 2/1/28 | | | | | | | 4,255,000 | | | | 5,050,751 | |
Landwirtschaftliche Rentenbank 5.375% 4/23/24 | | | NZD | | | | 1,803,000 | | | | 1,367,887 | |
Lloyds Banking Group 7.50% µy | | | | | | | 3,560,000 | | | | 3,443,588 | |
Morgan Stanley | | | | | | | | | | | | |
3.125% 8/5/21 | | | CAD | | | | 972,000 | | | | 713,165 | |
3.737% 4/24/24 µ | | | | | | | 7,470,000 | | | | 7,420,248 | |
5.00% 9/30/21 | | | AUD | | | | 1,096,000 | | | | 814,620 | |
5.00% 11/24/25 | | | | | | | 2,725,000 | | | | 2,783,881 | |
5.50% 1/26/20 | | | | | | | 1,060,000 | | | | 1,084,239 | |
Nationwide Building Society 144A 4.125% 10/18/32 #µ | | | | | | | 3,915,000 | | | | 3,472,841 | |
Nederlandse Waterschapsbank 144A 2.808% (LIBOR03M + 0.02%) 3/15/19 #• | | | | | | | 1,215,000 | | | | 1,215,174 | |
PNC Bank | | | | | | | | | | | | |
2.70% 11/1/22 | | | | | | | 1,080,000 | | | | 1,050,000 | |
4.05% 7/26/28 | | | | | | | 4,625,000 | | | | 4,654,334 | |
PNC Financial Services Group 5.00% µy | | | | | | | 2,680,000 | | | | 2,472,300 | |
Popular 6.125% 9/14/23 | | | | | | | 680,000 | | | | 676,178 | |
Regions Financial | | | | | | | | | | | | |
2.75% 8/14/22 | | | | | | | 1,180,000 | | | | 1,139,350 | |
3.80% 8/14/23 | | | | | | | 1,565,000 | | | | 1,568,963 | |
Royal Bank of Scotland Group | | | | | | | | | | | | |
3.875% 9/12/23 | | | | | | | 200,000 | | | | 191,928 | |
4.519% 6/25/24 µ | | | | | | | 1,265,000 | | | | 1,242,423 | |
8.625% µy | | | | | | | 4,440,000 | | | | 4,606,500 | |
Santander UK 144A 5.00% 11/7/23 # | | | | | | | 5,380,000 | | | | 5,265,046 | |
Santander UK Group Holdings 4.796% 11/15/24 µ | | | | | | | 255,000 | | | | 253,456 | |
| | |
| | Diversified Income Series-14 |
Delaware VIP® Diversified Income Series
Schedule of investments (continued)
| | | | | | | | | | | | |
| | | | | | Principal | | | Value | |
| | | | | | amount° | | | (US $) | |
| |
Corporate Bonds (continued) | | | | | |
Banking (continued) | | | | | | | | | |
| | | |
Societe Generale 144A 7.375% #µy | | | | | | | 695,000 | | | $ | 678,494 | |
| | | |
State Street | | | | | | | | | | | | |
3.10% 5/15/23 | | | | | | | 1,360,000 | | | | 1,337,426 | |
4.141% 12/3/29 µ | | | | | | | 1,525,000 | | | | 1,577,902 | |
| | | |
SunTrust Banks | | | | | | | | | | | | |
2.45% 8/1/22 | | | | | | | 1,830,000 | | | | 1,765,634 | |
2.70% 1/27/22 | | | | | | | 2,525,000 | | | | 2,464,288 | |
3.00% 2/2/23 | | | | | | | 1,595,000 | | | | 1,564,685 | |
3.30% 5/15/26 | | | | | | | 1,245,000 | | | | 1,181,543 | |
4.00% 5/1/25 | | | | | | | 250,000 | | | | 251,114 | |
| | | |
SVB Financial Group 3.50% 1/29/25 | | | | | | | 1,350,000 | | | | 1,295,239 | |
| | | |
Turkiye Garanti Bankasi | | | | | | | | | | | | |
144A 5.25% 9/13/22 # | | | | | | | 1,400,000 | | | | 1,323,045 | |
144A 6.25% 4/20/21 # | | | | | | | 1,350,000 | | | | 1,344,215 | |
| | | |
UBS Group Funding Switzerland | | | | | | | | | | | | |
144A 4.125% 9/24/25 # | | | | | | | 2,265,000 | | | | 2,252,477 | |
6.875% µy | | | | | | | 5,120,000 | | | | 5,076,529 | |
7.125% µy | | | | | | | 785,000 | | | | 798,050 | |
| | | |
US Bancorp | | | | | | | | | | | | |
2.375% 7/22/26 | | | | | | | 3,520,000 | | | | 3,215,216 | |
3.10% 4/27/26 | | | | | | | 195,000 | | | | 184,915 | |
3.15% 4/27/27 | | | | | | | 4,990,000 | | | | 4,788,189 | |
3.60% 9/11/24 | | | | | | | 2,640,000 | | | | 2,629,126 | |
3.95% 11/17/25 | | | | | | | 4,590,000 | | | | 4,692,787 | |
| | | |
US Bank 3.40% 7/24/23 | | | | | | | 1,505,000 | | | | 1,506,472 | |
| | | |
USB Capital IX 3.50% (LIBOR03M + 1.02%)y• | | | | | | | 7,185,000 | | | | 5,325,881 | |
| | | |
Wells Fargo & Co. | | | | | | | | | | | | |
3.00% 7/27/21 | | | AUD | | | | 1,795,000 | | | | 1,269,315 | |
3.50% 9/12/29 | | | GBP | | | | 654,000 | | | | 893,401 | |
| | | |
Wells Fargo Capital X 5.95% 12/15/36 | | | | | | | 175,000 | | | | 181,563 | |
| | | |
Westpac Banking 5.00% µy | | | | | | | 755,000 | | | | 628,032 | |
| | | |
Woori Bank 144A 4.75% 4/30/24 # | | | | | | | 1,550,000 | | | | 1,568,437 | |
| | | |
Zions Bancorp 4.50% 6/13/23 | | | | | | | 1,895,000 | | | | 1,927,739 | |
| | | | | | | | | | | | |
| | | |
| | | | | | | | | | | 209,775,565 | |
| | | | | | | | | | | | |
| Basic Industry – 3.66% | | | | | | | | | |
| | | |
Alcoa Nederland Holding 144A 6.75% 9/30/24 # | | | | | | | 420,000 | | | | 428,400 | |
| | | |
Anglo American Capital | | | | | | | | | | | | |
144A 4.00% 9/11/27 # | | | | | | | 520,000 | | | | 470,371 | |
144A 4.75% 4/10/27 # | | | | | | | 8,875,000 | | | | 8,512,889 | |
| | | |
BHP Billiton Finance USA 144A 6.25% 10/19/75 #µ | | | | | | | 6,170,000 | | | | 6,315,273 | |
| | | |
BMC East 144A 5.50% 10/1/24 # | | | | | | | 645,000 | | | | 603,881 | |
| | | |
Boise Cascade 144A 5.625% 9/1/24 # | | | | | | | 1,145,000 | | | | 1,079,163 | |
| | | |
Braskem Netherlands Finance | | | | | | | | | | | | |
144A 3.50% 1/10/23 # | | | | | | | 285,000 | | | | 271,252 | |
144A 4.50% 1/10/28 # | | | | | | | 2,765,000 | | | | 2,565,948 | |
| | | |
Builders FirstSource 144A 5.625% 9/1/24 # | | | | | | | 890,000 | | | | 828,813 | |
| | | |
Cleveland-Cliffs 5.75% 3/1/25 | | | | | | | 1,165,000 | | | | 1,051,413 | |
| | | | | | | | | | | | |
| | | | | | Principal | | | Value | |
| | | | | | amount° | | | (US $) | |
| |
Corporate Bonds (continued) | | | | | |
Basic Industry (continued) | | | | | | | | | |
CSN Resources 144A 7.625% 2/13/23 # | | | | | | | 2,010,000 | | | $ | 1,879,350 | |
Cydsa 144A 6.25% 10/4/27 # | | | | | | | 2,090,000 | | | | 1,888,837 | |
Dow Chemical | | | | | | | | | | | | |
144A 4.80% 11/30/28 # | | | | | | | 3,650,000 | | | | 3,723,129 | |
144A 5.55% 11/30/48 # | | | | | | | 2,760,000 | | | | 2,800,323 | |
DowDuPont | | | | | | | | | | | | |
4.205% 11/15/23 | | | | | | | 2,180,000 | | | | 2,231,427 | |
4.725% 11/15/28 | | | | | | | 2,380,000 | | | | 2,473,107 | |
5.419% 11/15/48 | | | | | | | 2,660,000 | | | | 2,777,572 | |
First Quantum Minerals 144A 7.25% 4/1/23 # | | | | | | | 1,925,000 | | | | 1,701,219 | |
Freeport-McMoRan | | | | | | | | | | | | |
4.55% 11/14/24 | | | | | | | 450,000 | | | | 416,813 | |
5.45% 3/15/43 | | | | | | | 620,000 | | | | 475,075 | |
6.875% 2/15/23 | | | | | | | 980,000 | | | | 1,014,300 | |
Georgia-Pacific 8.00% 1/15/24 | | | | | | | 5,305,000 | | | | 6,372,847 | |
HD Supply 144A 5.375% 10/15/26 # | | | | | | | 1,050,000 | | | | 1,022,269 | |
Hudbay Minerals | | | | | | | | | | | | |
144A 7.25% 1/15/23 # | | | | | | | 20,000 | | | | 19,850 | |
144A 7.625% 1/15/25 # | | | | | | | 395,000 | | | | 388,087 | |
Israel Chemicals 144A 6.375% 5/31/38 # | | | | | | | 2,440,000 | | | | 2,446,259 | |
Joseph T Ryerson & Son 144A 11.00% 5/15/22 # | | | | | | | 440,000 | | | | 444,400 | |
Lennar 5.875% 11/15/24 | | | | | | | 180,000 | | | | 180,675 | |
Mexichem 144A 5.50% 1/15/48 # | | | | | | | 2,120,000 | | | | 1,828,500 | |
NOVA Chemicals | | | | | | | | | | | | |
144A 5.00% 5/1/25 # | | | | | | | 602,000 | | | | 544,057 | |
144A 5.25% 6/1/27 # | | | | | | | 460,000 | | | | 408,825 | |
Novelis 144A 6.25% 8/15/24 # | | | | | | | 460,000 | | | | 433,550 | |
Novolipetsk Steel Via Steel Funding DAC 144A 4.00% 9/21/24 # | | | | | | | 1,865,000 | | | | 1,735,271 | |
OCP | | | | | | | | | | | | |
144A 4.50% 10/22/25 # | | | | | | | 1,765,000 | | | | 1,695,685 | |
144A 6.875% 4/25/44 # | | | | | | | 640,000 | | | | 667,427 | |
Olin 5.125% 9/15/27 | | | | | | | 1,110,000 | | | | 1,026,750 | |
Petkim Petrokimya Holding 144A 5.875% 1/26/23 # | | | | | | | 1,765,000 | | | | 1,613,028 | |
Phosagro OAO Via Phosagro Bond | | | | | | | | | | | | |
Funding DAC 144A 3.95% 11/3/21 # | | | | | | | 1,720,000 | | | | 1,672,442 | |
SASOL Financing USA | | | | | | | | | | | | |
5.875% 3/27/24 | | | | | | | 550,000 | | | | 549,414 | |
6.50% 9/27/28 | | | | | | | 595,000 | | | | 596,487 | |
Standard Industries 144A 5.00% 2/15/27 # | | | | | | | 1,355,000 | | | | 1,189,013 | |
Starfruit Finco 144A 8.00% 10/1/26 # | | | | | | | 435,000 | | | | 403,463 | |
Steel Dynamics 5.50% 10/1/24 | | | | | | | 595,000 | | | | 590,537 | |
Suzano Austria 144A 7.00% 3/16/47 # | | | | | | | 1,840,000 | | | | 1,892,440 | |
Syngenta Finance 144A 3.933% 4/23/21 # | | | | | | | 1,615,000 | | | | 1,593,743 | |
| | |
| | Diversified Income Series-15 |
Delaware VIP® Diversified Income Series
Schedule of investments (continued)
| | | | | | | | | | | | |
| | | | | | Principal | | | Value | |
| | | | | | amount° | | | (US $) | |
|
Corporate Bonds (continued) | |
Basic Industry (continued) | |
Syngenta Finance | | | | | | | | | | | | |
144A 4.441% 4/24/23 # | | | | | | | 2,285,000 | | | $ | 2,204,112 | |
144A 5.182% 4/24/28 # | | | | | | | 3,225,000 | | | | 2,997,777 | |
Tronox Finance 144A 5.75% 10/1/25 # | | | | | | | 1,160,000 | | | | 943,950 | |
Vedanta Resources 144A 7.125% 5/31/23 # | | | | | | | 1,345,000 | | | | 1,212,854 | |
Westrock | | | | | | | | | | | | |
144A 4.65% 3/15/26 # | | | | | | | 1,990,000 | | | | 2,024,364 | |
144A 4.90% 3/15/29 # | | | | | | | 3,910,000 | | | | 4,029,180 | |
| | | | | | | | | | | | |
| | | | | | | | | | | 86,235,811 | |
| | | | | | | | | | | | |
| Brokerage – 0.68% | | | | | | | | | |
Charles Schwab | | | | | | | | | | | | |
3.25% 5/21/21 | | | | | | | 1,220,000 | | | | 1,226,314 | |
3.85% 5/21/25 | | | | | | | 1,300,000 | | | | 1,327,694 | |
5.00% µy | | | | | | | 975,000 | | | | 820,463 | |
E*TRADE Financial | | | | | | | | | | | | |
3.80% 8/24/27 | | | | | | | 1,790,000 | | | | 1,693,952 | |
5.30% µy | | | | | | | 60,000 | | | | 49,806 | |
5.875% µy | | | | | | | 1,945,000 | | | | 1,755,363 | |
Intercontinental Exchange | | | | | | | | | | | | |
3.45% 9/21/23 | | | | | | | 590,000 | | | | 592,867 | |
3.75% 9/21/28 | | | | | | | 665,000 | | | | 666,136 | |
4.25% 9/21/48 | | | | | | | 660,000 | | | | 650,913 | |
Jefferies Group | | | | | | | | | | | | |
4.15% 1/23/30 | | | | | | | 2,135,000 | | | | 1,835,918 | |
6.45% 6/8/27 | | | | | | | 893,000 | | | | 935,740 | |
6.50% 1/20/43 | | | | | | | 750,000 | | | | 762,468 | |
Lazard Group | | | | | | | | | | | | |
3.625% 3/1/27 | | | | | | | 475,000 | | | | 447,748 | |
3.75% 2/13/25 | | | | | | | 1,495,000 | | | | 1,452,642 | |
4.50% 9/19/28 | | | | | | | 1,775,000 | | | | 1,779,886 | |
| | | | | | | | | | | | |
| | | | | | | | | | | 15,997,910 | |
| | | | | | | | | | | | |
| Capital Goods – 1.54% | | | | | | | | | |
Anixter 144A 6.00% 12/1/25 # | | | | | | | 455,000 | | | | 452,725 | |
Ardagh Packaging Finance 144A 6.00% 2/15/25 # | | | | | | | 445,000 | | | | 411,901 | |
Ball 5.25% 7/1/25 | | | | | | | 755,000 | | | | 755,000 | |
Bombardier 144A 6.00% 10/15/22 # | | | | | | | 685,000 | | | | 645,613 | |
BWAY Holding 144A 5.50% 4/15/24 # | | | | | | | 1,210,000 | | | | 1,141,937 | |
CCL Industries 144A 3.25% 10/1/26 # | | | | | | | 1,570,000 | | | | 1,467,626 | |
Crane 4.20% 3/15/48 | | | | | | | 1,510,000 | | | | 1,390,576 | |
EnPro Industries 144A 5.75% 10/15/26 # | | | | | | | 450,000 | | | | 435,375 | |
General Electric | | | | | | | | | | | | |
2.10% 12/11/19 | | | | | | | 795,000 | | | | 781,310 | |
2.70% 10/9/22 | | | | | | | 755,000 | | | | 701,163 | |
5.55% 5/4/20 | | | | | | | 1,295,000 | | | | 1,317,432 | |
6.00% 8/7/19 | | | | | | | 2,675,000 | | | | 2,704,242 | |
Grupo Cementos de Chihuahua 144A | | | | | | | | | |
5.25% 6/23/24 # | | | | | | | 1,905,000 | | | | 1,826,438 | |
| | | | | | | | | | | | |
| | | | | | Principal | | | Value | |
| | | | | | amount° | | | (US $) | |
|
Corporate Bonds (continued) | |
Capital Goods (continued) | |
L3 Technologies | | | | | | | | | | | | |
3.85% 6/15/23 | | | | | | | 1,085,000 | | | $ | 1,087,704 | |
4.40% 6/15/28 | | | | | | | 3,195,000 | | | | 3,202,338 | |
Martin Marietta Materials 4.25% 12/15/47 | | | | | | | 1,860,000 | | | | 1,530,285 | |
New Enterprise Stone & Lime 144A 10.125% 4/1/22 # | | | | | | | 1,010,000 | | | | 989,800 | |
Northrop Grumman | | | | | | | | | | | | |
2.55% 10/15/22 | | | | | | | 3,740,000 | | | | 3,625,619 | |
3.25% 8/1/23 | | | | | | | 1,325,000 | | | | 1,305,258 | |
Nvent Finance 4.55% 4/15/28 | | | | | | | 5,990,000 | | | | 5,883,202 | |
TransDigm 6.375% 6/15/26 | | | | | | | 915,000 | | | | 854,381 | |
United Technologies | | | | | | | | | | | | |
3.65% 8/16/23 | | | | | | | 545,000 | | | | 543,402 | |
4.125% 11/16/28 | | | | | | | 3,335,000 | | | | 3,318,200 | |
| | | | | | | | | | | | |
| | | | | | | | | | | 36,371,527 | |
| | | | | | | | | | | | |
| Communications – 4.16% | | | | | |
American Tower Trust #1 144A 3.07% 3/15/23 # | | | | | | | 3,070,000 | | | | 3,025,242 | |
AT&T | | | | | | | | | | | | |
4.50% 3/9/48 | | | | | | | 1,875,000 | | | | 1,622,709 | |
5.25% 3/1/37 | | | | | | | 6,320,000 | | | | 6,230,785 | |
Bell Canada 3.35% 3/22/23 | | | CAD | | | | 773,000 | | | | 566,710 | |
British Telecommunications 4.50% 12/4/23 | | | | | | | 1,175,000 | | | | 1,192,130 | |
C&W Senior Financing 144A 7.50% 10/15/26 # | | | | | | | 1,445,000 | | | | 1,392,619 | |
Charter Communications Operating 5.375% 4/1/38 | | | | | | | 4,390,000 | | | | 4,103,283 | |
Comcast | | | | | | | | | | | | |
3.70% 4/15/24 | | | | | | | 7,050,000 | | | | 7,097,537 | |
4.70% 10/15/48 | | | | | | | 3,310,000 | | | | 3,375,937 | |
Comunicaciones Celulares 144A 6.875% 2/6/24 # | | | | | | | 1,970,000 | | | | 2,012,385 | |
Crown Castle International | | | | | | | | | | | | |
3.80% 2/15/28 | | | | | | | 5,075,000 | | | | 4,771,852 | |
5.25% 1/15/23 | | | | | | | 2,190,000 | | | | 2,276,083 | |
Crown Castle Towers 144A 4.241% 7/15/28 # | | | | | | | 1,180,000 | | | | 1,176,554 | |
Deutsche Telekom International Finance | | | | | | | | | | | | |
1.25% 10/6/23 | | | GBP | | | | 982,000 | | | | 1,212,563 | |
144A 1.95%
9/19/21 # | | | | | | | 1,360,000 | | | | 1,305,675 | |
144A 4.375% 6/21/28 # | | | | | | | 2,515,000 | | | | 2,482,544 | |
6.50% 4/8/22 | | | GBP | | | | 416,000 | | | | 607,638 | |
Digicel Group | | | | | | | | | | | | |
144A 7.125%
4/1/22 # | | | | | | | 2,285,000 | | | | 1,079,663 | |
144A 8.25%
9/30/20 # | | | | | | | 1,125,000 | | | | 765,000 | |
Discovery Communications 5.20% 9/20/47 | | | | | | | 3,960,000 | | | | 3,674,406 | |
Equinix 5.375% 5/15/27 | | | | | | | 850,000 | | | | 833,000 | |
| | |
| | Diversified Income Series-16 |
Delaware VIP® Diversified Income Series
Schedule of investments (continued)
| | | | | | | | | | | | |
| | | | | | Principal | | | Value | |
| | | | | | amount° | | | (US $) | |
|
Corporate Bonds (continued) | |
Communications (continued) | |
GTP Acquisition Partners I 144A 2.35% 6/15/20 # | | | | | | | 1,095,000 | | | $ | 1,077,756 | |
Level 3 Financing 5.375% 5/1/25 | | | | | | | 1,414,000 | | | | 1,329,160 | |
Myriad International Holdings 144A 4.85% 7/6/27 # | | | | | | | 1,365,000 | | | | 1,312,669 | |
SBA Communications 4.875% 9/1/24 | | | | | | | 1,225,000 | | | | 1,156,094 | |
SBA Tower Trust 144A 2.898% 10/15/19 #f | | | | | | | 1,300,000 | | | | 1,292,359 | |
Sprint | | | | | | | | | | | | |
7.125% 6/15/24 | | | | | | | 550,000 | | | | 546,458 | |
7.875% 9/15/23 | | | | | | | 1,995,000 | | | | 2,052,356 | |
Sprint Communications 7.00% 8/15/20 | | | . | | | | 140,000 | | | | 143,682 | |
Sprint Spectrum 144A 4.738% 3/20/25 # | | | | | | | 1,930,000 | | | | 1,898,637 | |
Telecom Italia 144A 5.303% 5/30/24 # | | | | | | | 655,000 | | | | 624,706 | |
Telefonica Emisiones 4.895% 3/6/48 | | | | | | | 2,735,000 | | | | 2,425,898 | |
TELUS 4.60% 11/16/48 | | | | | | | 480,000 | | | | 481,222 | |
Time Warner Cable 7.30% 7/1/38 | | | | | | | 5,775,000 | | | | 6,283,131 | |
Time Warner Entertainment 8.375% 3/15/23 | | | | | | | 2,495,000 | | | | 2,848,765 | |
T-Mobile USA 6.50% 1/15/26 | | | | | | | 920,000 | | | | 940,700 | |
Verizon Communications | | | | | | | | | | | | |
3.25% 2/17/26 | | | EUR | | | | 971,000 | | | | 1,251,598 | |
4.329% 9/21/28 | | | | | | | 1,080,000 | | | | 1,087,246 | |
4.50% 8/17/27 | | | AUD | | | | 2,370,000 | | | | 1,721,220 | |
4.50% 8/10/33 | | | | | | | 5,390,000 | | | | 5,338,922 | |
Viacom 4.375% 3/15/43 | | | | | | | 4,380,000 | | | | 3,488,286 | |
Vodafone Group 3.75% 1/16/24 | | | | | | | 3,650,000 | | | | 3,601,396 | |
VTR Finance 144A 6.875% 1/15/24 # | | | | | | | 1,881,000 | | | | 1,888,054 | |
Warner Media | | | | | | | | | | | | |
3.875% 1/15/26 | | | | | | | 1,210,000 | | | | 1,157,969 | |
4.85% 7/15/45 | | | | | | | 2,175,000 | | | | 1,953,061 | |
Zayo Group | | | | | | | | | | | | |
144A 5.75% 1/15/27 # | | | | | | | 1,065,000 | | | | 953,175 | |
6.375% 5/15/25 | | | | | | | 270,000 | | | | 252,113 | |
| | | | | | | | | | | | |
| | | | | | | | | | | 97,910,948 | |
| | | | | | | | | | | | |
| Consumer Cyclical – 2.04% | | | | | | | | | |
Allison Transmission 144A 5.00% 10/1/24 # | | | | | | | 835,000 | | | | 804,731 | |
AMC Entertainment Holdings 6.125% 5/15/27 | | | | | | | 1,055,000 | | | | 907,300 | |
Atento Luxco 1 144A 6.125% 8/10/22 # | | | | 1,715,000 | | | | 1,663,550 | |
Best Buy 4.45% 10/1/28 | | | | | | | 3,645,000 | | | | 3,485,555 | |
Boyd Gaming 6.375% 4/1/26 | | | | | | | 715,000 | | | | 694,444 | |
Daimler Finance North America 144A 3.35% 2/22/23 # | | | | | | | 1,985,000 | | | | 1,958,932 | |
Dollar Tree | | | | | | | | | | | | |
3.70% 5/15/23 | | | | | | | 2,835,000 | | | | 2,775,057 | |
4.00% 5/15/25 | | | | | | | 1,890,000 | | | | 1,820,266 | |
Ford Motor Credit 4.14% 2/15/23 | | | | | | | 4,780,000 | | | | 4,547,409 | |
General Motors 6.75% 4/1/46 | | | | | | | 670,000 | | | | 651,288 | |
| | | | | | | | | | | | |
| | | | | | Principal | | | Value | |
| | | | | | amount° | | | (US $) | |
|
Corporate Bonds (continued) | |
Consumer Cyclical (continued) | |
General Motors Financial
| | | | | | | | | | | | |
3.45% 1/14/22 | | | | | | | 785,000 | | | $ | 761,193 | |
4.35% 4/9/25 | | | | | | | 3,265,000 | | | | 3,097,897 | |
5.25% 3/1/26 | | | | | | | 4,255,000 | | | | 4,170,785 | |
GLP Capital 5.30% 1/15/29 | | | | | | | 1,160,000 | | | | 1,138,865 | |
Home Depot | | | | | | | | | | | | |
3.90% 12/6/28 | | | | | | | 1,710,000 | | | | 1,754,690 | |
4.50% 12/6/48 | | | | | | | 805,000 | | | | 835,365 | |
Hyundai Capital America 144A 2.55% 2/6/19 # | | | | | | | 685,000 | | | | 684,621 | |
JD.com 3.125% 4/29/21 | | | | | | | 2,985,000 | | | | 2,889,498 | |
KFC Holding 144A 5.25% 6/1/26 # | | | | | | | 1,091,000 | | | | 1,058,303 | |
Levi Strauss & Co. 5.00% 5/1/25 | | | | | | | 490,000 | | | | 481,425 | |
Live Nation Entertainment 144A 5.625% 3/15/26 # | | | | | | | 1,020,000 | | | | 999,600 | |
Lowe’s 4.05% 5/3/47 | | | | | | | 825,000 | | | | 713,686 | |
Marriott International 4.50% 10/1/34 | | | | | | | 410,000 | | | | 392,542 | |
MGM Resorts International 5.75% 6/15/25 | | | | | | | 700,000 | | | | 679,000 | |
Penn National Gaming 144A 5.625% 1/15/27 # | | | | | | | 1,299,000 | | | | 1,165,853 | |
Penske Automotive Group 5.50% 5/15/26 | | | | | | | 1,055,000 | | | | 985,106 | |
Royal Caribbean Cruises 3.70% 3/15/28 | | | | | | | 3,875,000 | | | | 3,572,728 | |
Sands China | | | | | | | | | | | | |
144A 4.60% 8/8/23 # | | | | | | | 765,000 | | | | 761,853 | |
144A 5.125%
8/8/25 # | | | | | | | 1,195,000 | | | | 1,185,419 | |
Scientific Games International 10.00% 12/1/22 | | | | | | | 1,505,000 | | | | 1,529,441 | |
| | | | | | | | | | | | |
| | | | | | | | | | | 48,166,402 | |
| | | | | | | | | | | | |
| ConsumerNon-Cyclical – 3.45% | | | | | |
AbbVie 4.25% 11/14/28 | | | | | | | 3,145,000 | | | | 3,061,138 | |
Air Medical Group Holdings 144A 6.375% 5/15/23 # | | | | | | | 214,000 | | | | 181,900 | |
Amgen 4.00% 9/13/29 | | | GBP | | | | 341,000 | | | | 475,740 | |
Anheuser-Busch 144A 3.65% 2/1/26 # | | | | | | | 4,180,000 | | | | 3,954,740 | |
Archer-Daniels-Midland 4.50% 3/15/49 | | | | | | | 1,265,000 | | | | 1,301,695 | |
AstraZeneca | | | | | | | | | | | | |
3.50% 8/17/23 | | | | | | | 1,240,000 | | | | 1,234,723 | |
4.00% 1/17/29 | | | | | | | 2,925,000 | | | | 2,887,033 | |
BAT Capital 2.297% 8/14/20 | | | | | | | 480,000 | | | | 468,745 | |
Bat Capital 3.222% 8/15/24 | | | | | | | 3,805,000 | | | | 3,508,678 | |
Bayer US Finance II | | | | | | | | | | | | |
144A 4.25% 12/15/25 # | | | | | | | 1,050,000 | | | | 1,023,918 | |
144A 4.375% 12/15/28 # | | | | | | | 4,470,000 | | | | 4,278,865 | |
Bunge Finance 4.35% 3/15/24 | | | | | | | 2,955,000 | | | | 2,906,573 | |
Campbell Soup 3.65% 3/15/23 | | | | | | | 3,885,000 | | | | 3,792,096 | |
CK Hutchison International 17 144A 2.875%
4/5/22 # | | | | | | | 2,605,000 | | | | 2,558,658 | |
| | |
| | Diversified Income Series-17 |
Delaware VIP® Diversified Income Series
Schedule of investments (continued)
| | | | | | | | | | | | |
| | | | | | Principal | | | Value | |
| | | | | | amount° | | | (US $) | |
|
Corporate Bonds (continued) | |
ConsumerNon-Cyclical (continued) | |
Conagra Brands | |
4.30% 5/1/24 | | | | | | | 3,945,000 | | | $ | 3,925,537 | |
4.60% 11/1/25 | | | | | | | 1,090,000 | | | | 1,095,497 | |
5.30% 11/1/38 | | | | | | | 1,920,000 | | | | 1,821,635 | |
Cott Holdings 144A 5.50% 4/1/25 # | | | | | | | 645,000 | | | | 610,331 | |
CVS Health 4.30% 3/25/28 | | | | | | | 9,975,000 | | | | 9,785,788 | |
General Mills 3.70% 10/17/23 | | | | | | | 2,310,000 | | | | 2,298,870 | |
JBS Investments 144A 7.25%
4/3/24 # | | | | | | | 1,160,000 | | | | 1,173,642 | |
JBS USA | | | | | | | | | | | | |
144A 5.75%
6/15/25 # | | | | | | | 1,015,000 | | | | 973,131 | |
144A 6.75%
2/15/28 # | | | | | | | 1,220,000 | | | | 1,194,075 | |
Kernel Holding 144A 8.75% 1/31/22 # | | | | | | | 1,990,000 | | | | 1,913,560 | |
Marfrig Holdings Europe 144A 8.00% 6/8/23 # | | | | | | | 2,155,000 | | | | 2,168,469 | |
MHP | | | | | | | | | | | | |
144A 6.95%
4/3/26 # | | | | | | | 1,085,000 | | | | 938,091 | |
144A 7.75%
5/10/24 # | | | | | | | 1,430,000 | | | | 1,331,299 | |
Mylan 144A 4.55% 4/15/28 # | | | | | | | 1,920,000 | | | | 1,793,846 | |
Nestle Holdings 144A 4.00% 9/24/48 # | | | | | | | 2,135,000 | | | | 2,102,444 | |
New York and Presbyterian Hospital 4.063% 8/1/56 | | | | | | | 1,630,000 | | | | 1,580,806 | |
Pernod Ricard 144A 4.45% 1/15/22 # | | | | | | | 1,780,000 | | | | 1,816,721 | |
Pilgrim’s Pride 144A 5.75% 3/15/25 # | | | | | | | 805,000 | | | | 758,713 | |
Post Holdings 144A 5.75% 3/1/27 # | | | | | | | 720,000 | | | | 678,600 | |
Rede D’or Finance 144A 4.95%
1/17/28 # | | | | | | | 2,470,000 | | | | 2,189,037 | |
Takeda Pharmaceutical 144A 4.40% 11/26/23 # | | | | | | | 3,985,000 | | | | 4,032,723 | |
Teva Pharmaceutical Finance | | | | | | | | | | | | |
Netherlands III 6.75% 3/1/28 | | | | | | | 1,785,000 | | | | 1,733,369 | |
Zimmer Biomet Holdings 4.625% 11/30/19 | | | | | | | 3,645,000 | | | | 3,688,226 | |
| | | | | | | | | | | | |
| | | | | | | | | | | 81,238,912 | |
| | | | | | | | | | | | |
| Electric – 4.42% | | | | | | | | | | | | |
AES Gener 144A 8.375% 12/18/73 #µ | | | | | | | 1,835,000 | | | | 1,838,083 | |
American Transmission Systems 144A 5.25% 1/15/22 # | | | | | | | 5,410,000 | | | | 5,688,836 | |
Atlantic City Electric 4.00% 10/15/28 | | | | | | | 645,000 | | | | 664,638 | |
Ausgrid Finance Pty | | | | | | | | | | | | |
144A 3.85%
5/1/23 # | | | | | | | 2,455,000 | | | | 2,451,823 | |
144A 4.35%
8/1/28 # | | | | | | | 1,795,000 | | | | 1,793,639 | |
Avangrid 3.15% 12/1/24 | | | | | | | 1,090,000 | | | | 1,053,354 | |
Berkshire Hathaway Energy 3.75% 11/15/23 | | | | | | | 3,280,000 | | | | 3,328,473 | |
CenterPoint Energy | | | | | | | | | | | | |
3.85% 2/1/24 | | | | | | | 1,645,000 | | | | 1,654,740 | |
4.25% 11/1/28 | | | | | | | 2,365,000 | | | | 2,402,733 | |
6.125% µy | | | | | | | 2,240,000 | | | | 2,186,800 | |
Cleveland Electric Illuminating 5.50% 8/15/24 | | | | | | | 365,000 | | | | 390,576 | |
ComEd Financing III 6.35% 3/15/33 | | | | | | | 2,055,000 | | | | 2,132,145 | |
| | | | | | | | | | | | |
| | | | | | Principal | | | Value | |
| | | | | | amount° | | | (US $) | |
|
Corporate Bonds (continued) | |
Electric (continued) | |
Consumers Energy | | | | | | | | | | | | |
3.80% 11/15/28 | | | | | | | 970,000 | | | $ | 994,446 | |
4.35% 4/15/49 | | | | | | | 940,000 | | | | 980,203 | |
DTE Energy 3.30% 6/15/22 | | | | | | | 1,810,000 | | | | 1,797,465 | |
Duke Energy Carolinas 3.95% 11/15/28 | | | | | | | 2,345,000 | | | | 2,406,403 | |
Electricite de France | | | | | | | | | | | | |
144A 4.50% 9/21/28 # | | | | | | | 2,845,000 | | | | 2,762,366 | |
144A 5.00% 9/21/48 # | | | | | | | 2,035,000 | | | | 1,809,499 | |
Emera 6.75% 6/15/76 µ | | | | | | | 4,545,000 | | | | 4,576,451 | |
Enel 144A 8.75%
9/24/73 #µ | | | | | | | 2,927,000 | | | | 3,000,175 | |
Enel Finance International | | | | | | | | | | | | |
144A 3.625% 5/25/27 # | | | | | | | 3,205,000 | | | | 2,833,817 | |
144A 4.625% 9/14/25 # | | | | | | | 400,000 | | | | 384,506 | |
Engie Energia Chile 144A 4.50% 1/29/25 # | | | | | | | 470,000 | | | | 454,845 | |
Entergy Louisiana | | | | | | | | | | | | |
4.05% 9/1/23 | | | | | | | 4,045,000 | | | | 4,151,079 | |
4.95% 1/15/45 | | | | | | | 545,000 | | | | 557,698 | |
Eskom Holdings SOC 144A 6.35% 8/10/28 # | | | | | | | 1,605,000 | | | | 1,550,327 | |
Evergy 4.85% 6/1/21 | | | | | | | 1,195,000 | | | | 1,226,614 | |
Exelon | | | | | | | | | | | | |
3.497% 6/1/22 | | | | | | | 2,700,000 | | | | 2,640,398 | |
3.95% 6/15/25 | | | | | | | 1,045,000 | | | | 1,034,930 | |
Interstate Power & Light 4.10% 9/26/28 | | | | | | | 5,425,000 | | | | 5,558,092 | |
Israel Electric 144A 5.00% 11/12/24 # | | | | | | | 1,110,000 | | | | 1,120,856 | |
Kallpa Generacion 144A 4.125% 8/16/27 # | | | | | | | 2,485,000 | | | | 2,304,862 | |
Kansas City Power & Light 3.65% 8/15/25 | | | | | | | 3,445,000 | | | | 3,431,101 | |
LG&E & KU Energy 4.375% 10/1/21 | | | | | | | 3,765,000 | | | | 3,828,222 | |
Mississippi Power 3.95% 3/30/28 | | | | | | | 2,170,000 | | | | 2,146,875 | |
National Rural Utilities Cooperative Finance | | | | | | | | | | | | |
4.75% 4/30/43 µ | | | | | | | 2,830,000 | | | | 2,715,640 | |
5.25% 4/20/46 µ | | | | | | | 990,000 | | | | 983,183 | |
Nevada Power 2.75% 4/15/20 | | | | | | | 2,355,000 | | | | 2,349,792 | |
New York State Electric & Gas 144A 3.25% 12/1/26 # | | | | | | | 2,495,000 | | | | 2,423,072 | |
Newfoundland & Labrador Hydro 3.60% 12/1/45 | | | CAD | | | | 400,000 | | | | 298,119 | |
NV Energy 6.25% 11/15/20 | | | | | | | 2,380,000 | | | | 2,501,180 | |
Oglethorpe Power 144A 5.05% 10/1/48 # | | | | | | | 2,895,000 | | | | 2,908,082 | |
Pacific Gas & Electric 3.95% 12/1/47 | | | | | | | 645,000 | | | | 493,776 | |
Pennsylvania Electric 5.20% 4/1/20 | | | | | | | 220,000 | | | | 225,541 | |
Perusahaan Listrik Negara | | | | | | | | | | | | |
144A 4.125% 5/15/27 # | | | | | | | 475,000 | | | | 440,652 | |
144A 5.25% 5/15/47 # | | | | | | | 1,455,000 | | | | 1,310,227 | |
| | |
| | Diversified Income Series-18 |
Delaware VIP® Diversified Income Series
Schedule of investments (continued)
| | | | | | | | |
| | | Principal | | | Value | |
| | | amount° | | | (US $) | |
|
Corporate Bonds (continued) | |
Electric (continued) | |
PSEG Power 3.85% 6/1/23 | | | 2,475,000 | | | $ | 2,479,359 | |
Public Service Co. of Oklahoma 5.15% 12/1/19 | | | 1,705,000 | | | | 1,736,776 | |
Southwestern Electric Power 4.10% 9/15/28 | | | 4,860,000 | | | | 4,884,055 | |
Trans-Allegheny Interstate Line 144A 3.85% 6/1/25 # | | | 1,190,000 | | | | 1,187,158 | |
| | | | | | | | |
| | | | | | | 104,073,682 | |
| | | | | | | | |
| Energy – 4.24% | | | | | | | | |
Abu Dhabi Crude Oil Pipeline 144A 4.60% 11/2/47 # | | | 1,800,000 | | | | 1,762,191 | |
Alta Mesa Holdings 7.875% 12/15/24 | | | 1,075,000 | | | | 671,875 | |
AmeriGas Partners 5.875% 8/20/26 | | | 785,000 | | | | 720,237 | |
BP Capital Markets America 3.796% 9/21/25 | | | 4,525,000 | | | | 4,552,766 | |
Cheniere Corpus Christi Holdings 5.875% 3/31/25 | | | 710,000 | | | | 708,225 | |
Cheniere Energy Partners 5.25% 10/1/25 | | | 415,000 | | | | 388,544 | |
Chesapeake Energy 8.00% 1/15/25 | | | 600,000 | | | | 532,500 | |
Crestwood Midstream Partners 5.75% 4/1/25 | | | 1,050,000 | | | | 979,125 | |
Diamond Offshore Drilling 7.875% 8/15/25 | | | 740,000 | | | | 617,900 | |
Enbridge | | | | | | | | |
6.00% 1/15/77 µ | | | 1,585,000 | | | | 1,432,914 | |
6.25% 3/1/78 µ | | | 1,150,000 | | | | 1,037,816 | |
Enbridge Energy Partners | | | | | | | | |
4.375% 10/15/20 | | | 480,000 | | | | 485,718 | |
5.20% 3/15/20 | | | 250,000 | | | | 255,386 | |
5.50% 9/15/40 | | | 830,000 | | | | 862,984 | |
Energy Transfer Operating | | | | | | | | |
6.625% µy | | | 3,355,000 | | | | 2,774,166 | |
9.70% 3/15/19 | | | 2,189,000 | | | | 2,215,120 | |
Ensco 7.75% 2/1/26 | | | 740,000 | | | | 551,300 | |
Enterprise Products Operating 4.80% 2/1/49 | | | 835,000 | | | | 815,468 | |
Gazprom OAO Via Gaz Capital 144A 4.95% 3/23/27 # | | | 2,440,000 | | | | 2,333,174 | |
Genesis Energy 6.75% 8/1/22 | | | 615,000 | | | | 602,700 | |
Geopark 144A 6.50% 9/21/24 # | | | 1,640,000 | | | | 1,523,150 | |
Gulfport Energy 6.625% 5/1/23 | | | 595,000 | | | | 565,250 | |
KazMunayGas National 144A 6.375% 10/24/48 # | | | 1,865,000 | | | | 1,882,251 | |
KazTransGas 144A 4.375% 9/26/27 # | | | 1,465,000 | | | | 1,363,055 | |
Kinder Morgan 5.20% 3/1/48 | | | 3,105,000 | | | | 2,982,677 | |
Kunlun Energy 144A 2.875% 5/13/20 # | | | 850,000 | | | | 843,973 | |
Laredo Petroleum 6.25% 3/15/23 | | | 700,000 | | | | 631,750 | |
Marathon Oil 4.40% 7/15/27 | | | 4,475,000 | | | | 4,261,917 | |
MPLX 4.80% 2/15/29 | | | 1,730,000 | | | | 1,730,241 | |
| | | | | | | | |
| | | Principal | | | Value | |
| | | amount° | | | (US $) | |
|
Corporate Bonds (continued) | |
Energy (continued) | |
MPLX | | | | | | | | |
4.875% 12/1/24 | | | 4,195,000 | | | $ | 4,275,150 | |
5.50% 2/15/49 | | | 1,625,000 | | | | 1,588,406 | |
Murphy Oil 6.875% 8/15/24 | | | 1,695,000 | | | | 1,689,962 | |
Murphy Oil USA | | | | | | | | |
5.625% 5/1/27 | | | 775,000 | | | | 747,875 | |
6.00% 8/15/23 | | | 1,380,000 | | | | 1,392,075 | |
Nabors Industries 5.75% 2/1/25 | | | 850,000 | | | | 645,875 | |
NiSource 144A 5.65% #µy | | | 2,080,000 | | | | 1,937,000 | |
Noble Energy | | | | | | | | |
3.85% 1/15/28 | | | 2,620,000 | | | | 2,376,453 | |
3.90% 11/15/24 | | | 1,350,000 | | | | 1,309,307 | |
4.95% 8/15/47 | | | 885,000 | | | | 769,396 | |
5.05% 11/15/44 | | | 665,000 | | | | 575,420 | |
NuStar Logistics 5.625% 4/28/27 | | | 745,000 | | | | 697,506 | |
Oasis Petroleum 144A 6.25% 5/1/26 # | | | 655,000 | | | | 551,837 | |
ONEOK 7.50% 9/1/23 | | | 3,525,000 | | | | 4,008,967 | |
Pertamina Persero 144A 4.875% 5/3/22 # | | | 320,000 | | | | 324,364 | |
Petrobras Global Finance | | | | | | | | |
7.25% 3/17/44 | | | 1,035,000 | | | | 1,023,237 | |
7.375% 1/17/27 | | | 1,250,000 | | | | 1,286,875 | |
Petroleos Mexicanos | | | | | | | | |
6.50% 3/13/27 | | | 865,000 | | | | 815,263 | |
6.75% 9/21/47 | | | 409,000 | | | | 339,220 | |
Precision Drilling | | | | | | | | |
144A 7.125% 1/15/26 # | | | 420,000 | | | | 363,300 | |
7.75% 12/15/23 | | | 625,000 | | | | 578,906 | |
QEP Resources | | | | | | | | |
5.25% 5/1/23 | | | 1,120,000 | | | | 996,800 | |
5.625% 3/1/26 | | | 295,000 | | | | 245,956 | |
Sabine Pass Liquefaction | | | | | | | | |
5.625% 3/1/25 | | | 3,865,000 | | | | 4,020,249 | |
5.75% 5/15/24 | | | 2,880,000 | | | | 3,021,881 | |
5.875% 6/30/26 | | | 2,220,000 | | | | 2,354,973 | |
Sempra Energy 3.80% 2/1/38 | | | 1,845,000 | | | | 1,590,837 | |
Shell International Finance 4.375% 5/11/45 | | | 469,000 | | | | 483,856 | |
Southwestern Energy 7.75% 10/1/27 | | | 430,000 | | | | 410,650 | |
Summit Midstream Holdings 5.75% 4/15/25 | | | 450,000 | | | | 416,250 | |
Targa Resources Partners 5.375% 2/1/27 | | | 855,000 | | | | 805,837 | |
Tecpetrol 144A 4.875%
12/12/22 # | | | 3,140,000 | | | | 2,904,500 | |
TransCanada PipeLines 5.10% 3/15/49 | | | 1,445,000 | | | | 1,442,093 | |
Transcanada Trust 5.875% 8/15/76 µ | | | 1,475,000 | | | | 1,391,073 | |
Transcontinental Gas Pipe Line 4.60% 3/15/48 | | | 1,295,000 | | | | 1,217,230 | |
Transocean 144A 9.00%
7/15/23 # | | | 170,000 | | | | 169,787 | |
Transocean Proteus 144A 6.25% 12/1/24 # | | | 632,000 | | | | 608,300 | |
| | |
| | Diversified Income Series-19 |
Delaware VIP® Diversified Income Series
Schedule of investments (continued)
| | | | | | | | |
| | | Principal | | | Value | |
| | | amount° | | | (US $) | |
|
Corporate Bonds (continued) | |
Energy (continued) | |
Transportadora de Gas del Sur 144A 6.75% 5/2/25 # | | | 1,305,000 | | | $ | 1,190,826 | |
Tullow Oil 144A 7.00% 3/1/25 # | | | 2,375,000 | | | | 2,214,687 | |
Whiting Petroleum 6.625% 1/15/26 | | | 380,000 | | | | 327,750 | |
Williams | | | | | | | | |
3.75% 6/15/27 | | | 1,110,000 | | | | 1,054,274 | |
4.55% 6/24/24 | | | 1,445,000 | | | | 1,460,612 | |
4.85% 3/1/48 | | | 2,115,000 | | | | 1,932,792 | |
YPF | | | | | | | | |
144A 7.00% 12/15/47 # | | | 1,410,000 | | | | 1,015,200 | |
144A 51.00% (BADLARPP + 4.00%) 7/7/20 #• | | | 3,175,000 | | | | 1,290,320 | |
| | | | | | | | |
| | | | | | | 99,947,500 | |
| | | | | | | | |
| Finance Companies – 1.09% | |
AerCap Global Aviation Trust 144A 6.50% 6/15/45 #µ | | | 1,955,000 | | | | 1,906,125 | |
AerCap Ireland Capital 3.65% 7/21/27 | | | 7,800,000 | | | | 6,772,117 | |
Air Lease | | | | | | | | |
3.00% 9/15/23 | | | 1,620,000 | | | | 1,522,753 | |
3.625% 4/1/27 | | | 3,080,000 | | | | 2,760,988 | |
Aviation Capital Group | | | | | | | | |
144A 3.50% 11/1/27 # | | | 985,000 | | | | 891,938 | |
144A 4.875% 10/1/25 # | | | 2,480,000 | | | | 2,481,578 | |
BOC Aviation 144A 2.375% 9/15/21 # | | | 2,120,000 | | | | 2,045,457 | |
Equate Petrochemical 144A 3.00% 3/3/22 # | | | 1,370,000 | | | | 1,327,023 | |
GE Capital International Funding Co. Unlimited 4.418% 11/15/35 | | | 755,000 | | | | 636,974 | |
International Lease Finance 8.625% 1/15/22 | | | 3,390,000 | | | | 3,771,232 | |
Temasek Financial I 144A 2.375% 1/23/23 # | | | 1,615,000 | | | | 1,565,402 | |
| | | | | | | | |
| | | | | | | 25,681,587 | |
| | | | | | | | |
| Healthcare – 0.62% | |
Bausch Health 144A 5.50% 11/1/25 # | | | 420,000 | | | | 393,225 | |
Charles River Laboratories International 144A 5.50% 4/1/26 # | | | 795,000 | | | | 785,063 | |
DaVita 5.00% 5/1/25 | | | 656,000 | | | | 597,780 | |
Encompass Health | | | | | | | | |
5.75% 11/1/24 | | | 1,165,000 | | | | 1,157,719 | |
5.75% 9/15/25 | | | 610,000 | | | | 597,800 | |
HCA | | | | | | | | |
5.375% 2/1/25 | | | 1,295,000 | | | | 1,265,863 | |
5.875% 2/15/26 | | | 1,225,000 | | | | 1,221,937 | |
7.58% 9/15/25 | | | 80,000 | | | | 85,200 | |
Hill-Rom Holdings 144A 5.75% 9/1/23 # | | | 765,000 | | | | 767,869 | |
MPH Acquisition Holdings 144A 7.125% 6/1/24 # | | | 855,000 | | | | 799,425 | |
Tenet Healthcare 5.125% 5/1/25 | | | 1,370,000 | | | | 1,280,950 | |
| | | | | | | | |
| | | Principal | | | Value | |
| | | amount° | | | (US $) | |
|
Corporate Bonds (continued) | |
Healthcare (continued) | |
Teva Pharmaceutical Finance Netherlands III 6.00% 4/15/24 | | | 1,640,000 | | | $ | 1,583,665 | |
UnitedHealth Group | | | | | | | | |
3.50% 2/15/24 | | | 1,225,000 | | | | 1,233,615 | |
3.70% 12/15/25 | | | 815,000 | | | | 824,278 | |
Universal Health Services 144A 5.00% 6/1/26 # | | | 485,000 | | | | 472,875 | |
WellCare Health Plans 144A 5.375% 8/15/26 # | | | 1,645,000 | | | | 1,591,537 | |
| | | | | | | | |
| | | | | | | 14,658,801 | |
| | | | | | | | |
| Insurance – 1.90% | |
Acrisure 144A 7.00% 11/15/25 # | | | 851,000 | | | | 729,733 | |
AssuredPartners 144A 7.00% 8/15/25 # | | | 1,264,000 | | | | 1,145,538 | |
Aviation Capital Group 144A 4.375% 1/30/24 # | | | 2,790,000 | | | | 2,796,560 | |
AXA Equitable Holdings | | | | | | | | |
144A 4.35% 4/20/28 # | | | 980,000 | | | | 928,391 | |
144A 5.00% 4/20/48 # | | | 2,325,000 | | | | 2,047,492 | |
Brighthouse Financial | | | | | | | | |
3.70% 6/22/27 | | | 1,430,000 | | | | 1,211,096 | |
4.70% 6/22/47 | | | 2,455,000 | | | | 1,836,262 | |
Cigna | | | | | | | | |
144A 3.326% (LIBOR03M + 0.89%) 7/15/23 #• | | | 1,770,000 | | | | 1,744,113 | |
144A 4.125% 11/15/25 # | | | 3,895,000 | | | | 3,897,096 | |
144A 4.375% 10/15/28 # | | | 1,955,000 | | | | 1,970,912 | |
HUB International 144A 7.00% 5/1/26 # | | | 215,000 | | | | 195,650 | |
MetLife | | | | | | | | |
3.60% 4/10/24 | | | 2,525,000 | | | | 2,544,027 | |
6.40% 12/15/36 | | | 110,000 | | | | 112,020 | |
144A 9.25% 4/8/38 # | | | 2,655,000 | | | | 3,358,575 | |
NFP 144A 6.875% 7/15/25 # | | | 2,645,000 | | | | 2,380,500 | |
Nuveen Finance 144A 4.125% 11/1/24 # | | | 1,615,000 | | | | 1,647,022 | |
Progressive 4.00% 3/1/29 | | | 2,335,000 | | | | 2,406,774 | |
Prudential Financial | | | | | | | | |
4.50% 11/15/20 | | | 795,000 | | | | 813,425 | |
5.375% 5/15/45 µ | | | 1,730,000 | | | | 1,625,508 | |
USIS Merger Sub 144A 6.875% 5/1/25 # | | | 3,663,000 | | | | 3,375,308 | |
Voya Financial 4.70% 1/23/48 µ | | | 2,160,000 | | | | 1,703,961 | |
Willis North America | | | | | | | | |
3.60% 5/15/24 | | | 575,000 | | | | 562,044 | |
4.50% 9/15/28 | | | 2,355,000 | | | | 2,342,516 | |
XLIT | | | | | | | | |
4.894% (LIBOR03M + 2.458%)y• | | | 1,325,000 | | | | 1,239,643 | |
5.50% 3/31/45 | | | 1,980,000 | | | | 2,057,156 | |
| | | | | | | | |
| | | | | | | 44,671,322 | |
| | | | | | | | |
| Media – 0.48% | | | | | | | | |
Altice France 144A 6.25% 5/15/24 # | | | 1,030,000 | | | | 964,337 | |
| | |
| | Diversified Income Series-20 |
Delaware VIP® Diversified Income Series
Schedule of investments (continued)
| | | | | | | | |
| | | Principal | | | Value | |
| | | amount° | | | (US $) | |
|
Corporate Bonds (continued) | |
Media (continued) | |
Altice Luxembourg 144A 7.75% 5/15/22 # | | | 915,000 | | | $ | 836,081 | |
AMC Networks 4.75% 8/1/25 | | | 540,000 | | | | 491,400 | |
CCO Holdings 144A 5.125% 5/1/27 # | | | 720,000 | | | | 672,408 | |
CSC Holdings 144A 7.75% 7/15/25 # | | | 1,080,000 | | | | 1,101,600 | |
Gray Television 144A 5.875% 7/15/26 # . | | | 885,000 | | | | 827,298 | |
Lamar Media 5.375% 1/15/24 | | | 910,000 | | | | 914,550 | |
Netflix 144A 5.875% 11/15/28 # | | | 930,000 | | | | 908,545 | |
Sirius XM Radio | | | | | | | | |
144A 5.00% 8/1/27 # | | | 510,000 | | | | 467,925 | |
144A 5.375% 4/15/25 # | | | 756,000 | | | | 719,145 | |
Tribune Media 5.875% 7/15/22 | | | 622,000 | | | | 628,220 | |
Unitymedia 144A 6.125% 1/15/25 # | | | 480,000 | | | | 484,752 | |
UPCB Finance IV 144A 5.375% 1/15/25 # | | | 1,198,000 | | | | 1,123,269 | |
Virgin Media Secured Finance 144A 5.25% 1/15/26 # | | | 1,340,000 | | | | 1,232,800 | |
| | | | | | | | |
| | | | | | | 11,372,330 | |
| | | | | | | | |
| Real Estate Investment Trusts – 0.76% | |
Corporate Office Properties | |
3.60% 5/15/23 | | | 1,750,000 | | | | 1,699,724 | |
5.25% 2/15/24 | | | 1,755,000 | | | | 1,821,254 | |
CubeSmart 3.125% 9/1/26 | | | 1,825,000 | | | | 1,677,297 | |
ESH Hospitality 144A 5.25% 5/1/25 # | | | 995,000 | | | | 927,837 | |
Growthpoint Properties International 144A 5.872% 5/2/23 # | | | 1,520,000 | | | | 1,523,800 | |
Hospitality Properties Trust 4.50% 3/15/25 | | | 2,025,000 | | | | 1,975,734 | |
Host Hotels & Resorts | | | | | | | | |
3.75% 10/15/23 | | | 710,000 | | | | 697,110 | |
3.875% 4/1/24 | | | 890,000 | | | | 878,966 | |
4.50% 2/1/26 | | | 1,680,000 | | | | 1,671,960 | |
Kilroy Realty 3.45% 12/15/24 | | | 1,960,000 | | | | 1,896,201 | |
Life Storage 3.50% 7/1/26 | | | 1,620,000 | | | | 1,521,902 | |
WP Carey 4.60% 4/1/24 | | | 1,680,000 | | | | 1,706,787 | |
| | | | | | | | |
| | | | | | | 17,998,572 | |
| | | | | | | | |
| Services – 0.28% | | | | | | | | |
Advanced Disposal Services 144A 5.625% 11/15/24 # | | | 650,000 | | | | 638,625 | |
Aramark Services 144A 5.00% 2/1/28 # | | | 745,000 | | | | 696,575 | |
Ashtead Capital 144A 5.25% 8/1/26 # | | | 885,000 | | | | 858,450 | |
Avis Budget Car Rental 144A 6.375% 4/1/24 # | | | 385,000 | | | | 369,600 | |
Covanta Holding 5.875% 7/1/25 | | | 600,000 | | | | 554,250 | |
GEO Group | | | | | | | | |
5.125% 4/1/23 | | | 390,000 | | | | 352,463 | |
6.00% 4/15/26 | | | 130,000 | | | | 114,563 | |
Iron Mountain US Holdings 144A 5.375% 6/1/26 # | | | 995,000 | | | | 910,425 | |
KAR Auction Services 144A 5.125% 6/1/25 # | | | 468,000 | | | | 424,710 | |
| | | | | | | | |
| | | Principal | | | Value | |
| | | amount° | | | (US $) | |
|
Corporate Bonds (continued) | |
Services (continued) | |
Prime Security Services Borrower 144A 9.25% 5/15/23 # | | | 562,000 | | | $ | 580,967 | |
United Rentals North America 5.50% 5/15/27 | | | 755,000 | | | | 702,150 | |
WeWork 144A 7.875% 5/1/25 # | | | 540,000 | | | | 481,950 | |
| | | | | | | | |
| | | | | | | 6,684,728 | |
| | | | | | | | |
| Technology – 1.30% | | | | | | | | |
Baidu 4.375% 3/29/28 | | | 2,085,000 | | | | 2,047,789 | |
Broadcom 3.50% 1/15/28 | | | 6,145,000 | | | | 5,337,215 | |
CDK Global | | | | | | | | |
4.875% 6/1/27 | | | 1,105,000 | | | | 1,030,413 | |
5.00% 10/15/24 | | | 2,275,000 | | | | 2,235,187 | |
CDW Finance 5.00% 9/1/25 | | | 800,000 | | | | 769,000 | |
CommScope Technologies 144A 5.00% 3/15/27 # | | | 1,696,000 | | | | 1,378,000 | |
Corning | | | | | | | | |
4.375% 11/15/57 | | | 1,105,000 | | | | 928,585 | |
5.35% 11/15/48 | | | 1,205,000 | | | | 1,228,549 | |
Dell International 144A 6.02% 6/15/26 # | | | 1,740,000 | | | | 1,751,187 | |
First Data 144A 5.75% 1/15/24 # | | | 605,000 | | | | 593,106 | |
Fiserv 3.80% 10/1/23 | | | 875,000 | | | | 881,327 | |
Genesys Telecommunications Laboratories 144A 10.00% 11/30/24 # | | | 50,000 | | | | 52,500 | |
Infor US 6.50% 5/15/22 | | | 170,000 | | | | 165,053 | |
Marvell Technology Group 4.875% 6/22/28 | | | 3,565,000 | | | | 3,481,922 | |
Microchip Technology | | | | | | | | |
144A 3.922% 6/1/21 # | | | 810,000 | | | | 803,937 | |
144A 4.333% 6/1/23 # | | | 880,000 | | | | 859,164 | |
MSCI 144A 5.375% 5/15/27 # | | | 635,000 | | | | 623,094 | |
NXP | | | | | | | | |
144A 4.625% 6/1/23 # | | | 1,580,000 | | | | 1,552,350 | |
144A 4.875% 3/1/24 # | | | 865,000 | | | | 869,879 | |
144A 5.35% 3/1/26 # | | | 960,000 | | | | 977,520 | |
144A 5.55% 12/1/28 # | | | 1,790,000 | | | | 1,836,164 | |
Tencent Holdings 144A 2.985% 1/19/23 # | | | 1,330,000 | | | | 1,293,206 | |
| | | | | | | | |
| | | | | | | 30,695,147 | |
| | | | | | | | |
| Transportation – 0.83% | | | | | | | | |
Adani Abbot Point Terminal 144A 4.45% 12/15/22 # | | | 3,550,000 | | | | 3,162,273 | |
Burlington Northern Santa Fe 4.15% 12/15/48 | | | 1,655,000 | | | | 1,618,233 | |
DAE Funding 144A 5.75% 11/15/23 # | | | 1,488,000 | | | | 1,476,840 | |
FedEx 4.05% 2/15/48 | | | 3,585,000 | | | | 3,019,110 | |
Norfolk Southern 3.80% 8/1/28 | | | 2,070,000 | | | | 2,075,968 | |
Penske Truck Leasing 144A 4.20% 4/1/27 # | | | 1,210,000 | | | | 1,185,977 | |
Union Pacific 3.50% 6/8/23 | | | 1,790,000 | | | | 1,795,088 | |
| | |
| | Diversified Income Series-21 |
Delaware VIP® Diversified Income Series
Schedule of investments (continued)
| | | | | | | | |
| | | Principal | | | Value | |
| | | amount° | | | (US $) | |
|
Corporate Bonds (continued) | |
Transportation (continued) | |
United Airlines2014-1 Class A Pass Through Trust 4.00% 4/11/26¨ | | | 680,694 | | | $ | 679,949 | |
United Airlines2014-2 Class A Pass Through Trust 3.75% 9/3/26¨ | | | 1,181,811 | | | | 1,158,109 | |
United Parcel Service 5.125% 4/1/19 | | | 2,180,000 | | | | 2,191,753 | |
XPO Logistics 144A 6.125% 9/1/23 # | | | 1,193,000 | | | | 1,152,736 | |
| | | | | | | | |
| | | | | | | 19,516,036 | |
| | | | | | | | |
| Utilities – 0.25% | | | | | | | | |
Aegea Finance 144A 5.75% 10/10/24 # | | | 2,145,000 | | | | 2,053,859 | |
AES Andres 144A 7.95% 5/11/26 # | | | 1,960,000 | | | | 1,989,400 | |
Calpine | | | | | | | | |
144A 5.25% 6/1/26 # | | | 219,000 | | | | 200,659 | |
5.75% 1/15/25 | | | 815,000 | | | | 747,763 | |
Vistra Operations 144A 5.50% 9/1/26 # | | | 845,000 | | | | 816,481 | |
| | | | | | | | |
| | | | | | | 5,808,162 | |
| | | | | | | | |
| | |
Total Corporate Bonds
(cost $990,488,137) | | | | | | | 956,804,942 | |
| | | | | | | | |
| Loan Agreements – 7.02% | | | | | | | | |
Acrisure Tranche B 1st Lien 6.772% (LIBOR01M + 4.25%) 11/22/23 • | | | 2,039,348 | | | | 1,973,070 | |
Air Medical Group Holdings Tranche B 1st Lien 5.682% (LIBOR01M + 3.25%) 4/28/22 • | | | 944,527 | | | | 881,446 | |
Allied Universal Holdco Tranche B 1st Lien 6.772% (LIBOR01M + 4.25%) 7/28/22 • | | | 377,000 | | | | 361,684 | |
Alpha 3 Tranche B1 1st Lien 5.803% (LIBOR03M + 3.00%) 1/31/24 • | | | 912,324 | | | | 872,790 | |
Altice France Tranche B11 1st Lien 5.272% (LIBOR01M + 2.75%) 7/31/25 • | | | 1,496,639 | | | | 1,374,102 | |
Altice France Tranche B12 1st Lien 6.143% (LIBOR01M + 3.688%) 1/31/26 • | | | 109,386 | | | | 101,627 | |
Altice France Tranche B13 1st Lien 6.455% (LIBOR01M + 4.00%) 1/31/26 • | | | 355,000 | | | | 334,587 | |
American Airlines Tranche B 1st Lien 4.455% (LIBOR01M + 2.00%) 12/14/23 • | | | 2,027,788 | | | | 1,934,003 | |
Applied Systems 2nd Lien 9.522% (LIBOR01M + 7.00%) 9/19/25 • | | | 2,085,000 | | | | 2,069,363 | |
Aramark Services Tranche B3 1st Lien 4.272% (LIBOR01M + 1.75%) 3/11/25 • | | | 979,296 | | | | 950,725 | |
AssuredPartners Tranche B 1st Lien 5.772% (LIBOR01M + 3.25%) 10/22/24 • | | | 1,225,639 | | | | 1,158,229 | |
| | | | | | | | |
| | | Principal | | | Value | |
| | | amount° | | | (US $) | |
|
Loan Agreements (continued) | |
Avis Budget Car Rental Tranche B 1st Lien 4.53% (LIBOR01M + 2.00%) 2/13/25 • | | | 751,627 | | | $ | 729,078 | |
Ball Metalpack Finco Tranche B 1st Lien 7.022% (LIBOR01M + 4.50%) 7/31/25 =• | | | 1,451,705 | | | | 1,440,890 | |
Ball Metalpack Finco Tranche B 2nd Lien 11.272% (LIBOR01M + 8.75%) 7/31/26 • | | | 319,000 | | | | 314,167 | |
Blue Ribbon 1st Lien 6.387% (LIBOR01M + 4.00%) 11/13/21 • | | | 2,405,350 | | | | 2,226,452 | |
Bombardier Recreational Products Tranche B 1st Lien 4.52% (LIBOR01M + 2.00%) 5/23/25 • | | | 847,875 | | | | 822,085 | |
Boxer Parent Tranche B 1st Lien 7.053% (LIBOR03M + 4.25%) 10/2/25 • | | | 1,492,000 | | | | 1,435,677 | |
Builders FirstSource 1st Lien 5.803% (LIBOR03M + 3.00%) 2/29/24 • | | | 997,636 | | | | 939,773 | |
BWAY Holding Tranche B 1st Lien 5.658% (LIBOR03M + 3.25%) 4/3/24 • | | | 927,175 | | | | 875,601 | |
CH Hold 2nd Lien 9.772% (LIBOR01M + 7.25%) 2/1/25 • | | | 403,000 | | | | 400,985 | |
Change Healthcare Holdings Tranche B 1st Lien 5.272% (LIBOR01M + 2.75%) 3/1/24 • | | | 1,604,088 | | | | 1,528,228 | |
Charter Communications Operating Tranche B 1st Lien 4.53% (LIBOR01M + 2.00%) 4/30/25 • | | | 1,176,080 | | | | 1,130,801 | |
Chemours Tranche B2 1st Lien 4.28% (LIBOR01M + 1.75%) 4/3/25 • | | | 2,262,944 | | | | 2,178,083 | |
CityCenter Holdings Tranche B 1st Lien 4.772% (LIBOR01M + 2.25%) 4/18/24 • | | | 2,470,264 | | | | 2,348,294 | |
Community Health Systems Tranche H 1st Lien 5.957% (LIBOR03M + 3.25%) 1/27/21 • | | | 1,737,372 | | | | 1,669,180 | |
Core & Main Tranche B 1st Lien 5.721% (LIBOR03M + 3.00%) 8/1/24 • | | | 1,498,647 | | | | 1,453,687 | |
CROWN Americas Tranche B 1st Lien 4.479% (LIBOR01M + 2.00%) 4/3/25 • | | | 614,547 | | | | 612,115 | |
CSC Holdings 1st Lien 4.705% (LIBOR01M + 2.25%) 7/17/25 • | | | 797,850 | | | | 753,968 | |
CSC Holdings Tranche B 1st Lien 4.955% (LIBOR01M + 2.50%) 1/25/26 • | | | 796,000 | | | | 763,497 | |
Dakota Holdings Tranche B 1st Lien 5.772% (LIBOR01M + 3.25%) 2/13/25 • | | | 345,390 | | | | 327,041 | |
| | |
| | Diversified Income Series-22 |
Delaware VIP® Diversified Income Series
Schedule of investments (continued)
| | | | | | | | |
| | | Principal | | | Value | |
| | | amount° | | | (US $) | |
| | |
Loan Agreements (continued) | | | | | | | | |
DaVita Tranche B 1st Lien 5.272% (LIBOR01M + 2.75%) 6/24/21 • | | | 337,192 | | | $ | 334,347 | |
Delek US Holdings Tranche B 1st Lien 4.772% (LIBOR01M + 2.25%) 3/30/25 • | | | 903,175 | | | | 880,596 | |
Digicel International Finance Tranche B 1st Lien 5.96% (LIBOR03M + 3.25%) 5/10/24 • | | | 662,741 | | | | 598,124 | |
DTZ US Borrower Tranche B 1st Lien 5.772% (LIBOR01M + 3.25%) 8/21/25 • | | | 723,188 | | | | 691,548 | |
Edgewater Generation Tranche B 1st Lien 6.272% (LIBOR01M + 3.75%) 12/13/25 • | | | 535,000 | | | | 524,300 | |
Energy Transfer Equity Tranche B 1st Lien 4.522% (LIBOR01M + 2.00%) 2/2/24 • | | | 905,000 | | | | 884,779 | |
Envision Healthcare Tranche B 1st Lien 6.272% (LIBOR01M + 3.75%) 10/11/25 • | | | 918,000 | | | | 859,605 | |
Equitrans Midstream Tranche B 1st Lien 0.00% 1/31/24 • X | | | 706,000 | | | | 691,880 | |
ESH Hospitality Tranche B 1st Lien 4.522% (LIBOR01M + 2.00%) 8/30/23 • | | | 2,087,751 | | | | 2,011,635 | |
ExamWorks Group Tranche B1 1st Lien 5.772% (LIBOR01M + 3.25%) 7/27/23 • | | | 2,001,617 | | | | 1,950,742 | |
First Data 1st Lien | | | | | | | | |
4.504% (LIBOR01M + 2.00%) 7/10/22 • | | | 694,530 | | | | 667,906 | |
4.504% (LIBOR01M + 2.00%) 4/26/24 • | | | 3,907,574 | | | | 3,743,945 | |
Flex Acquisition 1st Lien 5.349% (LIBOR01M + 3.00%) 12/29/23 • | | | 471,865 | | | | 445,617 | |
Flying Fortress Holdings Tranche B 1st Lien 4.553% (LIBOR03M + 1.75%) 10/30/22 • | | | 902,500 | | | | 886,706 | |
Frontier Communications TrancheA-DD 1st Lien 5.28% (LIBOR01M + 2.75%) 3/31/21 • | | | 927,940 | | | | 884,791 | |
Gardner Denver Tranche B1 1st Lien 5.272% (LIBOR01M + 2.75%) 7/30/24 • | | | 1,333,254 | | | | 1,292,424 | |
Gates Global Tranche B2 1st Lien 5.272% (LIBOR01M + 2.75%) 3/31/24 • | | | 1,541,071 | | | | 1,468,593 | |
Gentiva Health Services 1st Lien 6.313% (LIBOR01M + 3.75%) 7/2/25 =• | | | 2,476,328 | | | | 2,414,419 | |
| | | | | | | | |
| | | Principal | | | Value | |
| | | amount° | | | (US $) | |
| | |
Loan Agreements (continued) | | | | | | | | |
GEO Group Tranche B 1st Lien 4.53% (LIBOR01M + 2.00%) 3/23/24 • | | | 456,515 | | | $ | 419,994 | |
GIP III Stetson I Tranche B 1st Lien 6.695% (LIBOR03M + 4.25%) 7/18/25 • | | | 822,000 | | | | 795,285 | |
Gray Television Tranche B2 1st Lien 4.599% (LIBOR01M + 2.25%) 2/7/24 • | | | 1,592,396 | | | | 1,536,662 | |
Greeneden US Holdings II Tranche B3 1st Lien 5.772% (LIBOR01M + 3.25%) 12/1/23 • | | | 1,685,815 | | | | 1,616,275 | |
Greenhill & Co. Tranche B 1st Lien 6.468% (LIBOR03M + 3.75%) 10/12/22 • | | | 856,151 | | | | 855,081 | |
GVC Holdings Tranche B2 1st Lien 5.022% (LIBOR01M + 2.50%) 3/16/24 • | | | 1,440,118 | | | | 1,405,015 | |
HCA Tranche B10 1st Lien 4.522% (LIBOR01M + 2.00%) 3/13/25 • | | | 3,597,813 | | | | 3,534,207 | |
Heartland Dental 1st Lien 6.272% (LIBOR01M + 3.75%) 4/30/25 • | | | 1,214,859 | | | | 1,163,228 | |
H-Food Holdings 1st Lien 6.21% (LIBOR01M + 3.688%) 5/31/25 • | | | 839,780 | | | | 805,139 | |
Hilton Worldwide Finance Tranche B2 1st Lien 4.256% (LIBOR01M + 1.75%) 10/25/23 • | | | 137,428 | | | | 132,618 | |
Hoya Midco Tranche B 1st Lien 6.022% (LIBOR01M + 3.50%) 6/30/24 • | | | 1,236,175 | | | | 1,180,547 | |
HUB International Tranche B 1st Lien 5.24% (LIBOR03M + 2.75%) 4/25/25 • | | | 1,990,000 | | | | 1,883,867 | |
Hyperion Insurance Group Tranche B 1st Lien 6.063% (LIBOR01M + 3.50%) 12/20/24 • | | | 1,362,315 | | | | 1,324,000 | |
INEOS US Finance Tranche B 1st Lien 4.522% (LIBOR01M + 2.00%) 3/31/24 • | | | 1,905,750 | | | | 1,818,005 | |
IQVIA Tranche B3 1st Lien 4.272% (LIBOR01M + 1.75%) 6/11/25 • | | | 1,477,575 | | | | 1,432,324 | |
Iron Mountain Tranche B 1st Lien 4.272% (LIBOR01M + 1.75%) 1/2/26 • | | | 3,283,429 | | | | 3,111,049 | |
JBS USA Tranche B 1st Lien 5.26% (LIBOR03M + 2.50%) 10/30/22 • | | | 1,206,157 | | | | 1,162,811 | |
Kronos Tranche B 1st Lien 5.541% (LIBOR03M + 3.00%) 11/1/23 • | | | 874,508 | | | | 836,067 | |
Lucid Energy Group II Borrower 1st Lien 5.504% (LIBOR01M + 3.00%) 2/18/25 • | | | 1,917,017 | | | | 1,763,656 | |
| | |
| | Diversified Income Series-23 |
Delaware VIP® Diversified Income Series
Schedule of investments (continued)
| | | | | | | | |
| | | Principal amount° | | | Value (US $) | |
| |
Loan Agreements (continued) | | | | | |
LUX HOLDCO III 1st Lien 5.495% (LIBOR02M + 3.00%) 3/28/25 • | | | 607,410 | | | $ | 592,984 | |
MGM Growth Properties Operating Partnership Tranche B 1st Lien 4.522% (LIBOR01M + 2.00%) 3/25/25 • | | | 1,494,631 | | | | 1,432,043 | |
Microchip Technology 1st Lien 4.53% (LIBOR01M + 2.00%) 5/29/25 • | | | 2,147,792 | | | | 2,043,087 | |
MPH Acquisition Holdings Tranche B 1st Lien 5.553% (LIBOR03M + 2.75%) 6/7/23 • | | | 3,140,725 | | | | 2,970,341 | |
NCI Building Systems Tranche B 1st Lien 6.175% (LIBOR03M + 3.75%) 4/12/25 =• | | | 1,016,890 | | | | 930,454 | |
Neiman Marcus Group 1st Lien 5.63% (LIBOR01M + 3.25%) 10/25/20 • | | | 495,000 | | | | 421,987 | |
NFP Tranche B 1st Lien 5.522% (LIBOR01M + 3.00%) 1/8/24 • | | | 1,633,333 | | | | 1,548,944 | |
Northriver Midstream Finance Tranche B 1st Lien 5.646% (LIBOR03M + 3.25%) 10/1/25 • | | | 304,238 | | | | 298,381 | |
OCI Partners 1st Lien 6.803% (LIBOR03M + 4.00%) 3/13/25 • | | | 446,625 | | | | 439,367 | |
ON Semiconductor Tranche BB 1st Lien 4.272% (LIBOR01M + 1.75%) 3/31/23 • | | | 1,389,434 | | | | 1,344,711 | |
Panda Stonewall Tranche B1 1st Lien 8.303% (LIBOR03M + 5.50%) 11/13/21 =• | | | 488,287 | | | | 487,066 | |
Penn National Gaming Tranche B 1st Lien 4.705% (LIBOR01M + 2.25%) 10/15/25 • | | | 1,425,000 | | | | 1,375,634 | |
Plaskolite PPC Intermediate II 1st Lien 6.69% (LIBOR03M + 4.25%) 12/14/25 =• | | | 716,000 | | | | 708,840 | |
PQ Tranche B 1st Lien 5.027% (LIBOR03M + 2.50%) 2/8/25 • | | | 2,653,615 | | | | 2,522,592 | |
Prestige Brands Tranche B5 1st Lien 4.522% (LIBOR01M + 2.00%) 1/26/24 • | | | 1,172,492 | | | | 1,132,188 | |
Radiate Holdco Tranche B 1st Lien 5.522% (LIBOR01M + 3.00%) 2/1/24 • | | | 1,570,054 | | | | 1,481,575 | |
Refinitiv US Holdings Tranche B 1st Lien 6.272% (LIBOR01M + 3.75%) 10/1/25 • | | | 1,023,000 | | | | 959,574 | |
Russell Investments US Institutional Holdco Tranche B 1st Lien 5.772% (LIBOR01M + 3.25%) 6/1/23 • | | | 3,826,487 | | | | 3,742,772 | |
| | | | | | | | |
| | | Principal amount° | | | Value (US $) | |
| |
Loan Agreements (continued) | | | | | |
Sable International Finance Tranche B4 1st Lien 5.772% (LIBOR01M + 3.25%) 1/31/26 • | | | 220,000 | | | $ | 213,503 | |
SBA Senior Finance II Tranche B 1st Lien 4.53% (LIBOR01M + 2.00%) 4/11/25 • | | | 1,925,325 | | | | 1,852,163 | |
Scientific Games International Tranche B5 1st Lien 5.25% (LIBOR02M + 2.75%) 8/14/24 • | | | 3,059,121 | | | | 2,880,162 | |
Sigma US Tranche B2 1st Lien 5.398% (LIBOR03M + 3.00%) 7/2/25 • | | | 1,330,315 | | | | 1,263,799 | |
Sinclair Television Group Tranche B2 1st Lien 4.78% (LIBOR01M + 2.25%) 1/3/24 • | | | 1,213,798 | | | | 1,159,683 | |
Solenis International 1st Lien 6.707% (LIBOR03M + 4.00%) 12/26/23 • | | | 740,280 | | | | 714,833 | |
Specialty Building Products Holdings 1st Lien 8.272% (LIBOR01M + 5.75%) 10/1/25 =• | | | 877,000 | | | | 850,690 | |
Sprint Communications Tranche B 1st Lien | | | | | | | | |
5.063% (LIBOR01M + 2.50%) 2/3/24 • | | | 3,160,095 | | | | 3,025,791 | |
5.563% (LIBOR01M + 3.00%) 2/3/24 • | | | 760,000 | | | | 727,700 | |
SS&C European Holdings Tranche B4 1st Lien 4.772% (LIBOR01M + 2.25%) 4/16/25 • | | | 616,813 | | | | 586,358 | |
SS&C Technologies Tranche B3 1st Lien 4.772% (LIBOR01M + 2.25%) 4/16/25 • | | | 1,626,130 | | | | 1,543,663 | |
StandardAero Aviation Holdings 1st Lien 6.27% (LIBOR01M + 3.75%) 7/7/22 • | | | 935,396 | | | | 926,510 | |
Staples 1st Lien 6.541% (LIBOR03M + 4.00%) 9/12/24 • | | | 597,433 | | | | 573,909 | |
Stars Group Holdings Tranche B 1st Lien 6.303% (LIBOR03M + 3.50%) 7/10/25 • | | | 1,782,484 | | | | 1,731,874 | |
Summit Materials Tranche B 1st Lien 4.522% (LIBOR01M + 2.00%) 11/10/24 • | | | 1,425,600 | | | | 1,369,467 | |
Summit Midstream Partners Holdings Tranche B 1st Lien 8.522% (LIBOR01M + 6.00%) 5/21/22 • | | | 1,354,600 | | | | 1,333,153 | |
Surgery Center Holdings 1st Lien 5.78% (LIBOR01M + 3.25%) 8/31/24 • | | | 2,820,736 | | | | 2,693,802 | |
Syneos Health Tranche B 1st Lien 4.522% (LIBOR01M + 2.00%) 8/1/24 • | | | 1,112,070 | | | | 1,075,928 | |
| | |
| | Diversified Income Series-24 |
Delaware VIP® Diversified Income Series
Schedule of investments (continued)
| | | | | | | | |
| | | Principal amount° | | | Value (US $) | |
|
Loan Agreements (continued) | |
Tecta America 1st Lien 7.379% (LIBOR03M + 5.00%) 11/21/25 =• | | | 865,000 | | | $ | 852,025 | |
Telenet Financing USD Tranche AN 1st Lien 4.705% (LIBOR01M + 2.25%) 8/15/26 • | | | 1,480,000 | | | | 1,411,920 | |
Thor Industries Tranche B 1st Lien 0.00% 11/9/25 • X | | | 2,135,000 | | | | 2,028,250 | |
Titan Acquisition Tranche B 1st Lien 5.522% (LIBOR01M + 3.00%) 3/28/25 • | | | 1,974,559 | | | | 1,827,701 | |
TMS International Tranche B2 1st Lien 5.275% (LIBOR01M + 2.75%) 8/14/24 =• | | | 559,820 | | | | 529,030 | |
TransDigm Tranche F 1st Lien 5.022% (LIBOR01M + 2.50%) 6/9/23 • | | | 2,974,756 | | | | 2,818,581 | |
Trident TPI Holdings 1st Lien 5.772% (LIBOR01M + 3.25%) 10/5/24 • | | | 660,019 | | | | 625,368 | |
Tronox Blocked Borrower Tranche B 1st Lien 5.522% (LIBOR01M + 3.00%) 9/22/24 • | | | 335,219 | | | | 326,778 | |
Tronox Finance Tranche B 1st Lien 5.522% (LIBOR01M + 3.00%) 9/22/24 • | | | 773,581 | | | | 754,103 | |
United Rentals North America Tranche B 1st Lien 4.272% (LIBOR01M + 1.75%) 10/31/25 • | | | 124,688 | | | | 122,069 | |
Unitymedia Finance Tranche D 1st Lien 4.705% (LIBOR01M + 2.25%) 1/15/26 • | | | 575,000 | | | | 556,621 | |
Unitymedia Finance Tranche E 1st Lien 4.455% (LIBOR01M + 2.00%) 6/1/23 • | | | 2,025,000 | | | | 1,974,013 | |
UPC Financing Partnership Tranche AR 1st Lien 4.955% (LIBOR01M + 2.50%) 1/15/26 • | | | 170,430 | | | | 162,654 | |
USI Tranche B 1st Lien 5.803% (LIBOR03M + 3.00%) 5/16/24 • | | | 3,781,247 | | | | 3,580,841 | |
USIC Holdings 1st Lien 5.772% (LIBOR01M + 3.25%) 12/9/23 • | | | 1,299,510 | | | | 1,245,363 | |
Utz Quality Foods 1st Lien 6.022% (LIBOR01M + 3.50%) 11/21/24 • | | | 652,206 | | | | 633,455 | |
Valeant Pharmaceuticals International Tranche B 1st Lien 5.379% (LIBOR01M + 3.00%) 6/1/25 • | | | 828,551 | | | | 795,409 | |
Vantage Specialty Chemicals 2nd Lien 10.777% (LIBOR03M + 8.25%) 10/26/25 • | | | 105,000 | | | | 103,687 | |
Vantage Specialty Chemicals Tranche B 1st Lien 6.012% (LIBOR02M + 3.50%) 10/28/24 • | | | 1,341,450 | | | | 1,301,206 | |
| | | | | | | | |
| | | Principal amount° | | | Value (US $) | |
|
Loan Agreements (continued) | |
Virgin Media Bristol Tranche K 1st Lien 4.955% (LIBOR01M + 2.50%) 1/15/26 • | | | 855,000 | | | $ | 812,891 | |
Vistra Operations Tranche B3 1st Lien 4.473% (LIBOR01M + 2.00%) 12/1/25 • | | | 2,855,650 | | | | 2,749,991 | |
Visual Comfort Group 1st Lien 5.522% (LIBOR01M + 3.00%) 2/28/24 =• | | | 1,423,047 | | | | 1,424,897 | |
Visual Comfort Group 2nd Lien 10.522% (LIBOR01M + 8.00%) 2/28/25 =• | | | 121,827 | | | | 122,248 | |
Western Digital Tranche B4 1st Lien 4.256% (LIBOR01M + 1.75%) 4/29/23 • | | | 231,907 | | | | 221,858 | |
Wyndham Hotels & Resorts Tranche B 1st Lien 4.272% (LIBOR01M + 1.75%) 5/30/25 • | | | 1,152,113 | | | | 1,110,348 | |
Wynn Resorts Tranche B 1st Lien 4.78% (LIBOR01M + 2.25%) 10/30/24 • | | | 985,000 | | | | 933,287 | |
XPO Logistics Tranche B 1st Lien 4.509% (LIBOR03M + 2.00%) 2/24/25 • | | | 2,077,000 | | | | 1,996,516 | |
Zayo Group Tranche B2 1st Lien 4.772% (LIBOR01M + 2.25%) 1/19/24 • | | | 1,548,757 | | | | 1,489,388 | |
Zekelman Industries 1st Lien 4.862% (LIBOR02M + 2.25%) 6/14/21 • | | | 2,075,374 | | | | 2,010,518 | |
| | | | | | | | |
Total Loan Agreements
(cost $171,544,553) | | | | | | | 165,445,559 | |
| | | | | | | | |
Municipal Bonds – 0.15% | | | | | | | | |
Buckeye, Ohio Tobacco Settlement Financing Authority (Asset-Backed Senior Turbo) SeriesA-2 5.875% 6/1/47 | | | 405,000 | | | | 385,268 | |
Commonwealth of Massachusetts Series C 5.00% 10/1/25 | | | 120,000 | | | | 141,774 | |
South Carolina Public Service Authority Series D 4.77% 12/1/45 | | | 340,000 | | | | 354,266 | |
State of California Various Purposes (Taxable Build America Bonds) 7.55% 4/1/39 | | | 925,000 | | | | 1,328,291 | |
Texas Water Development Board (2016 State Water Implementation) | | | | | | | | |
Series A 5.00% 10/15/45 | | | 290,000 | | | | 325,914 | |
(Water Implementation Revenue) Series B 5.00% 10/15/46 | | | 795,000 | | | | 897,539 | |
| | | | | | | | |
Total Municipal Bonds
(cost $3,573,499) | | | | | | | 3,433,052 | |
| | | | | | | | |
| | |
| | Diversified Income Series-25 |
Delaware VIP® Diversified Income Series
Schedule of investments (continued)
| | | | | | | | |
| | | Principal amount° | | | Value (US $) | |
| | |
Non-Agency Asset-Backed Securities – 3.29% | | | | | | | | |
American Express Credit Account Master Trust | | | | | | | | |
Series2017-5 A 2.835% (LIBOR01M + 0.38%) 2/18/25 • | | | 3,785,000 | | | $ | 3,783,487 | |
Series2018-3 A 2.775% (LIBOR01M + 0.32%) 10/15/25 • | | | 1,745,000 | | | | 1,732,379 | |
Series2018-5 A 2.795% (LIBOR01M + 0.34%) 12/15/25 • | | | 960,000 | | | | 953,281 | |
Series2018-7 A 2.815% (LIBOR01M + 0.36%) 2/17/26 • | | | 2,500,000 | | | | 2,484,844 | |
Avis Budget Rental Car Funding AESOP | | | | | | | | |
Series2014-1A A 144A 2.46% 7/20/20 # | | | 1,440,000 | | | | 1,435,782 | |
BA Credit Card Trust | | | | | | | | |
Series2018-A3 A3 3.10% 12/15/23 | | | 2,100,000 | | | | 2,112,782 | |
Barclays Dryrock Issuance Trust | | | | | | | | |
Series2017-1 A 2.785% (LIBOR01M + 0.33%, Floor 0.33%) 3/15/23 • | | | 540,000 | | | | 540,206 | |
Carmax Auto Owner Trust | | | | | | | | |
Series2018-4 A2B 2.655% (LIBOR01M + 0.20%) 2/15/22 • | | | 2,015,000 | | | | 2,015,067 | |
Chase Issuance Trust | | | | | | | | |
Series2016-A3 A3 3.005% (LIBOR01M + 0.55%) 6/15/23 • | | | 1,840,000 | | | | 1,849,065 | |
Series2017-A1 A 2.755% (LIBOR01M + 0.30%) 1/15/22 • | | | 1,745,000 | | | | 1,745,847 | |
Series2017-A2 A 2.855% (LIBOR01M + 0.40%) 3/15/24 • | | | 3,480,000 | | | | 3,479,995 | |
Citibank Credit Card Issuance Trust | | | | | | | | |
Series2017-A5 A5 3.124% (LIBOR01M + 0.62%, Floor 0.62%) 4/22/26 • | | | 1,220,000 | | | | 1,226,274 | |
CNH Equipment Trust | | | | | | | | |
Series2017-A A3 2.07% 5/16/22 | | | 4,810,000 | | | | 4,762,775 | |
Discover Card Execution Note Trust | | | | | | | | |
Series2017-A7 A7 2.815% (LIBOR01M + 0.36%) 4/15/25 • | | | 1,525,000 | | | | 1,518,455 | |
Ford Credit Auto Owner Trust | | | | | | | | |
Series2018-B A2B 2.575% (LIBOR01M + 0.12%, Floor 0.12%) 9/15/21 • | | | 2,720,000 | | | | 2,720,107 | |
Ford Credit Floorplan Master Owner Trust A | | | | | | | | |
Series2017-1 A2 2.875% (LIBOR01M + 0.42%) 5/15/22 • | | | 630,000 | | | | 632,068 | |
GMF Floorplan Owner Revolving Trust | | | | | | | | |
Series2017-1 A1 144A 2.22% 1/18/22 # | | | 825,000 | | | | 817,913 | |
| | | | | | | | |
| | | Principal amount° | | | Value (US $) | |
| | |
Non-Agency Asset-Backed Securities (continued) | | | | | | | | |
Golden Credit Card Trust | | | | | | | | |
Series2014-2A A 144A 2.905% (LIBOR01M + 0.45%) 3/15/21 #• | | | 1,195,000 | | | $ | 1,195,102 | |
Hardee’s Funding | | | | | | | | |
Series2018-1A A2I 144A 4.25% 6/20/48 # | | | 1,820,438 | | | | 1,840,790 | |
Hertz Vehicle Financing | | | | | | | | |
Series2018-2A A 144A 3.65% 6/27/22 # | | | 1,000,000 | | | | 1,007,637 | |
HOA Funding | | | | | | | | |
Series2014-1A A2 144A 4.846% 8/20/44 # | | | 3,705,750 | | | | 3,690,556 | |
Hyundai Auto Lease Securitization Trust | | | | | | | | |
Series2018-A A3 144A 2.81% 4/15/21 # | | | 2,000,000 | | | | 1,992,955 | |
Mercedes-Benz Master Owner Trust | | | | | | | | |
Series2018-BA A 144A 2.795% | | | | | | | | |
(LIBOR01M + 0.34%) 5/15/23 #• | | | 1,000,000 | | | | 997,232 | |
Navistar Financial Dealer Note Master Owner Trust II | | | | | | | | |
Series2018-1 A 144A 3.136% (LIBOR01M + 0.63%, Floor 0.63%) 9/25/23 #• | | | 950,000 | | | | 949,643 | |
Nissan Auto Lease Trust | | | | | | | | |
Series2018-A A2B 2.605% (LIBOR01M + 0.15%) 2/16/21 • | | | 2,015,000 | | | | 2,015,273 | |
Penarth Master Issuer | | | | | | | | |
Series2018-2A A1 144A 2.905% (LIBOR01M + 0.45%) 9/18/22 #• | | | 3,865,000 | | | | 3,860,432 | |
PFS Financing | | | | | | | | |
Series2018-A A 144A 2.855% (LIBOR01M + 0.40%) 2/15/22 #• | | | 1,085,000 | | | | 1,084,221 | |
Series2018-E A 144A 2.905% (LIBOR01M + 0.45%) 10/17/22 #• | | | 5,500,000 | | | | 5,490,364 | |
Taco Bell Funding | | | | | | | | |
Series2016-1A A2II 144A 4.377% 5/25/46 # | | | 1,723,750 | | | | 1,738,126 | |
Towd Point Mortgage Trust | | | | | | | | |
Series2015-5 A1B 144A 2.75% 5/25/55 #• | | | 810,967 | | | | 798,695 | |
Series2016-1 A1B 144A 2.75% 2/25/55 #• | | | 511,231 | | | | 504,175 | |
Series2016-2 A1 144A 3.00% 8/25/55 #• | | | 557,810 | | | | 549,242 | |
Series2016-3 A1 144A 2.25% 4/25/56 #• | | | 736,403 | | | | 719,478 | |
Series2017-1 A1 144A 2.75% 10/25/56 #• | | | 661,623 | | | | 647,118 | |
| | |
| | Diversified Income Series-26 |
Delaware VIP® Diversified Income Series
Schedule of investments (continued)
| | | | | | | | |
| | | Principal | | | Value | |
| | | amount° | | | (US $) | |
| | |
Non-Agency Asset-Backed
Securities (continued) | | | | | | | | |
Towd Point Mortgage Trust | | | | | | | | |
Series2017-2 A1 144A 2.75% 4/25/57 #• | | | 369,603 | | | $ | 361,436 | |
Series2017-4 M1 144A 3.25% 6/25/57 #• | | | 1,505,000 | | | | 1,410,108 | |
Series2018-1 A1 144A 3.00% 1/25/58 #• | | | 651,721 | | | | 639,685 | |
Trafigura Securitisation Finance | | | | | | | | |
Series2017-1A A1 144A 3.305% (LIBOR01M + 0.85%) 12/15/20 #• | | | 1,800,000 | | | | 1,808,266 | |
Series2018-1A A1 144A 3.185% (LIBOR01M + 0.73%) 3/15/22 #• | | | 3,340,000 | | | | 3,340,868 | |
Vantage Data Centers Issuer
| | | | | | | | |
Series2018-1A A2 144A 4.072% 2/16/43 # | | | 892,500 | | | | 893,894 | |
Verizon Owner Trust
| | | | | | | | |
Series2017-1A A 144A 2.06% 9/20/21 # | | | 1,620,000 | | | | 1,607,946 | |
Volvo Financial Equipment Master Owner Trust
| | | | | | | | |
Series2017-A A 144A 2.955% (LIBOR01M + 0.50%) 11/15/22 #• | | | 3,500,000 | | | | 3,507,406 | |
Wendys Funding
| | | | | | | | |
Series2018-1A A2I 144A 3.573% 3/15/48 # | | | 1,163,250 | | | | 1,114,789 | |
| | | | | | | | |
| | |
TotalNon-Agency Asset-Backed Securities
(cost $77,834,357) | | | | | | | 77,575,764 | |
| | | | | | | | |
| | |
Non-Agency Collateralized
Mortgage Obligations – 2.09% | | | | | | | | |
Banc of America Alternative Loan Trust | | | | | | | | |
Series2005-1 2A1 5.50% 2/25/20 | | | 28,598 | | | | 26,205 | |
Series2005-6 7A1 5.50% 7/25/20 | | | 21,335 | | | | 19,485 | |
Citicorp Mortgage Securities Trust
| | | | | | | | |
Series2006-3 1A9 5.75% 6/25/36 | | | 63,607 | | | | 63,125 | |
Citicorp Residential Mortgage Trust
| | | | | | | | |
Series2006-3 A5 5.276% 11/25/36 • | | | 1,800,000 | | | | 1,841,891 | |
Connecticut Avenue Securities Trust
| | | | | | | | |
Series2018-R07 1M2 144A 4.906% (LIBOR01M + 2.40%) 4/25/31 #• | | | 1,845,000 | | | | 1,814,719 | |
Flagstar Mortgage Trust | | | | | | | | |
Series2018-1 A5 144A 3.50% 3/25/48 #• | | | 1,401,951 | | | | 1,384,701 | |
Series2018-5 A7 144A 4.00% 9/25/48 #• | | | 1,074,374 | | | | 1,077,396 | |
Galton Funding Mortgage Trust Series2018-1 A43 144A 3.50% 11/25/57 #• | | | 1,013,581 | | | | 1,010,324 | |
| | | | | | | | |
| | | Principal | | | Value | |
| | | amount° | | | (US $) | |
| | |
Non-Agency Collateralized
Mortgage Obligations (continued) | | | | | | | | |
Holmes Master Issuer
| | | | | | | | |
Series2018-2A A2 144A 2.856% (LIBOR03M + 0.42%) 10/15/54 #• | | | 1,540,000 | | | $ | 1,536,010 | |
JPMorgan Mortgage Trust | | | | | | | | |
Series2014-2 B1 144A 3.418% 6/25/29 #• | | | 668,546 | | | | 664,507 | |
Series2014-2 B2 144A 3.418% 6/25/29 #• | | | 249,893 | | | | 246,883 | |
Series 2014-IVR6 2A4 144A 2.50% 7/25/44 #• | | | 1,050,000 | | | | 1,050,331 | |
Series2015-4 B1 144A 3.624% 6/25/45 #• | | | 1,057,984 | | | | 1,048,539 | |
Series2015-4 B2 144A 3.624% 6/25/45 #• | | | 758,989 | | | | 743,023 | |
Series2016-4 B1 144A 3.902% 10/25/46 #• | | | 515,388 | | | | 516,892 | |
Series2016-4 B2 144A 3.902% 10/25/46 #• | | | 884,198 | | | | 881,849 | |
Series2017-1 B2 144A 3.549% 1/25/47 #• | | | 1,670,606 | | | | 1,627,731 | |
Series2017-2 A3 144A 3.50% 5/25/47 #• | | | 773,478 | | | | 758,714 | |
Series2018-3 A5 144A 3.50% 9/25/48 #• | | | 2,550,268 | | | | 2,516,597 | |
Series2018-4 A15 144A 3.50% 10/25/48 #• | | | 1,689,535 | | | | 1,677,589 | |
Series2018-6 1A4 144A 3.50% 12/25/48 #• | | | 1,081,526 | | | | 1,072,652 | |
Series 2018-7FRB A2 144A 3.065% (LIBOR01M + 0.75%) 4/25/46 #• | | | 1,225,850 | | | | 1,225,840 | |
JPMorgan Trust | | | | | | | | |
Series2015-1 B2 144A 3.303% 12/25/44 #• | | | 1,304,517 | | | | 1,299,065 | |
Series2015-5 B2 144A 3.161% 5/25/45 #• | | | 1,205,162 | | | | 1,189,058 | |
Series2015-6 B1 144A 3.612% 10/25/45 #• | | | 730,187 | | | | 726,541 | |
Series2015-6 B2 144A 3.612% 10/25/45 #• | | | 707,368 | | | | 698,887 | |
New Residential Mortgage Loan Trust
| | | | | | | | |
Series 2018-RPL1 A1 144A 3.50% 12/25/57 #• | | | 927,743 | | | | 922,972 | |
Permanent Master Issuer | | | | | | | | |
Series2018-1A 1A1 144A 2.816% (LIBOR03M + 0.38%) 7/15/58 #• | | | 1,000,000 | | | | 996,319 | |
Sequoia Mortgage Trust | | | | | | | | |
Series2014-2 A4 144A 3.50% 7/25/44 #• | | | 598,547 | | | | 592,604 | |
Series2015-1 B2 144A 3.876% 1/25/45 #• | | | 814,910 | | | | 821,117 | |
| | |
| | Diversified Income Series-27 |
Delaware VIP® Diversified Income Series
Schedule of investments (continued)
| | | | | | | | |
| | | Principal | | | Value | |
| | | amount° | | | (US $) | |
| | |
Non-Agency Collateralized
Mortgage Obligations (continued) | | | | | | | | |
Sequoia Mortgage Trust | | | | | | | | |
Series2015-2 B2 144A 3.743% 5/25/45 #• | | | 5,010,794 | | | $ | 4,990,315 | |
Series2017-4 A1 144A 3.50% 7/25/47 #• | | | 828,056 | | | | 815,118 | |
Series2017-5 B1 144A 3.879% 8/25/47 #• | | | 3,609,191 | | | | 3,619,102 | |
Series2018-5 A4 144A 3.50% 5/25/48 #• | | | 1,424,131 | | | | 1,412,484 | |
Series2018-8 A4 144A 4.00% 11/25/48 #• | | | 2,571,087 | | | | 2,580,415 | |
Silverstone Master Issuer | | | | | | | | |
Series2018-1A 1A 144A 2.859% (LIBOR03M + 0.39%) 1/21/70 #• | | | 3,600,000 | | | | 3,581,723 | |
Towd Point Mortgage Trust | | | | | | | | |
Series2015-6 A1B 144A 2.75% 4/25/55 #• | | | 926,775 | | | | 910,251 | |
Washington Mutual Mortgage Pass Through Certificates Trust | | | | | | | | |
Series2005-1 5A2 6.00% 3/25/35¨ | | | 13,844 | | | | 1,885 | |
Wells Fargo Mortgage-Backed Securities Trust | | | | | | | | |
Series2006-2 3A1 5.75% 3/25/36 | | | 127,115 | | | | 122,816 | |
Series2006-3 A11 5.50% 3/25/36 | | | 198,262 | | | | 196,970 | |
Series2006-AR5 2A1 4.139% 4/25/36 • | | | 150,074 | | | | 148,100 | |
Series 2007-AR10 2A1 4.621% 1/25/38 • | | | 753,266 | | | | 738,409 | |
| | | | | | | | |
TotalNon-Agency Collateralized Mortgage Obligations
(cost $49,131,093) | | | | | | | 49,169,154 | |
| | | | | | | | |
Non-Agency Commercial Mortgage-Backed Securities – 6.71% | | | | | | | | |
BANK | | | | | | | | |
Series 2017-BNK5 A5 3.39% 6/15/60 | | | 3,645,000 | | | | 3,567,960 | |
Series 2017-BNK5 B 3.896% 6/15/60 • | | | 1,500,000 | | | | 1,470,624 | |
Series 2017-BNK7 A5 3.435% 9/15/60 | | | 1,755,000 | | | | 1,719,220 | |
Series 2017-BNK8 A4 3.488% 11/15/50 | | | 1,265,000 | | | | 1,251,748 | |
Series 2018-BN14 A4 4.231% 9/15/60 | | | 1,500,000 | | | | 1,555,357 | |
BBCMS Mortgage Trust | | | | | | | | |
Series2018-C2 A5 4.314% 12/15/51 | | | 2,215,000 | | | | 2,317,733 | |
BENCHMARK Mortgage Trust | | | | | | | | |
Series2018-B1 A5 3.666% 1/15/51 • | | | 270,000 | | | | 270,314 | |
Series2018-B6 A4 4.261% 10/10/51 | | | 1,450,000 | | | | 1,517,298 | |
| | | | | | | | |
| | | Principal | | | Value | |
| | | amount° | | | (US $) | |
| | |
Non-Agency Commercial
Mortgage-Backed Securities (continued) | | | | | | | | |
CCUBS Commercial Mortgage Trust | | | | | | | | |
Series2017-C1 A4 3.544% 11/15/50 | | | 1,000,000 | | | $ | 990,580 | |
CD Mortgage Trust | | | | | | | | |
Series2016-CD2 A3 3.248% 11/10/49 | | | 12,150,000 | | | | 11,903,224 | |
CFCRE Commercial Mortgage Trust | | | | | | | | |
Series2011-C2 C 144A 5.756% 12/15/47 #• | | | 880,000 | | | | 925,679 | |
Series2016-C7 A3 3.839% 12/10/54 | | | 5,695,000 | | | | 5,743,972 | |
Citigroup Commercial Mortgage Trust | | | | | | | | |
Series 2014-GC25 A4 3.635% 10/10/47 | | | 1,935,000 | | | | 1,958,151 | |
Series 2015-GC27 A5 3.137% 2/10/48 | | | 5,210,000 | | | | 5,121,792 | |
Series2016-P3 A4 3.329% 4/15/49 | | | 3,100,000 | | | | 3,055,877 | |
Series2017-C4 A4 3.471% 10/12/50 | | | 1,560,000 | | | | 1,539,317 | |
Series2018-C5 A4 4.228% 6/10/51 | | | 2,100,000 | | | | 2,197,754 | |
COMM Mortgage Trust | | | | | | | | |
Series2013-CR6 AM 144A 3.147% 3/10/46 # | | | 1,765,000 | | | | 1,743,934 | |
Series2013-WWP A2 144A 3.424% 3/10/31 # | | | 2,540,000 | | | | 2,580,120 | |
Series 2014-CR19 A5 3.796% 8/10/47 | | | 9,707,000 | | | | 9,900,569 | |
Series 2014-CR20 AM 3.938% 11/10/47 | | | 7,775,000 | | | | 7,894,397 | |
Series2015-3BP A 144A 3.178% 2/10/35 # | | | 3,960,000 | | | | 3,901,304 | |
Series 2015-CR23 A4 3.497% 5/10/48 | | | 1,910,000 | | | | 1,914,850 | |
DB-JPM Mortgage Trust | | | | | | | | |
Series2016-C1 A4 3.276% 5/10/49 | | | 3,415,000 | | | | 3,354,575 | |
Series2016-C3 A5 2.89% 8/10/49 | | | 1,985,000 | | | | 1,894,707 | |
DB-UBS Mortgage Trust | | | | | | | | |
Series 2011-LC1A C 144A 5.698% 11/10/46 #• | | | 1,265,000 | | | | 1,320,114 | |
GRACE Mortgage Trust | | | | | | | | |
Series 2014-GRCE B 144A 3.52% 6/10/28 # | | | 6,015,000 | | | | 6,007,022 | |
GS Mortgage Securities Corp II | | | | | | | | |
Series 2018-GS10 C 4.413% 7/10/51 • | | | 1,100,000 | | | | 1,095,310 | |
GS Mortgage Securities Trust | | | | | | | | |
Series2010-C1 C 144A 5.635% 8/10/43 #• | | | 1,010,000 | | | | 1,032,123 | |
Series 2015-GC32 A4 3.764% 7/10/48 | | | 1,240,000 | | | | 1,258,428 | |
Series2017-GS5 A4 3.674% 3/10/50 | | | 2,980,000 | | | | 2,977,370 | |
Series2017-GS5 XA 0.82% 3/10/50 • | | | 32,989,708 | | | | 1,815,968 | |
| | |
| | Diversified Income Series-28 |
Delaware VIP® Diversified Income Series
Schedule of investments (continued)
| | | | | | | | |
| | | Principal | | | Value | |
| | | amount° | | | (US $) | |
Non-Agency Commercial
Mortgage-Backed Securities (continued) | | | | | | | | |
GS Mortgage Securities Trust | | | | | | | | |
Series2017-GS6 A3 3.433% 5/10/50 | | | 4,410,000 | | | $ | 4,328,833 | |
Series2018-GS9 A4 3.992% 3/10/51 • | | | 1,370,000 | | | | 1,396,600 | |
Series2018-GS9 C 4.364% 3/10/51 • | | | 400,000 | | | | 395,560 | |
JPM-BB Commercial Mortgage Securities Trust | | | | | | | | |
Series2015-C31 A3 3.801% 8/15/48 | | | 1,610,000 | | | | 1,638,563 | |
Series2015-C33 A4 3.77% 12/15/48 | | | 4,710,000 | | | | 4,777,407 | |
JPM-DB Commercial Mortgage Securities Trust | | | | | | | | |
Series2016-C2 A4 3.144% 6/15/49 | | | 2,080,000 | | | | 2,028,059 | |
Series2017-C7 A5 3.409% 10/15/50 | | | 3,425,000 | | | | 3,363,701 | |
JPMorgan Chase Commercial Mortgage Securities Trust | | | | | | | | |
Series 2005-CB11 E 5.566% 8/12/37 • | | | 600,000 | | | | 613,861 | |
Series 2013-LC11 B 3.499% 4/15/46 | | | 2,445,000 | | | | 2,381,360 | |
Series2015-JP1 A5 3.914% 1/15/49 | | | 1,590,000 | | | | 1,625,749 | |
Series2016-JP2 A4 2.822% 8/15/49 | | | 4,995,000 | | | | 4,745,381 | |
Series2016-JP2 AS 3.056% 8/15/49 | | | 3,095,000 | | | | 2,904,609 | |
Series2016-JP3 B 3.397% 8/15/49 • | | | 700,000 | | | | 661,463 | |
Series 2016-WIKI A 144A 2.798% 10/5/31 # | | | 1,610,000 | | | | 1,583,554 | |
Series 2016-WIKI B 144A 3.201% 10/5/31 # | | | 1,490,000 | | | | 1,464,414 | |
LB-UBS Commercial Mortgage Trust | | | | | | | | |
Series2006-C6 AJ 5.452% 9/15/39 • | | | 1,195,229 | | | | 824,798 | |
Morgan Stanley BAML Trust | | | | | | | | |
Series2014-C17 A5 3.741% 8/15/47 | | | 1,640,000 | | | | 1,663,533 | |
Series2015-C26 A5 3.531% 10/15/48 | | | 1,970,000 | | | | 1,967,935 | |
Series2016-C29 A4 3.325% 5/15/49 | | | 1,620,000 | | | | 1,594,417 | |
Morgan Stanley Capital I Trust | | | | | | | | |
Series 2006-HQ10 B 5.448% 11/12/41 • | | | 2,310,000 | | | | 2,184,072 | |
Series2006-T21 B 144A 5.15% 10/12/52 #• | | | 800,000 | | | | 798,552 | |
Series2018-L1 A4 4.407% 10/15/51 | | | 1,655,000 | | | | 1,738,224 | |
UBS Commercial Mortgage Trust | | | | | | | | |
Series2012-C1 A3 3.40% 5/10/45 | | | 1,327,634 | | | | 1,335,396 | |
Series2018-C9 A4 4.117% 3/15/51 • | | | 2,365,000 | | | | 2,435,980 | |
UBS-Barclays Commercial Mortgage Trust | | | | | | | | |
Series2013-C5 B 144A 3.649% 3/10/46 #• | | | 1,000,000 | | | | 989,130 | |
Wells Fargo Commercial Mortgage Trust | | | | | | | | |
Series 2014-LC18 A5 3.405% 12/15/47 | | | 1,175,000 | | | | 1,176,263 | |
| | | | | | | | | | |
| | | | | Principal | | | Value | |
| | | | | amount° | | | (US $) | |
Non-Agency Commercial
Mortgage-Backed Securities (continued) | | | | | | | | | | |
Wells Fargo Commercial Mortgage Trust | | | | | | | | | | |
Series2015-C30 XA 0.926% 9/15/58 • | | | | | 15,958,572 | | | $ | 752,495 | |
Series 2015-NXS3 A4 3.617% 9/15/57 | | | | | 1,250,000 | | | | 1,257,237 | |
Series 2016-BNK1 A3 2.652% 8/15/49 | | | | | 2,575,000 | | | | 2,416,769 | |
Series2017-C38 A5 3.453% 7/15/50 | | | | | 2,240,000 | | | | 2,197,403 | |
Series2017-RB1 XA 1.28% 3/15/50 • | | | | | 20,499,364 | | | | 1,672,061 | |
WF-RBS Commercial Mortgage Trust | | | | | | | | | | |
Series2012-C10 A3 2.875% 12/15/45 | | | | | 3,605,000 | | | | 3,547,707 | |
| | | | | | | | | | |
TotalNon-Agency Commercial Mortgage-Backed Securities
(cost $163,515,849) | | | | | | | | | 158,258,477 | |
| | | | | | | | | | |
Regional Bonds – 0.34%D | | | | | |
Argentina – 0.08% | | | | | | | | | | |
Provincia de Cordoba | | | | | | | | | | |
144A 7.125% 8/1/27 # | | | 1,575,000 | | | | 1,145,813 | |
144A 7.45% 9/1/24 # | | | 920,000 | | | | 754,400 | |
| | | | | | | | | | |
| | | | | | | | | 1,900,213 | |
| | | | | | | | | | |
Australia – 0.11% | | | | | | | | | | |
New South Wales Treasury 4.00% 5/20/26 | | AUD | | | 1,094,900 | | | | 846,379 | |
Queensland Treasury | | | | | | | | | | |
144A 2.75% 8/20/27 # | | AUD | | | 1,254,000 | | | | 881,589 | |
144A 3.25% 7/21/28 # | | AUD | | | 1,298,000 | | | | 946,163 | |
| | | | | | | | | | |
| | | | | | | | | 2,674,131 | |
| | | | | | | | | | |
Canada – 0.15% | | | | | | | | | | |
Province of Ontario Canada | | | | | | | | | | |
2.60% 6/2/27 | | CAD | | | 630,000 | | | | 455,103 | |
3.45% 6/2/45 | | CAD | | | 1,488,000 | | | | 1,138,398 | |
Province of Quebec Canada | | | | | | | | | | |
1.65% 3/3/22 | | CAD | | | 2,281,000 | | | | 1,644,235 | |
6.00% 10/1/29 | | CAD | | | 224,000 | | | | 211,048 | |
| | | | | | | | | | |
| | | | | | | | | 3,448,784 | |
| | | | | | | | | | |
Total Regional Bonds
(cost $9,166,982) | | | | | | | | | 8,023,128 | |
| | | | | | | | | | |
Sovereign Bonds – 2.04%D | | | | | | | | | | |
Argentina – 0.20% | | | | | | | | | | |
Argentine Bonos del Tesoro 16.00% 10/17/23 | | ARS | | | 52,592,000 | | | | 1,225,424 | |
Argentine Republic Government
International Bond | | | | | | | | |
5.625% 1/26/22 | | | | | 2,185,000 | | | | 1,851,787 | |
6.875% 1/11/48 | | | | | 2,275,000 | | | | 1,595,344 | |
| | | | | | | | | | |
| | | | | | | | | 4,672,555 | |
| | | | | | | | | | |
| | |
| | Diversified Income Series-29 |
Delaware VIP® Diversified Income Series
Schedule of investments (continued)
| | | | | | | | | | | | |
| | | | | | Principal | | | Value | |
| | | | | | amount° | | | (US $) | |
Sovereign BondsD
(continued) | | | | | | | | | | | | |
| Australia – 0.00% | | | | | | | | | | | | |
Australia Government Bond 3.75% 4/21/37 | | | AUD | | | | 33,000 | | | $ | 27,027 | |
| | | | | | | | | | | | |
| | | | | | | | | | | 27,027 | |
| | | | | | | | | | | | |
Bermuda – 0.06% | | | | | | | | | | | | |
Bermuda Government International Bond 144A 3.717% 1/25/27 # | | | | | | | 1,600,000 | | | | 1,529,872 | |
| | | | | | | | | | | | |
| | | | | | | | | | | 1,529,872 | |
| | | | | | | | | | | | |
Brazil – 0.21% | | | | | | | | | | | | |
Brazil Notas do Tesouro Nacional Series F 10.00% 1/1/27 | | | BRL | | | | 18,765,000 | | | | 5,059,175 | |
| | | | | | | | | | | | |
| | | | | | | | | | | 5,059,175 | |
| | | | | | | | | | | | |
Canada – 0.02% | | | | | | | | | | | | |
Canadian Government Bond 2.75% 12/1/48 | | | CAD | | | | 496,000 | | | | 408,586 | |
| | | | | | | | | | | | |
| | | | | | | | | | | 408,586 | |
| | | | | | | | | | | | |
Colombia – 0.24% | | | | | | | | | | | | |
Colombian TES 7.00% 6/30/32 | | | COP | | | | 18,215,000,000 | | | | 5,561,125 | |
| | | | | | | | | | | | |
| | | | | | | | | | | 5,561,125 | |
| | | | | | | | | | | | |
Egypt – 0.10% | | | | | | | | | | | | |
Egypt Government International Bond | | | | | | | | | | | | |
144A 5.577% 2/21/23 # | | | | | | | 1,200,000 | | | | 1,140,415 | |
144A 7.903% 2/21/48 # | | | | | | | 1,300,000 | | | | 1,123,398 | |
| | | | | | | | | | | | |
| | | | | | | | | | | 2,263,813 | |
| | | | | | | | | | | | |
Indonesia – 0.03% | | | | | | | | | | | | |
Indonesia Government International Bond 144A 5.125% 1/15/45 # | | | | | | | 600,000 | | | | 592,895 | |
| | | | | | | | | | | | |
| | | | | | | | | | | 592,895 | |
| | | | | | | | | | | | |
Ivory Coast – 0.12% | | | | | | | | | | | | |
Ivory Coast Government International Bond 144A 6.125% 6/15/33 # | | | | | | | 3,400,000 | | | | 2,833,050 | |
| | | | | | | | | | | | |
| | | | | | | | | | | 2,833,050 | |
| | | | | | | | | | | | |
Jordan – 0.07% | | | | | | | | | | | | |
Jordan Government International Bond 144A 5.75%
1/31/27 # | | | | | | | 1,865,000 | | | | 1,717,355 | |
| | | | | | | | | | | | |
| | | | | | | | | | | 1,717,355 | |
| | | | | | | | | | | | |
Mexico – 0.06% | | | | | | | | | | | | |
Mexico Government International Bond 4.35% 1/15/47 | | | | | | | 1,700,000 | | | | 1,463,275 | |
| | | | | | | | | | | | |
| | | | | | | | | | | 1,463,275 | |
| | | | | | | | | | | | |
Nigeria – 0.06% | | | | | | | | | | | | |
Nigeria Government International Bond 144A 7.875% 2/16/32 # | | | | | | | 1,445,000 | | | | 1,315,977 | |
| | | | | | | | | | | | |
| | | | | | | | | | | 1,315,977 | |
| | | | | | | | | | | | |
Poland – 0.06% | | | | | | | | | | | | |
Republic of Poland Government Bond | | | | | | | | | | | | |
2.50% 1/25/23 | | | PLN | | | | 1,554,000 | | | | 423,178 | |
3.25% 7/25/25 | | | PLN | | | | 3,319,000 | | | | 928,426 | |
| | | | | | | | | | | | |
| | | | | | | | | | | 1,351,604 | |
| | | | | | | | | | | | |
| | | | | | | | | | | | |
| | | | | | Principal | | | Value | |
| | | | | | amount° | | | (US $) | |
| | | |
Sovereign BondsD(continued) | | | | | | | | | | | | |
| Poland (continued) | | | | | | | | | | | | |
Republic of Poland Government Bond | | | | | | | | | | | | |
Republic of Korea – 0.15% | | | | | | | | | | | | |
Export-Import Bank of Korea 4.00% 6/7/27 | | | AUD | | | | 530,000 | | | $ | 383,383 | |
Inflation Linked Korea Treasury Bond 1.125% 6/10/23 | | | KRW | | | | 3,462,737,025 | | | | 3,169,515 | |
| | | | | | | | | | | | |
| | | | | | | | | | | 3,552,898 | |
| | | | | | | | | | | | |
Senegal – 0.08% | | | | | | | | | | | | |
Senegal Government International Bond 144A 6.75% 3/13/48 # | | | | | | | 2,380,000 | | | | 1,981,053 | |
| | | | | | | | | | | | |
| | | | | | | | | | | 1,981,053 | |
| | | | | | | | | | | | |
South Africa – 0.28% | | | | | | | | | | | | |
Republic of South Africa Government Bond | | | | | | | | | | | | |
8.00% 1/31/30 | | | ZAR | | | | 44,129,000 | | | | 2,777,080 | |
8.75% 1/31/44 | | | ZAR | | | | 29,231,000 | | | | 1,809,325 | |
Republic of South Africa Government International Bond 5.875% 6/22/30 | | | | | | | 1,950,000 | | | | 1,907,412 | |
| | | | | | | | | | | | |
| | | | | | | | | | | 6,493,817 | |
| | | | | | | | | | | | |
Turkey – 0.15% | | | | | | | | | | | | |
Turkey Government Bond 8.00% 3/12/25 | | | TRY | | | | 27,797,000 | | | | 3,608,227 | |
| | | | | | | | | | | | |
| | | | | | | | | | | 3,608,227 | |
| | | | | | | | | | | | |
Ukraine – 0.13% | | | | | | | | | | | | |
Ukraine Government International Bond | | | | | | | | | | | | |
144A 7.75% 9/1/26 # | | | | | | | 1,000,000 | | | | 854,525 | |
144A 8.994% 2/1/24 # | | | | | | | 1,190,000 | | | | 1,113,256 | |
144A 9.75% 11/1/28 # | | | | | | | 1,220,000 | | | | 1,146,574 | |
| | | | | | | | | | | | |
| | | | | | | | | | | 3,114,355 | |
| | | | | | | | | | | | |
United Kingdom – 0.02% | | | | | | | | | | | | |
United Kingdom Gilt 3.50% 1/22/45 | | | GBP | | | | 340,300 | | | | 580,809 | |
| | | | | | | | | | | | |
| | | | | | | | | | | 580,809 | |
| | | | | | | | | | | | |
Total Sovereign Bonds
(cost $53,601,160) | | | | | | | | | | | 48,127,468 | |
| | | | | | | | | | | | |
Supranational Banks – 0.78% | | | | | | | | | | | | |
Arab Petroleum Investments 144A 4.125% 9/18/23 # | | | | | | | 1,750,000 | | | | 1,752,415 | |
Asian Development Bank 3.50% 5/30/24 | | | NZD | | | | 2,556,000 | | | | 1,788,081 | |
Banque Ouest Africaine de Developpement 144A 5.00% 7/27/27 # | | | | | | | 2,320,000 | | | | 2,181,538 | |
European Investment Bank | | | | | | | | | | | | |
1.00% 9/21/26 | | | GBP | | | | 982,000 | | | | 1,197,792 | |
6.00% 12/7/28 | | | GBP | | | | 421,000 | | | | 741,160 | |
Inter-American Development Bank 6.25% 6/15/21 | | | IDR | | | | 35,500,000,000 | | | | 2,356,462 | |
| | |
| | Diversified Income Series-30 |
Delaware VIP® Diversified Income Series
Schedule of investments (continued)
| | | | | | | | | | | | |
| | | | | | Principal | | | Value | |
| | | | | | amount° | | | (US $) | |
| | | |
Supranational Banks
(continued) | | | | | | | | | | | | |
Inter-American Development Bank 7.875% 3/14/23 | | | IDR | | | | 9,990,000,000 | | | $ | 693,343 | |
International Bank for Reconstruction & Development | | | | | | | | | | | | |
2.50% 11/25/24 | | | | | | | 1,507,000 | | | | 1,492,557 | |
2.525% (LIBOR01M + 0.07%) 4/17/19 • | | | | | | | 1,507,000 | | | | 1,507,247 | |
3.00% 2/2/23 | | | NZD | | | | 2,193,000 | | | | 1,502,554 | |
3.375% 1/25/22 | | | NZD | | | | 720,000 | | | | 498,164 | |
4.625% 10/6/21 | | | NZD | | | | 1,123,000 | | | | 800,785 | |
International Finance | | | | | | | | | | | | |
2.375% 7/19/23 | | | CAD | | | | 1,422,000 | | | | 1,045,876 | |
3.625% 5/20/20 | | | NZD | | | | 472,000 | | | | 323,232 | |
3.75% 8/9/27 | | | NZD | | | | 790,000 | | | | 554,531 | |
| | | | | | | | | | | | |
Total Supranational Banks (cost $19,336,039) | | | | | | | | | | | 18,435,737 | |
| | | | | | | | | | | | |
US Treasury Obligations – 11.87% | | | | | | | | | | | | |
US Treasury Bond
3.375% 11/15/48 | | | | | | | 6,915,000 | | | | 7,408,889 | |
US Treasury Notes | | | | | | | | | | | | |
2.875% 9/30/23 | | | | | | | 35,840,000 | | | | 36,426,629 | |
2.875% 10/31/23 | | | | | | | 36,845,000 | | | | 37,461,332 | |
2.875% 11/30/23 | | | | | | | 1,900,000 | | | | 1,933,282 | |
2.875% 8/15/28¥ | | | | 30,335,000 | | | | 30,831,611 | |
3.125% 11/15/28 | | | | | | | 159,670,000 | | | | 165,758,281 | |
| | | | | | | | | | | | |
Total US Treasury Obligations
(cost $273,650,668) | | | | | | | | | | | 279,820,024 | |
| | | | | | | | | | | | |
| | | |
| | | | | | Number of shares | | | | |
Common Stock – 0.01% | | | | | |
Adelphia Recovery
Trust =† | | | | 1 | | | | 0 | |
Century
Communications =† | | | | 2,500,000 | | | | 0 | |
Spectrum Pharmaceuticals † | | | | | | | 23,372 | | | | 204,505 | |
| | | | | | | | | | | | |
Total Common Stock
(cost $321,677) | | | | 204,505 | |
| | | | | | | | | | | | |
Convertible Preferred
Stock – 0.71% | | | | | |
A Schulman 6.00% exercise price $52.33y | | | | | | | 2,654 | | | | 2,740,255 | |
AMG Capital Trust II 5.15% exercise price $198.02, maturity date 10/15/37 | | | | | | | 28,129 | | | | 1,357,224 | |
Assurant 6.50% exercise price $106.91, maturity date 3/15/21 | | | | | | | 14,418 | | | | 1,415,271 | |
Bank of America 7.25% exercise price $50.00y | | | | | | | 1,140 | | | | 1,427,850 | |
Becton Dickinson 6.125% exercise price $211.80, maturity date 5/1/20 | | | | | | | 26,215 | | | | 1,511,819 | |
Crown Castle International 6.875% exercise price $114.88, maturity date 8/1/20 | | | | | | | 990 | | | | 1,041,727 | |
| | | | | | | | |
| | | Number of | | | Value | |
| | | shares | | | (US $) | |
| | |
Convertible Preferred Stock
(continued) | | | | | | | | |
DTE Energy 6.50% exercise price $116.31, maturity date 10/1/19 | | | 24,034 | | | $ | 1,241,596 | |
El Paso Energy Capital Trust I 4.75% exercise price $34.49, maturity date 3/31/28 | | | 37,033 | | | | 1,546,128 | |
QTS Realty Trust 6.50% exercise price $47.03y | | | 18,173 | | | | 1,713,350 | |
Wells Fargo & Co. 7.50% exercise price $156.71y | | | 829 | | | | 1,046,173 | |
Welltower 6.50% exercise price $56.57y | | | 25,809 | | | | 1,629,838 | |
| | | | | | | | |
Total Convertible Preferred Stock (cost $17,084,072) | | | | | | | 16,671,231 | |
| | | | | | | | |
Preferred Stock – 0.27% | | | | | | | | |
Bank of America 6.50% µ | | | 4,065,000 | | | | 4,120,894 | |
Morgan Stanley 5.55% µ | | | 2,085,000 | | | | 2,026,099 | |
USB Realty 144A 3.583% (LIBOR03M + 1.147%) #• | | | 300,000 | | | | 260,250 | |
| | | | | | | | |
Total Preferred Stock
(cost $6,792,284) | | | | | | | 6,407,243 | |
| | | | | | | | |
| | |
| | | Principal | | | | |
| | | amount° | | | | |
Short-Term Investments – 2.23% | | | | | | | | |
Discount Note – 0.34%≠ | | | | | | | | |
Federal Home Loan Bank 1.05% 1/2/19 | | | 7,979,412 | | | | 7,979,412 | |
| | | | | | | | |
| | | | | | | 7,979,412 | |
| | | | | | | | |
Repurchase Agreements – 1.74% | | | | | | | | |
Bank of America Merrill Lynch 2.95%, dated 12/31/18, to be repurchased on 1/2/19, repurchase at $4,987,950 (cash collateralized of $4,987,133) | | | 4,987,133 | | | | 4,987,133 | |
Bank of Montreal
2.60%, dated 12/31/18, to be repurchased on 1/2/19, repurchase price $13,716,595 (collateralized by US government obligations 0.00%–3.75% 1/24/19–2/15/47; market value $13,988,908) | | | 13,714,614 | | | | 13,714,614 | |
| | |
| | Diversified Income Series-31 |
Delaware VIP® Diversified Income Series
Schedule of investments (continued)
| | | | | | | | |
| | | Principal | | | Value | |
| | | amount° | | | (US $) | |
| | |
Short-Term Investments (continued) | | | | | | | | |
Repurchase Agreements (continued) | | | | | | | | |
BNP Paribas
2.93%, dated 12/31/18, to be repurchased on 1/2/19, repurchase price $22,429,439 (collateralized by US government obligations 0.00%–8.00% 2/15/19–8/15/46; market value $22,874,305) | | | 22,425,788 | | | $ | 22,425,788 | |
| | | | | | | | |
| | | | | | | 41,127,535 | |
| | | | | | | | |
| | | | | | | | |
| | | Principal | | | Value | |
| | | amount° | | | (US $) | |
| | |
Short-Term Investments (continued) | | | | | | | | |
US Treasury Obligation – 0.15%≠ | | | | | | | | |
US Treasury Bill 1.493% 1/3/19 | | | 3,464,498 | | | $ | 3,464,279 | |
| | | | | | | | |
| | | | | | | 3,464,279 | |
| | | | | | | | |
Total Short-Term Investments
(cost $52,570,547) | | | | | | | 52,571,226 | |
| | | | | | | | |
| | | | |
Total Value of Securities – 101.13%
(cost $2,441,411,040) | | $ | 2,383,579,526 | |
| # | Security exempt from registration under Rule 144A of the Securities Act of 1933, as amended. At Dec. 31, 2018, the aggregate value of Rule 144A securities was $623,900,619, which represents 26.47% of the Series’ net assets. See Note 11 in “Notes to financial statements.” |
| ¨ | Pass Through Agreement. Security represents the contractual right to receive a proportionate amount of underlying payments due to the counterparty pursuant to various agreements related to the rescheduling of obligations and the exchange of certain notes. |
| = | The value of this security was determined using significant unobservable inputs and is reported as a Level 3 security in the disclosure table located in Note 3 in “Notes to financial statements.” |
| ≠ | The rate shown is the effective yield at the time of purchase. |
| ° | Principal amount shown is stated in USD unless noted that the security is denominated in another currency. |
| D | Securities have been classified by country of origin. |
| µ | Fixed to variable rate investment. The rate shown reflects the fixed rate in effect at Dec. 31, 2018. Rate will reset at a future date. |
| S | Interest only security. An interest only security is the interest only portion of a fixed income security, which is separated and sold individually from the principal portion of the security. |
| y | No contractual maturity date. |
| † | Non-income producing security. |
| • | Variable rate investment. Rates reset periodically. Rate shown reflects the rate in effect at Dec. 31, 2018. For securities based on a published reference rate and spread, the reference rate and spread are indicated in their description above. The reference rate descriptions (i.e. LIBOR03M, LIBOR06M, etc.) used in this report are identical for different securities, but the underlying reference rates may differ due to the timing of the reset period. Certain variable rate securities are not based on a published reference rate and spread but are determined by the issuer or agent and are based on current market conditions, or for mortgage-backed securities, are impacted by the individual mortgages which are paying off over time. These securities do not indicate a reference rate and spread in their description above. |
| X | This loan will settle after Dec. 31, 2018, at which time the interest rate, based on the LIBOR and the agreed upon spread on trade date, will be reflected. |
| f | Step coupon bond. Stated rate in effect at Dec. 31, 2018 through maturity date. |
| ¥ | Fully or partially pledged as collateral for futures contracts. |
Unfunded Loan Commitments
The Series may invest in floating rate loans. In connection with these investments, the Series may also enter into unfunded corporate loan commitments (commitments). Commitments may obligate the Series to furnish temporary financing to a borrower until permanent financing can be arranged. In connection with these commitments, the Series earns a commitment fee, typically set as a percentage of the commitment amount. The following unfunded loan commitment was outstanding at Dec. 31, 2018:
| | | | | | | | | | | | | | | | |
| | | | | | | | | | | | Unrealized Appreciation | |
Borrower | | Principal Amount | | | Cost | | | Value | | | (Depreciation) | |
Heartland Dental Tranche DD 1st Lien 4.923% | | | | | | | | | | | | | | | | |
(LIBOR1M+3.75%) 4/30/25 | | $ | 111,193 | | | $ | 111,193 | | | $ | 106,467 | | | $ | 4,726 | |
| | |
| | Diversified Income Series-32 |
Delaware VIP® Diversified Income Series
Schedule of investments (continued)
The following foreign currency exchange contracts, futures contracts, and swap contracts were outstanding at Dec. 31, 2018:1
Foreign Currency Exchange Contracts
| | | | | | | | | | | | | | | | | | | | | | | | |
Counterparty | | Contracts to Receive (Deliver) | | | In Exchange For | | | Settlement
Date | | | Unrealized
Appreciation | | | Unrealized
Depreciation | |
BA | | AUD | | | 583,731 | | | USD | | | (402,999) | | | | 1/11/19 | | | | $ 8,251 | | | | $ — | |
BA | | CAD | | | (6,228,454) | | | USD | | | 4,762,288 | | | | 1/11/19 | | | | 198,612 | | | | — | |
BA | | EUR | | | 3,762,849 | | | USD | | | (4,311,825) | | | | 1/11/19 | | | | 3,511 | | | | — | |
BA | | JPY | | | (767,587,246) | | | USD | | | 6,865,858 | | | | 1/11/19 | | | | — | | | | (144,088) | |
BA | | NZD | | | (8,615,851) | | | USD | | | 5,687,405 | | | | 1/11/19 | | | | — | | | | (96,764) | |
BNP | | AUD | | | (1,819,586) | | | USD | | | 1,290,360 | | | | 1/11/19 | | | | 8,423 | | | | — | |
BNP | | MXN | | | 9,816,327 | | | USD | | | (494,495) | | | | 1/11/19 | | | | 4,228 | | | | — | |
BNP | | NOK | | | (12,261,189) | | | USD | | | 1,471,949 | | | | 1/11/19 | | | | 53,154 | | | | — | |
HSBCB | | EUR | | | 2,108,344 | | | USD | | | (2,414,465) | | | | 1/11/19 | | | | 3,440 | | | | — | |
HSBCB | | GBP | | | (2,068,659) | | | USD | | | 2,660,290 | | | | 1/11/19 | | | | 22,098 | | | | — | |
JPMCB | | KRW | | | (3,480,705,620) | | | USD | | | 3,060,768 | | | | 1/11/19 | | | | — | | | | (65,730) | |
JPMCB | | PLN | | | (3,466,675) | | | USD | | | 914,690 | | | | 1/11/19 | | | | — | | | | (11,802) | |
TDB | | JPY | | | 1,395,825,161 | | | USD | | | (12,495,357) | | | | 1/11/19 | | | | 251,933 | | | | — | |
Total Foreign Currency Exchange Contracts | | | | | | | | | | | | | | $553,650 | | | | $(318,384) | |
Futures Contracts
| | | | | | | | | | | | | | | | | | | | |
Contracts to Buy (Sell) | | Notional
Amount | | | Notional
Cost (Proceeds) | | | Expiration
Date | | | Value/
Unrealized
Appreciation | | | Variation Margin
Due from
(Due to) Brokers | |
(118) E-mini S&P 500 Index | | $ | (14,780,680 | ) | | $ | (15,059,416 | ) | | | 3/15/19 | | | $ | 278,736 | | | $ | (113,280 | ) |
1,331 US Treasury 5 yr Notes | | | 152,649,063 | | | | 150,053,227 | | | | 3/29/19 | | | | 2,595,836 | | | | 332,750 | |
2,611 US Treasury 10 yr Notes | | | 318,582,810 | | | | 310,715,371 | | | | 3/20/19 | | | | 7,867,439 | | | | 1,019,935 | |
634 US Treasury Long Bond | | | 92,564,000 | | | | 89,196,619 | | | | 3/20/19 | | | | 3,367,381 | | | | 297,187 | |
| | | | | | | | | | | | | | | | | | | | |
Total Futures Contracts | | | | | | $ | 534,905,801 | | | | | | | $ | 14,109,392 | | | $ | 1,536,592 | |
| | | | | | | | | | | | | | | | | | | | |
Swap Contracts
CDS Contracts2
| | | | | | | | | | | | | | | | | | | | | | | | | | | | | | | | | | | |
Counterparty/
Reference Obligation/
Termination Date/
Payment Frequency | | Notional
Amount3 | | Annual
Protection
Payments | | Value | | Upfront
Payments
Paid (Received) | | Unrealized
Appreciation4 | | Unrealized
Depreciation4 | | Variation
Margin
Due from
(Due to)
Brokers |
Centrally Cleared/ Protection Sold: | | | | | | | | | | | | | | | | | | | | | | | | | | | | | | | | | | | |
CDX.NA.HY.31512/20/23 – Quarterly | | | | 8,165,000 | | | | | 5.00 | % | | | $ | 165,756 | | | | $ | 101,503 | | | | $ | 64,253 | | | | $ | — | | | | $ | 9,363 | |
| | | | | | | | | | | | | | | | | | | | | | | | | | | | | | | | | | | |
| | | | | | | | | | | | | | 165,756 | | | | | 101,503 | | | | | 64,253 | | | | | — | | | | | 9,363 | |
| | | | | | | | | | | | | | | | | | | | | | | | | | | | | | | | | | | |
Over-The-Counter/ Protection Sold/ Moody’s Ratings: | | | | | | | | | | | | | | | | | | | | | | | | | | | | | | | | | | | |
MSC-CMBX.NA.BBB- .665/11/63 – Monthly | | | | 13,275,000 | | | | | 3.00 | % | | | | (2,140,716 | ) | | | | (1,542,879 | ) | | | | — | | | | | (597,837 | ) | | | | — | |
| | | | | | | | | | | | | | | | | | | | | | | | | | | | | | | | | | | |
| | | | | | | | | | | | | | (2,140,716 | ) | | | | (1,542,879 | ) | | | | — | | | | | (597,837 | ) | | | | — | |
| | | | | | | | | | | | | | | | | | | | | | | | | | | | | | | | | | | |
Total CDS Contracts | | | | | | | | | | | | | $ | (1,974,960 | ) | | | $ | (1,441,376 | ) | | | $ | 64,253 | | | | $ | (597,837 | ) | | | $ | 9,363 | |
| | | | | | | | | | | | | | | | | | | | | | | | | | | | | | | | | | | |
| | |
| | Diversified Income Series-33 |
Delaware VIP® Diversified Income Series
Schedule of investments (continued)
The use of foreign currency exchange contracts, futures contracts, and swap contracts involves elements of market risk and risks in excess of the amounts disclosed in these financial statements. The notional amounts and foreign currency exchange contracts presented above represent the Series’ total exposure in such contracts, whereas only the net unrealized appreciation (depreciation) is reflected in the Series’ net assets.
1See Note 8 in “Notes to financial statements.”
2A CDS contract is a risk-transfer instrument through which one party (purchaser of protection) transfers to another party (seller of protection) the financial risk of a credit event (as defined in the CDS agreement), as it relates to a particular reference security or basket of securities (such as an index). Periodic payments (receipts) on such contracts are accrued daily and recorded as unrealized losses (gains) on swap contracts. Upon payment (receipt), such amounts are recorded as realized losses (gains) on swap contracts. Upfront payments made or received in connection with CDS contracts are amortized over the expected life of the CDS contracts as unrealized losses (gains) on swap contracts. The change in value of CDS contracts is recorded daily as unrealized appreciation or depreciation. A realized gain or loss is recorded upon a credit event (as defined in the CDS agreement) or the maturity or termination of the CDS agreement.
3Notional amount shown is stated in USD unless noted that the swap is denominated in another currency.
4Unrealized appreciation (depreciation) does not include periodic interest payments (receipt) on swap contracts accrued daily in the amount of $12,251.
5Markit’s CDX.NA.HY Index is composed of 100 liquid North American entities with high yield credit ratings that trade in the CDS market.
6Markit’s CMBX.NA Index is a synthetic tradable index referencing a basket of 25 commercial mortgage-backed securities in North America. Credit-quality ratings are measured on a scale that generally ranges from AAA (highest) to BB (lowest). US Agency and US Agency mortgage-backed securities appear under US Government.
Summary of abbreviations:
ARM – Adjustable Rate Mortgage
ARS – Argentine Peso
AUD – Australian Dollar
BADLARPP – Argentina Term Deposit Rate
BA – Bank of America, N.A.
BB – Barclays Bank
BBSW3M – Bank Bill Swap 3 Months
BNP – BNP Paribas
BRL – Brazilian Real
CAD – Canadian Dollar
CDO – Collateralized Debt Obligation
CDS – Credit Default Swap
CDX.NA.HY – Credit Default Swap Index North American High Yield
CLO – Collateralized Loan Obligation
CMBX.NA – Commercial Mortgaged-Backed Securities Index North America
COP – Colombian Peso
DB – Deutsche Bank
EUR – European Monetary Unit
FREMF – Freddie Mac Multifamily
GBP – British Pound Sterling
GNMA – Government National Mortgage Association
GS – Goldman Sachs
HSBCB – HSBC Bank USA, National Association
ICE – Intercontinental Exchange
IDR – Indonesian Rupiah
JPM – JPMorgan
JPMCB – JPMorgan Chase Bank, National Association
JPY – Japanese Yen
| | |
| | Diversified Income Series-34 |
Delaware VIP® Diversified Income Series
Schedule of investments (continued)
Summary of abbreviations (continued):
KRW – South Korean Won
LB – Lehman Brothers
LIBOR – London Interbank Offered Rate
LIBOR01M – ICE LIBOR USD 1 Month
LIBOR02M – ICE LIBOR USD 2 Month
LIBOR03M – ICE LIBOR USD 3 Month
LIBOR06M – ICE LIBOR USD 6 Month
LIBOR12M – ICE LIBOR USD 12 Month
MSCS – Morgan Stanley Capital Services LLC
MXN – Mexican Peso
NOK – Norwegian Krone
NZD – New Zealand Dollar
PLN – Polish Zloty
RBS – Royal Bank of Scotland
REMIC – Real Estate Mortgage Investment Conduit
S&P – Standard & Poor’s Financial Services LLC
S.F. – Single Family
TBA – To be announced
TDB – The Toronto-Dominion Bank
TRY – Turkish Lira
USD – US Dollar
WF – Wells Fargo
yr – Year
ZAR – South African Rand
See accompanying notes, which are an integral part of the financial statements.
| | |
| | Diversified Income Series-35 |
| | | | |
Delaware VIP®Trust — Delaware VIP Diversified Income Series | | | | |
| Statement of assets and liabilities | | | December 31, 2018 | |
| | | | |
Assets: | | | | |
Investments, at value1 | | $ | 2,383,579,526 | |
Cash | | | 5,657,071 | |
Cash collateral due from brokers | | | 2,607,371 | |
Foreign currencies, at value2 | | | 1,430,899 | |
Receivable for securities sold | | | 61,512,781 | |
Dividends and interest receivables | | | 19,634,754 | |
Variation margin due from broker on future contracts | | | 1,536,592 | |
Unrealized appreciation on foreign currency exchange contracts | | | 553,650 | |
Upfront payments paid on credit default swap contracts | | | 101,503 | |
Swap payments receivable | | | 22,708 | |
Variation margin due from brokers on centrally cleared credit default swap contracts | | | 9,363 | |
Receivable for series shares sold | | | 3,535 | |
Other assets3 | | | 1,305,392 | |
| | | | |
Total assets | | | 2,477,955,145 | |
| | | | |
Liabilities: | | | | |
Payable for securities purchased | | | 104,906,444 | |
Payable for series shares redeemed | | | 5,970,060 | |
Contingent liabilities3 | | | 4,351,308 | |
Upfront payments received on credit default swap contracts | | | 1,542,879 | |
Management fees payable to affiliates | | | 1,176,672 | |
Cash collateral due to brokers | | | 1,140,000 | |
Unrealized depreciation on credit default swap contracts | | | 597,837 | |
Distribution fees payable to affiliates | | | 525,061 | |
Other accrued expenses payable | | | 366,234 | |
Unrealized depreciation on foreign currency exchange contracts | | | 318,384 | |
Dividend disbursing and transfer agent fees and expenses payable to affiliates | | | 15,177 | |
Accounting and administration expenses payable to affiliates | | | 8,184 | |
Trustees’ fees and expenses payable to affiliates | | | 5,927 | |
Audit and tax fees payable | | | 4,450 | |
Legal fees payable to affiliates | | | 4,120 | |
Reports and statements to shareholders expenses payable to affiliates | | | 1,750 | |
| | | | |
Total liabilities | | | 120,934,487 | |
| | | | |
Total Net Assets | | $ | 2,357,020,658 | |
| | | | |
| |
Net Assets Consist of: | | | | |
Paid-in capital | | $ | 2,440,107,729 | |
Total distributable earnings (loss) | | | (83,087,071 | ) |
| | | | |
Total Net Assets | | $ | 2,357,020,658 | |
| | | | |
Diversified Income Series-36
Delaware VIP® Trust — Delaware VIP Diversified Income Series
Statement of assets and liabilities (continued)
| | | | |
Net Asset Value: | | | | |
Standard Class: | | | | |
Net assets | | $ | 323,183,801 | |
Shares of beneficial interest outstanding, unlimited authorization, no par | | | 32,339,724 | |
Net asset value per share | | $ | 9.99 | |
| |
Service Class: | | | | |
Net assets | | $ | 2,033,836,857 | |
Shares of beneficial interest outstanding, unlimited authorization, no par | | | 205,084,208 | |
Net asset value per share | | $ | 9.92 | |
| |
| | | | |
1Investments, at cost | | $ | 2,441,411,040 | |
2Foreign currencies, at cost | | | 1,458,827 | |
3See Note 13 in “Notes to financial statements.” | | | | |
See accompanying notes, which are an integral part of the financial statements.
| | |
| | Diversified Income Series-37 |
Delaware VIP® Trust —
Delaware VIP Diversified Income Series
Statement of operations
Year ended December 31, 2018
| | | | |
Investment Income: | | | | |
Interest | | $ | 98,547,562 | |
Dividends | | | 1,272,381 | |
Foreign tax withheld | | | (113,899 | ) |
| | | | |
| | | 99,706,044 | |
| | | | |
| |
Expenses: | | | | |
Management fees | | | 14,354,161 | |
Distribution expenses – Service Class | | | 6,444,306 | |
Reports and statements to shareholders expenses | | | 489,520 | |
Accounting and administration expenses | | | 475,875 | |
Dividend disbursing and transfer agent fees and expenses | | | 206,601 | |
Legal fees | | | 175,834 | |
Custodian fees | | | 155,844 | |
Trustees’ fees and expenses | | | 118,970 | |
Audit and tax fees | | | 51,353 | |
Registration fees | | | 245 | |
Other | | | 177,695 | |
| | | | |
| | | 22,650,404 | |
Less waived distribution expenses – Service Class | | | (356,987 | ) |
Less expenses paid indirectly | | | (55,035 | ) |
| | | | |
Total operating expenses | | | 22,238,382 | |
| | | | |
Net Investment Income | | | 77,467,662 | |
| | | | |
| |
Net Realized and Unrealized Gain (Loss): | | | | |
Net realized gain (loss) on: | | | | |
Investments | | | (52,771,843 | ) |
Foreign currencies | | | (16,450,879 | ) |
Foreign currency exchange contracts | | | 465,603 | |
Futures contracts | | | 1,721,436 | |
Options purchased | | | 66,506 | |
Swap contracts | | | (1,279,503 | ) |
| | | | |
Net realized loss | | | (68,248,680 | ) |
| | | | |
Net change in unrealized appreciation (depreciation) of: | | | | |
Investments | | | (84,345,052 | ) |
Foreign currencies | | | (95,065 | ) |
Foreign currency exchange contracts | | | 859,056 | |
Futures contracts | | | 14,807,785 | |
Options purchased | | | 232,248 | |
Swap contracts | | | 340,894 | |
| | | | |
Net change in unrealized appreciation (depreciation) | | | (68,200,134 | ) |
| | | | |
Net Realized and Unrealized Loss | | | (136,448,814 | ) |
| | | | |
| |
Net Decrease in Net Assets Resulting from Operations | | $ | (58,981,152 | ) |
| | | | |
Delaware VIP Trust —
Delaware VIP Diversified Income Series
Statements of changes in net assets
| | | | | | | | |
| | | Year ended | |
| | | 12/31/18 | | | 12/31/17 | |
Increase (Decrease) in Net Assets from Operations: | | | | | | | | |
Net investment income | | $ | 77,467,662 | | | $ | 72,163,413 | |
Net realized loss | | | (68,248,680 | ) | | | (661,170 | ) |
Net change in unrealized appreciation (depreciation) | | | (68,200,134 | ) | | | 42,690,012 | |
| | | | | | | | |
Net increase (decrease) in net assets resulting from operations | | | (58,981,152 | ) | | | 114,192,255 | |
| | | | | | | | |
| | |
Dividends and Distributions to Shareholders from: | | | | | | | | |
Distributable earnings*: | | | | | | | | |
Standard Class | | | (10,363,469 | ) | | | (8,640,054 | ) |
Service Class | | | (64,115,915 | ) | | | (49,949,320 | ) |
| | | | | | | | |
| | | (74,479,384 | ) | | | (58,589,374 | ) |
| | | | | | | | |
| | |
Capital Share Transactions: | | | | | | | | |
Proceeds from shares sold: | | | | | | | | |
Standard Class | | | 26,765,650 | | | | 26,291,205 | |
Service Class | | | 104,428,900 | | | | 209,535,772 | |
| | |
Net asset value of shares issued upon reinvestment of dividends and distributions: | | | | | | | | |
Standard Class | | | 10,363,469 | | | | 8,640,054 | |
Service Class | | | 64,115,915 | | | | 49,949,320 | |
| | | | | | | | |
| | | 205,673,934 | | | | 294,416,351 | |
| | | | | | | | |
| | |
Cost of shares redeemed: | | | | | | | | |
Standard Class | | | (29,938,183 | ) | | | (31,933,271 | ) |
Service Class | | | (203,694,779 | ) | | | (36,521,555 | ) |
| | | | | | | | |
| | | (233,632,962 | ) | | | (68,454,826 | ) |
| | | | | | | | |
| | |
Increase (Decrease) in net assets derived from capital share transactions | | | (27,959,028 | ) | | | 225,961,525 | |
| | | | | | | | |
Net Increase (Decrease) in Net Assets | | | (161,419,564 | ) | | | 281,564,406 | |
| | |
Net Assets: | | | | | | | | |
Beginning of year | | | 2,518,440,222 | | | | 2,236,875,816 | |
| | | | | | | | |
End of year1 | | $ | 2,357,020,658 | | | $ | 2,518,440,222 | |
| | | | | | | | |
| 1 | Net Assets – End of year includes undistributed net investment income of $73,950,854 in 2017. The Securities and Exchange Commission eliminated the requirement to disclose undistributed (distributions in excess of) net investment income in 2018. |
| * | For the year ended Dec. 31, 2018, the Series has adopted amendments to RegulationS-X (see Note 14 in “Notes to financial statements”). For the year ended Dec. 31, 2017, the dividends and distributions to shareholders were as follows: |
| | | | | | | | |
| | | Standard Class | | | Service Class | |
Dividends from net investment income | | | $(8,640,054 | ) | | | $(49,949,320 | ) |
See accompanying notes, which are an integral part of the financial statements.
Diversified Income Series-38
Delaware VIP® Trust — Delaware VIP Diversified Income Series
Financial highlights
Selected data for each share of the Series outstanding throughout each period were as follows:
| | | | | | | | | | | | | | | | | | | | |
| | | Delaware VIP Diversified Income Series Standard Class Year ended | |
| | | 12/31/18 | | | 12/31/17 | | | 12/31/16 | | | 12/31/15 | | | 12/31/14 | |
Net asset value, beginning of period | | | $ 10.54 | | | | $ 10.29 | | | | $ 10.29 | | | | $ 10.84 | | | | $ 10.53 | |
| | | | | |
Income (loss) from investment operations: | | | | | | | | | | | | | | | | | | | | |
Net investment income1 | | | 0.34 | | | | 0.34 | | | | 0.27 | | | | 0.35 | | | | 0.33 | |
Net realized and unrealized gain (loss) | | | (0.56 | ) | | | 0.19 | | | | 0.09 | | | | (0.45 | ) | | | 0.22 | |
| | | | | | | | | | | | | | | | | | | | |
Total from investment operations | | | (0.22 | ) | | | 0.53 | | | | 0.36 | | | | (0.10 | ) | | | 0.55 | |
| | | | | | | | | | | | | | | | | | | | |
| | | | | |
Less dividends and distributions from: | | | | | | | | | | | | | | | | | | | | |
Net investment income | | | (0.33 | ) | | | (0.28 | ) | | | (0.36 | ) | | | (0.33 | ) | | | (0.24 | ) |
Net realized gain | | | — | | | | — | | | | — | | | | (0.12 | ) | | | — | |
| | | | | | | | | | | | | | | | | | | | |
Total dividends and distributions | | | (0.33 | ) | | | (0.28 | ) | | | (0.36 | ) | | | (0.45 | ) | | | (0.24 | ) |
| | | | | | | | | | | | | | | | | | | | |
| | | | | |
Net asset value, end of period | | | $ 9.99 | | | | $ 10.54 | | | | $ 10.29 | | | | $ 10.29 | | | | $ 10.84 | |
| | | | | | | | | | | | | | | | | | | | |
| | | | | |
Total return2 | | | (2.12% | ) | | | 5.22% | | | | 3.52% | | | | (1.08% | ) | | | 5.32% | |
| | | | | |
Ratios and supplemental data: | | | | | | | | | | | | | | | | | | | | |
Net assets, end of period (000 omitted) | | | $323,184 | | | | $333,226 | | | | $322,535 | | | | $339,023 | | | | $473,568 | |
Ratio of expenses to average net assets | | | 0.65% | | | | 0.66% | | | | 0.67% | | | | 0.67% | | | | 0.67% | |
Ratio of net investment income to average net assets | | | 3.38% | | | | 3.22% | | | | 2.63% | | | | 3.29% | | | | 3.09% | |
Portfolio turnover | | | 143% | | | | 145% | | | | 247% | | | | 250% | | | | 252% | |
| 1 | The average shares outstanding method has been applied for per share information. |
| 2 | Total return is based on the change in net asset value of a share during the period and assumes reinvestment of dividends and distributions at net asset value. Total return does not include fees, charges, or expenses imposed by the variable annuity and life insurance contracts for which Delaware VIP Trust serves as an underlying investment vehicle. |
See accompanying notes, which are an integral part of the financial statements.
Diversified Income Series-39
Delaware VIP® Diversified Income Series
Financial highlights (continued)
Selected data for each share of the Series outstanding throughout each period were as follows:
| | | | | | | | | | | | | | | | | | | | |
| | | Delaware VIP Diversified Income Series Service Class Year ended | |
| | | 12/31/18 | | | 12/31/17 | | | 12/31/16 | | | 12/31/15 | | | 12/31/14 | |
Net asset value, beginning of period | | $ | 10.46 | | | $ | 10.22 | | | $ | 10.22 | | | $ | 10.77 | | | $ | 10.47 | |
| | | | | |
Income (loss) from investment operations: | | | | | | | | | | | | | | | | | | | | |
Net investment income1 | | | 0.31 | | | | 0.31 | | | | 0.25 | | | | 0.32 | | | | 0.31 | |
Net realized and unrealized gain (loss) | �� | | (0.55 | ) | | | 0.18 | | | | 0.08 | | | | (0.45 | ) | | | 0.21 | |
| | | | | | | | | | | | | | | | | | | | |
Total from investment operations | | | (0.24 | ) | | | 0.49 | | | | 0.33 | | | | (0.13 | ) | | | 0.52 | |
| | | | | | | | | | | | | | | | | | | | |
| | | | | |
Less dividends and distributions from: | | | | | | | | | | | | | | | | | | | | |
Net investment income | | | (0.30 | ) | | | (0.25 | ) | | | (0.33 | ) | | | (0.30 | ) | | | (0.22 | ) |
Net realized gain | | | — | | | | — | | | | — | | | | (0.12 | ) | | | — | |
| | | | | | | | | | | | | | | | | | | | |
Total dividends and distributions | | | (0.30 | ) | | | (0.25 | ) | | | (0.33 | ) | | | (0.42 | ) | | | (0.22 | ) |
| | | | | | | | | | | | | | | | | | | | |
| | | | | |
Net asset value, end of period | | $ | 9.92 | | | $ | 10.46 | | | $ | 10.22 | | | $ | 10.22 | | | $ | 10.77 | |
| | | | | | | | | | | | | | | | | | | | |
| | | | | |
Total return2 | | | (2.29% | ) | | | 4.89% | | | | 3.28% | | | | (1.34% | ) | | | 4.98% | |
| | | | | |
Ratios and supplemental data: | | | | | | | | | | | | | | | | | | | | |
Net assets, end of period (000 omitted) | | $ | 2,033,837 | | | $ | 2,185,214 | | | $ | 1,914,341 | | | $ | 1,831,388 | | | $ | 1,819,811 | |
Ratio of expenses to average net assets | | | 0.93% | | | | 0.91% | | | | 0.92% | | | | 0.92% | | | | 0.92% | |
Ratio of expenses to average net assets prior to fees waived | | | 0.95% | | | | 0.96% | | | | 0.97% | | | | 0.97% | | | | 0.97% | |
Ratio of net investment income to average net assets | | | 3.10% | | | | 2.97% | | | | 2.38% | | | | 3.04% | | | | 2.84% | |
Ratio of net investment income to average net assets prior to fees waived | | | 3.08% | | | | 2.92% | | | | 2.33% | | | | 2.99% | | | | 2.79% | |
Portfolio turnover | | | 143% | | | | 145% | | | | 247% | | | | 250% | | | | 252% | |
| 1 | The average shares outstanding method has been applied for per share information. |
| 2 | Total return is based on the change in net asset value of a share during the period and assumes reinvestment of dividends and distributions at net asset value. Total return during all of the periods shown reflects a waiver by the distributor. Performance would have been lower had the waiver not been in effect. Total return does not include fees, charges, or expenses imposed by the variable annuity and life insurance contracts for which Delaware VIP Trust serves as an underlying investment vehicle. |
See accompanying notes, which are an integral part of the financial statements.
| | |
| | Diversified Income Series-40 |
Delaware VIP® Trust — Delaware VIP Diversified Income Series
Notes to financial statements
December 31, 2018
Delaware VIP Trust (Trust) is organized as a Delaware statutory trust and offers 10 series: Delaware VIP Diversified Income Series, Delaware VIP Emerging Markets Series, Delaware VIP High Yield Series, Delaware VIP International Value Equity Series, Delaware VIP Limited-Term Diversified Income Series, Delaware VIP REIT Series, Delaware VIP Small Cap Value Series, Delaware VIP Smid Cap Core Series, Delaware VIP U.S. Growth Series, and Delaware VIP Value Series. These financial statements and the related notes pertain to Delaware VIP Diversified Income Series (Series). The Trust is anopen-end investment company. The Series is considered diversified under the Investment Company Act of 1940, as amended, and offers Standard Class and Service Class shares. The Standard Class shares do not carry a distribution and service(12b-1) fee and the Service Class shares carry a12b-1 fee. The shares of the Series are sold only to separate accounts of life insurance companies.
The investment objective of the Series is to seek maximum long-term total return consistent with reasonable risk.
1. Significant Accounting Policies
The Series is an investment company and follows accounting and reporting guidance under Financial Accounting Standards Board (FASB) Accounting Standards Codification Topic 946, Financial Services - Investment Companies. The following accounting policies are in accordance with US generally accepted accounting principles (US GAAP) and are consistently followed by the Series.
Security Valuation — Equity securities, except those traded on the Nasdaq Stock Market LLC (Nasdaq), are valued at the last quoted sales price as of the time of the regular close of the New York Stock Exchange on the valuation date. Equity securities traded on the Nasdaq are valued in accordance with the Nasdaq Official Closing Price, which may not be the last sales price. If, on a particular day, an equity security does not trade, the mean between the bid and ask prices will be used, which approximates fair value. US government and agency securities are valued at the mean between the bid and ask prices, which approximates fair value. Other debt securities, credit default swap contracts and interest rate swap contracts are valued based upon valuations provided by an independent pricing service or broker/counterparty and reviewed by management. To the extent current market prices are not available, the pricing service may take into account developments related to the specific security, as well as transactions in comparable securities. Valuations for fixed income securities utilize matrix systems, which reflect such factors as security prices, yields, maturities, and ratings, and are supplemented by dealer and exchange quotations. For asset-backed securities, collateralized mortgage obligations, commercial mortgage securities, and US government agency mortgage securities, pricing vendors utilize matrix pricing which considers prepayment speed, attributes of the collateral, yield or price of bonds of comparable quality, coupon, maturity, and type as well as broker/dealer-supplied prices. Swap prices are derived using daily swap curves and models that incorporate a number of market data factors, such as discounted cash flows, trades, and values of the underlying reference instruments. Foreign currency exchange contracts and foreign cross currency exchange contracts are valued at the mean between the bid and ask prices, which approximates fair value. Interpolated values are derived when the settlement date of the contract is an interim date for which quotations are not available. Futures contracts and options on futures contracts are valued at the daily quoted settlement prices. Exchange-traded options are valued at the last reported sale price or, if no sales are reported, at the mean between the last reported bid and ask prices, which approximates fair value. Investments in repurchase agreements are generally valued at par, which approximates fair value, each business day. Generally, other securities and assets for which market quotations are not readily available are valued at fair value as determined in good faith under the direction of the Trust’s Board of Trustees (Board). In determining whether market quotations are readily available or fair valuation will be used, various factors will be taken into consideration, such as market closures or suspension of trading in a security. Restricted securities are valued at fair value using methods approved by the Board.
Federal and Foreign Income Taxes — No provision for federal income taxes has been made as the Series intends to continue to qualify for federal income tax purposes as a regulated investment company under Subchapter M of the Internal Revenue Code of 1986, as amended, and make the requisite distributions to shareholders. The Series evaluates tax positions taken or expected to be taken in the course of preparing the Series’ tax returns to determine whether the tax positions are“more-likely-than-not” of being sustained by the applicable tax authority. Tax positions not deemed to meet the“more-likely-than-not” threshold are recorded as a tax benefit or expense in the current year. Management has analyzed the Series’ tax positions taken or expected to be taken on the Series’ federal income tax returns through the year ended Dec. 31, 2018 and for all open tax years (years ended Dec. 31, 2015–Dec. 31, 2017), and has concluded that no provision for federal income tax is required in the Series’ financial statements. In regard to foreign taxes only, the Series has open tax years in certain foreign countries in which it invests that may date back to the inception of the Series. If applicable, the Series recognizes interest accrued on unrecognized tax benefits in interest expense and penalties in other expenses on the “Statement of operations.” During the year ended Dec. 31, 2018, the Series did not incur any interest or tax penalties.
Class Accounting — Investment income, common expenses, and realized and unrealized gain (loss) on investments are allocated to the classes of the Series on the basis of daily net assets of each class. Distribution expenses relating to a specific class are charged directly to that class.
Repurchase Agreements — The Series may purchase certain US government securities subject to the counterparty’s agreement to repurchase them at an agreed upon date and price. The counterparty will be required on a daily basis to maintain the value of the collateral subject to the agreement at not less than the repurchase price (including accrued interest). The agreements are conditioned upon the collateral being deposited under the Federal Reserve book-entry system with the Series’ custodian or a third-partysub-custodian. In the event of default or bankruptcy by the other party to the agreement, retention of the collateral may be subject to legal proceedings. All open repurchase agreements as of the date of this report were entered into on Dec. 31, 2018, and matured on the next business day.
To Be Announced Trades (TBA) — The Series may contract to purchase or sell securities for a fixed price at a transaction date beyond the customary settlement period (examples: when issued, delayed delivery, forward commitment, or TBA transactions) consistent with the Series’ ability to manage its investment portfolio and meet redemption requests. These transactions involve a commitment by the Series to purchase or sell securities for a predetermined price or yield with payment and delivery taking place more than
Diversified Income Series-41
Delaware VIP® Diversified Income Series
Notes to financial statements (continued)
1. Significant Accounting Policies (continued)
three days in the future, or after a period longer than the customary settlement period for that type of security. No interest will be earned by the Series on such purchases until the securities are delivered or the transaction is completed; however, the market value may change prior to delivery. At Dec. 31, 2018, the Series received $980,000 in cash as collateral for open TBA transactions as of Dec. 31, 2018, which is included under “Cash collateral due to brokers” on the “Statement of assets and liabilities.”
Foreign Currency Transactions — Transactions denominated in foreign currencies are recorded at the prevailing exchange rates on the valuation date in accordance with the Series’ prospectus. The value of all assets and liabilities denominated in foreign currencies is translated daily into US dollars at the exchange rate of such currencies against the US dollar. Transaction gains or losses resulting from changes in exchange rates during the reporting period or upon settlement of the foreign currency transaction are reported in operations for the current period. The Series generally bifurcates that portion of realized gains and losses on investments in debt securities which is due to changes in foreign exchange rates from that which is due to changes in market prices of debt securities. That portion of gains (losses), which is due to changes to foreign exchange rates, is included on the “Statement of operations” under “Net realized gain (loss) on foreign currencies.” The Series reports certain foreign currency related transactions as components of realized gains (losses) for financial reporting purposes, whereas such components are treated as ordinary income (loss) for federal income tax purposes.
Use of Estimates — The preparation of financial statements in conformity with US GAAP requires management to make estimates and assumptions that affect the fair value of investments, the reported amounts of assets and liabilities and disclosure of contingent assets and liabilities at the date of the financial statements, and the reported amounts of revenues and expenses during the reporting period. Actual results could differ from those estimates and the differences could be material.
Other — Expenses directly attributable to the Series are charged directly to the Series. Other expenses common to various funds within the Delaware Funds® by Macquarie (Delaware Funds) are generally allocated among such funds on the basis of average net assets. Management fees and certain other expenses are paid monthly. Security transactions are recorded on the date the securities are purchased or sold (trade date) for financial reporting purposes. Costs used in calculating realized gains and losses on the sale of investment securities are those of the specific securities sold. Dividend income is recorded on theex-dividend date and interest income is recorded on the accrual basis. Discounts and premiums on debt securities are accreted or amortized to interest income, respectively, over the lives of the respective securities using the effective interest method. Realized gains (losses) on paydowns of asset- and mortgage-backed securities are classified as interest income. Withholding taxes and reclaims on foreign interest have been recorded in accordance with the Series’ understanding of the applicable country’s tax rules and rates. The Series may pay foreign capital gains taxes on certain foreign securities held, which are reported as components of realized losses for financial reporting purposes, whereas such components are treated as ordinary loss for federal income tax purposes. The Series declares and pays dividends from net investment income and distributions from net realized gain on investments, if any, following the close of the fiscal year. The Series may distribute more frequently, if necessary for tax purposes. Dividends and distributions, if any, are recorded on theex-dividend date.
The Series receives earnings credits from its custodian when positive cash balances are maintained, which may be used to offset custody fees. The expenses paid under this arrangement are included on the “Statement of operations” under “Custodian fees” with the corresponding expenses offset included under “Less expenses paid indirectly.” For the year ended Dec. 31, 2018, the Series earned $55,034 under this arrangement.
The Series receives earnings credits from its transfer agent when positive cash balances are maintained, which may be used to offset transfer agent fees. If the amount earned is greater than $1, the expenses paid under this arrangement are included on the “Statement of operations” under “Dividend disbursing and transfer agent fees and expenses” with the corresponding expenses offset included under “Less expenses paid indirectly.” For the year ended Dec. 31, 2018, the Series earned $1 under this arrangement.
2. Investment Management, Administration Agreements, and Other Transactions with Affiliates
In accordance with the terms of its investment management agreement, the Series pays Delaware Management Company (DMC), a series of Macquarie Investment Management Business Trust and the investment manager, an annual fee which is calculated daily and paid monthly at the rate of 0.65% on the first $500 million of average daily net assets of the Series, 0.60% on the next $500 million, 0.55% on the next $1.5 billion, and 0.50% on average daily net assets in excess of $2.5 billion
DMC has contractually agreed to waive that portion, if any, of its management fee and reimburse the Series to the extent necessary to ensure that annual operating expenses (excluding any12b-1 fees, acquired fund fees and expenses, taxes, interest, short sale dividend and interest expenses, brokerage fees, certain insurance costs, and nonroutine expenses or costs, including, but not limited to, those relating to reorganizations, litigation, conducting shareholder meetings, and liquidations), do not exceed 0.67% of the Series’ average daily net assets from April 30, 2018 through Dec. 31, 2018.* These expense waivers and reimbursements may only be terminated by agreement of DMC and the Series. The waivers and reimbursements are accrued daily and received monthly.
Delaware Investments Fund Services Company (DIFSC), an affiliate of DMC, provides fund accounting and financial administration oversight services to the Series. For these services, DIFSC’s fees are calculated daily and paid monthly based on the aggregate daily net assets of all funds within the Delaware Funds at the following annual rates: 0.00475% of the first $35 billion; 0.0040% of the next $10 billion; and 0.0025% of aggregate average daily net assets in excess of $45 billion (Total Fee). Each Fund in the Delaware Funds pays a minimum of $4,000, which, in aggregate, is subtracted from the Total Fee. Each Fund then pays its portion of the remainder of the Total Fee on a relative net asset value (NAV) basis. This amount is included on the “Statement of operations” under “Accounting and administration expenses.” For the year ended Dec. 31, 2018, the Series was charged $97,462 for these services.
| | |
| | Diversified Income Series-42 |
Delaware VIP® Diversified Income Series
Notes to financial statements (continued)
2. Investment Management, Administration Agreements, and Other Transactions with Affiliates (continued)
DIFSC is also the transfer agent and dividend disbursing agent of the Series. For these services, DIFSC’s fees are calculated daily and paid monthly at the annual rate of 0.0075% of the Series’ average daily net assets. This amount is included on the “Statement of operations” under “Dividend disbursing and transfer agent fees and expenses.” For the year ended Dec. 31, 2018, the Series was charged $185,550 for these services. Pursuant to asub-transfer agency agreement between DIFSC and BNY Mellon Investment Servicing (US) Inc. (BNYMIS), BNYMIS provides certainsub-transfer agency services to the Series.Sub-transfer agency fees are paid by the Series and are also included on the “Statement of operations” under “Dividend disbursing and transfer agent fees and expenses.”
Pursuant to a distribution agreement and distribution plan, the Series pays DDLP, the distributor and an affiliate of DMC, an annual12b-1 fee of 0.30% of the average daily net assets of the Service Class shares. Prior to May 1, 2018, DDLP had contracted to waive12b-1 fees in order to limit12b-1 fees of the Service Class shares to 0.25% of average daily net assets. The fees are calculated daily and paid monthly. Standard Class shares pay no12b-1 fees.
As provided in the investment management agreement, the Series bears a portion of the cost of certain resources shared with DMC, including the cost of internal personnel of DMC and/or its affiliates that provide legal, tax, and regulatory reporting services to the Series. For the year ended Dec. 31, 2018, the Series was charged $73,549 for internal legal, tax, and regulatory reporting services provided by DMC and/or its affiliates’ employees. This amount is included on the “Statement of operations” under “Legal fees.”
Trustees’ fees include expenses accrued by the Series for each Trustee’s retainer and meeting fees. Certain officers of DMC, DIFSC, and DDLP are officers and/or Trustees of the Trust. These officers and Trustees are paid no compensation by the Series.
*The aggregate contractual waiver period covering this report is from April 30, 2018 through April 30, 2019.
3. Investments
For the year ended Dec. 31, 2018, the Series made purchases and sales of investment securities other than short-term investments as follows:
| | | | |
Purchases other than US government securities | | $ | 1,846,137,871 | |
Purchases of US government securities | | | 1,669,654,804 | |
Sales other than US government securities | | | 1,679,045,394 | |
Sales of US government securities | | | 1,767,375,775 | |
The tax cost of investments includes adjustments to net unrealized appreciation (depreciation) which may not necessarily be final tax cost basis adjustments, but approximate the tax basis unrealized gains and losses that may be realized and distributed to shareholders. At Dec. 31, 2018, the cost and unrealized appreciation (depreciation) of investments and derivatives for federal income tax purposes for the Series were as follows:
| | | | | | |
Cost of Investments and Derivatives | | Aggregate
Unrealized
Appreciation of
Investments | | Aggregate
Unrealized
Depreciation of
Investments | | Net Unrealized
Depreciation of
Investments |
| $2,457,772,599 | | $21,301,184 | | $(81,683,183) | | $(60,381,999) |
US GAAP defines fair value as the price that the Series would receive to sell an asset or pay to transfer a liability in an orderly transaction between market participants at the measurement date under current market conditions. A three-level hierarchy for fair value measurements has been established based upon the transparency of inputs to the valuation of an asset or liability. Inputs may be observable or unobservable and refer broadly to the assumptions that market participants would use in pricing the asset or liability. Observable inputs reflect the assumptions market participants would use in pricing the asset or liability based on market data obtained from sources independent of the reporting entity. Unobservable inputs reflect the reporting entity’s own assumptions about the assumptions that market participants would use in pricing the asset or liability based on the best information available under the circumstances. The Series’ investment in its entirety is assigned a level based upon the observability of the inputs which are significant to the overall valuation. The three-level hierarchy of inputs is summarized below and on the next page.
| | |
| Level 1 – | | Inputs are quoted prices in active markets for identical investments. (Examples: equity securities,open-end investment companies, futures contracts, exchange-traded options contracts) |
| Level 2 – | | Other observable inputs, including, but not limited to: quoted prices for similar assets or liabilities in markets that are active, quoted prices for identical or similar assets or liabilities in markets that are not active, inputs other than quoted prices that are observable for the assets or liabilities (such as interest rates, yield curves, volatilities, prepayment speeds, loss severities, credit risks, and default rates) or other market-corroborated inputs. (Examples: debt securities, government securities, swap contracts, foreign currency exchange contracts, foreign securities utilizing international fair value pricing, broker-quoted securities, fair valued securities) |
| | |
| | Diversified Income Series-43 |
Delaware VIP® Diversified Income Series
Notes to financial statements (continued)
3. Investments (continued)
Level 3 – Significant unobservable inputs, including the Series’ own assumptions used to determine the fair value of investments. (Examples: broker-quoted securities, fair valued securities)
Level 3 investments are valued using significant unobservable inputs. The Series may also use an income-based valuation approach in which the anticipated future cash flows of the investment are discounted to calculate fair value. Discounts may also be applied due to the nature or duration of any restrictions on the disposition of the investments. Valuations may also be based upon current market prices of securities that are comparable in coupon, rating, maturity, and industry. The derived value of a Level 3 investment may not represent the value which is received upon disposition and this could impact the results of operations.
The following table summarizes the valuation of the Series’ investments by fair value hierarchy levels as of Dec. 31, 2018:
| | | | | | | | | | | | | | | | | | | | |
| | | Level 1 | | Level 2 | | Level 3 | | Total |
Securities | | | | | | | | | | | | | | | | | | | | |
Assets: | | | | | | | | | | | | | | | | | | | | |
Agency, Asset- & Mortgage-Backed Securities | | | $ | — | | | | $ | 634,986,055 | | | | $ | — | | | | $ | 634,986,055 | |
Collateralized Debt Obligations | | | | — | | | | | 120,234,650 | | | | | — | | | | | 120,234,650 | |
Corporate Debt | | | | — | | | | | 1,029,219,648 | | | | | — | | | | | 1,029,219,648 | |
Foreign Debt | | | | — | | | | | 74,586,333 | | | | | — | | | | | 74,586,333 | |
Municipal Bonds | | | | — | | | | | 3,433,052 | | | | | — | | | | | 3,433,052 | |
Loan Agreements1 | | | | — | | | | | 155,685,000 | | | | | 9,760,559 | | | | | 165,445,559 | |
US Treasury Obligations | | | | — | | | | | 279,820,024 | | | | | — | | | | | 279,820,024 | |
Common Stock | | | | 204,505 | | | | | — | | | | | — | | | | | 204,505 | |
Convertible Preferred Stock1 | | | | 11,027,624 | | | | | 5,643,607 | | | | | — | | | | | 16,671,231 | |
Preferred Stock | | | | — | | | | | 6,407,243 | | | | | — | | | | | 6,407,243 | |
Short-Term Investments | | | | — | | | | | 52,571,226 | | | | | — | | | | | 52,571,226 | |
| | | | | | | | | | | | | | | | | | | | |
Total Value of Securities | | | $ | 11,232,129 | | | | $ | 2,362,586,838 | | | | $ | 9,760,559 | | | | $ | 2,383,579,526 | |
| | | | | | | | | | | | | | | | | | | | |
| | | | |
Derivatives:2 | | | | | | | | | | | | | | | | | | | | |
Assets: | | | | | | | | | | | | | | | | | | | | |
Foreign Currency Exchange Contracts | | | $ | — | | | | $ | 553,650 | | | | $ | — | | | | $ | 553,650 | |
Futures Contracts | | | | 14,109,392 | | | | | — | | | | | — | | | | | 14,109,392 | |
Swap Contracts | | | | — | | | | | 64,253 | | | | | — | | | | | 64,253 | |
Liabilities: | | | | | | | | | | | | | | | | | | | | |
Foreign Currency Exchange Contracts | | | | — | | | | | (318,384 | ) | | | | — | | | | | (318,384 | ) |
Swap Contracts | | | | — | | | | | (597,837 | ) | | | | — | | | | | (597,837 | ) |
1Security type is valued across multiple levels. Level 1 investments represent exchange-traded investments, Level 2 investments represent investments with observable inputs or matrix-priced investments, and Level 3 investments represent investments without observable inputs. The amounts attributed to Level 1 investments, Level 2 investments, and Level 3 investments represent the following percentages of the total value of these security types:
| | | | | | | | | | | | | | | | | | | | |
| | | Level 1 | | Level 2 | | Level 3 | | Total |
Loan Agreements | | — | | 94.10% | | 5.90% | | 100.00% |
Convertible Preferred Stock | | 66.15% | | 33.85% | | — | | 100.00% |
2Foreign Currency Exchange contracts, Futures Contracts and Swap Contracts are valued at the unrealized appreciation (depreciation) on the instrument at the year end.
The securities that have been valued at zero on the “Schedule of investments” are considered to be Level 3 investments in this table.
During the year ended Dec. 31, 2018, there were no transfers between Level 1 investments, Level 2 investments, or Level 3 investments that had a significant impact to the Series. The Series’ policy is to recognize transfers between levels based on fair value at the beginning of the reporting period.
A reconciliation of Level 3 investments is presented when the Series has a significant amount of Level 3 investments at the beginning, interim, or end of period in relation to the Series’ net assets. Management has determined not to provide a reconciliation of Level 3 investments as the Level 3 investments were not considered significant to the Series’ net assets at the beginning, interim, or end of the period. Management has determined not to provide additional disclosure on Level 3 inputs since the Level 3 investments are not considered significant to the Series’ net assets at the end of the year.
| | |
| | Diversified Income Series-44 |
Delaware VIP® Diversified Income Series
Notes to financial statements (continued)
4. Dividend and Distribution Information
Income and long-term capital gain distributions are determined in accordance with federal income tax regulations, which may differ from US GAAP. Additionally, distributions from net gains on foreign currency transactions and net short-term gains on sales of investment securities are treated as ordinary income for federal income tax purposes. The tax character of dividends and distributions paid during the years ended Dec. 31, 2018 and 2017 was as follows:
| | | | | | | | |
| | | Year ended | |
| | | 12/31/18 | | | 12/31/17 | |
Ordinary income | | $ | 74,479,384 | | | $ | 58,589,374 | |
5. Components of Net Assets on a Tax Basis
As of Dec. 31, 2018, the components of net assets on a tax basis were as follows:
| | | | |
| |
Shares of beneficial interest | | $ | 2,440,107,729 | |
Undistributed ordinary income | | | 64,924,278 | |
Troubled debt litigation | | | (3,045,916 | ) |
Capital loss carryforwards | | | (84,583,434 | ) |
Net unrealized depreciation on investments, foreign currencies, and derivatives | | | (60,381,999 | ) |
| | | | |
Net assets | | $ | 2,357,020,658 | |
| | | | |
The differences between book basis and tax basis components of net assets are primarily attributable to tax deferral of losses on wash sales,mark-to-market of futures contracts,mark-to-market of foreign currency exchange contracts, straddle losses, amortization on convertible bonds, contingent payment debt instruments, tax treatment of CDS contracts, trust preferred securities, and deemed dividend income.
At Dec. 31, 2018, capital loss carryforwards available to offset future realized gains were as follows:
| | | | | | | | | | | | |
| | | Loss carryforward character | |
| | | No Expiration | |
| | | Short-term | | | Long-term | | | Total | |
| | $ | 47,774,823 | | | $ | 36,808,611 | | | $ | 84,583,434 | |
| | | |
| 6. Capital Shares | | | | | | | | | | | | |
| | | |
| Transactions in capital shares were as follows: | | | | | | | | | | | | |
| | | | | | | | |
| | | Year ended | |
| | | 12/31/18 | | | 12/31/17 | |
Shares sold: | | | | | | | | |
Standard Class | | | 2,642,484 | | | | 2,521,490 | |
Service Class | | | 10,279,208 | | | | 20,249,530 | |
Shares issued upon reinvestment of dividends and distributions: | | | | | | | | |
Standard Class | | | 1,031,191 | | | | 841,290 | |
Service Class | | | 6,418,010 | | | | 4,887,409 | |
| | | | | | | | |
| | | 20,370,893 | | | | 28,499,719 | |
| | | | | | | | |
Shares redeemed: | | | | | | | | |
Standard Class | | | (2,963,149 | ) | | | (3,067,813 | ) |
Service Class | | | (20,497,216 | ) | | | (3,519,410 | ) |
| | | | | | | | |
| | | (23,460,365 | ) | | | (6,587,223 | ) |
| | | | | | | | |
Net increase (decrease) | | | (3,089,472 | ) | | | 21,912,496 | |
| | | | | | | | |
| | |
| | Diversified Income Series-45 |
Delaware VIP® Diversified Income Series
Notes to financial statements (continued)
7. Line of Credit
The Series, along with certain other funds in the Delaware Funds (Participants), was a participant in a revolving line of credit intended to be used for temporary or emergency purposes as an additional source of liquidity to fund redemptions of investor shares. The revolving line of credit available was reduced from $155,000,000 to 130,000,000 on Sep. 6, 2018. Under the agreement, the Participants were charged an annual commitment fee of 0.15%, which is allocated across the Participants based on a weighted average of the respective net assets of each Participant. The Participants were permitted to borrow up to a maximum ofone-third of their net assets under the agreement. Each Participant was individually, and not jointly, liable for its particular advances, if any, under the line of credit. The line of credit available under the agreement expired on Nov. 5, 2018.
On Nov. 5, 2018, the Participants entered into an amendment to the agreement for a $190,000,000 revolving line of credit. The revolving line of credit was increased to $220,000,000 on Nov. 29, 2018. The revolving line of credit is to be used as described above and operates in substantially the same manner as the original agreement. The line of credit available under the agreement expires on Nov. 4, 2019.
The Series had no amounts outstanding as of Dec. 31, 2018, or at any time during the year then ended.
8. Derivatives
US GAAP requires disclosures that enable investors to understand: (1) how and why an entity uses derivatives; (2) how they are accounted for; and (3) how they affect an entity’s results of operations and financial position.
Foreign Currency Exchange Contracts— The Series may enter into foreign currency exchange contracts and foreign cross currency exchange contracts as a way of managing foreign exchange rate risk. The Series may enter into these contracts to fix the US dollar value of a security that it has agreed to buy or sell for the period between the date the trade was entered into and the date the security is delivered and paid for. The Series may also use these contracts to hedge the US dollar value of securities it already owns that are denominated in foreign currencies. In addition, the Series may enter into these contracts to facilitate or expedite the settlement of portfolio transactions. The change in value is recorded as an unrealized gain or loss. When the contract is closed, a realized gain or loss is recorded equal to the difference between the value of the contract at the time it was opened and the value at the time it was closed.
The use of foreign currency exchange contracts and foreign cross currency exchange contracts does not eliminate fluctuations in the underlying prices of the securities, but does establish a rate of exchange that can be achieved in the future. Although foreign currency exchange contracts and foreign cross currency exchange contracts limit the risk of loss due to an unfavorable change in the value of the hedged currency, they also limit any potential gain that might result should the value of the currency change favorably. In addition, the Series could be exposed to risks if the counterparties to the contracts are unable to meet the terms of their contracts. The Series’ maximum risk of loss from counterparty credit risk is the value of its currency exchanged with the counterparty. The risk is generally mitigated by having a netting arrangement between the Series and the counterparty and by the posting of collateral by the counterparty to the Series to cover the Series’ exposure to the counterparty.
During the year ended Dec. 31, 2018, the Series entered into foreign currency exchange contracts to hedge the US dollar value of securities it already owns that are denominated in foreign currencies.
Futures Contracts— A futures contract is an agreement in which the writer (or seller) of the contract agrees to deliver to the buyer an amount of cash or securities equal to a specific dollar amount times the difference between the value of a specific security or index at the close of the last trading day of the contract and the price at which the agreement is made. The Series may use futures contracts in the normal course of pursuing its investment objective. The Series may invest in futures contracts to hedge its existing portfolio securities against fluctuations in value caused by changes in interest rates or market conditions. Upon entering into a futures contract, the Series deposits cash or pledges US government securities to a broker, equal to the minimum “initial margin” requirements of the exchange on which the contract is traded. Subsequent payments are received from the broker or paid to the broker each day, based on the daily fluctuation in the market value of the contract. These receipts or payments are known as “variation margin” and are recorded daily by the Series as unrealized gains or losses until the contracts are closed. When the contracts are closed, the Series records a realized gain or loss equal to the difference between the value of the contract at the time it was opened and the value at the time it was closed. Risks of entering into futures contracts include potential imperfect correlation between the futures contracts and the underlying securities and the possibility of an illiquid secondary market for these instruments. When investing in futures, there is reduced counterparty credit risk to the Series because futures are exchange-traded and the exchange’s clearinghouse, as counterparty to all exchange-traded futures, guarantees against default. At Dec. 31, 2018, the Series posted $6,826,963 in security as collateral for open futures contracts. Security collateral is presented on the ”Schedule of investments.“
During the year ended Dec. 31, 2018, the Series entered into futures contracts to hedge the Series’ existing portfolio securities against fluctuations in value caused by changes in interest rates or market conditions.
| | |
| | Diversified Income Series-46 |
Delaware VIP® Diversified Income Series
Notes to financial statements (continued)
8. Derivatives (continued)
Options Contracts— The Series may enter into options contracts in the normal course of pursuing its investment objective. The Series may buy or write options contracts for any number of reasons, including without limitation: to manage the Series’ exposure to changes in securities prices caused by interest rates or market conditions and foreign currencies; as an efficient means of adjusting the Series’ overall exposure to certain markets; to protect the value of portfolio securities; and as a cash management tool. The Series may buy or write call or put options on securities, futures, swaps, swaptions, financial indices, and foreign currencies. When the Series buys an option, a premium is paid and an asset is recorded and adjusted on a daily basis to reflect the current market value of the option purchased. When the Series writes an option, a premium is received and a liability is recorded and adjusted on a daily basis to reflect the current market value of the option written. Premiums received from writing options that expire unexercised are treated by the Series on the expiration date as realized gains. The difference between the premium received and the amount paid on effecting a closing purchase transaction, including brokerage commissions, is treated as realized gain or loss. If a call option is exercised, the premium is added to the proceeds from the sale of the underlying security in determining whether the Series has a realized gain or loss. If a put option is exercised, the premium reduces the cost basis of the securities purchased by the Series. The Series, as writer of an option, bears the market risk of an unfavorable change in the price of the security underlying the written option. When writing options, the Series is subject to minimal counterparty risk because the counterparty is only obligated to pay premiums and does not bear the market risk of an unfavorable market change. No option contracts were outstanding at Dec. 31, 2018.
During the year ended Dec. 31, 2018, the Series entered into option contracts to manage the Series’ exposure to changes in securities prices caused by interest rates or market conditions.
Swap Contracts— The Series may enter into interest rate swap contracts and CDS contracts in the normal course of pursuing its investment objective. The Series may invest in interest rate swap contracts to manage the Series’ sensitivity to interest rates or to hedge against changes in interest rates. The Series may enter into CDS contracts in order to hedge against a credit event, to enhance total return or to gain exposure to certain securities or markets. The Series will not be permitted to enter into any swap transactions unless, at the time of entering into such transactions, the unsecured long-term debt of the actual counterparty, combined with any credit enhancements, is rated at leastBBB- by Standard & Poor’s Financial Services LLC. (S&P) or Baa3 by Moody’s Investors Service, Inc. (Moody’s) or is determined to be of equivalent credit quality by DMC.
Interest Rate Swaps. An interest rate swap contract is an exchange of interest rates between counterparties. In one instance, an interest rate swap involves payments received by the Series from another party based on a variable or floating interest rate, in return for making payments based on a fixed interest rate. An interest rate swap can also work in reverse with the Series receiving payments based on a fixed interest rate and making payments based on a variable or floating interest rate. Interest rate swaps may be used to adjust the Series’ sensitivity to interest rates or to hedge against changes in interest rates. Periodic payments on such contracts are accrued daily and recorded as unrealized appreciation (depreciation) on swap contracts. Upon periodic payment (receipt) or termination of the contract, such amounts are recorded as realized gains or losses on swap contracts. The Series’ maximum risk of loss from counterparty credit risk is the discounted net value of the cash flows to be received from/paid to the counterparty over the interest rate swap contract’s remaining life, to the extent that the amount is positive. This risk is mitigated by (1) for bilateral swap contracts, having a netting arrangement between the Series and the counterparty and by the posting of collateral by the counterparty to the Series to cover the Series’ exposure to the counterparty and (2) for cleared swaps, trading these instruments through a central counterparty.
During the year ended Dec. 31, 2018, the Series entered into interest rate swap contracts to manage the Series’ sensitivity to interest rates or to hedge against changes in interest rates.
Credit Default Swaps. A CDS contract is a risk-transfer instrument through which one party (purchaser of protection) transfers to another party (seller of protection) the financial risk of a credit event (as defined in the CDS agreement), as it relates to a particular reference security or basket of securities (such as an index). In exchange for the protection offered by the seller of protection, the purchaser of protection agrees to pay the seller of protection a periodic amount at a stated rate that is applied to the notional amount of the CDS contract. In addition, an upfront payment may be made or received by the Series in connection with an unwinding or assignment of a CDS contract. Upon the occurrence of a credit event, the seller of protection would pay the par (or other agreed-upon) value of the reference security (or basket of securities) to the counterparty. Credit events generally include, among others, bankruptcy, failure to pay, and obligation default.
During the year ended Dec. 31, 2018, the Series entered into CDS contracts as a purchaser and seller of protection, as a hedge against credit events. Periodic payments (receipts) on such contracts are accrued daily and recorded as unrealized losses (gains) on swap contracts. Upon payment (receipt), such amounts are recorded as realized losses (gains) on swap contracts. Upfront payments made or received in connection with CDS contracts are amortized over the expected life of the CDS contracts as unrealized losses (gains) on swap contracts. The change in value of CDS contracts is recorded daily as unrealized appreciation or depreciation. A realized gain or loss is recorded upon a credit event (as defined in the CDS agreement) or the maturity or termination of the agreement. Initial margin and variation margin is posted to central counterparties for central cleared CDS basket trades, as determined by the applicable central counterparty.
| | |
| | Diversified Income Series-47 |
Delaware VIP® Diversified Income Series
Notes to financial statements (continued)
8. Derivatives (continued)
As disclosed in the footnotes to the “Schedule of investments,” at Dec. 31, 2018, the notional value of the protection sold was $13,275,000, which reflects the maximum potential amount the Series would have been required to make as a seller of credit protection if a credit event had occurred. In addition to serving as the source of the current value of the securities, the quoted market prices and resulting market values for credit default swap agreements on securities and credit indices serve as an indicator of the current status of the payment/performance risk and represent the likelihood of an expected liability (or profit) for the credit derivative if the swap agreement has been closed/sold as of the period end. Increasing market values, in absolute terms when compared to the notional amount of the swap, represent a deterioration of the reference entity’s credit soundness and a greater likelihood of risk of default or other credit event occurring as defined under the terms of the agreement. At Dec. 31, 2018, there were no recourse provisions with third parties to recover any amounts paid under the credit derivative agreement (including any purchased credit protection) nor was any collateral held by the Series and other third parties which the Series can obtain occurrence of a credit event. At Dec. 31, 2018, the net unrealized depreciation of the protection sold was $597,837.
CDS contracts may involve greater risks than if the Series had invested in the reference obligation directly. CDS contracts are subject to general market risk, liquidity risk, counterparty risk, and credit risk. The Series’ maximum risk of loss from counterparty credit risk, either as the seller of protection or the buyer of protection, is the fair value of the contract. This risk is mitigated by (1) for bilateral swap contracts, having a netting arrangement between the Series and the counterparty and by the posting of collateral by the counterparty to the Series to cover the Series’ exposure to the counterparty, and (2) for cleared swaps, trading these instruments through a central counterparty.
During the year ended Dec. 31, 2018, the Series entered into CDS contracts to hedge against credit events and to gain exposure to certain securities or markets.
Swaps Generally. For centrally cleared swaps, payments are received from the broker or paid to the broker each day, based on the daily fluctuation in the market value of the contract. These receipts or payments are known as “variation margin” and are recorded by the Series as unrealized gains or losses until the contracts are closed. When the contracts are closed, the Series records a realized gain or loss equal to the difference between the value of the contract at the time it was opened and the value at the time it was closed. The value of open swaps may differ from that which would be realized in the event the Series terminated its position in the contract on a given day. Risks of entering into these contracts include the potential inability of the counterparty to meet the terms of the contracts. This type of risk is generally limited to the amount of favorable movement in the value of the underlying security, instrument, or basket of instruments, if any, at the day of default. Risks also arise from potential losses from adverse market movements and such losses could exceed the unrealized amounts shown on the “Schedule of investments.”
At Dec. 31, 2018, the Series posted $267,371 in cash as collateral for certain open centrally cleared swap contracts, which is included under “Cash collateral due from brokers” on the “Statement of assets and liabilities.” At Dec. 31, 2018, for bilateral open derivatives contracts, the Series posted $2,340,000 in cash as collateral, which is included under “Cash collateral due from brokers” on the “Statement of assets and liabilities.” At Dec. 31, 2018, the Series received $160,000 in cash as collateral for certain open derivatives, which is included under “Cash collateral due to brokers” on the “Statement of assets and liabilities.”
Fair values of derivative instruments as of Dec. 31, 2018 were as follows:
| | | | | | | | | | | | | | | | | | | | |
| | | Asset Derivatives Fair Value | |
| Statement of Assets and Liabilities Location | | Currency
Contracts | | | Equity
Contracts | | | Interest
Rate
Contracts | | | Credit
Contracts | | | Total | |
Unrealized appreciation on foreign currency exchange contracts | | $ | 553,650 | | | $ | — | | | $ | — | | | $ | — | | | $ | 553,650 | |
Variation margin due to broker on futures contracts* | | | — | | | | 278,736 | | | | 13,830,656 | | | | — | | | | 14,109,392 | |
Variation margin due from brokers on centrally cleared credit default swap contracts** | | | — | | | | — | | | | — | | | | 64,253 | | | | 64,253 | |
| | | | | | | | | | | | | | | | | | | | |
Total | | $ | 553,650 | | | $ | 278,736 | | | $ | 13,830,656 | | | $ | 64,253 | | | $ | 14,727,295 | |
| | | | | | | | | | | | | | | | | | | | |
| | |
| | Diversified Income Series-48 |
Delaware VIP® Diversified Income Series
Notes to financial statements (continued)
8. Derivatives (continued)
| | | | | | | | | | | | | | | |
| | | Liability Derivatives Fair Value |
| Statement of Assets and Liabilities Location | | Currency
Contracts | | Credit
Contracts | | Total |
Unrealized depreciation on foreign currency exchange contracts | | | $ | 318,384 | | | | $ | — | | | | $ | 318,384 | |
Unrealized depreciation on credit default swap contracts | | | | — | | | | | 597,837 | | | | | 597,837 | |
| | | | | | | | | | | | | | | |
Total | | | $ | 318,384 | | | | $ | 597,837 | | | | $ | 916,221 | |
| | | | | | | | | | | | | | | |
*Includes cumulative appreciation (depreciation) of futures contracts from the date the contracts were opened through Dec. 31, 2018. Only current day variation margin is reported on the “Statement of assets and liabilities.”
**Includes cumulative appreciation (depreciation) of centrally cleared credit default swap contracts from the date the contracts were opened through Dec. 31, 2018. Only current day variation margin is reported on the “Statement of assets and liabilities.”
The effect of derivative instruments on the “Statement of operations” for the year ended Dec. 31, 2018 was as follows:
| | | | | | | | | | | | | | | | | | | | | | | | | |
| | | Net Realized Gain (Loss) on: |
| | | Foreign | | | | | | | | |
| | | Currency | | Futures | | Options | | Swap | | |
| | | Exchange Contracts | | Contracts | | Purchased | | Contracts | | Total |
Currency contracts | | | $ | 465,603 | | | | $ | — | | | | $ | (411,218 | ) | | | $ | — | | | | $ | 54,385 | |
Equity contracts | | | | — | | | | | (1,395,616 | ) | | | | — | | | | | — | | | | | (1,395,616 | ) |
Interest rate contracts | | | | — | | | | | 3,117,052 | | | | | 477,724 | | | | | 303,872 | | | | | 3,898,648 | |
Credit contracts | | | | — | | | | | — | | | | | — | | | | | (1,583,375 | ) | | | | (1,583,375 | ) |
| | | | | | | | | | | | | | | | | | | | | | | | | |
Total | | | $ | 465,603 | | | | $ | 1,721,436 | | | | $ | 66,506 | | | | $ | (1,279,503 | ) | | | $ | 974,042 | |
| | | | | | | | | | | | | | | | | | | | | | | | | |
| |
| | | Net Change in Unrealized Appreciation (Depreciation) of: |
| | | Foreign | | | | | | | | |
| | | Currency | | Futures | | Options | | Swaps | | |
| | | Exchange Contracts | | Contracts | | Purchased | | Contracts | | Total |
Currency contracts | | | $ | 859,056 | | | | $ | — | | | | $ | 232,248 | | | | $ | — | | | | $ | 1,091,304 | |
Equity contracts | | | | — | | | | | 278,736 | | | | | — | | | | | — | | | | | 278,736 | |
Interest rate contracts | | | | — | | | | | 14,529,049 | | | | | — | | | | | 298,700 | | | | | 14,827,749 | |
Credit contracts | | | | — | | | | | — | | | | | — | | | | | 42,194 | | | | | 42,194 | |
| | | | | | | | | | | | | | | | | | | | | | | | | |
Total | | | $ | 859,056 | | | | $ | 14,807,785 | | | | $ | 232,248 | | | | $ | 340,894 | | | | $ | 16,239,983 | |
| | | | | | | | | | | | | | | | | | | | | | | | | |
Derivatives Generally.The table below summarizes the average balance of derivative holdings by the Series during the year ended Dec. 31, 2018:
| | | | | | | | | | | | |
| | | Long | | | Short | |
| | | Derivatives | | | Derivatives | |
| | | Volume | | | Volume | |
Foreign currency exchange contracts (average cost) | | | USD | | | | 56,045,737 | | | | USD 79,926,047 | |
Futures contracts (average notional value) | | | | | | | 232,490,254 | | | | 54,132,880 | |
Options contracts (average value) | | | | | | | 79,396 | | | | — | |
CDS contracts (average notional value)* | | | | | | | 28,866,045 | | | | 13,393,155 | |
CDS contracts (average notional value)* | | | EUR | | | | 544,762 | | | | — | |
Interest rate swap contracts (average notional value)** | | | USD | | | | — | | | | 3,390,238 | |
* Long represents buying protection and short represents selling protection.
**Long represents receiving fixed interest payments and short represents paying fixed interest payments.
9. Offsetting
The Series entered into an International Swaps and Derivatives Association, Inc. Master Agreement (ISDA Master Agreement) or a similar agreement with certain of its derivative contract counterparties in order to better define its contractual rights and to secure rights that will help the Series mitigate its counterparty risk. An ISDA Master Agreement is a bilateral agreement between the Series and a counterparty that governs certainover-the-counter
| | |
| | Diversified Income Series-49 |
Delaware VIP® Diversified Income Series
Notes to financial statements (continued)
9. Offsetting (continued)
derivatives and foreign exchange contracts and typically contains, among other things, collateral posting items and netting provisions in the event of a default and/or termination event. Under an ISDA Master Agreement, the Series may, under certain circumstances, offset with the counterparty certain derivative financial instruments’ payables and/or receivables with collateral held and/or posted and create one single net payment. The provisions of the ISDA Master Agreement typically permit a single net payment in the event of default(close-out), including the bankruptcy or insolvency of the counterparty. However, bankruptcy or insolvency laws of a particular jurisdiction may impose restrictions on or prohibitions against the right of offset in bankruptcy, insolvency, or other events.
For financial reporting purposes, the Series does not offset derivative assets and derivative liabilities that are subject to netting arrangements on the “Statement of assets and liabilities.”
At Dec. 31, 2018, the Series had the following assets and liabilities subject to offsetting provisions:
Offsetting of Financial Assets and Liabilities and Derivative Assets and Liabilities
| | | | | | | | | | | | | | | |
| | | Gross Value of | | Gross Value of | | |
| Counterparty | | Derivative Asset | | Derivative Liability | | Net Position(a) |
Bank of America, N.A | | | $ | 210,374 | | | | $ | (240,852 | ) | | | $ | (30,478 | ) |
BNP Paribas | | | | 65,805 | | | | | — | | | | | 65,805 | |
HSBC Bank USA, National Association | | | | 25,538 | | | | | — | | | | | 25,538 | |
JPMorgan Chase Bank, National Association | | | | — | | | | | (77,532 | ) | | | | (77,532 | ) |
Morgan Stanley Capital Services LLC | | | | — | | | | | (597,837 | ) | | | | (597,837 | ) |
The Toronto-Dominion Bank | | | | 251,933 | | | | | — | | | | | 251,933 | |
| | | | | | | | | | | | | | | |
Total | | | $ | 553,650 | | | | $ | (916,221 | ) | | | $ | (362,571 | ) |
| | | | | | | | | | | | | | | |
| | | | | | | | | | | | | | | | | | | | | | | | | | | | | | |
| | | | | Fair Value of | | | | Fair Value of | | | | |
| | | | | Non-Cash | | Cash Collateral | | Non-Cash | | Cash Collateral | | |
| Counterparty | | Net Position | | Collateral Received | | Received | | Collateral Pledged | | Pledged | | Net Exposure(a) |
Bank of America, N.A | | | $ | (30,478 | ) | | | $ | — | | | | $ | — | | | | $ | — | | | | $ | 30,478 | | | | $ | — | |
BNP Paribas | | | | 65,805 | | | | | — | | | | | — | | | | | — | | | | | — | | | | | 65,805 | |
HSBC Bank USA, National Association | | | | 25,538 | | | | | — | | | | | — | | | | | — | | | | | — | | | | | 25,538 | |
JPMorgan Chase Bank, National Association | | | | (77,532 | ) | | | | — | | | | | — | | | | | — | | | | | 60,000 | | | | | (17,532 | ) |
Morgan Stanley Capital Services LLC | | | | (597,837 | ) | | | | — | | | | | — | | | | | — | | | | | 597,837 | | | | | — | |
The Toronto-Dominion Bank | | | | 251,933 | | | | | — | | | | | (160,000 | ) | | | | — | | | | | — | | | | | 91,933 | |
| | | | | | | | | | | | | | | | | | | | | | | | | | | | | | |
Total | | | $ | (362,571 | ) | | | $ | — | | | | $ | (160,000 | ) | | | $ | — | | | | $ | 688,315 | | | | $ | 165,744 | |
| | | | | | | | | | | | | | | | | | | | | | | | | | | | | | |
Master Repurchase Agreements
Repurchase agreements are entered into by the Series under Master Repurchase Agreements (each, an MRA). The MRA permits the Series, under certain circumstances including an event of default (such as bankruptcy or insolvency), to offset payables and/or receivables with collateral held by and/or posted to the counterparty. As a result, one single net payment is created. Bankruptcy or insolvency laws of a particular jurisdiction may impose restrictions on or prohibitions against such a right of offset in the event of the MRA counterparty’s bankruptcy or insolvency. Based on the terms of the MRA, the Series receives securities as collateral with a market value in excess of the repurchase price at maturity. Upon a bankruptcy or insolvency of the MRA counterparty, the Series would recognize a liability with respect to such excess collateral. The liability reflects the Series’ obligation under bankruptcy law to return the excess to the counterparty. As of Dec. 31, 2018, the following table is a summary of the Series’ repurchase agreements by counterparty which are subject to offset under an MRA:
| | | | | | | | | | | | | | | | | | | | | | | | | |
| | | | | Fair Value of | | | | Net | | |
| | | Repurchase | | Non-Cash | | Cash Collateral | | Collateral | | |
| Counterparty | | Agreements | | Collateral Received(b) | | Received | | Received | | Net Exposure(a) |
Bank of America Merrill Lynch | | | $ | 4,987,133 | | | | $ | — | | | | $ | (4,987,133 | ) | | | $ | (4,987,133 | ) | | | $ | — | |
Bank of Montreal | | | | 13,714,614 | | | | | (13,714,614 | ) | | | | — | | | | | (13,714,614 | ) | | | | — | |
BNP Paribas | | | | 22,425,788 | | | | | (22,425,788 | ) | | | | — | | | | | (22,425,788 | ) | | | | — | |
| | | | | | | | | | | | | | | | | | | | | | | | | |
Total | | | $ | 41,127,535 | | | | $ | (36,140,402 | ) | | | $ | (4,987,133 | ) | | | $ | (41,127,535 | ) | | | $ | — | |
| | | | | | | | | | | | | | | | | | | | | | | | | |
| | |
| | Diversified Income Series-50 |
Delaware VIP® Diversified Income Series
Notes to financial statements (continued)
9. Offsetting (continued)
Master Securities Forward Transaction Agreements
Master Securities Forward Transaction Agreements (MFA) govern certain forward settling transactions, such as TBA securities, delayed-delivery or sale-buyback transactions by and between the Fund and select counterparties. The MFA maintain provisions for, among other things, transaction initiation and confirmation, payment and transfer, events of default, termination, and maintenance of collateral. As of Dec. 31, 2018, the following table is a summary of the Fund’s TBA securities by counterparty which are subject to offsetting under MFA:
| | | | | | | | | | | | | | | | |
| | | | | | Cash | | | Cash | | | | |
| | | TBA | | | Collateral | | | Collateral | | | Net | |
| Counterparty | | at Value | | | Received | | | Pledged | | | Exposure(a) | |
Goldman Sachs Bank USA | | | $51,756,083 | | | | $(980,000 | ) | | | $— | | | | $50,776,083 | |
(a)Net exposure represents the receivable (payable) that would be due from (to) the counterparty in an event of default.
(b)The value of the related collateral received exceeded the value of the net position and repurchase agreements as of Dec. 31, 2018.
10. Securities Lending
The Series, along with other funds in the Delaware Funds, may lend its securities pursuant to a security lending agreement (Lending Agreement) with The Bank of New York Mellon (BNY Mellon). At the time a security is loaned, the borrower must post collateral equal to the required percentage of the market value of the loaned security, including any accrued interest. The required percentage is: (1) 102% with respect to US securities and foreign securities that are denominated and payable in US dollars; and (2) 105% with respect to foreign securities. With respect to each loan, if on any business day, the aggregate market value of securities collateral plus cash collateral held is less than the aggregate market value of the securities which are the subject of such loan, the borrower will be notified to provide additional collateral by the end of the following business day which, together with the collateral already held, will be not less than the applicable initial collateral requirements for such security loan. If the aggregate market value of securities collateral and cash collateral held with respect to a security loan exceeds the applicable initial collateral requirement, upon request of the borrower, BNY Mellon must return enough collateral to the borrower by the end of the following business day to reduce the value of the remaining collateral to the applicable initial collateral requirement for such security loan. As a result of the foregoing, the value of the collateral held with respect to a loaned security on any particular day may be more or less than the value of the security on loan. The collateral percentage with respect to the market value of the loaned security is determined by the security lending agent.
Cash collateral received by each Series of the Trust is generally invested in a series of individual separate accounts, each corresponding to a series. The investment guidelines permit each separate account to hold certain securities that would be considered eligible securities for a money market fund. Cash collateral received is generally invested in government securities; certain obligations issued by government sponsored enterprises; repurchase agreements collateralized by US Treasury securities; obligations issued by the central government of any Organization for Economic Cooperation and Development (OECD) country or its agencies, instrumentalities, or establishments; obligations of supranational organizations; commercial paper, notes, bonds, and other debt obligations; certificates of deposit, time deposits, and other bank obligations; and asset-backed securities. A Series can also accept US government securities and letters of credit(non-cash collateral) in connection with securities loans.
In the event of default or bankruptcy by the lending agent, realization and/or retention of the collateral may be subject to legal proceedings. In the event the borrower fails to return loaned securities and the collateral received is insufficient to cover the value of the loaned securities and provided such collateral shortfall is not the result of investment losses, the lending agent has agreed to pay the amount of the shortfall to the Series or, at the discretion of the lending agent, replace the loaned securities. The Series continues to record dividends or interest, as applicable, on the securities loaned and is subject to changes in value of the securities loaned that may occur during the term of the loan. The Series has the right under the Lending Agreement to recover the securities from the borrower on demand. With respect to security loans collateralized bynon-cash collateral, the Series receives loan premiums paid by the borrower. With respect to security loans collateralized by cash collateral, the earnings from the collateral investments are shared among the Series, the security lending agent, and the borrower. The Series records security lending income net of allocations to the security lending agent, and the borrower.
The Series may incur investment losses as a result of investing securities lending collateral. This could occur if an investment in the collateral investment account defaulted or became impaired. Under those circumstances, the value of the Series’ cash collateral account may be less than the amount the Series would be required to return to the borrowers of the securities and the Series would be required to make up for this shortfall.
During the year ended Dec. 31, 2018, the Series had no securities out on loan.
| | |
| | Diversified Income Series-51 |
Delaware VIP® Diversified Income Series
Notes to financial statements (continued)
11. Credit and Market Risk
When interest rates rise, fixed income securities (i.e., debt obligations) generally will decline in value. These declines in value are greater for fixed income securities with longer maturities or durations.
Some countries in which the Series may invest require governmental approval for the repatriation of investment income, capital, or the proceeds of sales of securities by foreign investors. In addition, if there is deterioration in a country’s balance of payments or for other reasons, a country may impose temporary restrictions on foreign capital remittances abroad.
The securities exchanges of certain foreign markets are substantially smaller, less liquid, and more volatile than the major securities markets in the United States. Consequently, acquisition and disposition of securities by the Series may be inhibited. In addition, a significant portion of the aggregate market value of securities listed on the major securities exchanges in emerging markets is held by a smaller number of investors. This may limit the number of shares available for acquisition or disposition by the Series.
The Series invests in bank loans and other securities that may subject it to direct indebtedness risk, the risk that the Series will not receive payment of principal, interest, and other amounts due in connection with these investments and will depend primarily on the financial condition of the borrower. Loans that are fully secured offer the Series more protection than unsecured loans in the event of nonpayment of scheduled interest or principal, although there is no assurance that the liquidation of collateral from a secured loan would satisfy the corporate borrower’s obligation, or that the collateral can be liquidated. Some loans or claims may be in default at the time of purchase. Certain of the loans and the other direct indebtedness acquired by the Series may involve revolving credit facilities or other standby financing commitments that obligate the Series to pay additional cash on a certain date or on demand. These commitments may require the Series to increase its investment in a company at a time when the Series might not otherwise decide to do so (including at a time when the company’s financial condition makes it unlikely that such amounts will be repaid). To the extent that the Series is committed to advance additional funds, it will at all times hold and maintain cash or other high grade debt obligations in an amount sufficient to meet such commitments. When a loan agreement is purchased, the Series may pay an assignment fee. On an ongoing basis, the Series may receive a commitment fee based on the undrawn portion of the underlying line of credit portion of a loan agreement. Prepayment penalty fees are received upon the prepayment of a loan agreement by a borrower. Prepayment penalty, facility, commitment, consent, and amendment fees are recorded to income as earned or paid.
As the Series may be required to rely upon another lending institution to collect and pass on to the Series amounts payable with respect to the loan and to enforce the Series’ rights under the loan and other direct indebtedness, an insolvency, bankruptcy, or reorganization of the lending institution may delay or prevent the Series from receiving such amounts. The highly leveraged nature of many loans may make them especially vulnerable to adverse changes in economic or market conditions. Investments in such loans and other direct indebtedness may involve additional risk to the Series.
The Series invests in fixed income securities whose value is derived from an underlying pool of mortgages or consumer loans. The value of these securities is sensitive to changes in economic conditions, including delinquencies and/or defaults, and may be adversely affected by shifts in the market’s perception of the issuers and changes in interest rates. Investors receive principal and interest payments as the underlying mortgages or consumer loans are paid back. Some of these securities are collateralized mortgage obligations (CMOs). CMOs are debt securities issued by US government agencies or by financial institutions and other mortgage lenders, which are collateralized by a pool of mortgages held under an indenture. Prepayment of mortgages may shorten the stated maturity of the obligations and can result in a loss of premium, if any has been paid. Certain of these securities may be stripped (securities which provide only the principal or interest feature of the underlying security). The yield to maturity on an interest-only CMO is extremely sensitive not only to changes in prevailing interest rates, but also to the rate of principal payments (including prepayments) on the related underlying mortgage assets. A rapid rate of principal payments may have a material adverse effect on the Series’ yield to maturity. If the underlying mortgage assets experience greater than anticipated prepayments of principal, the Series may fail to fully recoup its initial investment in these securities even if the securities are rated in the highest rating categories.
The Series invests a portion of its assets in high yield fixed income securities, which are securities rated lower thanBBB- by S&P and lower than Baa3 by Moody’s, or similarly rated by another nationally recognized statistical rating organization. Investments in these higher yielding securities are generally accompanied by a greater degree of credit risk than higher rated securities. Additionally, lower rated securities may be more susceptible to adverse economic and competitive industry conditions than investment grade securities.
The Series invests in certain obligations that may have liquidity protection to ensure that the receipt of payments due on the underlying security is timely. Such protection may be provided through guarantees, insurance policies, or letters of credit obtained by the issuer or sponsor through third parties, through various means of structuring the transaction or through a combination of such approaches. The Series will not pay any additional fees for such credit support, although the existence of credit support may increase the price of the security.
The Series may invest up to 15% of its net assets in illiquid securities, which may include securities with contractual restrictions on resale, securities exempt from registration under Rule 144A promulgated under of the Securities Act of 1933, as amended, and other securities which may not be readily marketable. The relative illiquidity of these securities may impair the Series from disposing of them in a timely manner and at a fair price when it is
| | |
| | Diversified Income Series-52 |
Delaware VIP® Diversified Income Series
Notes to financial statements (continued)
11. Credit and Market Risk (continued)
necessary or desirable to do so. While maintaining oversight, the Board has delegated to DMC, theday-to-day functions of determining whether individual securities are liquid for purposes of the Series’ limitation on investments in illiquid securities. Securities eligible for resale pursuant to Rule 144A, which are determined to be liquid, are not subject to the Series’ 15% limit on investments in illiquid securities. Rule 144A securities have been identified on the ’’Schedule of investments.” Restricted securities are valued pursuant to the security valuation procedures described in Note 1.
12. Contractual Obligations
The Series enters into contracts in the normal course of business that contain a variety of indemnifications. The Series’ maximum exposure under these arrangements is unknown. However, the Series has not had prior claims or losses pursuant to these contracts. Management has reviewed the Series’ existing contracts and expects the risk of loss to be remote.
13. General Motors Term Loan Litigation
The Series received notice of a litigation proceeding related to a General Motors Corporation (G.M.) term loan participation previously held by the Series in 2009. Management believes the matter subject to the litigation notice will likely lead to a recovery from the Series of certain amounts received by the Series because a US Court of Appeals has ruled that the Series and similarly situated investors were unsecured creditors rather than secured lenders of G.M. as a result of an erroneous Uniform Commercial Code filing made by a third-party. The Series received the full principal on the loans in 2009 after the G.M. bankruptcy. However, based on the court ruling the estate is seeking to recover such amounts arguing that, as unsecured creditors, the Series (and other similarly situated lenders) should not have received payment in full. Based on currently available information related to the litigation and the Series’ potential exposure, the Series recorded a contingent liability of $4,351,308 and an asset of $1,305,392 based on the expected recoveries to unsecured creditors as of Dec. 31, 2018 that resulted in a net decrease in the Series’ NAV to reflect this potential recovery.
14. Recent Accounting Pronouncements
In March 2017, the FASB issued an Accounting Standards Update (ASU), ASU2017-08, Receivables — Nonrefundable Fees and Other Costs (Subtopic310-20), Premium Amortization on Purchased Callable Debt Securities which amends the amortization period for certain callable debt securities purchased at a premium, shortening such period to the earliest call date. The ASU2017-08 does not require any accounting change for debt securities held at a discount; the discount continues to be amortized to maturity. The ASU2017-08 is effective for fiscal years, and interim periods within those fiscal years, beginning after Dec. 15, 2018. At this time, management is evaluating the implications of these changes on the financial statements.
In August 2018, the FASB issued an ASU2018-13, which changes certain fair value measurement disclosure requirements. The ASU2018-13, in addition to other modifications and additions, removes the requirement to disclose the amount and reasons for transfers between Level 1 and Level 2 of the fair value hierarchy, the policy for the timing of transfers between levels and the valuation process for Level 3 fair value measurements. The ASU2018-13 is effective for fiscal years, and interim periods within those fiscal years, beginning after Dec. 15, 2019. At this time, management is evaluating the implications of these changes on the financial statements.
In August 2018, the Securities and Exchange Commission (SEC) adopted amendments to RegulationS-X to update and simplify the disclosure requirements for registered investment companies by eliminating requirements that are redundant or duplicative of US GAAP requirements or other SEC disclosure requirements. The new amendments require the presentation of the total, rather than the components, of distributable earnings on the “Statement of assets and liabilities” and the total, rather than the components, of dividends from net investment income and distributions from net realized gains on the “Statements of changes in net assets.” The amendments also removed the requirement for the parenthetical disclosure of undistributed net investment income on the “Statements of changes in net assets” and certain tax adjustments that were reflected in the “Notes to financial statements.” All of these have been reflected in the Series’ financial statements.
15. Subsequent Events
Management has determined that no material events or transactions occurred subsequent to Dec. 31, 2018, that would require recognition or disclosure in the Series’ financial statements.
| | |
| | Diversified Income Series-53 |
Delaware VIP® Trust — Delaware VIP Diversified Income Series
Report of independent registered public accounting firm
To the Board of Trustees of Delaware VIP® Trust and Shareholders of Delaware VIP Diversified Income Series
Opinion on the Financial Statements
We have audited the accompanying statement of assets and liabilities, including the schedule of investments, of Delaware VIP Diversified Income Series (one of the series constituting Delaware VIP® Trust, referred to hereafter as the “Series”) as of December 31, 2018, the related statement of operations for the year ended December 31, 2018, the statements of changes in net assets for each of the two years in the period ended December 31, 2018, including the related notes, and the financial highlights for each of the five years in the period ended December 31, 2018 (collectively referred to as the “financial statements”). In our opinion, the financial statements present fairly, in all material respects, the financial position of the Series as of December 31, 2018, the results of its operations for the year then ended, the changes in its net assets for each of the two years in the period ended December 31, 2018 and the financial highlights for each of the five years in the period ended December 31, 2018 in conformity with accounting principles generally accepted in the United States of America.
Basis for Opinion
These financial statements are the responsibility of the Series’ management. Our responsibility is to express an opinion on the Series’ financial statements based on our audits. We are a public accounting firm registered with the Public Company Accounting Oversight Board (United States) (PCAOB) and are required to be independent with respect to the Series in accordance with the U.S. federal securities laws and the applicable rules and regulations of the Securities and Exchange Commission and the PCAOB.
We conducted our audits of these financial statements in accordance with the standards of the PCAOB. Those standards require that we plan and perform the audit to obtain reasonable assurance about whether the financial statements are free of material misstatement, whether due to error or fraud.
Our audits included performing procedures to assess the risks of material misstatement of the financial statements, whether due to error or fraud, and performing procedures that respond to those risks. Such procedures included examining, on a test basis, evidence regarding the amounts and disclosures in the financial statements. Our audits also included evaluating the accounting principles used and significant estimates made by management, as well as evaluating the overall presentation of the financial statements. Our procedures included confirmation of securities owned as of December 31, 2018 by correspondence with the custodian and brokers; when replies were not received from brokers, we performed other auditing procedures. We believe that our audits provide a reasonable basis for our opinion.
/s/PricewaterhouseCoopers LLP
Philadelphia, Pennsylvania
February 14, 2019
We have served as the auditor of one or more investment companies in Delaware Funds® by Macquarie since 2010.
| | |
| | Diversified Income Series-54 |
Delaware VIP® Trust — Delaware VIP Diversified Income Series
Other Series information (Unaudited)
Board consideration of investment advisory agreement for Delaware VIP Diversified Income Series
At a meeting held on Aug.15-16, 2018 (the “Annual Meeting”), the Board of Trustees (the “Board”), including a majority of disinterested or independent Trustees, approved the renewal of the Investment Advisory Agreement for Delaware VIP Diversified Income Series (the “Series”). In making its decision, the Board considered information furnished at regular quarterly Board meetings, including reports detailing Series performance, investment strategies, and expenses, as well as information prepared specifically in connection with the renewal of the Investment Advisory Agreement. Information furnished specifically in connection with the renewal of the Investment Advisory Agreement with Delaware Management Company (“DMC”), a series of Macquarie Investment Management Business Trust (“MIMBT”), included materials provided by DMC and its affiliates (collectively, “Macquarie Investment Management”) concerning, among other things, the nature, extent, and quality of services provided to the Series; the costs of such services to the Series; economies of scale; and the investment manager’s financial condition and profitability. In addition, in connection with the Annual Meeting, materials were provided to the Trustees in May 2018, including reports provided by Broadridge Financial Solutions (“Broadridge”). The Broadridge reports compared the Series’ investment performance and expenses with those of other comparable mutual funds. The Independent Trustees reviewed and discussed the Broadridge reports with independent legal counsel to the Independent Trustees. In addition to the information noted above, the Board also requested and received information regarding DMC’s policy with respect to advisory fee levels and its breakpoint philosophy; the structure of portfolio manager compensation; comparative client fee information; and any constraints or limitations on the availability of securities for certain investment styles, which had in the past year inhibited, or which were likely in the future to inhibit, the investment manager’s ability to invest fully in accordance with Series policies.
In considering information relating to the approval of the Series’ Investment Advisory Agreement, the Independent Trustees received assistance and advice from and met separately with independent legal counsel to the Independent Trustees and also received assistance and advice from an experienced and knowledgeable independent fund consultant, JDL Consultants, LLC (“JDL”). Although the Board gave attention to all information furnished, the following discussion identifies, under separate headings, the primary factors taken into account by the Board during its contract renewal considerations.
Nature, extent, and quality of services.The Board considered the services provided by DMC to the Series and its shareholders. In reviewing the nature, extent, and quality of services, the Board considered reports furnished to it throughout the year, which covered matters such as the relative performance of the Series, compliance of portfolio managers with the investment policies, strategies and restrictions for the Series, compliance by DMC and Delaware Distributors, L.P. (together, “Management”) personnel with the Code of Ethics adopted throughout the Delaware Funds® by Macquarie (the “Delaware Funds”), and adherence to fair value pricing procedures as established by the Board. The Board was pleased with the current staffing of DMC and the emphasis placed on research in the investment process. The Board recognized DMC’s receipt of certain favorable industry distinctions during the past several years. The Board gave favorable consideration to DMC’s efforts to control expenses while maintaining service levels committed to Series matters. The Board was satisfied with the nature, extent, and quality of the overall services provided by DMC.
Investment performance.The Board placed significant emphasis on the investment performance of the Series in view of the importance of investment performance to shareholders. Although the Board considered performance reports and discussions with portfolio managers at Board meetings throughout the year, the Board gave particular weight to the Broadridge reports furnished for the Annual Meeting. The Broadridge reports prepared for the Series showed the investment performance of its Standard Class shares in comparison to a group of similar funds as selected by Broadridge (the “Performance Universe”). A fund with the best performance ranked first, and a fund with the poorest performance ranked last. The highest/best performing 25% of funds in the Performance Universe make up the first quartile; the next 25%, the second quartile; the next 25%, the third quartile; and the poorest/worst performing 25% of funds in the Performance Universe make up the fourth quartile. Comparative annualized performance for the Series was shown for the past1-,3-,5-, and10-year periods, as applicable, ended Jan. 31, 2018. The Board’s objective is that the Series’ performance for the1-,3-, and5-year periods be at or above the median of its Performance Universe.
Broadridge currently classifies the Series as a core plus bond fund. Management believes that it would be more appropriate to include the Series in the general bond funds category. Accordingly, the Broadridge report prepared for the Series compares the Series’ performance to two separate Performance Universes — one, consisting of all core plus bond funds underlying variable insurance products, and the other, consisting of all general bond funds underlying variable insurance products. When compared to other core plus bond funds, the Broadridge report comparison showed that the Series’ total return for the1-,3-, and5-year periods was in the second quartile of its Performance Universe. The report further showed that the Series’ total return for the10-year period was in the first quartile of its Performance Universe. When compared to other general bond funds, the Broadridge report comparison showed that the Series’ total return for the1-,5-, and10-year periods was in the third quartile of its Performance Universe. The report further showed that Series’ total return for the3-year period was in the fourth quartile of its Performance Universe. The Board observed that, when compared to other general bond funds, the Series’ performance results were not in line with the Board’s objective. In evaluating the Series’ performance, the Board considered the numerous investment and performance reports delivered by Management personnel to the Board’s Investments Committee. The Board was satisfied that Management was taking action to improve Series performance and to meet the Board’s performance objective.
Comparative expenses.The Board considered expense data for the Delaware Funds. Management provided the Board with information on pricing levels and fee structures for the Series as of its most recently completed fiscal year. The Board also focused on the comparative analysis of effective management
| | |
| | Diversified Income Series-55 |
Delaware VIP® Trust — Delaware VIP Diversified Income Series
Other Series information (Unaudited)
Board consideration of investment advisory agreement for Delaware VIP Diversified Income Series (continued)
fees and total expense ratios of the Series versus effective management fees and expense ratios of a group of similar funds as selected by Broadridge (the “Expense Group”). In reviewing comparative costs, the Series’ contractual management fee and the actual management fee incurred by the Series were compared with the contractual management fees (assuming all funds in the Expense Group were similar in size to the Series) and actual management fees (as reported by each fund) within the Expense Group, taking into account any applicable breakpoints and fee waivers. The Series’ total expenses were also compared with those of its Expense Group. The Broadridge total expenses, for comparative consistency, were shown by Broadridge for Standard Class shares which do not charge12b-1 andnon-12b-1 service fees. The Board’s objective is for each Series’ total expense ratio to be competitive with those of the peer funds within its Expense Group.
When compared to other core plus bond funds and other core plus bond/general bond/ high yield funds, the expense comparisons for the Series showed that the actual management fee and total expenses were in the quartile with the highest expenses of its Expense Group. The Series’ total expenses were not in line with the Board’s objective. In evaluating total expenses, the Board considered various initiatives implemented by Management, such as the negotiation of lower fees for fund accounting, fund accounting oversight and custody services, which had created an opportunity for a further reduction in expenses. The Board was satisfied with Management’s efforts to improve the Series’ total expense ratio and to bring it in line with the Board’s objective.
Management profitability.The Board considered the level of profits realized by DMC in connection with the operation of the Series. In this respect, the Board reviewed the Investment Management Profitability Analysis that addressed the overall profitability of DMC’s business in providing management and other services to each of the individual funds and the Delaware Funds as a whole. Specific attention was given to the methodology used by DMC in allocating costs for the purpose of determining profitability. Management stated that the level of profits of DMC, to a certain extent, reflects recent operational cost savings and efficiencies initiated by DMC. The Board considered DMC’s efforts to improve services provided to Fund shareholders and to meet additional regulatory and compliance requirements resulting from recent industry-wide Securities and Exchange Commission initiatives. The Board also considered the extent to which DMC might derive ancillary benefits from fund operations, including the potential for procuring additional business as a result of the prestige and visibility associated with its role as service provider to the Delaware Funds and the benefits from allocation of fund brokerage to improve trading efficiencies. As part of its work, the Board also reviewed a report prepared by JDL regarding MIMBT profitability as compared to certain peer fund complexes and the Independent Trustees met with JDL personnel to discuss DMC’s profitability in such context. The Board found that the management fees were reasonable in light of the services rendered and the profitability of DMC.
Economies of scale.The Trustees considered whether economies of scale are realized by DMC as the Series’ assets increase and the extent to which any economies of scale are reflected in the level of management fees charged. The Trustees reviewed the Series’ advisory fee pricing and structure approved by the Board and shareholders, which includes breakpoints, and which applies to most funds in the Delaware Funds complex. Breakpoints in the advisory fee occur when the advisory fee rate is reduced on assets in excess of specified levels. Breakpoints result in a lower advisory fee, than would otherwise be the case in the absence of breakpoints, when the asset levels specified in the breakpoints are exceeded. The Board noted that, as of March 31, 2018, the Series’ assets exceeded the final breakpoint level. The Board believed that, given the extent to which economies of scale might be realized by DMC and its affiliates, the schedule of fees under the Investment Advisory Agreement provides a sharing of benefits with the Series and its shareholders.
Board consideration ofsub-advisory agreement for Delaware VIP Diversified Income Series
At a meeting held on Nov.14-15, 2018, the Board of Trustees of Delaware VIP Diversified Income Series (the “Series”), including a majority ofnon-interested or independent Trustees (the “Independent Trustees”), approved a newSub-Advisory Agreement between Delaware Management Company (“DMC” or “Management”) and Macquarie Investment Management Austria Kapitalanlage AG (“MIMAK”) for the Series. MIMAK may also be referenced as“sub-advisor” below.
In reaching the decision to approve theSub-Advisory Agreement, the Board considered and reviewed information about MIMAK, including its personnel, operations, and financial condition, which had been provided by MIMAK. The Board also reviewed material furnished by DMC, including: a memorandum from DMC reviewing theSub-Advisory Agreement and the various services proposed to be rendered by MIMAK; information concerning MIMAK’s organizational structure and the experience of its key investment management personnel; copies of MIMAK’s Form ADV, financial statements, compliance policies and procedures, and Codes of Ethics; relevant performance information provided with respect to MIMAK; and a copy of theSub-Advisory Agreement.
In considering such information and materials, the Independent Trustees received assistance and advice from and met separately with independent counsel. The materials prepared by Management in connection with the approval of theSub-Advisory Agreement were sent to the Independent Trustees in advance of the meeting. While attention was given to all information furnished, the following discusses some primary factors relevant to the Board’s decision. This discussion of the information and factors considered by the Board (as well as the discussion above) is not intended to be exhaustive, but rather summarizes certain factors considered by the Board. In view of the wide variety of factors considered, the Board did not, unless otherwise noted,
Diversified Income Series-56
Delaware VIP® Trust — Delaware VIP Diversified Income Series
Other Series information (Unaudited)
Board consideration ofsub-advisory agreement for Delaware VIP Diversified Income Series (continued)
find it practicable to quantify or otherwise assign relative weights to the following factors. In addition, individual Trustees may have assigned different weights to various factors.
Nature, extent, and quality of services.The Board considered the nature, extent, and quality of services that MIMAK would provide as asub-advisor to the Series. The Trustees considered the types of services to be provided by MIMAK in connection with DMC’s management of the Series, and the qualifications and experience of MIMAK’s research team. The Board considered MIMAK’s organization, personnel, and operations. The Trustees also considered Management’s review and recommendation process with respect to MIMAK, and Management’s favorable assessment as to the nature, extent, and quality of the research services to be provided by MIMAK, as well as MIMAK’s ability to render such services based on its experience, organization and resources, were appropriate for the Series, in light of the Series’ investment objective, strategies, and policies.
In discussing the nature of the services proposed to be provided by MIMAK, several Board members observed that, unlike traditionalsub-advisors, who make the investment-related decisions with respect to thesub-advised portfolio, the relationship contemplated in this case is limited to access to MIMAK’son-the-ground research expertise, perspective, and resources.
Sub-advisory fees.The Board considered that DMC would not pay fees in connection with MIMAK’s services. The Board concluded that, in light of the quality and extent of the services to be provided and the nature of the business relationships between DMC and MIMAK, the proposed fee arrangement was understandable and reasonable.
Investment performance.In evaluating performance, the Board considered that MIMAK would provide investment recommendations and ideas, including with respect to specific securities, but that DMC’s portfolio managers for the Series would retain portfolio management discretion over the Series.
Economies of scale andfall-out benefits.The Board considered whether the proposed fee arrangement would reflect economies of scale for the benefit of Series investors as assets in the Series increased, as applicable. The Board also considered that DMC and its affiliates may benefit by leveraging the global resources of its affiliates.
Tax Information
All disclosures are based on financial information available as of the date of this annual report and, accordingly are subject to change. For any and all items requiring reporting, it is the intention of the Series to report the maximum amount permitted under the Internal Revenue Code and the regulations thereunder.
For the year ended Dec. 31, 2018, the Series reports distributions paid during the year as follows:
| | | | |
| | | (A) Ordinary Income Distributions (Tax Basis) | | |
| | 100.00% | | |
(A) is based on a percentage of the Series’ total distributions.
Diversified Income Series-57
Delaware Funds® by Macquarie
Board of trustees/directors and officers addendum
A mutual fund is governed by a Board of Trustees/Directors (“Trustees”), which has oversight responsibility for the management of a fund’s business affairs. Trustees establish procedures and oversee and review the performance of the investment manager, the distributor, and others who perform services for the fund. The independent fund trustees, in particular, are advocates for shareholder interests. Each trustee has served in that capacity since he or she was elected to or appointed to the Board of Trustees, and will continue to serve until his or her retirement or the election of a new trustee in his or her place. The following is a list of the Trustees and Officers with certain background and related information.
| | | | | | | | | | |
Name, Address, and Birth Date | | Position(s) Held with Fund(s) | | Length of Time
Served | | Principal
Occupation(s) During the Past Five Years | | Number of
Portfolios in Fund
Complex Overseen
by Trustee
or Officer | | Other
Directorships
Held by Trustee
or Officer |
| INTERESTED TRUSTEE | | | | | | | | |
| | | | | |
Shawn K. Lytle1,3 2005 Market Street Philadelphia, PA 19103 February 1970 | | President, Chief Executive Officer, and Trustee | | President and Chief Executive Officer since August 2015 Trustee since September 2015 | | President — Macquarie Investment Management2 (June 2015-Present) Regional Head of Americas — UBS Global Asset Management(April 2010-May 2015) | | 59 | | Trustee —
UBS Relationship Funds,
SMA Relationship Trust,
and UBS Funds
(May 2010–April 2015) |
| INDEPENDENT TRUSTEES | | | | | | | | |
| | | | | |
Thomas L. Bennett 2005 Market Street Philadelphia, PA 19103 | | Chair and Trustee | | Trustee since
March 2005 | | Private Investor
(March 2004–Present) | | 59 | | None |
| | | | | |
| October 1947 | | | | Chair since March 2015 | | | | | | |
Jerome D. Abernathy 2005 Market Street
Philadelphia, PA 19103 July 1959 | | Trustee | | Since January 2019 | | Managing Member, Stonebrook Capital Management, LLC (financial technology: macro factors and databases) (January 1993–Present) | | 59 | | None |
Ann D. Borowiec 2005 Market Street
Philadelphia, PA 19103 November 1958 | | Trustee | | Since March 2015 | | Chief Executive Officer, Private Wealth Management
(2011–2013) and Market Manager, New Jersey Private Bank (2005–2011) — J.P. Morgan Chase & Co. | | 59 | | Director —
Banco Santander International
(October 2016-Present) Director —
Santander Bank, N.A.
(December 2016-Present) |
Joseph W. Chow 2005 Market Street
Philadelphia, PA 19103 January 1953 | | Trustee | | Since January 2013 | | Private Investor
(April 2011–Present) | | 59 | | Director and Audit
Committee
Member — Hercules
Technology Growth
Capital, Inc.
(July 2004–July 2014) |
John A. Fry 2005 Market Street
Philadelphia, PA 19103 May 1960 | | Trustee | | Since January 2001 | | President — Drexel University (August 2010–Present) President — Franklin & Marshall College (July 2002–July 2010) | | 59 | | Director; Compensation Committee
and Governance
Committee Member —
Community Health
Systems Director —
Drexel Morgan & Co. Director and Audit
Committee Member —
vTv Therapeutics LLC Director and Audit Committee
Member — FS Credit Real
Estate Income Trust, Inc. |
Lucinda S. Landreth 2005 Market Street
Philadelphia, PA 19103 June 1947 | | Trustee | | Since
March 2005 | | Private Investor
(2004–Present) | | 59 | | None |
Diversified Income Series-58
| | | | | | | | | | |
Name, Address, and Birth Date | | Position(s) Held with Fund(s) | | Length of Time
Served | | Principal
Occupation(s)
During the
Past Five Years | | Number of
Portfolios in Fund
Complex Overseen
by Trustee
or Officer | | Other
Directorships
Held by Trustee
or Officer |
| | | | | |
Frances A. Sevilla-Sacasa
2005 Market Street
Philadelphia, PA 19103 January 1956 | | Trustee | | Since
September 2011 | | Private Investor
(January 2017-Present) Chief Executive Officer —
Banco Itaú
International
(April 2012–December 2016) Executive Advisor to Dean
(August 2011–March 2012)
and Interim Dean (January 2011–July 2011) —
University of Miami School of
Business Administration President — U.S. Trust,
Bank of America Private
Wealth Management
(Private Banking)
(July 2007–December 2008) | | 59 | | Trust Manager and
Audit Committee
Chair — Camden
Property Trust
(August 2011-Present) Director — Carrizo
Oil & Gas, Inc.
(March 2018-Present) |
| | | | | |
Thomas K. Whitford 2005 Market Street
Philadelphia, PA 19103 March 1956 | | Trustee | | Since
January 2013 | | Vice Chairman
(2010–April 2013) —
PNC Financial
Services Group | | 59 | | Director — HSBC North
America Holdings Inc.
(December 2013-Present) Director — HSBC USA Inc.
(July 2014-Present) Director —
HSBC Bank USA,
National Association
(July 2014-March 2017) Director — HSBC
Finance Corporation
(December 2013-April 2018) |
| | | | | |
Christianna Wood 2005 Market Street
Philadelphia, PA 19103 March 1956 | | Trustee | | Since
January 2019 | | Chief Executive Officer
and President —
Gore Creek Capital, Ltd.
(August 2009–Present) | | 59 | | Director and Audit
Committee Member —
H&R Block Corporation
(July 2008-Present) Director and Audit
Committee Member —
Grange Insurance
(2013-Present) Trustee and Audit
Committee Member —
The Merger Fund
(2013-Present),
The Merger Fund VL
(2013-Present);
WCM Alternatives:
Event-Driven Fund
(2013-Present),
and WCM Alternatives:
Credit Event Fund
(December 2017-Present) Director — International
Securities Exchange
(2010-2016) |
| | | | | |
Janet L. Yeomans 2005 Market Street
Philadelphia, PA 19103 July 1948 | | Trustee | | Since
April 1999 | | Vice President and Treasurer
(January 2006–July 2012),
Vice President —
Mergers & Acquisitions
(January 2003–January 2006), and
Vice President and Treasurer
(July 1995–January 2003) —
3M Company | | 59 | | Director; Personnel and
Compensation Committee
Chair; Member of
Nominating, Investments,
and Audit Committees for
various periods
throughout directorship
— Okabena Company
(2009-2017) |
Diversified Income Series-59
| | | | | | | | | | |
Name, Address,
and Birth Date | | Position(s)
Held with
Fund(s) | | Length of Time
Served | | Principal
Occupation(s)
During the
Past Five Years | | Number of
Portfolios in Fund
Complex Overseen
by Trustee
or Officer | | Other
Directorships
Held by
Trustee
or Officer |
| OFFICERS | | | | | | | | | | |
| | | | | |
David F. Connor 2005 Market Street
Philadelphia, PA 19103
December 1963 | | Senior Vice President, General Counsel,
and Secretary | | Senior Vice President, since May 2013; General Counsel since May 2015; Secretary since October 2005 | | David F. Connor has served in
various capacities at different
times at Macquarie Investment
Management. | | 59 | | None3 |
Daniel V. Geatens 2005 Market Street
Philadelphia, PA 19103 October 1972 | | Vice President
and Treasurer | | Vice President
and Treasurer
since
October 2007 | | Daniel V. Geatens has served in
various capacities at different
times at Macquarie Investment
Management. | | 59 | | None3 |
Richard Salus 2005 Market Street
Philadelphia, PA 19103 October 1963 | | Senior
Vice President
and
Chief Financial
Officer | | Senior Vice President
and Chief Financial
Officer since
November 2006 | | Richard Salus has served in
various capacities at different
times at Macquarie Investment
Management. | | 59 | | None3 |
| 1 | Shawn K. Lytle is considered to be an “Interested Trustee” because he is an executive officer of the Fund’s(s’) investment advisor. |
| 2 | Macquarie Investment Management is the marketing name for Macquarie Management Holdings, Inc. and its subsidiaries, including the Fund’s(s’) investment advisor, principal underwriter, and its transfer agent. |
| 3 | Shawn K. Lytle, David F. Connor, Daniel V. Geatens, and Richard Salus serve in similar capacities for the six portfolios of the Optimum Fund Trust, which have the same investment advisor, principal underwriter, and transfer agent as the registrant. Mr. Geatens also serves as the Chief Financial Officer and Treasurer for Macquarie Global Infrastructure Total Return Fund Inc., which has an affiliated investment manager. |
The Statement of Additional Information for the Fund(s) includes additional information about the Trustees and Officers and is available, without charge, upon request by calling 800523-1918.
Diversified Income Series-60
|
The Series files its complete schedule of portfolio holdings with the Securities and Exchange Commission (SEC) for the first and third quarters of each fiscal year on FormN-Q. The Series’ FormsN-Q, as well as a description of the policies and procedures that the Series uses to determine how to vote proxies (if any) relating to portfolio securities are available without charge (i) upon request, by calling 800523-1918; and (ii) on the SEC’s website at sec.gov. In addition, a description of the policies and procedures that the Series uses to determine how to vote proxies (if any) relating to portfolio securities and the Schedule of Investments included in the Series’ most recent FormN-Q are available without charge on the Series’ website at delawarefunds.com/vip/literature. The Series’ FormsN-Q may be reviewed and copied at the SEC’s Public Reference Room in Washington, DC; information on the operation of the Public Reference Room may be obtained by calling 800SEC-0330. Information (if any) regarding how the Series voted proxies relating to portfolio securities during the most recently disclosed12-month period ended June 30 is available without charge (i) through the Series’ website at delawarefunds.com/proxy; and (ii) on the SEC’s website at sec.gov. |
| | |
| AR-VIPDIVINC 22040 (2/19) (730130) | | Diversified IncomeSeries-61 |
| | |
| | |

| |  |
| | |
| | |
| | |
| | |
| | |
| | |
| | |
| | |
| | |
| | |
| | |
| | |
| | |
| | |
| | |
| | |
| | |
| | |
| | |
| | |
| | |
| | Annual report |
| | |
Delaware VIP® Trust
Delaware VIP Emerging Markets Series
December 31, 2018
Table of contents
Other than Macquarie Bank Limited (MBL), none of the entities noted are authorized deposit-taking institutions for the purposes of the Banking Act 1959 (Commonwealth of Australia). The obligations of these entities do not represent deposits or other liabilities of MBL. MBL does not guarantee or otherwise provide assurance in respect of the obligations of these entities, unless noted otherwise. The Series is governed by US laws and regulations.
Unless otherwise noted, views expressed herein are current as of Dec. 31, 2018, and subject to change for events occurring after such date.
The Series is not FDIC insured and is not guaranteed. It is possible to lose the principal amount invested.
Advisory services provided by Delaware Management Company, a series of Macquarie Investment Management Business Trust (MIMBT), a US registered investment advisor.
The Series is distributed byDelaware Distributors, L.P.(DDLP), an affiliate of MIMBT and Macquarie Group Limited. Macquarie Investment Management (MIM), is the marketing name for certain companies comprising the asset management division of Macquarie Group Limited and its subsidiaries and affiliates worldwide.
This material may be used in conjunction with the offering of shares in Delaware VIP Emerging Markets Series only if preceded or accompanied by the Series’ current prospectus or the summary prospectus.
© 2019 Macquarie Management Holdings, Inc.
All third-party marks cited are the property of their respective owners.
| | |
| Delaware VIP®Trust — Delaware VIP Emerging Markets Series | | |
| Portfolio management review | | January 8, 2019 |
For the fiscal year ended Dec. 31, 2018, Delaware VIP Emerging Markets Series (the “Series”) fell 15.81% for Standard Class shares and fell 16.03% for Service Class shares (both returns reflect reinvestment of all dividends). By comparison, the Series’ benchmark, the MSCI Emerging Markets Index, declined 14.58% (net) and 14.25% (gross) for the same period.
During the12-month period, emerging markets experienced volatility underpinned by trade tensions, US interest rate tightening, and concern about slowing economic growth. Almost all countries, save for a few, experienced varying degrees of decline. Turkey declined the most, falling approximately 41%, as both its currency and equities were pressured by concerns of a potential financial crisis. Among sectors, energy was the only sector to deliver positive returns for the period, driven by stabilizing oil prices for the first three quarters of the year. In contrast, consumer discretionary, communication services, and healthcare lagged.
Among regions, Latin America outperformed, driven primarily by Brazil, which ended the year roughly flat. Following an uncertain leadup to the presidential election, Brazilian equities rebounded during the fourth quarter of 2018 as Jair Bolsonaro won decisively, raising investors’ expectations for the implementation of critical reform measures. Additionally, the energy and materials sectors outperformed during 2018 due to strength in commodity prices. At the other end of the spectrum, Mexico and Colombia fell 16% and 12%, respectively. In Mexico, the cancellation of a high-profile airport construction project and proposed regulations on bank fees heightened concern about the new government’s policies. Argentina experienced weakness as its currency depreciated due to concerns about the country’s funding and economy.
Asia, the largest region by benchmark weight, declined with increasing concerns about a growth slowdown in both China and developed economies. North Asia was the epicenter of underperformance, while South and Southeast Asia fared better. In South Korea, softening demand in smartphones and servers reverberated across the technology supply chain, dragging down shares of semiconductor stocks. In China, technology and consumer stocks declined as growth expectations moderated. Concerns about government regulation further dampened performance in the Internet and healthcare sectors. On the positive side, Thailand outperformed, buoyed both by rising energy prices for most of the year and a strengthening economy. India also outperformed driven by export-oriented sectors such as software services.
Europe, the Middle East, and Africa (EMEA) was the weakest-performing region during the period, falling only slightly behind Asia. Qatar was the strongest-performing country, rising 30% during the fiscal year, supported by rising energy prices leading up to the fourth quarter of 2018. Russia outperformed the region amid improving economic data and higher oil prices. As mentioned earlier, Turkey was the weakest performer in the region. South Africa also underperformed as the country continued transitioning to a post-Zuma era, the rand depreciated, and debate about land reform intensified.
The Series’ overweight allocation and stock selection in Brazil contributed to relative performance during the period. Shares ofB2W Cia Digitalrose in sympathy with improving sentiment about Brazil’s economy, optimism toward the company’s shift in sales strategy, and evidence of margin expansion.
In India, stock selection contributed to relative performance during the period. The Series’ largest holding,Reliance Industries Ltd., appreciated as the company continues to invest in the telecommunications, media, and retail businesses, which we expect will drive long-term earnings growth.
In South Korea, stock selection contributed to the Series’ relative performance during the12-month period. Shares of telecommunications operatorsSK Telecom Co. Ltd.andLG Uplus Corp.rose, supported by a stable operating environment and inexpensive valuations. We remain optimistic about these companies’ long-term growth opportunities in 5G wireless networking.
The Series’ underweight allocation to South Africa also contributed to relative performance during the fiscal period. On a sector basis, consumer discretionary, led by B2W, was the largest contributor to performance.
Conversely, China detracted the most from the Series’ relative performance due to unfavorable stock selection. Concerns about slower economic growth weighed on advertising-driven stocks such asSINA Corp. China, Weibo Corp., andBaidu Inc.and consumer staples stocks such asTsingtao Brewery Co. Ltd.andTingyi Cayman Islands Holding Corp.In addition, tightening government regulations in the gaming sector adversely affected sentiment for stocks such asSohu.com Ltd.Despite these concerns, we retain an optimistic view on long-term consumption premiumization and Internet engagement in China, and we continue to see these companies as well positioned to potentially capture value from these trends.
The Series’ overweight allocation to Argentina detracted from performance as currencies came under pressure due to greater reliance on external funding, higher inflation, and rising US interest rates. Within Russia, stock selection detracted from performance driven by the Series’ overweight allocation to the financials and communication services sectors and underweight to materials.
In Taiwan, stock selection and an underweight allocation detracted from relative performance during the12-month period. Shares ofMediaTek Inc.underperformed due to concerns about smartphone demand.
Emerging Markets Series-1
Delaware VIP®Trust — Delaware VIP Emerging Markets Series
| | |
| Portfolio management review (continued) | | January 8, 2019 |
In terms of sectors, communication services – led by Sohu.com and SINA – and real estate, due to the Series’ holdings in Argentina, detracted from relative performance.
Our positive long-term view on emerging market equities remains intact. Despite ongoing political and macroeconomic concerns, we believe that growth prospects for emerging economies remain favorable. We continue to believe that the Chinese economy will muddle through, supported by structural growth in consumption, improvement in living standards, and targeted policies from the government. In the near term, macro risks appear to dominate investor sentiment. However, we believe that these risks may be more manageable than the market appears to reflect.
Considering the varied macroeconomic backdrop that we see across emerging markets, we believe there are selective opportunities for long-term stock appreciation driven by structural demographic shifts, technology adoption, implementation of government policy, improvement in corporate governance, and industry consolidation. We have found that in markets where price action is heavily macro driven, investors can often misprice individual companies significantly. Our investment approach remains centered on identifying individual companies that we believe possess sustainable franchises and favorable long-term growth prospects, and that trade at significant discounts to their intrinsic value. We are particularly focused on companies that we expect to benefit from long-term changes in how people in emerging markets live and work. Among countries, we currently hold overweight positions in Brazil, South Korea, Russia, and Mexico. Conversely, we are currently underweight China, South Africa, and Taiwan. Sectors we currently favor include communication services, technology, and consumer staples. We have an underweight to financials.
Unless otherwise noted, views expressed herein are current as of Dec. 31, 2018, and subject to change.
Emerging Markets Series-2
Delaware VIP® Trust — Delaware VIP Emerging Markets Series
Performance summary
The performance quoted represents past performance and does not guarantee future results. Investment return and principal value of an investment will fluctuate so that shares, when redeemed, may be worth more or less than their original cost. Current performance may be lower or higher than the performance quoted.
Carefully consider the Series’ investment objectives, risk factors, charges, and expenses before investing. This and other information can be found in the Series’ prospectus and its summary prospectus, which may be obtained by visiting delawarefunds.com/vip/literature or calling 800523-1918. Investors should read the prospectus and the summary prospectus carefully before investing.
| | | | | | | | | | | | |
| Delaware VIP Emerging Markets Series | | | | | | | | | | | | |
| Average annual total returns | | | | | | | | | | | | |
| For periods ended December 31, 2018 | | 1 year | | 3 years | | 5 years | | 10 years | | Lifetime | | |
| | | | | | |
Standard Class shares (commenced operations on May 1, 1997) | | -15.81% | | +10.47% | | +1.17% | | +8.50% | | +6.87% | | |
| | | | | | | | | | | | |
| | | | | | | | | | | | |
Service Class shares (commenced operations on May 1, 2000) | | -16.03% | | +10.21% | | +0.91% | | +8.23% | | +8.99% | | |
| | | | | | | | | | | | |
| | | | | | | | | | | | |
MSCI Emerging Markets Index (net) | | -14.58% | | +9.25% | | +1.65% | | +8.02% | | n/a | | |
| | | | | | | | | | | | |
| | | | | | | | | | | | |
MSCI Emerging Markets Index (gross) | | -14.25% | | +9.65% | | +2.03% | | +8.39% | | n/a | | |
Returns reflect the reinvestment of all distributions. Please see page 4 for a description of the index.
As described in the Series’ most recent prospectus, the net expense ratio for Service Class shares of the Series was 1.66%, while total operating expenses for Standard Class and Service Class shares were 1.38% and 1.68%, respectively. The management fee for Standard Class and Service Class shares was 1.24%. The Series’ investment manager, Delaware Management Company (Manager), has contractually agreed to waive all or a portion of its investment advisory fees and/or pay/reimburse expenses (excluding any12b-1 fees, acquired fund fees and expenses, taxes, interest, short sale and dividend interest expenses, brokerage fees, certain insurance costs, and nonroutine expenses or costs, including, but not limited to, those relating to reorganizations, litigation, conducting shareholder meetings, and liquidations) in order to prevent annual series operating expenses from exceeding 1.36% of the Series’ average daily net assets from Jan. 1, 2018 through Dec. 31, 2018.* These waivers and reimbursements may only be terminated by agreement of the Manager and the Series. Please see the most recent prospectus and any applicable supplement(s) for additional information on these fee waivers and/or reimbursements. Please see the “Financial highlights” section in this report for the most recent expense ratios.
The Series pays Delaware Distributors, L.P. (DDLP), the distributor and affiliate of DMC, an annual12b-1 fee of 0.30% of the average daily net assets of the Service Class shares. Prior to May 1, 2018, DDLP had contracted to waive12b-1 fees in order to limit12b-1 fees of the Service Class shares to 0.25% of average daily net assets.
Earnings from a variable annuity or variable life investment compoundtax-free until withdrawal, and as a result, no adjustments were made for income taxes.
Expense limitations were in effect for both classes during certain periods shown in the Series performance table above and in the Performance of a $10,000 Investment graph on the next page.
Performance data do not reflect insurance fees related to a variable annuity or variable life investment or the deferred sales charge that would apply to certain withdrawals of investments held for fewer than eight years. Performance shown here would have been reduced if such fees were included and the expense limitation removed. For more information about fees, consult your variable annuity or variable life prospectus.
Investments in variable products involve risk.
International investments entail risks not ordinarily associated with US investments including fluctuation in currency values, differences in accounting principles, or economic or political instability in other nations. Investing in emerging markets can be riskier than investing in established foreign markets due to increased volatility and lower trading volume.
Investments in small and/ormedium-sized companies typically exhibit greater risk and higher volatility than larger, more established companies.
Please read both the contract and underlying prospectus for specific details regarding the product’s risk profile.
* The aggregate contractual waiver period covering this report is from May 1, 2017 through April 30, 2019.
Emerging Markets Series-3
Delaware VIP® Emerging Markets Series
Performance summary (continued)
| | | | |
| For period beginning Dec. 31, 2008 through Dec. 31, 2018 | | Starting value | | Ending value |
— Delaware VIP Emerging Markets Series (Standard Class) | | $10,000 | | $22,616 |
- - MSCI Emerging Markets Index (gross) | | $10,000 | | $22,378 |
- - - MSCI Emerging Markets Index (net) | | $10,000 | | $21,628 |
The graph shows a $10,000 investment in the Delaware VIP Emerging Markets Series Standard Class shares for the period from Dec. 31, 2008 through Dec. 31, 2018.
The graph also shows $10,000 invested in the MSCI Emerging Markets Index for the period from Dec. 31, 2008 through Dec. 31, 2018. The MSCI Emerging Markets Index measures equity market performance across emerging market countries worldwide. Index “gross” return approximates the maximum possible dividend reinvestment. Index “net” return approximates the minimum possible dividend reinvestment, after deduction of withholding tax at the highest possible rate.
Index performance returns do not reflect any management fees, transaction costs or expenses. Indices are unmanaged and one cannot invest directly in an index.
Performance of Service Class shares will vary due to different charges and expenses.
Past performance is not a guarantee of future results.
| | |
| | Emerging Markets Series-4 |
Delaware VIP® Trust — Delaware VIP Emerging Markets Series
Disclosure of Series expenses
For thesix-month period from July 1, 2018 to December 31, 2018 (Unaudited)
As a shareholder of the Series, you incur ongoing costs, which may include management fees; distribution and service(12b-1) fees; and other Series expenses. This Example is intended to help you understand your ongoing costs (in dollars) of investing in the Series and to compare these costs with the ongoing costs of investing in other mutual funds.
The Example is based on an investment of $1,000 invested at the beginning of the period and held for the entiresix-month period from July 1, 2018 to Dec. 31, 2018.
Actual expenses
The first section of the table shown, “Actual Series Return,” provides information about actual account values and actual expenses. You may use the information in this section of the table, together with the amount you invested, to estimate the expenses that you paid over the period. Simply divide your account value by $1,000 (for example, an $8,600 account value divided by $1,000 = 8.6), then multiply the result by the number in the first section under the heading entitled “Expenses Paid During Period” to estimate the expenses you paid on your account during the period.
Hypothetical example for comparison purposes
The second section of the table shown, “Hypothetical 5% Return,” provides information about hypothetical account values and hypothetical expenses based on the Series’ actual expense ratio and an assumed rate of return of 5% per year before expenses, which is not the Series’ actual return. The hypothetical account values and expenses may not be used to estimate the actual ending account balance or expenses you paid for the period. You may use this information to compare the ongoing costs of investing in the Series and other funds. To do so, compare this 5% hypothetical example with the 5% hypothetical examples that appear in the shareholder reports of other funds.
Please note that the expenses shown in the table are meant to highlight your ongoing costs only. As a shareholder of the Series, you do not incur any transaction costs, such as sales charges (loads), redemption fees or exchange fees, but shareholders of other funds may incur such costs. Also, the fees related to the variable annuity investment or the deferred sales charge that could apply have not been included. Therefore, the second section of the table is useful in comparing ongoing costs only, and will not help you determine the relative total costs of owning different funds. The Series’ expenses shown in the table assume reinvestment of all dividends and distributions.
Expense analysis of an investment of $1,000
| | | | | | | | | | | | |
| | | Beginning
Account
Value
7/1/18 | | | Ending
Account
Value
12/31/18 | | | Annualized
Expense
Ratio | | Expenses Paid During Period 7/1/18 to 12/31/18* |
Actual Series return† |
Standard Class | | | $1,000.00 | | | $ | 929.20 | | | 1.33% | | $6.47 |
Service Class | | | 1,000.00 | | | | 928.10 | | | 1.63% | | 7.92 |
Hypothetical 5% return(5% return before expenses) |
Standard Class | | | $1,000.00 | | | $ | 1,018.50 | | | 1.33% | | $6.77 |
Service Class | | | 1,000.00 | | | | 1,016.99 | | | 1.63% | | 8.29 |
| * | “Expenses Paid During Period” are equal to the Series’ annualized expense ratio, multiplied by the average account value over the period, multiplied by 184/365 (to reflect theone-half year period). |
| † | Because actual returns reflect only the most recentsix-month period, the returns shown may differ significantly from fiscal year returns. |
Emerging Markets Series-5
Delaware VIP® Trust — Delaware VIP Emerging Markets Series
Security type / country and sector allocations
As of December 31, 2018 (Unaudited)
Sector designations may be different than the sector designations presented in other Series materials. The sector designations may represent the investment manager’s internal sector classifications.
| | | | | |
| Security type / country | | Percentage of net assets |
Common Stock by Country | | | | 92.54 | % |
Argentina | | | | 2.75 | % |
Bahrain | | | | 0.13 | % |
Brazil | | | | 14.82 | % |
Chile | | | | 0.68 | % |
China/Hong Kong | | | | 21.45 | % |
India | | | | 10.84 | % |
Japan | | | | 0.28 | % |
Malaysia | | | | 0.93 | % |
Mexico | | | | 4.63 | % |
Peru | | | | 0.36 | % |
Republic of Korea | | | | 18.89 | % |
Russia | | | | 5.67 | % |
South Africa | | | | 0.52 | % |
Taiwan | | | | 6.19 | % |
Thailand | | | | 1.11 | % |
Turkey | | | | 0.92 | % |
United Kingdom | | | | 0.68 | % |
United States | | | | 1.69 | % |
Exchange-Traded Fund | | | | 0.63 | % |
Convertible Preferred Stock | | | | 0.08 | % |
Preferred Stock by Country | | | | 6.26 | % |
Brazil | | | | 1.78 | % |
Republic of Korea | | | | 2.78 | % |
Russia | | | | 1.70 | % |
Participation Notes | | | | 0.00 | % |
Short-Term Investments | | | | 0.14 | % |
Total Value of Securities | | | | 99.65 | % |
Receivables and Other Assets Net of Liabilities | | | | 0.35 | % |
Total Net Assets | | | | 100.00 | % |
| | | | | |
| |
Common stock, convertible preferred stock, preferred stock, and participation notes by sector² | | Percentage of net assets |
Consumer Discretionary | | | | 10.51 | % |
Consumer Staples | | | | 8.31 | % |
Energy | | | | 18.64 | % |
Financials | | | | 8.05 | % |
Healthcare | | | | 2.47 | % |
Industrials | | | | 1.70 | % |
Information Technology1 | | | | 29.71 | % |
Materials | | | | 3.50 | % |
Real Estate | | | | 2.03 | % |
Telecommunication Services | | | | 12.70 | % |
Utilities | | | | 1.26 | % |
Total | | | | 98.88 | % |
² Narrow industries are utilized for compliance purposes for diversification whereas broad sectors are used for financial reporting.
1 To monitor compliance with the Series’ concentration guidelines, the Information Technology sector (as disclosed herein for financial reporting purposes) is divided into varioussub-categories or “industries,” in this case, Internet, semiconductors, and electronics. As of Dec. 31, 2018, such amounts, as a percentage of total net assets, were 12.96%, 15.65%, and 1.10%, respectively. The percentage in any such single industry will comply with the Series’ concentration policy even if the percentage in the “Information Technology sector” for financial reporting purposes may exceed 25%.
Emerging Markets Series-6
Delaware VIP® Trust — Delaware VIP Emerging Markets Series
Schedule of investments
December 31, 2018
| | | | | | | | |
| | | Number of shares | | | Value (US $) | |
| | |
Common Stock – 92.54%D | | | | | | | | |
Argentina – 2.75% | | | | | | | | |
Arcos Dorados Holdings Class A | | | 449,841 | | | $ | 3,553,744 | |
Cablevision Holding GDR † | | | 262,838 | | | | 1,664,211 | |
Cresud ADR † | | | 343,105 | | | | 4,168,726 | |
Grupo Clarin GDR Class B 144A #† | | | 77,680 | | | | 204,205 | |
IRSA Inversiones y Representaciones ADR † | | | 430,000 | | | | 5,615,800 | |
IRSA Propiedades Comerciales ADR | | | 11,922 | | | | 214,954 | |
| | | | | | | | |
| | | | | | | 15,421,640 | |
| | | | | | | | |
Bahrain – 0.13% | | | | | | | | |
Aluminium Bahrain GDR 144A # | | | 91,200 | | | | 725,925 | |
| | | | | | | | |
| | | | | | | 725,925 | |
| | | | | | | | |
Brazil – 14.82% | | | | | | | | |
AES Tiete Energia | | | 330,193 | | | | 853,650 | |
Atacadao Distribuicao Comercio e Industria | | | 532,600 | | | | 2,485,902 | |
B2W Cia Digital † | | | 2,553,158 | | | | 27,680,758 | |
Banco Bradesco ADR | | | 598,400 | | | | 5,918,176 | |
Banco Santander Brasil ADR | | | 53,466 | | | | 595,077 | |
BRF ADR † | | | 788,900 | | | | 4,480,952 | |
Centrais Eletricas Brasileiras † | | | 711,800 | | | | 4,449,955 | |
Cia Brasileira de Distribuicao ADR | | | 300,000 | | | | 6,231,000 | |
Hypera | | | 216,800 | | | | 1,689,314 | |
Itau Unibanco Holding ADR | | | 1,049,325 | | | | 9,590,832 | |
Petroleo Brasileiro ADR | | | 488,906 | | | | 6,360,667 | |
Rumo † | | | 234,448 | | | | 1,028,347 | |
Telefonica Brasil ADR | | | 392,181 | | | | 4,678,719 | |
TIM Participacoes ADR | | | 264,100 | | | | 4,051,294 | |
Vale | | | 220,597 | | | | 2,902,779 | |
| | | | | | | | |
| | | | | | | 82,997,422 | |
| | | | | | | | |
Chile – 0.68% | | | | | | | | |
Sociedad Quimica y Minera de Chile ADR | | | 100,000 | | | | 3,830,000 | |
| | | | | | | | |
| | | | | | | 3,830,000 | |
| | | | | | | | |
China/Hong Kong – 21.45% | | | | | | | | |
Alibaba Group Holding ADR † | | | 87,900 | | | | 12,048,453 | |
Baidu ADR † | | | 53,600 | | | | 8,500,960 | |
BeiGene † | | | 182,800 | | | | 1,963,282 | |
BeiGene ADR † | | | 11,002 | | | | 1,543,141 | |
China Mengniu Dairy † | | | 1,448,000 | | | | 4,511,998 | |
China Mobile ADR | | | 381,200 | | | | 18,297,600 | |
China Petroleum & Chemical Class H | | | 2,260,000 | | | | 1,613,358 | |
China Petroleum & Chemical ADR | | | 42,234 | | | | 2,981,720 | |
CNOOC | | | 1,998,000 | | | | 3,087,389 | |
Ctrip.com International ADR † | | | 130,000 | | | | 3,517,800 | |
Genscript Biotech † | | | 1,158,000 | | | | 1,561,647 | |
JD.com ADR † | | | 91,700 | | | | 1,919,281 | |
Kunlun Energy | | | 4,622,900 | | | | 4,900,079 | |
PetroChina Class H | | | 3,000,000 | | | | 1,869,612 | |
SINA † | | | 200,000 | | | | 10,728,000 | |
Sohu.com ADR † | | | 491,279 | | | | 8,558,080 | |
Tencent Holdings | | | 623,000 | | | | 24,982,057 | |
| | | | | | | | |
| | | Number of shares | | | Value (US $) | |
| |
Common StockD(continued) | | | | | |
China/Hong Kong (continued) | | | | | |
Tianjin Development Holdings | | | 35,950 | | | $ | 14,003 | |
Tingyi Cayman Islands Holding | | | 1,706,000 | | | | 2,278,879 | |
Tsingtao Brewery Class H | | | 645,429 | | | | 2,604,630 | |
Weibo ADR † | | | 40,000 | | | | 2,337,200 | |
ZhongAn Online P&C Insurance Class H 144A #† | | | 109,400 | | | | 349,974 | |
| | | | | | | | |
| | | | | | | 120,169,143 | |
| | | | | | | | |
India – 10.84% | | | | | | | | |
Dr Reddy’s Laboratories ADR | | | 110,000 | | | | 4,147,000 | |
Indiabulls Real Estate GDR † | | | 44,628 | | | | 55,785 | |
Natco Pharma | | | 200,000 | | | | 1,948,149 | |
RattanIndia Infrastructure GDR † | | | 131,652 | | | | 6,600 | |
Reliance Industries | | | 1,600,000 | | | | 25,696,484 | |
Reliance Industries GDR 144A # | | | 860,000 | | | | 27,391,000 | |
Sify Technologies ADR | | | 91,200 | | | | 135,888 | |
Tata Motors ADR † | | | 110,000 | | | | 1,339,800 | |
| | | | | | | | |
| | | | | | | 60,720,706 | |
| | | | | | | | |
Japan – 0.28% | | | | | | | | |
Renesas Electronics † | | | 350,000 | | | | 1,589,675 | |
| | | | | | | | |
| | | | | | | 1,589,675 | |
| | | | | | | | |
Malaysia – 0.93% | | | | | | | | |
Hong Leong Bank | | | 895,090 | | | | 4,418,593 | |
UEM Sunrise | | | 4,748,132 | | | | 764,067 | |
| | | | | | | | |
| | | | | | | 5,182,660 | |
| | | | | | | | |
Mexico – 4.63% | | | | | | | | |
America Movil Class L ADR | | | 213,289 | | | | 3,039,368 | |
Cemex ADR † | | | 506,188 | | | | 2,439,826 | |
Coca-Cola Femsa ADR | | | 58,700 | | | | 3,571,308 | |
Fomento Economico Mexicano ADR | | | 98,307 | | | | 8,459,317 | |
Grupo Financiero Banorte Class O | | | 475,400 | | | | 2,320,665 | |
Grupo Lala | | | 606,200 | | | | 654,268 | |
Grupo Televisa ADR | | | 432,500 | | | | 5,440,850 | |
| | | | | | | | |
| | | | | | | 25,925,602 | |
| | | | | | | | |
Peru – 0.36% | | | | | | | | |
Cia de Minas Buenaventura ADR | | | 125,440 | | | | 2,034,637 | |
| | | | | | | | |
| | | | | | | 2,034,637 | |
| | | | | | | | |
Republic of Korea – 18.89% | | | | | | | | |
Hite Jinro | | | 150,000 | | | | 2,234,168 | |
KB Financial Group ADR | | | 90,000 | | | | 3,778,200 | |
LG Display ADR | | | 188,309 | | | | 1,542,251 | |
LG Electronics | | | 62,908 | | | | 3,527,455 | |
LG Uplus | | | 411,401 | | | | 6,501,857 | |
Lotte | | | 69,206 | | | | 3,269,678 | |
Lotte Chilsung Beverage | | | 1,421 | | | | 1,782,936 | |
Lotte Confectionery | | | 8,599 | | | | 1,163,208 | |
Samsung Electronics | | | 982,700 | | | | 34,209,476 | |
Samsung Life Insurance | | | 71,180 | | | | 5,208,536 | |
SK Hynix | | | 230,000 | | | | 12,538,799 | |
SK Telecom | | | 16,491 | | | | 3,978,945 | |
| | |
| | |
| | Emerging Markets Series-7 |
Delaware VIP® Emerging Markets Series
Schedule of investments (continued)
| | | | | | | | |
| | | Number of shares | | | Value (US $) | |
|
Common StockD(continued) | |
Republic of Korea (continued) | |
SK Telecom ADR | | | 971,935 | | | $ | 26,047,858 | |
| | | | | | | | |
| | | | | | | 105,783,367 | |
| | | | | | | | |
Russia – 5.67% | | | | | | | | |
ENEL RUSSIA PJSC GDR | | | 15,101 | | | | 11,243 | |
Etalon Group GDR 144A # | | | 354,800 | | | | 578,324 | |
Gazprom PJSC ADR | | | 783,900 | | | | 3,471,893 | |
LUKOIL PJSC ADR (London International Exchange) | | | 133,500 | | | | 9,542,580 | |
Mobile TeleSystems PJSC ADR | | | 154,402 | | | | 1,080,814 | |
Sberbank of Russia PJSC | | | 3,308,402 | | | | 8,846,147 | |
Surgutneftegas PJSC ADR | | | 294,652 | | | | 1,119,678 | |
T Plus =† | | | 25,634 | | | | 0 | |
VEON ADR | | | 692,688 | | | | 1,620,890 | |
Yandex Class A † | | | 200,000 | | | | 5,470,000 | |
| | | | | | | | |
| | | | | | | 31,741,569 | |
| | | | | | | | |
South Africa – 0.52% | | | | | | | | |
Impala Platinum Holdings † | | | 500,000 | | | | 1,274,718 | |
Sun International † | | | 210,726 | | | | 922,727 | |
Tongaat Hulett | | | 182,915 | | | | 709,284 | |
| | | | | | | | |
| | | | | | | 2,906,729 | |
| | | | | | | | |
Taiwan – 6.19% | | | | | | | | |
Hon Hai Precision Industry | | | 1,999,564 | | | | 4,601,871 | |
MediaTek | | | 1,045,000 | | | | 7,777,413 | |
President Chain Store | | | 500,000 | | | | 5,037,505 | |
Taiwan Semiconductor Manufacturing | | | 2,375,864 | | | | 17,251,703 | |
| | | | | | | | |
| | | | | | | 34,668,492 | |
| | | | | | | | |
Thailand – 1.11% | | | | | | | | |
Bangkok Bank-Foreign | | | 638,091 | | | | 4,061,469 | |
PTT Exploration & Production - Foreign | | | 617,051 | | | | 2,150,961 | |
| | | | | | | | |
| | | | | | | 6,212,430 | |
| | | | | | | | |
Turkey – 0.92% | | | | | | | | |
Turkcell Iletisim Hizmetleri | | | 730,024 | | | | 1,678,676 | |
Turkiye Sise ve Cam Fabrikalari | | | 3,243,612 | | | | 3,474,970 | |
| | | | | | | | |
| | | | | | | 5,153,646 | |
| | | | | | | | |
United Kingdom – 0.68% | | | | | | | | |
Anglo American ADR | | | 92,815 | | | | 1,024,678 | |
Griffin Mining † | | | 1,642,873 | | | | 1,800,845 | |
Hikma Pharmaceuticals | | | 44,202 | | | | 966,792 | |
| | | | | | | | |
| | | | | | | 3,792,315 | |
| | | | | | | | |
| | | | | | | | | | |
| | | | | Number of
shares | | | Value (US $) | |
| |
Common StockD(continued) | | | | | |
United States – 1.69% | | | | | | | | | | |
Altaba † | | | | | 157,300 | | | $ | 9,113,962 | |
Avon Products † | | | | | 241,200 | | | | 366,624 | |
| | | | | | | | | | |
| | | | | | | | | 9,480,586 | |
| | | | | | | | | | |
Total Common Stock (cost $510,470,025) | | | | | | | | | 518,336,544 | |
| | | | | | | | | | |
Exchange-Traded Fund – 0.63% | | | | | |
iShares MSCI Turkey ETF | | | | | 143,000 | | | | 3,513,510 | |
| | | | | | | | | | |
Total Exchange-Traded Fund
(cost $5,709,139) | | | | | | | | | 3,513,510 | |
| | | | | | | | | | |
Convertible Preferred Stock – 0.08% | | | | | |
CJy† | | KRW | | | 4,205 | | | | 457,830 | |
| | | | | | | | | | |
Total Convertible Preferred Stock
(cost $470,778) | | | | | | | | | 457,830 | |
| | | | | | | | | | |
Preferred Stock – 6.26%D | | | | | |
Brazil – 1.78% | | | | | | | | | | |
Braskem Class A 3.92% | | | | | 169,768 | | | | 2,075,368 | |
Centrais Eletricas Brasileiras Class B † | | | | | 233,700 | | | | 1,698,595 | |
Gerdau 2.45% | | | | | 389,400 | | | | 1,488,978 | |
Petroleo Brasileiro Class A ADR 3.49% | | | | | 403,795 | | | | 4,679,984 | |
| | | | | | | | | | |
| | | | | | | | | 9,942,925 | |
| | | | | | | | | | |
Republic of Korea – 2.78% | | | | | |
CJ 2.90% | | | | | 28,030 | | | | 1,306,765 | |
Samsung Electronics 3.31% | | | | | 499,750 | | | | 14,279,688 | |
| | | | | | | | | | |
| | | | | | | | | 15,586,453 | |
| | | | | | | | | | |
Russia – 1.70% | | | | | | | | | | |
Transneft PJSC 4.38% | | | | | 3,887 | | | | 9,539,677 | |
| | | | | | | | | | |
| | | | | | | | | 9,539,677 | |
| | | | | | | | | | |
Total Preferred Stock
(cost $24,934,837) | | | | | | | | | 35,069,055 | |
| | | | | | | | | | |
| |
Participation Notes – 0.00% | | | | | |
Lehman Indian Oil CW 12 LEPO 144A =† | | | | | 100,339 | | | | 0 | |
Lehman Oil & Natural Gas CW 12 LEPO =† | | | | | 146,971 | | | | 0 | |
| | | | | | | | | | |
Total Participation Notes
(cost $4,952,197) | | | | | | | | | 0 | |
| | | | | | | | | | |
| | |
| | |
| | Emerging Markets Series-8 |
Delaware VIP® Emerging Markets Series
Schedule of investments (continued)
| | | | | | | | |
| | | Principal amount° | | | Value (US $) | |
| |
Short-Term Investments – 0.14% | | | | | |
Discount Note – 0.02%≠ | | | | | | | | |
Federal Home Loan Bank 1.049% 1/2/19 | | | 129,345 | | | $ | 129,345 | |
| | | | | | | | |
| | | | | | | 129,345 | |
| | | | | | | | |
Repurchase Agreements – 0.12% | | | | | |
Bank of America Merrill Lynch 2.95%, dated 12/31/18, to be repurchased on 1/2/19, repurchase at $80,854 (cash collateralized of $80,841) | | | 80,841 | | | | 80,841 | |
Bank of Montreal 2.60%, dated 12/31/18, to be repurchased on 1/2/19, repurchase price $222,344 (collateralized by US government obligations 0.00%–3.75% 1/24/19–2/15/47; market value $226,758) | | | 222,311 | | | | 222,311 | |
| | | | | | | | |
| | | Principal amount° | | | Value (US $) | |
| |
Short-Term Investments (continued) | | | | | |
Repurchase Agreements (continued) | | | | | |
BNP Paribas 2.93%, dated 12/31/18, to be repurchased on 1/2/19, repurchase price $363,577 (collateralized by US government obligations 0.00%–8.00% 2/15/19–8/15/46; market value $370,788) | | | 363,518 | | | $ | 363,518 | |
| | | | | | | | |
| | | | | | | 666,670 | |
| | | | | | | | |
Total Short-Term Investments
(cost $796,007) | | | | | | | 796,015 | |
| | | | | | | | |
| | | | |
Total Value of Securities – 99.65%
(cost $547,332,983) | | $ | 558,172,954 | |
| | | | |
| # | Security exempt from registration under Rule 144A of the Securities Act of 1933, as amended. At Dec. 31, 2018, the aggregate value of Rule 144A securities was $29,249,428, which represents 5.22% of the Series’ net assets. See Note 11 in “Notes to financial statements.” |
| = | The value of this security was determined using significant unobservable inputs and is reported as a Level 3 security in the disclosure table located in Note 3 in “Notes to financial statements.” |
| ≠ | The rate shown is the effective yield at the time of purchase. |
| ° | Principal amount shown is stated in USD unless noted that the security is denominated in another currency. |
| D | Securities have been classified by country of origin. Aggregate classification by business sector has been presented on page 6 in “Security type / country and sector allocations.” |
| y | Exercise price and conversion date to be announced. |
| † | Non-income producing security. |
Summary of Abbreviations:
ADR – American Depositary Receipt
ETF – Exchange Traded Fund
GDR – Global Depositary Receipt
KRW – South Korean Won
LEPO – Low Exercise Price Option
PJSC – Public Joint Stock Company
USD – US Dollar
See accompanying notes, which are an integral part of the financial statements.
| | |
| | Emerging Markets Series-9 |
Delaware VIP®Trust — Delaware VIP Emerging Markets Series
| | |
| Statement of assets and liabilities | | December 31, 2018 |
| | | | |
Assets: | | | | |
Investments, at value1 | | $ | 558,172,954 | |
Foreign currencies, at value2 | | | 1,136,774 | |
Cash | | | 73,140 | |
Dividends and interest receivable | | | 1,790,629 | |
Receivable for series shares sold | | | 170,823 | |
Foreign tax reclaims receivable | | | 15,988 | |
| | | | |
Total assets | | | 561,360,308 | |
| | | | |
Liabilities: | | | | |
Payable for series shares redeemed | | | 391,673 | |
Investment management fees payable | | | 600,095 | |
Other accrued expenses | | | 147,865 | |
Distribution fees payable to affiliates | | | 84,167 | |
Audit and tax fees payable | | | 6,153 | |
Dividend disbursing and transfer agent fees and expenses payable to affiliates | | | 3,618 | |
Accounting and administration expenses payable to affiliates | | | 2,210 | |
Trustees’ fees and expenses payable | | | 1,473 | |
Legal fees payable to affiliates | | | 1,028 | |
Reports and statements to shareholders expenses payable to affiliates | | | 415 | |
| | | | |
Total liabilities | | | 1,238,697 | |
| | | | |
Total Net Assets | | $ | 560,121,611 | |
| | | | |
| |
Net Assets Consist of: | | | | |
Paid-in capital | | $ | 542,596,579 | |
Total distributable earnings (loss) | | | 17,525,032 | |
| | | | |
Total Net Assets | | $ | 560,121,611 | |
| | | | |
| |
Standard Class: | | | | |
Net assets | | $ | 236,591,686 | |
Shares of beneficial interest outstanding, unlimited authorization, no par | | | 11,618,454 | |
Net asset value per share | | $ | 20.36 | |
| |
Service Class: | | | | |
Net assets | | $ | 323,529,925 | |
Shares of beneficial interest outstanding, unlimited authorization, no par | | | 15,954,936 | |
Net asset value per share | | $ | 20.28 | |
1Investments, at cost | | $ | 547,332,983 | |
2Foreign currencies, at cost | | | 1,123,722 | |
See accompanying notes, which are an integral part of the financial statements.
| | |
| | Emerging Markets Series-10 |
Delaware VIP® Trust —
Delaware VIP Emerging Markets Series
Statement of operations
Year ended December 31, 2018
| | | | |
Investment Income: | | | | |
Dividends | | $ | 14,398,757 | |
Interest | | | 153,716 | |
Foreign tax withheld | | | (1,751,339 | ) |
| | | | |
| | | 12,801,134 | |
| | | | |
Expenses: | | | | |
Management fees | | | 7,735,096 | |
Distribution expenses - Service Class | | | 1,095,217 | |
Custodian fees | | | 203,167 | |
Accounting and administration expenses | | | 145,148 | |
Reports and statements to shareholders | | | 84,216 | |
Dividend disbursing and transfer agent fees and expenses | | | 52,388 | |
Audit and tax | | | 50,309 | |
Legal fees | | | 38,288 | |
Trustees’ fees and expenses | | | 30,104 | |
Registration fees | | | 1,482 | |
Other | | | 27,445 | |
| | | | |
| | | 9,462,860 | |
Less waived distribution expenses - Service Class | | | (64,203 | ) |
Less expenses paid indirectly | | | (1,022 | ) |
| | | | |
Total operating expenses | | | 9,397,635 | |
| | | | |
Net Investment Income | | | 3,403,499 | |
| | | | |
| |
Net Realized and Unrealized Gain (Loss): | | | | |
Net realized gain (loss) on: | | | | |
Investments | | | 14,020,837 | |
Foreign currencies | | | (99,852 | ) |
Foreign currency exchange contracts | | | 6,489 | |
| | | | |
Net realized gain | | | 13,927,474 | |
| | | | |
Net change in unrealized appreciation (depreciation) of: | | | | |
Investments* | | | (120,634,764 | ) |
Foreign currencies | | | (37,928 | ) |
| | | | |
Net change in unrealized appreciation (depreciation) | | | (120,672,692 | ) |
| | | | |
Net Realized and Unrealized Loss | | | (106,745,218 | ) |
| | | | |
Net Decrease in Net Assets Resulting from Operations | | $ | (103,341,719 | ) |
| | | | |
* Includes $1,952,376 decrease in capital gains tax accrued. | | | | |
Delaware VIP Trust —
Delaware VIP Emerging Markets Series
Statements of changes in net assets
| | | | | | | | |
| | | Year ended | |
| | | 12/31/18 | | | 12/31/17 | |
Increase (Decrease) in Net Assets from Operations: | | | | | | | | |
Net investment income | | $ | 3,403,499 | | | $ | 13,736,754 | |
Net realized gain | | | 13,927,474 | | | | 10,440,357 | |
Net change in unrealized appreciation (depreciation) | | | (120,672,692 | ) | | | 175,201,769 | |
| | | | | | | | |
Net increase (decrease) in net assets resulting from operations | | | (103,341,719 | ) | | | 199,378,880 | |
| | | | | | | | |
Dividends and Distributions to Shareholders from: | | | | | | | | |
Distributable earnings*: | | | | | | | | |
Standard Class | | | (9,054,720 | ) | | | (1,380,619 | ) |
Service Class | | | (12,652,674 | ) | | | (1,408,749 | ) |
| | | | | | | | |
| | | (21,707,394 | ) | | | (2,789,368 | ) |
| | | | | | | | |
Capital Share Transactions: | | | | | | | | |
Proceeds from shares sold: | | | | | | | | |
Standard Class | | | 51,044,803 | | | | 44,659,187 | |
Service Class | | | 40,892,411 | | | | 25,104,978 | |
Net asset value of shares issued upon reinvestment of dividends and distributions: | | | | | | | | |
Standard Class | | | 9,054,720 | | | | 1,380,619 | |
Service Class | | | 12,652,674 | | | | 1,408,749 | |
| | | | | | | | |
| | | 113,644,608 | | | | 72,553,533 | |
| | | | | | | | |
Cost of shares redeemed: | | | | | | | | |
Standard Class | | | (64,347,724 | ) | | | (30,228,125 | ) |
Service Class | | | (41,351,896 | ) | | | (68,865,323 | ) |
| | | | | | | | |
| | | (105,699,620 | ) | | | (99,093,448 | ) |
| | | | | | | | |
Increase (decrease) in net assets derived from capital share transactions | | | 7,944,988 | | | | (26,539,915 | ) |
Net Increase (Decrease) in Net Assets | | | (117,104,125 | ) | | | 170,049,597 | |
| | | | | | | | |
| | |
Net Assets: | | | | | | | | |
Beginning of year | | | 677,225,736 | | | | 507,176,139 | |
| | | | | | | | |
End of year1 | | $ | 560,121,611 | | | $ | 677,225,736 | |
| | | | | | | | |
| 1 | Net Assets – End of year includes undistributed net investment income of $9,761,518 in 2017. The Securities and Exchange Commission eliminated the requirement to disclose undistributed (distributions in excess of) net investment income in 2018. |
| * | For the year ended Dec. 31, 2018, the Series has adopted amendments to RegulationS-X (see Note 13 in “Notes to financial statements”). For the year ended Dec. 31, 2017, the dividends and distributions to shareholders were as follows: |
| | | | |
| | | Standard Class | | Service Class |
Dividends from net investment income | | $(1,380,619) | | $(1,408,749) |
See accompanying notes, which are an integral part of the financial statements.
Emerging Markets Series-11
Delaware VIP® Trust — Delaware VIP Emerging Markets Series
Financial highlights
Selected data for each share of the Series outstanding throughout each period were as follows:
| | | | | | | | | | | | | | | | | | | | | | | | |
| | | Delaware VIP Emerging Markets Series Standard Class | | | | |
| | | | | | | | | Year ended | | | | | | | | | | |
| | | 12/31/18 | | | 12/31/17 | | | 12/31/16 | | | 12/31/15 | | | 12/31/14 | | | | |
Net asset value, beginning of period | | $ | 25.06 | | | $ | 17.94 | | | $ | 16.27 | | | $ | 19.54 | | | $ | 21.47 | | | | | |
| | | | | | |
Income (loss) from investment operations: | | | | | | | | | | | | | | | | | | | | | | | | |
Net investment income1 | | | 0.16 | | | | 0.53 | | | | 0.09 | | | | 0.13 | | | | 0.13 | | | | | |
Net realized and unrealized gain (loss) | | | (3.98 | ) | | | 6.72 | | | | 2.15 | | | | (2.86 | ) | | | (1.84 | ) | | | | |
| | | | | | | | | | | | | | | | | | | | | | | | |
Total from investment operations | | | (3.82 | ) | | | 7.25 | | | | 2.24 | | | | (2.73 | ) | | | (1.71 | ) | | | | |
| | | | | | | | | | | | | | | | | | | | | | | | |
| | | | | | |
Less dividends and distributions from: | | | | | | | | | | | | | | | | | | | | | | | | |
Net investment income | | | (0.80 | ) | | | (0.13 | ) | | | (0.19 | ) | | | (0.16 | ) | | | (0.14 | ) | | | | |
Net realized gain | | | (0.08 | ) | | | — | | | | (0.38 | ) | | | (0.38 | ) | | | (0.08 | ) | | | | |
| | | | | | | | | | | | | | | | | | | | | | | | |
Total dividends and distributions | | | (0.88 | ) | | | (0.13 | ) | | | (0.57 | ) | | | (0.54 | ) | | | (0.22 | ) | | | | |
| | | | | | | | | | | | | | | | | | | | | | | | |
| | | | | | |
Net asset value, end of period | | $ | 20.36 | | | $ | 25.06 | | | $ | 17.94 | | | $ | 16.27 | | | $ | 19.54 | | | | | |
| | | | | | | | | | | | | | | | | | | | | | | | |
| | | | | | |
Total return2 | | | (15.81% | ) | | | 40.55% | | | | 13.93% | | | | (14.51% | ) | | | (8.06% | ) | | | | |
| | | | | | |
Ratios and supplemental data: | | | | | | | | | | | | | | | | | | | | | | | | |
Net assets, end of period (000 omitted) | | | $236,592 | | | | $291,019 | | | | $196,918 | | | | $172,098 | | | | $172,200 | | | | | |
Ratio of expenses to average net assets | | | 1.34% | | | | 1.36% | | | | 1.37% | | | | 1.37% | | | | 1.38% | | | | | |
Ratio of expenses to average net assets prior to fees waived | | | 1.34% | | | | 1.38% | | | | 1.40% | | | | 1.37% | | | | 1.38% | | | | | |
Ratio of net investment income to average net assets | | | 0.71% | | | | 2.40% | | | | 0.53% | | | | 0.70% | | | | 0.62% | | | | | |
Ratio of net investment income to average net assets prior to fees waived | | | 0.71% | | | | 2.38% | | | | 0.50% | | | | 0.70% | | | | 0.62% | | | | | |
Portfolio turnover | | | 11% | | | | 6% | | | | 8% | | | | 6% | | | | 5% | | | | | |
| 1 | The average shares outstanding method has been applied for per share information. |
| 2 | Total return is based on the change in net asset value of a share during the period and assumes reinvestment of dividends and distributions at net asset value. Total return during some of the periods shown reflects a waiver by the manager. Performance would have been lower had the waiver not been in effect. Total return does not include fees, charges, or expenses imposed by the variable annuity and life insurance contracts for which Delaware VIP Trust serves as an underlying investment vehicle. |
See accompanying notes, which are an integral part of the financial statements.
| | |
| | Emerging Markets Series-12 |
Delaware VIP® Emerging Markets Series
Financial highlights (continued)
Selected data for each share of the Series outstanding throughout each period were as follows:
| | | | | | | | | | | | | | | | | | | | | | | | |
| | | Delaware VIP Emerging Markets Series Service Class | | | | |
| | | Year ended | |
| | | 12/31/18 | | | 12/31/17 | | | 12/31/16 | | | 12/31/15 | | | 12/31/14 | | | | |
Net asset value, beginning of period | | $ | 24.97 | | | $ | 17.88 | | | $ | 16.21 | | | $ | 19.48 | | | $ | 21.40 | | | | | |
| | | | | | |
Income (loss) from investment operations: | | | | | | | | | | | | | | | | | | | | | | | | |
Net investment income1 | | | 0.10 | | | | 0.48 | | | | 0.05 | | | | 0.08 | | | | 0.08 | | | | | |
Net realized and unrealized gain (loss) | | | (3.97 | ) | | | 6.69 | | | | 2.14 | | | | (2.86 | ) | | | (1.84 | ) | | | | |
| | | | | | | | | | | | | | | | | | | | | | | | |
Total from investment operations | | | (3.87 | ) | | | 7.17 | | | | 2.19 | | | | (2.78 | ) | | | (1.76 | ) | | | | |
| | | | | | | | | | | | | | | | | | | | | | | | |
| | | | | | |
Less dividends and distributions from: | | | | | | | | | | | | | | | | | | | | | | | | |
Net investment income | | | (0.74 | ) | | | (0.08 | ) | | | (0.14 | ) | | | (0.11 | ) | | | (0.08 | ) | | | | |
Net realized gain | | | (0.08 | ) | | | — | | | | (0.38 | ) | | | (0.38 | ) | | | (0.08 | ) | | | | |
| | | | | | | | | | | | | | | | | | | | | | | | |
Total dividends and distributions | | | (0.82 | ) | | | (0.08 | ) | | | (0.52 | ) | | | (0.49 | ) | | | (0.16 | ) | | | | |
| | | | | | | | | | | | | | | | | | | | | | | | |
| | | | | | |
Net asset value, end of period | | $ | 20.28 | | | $ | 24.97 | | | $ | 17.88 | | | $ | 16.21 | | | $ | 19.48 | | | | | |
| | | | | | | | | | | | | | | | | | | | | | | | |
| | | | | | |
Total return2 | | | (16.03% | ) | | | 40.22% | | | | 13.68% | | | | (14.77% | ) | | | (8.26% | ) | | | | |
| | | | | | |
Ratios and supplemental data: | | | | | | | | | | | | | | | | | | | | | | | | |
Net assets, end of period (000 omitted) | | | $323,530 | | | | $386,207 | | | | $310,258 | | | | $310,063 | | | | $362,469 | | | | | |
Ratio of expenses to average net assets | | | 1.62% | | | | 1.61% | | | | 1.62% | | | | 1.62% | | | | 1.63% | | | | | |
Ratio of expenses to average net assets prior to fees waived | | | 1.64% | | | | 1.68% | | | | 1.70% | | | | 1.67% | | | | 1.68% | | | | | |
Ratio of net investment income to average net assets | | | 0.43% | | | | 2.15% | | | | 0.28% | | | | 0.45% | | | | 0.37% | | | | | |
Ratio of net investment income to average net assets prior to fees waived | | | 0.41% | | | | 2.08% | | | | 0.20% | | | | 0.40% | | | | 0.32% | | | | | |
Portfolio turnover | | | 11% | | | | 6% | | | | 8% | | | | 6% | | | | 5% | | | | | |
| 1 | The average shares outstanding method has been applied for per share information. |
| 2 | Total return is based on the change in net asset value of a share during the period and assumes reinvestment of dividends and distributions at net asset value. Total return during all of the periods shown reflects waivers by the manager and/or distributor. Performance would have been lower had the waivers not been in effect. Total return does not include fees, charges, or expenses imposed by the variable annuity and life insurance contracts for which Delaware VIP Trust serves as an underlying investment vehicle. |
See accompanying notes, which are an integral part of the financial statements.
| | |
| | Emerging Markets Series-13 |
Delaware VIP® Trust — Delaware VIP Emerging Markets Series
Notes to financial statements
December 31, 2018
Delaware VIP Trust (Trust) is organized as a Delaware statutory trust and offers 10 series: Delaware VIP Diversified Income Series, Delaware VIP Emerging Markets Series, Delaware VIP High Yield Series, Delaware VIP International Value Equity Series, Delaware VIP Limited-Term Diversified Income Series, Delaware VIP REIT Series, Delaware VIP Small Cap Value Series, Delaware VIP Smid Cap Core Series, Delaware VIP U.S. Growth Series, and Delaware VIP Value Series. These financial statements and the related notes pertain to Delaware VIP Emerging Markets Series (Series). The Trust is anopen-end investment company. The Series is considered diversified under the Investment Company Act of 1940, as amended, and offers Standard Class and Service Class shares. The Standard Class shares do not carry a distribution and service(12b-1) fee and the Service Class shares carry a12b-1 fee. The shares of the Series are sold only to separate accounts of life insurance companies.
The investment objective of the Series is to seek long-term capital appreciation.
1. Significant Accounting Policies
The Series is an investment company and follows accounting and reporting guidance under Financial Accounting Standards Board (FASB) Accounting Standards Codification Topic 946, Financial Services – Investment Companies. The following accounting policies are in accordance with US generally accepted accounting principles (US GAAP) and are consistently followed by the Series.
Security Valuation — Equity securities and exchange-traded funds (ETFs), except those traded on the Nasdaq Stock Market LLC (Nasdaq), are valued at the last quoted sales price as of the time of the regular close of the New York Stock Exchange on the valuation date. Equity securities and ETFs traded on the Nasdaq are valued in accordance with the Nasdaq Official Closing Price, which may not be the last sales price. If, on a particular day, an equity security or ETF does not trade, the mean between the bid and ask prices will be used, which approximates fair value. Securities listed on a foreign exchange are normally valued at the last quoted sales price on the valuation date. US government and agency securities are valued at the mean between the bid and ask prices, which approximates fair value. Foreign currency exchange contracts and foreign cross currency exchange contracts are valued at the mean between the bid and ask prices, which approximates fair value. Interpolated values are derived when the settlement date of the contract is an interim date for which quotations are not available. Investments in repurchase agreements are generally values at par, which approximates fair value, each business day. Generally, other securities and assets for which market quotations are not readily available are valued at fair value as determined in good faith under the direction of the Trust’s Board of Trustees (Board). In determining whether market quotations are readily available or fair valuation will be used, various factors will be taken into consideration, such as market closures or suspension of trading in a security. The Series may use fair value pricing more frequently for securities traded primarily innon-US markets because, among other things, most foreign markets close well before the Series values its securities, generally as of 4:00pm Eastern time. The earlier close of these foreign markets gives rise to the possibility that significant events, including broad market moves, government actions or pronouncements, aftermarket trading, or news events may have occurred in the interim. Whenever such a significant event occurs, the Series may value foreign securities using fair value prices based on third-party vendor modeling tools (international fair value pricing). Restricted securities are valued at fair value using methods approved by the Board.
Federal and Foreign Income Taxes — No provision for federal income taxes has been made as the Series intends to continue to qualify for federal income tax purposes as a regulated investment company under Subchapter M of the Internal Revenue Code of 1986, as amended, and make the requisite distributions to shareholders. The Series evaluates tax positions taken or expected to be taken in the course of preparing the Series’ tax returns to determine whether the tax positions are“more-likely-than-not” of being sustained by the applicable tax authority. Tax positions not deemed to meet the“more-likely-than-not” threshold are recorded as a tax benefit or expense in the current year. Management has analyzed the Series’ tax positions taken or expected to be taken on the Series’ federal income tax returns through the year ended Dec. 31, 2018 and for all open tax years (years ended Dec. 31, 2015–Dec. 31, 2017), and has concluded that no provision for federal income tax is required in the Series’ financial statements. In regard to foreign taxes only, the Series has open tax years in certain foreign countries in which it invests that may date back to the inception of the Series. If applicable, the Series recognizes interest accrued on unrecognized tax benefits in interest expense and penalties in other expenses on the Statement of operations. During the year ended Dec. 31, 2018, the Series did not incur any interest or tax penalties.
Class Accounting — Investment income, common expenses, and realized and unrealized gain (loss) on investments are allocated to the classes of the Series on the basis of daily net assets of each class. Distribution expenses relating to a specific class are charged directly to that class.
Repurchase Agreements — The Series may purchase certain US government securities subject to the counterparty’s agreement to repurchase them at an agreed upon date and price. The counterparty will be required on a daily basis to maintain the value of the collateral subject to the agreement at not less than the repurchase price (including accrued interest). The agreements are conditioned upon the collateral being deposited under the Federal Reserve book-entry system with the Series’ custodian or a third partysub-custodian. In the event of default or bankruptcy by the other party to the agreement, retention of the collateral may be subject to legal proceedings. All open repurchase agreements as of the date of this report were entered into on Dec. 31, 2018, and matured on the next business day.
Foreign Currency Transactions — Transactions denominated in foreign currencies are recorded at the prevailing exchange rates on the valuation date in accordance with the Series’ prospectus. The value of all assets and liabilities denominated in foreign currencies is translated daily into US dollars at the
Emerging Markets Series-14
Delaware VIP® Emerging Markets Series
Notes to financial statements (continued)
1. Significant Accounting Policies (continued)
exchange rate of such currencies against the US dollar. Transaction gains or losses resulting from changes in exchange rates during the reporting period or upon settlement of the foreign currency transaction are reported in operations for the current period. The Series generally does not bifurcate that portion of realized gains and losses on investments which is due to changes in foreign exchange rates from that which is due to changes in market prices. The realized gains and losses are included on the “Statement of operations” under “Net realized and unrealized gain (loss) on investments.” The Series reports certain foreign currency related transactions as components of realized gains (losses) for financial reporting purposes, whereas such components are treated as ordinary income (loss) for federal income tax purposes.
Use of Estimates— The preparation of financial statements in conformity with US GAAP requires management to make estimates and assumptions that affect the fair value of investments, the reported amounts of assets and liabilities and disclosure of contingent assets and liabilities at the date of the financial statements, and the reported amounts of revenues and expenses during the reporting period. Actual results could differ from those estimates and the differences could be material.
Other — Expenses directly attributable to the Series are charged directly to the Series. Other expenses common to various funds within the Delaware Funds® by Macquarie (Delaware Funds) are generally allocated among such funds on the basis of average net assets. Management fees and certain other expenses are paid monthly. Security transactions are recorded on the date the securities are purchased or sold (trade date) for financial reporting purposes. Costs used in calculating realized gains and losses on the sale of investment securities are those of the specific securities sold. Dividend income is recorded on theex-dividend date and interest income is recorded on the accrual basis. Taxablenon-cash dividends are recorded as dividend income. Foreign dividends are also recorded on theex-dividend date or as soon after theex-dividend date that the Series is aware of such dividends, net of all tax withholdings, a portion of which may be reclaimable. Withholding taxes and reclaims on foreign dividends have been recorded in accordance with the Series’ understanding of the applicable country’s tax rules and rates. The Series may pay foreign capital gains taxes on certain foreign securities held, which are reported as components of realized losses for financial reporting purposes, whereas such components are treated as ordinary loss for federal income tax purposes.
The Series declares and pays dividends from net investment income and distributions from net realized gain on investments, if any, following the close of the fiscal year. The Series may distribute more frequently, if necessary for tax purposes. Dividends and distributions, if any, are recorded on theex-dividend date.
The Series receives earnings credits from its custodian when positive cash balances are maintained, which may be used to offset custody fees. The expenses paid under this arrangement are included on the “Statement of operations” under “Custodian fees” with the corresponding expenses offset included under “Less expenses paid indirectly.” For the year ended Dec. 31, 2018, the Series earned $1,019 under this arrangement.
The Series receives earnings credits from its transfer agent when positive cash balances are maintained, which may be used to offset transfer agent fees. If the amount earned is greater than $1, the expenses paid under this arrangement are included on the “Statement of operations” under “Dividend disbursing and transfer agent fees and expenses” with the corresponding expenses offset included under “Less expenses paid indirectly.” For the year ended Dec. 31, 2018, the Series earned $3 under this arrangement.
During the year ended Dec. 31, 2018, the Series frequently maintained a negative cash balance with its custodian, which is considered a form of borrowing or leverage. If the Series maintains a negative cash balance and the Series’ investments decrease in value, the Series’ losses will be greater than if the Series did not maintain a negative cash balance. The Series is required to pay interest to the custodian on negative cash balances. During the year ended Dec. 31, 2018, the Series had an average outstanding overdraft balance equal to 0.13% of its average net assets for which it was charged interest of $17,129, which is included on the “Statement of operations” under “Custodian fees.” The average borrowing rate charged on the overdraft was 2.12%.
2. Investment Management, Administration Agreements, and Other Transactions with Affiliates
In accordance with the terms of its investment management agreement, the Series pays Delaware Management Company (DMC), a series of Macquarie Investment Management Business Trust and the investment manager, an annual fee which is calculated daily and paid monthly at the rate of 1.25% on the first $500 million of average daily and paid monthly net assets of the Series, 1.20% on the next $500 million, 1.15% on the next $1.5 billion, and 1.10% on average daily net assets in excess of $2.5 billion.
DMC has contractually agreed to waive that portion, if any, of its management fee and reimburse the Series to the extent necessary to ensure that annual operating expenses (excluding any12b-1 fees, acquired fund fees and expenses, taxes, interest, short sale dividend and interest expenses, brokerage fees, certain insurance costs, and nonroutine expenses or costs, including, but not limited to, those relating to reorganizations, litigation, conducting shareholder meetings, and liquidations), do not exceed 1.36% of the Series’ average daily net assets from Jan. 1, 2018 through Dec. 31, 2018.* These expense waivers and reimbursements may only be terminated by agreement of DMC and the Series. The waivers and reimbursements are accrued daily and received monthly.
Emerging Markets Series-15
Delaware VIP® Emerging Markets Series
Notes to financial statements (continued)
2. Investment Management, Administration Agreements, and Other Transactions with Affiliates (continued)
Delaware Investments Fund Services Company (DIFSC), an affiliate of DMC, provides fund accounting and financial administration oversight services to the Series. For these services, DIFSC’s fees are calculated daily and paid monthly based on the aggregate daily net assets of all funds within the Delaware Funds at the following annual rates: 0.00475% of the first $35 billion; 0.0040% of the next $10 billion; and 0.0025% of aggregate average daily net assets in excess of $45 billion (Total Fee). Each fund in the Delaware Funds pays a minimum of $4,000, which, in aggregate, is subtracted from the Total Fee. Each fund then pays its portion of the remainder of the Total Fee on a relative net asset value (NAV) basis. For the year ended Dec. 31, 2018, the Series was charged $27,562 for these services. This amount is included on the “Statement of operations” under “Accounting and administration expenses.”
DIFSC is also the transfer agent and dividend disbursing agent of the Series. For these services, DIFSC’s fees are calculated daily and paid monthly at the annual rate of 0.0075% of the Series’ average daily net assets. This amount is included on the “Statement of operations” under “Dividend disbursing and transfer agent fees and expenses.” For the year ended Dec. 31, 2018, the Series was charged $46,782 for these services. Pursuant to asub-transfer agency agreement between DIFSC and BNY Mellon Investment Servicing (US) Inc. (BNYMIS), BNYMIS provides certainsub-transfer agency services to the Series.Sub-transfer agency fees are paid directly by the Series and are also included on the “Statement of operations” under “Dividend disbursing and transfer agent fees and expenses.”
Pursuant to a distribution agreement and distribution plan, the Series pays Delaware Distributors, L.P. (DDLP), the distributor and an affiliate of DMC, an annual12b-1 fee of 0.30% of the average daily net assets of the Service Class shares. The fee is calculated daily and paid monthly. Prior to May. 1, 2018, DDLP had contracted to waive12b-1 fees in order to limit12b-1 fees of the Service Class shares to 0.25% of average daily net assets. The waiver was calculated daily and received monthly. Standard Class shares pay no12b-1 fees.
As provided in the investment management agreement, the Series bears a portion of the cost of resources shared with DMC, including the cost of internal personnel of DMC and/or its affiliates that provide legal, tax, and regulatory reporting services to the Series. These amounts are included on the “Statement of operations” under “Legal fees.” For the year ended Dec. 31, 2018, the Series was charged $20,478 for internal legal, tax, and regulatory reporting services provided by DMC and/or its affiliates’ employees.
Trustees’ fees include expenses accrued by the Series for each Trustee’s retainer and meeting fees. Certain officers of DMC, DIFSC, and DDLP are officers and/or Trustees of the Trust. These officers and Trustees are paid no compensation by the Series.
* The aggregate contractual waiver period covering this report is from May 1, 2017 through April 30, 2019.
3. Investments
For the year ended Dec. 31, 2018, the Series made purchases and sales of investment securities other than short-term investments as follows:
| | | | |
Purchases | | $ | 70,670,658 | |
Sales | | | 73,965,734 | |
The tax cost of investments includes adjustments to net unrealized appreciation (depreciation) which may not necessarily be final tax cost basis adjustments, but approximate the tax basis unrealized gains and losses that may be realized and distributed to shareholders. At Dec. 31, 2018, the cost and unrealized appreciation (depreciation) of investments and derivatives for federal income tax purposes for the Series were as follows:
| | | | | | |
Cost of Investments | | Aggregate
Unrealized
Appreciation of Investments | | Aggregate
Unrealized
Depreciation of Investments | | Net Unrealized
Appreciation of Investments |
$557,577,793 | | $159,412,191 | | $(158,817,030) | | $595,161 |
US GAAP defines fair value as the price that the Series would receive to sell an asset or pay to transfer a liability in an orderly transaction between market participants at the measurement date under current market conditions. A three-level hierarchy for fair value measurements has been established based upon the transparency of inputs to the valuation of an asset or liability. Inputs may be observable or unobservable and refer broadly to the assumptions that market participants would use in pricing the asset or liability. Observable inputs reflect the assumptions that market participants would use in pricing the asset or liability based on market data obtained from sources independent of the reporting entity. Unobservable inputs reflect the reporting entity’s own assumptions about the assumptions that market participants would use in pricing the asset or liability based on the best information available under the circumstances. The Series’ investment in its entirety is assigned a level based upon the observability of the inputs which are significant to the overall valuation. The three-level hierarchy of inputs is summarized below and on the next page.
| | |
| Level 1 – | | Inputs are quoted prices in active markets for identical investments. (Examples: equity securities,open-end investment companies, futures contracts, exchange-traded options contracts) |
Emerging Markets Series-16
Delaware VIP® Emerging Markets Series
Notes to financial statements (continued)
3. Investments (continued)
| | |
| Level 2 – | | Other observable inputs, including, but not limited to: quoted prices for similar assets or liabilities in markets that are active, quoted prices for identical or similar assets or liabilities in markets that are not active, inputs other than quoted prices that are observable for the assets or liabilities (such as interest rates, yield curves, volatilities, prepayment speeds, loss severities, credit risks, and default rates) or other market-corroborated inputs. (Examples: debt securities, government securities, swap contracts, foreign currency exchange contracts, foreign securities utilizing international fair value pricing, broker-quoted securities, fair valued securities) |
| Level 3 – | | Significant unobservable inputs, including the Series’ own assumptions used to determine the fair value of investments. (Examples: broker-quoted securities, fair valued securities) |
Level 3 investments are valued using significant unobservable inputs. The Series may also use an income-based valuation approach in which the anticipated future cash flows of the investment are discounted to calculate fair value. Discounts may also be applied due to the nature or duration of any restrictions on the disposition of the investments. Valuations may also be based upon current market prices of securities that are comparable in coupon, rating, maturity, and industry. The derived value of a Level 3 investment may not represent the value which is received upon disposition and this could impact the results of operations.
The following table summarizes the valuation of the Series’ investments by fair value hierarchy levels as of Dec. 31, 2018:
| | | | | | | | | | | | | | | | |
| Securities | | Level 1 | | | Level 2 | | | Level 3 | | | Total | |
Assets: | | | | | | | | | | | | | | | | |
Common Stock | | | | | | | | | | | | | | | | |
Argentina | | $ | 15,217,435 | | | $ | 204,205 | | | | $— | | | $ | 15,421,640 | |
Bahrain | | | — | | | | 725,925 | | | | — | | | | 725,925 | |
Brazil | | | 82,997,422 | | | | — | | | | — | | | | 82,997,422 | |
Chile | | | 3,830,000 | | | | — | | | | — | | | | 3,830,000 | |
China/Hong Kong | | | 120,169,143 | | | | — | | | | — | | | | 120,169,143 | |
India | | | 60,714,106 | | | | 6,600 | | | | — | | | | 60,720,706 | |
Japan | | | — | | | | 1,589,675 | | | | — | | | | 1,589,675 | |
Malaysia | | | 5,182,660 | | | | — | | | | — | | | | 5,182,660 | |
Mexico | | | 25,925,602 | | | | — | | | | — | | | | 25,925,602 | |
Peru | | | 2,034,637 | | | | — | | | | — | | | | 2,034,637 | |
Republic of Korea | | | 33,151,245 | | | | 72,632,122 | | | | — | | | | 105,783,367 | |
Russia | | | 22,305,855 | | | | 9,435,714 | | | | — | | | | 31,741,569 | |
South Africa | | | 2,906,729 | | | | — | | | | — | | | | 2,906,729 | |
Taiwan | | | — | | | | 34,668,492 | | | | — | | | | 34,668,492 | |
Thailand | | | 2,150,961 | | | | 4,061,469 | | | | — | | | | 6,212,430 | |
Turkey | | | 5,153,646 | | | | — | | | | — | | | | 5,153,646 | |
United Kingdom | | | 3,792,315 | | | | — | | | | — | | | | 3,792,315 | |
United States | | | 9,480,586 | | | | — | | | | — | | | | 9,480,586 | |
Convertible Preferred Stock | | | — | | | | 457,830 | | | | — | | | | 457,830 | |
Exchange-Traded Fund | | | 3,513,510 | | | | — | | | | — | | | | 3,513,510 | |
Preferred Stock1 | | | 9,942,925 | | | | 25,126,130 | | | | — | | | | 35,069,055 | |
Participation Notes | | | — | | | | — | | | | — | | | | — | |
Short-Term Investments | | | — | | | | 796,015 | | | | — | | | | 796,015 | |
| | | | | | | | | | | | | | | | |
Total Value of Securities | | $ | 408,468,777 | | | $ | 149,704,177 | | | | $— | | | $ | 558,172,954 | |
| | | | | | | | | | | | | | | | |
1Security type is valued across multiple levels. The amounts attributed to Level 1 investments and Level 2 investments represent 28.35% and 71.65%, respectively, of the total market value of this security type. Level 1 investments represent exchange traded investments and Level 2 investments represent investments with observable inputs.
As a result of utilizing international fair value pricing at Dec. 31, 2018, a portion of the common stock in the portfolio was categorized as Level 2.
The securities that have been valued at zero on the “Schedule of investments” are considered to be Level 3 investments in this table.
During the year ended Dec. 31, 2018, there were no transfers between Level 1 investments, Level 2 investments, or Level 3 investments that had a significant impact to the Series. This does not include transfers between Level 1 investments and Level 2 investments due to the Series utilizing international fair value pricing during the period. In accordance with the fair valuation procedures described in Note 1, international fair value pricing of securities occurs when market volatility exceeds an established rolling threshold. If the threshold is exceeded on a given date, then prices of international securities (those that traded on exchanges that close at a different time than the time that the Series’ NAV is determined) are established using a separate
Emerging Markets Series-17
Delaware VIP® Emerging Markets Series
Notes to financial statements (continued)
3. Investments (continued)
pricing feed from a third party vendor designed to establish a price for each such security as of the time that the Series’ NAV is determined. Further, international fair value pricing uses other observable market-based inputs in place of the closing exchange price due to the events occurring after the close of the exchange or market on which the investment is principally traded, causing a change in classification between levels. The Series’ policy is to recognize transfers between levels based on fair value at the beginning of the reporting period.
A reconciliation of Level 3 investments is presented when the Series has a significant amount of Level 3 investments at the beginning, interim, or end of the period in relation to net assets. Management has determined not to provide a reconciliation of Level 3 investments as the Level 3 investments were not considered significant to the Series’ net assets at the beginning, interim, or end of the period. Management has determined not to provide additional disclosure on Level 3 inputs since the Level 3 investments are not considered significant to the Series’ net assets at the end of the year.
4. Dividend and Distribution Information
Income and long-term capital gain distributions are determined in accordance with federal income tax regulations, which may differ from US GAAP. Additionally, distributions from net gains on foreign currency transactions and net short-term gains on sales of investment securities are treated as ordinary income for federal income tax purposes. The tax character of dividends and distributions paid during the years ended Dec. 31, 2018 and 2017 was as follows:
| | | | | | | | |
| | | Year ended | |
| | | 12/31/18 | | | 12/31/17 | |
Ordinary income | | $ | 21,707,394 | | | $ | 2,789,368 | |
| | | | | | | | |
5. Components of Net Assets on a Tax Basis
As of Dec. 31, 2018, the components of net assets on a tax basis were as follows:
| | | | |
Shares of beneficial interest | | $ | 542,596,579 | |
Undistributed ordinary income | | | 4,420,367 | |
Undistributed long-term capital gains | | | 12,509,504 | |
Unrealized appreciation on investments, foreign currencies, and derivatives | | | 595,161 | |
| | | | |
Net assets | | $ | 560,121,611 | |
| | | | |
The differences between the book basis and tax basis components of net assets are primarily attributable to tax deferral of losses on wash sales and tax recognition of unrealized gain on investments in passive foreign investment companies (PFICs) and securities no longer considered PFICs.
6. Capital Shares
Transactions in capital shares were as follows:
| | | | | | | | |
| | | Year ended | |
| | | 12/31/18 | | | 12/31/17 | |
Shares sold: | | | | | | | | |
Standard Class | | | 2,222,882 | | | | 1,945,012 | |
Service Class | | | 1,778,979 | | | | 1,134,174 | |
Shares issued upon reinvestment of dividends and distributions: | | | | | | | | |
Standard Class | | | 373,545 | | | | 67,183 | |
Service Class | | | 523,054 | | | | 68,686 | |
| | | | | | | | |
| | | 4,898,460 | | | | 3,215,055 | |
| | | | | | | | |
| | |
Shares redeemed: | | | | | | | | |
Standard Class | | | (2,591,433 | ) | | | (1,376,945 | ) |
Service Class | | | (1,815,773 | ) | | | (3,087,084 | ) |
| | | | | | | | |
| | | (4,407,206 | ) | | | (4,464,029 | ) |
| | | | | | | | |
Net increase (decrease) | | | 491,254 | | | | (1,248,974 | ) |
| | | | | | | | |
Emerging Markets Series-18
Delaware VIP® Emerging Markets Series
Notes to financial statements (continued)
7. Line of Credit
The Series, along with certain other funds in the Delaware Funds (Participants), was a participant in a revolving line of credit intended to be used for temporary or emergency purposes as an additional source of liquidity to fund redemptions of investor shares. The revolving line of credit available was reduced from $155,000,000 to $130,000,0000 on Sept. 6, 2018. Under the agreement, the Participants were charged an annual commitment fee of 0.15%, which was allocated across the Participants based on a weighted average of the respective net assets of each Participant. The Participants were permitted to borrow up to a maximum ofone-third of their net assets under the agreement. Each Participant was individually, and not jointly, liable for its particular advances, if any, under the line of credit. The line of credit available under the agreement expired on Nov. 5, 2018.
On Nov. 5, 2018, the Participants entered into an amendment to the agreement for a $190,000,000 revolving line of credit. The revolving line of credit available was increased to $220,000,000 on Nov. 29, 2018. The revolving line of credit is to be used as described above and operates in substantially the same manner as the original agreement. The line of credit available under the agreement expires on Nov. 4, 2019.
The Series had no amounts outstanding as of Dec. 31, 2018, or at any time during the year then ended.
8. Derivatives
US GAAP requires disclosures that enable investors to understand: (1) how and why an entity uses derivatives; (2) how they are accounted for; and (3) how they affect an entity’s results of operations and financial position.
Foreign Currency Exchange Contracts
The Series may enter into foreign currency exchange contracts and foreign cross currency exchange contracts as a way of managing foreign exchange rate risk. The Series may enter into these contracts to fix the US dollar value of a security that it has agreed to buy or sell for the period between the date the trade was entered into and the date the security is delivered and paid for. The Series may also use these contracts to hedge the US dollar value of securities it already owns that are denominated in foreign currencies. In addition, the Series may enter into these contracts to facilitate or expedite the settlement of portfolio transactions. The change in value is recorded as an unrealized gain or loss. When the contract is closed, a realized gain or loss is recorded equal to the difference between the value of the contract at the time it was opened and the value at the time it was closed.
The use of foreign currency exchange contracts and foreign cross currency exchange contracts does not eliminate fluctuations in the underlying prices of the securities, but does establish a rate of exchange that can be achieved in the future. Although foreign currency exchange contracts and foreign cross currency exchange contracts limit the risk of loss due to an unfavorable change in the value of the hedged currency, they also limit any potential gain that might result should the value of the currency change favorably. In addition, the Series could be exposed to risks if the counterparties to the contracts are unable to meet the terms of their contracts. The Series’ maximum risk of loss from counterparty credit risk is the value of its currency exchanged with the counterparty. The risk is generally mitigated by having a netting arrangement between the Series and the counterparty and by the posting of collateral by the counterparty to the Series to cover the Series’ exposure to the counterparty. No foreign currency exchange contracts and foreign cross currency contracts were outstanding at Dec. 31, 2018.
During the year ended Dec. 31, 2018, the Series entered into foreign currency exchange contracts and foreign cross currency exchange contracts to facilitate or expedite the settlement of portfolio transactions.
At Dec. 31, 2018, the Series experienced net realized and unrealized gains or losses attributable to foreign currency holdings, which are disclosed as “Net realized gain on foreign currency exchange contracts” on the “Statement of operations.”
Derivatives Generally.The table below summarizes the average balance of derivative holdings by the Series during the year ended Dec. 31, 2018.
| | | | |
| | | Long | | Short |
| | | Derivatives
Volume | | Derivatives
Volume |
Foreign currency exchange contracts (average cost) | | $149,552 | | $90,798 |
9. Offsetting
Master Repurchase Agreements
Repurchase agreements are entered into by the Series under master repurchase agreements (each, an MRA). The MRA permits the Series, under certain circumstances including an event of default (such as bankruptcy or insolvency), to offset payables and/or receivables with collateral held by and/or posted to the counterparty. As a result, one single net payment is created. Bankruptcy or insolvency laws of a particular jurisdiction may impose restrictions on or prohibitions against such a right of offset in the event of the MRA counterparty’s bankruptcy or insolvency. Based on the terms of the MRA, the Series receives securities as collateral with a market value in excess of the repurchase price at maturity. Upon a bankruptcy or insolvency of the MRA
| | |
| | Emerging Markets Series-19 |
Delaware VIP® Emerging Markets Series
Notes to financial statements (continued)
9. Offsetting (continued)
counterparty, the Series would recognize a liability with respect to such excess collateral. The liability reflects the Series’ obligation under bankruptcy law to return the excess to the counterparty. As of Dec. 31, 2018, the following table is a summary of the Series’ repurchase agreements by counterparty which are subject to offset under an MRA:
| | | | | | | | | | | | | | | | | | |
Master Repurchase
Agreements Counterparty | | Repurchase
Agreements | | | Fair Value of Non-Cash Collateral Received(a) | | | Cash Collateral Received | | | Net Collateral Received | | | Net Exposure(b) |
Bank of America Merrill Lynch | | | $ 80,841 | | | | $ — | | | | $(80,841) | | | | $ (80,841) | | | $— |
Bank of Montreal | | | 222,311 | | | | (222,311) | | | | — | | | | (222,311) | | | — |
BNP Paribas | | | 363,518 | | | | (363,518) | | | | — | | | | (363,518) | | | — |
Total | | | $666,670 | | | | $(585,829) | | | | $(80,841) | | | | $(666,670) | | | $— |
(a)The value of the related collateral received exceeded the value of the repurchase agreements as of Dec. 31, 2018.
(b)Net exposure represents the receivable (payable) that would be due from (to) the counterparty in the event of default.
10. Securities Lending
The Series, along with other funds in the Delaware Funds, may lend its securities pursuant to a security lending agreement (Lending Agreement) with The Bank of New York Mellon (BNY Mellon). At the time a security is loaned, the borrower must post collateral equal to the required percentage of the market value of the loaned security, including any accrued interest. The required percentage is: (1) 102% with respect to US securities and foreign securities that are denominated and payable in US dollars; and (2) 105% with respect to foreign securities. With respect to each loan, if on any business day the aggregate market value of securities collateral plus cash collateral held is less than the aggregate market value of the securities that are the subject of such loan, the borrower will be notified to provide additional collateral by the end of the following business day, which, together with the collateral already held, will be not less than the applicable initial collateral requirements for such security loan. If the aggregate market value of securities collateral and cash collateral held with respect to a security loan exceeds the applicable initial collateral requirement, upon the request of the borrower, BNY Mellon must return enough collateral to the borrower by the end of the following business day to reduce the value of the remaining collateral to the applicable initial collateral requirement for such security loan. As a result of the foregoing, the value of the collateral held with respect to a loaned security on any particular day may be more or less than the value of the security on loan. The collateral percentage with respect to the market value of the loaned securities is determined by the security lending agent.
Cash collateral received by each series of the Trust is generally invested in a series of individual separate accounts, each corresponding to a series. The investment guidelines permit each separate account to hold certain securities that would be considered eligible securities for a money market fund. Cash collateral received is generally invested in government securities; certain obligations issued by government sponsored enterprises; repurchase agreements collateralized by US Treasury securities; obligations issued by the central government of any Organization for Economic Cooperation and Development (OECD) country or its agencies, instrumentalities, or establishments; obligations of supranational organizations; commercial paper, notes, bonds, and other debt obligations; certificates of deposit, time deposits, and other bank obligations; and asset-backed securities. The Series can also accept US government securities and letters of credit(non-cash collateral) in connection with securities loans.
In the event of default or bankruptcy by the lending agent, realization and/or retention of the collateral may be subject to legal proceedings. In the event the borrower fails to return loaned securities and the collateral received is insufficient to cover the value of the loaned securities and provided such collateral shortfall is not the result of investment losses, the lending agent has agreed to pay the amount of the shortfall to the Series or, at the discretion of the lending agent, replace the loaned securities. The Series continues to record dividends or interest, as applicable, on the securities loaned and are subject to changes in value of the securities loaned that may occur during the term of the loan. The Series has the right under the Lending Agreement to recover the securities from the borrower on demand. With respect to security loans collateralized bynon-cash collateral, the Series receives loan premiums paid by the borrower. With respect to security loans collateralized by cash collateral, the earnings from the collateral investments are shared among the Series, the security lending agent, and the borrower. The Series records security lending income net of allocations to the security lending agent and the borrower.
The Series may incur investment losses as a result of investing securities lending collateral. This could occur if an investment in the collateral investment account defaulted or became impaired. Under those circumstances, the value of the Series’ cash collateral account may be less than the amount the Series would be required to return to the borrowers of the securities and the Series would be required to make up for this shortfall.
During the year ended Dec. 31, 2018, the Series had no securities out on loan.
Emerging Markets Series-20
Delaware VIP® Emerging Markets Series
Notes to financial statements (continued)
11. Credit and Market Risk
Some countries in which the Series may invest require governmental approval for the repatriation of investment income, capital, or the proceeds of sales of securities by foreign investors. In addition, if there is deterioration in a country’s balance of payments or for other reasons, a country may impose temporary restrictions on foreign capital remittances abroad.
The securities exchanges of certain foreign markets are substantially smaller, less liquid, and more volatile than the major securities markets in the United States. Consequently, acquisition and disposition of securities by the Series may be inhibited. In addition, a significant portion of the aggregate market value of equity securities listed on the major securities exchanges in emerging markets is held by a smaller number of investors. This may limit the number of shares available for acquisition or disposition by the Series.
The Series may invest up to 10% of its net assets in illiquid securities, which may include securities with contractual restrictions on resale, securities exempt from registration under Rule 144A, promulgated under the Securities Act of 1933, as amended, and other securities which may not be readily marketable. The relative illiquidity of these securities may impair the Series from disposing of them in a timely manner and at a fair price when it is necessary or desirable to do so. While maintaining oversight, the Board has delegated to DMC theday-to-day functions of determining whether individual securities are liquid for purposes of the Series’ limitation on investments in illiquid securities. Securities eligible for resale pursuant to Rule 144A, which are determined to be liquid, are not subject to the Series’ 10% limit on investments in illiquid securities. Restricted securities and private placements are valued pursuant to the security valuation procedures described in Note 1.
12. Contractual Obligations
The Series enters into contracts in the normal course of business that contain a variety of indemnifications. The Series’ maximum exposure under these arrangements is unknown. However, the Series has not had prior claims or losses pursuant to these contracts. Management has reviewed the Series’ existing contracts and expects the risk of loss to be remote.
13. Recent Accounting Pronouncements
In August 2018, the FASB issued an Accounting Standards Update, ASU2018-13, which changes certain fair value measurement disclosure requirements. The ASU2018-13, in addition to other modifications and additions, removes the requirement to disclose the amount and reasons for transfers between Level 1 and Level 2 of the fair value hierarchy, the policy for the timing of transfers between levels and the valuation process for Level 3 fair value measurements. The ASU2018-13 is effective for fiscal years, and interim periods within those fiscal years, beginning after Dec. 15, 2019. At this time, management is evaluating the implications of these changes on the financial statements.
In August 2018, the Securities and Exchange Commission (SEC) adopted amendments to RegulationS-X to update and simplify the disclosure requirements for registered investment companies by eliminating requirements that are redundant or duplicative of US GAAP requirements or other SEC disclosure requirements. The new amendments require the presentation of the total, rather than the components, of distributable earnings on the “Statement of assets and liabilities” and the total, rather than the components, of dividends from net investment income and distributions from net realized gains on the “Statements of changes in net assets.” The amendments also removed the requirement for the parenthetical disclosure of undistributed net investment income on the “Statements of changes in net assets” and certain tax adjustments that were reflected in the “Notes to financial statements.” All of these have been reflected in the Series’ financial statements.
14. Subsequent Events
Management has determined that no material events or transactions occurred subsequent to Dec. 31, 2018, that would require recognition or disclosure in the Series’ financial statements.
| | |
| | Emerging Markets Series-21 |
Delaware VIP® Trust—Delaware VIP Emerging Markets Series
Report of independent registered public accounting firm
To the Board of Trustees of Delaware VIP® Trust and Shareholders of Delaware VIP Emerging Markets Series
Opinion on the Financial Statements
We have audited the accompanying statement of assets and liabilities, including the schedule of investments, of Delaware VIP Emerging Markets Series (one of the series constituting Delaware VIP® Trust, referred to hereafter as the “Series”) as of December 31, 2018, the related statement of operations for the year ended December 31, 2018, the statements of changes in net assets for each of the two years in the period ended December 31, 2018, including the related notes, and the financial highlights for each of the five years in the period ended December 31, 2018 (collectively referred to as the “financial statements”). In our opinion, the financial statements present fairly, in all material respects, the financial position of the Series as of December 31, 2018, the results of its operations for the year then ended, the changes in its net assets for each of the two years in the period ended December 31, 2018 and the financial highlights for each of the five years in the period ended December 31, 2018 in conformity with accounting principles generally accepted in the United States of America.
Basis for Opinion
These financial statements are the responsibility of the Series’ management. Our responsibility is to express an opinion on the Series’ financial statements based on our audits. We are a public accounting firm registered with the Public Company Accounting Oversight Board (United States) (PCAOB) and are required to be independent with respect to the Series in accordance with the U.S. federal securities laws and the applicable rules and regulations of the Securities and Exchange Commission and the PCAOB.
We conducted our audits of these financial statements in accordance with the standards of the PCAOB. Those standards require that we plan and perform the audit to obtain reasonable assurance about whether the financial statements are free of material misstatement, whether due to error or fraud.
Our audits included performing procedures to assess the risks of material misstatement of the financial statements, whether due to error or fraud, and performing procedures that respond to those risks. Such procedures included examining, on a test basis, evidence regarding the amounts and disclosures in the financial statements. Our audits also included evaluating the accounting principles used and significant estimates made by management, as well as evaluating the overall presentation of the financial statements. Our procedures included confirmation of securities owned as of December 31, 2018 by correspondence with the custodian and brokers. We believe that our audits provide a reasonable basis for our opinion.
/s/ PricewaterhouseCoopers LLP
Philadelphia, Pennsylvania
February 14, 2019
We have served as the auditor of one or more investment companies in Delaware Funds® by Macquarie since 2010.
| | |
| | Emerging Markets Series-22 |
Delaware VIP® Trust — Delaware VIP Emerging Markets Series
Other Series information (Unaudited)
Board consideration of investment advisory agreement for Delaware VIP Emerging Markets Series
At a meeting held on Aug.15-16, 2018 (the “Annual Meeting”), the Board of Trustees (the “Board”), including a majority of disinterested or independent Trustees, approved the renewal of the Investment Advisory Agreement for Delaware VIP Emerging Markets Series (the “Series”). In making its decision, the Board considered information furnished at regular quarterly Board meetings, including reports detailing Series performance, investment strategies, and expenses, as well as information prepared specifically in connection with the renewal of the Investment Advisory Agreement. Information furnished specifically in connection with the renewal of the Investment Advisory Agreement with Delaware Management Company (“DMC”), a series of Macquarie Investment Management Business Trust (“MIMBT”), included materials provided by DMC and its affiliates (collectively, “Macquarie Investment Management”) concerning, among other things, the nature, extent, and quality of services provided to the Series; the costs of such services to the Series; economies of scale; and the investment manager’s financial condition and profitability. In addition, in connection with the Annual Meeting, materials were provided to the Trustees in May 2018, including reports provided by Broadridge Financial Solutions (“Broadridge”). The Broadridge reports compared the Series’ investment performance and expenses with those of other comparable mutual funds. The Independent Trustees reviewed and discussed the Broadridge reports with independent legal counsel to the Independent Trustees. In addition to the information noted above, the Board also requested and received information regarding DMC’s policy with respect to advisory fee levels and its breakpoint philosophy; the structure of portfolio manager compensation; comparative client fee information; and any constraints or limitations on the availability of securities for certain investment styles, which had in the past year inhibited, or which were likely in the future to inhibit, the investment manager’s ability to invest fully in accordance with Series policies.
In considering information relating to the approval of the Series’ Investment Advisory Agreement, the Independent Trustees received assistance and advice from and met separately with independent legal counsel to the Independent Trustees and also received assistance and advice from an experienced and knowledgeable independent fund consultant, JDL Consultants, LLC (“JDL”). Although the Board gave attention to all information furnished, the following discussion identifies, under separate headings, the primary factors taken into account by the Board during its contract renewal considerations.
Nature, extent, and quality of services.The Board considered the services provided by DMC to the Series and its shareholders. In reviewing the nature, extent, and quality of services, the Board considered reports furnished to it throughout the year, which covered matters such as the relative performance of the Series, compliance of portfolio managers with the investment policies, strategies and restrictions for the Series, compliance by DMC and Delaware Distributors, L.P. (together, “Management”) personnel with the Code of Ethics adopted throughout the Delaware Funds® by Macquarie (the “Delaware Funds”), and adherence to fair value pricing procedures as established by the Board. The Board was pleased with the current staffing of DMC and the emphasis placed on research in the investment process. The Board recognized DMC’s receipt of certain favorable industry distinctions during the past several years. The Board gave favorable consideration to DMC’s efforts to control expenses while maintaining service levels committed to Series matters. The Board was satisfied with the nature, extent, and quality of the overall services provided by DMC.
Investment performance.The Board placed significant emphasis on the investment performance of the Series in view of the importance of investment performance to shareholders. Although the Board considered performance reports and discussions with portfolio managers at Board meetings throughout the year, the Board gave particular weight to the Broadridge reports furnished for the Annual Meeting. The Broadridge reports prepared for the Series showed the investment performance of its Standard Class shares in comparison to a group of similar funds as selected by Broadridge (the “Performance Universe”). A fund with the best performance ranked first, and a fund with the poorest performance ranked last. The highest/best performing 25% of funds in the Performance Universe make up the first quartile; the next 25%, the second quartile; the next 25%, the third quartile; and the poorest/worst performing 25% of funds in the Performance Universe make up the fourth quartile. Comparative annualized performance for the Series was shown for the past1-,3-,5- and10-year periods, as applicable, ended Jan. 31, 2018. The Board’s objective is that the Series’ performance for the1-,3- and5-year periods be at or above the median of its Performance Universe.
The Performance Universe for the Series consisted of the Series and all emerging markets funds underlying variable insurance products as selected by Broadridge. The Broadridge report comparison showed that the Series’ total return for the1-year period was in the third quartile of its Performance Universe. The report further showed that the Series’ total return for the3-,5-, and10-year periods was in the first quartile of its Performance Universe. The Board was satisfied with performance.
Comparative expenses.The Board considered expense data for the Delaware Funds. Management provided the Board with information on pricing levels and fee structures for the Series as of its most recently completed fiscal year. The Board also focused on the comparative analysis of effective management fees and total expense ratios of the Series versus effective management fees and expense ratios of a group of similar funds as selected by Broadridge (the “Expense Group”). In reviewing comparative costs, the Series’ contractual management fee and the actual management fee incurred by the Series were compared with the contractual management fees (assuming all funds in the Expense Group were similar in size to the Series) and actual management fees (as reported by each fund) within the Expense Group, taking into account any applicable breakpoints and fee waivers. The Series’ total expenses were also compared with those of its Expense Group. The Broadridge total expenses, for comparative consistency, were shown by Broadridge for Standard Class shares which do not charge12b-1 andnon-12b-1 service fees. The Board’s objective is for each Series’ total expense ratio to be competitive with those of the peer funds within its Expense Group.
| | |
| | Emerging Markets Series-23 |
Delaware VIP® Trust — Delaware VIP Emerging Markets Series
Other Series information (Unaudited)
Board consideration of investment advisory agreement for Delaware VIP Emerging Markets Series (continued)
The expense comparisons for the Series showed that the actual management fee and total expenses were in the quartile with the highest expenses of its Expense Group. The Series’ total expenses were not in line with the Board’s objective. In evaluating total expenses, the Board considered various initiatives implemented by Management, such as the negotiation of lower fees for fund accounting, fund accounting oversight and custody services, which had created an opportunity for a further reduction in expenses. The Board was satisfied with Management’s efforts to improve the Series’ total expense ratio and to bring it in line with the Board’s objective.
Management profitability.The Board considered the level of profits realized by DMC in connection with the operation of the Series. In this respect, the Board reviewed the Investment Management Profitability Analysis that addressed the overall profitability of DMC’s business in providing management and other services to each of the individual funds and the Delaware Funds as a whole. Specific attention was given to the methodology used by DMC in allocating costs for the purpose of determining profitability. Management stated that the level of profits of DMC, to a certain extent, reflects recent operational cost savings and efficiencies initiated by DMC. The Board considered DMC’s efforts to improve services provided to Fund shareholders and to meet additional regulatory and compliance requirements resulting from recent industry-wide Securities and Exchange Commission initiatives. The Board also considered the extent to which DMC might derive ancillary benefits from fund operations, including the potential for procuring additional business as a result of the prestige and visibility associated with its role as service provider to the Delaware Funds and the benefits from allocation of fund brokerage to improve trading efficiencies. As part of its work, the Board also reviewed a report prepared by JDL regarding MIMBT profitability as compared to certain peer fund complexes and the Independent Trustees met with JDL personnel to discuss DMC’s profitability in such context. The Board found that the management fees were reasonable in light of the services rendered and the profitability of DMC.
Economies of scale.The Trustees considered whether economies of scale are realized by DMC as the Series’ assets increase and the extent to which any economies of scale are reflected in the level of management fees charged. The Trustees reviewed the Series’ advisory fee pricing and structure approved by the Board and shareholders, which includes breakpoints, and which applies to most funds in the Delaware Funds complex. Breakpoints in the advisory fee occur when the advisory fee rate is reduced on assets in excess of specified levels. Breakpoints result in a lower advisory fee, than would otherwise be the case in the absence of breakpoints, when the asset levels specified in the breakpoints are exceeded. The Board noted that, as of March 31, 2018, the Series’ assets exceeded the first breakpoint level. The Board believed that, given the extent to which economies of scale might be realized by DMC and its affiliates, the schedule of fees under the Investment Advisory Agreement provides a sharing of benefits with the Series and its shareholders.
Tax Information
All disclosures are based on financial information available as of the date of this annual report and, accordingly are subject to change. For any and all items requiring reporting, it is the intention of the Series to report the maximum amount permitted under the Internal Revenue Code and the regulations thereunder.
For the year ended Dec. 31, 2018, the Series reports distributions paid during the year as follows:
|
(A) Ordinary Income Distributions (Tax Basis) |
100.00% |
(A) is based on a percentage of the Series’ total distributions.
The Series intends to pass through foreign tax credits of $1,379,123. The gross foreign source income earned during the fiscal year ended Dec. 31, 2018 by the Series was $14,407,787.
Emerging Markets Series-24
Delaware Funds® by Macquarie
Board of trustees/directors and officers addendum
A mutual fund is governed by a Board of Trustees/Directors (“Trustees”), which has oversight responsibility for the management of a fund’s business affairs. Trustees establish procedures and oversee and review the performance of the investment manager, the distributor, and others who perform services for the fund. The independent fund trustees, in particular, are advocates for shareholder interests. Each trustee has served in that capacity since he or she was elected to or appointed to the Board of Trustees, and will continue to serve until his or her retirement or the election of a new trustee in his or her place. The following is a list of the Trustees and Officers with certain background and related information.
| | | | | | | | | | |
Name, Address, and Birth Date | | Position(s) Held with Fund(s) | | Length of Time Served | | Principal Occupation(s) During the Past Five Years | | Number of Portfolios in Fund Complex Overseen by Trustee or Officer | | Other Directorships Held by Trustee or Officer |
INTERESTED TRUSTEE | | | | | | |
| | | | | |
Shawn K. Lytle1,3
2005 Market Street Philadelphia, PA 19103 February 1970 | | President,
Chief Executive Officer,
and Trustee | | President and
Chief Executive Officer
since August 2015 Trustee since
September 2015 | | President — Macquarie
Investment Management2
(June 2015-Present) Regional Head of
Americas — UBS Global
Asset Management
(April2010-May 2015) | | 59 | | Trustee —
UBS Relationship Funds,
SMA Relationship Trust,
and UBS Funds
(May 2010–April 2015) |
INDEPENDENT TRUSTEES | | | | | | |
| | | | | |
Thomas L. Bennett
2005 Market Street
Philadelphia, PA 19103 October 1947 | | Chair and Trustee | | Trustee since
March 2005 Chair since March 2015 | | Private Investor
(March 2004–Present) | | 59 | | None |
Jerome D. Abernathy
2005 Market Street
Philadelphia, PA 19103 July 1959 | | Trustee | | Since January 2019 | | Managing Member,
Stonebrook Capital
Management, LLC
(financial technology: macro
factors and databases)
(January 1993–Present) | | 59 | | None |
| | | | | |
Ann D. Borowiec
2005 Market Street
Philadelphia, PA 19103 November 1958 | | Trustee | | Since March 2015 | | Chief Executive Officer,
Private Wealth Management
(2011–2013) and Market Manager,
New Jersey Private Bank
(2005–2011) —
J.P. Morgan Chase & Co. | | 59 | | Director —
Banco Santander International
(October 2016-Present) Director —
Santander Bank, N.A.
(December 2016-Present) |
| | | | | |
Joseph W. Chow
2005 Market Street
Philadelphia, PA 19103 January 1953 | | Trustee | | Since January 2013 | | Private Investor
(April 2011–Present) | | 59 | | Director and Audit
Committee
Member — Hercules
Technology Growth
Capital, Inc.
(July 2004–July 2014) |
| | | | | |
John A. Fry
2005 Market Street
Philadelphia, PA 19103 May 1960 | | Trustee | | Since January 2001 | | President —
Drexel University
(August 2010–Present) President —
Franklin & Marshall College
(July 2002–July 2010) | | 59 | | Director; Compensation Committee and Governance Committee Member — Community Health Systems Director — Drexel Morgan & Co. Director and Audit Committee Member — vTv Therapeutics LLC Director and Audit Committee Member — FS Credit Real Estate Income Trust, Inc. |
| | | | | |
Lucinda S. Landreth
2005 Market Street
Philadelphia, PA 19103 June 1947 | | Trustee | | Since March 2005 | | Private Investor
(2004–Present) | | 59 | | None |
Emerging Markets Series-25
| | | | | | | | | | |
Name, Address, and Birth Date | | Position(s) Held with Fund(s) | | Length of Time Served | | Principal Occupation(s) During the Past Five Years | | Number of Portfolios in Fund Complex Overseen by Trustee or Officer | | Other Directorships Held by Trustee or Officer |
| | | | | |
| Frances A. Sevilla-Sacasa | | Trustee | | Since | | Private Investor | | 59 | | Trust Manager and |
| 2005 Market Street | | | | September 2011 | | (January 2017-Present) | | | | Audit Committee |
| Philadelphia, PA 19103 | | | | | | | | | | Chair — Camden |
| | | | | | Chief Executive Officer — | | | | Property Trust |
| January 1956 | | | | | | Banco Itaú | | | | (August 2011-Present) |
| | | | | | International | | | | |
| | | | | | (April 2012–December 2016) | | | | Director — Carrizo |
| | | | | | | | | | Oil & Gas, Inc. |
| | | | | | Executive Advisor to Dean | | | | (March 2018-Present) |
| | | | | | (August 2011–March 2012) | | | | |
| | | | | | and Interim Dean | | | | |
| | | | | | (January 2011–July 2011) — | | | | |
| | | | | | University of Miami School of | | | | |
| | | | | | Business Administration | | | | |
| | | | | | | | | | |
| | | | | | President — U.S. Trust, | | | | |
| | | | | | Bank of America Private | | | | |
| | | | | | Wealth Management | | | | |
| | | | | | (Private Banking) | | | | |
| | | | | | | (July 2007–December 2008) | | | | |
| Thomas K. Whitford | | Trustee | | Since | | Vice Chairman | | 59 | | Director — HSBC North |
| 2005 Market Street | | | | January 2013 | | (2010–April 2013) — | | | | America Holdings Inc. |
| Philadelphia, PA 19103 | | | | | | PNC Financial | | | | (December 2013-Present) |
| | | | | | Services Group | | | | |
| March 1956 | | | | | | | | | | Director — HSBC USA Inc. |
| | | | | | | | | | (July 2014-Present) |
| | | | | | | | | | |
| | | | | | | | | | Director — |
| | | | | | | | | | HSBC Bank USA, |
| | | | | | | | | | National Association |
| | | | | | | | | | (July 2014-March 2017) |
| | | | | | | | | | |
| | | | | | | | | | Director — HSBC |
| | | | | | | | | | Finance Corporation |
| | | | | | | | | | | (December 2013-April 2018) |
| Christianna Wood | | Trustee | | Since | | Chief Executive Officer | | 59 | | Director and Audit |
| 2005 Market Street | | | | January 2019 | | and President — | | | | Committee Member — |
| Philadelphia, PA 19103 | | | | | | Gore Creek Capital, Ltd. | | | | H&R Block Corporation |
| | | | | | (August 2009–Present) | | | | (July 2008-Present) |
| March 1956 | | | | | | | | | | |
| | | | | | | | | | Director and Audit |
| | | | | | | | | | Committee Member — |
| | | | | | | | | | Grange Insurance |
| | | | | | | | | | (2013-Present) |
| | | | | | | | | | |
| | | | | | | | | | Trustee and Audit |
| | | | | | | | | | Committee Member — |
| | | | | | | | | | The Merger Fund |
| | | | | | | | | | (2013-Present), |
| | | | | | | | | | The Merger Fund VL |
| | | | | | | | | | (2013-Present); |
| | | | | | | | | | WCM Alternatives: |
| | | | | | | | | | Event-Driven Fund |
| | | | | | | | | | (2013-Present), |
| | | | | | | | | | and WCM Alternatives: |
| | | | | | | | | | Credit Event Fund |
| | | | | | | | | | (December 2017-Present) |
| | | | | | | | | | |
| | | | | | | | | | Director — International |
| | | | | | | | | | Securities Exchange |
| | | | | | | | | | | (2010-2016) |
| Janet L. Yeomans | | Trustee | | Since | | Vice President and Treasurer | | 59 | | Director; Personnel and |
| 2005 Market Street | | | | April 1999 | | (January 2006–July 2012), | | | | Compensation Committee |
| Philadelphia, PA 19103 | | | | | | Vice President — | | | | Chair; Member of |
| | | | | | Mergers & Acquisitions | | | | Nominating, Investments, |
| July 1948 | | | | | | (January 2003–January 2006), and | | | | and Audit Committees for |
| | | | | | Vice President and Treasurer | | | | various periods |
| | | | | | (July 1995–January 2003) — | | | | throughout directorship |
| | | | | | 3M Company | | | | — Okabena Company |
| | | | | | | | | | | (2009-2017) |
| | |
| | |
| | Emerging Markets Series-26 |
| | | | | | | | | | |
Name, Address, and Birth Date | | Position(s) Held with Fund(s) | | Length of Time Served | | Principal Occupation(s) During the Past Five Years | | Number of
Portfolios in Fund
Complex Overseen
by Trustee
or Officer | | Other Directorships Held by Trustee or Officer |
| OFFICERS | | | | | | | | | | |
| | | | | |
| David F. Connor | | Senior | | Senior Vice President, | | David F. Connor has served in | | 59 | | None3 |
| 2005 Market Street | | Vice President, | | since May 2013; | | various capacities at different | | | | |
| Philadelphia, PA 19103 | | General Counsel, | | General Counsel | | times at Macquarie Investment | | | | |
| | and Secretary | | since May 2015; | | Management. | | | | |
| December 1963 | | | | Secretary since | | | | | | |
| | | | | October 2005 | | | | | | |
| | | | | |
| Daniel V. Geatens | | Vice President | | Vice President | | Daniel V. Geatens has served in | | 59 | | None3 |
| 2005 Market Street | | and Treasurer | | and Treasurer | | various capacities at different | | | | |
| Philadelphia, PA 19103 | | | | since | | times at Macquarie Investment | | | | |
| | | | October 2007 | | Management. | | | | |
| October 1972 | | | | | | | | | | |
| | | | | |
| Richard Salus | | Senior | | Senior Vice President | | Richard Salus has served in | | 59 | | None3 |
| 2005 Market Street | | Vice President | | and Chief Financial | | various capacities at different | | | | |
| Philadelphia, PA 19103 | | and | | Officer since | | times at Macquarie Investment | | | | |
| | Chief Financial | | November 2006 | | Management. | | | | |
| October 1963 | | Officer | | | | | | | | |
| 1 | Shawn K. Lytle is considered to be an “Interested Trustee” because he is an executive officer of the Fund’s(s’) investment advisor. |
| 2 | Macquarie Investment Management is the marketing name for Macquarie Management Holdings, Inc. and its subsidiaries, including the Fund’s(s’) investment advisor, principal underwriter, and its transfer agent. |
| 3 | Shawn K. Lytle, David F. Connor, Daniel V. Geatens, and Richard Salus serve in similar capacities for the six portfolios of the Optimum Fund Trust, which have the same investment advisor, principal underwriter, and transfer agent as the registrant. Mr. Geatens also serves as the Chief Financial Officer and Treasurer for Macquarie Global Infrastructure Total Return Fund Inc., which has an affiliated investment manager. |
The Statement of Additional Information for the Fund(s) includes additional information about the Trustees and Officers and is available, without charge, upon request by calling 800523-1918.
| | |
| | |
| | Emerging Markets Series-27 |
| | | | |
| | |
| | The Series files its complete schedule of portfolio holdings with the Securities and Exchange Commission (SEC) for the first and third quarters of each fiscal year on FormN-Q. The Series’ FormsN-Q, as well as a description of the policies and procedures that the Series uses to determine how to vote proxies (if any) relating to portfolio securities are available without charge (i) upon request, by calling 800523-1918; and (ii) on the SEC’s website at sec.gov. In addition, a description of the policies and procedures that the Series uses to determine how to vote proxies (if any) relating to portfolio securities and the Schedule of Investments included in the Series’ most recent FormN-Q are available without charge on the Series’ website at delawarefunds.com/vip/literature. The Series’ FormsN-Q may be reviewed and copied at the SEC’s Public Reference Room in Washington, DC; information on the operation of the Public Reference Room may be obtained by calling 800SEC-0330. Information (if any) regarding how the Series voted proxies relating to portfolio securities during the most recently disclosed12-month period ended June 30 is available without charge (i) through the Series’ website at delawarefunds.com/proxy; and (ii) on the SEC’s website at sec.gov. | | |
| | |
| AR-VIPEM 22041 (2/19) (730130) | | Emerging Markets Series-28 |
Delaware VIP®Trust
Delaware VIP Smid Cap Core Series
December 31, 2018
Table of contents
| | | | | | | | | | |
| | | |

| | Portfolio management review | | | 1 | | | | | |
| | | |
| | Performance summary | | | 3 | | | | | |
| | | |
| | Disclosure of Series expenses | | | 6 | | | | | |
| | | |
| | Security type / sector allocation and top 10 equity holdings | | | 7 | | | | | |
| | | |
| | Schedule of investments | | | 8 | | | | | |
| | | |
| | Statement of assets and liabilities | | | 11 | | | | | |
| | | |
| | Statement of operations | | | 12 | | | | | |
| | | |
| | Statements of changes in net assets | | | 12 | | | | | |
| | | |
| | Financial highlights | | | 13 | | | | | |
| | | |
| | Notes to financial statements | | | 15 | | | | | |
| | | |
| | Report of independent registered public accounting firm | | | 22 | | | | | |
| | | |
| | Other Series information | | | 23 | | | | | |
| | | |
| | Board of trustees / directors and officers addendum | | | 25 | | | | | |
| | | |
| | | | | | | | | | | |
| | | |
| | Other than Macquarie Bank Limited (MBL), none of the entities noted are authorized deposit-taking institutions for the purposes of the Banking Act 1959 (Commonwealth of Australia). The obligations of these entities do not represent deposits or other liabilities of MBL. MBL does not guarantee or otherwise provide assurance in respect of the obligations of these entities, unless noted otherwise. The Series is governed by US laws and regulations. Unless otherwise noted, views expressed herein are current as of Dec. 31, 2018, and subject to change for events occurring after such date. The Series is not FDIC insured and is not guaranteed. It is possible to lose the principal amount invested. Advisory services provided by Delaware Management Company, a series of Macquarie Investment Management Business Trust (MIMBT), a US registered investment advisor. The Series is distributed byDelaware Distributors, L.P.(DDLP), an affiliate of MIMBT and Macquarie Group Limited. Macquarie Investment Management (MIM) is the marketing name for certain companies comprising the asset management division of Macquarie Group Limited and its subsidiaries and affiliates worldwide. This material may be used in conjunction with the offering of shares in Delaware VIP Smid Cap Core Series only if preceded or accompanied by the Series’ current prospectus or the summary prospectus. © 2019 Macquarie Management Holdings, Inc. All third-party marks cited are the property of their respective owners. | | | | | | | | |
Delaware VIP®Trust — Delaware VIP Smid Cap Core Series
| | |
| Portfolio management review | | January 8, 2019 |
For the fiscal year ended Dec. 31, 2018, Delaware VIP Smid Cap Core Series (the “Series”) Standard Class shares declined 12.12% and Service Class shares declined 12.40%. Both figures reflect all dividends reinvested. The Series’ benchmark, the Russell 2500TMIndex, fell 10.00% for the same period.
Over the year, small- andmid-cap stocks underperformedlarge-cap stocks. Thesmaller-cap Russell 2000 Index declined 11.01% for the year while the Russell Midcap®Index fell 9.06%, and thelarge-cap Russell 1000®Index declined 4.78%. Growth companies declined by less than value companies during the year as the Russell 2500TMGrowth Index fell 7.47% versus the 12.36% decline for the Russell 2500TMValue Index.
In the Russell 2500 Index, higher-quality companies underperformed. Companies with lowprice-to-earnings (P/E) ratios declined more than companies with high P/E ratios and companies with high return on equity (ROE), declined more than companies with low ROE. Two of the benchmark’s 16 sectors were positive for the year: utilities and technology. The healthcare sector declined during the year, but by the least amount of any of the negative sectors. The energy sector was the weakest- performing sector in the benchmark, with a decline of more than 35%. The credit cyclicals, basic materials, transportation, and capital goods sectors each fell by more than 15% during the year.
On the economic front, the Federal Open Market Committee increased the federal funds rate four times during the year, ending at a new target range of 2.25% to 2.50%. We continue to believe that the US Federal Reserve will act when it believes the economy can support it and Fed Chairman Powell recently took a more dovish tone stating that the Fed will be patient with policy. Third quarter gross domestic product (GDP) growth was strong with a growth rate of 3.4%. The unemployment rate reached its lowest level since 1969, at 3.7%, in November, then rose slightly in December to a still low 3.9%, with positive signs of wage inflation reported. (Sources: US Bureau of Economic Analysis, US Bureau of Labor Statistics.)
With respect to the survey data that we carefully monitor, the Conference Board Consumer Confidence Index®(1985=100, SA) continued to measure above 100, with a December survey of 128.1. The National Federation of Independent Business (NFIB) Small Business Optimism Index was basically unchanged in December, declining by 0.4 points, to 104.4. In the manufacturing sector, the Purchasing Managers’ Index fell below 55, to a reading of 54.1 for December, which was the indicator’s largest monthly decline in 10 years. The production and new orderssub-components drove the decline as tariffs and a strong dollar were noted as headwinds. Overall, these readings indicated a relatively healthy economy, albeit one that we continue to carefully monitor.
Stock selection was the main detractor from relative performance during the fiscal year. The Series’ holdings in the finance sector detracted, led by underperformance from regional bank holdings. Investors grew concerned over the flattening yield curve later in the fiscal year, leading to an unwarranted selloff in bank stocks, which affected our holdings more than those in the benchmark. Stock selection in the technology, energy, business services, and capital goods sectors detracted. Contributing was stock selection in the healthcare, consumer discretionary, and consumer staples sectors.
Tenneco Inc.designs, manufactures, and distributes emissions-reduction and suspension technologies for vehicles. Shares of Tenneco detracted from the Series’ performance during the fiscal year. The company’s stock price fell in April, after it announced plans to acquire Federal-Mogul from Icahn Enterprises in an equity- and debt-financed deal that would eventually allow for the separation of the company into two independent, publicly traded companies through atax-freespin-off to shareholders. Tenneco plans to complete thespin-off in 2019 by establishing one company to focus on aftermarket and ride performance and a second one to focus on powertrain technology. While the acquisition is expected to be accretive in Tenneco’s 2019 fiscal year and was approved by its shareholders, the stock has underperformed as investors had anticipated Tenneco would complete a deal that would have boosted its profile in the battery electric vehicle powertrain market. We added to the Series’ position in Tenneco during the fiscal year on the stock’s price weakness. As of the end of the fiscal year, we continued to hold shares of Tenneco as its revenues and profits have remained strong and the company has announced additional merger-related cost savings.
Belden Inc.provides broadcast solutions for television and satellite, connectivity infrastructure, and is a leading producer of cable products. The company’s stock underperformed during the fiscal year. In February, the company reported fiscal fourth quarter 2017 results that missed expectations, leading to a selloff in shares. We added to the Series’ weight on this weakness, which the company reported was an isolated situation in its Broadcast Solutions segment. During the remainder of the year, the stock performed well. Belden entered its fiscal third quarter of 2018 with a record backlog, but when the company reported results for its fiscal third quarter, management noted that new orders during the quarter had softened in its Enterprise segment and capacity constraints in the company’s Industrial segment led to a revenue miss. We remain invested in Belden as the company generates strong, consistent free-cash flow, is repurchasing its shares, and has a management team that is committed to executing over the long term.
In the healthcare sector, shares of glucose monitoring systems companyDexCom, Inc.contributed to the Series’ performance during the fiscal year. During the year, DexCom reported multiple quarters of strong financial results that beat expectations, while continuing to raise guidance. We maintained the Series’ position in DexCom as we continue to see ample opportunities for growth in the company’s sales.
Unless otherwise noted, views expressed herein are current as of Dec. 31, 2018, and subject to change.
Smid Cap Core Series-1
Delaware VIP®Trust — Delaware VIP Smid Cap Core Series
| | |
| Portfolio management review (continued) | | January 8, 2019 |
Shares of online and mobile restaurantpick-up and delivery companyGrubHub Inc.outperformed during the12-month period. The company’s outperformance resulted from consistently beating earnings expectations and a number of key business developments. GrubHub announced a transformative partnership with Yum! Brands in February that boosted the stock’s price. This partnership will leverage Yum! Brands’ Pizza Hut delivery infrastructure, the largest in the nation, to deliver food from GrubHub clients as well as Yum! Brands’ other restaurants: Taco Bell and KFC. Additionally, GrubHub benefited from acquiring restaurant software company, LevelUp. We trimmed the Series’ position in GrubHub during the fiscal year to maintain its weight in the portfolio, while ending the fiscal year with a relative overweight.
With respect to sector positioning, the Series ended the fiscal period with its largest relative overweight positions in the basic materials, finance, capital goods, and healthcare sectors. In the capital goods sector, we increased the weight to the engineering and construction industry as we purchased four new positions during the year. The Series’ absolute weight in the healthcare sector increased during the year as a result of stock outperformance, ending the period with a relative overweight. During the year, the Series remained underweight in the consumer services, real estate investment trust (REIT), and media sectors.
On balance, we believe the macroeconomic environment should favor active managers who can apply thorough company-level analysis when making investment decisions. We continue to maintain our strategy of investing in companies that, in our view, have strong balance sheets and cash flow, sustainable competitive advantages, and high-quality management teams with the ability to deliver value to shareholders over the long term.
Unless otherwise noted, views expressed herein are current as of Dec. 31, 2018, and subject to change.
Smid Cap Core Series-2
Delaware VIP®Trust — Delaware VIP Smid Cap Core Series
Performance summary
The performance quoted represents past performance and does not guarantee future results. Investment return and principal value of an investment will fluctuate so that shares, when redeemed, may be worth more or less than their original cost. Current performance may be lower or higher than the performance quoted.
Carefully consider the Series’ investment objectives, risk factors, charges, and expenses before investing. This and other information can be found in the Series’ prospectus and its summary prospectus, which may be obtained by visiting delawarefunds.com/vip/literature or calling 800523-1918. Investors should read the prospectus and the summary prospectus carefully before investing.
| | | | | | | | | | | | | | | | | | | | | | |
| Delaware VIP Smid Cap Core Series | | | | | | | | | | | | | | | | | | | | | |
| Average annual total returns | | | | | | | | | | | | | | | | | | | | | |
| For periods ended December 31, 2018 | | 1 year | | | | 3 years | | | | 5 years | | | | 10 years | | | | Lifetime | | | |
| Standard Class shares (commenced operations on July 12, 1991) | | -12.12% | | | | +4.13% | | | | +4.61% | | | | +15.46% | | | | +9.56% | | | | |
| | | | | | | | | | | | | | | | | | | | | | |
| Service Class shares (commenced operations on May 1, 2000) | | -12.40% | | | | +3.85% | | | | +4.34% | | | | +15.18% | | | | +5.58% | | | | |
| | | | | | | | | | | | | | | | | | | | | | |
| Russell 2500 Index | | -10.00% | | | | +7.32% | | | | +5.15% | | | | +13.15% | | | | n/a | | | | |
Returns reflect the reinvestment of all distributions. Please see page 4 for a description of the index.
As described in the Series’ most recent prospectus, the net expense ratio for Service Class shares of the Series was 1.07%, while total operating expenses for Standard Class and Service Class shares were 0.81% and 1.11%, respectively. The management fee for Standard Class and Service Class shares was 0.74%. Please see the “Financial highlights” section in this report for the most recent expense ratios.
The Series pays Delaware Distributors, L.P. (DDLP), the distributor and an affiliate of DMC, an annual12b-1 fee of 0.30% of the average daily net assets of the Service Class shares. Prior to May 1, 2018, DDLP had contracted to waive12b-1 fees in order to limit12b-1 fees of the Service Class shares to 0.25% of average daily net assets.
Earnings from a variable annuity or variable life investment compoundtax-free until withdrawal, and as a result, no adjustments were made for income taxes.
Expense limitations were in effect for both classes during certain periods shown in the Series performance table above and in the Performance of a $10,000 Investment graph on the next page.
Performance data do not reflect insurance fees related to a variable annuity or variable life investment or the deferred sales charge that would apply to certain withdrawals of investments held for fewer than eight years. Performance shown here would have been reduced if such fees were included and the expense limitation removed. For more information about fees, consult your variable annuity or variable life prospectus.
Investments in variable products involve risk.
Investments in small and/ormedium-sized companies typically exhibit greater risk and higher volatility than larger, more established companies.
Holding a relatively concentrated portfolio of a limited number of securities may increase risk because each investment has a greater effect on the Series’ overall performance than would be the case for a more diversified fund.
REIT investments are subject to many of the risks associated with direct real estate ownership, including changes in economic conditions, credit risk, and interest rate fluctuations.
International investments entail risks not ordinarily associated with US investments including fluctuation in currency values, differences in accounting principles, or economic or political instability in other nations.
Investing in emerging markets can be riskier than investing in established foreign markets due to increased volatility and lower trading volume.
Please read both the contract and underlying prospectus for specific details regarding the product’s risk profile.
Smid Cap Core Series-3
Delaware VIP®Smid Cap Core Series
Performance summary (continued)
| | | | | | | | |
| For period beginning Dec. 31, 2008 through Dec. 31, 2018 | | Starting value | | | Ending value | |
— Delaware VIP Smid Cap Core Series (Standard Class) | | | $10,000 | | | | $42,121 | |
-- Russell 2500 Index | | | $10,000 | | | | $34,405 | |
The graph shows a $10,000 investment in the Delaware VIP Smid Cap Core Series Standard Class shares for the period from Dec. 31, 2008 through Dec. 31, 2018.
The graph also shows $10,000 invested in the Russell 2500 Index for the period from Dec. 31, 2008 through Dec. 31, 2018. The Russell 2500 Index measures the performance of the small- tomid-cap segment of the US equity universe. The Russell 2500 Index is a subset of the Russell 3000®Index, representing approximately 2,500 of the smallest securities based on a combination of their market cap and current index membership.
The Russell Midcap Index, mentioned on page 1, measures the performance of themid-cap segment of the US equity universe. The Russell Midcap Index is a subset of the Russell 1000 Index.
The Russell 1000 Index, mentioned on page 1, measures the performance of thelarge-cap segment of the US equity universe.
The Russell 2500 Growth Index, mentioned on page 1, measures the performance of the small- tomid-cap growth segment of the US equity universe. It includes those Russell 2500 companies with higherprice-to-book ratios and higher forecasted growth values.
The Russell 2500 Value Index, mentioned on page 1, measures the performance of the small- tomid-cap value segment of the US equity universe. It includes those Russell 2500 companies with lowerprice-to-book ratios and lower forecasted growth values.
The Conference Board Consumer Confidence Index, mentioned on page 1, is a barometer of the health of the US economy from the perspective of the consumer. The index is based on consumers’ perceptions of current business and employment conditions, as well as their expectations for six months hence regarding business conditions, employment, and income. The resulting relative value is then used as an “index value” and compared against each respective monthly value for 1985. In that year, the result of the index was arbitrarily set at 100, representing it as index benchmark.
The NFIB Small Business Optimism Index, mentioned on page 1, is a survey asking small business owners a battery of questions related to their expectations for the future and their plans to hire, build inventory, borrow, and expand.
The Purchasing Managers’ Index, mentioned on page 1, is an indicator of the economic health of the manufacturing sector. A PMI reading above 50% indicates that the manufacturing economy is generally expanding; below 50% indicates that it is generally declining.
Gross domestic product is a measure of all goods and services produced by a nation in a year.
Theprice-to-earnings ratio (P/E ratio) is a valuation ratio of a company’s current share price compared to its earnings per share. Generally, a high P/E ratio means that investors are anticipating higher growth in the future.
Frank Russell Company (“Russell”) is the source and owner of the trademarks, service marks, and copyrights related to the Russell Indexes. Russell®is a trademark of the Frank Russell Company.
Smid Cap Core Series-4
Delaware VIP® Smid Cap Core Series
Performance summary (continued)
Index performance returns do not reflect any management fees, transaction costs or expenses. Indices are unmanaged and one cannot invest directly in an index.
Performance of Service Class shares will vary due to different charges and expenses.
Past performance is not a guarantee of future results.
Smid Cap Core Series-5
Delaware VIP®Trust — Delaware VIP Smid Cap Core Series
Disclosure of Series expenses
For thesix-month period from July 1, 2018 to December 31, 2018 (Unaudited)
As a shareholder of the Series, you incur ongoing costs, which may include management fees; distribution and service(12b-1) fees; and other Series expenses. This example is intended to help you understand your ongoing costs (in dollars) of investing in the Series and to compare these costs with the ongoing costs of investing in other mutual funds.
The example is based on an investment of $1,000 invested at the beginning of the period and held for the entiresix-month period from July 1, 2018 to Dec. 31, 2018.
Actual expenses
The first section of the table shown, “Actual Series return,” provides information about actual account values and actual expenses. You may use the information in this section of the table, together with the amount you invested, to estimate the expenses that you paid over the period. Simply divide your account value by $1,000 (for example, an $8,600 account value divided by $1,000 = 8.6), then multiply the result by the number in the first section under the heading entitled “Expenses Paid During Period” to estimate the expenses you paid on your account during the period.
Hypothetical example for comparison purposes
The second section of the table shown, “Hypothetical 5% Return,” provides information about hypothetical account values and hypothetical expenses based on the Series’ actual expense ratio and an assumed rate of return of 5% per year before expenses, which is not the Series’ actual return. The hypothetical account values and expenses may not be used to estimate the actual ending account balance or expenses you paid for the period. You may use this information to compare the ongoing costs of investing in the Series and other funds. To do so, compare the 5% hypothetical example with the 5% hypothetical examples that appear in the shareholder reports of other funds.
Please note that the expenses shown in the table are meant to highlight your ongoing costs only. As a shareholder of the Series, you do not incur any transaction costs, such as sales charges (loads), redemption fees or exchange fees, but shareholders of other funds may incur such costs. Also, the fees related to the variable annuity investment or the deferred sales charge that could apply have not been included. Therefore, the second section of the table is useful in comparing ongoing costs only, and will not help you determine the relative total costs of owning different funds. The Series’ expenses shown in the table assume reinvestment of all dividends and distributions.
Expense analysis of an investment of $1,000
| | | | | | | | | | | | | | |
| | | Beginning
Account
Value
7/1/18 | | | Ending
Account
Value
12/31/18 | | | Annualized
Expense
Ratio | | | Expenses
Paid During
Period
7/1/18 to
12/31/18* |
Actual Series return† |
Standard Class | | | $1,000.00 | | | $ | 842.60 | | | | 0.81 | % | | $3.76 |
Service Class | | | 1,000.00 | | | | 841.10 | | | | 1.11 | % | | 5.15 |
Hypothetical 5% return(5% return before expenses) |
Standard Class | | | $1,000.00 | | | $ | 1,021.12 | | | | 0.81 | % | | $4.13 |
Service Class | | | 1,000.00 | | | | 1,019.61 | | | | 1.11 | % | | 5.65 |
*“Expenses Paid During Period” are equal to the Series’ annualized expense ratio, multiplied by the average account value over the period, multiplied by 184/365 (to reflect theone-half year period).
†Because actual returns reflect only the most recentsix-month period, the returns shown may differ significantly from fiscal year returns.
Smid Cap Core Series-6
Delaware VIP®Trust — Delaware VIP Smid Cap Core Series
Security type / sector allocation and top 10 equity holdings
As of December 31, 2018 (Unaudited)
Sector designations may be different than the sector designations presented in other Series materials. The sector designations may represent the investment manager’s internal sector classifications.
| | |
| Security type / sector | | Percentage of net assets |
Common Stock | | 97.64% |
Basic Materials | | 8.87% |
Business Services | | 4.32% |
Capital Goods | | 11.18% |
Communications Services | | 1.00% |
Consumer Discretionary | | 3.70% |
Consumer Services | | 1.67% |
Consumer Staples | | 1.67% |
Credit Cyclicals | | 1.77% |
Energy | | 3.31% |
Financial Services | | 16.98% |
Healthcare | | 13.24% |
Media | | 1.17% |
Real Estate Investment Trusts | | 7.78% |
Technology | | 15.04% |
Transportation | | 1.64% |
Utilities | | 4.30% |
Short-Term Investments | | 2.18% |
Total Value of Securities | | 99.82% |
Receivables and Other Assets Net of Liabilities | | 0.18% |
Total Net Assets | | 100.00% |
| | |
| Holdings are for informational purposes only and are subject to change at any time. They are not a recommendation to buy, sell, or hold any security. |
| |
| Top 10 equity holdings | | Percentage
of net assets |
Spire | | 1.64% |
NorthWestern | | 1.52% |
Diamondback Energy | | 1.44% |
Steven Madden | | 1.30% |
Exact Sciences | | 1.28% |
Reinsurance Group of America | | 1.25% |
Encompass Health | | 1.25% |
Reliance Steel & Aluminum | | 1.23% |
EPR Properties | | 1.21% |
WellCare Health Plans | | 1.20% |
Smid Cap Core Series-7
Delaware VIP®Trust — Delaware VIP Smid Cap Core Series
Schedule of investments
December 31, 2018
| | | | | | | | |
| | | Number of | | | Value | |
| | | shares | | | (US $) | |
| |
Common Stock – 97.64% | | | | | |
Basic Materials – 8.87% | |
Balchem | | | 71,782 | | | $ | 5,624,120 | |
Continental Building Products † | | | 234,887 | | | | 5,977,874 | |
Eastman Chemical | | | 72,261 | | | | 5,283,002 | |
Huntsman | | | 281,420 | | | | 5,428,592 | |
Kaiser Aluminum | | | 49,495 | | | | 4,419,409 | |
Minerals Technologies | | | 91,347 | | | | 4,689,755 | |
Neenah | | | 88,278 | | | | 5,201,340 | |
Reliance Steel & Aluminum | | | 93,143 | | | | 6,628,987 | |
Worthington Industries | | | 135,800 | | | | 4,731,272 | |
| | | | | | | | |
| | | | | | | 47,984,351 | |
| | | | | | | | |
|
Business Services – 4.32% | |
ABM Industries | | | 149,675 | | | | 4,806,064 | |
Aramark | | | 204,899 | | | | 5,935,924 | |
ASGN † | | | 59,510 | | | | 3,243,295 | |
Gartner † | | | 23,773 | | | | 3,039,140 | |
US Ecology | | | 73,175 | | | | 4,608,561 | |
WageWorks † | | | 63,365 | | | | 1,720,993 | |
| | | | | | | | |
| | | | | | | 23,353,977 | |
| | | | | | | | |
|
Capital Goods – 11.18% | |
Barnes Group | | | 84,694 | | | | 4,541,292 | |
Belden | | | 79,175 | | | | 3,307,140 | |
BWX Technologies | | | 64,825 | | | | 2,478,260 | |
Columbus McKinnon | | | 34,675 | | | | 1,045,105 | |
ESCO Technologies | | | 64,328 | | | | 4,242,432 | |
Federal Signal | | | 64,600 | | | | 1,285,540 | |
Gates Industrial † | | | 134,425 | | | | 1,779,787 | |
Graco | | | 112,784 | | | | 4,720,010 | |
Granite Construction | | | 95,068 | | | | 3,829,339 | |
Jacobs Engineering Group | | | 49,625 | | | | 2,901,077 | |
Kadant | | | 72,700 | | | | 5,922,142 | |
Lincoln Electric Holdings | | | 65,485 | | | | 5,163,492 | |
MasTec † | | | 51,675 | | | | 2,095,938 | |
Oshkosh | | | 60,400 | | | | 3,703,124 | |
Quanta Services | | | 92,625 | | | | 2,788,013 | |
Spirit AeroSystems Holdings Class A | | | 43,500 | | | | 3,135,915 | |
Tetra Tech | | | 21,625 | | | | 1,119,526 | |
United Rentals † | | | 34,250 | | | | 3,511,653 | |
Woodward | | | 39,100 | | | | 2,904,739 | |
| | | | | | | | |
| | | | | | | 60,474,524 | |
| | | | | | | | |
|
Communications Services – 1.00% | |
InterXion Holding † | | | 100,138 | | | | 5,423,474 | |
| | | | | | | | |
| | | | | | | 5,423,474 | |
| | | | | | | | |
Consumer Discretionary – 3.70% | |
American Eagle Outfitters | | | 91,475 | | | | 1,768,212 | |
Five Below † | | | 51,626 | | | | 5,282,372 | |
Malibu Boats Class A † | | | 117,441 | | | | 4,086,947 | |
Steven Madden | | | 231,879 | | | | 7,016,659 | |
Tractor Supply | | | 22,167 | | | | 1,849,614 | |
| | | | | | | | |
| | | | | | | 20,003,804 | |
| | | | | | | | |
| | | | | | | | |
| | | Number of | | | Value | |
| | | shares | | | (US $) | |
|
Common Stock (continued) | |
Consumer Services – 1.67% | |
Cheesecake Factory | | | 70,803 | | | $ | 3,080,639 | |
Chuy’s Holdings † | | | 81,134 | | | | 1,439,317 | |
Hawaiian Holdings | | | 42,254 | | | | 1,115,928 | |
Jack in the Box | | | 43,500 | | | | 3,376,905 | |
| | | | | | | | |
| | | | | | | 9,012,789 | |
| | | | | | | | |
|
Consumer Staples – 1.67% | |
Casey’s General Stores | | | 40,935 | | | | 5,245,411 | |
J&J Snack Foods | | | 26,078 | | | | 3,770,618 | |
| | | | | | | | |
| | | | | | | 9,016,029 | |
| | | | | | | | |
Credit Cyclicals – 1.77% | | | | | |
BorgWarner | | | 111,950 | | | | 3,889,143 | |
Tenneco Class A | | | 107,664 | | | | 2,948,917 | |
Toll Brothers | | | 83,900 | | | | 2,762,827 | |
| | | | | | | | |
| | | | | | | 9,600,887 | |
| | | | | | | | |
|
Energy – 3.31% | |
Carrizo Oil & Gas † | | | 182,567 | | | | 2,061,181 | |
Diamondback Energy | | | 83,767 | | | | 7,765,201 | |
KLX Energy Services Holdings † | | | 24,987 | | | | 585,945 | |
Parsley Energy Class A † | | | 215,727 | | | | 3,447,317 | |
Patterson-UTI Energy | | | 173,203 | | | | 1,792,651 | |
SRC Energy † | | | 40,928 | | | | 192,362 | |
US Silica Holdings | | | 202,989 | | | | 2,066,428 | |
| | | | | | | | |
| | | | | | | 17,911,085 | |
| | | | | | | | |
|
Financial Services – 16.98% | |
CenterState Bank | | | 164,050 | | | | 3,451,612 | |
East West Bancorp | | | 117,091 | | | | 5,096,971 | |
Essent Group † | | | 153,833 | | | | 5,258,012 | |
Evercore Class A | | | 29,300 | | | | 2,096,708 | |
First Financial Bancorp | | | 142,015 | | | | 3,368,596 | |
Great Western Bancorp | | | 188,337 | | | | 5,885,531 | |
Independent Bank Group | | | 78,025 | | | | 3,571,204 | |
Lazard Class A | | | 151,865 | | | | 5,605,337 | |
MGIC Investment † | | | 556,815 | | | | 5,824,285 | |
Primerica | | | 65,539 | | | | 6,403,816 | |
Prosperity Bancshares | | | 61,142 | | | | 3,809,147 | |
Reinsurance Group of America | | | 48,260 | | | | 6,767,500 | |
Selective Insurance Group | | | 80,154 | | | | 4,884,585 | |
Sterling Bancorp | | | 272,003 | | | | 4,490,770 | |
Stifel Financial | | | 129,454 | | | | 5,361,985 | |
Umpqua Holdings | | | 235,905 | | | | 3,750,889 | |
Valley National Bancorp | | | 405,125 | | | | 3,597,510 | |
Webster Financial | | | 84,364 | | | | 4,158,302 | |
Western Alliance Bancorp † | | | 120,572 | | | | 4,761,388 | |
WSFS Financial | | | 98,118 | | | | 3,719,653 | |
| | | | | | | | |
| | | | | | | 91,863,801 | |
| | | | | | | | |
|
Healthcare – 13.24% | |
Alkermes † | | | 104,777 | | | | 3,091,969 | |
Bio-Techne | | | 38,525 | | | | 5,575,338 | |
Catalent † | | | 163,495 | | | | 5,097,774 | |
DexCom † | | | 52,784 | | | | 6,323,523 | |
Smid Cap Core Series-8
Delaware VIP®Smid Cap Core Series
Schedule of investments (continued)
| | | | | | | | |
| | | Number of | | | Value | |
| | | shares | | | (US $) | |
|
Common Stock (continued) | |
Healthcare (continued) | | | | | |
Encompass Health | | | 109,514 | | | $ | 6,757,014 | |
Exact Sciences † | | | 109,993 | | | | 6,940,558 | |
ICON (Ireland) † | | | 44,901 | | | | 5,801,658 | |
Ligand Pharmaceuticals Class B † | | | 30,754 | | | | 4,173,318 | |
Medicines † | | | 151,777 | | | | 2,905,012 | |
Neurocrine Biosciences † | | | 84,545 | | | | 6,037,358 | |
Supernus Pharmaceuticals † | | | 58,025 | | | | 1,927,591 | |
TESARO † | | | 40,300 | | | | 2,992,275 | |
Ultragenyx Pharmaceutical † | | | 25,150 | | | | 1,093,522 | |
WellCare Health Plans † | | | 27,537 | | | | 6,501,210 | |
West Pharmaceutical Services | | | 65,476 | | | | 6,418,612 | |
| | | | | | | | |
| | | | | | | 71,636,732 | |
| | | | | | | | |
| | |
Media – 1.17% | | | | | | | | |
Cinemark Holdings | | | 82,324 | | | | 2,947,199 | |
Interpublic Group of Companies | | | 163,903 | | | | 3,381,319 | |
| | | | | | | | |
| | | | | | | 6,328,518 | |
| | | | | | | | |
|
Real Estate Investment Trusts – 7.78% | |
Apartment Investment & Management Class A | | | 136,921 | | | | 6,008,093 | |
Brixmor Property Group | | | 328,577 | | | | 4,826,796 | |
EPR Properties | | | 102,476 | | | | 6,561,538 | |
Equity Commonwealth | | | 106,950 | | | | 3,209,569 | |
First Industrial Realty Trust | | | 144,460 | | | | 4,169,116 | |
Kite Realty Group Trust | | | 344,960 | | | | 4,860,486 | |
Mack-Cali Realty | | | 173,075 | | | | 3,390,539 | |
Pebblebrook Hotel Trust | | | 144,222 | | | | 4,082,925 | |
RPT Realty | | | 414,618 | | | | 4,954,685 | |
| | | | | | | | |
| | | | | | | 42,063,747 | |
| | | | | | | | |
| |
Technology – 15.04% | | | | | |
Arista Networks † | | | 6,094 | | | | 1,284,006 | |
Blackbaud | | | 30,080 | | | | 1,892,032 | |
Brooks Automation | | | 63,975 | | | | 1,674,865 | |
ExlService Holdings † | | | 76,816 | | | | 4,042,058 | |
GrubHub † | | | 64,681 | | | | 4,968,148 | |
Guidewire Software † | | | 65,729 | | | | 5,273,438 | |
II-VI † | | | 95,768 | | | | 3,108,629 | |
j2 Global | | | 65,941 | | | | 4,574,987 | |
KeyW Holding † | | | 123,208 | | | | 824,262 | |
LendingTree † | | | 17,782 | | | | 3,904,394 | |
MACOM Technology Solutions Holdings † | | | 71,816 | | | | 1,042,050 | |
MaxLinear † | | | 250,286 | | | | 4,405,034 | |
NETGEAR † | | | 67,717 | | | | 3,523,316 | |
Paycom Software † | | | 36,577 | | | | 4,478,854 | |
Proofpoint † | | | 65,204 | | | | 5,464,747 | |
PTC † | | | 64,074 | | | | 5,311,735 | |
Semtech † | | | 101,311 | | | | 4,647,136 | |
SS&C Technologies Holdings | | | 109,276 | | | | 4,929,440 | |
SYNNEX | | | 13,379 | | | | 1,081,558 | |
Tyler Technologies † | | | 32,158 | | | | 5,975,600 | |
WNS Holdings ADR † | | | 145,051 | | | | 5,984,804 | |
| | | | | | | | |
| | | Number of | | | Value | |
| | | shares | | | (US $) | |
|
Common Stock (continued) | |
Technology (continued) | | | | | |
Yelp † | | | 84,281 | | | $ | 2,948,992 | |
| | | | | | | | |
| | | | | | | 81,340,085 | |
| | | | | | | | |
| | |
Transportation – 1.64% | | | | | | | | |
Genesee & Wyoming Class A † | | | 66,762 | | | | 4,941,723 | |
Knight-Swift Transportation Holdings | | | 158,050 | | | | 3,962,313 | |
| | | | | | | | |
| | | | | | | 8,904,036 | |
| | | | | | | | |
| | |
Utilities – 4.30% | | | | | | | | |
NorthWestern | | | 138,591 | | | | 8,237,849 | |
South Jersey Industries | | | 221,589 | | | | 6,160,174 | |
Spire | | | 119,551 | | | | 8,856,338 | |
| | | | | | | | |
| | | | | | | 23,254,361 | |
| | | | | | | | |
| |
Total Common Stock
(cost $553,935,893) | | | | 528,172,200 | |
| | | | | | | | |
| | | Principal
amount° | | | | |
|
Short-Term Investments – 2.18% | |
Discount Note – 0.33%≠ | |
Federal Home Loan Bank | | | | | | | | |
1.05% 1/2/19 | | | 1,782,068 | | | | 1,782,068 | |
| | | | | | | | |
| | | | | | | 1,782,068 | |
| | | | | | | | |
|
Repurchase Agreement – 1.70% | |
Bank of America Merrill Lynch 2.95%, dated 12/31/18, to be repurchased on 1/2/19, repurchase at $1,113,975 (cash collateralized of $1,113,792) | | | 1,113,792 | | | | 1,113,792 | |
Bank of Montreal 2.60%, dated 12/31/18, to be repurchased on 1/2/19, repurchase price $3,063,371 (collateralized by US government obligations0.00%-3.75% 1/24/19-2/15/47; market value $3,124,188) | | | 3,062,929 | | | | 3,062,929 | |
Smid Cap CoreSeries-9
Delaware VIP® Smid Cap Core Series
Schedule of investments (continued)
| | | | | | | | |
| | | Principal | | | Value | |
| | | amount° | | | (US $) | |
|
Short-Term Investments (continued) | |
Repurchase Agreement (continued) | |
BNP Paribas
2.93%, dated 12/31/18, to be repurchased on 1/2/19, repurchase price $5,009,238 (collateralized by US government obligations0.00%-8.00% 2/15/19 -8/15/46; market value $5,108,592) | | | 5,008,423 | | | $ | 5,008,423 | |
| | | | | | | | |
| | | | | | | 9,185,144 | |
| | | | | | | | |
| | | | | | | | |
| | | Principal | | | Value | |
| | | amount° | | | (US $) | |
|
Short-Term Investments (continued) | |
US Treasury Obligation – 0.15%≠ | |
US Treasury Bill | |
1.493% 1/3/19 | | | 815,463 | | | $ | 815,412 | |
| | | | | | | | |
| | | | | | | 815,412 | |
| | | | | | | | |
Total Short-Term Investments
(cost $11,782,470) | | | | 11,782,624 | |
| | | | | | | | |
| | | | |
Total Value of Securities – 99.82%
(cost $565,718,363) | | $ | 539,954,824 | |
| | | | |
≠ The rate shown is the effective yield at the time of purchase.
° Principal amount shown is stated in USD unless noted that the security is denominated in another currency.
†Non-income producing security.
Summary of Abbreviations:
ADR – American Depositary Receipt
USD – US Dollar
See accompanying notes, which are an integral part of the financial statements.
Smid Cap Core Series-10
| | | | |
| Delaware VIP®Trust — Delaware VIP Smid Cap Core Series | |
| Statement of assets and liabilities | | | December 31, 2018 | |
| | | | |
Assets: | | | | |
Investments, at value1 | | $ | 539,954,824 | |
Cash | | | 224,926 | |
Receivable for series shares sold | | | 603,201 | |
Dividends and interest receivable | | | 588,033 | |
Foreign tax reclaims receivable | | | 277,181 | |
| | | | |
Total assets | | | 541,648,165 | |
| | | | |
Liabilities: | | | | |
Investment management fees payable to affiliates | | | 353,042 | |
Payable for series shares redeemed | | | 166,453 | |
Payable for securities purchased | | | 54,739 | |
Distribution fees payable to affiliates | | | 52,274 | |
Reports and statements to shareholders expenses payable tonon-affiliates | | | 48,038 | |
Other accrued expenses | | | 28,798 | |
Registration fees payable | | | 14,837 | |
Audit and tax fees payable | | | 4,525 | |
Dividend disbursing and transfer agent fees and expenses payable to affiliates | | | 3,555 | |
Accounting and administration expenses payable to affiliates | | | 2,177 | |
Trustees’ fees and expenses payable to affiliates | | | 1,522 | |
Legal fees payable to affiliates | | | 1,056 | |
Reports and statements to shareholders expenses payable to affiliates | | | 400 | |
| | | | |
Total liabilities | | | 731,416 | |
| | | | |
Total Net Assets | | $ | 540,916,749 | |
| | | | |
| |
Net Assets Consist of: | | | | |
Paid-in capital | | $ | 531,152,272 | |
Total distributable earnings (loss) | | | 9,764,477 | |
| | | | |
Total Net Assets | | $ | 540,916,749 | |
| | | | |
| |
Net Asset Value | | | | |
Standard Class: | | | | |
Net assets | | $ | 343,360,391 | |
Shares of beneficial interest outstanding, unlimited authorization, no par | | | 18,146,050 | |
Net asset value per share | | $ | 18.92 | |
| |
Service Class: | | | | |
Net assets | | $ | 197,556,358 | |
Shares of beneficial interest outstanding, unlimited authorization, no par | | | 11,273,733 | |
Net asset value per share | | $ | 17.52 | |
| | | | |
1Investments, at cost | | $ | 565,718,363 | |
See accompanying notes, which are an integral part of the financial statements.
Smid Cap Core Series-11
Delaware VIP®Trust —
Delaware VIP Smid Cap Core Series
Statement of operations
Year ended December 31, 2018
| | | | |
Investment Income: | | | | |
Dividends | | $ | 8,319,533 | |
Interest | | | 251,993 | |
| | | | |
| | | 8,571,526 | |
| | | | |
Expenses: | | | | |
Management fees | | | 4,793,986 | |
Distribution expenses — Service Class | | | 715,658 | |
Accounting and administration expenses | | | 149,593 | |
Reports and statements to shareholders expenses | | | 103,342 | |
Dividend disbursing and transfer agent fees and expenses | | | 54,798 | |
Legal fees | | | 38,339 | |
Audit and tax fees | | | 33,986 | |
Trustees’ fees and expenses | | | 31,032 | |
Custodian fees | | | 17,226 | |
Registration fees | | | 15,064 | |
Other | | | 17,899 | |
| | | | |
| | | 5,970,923 | |
Less waived distribution expenses — Service Class | | | (39,198 | ) |
Less expenses paid indirectly | | | (70 | ) |
| | | | |
Total operating expenses | | | 5,931,655 | |
| | | | |
Net Investment Income | | | 2,639,871 | |
| | | | |
| |
Net Realized and Unrealized Gain (Loss): | | | | |
Net realized gain (loss) on: | | | | |
Investments | | | 33,702,128 | |
Foreign currencies | | | (1,069 | ) |
| | | | |
Net realized gain | | | 33,701,059 | |
| | | | |
Net change in unrealized appreciation (depreciation) of: | | | | |
Investments | | | (109,743,479 | ) |
Foreign currencies | | | (3,490 | ) |
| | | | |
Net change in unrealized appreciation (depreciation) | | | (109,746,969 | ) |
| | | | |
Net Realized and Unrealized Loss | | | (76,045,910 | ) |
| | | | |
Net Decrease in Net Assets Resulting from Operations | | $ | (73,406,039 | ) |
| | | | |
Delaware VIP Trust —
Delaware VIP Smid Cap Core Series
Statements of changes in net assets
| | | | | | | | |
| | | Year ended | |
| | | 12/31/18 | | | 12/31/17 | |
Increase (Decrease) in Net Assets from Operations: | | | | | | | | |
Net investment income | | $ | 2,639,871 | | | $ | 822,867 | |
Net realized gain | | | 33,701,059 | | | | 202,041,167 | |
Net change in unrealized appreciation (depreciation) | | | (109,746,969 | ) | | | (92,287,653 | ) |
| | | | | | | | |
Net increase (decrease) in net assets | | | | | | | | |
resulting from operations | | | (73,406,039 | ) | | | 110,576,381 | |
| | | | | | | | |
Dividends and Distributions to Shareholders from: | | | | | | | | |
Distributable earnings*: | | | | | | | | |
Standard Class | | | (126,240,340 | ) | | | (28,223,606 | ) |
Service Class | | | (76,399,191 | ) | | | (16,817,145 | ) |
| | | | | | | | |
| | | (202,639,531 | ) | | | (45,040,751 | ) |
| | | | | | | | |
Capital Share Transactions: | | | | | | | | |
Proceeds from shares sold: | | | | | | | | |
Standard Class | | | 12,579,893 | | | | 11,760,208 | |
Service Class | | | 11,843,249 | | | | 10,399,175 | |
| | |
Net asset value of shares based upon reinvestment of dividends and distributions: | | | | | | | | |
Standard Class | | | 126,240,340 | | | | 28,223,606 | |
Service Class | | | 76,399,191 | | | | 16,817,145 | |
| | | | | | | | |
| | | 227,062,673 | | | | 67,200,134 | |
| | | | | | | | |
Cost of shares redeemed: | | | | | | | | |
Standard Class | | | (33,970,144 | ) | | | (65,731,640 | ) |
Service Class | | | (27,135,691 | ) | | | (42,232,683 | ) |
| | | | | | | | |
| | | (61,105,835 | ) | | | (107,964,323 | ) |
| | | | | | | | |
Increase (decrease) in net assets derived | | | | | | | | |
from capital share transactions | | | 165,956,838 | | | | (40,764,189 | ) |
| | | | | | | | |
Net Increase (Decrease) in Net Assets | | | (110,088,732 | ) | | | 24,771,441 | |
| | |
Net Assets: | | | | | | | | |
Beginning of year | | | 651,005,481 | | | | 626,234,040 | |
| | | | | | | | |
End of year1 | | $ | 540,916,749 | | | $ | 651,005,481 | |
| | | | | | | | |
| 1 | Net Assets – End of year includes undistributed net investment income of $613,534 in 2017. The Securities and Exchange Commission eliminated the requirement to disclose undistributed (distributions in excess of) net investment income in 2018. |
| * | For the year ended Dec. 31, 2018, the Series has adopted amendments to RegulationS-X (see Note 12 in “Notes to financial statements”). For the year ended Dec. 31, 2017, the dividends and distributions to shareholders were as follows: |
| | | | | | | | |
| | | Standard Class | | | Service Class | |
Dividends from net investment income | | | $ (1,250,888) | | | | $ (211,590) | |
Distributions from net realized gain | | | (26,972,718) | | | | (16,605,555) | |
See accompanying notes, which are an integral part of the financial statements.
Smid Cap Core Series-12
Delaware VIP®Trust — Delaware VIP Smid Cap Core Series
Financial highlights
Selected data for each share of the Series outstanding throughout each period were as follows:
| | | | | | | | | | | | | | | | | | | | |
| | | Delaware VIP Smid Cap Core Series Standard Class
Year ended | |
| | | 12/31/18 | | | 12/31/171 | | | 12/31/16 | | | 12/31/15 | | | 12/31/14 | |
Net asset value, beginning of period | | $ | 30.98 | | | $ | 28.08 | | | $ | 29.79 | | | $ | 30.20 | | | $ | 32.39 | |
| | | | |
Income (loss) from investment operations: | | | | | | | | | | | | | | | | | |
Net investment income2 | | | 0.12 | | | | 0.06 | | | | 0.09 | | | | 0.07 | | | | 0.12 | |
Net realized and unrealized gain (loss) | | | (2.59 | ) | | | 4.89 | | | | 2.15 | | | | 2.21 | | | | 0.62 | |
| | | | | | | | | | | | | | | | | | | | |
Total from investment operations | | | (2.47 | ) | | | 4.95 | | | | 2.24 | | | | 2.28 | | | | 0.74 | |
| | | | | | | | | | | | | | | | | | | | |
| | | | | |
Less dividends and distributions from: | | | | | | | | | | | | | | | | | | | | |
Net investment income | | | (0.05 | ) | | | (0.09 | ) | | | (0.07 | ) | | | (0.12 | ) | | | (0.02 | ) |
Net realized gain | | | (9.54 | ) | | | (1.96 | ) | | | (3.88 | ) | | | (2.57 | ) | | | (2.91 | ) |
| | | | | | | | | | | | | | | | | | | | |
Total dividends and distributions | | | (9.59 | ) | | | (2.05 | ) | | | (3.95 | ) | | | (2.69 | ) | | | (2.93 | ) |
| | | | | | | | | | | | | | | | | | | | |
| | | | | |
Net asset value, end of period | | $ | 18.92 | | | $ | 30.98 | | | $ | 28.08 | | | $ | 29.79 | | | $ | 30.20 | |
| | | | | | | | | | | | | | | | | | | | |
| | | | | |
Total return3 | | | (12.12% | ) | | | 18.65% | | | | 8.29% | | | | 7.54% | | | | 3.15% | |
| | | |
Ratios and supplemental data: | | | | | | | | | | | | | |
Net assets, end of period (000 omitted) | | $ | 343,361 | | | $ | 411,087 | | | $ | 394,898 | | | $ | 394,406 | | | $ | 386,290 | |
Ratio of expenses to average net assets | | | 0.81% | | | | 0.81% | | | | 0.82% | | | | 0.83% | | | | 0.83% | |
Ratio of net investment income to average net assets | | | 0.51% | | | | 0.22% | | | | 0.33% | | | | 0.24% | | | | 0.40% | |
Portfolio turnover | | | 18% | | | | 112% | | | | 15% | | | | 23% | | | | 18% | |
| 1 | Effective April 28, 2017, Jackson Square Partners, LLC no longer serves assub-advisor to the Series. The Series’ portfolio turnover rate increased substantially during the year ended Dec. 31, 2017. |
| 2 | The average shares outstanding method has been applied for per share information. |
| 3 | Total return is based on the change in net asset value of a share during the period and assumes reinvestment of dividends and distributions at net asset value. Total return does not include fees, charges, or expenses imposed by the variable annuity and life insurance contracts for which Delaware VIP Trust serves as an underlying investment vehicle. |
See accompanying notes, which are an integral part of the financial statements.
Smid Cap Core Series-13
Delaware VIP®Smid Cap Core Series
Financial highlights (continued)
Selected data for each share of the Series outstanding throughout each period were as follows:
| | | | | | | | | | | | | | | | | | | | |
| | | Delaware VIP Smid Cap Core Series Service Class
Year ended | |
| | | 12/31/18 | | | 12/31/171 | | | 12/31/16 | | | 12/31/15 | | | 12/31/14 | |
Net asset value, beginning of period | | $ | 29.41 | | | $ | 26.75 | | | $ | 28.56 | | | $ | 29.06 | | | $ | 31.33 | |
| | | | | |
Income (loss) from investment operations: | | | | | | | | | | | | | | | | | | | | |
Net investment income (loss)2 | | | 0.05 | | | | (0.01 | ) | | | 0.02 | | | | — | 3 | | | 0.04 | |
Net realized and unrealized gain (loss) | | | (2.40 | ) | | | 4.66 | | | | 2.05 | | | | 2.12 | | | | 0.60 | |
| | | | | | | | | | | | | | | | | | | | |
Total from investment operations | | | (2.35 | ) | | | 4.65 | | | | 2.07 | | | | 2.12 | | | | 0.64 | |
| | | | | | | | | | | | | | | | | | | | |
| | | | | |
Less dividends and distributions from: | | | | | | | | | | | | | | | | | | | | |
Net investment income | | | — | | | | (0.03 | ) | | | — | | | | (0.05 | ) | | | — | |
Net realized gain | | | (9.54 | ) | | | (1.96 | ) | | | (3.88 | ) | | | (2.57 | ) | | | (2.91 | ) |
| | | | | | | | | | | | | | | | | | | | |
Total dividends and distributions | | | (9.54 | ) | | | (1.99 | ) | | | (3.88 | ) | | | (2.62 | ) | | | (2.91 | ) |
| | | | | | | | | | | | | | | | | | | | |
| | | | | |
Net asset value, end of period | | $ | 17.52 | | | $ | 29.41 | | | $ | 26.75 | | | $ | 28.56 | | | $ | 29.06 | |
| | | | | | | | | | | | | | | | | | | | |
| | | | | |
Total return4 | | | (12.40% | ) | | | 18.38% | | | | 8.02% | | | | 7.31% | | | | 2.87% | |
| | | | | |
Ratios and supplemental data: | | | | | | | | | | | | | | | | | | | | |
Net assets, end of period (000 omitted) | | $ | 197,556 | | | $ | 239,918 | | | $ | 231,336 | | | $ | 230,085 | | | $ | 203,931 | |
Ratio of expenses to average net assets | | | 1.09% | | | | 1.06% | | | | 1.07% | | | | 1.08% | | | | 1.08% | |
Ratio of expenses to average net assets prior to fees waived | | | 1.11% | | | | 1.11% | | | | 1.12% | | | | 1.13% | | | | 1.13% | |
Ratio of net investment income (loss) to average net assets | | | 0.23% | | | | (0.03% | ) | | | 0.08% | | | | (0.01% | ) | | | 0.15% | |
Ratio of net investment income (loss) to average net assets prior to fees waived | | | 0.21% | | | | (0.08% | ) | | | 0.03% | | | | (0.06% | ) | | | 0.10% | |
Portfolio turnover | | | 18% | | | | 112% | | | | 15% | | | | 23% | | | | 18% | |
| 1 | Effective April 28, 2017, Jackson Square Partners, LLC no longer serves assub-advisor to the Series. The Series’ portfolio turnover rate increased substantially during the year ended Dec. 31, 2017. |
| 2 | The average shares outstanding method has been applied for per share information. |
| 3 | The amount is less than $0.005 per share. |
| 4 | Total return is based on the change in net asset value of a share during the period and assumes reinvestment of dividends and distributions at net asset value. Total return during all of the periods shown reflects a waiver by the distributor. Performance would have been lower had the waiver not been in effect. Total return does not include fees, charges, or expenses imposed by the variable annuity and life insurance contracts for which Delaware VIP Trust serves as an underlying investment vehicle. |
See accompanying notes, which are an integral part of the financial statements.
Smid Cap Core Series-14
Delaware VIP®Trust — Delaware VIP Smid Cap Core Series
Notes to financial statements
December 31, 2018
Delaware VIP Trust (Trust) is organized as a Delaware statutory trust and offers 10 series: Delaware VIP Diversified Income Series, Delaware VIP Emerging Markets Series, Delaware VIP High Yield Series, Delaware VIP International Value Equity Series, Delaware VIP Limited-Term Diversified Income Series, Delaware VIP REIT Series, Delaware VIP Small Cap Value Series, Delaware VIP Smid Cap Core Series, Delaware VIP U.S. Growth Series, and Delaware VIP Value Series. These financial statements and the related notes pertain to Delaware VIP Smid Cap Core Series (Series). The Trust is anopen-end investment company. The Series is considered diversified under the Investment Company Act of 1940, as amended, and offers Standard Class and Service Class shares. The Standard Class shares do not carry a distribution and service(12b-1) fee and the Service Class shares carry a12b-1 fee. The shares of the Series are sold only to separate accounts of life insurance companies.
The investment objective of the Series is to seek long-term capital appreciation.
1. Significant Accounting Policies
The Series is an investment company and follows accounting and reporting guidance under Financial Accounting Standards Board (FASB) Accounting Standards Codification Topic 946, Financial Services - Investment Companies. The following accounting policies are in accordance with US generally accepted accounting principles (US GAAP) and are consistently followed by the Series.
Security Valuation –Equity securities, except those traded on the Nasdaq Stock Market LLC (Nasdaq), are valued at the last quoted sales price as of the time of the regular close of the New York Stock Exchange on the valuation date. Equity securities traded on the Nasdaq are valued in accordance with the Nasdaq Official Closing Price, which may not be the last sales price. If, on a particular day, an equity security does not trade, the mean between the bid and ask prices will be used, which approximates fair value. Equity securities listed on a foreign exchange are normally valued at the last quoted sales price on the valuation date. US government and agency securities are valued at the mean between the bid and ask prices, which approximates fair value. Investments in repurchase agreements are generally valued at par, which approximates fair value, each business day. Generally, other securities and assets for which market quotations are not readily available are valued at fair value as determined in good faith under the direction of the Trust’s Board of Trustees (Board). In determining whether market quotations are readily available or fair valuation will be used, various factors will be taken into consideration, such as market closures or suspension of trading in a security. The Series may use fair value pricing more frequently for securities traded primarily innon-US markets because, among other things, most foreign markets close well before the Series values its securities, generally as of 4:00pm Eastern time. The earlier close of these foreign markets gives rise to the possibility that significant events, including broad market moves, government actions or pronouncements, aftermarket trading, or news events may have occurred in the interim. Whenever such a significant event occurs, the Series may value foreign securities using fair value prices based on third-party vendor modeling tools (international fair value pricing). Restricted securities are valued at fair value using methods approved by the Board.
Federal and Foreign Income Taxes– No provision for federal income taxes has been made as the Series intends to continue to qualify for federal income tax purposes as a regulated investment company under Subchapter M of the Internal Revenue Code of 1986, as amended, and make the requisite distributions to shareholders. The Series evaluates tax positions taken or expected to be taken in the course of preparing the Series’ tax returns to determine whether the tax positions are“more-likely-than-not” of being sustained by the applicable tax authority. Tax positions not deemed to meet the“more-likely-than-not” threshold are recorded as a tax benefit or expense in the current year. Management has analyzed the Series’ tax positions taken or expected to be taken on the Series’ federal income tax returns through the year ended Dec. 31, 2018 and for all open tax years (years ended Dec. 31, 2015–Dec. 31, 2017), and has concluded that no provision for federal income tax is required in the Series’ financial statements. In regard to foreign taxes only, the Series has open tax years in certain foreign countries in which it invests in that may date back to the inception of the Series. If applicable, the Series recognizes interest accrued on unrecognized tax benefits in interest expense and penalties in other expenses on the “Statement of operations.” During the year ended Dec. 31, 2018, the Series did not incur any interest or tax penalties.
Class Accounting– Investment income, common expenses, and realized and unrealized gain (loss) on investments are allocated to the various classes of the Series on the basis of daily net assets of each class. Distribution expenses relating to a specific class are charged directly to that class.
Repurchase Agreements –The Series may purchase certain US government securities subject to the counterparty’s agreement to repurchase them at an agreed upon date and price. The counterparty will be required on a daily basis to maintain the value of the collateral subject to the agreement at not less than the repurchase price (including accrued interest). The agreements are conditioned upon the collateral being deposited under the Federal Reserve book-entry system with the Series’ custodian or a third-partysub-custodian. In the event of default or bankruptcy by the other party to the agreement, retention of the collateral may be subject to legal proceedings. All open repurchase agreements as of the date of this report were entered into on Dec. 31, 2018, and matured on the next business day.
Foreign Currency Transactions – Transactions denominated in foreign currencies are recorded at the prevailing exchange rates on the valuation date in accordance with the Series’ prospectus. The value of all assets and liabilities denominated in foreign currencies is translated daily into US dollars at the exchange rate of such currencies against the US dollar. Transaction gains or losses resulting from changes in exchange rates during the reporting period or upon settlement of the foreign currency transaction are reported in operations for the current period. The Series generally does not bifurcate that portion of
Smid Cap CoreSeries-15
Delaware VIP® Smid Cap Core Series
Notes to financial statements
1. Significant Accounting Policies (continued)
realized gains and losses on investments which is due to changes in foreign exchange rates from that which is due to changes in market prices. These gains and losses are included on the “Statement of operations” under “Net realized and unrealized gain (loss) on investments.” The Series reports certain foreign currency related transactions as components of realized gains (losses) for financial reporting purposes, whereas such components are treated as ordinary income (loss) for federal income tax purposes.
Use of Estimates– The preparation of financial statements in conformity with US GAAP requires management to make estimates and assumptions that affect the fair value of investments, the reported amounts of assets and liabilities and disclosure of contingent assets and liabilities at the date of the financial statements, and the reported amounts of revenues and expenses during the reporting period. Actual results could differ from those estimates and the differences could be material.
Other – Expenses directly attributable to the Series are charged directly to the Series. Other expenses common to various funds within the Delaware Funds®by Macquarie (Delaware Funds) are generally allocated among such funds on the basis of average net assets. Management fees and certain other expenses are paid monthly. Security transactions are recorded on the date the securities are purchased or sold (trade date) for financial reporting purposes. Costs used in calculating realized gains and losses on the sale of investment securities are those of the specific securities sold. Dividend income is recorded on theex-dividend date and interest income is recorded on the accrual basis. Discounts and premiums on debt securities are accreted or amortized to interest income, respectively, over the lives of the respective securities using the effective interest method. Foreign dividends are also recorded on theex-dividend date or as soon after theex-dividend date that the Series is aware of such dividends, net of all tax withholdings, a portion of which may be reclaimable. Withholding taxes and reclaims on foreign dividends have been recorded in accordance with the Series’ understanding of the applicable country’s tax rules and rates. Distributions received from investments in real estate investment trusts (REITs) are recorded as dividend income onex-dividend date, subject to reclassification upon notice of the character of such distributions by the issuer. The Series declares and pays dividends from net investment income and distributions from net realized gain on investments, if any, following the close of the fiscal year. The Series may distribute more frequently, if necessary for tax purposes. Dividends and distributions, if any, are recorded on theex-dividend date.
Subject to seeking best execution, the Series may direct certain security trades to brokers who have agreed to rebate a portion of the related brokerage commission to the Series in cash. In general, best execution refers to many factors, including the price paid or received for a security, the commission charged, the promptness and reliability of execution, the confidentiality and placement accorded the order, and other factors affecting the overall benefit obtained by the Series on the transaction. There were no commission rebates for the year ended Dec. 31, 2018.
The Series receives earnings credits from its custodian when positive cash balances are maintained, which may be used to offset custody fees. The expenses paid under this arrangement are included on the “Statement of operations” under “Custodian fees” with the corresponding expenses offset included under “Less expenses paid indirectly.” For the year ended Dec. 31, 2018, the Series earned $67 under this arrangement.
The Series receives earnings credits from its transfer agent when positive cash balances are maintained, which may be used to offset transfer agent fees. If the amount earned is greater than $1, the expenses paid under this arrangement are included on the “Statement of operations” under “Dividend disbursing and transfer agent fees and expenses” with the corresponding expenses offset included under “Less expenses paid indirectly.” For the year ended Dec. 31, 2018, the Series earned $3 under this arrangement.
2. Investment Management, Administration Agreements, and Other Transactions with Affiliates
In accordance with the terms of its investment management agreement, the Series pays Delaware Management Company (DMC), a series of Macquarie Investment Management Business Trust and the investment manager, an annual fee which is calculated daily and paid monthly at the rate of 0.75% on the first $500 million of average daily net assets of the Series, 0.70% on the next $500 million, 0.65% on the next $1.5 billion, and 0.60% on average daily net assets in excess of $2.5 billion.
Delaware Investments Fund Services Company (DIFSC), an affiliate of DMC, provides fund accounting and financial administration oversight services to the Series. For these services, DIFSC’s fees are calculated daily and paid monthly based on the aggregate daily net assets of all funds within the Delaware Funds at the following annual rates: 0.00475% of the first $35 billion; 0.0040% of the next $10 billion; and 0.0025% of aggregate average daily net assets in excess of $45 billion (Total Fee). Each fund in the Delaware Funds pays a minimum of $4,000, which, in aggregate, is subtracted from the Total Fee. Each fund then pays its portion of the remainder of the Total Fee on a relative net asset value basis. For the year ended Dec. 31, 2018, the Series was charged $28,512 for these services. This amount is included on the “Statement of operations” under “Accounting and administration expenses.”
DIFSC is also the transfer agent and dividend disbursing agent of the Series. For these services, DIFSC’s fees are calculated daily and paid monthly at the annual rate of 0.0075% of the Series’ average daily net assets. This amount is included on the “Statement of operations” under “Dividend disbursing and transfer agent fees and expenses.” For the year ended Dec. 31, 2018, the Series was charged $48,686 for these services. Pursuant to asub-transfer agency agreement between DIFSC and BNY Mellon Investment Servicing (US) Inc. (BNYMIS), BNYMIS provides certainsub-transfer agency services to the
Smid Cap Core Series-16
Delaware VIP® Smid Cap Core Series
Notes to financial statements
2. Investment Management, Administration Agreements, and Other Transactions with Affiliates (continued)
Series.Sub-transfer agency fees are paid by the Series and are also included on the “Statement of operations” under “Dividend disbursing and transfer agent fees and expenses.”
Pursuant to a distribution agreement and distribution plan, the Series pays Delaware Distributors, L.P. (DDLP), the distributor and an affiliate of DMC, an annual12b-1 fee of 0.30% of the average daily net assets of the Service Class shares. Prior to May 1, 2018, DDLP had contracted to waive12b-1 fees in order to limit12b-1 fees of the Service Class shares to 0.25% of average daily net assets. The fees are calculated daily and paid monthly. Standard Class shares pay no12b-1 fees.
As provided in the investment management agreement, the Series bears a portion of the cost of certain resources shared with DMC, including the cost of internal personnel of DMC and/or its affiliates that provide legal, tax, and regulatory reporting services to the Series. For the year ended Dec. 31, 2018, the Series was charged $19,285 for internal legal, tax, and regulatory reporting services provided by DMC and/or its affiliates’ employees. This amount is included on the “Statement of operations” under “Legal fees.”
Trustees’ fees include expenses accrued by the Series for each Trustee’s retainer and meeting fees. Certain officers of DMC, DIFSC, and DDLP are officers and/or Trustees of the Trust. These officers and Trustees are paid no compensation by the Series.
3. Investments
For the year ended Dec. 31, 2018, the Series made purchases and sales of investment securities other than short-term investments as follows:
| | | | |
Purchases | | $ | 111,766,896 | |
Sales | | | 139,476,784 | |
The tax cost of investments includes adjustments to net unrealized appreciation (depreciation) which may not necessarily be the final tax cost basis adjustments, but approximate the tax basis unrealized gains and losses that may be realized and distributed to shareholders. At Dec. 31, 2018, the cost and unrealized appreciation (depreciation) of investments for federal income tax purposes for the Series were as follows:
| | | | | | |
| | | Aggregate
Unrealized | | Aggregate
Unrealized | | Net Unrealized |
| Cost of | | Appreciation | | Depreciation | | Depreciation |
Investments | | of Investments | | of Investments | | of Investments |
| $566,919,319 | | $55,158,576 | | $(82,123,071) | | $(26,964,495) |
US GAAP defines fair value as the price that the Series would receive to sell an asset or pay to transfer a liability in an orderly transaction between market participants at the measurement date under current market conditions. A three-level hierarchy for fair value measurements has been established based upon the transparency of inputs to the valuation of an asset or liability. Inputs may be observable or unobservable and refer broadly to the assumptions that market participants would use in pricing the asset or liability. Observable inputs reflect the assumptions market participants would use in pricing the asset or liability based on market data obtained from sources independent of the reporting entity. Unobservable inputs reflect the reporting entity’s own assumptions about the assumptions that market participants would use in pricing the asset or liability based on the best information available under the circumstances. The Series’ investment in its entirety is assigned a level based upon the observability of the inputs which are significant to the overall valuation. The three-level hierarchy of inputs is summarized below and on the next page.
| | | | |
| Level 1 | | – | | Inputs are quoted prices in active markets for identical investments. (Examples: equity securities,open-end investment companies, futures contracts, exchange-traded options contracts) |
| Level 2 | | – | | Other observable inputs, including, but not limited to: quoted prices for similar assets or liabilities in markets that are active, quoted prices for identical or similar assets or liabilities in markets that are not active, inputs other than quoted prices that are observable for the assets or liabilities (such as interest rates, yield curves, volatilities, prepayment speeds, loss severities, credit risks, and default rates) or other market-corroborated inputs. (Examples: debt securities, government securities, swap contracts, foreign currency exchange contracts, foreign securities utilizing international fair value pricing, broker-quoted securities, fair valued securities) |
| Level 3 | | – | | Significant unobservable inputs, including the Series’ own assumptions used to determine the fair value of investments. (Examples: broker-quoted securities, fair valued securities) |
Smid Cap Core Series-17
Delaware VIP®Smid Cap Core Series
Notes to financial statements
3. Investments (continued)
Level 3 investments are valued using significant unobservable inputs. The Series may also use an income-based valuation approach in which the anticipated future cash flows of the investment are discounted to calculate fair value. Discounts may also be applied due to the nature or duration of any restrictions on the disposition of the investments. Valuations may also be based upon current market prices of securities that are comparable in coupon, rating, maturity, and industry. The derived value of a Level 3 investment may not represent the value which is received upon disposition and this could impact the results of operations.
The following table summarizes the valuation of the Series’ investments by fair value hierarchy levels as of Dec. 31, 2018:
| | | | | | | | | | | | |
| | | Level 1 | | | Level 2 | | | Total | |
Securities | | | | | | | | | | | | |
Assets: | | | | | | | | | | | | |
Common Stock | | $ | 528,172,200 | | | $ | — | | | $ | 528,172,200 | |
Short-Term Investments | | | — | | | | 11,782,624 | | | | 11,782,624 | |
| | | | | | | | | | | | |
Total Value of Securities | | $ | 528,172,200 | | | $ | 11,782,624 | | | $ | 539,954,824 | |
| | | | | | | | | | | | |
During the year ended Dec. 31, 2018, there were no transfers between Level 1 investments, Level 2 investments, or Level 3 investments that had a significant impact to the Series. This does not include transfers between Level 1 investments and Level 2 investments due to the Series utilizing international fair value pricing during the year. In accordance with the fair valuation procedures described in Note 1, international fair value pricing of securities in the Series occurs when market volatility exceeds an established rolling threshold. If the threshold is exceeded on a given date, then prices of international securities (those that traded on exchanges that close at a different time than the time that the Series’ NAV is determined) are established using a separate pricing feed from a third-party vendor designed to establish a price for each such security as of the time that the Series’ NAV is determined. Further, international fair value pricing uses other observable market-based inputs in place of the closing exchange price due to the events occurring after the close of the exchange or market on which the investment is principally traded, causing a change in classification between levels. The Series’ policy is to recognize transfers between levels based on fair value at the beginning of the reporting period.
A reconciliation of Level 3 investments is presented when the Series has a significant amount of Level 3 investments at the beginning, interim, or end of the period in relation to the Series’ net assets. During the year ended Dec. 31, 2018, there were no Level 3 investments.
4. Dividend and Distribution Information
Income and long-term capital gain distributions are determined in accordance with federal income tax regulations, which may differ from US GAAP. Additionally, distributions from net gains on foreign currency transactions and net short-term gains on sales of investment securities are treated as ordinary income for federal income tax purposes. The tax character of dividends and distributions paid during the years ended Dec. 31, 2018 and 2017 was as follows:
| | | | | | | | |
| | | Year ended | |
| | | 12/31/18 | | | 12/31/17 | |
Ordinary income | | $ | 20,641,354 | | | $ | 1,462,478 | |
Long-term capital gains | | | 181,998,177 | | | | 43,578,273 | |
| | | | | | | | |
| | $ | 202,639,531 | | | $ | 45,040,751 | |
| | | | | | | | |
5. Components of Net Assets on a Tax Basis
|
As of Dec. 31, 2018, the components of net assets on a tax basis were as follows: |
| | | | |
Shares of beneficial interest | | $ | 531,152,272 | |
Undistributed ordinary income | | | 7,085,787 | |
Undistributed long-term capital gains | | | 29,643,185 | |
Net unrealized depreciation on investments and foreign currencies | | | (26,964,495 | ) |
| | | | |
Net assets | | $ | 540,916,749 | |
| | | | |
The differences between book basis and tax basis components of net assets are primarily attributable to tax deferral of losses on wash sales and limited partnerships.
Smid Cap Core Series-18
Delaware VIP®Smid Cap Core Series
Notes to financial statements
6. Capital Shares
Transactions in capital shares were as follows:
| | | | | | | | |
| | | Year ended | |
| | | 12/31/18 | | | 12/31/17 | |
Shares sold: | | | | | | | | |
Standard Class | | | 502,720 | | | | 409,851 | |
Service Class | | | 529,135 | | | | 382,148 | |
| | |
Shares issued upon reinvestment of dividends and distributions: | | | | | | | | |
Standard Class | | | 5,774,996 | | | | 1,036,495 | |
Service Class | | | 3,767,218 | | | | 649,561 | |
| | | | | | | | |
| | | 10,574,069 | | | 2,478,055 | |
| | | | | | | | |
Shares redeemed: | | | | | | | | |
Standard Class | | | (1,398,990 | ) | | | (2,241,995 | ) |
Service Class | | | (1,181,607 | ) | | | (1,521,019 | ) |
| | | | | | | | |
| | | (2,580,597 | ) | | | (3,763,014 | ) |
| | | | | | | | |
Net increase (decrease) | | | 7,993,472 | | | | (1,284,959 | ) |
| | | | | | | | |
7. Line of Credit
The Series, along with certain other funds in the Delaware Funds (Participants), was a participant in a revolving line of credit intended to be used for temporary or emergency purposes as an additional source of liquidity to fund redemptions of investor shares. The revolving line of credit available was reduced from $155,000,000 to $130,000,0000 on Sept. 6, 2018. Under the agreement, the Participants were charged an annual commitment fee of 0.15%, which was allocated across the Participants based on a weighted average of the respective net assets of each Participant. The Participants were permitted to borrow up to a maximum ofone-third of their net assets under the agreement. Each Participant was individually, and not jointly, liable for its particular advances, if any, under the line of credit. The line of credit available under the agreement expired on Nov. 5, 2018.
On Nov. 5, 2018, the Participants entered into an amendment to the agreement for a $190,000,000 revolving line of credit. The revolving line of credit available was increased to $220,000,000 on Nov. 29, 2018. The revolving line of credit is to be used as described above and operates in substantially the same manner as the original agreement. The line of credit available under the agreement expires on Nov. 4, 2019.
The Series had no amounts outstanding as of Dec. 31, 2018, or at any time during the year then ended.
8. Offsetting
Master Repurchase Agreements
Repurchase agreements are entered into by the Series under master repurchase agreements (each, an MRA). The MRA permits the Series, under certain circumstances including an event of default (such as bankruptcy or insolvency), to offset payables and/or receivables with collateral held by and/or posted to the counterparty. As a result, one single net payment is created. Bankruptcy or insolvency laws of a particular jurisdiction may impose restrictions on or prohibitions against such a right of offset in the event of the MRA counterparty’s bankruptcy or insolvency. Based on the terms of the MRA, the Series receives securities as collateral with a market value in excess of the repurchase price at maturity. Upon a bankruptcy or insolvency of the MRA counterparty, the Series would recognize a liability with respect to such excess collateral. The liability reflects the Series’ obligation under bankruptcy law to
Smid Cap CoreSeries-19
Delaware VIP®Smid Cap Core Series
Notes to financial statements
8. Offsetting (continued)
return the excess to the counterparty. As of Dec. 31, 2018, the following table is a summary of the Series’ repurchase agreements by counterparty which are subject to offset under an MRA:
| | | | | | | | | | | | |
Counterparty | | Repurchase
Agreements | | Fair Value of
Non-Cash
Collateral Received(a) | | Cash Collateral
Received | | | Net Collateral
Received | | Net Exposure(b) |
Bank of America Merrill Lynch | | $1,113,792 | | $ — | | | $(1,113,792) | | | $(1,113,792) | | $— |
Bank of Montreal | | 3,062,929 | | (3,062,929) | | | — | | | (3,062,929) | | — |
BNP Paribas | | 5,008,423 | | (5,008,423) | | | — | | | (5,008,423) | | — |
Total | | $9,185,144 | | $(8,071,352) | | | $(1,113,792) | | | $(9,185,144) | | $— |
(a)The value of the related collateral received exceeded the value of the repurchase agreements as of Dec. 31, 2018.
(b)Net exposure represents the receivable (payable) that would be due from (to) the counterparty in the event of default.
9. Securities Lending
The Series, along with other funds in the Delaware Funds, may lend its securities pursuant to a security lending agreement (Lending Agreement) with The Bank of New York Mellon (BNY Mellon). At the time a security is loaned, the borrower must post collateral equal to the required percentage of the market value of the loaned security, including any accrued interest. The required percentage is: (1) 102% with respect to US securities and foreign securities that are denominated and payable in US dollars; and (2) 105% with respect to foreign securities. With respect to each loan, if on any business day the aggregate market value of securities collateral plus cash collateral held is less than the aggregate market value of the securities that are the subject of such loan, the borrower will be notified to provide additional collateral by the end of the following business day, which, together with the collateral already held, will be not less than the applicable initial collateral requirements for such security loan. If the aggregate market value of securities collateral and cash collateral held with respect to a security loan exceeds the applicable initial collateral requirement, upon request of the borrower, BNY Mellon must return enough collateral to the borrower by the end of the following business day to reduce the value of the remaining collateral to the applicable initial collateral requirement for such security loan. As a result of the foregoing, the value of the collateral held with respect to a loaned security on any particular day may be more or less than the value of the security on loan. The collateral percentage with respect to the market value of the loaned security is determined by the security lending agent.
Cash collateral received by each series of the Trust is generally invested in a series of individual separate accounts, each corresponding to a series. The investment guidelines permit each separate account to hold certain securities that would be considered eligible securities for a money market fund. Cash collateral received is generally invested in government securities; certain obligations issued by government sponsored enterprises; repurchase agreements collateralized by US Treasury securities; obligations issued by the central government of any Organization for Economic Cooperation and Development (OECD) country or its agencies, instrumentalities or establishments; obligations of supranational organizations, commercial paper, notes, bonds and other debt obligations; certificates of deposit, time deposits, and other bank obligations; and asset-backed securities. The Series can also accept US government securities and letters of credit(non-cash collateral) in connection with securities loans.
In the event of default or bankruptcy by the lending agent, realization and/or retention of the collateral may be subject to legal proceedings. In the event the borrower fails to return loaned securities and the collateral received is insufficient to cover the value of the loaned securities and provided such collateral shortfall is not the result of investment losses, the lending agent has agreed to pay the amount of the shortfall to the Series or, at the discretion of the lending agent, replace the loaned securities. The Series continues to record dividends or interest, as applicable, on the securities loaned and is subject to changes in value of the securities loaned that may occur during the term of the loan. The Series has the right under the Lending Agreement to recover the securities from the borrower on demand. With respect to security loans collateralized bynon-cash collateral, the Series receives loan premiums paid by the borrower. With respect to security loans collateralized by cash collateral, the earnings from the collateral investments are shared among the Series, the security lending agent, and the borrower. The Series records security lending income net of allocations to the security lending agent and the borrower.
The Series may incur investment losses as a result of investing securities lending collateral. This could occur if an investment in the collateral investment account defaulted or became impaired. Under those circumstances, the value of a Series’ cash collateral account may be less than the amount the Series would be required to return to the borrowers of the securities and the Series would be required to make up for this shortfall.
During the year ended Dec. 31, 2018, the Series had no securities out on loan.
Smid Cap Core Series-20
Delaware VIP®Smid Cap Core Series
Notes to financial statements
10. Credit and Market Risk
The Series invests a significant portion of its assets in small- andmid-sized companies and may be subject to certain risks associated with ownership of securities of such companies. Investments in small- ormid-sized companies may be more volatile than investments in larger companies for a number of reasons, which include more limited financial resources or a dependence on narrow product lines.
The Series invests in REITs and is subject to the risks associated with that industry. If the Series holds real estate directly as a result of defaults or receives rental income directly from real estate holdings, its tax status as a regulated investment company may be jeopardized. There were no direct real estate holdings during the year ended Dec. 31, 2018. The Series’ REIT holdings are also affected by interest rate changes, particularly if the REITs it holds use floating rate debt to finance their ongoing operations.
Some countries in which the Series may invest require governmental approval for the repatriation of investment income, capital or the proceeds of sales of securities by foreign investors. In addition, if there is deterioration in a country’s balance of payments or for other reasons, a country may impose temporary restrictions on foreign capital remittances abroad.
The securities exchanges of certain foreign markets are substantially smaller, less liquid and more volatile than the major securities markets in the United States. Consequently, acquisition and disposition of securities by the Series may be inhibited. In addition, a significant portion of the aggregate market value of equity securities listed on the major securities exchanges in emerging markets is held by a smaller number of investors. This may limit the number of shares available for acquisition or disposition by the Series.
The Series may invest up to 10% of its net assets in illiquid securities, which may include securities with contractual restrictions on resale, securities exempt from registration under Rule 144A promulgated under the Securities Act of 1933, as amended, and other securities which may not be readily marketable. The relative illiquidity of these securities may impair the Series from disposing of them in a timely manner and at a fair price when it is necessary or desirable to do so. While maintaining oversight, the Board has delegated to DMC theday-to-day functions of determining whether individual securities are liquid for purposes of the Series’ limitation on investments in illiquid securities. Securities eligible for resale pursuant to Rule 144A, which are determined to be liquid, are not subject to the Series’ 10% limit on investments in illiquid securities. As of Dec. 31, 2018, there were no Rule 144A securities held by the Series. Restricted securities are valued pursuant to the security valuation procedures described in Note 1.
11. Contractual Obligations
The Series enters into contracts in the normal course of business that contain a variety of indemnifications. The Series’ maximum exposure under these arrangements is unknown. However, the Series has not had prior claims or losses pursuant to these contracts. Management has reviewed the Series’ existing contracts and expects the risk of loss to be remote.
12. Recent Accounting Pronouncements
In August 2018, the FASB issued an Accounting Standards Update, ASU2018-13, which changes certain fair value measurement disclosure requirements. The ASU2018-13, in addition to other modifications and additions, removes the requirement to disclose the amount and reasons for transfers between Level 1 and Level 2 of the fair value hierarchy, the policy for the timing of transfers between levels and the valuation process for Level 3 fair value measurements. The ASU2018-13 is effective for fiscal years, and interim periods within those fiscal years, beginning after Dec. 15, 2019. At this time, management is evaluating the implications of these changes on the financial statements.
In August 2018, the Securities and Exchange Commission (SEC) adopted amendments to RegulationS-X to update and simplify the disclosure requirements for registered investment companies by eliminating requirements that are redundant or duplicative of US GAAP requirements or other SEC disclosure requirements. The new amendments require the presentation of the total, rather than the components, of distributable earnings on the “Statement of assets and liabilities” and the total, rather than the components, of dividends from net investment income and distributions from net realized gains on the “Statements of changes in net assets.” The amendments also removed the requirement for the parenthetical disclosure of undistributed net investment income on the “Statements of changes in net assets” and certain tax adjustments that were reflected in the “Notes to financial statements.” All of these have been reflected in the Series financial statements.
13. Subsequent Events
Management has determined that no material events or transactions occurred subsequent to Dec. 31, 2018, that would require recognition or disclosure in the Series’ financial statements.
Smid Cap CoreSeries-21
Delaware VIP®Trust — Delaware VIP Smid Cap Core Series
Report of independent registered public accounting firm
To the Board of Trustees of Delaware VIP®Trust and Shareholders of Delaware VIP Smid Cap Core Series
Opinion on the Financial Statements
We have audited the accompanying statement of assets and liabilities, including the schedule of investments, of Delaware VIP Smid Cap Core Series (one of the series constituting Delaware VIP® Trust, referred to hereafter as the “Series”) as of December 31, 2018, the related statement of operations for the year ended December 31, 2018, the statements of changes in net assets for each of the two years in the period ended December 31, 2018, including the related notes, and the financial highlights for each of the five years in the period ended December 31, 2018 (collectively referred to as the “financial statements”). In our opinion, the financial statements present fairly, in all material respects, the financial position of the Series as of December 31, 2018, the results of its operations for the year then ended, the changes in its net assets for each of the two years in the period ended December 31, 2018 and the financial highlights for each of the five years in the period ended December 31, 2018 in conformity with accounting principles generally accepted in the United States of America.
Basis for Opinion
These financial statements are the responsibility of the Series’ management. Our responsibility is to express an opinion on the Series’ financial statements based on our audits. We are a public accounting firm registered with the Public Company Accounting Oversight Board (United States) (PCAOB) and are required to be independent with respect to the Series in accordance with the U.S. federal securities laws and the applicable rules and regulations of the Securities and Exchange Commission and the PCAOB.
We conducted our audits of these financial statements in accordance with the standards of the PCAOB. Those standards require that we plan and perform the audit to obtain reasonable assurance about whether the financial statements are free of material misstatement, whether due to error or fraud.
Our audits included performing procedures to assess the risks of material misstatement of the financial statements, whether due to error or fraud, and performing procedures that respond to those risks. Such procedures included examining, on a test basis, evidence regarding the amounts and disclosures in the financial statements. Our audits also included evaluating the accounting principles used and significant estimates made by management, as well as evaluating the overall presentation of the financial statements. Our procedures included confirmation of securities owned as of December 31, 2018 by correspondence with the custodian and brokers. We believe that our audits provide a reasonable basis for our opinion.
/s/PricewaterhouseCoopers LLP
Philadelphia, Pennsylvania
February 14, 2019
We have served as the auditor of one or more investment companies in Delaware Funds®by Macquarie since 2010.
Smid Cap CoreSeries-22
Delaware VIP®Trust — Delaware VIP Smid Cap Core Series
Other Series information (Unaudited)
Board consideration of investment advisory agreement for Delaware VIP Smid Cap Core Series
At a meeting held on Aug.15-16, 2018 (the “Annual Meeting”), the Board of Trustees (the “Board”), including a majority of disinterested or independent Trustees, approved the renewal of the Investment Advisory Agreement for Delaware VIP Smid Cap Core Series (the “Series”). In making its decision, the Board considered information furnished at regular quarterly Board meetings, including reports detailing Series performance, investment strategies, and expenses, as well as information prepared specifically in connection with the renewal of the Investment Advisory Agreement. Information furnished specifically in connection with the renewal of the Investment Advisory Agreement with Delaware Management Company (“DMC”), a series of Macquarie Investment Management Business Trust (“MIMBT”), included materials provided by DMC and its affiliates (collectively, “Macquarie Investment Management”) concerning, among other things, the nature, extent, and quality of services provided to the Series; the costs of such services to the Series; economies of scale; and the investment manager’s financial condition and profitability. In addition, in connection with the Annual Meeting, materials were provided to the Trustees in May 2018, including reports provided by Broadridge Financial Solutions (“Broadridge”). The Broadridge reports compared the Series’ investment performance and expenses with those of other comparable mutual funds. The Independent Trustees reviewed and discussed the Broadridge reports with independent legal counsel to the Independent Trustees. In addition to the information noted above, the Board also requested and received information regarding DMC’s policy with respect to advisory fee levels and its breakpoint philosophy; the structure of portfolio manager compensation; comparative client fee information; and any constraints or limitations on the availability of securities for certain investment styles, which had in the past year inhibited, or which were likely in the future to inhibit, the investment manager’s ability to invest fully in accordance with Series policies.
In considering information relating to the approval of the Series’ Investment Advisory Agreement, the Independent Trustees received assistance and advice from and met separately with independent legal counsel to the Independent Trustees and also received assistance and advice from an experienced and knowledgeable independent fund consultant, JDL Consultants, LLC (“JDL”). Although the Board gave attention to all information furnished, the following discussion identifies, under separate headings, the primary factors taken into account by the Board during its contract renewal considerations.
Nature, extent, and quality of services.The Board considered the services provided by DMC to the Series and its shareholders. In reviewing the nature, extent, and quality of services, the Board considered reports furnished to it throughout the year, which covered matters such as the relative performance of the Series, compliance of portfolio managers with the investment policies, strategies and restrictions for the Series, compliance by DMC and Delaware Distributors, L.P. (together, “Management”) personnel with the Code of Ethics adopted throughout the Delaware Funds®by Macquarie (the “Delaware Funds”), and adherence to fair value pricing procedures as established by the Board. The Board was pleased with the current staffing of DMC and the emphasis placed on research in the investment process. The Board recognized DMC’s receipt of certain favorable industry distinctions during the past several years. The Board gave favorable consideration to DMC’s efforts to control expenses while maintaining service levels committed to Series matters. The Board was satisfied with the nature, extent, and quality of the overall services provided by DMC.
Investment performance.The Board placed significant emphasis on the investment performance of the Series in view of the importance of investment performance to shareholders. Although the Board considered performance reports and discussions with portfolio managers at Board meetings throughout the year, the Board gave particular weight to the Broadridge reports furnished for the Annual Meeting. The Broadridge reports prepared for the Series showed the investment performance of its Standard Class shares in comparison to a group of similar funds as selected by Broadridge (the “Performance Universe”). A fund with the best performance ranked first, and a fund with the poorest performance ranked last. The highest/best performing 25% of funds in the Performance Universe make up the first quartile; the next 25%, the second quartile; the next 25%, the third quartile; and the poorest/worst performing 25% of funds in the Performance Universe make up the fourth quartile. Comparative annualized performance for the Series was shown for the past1-,3-,5-, and10-year periods, as applicable, ended Jan. 31, 2018. The Board’s objective is that the Series’ performance for the1-,3-, and5-year periods be at or above the median of its Performance Universe.
Broadridge currently classifies the Series as asmall-cap growth fund. However, Management believes that it would be more appropriate to include the Series in themid-cap core funds category. Accordingly, the Broadridge report prepared for the Series compares the Series’ performance to two separate Performance Universes — one, consisting of allsmall-cap growth funds underlying variable insurance products, and the other, consisting of allmid-cap core funds underlying variable insurance products. When compared to othersmall-cap growth funds, the Broadridge report comparison showed that the Series’ total return for the1-year period was in the fourth quartile of its Performance Universe. The report further showed that the Series’ total return for the3- and5-year periods was in the second quartile of its Performance Universe and the Series’ total return for the10-year period was in the first quartile of its Performance Universe. When compared to othermid-cap core funds, the Broadridge report comparison showed that the Series’ total return for the1-,3-,5-, and10-year periods was in the first quartile of its Performance Universe. The Board was satisfied with performance.
Comparative expenses.The Board considered expense data for the Delaware Funds. Management provided the Board with information on pricing levels and fee structures for the Series as of its most recently completed fiscal year. The Board also focused on the comparative analysis of effective management fees and total expense ratios of the Series versus effective management fees and expense ratios of a group of similar funds as selected by Broadridge (the “Expense Group”). In reviewing comparative costs, the Series’ contractual management fee and the actual management fee incurred by the Series were compared with the contractual management fees (assuming all funds in the Expense Group were similar in size to the Series) and actual management fees
Smid Cap Core Series-23
Delaware VIP®Trust — Delaware VIP Smid Cap Core Series
Other Series information (Unaudited)
Board consideration of investment advisory agreement for Delaware VIP Smid Cap Core Series (continued)
(as reported by each fund) within the Expense Group, taking into account any applicable breakpoints and fee waivers. The Series’ total expenses were also compared with those of its Expense Group. The Broadridge total expenses, for comparative consistency, were shown by Broadridge for Standard Class shares which do not charge12b-1 andnon-12b-1 service fees. The Board’s objective is for the Series’ total expense ratio to be competitive with those of the peer funds within its Expense Group.
When compared to othersmall-cap growth funds, the expense comparisons for the Series showed that the actual management fee was in the quartile with the lowest expenses of its Expense Group and its total expenses were in the quartile with the second lowest expenses of its Expense Group. When compared to othermid-cap core funds, the expense comparisons for the Series showed that the actual management fee and total expenses were in the quartile with the second lowest expenses of its Expense Group. The Board was satisfied with the management fee and total expenses of the Series in comparison to those of its Expense Group.
Management profitability.The Board considered the level of profits realized by DMC in connection with the operation of the Series. In this respect, the Board reviewed the Investment Management Profitability Analysis that addressed the overall profitability of DMC’s business in providing management and other services to each of the individual funds and the Delaware Funds as a whole. Specific attention was given to the methodology used by DMC in allocating costs for the purpose of determining profitability. Management stated that the level of profits of DMC, to a certain extent, reflects recent operational cost savings and efficiencies initiated by DMC. The Board considered DMC’s efforts to improve services provided to Fund shareholders and to meet additional regulatory and compliance requirements resulting from recent industry-wide Securities and Exchange Commission initiatives. The Board also considered the extent to which DMC might derive ancillary benefits from fund operations, including the potential for procuring additional business as a result of the prestige and visibility associated with its role as service provider to the Delaware Funds and the benefits from allocation of fund brokerage to improve trading efficiencies. As part of its work, the Board also reviewed a report prepared by JDL regarding MIMBT profitability as compared to certain peer fund complexes and the Independent Trustees met with JDL personnel to discuss DMC’s profitability in such context. The Board found that the management fees were reasonable in light of the services rendered and the profitability of DMC.
Economies of scale.The Trustees considered whether economies of scale are realized by DMC as the Series’ assets increase and the extent to which any economies of scale are reflected in the level of management fees charged. The Trustees reviewed the Series’ advisory fee pricing and structure approved by the Board and shareholders, which includes breakpoints, and which applies to most funds in the Delaware Funds complex. Breakpoints in the advisory fee occur when the advisory fee rate is reduced on assets in excess of specified levels. Breakpoints result in a lower advisory fee, than would otherwise be the case in the absence of breakpoints, when the asset levels specified in the breakpoints are exceeded. The Board noted that, as of March 31, 2018, the Series’ assets exceeded the first breakpoint level. The Board believed that, given the extent to which economies of scale might be realized by DMC and its affiliates, the schedule of fees under the Investment Advisory Agreement provides a sharing of the benefits with the Series and its shareholders.
Tax Information
All disclosures are based on financial information available as of the date of this annual report and, accordingly is subject to change. For any and all items requiring reporting, it is the intention of the Series to report the maximum amount permitted under the Internal Revenue Code and the regulations thereunder.
For the year ended Dec. 31, 2018, the Series’ reports distributions paid during the year as follows:
| | | | | | |
| (A) | | | | | | |
| Long-Term | | (B) | | | | |
| Capital Gain | | Ordinary Income | | Total | | (C) |
| Distributions | | Distributions* | | Distributions | | Qualifying |
| (Tax Basis) | | (Tax Basis) | | (Tax Basis) | | Dividends1 |
| 89.81% | | 10.19% | | 100.00% | | 21.16% |
(A) and (B) are based on a percentage of the Series’ total distributions.
(C) is based on a percentage of the Series’ ordinary income distributions.
1Qualifying dividends represent dividends which qualify for the corporate dividends received deduction.
*For the fiscal year ended Dec. 31, 2018, certain dividends paid by the Series may be subject to a maximum tax rate of 20%. The percentage of dividends paid by the Series from ordinary income reported as qualified income is 22.95%. Complete information will be computed and reported in conjunction with your 2018 Form1099-DIV.
Smid Cap CoreSeries-24
Delaware Funds®by Macquarie
Board of trustees/directors and officers addendum
A mutual fund is governed by a Board of Trustees/Directors (“Trustees”), which has oversight responsibility for the management of a fund’s business affairs. Trustees establish procedures and oversee and review the performance of the investment manager, the distributor, and others who perform services for the fund. The independent fund trustees, in particular, are advocates for shareholder interests. Each trustee has served in that capacity since he or she was elected to or appointed to the Board of Trustees, and will continue to serve until his or her retirement or the election of a new trustee in his or her place. The following is a list of the Trustees and Officers with certain background and related information.
| | | | | | | | | | |
| | | | | | | | | Number of | | Other |
| | | | | | | Principal | | Portfolios in Fund | | Directorships |
| Name, | | Position(s) | | | | Occupation(s) | | Complex Overseen | | Held by |
| Address, | | Held with | | Length of Time | | During the | | by Trustee | | Trustee |
| and Birth Date | | Fund(s) | | Served | | Past Five Years | | or Officer | | or Officer |
| INTERESTED TRUSTEE | | | | | | | | | | |
| | | | | |
Shawn K. Lytle1,3 2005 Market Street
Philadelphia, PA 19103 February 1970 | | President, Chief Executive Officer, and Trustee | | President and Chief Executive Officer since August 2015 Trustee since September 2015 | | President—Macquarie Investment Management2 (June 2015-Present) Regional Head of Americas—UBS Global Asset Management (April2010-May 2015) | | 59 | | Trustee — UBS Relationship Funds, SMA Relationship Trust, and UBS Funds (May 2010–April 2015) |
| INDEPENDENT TRUSTEES | | | | | | | | | | |
| | | | | |
Thomas L. Bennett 2005 Market Street Philadelphia, PA 19103 October 1947 | | Chair and Trustee | | Trustee since
March 2005 Chair since March 2015 | | Private Investor (March 2004–Present) | | 59 | | None |
Jerome D. Abernathy 2005 Market Street Philadelphia, PA 19103 July 1959 | | Trustee | | Since January 2019 | | Managing Member, Stonebrook Capital Management, LLC (financial technology: macro factors and databases) (January 1993–Present) | | 59 | | None |
Ann D. Borowiec 2005 Market Street Philadelphia, PA 19103 November 1958 | | Trustee | | Since March 2015 | | Chief Executive Officer, Private Wealth Management (2011–2013) and Market Manager, New Jersey Private Bank (2005–2011 )—J.P. Morgan Chase & Co. | | 59 | | Director — Banco Santander International (October 2016-Present) Director — Santander Bank, N.A. (December 2016-Present) |
Joseph W. Chow 2005 Market Street Philadelphia, PA 19103 January 1953 | | Trustee | | Since January 2013 | | Private Investor (April 2011–Present) | | 59 | | Director and Audit Committee Member — Hercules Technology Growth Capital, Inc. (July 2004–July 2014) |
John A. Fry 2005 Market Street
Philadelphia, PA 19103 May 1960 | | Trustee | | Since January 2001 | | President—Drexel University (August 2010–Present) President—Franklin & Marshall College (July 2002–July 2010) | | 59 | | Director; Compensation Committee and Governance Committee Member — Community Health Systems Director — Drexel Morgan & Co. Director and Audit Committee Member — vTv Therapeutics LLC Director and Audit Committee Member — FS Credit Real Estate Income Trust, Inc. |
Lucinda S. Landreth2005 Market Street
Philadelphia, PA 19103 June 1947 | | Trustee | | Since March 2005 | | Private Investor (2004–Present) | | 59 | | None |
Smid Cap Core Series-25
| | | | | | | | | | |
| | | | | | | | | Number of | | Other |
| | | | | | | Principal | | Portfolios in Fund | | Directorships |
| Name, | | Position(s) | | | | Occupation(s) | | Complex Overseen | | Held by |
| Address, | | Held with | | Length of Time | | During the | | by Trustee | | Trustee |
| and Birth Date | | Fund(s) | | Served | | Past Five Years | | or Officer | | or Officer |
| | | | | |
Frances A. Sevilla-Sacasa2005 Market Street Philadelphia, PA 19103 January 1956 | | Trustee | | Since September 2011 | | Private Investor(January 2017-Present) Chief Executive Officer—Banco Itaú International (April 2012–December 2016) Executive Advisor to Dean (August 2011–March 2012) and Interim Dean (January 2011–July 2011)—University of Miami School of Business Administration President—U.S. Trust, Bank of America Private Wealth Management (Private Banking) (July 2007–December 2008) | | 59 | | Trust Manager and Audit Committee Chair — Camden Property Trust(August 2011-Present) Director — Carrizo Oil & Gas, Inc.(March 2018-Present) |
Thomas K. Whitford 2005 Market Street Philadelphia, PA 19103 March 1956 | | Trustee | | Since January 2013 | | Vice Chairman (2010–April 2013)—PNC Financial Services Group | | 59 | | Director — HSBC North America Holdings Inc. (December 2013-Present) Director — HSBC USA Inc. (July 2014-Present) Director — HSBC Bank USA, National Association (July 2014-March 2017) Director — HSBC Finance Corporation (December 2013-April 2018) |
Christianna Wood 2005 Market Street Philadelphia, PA 19103 March 1956 | | Trustee | | Since January 2019 | | Chief Executive Officer and President—Gore Creek Capital, Ltd. (August 2009–Present) | | 59 | | Director and Audit Committee Member — H&R Block Corporation (July 2008-Present) Director and Audit Committee Member — Grange Insurance (2013-Present) Trustee and Audit Committee Member — The Merger Fund (2013-Present), The Merger Fund VL (2013-Present); WCM Alternatives: Event-Driven Fund (2013-Present), and WCM Alternatives: Credit Event Fund (December 2017-Present) Director — International Securities Exchange (2010-2016) |
Janet L. Yeomans 2005 Market Street Philadelphia, PA 19103 July 1948 | | Trustee | | Since April 1999 | | Vice President and Treasurer (January 2006–July 2012), Vice President—Mergers & Acquisitions (January 2003–January 2006), and Vice President and Treasurer (July 1995–January 2003)—3M Company | | 59 | | Director; Personnel and Compensation Committee Chair; Member of Nominating, Investments, and Audit Committees for various periods throughout directorship — Okabena Company (2009-2017) |
Smid Cap Core Series-26
| | | | | | | | | | |
| | | | | | | | | Number of | | Other |
| | | | | | | Principal | | Portfolios in Fund | | Directorships |
| Name, | | Position(s) | | | | Occupation(s) | | Complex Overseen | | Held by |
| Address, | | Held with | | Length of Time | | During the | | by Trustee | | Trustee |
| and Birth Date | | Fund(s) | | Served | | Past Five Years | | or Officer | | or Officer |
| OFFICERS | | | | | | | | | | |
| | | | | |
David F. Connor 2005 Market Street Philadelphia, PA 19103 December 1963 | | Senior Vice President, General Counsel, and Secretary | | Senior Vice President, since May 2013; General Counsel since May 2015; Secretary since October 2005 | | David F. Connor has served in various capacities at different times at Macquarie Investment Management. | | 59 | | None3 |
Daniel V. Geatens 2005 Market Street Philadelphia, PA 19103 October 1972 | | Vice President and Treasurer | | Vice President and Treasurer since October 2007 | | Daniel V. Geatens has served in various capacities at different times at Macquarie Investment Management. | | 59 | | None3 |
Richard Salus 2005 Market Street Philadelphia, PA 19103 October 1963 | | Senior Vice President and Chief Financial Officer | | Senior Vice President and Chief Financial Officer since November 2006 | | Richard Salus has served in various capacities at different times at Macquarie Investment Management. | | 59 | | None3 |
| 1 | Shawn K. Lytle is considered to be an “Interested Trustee” because he is an executive officer of the Fund’s(s’) investment advisor. |
| 2 | Macquarie Investment Management is the marketing name for Macquarie Management Holdings, Inc. and its subsidiaries, including the Fund’s(s’) investment advisor, principal underwriter, and its transfer agent. |
| 3 | Shawn K. Lytle, David F. Connor, Daniel V. Geatens, and Richard Salus serve in similar capacities for the six portfolios of the Optimum Fund Trust, which have the same investment advisor, principal underwriter, and transfer agent as the registrant. Mr. Geatens also serves as the Chief Financial Officer and Treasurer for Macquarie Global Infrastructure Total Return Fund Inc., which has an affiliated investment manager. |
The Statement of Additional Information for the Fund(s) includes additional information about the Trustees and Officers and is available, without charge, upon request by calling 800523-1918.
Smid Cap Core Series-27
| | | | |
| | The Series files its complete schedule of portfolio holdings with the Securities and Exchange Commission (SEC) for the first and third quarters of each fiscal year on FormN-Q. The Series’ FormsN-Q, as well as a description of the policies and procedures that the Series uses to determine how to vote proxies (if any) relating to portfolio securities are available without charge (i) upon request, by calling 800523-1918; and (ii) on the SEC’s website at sec.gov. In addition, a description of the policies and procedures that the Series uses to determine how to vote proxies (if any) relating to portfolio securities and the Schedule of Investments included in the Series’ most recent FormN-Q are available without charge on the Series’ website at delawarefunds.com/vip/literature. The Series’ FormsN-Q may be reviewed and copied at the SEC’s Public Reference Room in Washington, DC; information on the operation of the Public Reference Room may be obtained by calling 800SEC-0330. Information (if any) regarding how the Series voted proxies relating to portfolio securities during the most recently disclosed12-month period ended June 30 is available without charge (i) through the Series’ website at delawarefunds.com/proxy; and (ii) on the SEC’s website at sec.gov. | | |
| | |
| AR-VIPSCG 22047 (2/19) (730130) | | Smid Cap Core Series-28 |
Delaware VIP®Trust
Delaware VIP High Yield Series
December 31, 2018
Table of contents
| | | | | | | | |
 | | Portfolio management review | | | 1 | | | |
| | | |
| | Performance summary | | | 3 | | | |
| | | |
| | Disclosure of Series expenses | | | 5 | | | |
| | | |
| | Security type / sector allocation | | | 6 | | | |
| | | |
| | Schedule of investments | | | 7 | | | |
| | | |
| | Statement of assets and liabilities | | | 11 | | | |
| | | |
| | Statement of operations | | | 12 | | | |
| | | |
| | Statements of changes in net assets | | | 12 | | | |
| | | |
| | Financial highlights | | | 13 | | | |
| | | |
| | Notes to financial statements | | | 15 | | | |
| | | |
| | Report of independent registered public accounting firm | | | 23 | | | |
| | | |
| | Other Series information | | | 24 | | | |
| | | |
| | Board of trustees / directors and officers addendum | | | 27 | | | |
| | | |
| | | | | | | | | |
| | Other than Macquarie Bank Limited (MBL), none of the entities noted are authorized deposit-taking institutions for the purposes of the Banking Act 1959 (Commonwealth of Australia). The obligations of these entities do not represent deposits or other liabilities of MBL. MBL does not guarantee or otherwise provide assurance in respect of the obligations of these entities, unless noted otherwise. The Series is governed by US laws and regulations. Unless otherwise noted, views expressed herein are current as of Dec. 31, 2018, and subject to change for events occurring after such date. The Series is not FDIC insured and is not guaranteed. It is possible to lose the principal amount invested. Advisory services provided by Delaware Management Company, a series of Macquarie Investment Management Business Trust (MIMBT), a US registered investment advisor. The Series is distributed byDelaware Distributors, L.P.(DDLP), an affiliate of MIMBT and Macquarie Group Limited. Macquarie Investment Management (MIM), is the marketing name for certain companies comprising the asset management division of Macquarie Group Limited and its subsidiaries and affiliates worldwide. This material may be used in conjunction with the offering of shares in Delaware VIP High Yield Series only if preceded or accompanied by the Series’ current prospectus or the summary prospectus. © 2019 Macquarie Management Holdings, Inc. All third-party marks cited are the property of their respective owners. | | | | | | |
Delaware VIP®Trust — Delaware VIP High Yield Series
| | |
| Portfolio management review | | January 8, 2019 |
For the fiscal year ended Dec. 31, 2018, Delaware VIP High Yield Series (the “Series”) Standard Class shares declined 4.47% and Service Class shares fell 4.76%. Both figures reflect all dividends reinvested. The Series outperformed its benchmark, the ICE BofAML US High Yield Constrained Index, which declined 2.27% for the same period.
High yield bonds posted negative returns during the Series’ fiscal year as concerns about Federal Open Market Committee (FOMC) rate decisions, rising trade tensions, slowing global growth, and declining oil prices all weighed on investors’ appetite for risk assets. Despite a supportive fundamental and technical backdrop for high yield throughout the fiscal year, fragile investor sentiment resulted in elevated volatility and roller-coaster-like performance as benchmark returns peaked in early October at +2.73% and finished 2018 at-2.27%. Over the Series’ fiscal year, credit spreads widened significantly, while default rates remained low by historical standards. (Source: Bloomberg.)
Key contributors to market volatility throughout the Series’ fiscal year were fluctuations in Treasury yields and West Texas Intermediate (WTI) oil prices. A rise in both Treasury yields and oil prices through the first three quarters of 2018 led to outperformance in the lower-quality, higher-beta (more volatile) credits in high yield, while theup-in-quality, more-duration-sensitive component of the market underperformed. Treasury yields rallied and credit risk sold off as trade tensions increased, concern about the outlook for global growth intensified, oil prices fell sharply, and FOMC rate moves came into question. Thus, the fourth quarter reversed direction as positiveyear-to-date returns gave way, with the energy sector leading to a significant selloff in lower-quality high yield.
From a valuation perspective, high yield spreads finished the Series’ fiscal year very close to historical averages, the result of a strong fundamental and technical backdrop offset by heightened concerns around the longevity of the current economic cycle. Lightnew-issue supply activity was a large contributor to the solid technical picture, as cash received from interest payments and principal repayments outweighed both the retail outflows from the market and the reduced volume ofnew-issue supply brought to market during the12-month period.
During the fiscal year, the Series’ positioning in the energy, automotive, and healthcare sectors detracted from the Series’ performance. In contrast, the Series’ positioning in the technology, financial services, and retail sectors contributed to performance.
American Tire Distributors Inc.detracted from the Series’ relative performance during the fiscal year. The business suffered a negative credit event when Goodyear and Bridgestone — its two largest customers, representing aboutone-quarter of annual revenue – formed a joint venture toin-source distribution of their manufactured tires. Bonds issued by American Tire Distributors traded down sharply on the news, and we subsequently sold the Series’ position because of the company’s deteriorating long-term outlook.
Alta Mesa Holdings LP,an oil and natural gas exploration and production company, also detracted from performance. Its weaker-than-expected third-quarter earnings results, combined with a precipitous 11% drop in oil prices in October, depressed the company’s equity and bond prices. Bond prices continued to deteriorate further in the fourth quarter as oil prices fell 40% from a high in early October. We remain positive, however, on the longer-term fundamentals of the company and maintain our position in the bonds.
Finally,Tronox Inc., a titanium dioxide producer, detracted from returns for the year. In 2017, Tronox announced the acquisition of Cristal USA Inc. with the intention of selling certain Cristal assets in order to both alleviate any antitrust concerns surrounding the transaction and to enhance the combined company’s credit profile moving forward. In August 2018, the Federal Trade Commission (FTC) filed an injunction to block the acquisition. As a result, Tronox’s bonds sold off, detracting from overall Series’ performance. We think the transactions will ultimately be completed, and we maintain the Series’ position in the bonds.
A bank loan issued toApplied Systems Inc., a provider of software to the property and casualty insurance market, was the Series’ strongest contributor. Applied Systems reported positive earnings during the fiscal year. In our view, the company has used its favorable free-cash-flow profile and stable margins to reduce outstanding debt while continuing to build upon an already-dominant market share within its industry.
CDK Global Inc.,a provider of integrated information technology and digital-marketing solutions, contributed to the Series’ return for the fiscal year. CDK Global was amid-year issuer of bonds with a strong credit profile, a solid balance sheet, and robust free-cash-flow generation. This credit profile led to strong relative performance during the fourth-quarter selloff in the broader high yield market. We currently maintain a core position in the company’s bonds.
Finally, a position inCenturyLink Inc.contributed to the Series’ returns for the fiscal year. The integrated communications company reported solid earnings results as it delivered faster-than-expected significant synergies from its recent acquisition of Level 3 Communications Inc. Based on valuations, we exited the position during the period.
Unless otherwise noted, views expressed herein are current as of Dec. 31, 2018, and subject to change.
High YieldSeries-1
Delaware VIP®Trust — Delaware VIP High Yield Series
| | |
| Portfolio management review (continued) | | January 8, 2019 |
Although the economic backdrop for high yield bonds remains generally supportive, we are cognizant of various risk factors, including the continuation of the Federal Reserve’s monetary tightening cycle, volatility in domestic equity markets, and the unforeseen consequences of an escalating trade war on the global economy. With those risks in mind, we moved the Series’ duration component to neutral and, regarding credit quality, maintain an overweight allocation to what we view as our highest conviction names. At the sector level, we have reduced exposure to sectors, such as builders, building materials, and packaging. Meanwhile, we have retained an overweight allocation to banking and insurance brokers.
Given investors’ heightened sensitivity for the risk factors discussed above, and the resulting widening in high yield spreads, we believe both the possibility of an FOMC pause and an extension of the economic cycle have made high yield valuations more compelling. As such, we think achieving a proper balance between disciplined credit selection and duration risk remains the primary challenge in managing the Series. In this environment, credit selection could remain paramount, in which case we believe ourbottom-up (bond by bond) approach to managing and constructing high yield portfolios may prove advantageous.
Unless otherwise noted, views expressed herein are current as of Dec. 31, 2018, and subject to change.
High YieldSeries-2
Delaware VIP®Trust — Delaware VIP High Yield Series
Performance summary
The performance quoted represents past performance and does not guarantee future results. Investment return and principal value of an investment will fluctuate so that shares, when redeemed, may be worth more or less than their original cost. Current performance may be lower or higher than the performance quoted.
Carefully consider the Series’ investment objectives, risk factors, charges, and expenses before investing. This and other information can be found in the Series’ prospectus and its summary prospectus, which may be obtained by visiting delawarefunds.com/vip/literature or calling 800523-1918. Investors should read the prospectus and the summary prospectus carefully before investing.
| | | | | | | | | | | | | | | | | | | | | | | | |
| Delaware VIP High Yield Series | | | | | | | | | | | | | | | | | | |
| Average annual total returns | | | | | | | | | | | | | | | | | | |
| For period ended December 31, 2018 | | 1 year | | | 3 years | | | 5 years | | | 10 years | | | Lifetime | | | | |
Standard Class shares (commenced operations on July 28, 1988) | | | -4.47% | | | | +5.13% | | | | +1.59% | | | | +9.37% | | | | +6.45% | | | | | |
| | | | | | | | | | | | | | | | | | | | | | | | |
Service Class shares (commenced operations on May 1, 2000) | | | -4.76% | | | | +4.87% | | | | +1.33% | | | | +9.10% | | | | +5.55% | | | | | |
| | | | | | | | | | | | | | | | | | | | | | | | |
ICE BofAML US High Yield Constrained Index* | | | -2.27% | | | | +7.27% | | | | +3.83% | | | | +11.02% | | | | n/a | | | | | |
*Formerly known as the BofA Merrill Lynch US High Yield Constrained Index.
Returns reflect the reinvestment of all distributions. Please see page 4 for a description of the index.
As described in the Series’ most recent prospectus, the net expense ratio for Service Class shares of the Series was 1.05%, while total operating expenses for Standard Class and Service Class shares were 0.75% and 1.05%, respectively. The management fee for Standard Class and Service Class shares was 0.65%.The Series’ investment manager, Delaware Management Company (Manager), has contractually agreed to waive all or a portion of its investment advisory fees and/or pay/reimburse expenses (excluding any12b-1 fees, acquired fund fees and expenses, taxes, interest, short sale and dividend interest expenses, brokerage fees, certain insurance costs, and nonroutine expenses or costs, including, but not limited to, those relating to reorganizations, litigation, conducting shareholder meetings, and liquidations) in order to prevent annual series operating expenses from exceeding 0.75% of the Series’ average daily net assets from Jan. 1, 2018 through Dec. 31, 2018.* These waivers and reimbursements may only be terminated by agreement of the Manager and the Series. Please see the most recent prospectus and any applicable supplement(s) for additional information on these fee waivers and/or reimbursements. Please see the “Financial highlights” section in this report for the most recent expense ratios.
The Series pays Delaware Distributors, L.P. (DDLP), the distributor and an affiliate of DMC, an annual12b-1 fee of 0.30% of the average daily net assets of the Service Class shares. Prior to May 1, 2018, DDLP had contracted to waive12b-1 fees in order to limit12b-1 fees of the Service Class shares to 0.25% of average daily net assets.
Earnings from a variable annuity or variable life investment compoundtax-free until withdrawal, and as a result, no adjustments were made for income taxes.
Expense limitations were in effect for both classes during certain periods shown in the Series performance table above and in the Performance of a $10,000 Investment graph on the next page.
Performance data do not reflect insurance fees related to a variable annuity or variable life investment or the deferred sales charge that would apply to certain withdrawals of investments held for fewer than eight years. Performance shown here would have been reduced if such fees were included and the expense limitation removed. For more information about fees, consult your variable annuity or variable life prospectus.
Investments in variable products involve risk.
Fixed income securities and bond funds can lose value, and investors can lose principal, as interest rates rise. They also may be affected by economic conditions that hinder an issuer’s ability to make interest and principal payments on its debt.
The Series may also be subject to prepayment risk, the risk that the principal of a bond that is held by a portfolio will be prepaid prior to maturity, at the time when interest rates are lower than what the bond was paying. A portfolio may then have to reinvest that money at a lower interest rate.
High yielding,non-investment-grade bonds (junk bonds) involve higher risk than investment grade bonds. The high yield secondary market is particularly susceptible to liquidity problems when institutional investors, such as mutual funds and certain other financial institutions, temporarily stop buying bonds for regulatory, financial, or other reasons. In addition, a less liquid secondary market makes it more difficult for the Series to obtain precise valuations of the high yield securities in its portfolio.
*The aggregate contractual waiver period covering this report is from May 1, 2017 through May 1, 2019.
High YieldSeries-3
Delaware VIP High Yield Series
Performance summary (continued)
The Series may experience portfolio turnover in excess of 100%, which could result in higher transaction costs and tax liability.
International investments entail risks not ordinarily associated with US investments including fluctuation in currency values, differences in accounting principles, or economic or political instability in other nations. Investing in emerging markets can be riskier than investing in established foreign markets due to increased volatility and lower trading volume.
The Series may invest in derivatives, which may involve additional expenses and are subject to risk, including the risk that an underlying security or securities index moves in the opposite direction from what the portfolio manager anticipated. A derivatives transaction depends upon the counterparties’ ability to fulfill their contractual obligations.
Please read both the contract and underlying prospectus for specific details regarding the product’s risk profile.
| | | | |
| For period beginning Dec. 31, 2008 through Dec. 31, 2018 | | Starting value | | Ending value |
— ICE BofAML US High Yield Constrained Index | | $10,000 | | $28,434 |
— Delaware VIP High Yield Series (Standard Class) | | $10,000 | | $24,494 |
The graph shows a $10,000 investment in the Delaware VIP High Yield Series Standard Class shares for the period from Dec. 31, 2008 through Dec. 31, 2018.
The graph also shows $10,000 invested in the ICE BofAML US High Yield Constrained Index for the period from Dec. 31, 2008 through Dec. 31, 2018. The ICE BofAML US High Yield Constrained Index (formerly known as the BofA Merrill Lynch US High Yield Constrained Index) tracks the performance of US dollar-denominated high yield corporate debt publicly issued in the US domestic market, but caps individual issuer exposure at 2% of the benchmark.
Index performance returns do not reflect any management fees, transaction costs or expenses. Indices are unmanaged and one cannot invest directly in an index.
Performance of Service Class shares will vary due to different charges and expenses.
Past performance is not a guarantee of future results.
High YieldSeries-4
| | |
| Delaware VIP® Trust — Delaware VIP High Yield Series |
| Disclosure of Series expenses | | |
| For thesix-month period July 1, 2018 to December 31, 2018 (Unaudited) |
As a shareholder of the Series, you incur ongoing costs, which may include management fees; distribution and service (12b-1) fees; and other
Series expenses. This example is intended to help you understand your ongoing costs (in dollars) of investing in the Series and to compare these
costs with the ongoing costs of investing in other mutual funds.
The example is based on an investment of $1,000 invested at the beginning of the period and held for the entiresix-month period from July 1, 2018 to Dec. 31, 2018.
Actual expenses
The first section of the table shown, “Actual Series Return,” provides information about actual account values and actual expenses. You may use the information in this section of the table, together with the amount you invested, to estimate the expenses that you paid over the period. Simply divide your account value by $1,000 (for example, an $8,600 account value divided by $1,000 = 8.6), then multiply the result by the number in the first section under the heading entitled “Expenses Paid During Period” to estimate the expenses you paid on your account during the period.
Hypothetical example for comparison purposes
The second section of the table shown, “Hypothetical 5% Return,” provides information about hypothetical account values and hypothetical expenses based on the Series’ actual expense ratio and an assumed rate of return of 5% per year before expenses, which is not the Series’ actual return. The hypothetical account values and expenses may not be used to estimate the actual ending account balance or expenses you paid for the period. You may use this information to compare the ongoing costs of investing in the Series and other funds. To do so, compare the 5% hypothetical example with the 5% hypothetical examples that appear in the shareholder reports of other funds.
Please note that the expenses shown in the table are meant to highlight your ongoing costs only. As a shareholder of the Series, you do not incur any transaction costs, such as sales charges (loads), redemption fees or exchange fees, but shareholders of other funds may incur such costs. Also, the fees related to the variable annuity investment or the deferred sales charge that could apply have not been included. Therefore, the second section of the table is useful in comparing ongoing costs only, and will not help you determine the relative total costs of owning different funds. The Series’ expenses shown in the table assume reinvestment of all dividends and distributions.
Expense analysis of an investment of $1,000
| | | | | | | | | | | | | | |
| | | Beginning
Account
Value
7/1/18 | | | Ending
Account
Value
12/31/18 | | | Annualized
Expense
Ratio | | Expenses
Paid During
Period
7/1/18 to
12/31/18* | |
Actual Series return† | | | | |
Standard Class | | $ | 1,000.00 | | | $ | 970.90 | | | 0.75% | | | $3.73 | |
Service Class | | | 1,000.00 | | | | 968.70 | | | 1.05% | | | 5.21 | |
|
Hypothetical 5% return(5% return before expenses) | |
Standard Class | | $ | 1,000.00 | | | $ | 1,021.42 | | | 0.75% | | | $3.82 | |
Service Class | | | 1,000.00 | | | | 1,019.91 | | | 1.05% | | | 5.35 | |
*“Expenses Paid During Period” are equal to the Series’ annualized expense ratio, multiplied by the average account value over the period, multiplied by 184/365 (to reflect theone-half year period).
| † | Because actual returns reflect only the most recentsix-month period, the returns shown may differ significantly from fiscal year returns. |
High Yield Series-5
| | |
| Delaware VIP®Trust — Delaware VIP High Yield Series |
| Security type / sector allocation | | |
| As of December 31, 2018 (Unaudited) | | |
Sector designations may be different than the sector designations presented in other Series materials. The sector designations may represent the investment manager’s internal sector classifications.
| | | | |
| Security type / sector | | Percentage of net assets | |
Corporate Bonds | | | 92.84% | |
Banking | | | 3.62% | |
Basic Industry | | | 13.63% | |
Capital Goods | | | 4.35% | |
Consumer Cyclical | | | 5.84% | |
ConsumerNon-Cyclical | | | 2.89% | |
Energy | | | 18.18% | |
Healthcare | | | 11.75% | |
Insurance | | | 4.70% | |
Media | | | 9.57% | |
Services | | | 5.52% | |
Technology & Electronics | | | 4.23% | |
Telecommunications | | | 5.66% | |
Transportation | | | 0.57% | |
Utilities | | | 2.33% | |
Loan Agreements | | | 6.11% | |
Common Stock | | | 0.00% | |
Total Value of Securities | | | 98.95% | |
Receivables and Other Assets Net of Liabilities | | | 1.05% | |
Total Net Assets | | | 100.00% | |
High YieldSeries-6
Delaware VIP®Trust — Delaware VIP High Yield Series
Schedule of investments
December 31, 2018
| | | | | | | | |
| | | Principal
amount° | | | Value (US $) | |
|
Corporate Bonds – 92.84% | |
Banking – 3.62% | |
Barclays 7.75%µy | | | 1,035,000 | | | $ | 998,175 | |
Credit Suisse Group | | | | | | | | |
144A 6.25%#µy | | | 865,000 | | | | 820,478 | |
144A 7.50%#µy | | | 595,000 | | | | 581,613 | |
Lloyds Banking Group 7.50%µy | | | 1,160,000 | | | | 1,122,068 | |
Popular 6.125% 9/14/23 | | | 1,340,000 | | | | 1,332,469 | |
Royal Bank of Scotland Group 8.625%µy | | | 1,030,000 | | | | 1,068,625 | |
UBS Group Funding Switzerland 6.875%µy | | | 1,145,000 | | | | 1,102,063 | |
| | | | | | | | |
| | | | | | | 7,025,491 | |
| | | | | | | | |
Basic Industry – 13.63% | |
BMC East 144A 5.50% 10/1/24 # | | | 855,000 | | | | 800,494 | |
Boise Cascade 144A 5.625% 9/1/24 # | | | 395,000 | | | | 372,287 | |
Cleveland-Cliffs 5.75% 3/1/25 | | | 1,540,000 | | | | 1,389,850 | |
First Quantum Minerals | | | | | | | | |
144A 6.875% 3/1/26 # | | | 510,000 | | | | 411,187 | |
144A 7.25% 5/15/22 # | | | 1,080,000 | | | | 1,005,750 | |
144A 7.25% 4/1/23 # | | | 580,000 | | | | 512,575 | |
Freeport-McMoRan | | | | | | | | |
5.45% 3/15/43 | | | 1,335,000 | | | | 1,022,944 | |
6.875% 2/15/23 | | | 945,000 | | | | 978,075 | |
Hudbay Minerals | | | | | | | | |
144A 7.25% 1/15/23 # | | | 140,000 | | | | 138,950 | |
144A 7.625% 1/15/25 # | | | 1,075,000 | | | | 1,056,187 | |
IAMGOLD 144A 7.00% 4/15/25 # | | | 860,000 | | | | 812,700 | |
Joseph T Ryerson & Son 144A 11.00% 5/15/22 # | | | 1,555,000 | | | | 1,570,550 | |
Lennar 5.875% 11/15/24 | | | 525,000 | | | | 526,969 | |
M/I Homes 5.625% 8/1/25 | | | 1,145,000 | | | | 1,053,400 | |
New Enterprise Stone & Lime 144A 10.125% 4/1/22 # | | | 1,630,000 | | | | 1,597,400 | |
NOVA Chemicals 144A 5.25% 6/1/27 # | | | 2,035,000 | | | | 1,808,606 | |
Novelis 144A 6.25% 8/15/24 # | | | 663,000 | | | | 624,877 | |
Schweitzer-Mauduit International 144A 6.875% 10/1/26 # | | | 1,095,000 | | | | 1,032,037 | |
Standard Industries 144A 6.00% 10/15/25 # | | | 1,690,000 | | | | 1,627,217 | |
Starfruit Finco 144A 8.00% 10/1/26 # | | | 1,715,000 | | | | 1,590,663 | |
Steel Dynamics 5.00% 12/15/26 | | | 1,638,000 | | | | 1,556,100 | |
Tronox Finance 144A 5.75% 10/1/25 # | | | 2,665,000 | | | | 2,168,644 | |
William Lyon Homes 6.00% 9/1/23 | | | 1,180,000 | | | | 1,067,900 | |
Zekelman Industries 144A 9.875% 6/15/23 # | | | 1,630,000 | | | | 1,723,725 | |
| | | | | | | | |
| | | | | | | 26,449,087 | |
| | | | | | | | |
Capital Goods – 4.35% | |
Anixter 144A 6.00% 12/1/25 # | | | 1,095,000 | | | | 1,089,525 | |
Ardagh Packaging Finance 144A 6.00% 2/15/25 # | | | 1,085,000 | | | | 1,004,298 | |
Bombardier 144A 6.00% 10/15/22 # | | | 555,000 | | | | 523,087 | |
| | | | | | | | |
| | | Principal
amount° | | | Value (US $) | |
|
Corporate Bonds (continued) | |
Capital Goods (continued) | |
Bombardier 144A 7.50% 3/15/25 # | | | 555,000 | | | $ | 525,169 | |
BWAY Holding 144A 7.25% 4/15/25 # | | | 1,010,000 | | | | 910,263 | |
BWX Technologies 144A 5.375% 7/15/26 # | | | 635,000 | | | | 614,172 | |
EnPro Industries 144A 5.75% 10/15/26 # | | | 1,210,000 | | | | 1,170,675 | |
Intertape Polymer Group 144A 7.00% 10/15/26 # | | | 1,095,000 | | | | 1,084,050 | |
TransDigm 6.375% 6/15/26 | | | 1,620,000 | | | | 1,512,675 | |
| | | | | | | | |
| | | | | | | 8,433,914 | |
| | | | | | | | |
Consumer Cyclical – 5.84% | |
AMC Entertainment Holdings 6.125% 5/15/27 | | | 1,950,000 | | | | 1,677,000 | |
Boyd Gaming 6.00% 8/15/26 | | | 1,695,000 | | | | 1,591,181 | |
ESH Hospitality 144A 5.25% 5/1/25 # | | | 1,370,000 | | | | 1,277,525 | |
Golden Nugget 144A 8.75% 10/1/25 # | | | 1,981,000 | | | | 1,911,665 | |
MGM Resorts International 5.75% 6/15/25 | | | 1,130,000 | | | | 1,096,100 | |
Penske Automotive Group 5.50% 5/15/26 | | | 1,055,000 | | | | 985,106 | |
Scientific Games International 10.00% 12/1/22 | | | 2,745,000 | | | | 2,789,579 | |
| | | | | | | | |
| | | | | | | 11,328,156 | |
| | | | | | | | |
ConsumerNon-Cyclical – 2.89% | |
JBS USA | | | | | | | | |
144A 5.75% 6/15/25 # | | | 460,000 | | | | 441,025 | |
144A 6.75% 2/15/28 # | | | 1,085,000 | | | | 1,061,944 | |
Minerva Luxembourg 144A 6.50% 9/20/26 # | | | 640,000 | | | | 598,406 | |
Pilgrim’s Pride 144A 5.75% 3/15/25 # | | | 945,000 | | | | 890,663 | |
Prestige Brands 144A 6.375% 3/1/24 # | | | 1,075,000 | | | | 1,042,750 | |
Sigma Holdco 144A 7.875% 5/15/26 # | | | 1,815,000 | | | | 1,579,050 | |
| | | | | | | | |
| | | | | | | 5,613,838 | |
| | | | | | | | |
Energy –18.18% | |
Alta Mesa Holdings 7.875% 12/15/24 | | | 3,035,000 | | | | 1,896,875 | |
AmeriGas Partners | | | | | | | | |
5.625% 5/20/24 | | | 695,000 | | | | 660,250 | |
5.875% 8/20/26 | | | 1,205,000 | | | | 1,105,588 | |
Cheniere Corpus Christi Holdings 7.00% 6/30/24 | | | 1,235,000 | | | | 1,306,013 | |
Cheniere Energy Partners 5.25% 10/1/25 | | | 1,580,000 | | | | 1,479,275 | |
Chesapeake Energy | | | | | | | | |
7.00% 10/1/24 | | | 480,000 | | | | 417,600 | |
8.00% 1/15/25 | | | 1,215,000 | | | | 1,078,313 | |
Crestwood Midstream Partners 5.75% 4/1/25 | | | 1,545,000 | | | | 1,440,713 | |
Diamond Offshore Drilling 7.875% 8/15/25 | | | 1,765,000 | | | | 1,473,775 | |
High Yield Series-7
Delaware VIP®High Yield Series
Schedule of investments (continued)
| | | | | | | | |
| | | Principal
amount° | | | Value (US $) | |
|
Corporate Bonds (continued) | |
Energy (continued) | |
Ensco 7.75% 2/1/26 | | | 1,890,000 | | | $ | 1,408,050 | |
Genesis Energy 6.50% 10/1/25 | | | 2,115,000 | | | | 1,871,775 | |
Gulfport Energy | | | | | | | | |
6.375% 5/15/25 | | | 610,000 | | | | 542,137 | |
6.375% 1/15/26 | | | 1,470,000 | | | | 1,275,225 | |
Laredo Petroleum 6.25% 3/15/23 | | | 2,420,000 | | | | 2,184,050 | |
Murphy Oil 6.875% 8/15/24 | | | 2,335,000 | | | | 2,328,059 | |
Murphy Oil USA 5.625% 5/1/27 | | | 1,600,000 | | | | 1,544,000 | |
Nine Energy Service 144A 8.75% 11/1/23 # | | | 630,000 | | | | 601,650 | |
Oasis Petroleum 144A 6.25% 5/1/26 # | | | 1,320,000 | | | | 1,112,100 | |
Precision Drilling 144A 7.125% 1/15/26 # | | | 1,895,000 | | | | 1,639,175 | |
SESI 7.75% 9/15/24 | | | 610,000 | | | | 488,000 | |
Southwestern Energy 7.75% 10/1/27 | | | 2,215,000 | | | | 2,115,325 | |
Summit Midstream Holdings 5.75% 4/15/25 | | | 1,125,000 | | | | 1,040,625 | |
Targa Resources Partners | | | | | | | | |
5.375% 2/1/27 | | | 1,345,000 | | | | 1,267,663 | |
144A 5.875% 4/15/26 # | | | 975,000 | | | | 953,063 | |
Transocean 144A 9.00% 7/15/23 # | | | 1,560,000 | | | | 1,558,050 | |
Whiting Petroleum 6.625% 1/15/26 | | | 2,890,000 | | | | 2,492,625 | |
| | | | | | | | |
| | | | | | | 35,279,974 | |
| | | | | | | | |
Healthcare – 11.75% | |
Air Medical Group Holdings 144A 6.375% 5/15/23 # | | | 1,286,000 | | | | 1,093,100 | |
Bausch Health 144A 5.50% 11/1/25 # | | | 1,110,000 | | | | 1,039,237 | |
Charles River Laboratories International 144A 5.50% 4/1/26 # | | | 2,489,000 | | | | 2,457,887 | |
Encompass Health | | | | | | | | |
5.75% 11/1/24 | | | 790,000 | | | | 785,063 | |
5.75% 9/15/25 | | | 1,335,000 | | | | 1,308,300 | |
Hadrian Merger 144A 8.50% 5/1/26 # | | | 1,150,000 | | | | 1,037,875 | |
HCA | | | | | | | | |
5.375% 2/1/25 | | | 1,140,000 | | | | 1,114,350 | |
5.875% 2/15/26 | | | 1,425,000 | | | | 1,421,437 | |
7.58% 9/15/25 | | | 580,000 | | | | 617,700 | |
Hill-Rom Holdings | | | | | | | | |
144A 5.00% 2/15/25 # | | | 535,000 | | | | 510,925 | |
144A 5.75% 9/1/23 # | | | 860,000 | | | | 863,225 | |
MPH Acquisition Holdings 144A 7.125% 6/1/24 # | | | 1,735,000 | | | | 1,622,225 | |
Polaris Intermediate 144A PIK 8.50% 12/1/22#T | | | 610,000 | | | | 558,681 | |
Surgery Center Holdings | | | | | | | | |
144A 6.75% 7/1/25 # | | | 1,010,000 | | | | 863,550 | |
144A 8.875% 4/15/21 # | | | 1,840,000 | | | | 1,844,600 | |
| | | | | | | | |
| | | Principal
amount° | | | Value (US $) | |
|
Corporate Bonds (continued) | |
Healthcare (continued) | |
Tenet Healthcare | | | | | | | | |
5.125% 5/1/25 | | | 610,000 | | | $ | 570,350 | |
8.125% 4/1/22 | | | 2,035,000 | | | | 2,047,719 | |
Teva Pharmaceutical Finance Netherlands III 6.00% 4/15/24 | | | 1,870,000 | | | | 1,805,764 | |
WellCare Health Plans 144A 5.375% 8/15/26 # | | | 1,285,000 | | | | 1,243,237 | |
| | | | | | | | |
| | | | | | | 22,805,225 | |
| | | | | | | | |
Insurance – 4.70% | |
Acrisure 144A 7.00% 11/15/25 # | | | 610,000 | | | | 523,075 | |
AssuredPartners 144A 7.00% 8/15/25 # | | | 2,230,000 | | | | 2,021,004 | |
HUB International 144A 7.00% 5/1/26 # | | | 2,545,000 | | | | 2,315,950 | |
NFP 144A 6.875% 7/15/25 # | | | 2,425,000 | | | | 2,182,500 | |
USIS Merger Sub 144A 6.875% 5/1/25 # | | | 2,260,000 | | | | 2,082,500 | |
| | | | | | | | |
| | | | | | | 9,125,029 | |
| | | | | | | | |
Media – 9.57% | |
Altice Luxembourg 144A 7.75% 5/15/22 # | | | 2,595,000 | | | | 2,371,181 | |
CCO Holdings | | | | | | | | |
144A 5.50% 5/1/26 # | | | 160,000 | | | | 154,200 | |
144A 5.75% 2/15/26 # | | | 2,065,000 | | | | 2,028,863 | |
144A 5.875% 5/1/27 # | | | 2,010,000 | | | | 1,954,725 | |
CSC Holdings | | | | | | | | |
6.75% 11/15/21 | | | 1,740,000 | | | | 1,787,850 | |
144A 7.50% 4/1/28 # | | | 945,000 | | | | 947,363 | |
144A 7.75% 7/15/25 # | | | 530,000 | | | | 540,600 | |
Gray Escrow 144A 7.00% 5/15/27 # | | | 1,195,000 | | | | 1,168,017 | |
Gray Television 144A 5.875% 7/15/26 # | | | 1,035,000 | | | | 967,518 | |
Radiate Holdco 144A 6.625% 2/15/25 # | | | 1,380,000 | | | | 1,197,150 | |
Sirius XM Radio 144A 5.375% 4/15/25 # | | | 2,050,000 | | | | 1,950,063 | |
Virgin Media Secured Finance 144A 5.25% 1/15/26 # | | | 2,525,000 | | | | 2,323,000 | |
VTR Finance 144A 6.875% 1/15/24 # | | | 1,170,000 | | | | 1,174,387 | |
| | | | | | | | |
| | | | | | | 18,564,917 | |
| | | | | | | | |
Services – 5.52% | |
Advanced Disposal Services 144A 5.625% 11/15/24 # | | | 1,245,000 | | | | 1,223,213 | |
Ashtead Capital 144A 5.25% 8/1/26 # | | | 1,020,000 | | | | 989,400 | |
Avis Budget Car Rental 144A 6.375% 4/1/24 # | | | 900,000 | | | | 864,000 | |
Covanta Holding 5.875% 7/1/25 | | | 735,000 | | | | 678,956 | |
GEO Group | | | | | | | | |
5.875% 10/15/24 | | | 210,000 | | | | 186,375 | |
6.00% 4/15/26 | | | 1,005,000 | | | | 885,656 | |
Iron Mountain US Holdings 144A 5.375% 6/1/26 # | | | 1,235,000 | | | | 1,130,025 | |
Prime Security Services Borrower 144A 9.25% 5/15/23 # | | | 426,000 | | | | 440,377 | |
TMS International 144A 7.25% 8/15/25 # | | | 870,000 | | | | 815,625 | |
High Yield Series-8
Delaware VIP®High Yield Series
Schedule of investments (continued)
| | | | | | | | |
| | | Principal
amount° | | | Value (US $) | |
|
Corporate Bonds (continued) | |
Services (continued) | |
United Rentals North America | | | | | | | | |
5.50% 5/15/27 | | | 730,000 | | | $ | 678,900 | |
5.875% 9/15/26 | | | 1,025,000 | | | | 969,906 | |
6.50% 12/15/26 | | | 730,000 | | | | 720,875 | |
WeWork 144A 7.875% 5/1/25 # | | | 1,270,000 | | | | 1,133,475 | |
| | | | | | | | |
| | | | | | | 10,716,783 | |
| | | | | | | | |
Technology & Electronics – 4.23% | |
CDK Global 5.875% 6/15/26 | | | 2,215,000 | | | | 2,226,739 | |
CommScope Technologies | | | | | | | | |
144A 5.00% 3/15/27 # | | | 2,307,000 | | | | 1,874,437 | |
144A 6.00% 6/15/25 # | | | 590,000 | | | | 539,850 | |
Genesys Telecommunications Laboratories 144A 10.00% 11/30/24 # | | | 1,285,000 | | | | 1,349,250 | |
Infor Software Parent 144A PIK 7.125% 5/1/21 #T | | | 580,000 | | | | 566,950 | |
RP Crown Parent 144A 7.375% 10/15/24 # | | | 1,638,000 | | | | 1,654,380 | |
| | | | | | | | |
| | | | | | | 8,211,606 | |
| | | | | | | | |
Telecommunications – 5.66% | |
C&W Senior Financing 144A | | | | | | | | |
7.50% 10/15/26 # | | | 1,255,000 | | | | 1,209,506 | |
Level 3 Financing 5.375% 5/1/25 | | | 1,949,000 | | | | 1,832,060 | |
Sprint | | | | | | | | |
7.125% 6/15/24 | | | 1,225,000 | | | | 1,217,111 | |
7.625% 3/1/26 | | | 605,000 | | | | 598,950 | |
7.875% 9/15/23 | | | 1,650,000 | | | | 1,697,437 | |
Sprint Capital 8.75% 3/15/32 | | | 490,000 | | | | 518,175 | |
T-Mobile USA 6.50% 1/15/26 | | | 1,189,000 | | | | 1,215,753 | |
Zayo Group 6.375% 5/15/25 | | | 2,875,000 | | | | 2,684,531 | |
| | | | | | | | |
| | | | | | | 10,973,523 | |
| | | | | | | | |
Transportation – 0.57% | |
DAE Funding 144A 5.75% 11/15/23 # | | | 1,110,000 | | | | 1,101,675 | |
| | | | | | | | |
| | | | | | | 1,101,675 | |
| | | | | | | | |
Utilities – 2.33% | |
Calpine | | | | | | | | |
5.75% 1/15/25 | | | 2,550,000 | | | | 2,339,625 | |
144A 5.875% 1/15/24 # | | | 1,180,000 | | | | 1,159,350 | |
Vistra Operations 144A 5.50% 9/1/26 # | | | 1,065,000 | | | | 1,029,056 | |
| | | | | | | | |
| | | | | | | 4,528,031 | |
| | | | | | | | |
Total Corporate Bonds
(cost $194,309,444) | | | | | | | 180,157,249 | |
| | | | | | | | |
| | | | | | | | |
| | | Principal
amount° | | | Value (US $) | |
|
Loan Agreements – 6.11% | |
AI Ladder Luxembourg Subco Tranche B 1st Lien 7.02% (LIBOR06M + 4.50%) 7/2/25 • | | | 607,058 | | | $ | 602,505 | |
Air Medical Group Holdings Tranche B 1st Lien 0.00% 4/28/22 • X | | | 555,000 | | | | 517,934 | |
Applied Systems 2nd Lien 9.522% (LIBOR01M + 7.00%) 9/19/25 • | | | 2,320,000 | | | | 2,302,600 | |
Blue Ribbon 1st Lien 6.387% (LIBOR01M + 4.00%) 11/13/21 • | | | 675,319 | | | | 625,092 | |
CH Hold 2nd Lien 9.772% (LIBOR01M + 7.25%) 2/1/25 • | | | 340,000 | | | | 338,300 | |
Community Health Systems Tranche H 1st Lien 5.957% (LIBOR03M + 3.25%) 1/27/21 • | | | 1,755,379 | | | | 1,686,481 | |
Frontier Communications Tranche B1 1st Lien 6.28% (LIBOR01M + 3.75%) 6/15/24 • | | | 1,414,860 | | | | 1,314,052 | |
Kronos 2nd Lien 9.25% (LIBOR03M + 8.25%) 11/1/24 • | | | 922,000 | | | | 913,212 | |
Solenis International Tranche B 2nd Lien 11.207% (LIBOR03M + 8.50%) 6/18/24 =• | | | 1,200,000 | | | | 1,140,000 | |
Summit Midstream Partners Holdings Tranche B 1st Lien 8.522% (LIBOR01M + 6.00%) 5/21/22 • | | | 513,967 | | | | 505,829 | |
Vantage Specialty Chemicals 2nd Lien 10.777% (LIBOR03M + 8.25%) 10/26/25 • | | | 570,000 | | | | 562,875 | |
Vantage Specialty Chemicals Tranche B 1st Lien 6.012% (LIBOR02M + 3.50%) 10/28/24 • | | | 613,800 | | | | 595,386 | |
Verscend Holding Tranche B 1st Lien 7.022% (LIBOR01M + 4.50%) 8/27/25 • | | | 596,750 | | | | 578,847 | |
Visual Comfort Group 2nd Lien 10.522% (LIBOR01M + 8.00%) 2/28/25 =• | | | 180,143 | | | | 180,764 | |
| | | | | | | | |
Total Loan Agreements
(cost $12,208,144) | | | | | | | 11,863,877 | |
| | | | | | | | |
| | | Number of
shares | | | | |
Common Stock – 0.00% | |
Century Communications =† | | | 2,820,000 | | | | 0 | |
| | | | | | | | |
Total Common Stock
(cost $85,371) | | | | | | | 0 | |
| | | | | | | | |
| | | | |
Total Value of Securities – 98.95% | | | | |
(cost $206,602,959) | | $ | 192,021,126 | |
| | | | |
# Security exempt from registration under Rule 144A of the Securities Act of 1933, as amended. At Dec. 31, 2018, the aggregate value of Rule 144A securities was $97,961,452, which represents 50.48% of the Fund’s net assets. See Note 9 in “Notes to financial statements.”
❆ PIK. 100% of the income received was in the form of cash.
High Yield Series-9
Delaware VIP®High Yield Series
Schedule of investments (continued)
| = | The value of this security was determined using significant unobservable inputs and is reported as a Level 3 security in the disclosure table located in Note 3 in “Notes to financial statements.” |
| ° | Principal amount shown is stated in USD unless noted that the security is denominated in another currency. |
| µ | Fixed to variable rate investment. The rate shown reflects the fixed rate in effect at Dec. 31, 2018. Rate will reset at a future date. |
| y | No contractual maturity date. |
| † | Non-income producing security. |
| • | Variable rate investment. Rates reset periodically. Rate shown reflects the rate in effect at Dec. 31, 2018. For securities based on a published reference rate and spread, the reference rate and spread are indicated in their description above. The reference rate descriptions (i.e. LIBOR03M, LIBOR06M, etc.) used in this report are identical for different securities, but the underlying reference rates may differ due to the timing of the reset period. Certain variable rate securities are not based on a published reference rate and spread but are determined by the issuer or agent and are based on current market conditions, or for mortgage-backed securities, are impacted by the individual mortgages which are paying off over time. These securities do not indicate a reference rate and spread in their description above. |
| X | This loan will settle after Dec. 31, 2018, at which time the interest rate, based on the LIBOR and the agreed upon spread on trade date, will be reflected. |
Summary of abbreviations:
ICE – Intercontinental Exchange
LIBOR – London Interbank Offered Rate
LIBOR01M – ICE LIBOR USD 1 Month
LIBOR02M – ICE LIBOR USD 2 Month
LIBOR03M – ICE LIBOR USD 3 Month
LIBOR06M – ICE LIBOR USD 6 Month
PIK –Payment-in-kind
USD – US dollar
See accompanying notes, which are an integral part of the financial statements.
High Yield Series-10
| | | | |
| Delaware VIP®Trust — Delaware VIP High Yield Series | | | | |
| Statement of assets and liabilities | | | December 31, 2018 | |
| | | | |
| |
Assets: | | | | |
Investments, at value1 | | $ | 192,021,126 | |
Cash | | | 780,002 | |
Dividend and interest receivable | | | 3,308,159 | |
Receivable for securities sold | | | 2,091,412 | |
Other assets2 | | | 920,913 | |
Receivable for series shares sold | | | 23,473 | |
| | | | |
Total assets | | | 199,145,085 | |
| | | | |
| |
Liabilities: | | | | |
Contingent liabilities2 | | | 3,069,708 | |
Payable for securities purchased | | | 1,677,756 | |
Payable for series shares redeemed | | | 144,951 | |
Investment management fees payable to affiliates | | | 112,299 | |
Other accrued expenses | | | 45,948 | |
Distribution fees payable to affiliates | | | 31,806 | |
Audit and tax fees payable | | | 4,450 | |
Dividend disbursing and transfer agent fees and expenses payable to affiliates | | | 1,327 | |
Accounting and administration expenses payable to affiliates | | | 1,025 | |
Trustees’ fees and expenses payable | | | 534 | |
Legal fees payable to affiliates | | | 370 | |
Reports and statements to shareholders expenses payable to affiliates | | | 144 | |
| | | | |
Total liabilities | | | 5,090,318 | |
| | | | |
Total Net Assets | | $ | 194,054,767 | |
| | | | |
| |
Net Assets Consist of: | | | | |
Paid-in capital | | $ | 229,246,903 | |
Total distributable earnings (loss) | | | (35,192,136 | ) |
| | | | |
Total Net Assets | | $ | 194,054,767 | |
| | | | |
| |
Net Asset Value: | | | | |
Standard Class: | | | | |
Net assets | | $ | 75,568,094 | |
Shares of beneficial interest outstanding, unlimited authorization, no par | | | 16,179,512 | |
Net asset value per share | | $ | 4.67 | |
| |
Service Class: | | | | |
Net assets | | $ | 118,486,673 | |
Shares of beneficial interest outstanding, unlimited authorization, no par | | | 25,479,883 | |
Net asset value per share | | $ | 4.65 | |
| | | | |
1Investments, at cost | | $ | 206,602,959 | |
2See Note 11 in “Notes to financial statements.” | | | | |
See accompanying notes, which are an integral part of the financial statements.
High YieldSeries-11
Delaware VIP®Trust —
Delaware VIP High Yield Series
Statement of operations
Year ended December 31, 2018
| | | | |
Investment Income: | |
Interest | | $ | 14,916,909 | |
Dividends | | | 29,202 | |
| | | | |
| | | 14,946,111 | |
| | | | |
Expenses: | | | | |
Management fees | | | 1,530,332 | |
Distribution expenses – Service Class | | | 418,999 | |
Accounting and administration expenses | | | 75,942 | |
Reports and statements to shareholders expenses | | | 51,973 | |
Audit and tax fees | | | 41,768 | |
Dividend disbursing and transfer agent fees and expenses | | | 19,781 | |
Legal fees | | | 12,667 | |
Trustees’ fees and expenses | | | 11,313 | |
Custodian fees | | | 9,005 | |
Registration fees | | | 245 | |
Other | | | 20,583 | |
| | | | |
| | | 2,192,608 | |
Less expenses waived | | | (4,264 | ) |
Less waived distribution expenses – Service Class | | | (24,082 | ) |
Less expenses paid indirectly | | | (2,228 | ) |
| | | | |
Total operating expenses | | | 2,162,034 | |
| | | | |
Net Investment Income | | | 12,784,077 | |
| | | | |
| | | | |
Net Realized and Unrealized Loss: | | | | |
Net realized loss on investments | | | (2,031,094 | ) |
Net change in unrealized appreciation (depreciation) of investments | | | (21,186,613 | ) |
| | | | |
Net Realized and Unrealized Loss | | | (23,217,707 | ) |
| | | | |
Net Decrease in Net Assets Resulting from Operations | | $ | (10,433,630 | ) |
| | | | |
Delaware VIP Trust —
Delaware VIP High Yield Series
Statements of changes in net assets
| | | | | | | | |
| | | Year ended | |
| | | 12/31/18 | | | 12/31/17 | |
Increase (Decrease) in
Net Assets from Operations: | |
Net investment income | | $ | 12,784,077 | | | $ | 13,979,544 | |
Net realized gain (loss) | | | (2,031,094 | ) | | | 6,015,882 | |
Net change in unrealized appreciation (depreciation) | | | (21,186,613 | ) | | | (856,110 | ) |
| | | | | | | | |
Net increase (decrease) in net assets resulting from operations | | | (10,433,630 | ) | | | 19,139,316 | |
| | | | | | | | |
|
Dividends and Distributions
to Shareholders from: | |
Distributable earnings*: | | | | | | | | |
Standard Class | | | (5,963,938 | ) | | | (6,549,527 | ) |
Service Class | | | (8,454,447 | ) | | | (9,180,849 | ) |
| | | | | | | | |
| | | (14,418,385 | ) | | | (15,730,376 | ) |
| | | | | | | | |
|
Capital Share Transactions: | |
Proceeds from shares sold: | | | | | | | | |
Standard Class | | | 15,912,072 | | | | 10,888,207 | |
Service Class | | | 16,527,138 | | | | 5,659,487 | |
Net asset value of shares issued upon reinvestment of dividends and distributions: | | | | | | | | |
Standard Class | | | 5,963,938 | | | | 6,549,527 | |
Service Class | | | 8,454,447 | | | | 9,180,849 | |
| | | | | | | | |
| | | 46,857,595 | | | | 32,278,070 | |
| | | | | | | | |
Cost of shares redeemed: | | | | | | | | |
Standard Class | | | (38,683,697 | ) | | | (29,111,594 | ) |
Service Class | | | (41,242,107 | ) | | | (28,045,480 | ) |
| | | | | | | | |
| | | (79,925,804 | ) | | | (57,157,074 | ) |
| | | | | | | | |
Decrease in net assets derived from capital share transactions | | | (33,068,209 | ) | | | (24,879,004 | ) |
| | | | | | | | |
Net Decrease in Net Assets | | | (57,920,224 | ) | | | (21,470,064 | ) |
|
Net Assets: | |
Beginning of year | | | 251,974,991 | | | | 273,445,055 | |
| | | | | | | | |
End of year1 | | $ | 194,054,767 | | | $ | 251,974,991 | |
| | | | | | | | |
| 1 | Net Assets – End of year includes undistributed net investment income of $14,407,921 in 2017. The Securities and Exchange Commission eliminated the requirement to disclose undistributed (distributions in excess of) net investment income in 2018. |
| * | For the year ended Nov. 30, 2018, the Fund has adopted amendments to RegulationS-X (see Note 12 in “Notes to financial statements”). For the year ended Nov. 30, 2017, the dividends and distributions to shareholders were as follows: |
| | | | | | | | |
| | | Standard Class | | | Service Class | |
Dividends from net investment income | | $ | (6,549,527) | | | $ | (9,180,849) | |
See accompanying notes, which are an integral part of the financial statements.
High Yield Series-12
Delaware VIP®Trust — Delaware VIP High Yield Series
Financial highlights
Selected data for each share of the Series outstanding throughout each period were as follows:
| | | | | | | | | | | | | | | | | | | | |
| | | Delaware VIP High Yield Series Standard Class
Year ended | |
| | | 12/31/18 | | | 12/31/17 | | | 12/31/16 | | | 12/31/15 | | | 12/31/14 | |
Net asset value, beginning of period | | $ | 5.20 | | | $ | 5.14 | | | $ | 4.89 | | | $ | 5.67 | | | $ | 6.19 | |
| | | | | |
Income (loss) from investment operations: | | | | | | | | | | | | | | | | | | | | |
Net investment income1 | | | 0.28 | | | | 0.28 | | | | 0.29 | | | | 0.34 | | | | 0.34 | |
Net realized and unrealized gain (loss) | | | (0.50 | ) | | | 0.09 | | | | 0.32 | | | | (0.67 | ) | | | (0.34 | ) |
| | | | | | | | | | | | | | | | | | | | |
Total from investment operations | | | (0.22 | ) | | | 0.37 | | | | 0.61 | | | | (0.33 | ) | | | — | |
| | | | | | | | | | | | | | | | | | | | |
|
Less dividends and distributions from: | |
Net investment income | | | (0.31 | ) | | | (0.31 | ) | | | (0.36 | ) | | | (0.37 | ) | | | (0.42 | ) |
Net realized gain | | | — | | | | — | | | | — | | | | (0.08 | ) | | | (0.10 | ) |
| | | | | | | | | | | | | | | | | | | | |
Total dividends and distributions | | | (0.31 | ) | | | (0.31 | ) | | | (0.36 | ) | | | (0.45 | ) | | | (0.52 | ) |
| | | | | | | | | | | | | | | | | | | | |
| | | | | |
Net asset value, end of period | | $ | 4.67 | | | $ | 5.20 | | | $ | 5.14 | | | $ | 4.89 | | | $ | 5.67 | |
| | | | | | | | | | | | | | | | | | | | |
| | | | | |
Total return2 | | | (4.47% | ) | | | 7.49% | | | | 13.16% | | | | (6.60% | ) | | | (0.29% | ) |
|
Ratios and supplemental data: | |
Net assets, end of period (000 omitted) | | $ | 75,568 | | | $ | 102,359 | | | $ | 112,614 | | | $ | 111,748 | | | $ | 139,666 | |
Ratio of expenses to average net assets | | | 0.75% | | | | 0.75% | | | | 0.74% | | | | 0.75% | | | | 0.75% | |
Ratio of expenses to average net assets
prior to fees waived | | | 0.75% | | | | 0.75% | | | | 0.75% | | | | 0.76% | | | | 0.75% | |
Ratio of net investment income to average net assets | | | 5.60% | | | | 5.35% | | | | 5.95% | | | | 6.25% | | | | 5.67% | |
Ratio of net investment income to average net assets
prior to fees waived | | | 5.60% | | | | 5.35% | | | | 5.94% | | | | 6.24% | | | | 5.67% | |
Portfolio turnover | | | 96% | | | | 86% | | | | 112% | | | | 99% | | | | 103% | |
| 1 | The average shares outstanding method has been applied for per share information. |
| 2 | Total return is based on the change in net asset value of a share during the period and assumes reinvestment of dividends and distributions at net asset value. Total return during some of the periods shown reflects a waiver by the manager. Performance would have been lower had the waiver not been in effect. Total return does not include fees, charges, or expenses imposed by the variable annuity and life insurance contracts for which Delaware VIP Trust serves as an underlying investment vehicle. |
See accompanying notes, which are an integral part of the financial statements.
High Yield Series-13
Delaware VIP®High Yield Series
Financial highlights (continued)
Selected data for each share of the Series outstanding throughout each period were as follows:
| | | | | | | | | | | | | | | | | | | | |
| | | Delaware VIP High Yield Series Service Class Year ended | |
| | | 12/31/18 | | | 12/31/17 | | | 12/31/16 | | | 12/31/15 | | | 12/31/14 | |
Net asset value, beginning of period | | $ | 5.18 | | | $ | 5.12 | | | $ | 4.87 | | | $ | 5.65 | | | $ | 6.17 | |
|
Income (loss) from investment operations: | |
Net investment income1 | | | 0.26 | | | | 0.26 | | | | 0.28 | | | | 0.32 | | | | 0.33 | |
Net realized and unrealized gain (loss) | | | (0.49 | ) | | | 0.10 | | | | 0.32 | | | | (0.66 | ) | | | (0.34 | ) |
| | | | | | | | | | | | | | | | | | | | |
Total from investment operations | | | (0.23 | ) | | | 0.36 | | | | 0.60 | | | | (0.34 | ) | | | (0.01 | ) |
| | | | | | | | | | | | | | | | | | | | |
|
Less dividends and distributions from: | |
Net investment income | | | (0.30 | ) | | | (0.30 | ) | | | (0.35 | ) | | | (0.36 | ) | | | (0.41 | ) |
Net realized gain | | | — | | | | — | | | | — | | | | (0.08 | ) | | | (0.10 | ) |
| | | | | | | | | | | | | | | | | | | | |
Total dividends and distributions | | | (0.30 | ) | | | (0.30 | ) | | | (0.35 | ) | | | (0.44) | | | | (0.51 | ) |
| | | | | | | | | | | | | | | | | | | | |
| | | | | |
Net asset value, end of period | | $ | 4.65 | | | $ | 5.18 | | | $ | 5.12 | | | $ | 4.87 | | | $ | 5.65 | |
| | | | | | | | | | | | | | | | | | | | |
| | | | | |
Total return2 | | | (4.76% | ) | | | 7.26% | | | | 12.91% | | | | (6.87% | ) | | | (0.54% | ) |
|
Ratios and supplemental data: | |
Net assets, end of period (000 omitted) | | $ | 118,487 | | | $ | 149,616 | | | $ | 160,831 | | | $ | 162,513 | | | $ | 208,177 | |
Ratio of expenses to average net assets | | | 1.03% | | | | 1.00% | | | | 0.99% | | | | 1.00% | | | | 1.00% | |
Ratio of expenses to average net assets
prior to fees waived | | | 1.05% | | | | 1.05% | | | | 1.05% | | | | 1.06% | | | | 1.05% | |
Ratio of net investment income to average net assets | | | 5.32% | | | | 5.10% | | | | 5.70% | | | | 6.00% | | | | 5.42% | |
Ratio of net investment income to average net assets
prior to fees waived | | | 5.30% | | | | 5.05% | | | | 5.64% | | | | 5.94% | | | | 5.37% | |
Portfolio turnover | | | 96% | | | | 86% | | | | 112% | | | | 99% | | | | 103% | |
| 1 | The average shares outstanding method has been applied for per share information. |
| 2 | Total return is based on the change in net asset value of a share during the period and assumes reinvestment of dividends and distributions at net asset value. Total return during all of the periods shown reflects waivers by the manager and/or distributor. Performance would have been lower had the waivers not been in effect. Total return does not include fees, charges, or expenses imposed by the variable annuity and life insurance contracts for which Delaware VIP Trust serves as an underlying investment vehicle. |
See accompanying notes, which are an integral part of the financial statements.
High Yield Series-14
Delaware VIP®Trust — Delaware VIP High Yield Series
Notes to financial statements
December 31, 2018
Delaware VIP Trust (Trust) is organized as a Delaware statutory trust and offers 10 series: Delaware VIP Diversified Income Series, Delaware VIP Emerging Markets Series, Delaware VIP High Yield Series, Delaware VIP International Value Equity Series, Delaware VIP Limited-Term Diversified Income Series, Delaware VIP REIT Series, Delaware VIP Small Cap Value Series, Delaware VIP Smid Cap Core Series, Delaware VIP U.S. Growth Series, and Delaware VIP Value Series. These financial statements and the related notes pertain to Delaware VIP High Yield Series (Series). The Trust is anopen-end investment company. The Series is considered diversified under the Investment Company Act of 1940, as amended (1940 Act), and offers Standard Class and Service Class shares. The Standard Class shares do not carry a distribution and service(12b-1) fee and the Service Class shares carry a12b-1 fee. The shares of the Series are sold only to separate accounts of life insurance companies.
The investment objective of the Series is to seek total return and, as a secondary objective, high current income.
1. Significant Accounting Policies
The Series is an investment company and follows accounting and reporting guidance under Financial Accounting Standards Board (FASB) Accounting Standards Codification Topic 946, Financial Services - Investment Companies. The following accounting policies are in accordance with US generally accepted accounting principles (US GAAP) and are consistently followed by the Series.
Security Valuation– Equity securities, except those traded on the Nasdaq Stock Market LLC (Nasdaq), are valued at the last quoted sales price as of the time of the regular close of the New York Stock Exchange on the valuation date. Equity securities traded on the Nasdaq are valued in accordance with the Nasdaq Official Closing Price, which may not be the last sales price. If, on a particular day, an equity security does not trade, the mean between the bid and ask prices will be used, which approximates fair value. US government and agency securities are valued at the mean between the bid and ask prices, which approximates fair value. Other debt securities are valued based upon valuations provided by an independent pricing service or broker and reviewed by management. To the extent current market prices are not available, the pricing service may take into account developments related to the specific security, as well as transactions in comparable securities. Valuations for fixed income securities utilize matrix systems, which reflect such factors as security prices, yields, maturities, and ratings, and are supplemented by dealer and exchange quotations. Investments in repurchase agreements are generally valued at par, which approximates fair value, each business day. Generally, other securities and assets for which market quotations are not readily available are valued at fair value as determined in good faith under the direction of the Trust’s Board of Trustees (Board). In determining whether market quotations are readily available or fair valuation will be used, various factors will be taken into consideration, such as market closures or suspension of trading in a security. Restricted securities are valued at fair value using methods approved by the Board.
Federal Income Taxes– No provision for federal income taxes has been made as the Series intends to continue to qualify for federal income tax purposes as a regulated investment company under Subchapter M of the Internal Revenue Code of 1986, as amended, and make the requisite distributions to shareholders. The Series evaluates tax positions taken or expected to be taken in the course of preparing the Series’ tax returns to determine whether the tax positions are“more-likely-than-not” of being sustained by the applicable tax authority. Tax positions not deemed to meet the“more-likely-than-not” threshold are recorded as a tax benefit or expense in the current year. Management has analyzed the Series’ tax positions taken or expected to be taken on the Series’ federal income tax returns through the year ended Dec. 31, 2018 and for all open tax years (years ended Dec. 31, 2015–Dec. 31, 2017), and has concluded that no provision for federal income tax is required in the Series’ financial statements. If applicable, the Series recognizes interest accrued on unrecognized tax benefits in interest expense and penalties in other expenses on the “Statement of operations.” During the year ended Dec. 31, 2018, the Series did not incur any interest or tax penalties.
Class Accounting– Investment income, common expenses, and realized and unrealized gain (loss) on investments are allocated to the classes of the Series on the basis of daily net assets of each class. Distribution expenses relating to a specific class are charged directly to that class.
Repurchase Agreements– The Series may purchase certain US government securities subject to the counterparty’s agreement to repurchase them at an agreed upon date and price. The counterparty will be required on a daily basis to maintain the value of the collateral subject to the agreement at not less than the repurchase price (including accrued interest). The agreements are conditioned upon the collateral being deposited under the Federal Reserve book-entry system with the Series’ custodian or a third-partysub-custodian. In the event of default or bankruptcy by the other party to the agreement, retention of the collateral may be subject to legal proceedings. At Dec. 31, 2018, the Series held no investments in repurchase agreements.
Use of Estimates– The preparation of financial statements in conformity with US GAAP requires management to make estimates and assumptions that affect the fair value of investments, the reported amounts of assets and liabilities and disclosure of contingent assets and liabilities at the date of the financial statements, and the reported amounts of revenues and expenses during the reporting period. Actual results could differ from those estimates and the differences could be material.
Other– Expenses directly attributable to the Series are charged directly to the Series. Other expenses common to various funds within the Delaware Funds®by Macquarie (Delaware Funds) are generally allocated among such funds on the basis of average net assets. Management fees and certain other expenses are paid monthly. Security transactions are recorded on the date the securities are purchased or sold (trade date) for financial
High Yield Series-15
Delaware VIP®High Yield Series
Notes to financial statements (continued)
1. Significant Accounting Policies (continued)
reporting purposes. Costs used in calculating realized gains and losses on the sale of investment securities are those of the specific securities sold. Dividend income is recorded on theex-dividend date and interest income is recorded on the accrual basis. Discounts and premiums on debt securities are accreted or amortized to interest income, respectively, over the lives of the respective securities using the effective interest method. The Series declares and pays dividends from net investment income and distributions from net realized gain on investments, if any, following the close of the fiscal year. The Series may distribute more frequently, if necessary for tax purposes. Dividends and distributions, if any, are recorded on theex-dividend date.
The Series receives earnings credits from its custodian when positive cash balances are maintained, which may be used to offset custody fees. The expenses paid under this arrangement is included on the “Statement of operations” under “Custodian fees” with the corresponding expenses offset included under “Less expenses paid indirectly.” For the year ended Dec. 31, 2018, the Series earned $2,227 under this arrangement.
The Series receives earnings credits from its transfer agent when positive cash balances are maintained, which may be used to offset transfer agent fees. If the amount earned is greater than $1, the expenses paid under this arrangement is included on the “Statement of operations” under “Dividend disbursing and transfer agent fees and expenses” with the corresponding expenses offset included under “Less expenses paid indirectly.” For the year ended Dec. 31, 2018, the Series earned $1 under this arrangement.
2. Investment Management, Administration Agreements, and Other Transactions with Affiliates
In accordance with the terms of its investment management agreement, the Series pays Delaware Management Company (DMC), a series of Macquarie Investment Management Business Trust and the investment manager, an annual fee which is calculated daily and paid monthly at the rate of 0.65% on the first $500 million of average daily net assets of the Series, 0.60% on the next $500 million, 0.55% on the next $1.5 billion, and 0.50% on average daily net assets in excess of $2.5 billion.
DMC has contractually agreed to waive all or a portion of its investment advisory fees and/or pay/reimburse expenses (excluding any12b-1 fee, acquired fund fees and expenses, taxes, interest, short sale and dividend interest expenses, brokerage fees, certain insurance costs, and nonroutine expenses or costs, including, but not limited to, those relating to reorganizations, litigation, conducting shareholder meetings, and liquidations) in order to prevent annual series operating expenses from exceeding 0.75% of the Series’ average daily net assets from Jan. 1, 2018 through Dec. 31, 2018.* The waiver and reimbursement are accrued daily and received monthly. This waiver and reimbursement may only be terminated by agreement of DMC and the Series.
Delaware Investments Fund Services Company (DIFSC), an affiliate of DMC, provides fund accounting and financial administration oversight services to the Series. For these services, DIFSC’s fees are calculated daily and paid monthly based on the aggregate daily net assets of all funds within the Delaware Funds at the following annual rate: 0.00475% of the first $35 billion; 0.0040% of the next $10 billion; and 0.0025% of aggregate average daily net assets in excess of $45 billion (Total Fee). Each fund in the Delaware Funds pays a minimum of $4,000, which, in aggregate, is subtracted from the Total Fee. Each fund then pays its portion of the remainder of the Total Fee on a relative net asset value (NAV) basis. This amount is included on the “Statement of operations” under “Accounting and administration expenses.” For the year ended Dec. 31, 2018, the Series was charged $12,892 for these services.
DIFSC is also the transfer agent and dividend disbursing agent of the Series. For these services, DIFSC’s fees are calculated daily and paid monthly at the annual rate of 0.0075% of the Series’ average daily net assets. This amount is included on the “Statement of operations” under “Dividend disbursing and transfer agent fees and expenses.” For the year ended Dec. 31, 2018, the Series was charged $17,658 for these services. Pursuant to asub-transfer agency agreement between DIFSC and BNY Mellon Investment Servicing (US) Inc. (BNYMIS), BNYMIS provides certainsub-transfer agency services to the Series.Sub-transfer agency fees are paid by the Series and are also included on the “Statement of operations” under “Dividend disbursing and transfer agent fees and expenses.”
Pursuant to a distribution agreement and distribution plan, the Series pays Delaware Distributors, L.P. (DDLP), the distributor and an affiliate of DMC, an annual12b-1 fee of 0.30% of the average daily net assets of the Service Class shares. Prior to May 1, 2018, DDLP had contracted to waive12b-1 fees in order to limit12b-1 fees of the Service Class shares to 0.25% of average daily net assets. The fees are calculated daily and paid monthly. Standard Class shares pay no12b-1 fees.
As provided in the investment management agreement, the Series bears a portion of the cost of certain resources shared with DMC, including the cost of internal personnel of DMC and/or its affiliates that provide legal, tax, and regulatory reporting services to the Series. For the year ended Dec. 31, 2018, the Series was charged $6,997 for internal legal, tax, and regulatory reporting services provided by DMC and/or its affiliates’ employees. This amount is included on the “Statement of operations” under “Legal fees.”
Trustees’ fees include expenses accrued by the Series for each Trustee’s retainer and meeting fees. Certain officers of DMC, DIFSC, and DDLP are officers and/or Trustees of the Trust. These officers and Trustees are paid no compensation by the Series.
Cross trades for the year ended Dec. 31, 2018 were executed by the Series pursuant to procedures adopted by the Board designed to ensure compliance with Rule17a-7 under the 1940 Act. Cross trading is the buying or selling of portfolio securities between funds of investment companies, or between a
High Yield Series-16
Delaware VIP®High Yield Series
Notes to financial statements (continued)
2. Investment Management, Administration Agreements, and Other Transactions with Affiliates (continued)
fund of an investment company and another entity, that are or could be considered affiliates by virtue of having a common investment advisor (or affiliated investment advisors), common directors/trustees and/or common officers. At its regularly scheduled meetings, the Board reviews such transactions for compliance with the procedures adopted by the Board. Pursuant to these procedures, for the year ended Dec. 31, 2018, the Series engaged in Rule17a-7 securities purchases of $864,485 and securities sales of $1,101,315, which resulted in net realized loss of $(4,279).
*The aggregate contractual waiver period covering this report is from May 1, 2017 through May 1, 2019.
3. Investments
For the year ended Dec. 31, 2018, the Series made purchases and sales of investment securities other than short-term investments as follows:
| | | | |
Purchases | | $ | 216,635,967 | |
Sales | | | 243,786,596 | |
The tax cost of investments includes adjustments to net unrealized appreciation (depreciation) which may not necessarily be the final tax cost basis adjustments, but approximate the tax basis unrealized gains and losses that may be realized and distributed to shareholders. At Dec. 31, 2018, the cost and unrealized appreciation (depreciation) of investments for federal income tax purposes for the Series were as follows:
| | | | | | | | | | | | | | | | | | |
Cost of
Investments | | Aggregate
Unrealized
Appreciation
of Investments | | Aggregate
Unrealized
Depreciation
of Investments | | Net Unrealized
Depreciation
of Investments |
| | $ | 207,009,746 | | | | $ | 53,246 | | | | $ | (15,041,866 | ) | | | $ | (14,988,620 | ) |
US GAAP defines fair value as the price that the Series would receive to sell an asset or pay to transfer a liability in an orderly transaction between market participants at the measurement date under current market conditions. A three-level hierarchy for fair value measurements has been established based upon the transparency of inputs to the valuation of an asset or liability. Inputs may be observable or unobservable and refer broadly to the assumptions that market participants would use in pricing the asset or liability. Observable inputs reflect the assumptions market participants would use in pricing the asset or liability based on market data obtained from sources independent of the reporting entity. Unobservable inputs reflect the reporting entity’s own assumptions about the assumptions that market participants would use in pricing the asset or liability based on the best information available under the circumstances. The Series’ investment in its entirety is assigned a level based upon the observability of the inputs which are significant to the overall valuation. The three-level hierarchy of inputs is summarized below.
| | | | |
| Level 1 | | – | | Inputs are quoted prices in active markets for identical investments. (Examples: equity securities,open-end investment companies, futures contracts, exchange-traded options contracts) |
| | |
| Level 2 | | – | | Other observable inputs, including, but not limited to: quoted prices for similar assets or liabilities in markets that are active, quoted prices for identical or similar assets or liabilities in markets that are not active, inputs other than quoted prices that are observable for the assets or liabilities (such as interest rates, yield curves, volatilities, prepayment speeds, loss severities, credit risks, and default rates) or other market-corroborated inputs. (Examples: debt securities, government securities, swap contracts, foreign currency exchange contracts, foreign securities utilizing international fair value pricing, broker-quoted securities, fair valued securities) |
| | |
| Level 3 | | – | | Significant unobservable inputs, including the Series’ own assumptions used to determine the fair value of investments. (Examples: broker-quoted securities, fair valued securities) |
Level 3 investments are valued using significant unobservable inputs. The Series may also use an income-based valuation approach in which the anticipated future cash flows of the investment are discounted to calculate fair value. Discounts may also be applied due to the nature or duration of any restrictions on the disposition of the investments. Valuations may also be based upon current market prices of securities that are comparable in coupon, rating, maturity, and industry. The derived value of a Level 3 investment may not represent the value which is received upon disposition and this could impact the results of operations.
High Yield Series-17
Delaware VIP®High Yield Series
Notes to financial statements (continued)
3. Investments (continued)
The following table summarizes the valuation of the Series’ investments by fair value hierarchy levels as of Dec. 31, 2018:
| | | | | | | | | | | | |
| Securities | | Level 2 | | | Level 3 | | | Total | |
Assets: | | | | | | | | | | | | |
Corporate Debt | | $ | 180,157,249 | | | $ | — | | | $ | 180,157,249 | |
Loan Agreements1 | | | 10,543,113 | | | | 1,320,764 | | | | 11,863,877 | |
Common Stock | | | — | | | | — | | | | — | |
| | | | | | | | | | | | |
Total Value of Securities | | $ | 190,700,362 | | | $ | 1,320,764 | | | $ | 192,021,126 | |
| | | | | | | | | | | | |
1Security type is valued across multiple levels. Level 2 investments represent investments with observable inputs or matrix priced investments and Level 3 investments represent investments without observable inputs. The amount attributed to Level 2 investments and Level 3 investments represents the following percentages of the total market value of these security types:
| | | | | | | | | | | | |
| | | Level 2 | | | Level 3 | | | Total | |
Loan Agreements | | | 88.87 | % | | | 11.13 | % | | | 100.00 | % |
The security that has been valued at zero on the “Schedule of investments” is considered to be a Level 3 investment in this table.
During the year ended Dec. 31, 2018, there were no transfers between Level 1 investments, Level 2 investments, or Level 3 investments that had a significant impact to the Series. The Series’ policy is to recognize transfers between levels based on fair value at the beginning of the reporting period.
A reconciliation of Level 3 investments is presented when the Series has a significant amount of Level 3 investments at the beginning, interim, or end of the year in relation to the Series’ net assets. Management has determined not to provide a reconciliation of Level 3 investments as the Level 3 investments were not considered significant to the Series’ net assets at the beginning, interim, or end of the year. Management has determined not to provide additional disclosure on Level 3 Investments inputs since the Level 3 investments are not considered significant to the Series’ net assets at the end of the year.
4. Dividend and Distribution Information
Income and long-term capital gain distributions are determined in accordance with federal income tax regulations, which may differ from US GAAP. Additionally, distributions from net short-term gains on sales of investment securities are treated as ordinary income for federal income tax purposes. The tax character of dividends and distributions paid during the years ended Dec. 31, 2018 and 2017 was as follows:
| | | | | | | | |
| | | Year ended | |
| | | 12/31/18 | | | 12/31/17 | |
Ordinary Income | | $ | 14,418,385 | | | $ | 15,730,376 | |
5. Components of Net Assets on a Tax Basis
As of Dec. 31, 2018, the components of net assets on a tax basis were as follows:
| | | | |
Shares of beneficial interest | | $ | 229,246,903 | |
Undistributed ordinary income | | | 13,307,614 | |
Troubled debt litigation | | | (2,148,795 | ) |
Capital loss carryforwards | | | (31,362,335 | ) |
Net unrealized depreciation of investments | | | (14,988,620 | ) |
| | | | |
Net assets | | $ | 194,054,767 | |
| | | | |
The differences between book basis and tax basis components of net assets are primarily attributable to tax deferral of losses on wash sales and tax treatment of market discount and premium on debt instruments.
High Yield Series-18
Delaware VIP® High Yield Series
Notes to financial statements (continued)
5. Components of Net Assets on a Tax Basis (continued)
At Dec. 31, 2018, capital loss carryforwards available to offset future realized capital gains were as follows:
| | | | | | | | | | |
| Loss carryforward character | |
| No Expiration | |
| Short-term | | | Long-term | | | Total | |
| $ | 12,965,862 | | | $ | 18,396,473 | | | $ | 31,362,335 | |
6. Capital Shares
Transactions in capital shares were as follows:
| | | | | | | | |
| | | Year ended | |
| | | 12/31/18 | | | 12/31/17 | |
Shares sold: | | | | | | | | |
Standard Class | | | 3,232,018 | | | | 2,099,882 | |
Service Class | | | 3,276,383 | | | | 1,099,990 | |
| | |
Shares issued upon reinvestment of dividends and distributions: | | | | | | | | |
Standard Class | | | 1,229,678 | | | | 1,315,166 | |
Service Class | | | 1,746,787 | | | | 1,847,253 | |
| | | | | | | | |
| | | 9,484,866 | | | | 6,362,291 | |
| | | | | | | | |
Shares redeemed: | | | | | | | | |
Standard Class | | | (7,968,834 | ) | | | (5,642,605 | ) |
Service Class | | | (8,437,338 | ) | | | (5,468,226 | ) |
| | | | | | | | |
| | | (16,406,172 | ) | | | (11,110,831 | ) |
| | | | | | | | |
Net decrease | | | (6,921,306 | ) | | | (4,748,540 | ) |
| | | | | | | | |
7. Line of Credit
The Series, along with certain other funds in the Delaware Funds (Participants), was a participant in a revolving line of credit intended to be used for temporary or emergency purposes as an additional source of liquidity to fund redemptions of investor shares. Under the agreement, the Participants were charged an annual commitment fee of 0.15%, which was allocated across the Participants based on a weighted average of the respective net assets of each Participant. The revolving line of credit available was reduced from $155,000,000 to 130,000,0000 on Sept. 6, 2018. The Participants were permitted to borrow up to a maximum ofone-third of their net assets under the agreement. Each Participant was individually, and not jointly, liable for its particular advances, if any, under the line of credit. The line of credit available under the agreement expired on Nov. 5, 2018.
On Nov. 5, 2018, the Participants entered into an amendment to the agreement for a $190,000,000 revolving line of credit. The revolving line of credit available was increased to $220,000,000 on Nov. 29, 2018. The revolving line of credit is to be used as described above and operates in substantially the same manner as the original agreement. The line of credit available under the agreement expires on Nov. 4, 2019.
The Series had no amounts outstanding as of Dec. 31, 2018, or at any time during the period then ended.
8. Securities Lending
The Series, along with other funds in the Delaware Funds, may lend its securities pursuant to a security lending agreement (Lending Agreement) with The Bank of New York Mellon (BNY Mellon). At the time a security is loaned, the borrower must post collateral equal to the required percentage of the market value of the loaned security, including any accrued interest. The required percentage is: (1) 102% with respect to US securities and foreign securities that are denominated and payable in US dollars; and (2) 105% with respect to foreign securities. With respect to each loan, if on any business day the aggregate market value of securities collateral plus cash collateral held is less than the aggregate market value of the securities which are the subject of such loan, the borrower will be notified to provide additional collateral by the end of the following business day, which, together with the collateral already held, will be not less than the applicable initial collateral requirements for such security loan. If the aggregate market value of securities collateral and cash collateral held with respect to a security loan exceeds the applicable initial collateral requirement, upon the request of the borrower, BNY Mellon must return enough collateral to the borrower by the end of the following business day to reduce the value of the remaining collateral to the applicable initial collateral
High Yield Series-19
Delaware VIP®High Yield Series
Notes to financial statements (continued)
8. Securities Lending (continued)
requirement for such security loan. As a result of the foregoing, the value of the collateral held with respect to a loaned security on any particular day may be more or less than the value of the security on loan. The collateral percentage with respect to the market value of the loaned security is determined by the security lending agent.
Cash collateral received by each series of the Trust is generally invested in a series of individual separate accounts, each corresponding to a series. The investment guidelines permit each separate account to hold certain securities that would be considered eligible securities for a money market fund. Cash collateral received is generally invested in government securities; certain obligations issued by government sponsored enterprises; repurchase agreements collateralized by US Treasury securities; obligations issued by the central government of any Organization for Economic Cooperation and Development (OECD) country or its agencies, instrumentalities, or establishments; obligations of supranational organizations; commercial paper, notes, bonds, and other debt obligations; certificates of deposit, time deposits, and other bank obligations; and asset-backed securities. A series can also accept US government securities and letters of credit(non-cash collateral) in connection with securities loans.
In the event of default or bankruptcy by the lending agent, realization and/or retention of the collateral may be subject to legal proceedings. In the event the borrower fails to return loaned securities and the collateral received is insufficient to cover the value of the loaned securities and provided such collateral shortfall is not the result of investment losses, the lending agent has agreed to pay the amount of the shortfall to the Series or, at the discretion of the lending agent, replace the loaned securities. The Series continues to record dividends or interest, as applicable, on the securities loaned and is subject to changes in value of the securities loaned that may occur during the term of the loan. The Series has the right under the Lending Agreement to recover the securities from the borrower on demand. With respect to security loans collateralized bynon-cash collateral, the Series receives loan premiums paid by the borrower. With respect to security loans collateralized by cash collateral, the earnings from the collateral investments are shared among the Series, the security lending agent, and the borrower. The Series records security lending income net of allocations to the security lending agent and the borrower.
The Series may incur investment losses as a result of investing securities lending collateral. This could occur if an investment in the collateral investment account defaulted or became impaired. Under those circumstances, the value of the Series’ cash collateral account may be less than the amount the Series would be required to return to the borrowers of the securities and the Series would be required to make up for this shortfall.
During the year ended Dec. 31, 2018, the Series had no securities out on loan.
9. Credit and Market Risk
When interest rates rise, fixed income securities (i.e., debt obligations) generally will decline in value. These declines in value are greater for fixed income securities with longer maturities or durations.
The Series invests in high yield fixed income securities, which are securities rated lower thanBBB- by Standard & Poor’s Financial Services LLC and lower than Baa3 by Moody’s Investors Service, Inc., or similarly rated by another nationally recognized statistical rating organization. Investments in these higher yielding securities are generally accompanied by a greater degree of credit risk than higher rated securities. Additionally, lower rated securities may be more susceptible to adverse economic and competitive industry conditions than investment grade securities.
The Series invests in certain obligations that may have liquidity protection designed to ensure that the receipt of payments due on the underlying security is timely. Such protection may be provided through guarantees, insurance policies, or letters of credit obtained by the issuer or sponsor through third parties, through various means of structuring the transaction, or through a combination of such approaches. The Series will not pay any additional fees for such credit support, although the existence of credit support may increase the price of the security.
The Series invests in bank loans and other securities that may subject it to direct indebtedness risk, the risk that the Series will not receive payment of principal, interest, and other amounts due in connection with these investments and will depend primarily on the financial condition of the borrower. Loans that are fully secured offer the Series more protection than unsecured loans in the event of nonpayment of scheduled interest or principal, although there is no assurance that the liquidation of collateral from a secured loan would satisfy the corporate borrower’s obligation, or that the collateral can be liquidated. Some loans or claims may be in default at the time of purchase. Certain of the loans and the other direct indebtedness acquired by the Series may involve revolving credit facilities or other standby financing commitments that obligate the Series to pay additional cash on a certain date or on demand. These commitments may require the Series to increase its investment in a company at a time when the Series might not otherwise decide to do so (including at a time when the company’s financial condition makes it unlikely that such amounts will be repaid). To the extent that the Series is committed to advance additional funds, it will at all times hold and maintain cash or other high grade debt obligations in an amount sufficient to meet such commitments. When a loan agreement is purchased, the Series may pay an assignment fee. On an ongoing basis, the Series may receive a commitment fee based on the undrawn portion of the underlying line of credit portion of a loan agreement. Prepayment penalty fees are received upon the prepayment of a loan agreement by a borrower. Prepayment penalty, facility, commitment, consent and amendment fees are recorded to income as earned or paid.
High YieldSeries-20
Delaware VIP®High Yield Series
Notes to financial statements (continued)
9. Credit and Market Risk (continued)
As the Series may be required to rely upon another lending institution to collect and pass on to the Series amounts payable with respect to the loan and to enforce the Series’ rights under the loan and other direct indebtedness, an insolvency, bankruptcy, or reorganization of the lending institution may delay or prevent the Series from receiving such amounts. The highly leveraged nature of many loans may make them especially vulnerable to adverse changes in economic or market conditions. Investments in such loans and other direct indebtedness may involve additional risk to the Series.
The Series may invest up to 15% of its net assets in illiquid securities, which may include securities with contractual restrictions on resale, securities exempt from registration under Rule 144A promulgated under the Securities Act of 1933, as amended, and other securities which may not be readily marketable. The relative illiquidity of these securities may impair the Series from disposing of them in a timely manner and at a fair price when it is necessary or desirable to do so. While maintaining oversight, the Board has delegated to DMC, theday-to-day functions of determining whether individual securities are liquid for purposes of the Series’ limitation on investments in illiquid securities. Securities eligible for resale pursuant to Rule 144A, which are determined to be liquid, are not subject to the Series’ 15% limit on investments in illiquid securities. Rule 144A securities have been identified on the “Schedule of investments.” Restricted securities are valued pursuant to the security valuation procedures described in Note 1.
10. Contractual Obligations
The Series enters into contracts in the normal course of business that contain a variety of indemnifications. The Series’ maximum exposure under these arrangements is unknown. However, the Series has not had prior claims or losses pursuant to these contracts. Management has reviewed the Series’ existing contracts and expects the risk of loss to be remote.
11. General Motors Term Loan Litigation
The Series received notice of a litigation proceeding related to a General Motors Corporation (G.M.) term loan participation previously held by the Series in 2009. Management believes the matter subject to the litigation notice may lead to a recovery from the Series of certain amounts received by the Series because a US Court of Appeals has ruled that the Series and similarly situated investors were unsecured creditors rather than secured lenders of G.M. as a result of an erroneous Uniform Commercial Code filing made by a third party. The Series received the full principal on the loans in 2009 after the G.M. bankruptcy. However, based on the court ruling the estate is seeking to recover such amounts arguing that, as unsecured creditors, the Series (and other similarly situated lenders) should not have received payment in full. Based on currently available information related to the litigation and the Series’ potential exposure, the Series recorded a contingent liability of $3,069,708 and an asset of $920,913 based on the expected recoveries to unsecured creditors as of Dec. 31, 2018 that resulted in a net decrease in the Series’ NAV to reflect this potential recovery.
12. Recent Accounting Pronouncements
In March 2017, the FASB issued an Accounting Standards Update, ASU2017-08, Receivables – Nonrefundable Fees and Other Costs (Subtopic310-20), Premium Amortization on Purchased Callable Debt Securities which amends the amortization period for certain callable debt securities purchased at a premium, shortening such period to the earliest call date. ASU2017-08 does not require any accounting change for debt securities held at a discount; the discount continues to be amortized to maturity. ASU2017-08 is effective for fiscal years, and interim periods within those fiscal years, beginning after Dec. 15, 2018. At this time, management is evaluating the implications of these changes on the financial statements.
In August 2018, the FASB issued an Accounting Standards Update, ASU2018-13, which changes certain fair value measurement disclosure requirements. ASU2018-13, in addition to other modifications and additions, removes the requirement to disclose the amount and reasons for transfers between Level 1 and Level 2 of the fair value hierarchy, the policy for the timing of transfers between levels and the valuation process for Level 3 fair value measurements. ASU2018-13 is effective for fiscal years, and interim periods within those fiscal years, beginning after Dec. 15, 2019. At this time, management is evaluating the implications of these changes on the financial statements.
In August 2018, the Securities and Exchange Commission (SEC) adopted amendments to RegulationS-X to update and simplify the disclosure requirements for registered investment companies by eliminating requirements that are redundant or duplicative of US GAAP requirements or other SEC disclosure requirements. The new amendments require the presentation of the total, rather than the components, of distributable earnings on the “Statement of assets and liabilities” and the total, rather than the components, of dividends from net investment income and distributions from net realized gains on the “Statements of changes in net assets.” The amendments also removed the requirement for the parenthetical disclosure of undistributed net investment income on the “Statements of changes in net assets” and certain tax adjustments that were reflected in the “Notes to financial statements.” All of these have been reflected in the Fund’s financial statements.
High YieldSeries-21
Delaware VIP®High Yield Series
Notes to financial statements (continued)
13. Subsequent Events
Management has determined that no material events or transactions occurred subsequent to Dec. 31, 2018, that would require recognition or disclosure in the Series’ financial statements.
High YieldSeries-22
Delaware VIP®Trust — Delaware VIP High Yield Series
Report of independent registered public accounting firm
To the Board of Trustees of Delaware VIP®Trust and Shareholders of Delaware VIP High Yield Series
Opinion on the Financial Statements
We have audited the accompanying statement of assets and liabilities, including the schedule of investments, of Delaware VIP High Yield Series (one of the series constituting Delaware VIP®Trust, referred to hereafter as the “Series”) as of December 31, 2018, the related statement of operations for the year ended December 31, 2018, the statements of changes in net assets for each of the two years in the period ended December 31, 2018, including the related notes, and the financial highlights for each of the five years in the period ended December 31, 2018 (collectively referred to as the “financial statements”). In our opinion, the financial statements present fairly, in all material respects, the financial position of the Series as of December 31, 2018, the results of its operations for the year then ended, the changes in its net assets for each of the two years in the period ended December 31, 2018 and the financial highlights for each of the five years in the period ended December 31, 2018 in conformity with accounting principles generally accepted in the United States of America.
Basis for Opinion
These financial statements are the responsibility of the Series’ management. Our responsibility is to express an opinion on the Series’ financial statements based on our audits. We are a public accounting firm registered with the Public Company Accounting Oversight Board (United States) (PCAOB) and are required to be independent with respect to the Series in accordance with the U.S. federal securities laws and the applicable rules and regulations of the Securities and Exchange Commission and the PCAOB.
We conducted our audits of these financial statements in accordance with the standards of the PCAOB. Those standards require that we plan and perform the audit to obtain reasonable assurance about whether the financial statements are free of material misstatement, whether due to error or fraud.
Our audits included performing procedures to assess the risks of material misstatement of the financial statements, whether due to error or fraud, and performing procedures that respond to those risks. Such procedures included examining, on a test basis, evidence regarding the amounts and disclosures in the financial statements. Our audits also included evaluating the accounting principles used and significant estimates made by management, as well as evaluating the overall presentation of the financial statements. Our procedures included confirmation of securities owned as of December 31, 2018 by correspondence with the custodian and brokers; when replies were not received from brokers, we performed other auditing procedures. We believe that our audits provide a reasonable basis for our opinion.
/s/PricewaterhouseCoopers LLP
Philadelphia, Pennsylvania
February 14, 2019
We have served as the auditor of one or more investment companies in Delaware Funds®by Macquarie since 2010.
High YieldSeries-23
Delaware VIP®Trust — Delaware VIP High Yield Series
Other Series information (Unaudited)
Board consideration of investment advisory agreement for Delaware VIP High Yield Series
At a meeting held on Aug.15-16, 2018 (the “Annual Meeting”), the Board of Trustees (the “Board”), including a majority of disinterested or independent Trustees, approved the renewal of the Investment Advisory Agreement for Delaware VIP High Yield Series (the “Series”). In making its decision, the Board considered information furnished at regular quarterly Board meetings, including reports detailing Series performance, investment strategies, and expenses, as well as information prepared specifically in connection with the renewal of the Investment Advisory Agreement. Information furnished specifically in connection with the renewal of the Investment Advisory Agreement with Delaware Management Company (“DMC”), a series of Macquarie Investment Management Business Trust (“MIMBT”), included materials provided by DMC and its affiliates (collectively, “Macquarie Investment Management”) concerning, among other things, the nature, extent, and quality of services provided to the Series; the costs of such services to the Series; economies of scale; and the investment manager’s financial condition and profitability. In addition, in connection with the Annual Meeting, materials were provided to the Trustees in May 2018, including reports provided by Broadridge Financial Solutions (“Broadridge”). The Broadridge reports compared the Series’ investment performance and expenses with those of other comparable mutual funds. The Independent Trustees reviewed and discussed the Broadridge reports with independent legal counsel to the Independent Trustees. In addition to the information noted above, the Board also requested and received information regarding DMC’s policy with respect to advisory fee levels and its breakpoint philosophy; the structure of portfolio manager compensation; comparative client fee information; and any constraints or limitations on the availability of securities for certain investment styles, which had in the past year inhibited, or which were likely in the future to inhibit, the investment manager’s ability to invest fully in accordance with Series policies.
In considering information relating to the approval of the Series’ Investment Advisory Agreement, the Independent Trustees received assistance and advice from and met separately with independent legal counsel to the Independent Trustees and also received assistance and advice from an experienced and knowledgeable independent fund consultant, JDL Consultants, LLC (“JDL”). Although the Board gave attention to all information furnished, the following discussion identifies, under separate headings, the primary factors taken into account by the Board during its contract renewal considerations.
Nature, extent, and quality of services.The Board considered the services provided by DMC to the Series and its shareholders. In reviewing the nature, extent, and quality of services, the Board considered reports furnished to it throughout the year, which covered matters such as the relative performance of the Series, compliance of portfolio managers with the investment policies, strategies and restrictions for the Series, compliance by DMC and Delaware Distributors, L.P. (together, “Management”) personnel with the Code of Ethics adopted throughout the Delaware Funds®by Macquarie (the “Delaware Funds”), and adherence to fair value pricing procedures as established by the Board. The Board was pleased with the current staffing of DMC and the emphasis placed on research in the investment process. The Board recognized DMC’s receipt of certain favorable industry distinctions during the past several years. The Board gave favorable consideration to DMC’s efforts to control expenses while maintaining service levels committed to Series matters. The Board as satisfied with the nature, extent, and quality of the overall services provided by DMC.
Investment performance.The Board placed significant emphasis on the investment performance of the Series in view of the importance of investment performance to shareholders. Although the Board considered performance reports and discussions with portfolio managers at Board meetings throughout the year, the Board gave particular weight to the Broadridge reports furnished for the Annual Meeting. The Broadridge reports prepared for the Series showed the investment performance of its Standard Class shares in comparison to a group of similar funds as selected by Broadridge (the “Performance Universe”). A fund with the best performance ranked first, and a fund with the poorest performance ranked last. The highest/best performing 25% of funds in the Performance Universe make up the first quartile; the next 25%, the second quartile; the next 25%, the third quartile; and the poorest/worst performing 25% of funds in the Performance Universe make up the fourth quartile. Comparative annualized performance for the Series was shown for the past1-,3-,5- and10-year periods, as applicable, ended Jan. 31, 2018. The Board’s objective is that the Series’ performance for the1-,3- and5-year periods be at or above the median of its Performance Universe.
The Performance Universe for the Series consisted of the Series and all high yield funds underlying variable insurance products as selected by Broadridge. The Broadridge report comparison showed that the Series’ total return for the1- and10-year periods was in the second quartile of its Performance Universe. The report further showed that the Series’ total return for the3-year and5-year periods was in the fourth quartile of its Performance Universe. The Board observed that the Series’ performance was mixed. In evaluating the Series’ performance, the Board considered the Series’ short-term performance results, which were strong, and consequently, the Board was satisfied with performance.
Comparative expenses.The Board considered expense data for the Delaware Funds. Management provided the Board with information on pricing levels and fee structures for the Series as of its most recently completed fiscal year. The Board also focused on the comparative analysis of effective management fees and total expense ratios of the Series versus effective management fees and expense ratios of a group of similar funds as selected by Broadridge (the “Expense Group”). In reviewing comparative costs, the Series’ contractual management fee and the actual management fee incurred by the Series were compared with the contractual management fees (assuming all funds in the Expense Group were similar in size to the Series) and actual management fees (as reported by each fund) within the Expense Group, taking into account any applicable breakpoints and fee waivers. The Series’ total expenses were also compared with those of its Expense Group. The Broadridge total expenses, for comparative consistency, were shown by Broadridge for Standard Class
High Yield Series-24
Delaware VIP®Trust — Delaware VIP High Yield Series
Other Series information (Unaudited)
Board consideration of investment advisory agreement for Delaware VIP High Yield Series (continued)
shares which do not charge12b-1 andnon-12b-1 service fees. The Board’s objective is for the Series’ total expense ratio to be competitive with those of the peer funds within its Expense Group.
The expense comparisons for the Series showed that the actual management fee was in the quartile with the second lowest expenses of its Expense Group and its total expenses were in the quartile with the second highest expenses of its Expense Group. The Series’ total expenses were not in line with the Board’s objective. In evaluating total expenses, the Board considered various initiatives implemented by Management, such as the negotiation of lower fees for fund accounting, fund accounting oversight and custody services, which had created an opportunity for a further reduction in expenses. The Board was satisfied with Management’s efforts to improve the Series’ total expense ratio and to bring it in line with the Board’s objective.
Management profitability.The Board considered the level of profits realized by DMC in connection with the operation of the Series. In this respect, the Board reviewed the Investment Management Profitability Analysis that addressed the overall profitability of DMC’s business in providing management and other services to each of the individual funds and the Delaware Funds as a whole. Specific attention was given to the methodology used by DMC in allocating costs for the purpose of determining profitability. Management stated that the level of profits of DMC, to a certain extent, reflects recent operational cost savings and efficiencies initiated by DMC. The Board considered DMC’s efforts to improve services provided to Fund shareholders and to meet additional regulatory and compliance requirements resulting from recent industry-wide Securities and Exchange Commission initiatives. The Board also considered the extent to which DMC might derive ancillary benefits from fund operations, including the potential for procuring additional business as a result of the prestige and visibility associated with its role as service provider to the Delaware Funds and the benefits from allocation of fund brokerage to improve trading efficiencies. As part of its work, the Board also reviewed a report prepared by JDL regarding MIMBT profitability as compared to certain peer fund complexes and the Independent Trustees met with JDL personnel to discuss DMC’s profitability in such context. The Board found that the management fees were reasonable in light of the services rendered and the profitability of DMC.
Economies of scale.The Trustees considered whether economies of scale are realized by DMC as the Series’ assets increase and the extent to which any economies of scale are reflected in the level of management fees charged. The Trustees reviewed the Series’ advisory fee pricing and structure approved by the Board and shareholders, which includes breakpoints, and which applies to most funds in the Delaware Funds complex. Breakpoints in the advisory fee occur when the advisory fee rate is reduced on assets in excess of specified levels. Breakpoints result in a lower advisory fee, than would otherwise be the case in the absence of breakpoints, when the asset levels specified in the breakpoints are exceeded. Although, as of March 31, 2018, the Series has not reached a size at which the advantages of any breakpoints in the applicable fee schedule, the Board recognized that the fee was structured so that, if the Series increases sufficiently in size, then economies of scale may be shared.
Board consideration ofsub-advisory agreement for Delaware VIP High Yield Series
At a meeting held on Nov.14-15, 2018, the Board of Trustees of Delaware VIP High Yield Series (the “Series”), including a majority ofnon-interested or independent Trustees (the “Independent Trustees”), approved a newSub-Advisory Agreement between Delaware Management Company (“DMC” or “Management”) and Macquarie Investment Management Austria Kapitalanlage AG (“MIMAK”) for the Series. MIMAK may also be referenced as“sub-advisor” below.
In reaching the decision to approve theSub-Advisory Agreement, the Board considered and reviewed information about MIMAK, including its personnel, operations, and financial condition, which had been provided by MIMAK. The Board also reviewed material furnished by DMC, including: a memorandum from DMC reviewing theSub-Advisory Agreement and the various services proposed to be rendered by MIMAK; information concerning MIMAK’s organizational structure and the experience of its key investment management personnel; copies of MIMAK’s Form ADV, financial statements, compliance policies and procedures, and Codes of Ethics; relevant performance information provided with respect to MIMAK; and a copy of theSub-Advisory Agreement.
In considering such information and materials, the Independent Trustees received assistance and advice from and met separately with independent counsel. The materials prepared by Management in connection with the approval of theSub-Advisory Agreement were sent to the Independent Trustees in advance of the meeting. While attention was given to all information furnished, the following discusses some primary factors relevant to the Board’s decision. This discussion of the information and factors considered by the Board (as well as the discussion above) is not intended to be exhaustive, but rather summarizes certain factors considered by the Board. In view of the wide variety of factors considered, the Board did not, unless otherwise noted, find it practicable to quantify or otherwise assign relative weights to the following factors. In addition, individual Trustees may have assigned different weights to various factors.
Nature, extent, and quality of services.The Board considered the nature, extent, and quality of services that MIMAK would provide as asub-advisor to the Series. The Trustees considered the types of services to be provided by MIMAK in connection with DMC’s management of the Series, and the qualifications and experience of MIMAK’s research team. The Board considered MIMAK’s organization, personnel, and operations.
High YieldSeries-25
Delaware VIP®Trust — Delaware VIP High Yield Series
Other Series information (Unaudited)
Board consideration ofsub-advisory agreement for Delaware VIP High Yield Series (continued)
The Trustees also considered Management’s review and recommendation process with respect to MIMAK, and Management’s favorable assessment as to the nature, extent, and quality of the research services to be provided by MIMAK, as well as MIMAK’s ability to render such services based on its experience, organization and resources, were appropriate for the Series, in light of the Series’ investment objective, strategies, and policies.
In discussing the nature of the services proposed to be provided by MIMAK, several Board members observed that, unlike traditionalsub-advisors, who make the investment-related decisions with respect to thesub-advised portfolio, the relationship contemplated in this case is limited to access to MIMAK’son-the-ground research expertise, perspective, and resources.
Sub-advisory fees.The Board considered that DMC would not pay fees in connection with MIMAK’s services. The Board concluded that, in light of the quality and extent of the services to be provided and the nature of the business relationships between DMC and MIMAK, the proposed fee arrangement was understandable and reasonable.
Investment performance.In evaluating performance, the Board considered that MIMAK would provide investment recommendations and ideas, including with respect to specific securities, but that DMC’s portfolio managers for the Series would retain portfolio management discretion over the Series.
Economies of scale andfall-out benefits.The Board considered whether the proposed fee arrangement would reflect economies of scale for the benefit of Series investors as assets in the Series increased, as applicable. The Board also considered that DMC and its affiliates may benefit by leveraging the global resources of its affiliates.
Tax Information
All disclosures are based on financial information available as of the date of this annual report and, accordingly are subject to change. For any and all items requiring reporting, it is the intention of the Series to report the maximum amount permitted under the Internal Revenue Code and the regulations thereunder.
For the year ended Dec. 31, 2018, the Series reports distributions paid during the year as follows:
|
(A)
Ordinary Income
Distributions
(Tax Basis) |
| 100.00% |
(A) is based on a percentage of the Series’ total distributions.
High YieldSeries-26
Delaware Funds®by Macquarie
BOARD OF TRUSTEES / DIRECTORS AND OFFICERS ADDENDUM
A mutual fund is governed by a Board of Trustees/Directors (“Trustees”), which has oversight responsibility for the management of a fund’s business affairs. Trustees establish procedures and oversee and review the performance of the investment manager, the distributor, and others who perform services for the fund. The independent fund trustees, in particular, are advocates for shareholder interests. Each trustee has served in that capacity since he or she was elected to or appointed to the Board of Trustees, and will continue to serve until his or her retirement or the election of a new trustee in his or her place. The following is a list of the Trustees and Officers with certain background and related information.
| | | | | | | | | | |
| | | | | | | | | Number of | | Other |
| | | | | | | Principal | | Portfolios in Fund | | Directorships |
| Name, | | Position(s) | | | | Occupation(s) | | Complex Overseen | | Held by |
| Address, | | Held with | | Length of Time | | During the | | by Trustee | | Trustee |
| and Birth Date | | Fund(s) | | Served | | Past Five Years | | or Officer | | or Officer |
INTERESTED TRUSTEE | | | | | | | | | | |
Shawn K. Lytle1,3 2005 Market Street Philadelphia, PA 19103 February 1970 | | President, Chief Executive Officer, and Trustee | | President and Chief Executive Officer since August 2015 Trustee since September 2015 | | President — Macquarie Investment Management2(June 2015-Present) Regional Head of Americas — UBS Global Asset Management(April 2010-May 2015) | | 59 | | Trustee — UBS Relationship Funds, SMA Relationship Trust, and UBS Funds (May 2010–April 2015) |
| INDEPENDENT TRUSTEES | | | | | | | | | | |
| | | | | |
Thomas L. Bennett 2005 Market Street Philadelphia, PA 19103 October 1947 | | Chair and Trustee | | Trustee since March 2005 Chair since March 2015 | | Private Investor (March 2004–Present) | | 59 | | None |
Jerome D. Abernathy 2005 Market Street
Philadelphia, PA 19103 July 1959 | | Trustee | | Since January 2019 | | Managing Member, Stonebrook Capital Management, LLC (financial technology: macro factors and databases) (January 1993–Present) | | 59 | | None |
Ann D. Borowiec 2005 Market Street Philadelphia, PA 19103 November 1958 | | Trustee | | Since March 2015 | | Chief Executive Officer, Private Wealth Management (2011–2013) and Market Manager, New Jersey Private Bank (2005–2011) — J.P. Morgan Chase & Co. | | 59 | | Director — Banco Santander International (October 2016-Present) Director — Santander Bank, N.A. (December 2016-Present) |
| | | | | |
Joseph W. Chow 2005 Market Street Philadelphia, PA 19103 January 1953 | | Trustee | | Since January 2013 | | Private Investor (April 2011–Present) | | 59 | | Director and Audit Committee Member — Hercules Technology Growth Capital, Inc. (July 2004–July 2014) |
John A. Fry 2005 Market Street Philadelphia, PA 19103 May 1960 | | Trustee | | Since January 2001 | | President — Drexel University (August 2010–Present) President — Franklin & Marshall College (July 2002–July 2010) | | 59 | | Director; Compensation Committee and Governance Committee Member — Community Health Systems Director — Drexel Morgan & Co. Director and Audit Committee Member — vTv Therapeutics LLC Director and Audit Committee Member — FS Credit Real Estate Income Trust, Inc. |
Lucinda S. Landreth2005 Market Street Philadelphia, PA 19103 June 1947 | | Trustee | | Since March 2005 | | Private Investor (2004–Present) | | 59 | | None |
High Yield Series-27
| | | | | | | | | | |
| | | | | | | | | Number of | | Other |
| | | | | | | Principal | | Portfolios in Fund | | Directorships |
| Name, | | Position(s) | | | | Occupation(s) | | Complex Overseen | | Held by |
| Address, | | Held with | | Length of Time | | During the | | by Trustee | | Trustee |
| and Birth Date | | Fund(s) | | Served | | Past Five Years | | or Officer | | or Officer |
| | | | | |
Frances A. Sevilla-Sacasa2005 Market Street Philadelphia, PA 19103 January 1956 | | Trustee | | Since September 2011 | | Private Investor(January 2017-Present) Chief Executive Officer — Banco Itaú International (April 2012–December 2016) Executive Advisor to Dean (August 2011–March 2012) and Interim Dean (January 2011–July 2011) — University of Miami School of Business Administration President — U.S. Trust, Bank of America Private Wealth Management (Private Banking) (July 2007–December 2008) | | 59 | | Trust Manager and Audit Committee Chair — Camden Property Trust(August 2011-Present) Director — Carrizo Oil & Gas, Inc.(March 2018-Present) |
| | | | | |
Thomas K. Whitford2005 Market Street Philadelphia, PA 19103 March 1956 | | Trustee | | Since January 2013 | | Vice Chairman (2010–April 2013) — PNC Financial Services Group | | 59 | | Director — HSBC North America Holdings Inc.(December 2013-Present) Director — HSBC USA Inc.(July 2014-Present) Director — HSBC Bank USA, National Association(July 2014-March 2017) Director — HSBC Finance Corporation(December 2013-April 2018) |
| | | | | |
Christianna Wood 2005 Market Street Philadelphia, PA 19103 March 1956 | | Trustee | | Since January 2019 | | Chief Executive Officer and President — Gore Creek Capital, Ltd. (August 2009–Present) | | 59 | | Director and Audit Committee Member — H&R Block Corporation(July 2008-Present) Director and Audit Committee Member — Grange Insurance(2013-Present) Trustee and Audit Committee Member — The Merger Fund(2013-Present), The Merger Fund VL(2013-Present); WCM Alternatives:Event-Driven Fund(2013-Present), and WCM Alternatives: Credit Event Fund(December 2017-Present) Director — International Securities Exchange(2010-2016) |
| | | | | |
Janet L. Yeomans 2005 Market Street Philadelphia, PA 19103 July 1948 | | Trustee | | Since April 1999 | | Vice President and Treasurer (January 2006–July 2012), Vice President — Mergers & Acquisitions (January 2003–January 2006), and Vice President and Treasurer (July 1995–January 2003) — 3M Company | | 59 | | Director; Personnel and Compensation Committee Chair; Member of Nominating, Investments, and Audit Committees for various periods throughout directorship — Okabena Company (2009-2017) |
High YieldSeries-28
| | | | | | | | | | |
| | | | | | | | | Number of | | Other |
| | | | | | | Principal | | Portfolios in Fund | | Directorships |
| Name, | | Position(s) | | | | Occupation(s) | | Complex Overseen | | Held by |
| Address, | | Held with | | Length of Time | | During the | | by Trustee | | Trustee |
| and Birth Date | | Fund(s) | | Served | | Past Five Years | | or Officer | | or Officer |
| OFFICERS | | | | | | | | | | |
| | | | | |
David F. Connor 2005 Market Street Philadelphia, PA 19103 December 1963 | | Senior Vice President, General Counsel, and Secretary | | Senior Vice President, since May 2013; General Counsel since May 2015; Secretary since October 2005 | | David F. Connor has served in various capacities at different times at Macquarie Investment Management. | | 59 | | None3 |
| | | | | | |
Daniel V. Geatens 2005 Market Street Philadelphia, PA 19103 October 1972 | | Vice President and Treasurer | | Vice President and Treasurer since October 2007 | | Daniel V. Geatens has served in various capacities at different times at Macquarie Investment Management. | | 59 | | None3 |
| | | | | |
Richard Salus 2005 Market Street Philadelphia, PA 19103 October 1963 | | Senior Vice President and Chief Financial Officer | | Senior Vice President and Chief Financial Officer since November 2006 | | Richard Salus has served in various capacities at different times at Macquarie Investment Management. | | 59 | | None3 |
| 1 | Shawn K. Lytle is considered to be an “Interested Trustee” because he is an executive officer of the Fund’s(s’) investment advisor. |
| 2 | Macquarie Investment Management is the marketing name for Macquarie Management Holdings, Inc. and its subsidiaries, including the Fund’s(s’) investment advisor, principal underwriter, and its transfer agent. |
| 3 | Shawn K. Lytle, David F. Connor, Daniel V. Geatens, and Richard Salus serve in similar capacities for the six portfolios of the Optimum Fund Trust, which have the same investment advisor, principal underwriter, and transfer agent as the registrant. Mr. Geatens also serves as the Chief Financial Officer and Treasurer for Macquarie Global Infrastructure Total Return Fund Inc., which has an affiliated investment manager. |
The Statement of Additional Information for the Fund(s) includes additional information about the Trustees and Officers and is available, without charge, upon request by calling 800523-1918.
High YieldSeries-29
| | | | |
| | The Series files its complete schedule of portfolio holdings with the Securities and Exchange Commission (SEC) for the first and third quarters of each fiscal year on FormN-Q. The Series’ FormsN-Q, as well as a description of the policies and procedures that the Series uses to determine how to vote proxies (if any) relating to portfolio securities are available without charge (i) upon request, by calling 800523-1918; and (ii) on the SEC’s website at sec.gov. In addition, a description of the policies and procedures that the Series uses to determine how to vote proxies (if any) relating to portfolio securities and the Schedule of Investments included in the Series’ most recent FormN-Q are available without charge on the Series’ website at delawarefunds.com/ vip/literature. The Series’ FormsN-Q may be reviewed and copied at the SEC’s Public Reference Room in Washington, DC; information on the operation of the Public Reference Room may be obtained by calling 800SEC-0330. Information (if any) regarding how the Series voted proxies relating to portfolio securities during the most recently disclosed12-month period ended June 30 is available without charge (i) through the Series’ website at delawarefunds.com/proxy; and (ii) on the SEC’s website at sec.gov. | | |
| | |
| AR-VIPHY 22042 (2/19) (730130) | | High YieldSeries-30 |
Delaware VIP®Trust
Delaware VIP International Value Equity Series
December 31, 2018

Table of contents
| | | | | | |
| | | |
 | | Portfolio management review | | 1 | | |
| | | |
| | Performance summary | | 3 | | |
| | | |
| | Disclosure of Series expenses | | 5 | | |
| | | |
| | Security type / country and sector allocations | | 6 | | |
| | | |
| | Schedule of investments | | 7 | | |
| | | |
| | Statement of assets and liabilities | | 10 | | |
| | | |
| | Statement of operations | | 11 | | |
| | | |
| | Statements of changes in net assets | | 11 | | |
| | | |
| | Financial highlights | | 12 | | |
| | | |
| | Notes to financial statements | | 14 | | |
| | | |
| | Report of independent registered public accounting firm | | 23 | | |
| | | |
| | Other Series information | | 24 | | |
| | | |
| | Board of trustees/directors and officers addendum | | 26 | | |
| |
| | | |
| |
| | Other than Macquarie Bank Limited (MBL), none of the entities noted are authorized deposit-taking institutions for the purposes of the Banking Act 1959 (Commonwealth of Australia). The obligations of these entities do not represent deposits or other liabilities of MBL. MBL does not guarantee or otherwise provide assurance in respect of the obligations of these entities, unless noted otherwise. The Series is governed by US laws and regulations. Unless otherwise noted, views expressed herein are current as of Dec. 31, 2018, and subject to change for events occurring after such date. The Series is not FDIC insured and is not guaranteed. It is possible to lose the principal amount invested. Advisory services provided by Delaware Management Company, a series of Macquarie Investment Management Business Trust (MIMBT), a US registered investment advisor. The Series is distributed byDelaware Distributors, L.P.(DDLP), an affiliate of MIMBT and Macquarie Group Limited. Macquarie Investment Management (MIM), is the marketing name for certain companies comprising the asset management division of Macquarie Group Limited and its subsidiaries and affiliates worldwide. This material may be used in conjunction with the offering of shares in Delaware VIP International Value Equity Series only if preceded or accompanied by the Series’ current prospectus or the summary prospectus. © 2019 Macquarie Management Holdings, Inc. All third-party marks cited are the property of their respective owners. |
Delaware VIP®Trust — Delaware VIP International Value Equity Series
| | |
| Portfolio management review | | January 8, 2019 |
For the fiscal year ended Dec. 31, 2018, Delaware VIP International Value Equity Series (the “Series”) Standard Class shares declined 17.64% and Service Class shares fell 17.90%. Both figures reflect all dividends reinvested. The Series’ benchmark, the MSCI EAFE (Europe, Australasia, Far East) Index, declined 13.79% (net) and 13.36% (gross) for the same period.
After remarkably steady improvement in the market’s appreciation of global economic drivers for the duration of 2017, uncertainty regained prominence in 2018. Though major economies remained within uptrends, and stimulus in many regions remained in play, leading sentiment measures generally cooled. Meanwhile, unsettled political conditions, both within major economic blocs and with respect to the trade regimes between them, fueled concerns about the durability of the current cycle of global growth. Stocks reflected this growing skepticism through higher volatility, lack of a clear market direction, and a mix of performance that favored stable, defensive characteristics.
• The US Federal Reserve’s rate increases were accompanied by Chairman Jerome H. Powell’s comments indicating confident satisfaction that the economy was on a solid track. Jobs continued to grow, retail and industrial activity remained on firm footing, and inflation was contained. However, some leading indicators such as the Purchasing Managers’ Index (PMI) showed pronounced signs of slowing, trade tensions continued to increase, and domestic politics remained unsettled. Although the solid returns of US equities through September faltered during the fourth quarter’s selloff, the perception of the United States as a safe haven against rising risks elsewhere kept it well ahead of global alternatives for the year.
• Economic sentiment indicators in Europe, while remaining positive declined significantly from the high readings that prevailed in late 2017. Ongoing concerns with the Italian government’s ability to fund its budgetary ambitions were compounded by a currency crisis in Turkey, demonstrations in France, trade-tension worries, and an uncertain outcome of Brexit negotiations. Although these troubles were manifest in heightened volatility of equity performance rather than in absolute declines for most of the year, the contrast with the US was clear. Despite the slowdown in the region, the European Central Bank ended its quantitative-easing program in December.
• Japan’s relatively stable but uninspiring economic indicators were reflected in a similarly undistinguished equity market trajectory for the year. Positive investor response to 2.8% annualized gross domestic product (GDP) growth for the second quarter and strong electoral endorsement for Shinzo Abe’s government were offset by continued concerns regarding trade tensions and contraction to a-2.5% annualized GDP growth rate for the third quarter — the worst downturn since the second quarter of 2014. The nation was disrupted by several natural disasters during the year (flooding, a heat wave, a typhoon and an earthquake), affecting businesses, production, and tourism.
• Emerging markets bore the brunt of fears related to the future of the global trading regime. China, having the most prominently mentioned role in global supply chains, was most commonly cited as the area of concern more broadly affecting emerging markets. There were few pockets of strength, with Brazil and Russia among the major emerging markets outperforming the MSCI ACWI (All Country World Index).
With late-cycle patterns of relative performance presenting a challenge to the Series’ value style, the Series underperformed the benchmark primarily due to adverse stock selection.
On a sector basis, weak stock selection in financials, consumer discretionary, consumer staples, and industrials more than offset strong stock selection in healthcare, information technology, and materials.
Overall sector allocation was negative. The adverse effect of an underexposure to utilities and overexposure to consumer discretionary and industrials more than offset the favorable effect of underweight exposures to materials and financials. On a regional basis, weak stock selection in the euro zone, Japan, United Kingdom, and Asia Pacific ex Japan more than offset strong selection in Europe ex euro zone.
Overall regional allocation was positive, with the favorable effect of exposure to Canada and emerging markets more than offsetting the adverse effect of an underweight exposure to Asia Pacific ex Japan. Net currency effect was positive primarily due to an underweight exposure to the Australian dollar, which more than offset the unfavorable effect of exposure to the Canadian dollar. An average 1.1% cash position also contributed to performance for the period.
The Series’ trading activity during the fiscal year included eliminating and trimming some holdings and redeploying the proceeds into new names and positions that we viewed as attractively valued. This activity involved a variety of sectors and regions but did not result in material changes to the Series’ portfolio positioning.
The confluence of economics and politics found interesting expression in equity-price movements during the fiscal year, but uniformity was not among its main traits. On the economic front, the Fed’s now well-established shift toward monetary normalization contrasted with earlier phases of recovery in Europe and Japan, where interest rates remain extremely low. The market responses one might expect under these conditions, such as relative outperformance by late-cycle secular growth in the US and a more procyclical mix of performance in other regions, was only partly borne out in a period
Unless otherwise noted, views expressed herein are current as of Dec. 31, 2018, and subject to change.
International Value EquitySeries-1
Delaware VIP®Trust — Delaware VIP International Value Equity Series
| | |
| Portfolio management review (continued) | | January 8, 2019 |
that saw abrupt and inconsistent rotations of leadership within an overall market that seemed to lack clear direction. The overlay of political events may help explain the market’s performance during the year, but it leaves uncertainty regarding the future.
Adapting to change is a key part of competitive success. While mindful of the potential of macro drivers to steer markets both up and down, we focus on the power of strong management teams and the competitive strength of individual companies with durable franchises to transcend the speculative cycles to which they happen to have some exposure.
Unless otherwise noted, views expressed herein are current as of Dec. 31, 2018, and subject to change.
International Value EquitySeries-2
Delaware VIP®Trust — Delaware VIP International Value Equity Series
Performance summary
The performance quoted represents past performance and does not guarantee future results. Investment return and principal value of an investment will fluctuate so that shares, when redeemed, may be worth more or less than their original cost. Current performance may be lower or higher than the performance quoted.
Carefully consider the Series’ investment objectives, risk factors, charges, and expenses before investing. This and other information can be found in the Series’ prospectus and its summary prospectus, which may be obtained by visiting delawarefunds.com/vip/literature or calling 800523-1918. Investors should read the prospectus and the summary prospectus carefully before investing.
| | | | | | | | | | |
| Delaware VIP International Value Equity Series | | | | | | |
| Average annual total returns | | | | | | | | | | |
| For periods ended December 31, 2018 | | 1 year | | 3 years | | 5 years | | 10 years | | Lifetime |
Standard Class shares (commenced operations on Oct. 29, 1992) | | -17.64% | | +1.68% | | -0.71% | | +5.73% | | +5.91% |
| | | | | | | | | | | |
Service Class shares (commenced operations on May 1, 2000) | | -17.90% | | +1.40% | | -0.96% | | +5.47% | | +3.95% |
| | | | | | | | | | | |
MSCI EAFE Index (net) | | -13.79% | | +2.87% | | +0.53% | | +6.32% | | n/a |
| | | | | | | | | | | |
MSCI EAFE Index (gross) | | -13.36% | | +3.38% | | +1.00% | | +6.81% | | n/a |
Returns reflect the reinvestment of all distributions. Please see page 4 for a description of the index.
As described in the Series’ most recent prospectus, the net expense ratio for Service Class shares of the Series was 1.27%, while total operating expenses for Standard Class and Service Class shares were 1.06% and 1.36%, respectively. The management fee for Standard Class and Service Class shares was 0.85%.The Series’ investment manager, Delaware Management Company (Manager), has contractually agreed to waive all or a portion of its investment advisory fees and/or pay/reimburse expenses (excluding any12b-1 fees, acquired fund fees and expenses, taxes, interest, short sale and dividend interest expenses, brokerage fees, certain insurance costs, and nonroutine expenses or costs, including, but not limited to, those relating to reorganizations, litigation, conducting shareholder meetings, and liquidations) in order to prevent annual series operating expenses from exceeding 1.04% of the Series’ average daily net assets from April 30, 2018 through Dec. 31, 2018.* These waivers and reimbursements may only be terminated by agreement of the Manager and the Series. Please see the most recent prospectus and any applicable supplement(s) for additional information on these fee waivers and/or reimbursements. Please see the “Financial highlights” section in this report for the most recent expense ratios.
The Series pays Delaware Distributors, L.P. (DDLP), the distributor and an affiliate of DMC, an annual12b-1 fee of 0.30% of the average daily net assets of the Service Class shares. Prior to May 1, 2018, DDLP had contracted to waive12b-1 fees in order to limit12b-1 fees of the Service Class shares to 0.25% of average daily net assets.
Earnings from a variable annuity or variable life investment compoundtax-free until withdrawal, and as a result, no adjustments were made for income taxes.
Expense limitations were in effect for both classes during certain periods shown in the Series performance table above and in the Performance of a $10,000 Investment graph on the next page.
Performance data do not reflect insurance fees related to a variable annuity or variable life investment or the deferred sales charge that would apply to certain withdrawals of investments held for fewer than eight years. Performance shown here would have been reduced if such fees were included and the expense limitation removed. For more information about fees, consult your variable annuity or variable life prospectus.
Investments in variable products involve risk.
International investments entail risks not ordinarily associated with US investments including fluctuation in currency values, differences in accounting principles, or economic or political instability in other nations.
Investing in emerging markets can be riskier than investing in established foreign markets due to increased volatility and lower trading volume.
Please read both the contract and underlying prospectus for specific details regarding the product’s risk profile.
*The aggregate contractual waiver period covering this report is from April 30, 2018 through April 30, 2019.
International Value EquitySeries-3
Delaware VIP®International Value Equity Series
Performance summary (continued)
| | | | |
| For period beginning Dec. 31, 2008 through Dec. 31, 2018 | | Starting value | | Ending value |
– – MSCI EAFE Index (gross) | | $10,000 | | $19,328 |
--- MSCI EAFE Index (net) | | $10,000 | | $18,452 |
–– Delaware VIP International Value Equity Series (Standard Class) | | $10,000 | | $17,450 |
The graph shows a $10,000 investment in the Delaware VIP International Value Equity Series Standard Class shares for the period from Dec. 31, 2008 through Dec. 31, 2018.
The graph also shows $10,000 invested in the MSCI EAFE Index for the period from Dec. 31, 2008 through Dec. 31, 2018. The MSCI EAFE (Europe, Australasia, Far East) Index is a free float-adjusted market capitalization weighted index designed to measure equity market performance of developed markets, excluding the United States and Canada. Index “gross” return approximates the maximum possible dividend reinvestment. Index “net” return approximates the minimum possible dividend reinvestment, after deduction of withholding tax at the highest possible rate.
The MSCI ACWI (All Country World Index), mentioned on page 1, is a free float-adjusted market capitalization weighted index that is designed to measure equity market performance across developed and emerging markets worldwide.
The Purchasing Managers’ Index, mentioned on page 1, is an indicator of the economic health of the manufacturing sector. A PMI reading above 50% indicates that the manufacturing economy is generally expanding; below 50% indicates that it is generally contracting.
Index performance returns do not reflect any management fees, transaction costs or expenses. Indices are unmanaged and one cannot invest directly in an index.
Performance of Service Class shares will vary due to different charges and expenses.
Past performance is not a guarantee of future results.
International Value EquitySeries-4
Delaware VIP®Trust — Delaware VIP International Value Equity Series
Disclosure of Series expenses
For thesix-month period from July 1, 2018 to December 31, 2018 (Unaudited)
As a shareholder of the Series, you incur ongoing costs, which may include management fees; distribution and service(12b-1) fees; and other Series expenses. This example is intended to help you understand your ongoing costs (in dollars) of investing in the Series and to compare these costs with the ongoing costs of investing in other mutual funds.
The example is based on an investment of $1,000 invested at the beginning of the period and held for the entiresix-month period from July 1, 2018 to Dec. 31, 2018.
Actual expenses
The first section of the table shown, “Actual Series return,” provides information about actual account values and actual expenses. You may use the information in this section of the table, together with the amount you invested, to estimate the expenses that you paid over the period. Simply divide your account value by $1,000 (for example, an $8,600 account value divided by $1,000 = 8.6), then multiply the result by the number in the first section under the heading entitled “Expenses Paid During Period” to estimate the expenses you paid on your account during the period.
Hypothetical example for comparison purposes
The second section of the table shown, “Hypothetical 5% return,” provides information about hypothetical account values and hypothetical expenses based on the Series’ actual expense ratio and an assumed rate of return of 5% per year before expenses, which is not the Series’ actual return. The hypothetical account values and expenses may not be used to estimate the actual ending account balance or expenses you paid for the period. You may use this information to compare the ongoing costs of investing in the Series and other funds. To do so, compare this 5% hypothetical example with the 5% hypothetical examples that appear in the shareholder reports of other funds.
Please note that the expenses shown in the table are meant to highlight your ongoing costs only. As a shareholder of the Series, you do not incur any transaction costs, such as sales charges (loads), redemption fees or exchange fees, but shareholders of other funds may incur such costs. Also, the fees related to the variable annuity investment or the deferred sales charge that could apply have not been included. Therefore, the second section of the table is useful in comparing ongoing costs only, and will not help you determine the relative total costs of owning different funds. The Series’ actual expenses shown in the table reflect fee waivers in effect. The Series’ expenses shown in the table assume reinvestment of all dividends and distributions.
Expense analysis of an investment of $1,000
| | | | | | | | | | | | | | |
| | | Beginning
Account
Value
7/1/18 | | | Ending
Account
Value
12/31/18 | | | Annualized
Expense
Ratio | | Expenses
Paid During
Period
7/1/18 to
12/31/18* | |
Actual Series return† | | | | |
Standard Class | | | $1,000.00 | | | | $ 878.10 | | | 1.04% | | | $4.92 | |
Service Class | | | 1,000.00 | | | | 876.30 | | | 1.34% | | | 6.34 | |
Hypothetical 5% return(5% return before expenses) | |
Standard Class | | | $1,000.00 | | | | $1,019.96 | | | 1.04% | | | $5.30 | |
Service Class | | | 1,000.00 | | | | 1,018.45 | | | 1.34% | | | 6.82 | |
| *“ | Expenses Paid During Period” are equal to the Series’ annualized expense ratio, multiplied by the average account value over the period, multiplied by 184/365 (to reflect theone-half year period). |
| † | Because actual returns reflect only the most recentsix-month period, the returns shown may differ significantly from fiscal year returns. |
International Value EquitySeries-5
Delaware VIP®Trust — Delaware VIP International Value Equity Series
Security type / country and sector allocations
As of December 31, 2018 (Unaudited)
Sector designations may be different than the sector designations presented in other Series materials. The sector designations may represent the investment manager’s internal sector classifications.
| | |
| Security type / sector | | Percentage of
net assets |
Common Stock by Country | | 98.76% |
Australia | | 0.45% |
Canada | | 4.85% |
China/Hong Kong | | 9.33% |
Denmark | | 2.40% |
France | | 17.70% |
Germany | | 4.25% |
Indonesia | | 2.38% |
Italy | | 2.76% |
Japan | | 20.83% |
Netherlands | | 4.69% |
Panama | | 1.34% |
Republic of Korea | | 2.08% |
Russia | | 0.88% |
Singapore | | 1.02% |
Spain | | 1.84% |
Sweden | | 3.80% |
Switzerland | | 3.45% |
United Kingdom | | 14.71% |
Short-Term Investments | | 0.47% |
Securities Lending Collateral | | 0.02% |
Total Value of Securities | | 99.25% |
Obligation to Return Securities Lending Collateral | | (0.02%) |
Receivables and Other Assets Net of Liabilities | | 0.77% |
Total Net Assets | | 100.00% |
| |
| Common stock by sector | | Percentage of
net assets |
Consumer Discretionary | | 19.90% |
Consumer Staples | | 7.88% |
Energy | | 5.85% |
Financials | | 18.19% |
Healthcare | | 11.41% |
Industrials | | 20.54% |
Information Technology | | 6.18% |
Materials | | 2.84% |
Telecommunication Services | | 4.83% |
Utilities | | 1.14% |
Total | | 98.76% |
International Value Equity Series-6
Delaware VIP® Trust — Delaware VIP International Value Equity Series
Schedule of investments
December 31, 2018
| | | | | | | | |
| | | Number of | | | Value | |
| | | shares | | | (US $) | |
| |
Common Stock – 98.76%D | | | | | |
Australia – 0.45% | | | | | | | | |
Coca-Cola Amatil | | | 34,302 | | | $ | 197,875 | |
| | | | | | | | |
| | | | | | | 197,875 | |
| | | | | | | | |
Canada – 4.85% | |
Alamos Gold Class A | | | 40,868 | | | | 146,983 | |
CGI Group Class A † | | | 19,114 | | | | 1,169,073 | |
Suncor Energy | | | 24,700 | | | | 689,870 | |
Yamana Gold | | | 54,383 | | | | 127,871 | |
| | | | | | | | |
| | | | | | | 2,133,797 | |
| | | | | | | | |
China/Hong Kong – 9.33% | |
CNOOC | | | 549,000 | | | | 848,337 | |
Sinopharm Group Class H | | | 137,598 | | | | 578,121 | |
Techtronic Industries | | | 205,359 | | | | 1,090,982 | |
Yue Yuen Industrial Holdings | | | 494,500 | | | | 1,581,920 | |
| | | | | | | | |
| | | | | | | 4,099,360 | |
| | | | | | | | |
Denmark – 2.40% | |
Carlsberg Class B | | | 9,909 | | | | 1,054,111 | |
| | | | | | | | |
| | | | | | | 1,054,111 | |
| | | | | | | | |
France – 17.70% | |
AXA | | | 49,179 | | | | 1,062,589 | |
Cie Generale des Etablissements Michelin | | | 10,443 | | | | 1,037,371 | |
Kering | | | 2,248 | | | | 1,060,136 | |
Publicis Groupe | | | 6,015 | | | | 345,136 | |
Sanofi | | | 9,016 | | | | 781,574 | |
Teleperformance | | | 5,161 | | | | 825,485 | |
TOTAL | | | 19,518 | | | | 1,032,712 | |
Valeo | | | 12,934 | | | | 378,036 | |
Vinci | | | 15,231 | | | | 1,256,815 | |
| | | | | | | | |
| | | | | | | 7,779,854 | |
| | | | | | | | |
Germany – 4.25% | |
Bayerische Motoren Werke | | | 10,876 | | | | 882,100 | |
Deutsche Post | | | 36,087 | | | | 985,508 | |
| | | | | | | | |
| | | | | | | 1,867,608 | |
| | | | | | | | |
Indonesia – 2.38% | | | | | | | | |
Bank Rakyat Indonesia Persero | | | 4,099,175 | | | | 1,044,299 | |
| | | | | | | | |
| | | | | | | 1,044,299 | |
| | | | | | | | |
Italy – 2.76% | | | | | | | | |
Leonardo | | | 59,965 | | | | 528,305 | |
UniCredit | | | 60,285 | | | | 682,842 | |
| | | | | | | | |
| | | | | | | 1,211,147 | |
| | | | | | | | |
Japan – 20.83% | | | | | | | | |
East Japan Railway | | | 10,956 | | | | 967,526 | |
Hitachi | | | 23,800 | | | | 630,944 | |
ITOCHU | | | 98,135 | | | | 1,666,606 | |
Matsumotokiyoshi Holdings | | | 23,400 | | | | 719,474 | |
MINEBEA MITSUMI * | | | 98,200 | | | | 1,416,045 | |
Mitsubishi UFJ Financial Group | | | 229,735 | | | | 1,127,460 | |
Nippon Telegraph & Telephone | | | 28,518 | | | | 1,163,515 | |
Nitori Holdings | | | 858 | | | | 107,456 | |
| | | | | | | | |
| | | Number of | | | Value | |
| | | shares | | | (US $) | |
| |
Common StockD (continued) | | | | | |
Japan (continued) | | | | | | | | |
Toyota Motor | | | 23,443 | | | $ | 1,357,035 | |
| | | | | | | | |
| | | | | | | 9,156,061 | |
| | | | | | | | |
Netherlands – 4.69% | | | | | | | | |
ING Groep | | | 75,176 | | | | 810,511 | |
Koninklijke Philips | | | 35,245 | | | | 1,249,014 | |
| | | | | | | | |
| | | | | | | 2,059,525 | |
| | | | | | | | |
Panama – 1.34% | | | | | | | | |
Copa Holdings Class A | | | 7,500 | | | | 590,325 | |
| | | | | | | | |
| | | | | | | 590,325 | |
| | | | | | | | |
Republic of Korea – 2.08% | |
Samsung Electronics | | | 26,270 | | | | 914,504 | |
| | | | | | | | |
| | | | | | | 914,504 | |
| | | | | | | | |
Russia – 0.88% | | | | | | | | |
Mobile TeleSystems ADR | | | 55,300 | | | | 387,100 | |
| | | | | | | | |
| | | | | | | 387,100 | |
| | | | | | | | |
Singapore – 1.02% | | | | | | | | |
United Overseas Bank | | | 24,900 | | | | 448,874 | |
| | | | | | | | |
| | | | | | | 448,874 | |
| | | | | | | | |
Spain – 1.84% | | | | | | | | |
Banco Santander | | | 177,930 | | | | 809,949 | |
| | | | | | | | |
| | | | | | | 809,949 | |
| | | | | | | | |
Sweden – 3.80% | | | | | | | | |
Nordea Bank | | | 130,330 | | | | 1,097,144 | |
Tele2 Class B | | | 45,029 | | | | 574,290 | |
| | | | | | | | |
| | | | | | | 1,671,434 | |
| | | | | | | | |
Switzerland – 3.45% | | | | | | | | |
Novartis | | | 17,705 | | | | 1,516,332 | |
| | | | | | | | |
| | | | | | | 1,516,332 | |
| | | | | | | | |
United Kingdom – 14.71% | |
Imperial Brands | | | 49,292 | | | | 1,493,412 | |
Meggitt | | | 131,827 | | | | 791,406 | |
National Grid | | | 51,545 | | | | 502,074 | |
Playtech | | | 184,154 | | | | 903,682 | |
Rio Tinto | | | 20,507 | | | | 974,956 | |
Shire | | | 15,242 | | | | 887,835 | |
Standard Chartered | | | 117,339 | | | | 911,271 | |
| | | | | | | | |
| | | | | | | 6,464,636 | |
| | | | | | | | |
Total Common Stock
(cost $46,316,979) | | | | 43,406,791 | |
| | | | | | | | |
| | |
| | | Principal | | | | |
| | | amount° | | | | |
|
Short–Term Investments – 0.47% | |
Discount Note – 0.07% ≠ | |
Federal Home Loan Bank 1.048% 1/2/19 | | | 30,061 | | | | 30,061 | |
| | | | | | | | |
| | | | | | | 30,061 | |
| | | | | | | | |
International Value Equity Series–7
Delaware VIP®International Value Equity Series
Schedule of investments (continued)
| | | | | | | | |
| | | Principal | | | Value | |
| | | amount° | | | (US $) | |
| |
Short-Term Investments (continued) | | | | | |
Repurchase Agreements – 0.35% | |
Bank of America Merrill Lynch 2.95%, dated 12/31/18, to be repurchased on 1/2/19, repurchase at $18,791 (cash collateralized of $18,788) | | | 18,788 | | | $ | 18,788 | |
Bank of Montreal
2.60%, dated 12/31/18, to be repurchased on 1/2/19, repurchase price $51,675 (collateralized by US government obligations0.00%-3.75% 1/24/19-2/15/47; market value $52,701) | | | 51,668 | | | | 51,668 | |
BNP Paribas
2.93%, dated 12/31/18, to be repurchased on 1/2/19, repurchase price $84,500 (collateralized by US government obligations0.00%-8.00% 2/15/19-8/15/46; market value $86,176) | | | 84,486 | | | | 84,486 | |
| | | | | | | | |
| | | | | | | 154,942 | |
| | | | | | | | |
US Treasury Obligation – 0.05% ≠ | |
US Treasury Bill 1.494% 1/3/19 | | | 20,396 | | | | 20,395 | |
| | | | | | | | |
| | | | | | | 20,395 | |
| | | | | | | | |
Total Short-Term Investments
(cost $205,396) | | | | 205,398 | |
| | | | | | | | |
| |
Total Value of Securities Before Securities Lending
Collateral – 99.23%
(cost $46,522,375) | | | | 43,612,189 | |
| | | | | | | | |
| | | | | | | | |
| | | Principal | | | Value | |
| | | amount° | | | (US $) | |
| |
Securities Lending Collateral – 0.02% ** | | | | | |
Repurchase Agreements – 0.02% | | | | | |
Bank of Montreal
2.85%, dated 12/31/18, to be repurchased on 1/2/19, repurchase price $2,222 (collateralized by US government obligations0.00%-3.375%1/10/19-9/9/49; market value $2,266) | | | 2,222 | | | $ | 2,222 | |
Bank of Nova Scotia
2.95%, dated 12/31/18, to be repurchased on 1/2/19, repurchase price $2,222 (collateralized by US government obligations0.125%-7.875%3/31/19-11/15/23; market value $2,267) | | | 2,222 | | | | 2,222 | |
Credit Agricole
2.95%, dated 12/31/18, to be repurchased on 1/2/19, repurchase price $2,222 (collateralized by US government obligations 2.75% 9/9/49; market value $2,266) | | | 2,222 | | | | 2,222 | |
JP Morgan Securities
2.95%, dated 12/31/18, to be repurchased on 1/2/19, repurchase price $657 (collateralized by US government obligations 2.25% 9/9/49; market value $670) | | | 657 | | | | 657 | |
Merrill Lynch, Pierce, Fenner & Smith
2.93%, dated 12/31/18, to be repurchased on 1/2/19, repurchase price $2,222 (collateralized by US government obligations 1.25% 8/31/19; market value $2,266) | | | 2,222 | | | | 2,222 | |
| | | | | | | | |
Total Securities Lending Collateral
(cost $9,545) | | | | 9,545 | |
| | | | | | | | |
| | | | | | | | |
Total Value of Securities - 99.25%
(cost $46,531,920) | | | | | | $ | 43,621,734∎ | |
| | | | | | | | |
| * | Fully or partially on loan. |
| ** | See Note 10 in “Notes to financial statements” for additional information on securities lending collateral. |
| ≠ | The rate shown is the effective yield at the time of purchase. |
| ∎ | Includes $8,652 of securities loaned. |
| ° | Principal amount shown is stated in USD unless noted that the security is denominated in another currency. |
| D | Securities have been classified by country of origin. Aggregate classification by business sector has been presented on page 6 in “Security type / country and sector allocations.” |
| † | Non-income producing security. |
International Value EquitySeries-8
Delaware VIP® International Value Equity Series
Schedule of investments (continued)
Summary of abbreviations:
ADR – American Depositary Receipt
USD – US Dollar
See accompanying notes, which are an integral part of financial statements.
International Value Equity Series-9
| | | | |
| Delaware VIP®Trust — Delaware VIP International Value Equity Series | | | | |
| Statement of assets and liabilities | | | December 31, 2018 | |
| | | | |
Assets: | | | | |
Investments, at value1 | | $ | 43,612,189 | |
Short-term investments held as collateral for loaned securities, at value2 | | | 9,545 | |
Foreign currencies, at value3 | | | 160,012 | |
Cash | | | 42,029 | |
Foreign tax reclaims receivable | | | 231,915 | |
Dividends and interest receivable | | | 27,399 | |
Receivable for series shares sold | | | 1,361 | |
Securities lending income receivable | | | 98 | |
| | | | |
| |
Total assets | | | 44,084,548 | |
| | | | |
Liabilities: | | | | |
Payable for series shares redeemed | | | 65,272 | |
Investment management fees payable to affiliates | | | 29,707 | |
Accounting and Administration expenses payable | | | 10,272 | |
Obligation to return securities lending collateral | | | 9,150 | |
Audit and tax fees payable | | | 5,921 | |
Custody fees payable | | | 4,895 | |
Pricing fees payable | | | 4,640 | |
Other accrued expenses | | | 3,945 | |
Accounting and administration expenses payable to affiliates | | | 486 | |
Dividend disbursing and transfer agent fees and expenses payable to affiliates | | | 282 | |
Distribution fees payable to affiliates | | | 137 | |
Trustees’ fees and expenses payable | | | 114 | |
Legal fees payable to affiliates | | | 83 | |
Reports and statements to shareholders expenses payable to affiliates | | | 33 | |
Other liabilities | | | 396 | |
| | | | |
| |
Total liabilities | | | 135,333 | |
| | | | |
| |
Total Net Assets | | $ | 43,949,215 | |
| | | | |
| |
Net Assets Consist of: | | | | |
Paid-in capital | | $ | 45,773,868 | |
Total distributable earnings (loss) | | | (1,824,653 | ) |
| | | | |
Total Net Assets | | $ | 43,949,215 | |
| | | | |
| |
Net Assets Value: | | | | |
Standard Class: | | | | |
Net assets | | $ | 43,416,463 | |
Shares of beneficial interest outstanding, unlimited authorization, no par | | | 4,046,356 | |
Net asset value per share | | $ | 10.73 | |
| |
Service Class: | | | | |
Net assets | | $ | 532,752 | |
Shares of beneficial interest outstanding, unlimited authorization, no par | | | 49,785 | |
Net asset value per share | | $ | 10.70 | |
| | | | |
1Investments, at cost | | $ | 46,522,375 | |
2Short-term investments held as collateral for loaned securities, at cost | | | 9,545 | |
3Foreign currencies, at cost | | | 162,388 | |
See accompanying notes, which are an integral part of the financial statements.
International Value Equity Series-10
Delaware VIP®Trust —
Delaware VIP International Value Equity Series
Statement of operations
Year ended December 31, 2018
| | | | |
Investment Income: | | | | |
Dividends | | $ | 1,813,020 | |
Interest | | | 12,149 | |
Securities lending income | | | 5,196 | |
Foreign tax withheld | | | (203,008 | ) |
| | | | |
| |
| | | 1,627,357 | |
| | | | |
Expenses: | | | | |
Management fees | | | 422,677 | |
Accounting and administration expenses | | | 42,859 | |
Audit and tax fees | | | 38,647 | |
Custodian fees | | | 16,315 | |
Legal fees | | | 5,306 | |
Dividend disbursing and transfer agent fees and expenses | | | 4,254 | |
Trustees’ fees and expenses | | | 2,391 | |
Reports and statements to shareholders expenses | | | 1,677 | |
Distribution expenses – Service Class | | | 1,431 | |
Registration fees | | | 487 | |
Other | | | 12,774 | |
| | | | |
| | | 548,818 | |
Less expenses waived | | | (18,079 | ) |
Less waived distribution expenses – Service Class | | | (67 | ) |
Less expenses paid indirectly | | | (84 | ) |
| | | | |
| |
Total operating expenses | | | 530,588 | |
| | | | |
| |
Net Investment Income | | | 1,096,769 | |
| | | | |
|
Net Realized and Unrealized Gain (Loss): | |
Net realized gain (loss) on: | | | | |
Investments | | | 914,497 | |
Foreign currencies | | | 4,857 | |
Foreign currency exchange contracts | | | (24,795 | ) |
| | | | |
Net realized gain | | | 894,559 | |
| | | | |
Net change in unrealized appreciation (depreciation) of: | | | | |
Investments | | | (11,320,814 | ) |
Foreign currencies | | | (9,710 | ) |
Foreign currency exchange contracts | | | (1,166 | ) |
| | | | |
Net change in unrealized appreciation (depreciation) | | | (11,331,690 | ) |
| | | | |
Net Realized and Unrealized Loss | | | (10,437,131 | ) |
| | | | |
Net Decrease in Net Assets Resulting from Operations | | $ | (9,340,362 | ) |
| | | | |
Delaware VIP Trust —
Delaware VIP International Value Equity Series
Statements of changes in net assets
| | | | | | | | |
| | | Year ended | |
| | | 12/31/18 | | | 12/31/17 | |
Increase (Decrease) in Net Assets from Operations: | | | | | | | | |
Net investment income | | $ | 1,096,769 | | | $ | 1,400,760 | |
Net realized gain | | | 894,559 | | | | 5,489,673 | |
Net change in unrealized appreciation (depreciation) | | | (11,331,690 | ) | | | 7,738,626 | |
| | | | | | | | |
Net increase (decrease) in net assets resulting from operations | | | (9,340,362 | ) | | | 14,629,059 | |
| | | | | | | | |
| |
Dividends and Distributions to Shareholders from: | | | | | |
Distributable earnings*: | | | | | | | | |
Standard Class | | | (1,385,108 | ) | | | (1,129,739 | ) |
Service Class | | | (11,061 | ) | | | (6,001 | ) |
| | | | | | | | |
| | |
| | | (1,396,169 | ) | | | (1,135,740 | ) |
| | | | | | | | |
| | |
Capital Share Transactions: | | | | | | | | |
Proceeds from shares sold: | | | | | | | | |
Standard Class | | | 4,315,587 | | | | 6,665,216 | |
Service Class | | | 319,083 | | | | 749,808 | |
Net asset value of shares issued upon reinvestment of dividends and distributions: | | | | | | | | |
Standard Class | | | 1,385,108 | | | | 1,129,739 | |
Service Class | | | 11,061 | | | | 6,001 | |
| | | | | | | | |
| | |
| | | 6,030,839 | | | | 8,550,764 | |
| | | | | | | | |
Cost of shares redeemed: | | | | | | | | |
Standard Class | | | (3,274,187 | ) | | | (35,220,387 | ) |
Service Class | | | (45,267 | ) | | | (811,874 | ) |
| | | | | | | | |
| | |
| | | (3,319,454 | ) | | | (36,032,261 | ) |
| | | | | | | | |
Increase (Decrease) in net assets derived from capital share transactions | | | 2,711,385 | | | | (27,481,497 | ) |
| | | | | | | | |
Net Decrease in Net Assets | | | (8,025,146 | ) | | | (13,988,178 | ) |
| | |
Net Assets: | | | | | | | | |
Beginning of year | | | 51,974,361 | | | | 65,962,539 | |
| | | | | | | | |
| | |
End of year1 | | $ | 43,949,215 | | | $ | 51,974,361 | |
| | | | | | | | |
| 1 | Net Assets - End of year includes undistributed net investment income of $1,392,925 in 2017. The Securities and Exchange Commission eliminated the requirement to disclose undistributed (distributions in excess of) net investment income in 2018. |
| * | For the year ended Dec. 31, 2018, the Series has adopted amendments to RegulationS-X (see Note 13 in “Notes to financial statements”). For the year ended Dec. 31, 2017, the dividends and distributions to shareholders were as follows: |
| | | | |
| | | Standard Class | | Service Class |
Dividends from net investment income | | $(1,129,739) | | $(6,001) |
See accompanying notes, which are an integral part of the financial statements.
International Value Equity Series-11
Delaware VIP®Trust — Delaware VIP International Value Equity Series
Financial highlights
Selected data for each share of the Series outstanding throughout each period were as follows:
| | | | | | | | | | | | | | | | | | | | | | | | | |
| | | Delaware VIP International Value Equity Series Standard Class
Year ended |
| | | 12/31/18 | | 12/31/17 | | 12/31/16 | | 12/31/15 | | 12/31/14 |
Net asset value, beginning of period | | | | $ 13.39 | | | | | $ 11.11 | | | | | $ 10.84 | | | | | $ 10.99 | | | | | $ 12.19 | |
| | | | | |
Income (loss) from investment operations: | | | | | | | | | | | | | | | | | | | | | | | | | |
Net investment income1 | | | | 0.27 | | | | | 0.25 | | | | | 0.19 | | | | | 0.19 | | | | | 0.25 | |
Net realized and unrealized gain (loss) | | | | (2.57 | ) | | | | 2.22 | | | | | 0.26 | | | | | (0.11 | ) | | | | (1.29 | ) |
| | | | | | | | | | | | | | | | | | | | | | | | | |
Total from investment operations | | | | (2.30 | ) | | | | 2.47 | | | | | 0.45 | | | | | 0.08 | | | | | (1.04 | ) |
| | | | | | | | | | | | | | | | | | | | | | | | | |
| | | | | |
Less dividends and distributions from: | | | | | | | | | | | | | | | | | | | | | | | | | |
Net investment income | | | | (0.36 | ) | | | | (0.19 | ) | | | | (0.18 | ) | | | | (0.23 | ) | | | | (0.16 | ) |
| | | | | | | | | | | | | | | | | | | | | | | | | |
Total dividends and distributions | | | | (0.36 | ) | | | | (0.19 | ) | | | | (0.18 | ) | | | | (0.23 | ) | | | | (0.16 | ) |
| | | | | | | | | | | | | | | | | | | | | | | | | |
| | | | | |
Net asset value, end of period | | | | $ 10.73 | | | | | $ 13.39 | | | | | $ 11.11 | | | | | $ 10.84 | | | | | $ 10.99 | |
| | | | | | | | | | | | | | | | | | | | | | | | | |
| | | | | |
Total return2 | | | | (17.64% | ) | | | | 22.51% | | | | | 4.19% | | | | | 0.49% | | | | | (8.67% | ) |
| | | | | |
Ratios and supplemental data: | | | | | | | | | | | | | | | | | | | | | | | | | |
Net assets, end of period (000 omitted) | | | | $ 43,416 | | | | | $ 51,613 | | | | | $65,633 | | | | | $62,285 | | | | | $ 57,986 | |
Ratio of expenses to average net assets | | | | 1.06% | | | | | 1.06% | | | | | 1.02% | | | | | 1.04% | | | | | 1.07% | |
Ratio of expenses to average net assets prior to fees waived | | | | 1.10% | | | | | 1.06% | | | | | 1.02% | | | | | 1.04% | | | | | 1.07% | |
Ratio of net investment income to average net assets | | | | 2.21% | | | | | 2.00% | | | | | 1.78% | | | | | 1.66% | | | | | 2.13% | |
Ratio of net investment income to average net assets prior to fees waived | | | | 2.17% | | | | | 2.00% | | | | | 1.78% | | | | | 1.66% | | | | | 2.13% | |
Portfolio turnover | | | | 13% | | | | | 15% | | | | | 19% | | | | | 11% | | | | | 27% | |
| 1 | The average shares outstanding method has been applied for per share information. |
| 2 | Total return is based on the change in net asset value of a share during the period and assumes reinvestment of dividends and distributions at net asset value. Total return during some of the periods shown reflects a waiver by the manager. Performance would have been lower had the waiver not been in effect. Total return does not include fees, charges, or expenses imposed by the variable annuity and life insurance contracts for which Delaware VIP Trust serves as an underlying investment vehicle. |
See accompanying notes, which are an integral part of the financial statements.
International Value Equity Series-12
Delaware VIP®International Value Equity Series
Financial highlights (continued)
Selected data for each share of the Series outstanding throughout each period were as follows:
| | | | | | | | | | | | | | | | | | | | | | | | | |
| | | Delaware VIP International Value Equity Series Service Class
Year ended |
| | | 12/31/18 | | 12/31/17 | | 12/31/16 | | 12/31/15 | | 12/31/14 |
Net asset value, beginning of period | | | | $ 13.36 | | | | | $ 11.09 | | | | | $ 10.82 | | | | | $ 10.97 | | | | | $ 12.16 | |
| | | | | |
Income (loss) from investment operations: | | | | | | | | | | | | | | | | | | | | | | | | | |
Net investment income1 | | | | 0.24 | | | | | 0.22 | | | | | 0.16 | | | | | 0.16 | | | | | 0.22 | |
Net realized and unrealized gain (loss) | | | | (2.57 | ) | | | | 2.21 | | | | | 0.26 | | | | | (0.11 | ) | | | | (1.28 | ) |
| | | | | | | | | | | | | | | | | | | | | | | | | |
Total from investment operations | | | | (2.33 | ) | | | | 2.43 | | | | | 0.42 | | | | | 0.05 | | | | | (1.06 | ) |
| | | | | | | | | | | | | | | | | | | | | | | | | |
| | | | | |
Less dividends and distributions from: | | | | | | | | | | | | | | | | | | | | | | | | | |
Net investment income | | | | (0.33 | ) | | | | (0.16 | ) | | | | (0.15 | ) | | | | (0.20 | ) | | | | (0.13 | ) |
| | | | | | | | | | | | | | | | | | | | | | | | | |
Total dividends and distributions | | | | (0.33 | ) | | | | (0.16 | ) | | | | (0.15 | ) | | | | (0.20 | ) | | | | (0.13 | ) |
| | | | | | | | | | | | | | | | | | | | | | | | | |
| | | | | |
Net asset value, end of period | | | | $ 10.70 | | | | | $ 13.36 | | | | | $ 11.09 | | | | | $ 10.82 | | | | | $ 10.97 | |
| | | | | | | | | | | | | | | | | | | | | | | | | |
| | | | | |
Total return2 | | | | (17.90% | ) | | | | 22.18% | | | | | 3.92% | | | | | 0.24% | | | | | (8.82% | ) |
| | | | | |
Ratios and supplemental data: | | | | | | | | | | | | | | | | | | | | | | | | | |
Net assets, end of period (000 omitted) | | | | $ 533 | | | | | $ 361 | | | | | $ 330 | | | | | $ 147 | | | | | $ 156 | |
Ratio of expenses to average net assets | | | | 1.35% | | | | | 1.31% | | | | | 1.27% | | | | | 1.29% | | | | | 1.32% | |
Ratio of expenses to average net assets prior to fees waived | | | | 1.40% | | | | | 1.36% | | | | | 1.32% | | | | | 1.34% | | | | | 1.37% | |
Ratio of net investment income to average net assets | | | | 1.92% | | | | | 1.75% | | | | | 1.53% | | | | | 1.41% | | | | | 1.88% | |
Ratio of net investment income to average net assets prior to fees waived | | | | 1.87% | | | | | 1.70% | | | | | 1.48% | | | | | 1.36% | | | | | 1.83% | |
Portfolio turnover | | | | 13% | | | | | 15% | | | | | 19% | | | | | 11% | | | | | 27% | |
| 1 | The average shares outstanding method has been applied for per share information. |
| 2 | Total return is based on the change in net asset value of a share during the period and assumes reinvestment of dividends and distributions at net asset value. Total return during all of the periods shown reflects a waiver by the distributor. Performance would have been lower had the waiver not been in effect. Total return does not include fees, charges, or expenses imposed by the variable annuity and life insurance contracts for which Delaware VIP Trust serves as an underlying investment vehicle. |
See accompanying notes, which are an integral part of the financial statements.
International Value Equity Series-13
Delaware VIP®Trust — Delaware VIP International Value Equity Series
Notes to financial statements
December 31, 2018
Delaware VIP Trust (Trust) is organized as a Delaware statutory trust and offers 10 series: Delaware VIP Diversified Income Series, Delaware VIP Emerging Markets Series, Delaware VIP High Yield Series, Delaware VIP International Value Equity Series, Delaware VIP Limited-Term Diversified Income Series, Delaware VIP REIT Series, Delaware VIP Small Cap Value Series, Delaware VIP Smid Cap Core Series, Delaware VIP U.S. Growth Series, and Delaware VIP Value Series. These financial statements and the related notes pertain to Delaware VIP International Value Equity Series (Series). The Trust is anopen-end investment company. The Series is considered diversified under the Investment Company Act of 1940, as amended, and offers Standard Class and Service Class shares. The Standard Class shares do not carry a distribution and service(12b-1) fee and the Service Class shares carry a12b-1 fee. The shares of the Series are sold only to separate accounts of life insurance companies.
The investment objective of the Series is to seek long-term growth without undue risk to principal.
1. Significant Accounting Policies
The Series is an investment company and follows accounting and reporting guidance under Financial Accounting Standards Board (FASB) Accounting Standards Codification Topic 946, Financial Services – Investment Companies. The following accounting policies are in accordance with US generally accepted accounting principles (US GAAP) and are consistently followed by the Series.
Security Valuation— Equity securities, except those traded on the Nasdaq Stock Market LLC (Nasdaq), are valued at the last quoted sales price as of the time of the regular close of the New York Stock Exchange on the valuation date. Equity securities traded on the Nasdaq are valued in accordance with the Nasdaq Official Closing Price, which may not be the last sales price. If, on a particular day, an equity security does not trade, the mean between the bid and ask prices will be used, which approximates fair value. Equity securities listed on a foreign exchange are normally valued at the last quoted sales price on the valuation date. US government and agency securities are valued at the mean between the bid and ask prices, which approximates fair value. Investments in repurchase agreements are generally valued at par, which approximates fair value, each business day.Open-end investment company securities are valued at net asset value (NAV) per share, as reported by the underlying investment company. Foreign currency exchange contracts and foreign cross currency exchange contracts are valued at the mean between the bid and ask prices, which approximates fair value. Interpolated values are derived when the settlement date of the contract is an interim date for which quotations are not available. Generally, other securities and assets for which market quotations are not readily available are valued at fair value as determined in good faith under the direction of the Trust’s Board of Trustees (Board). In determining whether market quotations are readily available or fair valuation will be used, various factors will be taken into consideration, such as market closures or suspension of trading in a security. The Series may use fair value pricing more frequently for securities traded primarily innon-US markets because, among other things, most foreign markets close well before the Series values its securities, generally as of 4:00pm Eastern time. The earlier close of these foreign markets gives rise to the possibility that significant events, including broad market moves, government actions or pronouncements, aftermarket trading, or news events may have occurred in the interim. Whenever such a significant event occurs, the Series may value foreign securities using fair value prices based on third-party vendor modeling tools (international fair value pricing). Restricted securities are valued at fair value using methods approved by the Board.
Federal and Foreign Income Taxes— No provision for federal income taxes has been made as the Series intends to continue to qualify for federal income tax purposes as a regulated investment company under Subchapter M of the Internal Revenue Code of 1986, as amended, and make the requisite distributions to shareholders. The Series evaluates tax positions taken or expected to be taken in the course of preparing the Series’ tax returns to determine whether the tax positions are“more-likely-than-not” of being sustained by the applicable tax authority. Tax positions not deemed to meet the“more-likely-than-not” threshold are recorded as a tax benefit or expense in the current year. Management has analyzed the Series’ tax positions taken or expected to be taken on the Series’ federal income tax returns through the year ended Dec. 31, 2018 and for all open tax years (years ended Dec. 31, 2015–Dec. 31, 2017), and has concluded that no provision for federal income tax is required in the Series’ financial statements. If applicable, the Series recognizes interest accrued on unrecognized tax benefits in interest expense and penalties in other expenses on the “Statement of operations.” During the year ended Dec. 31, 2018, the Series did not incur any interest or tax penalties. In regard to foreign taxes only, the Series has open tax years in certain foreign countries in which it invests in that may date back to the inception of the Series.
Class Accounting— Investment income, common expenses, and realized and unrealized gain (loss) on investments are allocated to the various classes of the Series on the basis of daily net assets of each class. Distribution expenses relating to a specific class are charged directly to that class.
Repurchase Agreements— The Series may purchase certain US government securities subject to the counterparty’s agreement to repurchase them at an agreed upon date and price. The counterparty will be required on a daily basis to maintain the value of the collateral subject to the agreement at not less than the repurchase price (including accrued interest). The agreements are conditioned upon the collateral being deposited under the Federal Reserve book-entry system with the Series’ custodian or a third-partysub-custodian. In the event of default or bankruptcy by the other party to the agreement, retention of the collateral may be subject to legal proceedings. All open repurchase agreements as of the date of this report were entered into on Dec. 31, 2018, and matured on the next business day.
International Value Equity Series-14
Delaware VIP®International Value Equity Series
Notes to financial statements (continued)
1. Significant Accounting Policies (continued)
Foreign Currency Transactions— Transactions denominated in foreign currencies are recorded at the prevailing exchange rates on the valuation date in accordance with the Series’ prospectus. The value of all assets and liabilities denominated in foreign currencies is translated daily into US dollars at the exchange rate of such currencies against the US dollar. Transaction gains or losses resulting from changes in exchange rates during the reporting period or upon settlement of the foreign currency transaction are reported in operations for the current period. The Series generally does not bifurcate that portion of realized gains and losses on investments which is due to changes in foreign exchange rates from that which is due to changes in market prices. These gains and losses are included on the “Statement of operations” under “Net realized gain (loss) on investments.” The Series reports certain foreign currency related transactions as components of realized gains (losses) for financial reporting purposes, whereas such components are treated as ordinary income (loss) for federal income tax purposes.
Use of Estimates— The preparation of financial statements in conformity with US GAAP requires management to make estimates and assumptions that affect the fair value of investments, the reported amounts of assets and liabilities and disclosure of contingent assets and liabilities at the date of the financial statements, and the reported amounts of revenues and expenses during the reporting period. Actual results could differ from those estimates and the differences could be material.
Other— Expenses directly attributable to the Series are charged directly to the Series. Other expenses common to various funds within the Delaware Funds®by Macquarie (Delaware Funds) are generally allocated among such funds on the basis of average net assets. Management fees and certain other expenses are paid monthly. Security transactions are recorded on the date the securities are purchased or sold (trade date) for financial reporting purposes. Costs used in calculating realized gains and losses on the sale of investment securities are those of the specific securities sold. Dividend income is recorded on theex-dividend date and interest income is recorded on the accrual basis. Discounts and premiums on debt securities are accreted or amortized to interest income, respectively, over the lives of the respective securities using the effective interest method. Taxablenon-cash dividends are recorded as dividend income. Foreign dividends are also recorded on theex-dividend date or as soon after theex-dividend date that the Series is aware of such dividends, net of all tax withholdings, a portion of which may be reclaimable. Withholding taxes and reclaims on foreign dividends have been recorded in accordance with the Series’ understanding of the applicable country’s tax rules and rates. The Series declares and pays dividends from net investment income and distributions from net realized gain on investments, if any, following the close of the fiscal year. The Series may distribute more frequently, if necessary for tax purposes. Dividends and distributions, if any, are recorded on theex-dividend date.
The Series receives earnings credits from its custodian when positive cash balances are maintained, which may be used to offset custody fees. The expenses paid under this arrangement are included on the “Statement of operations” under “Custodian fees” with the corresponding expenses offset included under “Less expenses paid indirectly.” For the year ended Dec. 31, 2018, the Series earned $82 under this arrangement.
The Series receives earnings credits from its transfer agent when positive cash balances are maintained, which may be used to offset transfer agent fees. If the amount earned is greater than $1, the expenses paid under this arrangement is included on the “Statement of operations” under “Dividend disbursing and transfer agent fees and expenses” with the corresponding expenses offset included under “Less expenses paid indirectly.” For the year ended Dec. 31, 2018, the Series earned $2 under this arrangement.
2. Investment Management, Administration Agreements, and Other Transactions with Affiliates
In accordance with the terms of its investment management agreement, the Series pays Delaware Management Company (DMC), a series of Macquarie Investment Management Business Trust and the investment manager, an annual fee which is calculated daily and paid monthly at the rate of 0.85% on the first $500 million of average daily net assets of the Series, 0.80% on the next $500 million, 0.75% on the next $1.5 billion, and 0.70% on average daily net assets in excess of $2.5 billion.
DMC has contractually agreed to waive all or a portion of its investment advisory fees and/or pay/reimburse expenses (excluding any12b-1 fee, acquired fund fees and expenses, taxes, interest, short sale and dividend interest expenses, brokerage fees, certain insurance costs, and nonroutine expenses or costs, including, but not limited to, those relating to reorganizations, litigation, conducting shareholder meetings, and liquidations) in order to prevent annual series operating expenses from exceeding 1.04% of the Series’ average daily net assets from April 30, 2018 through Dec. 31, 2018.* The waiver and reimbursement are accrued daily and received monthly. This waiver and reimbursement may only be terminated by agreement of DMC and the Series.
Delaware Investments Fund Services Company (DIFSC), an affiliate of DMC, provides fund accounting and financial administration oversight services to the Series. For these services, DIFSC’s fees are calculated daily and paid monthly based on the aggregate daily net assets of all funds within the Delaware Funds at the following annual rates: 0.00475% of the first $35 billion; 0.0040% of the next $10 billion; and 0.0025% of aggregate average daily net assets in excess of $45 billion (Total Fee). Each Fund in the Delaware Funds pays a minimum of $4,000, which, in aggregate, is subtracted from the Total Fee. Each Fund then pays its portion of the remainder of the Total Fee on a relative NAV basis. For the year ended Dec. 31, 2018, the Series was charged $5,878 for these services. This amount is included on the “Statement of operations” under “Accounting and administration expenses.”
International Value Equity Series-15
Delaware VIP®International Value Equity Series
Notes to financial statements (continued)
2. Investment Management, Administration Agreements, and Other Transactions with Affiliates (continued)
DIFSC is also the transfer agent and dividend disbursing agent of the Series. For these services, DIFSC’s fees are calculated daily and paid monthly at the annual rate of 0.0075% of the Series’ average daily net assets. This amount is included on the “Statement of operations” under “Dividend disbursing and transfer agent fees and expenses.” For the year ended Dec. 31, 2018, the Series was charged $3,730 for these services. Pursuant to asub-transfer agency agreement between DIFSC and BNY Mellon Investment Servicing (US) Inc. (BNYMIS), BNYMIS provides certainsub-transfer agency services to the Series.Sub-transfer agency fees are paid by the Series and are also included on the “Statement of operations” under “Dividend disbursing and transfer agent fees and expenses.”
Pursuant to a distribution agreement and distribution plan, the Series pays Delaware Distributors, L.P. (DDLP), the distributor and an affiliate of DMC, an annual12b-1 fee of 0.30% of the average daily net assets of the Service Class shares. Prior to May 1, 2018, DDLP had contracted to waive12b-1 fees in order to limit12b-1 fees of the Service Class shares to 0.25% of average daily net assets. The fees are calculated daily and paid monthly. Standard Class shares pay no12b-1 fees.
As provided in the investment management agreement, the Series bears a portion of the cost of certain resources shared with DMC, including the cost of internal personnel of DMC and/or its affiliates that provide legal, tax, and regulatory reporting services to the Series. For the year ended Dec. 31, 2018, the Series was charged $3,396 for internal legal, tax, and regulatory reporting services provided by DMC and/or its affiliates’ employees. This amount is included on the “Statement of operations” under “Legal fees.”
Trustees’ fees include expenses accrued by the Series for each Trustee’s retainer and meeting fees. Certain officers of DMC, DIFSC, and DDLP are officers and/or Trustees of the Trust. These officers and Trustees are paid no compensation by the Series.
*The aggregate contractual waiver period covering this report is from April 30, 2018 through April 30, 2019.
3. Investments
For the year ended Dec. 31, 2018, the Series made purchases and sales of investment securities other than short-term investments as follows:
| | | | |
Purchases | | $ | 10,113,234 | |
Sales | | | 6,178,814 | |
The tax cost of investments includes adjustments to net unrealized appreciation (depreciation) which may not necessarily be final tax cost basis adjustments, but approximate the tax basis unrealized gains and losses that may be realized and distributed to shareholders. At Dec. 31, 2018, the cost and unrealized appreciation (depreciation) of investments in the Series for federal income tax purposes were as follows:
| | | | | | |
Cost of Investments | | Aggregate
Unrealized
Appreciation of Investments | | Aggregate
Unrealized
Depreciation
of Investments | | Net Unrealized
Depreciation
of Investments |
| $47,354,852 | | $5,287,239 | | $(9,020,357) | | $(3,733,118) |
US GAAP defines fair value as the price that the Series would receive to sell an asset or pay to transfer a liability in an orderly transaction between market participants at the measurement date under current market conditions. A three-level hierarchy for fair value measurements has been established based upon the transparency of inputs to the valuation of an asset or liability. Inputs may be observable or unobservable and refer broadly to the assumptions that market participants would use in pricing the asset or liability. Observable inputs reflect the assumptions market participants would use in pricing the asset or liability based on market data obtained from sources independent of the reporting entity. Unobservable inputs reflect the reporting entity’s own assumptions about the assumptions that market participants would use in pricing the asset or liability based on the best information available under the circumstances. The Series’ investment in its entirety is assigned a level based upon the observability of the inputs which are significant to the overall valuation. The three-level hierarchy of inputs is summarized below and on the next page.
| | | | |
| Level 1 | | – | | Inputs are quoted prices in active markets for identical investments. (Examples: equity securities,open-end investment companies, futures contracts, exchange-traded options contracts) |
| Level 2 | | – | | Other observable inputs, including, but not limited to: quoted prices for similar assets or liabilities in markets that are active, quoted prices for identical or similar assets or liabilities in markets that are not active, inputs other than quoted prices that are observable for the assets or liabilities (such as interest rates, yield curves, volatilities, prepayment speeds, loss severities, credit risks, and default rates) or other market-corroborated inputs. (Examples: debt securities, government securities, swap contracts, foreign currency exchange contracts, foreign securities utilizing international fair value pricing, broker-quoted securities, fair valued securities) |
| Level 3 | | – | | Significant unobservable inputs, including the Series’ own assumptions used to determine the fair value of investments. (Examples: broker-quoted securities, fair valued securities) |
International Value Equity Series-16
Delaware VIP®International Value Equity Series
Notes to financial statements (continued)
3. Investments (continued)
Level 3 investments are valued using significant unobservable inputs. The Series may also use an income-based valuation approach in which the anticipated future cash flows of the investment are discounted to calculate fair value. Discounts may also be applied due to the nature or duration of any restrictions on the disposition of the investments. Valuations may also be based upon current market prices of securities that are comparable in coupon, rating, maturity, and industry. The derived value of a Level 3 investment may not represent the value which is received upon disposition and this could impact the results of operations.
The following table summarizes the valuation of the Series’ investments by fair value hierarchy levels as of Dec. 31, 2018:
| | | | | | | | | | | | |
Securities | | Level 1 | | | Level 2 | | | Total | |
Assets: | | | | | | | | | | | | |
Common Stock | | | | | | | | | | | | |
Australia | | $ | 197,875 | | | $ | — | | | $ | 197,875 | |
Canada | | | 2,133,797 | | | | — | | | | 2,133,797 | |
China/Hong Kong | | | 4,099,360 | | | | — | | | | 4,099,360 | |
Denmark | | | — | | | | 1,054,111 | | | | 1,054,111 | |
France | | | 7,779,854 | | | | — | | | | 7,779,854 | |
Germany | | | — | | | | 1,867,608 | | | | 1,867,608 | |
Indonesia | | | — | | | | 1,044,299 | | | | 1,044,299 | |
Italy | | | — | | | | 1,211,147 | | | | 1,211,147 | |
Japan | | | — | | | | 9,156,061 | | | | 9,156,061 | |
Netherlands | | | 2,059,525 | | | | — | | | | 2,059,525 | |
Panama | | | 590,325 | | | | — | | | | 590,325 | |
Republic of Korea | | | — | | | | 914,504 | | | | 914,504 | |
Russia | | | 387,100 | | | | — | | | | 387,100 | |
Singapore | | | 448,874 | | | | — | | | | 448,874 | |
Spain | | | 809,949 | | | | — | | | | 809,949 | |
Sweden | | | — | | | | 1,671,434 | | | | 1,671,434 | |
Switzerland | | | — | | | | 1,516,332 | | | | 1,516,332 | |
United Kingdom | | | 6,464,636 | | | | — | | | | 6,464,636 | |
Securities Lending Collateral | | | — | | | | 9,545 | | | | 9,545 | |
Short-Term Investments | | | — | | | | 205,398 | | | | 205,398 | |
| | | | | | | | | | | | |
Total Value of Securities | | $ | 24,971,295 | | | $ | 18,650,439 | | | $ | 43,621,734 | |
| | | | | | | | | | | | |
As a result of utilizing international fair value pricing at Dec. 31, 2018, a portion of the common stock in the portfolio was categorized as Level 2.
During the year ended Dec. 31, 2018, there were no transfers between Level 1 investments, Level 2 investments, or Level 3 investments that had a significant impact to the Series. This does not include transfers between Level 1 investments and Level 2 investments due to the Series utilizing international fair value pricing during the year. In accordance with the fair valuation procedures described in Note 1, international fair value pricing of securities in the Series’ occurs when market volatility exceeds an established rolling threshold. If the threshold is exceeded on a given date, then prices of international securities (those that traded on exchanges that close at a different time than the time that the Series’ NAV is determined) are established using a separate pricing feed from a third party vendor designed to establish a price for each such security as of the time that the Series’ NAV is determined. Further, international fair value pricing uses other observable market-based inputs in place of the closing exchange price due to the events occurring after the close of the exchange or market on which the investment is principally traded, causing a change in classification between levels. The Series’ policy is to recognize transfers between levels based on fair value at the beginning of the reporting period.
A reconciliation of Level 3 investments is presented when the Series has a significant amount of Level 3 investments at the beginning, interim, or end of the period in relation to net assets. During the year ended Dec. 31, 2018, there were no Level 3 investments.
4. Dividend and Distribution Information
Income and long-term capital gain distributions are determined in accordance with federal income tax regulations, which may differ from US GAAP.
Additionally, distributions from net gains on foreign currency transactions and net short-term gains on sales of investment securities are treated as ordinary
International Value Equity Series-17
Delaware VIP®International Value Equity Series
Notes to financial statements (continued)
4. Dividend and Distribution Information (continued)
income for federal income tax purposes. The tax character of dividends and distributions paid during the years ended Dec. 31, 2018 and 2017 was as follows:
| | | | | | | | |
| | | Year ended | |
| | | 12/31/18 | | | 12/31/17 | |
Ordinary income | | | $1,396,169 | | | | $1,135,740 | |
5. Components of Net Assets on a Tax Basis
As of Dec. 31, 2018, the components of net assets on a tax basis were as follows:
| | | | |
| |
Shares of beneficial interest | | | $45,773,868 | |
Undistributed ordinary income | | | 1,073,587 | |
Undistributed long-term capital gains | | | 834,878 | |
Net unrealized depreciation on investments, foreign currencies, and derivatives | | | (3,733,118 | ) |
| | | | |
Net assets | | | $43,949,215 | |
| | | | |
The differences between book basis and tax basis components of net assets are primarily attributable to tax deferral of losses on wash sales.
6. Capital Shares
Transactions in capital shares were as follows:
| | | | | | | | |
| | | Year ended | |
| | | 12/31/18 | | | 12/31/17 | |
Shares sold: | | | | | | | | |
Standard Class | | | 352,272 | | | | 536,097 | |
Service Class | | | 25,616 | | | | 59,256 | |
Shares issued upon reinvestment of dividends and distributions: | | | | | | | | |
Standard Class | | | 107,041 | | | | 97,814 | |
Service Class | | | 856 | | | | 520 | |
| | | | | | | | |
| | | 485,785 | | | | 693,687 | |
| | | | | | | | |
Shares redeemed: | | | | | | | | |
Standard Class | | | (266,457 | ) | | | (2,686,700 | ) |
Service Class | | | (3,703 | ) | | | (62,462 | ) |
| | | | | | | | |
| | | (270,160 | ) | | | (2,749,162 | ) |
| | | | | | | | |
Net increase (decrease) | | | 215,625 | | | | (2,055,475 | ) |
| | | | | | | | |
7. Line of Credit
The Series, along with certain other funds in the Delaware Funds (Participants), was a participant in a revolving line of credit intended to be used for temporary or emergency purposes as an additional source of liquidity to fund redemptions of investor shares. Under the agreement, the Participants were charged an annual commitment fee of 0.15%, which was allocated across the Participants based on a weighted average of the respective net assets of each Participant. The revolving line of credit available was reduced from $155,000,000 to $130,000,000 on Sept.6, 2018. The Participants were permitted to borrow up to a maximum ofone-third of their net assets under the agreement. Each Participant was individually, and not jointly, liable for its particular advances, if any, under the line of credit. The line of credit available under the agreement expired on Nov. 5, 2018.
On Nov. 5, 2018, the Participants entered into an amendment to the agreement for a $190,000,000 revolving line of credit. The revolving line of credit available was increased to $220,000,000 on Nov. 29, 2018. The revolving line of credit is to be used as described above and operated in substantially the same manner as the original agreement. The line of credit available under the agreement expires on Nov. 4, 2019.
The Series had no amounts outstanding as of Dec. 31, 2018, or at any time during the year then ended.
International Value Equity Series-18
Delaware VIP®International Value Equity Series
Notes to financial statements (continued)
8. Derivatives
US GAAP requires disclosures that enable investors to understand: (1) how and why an entity uses derivatives; (2) how they are accounted for; and (3) how they affect an entity’s results of operations and financial position.
Foreign Currency Exchange Contracts
The Series may enter into foreign currency exchange contracts and foreign cross currency exchange contracts as a way of managing foreign exchange rate risk. The Series may enter into these contracts to fix the US dollar value of a security that it has agreed to buy or sell for the period between the date the trade was entered into and the date the security is delivered and paid for. The Series may also use these contracts to hedge the US dollar value of securities it already owns that are denominated in foreign currencies. In addition, the Series may enter into these contracts to facilitate or expedite the settlement of portfolio transactions. The change in value is recorded as an unrealized gain or loss. When the contract is closed, a realized gain or loss is recorded equal to the difference between the value of the contract at the time it was opened and the value at the time it was closed.
The use of foreign currency exchange contracts and foreign cross currency exchange contracts does not eliminate fluctuations in the underlying prices of the securities, but does establish a rate of exchange that can be achieved in the future. Although foreign currency exchange contracts and foreign cross currency exchange contracts limit the risk of loss due to an unfavorable change in the value of the hedged currency, they also limit any potential gain that might result should the value of the currency change favorably. In addition, the Series could be exposed to risks if the counterparties to the contracts are unable to meet the terms of their contracts. The Series’ maximum risk of loss from counterparty credit risk is the value of its currency exchanged with the counterparty. The risk is generally mitigated by having a netting arrangement between the Series and the counterparty and by the posting of collateral by the counterparty to the Series to cover the Series’ exposure to the counterparty. No foreign currency exchange contracts and foreign cross currency contracts were outstanding at Dec. 31, 2018.
During the year ended Dec. 31, 2018, the Series entered into foreign currency exchange contracts and foreign cross currency exchange contracts to fix the US dollar value of a security between trade date and settlement date and to facilitate or expedite the settlement of portfolio transactions.
During the year ended Dec. 31, 2018, the Series experienced net realized gains or losses attributable to foreign currency holdings, which is disclosed on the “Statement of assets and liabilities” and “Statement of operations.”
Derivatives Generally.The table below summarizes the average balance of derivative holdings by the Series during the year ended Dec. 31, 2018.
| | | | |
| | | Long Derivatives | | Short Derivatives |
| | | Volume | | Volume |
Foreign currency exchange contracts (Average cost) | | $48,911 | | $32,741 |
9. Offsetting
Master Repurchase Agreements
Repurchase agreements are entered into by the Series under master repurchase agreements (each, an MRA). The MRA permits the Series, under certain circumstances including an event of default (such as bankruptcy or insolvency), to offset payables and/or receivables with collateral held by and/or posted to the counterparty. As a result, one single net payment is created. Bankruptcy or insolvency laws of a particular jurisdiction may impose restrictions on or prohibitions against such a right of offset in the event of the MRA counterparty’s bankruptcy or insolvency. Based on the terms of the MRA, the Series receives securities as collateral with a market value in excess of the repurchase price at maturity. Upon a bankruptcy or insolvency of the MRA counterparty, the Series would recognize a liability with respect to such excess collateral. The liability reflects the Series’ obligation under bankruptcy law to return the excess to the counterparty. As of Dec. 31, 2018, the following table is a summary of the Series’ repurchase agreements by counterparty which are subject to offset under an MRA:
| | | | | | | | | | |
Counterparty | | Repurchase
Agreements | | Fair Value of
Non-Cash
Collateral Received(a) | | Cash Collateral
Received | | Net Collateral
Received | | Net Exposure(b) |
Bank of America Merrill Lynch | | $ 18,788 | | $ — | | $(18,788) | | $ (18,788) | | $— |
Bank of Montreal | | 51,668 | | (51,668) | | — | | (51,668) | | — |
BNP Paribas | | 84,486 | | (84,486) | | — | | (84,486) | | — |
Total | | $154,942 | | $(136,154) | | $(18,788) | | $(154,942) | | $— |
Securities Lending
Securities lending transactions are entered into by the Series under master securities lending agreements (each, an “MSLA”) which provide the right, in the event of default (including bankruptcy or insolvency), for thenon-defaulting party to liquidate the collateral and calculate a net exposure to the defaulting
International Value Equity Series-19
Delaware VIP®International Value Equity Series
Notes to financial statements (continued)
9. Offsetting (continued)
party or request additional collateral. In the event that a borrower defaults, the Series, as lender, would offset the market value of the collateral received against the market value of the securities loaned. When the value of the collateral is greater than that of the market value of the securities loaned, the lender is left with a net amount payable to the defaulting party. However, bankruptcy or insolvency laws of a particular jurisdiction may impose restrictions on or prohibitions against such a right of offset in the event of an MLSA counterparty’s bankruptcy or insolvency. Under the MSLA, the borrower can resell orre-pledge the loaned securities, and the Series can reinvest cash collateral, or, upon an event of default, resell, orre-pledge the collateral (see also Note 10).
As of Dec. 31, 2018, the following table is a summary of the Series securities lending agreement by counterparty which are subject to offset under an MSLA:
| | | | | | | | | | |
Counterparty | | Securities Loaned
at Value | | Cash Collateral
Received -
Invested in Securities(a) | | Fair Value of
Non-Cash Collateral
Received | | Net Collateral
Received | | Net Exposure(b) |
BNY Mellon | | $8,652 | | $(8,652) | | $ — | | $(8,652) | | $ — |
(a)The value of the related collateral received exceeded the value of the repurchase agreements and securities loaned at value, as applicable, as of Dec. 31, 2018.
(b)Net exposure represents the receivable (payable) that would be due from (to) the counterparty in the event of default.
10. Securities Lending
The Series, along with other funds in the Delaware Funds, may lend its securities pursuant to a security lending agreement (Lending Agreement) with The Bank of New York Mellon (BNY Mellon). At the time a security is loaned, the borrower must post collateral equal to the required percentage of the market value of the loaned security, including any accrued interest. The required percentage is: (1) 102% with respect to US securities and foreign securities that are denominated and payable in US dollars; and (2) 105% with respect to foreign securities. With respect to each loan, if on any business day, the aggregate market value of securities collateral plus cash collateral held is less than the aggregate market value of the securities which are the subject of such loan, the borrower will be notified to provide additional collateral by the end of the following business day, which, together with the collateral already held, will be not less than the applicable initial collateral requirements for such security loan. If the aggregate market value of securities collateral and cash collateral held with respect to a security loan exceeds the applicable initial collateral requirement, upon the request of the borrower, BNY Mellon must return enough collateral to the borrower by the end of the following business day to reduce the value of the remaining collateral to the applicable initial collateral requirement for such security loan. As a result of the foregoing, the value of the collateral held with respect to a loaned security on any particular day, may be more or less than the value of the security on loan. The collateral percentage with respect to the market value of the loaned security is determined by the security lending agent.
Cash collateral received by each series of the Trust is generally invested in a series of individual separate accounts, each corresponding to a series. The investment guidelines permit each separate account to hold certain securities that would be considered eligible securities for a money market fund. Cash collateral received is generally invested in government securities; certain obligations issued by government sponsored enterprises; repurchase agreements collateralized by US Treasury securities; obligations issued by the central government of any Organization for Economic Cooperation and Development (OECD) country or its agencies, instrumentalities, or establishments; obligations of supranational organizations; commercial paper, notes, bonds, and other debt obligations; certificates of deposit, time deposits, and other bank obligations; and asset-backed securities as disclosed on the “Schedule of Investments.” Securities purchased with cash collateral are valued at the market value. The Series can also accept US government securities and letters of credit(non-cash collateral) in connection with securities loans.
In the event of default or bankruptcy by the lending agent, realization and/or retention of the collateral may be subject to legal proceedings. In the event the borrower fails to return loaned securities and the collateral received is insufficient to cover the value of the loaned securities and provided such collateral shortfall is not the result of investment losses, the lending agent has agreed to pay the amount of the shortfall to the Series or, at the discretion of the lending agent, replace the loaned securities. The Series continues to record dividends or interest, as applicable, on the securities loaned and is subject to changes in value of the securities loaned that may occur during the term of the loan. The Series has the right under the Lending Agreement to recover the securities from the borrower on demand. With respect to security loans collateralized bynon-cash collateral, the Series receives loan premiums paid by the borrower. With respect to security loans collateralized by cash collateral, the earnings from the collateral investments are shared among the Series, the security lending agent, and the borrower. The Series records security lending income net of allocations to the security lending agent and the borrower.
The Series may incur investment losses as a result of investing securities lending collateral. This could occur if an investment in the collateral investment account defaulted or became impaired. Under those circumstances, the value of the Series’ cash collateral account may be less than the amount the Series would be required to return to the borrowers of the securities and the Series would be required to make up for this shortfall.
International Value Equity Series-20
Delaware VIP®International Value Equity Series
Notes to financial statements (continued)
10. Securities Lending (continued)
The following table reflects a breakdown of transactions in securities lending collateral accounted for as secured borrowings, the gross obligation by the type of collateral pledged, and the remaining contractual maturity of those transactions as of Dec. 31, 2018:
Remaining Contractual Maturity of the Agreements as of Dec. 31, 2018
| | | | | | | | | | |
Securities Lending Transactions | | Overnight
and
Continuous | | Under
30 days | | Between
30 and 90 days | | Over
90 days | | Total |
Repurchase Agreements | | $9,545 | | $— | | $— | | $— | | $9,545 |
At Dec. 31, 2018, the value of securities on loan was $8,652 for which the Series received cash collateral of $9,545. At Dec. 31, 2018, the value of invested collateral was $9,545. Investments purchased with cash collateral are presented on the “Schedule of investments” under the caption “Securities Lending Collateral.”
11. Credit and Market Risk
Some countries in which the Series may invest require governmental approval for the repatriation of investment income, capital, or the proceeds of sales of securities by foreign investors. In addition, if there is deterioration in a country’s balance of payments or for other reasons, a country may impose temporary restrictions on foreign capital remittances abroad.
The securities exchanges of certain foreign markets are substantially smaller, less liquid, and more volatile than the major securities markets in the US. Consequently, acquisition and disposition of securities by the Series may be inhibited. In addition, a significant portion of the aggregate market value of equity securities listed on the major securities exchanges in emerging markets is held by a smaller number of investors. This may limit the number of shares available for acquisition or disposition by the Series.
The Series may invest up to 10% of its net assets in illiquid securities, which may include securities with contractual restrictions on resale, securities exempt from registration under Rule 144A promulgated under the Securities Act of 1933, as amended, and other securities which may not be readily marketable. The relative illiquidity of these securities may impair the Series from disposing of them in a timely manner and at a fair price when it is necessary or desirable to do so. While maintaining oversight, the Board has delegated to DMC, theday-to-day functions of determining whether individual securities are liquid for purposes of the Series’ limitation on investments in illiquid securities. Securities eligible for resale pursuant to Rule 144A, which are determined to be liquid, are not subject to the Series’ 10% limit on investments in illiquid securities. As of Dec. 31, 2018, there were no Rule 144A securities held by the Series. Restricted securities are valued pursuant to the security valuation procedures described in Note 1.
12. Contractual Obligations
The Series enters into contracts in the normal course of business that contain a variety of indemnifications. The Series’ maximum exposure under these arrangements is unknown. However, the Series has not had prior claims or losses pursuant to these contracts. Management has reviewed the Series’ existing contracts and expects the risk of loss to be remote.
13. Recent Accounting Pronouncements
In August 2018, the FASB issued an Accounting Standards Update, ASU2018-13, which changes certain fair value measurement disclosure requirements. The ASU2018-13, in addition to other modifications and additions, removes the requirement to disclose the amount and reasons for transfers between Level 1 and Level 2 of the fair value hierarchy, the policy for the timing of transfers between levels and the valuation process for Level 3 fair value measurements. The ASU2018-13 is effective for fiscal years, and interim periods within those fiscal years, beginning after Dec. 15, 2019. At this time, management is evaluating the implications of these changes on the financial statements.
In August 2018, the Securities and Exchange Commission (SEC) adopted amendments to RegulationS-X to update and simplify the disclosure requirements for registered investment companies by eliminating requirements that are redundant or duplicative of US GAAP requirements or other SEC disclosure requirements. The new amendments require the presentation of the total, rather than the components, of distributable earnings on the “Statement of assets and liabilities” and the total, rather than the components, of dividends from net investment income and distributions from net realized gains on the “Statements of changes in net assets.” The amendments also removed the requirement for the parenthetical disclosure of undistributed net investment income on the “Statements of changes in net assets” and certain tax adjustments that were reflected in the “Notes to financial statements.” All of these have been reflected in the Series’ financial statements.
International Value Equity Series-21
Delaware VIP®International Value Equity Series
Notes to financial statements (continued)
14. Subsequent Events
Management has determined that no material events or transactions occurred subsequent to Dec. 31, 2018, that would require recognition or disclosure in the Series’ financial statements.
International Value EquitySeries-22
Delaware VIP® Trust — Delaware VIP International Value Equity Series
Report of independent registered public accounting firm
To the Board of Trustees of Delaware VIP®Trust and Shareholders of Delaware VIP International Value Equity Series
Opinion on the Financial Statements
We have audited the accompanying statement of assets and liabilities, including the schedule of investments, of Delaware VIP International Value Equity Series (one of the series constituting Delaware VIP®Trust, referred to hereafter as the “Series”) as of December 31, 2018, the related statement of operations for the year ended December 31, 2018, the statements of changes in net assets for each of the two years in the period ended December 31, 2018, including the related notes, and the financial highlights for each of the five years in the period ended December 31, 2018 (collectively referred to as the “financial statements”). In our opinion, the financial statements present fairly, in all material respects, the financial position of the Series as of December 31, 2018, the results of its operations for the year then ended, the changes in its net assets for each of the two years in the period ended December 31, 2018 and the financial highlights for each of the five years in the period ended December 31, 2018 in conformity with accounting principles generally accepted in the United States of America.
Basis for Opinion
These financial statements are the responsibility of the Series’ management. Our responsibility is to express an opinion on the Series’ financial statements based on our audits. We are a public accounting firm registered with the Public Company Accounting Oversight Board (United States) (PCAOB) and are required to be independent with respect to the Series in accordance with the U.S. federal securities laws and the applicable rules and regulations of the Securities and Exchange Commission and the PCAOB.
We conducted our audits of these financial statements in accordance with the standards of the PCAOB. Those standards require that we plan and perform the audit to obtain reasonable assurance about whether the financial statements are free of material misstatement, whether due to error or fraud.
Our audits included performing procedures to assess the risks of material misstatement of the financial statements, whether due to error or fraud, and performing procedures that respond to those risks. Such procedures included examining, on a test basis, evidence regarding the amounts and disclosures in the financial statements. Our audits also included evaluating the accounting principles used and significant estimates made by management, as well as evaluating the overall presentation of the financial statements. Our procedures included confirmation of securities owned as of December 31, 2018 by correspondence with the custodian and brokers. We believe that our audits provide a reasonable basis for our opinion.
/s/PricewaterhouseCoopers LLP
Philadelphia, Pennsylvania
February 14, 2019
We have served as the auditor of one or more investment companies in Delaware Funds®by Macquarie since 2010.
International Value EquitySeries-23
Delaware VIP® Trust — Delaware VIP International Value Equity Series
Other Series information (Unaudited)
Board consideration of investment advisory agreement for Delaware VIP International Value Equity Series
At a meeting held on Aug.15-16, 2018 (the “Annual Meeting”), the Board of Trustees (the “Board”), including a majority of disinterested or independent Trustees, approved the renewal of the Investment Advisory Agreement for Delaware VIP International Value Equity Series (the “Series”). In making its decision, the Board considered information furnished at regular quarterly Board meetings, including reports detailing Series performance, investment strategies, and expenses, as well as information prepared specifically in connection with the renewal of the Investment Advisory Agreement. Information furnished specifically in connection with the renewal of the Investment Advisory Agreement with Delaware Management Company (“DMC”), a series of Macquarie Investment Management Business Trust (“MIMBT”), included materials provided by DMC and its affiliates (collectively, “Macquarie Investment Management”) concerning, among other things, the nature, extent, and quality of services provided to the Series; the costs of such services to the Series; economies of scale; and the investment manager’s financial condition and profitability. In addition, in connection with the Annual Meeting, materials were provided to the Trustees in May 2018, including reports provided by Broadridge Financial Solutions (“Broadridge”). The Broadridge reports compared the Series’ investment performance and expenses with those of other comparable mutual funds. The Independent Trustees reviewed and discussed the Broadridge reports with independent legal counsel to the Independent Trustees. In addition to the information noted above, the Board also requested and received information regarding DMC’s policy with respect to advisory fee levels and its breakpoint philosophy; the structure of portfolio manager compensation; comparative client fee information; and any constraints or limitations on the availability of securities for certain investment styles, which had in the past year inhibited, or which were likely in the future to inhibit, the investment manager’s ability to invest fully in accordance with Series policies.
In considering information relating to the approval of the Series’ Investment Advisory Agreement, the Independent Trustees received assistance and advice from and met separately with independent legal counsel to the Independent Trustees and also received assistance and advice from an experienced and knowledgeable independent fund consultant, JDL Consultants, LLC (“JDL”). Although the Board gave attention to all information furnished, the following discussion identifies, under separate headings, the primary factors taken into account by the Board during its contract renewal considerations.
Nature, extent, and quality of services.The Board considered the services provided by DMC to the Series and its shareholders. In reviewing the nature, extent, and quality of services, the Board considered reports furnished to it throughout the year, which covered matters such as the relative performance of the Series, compliance of portfolio managers with the investment policies, strategies and restrictions for the Series, compliance by DMC and Delaware Distributors, L.P. (together, “Management”) personnel with the Code of Ethics adopted throughout the Delaware Funds®by Macquarie (the “Delaware Funds”), and adherence to fair value pricing procedures as established by the Board. The Board was pleased with the current staffing of DMC and the emphasis placed on research in the investment process. The Board recognized DMC’s receipt of certain favorable industry distinctions during the past several years. The Board gave favorable consideration to DMC’s efforts to control expenses while maintaining service levels committed to Series matters. The Board was satisfied with the nature, extent, and quality of the overall services provided by DMC.
Investment performance.The Board placed significant emphasis on the investment performance of the Series in view of the importance of investment performance to shareholders. Although the Board considered performance reports and discussions with portfolio managers at Board meetings throughout the year, the Board gave particular weight to the Broadridge reports furnished for the Annual Meeting. The Broadridge reports prepared for the Series showed the investment performance of its Standard Class shares in comparison to a group of similar funds as selected by Broadridge (the “Performance Universe”). A fund with the best performance ranked first, and a fund with the poorest performance ranked last. The highest/best performing 25% of funds in the Performance Universe make up the first quartile; the next 25%, the second quartile; the next 25%, the third quartile; and the poorest/worst performing 25% of funds in the Performance Universe make up the fourth quartile. Comparative annualized performance for the Series was shown for the past1-,3-,5- and10-year periods, as applicable, ended Jan. 31, 2018. The Board’s objective is that the Series’ performance for the1-,3- and5-year periods be at or above the median of its Performance Universe.
The Performance Universe for the Series consisted of the Series and all internationalmulti-cap value funds underlying variable insurance products as selected by Broadridge. The Broadridge report comparison showed that the Series’ total return for the1- and5-year periods was in the second quartile of its Performance Universe. The report further showed that the Series’ total return for the3- and10-year periods was in the first quartile of its Performance Universe. The Board was satisfied with performance.
Comparative expenses.The Board considered expense data for the Delaware Funds. Management provided the Board with information on pricing levels and fee structures for the Series as of its most recently completed fiscal year. The Board also focused on the comparative analysis of effective management fees and total expense ratios of the Series versus effective management fees and expense ratios of a group of similar funds as selected by Broadridge (the “Expense Group”). In reviewing comparative costs, the Series’ contractual management fee and the actual management fee incurred by the Series were compared with the contractual management fees (assuming all funds in the Expense Group were similar in size to the Series) and actual management fees (as reported by each fund) within the Expense Group, taking into account any applicable breakpoints and fee waivers. The Series’ total expenses were also compared with those of its Expense Group. The Broadridge total expenses, for comparative consistency, were shown by Broadridge for Standard Class shares which do not charge12b-1 andnon-12b-1 service fees. The Board’s objective is for the Series’ total expense ratio to be competitive with those of the peer funds within its Expense Group.
International Value Equity Series-24
Delaware VIP®Trust — Delaware VIP International Value Equity Series
Other Series information (Unaudited)
Board consideration of investment advisory agreement for Delaware VIP International Value Equity Series (continued)
The expense comparisons for the Series showed that its actual management fee was in the quartile with the highest expenses of its Expense Group and its total expenses were in the quartile with the second lowest expenses of its Expense Group. The Board was satisfied with the total expenses of the Series in comparison to those of its Expense Group.
Management profitability.The Board considered the level of profits realized by DMC in connection with the operation of the Series. In this respect, the Board reviewed the Investment Management Profitability Analysis that addressed the overall profitability of DMC’s business in providing management and other services to each of the individual funds and the Delaware Funds as a whole. Specific attention was given to the methodology used by DMC in allocating costs for the purpose of determining profitability. Management stated that the level of profits of DMC, to a certain extent, reflects recent operational cost savings and efficiencies initiated by DMC. The Board considered DMC’s efforts to improve services provided to Fund shareholders and to meet additional regulatory and compliance requirements resulting from recent industry-wide Securities and Exchange Commission initiatives. The Board also considered the extent to which DMC might derive ancillary benefits from fund operations, including the potential for procuring additional business as a result of the prestige and visibility associated with its role as service provider to the Delaware Funds and the benefits from allocation of fund brokerage to improve trading efficiencies. As part of its work, the Board also reviewed a report prepared by JDL regarding MIMBT profitability as compared to certain peer fund complexes and the Independent Trustees met with JDL personnel to discuss DMC’s profitability in such context. The Board found that the management fees were reasonable in light of the services rendered and the profitability of DMC.
Economies of scale.The Trustees considered whether economies of scale are realized by DMC as the Series’ assets increase and the extent to which any economies of scale are reflected in the level of management fees charged. The Trustees reviewed the Series’ advisory fee pricing and structure approved by the Board and shareholders, which includes breakpoints, and which applies to most funds in the Delaware Funds complex. Breakpoints in the advisory fee occur when the advisory fee rate is reduced on assets in excess of specified levels. Breakpoints result in a lower advisory fee, than would otherwise be the case in the absence of breakpoints, when the asset levels specified in the breakpoints are exceeded. Although, as of March 31, 2018, the Series has not reached a size at which the advantages of any breakpoints in the applicable fee schedule, the Board recognized that the fee was structured so that, if the Series increases sufficiently in size, then economies of scale may be shared.
Tax Information
For the year ended Dec. 31, 2018, the Series reports distributions paid during the year as follows:
|
| (A) |
| Ordinary Income |
| Distributions |
| (Tax Basis) |
100.00% |
All disclosures are based on financial information available as of the date of this annual report and, accordingly are subject to change. For any and all items requiring reporting, it is the intention of the Series to report the maximum amount permitted under the Internal Revenue Code and the regulations thereunder.
(A) is based on a percentage of the Series’ total distributions.
The Series intends to pass through foreign tax credits in the maximum amount of $93,625. The gross foreign source income earned during the fiscal year 2018 by the Series was $1,643,214.
International Value Equity Series-25
Delaware Funds®by Macquarie
Board of trustees/directors and officers addendum
A mutual fund is governed by a Board of Trustees/Directors (“Trustees”), which has oversight responsibility for the management of a fund’s business affairs. Trustees establish procedures and oversee and review the performance of the investment manager, the distributor, and others who perform services for the fund. The independent fund trustees, in particular, are advocates for shareholder interests. Each trustee has served in that capacity since he or she was elected to or appointed to the Board of Trustees, and will continue to serve until his or her retirement or the election of a new trustee in his or her place. The following is a list of the Trustees and Officers with certain background and related information.
| | | | | | | | | | |
Name, Address, and Birth Date | | Position(s) Held with Fund(s) | | Length of Time
Served | | Principal
Occupation(s)
During the Past Five Years | | Number of
Portfolios in Fund
Complex Overseen
by Trustee or Officer | | Other
Directorships
Held by Trustee
or Officer |
| INTERESTED TRUSTEE | | | | | | |
| | | | | |
Shawn K. Lytle1,3 2005 Market Street Philadelphia, PA 19103 February 1970 | | President, Chief Executive Officer, and Trustee | | President and Chief Executive Officer since August 2015 Trustee since
September 2015 | | President—Macquarie Investment Management2(June 2015-Present) Regional Head of Americas — UBS Global Asset Management(April 2010-May 2015) | | 59 | | Trustee — UBS Relationship Funds, SMA Relationship Trust, and UBS Funds (May 2010–April 2015) |
| INDEPENDENT TRUSTEES | | | | | | |
| | | | | |
Thomas L. Bennett 2005 Market Street Philadelphia, PA 19103 October 1947 | | Chair and Trustee | | Trustee since March 2005 Chair since March 2015 | | Private Investor (March 2004–Present) | | 59 | | None |
Jerome D. Abernathy2005 Market Street Philadelphia, PA 19103 July 1959 | | Trustee | | Since January 2019 | | Managing Member, Stonebrook Capital Management, LLC (financial technology: macro factors and databases) (January 1993–Present) | | 59 | | None |
Ann D. Borowiec 2005 Market Street Philadelphia, PA 19103 November 1958 | | Trustee | | Since March 2015 | | Chief Executive Officer, Private Wealth Management (2011–2013) and Market Manager, New Jersey Private Bank (2005–2011)—J.P. Morgan Chase & Co. | | 59 | | Director — Banco Santander International (October 2016-Present) Director — Santander Bank, N.A. (December 2016-Present) |
Joseph W. Chow 2005 Market Street Philadelphia, PA 19103 January 1953 | | Trustee | | Since January 2013 | | Private Investor (April 2011–Present) | | 59 | | Director and Audit Committee Member — Hercules Technology Growth Capital, Inc. (July 2004–July 2014) |
John A. Fry 2005 Market Street Philadelphia, PA 19103 May 1960 | | Trustee | | Since January 2001 | | President— Drexel University (August 2010–Present) President — Franklin & Marshall College (July 2002–July 2010) | | 59 | | Director; Compensation Committee and Governance Committee Member — Community Health Systems Director — Drexel Morgan & Co. Director and Audit Committee Member — vTv Therapeutics LLC Director and Audit Committee Member — FS Credit Real Estate Income Trust, Inc. |
Lucinda S. Landreth 2005 Market Street Philadelphia, PA 19103 June 1947 | | Trustee | | Since March 2005 | | Private Investor (2004–Present) | | 59 | | None |
International Value Equity Series-26
| | | | | | | | | | |
Name,
Address,
and Birth Date | | Position(s)
Held with
Fund(s) | | Length of Time Served | | Principal
Occupation(s)
During the
Past Five Years | | Number of
Portfolios in Fund
Complex Overseen
by Trustee
or Officer | | Other
Directorships
Held by
Trustee
or Officer |
| | | | | |
Frances A. Sevilla-Sacasa 2005 Market Street Philadelphia, PA 19103 January 1956 | | Trustee | | Since September 2011 | | Private Investor (January 2017-Present) Chief Executive Officer — Banco Itaú International (April 2012–December 2016) Executive Advisor to Dean (August 2011–March 2012) and Interim Dean (January 2011–July 2011)— University of Miami School of Business Administration President—U.S. Trust, Bank of America Private Wealth Management (Private Banking) (July 2007–December 2008) | | 59 | | Trust Manager and Audit Committee Chair — Camden Property Trust (August 2011-Present) Director — Carrizo Oil & Gas, Inc. (March 2018-Present) |
| | | | | |
Thomas K. Whitford 2005 Market Street Philadelphia, PA 19103 March 1956 | | Trustee | | Since January 2013 | | Vice Chairman (2010–April 2013)—PNC Financial Services Group | | 59 | | Director — HSBC North America Holdings Inc. (December 2013-Present) Director — HSBC USA Inc. (July 2014-Present) Director — HSBC Bank USA, National Association(July 2014-March 2017) Director — HSBC Finance Corporation(December 2013-April 2018) |
| | | | | |
Christianna Wood 2005 Market Street Philadelphia, PA 19103 March 1956 | | Trustee | | Since January 2019 | | Chief Executive Officer and President—Gore Creek Capital, Ltd. (August 2009–Present) | | 59 | | Director and Audit Committee Member — H&R Block Corporation (July 2008-Present) Director and Audit Committee Member — Grange Insurance (2013-Present) Trustee and Audit Committee Member — The Merger Fund (2013-Present), The Merger Fund VL (2013-Present); WCM Alternatives: Event-Driven Fund (2013-Present), and WCM Alternatives: Credit Event Fund (December 2017-Present) Director —International Securities Exchange (2010-2016) |
| | | | | |
Janet L. Yeomans 2005 Market Street Philadelphia, PA 19103 July 1948 | | Trustee | | Since April 1999 | | Vice President and Treasurer (January 2006–July 2012), Vice President—Mergers & Acquisitions (January 2003–January 2006), and Vice President and Treasurer (July 1995–January 2003)—3M Company | | 59 | | Director; Personnel and Compensation Committee Chair; Member of Nominating, Investments, and Audit Committees for various periods throughout directorship —Okabena Company (2009-2017) |
International Value Equity Series-27
| | | | | | | | | | | | | | | | | | | | |
| | | | | | | | | | | | | | | | | Number of | | | | Other |
| | | | | | | | | | | | | Principal | | | | Portfolios in Fund | | | | Directorships |
| Name, | | | | Position(s) | | | | | | | | Occupation(s) | | | | Complex Overseen | | | | Held by |
| Address, | | | | Held with | | | | Length of Time | | | | During the | | | | by Trustee | | | | Trustee |
| and Birth Date | | | | Fund(s) | | | | Served | | | | Past Five Years | | | | or Officer | | | | or Officer |
| OFFICERS | | | | | | | | | | | | | | | | | | | | |
| | | | | | | | | | |
David F. Connor 2005 Market Street Philadelphia, PA 19103 December 1963 | | | | Senior Vice President, General Counsel, and Secretary | | | | Senior Vice President, since May 2013; General Counsel since May 2015; Secretary since October 2005 | | | | David F. Connor has served in various capacities at different times at Macquarie Investment Management. | | | | 59 | | | | None3 |
Daniel V. Geatens 2005 Market Street Philadelphia, PA 19103 October 1972 | | | | Vice President and Treasurer | | | | Vice President and Treasurer since October 2007 | | | | Daniel V. Geatens has served in various capacities at different times at Macquarie Investment Management. | | | | 59 | | | | None3 |
Richard Salus 2005 Market Street Philadelphia, PA 19103 October 1963 | | | | Senior Vice President and Chief Financial Officer | | | | Senior Vice President and Chief Financial Officer since November 2006 | | | | Richard Salus has served in various capacities at different times at Macquarie Investment Management. | | | | 59 | | | | None3 |
| 1 | Shawn K. Lytle is considered to be an “Interested Trustee” because he is an executive officer of the Fund’s(s’) investment advisor. |
| 2 | Macquarie Investment Management is the marketing name for Macquarie Management Holdings, Inc. and its subsidiaries, including the Fund’s(s’) investment advisor, principal underwriter, and its transfer agent. |
| 3 | Shawn K. Lytle, David F. Connor, Daniel V. Geatens, and Richard Salus serve in similar capacities for the six portfolios of the Optimum Fund Trust, which have the same investment advisor, principal underwriter, and transfer agent as the registrant. Mr. Geatens also serves as the Chief Financial Officer and Treasurer for Macquarie Global Infrastructure Total Return Fund Inc., which has an affiliated investment manager. |
The Statement of Additional Information for the Fund(s) includes additional information about the Trustees and Officers and is available, without charge, upon request by calling 800523-1918.
International Value Equity Series-28
| | | | |
| | The Series files its complete schedule of portfolio holdings with the Securities and Exchange Commission (SEC) for the first and third quarters of each fiscal year on Form N-Q. The Series’ Forms N-Q, as well as a description of the policies and procedures that the Series uses to determine how to vote proxies (if any) relating to portfolio securities are available without charge (i) upon request, by calling 800 523-1918; and (ii) on the SEC’s website at sec.gov. In addition, a description of the policies and procedures that the Series uses to determine how to vote proxies (if any) relating to portfolio securities and the Schedule of Investments included in the Series’ most recent Form N-Q are available without charge on the Series’ website at delawarefunds.com/vip/literature. The Series’ Forms N-Q may be reviewed and copied at the SEC’s Public Reference Room in Washington, DC; information on the operation of the Public Reference Room may be obtained by calling 800 SEC-0330. Information (if any) regarding how the Series voted proxies relating to portfolio securities during the most recently disclosed 12-month period ended June 30 is available without charge (i) through the Series’ website at delawarefunds.com/proxy; and (ii) on the SEC’s website at sec.gov. | | |
| | |
| AR-VIPIVE 22043 (2/19) (730130) | | International Value EquitySeries-29 |
| | |
| | |

| |  |
| | |
| | |
| | |
| | |
| | |
| | |
| | |
| | |
| | |
| | |
| | |
| | |
| | |
| | |
| | |
| | |
| | |
| | |
| | |
| | |
| | |
| | Annual report |
| | |
Delaware VIP® Trust
Delaware VIP Limited-Term Diversified Income Series
December 31, 2018
Table of contents
Other than Macquarie Bank Limited (MBL), none of the entities noted are authorized deposit-taking institutions for the purposes of the Banking Act 1959 (Commonwealth of Australia). The obligations of these entities do not represent deposits or other liabilities of MBL. MBL does not guarantee or otherwise provide assurance in respect of the obligations of these entities, unless noted otherwise. The Series is governed by US laws and regulations.
Unless otherwise noted, views expressed herein are current as of Dec. 31, 2018, and subject to change for events occurring after such date.
The Series is not FDIC insured and is not guaranteed. It is possible to lose the principal amount invested.
Advisory services provided by Delaware Management Company, a series of Macquarie Investment Management Business Trust (MIMBT), a US registered investment advisor.
The Series is distributed byDelaware Distributors, L.P.(DDLP), an affiliate of MIMBT and Macquarie Group Limited. Macquarie Investment Management (MIM), a member of Macquarie Group, is the marketing name for certain companies comprising the asset management division of Macquarie Group Limited and its subsidiaries and affiliates worldwide.
This material may be used in conjunction with the offering of shares in Delaware VIP Limited-Term Diversified Income Series only if preceded or accompanied by the Series’ current prospectus or the summary prospectus.
© 2019 Macquarie Management Holdings, Inc.
All third-party marks cited are the property of their respective owners.
| | |
Delaware VIP® Trust — Delaware VIP Limited-Term Diversified Income Series |
Portfolio management review | | January 8, 2019 |
For the fiscal year ended Dec. 31, 2018, Delaware VIP Limited-Term Diversified Income Series (the “Series”) Standard Class shares gained 0.24%, and Service Class shares gained 0.04%. Both figures reflect all distributions reinvested. For the same period, the Series benchmark, the Bloomberg Barclays 1–3 Year US Government/Credit Index, advanced 1.60%.
In contrast to 2017, capital-market volatility picked up considerably, particularly late in the fiscal year. Investors grew increasingly concerned about slowing global economic growth, fallout from the escalatingUS-China trade war, rising US Federal Reserve rate hikes, and the risk that the Fed would become overly restrictive in its monetary policy.
The resultingrisk-off,flee-to-safety mentality caused credit spreads – the premium investors receive for investing in more-volatile securities – to rise. Overall, credit spreads on corporate bonds widened by about 60 basis points (0.60%) during the year, with more thantwo-thirds of that occurring late in 2018. (One basis point is a hundredth of a percentage point.) Credit spreads on agency mortgage-backed securities (MBS) widened by about 20 basis points as measured by their current coupon.
Driven by four Fed quarter-point increases that brought the federal funds target rate to a range of2.25%-2.50%, rates rose, led by shorter-term bonds. This also caused the Treasury yield curve to flatten significantly: The yield ontwo-year Treasury securities rose 60 basis points while10-year Treasury yields climbed 28 basis points.
For the most part, rising yields and the upturn in volatility hurt the Series’12-month relative performance. The Series is positioned with a barbell structure: The anchor on the front end – a large portion of floating-rate asset-backed securities (ABS) and some interest-only MBS – is positioned to capitalize on rate increases. To balance this, on the long end of the barbell, the Series holds corporate credit in the3- to5-year maturity range to profit from additional yield.
While the short-term holdings did gain in response to rising yields, the negative effect of the longer-term corporate credit more than offset that benefit. In arisk-off environment, the drop of each basis point added to the credit spread was magnified on the longer end of the barbell.
The Series’ approach to sector allocation involves far less exposure to Treasurys than the benchmark – just 5% of the portfolio on average during the past year versus 65% in the benchmark. In place of Treasurys, the Series holds a diverse range of somewhat riskier but potentially higher yielding assets on each end of the barbell. During this period, on the longer end, roughly 4% was allocated to high yield bonds, with 3% each to bank loans and emerging market bonds. Each of these detracted from returns in therisk-off market. Even some high yield credit default swaps (CDX), held as a hedge against some spread widening, proved ineffective.
Drilling deeper, within the agency MBS sector, we also have a barbell layer. Short-term, interest-only securities, which benefit as interest rates rise, are balanced by longer-duration, higher yielding collateralized mortgage obligations (CMOs), which perform poorly as rates rise. That combination, in the right conditions, has had attractive overall returns.
Although this positioning worked well for us in 2016 and 2017, in 2018, as interest rates rose on longer bonds, those long-duration CMOs had poor performance. That more than offset the gains of the interest-only and high-coupon mortgages. That was partly because rising volatility hurt the performance of the interest-only MBS holdings.
On the positive side, floating-rate ABS, interest-only MBS, and other short-term MBS participated as short-term rates rose. Collateralized loan obligations (CLOs), where we had a 2% allocation, were also positive, returning more than 3% versus the benchmark’s 1.60%.
In this challenging environment, we have maintained an overweight to spread duration within credit because we believe the widening spreads have made them more attractive and that their fundamentals haven’t really changed. We can find what we consider to be good companies at more attractive valuations, creating an opportunity for that sector to perform well in terms of yield and potential spread tightening throughout the year. We still like CLOs, where we see opportunities to generate income while containing risk by focusing on the high capital structure of CLOs whose underlying loans are in good shape.
However, there are numerous risks, in our view. These include the chance that the Fed errs, becoming too restrictive and raising interest rates above the neutral rate. That could affect riskier assets, lead to deterioration in credit conditions, and curtail economic growth. Other risks that we see include growing weakness in China or another emerging market country that could broadly affect risk markets. Additionally, the impact of tariffs and trade tensions along with the government shutdown could increasingly affect economic growth.
Unless otherwise noted, views expressed herein are current as of Dec. 31, 2018, and subject to change.
Limited-Term Diversified Income Series-1
| | |
Delaware VIP® Trust — Delaware VIP Limited-Term Diversified Income Series |
Portfolio management review (continued) | | January 8, 2019 |
On the other hand, if prompted by weakening economic conditions, we might also see the Fed and other central banks reverse direction and become more accommodative. If that were to happen, we think it would certainly benefit corporate credit.
Despite the Series’ disappointing performance of late, we don’t see much reason to change our strategies. We believe the barbell positioning still provides a yield advantage over the benchmark. We want to make sure we have some high-quality duration. And on the shorter side, while the floating rate product may not benefit as designed if further Fed rate increases don’t materialize, it does provide an attractive yield advantage versus other short-term alternatives.
During the year, the Series owned some high yield credit default swaps along with Treasury futures. Our exposure to CDX averaged about 8% of our portfolio during the year, allowing us to hedge both high yield bank loans and emerging market bonds. Both types of derivatives detracted somewhat from the Series’ performance, but their combined impact on portfolio returns was less than 50 basis points.
Unless otherwise noted, views expressed herein are current as of Dec. 31, 2018, and subject to change.
Limited-Term Diversified Income Series-2
Delaware VIP® Trust — Delaware VIP Limited-Term Diversified Income Series
Performance summary
The performance quoted represents past performance and does not guarantee future results. Investment return and principal value of an investment will fluctuate so that shares, when redeemed, may be worth more or less than their original cost. Current performance may be lower or higher than the performance quoted.
Carefully consider the Series’ investment objectives, risk factors, charges, and expenses before investing. This and other information can be found in the Series’ prospectus and its summary prospectus, which may be obtained by visiting delawarefunds.com/vip/literature or calling 800523-1918. Investors should read the prospectus and the summary prospectus carefully before investing.
| | | | | | | | | | |
Delaware VIP Limited-Term Diversified Income Series Average annual total returns For periods ended December 31, 2018 | | 1 year | | 3 years | | 5 years | | 10 years | | Lifetime |
Standard Class shares (commenced operations on July 28, 1988) | | +0.24% | | +1.50% | | +1.39% | | +2.82% | | +4.71% |
| | | | | | | | | | |
Service Class shares (commenced operations on May 1, 2000) | | +0.04% | | +1.23% | | +1.15% | | +2.58% | | +3.48% |
| | | | | | | | | | |
Bloomberg Barclays 1–3 Year US Government/Credit Index | | +1.60% | | +1.24% | | +1.03% | | +1.52% | | n/a |
Returns reflect the reinvestment of all distributions. Please see page 4 for a description of the index.
As described in the Series’ most recent prospectus, the net expense ratio for Service Class shares of the Series was 0.80%, while total operating expenses for Standard Class and Service Class shares were 0.55% and 0.85%, respectively. The management fee for Standard Class and Service Class shares was 0.48%. The Series’ investment manager, Delaware Management Company (Manager), has contractually agreed to waive all or a portion of its investment advisory fees and/or pay/reimburse expenses (excluding any12b-1 fees, acquired fund fees and expenses, taxes, interest, short sale and dividend interest expenses, brokerage fees, certain insurance costs, and nonroutine expenses or costs, including, but not limited to, those relating to reorganizations, litigation, conducting shareholder meetings, and liquidations) in order to prevent annual series operating expenses from exceeding 0.56% of the Series’ average daily net assets from April 30, 2018 through Dec. 31, 2018.* Please see the most recent prospectus and any applicable supplement(s) for additional information on these fee waivers and/or reimbursements. Please see the “Financial highlights” section in this report for the most recent expense ratios.
The Series pays Delaware Distributors, L.P. (DDLP), the distributor and an affiliate of DMC, an annual12b-1 fee of 0.30% of the average daily net assets of the Service Class shares. Prior to May 1, 2018, DDLP had contracted to waive12b-1 fees in order to limit12b-1 fees of the Service Class shares to 0.25% of average daily net assets. These waivers and reimbursements may only be terminated by agreement of the Manager and the Series.
Earnings from a variable annuity or variable life investment compoundtax-free until withdrawal, and as a result, no adjustments were made for income taxes.
Expense limitations were in effect for both classes during certain periods shown in the Series’ performance table above and in the Performance of a $10,000 Investment graph on the next page.
Performance data do not reflect insurance fees related to a variable annuity or variable life investment or the deferred sales charge that would apply to certain withdrawals of investments held for fewer than eight years. Performance shown here would have been reduced if such fees were included and the expense limitation removed. For more information about fees, consult your variable annuity or variable life prospectus.
Investments in variable products involve risk.
Fixed income securities and bond portfolios can lose value, and investors can lose principal, as interest rates rise. They also may be affected by economic conditions that hinder an issuer’s ability to make interest and principal payments on its debt.
The Series may also be subject to prepayment risk, the risk that the principal of a fixed income security that is held by the Series may be prepaid prior to maturity, potentially forcing the Series to reinvest that money at a lower interest rate.
High yielding, noninvestment grade bonds (junk bonds) involve higher risk than investment grade bonds. The high yield secondary market is particularly susceptible to liquidity problems when institutional investors, such as mutual funds and certain other financial institutions, temporarily stop buying bonds for regulatory, financial, or other reasons. In addition, a less liquid secondary market makes it more difficult for the Series to obtain precise valuations of the high yield securities in its portfolio.
The Series may invest in derivatives, which may involve additional expenses and are subject to risk, including the risk that an underlying security or securities index moves in the opposite direction from what the portfolio manager anticipated. A derivatives transaction depends upon the counterparties’ ability to fulfill their contractual obligations.
Limited-Term Diversified Income Series-3
Delaware VIP® Limited-Term Diversified Income Series
Performance summary (continued)
International investments entail risks not ordinarily associated with US investments including fluctuation in currency values, differences in accounting principles, or economic or political instability in other nations. Investing in emerging markets can be riskier than investing in established foreign markets due to increased volatility and lower trading volume.
If and when the Series invests in forward foreign currency contracts or uses other investments to hedge against currency risks, the Series will be subject to special risks, including counterparty risk.
Diversification may not protect against market risk.
The Series may experience portfolio turnover in excess of 100%, which could result in higher transaction costs and tax liability.
Please read both the contract and underlying prospectus for specific details regarding the product’s risk profile.
*The aggregate contractual waiver period covering this report is from April 30, 2018 through April 30, 2019.
| | | | |
| For period beginning Dec. 31, 2008, through Dec. 31, 2018 | | Starting value | | Ending value |
–– Delaware VIP Limited-Term Diversified Income Series (Standard Class) | | $10,000 | | $13,209 |
– – Bloomberg Barclays 1–3 Year US Government / Credit Index | | $10,000 | | $11,632 |
The graph shows a $10,000 investment in the Delaware VIP Limited-Term Diversified Income Series Standard Class shares for the period from Dec. 31, 2008 through Dec. 31, 2018.
The graph also shows $10,000 invested in the Bloomberg Barclays 1–3 Year US Government/Credit Index for the period from Dec. 31, 2008 through Dec. 31, 2018. The Bloomberg Barclays 1–3 Year US Government/Credit Index is a market value-weighted index of government fixed-rate debt securities and investment grade US and foreign fixed-rate debt securities with average maturities of one to three years.
Index performance returns do not reflect any management fees, transaction costs or expenses. Indices are unmanaged and one cannot invest directly in an index.
Performance of Service Class shares will vary due to different charges and expenses.
Past performance is not a guarantee of future results.
Limited-Term Diversified Income Series-4
Delaware VIP® Trust — Delaware VIP Limited-Term Diversified Income Series
Disclosure of Series expenses
For thesix-month period from July 1, 2018 to December 31, 2018 (Unaudited)
As a shareholder of the Series, you incur ongoing costs, which may include management fees; distribution and service(12b-1) fees; and other Series expenses. This example is intended to help you understand your ongoing costs (in dollars) of investing in the Series and to compare these costs with the ongoing costs of investing in other mutual funds.
The example is based on an investment of $1,000 invested at the beginning of the period and held for the entiresix-month period from July 1, 2018 to Dec. 31, 2018.
Actual expenses
The first section of the table shown, “Actual Series return,” provides information about actual account values and actual expenses. You may use the information in this section of the table, together with the amount you invested, to estimate the expenses that you paid over the period. Simply divide your account value by $1,000 (for example, an $8,600 account value divided by $1,000 = 8.6), then multiply the result by the number in the first section under the heading entitled “Expenses Paid During Period” to estimate the expenses you paid on your account during the period.
Hypothetical example for comparison purposes
The second section of the table shown, “Hypothetical 5% return,” provides information about hypothetical account values and hypothetical expenses based on the Series’ actual expense ratio and an assumed rate of return of 5% per year before expenses, which is not the Series’ actual return. The hypothetical account values and expenses may not be used to estimate the actual ending account balance or expenses you paid for the period. You may use this information to compare the ongoing costs of investing in the Series and other funds. To do so, compare the 5% hypothetical example with the 5% hypothetical examples that appear in the shareholder reports of other funds.
Please note that the expenses shown in the table are meant to highlight your ongoing costs only. As a shareholder of the Series, you do not incur any transaction costs, such as sales charges (loads), redemption fees or exchange fees, but shareholders of other funds may incur such costs. Also, the fees related to the variable annuity investment or the deferred sales charge that could apply have not been included. Therefore, the second section of the table is useful in comparing ongoing costs only, and will not help you determine the relative total costs of owning different funds. The Series’ expenses shown in the table assume reinvestment of all dividends and distributions.
Expense analysis of an investment of $1,000
| | | | | | | | | | | | | | |
| | | Beginning
Account
Value
7/1/18 | | | Ending
Account
Value
12/31/18 | | | Annualized
Expense
Ratio | | | Expenses
Paid
During
Period
7/1/18 to
12/31/18* |
Actual Series return† | | | | | | | | | | | | | | |
Standard Class | | | $1,000.00 | | | | $1,008.20 | | | | 0.54% | | | $2.73 |
Service Class | | | 1,000.00 | | | | 1,006.60 | | | | 0.84% | | | 4.25 |
Hypothetical 5% return(5% return before expenses) |
Standard Class | | | $1,000.00 | | | | $1,022.48 | | | | 0.54% | | | $2.75 |
Service Class | | | 1,000.00 | | | | 1,020.97 | | | | 0.84% | | | 4.28 |
| * | “Expenses Paid During Period” are equal to the Series’ annualized expense ratio, multiplied by the average account value over the period, multiplied by 184/365 (to reflect theone-half year period). |
| † | Because actual returns reflect only the most recentsix-month period, the returns shown may differ significantly from fiscal year returns. |
Limited-Term Diversified Income Series-5
Delaware VIP® Trust — Delaware VIP Limited-Term Diversified Income Series
Security type / sector allocation
As of December 31, 2018 (Unaudited)
Sector designations may be different than the sector designations presented in other Series materials. The sector designations may represent the investment manager’s internal sector classifications.
| | | | | |
| Security type / sector | | Percentage of
net assets |
Agency Asset-Backed Security | | | | 0.00 | % |
Agency Collateralized Mortgage Obligations | | | | 0.56 | % |
Agency Commercial Mortgage-Backed Securities | | | | 0.37 | % |
Agency Mortgage-Backed Securities | | | | 19.40 | % |
Corporate Bonds | | | | 37.97 | % |
Banking | | | | 13.20 | % |
Basic Industry | | | | 1.54 | % |
Brokerage | | | | 0.81 | % |
Capital Goods | | | | 1.72 | % |
Communications | | | | 3.83 | % |
Consumer Cyclical | | | | 2.35 | % |
ConsumerNon-Cyclical | | | | 4.09 | % |
Electric | | | | 5.52 | % |
Energy | | | | 2.41 | % |
Finance Companies | | | | 0.87 | % |
Insurance | | | | 0.26 | % |
Natural Gas | | | | 0.12 | % |
REITs | | | | 0.12 | % |
Technology | | | | 0.98 | % |
Transportation | | | | 0.15 | % |
Municipal Bond | | | | 0.03 | % |
Non-Agency Asset-Backed Securities | | | | 28.04 | % |
Non-Agency Collateralized Mortgage Obligations | | | | 0.47 | % |
Non-Agency Commercial Mortgage-Backed Security | | | | 0.04 | % |
Sovereign Bond | | | | 0.95 | % |
Supranational Bank | | | | 0.71 | % |
US Treasury Obligations | | | | 11.55 | % |
Preferred Stock | | | | 0.18 | % |
Short-Term Investments | | | | 1.55 | % |
Total Value of Securities | | | | 101.82 | % |
Liabilities Net of Receivables and Other Assets | | | | (1.82 | %) |
Total Net Assets | | | | 100.00 | % |
Limited-Term Diversified Income Series-6
Delaware VIP® Trust — Delaware VIP Limited-Term Diversified Income Series
Schedule of investments
December 31, 2018
| | | | | | | | |
| | | Principal
amount° | | | Value (US $) | |
| | |
Agency Asset-Backed Security – 0.00% | | | | | | | | |
Fannie Mae Grantor Trust | | | | | | | | |
Series2003-T4 2A5 4.665% 9/26/33 • | | | 12,787 | | | $ | 13,905 | |
| | | | | | | | |
Total Agency Asset-Backed Security (cost $12,684) | | | | | | | 13,905 | |
| | | | | | | | |
| | |
Agency Collateralized Mortgage Obligations – 0.56% | | | | | | | | |
Fannie Mae Connecticut Avenue Securities | | | | | | | | |
Series2016-C03 1M1 4.506% (LIBOR01M + 2.00%) 10/25/28 • | | | 596,112 | | | | 600,842 | |
Series2016-C04 1M1 3.956% (LIBOR01M + 1.45%) 1/25/29 • | | | 357,477 | | | | 358,799 | |
Series2017-C01 1M1 3.806% (LIBOR01M + 1.30%) 7/25/29 • | | | 411,307 | | | | 412,548 | |
Fannie Mae Grantor Trust | | | | | | | | |
Series2001-T5 A2 7.00% 6/19/41 • | | | 10,847 | | | | 11,975 | |
FDIC Guaranteed Notes Trust | | | | | | | | |
Series2010-S2 1A 144A 3.02% (LIBOR01M + 0.50%, Cap 10.00%, Floor 0.45%) 11/29/37 #• | | | 1,733,313 | | | | 1,731,235 | |
Freddie Mac REMICs | | | | | | | | |
Series 3067 FA 2.805% (LIBOR01M + 0.35%, Cap 7.00%, Floor 0.35%) 11/15/35 • | | | 666,122 | | | | 667,429 | |
Series 3800 AF 2.955% (LIBOR01M + 0.50%, Cap 7.00%, Floor 0.50%) 2/15/41 • | | | 1,291,039 | | | | 1,298,525 | |
Freddie Mac Structured Agency Credit Risk Debt Notes | | | | | | | | |
Series 2015-DNA3 M2 5.356% (LIBOR01M + 2.85%) 4/25/28 • | | | 468,863 | | | | 481,651 | |
Series 2015-HQA1 M2 5.156% (LIBOR01M + 2.65%) 3/25/28 • | | | 227,519 | | | | 230,405 | |
Series 2016-DNA3 M2 4.506% (LIBOR01M + 2.00%) 12/25/28 • | | | 290,882 | | | | 293,503 | |
Series 2016-DNA4 M2 3.806% (LIBOR01M + 1.30%, Floor 1.30%) 3/25/29 • | | | 500,000 | | | | 500,552 | |
Series 2016-HQA2 M2 4.756% (LIBOR01M + 2.25%) 11/25/28 • | | | 340,526 | | | | 345,976 | |
Series 2017-DNA3 M2 5.006% (LIBOR01M + 2.50%) 3/25/30 • | | | 450,000 | | | | 450,001 | |
Freddie Mac Structured Pass Through Certificates | | | | | | | | |
SeriesT-54 2A 6.50% 2/25/43 ◆ | | | 695 | | | | 794 | |
SeriesT-58 2A 6.50% 9/25/43 ◆ | | | 14,999 | | | | 17,075 | |
| | | | | | | | |
| | | Principal
amount° | | | Value (US $) | |
| | |
Agency Collateralized Mortgage Obligations (continued) | | | | | | | | |
NCUA Guaranteed Notes Trust | | | | | | | | |
Series2011-R2 1A 2.78% (LIBOR01M + 0.40%, Cap 8.00%, Floor 0.40%) 2/6/20 • | | | 950,937 | | | $ | 950,948 | |
| | | | | | | | |
Total Agency Collateralized Mortgage Obligations
(cost $8,317,390) | | | | | | | 8,352,258 | |
| | | | | | | | |
| | |
Agency Commercial Mortgage-Backed Securities – 0.37% | | | | | | | | |
Fannie Mae Multifamily Remic Trust | | | | | | | | |
Series2015-M12 FA 2.641% (LIBOR01M + 0.34%, Floor 0.34%) 4/25/20 • | | | 509,646 | | | | 509,145 | |
FREMF Mortgage Trust | | | | | | | | |
Series2011-K15 B 144A 4.948% 8/25/44 #• | | | 125,000 | | | | 130,116 | |
Series2012-K22 B 144A 3.686% 8/25/45 #• | | | 1,115,000 | | | | 1,131,558 | |
Series2013-K28 C 144A 3.49% 6/25/46 #• | | | 150,000 | | | | 146,425 | |
Series2013-K33 C 144A 3.50% 8/25/46 #• | | | 150,000 | | | | 143,778 | |
Series 2013-K712 B 144A 3.358% 5/25/45 #• | | | 625,000 | | | | 624,386 | |
Series 2014-K717 B 144A 3.629% 11/25/47 #• | | | 635,000 | | | | 640,919 | |
Series 2014-K717 C 144A 3.629% 11/25/47 #• | | | 215,000 | | | | 216,335 | |
Series 2016-K722 B 144A 3.836% 7/25/49 #• | | | 535,000 | | | | 543,314 | |
NCUA Guaranteed Notes Trust | | | | | | | | |
Series2011-C1 2A 2.811% (LIBOR01M + 0.53%, Cap 8.00%, Floor 0.53%) 3/9/21 • | | | 1,434,615 | | | | 1,438,316 | |
| | | | | | | | |
Total Agency Commercial Mortgage-Backed Securities (cost $5,548,384) | | | | | | | 5,524,292 | |
| | | | | | | | |
| | |
Agency Mortgage-Backed Securities – 19.40% | | | | | | | | |
Fannie Mae ARM | | | | | | | | |
3.879% (LIBOR12M + 1.754%, Cap 11.211%) 4/1/36 • | | | 2,717 | | | | 2,844 | |
4.24% (LIBOR12M + 1.552%, Cap 9.623%) 8/1/34 • | | | 4,678 | | | | 4,868 | |
4.309% (LIBOR12M + 1.592%, Cap 11.215%) 8/1/36 • | | | 6,743 | | | | 7,123 | |
Limited-Term Diversified Income Series-7
Delaware VIP® Limited-Term Diversified Income Series
Schedule of investments (continued)
| | | | | | | | |
| | | Principal
amount° | | | Value (US $) | |
| | |
Agency Mortgage-Backed Securities (continued) | | | | | | | | |
Fannie Mae ARM | | | | | | | | |
4.346% (LIBOR12M + 1.596%, Cap 9.595%) 9/1/38 • | | | 277,748 | | | $ | 289,095 | |
4.365% (H15T1Y + 2.136%, Cap 9.927%) 12/1/33 • | | | 4,371 | | | | 4,643 | |
4.426% (LIBOR12M + 1.713%, Cap 11.074%) 6/1/36 • | | | 6,575 | | | | 6,899 | |
4.549% (LIBOR12M + 1.799%, Cap 11.328%) 7/1/36 • | | | 8,555 | | | | 9,019 | |
4.563% (LIBOR12M + 1.83%, Cap 10.16%) 8/1/35 • | | | 1,552 | | | | 1,629 | |
4.609% (LIBOR12M + 1.859%, Cap 10.109%) 7/1/36 • | | | 1,769 | | | | 1,861 | |
Fannie Mae S.F. 30 yr | | | | | | | | |
4.50% 11/1/39 | | | 502,926 | | | | 527,501 | |
4.50% 7/1/40 | | | 556,138 | | | | 586,544 | |
4.50% 8/1/40 | | | 133,654 | | | | 139,566 | |
4.50% 8/1/41 | | | 1,323,803 | | | | 1,389,064 | |
4.50% 10/1/43 | | | 1,541,459 | | | | 1,615,182 | |
4.50% 10/1/44 | | | 105,465 | | | | 110,612 | |
4.50% 2/1/46 | | | 39,022,866 | | | | 40,890,609 | |
4.50% 3/1/46 | | | 10,242,159 | | | | 10,744,762 | |
4.50% 11/1/47 | | | 13,711,873 | | | | 14,401,979 | |
5.00% 6/1/44 | | | 1,291,565 | | | | 1,380,248 | |
5.00% 7/1/47 | | | 4,483,854 | | | | 4,779,772 | |
5.00% 8/1/48 | | | 33,903,068 | | | | 36,000,549 | |
5.00% 9/1/48 | | | 19,552,147 | | | | 20,540,295 | |
5.00% 12/1/48 | | | 30,393,458 | | | | 32,108,135 | |
5.50% 5/1/44 | | | 60,090,852 | | | | 64,743,304 | |
5.50% 8/1/48 | | | 1,125,657 | | | | 1,212,694 | |
6.00% 6/1/41 | | | 2,618,029 | | | | 2,854,750 | |
6.00% 7/1/41 | | | 12,125,509 | | | | 13,230,950 | |
6.00% 1/1/42 | | | 2,313,448 | | | | 2,544,943 | |
Freddie Mac ARM | | | | | | | | |
4.635% (LIBOR12M + 1.885%, Cap 10.064%) 7/1/38 • | | | 170,155 | | | | 179,338 | |
4.65% (LIBOR12M + 1.775%, Cap 11.228%) 10/1/37 • | | | 34,618 | | | | 36,224 | |
4.68% (LIBOR12M + 1.93%, Cap 10.039%) 8/1/38 • | | | 2,584 | | | | 2,680 | |
Freddie Mac S.F. 30 yr | | | | | | | | |
4.50% 5/1/40 | | | 3,189,335 | | | | 3,330,118 | |
4.50% 3/1/42 | | | 879,506 | | | | 921,167 | |
4.50% 8/1/42 | | | 6,074,693 | | | | 6,333,776 | |
4.50% 12/1/43 | | | 335,335 | | | | 351,505 | |
4.50% 8/1/44 | | | 242,219 | | | | 253,514 | |
4.50% 7/1/45 | | | 1,792,387 | | | | 1,880,688 | |
5.00% 12/1/44 | | | 3,326,188 | | | | 3,524,116 | |
5.50% 6/1/41 | | | 2,491,293 | | | | 2,708,679 | |
5.50% 9/1/41 | | | 4,151,985 | | | | 4,477,447 | |
6.00% 7/1/40 | | | 6,791,988 | | | | 7,450,181 | |
| | | | | | | | |
| | | Principal
amount° | | | Value (US $) | |
| | |
Agency Mortgage-Backed Securities (continued) | | | | | | | | |
GNMA I S.F. 30 yr 5.50% 2/15/41 | | | 302,529 | | | $ | 322,462 | |
GNMA II S.F. 30 yr | | | | | | | | |
5.00% 9/20/46 | | | 596,347 | | | | 629,117 | |
5.00% 7/20/48 | | | 769,932 | | | | 801,690 | |
5.00% 9/20/48 | | | 781,788 | | | | 815,501 | |
5.50% 5/20/37 | | | 160,630 | | | | 168,898 | |
6.00% 2/20/39 | | | 182,224 | | | | 193,563 | |
6.00% 10/20/39 | | | 773,519 | | | | 835,725 | |
6.00% 2/20/40 | | | 831,257 | | | | 891,324 | |
6.00% 4/20/46 | | | 243,611 | | | | 264,092 | |
6.50% 6/20/39 | | | 653,973 | | | | 730,277 | |
| | | | | | | | |
Total Agency Mortgage-Backed Securities
(cost $292,820,681) | | | | | | | 287,231,522 | |
| | | | | | | | |
| | |
Corporate Bonds – 37.97% | | | | | | | | |
Banking – 13.20% | | | | | | | | |
Banco Santander 3.50% 4/11/22 | | | 3,800,000 | | | | 3,731,772 | |
Bank of America | | | | | | | | |
3.864% 7/23/24 µ | | | 1,840,000 | | | | 1,836,643 | |
4.271% 7/23/29 µ | | | 1,475,000 | | | | 1,470,685 | |
5.625% 7/1/20 | | | 7,475,000 | | | | 7,727,966 | |
Bank of Montreal 3.10% 4/13/21 | | | 3,170,000 | | | | 3,169,331 | |
Bank of New York Mellon | | | | | | | | |
2.95% 1/29/23 | | | 4,920,000 | | | | 4,845,053 | |
3.57% (LIBOR03M + 1.05%) 10/30/23 • | | | 4,255,000 | | | | 4,264,761 | |
Barclays 7.75%µy | | | 1,070,000 | | | | 1,031,929 | |
BB&T 3.75% 12/6/23 | | | 7,405,000 | | | | 7,471,738 | |
Citibank 3.40% 7/23/21 | | | 2,170,000 | | | | 2,173,439 | |
Citizens Bank 2.45% 12/4/19 | | | 5,065,000 | | | | 5,030,300 | |
Commonwealth Bank of Australia 2.40% 11/2/20 | | | 8,600,000 | | | | 8,467,941 | |
Compass Bank 2.875% 6/29/22 | | | 7,155,000 | | | | 6,861,356 | |
Credit Suisse Group | | | | | | | | |
144A 4.207% 6/12/24 #µ | | | 2,935,000 | | | | 2,930,164 | |
144A 7.25%#µy | | | 2,425,000 | | | | 2,293,686 | |
144A 7.50%#µy | | | 740,000 | | | | 723,350 | |
Credit Suisse Group Funding Guernsey 3.80% 6/9/23 | | | 1,640,000 | | | | 1,610,836 | |
Fifth Third Bancorp 2.60% 6/15/22 | | | 2,355,000 | | | | 2,292,653 | |
Fifth Third Bank | | | | | | | | |
2.30% 3/15/19 | | | 200,000 | | | | 199,756 | |
3.85% 3/15/26 | | | 1,190,000 | | | | 1,173,938 | |
Goldman Sachs Group | | | | | | | | |
4.223% 5/1/29 µ | | | 540,000 | | | | 520,987 | |
6.00% 6/15/20 | | | 7,860,000 | | | | 8,138,161 | |
HSBC Holdings 3.95%
5/18/24 µ | | | 4,305,000 | | | | 4,284,054 | |
Huntington Bancshares 2.30% 1/14/22 | | | 2,670,000 | | | | 2,579,702 | |
Huntington National Bank 2.50% 8/7/22 | | | 1,400,000 | | | | 1,353,620 | |
ING Groep 144A 4.625% 1/6/26 # | | | 1,900,000 | | | | 1,916,555 | |
Limited-Term Diversified Income Series-8
Delaware VIP® Limited-Term Diversified Income Series
Schedule of investments (continued)
| | | | | | | | |
| | | Principal
amount° | | | Value (US $) | |
| | |
Corporate Bonds (continued) | | | | | | | | |
Banking (continued) | | | | | | | | |
JPMorgan Chase & Co. | | | | | | | | |
3.797% 7/23/24 µ | | | 3,275,000 | | | $ | 3,282,750 | |
4.35% 8/15/21 | | | 3,870,000 | | | | 3,961,572 | |
4.452% 12/5/29 µ | | | 1,390,000 | | | | 1,416,409 | |
KeyBank | | | | | | | | |
2.30% 9/14/22 | | | 1,245,000 | | | | 1,199,523 | |
2.40% 6/9/22 | | | 2,725,000 | | | | 2,641,090 | |
3.18% 5/22/22 | | | 940,000 | | | | 936,716 | |
Lloyds Banking Group 2.907% 11/7/23 µ | | | 3,325,000 | | | | 3,146,795 | |
Manufacturers & Traders Trust | | | | | | | | |
2.05% 8/17/20 | | | 4,255,000 | | | | 4,171,423 | |
2.50% 5/18/22 | | | 1,445,000 | | | | 1,404,272 | |
Morgan Stanley | | | | | | | | |
2.75% 5/19/22 | | | 260,000 | | | | 253,058 | |
3.625% 1/20/27 | | | 2,145,000 | | | | 2,041,803 | |
3.737% 4/24/24 µ | | | 1,045,000 | | | | 1,038,040 | |
5.00% 11/24/25 | | | 4,055,000 | | | | 4,142,620 | |
5.50% 1/26/20 | | | 4,605,000 | | | | 4,710,304 | |
Nationwide Building Society 144A 4.363% 8/1/24 #µ | | | 2,505,000 | | | | 2,456,583 | |
PNC Bank | | | | | | | | |
2.45% 11/5/20 | | | 3,635,000 | | | | 3,590,706 | |
2.70% 11/1/22 | | | 505,000 | | | | 490,972 | |
PNC Financial Services Group 5.00%µy | | | 2,705,000 | | | | 2,495,363 | |
Regions Financial | | | | | | | | |
2.75% 8/14/22 | | | 1,090,000 | | | | 1,052,450 | |
3.80% 8/14/23 | | | 1,360,000 | | | | 1,363,443 | |
Royal Bank of Canada 2.75% 2/1/22 | | | 4,095,000 | | | | 4,031,076 | |
Royal Bank of Scotland Group | | | | | | | | |
3.875% 9/12/23 | | | 3,340,000 | | | | 3,205,196 | |
8.625%µy | | | 2,095,000 | | | | 2,173,563 | |
Santander UK | | | | | | | | |
2.125% 11/3/20 | | | 3,250,000 | | | | 3,174,441 | |
144A 5.00% 11/7/23 # | | | 2,050,000 | | | | 2,006,198 | |
Skandinaviska Enskilda Banken 144A 2.375% 3/25/19 # | | | 7,410,000 | | | | 7,399,300 | |
SunTrust Banks 4.00% 5/1/25 | | | 1,825,000 | | | | 1,833,130 | |
Toronto-Dominion Bank 2.25% 11/5/19 | | | 6,935,000 | | | | 6,897,943 | |
UBS Group Funding Switzerland | | | | | | | | |
144A 2.65% 2/1/22 # | | | 1,795,000 | | | | 1,738,021 | |
144A 3.00% 4/15/21 # | | | 5,915,000 | | | | 5,870,966 | |
6.875%µy | | | 390,000 | | | | 391,333 | |
US Bancorp | | | | | | | | |
2.35% 1/29/21 | | | 3,365,000 | | | | 3,316,193 | |
2.375% 7/22/26 | | | 1,230,000 | | | | 1,123,499 | |
3.95% 11/17/25 | | | 13,210,000 | | | | 13,505,821 | |
US Bank 3.40% 7/24/23 | | | 1,340,000 | | | | 1,341,310 | |
USB Capital IX 3.50% (LIBOR03M + 1.02%)y• | | | 2,220,000 | | | | 1,645,575 | |
Zions Bancorp 4.50% 6/13/23 | | | 1,770,000 | | | | 1,800,579 | |
| | | | | | | | |
| | | | | | | 195,350,412 | |
| | | | | | | | |
| | | | | | | | |
| | | Principal
amount° | | | Value (US $) | |
| | |
Corporate Bonds (continued) | | | | | | | | |
Basic Industry – 1.54% | | | | | | | | |
Dow Chemical 144A 4.55% 11/30/25 # | | | 4,100,000 | | | $ | 4,178,916 | |
DowDuPont 4.205% 11/15/23 | | | 8,345,000 | | | | 8,541,861 | |
Georgia-Pacific 144A 5.40% 11/1/20 # | | | 2,365,000 | | | | 2,450,727 | |
Syngenta Finance | | | | | | | | |
144A 3.933% 4/23/21 # | | | 1,445,000 | | | | 1,425,980 | |
144A 4.441% 4/24/23 # | | | 3,315,000 | | | | 3,197,651 | |
Westrock 144A 4.65%
3/15/26 # | | | 3,020,000 | | | | 3,072,150 | |
| | | | | | | | |
| | | | | | | 22,867,285 | |
| | | | | | | | |
Brokerage – 0.81% | | | | | | | | |
Charles Schwab | | | | | | | | |
3.25% 5/21/21 | | | 1,515,000 | | | | 1,522,841 | |
3.85% 5/21/25 | | | 1,605,000 | | | | 1,639,191 | |
E*TRADE Financial 5.30%µy | | | 4,765,000 | | | | 3,955,427 | |
Intercontinental Exchange 3.45% 9/21/23 | | | 1,710,000 | | | | 1,718,309 | |
Jefferies Group 5.125% 1/20/23 | | | 3,115,000 | | | | 3,187,709 | |
| | | | | | | | |
| | | | | | | 12,023,477 | |
| | | | | | | | |
Capital Goods – 1.72% | | | | | | | | |
Allegion US Holding 3.20% 10/1/24 | | | 1,500,000 | | | | 1,416,965 | |
General Dynamics 3.375% 5/15/23 | | | 3,665,000 | | | | 3,692,333 | |
General Electric | | | | | | | | |
2.70% 10/9/22 | | | 1,430,000 | | | | 1,328,031 | |
2.962% (LIBOR03M + 0.38%) 5/5/26 • | | | 305,000 | | | | 245,779 | |
L3 Technologies 3.85% 6/15/23 | | | 970,000 | | | | 972,418 | |
Nvent Finance 3.95% 4/15/23 | | | 9,970,000 | | | | 9,907,760 | |
United Technologies | | | | | | | | |
2.30% 5/4/22 | | | 6,550,000 | | | | 6,288,342 | |
3.65% 8/16/23 | | | 485,000 | | | | 483,578 | |
4.125% 11/16/28 | | | 1,170,000 | | | | 1,164,106 | |
| | | | | | | | |
| | | | | | | 25,499,312 | |
| | | | | | | | |
Communications – 3.83% | | | | | | | | |
American Tower Trust I 144A 3.07% 3/15/23 # | | | 1,575,000 | | | | 1,552,038 | |
AT&T | | | | | | | | |
3.956% (LIBOR03M + 1.18%) 6/12/24 • | | | 5,055,000 | | | | 4,906,878 | |
4.30% 2/15/30 | | | 780,000 | | | | 739,189 | |
British Telecommunications 4.50% 12/4/23 | | | 3,310,000 | | | | 3,358,256 | |
Charter Communications Operating | | | | | | | | |
4.50% 2/1/24 | | | 8,300,000 | | | | 8,296,153 | |
5.375% 4/1/38 | | | 360,000 | | | | 336,488 | |
Comcast 3.70% 4/15/24 | | | 3,975,000 | | | | 4,001,803 | |
Crown Castle International 5.25% 1/15/23 | | | 2,095,000 | | | | 2,177,349 | |
Crown Castle Towers 144A 3.663% 5/15/25 # | | | 3,785,000 | | | | 3,676,976 | |
Deutsche Telekom International Finance 144A 4.375% 6/21/28 # | | | 2,255,000 | | | | 2,225,899 | |
Limited-Term Diversified Income Series-9
Delaware VIP® Limited-Term Diversified Income Series
Schedule of investments (continued)
| | | | | | | | |
| | | Principal
amount° | | | Value (US $) | |
| | |
Corporate Bonds (continued) | | | | | | | | |
Communications (continued) | | | | | | | | |
GTP Acquisition Partners I 144A 2.35% 6/15/20 # | | | 1,080,000 | | | $ | 1,062,993 | |
SBA Tower Trust 144A 2.898% 10/15/19 # | | | 1,520,000 | | | | 1,511,065 | |
Sprint Spectrum 144A 4.738% 3/20/25 # | | | 1,745,000 | | | | 1,716,644 | |
Time Warner Entertainment 8.375% 3/15/23 | | | 8,635,000 | | | | 9,859,352 | |
Verizon Communications 2.625% 2/21/20 | | | 3,990,000 | | | | 3,975,681 | |
Vodafone Group 3.75% 1/16/24 | | | 5,660,000 | | | | 5,584,630 | |
Warner Media 3.875% 1/15/26 | | | 1,840,000 | | | | 1,760,878 | |
| | | | | | | | |
| | | | | | | 56,742,272 | |
| | | | | | | | |
Consumer Cyclical – 2.35% | | | | | | | | |
Dollar Tree | | | | | | | | |
3.70% 5/15/23 | | | 4,090,000 | | | | 4,003,521 | |
4.00% 5/15/25 | | | 2,615,000 | | | | 2,518,516 | |
Ford Motor Credit | | | | | | | | |
3.336% 3/18/21 | | | 720,000 | | | | 698,967 | |
4.14% 2/15/23 | | | 4,045,000 | | | | 3,848,173 | |
General Motors Financial | | | | | | | | |
3.45% 1/14/22 | | | 3,095,000 | | | | 3,001,138 | |
4.15% 6/19/23 | | | 1,290,000 | | | | 1,258,120 | |
4.35% 4/9/25 | | | 2,145,000 | | | | 2,035,219 | |
Hyundai Capital America 144A 2.55% 2/6/19 # | | | 3,000,000 | | | | 2,998,341 | |
Marriott International 4.15% 12/1/23 | | | 8,425,000 | | | | 8,447,807 | |
Toyota Motor 3.419% 7/20/23 | | | 5,895,000 | | | | 5,903,721 | |
| | | | | | | | |
| | | | | | | 34,713,523 | |
| | | | | | | | |
ConsumerNon-Cyclical – 4.09% | | | | | | | | |
AbbVie 3.75% 11/14/23 | | | 6,835,000 | | | | 6,807,500 | |
Anheuser-Busch InBev Finance 3.30% 2/1/23 | | | 6,600,000 | | | | 6,432,235 | |
BAT Capital 2.297% 8/14/20 | | | 3,630,000 | | | | 3,544,885 | |
Bayer US Finance II 144A 4.25% 12/15/25 # | | | 2,795,000 | | | | 2,725,572 | |
Becton Dickinson 3.363% 6/6/24 | | | 3,000,000 | | | | 2,884,745 | |
Cigna | | | | | | | | |
144A 3.326% (LIBOR03M + 0.89%) 7/15/23 #• | | | 1,775,000 | | | | 1,749,040 | |
144A 3.75% 7/15/23 # | | | 1,630,000 | | | | 1,626,150 | |
144A 4.125% 11/15/25 # | | | 1,650,000 | | | | 1,650,888 | |
Conagra Brands | | | | | | | | |
4.30% 5/1/24 | | | 2,230,000 | | | | 2,218,998 | |
4.60% 11/1/25 | | | 975,000 | | | | 979,917 | |
CVS Health | | | | | | | | |
3.35% 3/9/21 | | | 4,795,000 | | | | 4,781,477 | |
3.70% 3/9/23 | | | 3,940,000 | | | | 3,901,339 | |
4.10% 3/25/25 | | | 1,045,000 | | | | 1,037,239 | |
4.30% 3/25/28 | | | 1,240,000 | | | | 1,216,479 | |
| | | | | | | | |
| | | Principal
amount° | | | Value (US $) | |
| | |
Corporate Bonds (continued) | | | | | | | | |
ConsumerNon-Cyclical (continued) | | | | | | | | |
Keurig Dr Pepper | | | | | | | | |
144A 3.551% 5/25/21 # | | | 2,550,000 | | | $ | 2,547,490 | |
144A 4.417% 5/25/25 # | | | 1,375,000 | | | | 1,371,118 | |
Molson Coors Brewing 2.10% 7/15/21 | | | 3,845,000 | | | | 3,709,275 | |
Shire Acquisitions Investments Ireland 1.90% 9/23/19 | | | 5,675,000 | | | | 5,596,550 | |
Takeda Pharmaceutical 144A 4.40% 11/26/23 # | | | 3,600,000 | | | | 3,643,112 | |
UnitedHealth Group | | | | | | | | |
3.50% 2/15/24 | | | 1,225,000 | | | | 1,233,615 | |
3.70% 12/15/25 | | | 820,000 | | | | 829,334 | |
| | | | | | | | |
| | | | | | | 60,486,958 | |
| | | | | | | | |
Electric – 5.52% | | | | | | | | |
AEP Texas 2.40% 10/1/22 | | | 5,720,000 | | | | 5,551,568 | |
Arizona Public Service 2.20% 1/15/20 | | | 8,255,000 | | | | 8,215,693 | |
Ausgrid Finance 144A 3.85% 5/1/23 # | | | 4,515,000 | | | | 4,509,158 | |
Avangrid 3.15% 12/1/24 | | | 3,335,000 | | | | 3,222,877 | |
CenterPoint Energy | | | | | | | | |
3.85% 2/1/24 | | | 2,970,000 | | | | 2,987,584 | |
6.125%µy | | | 2,000,000 | | | | 1,952,500 | |
Cleveland Electric Illuminating 5.50% 8/15/24 | | | 5,210,000 | | | | 5,575,068 | |
DTE Energy 2.40% 12/1/19 | | | 2,350,000 | | | | 2,326,438 | |
Duke Energy 1.80% 9/1/21 | | | 3,140,000 | | | | 3,007,266 | |
Enel Finance International 144A 2.875% 5/25/22 # | | | 7,275,000 | | | | 6,859,675 | |
Entergy 4.00% 7/15/22 | | | 3,797,000 | | | | 3,833,154 | |
Entergy Louisiana 4.05% 9/1/23 | | | 480,000 | | | | 492,588 | |
Exelon 2.85% 6/15/20 | | | 3,500,000 | | | | 3,472,955 | |
Exelon Generation 4.25% 6/15/22 | | | 1,675,000 | | | | 1,699,216 | |
Fortis 2.10% 10/4/21 | | | 3,715,000 | | | | 3,573,677 | |
IPALCO Enterprises 3.45% 7/15/20 | | | 4,765,000 | | | | 4,761,694 | |
ITC Holdings 2.70% 11/15/22 | | | 7,410,000 | | | | 7,168,445 | |
LG&E & KU Energy 3.75% 11/15/20 | | | 470,000 | | | | 471,908 | |
National Rural Utilities Cooperative Finance 5.25% 4/20/46 µ | | | 1,000,000 | | | | 993,114 | |
Nevada Power 2.75% 4/15/20 | | | 2,110,000 | | | | 2,105,334 | |
NV Energy 6.25% 11/15/20 | | | 2,350,000 | | | | 2,469,653 | |
PSEG Power 3.85% 6/1/23 | | | 2,400,000 | | | | 2,404,227 | |
Sempra Energy 2.90% 2/1/23 | | | 4,240,000 | | | | 4,123,694 | |
| | | | | | | | |
| | | | | | | 81,777,486 | |
| | | | | | | | |
Energy – 2.41% | | | | | | | | |
BP Capital Markets America 3.796% 9/21/25 | | | 4,035,000 | | | | 4,059,760 | |
Enbridge Energy Partners | | | | | | | | |
4.375% 10/15/20 | | | 1,095,000 | | | | 1,108,043 | |
5.20% 3/15/20 | | | 225,000 | | | | 229,847 | |
Kinder Morgan Energy Partners 9.00% 2/1/19 | | | 2,215,000 | | | | 2,224,600 | |
Marathon Oil 2.80% 11/1/22 | | | 2,310,000 | | | | 2,171,451 | |
MPLX 4.875% 12/1/24 | | | 3,885,000 | | | | 3,959,228 | |
Limited-Term Diversified Income Series-10
Delaware VIP® Limited-Term Diversified Income Series
Schedule of investments (continued)
| | | | | | | | |
| | | Principal amount° | | | Value (US $) | |
| | |
Corporate Bonds (continued) | | | | | | | | |
Energy (continued) | | | | | | | | |
Noble Energy 3.90% 11/15/24 | | | 5,985,000 | | | $ | 5,804,595 | |
ONEOK 7.50% 9/1/23 | | | 4,745,000 | | | | 5,396,467 | |
Sabine Pass Liquefaction | | | | | | | | |
5.625% 3/1/25 | | | 2,865,000 | | | | 2,980,081 | |
5.75% 5/15/24 | | | 4,505,000 | | | | 4,726,936 | |
5.875% 6/30/26 | | | 1,650,000 | | | | 1,750,318 | |
Williams 4.55% 6/24/24 | | | 1,295,000 | | | | 1,308,992 | |
| | | | | | | | |
| | | | | | | 35,720,318 | |
| | | | | | | | |
Finance Companies – 0.87% | | | | | | | | |
Aviation Capital Group | | | | | | | | |
144A 2.875% 1/20/22 # | | | 5,430,000 | | | | 5,257,735 | |
144A 4.375% 1/30/24 # | | | 335,000 | | | | 335,788 | |
International Lease Finance 8.625% 1/15/22 | | | 6,480,000 | | | | 7,208,727 | |
| | | | | | | | |
| | | | | | | 12,802,250 | |
| | | | | | | | |
Insurance – 0.26% | | | | | | | | |
AXA Equitable Holdings 144A 3.90% 4/20/23 # | | | 1,985,000 | | | | 1,962,207 | |
Willis North America 3.60% 5/15/24 | | | 1,965,000 | | | | 1,920,723 | |
| | | | | | | | |
| | | | | | | 3,882,930 | |
| | | | | | | | |
Natural Gas – 0.12% | | | | | | | | |
NiSource 144A 5.65%#µy | | | 1,850,000 | | | | 1,722,813 | |
| | | | | | | | |
| | | | | | | 1,722,813 | |
| | | | | | | | |
REITs – 0.12% | | | | | | | | |
Kilroy Realty 3.45% 12/15/24 | | | 1,790,000 | | | | 1,731,735 | |
| | | | | | | | |
| | | | | | | 1,731,735 | |
| | | | | | | | |
Technology – 0.98% | | | | | | | | |
Analog Devices 2.95% 1/12/21 | | | 625,000 | | | | 619,799 | |
Fiserv 3.80% 10/1/23 | | | 4,160,000 | | | | 4,190,079 | |
Microchip Technology | | | | | | | | |
144A 3.922% 6/1/21 # | | | 1,675,000 | | | | 1,662,462 | |
144A 4.333% 6/1/23 # | | | 1,815,000 | | | | 1,772,026 | |
NXP | | | | | | | | |
144A 4.125% 6/1/21 # | | | 2,140,000 | | | | 2,118,600 | |
144A 4.625% 6/1/23 # | | | 385,000 | | | | 378,263 | |
144A 4.875% 3/1/24 # | | | 1,940,000 | | | | 1,950,942 | |
144A 5.35% 3/1/26 # | | | 1,800,000 | | | | 1,832,850 | |
| | | | | | | | |
| | | | | | | 14,525,021 | |
| | | | | | | | |
Transportation – 0.15% | | | | | | | | |
Union Pacific 3.50% 6/8/23 | | | 1,605,000 | | | | 1,609,562 | |
United Airlines2015-1 Class AA Pass-Through Trust 3.45% 12/1/27¨. | | | 650,548 | | | | 617,012 | |
| | | | | | | | |
| | | | | | | 2,226,574 | |
| | | | | | | | |
Total Corporate Bonds
(cost $568,009,844) | | | | | | | 562,072,366 | |
| | | | | | | | |
| | | | | | | | |
| | | Principal amount° | | | Value (US $) | |
| | |
Municipal Bond – 0.03% | | | | | | | | |
Commonwealth of Massachusetts 5.00% 10/1/25 | | | 355,000 | | | $ | 419,415 | |
| | | | | | | | |
Total Municipal Bond
(cost $433,428) | | | | | | | 419,415 | |
| | | | | | | | |
| | |
Non-Agency Asset-Backed Securities – 28.04% | | | | | | | | |
American Express Credit Account Master Trust | | | | | | | | |
Series2017-2 A 2.905% (LIBOR01M + 0.45%) 9/16/24 • | | | 10,260,000 | | | | 10,271,257 | |
Series2017-5 A 2.835% (LIBOR01M + 0.38%) 2/18/25 • | | | 2,425,000 | | | | 2,424,031 | |
Series2018-5 A 2.795% (LIBOR01M + 0.34%) 12/15/25 • | | | 13,040,000 | | | | 12,948,738 | |
Series2018-7 A 2.815% (LIBOR01M + 0.36%) 2/17/26 • | | | 7,000,000 | | | | 6,957,563 | |
Series2018-9 A 2.835% (LIBOR01M + 0.38%) 4/15/26 • | | | 6,000,000 | | | | 5,959,924 | |
ARI Fleet Lease Trust | | | | | | | | |
Series2018-B A2 144A 3.22% 8/16/27 # | | | 8,000,000 | | | | 8,022,407 | |
BA Credit Card Trust | | | | | | | | |
Series2017-A1 A1 1.95% 8/15/22 | | | 3,300,000 | | | | 3,260,674 | |
Series2018-A3 A3 3.10% 12/15/23 | | | 3,500,000 | | | | 3,521,303 | |
Barclays Dryrock Issuance Trust | | | | | | | | |
Series2017-1 A 2.785% (LIBOR01M + 0.33%, Floor 0.33%) 3/15/23 • | | | 6,410,000 | | | | 6,412,444 | |
BMW Floorplan Master Owner Trust | | | | | | | | |
Series2018-1 A2 144A 2.775% (LIBOR01M + 0.32%) 5/15/23 #• | | | 2,200,000 | | | | 2,199,997 | |
BMW Vehicle Lease Trust | | | | | | | | |
Series2016-2 A3 1.43% 9/20/19 | | | 311,156 | | | | 310,694 | |
Cabela’s Credit Card Master Note Trust | | | | | | | | |
Series2015-1A A1 2.26% 3/15/23 | | | 5,805,000 | | | | 5,744,954 | |
Series2016-1 A1 1.78% 6/15/22 | | | 6,684,000 | | | | 6,645,243 | |
CARDS II Trust | | | | | | | | |
Series2017-1A A 144A 2.825% (LIBOR01M + 0.37%) 4/18/22 #• | | | 1,230,000 | | | | 1,229,880 | |
CarMax Auto Owner Trust | | | | | | | | |
Series2018-1 A2B 2.605% (LIBOR01M + 0.15%) 5/17/21 • | | | 2,718,353 | | | | 2,717,075 | |
Chase Issuance Trust | | | | | | | | |
Series2014-A5 A5 2.825% (LIBOR01M + 0.37%) 4/15/21 • | | | 882,000 | | | | 882,574 | |
Series2015-A4 A4 1.84% 4/15/22 | | | 7,895,000 | | | | 7,777,022 | |
Series2016-A1 A 2.865% (LIBOR01M + 0.41%) 5/15/21 • | | | 7,524,000 | | | | 7,530,191 | |
Series2016-A3 A3 3.005% (LIBOR01M + 0.55%) 6/15/23 • | | | 15,735,000 | | | | 15,812,517 | |
Limited-Term Diversified Income Series-11
Delaware VIP® Limited-Term Diversified Income Series
Schedule of investments (continued)
| | | | | | | | |
| | | Principal amount° | | | Value (US $) | |
| | |
Non-Agency Asset-Backed Securities (continued) | | | | | | | | |
Chase Issuance Trust | | | | | | | | |
Series2017-A1 A 2.755% (LIBOR01M + 0.30%) 1/15/22 • | | | 3,440,000 | | | $ | 3,441,669 | |
Series2017-A2 A 2.855% (LIBOR01M + 0.40%) 3/15/24 • | | | 4,555,000 | | | | 4,554,994 | |
Series2018-A1 A1 2.655% (LIBOR01M + 0.20%) 4/17/23 • | | | 3,040,000 | | | | 3,030,640 | |
Chesapeake Funding II | | | | | | | | |
Series2017-2A A2 144A 2.905% (LIBOR01M + 0.45%, Floor 0.45%) 5/15/29 #• | | | 2,349,507 | | | | 2,353,617 | |
Series2017-4A A2 144A 2.795% (LIBOR01M + 0.34%) 11/15/29 #• | | | 4,038,663 | | | | 4,029,586 | |
Citibank Credit Card Issuance Trust | | | | | | | | |
Series2016-A3 A3 2.873% (LIBOR01M + 0.49%) 12/7/23 • | | | 15,395,000 | | | | 15,411,904 | |
Series2017-A4 A4 2.603% (LIBOR01M + 0.22%) 4/7/22 • | | | 1,500,000 | | | | 1,500,001 | |
Series2017-A5 A5 3.124% (LIBOR01M + 0.62%, Floor 0.62%) 4/22/26 • | | | 1,000,000 | | | | 1,005,143 | |
Series2017-A7 A7 2.757% (LIBOR01M + 0.37%) 8/8/24 • | | | 19,325,000 | | | | 19,265,193 | |
Series2017-A9 A9 1.80% 9/20/21 | | | 1,500,000 | | | | 1,487,925 | |
Series2018-A2 A2 2.80% (LIBOR01M + 0.33%) 1/20/25 • | | | 10,455,000 | | | | 10,394,017 | |
Series2018-A4 A4 2.723% (LIBOR01M + 0.34%) 6/7/25 • | | | 9,000,000 | | | | 8,927,886 | |
Discover Card Execution Note Trust | | | | | | | | |
Series2017-A1 A1 2.945% (LIBOR01M + 0.49%) 7/15/24 • | | | 14,770,000 | | | | 14,800,708 | |
Series2017-A7 A7 2.815% (LIBOR01M + 0.36%) 4/15/25 • | | | 10,490,000 | | | | 10,444,977 | |
Series2018-A2 A2 2.785% (LIBOR01M + 0.33%) 8/15/25 • | | | 9,375,000 | | | | 9,301,399 | |
Series2018-A3 A3 2.685% (LIBOR01M + 0.23%, Floor 0.23%) 12/15/23 • | | | 6,920,000 | | | | 6,896,723 | |
Enterprise Fleet Financing | | | | | | | | |
Series2017-2 A2 144A 1.97% 1/20/23 # | | | 7,750,791 | | | | 7,690,921 | |
Ford Credit Auto Lease Trust | | | | | | | | |
Series2018-A A2A 2.71% 12/15/20 | | | 10,552,575 | | | | 10,531,851 | |
Ford Credit Auto Owner Trust | | | | | | | | |
Series2015-A C 2.20% 11/15/20 | | | 6,000,000 | | | | 5,978,462 | |
Series2017-A A3 1.67% 6/15/21 | | | 5,889,941 | | | | 5,843,848 | |
Ford Credit Floorplan Master Owner Trust A | | | | | | | | |
Series2015-2 A2 3.025% (LIBOR01M + 0.57%, Floor 0.57%) 1/15/22 • | | | 26,374,000 | | | | 26,448,330 | |
| | | | | | | | |
| | | Principal amount° | | | Value (US $) | |
| | |
Non-Agency Asset-Backed Securities (continued) | | | | | | | | |
Ford Credit Floorplan Master Owner Trust A | | | | | | | | |
Series2017-1 A2 2.875% (LIBOR01M + 0.42%) 5/15/22 • | | | 425,000 | | | $ | 426,395 | |
Series2017-2 A2 2.805% (LIBOR01M + 0.35%, Floor 0.62%) 9/15/22 • | | | 17,200,000 | | | | 17,220,373 | |
Series2018-1 A2 2.735% (LIBOR01M + 0.28%) 5/15/23 • | | | 1,225,000 | | | | 1,218,728 | |
GMF Floorplan Owner Revolving Trust | | | | | | | | |
Series2017-1 A1 144A 2.22% 1/18/22 # | | | 2,150,000 | | | | 2,131,531 | |
Series2017-1 A2 144A 3.025% (LIBOR01M + 0.57%) 1/18/22 #• | | | 500,000 | | | | 501,617 | |
Golden Credit Card Trust | | | | | | | | |
Series2014-2A A 144A 2.905% (LIBOR01M + 0.45%) 3/15/21 #• | | | 1,485,000 | | | | 1,485,126 | |
HOA Funding | | | | | | | | |
Series2014-1A A2 144A 4.846% 8/20/44 # | | | 333,975 | | | | 332,606 | |
Hyundai Auto Lease Securitization Trust | | | | | | | | |
Series2016-C A3 144A 1.49% 2/18/20 # | | | 440,075 | | | | 439,682 | |
Series2017-C A3 144A 2.12% 2/16/21 # | | | 2,500,000 | | | | 2,482,014 | |
Series2018-A A3 144A 2.81% 4/15/21 # | | | 1,300,000 | | | | 1,295,421 | |
Invitation Homes Trust | | | | | | | | |
Series 2018-SFR1 A 144A 3.155% (LIBOR01M + 0.70%) 3/17/37 #• | | | 3,420,868 | | | | 3,349,372 | |
Mercedes-Benz Auto Lease Trust | | | | | | | | |
Series2018-B A2 3.04% 12/15/20 | | | 3,670,000 | | | | 3,672,117 | |
Mercedes-Benz Master Owner Trust | | | | | | | | |
Series2016-BA A 144A 3.155% (LIBOR01M + 0.70%, Floor 0.75%) 5/17/21 #• | | | 2,280,000 | | | | 2,284,601 | |
Series2017-AA A 144A 2.755% (LIBOR01M + 0.30%) 5/16/21 #• | | | 1,000,000 | | | | 1,000,446 | |
Series2017-BA A 144A 2.875% (LIBOR01M + 0.42%) 5/16/22 #• | | | 7,080,000 | | | | 7,080,685 | |
Series2018-BA A 144A 2.795% (LIBOR01M + 0.34%) 5/15/23 #• | | | 2,400,000 | | | | 2,393,357 | |
MMAF Equipment Finance | | | | | | | | |
Series2015-AA A5 144A 2.49% 2/19/36 # | | | 1,595,000 | | | | 1,582,337 | |
Navistar Financial Dealer Note Master Owner Trust II | | | | | | | | |
Series2017-1 A 144A 3.286% (LIBOR01M + 0.78%) 6/27/22 #• | | | 1,900,000 | | | | 1,902,005 | |
Limited-Term Diversified Income Series-12
Delaware VIP® Limited-Term Diversified Income Series
Schedule of investments (continued)
| | | | | | | | |
| | | Principal amount° | | | Value (US $) | |
| | |
Non-Agency Asset-Backed Securities (continued) | | | | | | | | |
Navistar Financial Dealer Note Master Owner Trust II | | | | | | | | |
Series2018-1 A 144A 3.136% (LIBOR01M + 0.63%, Floor 0.63%) 9/25/23 #• | | | 600,000 | | | $ | 599,775 | |
Nissan Master Owner Trust Receivables | | | | | | | | |
Series2016-A A1 3.095% (LIBOR01M + 0.64%, Floor 0.65%) 6/15/21 • | | | 2,790,000 | | | | 2,792,356 | |
Series2017-B A 2.885% (LIBOR01M + 0.43%) 4/18/22 • | | | 2,170,000 | | | | 2,169,371 | |
Series2017-C A 2.775% (LIBOR01M + 0.32%) 10/17/22 • | | | 3,720,000 | | | | 3,714,820 | |
PFS Financing | | | | | | | | |
Series2018-A A 144A 2.855% (LIBOR01M + 0.40%) 2/15/22 #• | | | 610,000 | | | | 609,562 | |
Series2018-C A 144A 2.935% (LIBOR01M + 0.48%) 4/15/22 #• | | | 1,900,000 | | | | 1,895,204 | |
Series2018-E A 144A 2.905% (LIBOR01M + 0.45%) 10/17/22 #• | | | 3,090,000 | | | | 3,084,586 | |
Popular ABS Mortgage Pass Through Trust | | | | | | | | |
Series2006-C A4 2.756% (LIBOR01M + 0.25%, Cap 14.00%, Floor 0.25%) 7/25/36¨• | | | 747,123 | | | | 740,609 | |
Tesla Auto Lease Trust | | | | | | | | |
Series2018-A A 144A 2.32% 12/20/19 # | | | 1,846,854 | | | | 1,841,779 | |
Series2018-B A 144A 3.71% 8/20/21 # | | | 1,315,000 | | | | 1,318,172 | |
Towd Point Mortgage Trust | | | | | | | | |
Series2015-5 A1B 144A 2.75% 5/25/55 #• | | | 513,105 | | | | 505,341 | |
Series2015-6 A1B 144A 2.75% 4/25/55 #• | | | 586,377 | | | | 575,923 | |
Toyota Auto Receivables Owner Trust | | | | | | | | |
Series2018-A A2B 2.525% (LIBOR01M + 0.07%) 10/15/20 • | | | 4,707,473 | | | | 4,707,316 | |
Series2018-C A2B 2.575% (LIBOR01M + 0.12%) 8/16/21 • | | | 2,500,000 | | | | 2,500,056 | |
Trafigura Securitisation Finance | | | | | | | | |
Series2017-1A A1 144A 3.305% (LIBOR01M + 0.85%) 12/15/20 #• | | | 7,415,000 | | | | 7,449,050 | |
Series2018-1A A1 144A 3.185% (LIBOR01M + 0.73%) 3/15/22 #• | | | 250,000 | | | | 250,065 | |
Verizon Owner Trust | | | | | | | | |
Series2016-2A A 144A 1.68% 5/20/21 # | | | 3,115,848 | | | | 3,098,066 | |
Series2017-1A A 144A 2.06% 9/20/21 # | | | 4,780,000 | | | | 4,744,434 | |
| | | | | | | | |
| | | Principal amount° | | | Value (US $) | |
| | |
Non-Agency Asset-Backed Securities (continued) | | | | | | | | |
Verizon Owner Trust | | | | | | | | |
Series2017-3A A1B 144A 2.74% (LIBOR01M + 0.27%) 4/20/22 #• | | | 13,325,000 | | | $ | 13,321,001 | |
Series2018-1A A1B 144A 2.73% (LIBOR01M + 0.26%) 9/20/22 #• | | | 5,070,000 | | | | 5,062,364 | |
Volkswagen Auto Loan Enhanced Trust | | | | | | | | |
Series2018-1 A2B 2.65% (LIBOR01M + 0.18%) 7/20/21 • | | | 1,135,000 | | | | 1,135,324 | |
Volvo Financial Equipment Master Owner Trust | | | | | | | | |
Series2017-A A 144A 2.955% (LIBOR01M + 0.50%) 11/15/22 #• | | | 15,000,000 | | | | 15,031,739 | |
Wheels SPV 2 | | | | | | | | |
Series2018-1A A2 144A 3.06% 4/20/27 # | | | 3,145,000 | | | | 3,144,951 | |
| | | | | | | | |
TotalNon-Agency Asset-Backed Securities
(cost $416,237,940) | | | | | | | 415,058,559 | |
| | | | | | | | |
| | |
Non-Agency Collateralized Mortgage Obligations – 0.47% | | | | | | | | |
Banc of America Alternative Loan Trust | | | | | | | | |
Series2005-6 7A1 5.50% 7/25/20 | | | 4,016 | | | | 3,668 | |
Galton Funding Mortgage Trust | | | | | | | | |
Series2018-1 A43 144A 3.50% 11/25/57 #• | | | 570,583 | | | | 568,749 | |
JPMorgan Mortgage Trust | | | | | | | | |
Series 2014-IVR6 2A4 144A 2.50% 7/25/44 #• | | | 650,000 | | | | 650,205 | |
Sequoia Mortgage Trust | | | | | | | | |
Series2014-2 A4 144A 3.50% 7/25/44 #• | | | 368,642 | | | | 364,981 | |
Series2017-4 A1 144A 3.50% 7/25/47 #• | | | 485,124 | | | | 477,544 | |
Silverstone Master Issuer | | | | | | | | |
Series2018-1A 1A 144A 2.859% (LIBOR03M + 0.39%) 1/21/70 #• | | | 4,950,000 | | | | 4,924,869 | |
| | | | | | | | |
| | |
TotalNon-Agency Collateralized Mortgage Obligations
(cost $7,026,914) | | | | | | | 6,990,016 | |
| | | | | | | | |
| | |
Non-Agency Commercial Mortgage-Backed
Security – 0.04% | | | | | | | | |
LB-UBS Commercial Mortgage Trust | | | | | | | | |
Series2006-C6 AJ 5.452% 9/15/39 • | | | 775,148 | | | | 534,911 | |
| | | | | | | | |
TotalNon-Agency Commercial Mortgage-Backed Security
(cost $822,041) | | | | | | | 534,911 | |
| | | | | | | | |
Limited-Term Diversified Income Series-13
Delaware VIP® Limited-Term Diversified Income Series
Schedule of investments (continued)
| | | | | | | | |
| | | Principal amount° | | | Value (US $) | |
| | |
Sovereign Bond – 0.95% | | | | | | | | |
Japan – 0.95% | | | | | | | | |
Japan Bank for International Cooperation 3.259% (LIBOR03M + 0.57%) 2/24/20 • | | | 14,030,000 | | | $ | 14,106,069 | |
| | | | | | | | |
Total Sovereign Bond
(cost $14,136,025) | | | | | | | 14,106,069 | |
| | | | | | | | |
| | |
Supranational Bank – 0.71% | | | | | | | | |
Inter-American Development Bank 2.387% (LIBOR01M + 0.00%) 10/9/20 • | | | 10,530,000 | | | | 10,521,672 | |
| | | | | | | | |
Total Supranational Bank
(cost $10,517,860) | | | | | | | 10,521,672 | |
| | | | | | | | |
| | |
US Treasury Obligations – 11.55% | | | | | | | | |
US Treasury Floating Rate Note | | | | | | | | |
2.513% (USBMMY3M + 0.033%) 4/30/20 • | | | 16,365,000 | | | | 16,361,246 | |
2.523% (USBMMY3M + 0.043%) 7/31/20 • | | | 104,655,000 | | | | 104,617,178 | |
2.525% (USBMMY3M + 0.045%) 10/31/20 • | | | 50,000,000 | | | | 49,933,465 | |
| | | | | | | | |
Total US Treasury Obligations
(cost $171,026,560) | | | | | | | 170,911,889 | |
| | | | | | | | |
| | |
| | | Number of
shares | | | | |
| | |
Preferred Stock – 0.18% | | | | | | | | |
Morgan Stanley 5.55% µ | | | 2,500,000 | | | | 2,429,375 | |
USB Realty 144A 3.583% (LIBOR03M +
1.147%)#• | | | 200,000 | | | | 173,500 | |
| | | | | | | | |
Total Preferred Stock
(cost $2,655,000) | | | | | | | 2,602,875 | |
| | | | | | | | |
| | | | | | | | |
| | | Principal amount° | | | Value (US $) | |
| | |
Short-Term Investments – 1.55% | | | | | | | | |
Discount Note – 0.18%≠ | | | | | | | | |
Federal Home Loan Bank 1.05% 1/2/19 | | | 2,662,946 | | | $ | 2,662,946 | |
| | | | | | | | |
| | | | | | | 2,662,946 | |
| | | | | | | | |
Repurchase Agreements – 0.93% | | | | | | | | |
Bank of America Merrill Lynch 2.95%, dated 12/31/18, to be repurchased on 1/2/19, repurchase at $1,664,614 (cash collateralized of $1,664,341) | | | 1,664,341 | | | | 1,664,341 | |
Bank of Montreal
2.60%, dated 12/31/18, to be repurchased on 1/2/19, repurchase price $4,577,599 (collateralized by US government obligations
0.00%–3.75% 1/24/19–2/15/47; market value $4,668,477). | | | 4,576,938 | | | | 4,576,938 | |
BNP Paribas
2.93%, dated 12/31/18, to be repurchased on 1/2/19, repurchase price $7,485,310 (collateralized by US government obligations
0.00%–8.00% 2/15/19–8/15/46; market value $7,633,774). | | | 7,484,092 | | | | 7,484,092 | |
| | | | | | | | |
| | | | | | | 13,725,371 | |
| | | | | | | | |
US Treasury Obligation – 0.44%≠ | | | | | | | | |
US Treasury Bill 1.493% 1/3/19 | | | 6,496,299 | | | | 6,495,889 | |
| | | | | | | | |
| | | | | | | 6,495,889 | |
| | | | | | | | |
Total Short-Term Investments
(cost $22,883,652) | | | | | | | 22,884,206 | |
| | | | | | | | |
| | | | | | |
Total Value of Securities – 101.82%
(cost $1,520,448,403) | | | | $ | 1,507,223,955 | |
| # | Security exempt from registration under Rule 144A of the Securities Act of 1933, as amended. At Dec. 31, 2018, the aggregate value of Rule 144A securities was $230,867,226, which represents 15.60% of the Series’ net assets. See Note 11 in “Notes to financial statements.” |
| ¨ | Pass Through Agreement. Security represents the contractual right to receive a proportionate amount of underlying payments due to the counterparty pursuant to various agreements related to the rescheduling of obligations and the exchange of certain notes. |
| ≠ | The rate shown is the effective yield at the time of purchase. |
| ° | Principal amount shown is stated in USD unless noted that the security is denominated in another currency. |
| µ | Fixed to variable rate investment. The rate shown reflects the fixed rate in effect at Dec. 31, 2018. Rate will reset at a future date. |
| y | No contractual maturity date. |
| • | Variable rate investment. Rates reset periodically. Rate shown reflects the rate in effect at Dec. 31, 2018. For securities based on a published reference rate and spread, the reference rate and spread are indicated in their description above. The reference rate descriptions (i.e. LIBOR03M, LIBOR06M, etc.) used in this report are identical for different securities, but the underlying reference rates may differ due to the timing of the reset period. Certain variable rate securities are not based on a published reference rate and spread but are determined by the issuer or agent and are based on current market conditions, or for mortgage-backed securities, are impacted by the individual mortgages which are paying off over time. These securities do not indicate a reference rate and spread in their description above. |
Limited-Term Diversified Income Series-14
Delaware VIP® Limited-Term Diversified Income Series
Schedule of investments (continued)
The following swap contract was outstanding at Dec. 31, 2018:1
Swap Contract
CDS Contract2
| | | | | | | | | | | | | | | | | | | | | | | | |
Reference Obligation/ Termination Date/ Payment Frequency | | Notional
Amount3 | | | Annual
Protection
Payments | | | Value | | | Upfront
Payments
Paid (Received) | | | Unrealized
Appreciation4 | | | Variation Margin
Due from
(Due to) Brokers | |
| | | | | | |
Centrally Cleared/ Protection Purchased: | | | | | | | | | | | | | | | | | | | | | | | | |
CDX.NA.HY.31512/20/23 - Quarterly | | | 27,000,000 | | | | 5.00% | | | | $(548,123) | | | | $(1,663,599) | | | | $1,115,476 | | | | $(30,960) | |
The use of swap contracts involves elements of market risk and risks in excess of the amounts disclosed in the financial statements. The notional amounts presented above represents the Series’ total exposure in such contracts, whereas only the net unrealized appreciation (depreciation) is reflected in the Series’ net assets.
1 See Note 8 in “Notes to financial statements.”
2 A CDS contract is a risk-transfer instrument through which one party (purchaser of protection) transfers to another party (seller of protection) the financial risk of a credit event (as defined in the CDS agreement), as it relates to a particular reference security or basket of securities (such as an index). Periodic payments (receipts) on such contracts are accrued daily and recorded as unrealized losses (gains) on swap contracts. Upon payment (receipt), such amounts are recorded as realized losses (gains) on swap contracts. Upfront payments made or received in connection with CDS contracts are amortized over the expected life of the CDS contracts as unrealized losses (gains) on swap contracts. The change in value of CDS contracts is recorded daily as unrealized appreciation or depreciation. A realized gain or loss is recorded upon a credit event (as defined in the CDS agreement) or the maturity or termination of the CDS agreement.
3 Notional amount shown is stated in US Dollars unless noted that the swap is denominated in another currency.
4 Unrealized appreciation (depreciation) does not include periodic interest payments on swap contracts accrued daily in the amount of ($6,115).
5 Markit’s CDX.NA.HY Index, is composed of 100 liquid North American entities with high yield credit ratings that trade in the CDS market.
Summary of abbreviations:
ARM – Adjustable Rate Mortgage
BA – Bank of America
CDS – Credit Default Swap
CDX.NA.HY – Credit Default Swap Index North America High Yield
FDIC – Federal Deposit Insurance Corporation
FREMF – Freddie Mac Multifamily
GNMA – Government National Mortgage Association
H15T1Y – US Treasury Yield Curve Rate T Note Constant Maturity 1 Year
ICE – Intercontinental Exchange
LB – Lehman Brothers
LIBOR – London Interbank Exchange
LIBOR01M – ICE LIBOR USD 1 Month
LIBOR03M – ICE LIBOR USD 3 Month
LIBOR06M – ICE LIBOR USD 6 Month
LIBOR12M – ICE LIBOR USD 1 Year
NCUA – National Credit Union Administration
REMIC – Real Estate Mortgage Investment Conduit
S.F. – Single Family
USBMMY03M – US Treasury 3 Month Bill Money Market Yield
USD – US Dollar
yr – Year
See accompanying notes, which are an integral part of the financial statements.
Limited-Term Diversified Income Series-15
Delaware VIP®Trust—Delaware VIP Limited-Term Diversified Income Series
| | |
| Statement of assets and liabilities | | December 31, 2018 |
| | | | |
Assets: | | | | |
Investments, at value1 | | $ | 1,507,223,955 | |
Cash | | | 19,072,777 | |
Cash collateral due from broker for swap contracts | | | 1,490,475 | |
Receivable for securities sold | | | 23,761,969 | |
Interest receivable | | | 7,692,021 | |
Receivable for series shares sold | | | 64,096 | |
| | | | |
Total assets | | | 1,559,305,293 | |
| | | | |
Liabilities: | | | | |
Payable for securities purchased | | | 72,628,822 | |
Payable for series shares redeemed | | | 2,666,960 | |
Upfront payments received on credit default swaps contracts | | | 1,663,599 | |
Distribution payable | | | 865,311 | |
Investment management fees payable to affiliates | | | 581,967 | |
Distribution fees payable to affiliates | | | 314,811 | |
Other accrued expenses | | | 141,043 | |
Swaps payments payable | | | 45,000 | |
Variation margin due to broker on centrally cleared credit default swap contracts | | | 30,960 | |
Dividend disbursing and transfer agent fees and expenses payable to affiliates | | | 9,169 | |
Accounting and administration expenses payable to affiliates | | | 5,078 | |
Trustees’ fees and expenses payable to affiliates | | | 3,344 | |
Legal fees payable to affiliates | | | 2,324 | |
Reports and statements to shareholders expenses payable to affiliates | | | 1,098 | |
| | | | |
Total liabilities | | | 78,959,486 | |
| | | | |
Total Net Assets | | $ | 1,480,345,807 | |
| | | | |
| |
Net Assets Consist of: | | | | |
Paid-in capital | | $ | 1,532,739,904 | |
Total distributable earnings (loss) | | | (52,394,097 | ) |
| | | | |
Total Net Assets | | $ | 1,480,345,807 | |
| | | | |
| |
Net Asset Value | | | | |
Standard Class: | | | | |
Net assets | | $ | 260,009,368 | |
Shares of beneficial interest outstanding, unlimited authorization, no par | | | 27,110,317 | |
Net asset value per share | | $ | 9.59 | |
| |
Service Class: | | | | |
Net assets | | $ | 1,220,336,439 | |
Shares of beneficial interest outstanding, unlimited authorization, no par | | | 128,095,719 | |
Net asset value per share | | $ | 9.53 | |
1Investments, at cost | | $ | 1,520,448,403 | |
See accompanying notes, which are an integral part of the financial statements.
Limited-Term Diversified Income Series-16
Delaware VIP® Trust—
Delaware VIP Limited-Term Diversified Income Series
Statement of operations
Year ended December 31, 2018
| | | | |
Investment Income: | | | | |
Interest | | $ | 37,366,082 | |
| | | | |
Expenses: | | | | |
Management fees | | | 6,657,295 | |
Distribution expenses – Service Class | | | 3,854,322 | |
Accounting and administration expenses | | | 282,859 | |
Reports and statements to shareholders expenses | | | 173,724 | |
Dividend disbursing and transfer agent fees and expenses | | | 116,573 | |
Legal fees | | | 83,407 | |
Trustees’ fees and expenses | | | 66,594 | |
Audit and tax fees | | | 50,353 | |
Custodian fees | | | 40,468 | |
Registration fees | | | 245 | |
Other | | | 65,780 | |
| | | | |
| | | 11,391,620 | |
Less waived distribution expenses – Service Class | | | (214,316 | ) |
Less expenses paid indirectly | | | (10,641 | ) |
| | | | |
Total operating expenses | | | 11,166,663 | |
| | | | |
Net Investment Income | | | 26,199,419 | |
| | | | |
| |
Net Realized and Unrealized Gain (Loss): | | | | |
Net realized loss on: | | | | |
Investments | | | (11,480,978 | ) |
Swap contracts | | | (2,088,802 | ) |
| | | | |
Net realized loss | | | (13,569,780 | ) |
| | | | |
Net change in unrealized appreciation (depreciation) of: | | | | |
Investments | | | (14,148,172 | ) |
Swap contracts | | | 1,747,413 | |
| | | | |
Net change in unrealized appreciation (depreciation) | | | (12,400,759 | ) |
| | | | |
Net Realized and Unrealized Loss | | | (25,970,539 | ) |
| | | | |
Net Increase in Net Assets Resulting from Operations | | $ | 228,880 | |
| | | | |
Delaware VIP Trust—
Delaware VIP Limited-Term Diversified Income Series
Statements of changes in net assets
| | | | | | | | |
| | | Year ended | |
| | | 12/31/18 | | | 12/31/17 | |
Increase (Decrease) in Net Assets from Operations: | | | | | | | | |
Net investment income | | $ | 26,199,419 | | | $ | 17,757,791 | |
Net realized gain (loss) | | | (13,569,780 | ) | | | 4,592,083 | |
Net change in unrealized appreciation (depreciation) | | | (12,400,759 | ) | | | 4,850,124 | |
| | | | | | | | |
Net increase in net assets resulting from operations | | | 228,880 | | | | 27,199,998 | |
| | | | | | | | |
Dividends and Distributions to Shareholders from: | | | | | | | | |
Distributable earnings*: | | | | | | | | |
Standard Class | | | (3,043,622 | ) | | | (1,916,055 | ) |
Service Class | | | (31,121,454 | ) | | | (23,867,534 | ) |
| | | | | | | | |
| | | (34,165,076 | ) | | | (25,783,589 | ) |
| | | | | | | | |
| | |
Capital Share Transactions: | | | | | | | | |
Proceeds from shares sold: | | | | | | | | |
Standard Class | | | 178,484,132 | | | | 29,332,842 | |
Service Class | | | 41,914,297 | | | | 54,140,719 | |
| | |
Net asset value of shares based upon reinvestment of dividends and distributions: | | | | | | | | |
Standard Class | | | 2,913,489 | | | | 1,915,246 | |
Service Class | | | 30,855,015 | | | | 23,934,377 | |
| | | | | | | | |
| | | 254,166,933 | | | | 109,323,184 | |
| | | | | | | | |
Cost of shares redeemed: | | | | | | | | |
Standard Class | | | (18,087,997 | ) | | | (13,776,255 | ) |
Service Class | | | (139,860,998 | ) | | | (86,289,865 | ) |
| | | | | | | | |
| | | (157,948,995 | ) | | | (100,066,120 | ) |
| | | | | | | | |
Increase in net assets derived from capital share transactions | | | 96,217,938 | | | | 9,257,064 | |
| | | | | | | | |
Net Increase in Net Assets | | | 62,281,742 | | | | 10,673,473 | |
| | |
Net Assets: | | | | | | | | |
Beginning of year | | | 1,418,064,065 | | | | 1,407,390,592 | |
| | | | | | | | |
End of year1 | | $ | 1,480,345,807 | | | $ | 1,418,064,065 | |
| | | | | | | | |
| 1 | Net Assets – End of year includes undistributed net investment income of $595,497 in 2017. The Securities and Exchange Commission eliminated the requirement to disclose undistributed (distributions in excess of) net investment income in 2018. |
| * | For the year ended Dec. 31, 2018, the Series has adopted amendments to RegulationS-X (see Note 13 in “Notes to financial statements”). For the year ended Dec. 31, 2017, the dividends and distributions to shareholders were as follows: |
| | | | |
| | | Standard Class | | Service Class |
Dividends from net investment income | | $(1,916,055) | | $(23,867,534) |
See accompanying notes, which are an integral part of the financial statements.
Limited-Term Diversified Income Series-17
Delaware VIP® Trust — Delaware VIP Limited-Term Diversified Income Series
Financial highlights
Selected data for each share of the Series outstanding throughout each period were as follows:
| | | | | | | | | | | | | | | | | | | | | | | | | | | | | | | | | | | | | |
| | | Delaware VIP Limited-Term Diversified Income Series Standard Class | | |
| | | | | | | | | | | | | | | | | | | | | | | | | | | | | | | | | | | | | |
| | | Year ended |
| | 12/31/18 | | | 12/31/17 | | | 12/31/16 | | | 12/31/15 | | | 12/31/14 | | | |
Net asset value, beginning of period | | | | | $ | 9.83 | | | | | | $ | 9.82 | | | | | | $ | 9.78 | | | | | | $ | 9.87 | | | | | | $ | 9.86 | | | |
| | | | | | | | | | | |
Income (loss) from investment operations: | | | | | | | | | | | | | | | | | | | | | | | | | | | | | | | | | | | | | |
Net investment income1 | | | | | | 0.21 | | | | | | | 0.15 | | | | | | | 0.11 | | | | | | | 0.13 | | | | | | | 0.12 | | | |
Net realized and unrealized gain (loss) | | | | | | (0.19 | ) | | | | | | 0.06 | | | | | | | 0.09 | | | | | | | (0.05 | ) | | | | | | 0.05 | | | |
| | | | | | | | | | | | | | | | | | | | | | | | | | | | | | | | | | | | | |
Total from investment operations | | | | | | 0.02 | | | | | | | 0.21 | | | | | | | 0.20 | | | | | | | 0.08 | | | | | | | 0.17 | | | |
| | | | | | | | | | | | | | | | | | | | | | | | | | | | | | | | | | | | | |
| | | | | | | | | | | |
Less dividends and distributions from: | | | | | | | | | | | | | | | | | | | | | | | | | | | | | | | | | | | | | |
Net investment income | | | | | | (0.26 | ) | | | | | | (0.20 | ) | | | | | | (0.16 | ) | | | | | | (0.17 | ) | | | | | | (0.16 | ) | | |
| | | | | | | | | | | | | | | | | | | | | | | | | | | | | | | | | | | | | |
Total dividends and distributions | | | | | | (0.26 | ) | | | | | | (0.20 | ) | | | | | | (0.16 | ) | | | | | | (0.17 | ) | | | | | | (0.16 | ) | | |
| | | | | | | | | | | | | | | | | | | | | | | | | | | | | | | | | | | | | |
| | | | | | | | | | | |
Net asset value, end of period | | | | | $ | 9.59 | | | | | | $ | 9.83 | | | | | | $ | 9.82 | | | | | | $ | 9.78 | | | | | | $ | 9.87 | | | |
| | | | | | | | | | | | | | | | | | | | | | | | | | | | | | | | | | | | | |
| | | | | | | | | | | |
Total return2 | | | | | | 0.24% | | | | | | | 2.17% | | | | | | | 2.09% | | | | | | | 0.78% | | | | | | | 1.69% | | | |
| | | | | | | | | | | |
Ratios and supplemental data: | | | | | | | | | | | | | | | | | | | | | | | | | | | | | | | | | | | | | |
Net assets, end of period (000 omitted) | | | | | $ | 260,009 | | | | | | $ | 98,895 | | | | | | $ | 81,412 | | | | | | $ | 62,646 | | | | | | $ | 59,362 | | | |
Ratio of expenses to average net assets | | | | | | 0.54% | | | | | | | 0.55% | | | | | | | 0.55% | | | | | | | 0.56% | | | | | | | 0.56% | | | |
Ratio of net investment income to average net assets | | | | | | 2.14% | | | | | | | 1.49% | | | | | | | 1.15% | | | | | | | 1.36% | | | | | | | 1.22% | | | |
Portfolio turnover | | | | | | 125% | | | | | | | 135% | | | | | | | 143% | | | | | | | 128% | | | | | | | 113% | | | |
| 1 | The average shares outstanding method has been applied for per share information. |
| 2 | Total return is based on the change in net asset value of a share during the period and assumes reinvestment of dividends and distributions at net asset value. Total return does not include fees, charges, or expenses imposed by the variable annuity and life insurance contracts for which Delaware VIP Trust serves as an underlying investment vehicle. |
See accompanying notes, which are an integral part of the financial statements.
Limited-Term Diversified Income Series-18
Delaware VIP® Limited-Term Diversified Income Series
Financial highlights (continued)
Selected data for each share of the Series outstanding throughout each period were as follows:
| | | | | | | | | | | | | | | | | | | | | | | | | | | | | | | | | | | | | | | | |
| | | Delaware VIP Limited-Term Diversified Income Series Service Class | | |
| | | | | | | | | | | | | | | | | | | | | | | | | | | | | | | | | | | | | | | | |
| | | Year ended |
| | 12/31/18 | | | 12/31/17 | | | 12/31/16 | | | 12/31/15 | | | 12/31/14 | | | | | | |
Net asset value, beginning of period | | | | | $ | 9.76 | | | | | | $ | 9.75 | | | | | | $ | 9.72 | | | | | | $ | 9.80 | | | | | | $ | 9.79 | | | | | | |
| | | | | | | | | | | |
Income (loss) from investment operations: | | | | | | | | | | | | | | | | | | | | | | | | | | | | | | | | | | | | | | | | |
Net investment income1 | | | | | | 0.18 | | | | | | | 0.12 | | | | | | | 0.09 | | | | | | | 0.11 | | | | | | | 0.10 | | | | | | |
Net realized and unrealized gain (loss) | | | | | | (0.18 | ) | | | | | | 0.07 | | | | | | | 0.08 | | | | | | | (0.05 | ) | | | | | | 0.04 | | | | | | |
| | | | | | | | | | | | | | | | | | | | | | | | | | | | | | | | | | | | | | | | |
Total from investment operations | | | | | | — | | | | | | | 0.19 | | | | | | | 0.17 | | | | | | | 0.06 | | | | | | | 0.14 | | | | | | |
| | | | | | | | | | | | | | | | | | | | | | | | | | | | | | | | | | | | | | | | |
| | | | | | | | | | | |
Less dividends and distributions from: | | | | | | | | | | | | | | | | | | | | | | | | | | | | | | | | | | | | | | | | |
Net investment income | | | | | | (0.23 | ) | | | | | | (0.18 | ) | | | | | | (0.14 | ) | | | | | | (0.14 | ) | | | | | | (0.13 | ) | | | | | |
| | | | | | | | | | | | | | | | | | | | | | | | | | | | | | | | | | | | | | | | |
Total dividends and distributions | | | | | | (0.23 | ) | | | | | | (0.18 | ) | | | | | | (0.14 | ) | | | | | | (0.14 | ) | | | | | | (0.13 | ) | | | | | |
| | | | | | | | | | | | | | | | | | | | | | | | | | | | | | | | | | | | | | | | |
| | | | | | | | | | | |
Net asset value, end of period | | | | | $ | 9.53 | | | | | | $ | 9.76 | | | | | | $ | 9.75 | | | | | | $ | 9.72 | | | | | | $ | 9.80 | | | | | | |
| | | | | | | | | | | | | | | | | | | | | | | | | | | | | | | | | | | | | | | | |
| | | | | | | | | | | |
Total return2 | | | | | | 0.04% | | | | | | | 1.92% | | | | | | | 1.73% | | | | | | | 0.62% | | | | | | | 1.44% | | | | | | |
| | | | | | | | | | | |
Ratios and supplemental data: | | | | | | | | | | | | | | | | | | | | | | | | | | | | | | | | | | | | | | | | |
Net assets, end of period (000 omitted) | | | | | $ | 1,220,337 | | | | | | $ | 1,319,169 | | | | | | $ | 1,325,979 | | | | | | $ | 1,370,899 | | | | | | $ | 1,405,542 | | | | | | |
Ratio of expenses to average net assets | | | | | | 0.82% | | | | | | | 0.80% | | | | | | | 0.80% | | | | | | | 0.81% | | | | | | | 0.81% | | | | | | |
Ratio of expenses to average net assets prior to fees waived | | | | | | 0.84% | | | | | | | 0.85% | | | | | | | 0.85% | | | | | | | 0.86% | | | | | | | 0.86% | | | | | | |
Ratio of net investment income to average net assets | | | | | | 1.86% | | | | | | | 1.24% | | | | | | | 0.90% | | | | | | | 1.11% | | | | | | | 0.97% | | | | | | |
Ratio of net investment income to average net assets prior to fees waived | | | | | | 1.84% | | | | | | | 1.19% | | | | | | | 0.85% | | | | | | | 1.06% | | | | | | | 0.92% | | | | | | |
Portfolio turnover | | | | | | 125% | | | | | | | 135% | | | | | | | 143% | | | | | | | 128% | | | | | | | 113% | | | | | | |
| 1 | The average shares outstanding method has been applied for per share information. |
| 2 | Total return is based on the change in net asset value of a share during the period and assumes reinvestment of dividends and distributions at net asset value. Total return during all of the periods shown reflects a waiver by the distributor. Performance would have been lower had the waiver not been in effect. Total return does not include fees, charges, or expenses imposed by the variable annuity and life insurance contracts for which Delaware VIP Trust serves as an underlying investment vehicle. |
See accompanying notes, which are an integral part of the financial statements.
Limited-Term Diversified Income Series-19
Delaware VIP® Trust — Delaware VIP Limited-Term Diversified Income Series
Notes to financial statements
December 31, 2018
Delaware VIP Trust (Trust) is organized as a Delaware statutory trust and offers 10 series: Delaware VIP Diversified Income Series, Delaware VIP Emerging Markets Series, Delaware VIP High Yield Series, Delaware VIP International Value Equity Series, Delaware VIP Limited-Term Diversified Income Series, Delaware VIP REIT Series, Delaware VIP Small Cap Value Series, Delaware VIP Smid Cap Core Series, Delaware VIP U.S. Growth Series, and Delaware VIP Value Series. These financial statements and the related notes pertain to Delaware VIP Limited-Term Diversified Income Series (Series). The Trust is anopen-end investment company. The Series is considered diversified under the Investment Company Act of 1940, as amended, and offers Standard Class and Service Class shares. The Standard Class shares do not carry a distribution and service(12b-1) fee and the Service Class shares carry a12b-1 fee. The shares of the Series are sold only to separate accounts of life insurance companies.
The investment objective of the Series is to seek maximum total return, consistent with reasonable risk.
1. Significant Accounting Policies
The Series is an investment company and follows accounting and reporting guidance under Financial Accounting Standards Board (FASB) Accounting Standards Codification Topic 946, Financial Services - Investment Companies. The following accounting policies are in accordance with US generally accepted accounting principles (US GAAP) and are consistently followed by the Series.
Security Valuation — Debt securities and credit default swap (CDS) contracts are valued based upon valuations provided by an independent pricing service or broker/counterparty and reviewed by management. To the extent current market prices are not available, the pricing service may take into account developments related to the specific security, as well as transactions in comparable securities. US government and agency securities are valued at the mean between the bid and ask prices, which approximates fair value. Valuations for fixed income securities utilize matrix systems, which reflect such factors as security prices, yields, maturities, and ratings, and are supplemented by dealer and exchange quotations. For asset-backed securities, collateralized mortgage obligations, commercial mortgage securities, and US government agency mortgage securities, pricing vendors utilize matrix pricing which considers prepayment speed, attributes of the collateral, yield or price of bonds of comparable quality, coupon, maturity, and type as well as broker/dealer-supplied prices. Equity securities, except those traded on the Nasdaq Stock Market LLC (Nasdaq), are valued at the last quoted sales price as of the time of the regular close of the New York Stock Exchange on the valuation date. Equity securities traded on the Nasdaq are valued in accordance with the Nasdaq Official Closing Price, which may not be the last sales price. If, on a particular day, an equity security does not trade, the mean between the bid and ask prices will be used, which approximates fair value. Swap prices are derived using daily swap curves and models that incorporate a number of market data factors, such as discounted cash flows, trades, and values of the underlying reference instruments. Investments in repurchase agreements are generally valued at par, which approximates fair value, each business day. Generally, other securities and assets for which market quotations are not readily available are valued at fair value as determined in good faith under the direction of the Trust’s Board of Trustees (Board). In determining whether market quotations are readily available or fair valuation will be used, various factors will be taken into consideration, such as market closures or suspension of a trading in a security. Restricted securities are valued at fair value using methods approved by the Board.
Federal and Foreign Income Taxes — No provision for federal income taxes has been made as the Series intends to continue to qualify for federal income tax purposes as a regulated investment company under Subchapter M of the Internal Revenue Code of 1986, as amended, and make the requisite distributions to shareholders. The Series evaluates tax positions taken or expected to be taken in the course of preparing the Series’ tax returns to determine whether the tax positions are“more-likely-than-not” of being sustained by the applicable tax authority. Tax positions not deemed to meet the“more-likely-than-not” threshold are recorded as a tax benefit or expense in the current year. Management has analyzed the Series’ tax positions taken or expected to be taken on the Series’ federal income tax returns through the year ended Dec. 31, 2018 and for all open tax years (years ended Dec. 31, 2015–Dec. 31, 2017), and has concluded that no provision for federal income tax is required in the Series’ financial statements. In regard to foreign taxes only, the Series has open tax years in certain foreign countries in which it invests that may date back to the inception of the Series. If applicable, the Series recognizes interest accrued on unrecognized tax benefits in interest expense and penalties in other expenses on the “Statement of operations.” During the year ended Dec. 31, 2018, the Series did not incur any interest or tax penalties.
Class Accounting — Investment income and common expenses are allocated to the classes of the Series on the basis of “settled shares” of each class in relation to the net assets of the Series. Realized and unrealized gain (loss) on investments is allocated to the classes of the Series on the basis of daily net assets of each class. Distribution expenses relating to a specific class are charged directly to that class.
Repurchase Agreements — The Series may purchase certain US government securities subject to the counterparty’s agreement to repurchase them at an agreed upon date and price. The counterparty will be required on a daily basis to maintain the value of the collateral subject to the agreement at not less than the repurchase price (including accrued interest). The agreements are conditioned upon the collateral being deposited under the Federal Reserve book-entry system with the Series’ custodian or a third-partysub-custodian. In the event of default or bankruptcy by the other party to the agreement, retention of the collateral may be subject to legal proceedings. All open repurchase agreements as of the date of this report were entered into on Dec. 31, 2018, and matured on the next business day.
Limited-Term Diversified Income Series-20
Delaware VIP® Limited-Term Diversified Income Series
Notes to financial statements (continued)
1. Significant Accounting Policies (continued)
To Be Announced Trades (TBA) — The Series may contract to purchase or sell securities for a fixed price at a transaction date beyond the customary settlement period (examples: when issued, delayed delivery, forward commitment, or TBA transactions) consistent with the Series’ ability to manage its investment portfolio and meet redemption requests. These transactions involve a commitment by the Series to purchase or sell securities for a predetermined price or yield with payment and delivery taking place more than three days in the future, or after a period longer than the customary settlement period for that type of security. No interest will be earned by the Series on such purchases until the securities are delivered or the transaction is completed; however, the market value may change prior to delivery.
Use of Estimates — The preparation of financial statements in conformity with US GAAP requires management to make estimates and assumptions that affect the fair value of investments, the reported amounts of assets and liabilities and disclosure of contingent assets and liabilities at the date of the financial statements, and the reported amounts of revenues and expenses during the reporting period. Actual results could differ from those estimates and the differences could be material.
Other — Expenses directly attributable to the Series are charged directly to the Series. Other expenses common to various funds within the Delaware Funds® by Macquarie (Delaware Funds) are generally allocated among such funds on the basis of average net assets. Management fees and certain other expenses are paid monthly. Security transactions are recorded on the date the securities are purchased or sold (trade date) for financial reporting purposes. Costs used in calculating realized gains and losses on the sale of investment securities are those of the specific securities sold. Interest income is recorded on the accrual basis. Discounts and premiums on debt securities are accreted or amortized to interest income, respectively, over the lives of the respective securities using the effective interest method. Realized gains (losses) on paydowns of mortgage- and asset-backed securities are classified as interest income. The Series declares dividends daily from net investment income and pays the dividends monthly and declares and pays distributions from net realized gain on investments, if any, following the close of the fiscal year. The Series may distribute more frequently, if necessary for tax purposes. Dividends and distributions, if any, are recorded on theex-dividend date.
The Series receives earnings credits from its custodian when positive cash balances are maintained, which may be used to offset custody fees. The expenses paid under this arrangement are included on the “Statement of operations” under “Custodian fees” with the corresponding expenses offset included under “Less expenses paid indirectly.” For the year ended Dec. 31, 2018, the Series earned $10,640 under this arrangement.
The Series receives earnings credits from its transfer agent when positive cash balances are maintained, which may be used to offset transfer agent fees. If the amount earned is greater than $1, the expenses paid under this arrangement are included on the “Statement of operations” under “Dividend disbursing and transfer agent fees and expenses” with the corresponding expenses offset included under “Less expenses paid indirectly.” For the year ended Dec. 31, 2018, the Series earned $1 under this arrangement.
2. Investment Management, Administration Agreements, and Other Transactions with Affiliates
In accordance with the terms of its investment management agreement, the Series pays Delaware Management Company (DMC), a series of Macquarie Investment Management Business Trust and the investment manager, an annual fee which is calculated daily and paid monthly at the rate of 0.50% on the first $500 million of average daily net assets of the Series, 0.475% on the next $500 million, 0.45% on the next $1.5 billion, and 0.425% on average daily net assets in excess of $2.5 billion.
DMC has contractually agreed to waive all or a portion of its investment advisory fees and/or pay/reimburse expenses (excluding any12b-1 fees, acquired fund fees and expenses, taxes, interest, short sale and dividend interest expenses, brokerage fees, certain insurance costs, and non routine expenses or costs, including, but not limited to, those relating to reorganizations, litigation, conducting shareholder meetings, and liquidations) in order to prevent annual Series operating expenses from exceeding 0.56% of the Series’ average daily net assets from April 30, 2018 through Dec. 31, 2018.* The waivers and reimbursements are accrued daily and received monthly. This waiver and reimbursement may only be terminated by agreement of DMC and the Series.
Delaware Investments Fund Services Company (DIFSC), an affiliate of DMC, provides fund accounting and financial administration oversight services to the Series. For these services, DIFSC’s fees are calculated daily and paid monthly based on the aggregate daily net assets of all funds within the Delaware Funds at the following annual rates: 0.00475% of the first $35 billion; 0.0040% of the next $10 billion; and 0.0025% of aggregate average daily net assets in excess of $45 billion (Total Fee). Each fund in the Delaware Funds pays a minimum of $4,000, which, in aggregate, is subtracted from the Total Fee. Each fund then pays its portion of the remainder of the Total Fee on a relative net asset value (NAV) basis. For the year ended Dec. 31, 2018, the Series was charged $56,750 for these services. This amount is included on the “Statement of operations” under “Accounting and administration expenses.”
DIFSC is also the transfer agent and dividend disbursing agent of the Series. For these services, DIFSC’s fees were calculated daily and paid monthly at the annual rate of 0.0075% of the Series’ average daily net assets. This amount is included on the “Statement of operations” under “Dividend disbursing and transfer agent fees and expenses.” For the year ended Dec. 31, 2018, the Series was charged $104,705 for these services. Pursuant to asub-transfer agency agreement between DIFSC and BNY Mellon Investment Servicing (US) Inc. (BNYMIS), BNYMIS provides certainsub-transfer agency services to the
Limited-Term Diversified Income Series-21
Delaware VIP® Limited-Term Diversified Income Series
Notes to financial statements (continued)
2. Investment Management, Administration Agreements, and Other Transactions with Affiliates (continued)
Series.Sub-transfer agency fees are paid by the Series and are also included on the “Statement of operations” under “Dividend disbursing and transfer agent fees and expenses.”
Pursuant to a distribution agreement and distribution plan, the Series pays Delaware Distributors, L.P. (DDLP), the distributor and an affiliate of DMC, an annual12b-1 fee of 0.30% of the average daily net assets of the Service Class shares. Prior to May 1, 2018, DDLP had contracted to waive12b-1 fees in order to limit12b-1 fees of the Service Class shares to 0.25% of average daily net assets. The fees are calculated daily and paid monthly. Standard Class shares pay no12b-1 fees.
As provided in the investment management agreement, the Series bears a portion of the cost of certain resources shared with DMC, including the cost of internal personnel of DMC and/or its affiliates that provide legal, tax, and regulatory reporting services to the Series. For the year ended Dec. 31, 2018, the Series was charged $41,346 for internal legal, tax, and regulatory reporting services provided by DMC and/or its affiliates’ employees. This amount is included on the “Statement of operations” under “Legal fees.”
Trustees’ fees include expenses accrued by the Series for each Trustee’s retainer and meeting fees. Certain officers of DMC, DIFSC, and DDLP are officers and/or Trustees of the Trust. These officers and Trustees are paid no compensation by the Series.
*The aggregate contractual waiver period covering this report is from April 30, 2018 through April 30, 2019.
3. Investments
For the year ended Dec. 31, 2018, the Series made purchases and sales of investment securities other than short-term investments as follows:
| | | | |
Purchases other than US government securities | | $ | 749,455,937 | |
Purchases of US government securities | | | 1,095,335,887 | |
Sales other than US government securities | | | 641,246,840 | |
Sales of US government securities | | | 1,084,070,558 | |
The tax cost of investments includes adjustments to net unrealized appreciation (depreciation) which may not necessarily be final tax cost basis adjustments, but approximate the tax basis unrealized gains and losses that may be realized and distributed to shareholders. At Dec. 31, 2018, the cost and unrealized appreciation (depreciation) of investments and derivatives for federal income tax purposes for the Series were as follows:
| | | | | | |
Cost of Investments and Derivatives | | Aggregate Unrealized
Appreciation of Investments and Derivatives | | Aggregate Unrealized Depreciation of Investments and Derivatives | | Net Unrealized Depreciation of Investments and Derivatives |
$1,526,137,141 | | $6,582,697 | | $(24,380,407) | | $(17,797,710) |
US GAAP defines fair value as the price that the Series would receive to sell an asset or pay to transfer a liability in an orderly transaction between market participants at the measurement date under current market conditions. A three-level hierarchy for fair value measurements has been established based upon the transparency of inputs to the valuation of an asset or liability. Inputs may be observable or unobservable and refer broadly to the assumptions that market participants would use in pricing the asset or liability. Observable inputs reflect the assumptions market participants would use in pricing the asset or liability based on market data obtained from sources independent of the reporting entity. Unobservable inputs reflect the reporting entity’s own assumptions about the assumptions that market participants would use in pricing the asset or liability based on the best information available under the circumstances. The Series’ investment in its entirety is assigned a level based upon the observability of the inputs which are significant to the overall valuation. The three-level hierarchy of inputs is summarized below.
| | |
| Level 1 – | | Inputs are quoted prices in active markets for identical investments. (Examples: equity securities,open-end investment companies, futures contracts, exchange-traded options contracts) |
| Level 2 – | | Other observable inputs, including but not limited to: quoted prices for similar assets or liabilities in markets that are active, quoted prices for identical or similar assets or liabilities in markets that are not active, inputs other than quoted prices that are observable for the assets or liabilities (such as interest rates, yield curves, volatilities, prepayment speeds, loss severities, credit risks, and default rates) or other market-corroborated inputs. (Examples: debt securities, government securities, swap contracts, foreign currency exchange contracts, foreign securities utilizing international fair value pricing, broker-quoted securities, fair valued securities) |
| Level 3 – | | Significant unobservable inputs, including the Series’ own assumptions used to determine the fair value of investments. (Examples: broker-quoted securities, fair valued securities) |
Limited-Term Diversified Income Series-22
Delaware VIP® Limited-Term Diversified Income Series
Notes to financial statements (continued)
3. Investments (continued)
Level 3 investments are valued using significant unobservable inputs. The Series may also use an income-based valuation approach in which the anticipated future cash flows of the investment are discounted to calculate fair value. Discounts may also be applied due to the nature or duration of any restrictions on the disposition of the investments. Valuations may also be based upon current market prices of securities that are comparable in coupon, rating, maturity, and industry. The derived value of a Level 3 investment may not represent the value which is received upon disposition and this could impact the results of operations.
The following table summarizes the valuation of the Series’ investments by fair value hierarchy levels as of Dec. 31, 2018:
| | | | |
| | | Level 2 | |
Securities: | | | | |
Assets: | | | | |
Agency, Asset- & Mortgage-Backed Securities | | $ | 723,705,463 | |
Corporate Debt | | | 562,072,366 | |
Foreign Debt | | | 24,627,741 | |
Municipal Bond | | | 419,415 | |
US Treasury Obligations | | | 170,911,889 | |
Preferred Stock | | | 2,602,875 | |
Short-Term Investments | | | 22,884,206 | |
| | | | |
Total Value of Securities | | $ | 1,507,223,955 | |
| | | | |
| |
Derivatives:* | | | | |
Assets: | | | | |
Swap Contracts | | $ | 1,115,476 | |
| | | | |
*Swap contracts are valued at the unrealized appreciation (depreciation) on the instrument at the year end.
During the year ended Dec. 31, 2018, there were no transfers between Level 1 investments, Level 2 investments, or Level 3 investments that had a significant impact to the Series. The Series’ policy is to recognize transfers between levels based on fair value at the beginning of the reporting period.
A reconciliation of Level 3 investments is presented when the Series has a significant amount of Level 3 investments at the beginning, interim, or end of the year in relation to the Series’ net assets. During the year ended Dec. 31, 2018, there were no Level 3 investments.
4. Dividend and Distribution Information
Income and long-term capital gain distributions are determined in accordance with federal income tax regulations, which may differ from US GAAP. Additionally, distributions from net short-term gains on sales of investment securities are treated as ordinary income for federal income tax purposes. The tax character of dividends and distributions paid during the years ended Dec. 31, 2018 and 2017 were as follows:
| | | | | | | | |
| | | Year ended | |
| | | 12/31/18 | | | 12/31/17 | |
Ordinary income | | $ | 34,165,076 | | | $ | 25,783,589 | |
5. Components of Net Assets on a Tax Basis
As of Dec. 31, 2018, the components of net assets on a tax basis were as follows:
| | | | |
Shares of beneficial interest | | $ | 1,532,739,904 | |
Undistributed ordinary income | | | 659,705 | |
Distributions payable | | | (865,311 | ) |
Capital loss carryforwards | | | (34,390,781 | ) |
Net unrealized depreciation on investments and derivatives | | | (17,797,710 | ) |
| | | | |
Net assets | | $ | 1,480,345,807 | |
| | | | |
The differences between book basis and tax basis components of net assets are primarily attributable to tax deferral of losses on wash sales, CDS contracts, and tax treatment of market discount and premium on debt instruments.
Limited-Term Diversified Income Series-23
Delaware VIP® Limited-Term Diversified Income Series
Notes to financial statements (continued)
5. Components of Net Assets on a Tax Basis(continued)
At Dec. 31, 2018, capital loss carryforwards available to offset future realized capital gains were as follows:
| | | | | | | | | | | | |
| | | Loss carryforward character | | | | |
| | | Short-term | | | Long-term | | | Total | |
| | $ | 16,664,156 | | | $ | 17,726,625 | | | $ | 34,390,781 | |
6. Capital Shares
Transactions in capital shares were as follows:
| | | | | | | | |
| | | Year ended | |
| | | 12/31/18 | | | 12/31/17 | |
Shares sold: | | | | | | | | |
Standard Class | | | 18,614,807 | | | | 2,976,250 | |
Service Class | | | 4,354,095 | | | | 5,533,204 | |
| | |
Shares issued upon reinvestment of dividends and distributions: | | | | | | | | |
Standard Class | | | 302,220 | | | | 194,233 | |
Service Class | | | 3,219,800 | | | | 2,443,899 | |
| | | | | | | | |
| | | 26,490,922 | | | | 11,147,586 | |
| | | | | | | | |
| | |
Shares redeemed: | | | | | | | | |
Standard Class | | | (1,869,984 | ) | | | (1,399,543 | ) |
Service Class | | | (14,614,581 | ) | | | (8,808,321 | ) |
| | | | | | | | |
| | | (16,484,565 | ) | | | (10,207,864 | ) |
| | | | | | | | |
Net increase | | | 10,006,357 | | | | 939,722 | |
| | | | | | | | |
7. Line of Credit
The Series, along with certain other funds in the Delaware Funds (Participants), was a participant in a revolving line of credit intended to be used for temporary or emergency purposes as an additional source of liquidity to fund redemptions of investor shares. The revolving line of credit available was reduced from $155,000,000 to 130,000,0000 on Sept. 6, 2018. Under the agreement, the Participants were charged an annual commitment fee of 0.15%, which was allocated across the Participants based on a weighted average of the respective net assets of each Participant. The Participants were permitted to borrow up to a maximum ofone-third of their net assets under the agreement. Each Participant was individually, and not jointly, liable for its particular advances, if any, under the line of credit. The line of credit available under the agreement expired on Nov. 5, 2018.
On Nov. 5, 2018, the Participants entered into an amendment to the agreement for a $190,000,000 revolving line of credit. The revolving line of credit available was increased to $220,000,000 on Nov. 29, 2018. The revolving line of credit is to be used as described above and operates in substantially the same manner as the original agreement. The line of credit available under the agreement expires on Nov. 4, 2019.
The Series had no amounts outstanding as of Dec. 31, 2018 or at any time during the year then ended.
8. Derivatives
US GAAP requires disclosures that enable investors to understand: (1) how and why an entity uses derivatives; (2) how they are accounted for; and (3) how they affect an entity’s results of operations and financial position.
Swap Contracts
The Series may enter into CDS contracts in the normal course of pursuing its investment objective. The Series may enter into CDS contracts in order to hedge against a credit event, to enhance total return or to gain exposure to certain securities or markets. The Series will not be permitted to enter into any swap transactions unless, at the time of entering into such transactions, the unsecured long-term debt of the actual counterparty, combined with any credit enhancements, is rated at leastBBB- by Standard & Poor’s Financial Services LLC (S&P) or Baa3 by Moody’s Investors Service, Inc. (Moody’s) or is determined to be of equivalent credit quality by DMC.
Credit Default Swaps. A CDS contract is a risk-transfer instrument through which one party (purchaser of protection) transfers to another party (seller of protection) the financial risk of a credit event (as defined in the CDS agreement), as it relates to a particular reference security or basket of securities (such as an index). In exchange for the protection offered by the seller of protection, the purchaser of protection agrees to pay the seller of protection a periodic
Limited-Term Diversified Income Series-24
Delaware VIP® Limited-Term Diversified Income Series
Notes to financial statements (continued)
8. Derivatives (continued)
amount at a stated rate that is applied to the notional amount of the CDS contract. In addition, an upfront payment may be made or received by the Series in connection with an unwinding or assignment of a CDS contract. Upon the occurrence of a credit event, the seller of protection would pay the par (or other agreed-upon) value of the reference security (or basket of securities) to the counterparty. Credit events generally include, among others, bankruptcy, failure to pay, and obligation default.
During the year ended Dec. 31, 2018, the Series entered into CDS contracts as a purchaser of protection. Periodic payments (receipt) on such contracts are accrued daily and recorded as unrealized losses (gains) on swap contracts. Upon payment (receipt), such amounts are recorded as realized losses (gains) on swap contracts. Upfront payments made or received in connection with CDS contracts are amortized over the expected life of the CDS contracts as unrealized losses (gains) on swap contracts. The change in value of CDS contracts is recorded as unrealized appreciation or depreciation daily. A realized gain or loss is recorded upon a credit event (as defined in the CDS agreement) or the maturity or termination of the agreement. Initial margin and variation margin is posted to central counterparties for centrally cleared CDS basket trades, as determined by the applicable central counterparty. During the year ended Dec. 31, 2018, the Series did not enter into any CDS contracts as a seller of protection.
CDS contracts may involve greater risks than if the Series had invested in the reference obligation directly. CDS contracts are subject to general market risk, liquidity risk, counterparty risk, and credit risk. The Series’ maximum risk of loss from counterparty credit risk, either as the seller of protection or the buyer of protection, is the fair value of the contract. This risk is mitigated by (1) For bilateral swap contracts, having a netting arrangement between the Series and the counterparty and by the posting of collateral by the counterparty to the Series to cover the Series’ exposure to the counterparty, and (2) for cleared swaps, trading these instruments through a central counterparty.
During the year ended Dec. 31, 2018, the Series entered in to CDS contracts to hedge against credit events.
Swaps Generally. The value of open swaps may differ from that which would be realized in the event the Series terminated its position in the contract on a given day. Risks of entering into these contracts include the potential inability of the counterparty to meet the terms of the contracts. This type of risk is generally limited to the amount of favorable movement in the value of the underlying security, instrument or basket of instruments, if any, at the day of default. Risks also arise from potential losses from adverse market movements and such losses could exceed the unrealized amounts shown on the “Schedule of investments.”
At Dec. 31, 2018, the Series experienced net realized and unrealized gains or losses attributable to credit contracts which are disclosed on the “Statement of asset and liabilities” as “Variation margin due to brokers on centrally cleared credit default swap contracts” and on the “Statement of operations” as “Net realized loss on swap contracts.”
Derivatives Generally. The table below summarizes the average balance of derivative holdings by the Series during the year ended Dec. 31, 2018.
| | | | | | |
| | | Long
Derivative
Volume | | | Short
Derivative
Volume |
CDS contracts (average notional value)* | | $ | 37,547,619 | | | $— |
*Long represents buying protection and short represents selling protection.
9. Offsetting
Master Repurchase Agreements
Repurchase agreements are entered into by the Series under master repurchase agreements (each, an MRA). The MRA permits the Series, under certain circumstances including an event of default (such as bankruptcy or insolvency), to offset payables and/or receivables with collateral held by and/or posted to the counterparty. As a result, one single net payment is created. Bankruptcy or insolvency laws of a particular jurisdiction may impose restrictions on or prohibitions against such a right of offset in the event of the MRA counterparty’s bankruptcy or insolvency. Based on the terms of the MRA, the Series receives securities as collateral with a market value in excess of the repurchase price at maturity. Upon a bankruptcy or insolvency of the MRA counterparty, the Series would recognize a liability with respect to such excess collateral. The liability reflects the Series’ obligation under bankruptcy law to
Limited-Term Diversified Income Series-25
Delaware VIP® Limited-Term Diversified Income Series
Notes to financial statements (continued)
9. Offsetting (continued)
return the excess to the counterparty. As of Dec. 31, 2018, the following table is a summary of the Series’ repurchase agreements by counterparty which are subject to offset under an MRA:
| | | | | | | | | | | | | | | | | | | | | | | | | |
Counterparty | | Repurchase Agreements | | Fair Value of
Non-Cash
Collateral Received(a) | | Cash Collateral
Received | | Net Collateral
Received | | Net Exposure(b) |
Bank of America Merrill Lynch | | | $ | 1,664,341 | | | | $ | — | | | | $ | (1,664,341 | ) | | | $ | (1,664,341 | ) | | | $ | — | |
Bank of Montreal | | | | 4,576,938 | | | | | (4,576,938 | ) | | | | — | | | | | (4,576,938 | ) | | | | — | |
BNP Paribas | | | | 7,484,092 | | | | | (7,484,092 | ) | | | | — | | | | | (7,484,092 | ) | | | | — | |
| | | | | | | | | | | | | | | | | | | | | | | | | |
Total | | | $ | 13,725,371 | | | | $ | (12,061,030 | ) | | | $ | (1,664,341 | ) | | | $ | (13,725,371 | ) | | | $ | — | |
| | | | | | | | | | | | | | | | | | | | | | | | | |
(a)The value of the related collateral received exceeded the value of the repurchase agreements as of Dec. 31, 2018.
(b)Net exposure represents the receivable (payable) that would be due from (to) the counterparty in the event of default.
10. Securities Lending
The Series, along with other funds in the Delaware Funds, may lend its securities pursuant to a security lending agreement (Lending Agreement) with The Bank of New York Mellon (BNY Mellon). At the time a security is loaned, the borrower must post collateral equal to the required percentage of the market value of the loaned security, including any accrued interest. The required percentage is: (1) 102% with respect to US securities and foreign securities that are denominated and payable in US dollars; and (2) 105% with respect to foreign securities. With respect to each loan, if on any business day the aggregate market value of securities collateral plus cash collateral held is less than the aggregate market value of the securities which are the subject of such loan, the borrower will be notified to provide additional collateral by the end of the following business day, which, together with the collateral already held, will be not less than the applicable initial collateral requirements for such security loan. If the aggregate market value of securities collateral and cash collateral held with respect to a security loan exceeds the applicable initial collateral requirement, upon the request of the borrower, BNY Mellon must return enough collateral to the borrower by the end of the following business day to reduce the value of the remaining collateral to the applicable initial collateral requirement for such security loan. As a result of the foregoing, the value of the collateral held with respect to a loaned security on any particular day may be more or less than the value of the security on loan. The collateral percentage with respect to the market value of the loaned security is determined by the security lending agent.
Cash collateral received by each series of the Trust is generally invested in a series of individual separate accounts, each corresponding to a series. The investment guidelines permit each separate account to hold certain securities that would be considered eligible securities for a money market fund. Cash collateral received is generally invested in government securities; certain obligations issued by government sponsored enterprises; repurchase agreements collateralized by US Treasury securities; obligations issued by the central government of any Organization for Economic Cooperation and Development (OECD) country or its agencies, instrumentalities, or establishments; obligations of supranational organizations; commercial paper, notes, bonds, and other debt obligations; certificates of deposit, time deposits, and other bank obligations; and asset-backed securities. A series can also accept US government securities and letters of credit(non-cash collateral) in connection with securities loans.
In the event of default or bankruptcy by the lending agent, realization and/or retention of the collateral may be subject to legal proceedings. In the event the borrower fails to return loaned securities and the collateral received is insufficient to cover the value of the loaned securities and provided such collateral shortfall is not the result of investment losses, the lending agent has agreed to pay the amount of the shortfall to the Series or, at the discretion of the lending agent, replace the loaned securities. The Series continues to record dividends or interest, as applicable, on the securities loaned and is subject to changes in value of the securities loaned that may occur during the term of the loan. The Series has the right under the Lending Agreement to recover the securities from the borrower on demand. With respect to security loans collateralized bynon-cash collateral, the Series receives loan premiums paid by the borrower. With respect to security loans collateralized by cash collateral, the earnings from the collateral investments are shared among the Series, the security lending agent, and the borrower. The Series records security lending income net of allocations to the security lending agent and the borrower.
The Series may incur investment losses as a result of investing securities lending collateral. This could occur if an investment in the collateral investment account defaulted or became impaired. Under those circumstances, the value of a Series’ cash collateral account may be less than the amount the Series would be required to return to the borrowers of the securities and the Series would be required to make up for this shortfall.
During the year ended Dec. 31, 2018, the Series had no securities out on loan.
11. Credit and Market Risk
The Series invests in fixed income securities whose value is derived from an underlying pool of mortgages or consumer loans. The value of these securities is sensitive to changes in economic conditions, including delinquencies and/or defaults, and may be adversely affected by shifts in the market’s perception
Limited-Term Diversified Income Series-26
Delaware VIP® Limited-Term Diversified Income Series
Notes to financial statements (continued)
11. Credit and Market Risk (continued)
of the issuers and changes in interest rates. Investors receive principal and interest payments as the underlying mortgages and consumer loans are paid back. Some of these securities are collateralized mortgage obligations (CMOs). CMOs are debt securities issued by US government agencies or by financial institutions and other mortgage lenders, which are collateralized by a pool of mortgages held under an indenture. Prepayment of mortgages may shorten the stated maturity of the obligations and can result in a loss of premium, if any has been paid. Certain of these securities may be stripped (securities which provide only the principal or interest feature of the underlying security). The yield to maturity on an interest-only CMO is extremely sensitive not only to changes in prevailing interest rates, but also to the rate of principal payments (including prepayments) on the related underlying mortgage assets. A rapid rate of principal payments may have a material adverse effect on the Series’ yield to maturity. If the underlying mortgage assets experience greater than anticipated prepayments of principal, the Series may fail to recoup its initial investment in these securities even if the securities are rated in the highest rating categories.
The Series invests in high yield fixed income securities, which are securities rated lower thanBBB- by Standard & Poor’s Financial Services LLC and lower than Baa3 by Moody’s Investors Service, Inc. or similarly rated by another nationally recognized statistical rating organization. Investments in these higher yielding securities are generally accompanied by a greater degree of credit risk than higher-rated securities. Additionally, lower-rated securities may be more susceptible to adverse economic and competitive industry conditions than investment grade securities.
The Series invests in certain obligations held by the Series that may have liquidity protection designed to ensure that the receipt of payments due on the underlying security is timely. Such protection may be provided through guarantees, insurance policies or letter of credit obtained by the issuer or sponsor through third parties, through various means of structuring the transaction or through a combination of such approaches. The Series will not pay any additional fees for such credit support, although the existence of credit support may increase the price of the security.
The Series may invest up to 15% of its net assets in illiquid securities, which may include securities with contractual restrictions on resale, securities exempt from registration under Rule 144A promulgated under the Securities Act of 1933, as amended, and other securities which may not be readily marketable. The relative illiquidity of these securities may impair the Series from disposing of them in a timely manner and at a fair price when it is necessary or desirable to do so. While maintaining oversight, the Board has delegated to DMC theday-to-day functions of determining whether individual securities are liquid for purposes of the Series’ limitation on investments in illiquid securities. Securities eligible for resale pursuant to Rule 144A, which are determined to be liquid, are not subject to the Series’ 15% limit on investments in illiquid securities. As of Dec. 31, 2018, Rule 144A securities have been identified on the “Schedule of investments.” Restricted securities are valued pursuant to the security valuation procedures described in Note 1.
12. Contractual Obligations
The Series enters into contracts in the normal course of business that contain a variety of indemnifications. The Series’ maximum exposure under these arrangements is unknown. However, the Series has not had prior claims or losses pursuant to these contracts. Management has reviewed the Series’ existing contracts and expects the risk of loss to be remote.
13. Recent Accounting Pronouncements
In March 2017, the FASB issued an Accounting Standards Update (ASU), ASU2017-08, Receivables — Nonrefundable Fees and Other Costs (Subtopic310-20), Premium Amortization on Purchased Callable Debt Securities which amends the amortization period for certain purchased callable debt securities purchased at a premium, shortening such period to the earliest call date. The ASU2017-08 does not require any accounting change for debt securities held at a discount; the discount continues to be amortized to maturity. The ASU2017-08 is effective for fiscal years, and interim periods within those fiscal years, beginning after Dec. 15, 2018. At this time, management is evaluating the implications of these changes on the financial statements.
In August 2018, the FASB issued ASU2018-13, which changes certain fair value measurement disclosure requirements. The ASU2018-13, in addition to other modifications and additions, removes the requirement to disclose the amount and reasons for transfers between Level 1 and Level 2 of the fair value hierarchy, the policy for the timing of transfers between levels and the valuation process for Level 3 fair value measurements. The ASU2018-13 is effective for fiscal years, and interim periods within those fiscal years, beginning after Dec. 15, 2019. At this time, management is evaluating the implications of these changes on the financial statements.
In August 2018, the Securities and Exchange Commission (SEC) adopted amendments to RegulationS-X to update and simplify the disclosure requirements for registered investment companies by eliminating requirements that are redundant or duplicative of US GAAP requirements or other SEC disclosure requirements. The new amendments require the presentation of the total, rather than the components, of distributable earnings on the “Statement of assets and liabilities” and the total, rather than the components, of dividends from net investment income and distributions from net realized gains on the “Statements of changes in net assets.” The amendments also removed the requirement for the parenthetical disclosure of undistributed net investment income on the “Statements of changes in net assets” and certain tax adjustments that were reflected in the “Notes to financial statements.”All of these have been reflected in the Series’ financial statements.
Limited-Term Diversified Income Series-27
Delaware VIP® Limited-Term Diversified Income Series
Notes to financial statements (continued)
14. Subsequent Events
Management has determined that no material events or transactions occurred subsequent to Dec. 31, 2018, that would require recognition or disclosure in the Series’ financial statements.
Limited-Term Diversified Income Series-28
Delaware VIP® Trust — Delaware VIP Limited-Term Diversified Income Series
Report of independent registered public accounting firm
To the Board of Trustees of Delaware VIP® Trust and Shareholders of Delaware VIP Limited-Term Diversified Income Series
Opinion on the Financial Statements
We have audited the accompanying statement of assets and liabilities, including the schedule of investments, of Delaware VIP Limited-Term Diversified Income Series (one of the series constituting Delaware VIP® Trust, referred to hereafter as the “Series”) as of December 31, 2018, the related statement of operations for the year ended December 31, 2018, the statements of changes in net assets for each of the two years in the period ended December 31, 2018, including the related notes, and the financial highlights for each of the five years in the period ended December 31, 2018 (collectively referred to as the “financial statements”). In our opinion, the financial statements present fairly, in all material respects, the financial position of the Series as of December 31, 2018, the results of its operations for the year then ended, the changes in its net assets for each of the two years in the period ended December 31, 2018 and the financial highlights for each of the five years in the period ended December 31, 2018 in conformity with accounting principles generally accepted in the United States of America.
Basis for Opinion
These financial statements are the responsibility of the Series’ management. Our responsibility is to express an opinion on the Series’ financial statements based on our audits. We are a public accounting firm registered with the Public Company Accounting Oversight Board (United States) (PCAOB) and are required to be independent with respect to the Series in accordance with the U.S. federal securities laws and the applicable rules and regulations of the Securities and Exchange Commission and the PCAOB.
We conducted our audits of these financial statements in accordance with the standards of the PCAOB. Those standards require that we plan and perform the audit to obtain reasonable assurance about whether the financial statements are free of material misstatement, whether due to error or fraud.
Our audits included performing procedures to assess the risks of material misstatement of the financial statements, whether due to error or fraud, and performing procedures that respond to those risks. Such procedures included examining, on a test basis, evidence regarding the amounts and disclosures in the financial statements. Our audits also included evaluating the accounting principles used and significant estimates made by management, as well as evaluating the overall presentation of the financial statements. Our procedures included confirmation of securities owned as of December 31, 2018 by correspondence with the custodian and brokers; when replies were not received from brokers, we performed other auditing procedures. We believe that our audits provide a reasonable basis for our opinion.
/s/ PricewaterhouseCoopers LLP
Philadelphia, Pennsylvania
February 14, 2019
We have served as the auditor of one or more investment companies in Delaware Funds® by Macquarie since 2010.
Limited-Term Diversified Income Series-29
Delaware VIP® Trust — Delaware VIP Limited-Term Diversified Income Series
Other Series information (Unaudited)
Board consideration of investment advisory agreement for Delaware VIP Limited-Term Diversified Income Series
At a meeting held on Aug.15-16, 2018 (the “Annual Meeting”), the Board of Trustees (the “Board”), including a majority of disinterested or independent Trustees, approved the renewal of the Investment Advisory Agreement for Delaware VIP Limited-Term Diversified Income Series (the “Series”). In making its decision, the Board considered information furnished at regular quarterly Board meetings, including reports detailing Series performance, investment strategies, and expenses, as well as information prepared specifically in connection with the renewal of the Investment Advisory Agreement. Information furnished specifically in connection with the renewal of the Investment Advisory Agreement with Delaware Management Company (“DMC”), a series of Macquarie Investment Management Business Trust (“MIMBT”), included materials provided by DMC and its affiliates (collectively, “Macquarie Investment Management”) concerning, among other things, the nature, extent, and quality of services provided to the Series; the costs of such services to the Series; economies of scale; and the investment manager’s financial condition and profitability. In addition, in connection with the Annual Meeting, materials were provided to the Trustees in May 2018, including reports provided by Broadridge Financial Solutions (“Broadridge”). The Broadridge reports compared the Series’ investment performance and expenses with those of other comparable mutual funds. The Independent Trustees reviewed and discussed the Broadridge reports with independent legal counsel to the Independent Trustees. In addition to the information noted above, the Board also requested and received information regarding DMC’s policy with respect to advisory fee levels and its breakpoint philosophy; the structure of portfolio manager compensation; comparative client fee information; and any constraints or limitations on the availability of securities for certain investment styles, which had in the past year inhibited, or which were likely in the future to inhibit, the investment manager’s ability to invest fully in accordance with Series policies.
In considering information relating to the approval of the Series’ Investment Advisory Agreement, the Independent Trustees received assistance and advice from and met separately with independent legal counsel to the Independent Trustees and also received assistance and advice from an experienced and knowledgeable independent fund consultant, JDL Consultants, LLC (“JDL”). Although the Board gave attention to all information furnished, the following discussion identifies, under separate headings, the primary factors taken into account by the Board during its contract renewal considerations.
Nature, extent, and quality of services.The Board considered the services provided by DMC to the Series and its shareholders. In reviewing the nature, extent, and quality of services, the Board considered reports furnished to it throughout the year, which covered matters such as the relative performance of the Series, compliance of portfolio managers with the investment policies, strategies and restrictions for the Series, compliance by DMC and Delaware Distributors, L.P. (together, “Management”) personnel with the Code of Ethics adopted throughout the Delaware Funds® by Macquarie (the “Delaware Funds”), and adherence to fair value pricing procedures as established by the Board. The Board was pleased with the current staffing of DMC and the emphasis placed on research in the investment process. The Board recognized DMC’s receipt of certain favorable industry distinctions during the past several years. The Board gave favorable consideration to DMC’s efforts to control expenses while maintaining service levels committed to Series matters. The Board was satisfied with the nature, extent, and quality of the overall services provided by DMC.
Investment performance.The Board placed significant emphasis on the investment performance of the Series in view of the importance of investment performance to shareholders. Although the Board considered performance reports and discussions with portfolio managers at Board meetings throughout the year, the Board gave particular weight to the Broadridge reports furnished for the Annual Meeting. The Broadridge reports prepared for the Series showed the investment performance of its Standard Class shares in comparison to a group of similar funds as selected by Broadridge (the “Performance Universe”). A fund with the best performance ranked first, and a fund with the poorest performance ranked last. The highest/best performing 25% of funds in the Performance Universe make up the first quartile; the next 25%, the second quartile; the next 25%, the third quartile; and the poorest/worst performing 25% of funds in the Performance Universe make up the fourth quartile. Comparative annualized performance for the Series was shown for the past1-,3-,5-, and10-year periods, as applicable, ended Jan. 31, 2018. The Board’s objective is that the Series’ performance for the1-,3-, and5-year periods be at or above the median of its Performance Universe.
The Performance Universe for the Series consisted of the Series and all short-intermediate investment-grade debt funds underlying variable insurance products as selected by Broadridge. The Broadridge report comparison showed that the Series’ total return for the1-year period was in the first quartile of its Performance Universe. The report further showed that the Series’ total return for the3-,5-, and10-year periods was in the second quartile of its Performance Universe. The Board was satisfied with performance.
Comparative expenses.The Board considered expense data for the Delaware Funds. Management provided the Board with information on pricing levels and fee structures for the Series as of its most recently completed fiscal year. The Board also focused on the comparative analysis of effective management fees and total expense ratios of the Series versus effective management fees and expense ratios of a group of similar funds as selected by Broadridge (the “Expense Group”). In reviewing comparative costs, the Series’ contractual management fee and the actual management fee incurred by the Series were compared with the contractual management fees (assuming all funds in the Expense Group were similar in size to the Series) and actual management fees (as reported by each fund) within the Expense Group, taking into account any applicable breakpoints and fee waivers. The Series’ total expenses were also compared with those of its Expense Group. The Broadridge total expenses, for comparative consistency, were shown by Broadridge for Standard Class shares which do not charge12b-1 andnon-12b-1 service fees. The Board’s objective is for each Series’ total expense ratio to be competitive with those of the peer funds within its Expense Group.
Limited-Term Diversified Income Series-30
Delaware VIP® Trust — Delaware VIP Limited-Term Diversified Income Series
Other Series information (Unaudited)
Board consideration of investment advisory agreement for Delaware VIP Limited-Term Diversified Income Series (continued)
The expense comparisons for the Series showed that the actual management fee was in the quartile with the second highest expenses of its Expense Group and total expenses were in the quartile with the highest expenses of its Expense Group. The Series’ total expenses were not in line with the Board’s objective. In evaluating total expenses, the Board considered various initiatives implemented by Management, such as the negotiation of lower fees for fund accounting, fund accounting oversight and custody services, which had created an opportunity for a further reduction in expenses. The Board was satisfied with Management’s efforts to improve the Series’ total expense ratio and to bring it in line with the Board’s objective.
Management profitability.The Board considered the level of profits realized by DMC in connection with the operation of the Series. In this respect, the Board reviewed the Investment Management Profitability Analysis that addressed the overall profitability of DMC’s business in providing management and other services to each of the individual funds and the Delaware Funds as a whole. Specific attention was given to the methodology used by DMC in allocating costs for the purpose of determining profitability. Management stated that the level of profits of DMC, to a certain extent, reflects recent operational cost savings and efficiencies initiated by DMC. The Board considered DMC’s efforts to improve services provided to Fund shareholders and to meet additional regulatory and compliance requirements resulting from recent industry-wide Securities and Exchange Commission initiatives. The Board also considered the extent to which DMC might derive ancillary benefits from fund operations, including the potential for procuring additional business as a result of the prestige and visibility associated with its role as service provider to the Delaware Funds and the benefits from allocation of fund brokerage to improve trading efficiencies. As part of its work, the Board also reviewed a report prepared by JDL regarding MIMBT profitability as compared to certain peer fund complexes and the Independent Trustees met with JDL personnel to discuss DMC’s profitability in such context. The Board found that the management fees were reasonable in light of the services rendered and the profitability of DMC.
Economies of scale.The Trustees considered whether economies of scale are realized by DMC as the Series’ assets increase and the extent to which any economies of scale are reflected in the level of management fees charged. The Trustees reviewed the Series’ advisory fee pricing and structure approved by the Board and shareholders, which includes breakpoints, and which applies to most funds in the Delaware Funds complex. Breakpoints in the advisory fee occur when the advisory fee rate is reduced on assets in excess of specified levels. Breakpoints result in a lower advisory fee, than would otherwise be the case in the absence of breakpoints, when the asset levels specified in the breakpoints are exceeded. The Board also noted that, as of March 31, 2018, the Series’ assets exceeded the second breakpoint level. The Board believed that, given the extent to which economies of scale might be realized by DMC and its affiliates, the schedule of fees under the Investment Advisory Agreement provides a sharing of benefits with the Series and its shareholders.
Board consideration ofsub-advisory agreement for Delaware VIP Limited-Term Diversified Income Series
At a meeting held on Nov.14-15, 2018, the Board of Trustees of Delaware VIP Limited-Term Diversified Income Series (the “Series”), including a majority ofnon-interested or independent Trustees (the “Independent Trustees”), approved a newSub-Advisory Agreement between Delaware Management Company (“DMC” or “Management”) and Macquarie Investment Management Austria Kapitalanlage AG (“MIMAK”) for the Series. MIMAK may also be referenced as“sub-advisor” below.
In reaching the decision to approve theSub-Advisory Agreement, the Board considered and reviewed information about MIMAK, including its personnel, operations, and financial condition, which had been provided by MIMAK. The Board also reviewed material furnished by DMC, including: a memorandum from DMC reviewing theSub-Advisory Agreement and the various services proposed to be rendered by MIMAK; information concerning MIMAK’s organizational structure and the experience of its key investment management personnel; copies of MIMAK’s Form ADV, financial statements, compliance policies and procedures, and Codes of Ethics; relevant performance information provided with respect to MIMAK; and a copy of theSub-Advisory Agreement.
In considering such information and materials, the Independent Trustees received assistance and advice from and met separately with independent counsel. The materials prepared by Management in connection with the approval of theSub-Advisory Agreement were sent to the Independent Trustees in advance of the meeting. While attention was given to all information furnished, the following discusses some primary factors relevant to the Board’s decision. This discussion of the information and factors considered by the Board (as well as the discussion above) is not intended to be exhaustive, but rather summarizes certain factors considered by the Board. In view of the wide variety of factors considered, the Board did not, unless otherwise noted, find it practicable to quantify or otherwise assign relative weights to the following factors. In addition, individual Trustees may have assigned different weights to various factors.
Nature, extent, and quality of services.The Board considered the nature, extent, and quality of services that MIMAK would provide as asub-advisor to the Series. The Trustees considered the types of services to be provided by MIMAK in connection with DMC’s management of the Series, and the qualifications and experience of MIMAK’s research team. The Board considered MIMAK’s organization, personnel, and operations. The Trustees also considered Management’s review and recommendation process with respect to MIMAK, and Management’s favorable assessment as to the
Limited-Term Diversified Income Series-31
Delaware VIP® Trust — Delaware VIP Limited-Term Diversified Income Series
Board consideration ofsub-advisory agreement for Delaware VIP Limited-Term Diversified Income Series (continued)
nature, extent, and quality of the research services to be provided by MIMAK, as well as MIMAK’s ability to render such services based on its experience, organization and resources, were appropriate for the Series, in light of the Series’ investment objective, strategies, and policies.
In discussing the nature of the services proposed to be provided by MIMAK, several Board members observed that, unlike traditionalsub-advisors, who make the investment-related decisions with respect to thesub-advised portfolio, the relationship contemplated in this case is limited to access to MIMAK’son-the-ground research expertise, perspective, and resources.
Sub-advisory fees.The Board considered that DMC would not pay fees in connection with MIMAK’s services. The Board concluded that, in light of the quality and extent of the services to be provided and the nature of the business relationships between DMC and MIMAK, the proposed fee arrangement was understandable and reasonable.
Investment performance.In evaluating performance, the Board considered that MIMAK would provide investment recommendations and ideas, including with respect to specific securities, but that DMC’s portfolio managers for the Series would retain portfolio management discretion over the Series.
Economies of scale andfall-out benefits.The Board considered whether the proposed fee arrangement would reflect economies of scale for the benefit of Series investors as assets in the Series increased, as applicable. The Board also considered that DMC and its affiliates may benefit by leveraging the global resources of its affiliates.
Tax Information
All disclosures are based on financial information available as of the date of this annual report and, accordingly are subject to change. For any and all items requiring reporting, it is the intention of the Series to report the maximum amount permitted under the Internal Revenue Code and the regulations thereunder.
For the year ended Dec. 31, 2018, the Series reports distributions paid during the year as follows:
|
(A)
Ordinary Income
Distributions
(Tax Basis) |
| 100.00% |
(A) is based on a percentage of the Series’ total distributions.
Limited-Term Diversified Income Series-32
Delaware Funds® by Macquarie
Board of trustees / directors and officers addendum
A mutual fund is governed by a Board of Trustees/Directors (“Trustees”), which has oversight responsibility for the management of a fund’s business affairs. Trustees establish procedures and oversee and review the performance of the investment manager, the distributor, and others who perform services for the fund. The independent fund trustees, in particular, are advocates for shareholder interests. Each trustee has served in that capacity since he or she was elected to or appointed to the Board of Trustees, and will continue to serve until his or her retirement or the election of a new trustee in his or her place. The following is a list of the Trustees and Officers with certain background and related information.
| | | | | | | | | | |
| | | | | | | | | Number of | | Other |
| | | | | | | Principal | | Portfolios in Fund | | Directorships |
| Name, | | Position(s) | | | | Occupation(s) | | Complex Overseen | | Held by |
| Address, | | Held with | | Length of Time | | During the | | by Trustee | | Trustee |
| and Birth Date | | Fund(s) | | Served | | Past Five Years | | or Officer | | or Officer |
| INTERESTED TRUSTEE | | | | | | | | | | |
| | | | | |
Shawn K. Lytle1,3
2005 Market Street
Philadelphia, PA 19103 February 1970 | | President,
Chief Executive Officer,
and Trustee | | President and Chief Executive Officer
since August 2015 Trustee since
September 2015 | | President — Macquarie Investment Management2 (June 2015-Present) Regional Head of
Americas — UBS Global
Asset Management
(April 2010-May 2015) | | 59 | | Trustee —
UBS Relationship Funds,
SMA Relationship Trust,
and UBS Funds
(May 2010–April 2015) |
| INDEPENDENT TRUSTEES | | | | |
| | | | | |
Thomas L. Bennett
2005 Market Street
Philadelphia, PA 19103 October 1947 | | Chair and Trustee | | Trustee since
March 2005 Chair since March 2015 | | Private Investor
(March 2004–Present) | | 59 | | None |
| | | | | | | | | | | |
Jerome D. Abernathy
2005 Market Street
Philadelphia, PA 19103 July 1959 | | Trustee | | Since
January 2019 | | Managing Member, Stonebrook Capital Management, LLC (financial technology: macro factors and databases) (January 1993–Present) | | 59 | | None |
| | | | | | | | | | | |
Ann D. Borowiec
2005 Market Street
Philadelphia, PA 19103 November 1958 | | Trustee | | Since March 2015 | | Chief Executive Officer, Private Wealth Management (2011–2013) and Market Manager, New Jersey Private Bank (2005–2011) —
J.P. Morgan Chase & Co. | | 59 | | Director —
Banco Santander International
(October 2016-Present) Director —
Santander Bank, N.A.
(December 2016-Present) |
| | | | | | | | | | | |
Joseph W. Chow
2005 Market Street
Philadelphia, PA 19103 January 1953 | | Trustee | | Since
January 2013 | | Private Investor
(April 2011–Present) | | 59 | | Director and Audit
Committee
Member — Hercules
Technology Growth
Capital, Inc.
(July 2004–July 2014) |
| | | | | | | | | | | |
John A. Fry 2005Market Street
Philadelphia, PA 19103 May 1960 | | Trustee | | Since
January 2001 | | President —
Drexel University
(August 2010–Present)
President — Franklin & Marshall College
(July 2002–July 2010) | | 59 | | Director; Compensation Committee
and Governance
Committee Member —
Community Health
Systems Director — Drexel Morgan & Co. Director and Audit
Committee Member —
vTv Therapeutics LLC Director and Audit Committee
Member — FS Credit Real
Estate Income Trust, Inc. |
| | | | | | | | | | | |
Lucinda S. Landreth 2005 Market Street
Philadelphia, PA 19103 June 1947 | | Trustee | | Since
March 2005 | | Private Investor
(2004–Present) | | 59 | | None |
| | | | | | | | | | | |
Limited-Term Diversified Income Series-33
| | | | | | | | | | |
| | | | | | | | | Number of | | Other |
| | | | | | | Principal | | Portfolios in Fund | | Directorships |
| Name, | | Position(s) | | | | Occupation(s) | | Complex Overseen | | Held by |
| Address, | | Held with | | Length of Time | | During the | | by Trustee | | Trustee |
| and Birth Date | | Fund(s) | | Served | | Past Five Years | | or Officer | | or Officer |
| | | | | |
Frances A. Sevilla-Sacasa 2005 Market Street Philadelphia, PA 19103 January 1956 | | Trustee | | Since September 2011 | | Private Investor
(January 2017-Present) Chief Executive Officer —
Banco Itaú
International
(April 2012–December 2016) Executive Advisor to Dean
(August 2011–March 2012)
and Interim Dean
(January 2011–July 2011) —
University of Miami School of
Business Administration President — U.S. Trust,
Bank of America Private
Wealth Management
(Private Banking)
(July 2007–December 2008) | | 59 | | Trust Manager and
Audit Committee
Chair — Camden
Property Trust
(August 2011-Present) Director — Carrizo
Oil & Gas, Inc.
(March 2018-Present) |
| | | | | | | | | | | |
Thomas K. Whitford 2005 Market Street Philadelphia, PA 19103 March 1956 | | Trustee | | Since
January 2013 | | Vice Chairman
(2010–April 2013) —
PNC Financial
Services Group | | 59 | | Director — HSBC North
America Holdings Inc.
(December 2013-Present) Director — HSBC USA Inc.
(July 2014-Present) Director —
HSBC Bank USA,
National Association
(July 2014-March 2017) Director — HSBC
Finance Corporation
(December 2013-April 2018) |
| | | | | | | | | | | |
Christianna Wood 2005 Market Street Philadelphia, PA 19103 March 1956 | | Trustee | | Since
January 2019 | | Chief Executive Officer
and President —
Gore Creek Capital, Ltd.
(August 2009–Present) | | 59 | | Director and Audit
Committee Member —
H&R Block Corporation
(July 2008-Present) Director and Audit
Committee Member —
Grange Insurance
(2013-Present) Trustee and Audit
Committee Member —
The Merger Fund
(2013-Present),
The Merger Fund VL
(2013-Present);
WCM Alternatives:
Event-Driven Fund
(2013-Present),
and WCM Alternatives:
Credit Event Fund
(December 2017-Present) Director — International
Securities Exchange
(2010-2016) |
| | | | | | | | | | | |
Janet L. Yeomans 2005 Market Street Philadelphia, PA 19103 July 1948 | | Trustee | | Since
April 1999 | | Vice President and Treasurer
(January 2006–July 2012),
Vice President —
Mergers & Acquisitions (January 2003–January 2006), and Vice President and Treasurer
(July 1995–January 2003) —
3M Company | | 59 | | Director; Personnel and
Compensation Committee
Chair; Member of
Nominating, Investments,
and Audit Committees for
various periods
throughout directorship
— Okabena Company
(2009-2017) |
| | | | | | | | | | | |
Limited-Term Diversified Income Series-34
| | | | | | | | | | |
| | | | | | | | | Number of | | Other |
| | | | | | | Principal | | Portfolios in Fund | | Directorships |
| Name, | | Position(s) | | | | Occupation(s) | | Complex Overseen | | Held by |
| Address, | | Held with | | Length of Time | | During the | | by Trustee | | Trustee |
| and Birth Date | | Fund(s) | | Served | | Past Five Years | | or Officer | | or Officer |
| OFFICERS | | | | | | | | | | |
| | | | | |
David F. Connor
2005 Market Street
Philadelphia, PA 19103 December 1963 | | Senior
Vice President,
General Counsel,
and Secretary | | Senior Vice President,
since May 2013;
General Counsel
since May 2015;
Secretary since
October 2005 | | David F. Connor has served in
various capacities at different
times at Macquarie Investment
Management. | | 59 | | None3 |
| | | | | | | | | | | |
Daniel V. Geatens
2005 Market Street
Philadelphia, PA 19103 October 1972 | | Vice President
and Treasurer | | Vice President
and Treasurer
since
October 2007 | | Daniel V. Geatens has served in
various capacities at different
times at Macquarie Investment
Management. | | 59 | | None3 |
| | | | | | | | | | | |
| | | | | |
Richard Salus
2005 Market Street
Philadelphia, PA 19103 October 1963 | | Senior
Vice President
and
Chief Financial
Officer | | Senior Vice President
and Chief Financial
Officer since
November 2006 | | Richard Salus has served in
various capacities at different
times at Macquarie Investment
Management. | | 59 | | None3 |
| | | | | | | | | | | |
| 1 | Shawn K. Lytle is considered to be an “Interested Trustee” because he is an executive officer of the Fund’s(s’) investment advisor. |
| 2 | Macquarie Investment Management is the marketing name for Macquarie Management Holdings, Inc. and its subsidiaries, including the Fund’s(s’) investment advisor, principal underwriter, and its transfer agent. |
| 3 | Shawn K. Lytle, David F. Connor, Daniel V. Geatens, and Richard Salus serve in similar capacities for the six portfolios of the Optimum Fund Trust, which have the same investment advisor, principal underwriter, and transfer agent as the registrant. Mr. Geatens also serves as the Chief Financial Officer and Treasurer for Macquarie Global Infrastructure Total Return Fund Inc., which has an affiliated investment manager. |
The Statement of Additional Information for the Fund(s) includes additional information about the Trustees and Officers and is available, without charge, upon request by calling 800523-1918.
Limited-Term Diversified Income Series-35
| | | | |
| | The Series files its complete schedule of portfolio holdings with the Securities and Exchange Commission (SEC) for the first and third quarters of each fiscal year on FormN-Q. The Series’ FormsN-Q, as well as a description of the policies and procedures that the Series uses to determine how to vote proxies (if any) relating to portfolio securities are available without charge (i) upon request, by calling 800523-1918; and (ii) on the SEC’s website at sec.gov. In addition, a description of the policies and procedures that the Series uses to determine how to vote proxies (if any) relating to portfolio securities and the Schedule of Investments included in the Series’ most recent FormN-Q are available without charge on the Series’ website at delawarefunds.com/vip/literature. The Series’ FormsN-Q may be reviewed and copied at the SEC’s Public Reference Room in Washington, DC; information on the operation of the Public Reference Room may be obtained by calling 800SEC-0330. Information (if any) regarding how the Series voted proxies relating to portfolio securities during the most recently disclosed12-month period ended June 30 is available without charge (i) through the Series’ website at delawarefunds.com/proxy; and (ii) on the SEC’s website at sec.gov. | | |
| | |
| AR-VIPLTD 22044 (2/19) (730130) | | Limited-Term Diversified Income Series-36 |
Delaware VIP®Trust
Delaware VIP REIT Series
December 31, 2018
Table of contents
| | | | | | | | | | |
| | | | |
| | 
| | Portfolio management review | | | 1 | | | |
| | | | |
| |
| | Performance summary | | | 3 | | | |
| | | | |
| |
| | Disclosure of Series expenses | | | 5 | | | |
| | | | |
| |
| | Security type / sector allocation and top 10 equity holdings | | | 6 | | | |
| | | | |
| |
| | Schedule of investments | | | 7 | | | |
| | | | |
| |
| | Statement of assets and liabilities | | | 9 | | | |
| | | | |
| |
| | Statement of operations | | | 10 | | | |
| | | | |
| |
| | Statements of changes in net assets | | | 10 | | | |
| | | | |
| |
| | Financial highlights | | | 11 | | | |
| | | | |
| |
| | Notes to financial statements | | | 13 | | | |
| | | | |
| |
| | Report of independent registered public accounting firm | | | 19 | | | |
| | | | |
| |
| | Other Series information | | | 20 | | | |
| | | | |
| |
| | Board of trustees / directors and officers addendum | | | 22 | | | |
| | | | |
| | | | | | | | | | |
| | | | Other than Macquarie Bank Limited (MBL), none of the entities noted are authorized deposit-taking institutions for the purposes of the Banking Act 1959 (Commonwealth of Australia). The obligations of these entities do not represent deposits or other liabilities of MBL. MBL does not guarantee or otherwise provide assurance in respect of the obligations of these entities, unless noted otherwise. The Series is governed by US laws and regulations. Unless otherwise noted, views expressed herein are current as of Dec. 31, 2018, and subject to change for events occurring after such date. The Series is not FDIC insured and is not guaranteed. It is possible to lose the principal amount invested. Advisory services provided by Delaware Management Company, a series of Macquarie Investment Management Business Trust (MIMBT), a US registered investment advisor. The Series is distributed byDelaware Distributors, L.P.(DDLP), an affiliate of MIMBT and Macquarie Group Limited. Macquarie Investment Management (MIM), is the marketing name for certain companies comprising the asset management division of Macquarie Group Limited and its subsidiaries and affiliates worldwide. This material may be used in conjunction with the offering of shares in Delaware VIP REIT Series only if preceded or accompanied by the Series’ current prospectus or the summary prospectus. © 2019 Macquarie Management Holdings, Inc. All third-party marks cited are the property of their respective owners. | | | | | | |
Delaware VIP®Trust — Delaware VIP REIT Series
| | |
| Portfolio management review | | January 8, 2019 |
For the fiscal year ended Dec. 31, 2018, Delaware VIP REIT Series (the “Series”) Standard Class shares declined 7.22% and Service Class shares fell 7.52% (both figures reflect returns with all dividends reinvested). The Series’ benchmark, the FTSE NAREIT Equity REITs Index, declined 4.62% for the same period.
Investors in real estate investment trusts (REITs) encountered challenging market conditions during the period. Significant volatility marked both the beginning and end of the period as two major market corrections bookended a long upswing. After a few difficult weeks in late January and early February 2018, REITs bounced back and gained significantly through August, only to level off and then succumb to a severe market selloff in December.
For the fiscal year, REITs as measured by the FTSE NAREIT Equity REITs Index underperformed the broader market as measured by the S&P 500®Index, which declined 4.38%.
Throughout the period, the US economy continued along its expansionary path. US gross domestic product (GDP) – a measure of the country’s economic output – peaked in the second quarter at 4.2% before slipping back in the third quarter to 3.4%. To combat potential inflation that can accelerate during periods of economic growth, the US Federal Reserve raised the federal funds rate by a quarter percentage point on four occasions during the fiscal year. At year end, the target range stood at2.25%-2.50%.
Higher interest rates drove the REIT market’s struggles during the fiscal year, as REITs rely on the availability of attractively priced capital to fund growth. Those real estate operators that saw the best share-price performance were largely companies with relatively stable cash flows and the ability to generate good internal growth.
Relative to the benchmark, the Series’ biggest performance challenge was security selection in the healthcare sector, especially the Series’ largeout-of-index position inBrookdale Senior Living Inc., an operator of senior-care facilities. An oversupply of senior housing facilities continued to hamper the group. As of fiscal year end, we think Brookdale’s stock is significantly undervalued, offering the most potential of any holding in the Series.
Within the tech sector, where security selection was modestly negative overall, the Series’ biggest relative detractors wereEquinix Inc., a data center REIT, andSBA Communications Corp., an owner of wireless communications towers. SBA’s shares fell, likely due to concern that a potential merger between wireless carriersT-Mobile and Sprint would result in one less competitor and a reduction in capital spending in the industry. Meanwhile, Equinix struggled as data center operators experienced slowing growth along with tighter availability of capital for companies in this industry. The negative effect from the Series’ Equinix position was partially offset by the positive effect of the Series’out-of-index position inAmerican Tower Corp.
In the freestanding category, our security selection was positive on balance. The Series benefited most from an overweight inSTORE Capital Corp.,a strong-performingtriple-net REIT (meaning tenants are responsible for paying ongoing expenses, such as real estate taxes and insurance). The company benefited from ready access to attractively priced capital, enabling further external growth. In contrast, the Series’ underweight in anothertriple-net REIT,Realty Income Corp., which we sold during the fiscal year, detracted from Series’ results considering the stock’s healthy gain for the full period.
In the regional malls sector, our security selection added value, largely due to the Series’ position inSimon Property Group Inc., whose shares achieved a modest gain for the fiscal year. The Series’ overweight in this stock reflected our view that Simon Property Group is abest-in-class mall operator benefiting from outstanding properties, a strong management team, good corporate governance, smart capital allocation, and healthy free cash flow.
Elsewhere, in the industrial REIT sector, our security selection contributed to relative performance, largely due to an investment inDCT Industrial Trust Inc.This operator of warehouse and distribution facilities experienced strong share-price performance by virtue of its acquisition by industry-leaderPrologis Inc., also a Series holding, in a transaction that closed in August.
The Series’ underweight allocation to the lagging diversified REIT sector contributed to relative performance. On an individual basis, the Series benefited from not owning several weak-performing benchmark components during the period, notably Colony Capital Inc. and Brookfield Property REIT Inc., which suffered steep declines.
Our management strategy remained consistent with the Series’ prospectus. We prioritize those areas of the REIT market that, in our opinion, have the potential to benefit from a strong fundamental backdrop for commercial real estate, and that offer what we see as attractively valued securities available for investment. We also seek to invest in companies that, in our view, are able to grow their cash flow and prudently raise capital.
Throughout the fiscal year, our management approach focused on REIT investments in those market areas that have demonstratedstable-to-accelerating internal growth. We simultaneously sought to avoid companies experiencing dilution from equity sales or a slowdown in internal growth. We also selectively sought individual value opportunities, even as value investing has become more difficult in the current real estate environment of higher interest rates and capital costs.
Unless otherwise noted, views expressed herein are current as of Dec. 31, 2018, and subject to change.
REIT Series-1
Delaware VIP®Trust — Delaware VIP REIT Series
| | |
| Portfolio management review (continued) | | January 8, 2019 |
In this environment, we continue to strive to own companies offering the opportunity for steady growth, which we currently find among owners of manufactured home communities, industrial properties, and data centers. Meanwhile, we have opportunistically added to what we view as deeper value areas, such as healthcare and retail.
As of the fiscal-year end, we plan to continue to invest in those areas of the REIT market where we see consistent growth potential. We also believe that if companies begin to act in more shareholder-friendly ways, the REIT asset class could offer strong opportunity due to what we view as attractive valuations across multiple sectors.
Unless otherwise noted, views expressed herein are current as of Dec. 31, 2018, and subject to change.
REIT Series-2
Delaware VIP®Trust — Delaware VIP REIT Series
Performance summary
The performance quoted represents past performance and does not guarantee future results. Investment return and principal value of an investment will fluctuate so that shares, when redeemed, may be worth more or less than their original cost. Current performance may be lower or higher than the performance quoted.
Carefully consider the Series’ investment objectives, risk factors, charges, and expenses before investing. This and other information can be found in the Series’ prospectus and its summary prospectus, which may be obtained by visiting delawarefunds.com/vip/literature or calling 800523-1918. Investors should read the prospectus and the summary prospectus carefully before investing.
| | | | | | | | | | | | | | | | | | | | | | | | |
| Delaware VIP REIT Series | | | | | | | | | | | | | | | | | | |
| Average annual total returns | | | | | | | | | | | | | | | | | | |
| For periods ended December 31, 2018 | | 1 year | | | 3 years | | | 5 years | | | 10 years | | | Lifetime | | | | |
Standard Class shares (commenced operations on May 4, 1998) | | | -7.22% | | | | -0.09% | | | | +6.02% | | | | +10.77% | | | | +8.25% | | | | | |
| | | | | | | | | | | | | | | | | | | | | | | | |
Service Class shares (commenced operations on May 1, 2000) | | | -7.52% | | | | -0.36% | | | | +5.74% | | | | +10.49% | | | | +9.10% | | | | | |
| | | | | | | | | | | | | | | | | | | | | | | | |
FTSE NAREIT Equity REITs Index | | | -4.62% | | | | +2.89% | | | | +7.90% | | | | +12.12% | | | | n/a | | | | | |
Returns reflect the reinvestment of all distributions. Please see page 4 for a description of the index.
As described in the Series’ most recent prospectus, the net expense ratio for Service Class shares of the Series was 1.10%, while total operating expenses for Standard Class and Service Class shares were 0.84% and 1.14%, respectively. The management fee for Standard Class and Service Class shares was 0.75%. Please see the most recent prospectus and any applicable supplement(s) for additional information on these fee waivers and/or reimbursements. Please see the “Financial highlights” section in this report for the most recent expense ratios.
The Series pays Delaware Distributors, L.P. (DDLP), the distributor and an affiliate of DMC, an annual12b-1 fee of 0.30% of the average daily net assets of the Service Class shares. Prior to May 1, 2018, DDLP had contracted to waive12b-1 fees in order to limit12b-1 fees of the Service Class shares to 0.25% of average daily net assets.
Earnings from a variable annuity or variable life investment compoundtax-free until withdrawal, and as a result, no adjustments were made for income taxes.
Expense limitations were in effect for both classes during certain periods shown in the Series’ performance chart above and in the Performance of a $10,000 Investment graph on the next page.
Performance data do not reflect insurance fees related to a variable annuity or variable life investment or the deferred sales charge that would apply to certain withdrawals of investments held for fewer than eight years. Performance shown here would have been reduced if such fees were included and the expense limitation removed. For more information about fees, consult your variable annuity or variable life prospectus.
Investments in variable products involve risk.
Narrowly focused investments may exhibit higher volatility than investments in multiple industry sectors.
REIT investments are subject to many of the risks associated with direct real estate ownership, including changes in economic conditions, credit risk, and interest rate fluctuations.
A REIT series’ tax status as a regulated investment company could be jeopardized if it holds real estate directly, as a result of defaults, or receives rental income from real estate holdings.
The Series may invest in derivatives, which may involve additional expenses and are subject to risk, including the risk that an underlying security or securities index moves in the opposite direction from what the portfolio manager anticipated. A derivatives transaction depends upon the counterparties’ ability to fulfill their contractual obligations.
The Series may experience portfolio turnover in excess of 100%, which could result in higher transaction costs and tax liability.
Please read both the contract and underlying prospectus for specific details regarding the product’s risk profile.
REIT Series-3
Delaware VIP® REIT Series
Performance summary (continued)
| | | | |
| For period beginning Dec. 31, 2008 through Dec. 31, 2018 | | Starting value | | Ending value |
-- FTSE NAREIT Equity REITs Index | | $10,000 | | $31,382 |
– Delaware VIP REIT Series (Standard Class) | | $10,000 | | $27,800 |
The chart shows a $10,000 investment in the Delaware VIP REIT Series Standard Class shares for the period from Dec. 31, 2008 through Dec. 31, 2018.
The chart also shows $10,000 invested in the FTSE NAREIT Equity REITs Index for the period from Dec. 31, 2008 through Dec. 31, 2018. The FTSE NAREIT Equity REITs Index measures the performance of all publicly traded equity real estate investment trusts (REITs) traded on US exchanges, excluding timber and infrastructure REITs.
The S&P 500 Index, mentioned on page 1, measures the performance of 500 mostlylarge-cap stocks weighted by market value, and is often used to represent performance of the US stock market.
Index performance returns do not reflect any management fees, transaction costs or expenses. Indices are unmanaged and one cannot invest directly in an index.
Performance of Service Class shares will vary due to different charges and expenses.
Past performance is not a guarantee of future results.
REITSeries-4
Delaware VIP®Trust — Delaware VIP REIT Series
Disclosure of Series expenses
For thesix-month period from July 1, 2018 to December 31, 2018 (Unaudited)
As a shareholder of the Series, you incur ongoing costs, which may include management fees; distribution and service(12b-1) fees; and other Series expenses. This example is intended to help you understand your ongoing costs (in dollars) of investing in the Series and to compare these costs with the ongoing costs of investing in other mutual funds.
The example is based on an investment of $1,000 invested at the beginning of the period and held for the entiresix-month period from July 1, 2018 to Dec. 31, 2018.
Actual expenses
The first section of the table shown, “Actual Series return,” provides information about actual account values and actual expenses. You may use the information in this section of the table, together with the amount you invested, to estimate the expenses that you paid over the period. Simply divide your account value by $1,000 (for example, an $8,600 account value divided by $1,000 = 8.6), then multiply the result by the number in the first section under the heading entitled “Expenses Paid During Period” to estimate the expenses you paid on your account during the period.
Hypothetical example for comparison purposes
The second section of the table shown, “Hypothetical 5% return,” provides information about hypothetical account values and hypothetical expenses based on the Series’ actual expense ratio and an assumed rate of return of 5% per year before expenses, which is not the Series’ actual return. The hypothetical account values and expenses may not be used to estimate the actual ending account balance or expenses you paid for the period. You may use this information to compare the ongoing costs of investing in the Series and other funds. To do so, compare this 5% hypothetical example with the 5% hypothetical examples that appear in the shareholder reports of other funds.
Please note that the expenses shown in the table are meant to highlight your ongoing costs only. As a shareholder of the Series, you do not incur any transaction costs, such as sales charges (loads), redemption fees or exchange fees, but shareholders of other funds may incur such costs. Also, the fees related to the variable annuity investment or the deferred sales charge that could apply have not been included. Therefore, the second section of the table is useful in comparing ongoing costs only, and will not help you determine the relative total costs of owning different funds. The Series’ expenses shown in the table assume reinvestment of all dividends and distributions.
Expense analysis of an investment of $1,000
| | | | | | | | | | | | | | |
| | | Beginning
Account
Value
7/1/18 | | | Ending
Account
Value
12/31/18 | | | Annualized
Expense
Ratio | | Expenses
Paid During
Period
7/1/18 to
12/31/18* | |
Actual Series return† | | | | |
Standard Class | | | $1,000.00 | | | | $ 930.10 | | | 0.83% | | | $4.04 | |
Service Class | | | 1,000.00 | | | | 928.50 | | | 1.13% | | | 5.49 | |
Hypothetical 5% return(5% return before expenses) | |
Standard Class | | | $1,000.00 | | | | $1,021.02 | | | 0.83% | | | $4.23 | |
Service Class | | | 1,000.00 | | | | 1,019.51 | | | 1.13% | | | 5.75 | |
| *“ | Expenses Paid During Period” are equal to the Series’ annualized expense ratio, multiplied by the average account value over the period, multiplied by 184/365 (to reflect theone-half year period). |
| † | Because actual returns reflect only the most recentsix-month period, the returns shown may differ significantly from fiscal year returns. |
REIT Series-5
Delaware VIP®Trust — Delaware VIP REIT Series
Security type / sector allocation and top 10 equity holdings
As of December 31, 2018 (Unaudited)
Sector designations may be different than the sector designations presented in other Series materials. The sector designations may represent the investment manager’s internal sector classifications.
| | |
| Security type / sector | | Percentage of
net assets |
| | | | |
Common Stock | | | 97.48 | % |
Diversified REITs | | | 1.72 | % |
Healthcare | | | 4.79 | % |
Healthcare REITs | | | 9.52 | % |
Hotel REITs | | | 5.36 | % |
Industrial REITs | | | 9.71 | % |
Information Technology REITs | | | 7.29 | % |
Mall REITs | | | 7.76 | % |
Manufactured Housing REITs | | | 4.88 | % |
Mixed REIT | | | 1.44 | % |
Multifamily REITs | | | 19.52 | % |
Office REITs | | | 6.00 | % |
Self-Storage REITs | | | 5.57 | % |
Shopping Center REITs | | | 4.78 | % |
Single Tenant REITs | | | 6.15 | % |
Specialty REITs | | | 2.99 | % |
Short-Term Investments | | | 2.07 | % |
Total Value of Securities | | | 99.55 | % |
Receivables and Other Assets Net of Liabilities | | | 0.45 | % |
Total Net Assets | | | 100.00 | % |
Holdings are for informational purposes only and are subject to change at any time. They are not a recommendation to buy, sell, or hold any security.
| | |
| Top 10 equity holdings | | Percentage
of net assets |
| |
Simon Property Group | | 7.76% |
Prologis | | 5.37% |
Welltower | | 4.98% |
Equity Residential | | 4.95% |
Brookdale Senior Living | | 4.79% |
AvalonBay Communities | | 4.44% |
Equinix | | 3.92% |
Camden Property Trust | | 3.46% |
STORE Capital | | 2.99% |
UDR | | 2.96% |
REIT Series-6
Delaware VIP®Trust — Delaware VIP REIT Series
Schedule of investments
December 31, 2018
| | | | | | | | |
| | | Number of | | | Value | |
| | | shares | | | (US $) | |
| |
Common Stock – 97.48% | | | | | |
Diversified REITs – 1.72% | | | | | |
Vornado Realty Trust | | | 103,393 | | | $ | 6,413,468 | |
| | | | | | | | |
| | | | | | | 6,413,468 | |
| | | | | | | | |
Healthcare – 4.79% | | | | | |
Brookdale Senior Living † | | | 2,661,429 | | | | 17,831,574 | |
| | | | | | | | |
| | | | | | | 17,831,574 | |
| | | | | | | | |
Healthcare REITs – 9.52% | | | | | |
HCP | | | 284,575 | | | | 7,948,180 | |
Omega Healthcare Investors | | | 89,050 | | | | 3,130,108 | |
Physicians Realty Trust | | | 92,750 | | | | 1,486,783 | |
Sabra Health Care REIT | | | 264,200 | | | | 4,354,016 | |
Welltower | | | 267,000 | | | | 18,532,470 | |
| | | | | | | | |
| | | | | | | 35,451,557 | |
| | | | | | | | |
Hotel REITs – 5.36% | | | | | |
Host Hotels & Resorts | | | 450,493 | | | | 7,509,718 | |
MGM Growth Properties Class A | | | 101,825 | | | | 2,689,198 | |
Park Hotels & Resorts | | | 192,675 | | | | 5,005,697 | |
RLJ Lodging Trust | | | 160,750 | | | | 2,636,300 | |
Sunstone Hotel Investors | | | 162,676 | | | | 2,116,415 | |
| | | | | | | | |
| | | | | | | 19,957,328 | |
| | | | | | | | |
Industrial REITs – 9.71% | | | | | |
Duke Realty | | | 423,800 | | | | 10,976,420 | |
Prologis | | | 340,270 | | | | 19,980,654 | |
Rexford Industrial Realty | | | 176,700 | | | | 5,207,349 | |
| | | | | | | | |
| | | | | | | 36,164,423 | |
| | | | | | | | |
Information Technology REITs – 7.29% | |
American Tower | | | 32,050 | | | | 5,069,989 | |
Digital Realty Trust | | | 37,075 | | | | 3,950,341 | |
Equinix | | | 41,375 | | | | 14,587,170 | |
SBA Communications † | | | 21,875 | | | | 3,541,344 | |
| | | | | | | | |
| | | | | | | 27,148,844 | |
| | | | | | | | |
Mall REITs – 7.76% | | | | | |
Simon Property Group | | | 171,928 | | | | 28,882,185 | |
| | | | | | | | |
| | | | | | | 28,882,185 | |
| | | | | | | | |
Manufactured Housing REITs – 4.88% | |
Equity LifeStyle Properties | | | 90,003 | | | | 8,741,991 | |
Sun Communities | | | 92,550 | | | | 9,413,261 | |
| | | | | | | | |
| | | | | | | 18,155,252 | |
| | | | | | | | |
Mixed REIT – 1.44% | | | | | |
Liberty Property Trust | | | 128,125 | | | | 5,365,875 | |
| | | | | | | | |
| | | | | | | 5,365,875 | |
| | | | | | | | |
Multifamily REITs – 19.52% | | | | | |
Apartment Investment & Management Class A | | | 213,250 | | | | 9,357,410 | |
AvalonBay Communities | | | 95,064 | | | | 16,545,889 | |
Camden Property Trust | | | 146,200 | | | | 12,872,910 | |
Equity Residential | | | 278,950 | | | | 18,413,489 | |
Essex Property Trust | | | 18,296 | | | | 4,486,362 | |
| | | | | | | | |
| | | Number of | | | Value | |
| | | shares | | | (US $) | |
| |
Common Stock (continued) | | | | | |
Multifamily REITs (continued) | | | | | |
UDR | | | 278,050 | | | $ | 11,016,341 | |
| | | | | | | | |
| | | | | | | 72,692,401 | |
| | | | | | | | |
Office REITs – 6.00% | | | | | |
Boston Properties | | | 72,265 | | | | 8,133,426 | |
Columbia Property Trust | | | 361,850 | | | | 7,001,797 | |
Kilroy Realty | | | 48,075 | | | | 3,022,956 | |
SL Green Realty | | | 52,825 | | | | 4,177,401 | |
| | | | | | | | |
| | | | | | | 22,335,580 | |
| | | | | | | | |
Self-Storage REITs – 5.57% | | | | | |
CubeSmart | | | 233,350 | | | | 6,694,811 | |
Extra Space Storage | | | 101,975 | | | | 9,226,698 | |
Public Storage | | | 23,911 | | | | 4,839,826 | |
| | | | | | | | |
| | | | | | | 20,761,335 | |
| | | | | | | | |
Shopping Center REITs – 4.78% | | | | | |
Kimco Realty | | | 283,775 | | | | 4,157,304 | |
Regency Centers | | | 130,410 | | | | 7,652,459 | |
Retail Properties of America Class A | | | 217,975 | | | | 2,365,029 | |
SITE Centers | | | 183,062 | | | | 2,026,496 | |
Weingarten Realty Investors | | | 63,782 | | | | 1,582,431 | |
| | | | | | | | |
| | | | | | | 17,783,719 | |
| | | | | | | | |
Single Tenant REITs – 6.15% | | | | | |
National Retail Properties | | | 181,436 | | | | 8,801,460 | |
Spirit Realty Capital | | | 83,765 | | | | 2,952,716 | |
STORE Capital | | | 393,400 | | | | 11,137,154 | |
| | | | | | | | |
| | | | | | | 22,891,330 | |
| | | | | | | | |
Specialty REITs – 2.99% | | | | | |
Cushman & Wakefield † | | | 230,525 | | | | 3,335,697 | |
GEO Group | | | 65,825 | | | | 1,296,753 | |
Invitation Homes | | | 323,775 | | | | 6,501,402 | |
| | | | | | | 11,133,852 | |
| | | | | | | | |
Total Common Stock (cost $380,701,301) | | | | | | | 362,968,723 | |
| | | | | | | | |
| | |
| | | Principal | | | | |
| | | amount° | | | | |
Short-Term Investments – 2.07% | | | | | |
Discount Note – 0.33% ≠ | | | | | |
Federal Home Loan Bank 1.05% 1/2/19 | | | 1,222,277 | | | | 1,222,277 | |
| | | | | | | | |
| | | | | | | 1,222,277 | |
| | | | | | | | |
Repurchase Agreements – 1.69% | | | | | |
Bank of America Merrill Lynch 2.95%, dated 12/31/18, to be repurchased on 1/2/19, repurchase at $764,048 (cash collateralized of $763,923) | | | 763,923 | | | | 763,923 | |
REIT Series-7
Delaware VIP® REIT Series
Schedule of investments (continued)
| | | | | | | | |
| | | Principal | | | Value | |
| | | amount° | | | (US $) | |
| |
Short-Term Investments (continued) | | | | | |
Repurchase Agreements (continued) | |
Bank of Montreal
2.60%, dated 12/31/18, to be repurchased on 1/2/19, repurchase price $2,101,092 (collateralized by US government obligations0.00%-3.75% 1/24/19 -2/15/47; market value $2,142,805) | | | 2,100,789 | | | $ | 2,100,789 | |
BNP Paribas
2.93%, dated 12/31/18, to be repurchased on 1/2/19, repurchase price $3,435,715 (collateralized by US government obligations0.00%-8.00% 2/15/19 -8/15/46; market value $3,503,859) | | | 3,435,156 | | | | 3,435,156 | |
| | | | | | | | |
| | | | | | | 6,299,868 | |
| | | | | | | | |
| | | | | | | | |
| | | Principal | | | Value | |
| | | amount° | | | (US $) | |
| |
Short-Term Investments (continued) | | | | | |
US Treasury Obligation – 0.05%≠ | | | | | |
US Treasury Bill 1.493% 1/3/19 | | | 184,968 | | | $ | 184,956 | |
| | | | | | | | |
| | | | | | | 184,956 | |
| | | | | | | | |
Total Short-Term Investments
(cost $7,707,018) | | | | 7,707,101 | |
| | | | | | | | |
| | | | |
Total Value of Securities – 99.55%
(cost $388,408,319) | | $ | 370,675,824 | |
| | | | |
| ≠ | The rate shown is the effective yield at the time of purchase. |
| ° | Principal amount shown is stated in USD unless noted that the security is denominated in another currency. |
| † | Non-income producing security. |
Summary of abbreviations:
REIT - Real Estate Investment Trust
USD - US dollar
See accompanying notes, which are an integral part of the financial statements.
REIT Series-8
| | | | |
| Delaware VIP®Trust – Delaware VIP REIT Series | | | | |
| Statement of assets and liabilities | | | December 31, 2018 | |
| | |
Assets: | | |
Investments, at value1 | | $370,675,824 |
Cash | | 260,355 |
Dividends and interest receivable | | 1,818,995 |
Receivable for series shares sold | | 83,795 |
| | |
Total assets | | 372,838,969 |
Liabilities: | | |
Management fees payable to affiliates | | 250,413 |
Payable for series shares redeemed | | 107,988 |
Distribution fees payable to affiliates | | 47,044 |
Reports and statements to shareholders payable | | 38,732 |
Other accrued expenses | | 23,398 |
Audit and tax fees payable | | 4,695 |
Dividend disbursing and transfer agent fees and expenses payable to affiliates | | 2,504 |
Accounting and administration expenses payable to affiliates | | 1,634 |
Trustees’ fees and expenses payable to affiliates | | 1,025 |
Legal fees payable to affiliates | | 714 |
Reports and statements to shareholders expenses payable to affiliates | | 276 |
Total liabilities | | 478,423 |
Total Net Assets | | $372,360,546 |
| | |
| |
Net Assets Consist of: | | |
Paid-in capital | | $415,992,592 |
Total distributable earnings (loss) | | (43,632,046) |
| | |
Total Net Assets | | $372,360,546 |
| | |
| |
Net Asset Value | | |
Standard Class: | | |
Net assets | | $198,903,308 |
Shares of beneficial interest outstanding, unlimited authorization, no par | | 16,785,222 |
Net asset value per share | | $ 11.85 |
| |
Service Class: | | |
Net assets | | $173,457,238 |
Shares of beneficial interest outstanding, unlimited authorization, no par | | 14,671,344 |
Net asset value per share | | $ 11.82 |
| | |
1Investments, at cost | | $388,408,319 |
See accompanying notes, which are an integral part of the financial statements.
REIT Series-9
Delaware VIP®Trust –
Delaware VIP REIT Series
Statement of operations
Year ended December 31, 2018
| | |
Investment Income: | | |
Dividends | | $ 12,590,828 |
Interest | | 127,845 |
| | |
| | 12,718,673 |
| | |
| |
Expenses: | | |
Management fees | | 3,119,107 |
Distribution expenses – Service Class | | 586,700 |
Accounting and administration expenses | | 108,090 |
Reports and statements to shareholders expenses | | 76,794 |
Audit and tax fees | | 35,455 |
Dividend disbursing and transfer agent fees and expenses | | 34,880 |
Legal fees | | 23,730 |
Trustees’ fees and expenses | | 20,023 |
Custodian fees | | 18,838 |
Registration fees | | 245 |
Other | | 11,823 |
| | |
| | 4,035,685 |
Less waived distribution expenses – Service Class | | (31,852) |
Less expenses paid indirectly | | (820) |
| | |
Total operating expenses | | 4,003,013 |
Net Investment Income | | 8,715,660 |
| | |
| |
Net Realized and Unrealized Loss: | | |
Net realized loss on investments | | (19,278,522) |
Net change in unrealized appreciation (depreciation) of investments | | (19,518,669) |
| | |
Net Realized and Unrealized Loss | | (38,797,191) |
| | |
| |
Net Decrease in Net Assets Resulting from Operations | | $(30,081,531) |
| | |
Delaware VIP Trust –
Delaware VIP REIT Series
Statements of changes in net assets
| | | | | | | | |
| | Year ended | |
| | | 12/31/18 | | | 12/31/17 | |
Increase (Decrease) in Net Assets from Operations: | | | | | | | | |
Net investment income | | $ | 8,715,660 | | | $ | 8,414,262 | |
Net realized gain (loss) | | | (19,278,522 | ) | | | 4,670,385 | |
Net change in unrealized appreciation (depreciation) | | | (19,518,669 | ) | | | (6,503,693 | ) |
| | | | | | | | |
Net increase (decrease) in net assets resulting from operations | | | (30,081,531 | ) | | | 6,580,954 | |
| | | | | | | | |
| | |
Dividends and Distributions to Shareholders from: | | | | | | | | |
Distributable earnings*: | | | | | | | | |
Standard Class | | | (11,357,786 | ) | | | (36,356,281 | ) |
Service Class | | | (9,640,377 | ) | | | (33,215,407 | ) |
| | | | | | | | |
| | | (20,998,163 | ) | | | (69,571,688 | ) |
| | | | | | | | |
| |
Capital Share Transactions: | | | | | |
Proceeds from shares sold: | | | | | | | | |
Standard Class | | | 8,399,074 | | | | 7,634,252 | |
Service Class | | | 8,627,567 | | | | 10,486,423 | |
| | |
Net asset value of shares issued upon reinvestment of dividends and distributions: | | | | | | | | |
Standard Class | | | 11,357,786 | | | | 36,356,281 | |
Service Class | | | 9,640,377 | | | | 33,215,407 | |
| | | | | | | | |
| | | 38,024,804 | | | | 87,692,363 | |
| | | | | | | | |
Cost of shares redeemed: | | | | | | | | |
Standard Class | | | (29,374,577 | ) | | | (27,074,042 | ) |
Service Class | | | (32,733,061 | ) | | | (33,249,113 | ) |
| | | | | | | | |
| | | (62,107,638 | ) | | | (60,323,155 | ) |
| | | | | | | | |
Increase (decrease) in net assets derived from capital share transactions | | | (24,082,834 | ) | | | 27,369,208 | |
| | | | | | | | |
Net Decrease in Net Assets | | | (75,162,528 | ) | | | (35,621,526 | ) |
| | |
Net Assets: | | | | | | | | |
Beginning of year | | | 447,523,074 | | | | 483,144,600 | |
| | | | | | | | |
End of year1 | | $ | 372,360,546 | | | $ | 447,523,074 | |
| | | | | | | | |
| 1 | Net Assets - End of year includes undistributed net investment income of $8,410,907 in 2017. The Securities and Exchange Commission eliminated the requirement to disclose undistributed (distributions in excess of) net investment income in 2018. |
| * | For the year ended Dec. 31, 2018, the Series has adopted amendments to RegulationS-X (see Note 12 in “Notes to financial statements”). For the year ended Dec. 31, 2017, the dividends and distributions to shareholders were as follows: |
| | | | |
| | | Standard Class | | Service Class |
Dividends from net investment income | | $ (3,825,327) | | $ (2,986,473) |
Distributions from net realized gains | | (32,530,954) | | (30,228,934) |
See accompanying notes, which are an integral part of the financial statements.
REIT Series-10
Delaware VIP®Trust — Delaware VIP REIT Series
Financial highlights
Selected data for each share of the Series outstanding throughout each period were as follows:
| | | | | | | | | | | | | | | | | | | | |
| | | Delaware VIP REIT Series Standard Class Year ended | |
| | | 12/31/18 | | | 12/31/17 | | | 12/31/16 | | | 12/31/15 | | | 12/31/14 | |
Net asset value, beginning of period | | $ | 13.49 | | | $ | 15.57 | | | $ | 15.89 | | | $ | 15.50 | | | $ | 12.14 | |
| | | | | |
Income (loss) from investment operations: | | | | | | | | | | | | | | | | | | | | |
Net investment income1 | | | 0.28 | | | | 0.27 | | | | 0.22 | | | | 0.21 | | | | 0.20 | |
Net realized and unrealized gain (loss) | | | (1.27 | ) | | | (0.03 | ) | | | 0.67 | | | | 0.37 | | | | 3.35 | |
| | | | | | | | | | | | | | | | | | | | |
Total from investment operations | | | (0.99 | ) | | | 0.24 | | | | 0.89 | | | | 0.58 | | | | 3.55 | |
| | | | | | | | | | | | | | | | | | | | |
| | | | | |
Less dividends and distributions from: | | | | | | | | | | | | | | | | | | | | |
Net investment income | | | (0.27 | ) | | | (0.24 | ) | | | (0.21 | ) | | | (0.19 | ) | | | (0.19 | ) |
Net realized gain | | | (0.38 | ) | | | (2.08 | ) | | | (1.00 | ) | | | — | | | | — | |
| | | | | | | | | | | | | | | | | | | | |
Total dividends and distributions | | | (0.65 | ) | | | (2.32 | ) | | | (1.21 | ) | | | (0.19 | ) | | | (0.19 | ) |
| | | | | | | | | | | | | | | | | | | | |
| | | | | |
Net asset value, end of period | | $ | 11.85 | | | $ | 13.49 | | | $ | 15.57 | | | $ | 15.89 | | | $ | 15.50 | |
| | | | | | | | | | | | | | | | | | | | |
| | | | | |
Total return2 | | | (7.22% | ) | | | 1.54% | | | | 5.87% | | | | 3.75% | | | | 29.46% | |
| | | | | |
Ratios and supplemental data: | | | | | | | | | | | | | | | | | | | | |
Net assets, end of period (000 omitted) | | $ | 198,904 | | | $ | 235,390 | | | $ | 251,083 | | | $ | 244,618 | | | $ | 260,182 | |
Ratio of expenses to average net assets | | | 0.83% | | | | 0.84% | | | | 0.83% | | | | 0.85% | | | | 0.84% | |
Ratio of net investment income to average net assets | | | 2.23% | | | | 1.94% | | | | 1.39% | | | | 1.32% | | | | 1.41% | |
Portfolio turnover | | | 111% | | | | 173% | | | | 130% | | | | 75% | | | | 84% | |
| 1 | The average shares outstanding method has been applied for per share information. |
| 2 | Total return is based on the change in net asset value of a share during the period and assumes reinvestment of dividends and distributions at net asset value. Total return does not include fees, charges, or expenses imposed by the variable annuity and life insurance contracts for which Delaware VIP Trust serves as an underlying investment vehicle. |
See accompanying notes, which are an integral part of the financial statements.
REIT Series-11
Delaware VIP® REIT Series
Financial highlights (continued)
Selected data for each share of the Series outstanding throughout each period were as follows:
| | | | | | | | | | | | | | | | | | | | |
| | | Delaware VIP REIT Series Service Class
Year ended | |
| | | 12/31/18 | | | 12/31/17 | | | 12/31/16 | | | 12/31/15 | | | 12/31/14 | |
Net asset value, beginning of period | | $ | 13.46 | | | $ | 15.54 | | | $ | 15.86 | | | $ | 15.47 | | | $ | 12.12 | |
| | | | | |
Income (loss) from investment operations: | | | | | | | | | | | | | | | | | | | | |
Net investment income1 | | | 0.24 | | | | 0.24 | | | | 0.18 | | | | 0.17 | | | | 0.16 | |
Net realized and unrealized gain (loss) | | | (1.27 | ) | | | (0.03 | ) | | | 0.67 | | | | 0.37 | | | | 3.35 | |
| | | | | | | | | | | | | | | | | | | | |
Total from investment operations | | | (1.03 | ) | | | 0.21 | | | | 0.85 | | | | 0.54 | | | | 3.51 | |
| | | | | | | | | | | | | | | | | | | | |
| | | | | |
Less dividends and distributions from: | | | | | | | | | | | | | | | | | | | | |
Net investment income | | | (0.23 | ) | | | (0.21 | ) | | | (0.17 | ) | | | (0.15 | ) | | | (0.16 | ) |
Net realized gain | | | (0.38 | ) | | | (2.08 | ) | | | (1.00 | ) | | | — | | | | — | |
| | | | | | | | | | | | | | | | | | | | |
Total dividends and distributions | | | (0.61 | ) | | | (2.29 | ) | | | (1.17 | ) | | | (0.15 | ) | | | (0.16 | ) |
| | | | | | | | | | | | | | | | | | | | |
| | | | | |
Net asset value, end of period | | $ | 11.82 | | | $ | 13.46 | | | $ | 15.54 | | | $ | 15.86 | | | $ | 15.47 | |
| | | | | | | | | | | | | | | | | | | | |
| | | | | |
Total return2 | | | (7.52% | ) | | | 1.27% | | | | 5.62% | | | | 3.52% | | | | 29.12% | |
| | | | | |
Ratios and supplemental data: | | | | | | | | | | | | | | | | | | | | |
Net assets, end of period (000 omitted) | | $ | 173,457 | | | $ | 212,133 | | | $ | 232,062 | | | $ | 238,103 | | | $ | 251,743 | |
Ratio of expenses to average net assets | | | 1.11% | | | | 1.09% | | | | 1.08% | | | | 1.10% | | | | 1.09% | |
Ratio of expenses to average net assets prior to fees waived | | | 1.13% | | | | 1.14% | | | | 1.13% | | | | 1.15% | | | | 1.14% | |
Ratio of net investment income to average net assets | | | 1.95% | | | | 1.69% | | | | 1.14% | | | | 1.07% | | | | 1.16% | |
Ratio of net investment income to average net assets prior to fees waived | | | 1.93% | | | | 1.64% | | | | 1.09% | | | | 1.02% | | | | 1.11% | |
Portfolio turnover | | | 111% | | | | 173% | | | | 130% | | | | 75% | | | | 84% | |
| 1 | The average shares outstanding method has been applied for per share information. |
| 2 | Total return is based on the change in net asset value of a share during the period and assumes reinvestment of dividends and distributions at net asset value. Total return during all of the periods shown reflects a waiver by the distributor. Performance would have been lower had the waiver not been in effect. Total return does not include fees, charges, or expenses imposed by the variable annuity and life insurance contracts for which Delaware VIP Trust serves as an underlying investment vehicle. |
See accompanying notes, which are an integral part of the financial statements.
REIT Series-12
Delaware VIP®Trust — Delaware VIP REIT Series
Notes to financial statements
December 31, 2018
Delaware VIP Trust (Trust) is organized as a Delaware statutory trust and offers 10 series: Delaware VIP Diversified Income Series, Delaware VIP Emerging Markets Series, Delaware VIP High Yield Series, Delaware VIP International Value Equity Series, Delaware VIP Limited-Term Diversified Income Series, Delaware VIP REIT Series, Delaware VIP Small Cap Value Series, Delaware VIP Smid Cap Core Series, Delaware VIP U.S. Growth Series, and Delaware VIP Value Series. These financial statements and the related notes pertain to Delaware VIP REIT Series (Series). The Trust is anopen-end investment company. The Series is considered diversified under the Investment Company Act of 1940, as amended, and offers Standard Class and Service Class shares. The Standard Class shares do not carry a distribution and service(12b-1) fee and the Service Class shares carry a12b-1 fee. The shares of the Series are sold only to separate accounts of life insurance companies.
The investment objectives of the Series are to seek maximum long-term total return, with capital appreciation as a secondary objective.
1. Significant Accounting Policies
The Series is an investment company and follows accounting and reporting guidance under Financial Accounting Standards Board (FASB) Accounting Standards Codification Topic 946, Financial Services - Investment Companies. The following accounting policies are in accordance with US generally accepted accounting principles (US GAAP) and are consistently followed by the Series.
Security Valuation –Equity securities, except those traded on the Nasdaq Stock Market LLC (Nasdaq), are valued at the last quoted sales price as of the time of the regular close of the New York Stock Exchange on the valuation date. Equity securities traded on the Nasdaq are valued in accordance with the Nasdaq Official Closing Price, which may not be the last sales price. If, on a particular day, an equity security does not trade, the mean between the bid and ask prices will be used, which approximates fair value. US government and agency securities are valued at the mean between the bid and ask prices, which approximates fair value. Investments in repurchase agreements are generally valued at par, which approximates fair value, each business day. Generally, other securities and assets for which market quotations are not readily available are valued at fair value as determined in good faith under the direction of the Trust’s Board of Trustees (Board). In determining whether market quotations are readily available or fair valuation will be used, various factors will be taken into consideration, such as market closures or suspension of trading in a security. Restricted securities are valued at fair value using methods approved by the Board.
Federal Income Taxes– No provision for federal income taxes has been made as the Series intends to continue to qualify for federal income tax purposes as a regulated investment company under Subchapter M of the Internal Revenue Code of 1986, as amended, and make the requisite distributions to shareholders. The Series evaluates tax positions taken or expected to be taken in the course of preparing the Series’ tax returns to determine whether the tax positions are“more-likely-than-not” of being sustained by the applicable tax authority. Tax positions not deemed to meet the“more-likely-than-not” threshold are recorded as a tax benefit or expense in the current year. Management has analyzed the Series’ tax positions taken or expected to be taken on the Series’ federal income tax returns through the year ended Dec. 31, 2018 and for all open tax years (years ended Dec. 31, 2015–Dec. 31, 2017), and has concluded that no provision for federal income tax is required in the Series’ financial statements. If applicable, the Series recognizes interest accrued on unrecognized tax benefits in interest expense and penalties in other expenses on the “Statement of operations.” During the year ended Dec. 31, 2018, the Series did not incur any interest or tax penalties.
Class Accounting– Investment income, common expenses, and realized and unrealized gain (loss) on investments are allocated to the classes of the Series on the basis of daily net assets of each class. Distribution expenses relating to a specific class are charged directly to that class.
Repurchase Agreements– The Series may purchase certain US government securities subject to the counterparty’s agreement to repurchase them at an agreed upon date and price. The counterparty will be required on a daily basis to maintain the value of the collateral subject to the agreement at not less than the repurchase price (including accrued interest). The agreements are conditioned upon the collateral being deposited under the Federal Reserve book-entry system with the Series’ custodian or a third-partysub-custodian. In the event of default or bankruptcy by the other party to the agreement, retention of the collateral may be subject to legal proceedings. All open repurchase agreements as of the date of this report were entered into on Dec. 31, 2018, and matured on the next business day.
Use of Estimates– The preparation of financial statements in conformity with US GAAP requires management to make estimates and assumptions that affect the fair value of investments, the reported amounts of assets and liabilities and disclosure of contingent assets and liabilities at the date of the financial statements, and the reported amounts of revenues and expenses during the reporting period. Actual results could differ from those estimates and the differences could be material.
Other– Expenses directly attributable to the Series are charged directly to the Series. Other expenses common to various funds within the Delaware Funds®by Macquarie (Delaware Funds) are generally allocated among such funds on the basis of average net assets. Management fees and certain other expenses are paid monthly. Security transactions are recorded on the date the securities are purchased or sold (trade date) for financial reporting purposes. Costs used in calculating realized gains and losses on the sale of investment securities are those of the specific securities sold. Dividend income is recorded on theex-dividend date and interest income is recorded on the accrual basis. Discounts and premiums on debt securities are accreted or amortized to interest income, respectively, over the lives of the respective securities using the effective interest method. Distributions received
REITSeries-13
Delaware VIP®REIT Series
Notes to financial statements (continued)
1. Significant Accounting Policies (continued)
from investments in real estate investment trusts (REITs) are recorded as dividend income on theex-dividend date, subject to reclassification upon notice of the character of such distributions by the issuer. The Series declares and pays dividends from net investment income and distributions from net realized gain on investments, if any, following the close of the fiscal year. The Series may distribute more frequently, if necessary for tax purposes. Dividends and distributions, if any, are recorded on theex-dividend date.
Subject to seeking best execution, the Series may direct certain security trades to brokers who have agreed to rebate a portion of the related brokerage commission to the Series in cash. In general, best execution refers to many factors, including the price paid or received for a security, the commission charged, the promptness and reliability of execution, the confidentiality and placement accorded the order, and other factors affecting the overall benefit obtained by the Series on the transaction. There were no commission rebates for the year ended Dec. 31, 2018.
The Series receives earnings credits from its custodian when positive cash balances are maintained, which may be used to offset custody fees. The expenses paid under this arrangement are included on the “Statement of operations” under “Custodian fees” with the corresponding expenses offset included under “Less expenses paid indirectly.” For the year ended Dec. 31, 2018, the Series earned $819 under this arrangement.
The Series receives earnings credits from its transfer agent when positive cash balances are maintained, which may be used to offset transfer agent fees. If the amount earned is greater than $1, the expenses paid under this arrangement is included on the “Statement of operations” under “Dividend disbursing and transfer agent fees and expenses” with the corresponding expenses offset included under “Less expenses paid indirectly.” For the year ended Dec. 31, 2018, the Series earned $1 under this arrangement.
2. Investment Management, Administration Agreements, and Other Transactions with Affiliates
In accordance with the terms of its investment management agreement, the Series pays Delaware Management Company (DMC), a series of Macquarie Investment Management Business Trust and the investment manager, an annual fee which is calculated daily and paid monthly at the rate of 0.75% on the first $500 million of average daily net assets of the Series, 0.70% on the next $500 million, 0.65% on the next $1.5 billion, and 0.60% on average daily net assets in excess of $2.5 billion.
Delaware Investments Fund Services Company (DIFSC), an affiliate of DMC, provides fund accounting and financial administration oversight services to the Series. For these services, DIFSC’s fees are calculated daily and paid monthly based on the aggregate daily net assets of all funds within the Delaware Funds at the following annual rates: 0.00475% of the first $35 billion; 0.0040% of the next $10 billion; and 0.0025% of aggregate average daily net assets in excess of $45 billion (Total Fee). Each Fund in the Delaware Funds pays a minimum of $4,000, which, in aggregate, is subtracted from the Total Fee. Each Fund then pays its portion of the remainder of the Total Fee on a relative net asset value (NAV) basis. For the year ended Dec. 31, 2018, the Series was charged $19,709 for these services. This amount is included on the “Statement of operations” under “Accounting and administration expenses.”
DIFSC is also the transfer agent and dividend disbursing agent of the Series. For these services, DIFSC’s fees are calculated daily and paid monthly at the annual rate of 0.0075% of the Series’ average daily net assets. This amount is included on the “Statement of operations” under “Dividend disbursing and transfer agent fees and expenses.” For the year ended Dec. 31, 2018, the Series was charged $31,191 for these services. Pursuant to asub-transfer agency agreement between DIFSC and BNY Mellon Investment Servicing (US) Inc. (BNYMIS), BNYMIS provides certainsub-transfer agency services to the Series.Sub-transfer agency fees are paid by the Series and are also included on the “Statement of operations” under “Dividend disbursing and transfer agent fees and expenses.”
Pursuant to a distribution agreement and distribution plan, the Series pays Delaware Distributors, L.P. (DDLP), the distributor and an affiliate of DMC, an annual12b-1 fee of 0.30% of the average daily net assets of the Service Class shares. Prior to May 1, 2018, DDLP had contracted to waive12b-1 fees in order to limit12b-1 fees of the Service Class shares to 0.25% of average daily net assets. The fees are calculated daily and paid monthly. Standard Class shares pay no12b-1 fees.
As provided in the investment management agreement, the Series bears a portion of the cost of certain resources shared with DMC, including the cost of internal personnel of DMC and/or its affiliates that provide legal, tax, and regulatory reporting services to the Series. For the year ended Dec. 31, 2018, the Series was charged $13,265 for internal legal, tax, and regulatory reporting services provided by DMC and/or its affiliates’ employees. This amount is included on the “Statement of operations” under “Legal fees.”
Trustees’ fees include expenses accrued by the Series for each Trustee’s retainer and meeting fees. Certain officers of DMC, DIFSC, and DDLP are officers and/or Trustees of the Trust. These officers and Trustees are paid no compensation by the Series.
REITSeries-14
Delaware VIP®REIT Series
Notes to financial statements (continued)
3. Investments
For the year ended Dec. 31, 2018, the Series made purchases and sales of investment securities other than short-term investments as follows:
| | | | |
Purchases | | $ | 455,128,448 | |
Sales | | | 487,137,075 | |
The tax cost of investments includes adjustments to net unrealized appreciation (depreciation) which may not necessarily be final tax cost basis adjustments, but approximate the tax basis unrealized gains and losses that may be realized and distributed to shareholders. At Dec. 31, 2018, the cost and unrealized appreciation (depreciation) of investments for federal income tax purposes for the Series were as follows:
| | | | | | |
Cost of
Investments | | Aggregate
Unrealized
Appreciation
of Investments | | Aggregate
Unrealized
Depreciation
of Investments | | Net Unrealized
Depreciation
of Investments |
$402,972,541 | | $10,473,508 | | $(42,770,225) | | $(32,296,717) |
US GAAP defines fair value as the price that the Series would receive to sell an asset or pay to transfer a liability in an orderly transaction between market participants at the measurement date under current market conditions. A three-level hierarchy for fair value measurements has been established based upon the transparency of inputs to the valuation of an asset or liability. Inputs may be observable or unobservable and refer broadly to the assumptions that market participants would use in pricing the asset or liability. Observable inputs reflect the assumptions market participants would use in pricing the asset or liability based on market data obtained from sources independent of the reporting entity. Unobservable inputs reflect the reporting entity’s own assumptions about the assumptions that market participants would use in pricing the asset or liability based on the best information available under the circumstances. The Series’ investment in its entirety is assigned a level based upon the observability of the inputs which are significant to the overall valuation. The three-level hierarchy of inputs is summarized below.
| | | | |
| Level 1 | | – | | Inputs are quoted prices in active markets for identical investments. (Examples: equity securities,open-end investment companies, futures contracts, exchange-traded options contracts) |
| Level 2 | | – | | Other observable inputs, including, but not limited to: quoted prices for similar assets or liabilities in markets that are active, quoted prices for identical or similar assets or liabilities in markets that are not active, inputs other than quoted prices that are observable for the assets or liabilities (such as interest rates, yield curves, volatilities, prepayment speeds, loss severities, credit risks, and default rates) or other market-corroborated inputs. (Examples: debt securities, government securities, swap contracts, foreign currency exchange contracts, foreign securities utilizing international fair value pricing, broker-quoted securities, fair valued securities) |
| Level 3 | | – | | Significant unobservable inputs, including the Series’ own assumptions used to determine the fair value of investments. (Examples: broker-quoted securities, fair valued securities) |
Level 3 investments are valued using significant unobservable inputs. The Series may also use an income-based valuation approach in which the anticipated future cash flows of the investment are discounted to calculate fair value. Discounts may also be applied due to the nature or duration of any restrictions on the disposition of the investments. Valuations may also be based upon current market prices of securities that are comparable in coupon, rating, maturity, and industry. The derived value of a Level 3 investment may not represent the value which is received upon disposition and this could impact the results of operations.
The following table summarizes the valuation of the Series’ investments by fair value hierarchy levels as of Dec. 31, 2018:
| | | | | | | | | | | | |
| Securities | | Level 1 | | | Level 2 | | | Total | |
Assets: | | | | | | | | | | | | |
Common Stock | | $ | 362,968,723 | | | $ | — | | | $ | 362,968,723 | |
Short-Term Investments | | | — | | | | 7,707,101 | | | | 7,707,101 | |
| | | | | | | | | | | | |
Total Value of Securities | | $ | 362,968,723 | | | $ | 7,707,101 | | | $ | 370,675,824 | |
| | | | | | | | | | | | |
During the year ended Dec. 31, 2018, there were no transfers between Level 1 investments, Level 2 investments, or Level 3 investments that had a significant impact to the Series. The Series’ policy is to recognize transfers between levels based on fair value at the beginning of the reporting period.
A reconciliation of Level 3 investments is presented when the Series has a significant amount of Level 3 investments at the beginning, interim, or end of the period in relation to the Series’ net assets. During the year ended Dec. 31, 2018, there were no Level 3 investments.
REITSeries-15
Delaware VIP®REIT Series
Notes to financial statements (continued)
4. Dividend and Distribution Information
Income and long-term capital gain distributions are determined in accordance with federal income tax regulations, which may differ from US GAAP. Additionally, distributions from net short-term gains on sales of investment securities are treated as ordinary income for federal income tax purposes. The tax character of dividends and distributions paid during the years ended Dec. 31, 2018 and 2017 was as follows:
| | | | | | | | |
| | | Year ended | |
| | | 12/31/18 | | | 12/31/17 | |
Ordinary income | | $ | 13,466,384 | | | $ | 19,031,075 | |
Long-term capital gains | | | 7,531,779 | | | | 50,540,613 | |
| | | | | | | | |
Total | | $ | 20,998,163 | | | $ | 69,571,688 | |
| | | | | | | | |
5. Components of Net Assets on a Tax Basis
As of Dec. 31, 2018, the components of net assets on a tax basis were as follows:
| | | | |
Shares of beneficial interest | | $ | 415,992,592 | |
Undistributed ordinary income | | | 8,809,243 | |
Capital loss carryforwards | | | (20,144,572 | ) |
Net unrealized depreciation on investments | | | (32,296,717 | ) |
| | | | |
Net assets | | $ | 372,360,546 | |
| | | | |
The differences between book basis and tax basis components of net assets are primarily attributable to tax deferral of losses on wash sales.
At Dec. 31, 2018, capital loss carryforwards available to offset future realized capital gains were as follows:
| | | | |
Loss carryforward character
No Expiration |
Short-term | | Long-term | | Total |
$12,243,538 | | $7,901,034 | | $20,144,572 |
6. Capital Shares
Transactions in capital shares were as follows:
| | | | | | | | |
| | | Year ended | |
| | | 12/31/18 | | | 12/31/17 | |
Shares sold: | | | | | | | | |
Standard Class | | | 676,737 | | | | 537,806 | |
Service Class | | | 688,375 | | | | 743,348 | |
| | |
Shares issued upon reinvestment of dividends and distributions: | | | | | | | | |
Standard Class | | | 985,064 | | | | 2,695,054 | |
Service Class | | | 836,112 | | | | 2,464,051 | |
| | | | | | | | |
| | | 3,186,288 | | | | 6,440,259 | |
| | | | | | | | |
| | |
Shares redeemed: | | | | | | | | |
Standard Class | | | (2,325,829 | ) | | | (1,910,638 | ) |
Service Class | | | (2,614,717 | ) | | | (2,383,545 | ) |
| | | | | | | | |
| | | (4,940,546 | ) | | | (4,294,183 | ) |
| | | | | | | | |
Net increase (decrease) | | | (1,754,258 | ) | | | 2,146,076 | |
| | | | | | | | |
7. Line of Credit
The Series, along with certain other funds in the Delaware Funds (Participants), was a participant in a revolving line of credit intended to be used for temporary or emergency purposes as an additional source of liquidity to fund redemptions of investor shares. Under the agreement, the Participants were charged an annual commitment fee of 0.15%, which was allocated across the Participants based on a weighted average of the respective net assets of each Participant. The revolving line of credit available was reduced from $155,000,000 to $130,000,000 on Sept. 6, 2018. The Participants were permitted
REITSeries-16
Delaware VIP®REIT Series
Notes to financial statements (continued)
7. Line of Credit (continued)
to borrow up to a maximum ofone-third of their net assets under the agreement. Each Participant was individually, and not jointly, liable for its particular advances, if any, under the line of credit. The line of credit available under the agreement expired on Nov. 5, 2018.
On Nov. 5, 2018, the Participants entered into an amendment to the agreement for a $190,000,000 revolving line of credit. The revolving line of credit available was increased to $220,000,000 on Nov. 29, 2018. The revolving line of credit is to be used as described above and operates in substantially the same manner as the original agreement. The line of credit available under the agreement expires on Nov. 4, 2019.
The Series had no amounts outstanding as of Dec. 31, 2018, or at any time during the year then ended.
8. Offsetting
Master Repurchase Agreements
Repurchase agreements are entered into by the Series under master repurchase agreements (each, an MRA). The MRA permits the Series, under certain circumstances including an event of default (such as bankruptcy or insolvency), to offset payables and/or receivables with collateral held by and/or posted to the counterparty. As a result, one single net payment is created. Bankruptcy or insolvency laws of a particular jurisdiction may impose restrictions on or prohibitions against such a right of offset in the event of the MRA counterparty’s bankruptcy or insolvency. Based on the terms of the MRA, the Series receives securities as collateral with a market value in excess of the repurchase price at maturity. Upon a bankruptcy or insolvency of the MRA counterparty, the Series would recognize a liability with respect to such excess collateral. The liability reflects the Series’ obligation under bankruptcy law to return the excess to the counterparty. As of Dec. 31, 2018, the following table is a summary of the Series’ repurchase agreements by counterparty which are subject to offset under an MRA:
| | | | | | | | | | | | | | | | | | | | | | | | | |
Counterparty | | Repurchase
Agreements | | Fair Value of
Non-Cash
Collateral Received(a) | | Cash Collateral
Received | | Net Collateral
Received | | Net Exposure(b) |
Bank of America Merrill Lynch | | | $ | 763,923 | | | | $ | — | | | | $ | (763,923 | ) | | | $ | (763,923 | ) | | | $ | — | |
Bank of Montreal | | | | 2,100,789 | | | | | (2,100,789 | ) | | | | — | | | | | (2,100,789 | ) | | | | — | |
BNP Paribas | | | | 3,435,156 | | | | | (3,435,156 | ) | | | | — | | | | | (3,435,156 | ) | | | | — | |
| | | | | | | | | | | | | | | | | | | | | | | | | |
Total | | | $ | 6,299,868 | | | | $ | (5,535,945 | ) | | | $ | (763,923 | ) | | | $ | (6,299,868 | ) | | | $ | — | |
| | | | | | | | | | | | | | | | | | | | | | | | | |
(a)The value of the related collateral received exceeded the value of the repurchase agreements as of Dec. 31, 2018.
(b)Net exposure represents the receivable (payable) that would be due from (to) the counterparty in an event of default.
9. Securities Lending
The Series, along with other funds in the Delaware Funds, may lend its securities pursuant to a security lending agreement (Lending Agreement) with The Bank of New York Mellon (BNY Mellon). At the time a security is loaned, the borrower must post collateral equal to the required percentage of the market value of the loaned security, including any accrued interest. The required percentage is: (1) 102% with respect to US securities and foreign securities that are denominated and payable in US dollars; and (2) 105% with respect to foreign securities. With respect to each loan, if on any business day, the aggregate market value of securities collateral plus cash collateral held is less than the aggregate market value of the securities which are the subject of such loan, the borrower will be notified to provide additional collateral by the end of the following business day, which, together with the collateral already held, will be not less than the applicable initial collateral requirements for such security loan. If the aggregate market value of securities collateral and cash collateral held with respect to a security loan exceeds the applicable initial collateral requirement, upon the request of the borrower, BNY Mellon must return enough collateral to the borrower by the end of the following business day to reduce the value of the remaining collateral to the applicable initial collateral requirement for such security loan. As a result of the foregoing, the value of the collateral held with respect to a loaned security on any particular day may be more or less than the value of the security on loan. The collateral percentage with respect to the market value of the loaned security is determined by the security lending agent.
Cash collateral received by each series of the Trust is generally invested in a series of individual separate accounts, each corresponding to a series. The investment guidelines permit each separate account to hold certain securities that would be considered eligible securities for a money market fund. Cash collateral received is generally invested in government securities; certain obligations issued by government sponsored enterprises; repurchase agreements collateralized by US Treasury securities; obligations issued by the central government of any Organization for Economic Cooperation and Development (OECD) country or its agencies, instrumentalities, or establishments; obligations of supranational organizations; commercial paper, notes, bonds, and other debt obligations; certificates of deposit, time deposits, and other bank obligations; and asset-backed securities. The Series can also accept US government securities and letters of credit(non-cash collateral) in connection with securities loans.
REITSeries-17
Delaware VIP®REIT Series
Notes to financial statements (continued)
9. Securities Lending (continued)
In the event of default or bankruptcy by the lending agent, realization and/or retention of the collateral may be subject to legal proceedings. In the event the borrower fails to return loaned securities and the collateral received is insufficient to cover the value of the loaned securities and provided such collateral shortfall is not the result of investment losses, the lending agent has agreed to pay the amount of the shortfall to the Series or, at the discretion of the lending agent, replace the loaned securities. The Series continues to record dividends or interest, as applicable, on the securities loaned and is subject to changes in value of the securities loaned that may occur during the term of the loan. The Series has the right under the Lending Agreement to recover the securities from the borrower on demand. With respect to security loans collateralized bynon-cash collateral, the Series receives loan premiums paid by the borrower. With respect to security loans collateralized by cash collateral, the earnings from the collateral investments are shared among the Series, the security lending agent, and the borrower. The Series records security lending income net of allocations to the security lending agent and the borrower.
The Series may incur investment losses as a result of investing securities lending collateral. This could occur if an investment in the collateral investment account defaulted or became impaired. Under those circumstances, the value of a Series’ cash collateral account may be less than the amount the Series would be required to return to the borrowers of the securities and the Series would be required to make up for this shortfall.
During the year ended Dec. 31, 2018, the Series had no securities out on loan.
10. Credit and Market Risk
The Series concentrates its investments in the real estate industry and is subject to the risks associated with that industry. If the Series holds real estate directly as a result of defaults or receives rental income directly from real estate holdings, its tax status as a regulated investment company may be jeopardized. The Series is also affected by interest rate changes, particularly if the REITs it holds use floating rate debt to finance their ongoing operations. Its investments may also tend to fluctuate more widely than that of a fund that invests in a broader range of industries.
The Series may invest up to 10% of its net assets in illiquid securities, which may include securities with contractual restrictions on resale, securities exempt from registration under Rule 144A, promulgated under Securities Act of 1933, as amended, and other securities which may not be readily marketable. The relative illiquidity of these securities may impair the Series from disposing of them in a timely manner and at a fair price when it is necessary or desirable to do so. While maintaining oversight, the Board has delegated to DMC, theday-to-day functions of determining whether individual securities are liquid for purposes of the Series’ limitation on investments in illiquid securities. Securities eligible for resale pursuant to Rule 144A, which are determined to be liquid, are not subject to the Series’ 10% limit on investments in illiquid securities. As of Dec. 31, 2018, there were no Rule 144A securities held by the Series. Restricted securities are valued pursuant to the security valuation procedures described in Note 1.
11. Contractual Obligations
The Series enters into contracts in the normal course of business that contain a variety of indemnifications. The Series’ maximum exposure under these arrangements is unknown. However, the Series has not had prior claims or losses pursuant to these contracts. Management has reviewed the Series’ existing contracts and expects the risk of loss to be remote.
12. Recent Accounting Pronouncements
In August 2018, the FASB issued an Accounting Standards Update, ASU2018-13, which changes certain fair value measurement disclosure requirements. The ASU2018-13, in addition to other modifications and additions, removes the requirement to disclose the amount and reasons for transfers between Level 1 and Level 2 of the fair value hierarchy, the policy for the timing of transfers between levels and the valuation process for Level 3 fair value measurements. The ASU2018-13 is effective for fiscal years, and interim periods within those fiscal years, beginning after Dec. 15, 2019. At this time, management is evaluating the implications of these changes on the financial statements.
In August 2018, the Securities and Exchange Commission (SEC) adopted amendments to RegulationS-X to update and simplify the disclosure requirements for registered investment companies by eliminating requirements that are redundant or duplicative of US GAAP requirements or other SEC disclosure requirements. The new amendments require the presentation of the total, rather than the components, of distributable earnings on the “Statement of assets and liabilities” and the total, rather than the components, of dividends from net investment income and distributions from net realized gains on the “Statements of changes in net assets.” The amendments also removed the requirement for the parenthetical disclosure of undistributed net investment income on the “Statements of changes in net assets” and certain tax adjustments that were reflected in the “Notes to financial statements.” All of these have been reflected in the Series’ financial statements.
13. Subsequent Events
Management has determined that no material events or transactions occurred subsequent to Dec. 31, 2018, that would require recognition or disclosure in the Series’ financial statements.
REITSeries-18
Delaware VIP®Trust — Delaware VIP REIT Series
Report of independent registered public accounting firm
To the Board of Trustees of Delaware VIP®Trust and Shareholders of Delaware VIP REIT Series
Opinion on the Financial Statements
We have audited the accompanying statement of assets and liabilities, including the schedule of investments, of Delaware VIP REIT Series (one of the series constituting Delaware VIP®Trust, referred to hereafter as the “Series”) as of December 31, 2018, the related statement of operations for the year ended December 31, 2018, the statements of changes in net assets for each of the two years in the period ended December 31, 2018, including the related notes, and the financial highlights for each of the five years in the period ended December 31, 2018 (collectively referred to as the “financial statements”). In our opinion, the financial statements present fairly, in all material respects, the financial position of the Series as of December 31, 2018, the results of its operations for the year then ended, the changes in its net assets for each of the two years in the period ended December 31, 2018 and the financial highlights for each of the five years in the period ended December 31, 2018 in conformity with accounting principles generally accepted in the United States of America.
Basis for Opinion
These financial statements are the responsibility of the Series’ management. Our responsibility is to express an opinion on the Series’ financial statements based on our audits. We are a public accounting firm registered with the Public Company Accounting Oversight Board (United States) (PCAOB) and are required to be independent with respect to the Series in accordance with the U.S. federal securities laws and the applicable rules and regulations of the Securities and Exchange Commission and the PCAOB.
We conducted our audits of these financial statements in accordance with the standards of the PCAOB. Those standards require that we plan and perform the audit to obtain reasonable assurance about whether the financial statements are free of material misstatement, whether due to error or fraud.
Our audits included performing procedures to assess the risks of material misstatement of the financial statements, whether due to error or fraud, and performing procedures that respond to those risks. Such procedures included examining, on a test basis, evidence regarding the amounts and disclosures in the financial statements. Our audits also included evaluating the accounting principles used and significant estimates made by management, as well as evaluating the overall presentation of the financial statements. Our procedures included confirmation of securities owned as of December 31, 2018 by correspondence with the custodian and brokers. We believe that our audits provide a reasonable basis for our opinion.
/s/PricewaterhouseCoopers LLP
Philadelphia, Pennsylvania
February 14, 2019
We have served as the auditor of one or more investment companies in Delaware Funds®by Macquarie since 2010.
REITSeries-19
Delaware VIP®Trust — Delaware VIP REIT Series
Other Series information (Unaudited)
Board consideration of investment advisory agreement for Delaware VIP REIT Series
At a meeting held on Aug.15-16, 2018 (the “Annual Meeting”), the Board of Trustees (the “Board”), including a majority of disinterested or independent Trustees, approved the renewal of the Investment Advisory Agreement for Delaware VIP REIT Series (the “Series”). In making its decision, the Board considered information furnished at regular quarterly Board meetings, including reports detailing Series performance, investment strategies, and expenses, as well as information prepared specifically in connection with the renewal of the Investment Advisory Agreement. Information furnished specifically in connection with the renewal of the Investment Advisory Agreement with Delaware Management Company (“DMC”), a series of Macquarie Investment Management Business Trust (“MIMBT”), included materials provided by DMC and its affiliates (collectively, “Macquarie Investment Management”) concerning, among other things, the nature, extent, and quality of services provided to the Series; the costs of such services to the Series; economies of scale; and the investment manager’s financial condition and profitability. In addition, in connection with the Annual Meeting, materials were provided to the Trustees in May 2018, including reports provided by Broadridge Financial Solutions (“Broadridge”). The Broadridge reports compared the Series’ investment performance and expenses with those of other comparable mutual funds. The Independent Trustees reviewed and discussed the Broadridge reports with independent legal counsel to the Independent Trustees. In addition to the information noted above, the Board also requested and received information regarding DMC’s policy with respect to advisory fee levels and its breakpoint philosophy; the structure of portfolio manager compensation; comparative client fee information; and any constraints or limitations on the availability of securities for certain investment styles, which had in the past year inhibited, or which were likely in the future to inhibit, the investment manager’s ability to invest fully in accordance with Series policies.
In considering information relating to the approval of the Series’ Investment Advisory Agreement, the Independent Trustees received assistance and advice from and met separately with independent legal counsel to the Independent Trustees and also received assistance and advice from an experienced and knowledgeable independent fund consultant, JDL Consultants, LLC (“JDL”). Although the Board gave attention to all information furnished, the following discussion identifies, under separate headings, the primary factors taken into account by the Board during its contract renewal considerations.
Nature, extent, and quality of services.The Board considered the services provided by DMC to the Series and its shareholders. In reviewing the nature, extent, and quality of services, the Board considered reports furnished to it throughout the year, which covered matters such as the relative performance of the Series, compliance of portfolio managers with the investment policies, strategies and restrictions for the Series, compliance by DMC and Delaware Distributors, L.P. (together, “Management”) personnel with the Code of Ethics adopted throughout the Delaware Funds®by Macquarie (the “Delaware Funds”), and adherence to fair value pricing procedures as established by the Board. The Board was pleased with the current staffing of DMC and the emphasis placed on research in the investment process. The Board recognized DMC’s receipt of certain favorable industry distinctions during the past several years. The Board gave favorable consideration to DMC’s efforts to control expenses while maintaining service levels committed to Series matters. The Board was satisfied with the nature, extent, and quality of the overall services provided by DMC.
Investment performance.The Board placed significant emphasis on the investment performance of the Series in view of the importance of investment performance to shareholders. Although the Board considered performance reports and discussions with portfolio managers at Board meetings throughout the year, the Board gave particular weight to the Broadridge reports furnished for the Annual Meeting. The Broadridge reports prepared for the Series showed the investment performance of its Standard Class shares in comparison to a group of similar funds as selected by Broadridge (the “Performance Universe”). A fund with the best performance ranked first, and a fund with the poorest performance ranked last. The highest/best performing 25% of funds in the Performance Universe make up the first quartile; the next 25%, the second quartile; the next 25%, the third quartile; and the poorest/worst performing 25% of funds in the Performance Universe make up the fourth quartile. Comparative annualized performance for the Series was shown for the past1-,3-,5- and10-year periods, as applicable, ended Jan. 31, 2018. The Board’s objective is that the Series’ performance for the1-,3- and5-year periods be at or above the median of its Performance Universe.
The Performance Universe for the Series consisted of the Series and all real estate funds underlying variable insurance products as selected by Broadridge. The Broadridge report comparison showed that the Series’ total return for the1-,3-, and5-year periods was in the fourth quartile of its Performance Universe. The report further showed that the Series’ total return for the10-year period was in the third quartile of its Performance Universe. The Board observed that the Series’ performance results were not in line with the Board’s objective. In evaluating the Series’ performance, the Board considered the numerous investment and performance reports delivered by Management personnel to the Board’s Investments Committee. The Board was satisfied that Management was taking action to improve Series performance and to meet the Board’s performance objective.
Comparative expenses. The Board considered expense data for the Delaware Funds. Management provided the Board with information on pricing levels and fee structures for the Series as of its most recently completed fiscal year. The Board also focused on the comparative analysis of effective management fees and total expense ratios of the Series versus effective management fees and expense ratios of a group of similar funds as selected by Broadridge (the “Expense Group”). In reviewing comparative costs, the Series’ contractual management fee and the actual management fee incurred by the Series were compared with the contractual management fees (assuming all funds in the Expense Group were similar in size to the Series) and actual management fees (as reported by each fund) within the Expense Group, taking into account any applicable breakpoints and fee waivers. The Series’ total expenses were also compared with those of its Expense Group. The Broadridge total expenses, for comparative consistency, were shown by Broadridge for Standard Class
REIT Series-20
Delaware VIP®Trust — Delaware VIP REIT Series
Other Series information (Unaudited)
Board consideration of investment advisory agreement for Delaware VIP REIT Series (continued)
shares which do not charge12b-1 andnon-12b-1 service fees. The Board’s objective is for the Series’ total expense ratio to be competitive with those of the peer funds within its Expense Group.
The expense comparisons for the Series showed that the actual management fee was in the quartile with the second lowest expenses of its Expense Group and its total expenses were in the quartile with the second highest expenses of its Expense Group. The Series’ total expenses were not in line with the Board’s objective. In evaluating total expenses, the Board considered various initiatives implemented by Management, such as the negotiation of lower fees for fund accounting, fund accounting oversight and custody services, which had created an opportunity for a further reduction in expenses. The Board was satisfied with Management’s efforts to improve the Series’ total expense ratio and to bring it in line with the Board’s objective.
Management profitability. The Board considered the level of profits realized by DMC in connection with the operation of the Series. In this respect, the Board reviewed the Investment Management Profitability Analysis that addressed the overall profitability of DMC’s business in providing management and other services to each of the individual funds and the Delaware Funds as a whole. Specific attention was given to the methodology used by DMC in allocating costs for the purpose of determining profitability. Management stated that the level of profits of DMC, to a certain extent, reflects recent operational cost savings and efficiencies initiated by DMC. The Board considered DMC’s efforts to improve services provided to Fund shareholders and to meet additional regulatory and compliance requirements resulting from recent industry-wide Securities and Exchange Commission initiatives. The Board also considered the extent to which DMC might derive ancillary benefits from fund operations, including the potential for procuring additional business as a result of the prestige and visibility associated with its role as service provider to the Delaware Funds and the benefits from allocation of fund brokerage to improve trading efficiencies. As part of its work, the Board also reviewed a report prepared by JDL regarding MIMBT profitability as compared to certain peer fund complexes and the Independent Trustees met with JDL personnel to discuss DMC’s profitability in such context. The Board found that the management fees were reasonable in light of the services rendered and the profitability of DMC.
Economies of scale.The Trustees considered whether economies of scale are realized by DMC as the Series’ assets increase and the extent to which any economies of scale are reflected in the level of management fees charged. The Trustees reviewed the Series’ advisory fee pricing and structure approved by the Board and shareholders, which includes breakpoints, and which applies to most funds in the Delaware Funds complex. Breakpoints in the advisory fee occur when the advisory fee rate is reduced on assets in excess of specified levels. Breakpoints result in a lower advisory fee, than would otherwise be the case in the absence of breakpoints, when the asset levels specified in the breakpoints are exceeded. Although, as of March 31, 2018, the Series has not reached a size at which the advantages of any breakpoints in the applicable fee schedule, the Board recognized that the fee was structured so that, if the Series increases sufficiently in size, then economies of scale may be shared.
Tax Information
All disclosures are based on financial information available as of the date of this annual report and, accordingly are subject to change. For any and all items requiring reporting, it is the intention of the Series to report the maximum amount permitted under the Internal Revenue Code and the regulations thereunder.
For the year ended Dec. 31, 2018, the Series reports distributions paid during the year as follows:
| | | | |
(A)
Long-Term
Capital Gains
Distributions
Tax Basis | | (B)
Ordinary Income
Distributions
(Tax Basis) | | Total
Distributions
(Tax Basis) |
| 35.87% | | 64.13% | | 100.00% |
(A) and (B) are based on a percentage of the Series’ total distributions.
REIT Series-21
Delaware Funds®by Macquarie
Board of trustees / directors and officers addendum
A mutual fund is governed by a Board of Trustees/Directors (“Trustees”), which has oversight responsibility for the management of a fund’s business affairs. Trustees establish procedures and oversee and review the performance of the investment manager, the distributor, and others who perform services for the fund. The independent fund trustees, in particular, are advocates for shareholder interests. Each trustee has served in that capacity since he or she was elected to or appointed to the Board of Trustees, and will continue to serve until his or her retirement or the election of a new trustee in his or her place. The following is a list of the Trustees and Officers with certain background and related information.
| | | | | | | | | | |
Name,
Address,
and Birth Date | | Position(s) Held with
Fund(s) | | Length of Time
Served | | Principal
Occupation(s) During the Past Five Years | | Number of
Portfolios in Fund
Complex Overseen
by Trustee or
Officer | | Other
Directorships
Held by
Trustee or
Officer |
| | | | | | | | | | |
INTERESTED TRUSTEE | | | | | | | | | | |
Shawn K. Lytle1, 3 2005 Market Street Philadelphia, PA 19103 February 1970 | | President, Chief Executive Officer, and Trustee | | President and Chief Executive Officer since August 2015 Trustee since September 2015 | | President — Macquarie Investment Management2(June 2015-Present) Regional Head of Americas — UBS Global Asset Management(April 2010-May 2015) | | 59 | | Trustee — UBS Relationship Funds, SMA Relationship Trust, and UBS Funds (May 2010–April 2015) |
| INDEPENDENT TRUSTEES | | | | | | | | | | |
| | | | | |
Thomas L. Bennett 2005 Market Street Philadelphia, PA 19103 October 1947 | | Chair and Trustee | | Trustee since March 2005 Chair since March 2015 | | Private Investor (March 2004–Present) | | 59 | | None |
Jerome D. Abernathy 2005 Market Street Philadelphia, PA 19103 July 1959 | | Trustee | | Since January 2019 | | Managing Member, Stonebrook Capital Management, LLC (financial technology: macro factors and databases) (January 1993–Present) | | 59 | | None |
Ann D. Borowiec 2005 Market Street Philadelphia, PA 19103 November 1958 | | Trustee | | Since March 2015 | | Chief Executive Officer, Private Wealth Management (2011–2013) and Market Manager, New Jersey Private Bank (2005–2011) — J.P. Morgan Chase & Co. | | 59 | | Director — Banco Santander International(October 2016-Present) Director — Santander Bank, N.A.(December 2016-Present) |
Joseph W. Chow 2005 Market Street Philadelphia, PA 19103 January 1953 | | Trustee | | Since January 2013 | | Private Investor (April 2011–Present) | | 59 | | Director and Audit Committee Member — Hercules Technology Growth Capital, Inc. (July 2004–July 2014) |
John A. Fry 2005 Market Street Philadelphia, PA 19103 May 1960 | | Trustee | | Since January 2001 | | President — Drexel University (August 2010–Present) President — Franklin & Marshall College (July 2002–July 2010) | | 59 | | Director; Compensation Committee and Governance Committee Member — Community Health Systems Director — Drexel Morgan & Co. Director and Audit Committee Member — vTv Therapeutics LLC Director and Audit Committee Member — FS Credit Real Estate Income Trust, Inc. |
Lucinda S. Landreth 2005 Market Street Philadelphia, PA 19103 June 1947 | | Trustee | | Since March 2005 | | Private Investor (2004–Present) | | 59 | | None |
REIT Series-22
| | | | | | | | | | |
Name, Address, and Birth Date | | Position(s) Held with Fund(s) | | Length of Time Served | | Principal
Occupation(s)
During the Past Five Years | | Number of
Portfolios in Fund
Complex Overseen
by Trustee or Officer | | Other
Directorships
Held by Trustee or
Officer |
| | | | | |
Frances A. Sevilla-Sacasa 2005 Market Street Philadelphia, PA 19103 January 1956 | | Trustee | | Since September 2011 | | Private Investor(January 2017-Present) Chief Executive Officer — Banco Itaú International (April 2012–December 2016) Executive Advisor to Dean (August 2011–March 2012) and Interim Dean (January 2011–July 2011) — University of Miami School of Business Administration President — U.S. Trust, Bank of America Private Wealth Management (Private Banking) (July 2007–December 2008) | | 59 | | Trust Manager and Audit Committee Chair — Camden Property Trust (August 2011-Present) Director — Carrizo Oil & Gas, Inc. (March 2018-Present) |
Thomas K. Whitford 2005 Market Street Philadelphia, PA 19103 March 1956 | | Trustee | | Since January 2013 | | Vice Chairman (2010–April 2013) — PNC Financial Services Group | | 59 | | Director — HSBC North America Holdings Inc.(December 2013-Present) Director —HSBC USA Inc. (July 2014-Present) Director — HSBC Bank USA, National Association(July 2014-March 2017) Director — HSBC Finance Corporation(December 2013-April 2018) |
Christianna Wood 2005 Market Street Philadelphia, PA 19103 March 1956 | | Trustee | | Since January 2019 | | Chief Executive Officer and President — Gore Creek Capital, Ltd. (August 2009–Present) | | 59 | | Director and Audit Committee Member — H&R Block Corporation (July 2008-Present) Director and Audit Committee Member — Grange Insurance (2013-Present) Trustee and Audit Committee Member — The Merger Fund (2013-Present), The Merger Fund VL (2013-Present); WCM Alternatives: Event-Driven Fund (2013-Present), and WCM Alternatives: Credit Event Fund(December 2017-Present) Director — International Securities Exchange (2010-2016) |
| | | | | |
Janet L. Yeomans 2005 Market Street Philadelphia, PA 19103 July 1948 | | Trustee | | Since April 1999 | | Vice President and Treasurer (January 2006–July 2012), Vice President — Mergers & Acquisitions (January 2003–January 2006), and Vice President and Treasurer (July 1995–January 2003) — 3M Company | | 59 | | Director; Personnel and Compensation Committee Chair; Member of Nominating, Investments, and Audit Committees for various periods throughout directorship — Okabena Company (2009-2017) |
REIT Series-23
| | | | | | | | | | |
Name,
Address,
and Birth Date | | Position(s)
Held with
Fund(s) | | Length of Time
Served | | Principal
Occupation(s)
During the
Past Five Years | | Number of
Portfolios in Fund
Complex Overseen
by Trustee
or Officer | | Other
Directorships
Held by
Trustee
or Officer |
| OFFICERS | | | | | | | | | | |
| | | | | |
David F. Connor 2005 Market Street Philadelphia, PA 19103 December 1963 | | Senior Vice President, General Counsel, and Secretary | | Senior Vice President, since May 2013; General Counsel since May 2015; Secretary since October 2005 | | David F. Connor has served in various capacities at different times at Macquarie Investment Management. | | 59 | | None3 |
| | | | | |
Daniel V. Geatens 2005 Market Street Philadelphia, PA 19103 October 1972 | | Vice President and Treasurer | | Vice President and Treasurer since October 2007 | | Daniel V. Geatens has served in various capacities at different times at Macquarie Investment Management. | | 59 | | None3 |
| | | | | |
Richard Salus 2005 Market Street Philadelphia, PA 19103 October 1963 | | Senior Vice President and Chief Financial Officer | | Senior Vice President and Chief Financial Officer since November 2006 | | Richard Salus has served in various capacities at different times at Macquarie Investment Management. | | 59 | | None3 |
| 1 | Shawn K. Lytle is considered to be an “Interested Trustee” because he is an executive officer of the Fund’s(s’) investment advisor. |
| 2 | Macquarie Investment Management is the marketing name for Macquarie Management Holdings, Inc. and its subsidiaries, including the Fund’s(s’) investment advisor, principal underwriter, and its transfer agent. |
| 3 | Shawn K. Lytle, David F. Connor, Daniel V. Geatens, and Richard Salus serve in similar capacities for the six portfolios of the Optimum Fund Trust, which have the same investment advisor, principal underwriter, and transfer agent as the registrant. Mr. Geatens also serves as the Chief Financial Officer and Treasurer for Macquarie Global Infrastructure Total Return Fund Inc., which has an affiliated investment manager. |
The Statement of Additional Information for the Fund(s) includes additional information about the Trustees and Officers and is available, without charge, upon request by calling 800523-1918.
REIT Series-24
| | | | |
| | The Series files its complete schedule of portfolio holdings with the Securities and Exchange Commission (SEC) for the first and third quarters of each fiscal year on FormN-Q. The Series’ FormsN-Q, as well as a description of the policies and procedures that the Series uses to determine how to vote proxies (if any) relating to portfolio securities are available without charge (i) upon request, by calling 800523-1918; and (ii) on the SEC’s website at sec.gov. In addition, a description of the policies and procedures that the Series uses to determine how to vote proxies (if any) relating to portfolio securities and the Schedule of Investments included in the Series’ most recent FormN-Q are available without charge on the Series’ website at delawarefunds.com/vip/literature. The Series’ FormsN-Q may be reviewed and copied at the SEC’s Public Reference Room in Washington, DC; information on the operation of the Public Reference Room may be obtained by calling 800SEC-0330. Information (if any) regarding how the Series voted proxies relating to portfolio securities during the most recently disclosed12-month period ended June 30 is available without charge (i) through the Series’ website at delawarefunds.com/proxy; and (ii) on the SEC’s website at sec.gov. | | |
REIT Series-25
|
| AR-VIPREIT 22045 (2/19) (730130) |
Delaware VIP® Trust
Delaware VIP Small Cap Value Series
December 31, 2018

Table of contents
Other than Macquarie Bank Limited (MBL), none of the entities noted are authorized deposit-taking institutions for the purposes of the Banking Act 1959 (Commonwealth of Australia). The obligations of these entities do not represent deposits or other liabilities of MBL. MBL does not guarantee or otherwise provide assurance in respect of the obligations of these entities, unless noted otherwise. The Series is governed by US laws and regulations.
Unless otherwise noted, views expressed herein are current as of Dec. 31, 2018, and subject to change for events occurring after such date.
The Series is not FDIC insured and is not guaranteed. It is possible to lose the principal amount invested.
Advisory services provided by Delaware Management Company, a series of Macquarie Investment Management Business Trust (MIMBT), a US registered investment advisor.
The Series is distributed byDelaware Distributors, L.P.(DDLP), an affiliate of MIMBT and Macquarie Group Limited. Macquarie Investment Management (MIM), a member of Macquarie Group, refers to the companies comprising the asset management division of Macquarie Group Limited and its subsidiaries and affiliates worldwide.
This material may be used in conjunction with the offering of shares in Delaware VIP Small Cap Value Series only if preceded or accompanied by the Series’ current prospectus or the summary prospectus.
© 2019 Macquarie Management Holdings, Inc.
All third-party marks cited are the property of their respective owners.
| | |
| Delaware VIP®Trust — Delaware VIP Small Cap Value Series |
| Portfolio management review | | January 8, 2019 |
For the fiscal year ended Dec. 31, 2018, Delaware VIP Small Cap Value Series (the “Series”) Standard Class shares declined 16.72% and Service Class shares declined 16.95%. Both figures reflect all dividends reinvested. The Series’ benchmark, the Russell 2000® Value Index, declined 12.86% for the same period.
Small-cap value stocks had posted positive returns for the year until October, when the market took a negative turn. While the economic and fiscal backdrop remained supportive, investors grew concerned that rising interest rates, uncertainty over trade policy, and the looming end of easy earnings comparisons would warrant a more cautious approach. The energy sector was the weakest-performing sector for the benchmark, despite successful efforts by the Organization of the Petroleum Exporting Countries to reduce the global glut of oil through production cuts. The consumer cyclical and basic industry sectors each declined more than 25% during the fiscal year. Only two sectors in the benchmark were positive for the year, business services and utilities.
Though value stocks were among the major beneficiaries of 2017tax-reform legislation, the group nonetheless underperformed its growth counterpart over the fiscal period. Several indicators suggest to us that value-oriented companies have the potential to perform well in the current market environment. Corporate earnings growth has broadened out across sectors, and while 2019 earnings growth is not likely to match 2018’stax-reform enhanced levels, in our view, earnings per share should grow at healthy levels next year. Share buybacks remain strong and value companies are exercising more disciplined capital expenditures than their growth peers.
Stock selection and sector positioning hurt the Series’ performance. Weak stock selection in the technology sector was the main detractor from relative returns, though stock selection in financial services and consumer staples was also a negative. Overweight allocations to the capital spending and basic industry sectors detracted, as did underweight allocations to the business services and real estate investment trust (REIT) sectors. Stock selection was a detractor in all four sectors of those sectors: capital spending, basic industry, business services, and REITs. The Series’ holdings in the utilities sector kept pace with the positive return for the utilities sector in the benchmark; however, the Series’ underweighting here detracted. Stock selection in the consumer services, healthcare, and energy sectors contributed.
During the year, lower-quality companies within the benchmark, those companies with highprice-to-earnings (P/E) ratios, declined by less than their higher-quality counterparts. The Series is overweight low P/E companies relative to the benchmark, which detracted from performance.
Semiconductor and integrated circuits manufacturerTower Semiconductor Ltd.detracted. During the year, the company’s earnings reports were lower than expected as management worked to upgrade its business mix by reducing the company’s lower-margin businesses in favor of increasing its higher-margin business lines. As the stock’s price declined during the year, we increased the Series’ position in Tower Semiconductor as we believe in management’s ability to execute on its planned shift in business mix, which should benefit the company’s financials.
Shares ofCommScope Holding Co. Inc.experienced two sharp declines during the year. In May, CommScope sold off after the company cut its full-year profit expectations, the result of unanticipated price pressure from several major North American telecommunications operators. During the fourth quarter, in conjunction with its fiscal third-quarter earnings release, CommScope announced an accretive acquisition of ARRIS International Plc. Investors seemed to view the purchase negatively, which weighed on the stock’s price. We trimmed the Series’ position in CommScope while we continue to evaluate the company’s financials prior to the closing of the ARRIS acquisition. We continue to view CommScope’s valuation as attractive given the company’s strong cash-flow generation; however, we are not pleased that the transaction will increase the company’s debt level.
Olin Corp.is a commodity chemical company that primarily produces chlorine, caustic soda, epoxy, and derivative chlorine products. Shares of Olin detracted during the year, the result of rising input costs across its businesses and a temporary demand imbalance in the chlor-alkali market, which resulted in a modest reversal of caustic soda pricing gains that had been realized over the previous 18 months. The decline in Olin’s share price during the year coincided with the company’s reporting its highest adjusted earnings before interest, taxes, depreciation, and amortization since the acquisition of the DowDuPont Chlorine Products business. We added to the Series’ position in Olin on the weakness and have a favorable outlook for the company, which trades at what we consider to be an attractive valuation and is returning cash to shareholders through debt pay down, dividends, and opportunistic stock repurchases.
Shares of healthcare product company,STERIS PLC,outperformed during the year. STERIS’ stock price traded at a relative discount to its peers in the healthcare equipment and supplies industry at the beginning of the year. While the industry group performed well during the fiscal year, STERIS experienced strong fundamental trends, prompting an increase to earnings guidance with resulting stock outperformance. During the year, we trimmed the Series’ holding in STERIS as the stock’s valuation gap relative to its peers narrowed in order to maintain the position’s size in the portfolio.
The Series benefited from a surge in merger and acquisition activity, which reached a total of nine companies during the fiscal year.Validus Holdings Ltd., a Bermuda-based reinsurer and provider of specialty insurance products, was the first takeout of the year. The Series’ position in Validus
| | |
| Unless otherwise noted, views expressed herein are current as of Dec. 31, 2018, and subject to change. |
| | |
Small Cap Value Series-1
| | |
| Delaware VIP®Trust — Delaware VIP Small Cap Value Series |
| Portfolio management review (continued) | | January 8, 2019 |
contributed as American International Group Inc. acquired the company in a cash deal worth $5.4 billion. We exited the Series’ position in Validus shortly after the deal was announced.
Stock selection in the consumer services sector contributed and was led bydrive-in restaurant operatorSonic Corp.In September, Sonic announced plans to be acquired at a premium by privately owned Inspire Brands Inc. in anall-cash deal. We exited the Series’ position in Sonic prior to the end of the fiscal year.
As the new fiscal year began, the Series remained positioned for economic growth. For example, we remained underweight the defensive sectors, including REITs and utilities. The Series is overweight some of the more-cyclical sectors, as we believe valuations and free-cash-flow generation are more attractive for companies in these sectors. The largest overweight sector positions in the Series are to the capital spending, basic industry, financial services, and energy sectors.
Our team’s disciplined philosophy remains unchanged. We continue to focus onbottom-up stock selection, and specifically on identifying companies that, in our view, trade at attractive valuations, generate strong free-cash flow, and implement shareholder-friendly policies through share buybacks, dividend increases, and debt reduction. In that regard, we are encouraged by the number of companies that continue to meet these criteria.
| | |
| Unless otherwise noted, views expressed herein are current as of Dec. 31, 2018, and subject to change. |
| | |
Small Cap Value Series-2
Delaware VIP® Trust — Delaware VIP Small Cap Value Series
Performance summary
The performance quoted represents past performance and does not guarantee future results. Investment return and principal value of an investment will fluctuate so that shares, when redeemed, may be worth more or less than their original cost. Current performance may be lower or higher than the performance quoted.
Carefully consider the Series’ investment objectives, risk factors, charges, and expenses before investing. This and other information can be found in the Series’ prospectus and its summary prospectus, which may be obtained by visiting delawarefunds.com/vip/literature or calling 800523-1918. Investors should read the prospectus and the summary prospectus carefully before investing.
| | | | | | | | | | | | | | | | | | | | | | | | | |
| Delaware VIP Small Cap Value Series | | | | | | | | | | |
| Average annual total returns | | | | | | | | | | |
| For periods ended December 31, 2018 | | 1 year | | 3 years | | 5 years | | 10 years | | Lifetime |
Standard Class shares (commenced operations on Dec. 27, 1993) | | | | -16.72% | | | | | +7.04% | | | | | +4.01% | | | | | +12.28% | | | | | +9.95% | |
| | | | | | | | | | | | | | | | | | | | | | | | | |
Service Class shares (commenced operations on May 1, 2000) | | | | -16.95% | | | | | +6.76% | | | | | +3.75% | | | | | +12.00% | | | | | +9.55% | |
| | | | | | | | | | | | | | | | | | | | | | | | | |
Russell 2000 Value Index | | | | -12.86% | | | �� | | +7.37% | | | | | +3.61% | | | | | +10.40% | | | | | n/a | |
| | | | | | | | | | | | | | | | | | | | | | | | | |
Returns reflect the reinvestment of all distributions. Please see page 4 for a description of the index.
As described in the Series’ most recent prospectus, the net expense ratio for Service Class shares of the Series was 1.04%, while total operating expenses for Standard Class and Service Class shares were 0.78% and 1.08%, respectively. The management fee for Standard Class and Service Class shares was 0.71%. Please see the “Financial highlights” section in this report for the most recent expense ratios.
The Series pays Delaware Distributors, L.P. (DDLP), the distributor and an affiliate of DMC, an annual12b-1 fee of 0.30% of the average daily net assets of the Service Class shares. Prior to May 1, 2018, DDLP had contracted to waive12b-1 fees in order to limit12b-1 fees of the Service Class shares to 0.25% of average daily net assets.
Earnings from a variable annuity or variable life investment compoundtax-free until withdrawal, and as a result, no adjustments were made for income taxes.
Expense limitations were in effect for both classes during certain periods shown in the Series performance table above and in the Performance of a $10,000 Investment graph on the next page.
Performance data do not reflect insurance fees related to a variable annuity or variable life investment or the deferred sales charge that would apply to certain withdrawals of investments held for fewer than eight years. Performance shown here would have been reduced if such fees were included and the expense limitation removed. For more information about fees, consult your variable annuity or variable life prospectus.
Investments in variable products involve risk.
Investments in small and/ormedium-sized companies typically exhibit greater risk and higher volatility than larger, more established companies.
Narrowly focused investments may exhibit higher volatility than investments in multiple industry sectors.
REIT investments are subject to many of the risks associated with direct real estate ownership, including changes in economic conditions, credit risk, and interest rate fluctuations.
Please read both the contract and underlying prospectus for specific details regarding the product’s risk profile.
Small Cap Value Series-3
Delaware VIP® Small Cap Value Series
Performance summary (continued)
| | | | |
| For period beginning Dec. 31, 2008 through Dec. 31, 2018 | | Starting value | | Ending value |
–– Delaware VIP Small Cap Value Series (Standard Class) | | $10,000 | | $31,851 |
– – Russell 2000 Value Index | | $10,000 | | $26,889 |
The graph shows a $10,000 investment in the Delaware VIP Small Cap Value Series Standard Class shares for the period from Dec. 31, 2008 through Dec. 31, 2018.
The graph also shows $10,000 invested in the Russell 2000 Value Index for the period from Dec. 31, 2008 through Dec. 31, 2018. The Russell 2000 Value Index measures the performance of thesmall-cap value segment of the US equity universe. It includes those Russell 2000 companies with lowerprice-to-book ratios and lower forecasted growth values.
Frank Russell Company (“Russell”) is the source and owner of the trademarks, service marks, and copyrights related to the Russell Indexes. Russell® is a trademark of the Frank Russell Company.
Index performance returns do not reflect any management fees, transaction costs or expenses. Indices are unmanaged and one cannot invest directly in an index.
Performance of Service Class shares will vary due to different charges and expenses.
Past performance is not a guarantee of future results.
Small Cap Value Series-4
Delaware VIP® Trust — Delaware VIP Small Cap Value Series
Disclosure of Series expenses
For thesix-month period from July 1, 2018 to December 31, 2018 (Unaudited)
As a shareholder of the Series, you incur ongoing costs, which may include management fees; distribution and service(12b-1) fees; and other Series expenses. This example is intended to help you understand your ongoing costs (in dollars) of investing in the Series and to compare these costs with the ongoing costs of investing in other mutual funds.
The example is based on an investment of $1,000 invested at the beginning of the period and held for the entiresix-month period from July 1, 2018 to Dec. 31, 2018.
Actual expenses
The first section of the table shown, “Actual Series Return,” provides information about actual account values and actual expenses. You may use the information in this section of the table, together with the amount you invested, to estimate the expenses that you paid over the period. Simply divide your account value by $1,000 (for example, an $8,600 account value divided by $1,000 = 8.6), then multiply the result by the number in the first section under the heading entitled “Expenses Paid During Period” to estimate the expenses you paid on your account during the period.
Hypothetical example for comparison purposes
The second section of the table shown, “Hypothetical 5% Return,” provides information about hypothetical account values and hypothetical expenses based on the Series’ actual expense ratio and an assumed rate of return of 5% per year before expenses, which is not the Series’ actual return. The hypothetical account values and expenses may not be used to estimate the actual ending account balance or expenses you paid for the period. You may use this information to compare the ongoing costs of investing in the Series and other funds. To do so, compare the 5% hypothetical example with the 5% hypothetical examples that appear in the shareholder reports of other funds.
Please note that the expenses shown in the table are meant to highlight your ongoing costs only. As a shareholder of the Series, you do not incur any transaction costs, such as sales charges (loads), redemption fees or exchange fees, but shareholders of other funds may incur such costs. Also, the fees related to the variable annuity investment or the deferred sales charge that could apply have not been included. Therefore, the second section of the table is useful in comparing ongoing costs only, and will not help you determine the relative total costs of
owning different funds. The Series’ expenses shown in the table assume reinvestment of all dividends and distributions.
Expense analysis of an investment of $1,000
| | | | | | | | | | | | | | |
| | | Beginning Account
Value
7/1/18 | | | Ending
Account
Value 12/31/18 | | | Annualized
Expense
Ratio | | | Expenses
Paid During
Period
7/1/18 to
12/31/18* |
| | | | |
Actual Series return† | | | | | | | | | | | | | | |
Standard Class | | | $1,000.00 | | | | $ 819.20 | | | | 0.77% | | | $3.53 |
Service Class | | | 1,000.00 | | | | 818.00 | | | | 1.07% | | | 4.90 |
|
Hypothetical 5% return(5% return before expenses) |
Standard Class | | | $1,000.00 | | | | $1,021.32 | | | | 0.77% | | | $3.92 |
Service Class | | | 1,000.00 | | | | 1,019.81 | | | | 1.07% | | | 5.45 |
*“Expenses Paid During Period” are equal to the Series’ annualized expense ratio, multiplied by the average account value over the period, multiplied by 184/365 (to reflect theone-half year period).
†Because actual returns reflect only the most recentsix-month period, the returns shown may differ significantly from fiscal year returns.
In addition to the Series’ expenses reflected above, the Series also indirectly bears its portion of the fees and expenses of the business development corporation (Underlying Fund) in which it invests. The table above does not reflect the expenses of the Underlying Fund.
Small Cap Value Series-5
Delaware VIP® Trust — Delaware VIP Small Cap Value Series
Security type / sector allocation and top 10 equity holdings
As of December 31, 2018 (Unaudited)
Sector designations may be different than the sector designations presented in other Series materials. The sector designations may represent the investment manager’s internal sector classifications.
| | | | | |
| | | Percentage of |
| Security type / sector | | net assets |
Common Stock² | | | | 97.19 | % |
Basic Industry | | | | 7.37 | % |
Business Services | | | | 0.88 | % |
Capital Spending | | | | 8.24 | % |
Consumer Cyclical | | | | 3.55 | % |
Consumer Services | | | | 10.13 | % |
Consumer Staples | | | | 2.15 | % |
Energy | | | | 6.29 | % |
Financial Services1 | | | | 29.41 | % |
Healthcare | | | | 3.63 | % |
Real Estate | | | | 8.19 | % |
Technology | | | | 12.31 | % |
Transportation | | | | 1.92 | % |
Utilities | | | | 3.12 | % |
Short-Term Investments | | | | 2.57 | % |
| |
Total Value of Securities | | | | 99.76 | % |
| |
Receivables and Other Assets Net of Liabilities | | | | 0.24 | % |
| |
Total Net Assets | | | | 100.00 | % |
| ² | Narrow industries are utilized for compliance purposes for diversification whereas broad sectors are used for financial reporting. |
| 1 | To monitor compliance with the Series’ concentration guidelines as described in the Series’ prospectus and Statement of Additional Information, the Financial Services sector (as disclosed herein for financial reporting purposes) is subdivided into a variety of “industries” (in accordance with the requirements of the Investment Company Act of 1940, as amended). The Financial Services sector consisted of banks, diversified financial services, insurance, and investment companies. As of Dec. 31, 2018, such amounts, as percentage of total net assets, were 21.73%, 2.08%, 5.02%, and 0.58%, respectively. The percentage in any such single industry will comply with the Series’ concentration policy even if the percentages in the Financial Services sector for financial reporting purposes may exceed 25%. |
Holdings are for informational purposes only and are subject to change at any time. They are not a recommendation to buy, sell, or hold any security.
| | | | | |
| Top 10 equity holdings | | Percentage
of net assets |
East West Bancorp | | | | 2.52% | |
MasTec | | | | 2.30% | |
ITT | | | | 2.24% | |
Berry Global Group | | | | 2.10% | |
Synopsys | | | | 1.99% | |
Webster Financial | | | | 1.96% | |
Selective Insurance Group | | | | 1.93% | |
Hancock Whitney | | | | 1.77% | |
Hanover Insurance Group | | | | 1.73% | |
Olin | | | | 1.52% | |
Small Cap Value Series-6
Delaware VIP® Trust — Delaware VIP Small Cap Value Series
Schedule of investments
December 31, 2018
| | | | | | | | |
| | | Number of | | | Value | |
| | | shares | | | (US $) | |
| |
Common Stock - 97.19%² | | | | | |
Basic Industry - 7.37% | | | | | |
Berry Global Group † | | | 468,200 | | | $ | 22,253,546 | |
HB Fuller | | | 340,100 | | | | 14,512,067 | |
Louisiana-Pacific | | | 308,200 | | | | 6,848,204 | |
Minerals Technologies | | | 71,178 | | | | 3,654,278 | |
Olin | | | 797,900 | | | | 16,045,769 | |
Trinseo | | | 319,900 | | | | 14,645,022 | |
| | | | | | | | |
| | | | | | | 77,958,886 | |
| | | | | | | | |
Business Services - 0.88% | | | | | |
Deluxe | | | 118,800 | | | | 4,566,672 | |
WESCO International † | | | 98,100 | | | | 4,708,800 | |
| | | | | | | | |
| | | | | | | 9,275,472 | |
| | | | | | | | |
Capital Spending - 8.24% | | | | | |
Altra Industrial Motion | | | 241,770 | | | | 6,080,515 | |
Atkore International Group † | | | 377,500 | | | | 7,489,600 | |
EnPro Industries | | | 120,600 | | | | 7,248,060 | |
H&E Equipment Services | | | 298,900 | | | | 6,103,538 | |
ITT | | | 490,800 | | | | 23,690,916 | |
MasTec † | | | 600,446 | | | | 24,354,090 | |
Primoris Services | | | 383,600 | | | | 7,338,268 | |
Rexnord † | | | 214,400 | | | | 4,920,480 | |
| | | | | | | | |
| | | | | | | 87,225,467 | |
| | | | | | | | |
Consumer Cyclical - 3.55% | | | | | |
Barnes Group | | | 205,400 | | | | 11,013,548 | |
Knoll | | | 382,893 | | | | 6,310,077 | |
Meritage Homes † | | | 376,800 | | | | 13,836,096 | |
Standard Motor Products | | | 79,901 | | | | 3,869,605 | |
Tenneco Class A | | | 93,200 | | | | 2,552,748 | |
| | | | | | | | |
| | | | | | | 37,582,074 | |
| | | | | | | | |
Consumer Services - 10.13% | | | | | |
Asbury Automotive Group † | | | 84,600 | | | | 5,639,436 | |
Cable One | | | 13,600 | | | | 11,153,360 | |
Caleres | | | 281,400 | | | | 7,831,362 | |
Cheesecake Factory | | | 178,700 | | | | 7,775,237 | |
Choice Hotels International | | | 180,000 | | | | 12,884,400 | |
Cinemark Holdings | | | 293,513 | | | | 10,507,765 | |
Cracker Barrel Old Country Store | | | 30,000 | | | | 4,795,800 | |
International Speedway Class A | | | 216,700 | | | | 9,504,462 | |
Meredith | | | 133,750 | | | | 6,946,975 | |
Steven Madden | | | 261,050 | | | | 7,899,373 | |
Texas Roadhouse | | | 94,700 | | | | 5,653,590 | |
UniFirst | | | 60,400 | | | | 8,641,428 | |
Wolverine World Wide | | | 250,300 | | | | 7,982,067 | |
| | | | | | | | |
| | | | | | | 107,215,255 | |
| | | | | | | | |
Consumer Staples - 2.15% | | | | | |
Core-Mark Holding | | | 204,569 | | | | 4,756,229 | |
J&J Snack Foods | | | 67,400 | | | | 9,745,366 | |
Scotts Miracle-Gro | | | 94,900 | | | | 5,832,554 | |
Spectrum Brands Holdings | | | 58,100 | | | | 2,454,725 | |
| | | | | | | | |
| | | | | | | 22,788,874 | |
| | | | | | | | |
Energy - 6.29% | | | | | | | | |
Delek US Holdings | | | 287,600 | | | | 9,349,876 | |
Dril-Quip † | | | 138,700 | | | | 4,165,161 | |
| | | | | | | | |
| | | Number of | | | Value | |
| | | shares | | | (US $) | |
| |
Common Stock² (continued) | | | | | |
Energy (continued) | | | | | | | | |
Helix Energy Solutions Group † | | | 893,000 | | | $ | 4,831,130 | |
KLX Energy Services Holdings † | | | 53,920 | | | | 1,264,424 | |
Oasis Petroleum † | | | 970,100 | | | | 5,364,653 | |
Patterson-UTI Energy | | | 840,100 | | | | 8,695,035 | |
Rowan Class A † | | | 688,900 | | | | 5,779,871 | |
SM Energy | | | 604,000 | | | | 9,349,920 | |
Southwest Gas Holdings | | | 189,700 | | | | 14,512,050 | |
Whiting Petroleum † | | | 142,525 | | | | 3,233,892 | |
| | | | | | | | |
| | | | | | | 66,546,012 | |
| | | | | | | | |
Financial Services - 29.41% | | | | | |
American Equity Investment Life Holding | | | 514,700 | | | | 14,380,718 | |
Bank of Hawaii | | | 83,600 | | | | 5,627,952 | |
Bank of NT Butterfield & Son | | | 171,100 | | | | 5,363,985 | |
Boston Private Financial Holdings | | | 515,100 | | | | 5,444,607 | |
Community Bank System | | | 171,000 | | | | 9,969,300 | |
East West Bancorp | | | 613,336 | | | | 26,698,517 | |
First Financial Bancorp | | | 557,200 | | | | 13,216,784 | |
First Hawaiian | | | 452,400 | | | | 10,183,524 | |
First Interstate BancSystem Class A | | | 293,000 | | | | 10,712,080 | |
First Midwest Bancorp | | | 547,300 | | | | 10,842,013 | |
FNB | | | 1,249,000 | | | | 12,290,160 | |
Great Western Bancorp | | | 468,600 | | | | 14,643,750 | |
Hancock Whitney | | | 539,800 | | | | 18,704,070 | |
Hanover Insurance Group | | | 156,800 | | | | 18,309,536 | |
Legg Mason | | | 251,800 | | | | 6,423,418 | |
Main Street Capital (BDC) | | | 182,400 | | | | 6,166,944 | |
NBT Bancorp | | | 295,900 | | | | 10,235,181 | |
Prosperity Bancshares | | | 202,000 | | | | 12,584,600 | |
S&T Bancorp | | | 203,942 | | | | 7,717,165 | |
Selective Insurance Group | | | 334,590 | | | | 20,389,915 | |
Stifel Financial | | | 375,100 | | | | 15,536,642 | |
Umpqua Holdings | | | 831,400 | | | | 13,219,260 | |
Valley National Bancorp | | | 1,273,000 | | | | 11,304,240 | |
Webster Financial | | | 420,200 | | | | 20,711,658 | |
WesBanco | | | 286,500 | | | | 10,511,685 | |
| | | | | | | | |
| | | | | | | 311,187,704 | |
| | | | | | | | |
Healthcare - 3.63% | | | | | |
Avanos Medical † | | | 209,700 | | | | 9,392,463 | |
Catalent † | | | 241,400 | | | | 7,526,852 | |
Service Corp. International | | | 201,000 | | | | 8,092,260 | |
STERIS | | | 124,898 | | | | 13,345,351 | |
| | | | | | | | |
| | | | | | | 38,356,926 | |
| | | | | | | | |
Real Estate - 8.19% | | | | | | | | |
Brandywine Realty Trust | | | 891,833 | | | | 11,477,891 | |
Healthcare Realty Trust | | | 351,700 | | | | 10,002,348 | |
Highwoods Properties | | | 271,500 | | | | 10,504,335 | |
Lexington Realty Trust | | | 1,075,100 | | | | 8,826,571 | |
Life Storage | | | 111,300 | | | | 10,349,787 | |
Outfront Media | | | 720,200 | | | | 13,050,024 | |
RPT Realty | | | 586,200 | | | | 7,005,090 | |
Summit Hotel Properties | | | 676,400 | | | | 6,581,372 | |
Small Cap Value Series-7
Delaware VIP® Small Cap Value Series
Schedule of investments (continued)
| | | | | | | | |
| | | Number of | | | Value | |
| | | shares | | | (US $) | |
| | |
Common Stock²(continued) | | | | | | | | |
Real Estate (continued) | | | | | | | | |
Washington Real Estate Investment
Trust | | | 384,400 | | | $ | 8,841,200 | |
| | | | | | | | |
| | | | | | | 86,638,618 | |
| | | | | | | | |
Technology - 12.31% | | | | | |
Cirrus Logic † | | | 154,000 | | | | 5,109,720 | |
Coherent † | | | 41,600 | | | | 4,397,536 | |
CommScope Holding † | | | 371,845 | | | | 6,094,540 | |
Flex † | | | 640,200 | | | | 4,871,922 | |
MaxLinear † | | | 315,300 | | | | 5,549,280 | |
NCR † | | | 328,399 | | | | 7,579,449 | |
NetScout Systems † | | | 246,163 | | | | 5,816,832 | |
ON Semiconductor † | | | 645,700 | | | | 10,660,507 | |
PTC † | | | 25,600 | | | | 2,122,240 | |
Synopsys † | | | 249,600 | | | | 21,026,304 | |
Tech Data † | | | 175,829 | | | | 14,384,570 | |
Teradyne | | | 407,000 | | | | 12,771,660 | |
Tower Semiconductor † | | | 458,900 | | | | 6,764,186 | |
TTM Technologies † | | | 538,312 | | | | 5,237,776 | |
Viavi Solutions † | | | 548,400 | | | | 5,511,420 | |
Vishay Intertechnology | | | 688,600 | | | | 12,401,686 | |
| | | | | | | | |
| | | | | | | 130,299,628 | |
| | | | | | | | |
Transportation - 1.92% | | | | | |
Kirby † | | | 74,200 | | | | 4,998,112 | |
Saia † | | | 95,850 | | | | 5,350,347 | |
Werner Enterprises | | | 337,200 | | | | 9,960,888 | |
| | | | | | | | |
| | | | | | | 20,309,347 | |
| | | | | | | | |
Utilities - 3.12% | | | | | | | | |
ALLETE | | | 128,800 | | | | 9,817,136 | |
Black Hills | | | 212,400 | | | | 13,334,472 | |
El Paso Electric | | | 197,700 | | | | 9,910,701 | |
| | | | | | | | |
| | | | | | | 33,062,309 | |
| | | | | | | | |
Total Common Stock
(cost $885,675,506) | | | | | | | 1,028,446,572 | |
| | | | | | | | |
| | | | | | | | |
| | | Principal | | | Value | |
| | | amount° | | | (US $) | |
| |
Short-Term Investments - 2.57% | | | | | |
Discount Note - 0.39%≠ | | | | | |
Federal Home Loan Bank 1.05% 1/2/19 | | | 4,180,798 | | | | 4,180,798 | |
| | | | | | | | |
| | | | | | | 4,180,798 | |
| | | | | | | | |
Repurchase Agreements - 2.04% | | | | | |
Bank of America Merrill Lynch 2.95%, dated 12/31/18, to be repurchased on 1/2/19, repurchase at $2,613,427 (cash collateralized of $2,612,999) | | | 2,612,999 | | | | 2,612,999 | |
Bank of Montreal 2.60%, dated 12/31/18, to be repurchased on 1/2/19, repurchase price $7,186,785 (collateralized by US government obligations0.00%-3.75%1/24/19-2/15/47; market value $7,329,463) | | | 7,185,748 | | | | 7,185,748 | |
BNP Paribas 2.93%, dated 12/31/18, to be repurchased on 1/2/19, repurchase price $11,751,864 (collateralized by US government obligations0.00%-8.00%2/15/19-8/15/46; market value $11,984,951) | | | 11,749,951 | | | | 11,749,951 | |
| | | | | | | | |
| | | | | | | 21,548,698 | |
| | | | | | | | |
U.S. Treasury Obligation - 0.14%≠ | | | | | |
US Treasury Bill 1.493% 1/3/19 | | | 1,435,889 | | | | 1,435,798 | |
| | | | | | | | |
| | | | | | | 1,435,798 | |
| | | | | | | | |
Total Short-Term Investments
(cost $27,164,963) | | | | | | | 27,165,294 | |
| | | | | | | | |
| | | | |
Total Value of Securities - 99.76%
(cost $912,840,469) | | $ | 1,055,611,866 | |
| | | | |
| ² | Narrow industries are utilized for compliance purposes for diversification whereas broad sectors are used for financial reporting. |
| ≠ | The rate shown is the effective yield at the time of purchase. |
| ° | Principal amount shown is stated in USD unless noted that the security is denominated in another currency. |
| † | Non-income producing security. |
BDC - Business Development Corporation
USD - US Dollar
See accompanying notes, which are an integral part of the financial statements.
Small Cap Value Series-8
| | | | |
| Delaware VIP®Trust — Delaware VIP Small Cap Value Series | | | | |
| Statement of assets and liabilities | | | December 31, 2018 | |
| | | | |
Assets: | | | | |
Investments, at value1 | | $ | 1,055,611,866 | |
Receivable for series shares sold | | | 3,661,971 | |
Dividends and interest receivable | | | 1,379,264 | |
Receivable for securities sold | | | 170,059 | |
| | | | |
Total assets | | | 1,060,823,160 | |
| | | | |
Liabilities: | | | | |
Cash overdraft | | | 876,439 | |
Payable for series shares redeemed | | | 816,839 | |
Investment management fees payable to affiliates | | | 663,939 | |
Distribution fees payable to affiliates | | | 185,483 | |
Other accrued expenses | | | 121,518 | |
Dividend disbursing and transfer agent fees and expenses payable to affiliates | | | 6,926 | |
Accounting and administration expenses payable to affiliates | | | 3,919 | |
Trustees’ fees and expenses payable to affiliates | | | 2,948 | |
Legal fees payable to affiliates | | | 2,046 | |
Reports and statements to shareholders expenses payable to affiliates | | | 782 | |
| | | | |
Total liabilities | | | 2,680,839 | |
| | | | |
Total Net Assets | | $ | 1,058,142,321 | |
| | | | |
| |
Net Assets Consist of: | | | | |
Paid-in capital | | $ | 809,869,215 | |
Total distributable earnings (loss) | | | 248,273,106 | |
| | | | |
Total Net Assets | | $ | 1,058,142,321 | |
| | | | |
| |
Net Asset Value: | | | | |
Standard Class: | | | | |
Net assets | | $ | 357,318,049 | |
Shares of beneficial interest outstanding, unlimited authorization, no par | | | 10,906,232 | |
Net asset value per share | | $ | 32.76 | |
| |
Service Class: | | | | |
Net assets | | $ | 700,824,272 | |
Shares of beneficial interest outstanding, unlimited authorization, no par | | | 21,513,082 | |
Net asset value per share | | $ | 32.58 | |
| |
1Investments, at cost | | $ | 912,840,469 | |
See accompanying notes, which are an integral part of the financial statements.
Small Cap Value Series-9
Delaware VIP® Trust —
Delaware VIP Small Cap Value Series
Statement of operations
Year ended December 31, 2018
| | | | |
Investment Income: | | | | |
Dividends | | $ | 22,070,853 | |
Interest | | | 328,539 | |
| | | | |
| | | 22,399,392 | |
| | | | |
Expenses: | | | | |
Management fees | | | 8,866,618 | |
Distribution expenses - Service Class | | | 2,488,133 | |
Accounting and administration expenses | | | 256,389 | |
Reports and statements to shareholders expenses | | | 139,735 | |
Dividends disbursing and transfer agent fees and expenses | | | 104,827 | |
Legal fees | | | 73,222 | |
Trustees’ fees and expenses | | | 59,622 | |
Audit and tax fees | | | 34,188 | |
Custodian fees | | | 26,362 | |
Registration fees | | | 6,973 | |
Other | | | 31,756 | |
| | | | |
| | | 12,087,825 | |
Less waived distribution expenses - Service Class | | | (136,773 | ) |
Less expenses paid indirectly | | | (2,086 | ) |
| | | | |
Total operating expenses | | | 11,948,966 | |
| | | | |
Net Investment Income | | | 10,450,426 | |
| | �� | | |
| |
Net Realized and Unrealized Gain (Loss): | | | | |
Net realized gain on investments | | | 95,626,959 | |
Net change in unrealized appreciation (depreciation) of investments | | | (318,139,961 | ) |
| | | | |
Net Realized and Unrealized Loss | | | (222,513,002 | ) |
| | | | |
Net Decrease in Net Assets Resulting from Operations | | $ | (212,062,576 | ) |
| | | | |
Delaware VIP Trust —
Delaware VIP Small Cap Value Series
Statements of changes in net assets
| | | | | | | | |
| | | Year ended | |
| | | 12/31/18 | | | 12/31/17 | |
Increase (Decrease) in Net Assets from
Operations: | | | | | | | | |
Net investment income | | $ | 10,450,426 | | | $ | 8,460,681 | |
Net realized gain | | | 95,626,959 | | | | 89,307,889 | |
Net change in unrealized appreciation
(depreciation) | | | (318,139,961 | ) | | | 42,498,525 | |
| | | | | | | | |
Net increase (decrease) in net assets
resulting from operations | | | (212,062,576 | ) | | | 140,267,095 | |
| | | | | | | | |
Dividends and Distributions to
Shareholders from: | | | | | | | | |
Distributable earnings*: | | | | | | | | |
Standard Class | | | (33,424,300 | ) | | | (18,477,709 | ) |
Service Class | | | (64,378,292 | ) | | | (32,861,291 | ) |
| | | | | | | | |
| | | (97,802,592 | ) | | | (51,339,000 | ) |
| | | | | | | | |
| | |
Capital Share Transactions: | | | | | | | | |
Proceeds from shares sold: | | | | | | | | |
Standard Class | | | 48,204,956 | | | | 48,898,580 | |
Service Class | | | 79,818,470 | | | | 83,357,127 | |
Net asset value of shares issued upon reinvestment of dividends and distributions: | | | | | | | | |
Standard Class | | | 33,424,300 | | | | 18,477,709 | |
Service Class | | | 64,378,292 | | | | 32,861,291 | |
| | | | | | | | |
| | | 225,826,018 | | | | 183,594,707 | |
| | | | | | | | |
Cost of shares redeemed: | | | | | | | | |
Standard Class | | | (59,827,644 | ) | | | (87,811,487 | ) |
Service Class | | | (90,648,481 | ) | | | (116,009,390 | ) |
| | | | | | | | |
| | | (150,476,125 | ) | | | (203,820,877 | ) |
| | | | | | | | |
Increase (Decrease) in net assets derived
from capital share transactions | | | 75,349,893 | | | | (20,226,170 | ) |
| | | | | | | | |
Net Increase (Decrease) in Net Assets | | | (234,515,275 | ) | | | 68,701,925 | |
| | | | | | | | |
Net Assets: | | | | | | | | |
Beginning of year | | | 1,292,657,596 | | | | 1,223,955,671 | |
| | | | | | | | |
| | |
End of year1 | | $ | 1,058,142,321 | | | $ | 1,292,657,596 | |
| | | | | | | | |
| 1 | Net Assets - End of year includes undistributed net investment income of $8,459,136 in 2017. The Securities and Exchange Commision eliminated the requirement to disclose undistributed (distributions in excess of) net investment income in 2018. |
| * | For the year ended Dec. 31, 2018, the Series has adopted amendments to RegulationS-X (see Note 12 in “Notes to financial statements”). For the year ended Dec. 31, 2017, the class specific dividends and distributions to shareholders were as follows: |
| | | | | | | | |
| | | Standard Class | | | Service Class | |
Dividends from net investment income | | $ | (3,678,580 | ) | | $ | (5,192,797 | ) |
Distributions from net realized gain | | | (14,799,129 | ) | | | (27,668,494 | ) |
See accompanying notes, which are an integral part of the financial statements.
Small Cap Value Series-10
Delaware VIP® Trust — Delaware VIP Small Cap Value Series
Financial highlights
Selected data for each share of the Series outstanding throughout each period were as follows:
| | | | | | | | | | | | | | | | | | | | |
| | | Delaware VIP Small Cap Value Series Standard Class
Year ended | |
| | | 12/31/18 | | | 12/31/17 | | | 12/31/16 | | | 12/31/15 | | | 12/31/14 | |
Net asset value, beginning of period | | $ | 42.73 | | | $ | 39.84 | | | $ | 33.72 | | | $ | 40.23 | | | $ | 41.72 | |
| | | | | |
Income (loss) from investment operations: | | | | | | | | | | | | | | | | | | | | |
Net investment income1 | | | 0.41 | | | | 0.34 | | | | 0.36 | | | | 0.33 | | | | 0.27 | |
Net realized and unrealized gain (loss) | | | (7.03 | ) | | | 4.30 | | | | 9.37 | | | | (2.43 | ) | | | 2.06 | |
| | | | | | | | | | | | | | | | | | | | |
Total from investment operations | | | (6.62 | ) | | | 4.64 | | | | 9.73 | | | | (2.10 | ) | | | 2.33 | |
| | | | | | | | | | | | | | | | | | | | |
| | | | | |
Less dividends and distributions from: | | | | | | | | | | | | | | | | | | | | |
Net investment income | | | (0.35 | ) | | | (0.35 | ) | | | (0.35 | ) | | | (0.28 | ) | | | (0.23 | ) |
Net realized gain | | | (3.00 | ) | | | (1.40 | ) | | | (3.26 | ) | | | (4.13 | ) | | | (3.59 | ) |
| | | | | | | | | | | | | | | | | | | | |
Total dividends and distributions | | | (3.35 | ) | | | (1.75 | ) | | | (3.61 | ) | | | (4.41 | ) | | | (3.82 | ) |
| | | | | | | | | | | | | | | | | | | | |
| | | | | |
Net asset value, end of period | | $ | 32.76 | | | $ | 42.73 | | | $ | 39.84 | | | $ | 33.72 | | | $ | 40.23 | |
| | | | | | | | | | | | | | | | | | | | |
| | | | | |
Total return2 | | | (16.72% | ) | | | 12.05% | | | | 31.41% | | | | (6.22% | ) | | | 5.86% | |
| | | | | |
Ratios and supplemental data: | | | | | | | | | | | | | | | | | | | | |
Net assets, end of period (000 omitted) | | $ | 357,318 | | | $ | 439,612 | | | $ | 429,275 | | | $ | 343,847 | | | $ | 379,542 | |
Ratio of expenses to average net assets3 | | | 0.77% | | | | 0.78% | | | | 0.79% | | | | 0.80% | | | | 0.80% | |
Ratio of net investment income to average net assets | | | 1.03% | | | | 0.85% | | | | 1.05% | | | | 0.90% | | | | 0.68% | |
Portfolio turnover | | | 18% | | | | 14% | | | | 11% | | | | 18% | | | | 16% | |
| 1 | The average shares outstanding method has been applied for per share information. |
| 2 | Total return is based on the change in net asset value of a share during the period and assumes reinvestment of dividends and distributions at net asset value. Total return does not include fees, charges, or expenses imposed by the variable annuity and life insurance contracts for which Delaware VIP Trust serves as an underlying investment vehicle. |
| 3 | Expense ratios do not include expenses of the Underlying Fund in which the Series invests. |
See accompanying notes, which are an integral part of the financial statements.
Small Cap Value Series-11
Delaware VIP®Small Cap Value Series
Financial highlights (continued)
Selected data for each share of the Series outstanding throughout each period were as follows:
| | | | | | | | | | | | | | | | | | | | |
| | | Delaware VIP Small Cap Value Series Service Class
Year ended | |
| | | 12/31/18 | | | 12/31/17 | | | 12/31/16 | | | 12/31/15 | | | 12/31/14 | |
Net asset value, beginning of period | | $ | 42.52 | | | $ | 39.67 | | | $ | 33.58 | | | $ | 40.08 | | | $ | 41.58 | |
| | | | | |
Income (loss) from investment operations: | | | | | | | | | | | | | | | | | | | | |
Net investment income1 | | | 0.29 | | | | 0.24 | | | | 0.27 | | | | 0.24 | | | | 0.17 | |
Net realized and unrealized gain (loss) | | | (6.98 | ) | | | 4.27 | | | | 9.34 | | | | (2.43 | ) | | | 2.06 | |
| | | | | | | | | | | | | | | | | | | | |
Total from investment operations | | | (6.69 | ) | | | 4.51 | | | | 9.61 | | | | (2.19 | ) | | | 2.23 | |
| | | | | | | | | | | | | | | | | | | | |
| | | | | |
Less dividends and distributions from: | | | | | | | | | | | | | | | | | | | | |
Net investment income | | | (0.25 | ) | | | (0.26 | ) | | | (0.26 | ) | | | (0.18 | ) | | | (0.14 | ) |
Net realized gain | | | (3.00 | ) | | | (1.40 | ) | | | (3.26 | ) | | | (4.13 | ) | | | (3.59 | ) |
| | | | | | | | | | | | | | | | | | | | |
Total dividends and distributions | | | (3.25 | ) | | | (1.66 | ) | | | (3.52 | ) | | | (4.31 | ) | | | (3.73 | ) |
| | | | | | | | | | | | | | | | | | | | |
| | | | | |
Net asset value, end of period | | $ | 32.58 | | | $ | 42.52 | | | $ | 39.67 | | | $ | 33.58 | | | $ | 40.08 | |
| | | | | | | | | | | | | | | | | | | | |
| | | | | |
Total return2 | | | (16.95% | ) | | | 11.76% | | | | 31.09% | | | | (6.46% | ) | | | 5.62% | |
| | | | | |
Ratios and supplemental data: | | | | | | | | | | | | | | | | | | | | |
Net assets, end of period (000 omitted) | | $ | 700,824 | | | $ | 853,046 | | | $ | 794,681 | | | $ | 621,022 | | | $ | 719,263 | |
Ratio of expenses to average net assets3 | | | 1.05% | | | | 1.03% | | | | 1.04% | | | | 1.05% | | | | 1.05% | |
Ratio of expenses to average net assets prior to fees waived3 | | | 1.07% | | | | 1.08% | | | | 1.09% | | | | 1.10% | | | | 1.10% | |
Ratio of net investment income to average net assets | | | 0.74% | | | | 0.60% | | | | 0.80% | | | | 0.65% | | | | 0.43% | |
Ratio of net investment income to average net assets prior to fees waived | | | 0.72% | | | | 0.55% | | | | 0.75% | | | | 0.60% | | | | 0.38% | |
Portfolio turnover | | | 18% | | | | 14% | | | | 11% | | | | 18% | | | | 16% | |
| 1 | The average shares outstanding method has been applied for per share information. |
| 2 | Total return is based on the change in net asset value of a share during the period and assumes reinvestment of dividends and distributions at net asset value. Total return during all of the periods shown reflects a waiver by the distributor. Performance would have been lower had the waiver not been in effect. Total return does not include fees, charges, or expenses imposed by the variable annuity and life insurance contracts for which Delaware VIP Trust serves as an underlying investment vehicle. |
| 3 | Expense ratios do not include expenses of the Underlying Fund in which the Series invests. |
See accompanying notes, which are an integral part of the financial statements.
Small Cap Value Series-12
Delaware VIP® Trust — Delaware VIP Small Cap Value Series
Notes to financial statements
December 31, 2018
Delaware VIP Trust (Trust) is organized as a Delaware statutory trust and offers 10 series: Delaware VIP Diversified Income Series, Delaware VIP Emerging Markets Series, Delaware VIP High Yield Series, Delaware VIP International Value Equity Series, Delaware VIP Limited-Term Diversified Income Series, Delaware VIP REIT Series, Delaware VIP Small Cap Value Series, Delaware VIP Smid Cap Core Series, Delaware VIP U.S. Growth Series, and Delaware VIP Value Series. These financial statements and the related notes pertain to Delaware VIP Small Cap Value Series (Series). The Trust is anopen-end investment company. The Series is considered diversified under the Investment Company Act of 1940, as amended (1940 Act), and offers Standard Class and Service Class shares. The Standard Class shares do not carry a distribution and service(12b-1) fee and the Service Class shares carry a12b-1 fee. The shares of the Series are sold only to separate accounts of life insurance companies.
The investment objective of the Series is to seek capital appreciation.
1. Significant Accounting Policies
The Fund is an investment company and follows accounting and reporting guidance under Financial Accounting Standards Board (FASB) Accounting Standards Codification Topic 946, Financial Services - Investment Companies. The following accounting policies are in accordance with US generally accepted accounting principles (US GAAP) and are consistently followed by the Series.
Security Valuation — Equity securities, except those traded on the Nasdaq Stock Market LLC (Nasdaq) are valued at the last quoted sales price as of the time of the regular close of the New York Stock Exchange on the valuation date. Equity securities traded on the Nasdaq are valued in accordance with the Nasdaq Official Closing Price, which may not be the last sales price. If, on a particular day, an equity security does not trade, the mean between the bid and ask prices will be used, which approximates fair value. US government and agency securities are valued at the mean between the bid and ask prices, which approximates fair value. Investments in repurchase agreements are generally valued at par, which approximates fair value, each business day. Generally, other securities and assets for which market quotations are not readily available are valued at fair value as determined in good faith under the direction of the Trust’s Board of Trustees (Board). In determining whether market quotations are readily available or fair valuation will be used, various factors will be taken into consideration, such as market closures or suspension of trading in a security. Restricted securities are valued at fair value using methods approved by the Board.
Federal Income Taxes — No provision for federal income taxes has been made as the Series intends to continue to qualify for federal income tax purposes as a regulated investment company under Subchapter M of the Internal Revenue Code of 1986, as amended, and make the requisite distributions to shareholders. The Series evaluates tax positions taken or expected to be taken in the course of preparing the Series’ tax returns to determine whether the tax positions are“more-likely-than-not” of being sustained by the applicable tax authority. Tax positions not deemed to meet the“more-likely-than-not” threshold are recorded as a tax benefit or expense in the current year. Management has analyzed the Series’ tax positions taken or expected to be taken on the Series’ federal income tax returns through the year ended Dec. 31, 2018 and for all open tax years (years ended Dec. 31, 2015–Dec. 31, 2017), and has concluded that no provision for federal income tax is required in the Series’ financial statements. If applicable, the Series recognizes interest accrued on unrecognized tax benefits in interest expense and penalties in other expenses on the “Statement of operations.” During the year ended Dec. 31, 2018, the Series did not incur any interest or tax penalties.
Class Accounting — Investment income, common expenses, and realized and unrealized gain (loss) on investments are allocated to the classes of the Series on the basis of daily net assets of each class. Distribution expenses relating to a specific class are charged directly to that class.
Underlying Funds — The Series may invest in other investment companies (Underlying Fund) to the extent permitted by the 1940 Act. The Underlying Fund in which the Series invests include business development corporations (BDC) and ETFs. The Series will indirectly bear the investment management fees and other expenses of the Underlying Fund.
Repurchase Agreements — The Series may purchase certain US government securities subject to the counterparty’s agreement to repurchase them at an agreed upon date and price. The counterparty will be required on a daily basis to maintain the value of the collateral subject to the agreement at not less than the repurchase price (including accrued interest). The agreements are conditioned upon the collateral being deposited under the Federal Reserve book-entry system with the Series’ custodian or a third-partysub-custodian. In the event of default or bankruptcy by the other party to the agreement, retention of the collateral may be subject to legal proceedings. All open repurchase agreements as of the date of this report were entered into on Dec. 31, 2018, and matured on the next business day.
Use of Estimates — The preparation of financial statements in conformity with US GAAP requires management to make estimates and assumptions that affect the fair value of investments, the reported amounts of assets and liabilities and disclosure of contingent assets and liabilities at the date of the financial statements, and the reported amounts of revenues and expenses during the reporting period. Actual results could differ from those estimates and the differences could be material.
Other — Expenses directly attributable to the Series are charged directly to the Series. Other expenses common to various funds within the Delaware Funds® by Macquarie (Delaware Funds) are generally allocated among such funds on the basis of average net assets. Management fees and
Small Cap Value Series-13
Delaware VIP® Small Cap Value Series
Notes to financial statements (continued)
1. Significant Accounting Policies (continued)
certain other expenses are paid monthly. Security transactions are recorded on the date the securities are purchased or sold (trade date) for financial reporting purposes. Costs used in calculating realized gains and losses on the sale of investment securities are those of the specific securities sold. Dividend income is recorded on theex-dividend date and interest income is recorded on the accrual basis. Discounts and premiums on debt securities are accreted or amortized to interest income, respectively, over the lives of the respective securities using the effective interest method. Distributions received from investments in real estate investment trusts (REITs) are recorded as dividend income on theex-dividend date, subject to reclassification upon notice of the character of such distribution by the issuer. The Series declares and pays dividends from net investment income and distributions from net realized gain on investments, if any, following the close of the fiscal year. The Series may distribute more frequently, if necessary for tax purposes. Dividends and distributions, if any, are recorded on theex-dividend date.
Subject to seeking best execution, the Series may direct certain security trades to brokers who have agreed to rebate a portion of the related brokerage commission to the Series in cash. In general, best execution refers to many factors, including the price paid or received for a security, the commission charged, the promptness and reliability of execution, the confidentiality and placement accorded the order, and other factors affecting the overall benefit obtained by the Series on the transaction. There were no commission rebates for the year ended Dec. 31, 2018.
The Series receives earnings credits from its custodian when positive cash balances are maintained, which may be used to offset custody fees. The expenses paid under this arrangement are included on the “Statement of operations” under “Custodian fees” with the corresponding expenses offset included under “Less expenses paid indirectly.” For the year ended Dec. 31, 2018, the Series earned $2,082 under this arrangement.
The Series receives earnings credits from its transfer agent when positive cash balances are maintained, which may be used to offset transfer agent fees. If the amount earned is greater than $1, the expenses paid under this arrangement are included on the “Statement of operations” under “Dividend disbursing and transfer agent fees and expenses” with the corresponding expenses offset included under “Less expenses paid indirectly.” For the year ended Dec. 31, 2018, the Series earned $4 under this arrangement.
2. Investment Management, Administration Agreements, and Other Transactions with Affiliates
In accordance with the terms of its investment management agreement, the Series pays Delaware Management Company (DMC), a series of Macquarie Investments Management Business Trust and the investment manager, an annual fee which is calculated daily and paid monthly at the rate of 0.75% on the first $500 million of average daily net assets of the Series, 0.70% on the next $500 million, 0.65% on the next $1.5 billion, and 0.60% on average daily net assets in excess of $2.5 billion.
Delaware Investments Fund Services Company (DIFSC), an affiliate of DMC, provides fund accounting and financial administration oversight services to the Series. For these services, DIFSC’s fees are calculated daily and paid monthly based on the aggregate daily net assets of all funds within the Delaware Funds at the following annual rates: 0.00475% of the first $35 billion; 0.0040% of the next $10 billion; and 0.0025% of aggregate average daily net assets in excess of $45 billion (Total Fee). Each fund in the Delaware funds pays a minimum of $4,000, which, in aggregate, is subtracted from the Total Fee. Each fund then pays its portion of the remainder of the Total Fee on a relative net asset value basis. This amount is included on the “Statement of operations” under “Accounting and administrative expenses.” For the year ended December 31, 2018, the Series was charged $51,156 for these services.
DIFSC is also the transfer agent and dividend disbursing agent of the Series. For these services, DIFSC’s fees were calculated daily and paid monthly at the annual rate of 0.0075% of the Series’ average daily net assets. This amount is included on the “Statement of operations” under “Dividend disbursing and transfer agent fees and expenses.” For the year ended Dec. 31, 2018, the Series was charged $93,653 for these services. Pursuant to asub-transfer agency agreement between DIFSC and BNY Mellon Investment Servicing (US) Inc. (BNYMIS), BNYMIS provides certainsub-transfer agency services to the Series.Sub-transfer agency fees are paid by the Series and are also included on the “Statement of operations” under “Dividend disbursing and transfer agent fees and expenses.”
Pursuant to a distribution agreement and distribution plan, the Series pays Delaware Distributors, L.P. (DDLP), the distributor and an affiliate of DMC, an annual12b-1 fee of 0.30% of the average daily net assets of the Service Class shares. Prior to May 1, 2018, DDLP had contracted to waive12b-1 fees in order to limit12b-1 fees of the Service Class shares to 0.25% of average daily net assets. The fees are calculated daily and paid monthly. Standard Class shares pay no12b-1 fees.
As provided in the investment management agreement, the Series bears a portion of the cost of certain resources shared with DMC, including the cost of internal personnel of DMC and/or its affiliates that provide legal, tax, and regulatory reporting services to the Series. For the year ended Dec. 31, 2018, the Series was charged $37,028 for internal legal, tax, and regulatory reporting services provided by DMC and/or its affiliates’ employees. This amount is included on the “Statement of operations” under “Legal fees.”
Trustees’ fees include expenses accrued by the Series for each Trustee’s retainer and meeting fees. Certain officers of DMC, DIFSC, and DDLP are officers and/or Trustees of the Trust. These officers and Trustees are paid no compensation by the Series.
Small Cap Value Series-14
Delaware VIP® Small Cap Value Series
Notes to financial statements (continued)
2. Investment Management, Administration Agreements, and Other Transactions with Affiliates (continued)
In addition to the management fees and other expenses of the Series, the Series indirectly bears the investment management fees and other expenses of the Underlying Fund. The amount of these fees and expenses incurred indirectly by the Series will vary based upon the expense and fee levels of the Underlying Fund and the amount of shares that are owned of the Underlying Fund at different times.
3. Investments
For the year ended Dec. 31, 2018, the Series made purchases and sales of investment securities other than short-term investments as follows:
| | | | |
Purchases | | $ | 217,568,540 | |
Sales | | | 244,566,933 | |
The tax cost of investments includes adjustments to net unrealized appreciation (depreciation) which may not necessarily be final tax cost basis adjustments, but approximate the tax basis unrealized gains and losses that may be realized and distributed to shareholders. At Dec. 31, 2018, the cost and unrealized appreciation (depreciation) of investments for federal income tax purposes for the Fund were as follows:
| | | | | | |
| | | Aggregate
Unrealized | | Aggregate
Unrealized | | Net Unrealized |
| Cost of | | Appreciation | | Depreciation | | Appreciation |
| Investments | | of Investments | | of Investments | | of Investments |
| $913,237,462 | | $256,459,685 | | $(114,085,281) | | $142,374,404 |
US GAAP defines fair value as the price that the Series would receive to sell an asset or pay to transfer a liability in an orderly transaction between market participants at the measurement date under current market conditions. A three-level hierarchy for fair value measurements has been established based upon the transparency of inputs to the valuation of an asset or liability. Inputs may be observable or unobservable and refer broadly to the assumptions that market participants would use in pricing the asset or liability. Observable inputs reflect the assumptions market participants would use in pricing the asset or liability based on market data obtained from sources independent of the reporting entity. Unobservable inputs reflect the reporting entity’s own assumptions about the assumptions that market participants would use in pricing the asset or liability based on the best information available under the circumstances. The Series’ investment in its entirety is assigned a level based upon the observability of the inputs which are significant to the overall valuation. The three-level hierarchy of inputs is summarized below.
| | | | |
| Level 1 | | – | | Inputs are quoted prices in active markets for identical investments. (Examples: equity securities,open-end investment companies, futures contracts, exchange-traded options contracts) |
| Level 2 | | – | | Other observable inputs, including, but not limited to: quoted prices for similar assets or liabilities in markets that are active, quoted prices for identical or similar assets or liabilities in markets that are not active, inputs other than quoted prices that are observable for the assets or liabilities (such as interest rates, yield curves, volatilities, prepayment speeds, loss severities, credit risks and default rates), or other market-corroborated inputs. (Examples: debt securities, government securities, swap contracts, foreign currency exchange contracts, foreign securities utilizing international fair value pricing, broker-quoted securities, fair valued securities) |
| Level 3 | | – | | Significant unobservable inputs, including the Series’ own assumptions used to determine the fair value of investments. (Examples: broker-quoted securities, fair valued securities) |
Level 3 investments are valued using significant unobservable inputs. The Series may also use an income-based valuation approach in which the anticipated future cash flows of the investment are discounted to calculate fair value. Discounts may also be applied due to the nature or duration of any restrictions on the disposition of the investments. Valuations may also be based upon current market prices of securities that are comparable in coupon, rating, maturity, and industry. The derived value of a Level 3 investment may not represent the value which is received upon disposition and this could impact the results of operations.
The following table summarizes the valuation of the Series’ investments by fair value hierarchy levels as of Dec. 31, 2018:
| | | | | | | | | | | | |
| Securities | | Level 1 | | | Level 2 | | | Total | |
Assets: | | | | | | | | | | | | |
Common Stock | | $ | 1,028,446,572 | | | $ | — | | | $ | 1,028,446,572 | |
Short-Term Investments | | | — | | | | 27,165,294 | | | | 27,165,294 | |
| | | | | | | | | | | | |
Total Value of Securities | | $ | 1,028,446,572 | | | $ | 27,165,294 | | | $ | 1,055,611,866 | |
| | | | | | | | | | | | |
During the year ended Dec. 31, 2018, there were no transfers between Level 1 investments, Level 2 investments, or Level 3 investments that had a significant impact to the Series. The Series’ policy is to recognize transfers between levels based on fair value at the beginning of the reporting period.
A reconciliation of Level 3 investments is presented when the Series has a significant amount of Level 3 investments at the beginning, interim, or end of the period in relation to the Series’ net assets. During the year ended Dec. 31, 2018, there were no Level 3 investments.
Small Cap Value Series-15
Delaware VIP® Small Cap Value Series
Notes to financial statements (continued)
4. Dividend and Distribution Information
Income and long-term capital gain distributions are determined in accordance with federal income tax regulations, which may differ from US GAAP. Additionally, distributions from net short-term gains on sales of investment securities are treated as ordinary income for federal income tax purposes. The tax character of dividends and distributions paid during the year ended Dec. 31, 2018 and 2017 was as follows:
| | | | | | | | |
| | | Year ended | |
| | | 12/31/18 | | | 12/31/17 | |
Ordinary income | | $ | 9,763,552 | | | $ | 8,871,377 | |
Long-term capital gains | | | 88,039,040 | | | | 42,467,623 | |
| | | | | | | | |
Total | | $ | 97,802,592 | | | $ | 51,339,000 | |
| | | | | | | | |
|
5. Components of Net Assets on a Tax Basis |
As of Dec. 31, 2018, the components of net assets on a tax basis were as follows: |
| | | | |
Shares of beneficial interest | | $ | 809,869,215 | |
Undistributed ordinary income | | | 16,150,892 | |
Undistributed long-term capital gains | | | 89,747,810 | |
Net unrealized appreciation on investments | | | 142,374,404 | |
| | | | |
Net assets | | $ | 1,058,142,321 | |
| | | | |
The differences between book basis and tax basis components of net assets are primarily attributable to tax deferral of losses on wash sales.
6. Capital Shares
Transactions in capital shares were as follows:
| | | | | | | | |
| | | Year ended | |
| | | 12/31/18 | | | 12/31/17 | |
Shares sold: | | | | | | | | |
Standard Class | | | 1,231,914 | | | | 1,225,082 | |
Service Class | | | 2,036,658 | | | | 2,075,925 | |
Shares issued upon reinvestment of dividends and distributions: | | | | | | | | |
Standard Class | | | 859,679 | | | | 474,031 | |
Service Class | | | 1,661,804 | | | | 845,632 | |
| | | | | | | | |
| | | 5,790,055 | | | | 4,620,670 | |
| | | | | | | | |
Shares redeemed: | | | | | | | | |
Standard Class | | | (1,473,380 | ) | | | (2,185,399 | ) |
Service Class | | | (2,248,735 | ) | | | (2,892,751 | ) |
| | | | | | | | |
| | | (3,722,115 | ) | | | (5,078,150 | ) |
| | | | | | | | |
Net increase (decrease) | | | 2,067,940 | | | | (457,480 | ) |
| | | | | | | | |
7. Line of Credit
The Series, along with certain other funds in the Delaware Funds (Participants), was a participant in a revolving line of credit intended to be used for temporary or emergency purposes as an additional source of liquidity to fund redemptions of investor shares. The revolving line of credit available was reduced from $155,000,000 to $130,000,0000 on Sept. 6, 2018. Under the agreement, the Participants were charged an annual commitment fee of 0.15%, which was allocated across the Participants based on a weighted average of the respective net assets of each Participant. The Participants were permitted to borrow up to a maximum ofone-third of their net assets under the agreement. Each Participant was individually, and not jointly, liable for its particular advances, if any, under the line of credit. The line of credit available under the agreement expired on Nov. 5, 2018.
On Nov. 5, 2018, the Participants entered into an amendment to the agreement for a $190,000,000 revolving line of credit. The revolving line of credit available was increased from $190,000,000 to $220,000,000 on Nov. 29, 2018. The revolving line of credit is to be used as described above and operates in substantially the same manner as the original agreement. The line of credit available under the agreement expires on Nov. 4, 2019.
The Series had no amounts outstanding as of Dec. 31, 2018, or at any time during the year then ended.
Small Cap Value Series-16
Delaware VIP® Small Cap Value Series
Notes to financial statements (continued)
8. Offsetting
Master Repurchase Agreements
Repurchase agreements are entered into by the Series under master repurchase agreements (each, an MRA). The MRA permits the Series, under certain circumstances including an event of default (such as bankruptcy or insolvency), to offset payables and/or receivables with collateral held by and/or posted to the counterparty. As a result, one single net payment is created. Bankruptcy or insolvency laws of a particular jurisdiction may impose restrictions on or prohibitions against such a right of offset in the event of the MRA counterparty’s bankruptcy or insolvency. Based on the terms of the MRA, the Series receives securities as collateral with a market value in excess of the repurchase price at maturity. Upon a bankruptcy or insolvency of the MRA counterparty, the Series would recognize a liability with respect to such excess collateral. The liability reflects the Series’ obligation under bankruptcy law to return the excess to the counterparty.
As of Dec. 31, 2018, the following table is a summary of the Series’ repurchase agreements by counterparty which are subject to offset under an MRA:
| | | | | | | | | | | | | | | | | | | | |
Counterparty | | Repurchase
Agreements | | Fair Value of
Non-Cash
Collateral Received(a)
| | Cash Collateral
Received | | Net Collateral
Received |
Bank of America Merrill Lynch | | | | $ 2,612,999 | | | | | $ — | | | | | $(2,612,999) | | | | | $ (2,612,999) | |
Bank of Montreal | | | | 7,185,748 | | | | | (7,185,748) | | | | | — | | | | | (7,185,748) | |
BNP Paribas | | | | 11,749,951 | | | | | (11,749,951) | | | | | — | | | | | (11,749,951) | |
| | | | | | | | | | | | | | | | | | | | |
Total | | | | $21,548,698 | | | | | $(18,935,699) | | | | | $(2,612,999) | | | | | $(21,548,698) | |
| | | | | | | | | | | | | | | | | | | | |
(a)The value of the related collateral received exceeded the value of the repurchase agreements as of Dec. 31, 2018.
(b)Net exposure represents the receivable (payable) that would be due from (to) the counterparty in an event of default.
9. Securities Lending
The Series, along with other funds in the Delaware Funds, may lend its securities pursuant to a security lending agreement (Lending Agreement) with The Bank of New York Mellon (BNY Mellon). At the time a security is loaned, the borrower must post collateral equal to the required percentage of the market value of the loaned security, including any accrued interest. The required percentage is: (1) 102% with respect to US securities and foreign securities that are denominated and payable in US dollars; and (2) 105% with respect to foreign securities. With respect to each loan, if on any business day, the aggregate market value of securities collateral plus cash collateral held is less than the aggregate market value of the securities which are the subject of such loan, the borrower will be notified to provide additional collateral by the end of the following business day which, together with the collateral already held, will be not less than the applicable initial collateral requirements for such security loan. If the aggregate market value of securities collateral and cash collateral held with respect to a security loan exceeds the applicable initial collateral requirement, upon the request of the borrower, BNY Mellon must return enough collateral to the borrower by the end of the following business day to reduce the value of the remaining collateral to the applicable initial collateral requirement for such security loan. As a result of the foregoing, the value of the collateral held with respect to a loaned security on any particular day may be more or less than the value of the security on loan. The collateral percentage with respect to the market value of the loaned security is determined by the security lending agent.
Cash collateral received by each series is generally invested in a series of individual separate accounts, each corresponding to a series. The investment guidelines permit each separate account to hold certain securities that would be considered eligible securities for a money market fund. Cash collateral received is generally invested in government securities; certain obligations issued by government sponsored enterprises; repurchase agreements collateralized by US Treasury securities; obligations issued by the central government of any Organization for Economic Cooperation and Development (OECD) country or its agencies, instrumentalities, or establishments; obligations of supranational organizations; commercial paper, notes, bonds, and other debt obligations; certificates of deposit, time deposits, and other bank obligations; and asset-backed securities. A series can also accept US government securities and letters of credit(non-cash collateral) in connection with securities loans.
In the event of default or bankruptcy by the lending agent, realization and/or retention of the collateral may be subject to legal proceedings. In the event the borrower fails to return loaned securities and the collateral received is insufficient to cover the value of the loaned securities and provided such collateral shortfall is not the result of investment losses, the lending agent has agreed to pay the amount of the shortfall to the Series or, at the discretion of the lending agent, replace the loaned securities. The Series continues to record dividends or interest, as applicable, on the securities loaned and is subject to changes in value of the securities loaned that may occur during the term of the loan. The Series has the right under the Lending Agreement to recover the securities from the borrower on demand. With respect to security loans collateralized bynon-cash collateral, the Series receives loan premiums paid by the borrower. With respect to security loans collateralized by cash collateral, the earnings from the collateral investments are shared among the Series, the security lending agent, and the borrower. The Series records security lending income net of allocations to the security lending agent and the borrower.
Small Cap Value Series-17
Delaware VIP® Small Cap Value Series
Notes to financial statements (continued)
9. Securities Lending (continued)
The Series may incur investment losses as a result of investing securities lending collateral. This could occur if an investment in the collateral investment account defaulted or became impaired. Under those circumstances, the value of a Series’ cash collateral account may be less than the amount the Series would be required to return to the borrowers of the securities and the Series would be required to make up for this shortfall.
During the year ended Dec. 31, 2018, the Series had no securities out on loan.
10. Credit and Market Risk
The Series invests a significant portion of its assets in small companies and may be subject to certain risks associated with ownership of securities of such companies. Investments in small sized companies may be more volatile than investments in larger companies for a number of reasons, which include limited financial resources or a dependence on narrow product lines.
The Series invests in REITs and is subject to the risks associated with that industry. If the Series holds real estate directly as a result of defaults or receives rental income directly from real estate holdings, its tax status as a regulated investment company may be jeopardized. There were no direct real estate holdings during the year ended Dec. 31, 2018. The Series’ REIT holdings are also affected by interest rate changes, particularly if the REITs it holds use floating rate debt to finance their ongoing operations.
The Series may invest up to 10% of its net assets in illiquid securities, which may include securities with contractual restrictions on resale, securities exempt from registration under Rule 144A, promulgated under the Securities Act of 1933, as amended, and other securities which may not be readily marketable. The relative illiquidity of these securities may impair the Series from disposing of them in a timely manner and at a fair price when it is necessary or desirable to do so. While maintaining oversight, the Board has delegated to DMC, theday-to-day functions of determining whether individual securities are liquid for purposes of the Series’ limitation on investments in illiquid securities. Securities eligible for resale pursuant to Rule 144A, which are determined to be liquid, are not subject to the Series’ 10% limit on investments in illiquid securities. As of Dec. 31, 2018, there were no Rule 144A securities held by the Series. Restricted securities are valued pursuant to the security valuation procedures described in Note 1.
11. Contractual Obligations
The Series enters into contracts in the normal course of business that contain a variety of indemnifications. The Series’ maximum exposure under these arrangements is unknown. However, the Series has not had prior claims or losses pursuant to these contracts. Management has reviewed the Series’ existing contracts and expects the risk of loss to be remote.
12. Recent Accounting Pronouncements
In August 2018, the FASB issued an Accounting Standards Update, ASU2018-13, which changes certain fair value measurement disclosure requirements. The ASU2018-13, in addition to other modifications and additions, removes the requirement to disclose the amount and reasons for transfers between Level 1 and Level 2 of the fair value hierarchy, the policy for the timing of transfers between levels and the valuation process for Level 3 fair value measurements. The ASU2018-13 is effective for fiscal years, and interim periods within those fiscal years, beginning after Dec. 15, 2019. At this time, management is evaluating the implications of these changes on the financial statements.
In August 2018, the Securities and Exchange Commission (SEC) adopted amendments to RegulationS-X to update and simplify the disclosure requirements for registered investment companies by eliminating requirements that are redundant or duplicative of US GAAP requirements or other SEC disclosure requirements. The new amendments require the presentation of the total, rather than the components, of distributable earnings on the “Statement of assets and liabilities” and the total, rather than the components, of dividends from net investment income and distributions from net realized gains on the “Statements of changes in net assets.” The amendments also removed the requirement for the parenthetical disclosure of undistributed net investment income on the “Statements of changes in net assets” and certain tax adjustments that were reflected in the “Notes to financial statements.” All of these have been reflected in the Series financial statements.
13. Subsequent Events
Management has determined that no material events or transactions occurred subsequent to Dec. 31, 2018, that would require recognition or disclosure in the Series’ financial statements.
Small Cap Value Series-18
Delaware VIP® Trust — Delaware VIP Small Cap Value Series
Report of independent registered public accounting firm
To the Board of Trustees of Delaware VIP® Trust and Shareholders of Delaware VIP Small Cap Value Series
Opinion on the Financial Statements
We have audited the accompanying statement of assets and liabilities, including the schedule of investments, of Delaware VIP Small Cap Value Series (one of the series constituting Delaware VIP® Trust, referred to hereafter as the “Series”) as of December 31, 2018, the related statement of operations for the year ended December 31, 2018, the statements of changes in net assets for each of the two years in the period ended December 31, 2018, including the related notes, and the financial highlights for each of the five years in the period ended December 31, 2018 (collectively referred to as the “financial statements”). In our opinion, the financial statements present fairly, in all material respects, the financial position of the Series as of December 31, 2018, the results of its operations for the year then ended, the changes in its net assets for each of the two years in the period ended December 31, 2018 and the financial highlights for each of the five years in the period ended December 31, 2018 in conformity with accounting principles generally accepted in the United States of America.
Basis for Opinion
These financial statements are the responsibility of the Series’ management. Our responsibility is to express an opinion on the Series’ financial statements based on our audits. We are a public accounting firm registered with the Public Company Accounting Oversight Board (United States) (PCAOB) and are required to be independent with respect to the Series in accordance with the U.S. federal securities laws and the applicable rules and regulations of the Securities and Exchange Commission and the PCAOB.
We conducted our audits of these financial statements in accordance with the standards of the PCAOB. Those standards require that we plan and perform the audit to obtain reasonable assurance about whether the financial statements are free of material misstatement, whether due to error or fraud.
Our audits included performing procedures to assess the risks of material misstatement of the financial statements, whether due to error or fraud, and performing procedures that respond to those risks. Such procedures included examining, on a test basis, evidence regarding the amounts and disclosures in the financial statements. Our audits also included evaluating the accounting principles used and significant estimates made by management, as well as evaluating the overall presentation of the financial statements. Our procedures included confirmation of securities owned as of December 31, 2018 by correspondence with the custodian and brokers. We believe that our audits provide a reasonable basis for our opinion.
/s/PricewaterhouseCoopers LLP
Philadelphia, Pennsylvania
February 14, 2019
We have served as the auditor of one or more investment companies in Delaware Funds® by Macquarie since 2010.
Small Cap Value Series-19
Delaware VIP® Trust — Delaware VIP Small Cap Value Series
Other Series information (Unaudited)
Board consideration of investment advisory agreement for Delaware VIP Small Cap Value Series
At a meeting held on Aug.15-16, 2018 (the “Annual Meeting”), the Board of Trustees (the “Board”), including a majority of disinterested or independent Trustees, approved the renewal of the Investment Advisory Agreement for Delaware VIP Small Cap Value Series (the “Series”). In making its decision, the Board considered information furnished at regular quarterly Board meetings, including reports detailing Series performance, investment strategies, and expenses, as well as information prepared specifically in connection with the renewal of the Investment Advisory Agreement. Information furnished specifically in connection with the renewal of the Investment Advisory Agreement with Delaware Management Company (“DMC”), a series of Macquarie Investment Management Business Trust (“MIMBT”), included materials provided by DMC and its affiliates (collectively, “Macquarie Investment Management”) concerning, among other things, the nature, extent, and quality of services provided to the Series; the costs of such services to the Series; economies of scale; and the investment manager’s financial condition and profitability. In addition, in connection with the Annual Meeting, materials were provided to the Trustees in May 2018, including reports provided by Broadridge Financial Solutions (“Broadridge”). The Broadridge reports compared the Series’ investment performance and expenses with those of other comparable mutual funds. The Independent Trustees reviewed and discussed the Broadridge reports with independent legal counsel to the Independent Trustees. In addition to the information noted above, the Board also requested and received information regarding DMC’s policy with respect to advisory fee levels and its breakpoint philosophy; the structure of portfolio manager compensation; comparative client fee information; and any constraints or limitations on the availability of securities for certain investment styles, which had in the past year inhibited, or which were likely in the future to inhibit, the investment manager’s ability to invest fully in accordance with Series policies
In considering information relating to the approval of the Series’ Investment Advisory Agreement, the Independent Trustees received assistance and advice from and met separately with independent legal counsel to the Independent Trustees and also received assistance and advice from an experienced and knowledgeable independent fund consultant, JDL Consultants, LLC (“JDL”). Although the Board gave attention to all information furnished, the following discussion identifies, under separate headings, the primary factors taken into account by the Board during its contract renewal considerations
Nature, extent, and quality of services.The Board considered the services provided by DMC to the Series and its shareholders. In reviewing the nature, extent, and quality of services, the Board considered reports furnished to it throughout the year, which covered matters such as the relative performance of the Series, compliance of portfolio managers with the investment policies, strategies and restrictions for the Series, compliance by DMC and Delaware Distributors, L.P. (together, “Management”) personnel with the Code of Ethics adopted throughout the Delaware Funds® by Macquarie (the “Delaware Funds”), and adherence to fair value pricing procedures as established by the Board. The Board was pleased with the current staffing of DMC and the emphasis placed on research in the investment process. The Board recognized DMC’s receipt of certain favorable industry distinctions during the past several years. The Board gave favorable consideration to DMC’s efforts to control expenses while maintaining service levels committed to Series matters. The Board was satisfied with the nature, extent, and quality of the overall services provided by DMC.
Investment performance.The Board placed significant emphasis on the investment performance of the Series in view of the importance of investment performance to shareholders. Although the Board considered performance reports and discussions with portfolio managers at Board meetings throughout the year, the Board gave particular weight to the Broadridge reports furnished for the Annual Meeting. The Broadridge reports prepared for the Series showed the investment performance of its Standard Class shares in comparison to a group of similar funds as selected by Broadridge (the “Performance Universe”). A fund with the best performance ranked first, and a fund with the poorest performance ranked last. The highest/best performing 25% of funds in the Performance Universe make up the first quartile; the next 25%, the second quartile; the next 25%, the third quartile; and the poorest/worst performing 25% of funds in the Performance Universe make up the fourth quartile. Comparative annualized performance for the Series was shown for the past1-,3-,5-, and10-year periods, as applicable, ended Jan. 31, 2018. The Board’s objective is that the Series’ performance for the1-,3-, and5-year periods be at or above the median of its Performance Universe.
Broadridge currently classifies the Series as asmall-cap core fund. However, Management believes that, because the Series utilizes a value investment philosophy and process, it would be more appropriate to include the Series in thesmall-cap value funds category. Accordingly, the Broadridge report prepared for the Series compares the Series’ performance to two separate Performance Universes — one, consisting of allsmall-cap core funds underlying variable insurance products, and the other, consisting of allsmall-cap value funds underlying variable insurance products. When compared to othersmall-cap core funds, the Broadridge report comparison showed that the Series’ total return for the1-year period was in the third quartile of its Performance Universe. The report further showed that the Series’ total return for the3- and10-year periods was in the first quartile of its Performance Universe and the Series’ total return for the5-year period was in the second quartile of its Performance Universe. When compared to othersmall-cap value funds, the Broadridge report comparison showed that the Series’ total return for the1-,3-,5-, and10-year periods was in the first quartile of its Performance Universe. The Board was satisfied with performance.
Comparative expenses.The Board considered expense data for the Delaware Funds. Management provided the Board with information on pricing levels and fee structures for the Series as of its most recently completed fiscal year. The Board also focused on the comparative analysis of effective management fees and total expense ratios of the Series versus effective management fees and expense ratios of a group of similar funds as selected by Broadridge (the “Expense Group”). In reviewing comparative costs, the Series’ contractual management fee and the actual management fee incurred by the Series were
Small Cap Value Series-20
Delaware VIP® Trust — Delaware VIP Small Cap Value Series
Other Series information (Unaudited)
Board consideration of investment advisory agreement for Delaware VIP Small Cap Value Series (continued)
compared with the contractual management fees (assuming all funds in the Expense Group were similar in size to the Series) and actual management fees (as reported by each fund) within the Expense Group, taking into account any applicable breakpoints and fee waivers. The Series’ total expenses were also compared with those of its Expense Group. The Broadridge total expenses, for comparative consistency, were shown by Broadridge for Standard Class shares which do not charge12b-1 andnon-12b-1 service fees. The Board’s objective is for the Series’ total expense ratio to be competitive with those of the peer funds within its Expense Group.
When compared to othersmall-cap core funds andsmall-cap value funds, the expense comparisons for the Series showed that the actual management fee and total expenses were in the quartile with the lowest expenses of its Expense Group. The Board was satisfied with the management fee and total expenses of the Series in comparison to those of its Expense Groups.
Management profitability.The Board considered the level of profits realized by DMC in connection with the operation of the Series. In this respect, the Board reviewed the Investment Management Profitability Analysis that addressed the overall profitability of DMC’s business in providing management and other services to each of the individual funds and the Delaware Funds as a whole. Specific attention was given to the methodology used by DMC in allocating costs for the purpose of determining profitability. Management stated that the level of profits of DMC, to a certain extent, reflects recent operational cost savings and efficiencies initiated by DMC. The Board considered DMC’s efforts to improve services provided to Fund shareholders and to meet additional regulatory and compliance requirements resulting from recent industry-wide Securities and Exchange Commission initiatives. The Board also considered the extent to which DMC might derive ancillary benefits from fund operations, including the potential for procuring additional business as a result of the prestige and visibility associated with its role as service provider to the Delaware Funds and the benefits from allocation of fund brokerage to improve trading efficiencies. As part of its work, the Board also reviewed a report prepared by JDL regarding MIMBT profitability as compared to certain peer fund complexes and the Independent Trustees met with JDL personnel to discuss DMC’s profitability in such context. The Board found that the management fees were reasonable in light of the services rendered and the profitability of DMC.
Economies of scale andfall-out benefits.The Trustees considered whether economies of scale are realized by DMC as the Series’ assets increase and the extent to which any economies of scale are reflected in the level of management fees charged. The Trustees reviewed the Series’ advisory fee pricing and structure approved by the Board and shareholders, which includes breakpoints, and which applies to most funds in the Delaware Funds complex. Breakpoints in the advisory fee occur when the advisory fee rate is reduced on assets in excess of specified levels. Breakpoints result in a lower advisory fee, than would otherwise be the case in the absence of breakpoints, when the asset levels specified in the breakpoints are exceeded. The Board noted that, as of March 31, 2018, the Series’ assets exceeded the second breakpoint level. The Board believed that, given the extent to which economies of scale might be realized by DMC and its affiliates, the schedule of fees under the Investment Management Agreement provides a sharing of benefits with the Series and its shareholders.
Tax Information
All disclosures are based on financial information available as of the date of this annual report and, accordingly are subject to change. For any and all items requiring reporting, it is the intention of the Series to report the maximum amount permitted under the Internal Revenue Code and the regulations thereunder.
For the year ended Dec. 31, 2018, the Series reports distributions paid during the year as follows:
| | | | | | | | |
| | | (A)
Long-Term
Capital Gains
Distributions
(Tax Basis) | | (B)
Ordinary Income
Distributions
(Tax Basis) | | Total
Distributions
(Tax Basis) | | (C)
Qualified
Dividends1 |
| | 90.02% | | 9.98% | | 100.00% | | 99.97% |
(A) and (B) are based on a percentage of the Series’ total distributions.
(C) is based on a percentage of the Series’ ordinary income distributions.
1Qualified dividends represent dividends which qualify for the corporate dividends received deduction.
Small Cap Value Series-21
Delaware Funds® by Macquarie
Board of trustees / directors and officers addendum
A mutual fund is governed by a Board of Trustees/Directors (“Trustees”), which has oversight responsibility for the management of a fund’s business affairs. Trustees establish procedures and oversee and review the performance of the investment manager, the distributor, and others who perform services for the fund. The independent fund trustees, in particular, are advocates for shareholder interests. Each trustee has served in that capacity since he or she was elected to or appointed to the Board of Trustees, and will continue to serve until his or her retirement or the election of a new trustee in his or her place. The following is a list of the Trustees and Officers with certain background and related information.
| | | | | | | | | | |
Name, Address, and Birth Date | | Position(s) Held with Fund(s) | | Length of Time Served | | Principal Occupation(s) During the Past Five Years | | Number of Portfolios in Fund Complex Overseen by Trustee or Officer | | Other Directorships Held by Trustee or Officer |
| INTERESTED TRUSTEE | | | | | | | | | | |
| | | | | |
Shawn K. Lytle1,3 2005 Market Street Philadelphia, PA 19103 February 1970 | | President, Chief Executive Officer, and Trustee | | President and Chief Executive Officer since August 2015 Trustee since September 2015 | | President — Macquarie Investment Management2(June 2015-Present) Regional Head of Americas — UBS Global Asset Management (April 2010-May 2015) | | 59 | | Trustee — UBS Relationship Funds, SMA Relationship Trust, and UBS Funds (May 2010–April 2015) |
INDEPENDENT TRUSTEES | | | | | | | | | | |
Thomas L. Bennett 2005 Market Street Philadelphia, PA 19103 October 1947 | | Chair and Trustee | | Trustee since March 2005 Chair since March 2015 | | Private Investor
(March 2004–Present) | | 59 | | None |
Jerome D. Abernathy 2005 Market Street Philadelphia, PA 19103 July 1959 | | Trustee | | Since January 2019 | | Managing Member, Stonebrook Capital Management, LLC (financial technology: macro factors and databases) (January 1993–Present) | | 59 | | None |
Ann D. Borowiec 2005 Market Street Philadelphia, PA 19103 November 1958 | | Trustee | | Since March 2015 | | Chief Executive Officer, Private Wealth Management (2011–2013) and Market Manager, New Jersey Private Bank (2005–2011) — J.P. Morgan Chase & Co. | | 59 | | Director — Banco Santander International(October 2016-Present) Director — Santander Bank, N.A. (December 2016-Present) |
Joseph W. Chow 2005 Market Street Philadelphia, PA 19103 January 1953 | | Trustee | | Since January 2013 | | Private Investor (April 2011–Present) | | 59 | | Director and Audit Committee Member — Hercules Technology Growth Capital, Inc. (July 2004–July 2014) |
John A. Fry 2005 Market Street Philadelphia, PA 19103 May 1960 | | Trustee | | Since January 2001 | | President — Drexel University (August 2010–Present) President — Franklin & Marshall College (July 2002–July 2010) | | 59 | | Director; Compensation Committee and Governance Committee Member — Community Health Systems Director — Drexel Morgan & Co. Director and Audit Committee Member — vTv Therapeutics LLC Director and Audit Committee Member — FS Credit Real Estate Income Trust, Inc. |
Lucinda S. Landreth 2005 Market Street Philadelphia, PA 19103 June 1947 | | Trustee | | Since March 2005 | | Private Investor (2004–Present) | | 59 | | None |
Small Cap Value Series-22
| | | | | | | | | | |
Name, Address, and Birth Date | | Position(s) Held with Fund(s) | | Length of Time Served | | Principal Occupation(s) During the Past Five Years | | Number of Portfolios in Fund Complex Overseen by Trustee or Officer | | Other Directorships Held by Trustee or Officer |
| | | | | |
Frances A. Sevilla-Sacasa 2005 Market Street Philadelphia, PA 19103 January 1956 | | Trustee | | Since September 2011 | | Private Investor (January 2017-Present) Chief Executive Officer — Banco Itaú International (April 2012–December 2016) Executive Advisor to Dean (August 2011–March 2012) and Interim Dean (January 2011–July 2011) — University of Miami School of Business Administration President — U.S. Trust, Bank of America Private Wealth Management (Private Banking) (July 2007–December 2008) | | 59 | | Trust Manager and Audit Committee Chair — Camden Property Trust (August 2011-Present) Director — Carrizo Oil & Gas,Inc. (March 2018-Present) |
Thomas K. Whitford 2005 Market Street Philadelphia, PA 19103 March 1956 | | Trustee | | Since January 2013 | | Vice Chairman (2010–April 2013) — PNC Financial Services Group | | 59 | | Director — HSBC North America Holdings Inc. (December 2013-Present) Director — HSBC USA Inc. (July 2014-Present) Director — HSBC Bank USA, National Association (July 2014-March 2017) Director — HSBC Finance Corporation (December 2013-April 2018) |
Christianna Wood 2005 Market Street Philadelphia, PA 19103 March 1956 | | Trustee | | Since January 2019 | | Chief Executive Officer and President — Gore Creek Capital, Ltd. (August 2009–Present) | | 59 | | Director and Audit Committee Member — H&R Block Corporation (July 2008-Present) Director and Audit Committee Member — Grange Insurance (2013-Present) Trustee and Audit Committee Member — The Merger Fund (2013-Present), The Merger Fund VL (2013-Present); WCM Alternatives: Event-Driven Fund (2013-Present), and WCM Alternatives: Credit Event Fund (December 2017-Present) Director — International Securities Exchange (2010-2016) |
Janet L. Yeomans 2005 Market Street Philadelphia, PA 19103 July 1948 | | Trustee | | Since April 1999 | | Vice President and Treasurer (January 2006–July 2012), Vice President — Mergers & Acquisitions (January 2003–January 2006), and Vice President and Treasurer (July 1995–January 2003) — 3M Company | | 59 | | Director; Personnel and Compensation Committee Chair; Member of Nominating, Investments, and Audit Committees for various periods throughout directorship — Okabena Company (2009-2017) |
Small Cap Value Series-23
| | | | | | | | | | |
Name, Address, and Birth Date | | Position(s) Held with Fund(s) | | Length of Time Served | | Principal Occupation(s) During the Past Five Years | | Number of Portfolios in Fund Complex Overseen by Trustee or Officer | | Other Directorships Held by Trustee or Officer |
OFFICERS | | | | | | | | | | |
David F. Connor 2005 Market Street Philadelphia, PA 19103 December 1963 | | Senior Vice President, General Counsel, and Secretary | | Senior Vice President, since May 2013; General Counsel since May 2015; Secretary since October 2005 | | David F. Connor has served in various capacities at different times at Macquarie Investment Management. | | 59 | | None3 |
Daniel V. Geatens 2005 Market Street Philadelphia, PA 19103 October 1972 | | Vice President and Treasurer | | Vice President and Treasurer since October 2007 | | Daniel V. Geatens has served in various capacities at different times at Macquarie Investment Management. | | 59 | | None3 |
Richard Salus 2005 Market Street Philadelphia, PA 19103 October 1963 | | Senior Vice President and Chief Financial Officer | | Senior Vice President and Chief Financial Officer since November 2006 | | Richard Salus has served in various capacities at different times at Macquarie Investment Management. | | 59 | | None3 |
| 1 | Shawn K. Lytle is considered to be an “Interested Trustee” because he is an executive officer of the Fund’s(s’) investment advisor. |
| 2 | Macquarie Investment Management is the marketing name for Macquarie Management Holdings, Inc. and its subsidiaries, including the Fund’s(s’) investment advisor, principal underwriter, and its transfer agent. |
| 3 | Shawn K. Lytle, David F. Connor, Daniel V. Geatens, and Richard Salus serve in similar capacities for the six portfolios of the Optimum Fund Trust, which have the same investment advisor, principal underwriter, and transfer agent as the registrant. Mr. Geatens also serves as the Chief Financial Officer and Treasurer for Macquarie Global Infrastructure Total Return Fund Inc., which has an affiliated investment manager. |
The Statement of Additional Information for the Fund(s) includes additional information about the Trustees and Officers and is available, without charge, upon request by calling 800523-1918.
Small Cap Value Series-24
| | | | |
| | The Series files its complete schedule of portfolio holdings with the Securities and Exchange Commission (SEC) for the first and third quarters of each fiscal year on FormN-Q. The Series’ FormsN-Q, as well as a description of the policies and procedures that the Series uses to determine how to vote proxies (if any) relating to portfolio securities are available without charge (i) upon request, by calling 800523-1918; and (ii) on the SEC’s website at sec.gov. In addition, a description of the policies and procedures that the Series uses to determine how to vote proxies (if any) relating to portfolio securities and the Schedule of Investments included in the Series’ most recent FormN-Q are available without charge on the Series’ website at delawarefunds.com/vip/literature. The Series’ FormsN-Q may be reviewed and copied at the SEC’s Public Reference Room in Washington, DC; information on the operation of the Public Reference Room may be obtained by calling 800SEC-0330. Information (if any) regarding how the Series voted proxies relating to portfolio securities during the most recently disclosed12-month period ended June 30 is available without charge (i) through the Series’ website at delawarefunds.com/proxy; and (ii) on the SEC’s website at sec.gov. | | |
| | |
| AR-VIPSCV 22046 (2/19) (730130) | | Small Cap Value Series-25 |
| | |
| | |

| |  |
| | |
| | |
| | |
| | |
| | |
| | |
| | |
| | |
| | |
| | |
| | |
| | |
| | |
| | |
| | |
| | |
| | |
| | |
| | |
| | |
| | |
| | Annual report |
| | |
Delaware VIP® Trust
Delaware VIP U.S. Growth Series
December 31, 2018
Table of contents
Other than Macquarie Bank Limited (MBL), none of the entities noted are authorized deposit-taking institutions for the purposes of the Banking Act 1959 (Commonwealth of Australia). The obligations of these entities do not represent deposits or other liabilities of MBL. MBL does not guarantee or otherwise provide assurance in respect of the obligations of these entities, unless noted otherwise. The Series is governed by US laws and regulations.
Unless otherwise noted, views expressed herein are current as of Dec. 31, 2018, and subject to change for events occurring after such date.
The Series is not FDIC insured and is not guaranteed. It is possible to lose the principal amount invested.
Advisory services provided by Delaware Management Company, a series of Macquarie Investment Management Business Trust (MIMBT) , a US registered investment advisor.
The Series is distributed byDelaware Distributors, L.P., an affiliate of MIMBT and Macquarie Group Limited. Macquarie Investment Management (MIM), a member of Macquarie Group, refers to the companies comprising the asset management division of Macquarie Group Limited and its subsidiaries and affiliates worldwide.
This material may be used in conjunction with the offering of shares in Delaware VIP U.S. Growth Series only if preceded or accompanied by the Series’ current prospectus or the summary prospectus.
© 2019 Macquarie Management Holdings, Inc.
All third-party marks cited are the property of their respective owners.
| | |
| Delaware VIP®Trust — Delaware VIP U.S. Growth Series |
| Portfolio management review | | January 8, 2019 |
Jackson Square Partners, LLC (JSP), a US registered investment advisor, is thesub-advisor to Delaware VIP U.S. Growth Series (the “Series”). Assub-advisor, JSP is responsible forday-to-day management of the Series’ assets. Although JSP serves assub-advisor, the investment manager, Delaware Management Company (DMC), a series of Macquarie Investment Management Business Trust (MIMBT) has ultimate responsibility for all investment advisory services.
For the fiscal year ended Dec. 31, 2018, the Series’ Standard Class shares declined 3.00% and Service Class shares fell 3.29%. Both figures reflect all distributions reinvested. For the same period, the Series’ benchmark, the Russell 1000® Growth Index, declined 1.51%.
US stock performance was increasingly volatile in 2018, as the S&P 500® Index returned-4.38% despite still-healthy US economic underpinnings. Stocks rose in January, sold off in early February and then regained momentum throughout the summer and early fall. However, the market mood changed abruptly in early October, as investors grew increasingly nervous about slowing global growth, US Federal Reserve rate hikes, escalatingUS-China trade tensions and political turbulence in Europe.
A robust labor market fueled US growth. The unemployment rate fell to below 4% – its lowest level since 1969 – consumer confidence reached an18-year high, and the economy grew at its fastest pace since 2014, with an annualized second-quarter expansion of 4.2%. (Sources: US Bureau of Labor Statistics, US Bureau of Economic Analysis.) The Fed’s four quarterly rate hikes brought the federal funds target rate up to a range of 2.25% to 2.5% by year end.
The housing market, after expanding for nearly 10 years, began to wane, as rising house prices and mortgage rates combined with salary stagnation led potential homebuyers to hold off. Residential investment declined, as did existing- andnew-home sales. (Sources: US Census Bureau and the US Department of Housing and Urban Development.)
An unprecedented surge in US crude oil and natural gas production during the fiscal year, made possible by shale development, led to record US exports. Oil prices crept steadily higher until expanding US crude inventories and a lowered estimate for global demand by the Organization of the Petroleum Exporting Countries, caused prices to tumble in October. The price of West Texas Intermediate (WTI) crude oil tumbled 38% in the fourth quarter in a massive selloff. (Sources: Bloomberg, US Energy Information Administration.)
Trade tensions escalated after the United States imposed taxes on imports, including steel and aluminum, from China, Mexico, Canada, and the European Union. All four responded with retaliatory tariffs on US goods. The US, Canada, and Mexico, however, negotiated a new trade deal to replace the North American Free Trade Agreement, the United States-Mexico-Canada Agreement. But easily the most concerning was theUS-China trade confrontation, growing into a full-scale trade war, with negative economic consequences evident late in 2018.
The combination of a strong US dollar, rising US interest rates, and an escalating global trade war hurt overseas markets. International stocks fell 13.36% for the fiscal year, as measured by the MSCI EAFE (Europe, Australasia, Far East) Index (net). Emerging markets fared worse, losing 14.25% for the same period, as measured by the MSCI Emerging Markets Index (net).
Strong relative performance in information technology and financials was unable to overcome weak relative performance in consumer discretionary and health care. On a stock specific level, the following were the most significant contributors and detractors during the period.
Liberty Global Plc.detracted from performance during the period. Weaker-than-expected video subscriptions for US cable companies and COMCAST’s pursuit of Sky pushed investors to focus unduly on secular trends against cable in the US market despite meaningful differences in how the European market operates. Unlike the US, average revenue per user in Europe is 50% to 80% less expensive due to lower content cost inflation. Additionally, the European Commission has opened anin-depth investigation into Vodafone’s acquisition of Liberty Global’s businesses in the Czech Republic, Germany, Hungary, and Romania. While we believe this deal will be economically beneficial, the duration of the approval process and the unknown use of proceeds has created short-term uncertainty and pressured the stock. However, we do not believe this pressure will persist and continue to believe that Liberty Global has an advantaged network with sustainable pricing power in an industry that continues to consolidate.
DENTSPLY Sirona,a dental equipment maker and dental consumables producer, detracted from performance. Investors have been concerned about declining revenues in the US amid continued headwinds related to foreign exchange rates. Projected revenue and cost synergies from the integration of recent acquisitions have lagged expectations while investment spending has yet to bear fruit. Further, surprising management changes weakened our confidence in the original thesis. We believe these issues represented fundamental change and have exited the position.
TripAdvisor Holdings Inc., a travel website providing travel advice and planning features, contributed to performance. The company’s earnings reports have been positive, which management has attributed to the stabilization of its core business and lower online acquisition costs. TripAdvisor had accelerated growth in itsnon-hotel segment and has integrated third-party networks, such as delivery.com, into its website and mobile app, which we believe could drive longer-term synergies. We think the company is an undervalued asset based on its ability to attract almost 500 million interested travelers, and that TripAdvisor is worth more than recognized at its current valuation.
U.S. Growth Series.-1
| | |
| Delaware VIP®Trust — Delaware VIP U.S. Growth Series |
| Portfolio management review (continued) | | January 8, 2019 |
Mastercard Incorporated,a financial service corporation that facilitates electronic funds transfer, contributed to performance. The company has reported a string of positive earnings, most recently showing quarterly net revenues increasing 17% year on year. Additionally, during the period, the company revised higher its three-year performance estimates. We believe Mastercard’s operating margins will continue to expand in the near to mid term. More broadly, there is an inexorable global payment trend away from paper currency and checks toward electronic payments (credit and debit). We believe that Mastercard is well positioned to take advantage of this. Its revenues are based on transactions laid over an existing network with minimal incremental capital investment required, resulting in high incremental margins.
Regardless of the economic outcome, we remain consistent in our long-term investment philosophy: We want to own what we view as strong secular-growth companies with solid business models and competitive positions that we believe can grow market share and have the potential to deliver shareholder value in a variety of market environments.
| | |
| Unless otherwise noted, views expressed herein are current as of Dec. 31, 2018, and subject to change. | | |
| | U.S. Growth Series.-2 |
Delaware VIP® Trust — Delaware VIP U.S. Growth Series
Performance summary
The performance quoted represents past performance and does not guarantee future results. Investment return and principal value of an investment will fluctuate so that shares, when redeemed, may be worth more or less than their original cost. Current performance may be lower or higher than the performance quoted.
Carefully consider the Series’ investment objectives, risk factors, charges, and expenses before investing. This and other information can be found in the Series’ prospectus and its summary prospectus, which may be obtained by visiting delawarefunds.com/vip/literature or calling 800523-1918. Investors should read the prospectus and the summary prospectus carefully before investing.
| | | | | | | | | | | | |
| Delaware VIP U.S. Growth Series | | | | | | | | | | | | |
| Average annual total returns | | | | | | | | | | | | |
| For periods ended December 31, 2018 | | 1 year | | 3 years | | 5 years | | 10 years | | Lifetime | | |
| | | | | | |
Standard Class shares (commenced operations on Nov. 15, 1999) | | -3.00% | | +5.67% | | +7.00% | | +14.46% | | +3.76% | | |
| | | | | | | | | | | | |
| | | | | | | | | | | | |
Service Class shares (commenced operations on May 1, 2000) | | -3.29% | | +5.40% | | +6.71% | | +14.17% | | +3.12% | | |
| | | | | | | | | | | | |
| | | | | | | | | | | | |
Russell 1000 Growth Index | | -1.51% | | +11.15% | | +10.40% | | +15.29% | | n/a | | |
Returns reflect the reinvestment of all distributions. Please see page 4 for a description of the index.
As described in the Series’ most recent prospectus, the net expense ratio for Service Class shares of the Series was 0.99%, while total operating expenses for Standard Class and Service Class shares were 0.74% and 1.04%, respectively. The management fee for Standard Class and Service Class shares was 0.65%. Please see the most recent prospectus and any applicable supplement(s) for additional information on these fee waivers and/or reimbursements. Please see the “Financial highlights” section in this report for the most recent expense ratios.
The Series pays Delaware Distributors, L.P. (DDLP), the distributor and an affiliate of DMC, an annual12b-1 fee of 0.30% of the average daily net assets of the Service Class shares. Prior to May 1, 2018, DDLP had contracted to waive12b-1 fees in order to limit12b-1 fees of the Service Class shares to 0.25% of average daily net assets.
Earnings from a variable annuity or variable life investment compoundtax-free until withdrawal, and as a result, no adjustments were made for income taxes.
Expense limitations were in effect for both classes during certain periods shown in the Series performance table above and in the Performance of a $10,000 Investment graph on the next page.
Performance data do not reflect insurance fees related to a variable annuity or variable life investment or the deferred sales charge that would apply to certain withdrawals of investments held for fewer than eight years. Performance shown here would have been reduced if such fees were included and the expense limitation removed. For more information about fees, consult your variable annuity or variable life prospectus.
Investments in variable products involve risk.
Investments in small and/ormedium-sized companies typically exhibit greater risk and higher volatility than larger, more established companies.
Please read both the contract and underlying prospectus for specific details regarding the product’s risk profile.
U.S. Growth Series-3
Delaware VIP® U.S. Growth Series
Performance summary (continued)
| | | | |
| For period beginning Dec. 31, 2008 through Dec. 31, 2018 | | Starting value | | Ending value |
- - Russell 1000 Growth Index | | $10,000 | | $41,481 |
— Delaware VIP U.S. Growth Series (Standard Class) | | $10,000 | | $38,590 |
The graph shows a $10,000 investment in the Delaware VIP U.S. Growth Series Standard Class shares for the period from Dec. 31, 2008 through Dec. 31, 2018.
The graph also shows $10,000 invested in the Russell 1000 Growth Index for the period from Dec. 31, 2008 through Dec. 31, 2018. The Russell 1000 Growth Index measures the performance of thelarge-cap growth segment of the US equity universe. It includes those Russell 1000 companies with higherprice-to-book ratios and higher forecasted growth values.
The MSCI EAFE (Europe, Australasia, Far East) Index, mentioned on page 1, is a free float-adjusted market capitalization weighted index designed to measure equity market performance of developed markets, excluding the United States and Canada. Index “gross” return approximates the maximum possible dividend reinvestment. Index “net” return approximates the minimum possible dividend reinvestment, after deduction of withholding tax at the highest possible rate.
The MSCI Emerging Markets Index, mentioned on page 1, is a free float-adjusted market capitalization index designed to measure equity market performance across emerging market countries worldwide. Index “gross” return approximates the maximum possible dividend reinvestment. Index “net” return approximates the minimum possible dividend reinvestment, after deduction of withholding tax at the highest possible rate.
The S&P 500 Index, mentioned on page 1, measures the performance of 500 mostlylarge-cap stocks weighted by market value, and is often used to represent performance of the US stock market.
Frank Russell Company (“Russell”) is the source and owner of the trademarks, service marks, and copyrights related to the Russell Indexes. Russell® is a trademark of Frank Russell Company.
Index performance returns do not reflect any management fees, transaction costs or expenses. Indices are unmanaged and one cannot invest directly in an index.
Performance of Service Class shares will vary due to different charges and expenses.
Past performance is not a guarantee of future results.
Delaware VIP® Trust — Delaware VIP U.S. Growth Series
Disclosure of Series expenses
For thesix-month period from July 1, 2018 to December 31, 2018 (Unaudited)
As a shareholder of the Series, you incur ongoing costs, which may include management fees; distribution and service(12b-1) fees; and other Series expenses. This example is intended to help you understand your ongoing costs (in dollars) of investing in the Series and to compare these costs with the ongoing costs of investing in other mutual funds.
The example is based on an investment of $1,000 invested at the beginning of the period and held for the entiresix-month period from July 1, 2018 to Dec. 31, 2018.
Actual expenses
The first section of the table shown, “Actual Series Return,” provides information about actual account values and actual expenses. You may use the information in this section of the table, together with the amount you invested, to estimate the expenses that you paid over the period. Simply divide your account value by $1,000 (for example, an $8,600 account value divided by $1,000 = 8.6), then multiply the result by the number in the first section under the heading entitled “Expenses Paid During Period” to estimate the expenses you paid on your account during the period.
Hypothetical example for comparison purposes
The second section of the table shown, “Hypothetical 5% Return,” provides information about hypothetical account values and hypothetical expenses based on the Series’ actual expense ratio and an assumed rate of return of 5% per year before expenses, which is not the Series’ actual return. The hypothetical account values and expenses may not be used to estimate the actual ending account balance or expenses you paid for the period. You may use this information to compare the ongoing costs of investing in the Series and other funds. To do so, compare the 5% hypothetical example with the 5% hypothetical examples that appear in the shareholder reports of other funds.
Please note that the expenses shown in the table are meant to highlight your ongoing costs only. As a shareholder of the Series, you do not incur any transaction costs, such as sales charges (loads), redemption fees, or exchange fees, but shareholders of other funds may incur such costs. Also, the fees related to the variable annuity investment or the deferred sales charge that could apply have not been included. Therefore, the second section of the table is useful in comparing ongoing costs only, and will not help you determine the relative total costs of owning different funds. The Series’ expenses shown in the table assume reinvestment of all dividends and distributions.
Expense analysis of an investment of $1,000
| | | | | | | | | | | | | | | | |
| | | | |
| | | Beginning
Account
Value
7/1/18 | | | Ending
Account
Value
12/31/18 | | | Annualized Expense
Ratio | | | Expenses
Paid During
Period
7/1/18 to
12/31/18* | |
Actual Series return† | | | | | | | | | | | | | | | | |
Standard Class | | $ | 1,000.00 | | | $ | 921.10 | | | | 0.73% | | | | $3.53 | |
Service Class | | | 1,000.00 | | | | 919.40 | | | | 1.03% | | | | 4.98 | |
|
Hypothetical 5% return(5% return before expenses) | |
Standard Class | | | $1,000.00 | | | $ | 1,021.53 | | | | 0.73% | | | | $3.72 | |
Service Class | | | 1,000.00 | | | | 1,020.01 | | | | 1.03% | | | | 5.24 | |
| * | “Expenses Paid During Period” are equal to the Series’ annualized expense ratio, multiplied by the average account value over the period, multiplied by 184/365 (to reflect theone-half year period). |
|
†Because actual returns reflect only the most recentsix-month period, the returns shown may differ significantly from fiscal year returns. |
U.S. Growth Series-5
Delaware VIP® Trust — Delaware VIP U.S. Growth Series
Security type / sector allocation and top 10 equity holdings
As of December 31, 2018 (Unaudited)
Sector designations may be different than the sector designations presented in other Series materials. The sector designations may represent the investment manager’s internal sector classifications.
| | | | | |
| Security type / sector | | Percentage of
net assets |
Common Stock² | | | | 96.87 | % |
Consumer Discretionary | | | | 22.73 | % |
Financial Services1 | | | | 27.35 | % |
Healthcare | | | | 16.88 | % |
Industrials | | | | 2.81 | % |
Technology1 | | | | 27.10 | % |
Short-Term Investments | | | | 3.07 | % |
Total Value of Securities | | | | 99.94 | % |
Receivables and Other Assets Net of Liabilities | | | | 0.06 | % |
Total Net Assets | | | | 100.00 | % |
| ² | Narrow industries are utilized for compliance purposes for diversification whereas broad sectors are used for financial reporting. |
| 1 | To monitor compliance with the Series’ concentration guidelines as described in the Series’ prospectus and statement of additional information, the Financial Services and Technology sectors (as disclosed herein for financial reporting purposes) are subdivided into a variety of “industries” (in accordance with the requirements of the Investment Company Act of 1940, as amended). The Financial Services sector consisted of commercial services, diversified financial services, private equity, and real estate investment trusts. As of Dec. 31, 2018, such amounts, as a percentage of total net assets, were 3.84%, 17.23%, 4.30%, and 1.98%, respectively. The Technology sector consisted of Internet, semiconductors, software, and telecommunications. As of Dec. 31, 2018, such amounts, as a percentage of total net assets, were 8.64%, 3.12%, 12.61%, and 2.73%, respectively. The percentage in any such single industry will comply with the Series’ concentration policy even if the percentages in the Financial Services and Technology sectors for financial reporting purposes may exceed 25%. |
Holdings are for informational purposes only and are subject to change at any time. They are not a recommendation to buy, sell, or hold any security.
| | |
| Top 10 equity holdings | | Percentage
of net assets |
Microsoft | | 9.11% |
IQVIA Holdings | | 5.34% |
Alphabet Class A & Class C | | 4.41% |
Biogen | | 4.41% |
KKR & Co. Class A | | 4.30% |
TripAdvisor | | 4.23% |
Dollar General | | 4.20% |
Hasbro | | 4.14% |
UnitedHealth Group | | 4.01% |
Take-Two Interactive Software | | 3.91% |
U.S. Growth Series-6
Delaware VIP® Trust — Delaware VIP U.S. Growth Series
Schedule of investments
December 31, 2018
| | | | | | | | |
| | | Number of
shares | | | Value (US $) | |
|
Common Stock – 96.87%² | |
Consumer Discretionary – 22.73% | |
Alibaba Group Holding ADR † | | | 35,804 | | | $ | 4,907,654 | |
Charter Communications Class A † | | | 22,059 | | | | 6,286,153 | |
Dollar General | | | 128,090 | | | | 13,843,967 | |
Dollar Tree † | | | 123,802 | | | | 11,181,797 | |
Hasbro | | | 167,812 | | | | 13,634,725 | |
Liberty Global Class A † | | | 89,482 | | | | 1,909,546 | |
Liberty Global Class C † | | | 495,932 | | | | 10,236,037 | |
Take-Two Interactive Software † | | | 125,019 | | | | 12,869,456 | |
| | | | | | | | |
| | | | | | | 74,869,335 | |
| | | | | | | | |
Financial Services – 27.35% | | | | | |
Charles Schwab | | | 268,950 | | | | 11,169,494 | |
CME Group | | | 50,868 | | | | 9,569,288 | |
Crown Castle International | | | 60,053 | | | | 6,523,557 | |
Intercontinental Exchange | | | 170,119 | | | | 12,815,064 | |
KKR & Co. Class A | | | 720,843 | | | | 14,150,148 | |
Mastercard Class A | | | 60,553 | | | | 11,423,323 | |
PayPal Holdings † | | | 150,467 | | | | 12,652,770 | |
Visa Class A | | | 89,032 | | | | 11,746,882 | |
| | | | | | | | |
| | | | | | | 90,050,526 | |
| | | | | | | | |
Healthcare – 16.88% | | | | | | | | |
Biogen † | | | 48,216 | | | | 14,509,159 | |
Illumina † | | | 34,235 | | | | 10,268,104 | |
IQVIA Holdings † | | | 151,381 | | | | 17,585,931 | |
UnitedHealth Group | | | 53,028 | | | | 13,210,335 | |
| | | | | | | | |
| | | | | | | 55,573,529 | |
| | | | | | | | |
Industrials – 2.81% | | | | | | | | |
FedEx | | | 57,343 | | | | 9,251,146 | |
| | | | | | | | |
| | | | | | | 9,251,146 | |
| | | | | | | | |
Technology – 27.10% | | | | | | | | |
Alphabet Class A † | | | 9,489 | | | | 9,915,625 | |
Alphabet Class C † | | | 4,450 | | | | 4,608,466 | |
Applied Materials | | | 313,518 | | | | 10,264,579 | |
Arista Networks † | | | 42,656 | | | | 8,987,619 | |
Autodesk † | | | 89,578 | | | | 11,520,627 | |
Microsoft | | | 295,465 | | | | 30,010,380 | |
TripAdvisor † | | | 258,210 | | | | 13,927,847 | |
| | | | | | | | |
| | | | | | | 89,235,143 | |
| | | | | | | | |
| | | | | | | | |
| | | Number of shares | | | Value (US $) | |
|
Common Stock²(continued) | |
Technology (continued) | |
Total Common Stock
(cost $271,739,395) | | | | | | | 318,979,679 | |
| | | | | | | | |
| | | Principal amount° | | | | |
Short-Term Investments – 3.07% | | | | | |
Discount Note – 0.49%≠ | | | | | | | | |
Federal Home Loan Bank 1.05% 1/2/19 | | | 1,633,548 | | | | 1,633,548 | |
| | | | | | | | |
| | | | | | | 1,633,548 | |
| | | | | | | | |
Repurchase Agreements – 2.56% | | | | | |
Bank of America Merrill Lynch
2.95%, dated 12/31/18, to be repurchased on 1/2/19, repurchase at $1,021,135 (cash collateralized of $1,020,968) | | | 1,020,968 | | | | 1,020,968 | |
Bank of Montreal
2.60%, dated 12/31/18, to be repurchased on 1/2/19, repurchase price $2,808,067 (collateralized by US government obligations 0.00%–3.75% 1/24/19–2/15/47; market value $2,863,815) | | | 2,807,662 | | | | 2,807,662 | |
BNP Paribas
2.93%, dated 12/31/18, to be repurchased on 1/2/19, repurchase price $4,591,764 (collateralized by US government obligations 0.00%–8.00% 2/15/19–8/15/46; market value $4,682,837) | | | 4,591,016 | | | | 4,591,016 | |
| | | | | | | | |
| | | | | | | 8,419,646 | |
| | | | | | | | |
US Treasury Obligation – 0.02%≠ | | | | | |
US Treasury Bill 1.494% 1/3/19 | | | 60,551 | | | | 60,547 | |
| | | | | | | | |
| | | | | | | 60,547 | |
| | | | | | | | |
Total Short-Term Investments
(cost $10,113,643) | | | | 10,113,741 | |
| | | | | | | | |
| | | | |
Total Value of Securities - 99.94%
(cost $281,853,038) | | $ | 329,093,420 | |
| | | | |
| ² | Narrow industries are utilized for compliance purposes for diversification whereas broad sectors are used for financial reporting. |
| ≠ | The rate shown is the effective yield at the time of purchase. |
| ° | Principal amount shown is stated in USD unless noted that the security is denominated in another currency. |
| † | Non-income producing security. |
U.S. Growth Series-7
Delaware VIP® U.S. Growth Series
Schedule of investments (continued)
Summary of abbreviations:
ADR – American Depositary Receipt
USD – US Dollar
See accompanying notes, which are an integral part of the financial statements.
Delaware VIP®Trust — Delaware VIP U.S. Growth Series
| | |
| Statement of assets and liabilities | | December 31, 2018 |
| | | | |
Assets: | | | | |
Investments, at value1 | | $ | 329,093,420 | |
Cash | | | 145,248 | |
Receivable for series shares sold | | | 315,487 | |
Dividends and interest receivable | | | 130,363 | |
Foreign tax reclaims receivable | | | 37,096 | |
| | | | |
Total assets | | | 329,721,614 | |
| | | | |
| |
Liabilities: | | | | |
Payable for series shares redeemed | | | 109,736 | |
Investment management fees payable to affiliates | | | 184,952 | |
Distribution fees payable to affiliates | | | 74,791 | |
Other accrued expenses | | | 60,592 | |
Audit and tax fees payable | | | 4,695 | |
Dividend disbursing and transfer agent fees and expenses payable to affiliates | | | 2,134 | |
Accounting and administration expenses payable to affiliates | | | 1,443 | |
Trustees’ fees and expenses payable | | | 895 | |
Legal fees payable to affiliates | | | 621 | |
Reports and statements to shareholders expense payable to affiliates | | | 244 | |
| | | | |
Total liabilities | | | 440,103 | |
| | | | |
Total Net Assets | | $ | 329,281,511 | |
| | | | |
| |
Net Assets Consist of: | | | | |
Paid-in capital | | $ | 221,670,272 | |
Total distributable earnings (loss) | | | 107,611,239 | |
| | | | |
Total Net Assets | | $ | 329,281,511 | |
| | | | |
| |
Net Asset Value: | | | | |
Standard Class: | | | | |
Net assets | | $ | 43,416,800 | |
Shares of beneficial interest outstanding, unlimited authorization, no par | | | 4,536,828 | |
Net asset value per share | | $ | 9.57 | |
| |
Service Class: | | | | |
Net assets | | $ | 285,864,711 | |
Shares of beneficial interest outstanding, unlimited authorization, no par | | | 30,937,899 | |
Net asset value per share | | $ | 9.24 | |
1Investments, at cost | | $ | 281,853,038 | |
See accompanying notes, which are an integral part of the financial statements.
| | |
| Delaware VIP®Trust — | | Delaware VIP Trust— |
| Delaware VIP U.S. Growth Series | | Delaware VIP U.S. Growth Series |
| Statement of operations | | Statements of changes in net assets |
| Year ended December 31, 2018 | | |
| | | | |
Investment Income: | |
Dividends | | $ | 2,941,633 | |
Interest | | | 93,158 | |
Foreign tax withheld | | | (8,636 | ) |
| | | | |
| | | 3,026,155 | |
| | | | |
Expenses: | | | | |
Management fees | | | 2,435,700 | |
Distribution expenses – Service Class | | | 980,897 | |
Accounting and administration expenses | | | 100,748 | |
Reports and statements to shareholders | | | 80,100 | |
Audit and tax fees | | | 34,106 | |
Dividend disbursing and transfer agent fees and expenses | | | 31,352 | |
Legal fees | | | 18,885 | |
Trustees’ fees and expenses | | | 17,979 | |
Custodian fees | | | 14,889 | |
Registration fees | | | 467 | |
Other | | | 10,413 | |
| | | | |
| | | 3,725,536 | |
Less waived distribution expenses - Service Class | | | (55,021 | ) |
Less expenses paid indirectly | | | (95 | ) |
| | | | |
Total operating expenses | | | 3,670,420 | |
| | | | |
Net Investment Loss | | | (644,265 | ) |
| | | | |
| |
Net Realized and Unrealized Gain (Loss): | | | | |
Net realized gain | | | 63,618,314 | |
Net change in unrealized appreciation (depreciation) of investments | | | (70,795,585 | ) |
| | | | |
Net Realized And Unrealized Loss | | | (7,177,271 | ) |
| | | | |
Net Decrease in Net Assets Resulting from Operations | | $ | (7,821,536 | ) |
| | | | |
| | | | | | | | |
| | | Year ended | |
| | | 12/31/18 | | | 12/31/17 | |
Increase (Decrease) in Net Assets from Operations: | | | | | | | | |
Net investment loss | | $ | (644,265 | ) | | $ | (644,685 | ) |
Net realized gain | | | 63,618,314 | | | | 48,033,890 | |
Net change in unrealized appreciation (depreciation) | | | (70,795,585 | ) | | | 47,537,885 | |
| | | | | | | | |
Net increase (decrease) in net assets resulting from operations | | | (7,821,536 | ) | | | 94,927,090 | |
| | | | | | | | |
| | |
Dividends and Distributions to Shareholders from: | | | | | | | | |
Distributable earnings*: | | | | | | | | |
Standard Class | | | (6,179,560 | ) | | | (539,552 | ) |
Service Class | | | (42,785,737 | ) | | | (3,478,091 | ) |
| | | | | | | | |
| | | (48,965,297 | ) | | | (4,017,643 | ) |
| | | | | | | | |
| | |
Capital Share Transactions: | | | | | | | | |
Proceeds from shares sold: | | | | | | | | |
Standard Class | | | 4,179,512 | | | | 4,844,072 | |
Service Class | | | 5,753,887 | | | | 1,440,957 | |
Net asset value of shares based upon reinvestment of dividends and distributions: | | | | | | | | |
Standard Class | | | 6,179,560 | | | | 539,552 | |
Service Class | | | 42,785,737 | | | | 3,478,091 | |
| | | | | | | | |
| | | 58,898,696 | | | | 10,302,672 | |
| | | | | | | | |
Cost of shares redeemed: | | | | | | | | |
Standard Class | | | (6,532,749 | ) | | | (18,216,062 | ) |
Service Class | | | (49,881,786 | ) | | | (63,378,600 | ) |
| | | | | | | | |
| | | (56,414,535 | ) | | | (81,594,662 | ) |
| | | | | | | | |
Increase (decrease) in net assets derived from capital share transactions | | | 2,484,161 | | | | (71,291,990 | ) |
| | | | | | | | |
Net Increase (Decrease) in Net Assets | | | (54,302,672 | ) | | | 19,617,457 | |
|
Net Assets: | |
Beginning of year | | | 383,584,183 | | | | 363,966,726 | |
| | | | | | | | |
End of year1 | | $ | 329,281,511 | | | $ | 383,584,183 | |
| | | | | | | | |
| 1 | Net Assets - There was no undistributed net investment income for the year ended 12/31/17. The Securities and Exchange Commission eliminated the requirement to disclose undistributed (distributions in excess of) net investment income in 2018. |
| * | For the year ended Dec. 31, 2018, the Fund has adopted amendments to RegulationS-X (see Note 12 in “Notes to financial statements”). For the year ended Dec. 31, 2017, the dividends and distributions to shareholders were as follows: |
| | | | | | | | |
| | | Standard Class | | | Service Class | |
Dividends from net realized gain | | | $(539,552 | ) | | | $(3,478,091 | ) |
See accompanying notes, which are an integral part of the financial statements.
Delaware VIP® Trust—Delaware VIP U.S. Growth Series
Financial highlights
Selected data for each share of the Series outstanding throughout each period were as follows:
| | | | | | | | | | | | | | | | | | | | |
| | | Delaware VIP U.S. Growth Series Standard Class | |
| | | Year ended | |
| | | 12/31/18 | | | | 12/31/17 | | | | 12/31/16 | | | | 12/31/15 | | | | 12/31/14 | |
Net asset value, beginning of period | | | $ 11.31 | | | | $ 8.91 | | | | $ 13.31 | | | | $ 13.75 | | | | $ 13.14 | |
| | | | | |
Income (loss) from investment operations: | | | | | | | | | | | | | | | | | | | | |
Net investment income1 | | | 0.01 | | | | 0.01 | | | | 0.02 | | | | 0.08 | | | | 0.08 | |
Net realized and unrealized gain (loss) | | | (0.27 | ) | | | 2.49 | | | | (0.75 | ) | | | 0.66 | | | | 1.49 | |
Total from investment operations | | | (0.26 | ) | | | 2.50 | | | | (0.73 | ) | | | 0.74 | | | | 1.57 | |
| | | | | |
Less dividends and distributions from: | | | | | | | | | | | | | | | | | | | | |
Net investment income | | | — | | | | — | | | | (0.08 | ) | | | (0.08 | ) | | | (0.03 | ) |
Net realized gain | | | (1.48 | ) | | | (0.10 | ) | | | (3.59 | ) | | | (1.10 | ) | | | (0.93 | ) |
Total dividends and distributions | | | (1.48 | ) | | | (0.10 | ) | | | (3.67 | ) | | | (1.18 | ) | | | (0.96 | ) |
| | | | | |
Net asset value, end of period | | | $ 9.57 | | | | $ 11.31 | | | | $ 8.91 | | | | $ 13.31 | | | | $ 13.75 | |
| | | | | |
Total return2 | | | (3.00% | ) | | | 28.28% | | | | (5.17% | ) | | | 5.39% | | | | 12.78% | |
| | | | | |
Ratios and supplemental data: | | | | | | | | | | | | | | | | | | | | |
Net assets, end of period (000 omitted) | | | $43,417 | | | | $46,908 | | | | $47,773 | | | | $50,055 | | | | $160,730 | |
Ratio of expenses to average net assets | | | 0.73% | | | | 0.74% | | | | 0.74% | | | | 0.75% | | | | 0.74% | |
Ratio of net investment income to average net assets | | | 0.08% | | | | 0.05% | | | | 0.22% | | | | 0.56% | | | | 0.58% | |
Portfolio turnover | | | 40% | | | | 25% | | | | 22% | | | | 39% | | | | 26% | |
|
1 The average shares outstanding method has been applied for per share information. 2 Total return is based on the change in net asset value of a share during the period and assumes reinvestment of dividends and distributions at net asset value. Total return does not include fees, charges, or expenses imposed by the variable annuity and life insurance contracts for which Delaware VIP Trust serves as an underlying investment vehicle. |
See accompanying notes, which are an integral part of the financial statements.
Delaware VIP® U.S. Growth Series
Financial highlights (continued)
Selected data for each share of the Series outstanding throughout each period were as follows:
| | | | | | | | | | | | | | | | | | | | |
| | | Delaware VIP U.S. Growth Series Service Class Year ended | |
| | | 12/31/18 | | | 12/31/17 | | | 12/31/16 | | | 12/31/15 | | | 12/31/14 | |
Net asset value, beginning of period | | $ | 11.00 | | | $ | 8.68 | | | $ | 13.07 | | | $ | 13.53 | | | $ | 12.94 | |
| | | | | |
Income (loss) from investment operations: | | | | | | | | | | | | | | | | | | | | |
Net investment income (loss)1 | | | (0.02 | ) | | | (0.02 | ) | | | — | 2 | | | 0.04 | | | | 0.04 | |
Net realized and unrealized gain (loss) | | | (0.26 | ) | | | 2.44 | | | | (0.75 | ) | | | 0.65 | | | | 1.48 | |
| | | | | | | | | | | | | | | | | | | | |
Total from investment operations | | | (0.28 | ) | | | 2.42 | | | | (0.75 | ) | | | 0.69 | | | | 1.52 | |
| | | | | | | | | | | | | | | | | | | | |
| | | | | |
Less dividends and distributions from: | | | | | | | | | | | | | | | | | | | | |
Net investment income | | | — | | | | — | | | | (0.05 | ) | | | (0.05 | ) | | | — | 2 |
Net realized gain | | | (1.48 | ) | | | (0.10 | ) | | | (3.59 | ) | | | (1.10 | ) | | | (0.93 | ) |
| | | | | | | | | | | | | | | | | | | | |
Total dividends and distributions | | | (1.48 | ) | | | (0.10 | ) | | | (3.64 | ) | | | (1.15 | ) | | | (0.93 | ) |
| | | | | | | | | | | | | | | | | | | | |
| | | | | |
Net asset value, end of period | | $ | 9.24 | | | $ | 11.00 | | | $ | 8.68 | | | $ | 13.07 | | | $ | 13.53 | |
| | | | | | | | | | | | | | | | | | | | |
| | | | | |
Total return3 | | | (3.29% | ) | | | 28.10% | | | | (5.50% | ) | | | 5.08% | | | | 12.48% | |
| | | | | |
Ratios and supplemental data: | | | | | | | | | | | | | | | | | | | | |
Net assets, end of period (000 omitted) | | $ | 285,865 | | | $ | 336,676 | | | $ | 316,194 | | | $ | 361,691 | | | $ | 365,985 | |
Ratio of expenses to average net assets | | | 1.01% | | | | 0.99% | | | | 0.99% | | | | 1.00% | | | | 0.99% | |
Ratio of expenses to average net assets prior to fees waived and expenses paid indirectly | | | 1.03% | | | | 1.04% | | | | 1.04% | | | | 1.05% | | | | 1.04% | |
Ratio of net investment income (loss) to average net assets | | | (0.20% | ) | | | (0.20% | ) | | | (0.03% | ) | | | 0.31% | | | | 0.33% | |
Ratio of net investment income (loss) to average net assets prior to fees waived and expenses paid indirectly | | | (0.22% | ) | | | (0.25% | ) | | | (0.08% | ) | | | 0.26% | | | | 0.28% | |
Portfolio turnover | | | 40% | | | | 25% | | | | 22% | | | | 39% | | | | 26% | |
| 1 | The average shares outstanding method has been applied for per share information. |
| 2 | Amount is less than $0.005 per share. |
| 3 | Total return is based on the change in net asset value of a share during the period and assumes reinvestment of dividends and distributions at net asset value. Total return during all of the periods shown reflects a waiver by the distributor. Performance would have been lower had the waiver not been in effect. Total return does not include fees, charges, or expenses imposed by the variable annuity and life insurance contracts for which Delaware VIP Trust serves as an underlying investment vehicle. |
See accompanying notes, which are an integral part of the financial statements.
Delaware VIP® Trust — Delaware VIP U.S. Growth Series
Notes to financial statements
December 31, 2018
Delaware VIP Trust (Trust) is organized as a Delaware statutory trust and offers 10 series: Delaware VIP Diversified Income Series, Delaware VIP Emerging Markets Series, Delaware VIP High Yield Series, Delaware VIP International Value Equity Series, Delaware VIP Limited-Term Diversified Income Series, Delaware VIP REIT Series, Delaware VIP Small Cap Value Series, Delaware VIP Smid Cap Core Series, Delaware VIP U.S. Growth Series, and Delaware VIP Value Series. These financial statements and the related notes pertain to Delaware VIP U.S. Growth Series (Series). The Trust is anopen-end investment company. The Series is considered diversified under the Investment Company Act of 1940, as amended, and offers Standard Class and Service Class shares. The Standard Class shares do not carry a distribution and service(12b-1) fee and the Service Class shares carry a12b-1 fee. The shares of the Series are sold only to separate accounts of life insurance companies.
The investment objective of the Series is to seek long-term capital appreciation.
1. Significant Accounting Policies
The Series is an investment company and follows accounting and reporting guidance under Financial Accounting Standards Board (FASB) Accounting Standards Codification (ASC) Topic 946, Financial Services - Investment Companies. The following accounting policies are in accordance with US generally accepted accounting principles (US GAAP) and are consistently followed by the Series.
Security Valuation — Equity securities, except those traded on the Nasdaq Stock Market LLC (Nasdaq) are valued at the last quoted sales price as of the time of the regular close of the New York Stock Exchange on the valuation date. Equity securities traded on the Nasdaq are valued in accordance with the Nasdaq Official Closing Price, which may not be the last sales price. If, on a particular day, an equity security does not trade, the mean between the bid and ask prices will be used, which approximates fair value. US government and agency securities are valued at the mean between the bid and ask prices, which approximates fair value. Investments in repurchase agreements are generally value at par, which approximates fair value, each business day. Generally, other securities and assets for which market quotations are not readily available are valued at fair value as determined in good faith under the direction of the Trust’s Board of Trustees (Board). In determining whether market quotations are readily available or fair valuation will be used, various factors will be taken into consideration, such as market closures or suspension of trading in a security. The Series may use fair value pricing more frequently for securities traded primarily innon-US markets because, among other things, most foreign markets close well before the Series values its securities, generally as of 4:00pm Eastern time. The earlier close of these foreign markets gives rise to the possibility that significant events, including broad market moves, government actions or pronouncements, aftermarket trading, or news events may have occurred in the interim. Whenever such a significant event occurs, the Series may value foreign securities using fair value prices based on third-party vendor modeling tools (international fair value pricing). Restricted securities are valued at fair value using methods approved by the Board.
Federal Income Taxes — No provision for federal income taxes has been made as the Series intends to continue to qualify for federal income tax purposes as a regulated investment company under Subchapter M of the Internal Revenue Code of 1986, as amended, and make the requisite distributions to shareholders. The Series evaluates tax positions taken or expected to be taken in the course of preparing the Series’ tax returns to determine whether the tax positions are“more-likely-than-not” of being sustained by the applicable tax authority. Tax positions not deemed to meet the“more-likely-than-not” threshold are recorded as a tax benefit or expense in the current year. Management has analyzed the Series’ tax positions taken or expected to be taken on the Series’ federal income tax returns through the year ended Dec. 31, 2018 and for all open tax years (years ended Dec. 31, 2015–Dec. 31, 2017), and has concluded that no provision for federal income tax is required in the Series’ financial statements. If applicable, the Series recognizes interest accrued on unrecognized tax benefits in interest expense and penalties in other expenses on the “Statement of operations.” During the year ended Dec. 31, 2018, the Series did not incur any interest or tax penalties.
Class Accounting — Investment income, common expenses, and realized and unrealized gain (loss) on investments are allocated to the classes of the Series on the basis of daily net assets of each class. Distribution expenses relating to a specific class are charged directly to that class.
Repurchase Agreements — The Series may purchase certain US government securities subject to the counterparty’s agreement to repurchase them at an agreed upon date and price. The counterparty will be required on a daily basis to maintain the value of the collateral subject to the agreement at not less than the repurchase price (including accrued interest). The agreements are conditioned upon the collateral being deposited under the Federal Reserve book-entry system with the Series’ custodian or a third-partysub-custodian. In the event of default or bankruptcy by the other party to the agreement, retention of the collateral may be subject to legal proceedings. All open repurchase agreements as of the date of this report were entered into on Dec. 31, 2018 and matured on the next business day.
Use of Estimates — The preparation of financial statements in conformity with US GAAP requires management to make estimates and assumptions that affect the fair value of investments, the reported amounts of assets and liabilities and disclosure of contingent assets and liabilities at the date of the financial statements, and the reported amounts of revenues and expenses during the reporting period. Actual results could differ from those estimates and the differences could be material.
Other — Expenses directly attributable to the Series are charged directly to the Series. Other expenses common to various funds within the Delaware Funds® by Macquarie (Delaware Funds) are generally allocated among such funds on the basis of average net assets. Management fees
U.S. Growth Series-13
Delaware VIP® U.S. Growth Series
Notes to financial statements (continued)
1. Significant Accounting Policies (continued)
and certain other expenses are paid monthly. Security transactions are recorded on the date the securities are purchased or sold (trade date) for financial reporting purposes. Costs used in calculating realized gains and losses on the sale of investment securities are those of the specific securities sold. Dividend income is recorded on theex-dividend date and interest income is recorded on the accrual basis. Foreign dividends are also recorded on theex-dividend date or as soon after theex-dividend date that the Series is aware of such dividends, net of all tax withholdings, a portion of which may be reclaimable. Withholding taxes and reclaims on foreign dividends have been recorded in accordance with the Series’ understanding of the applicable country’s tax rules and rates. The Series declares and pays dividends from net investment income and distributions from net realized gain on investments, if any, following the close of the fiscal year. The Series may distribute more frequently, if necessary for tax purposes. Dividends and distributions, if any, are recorded on theex-dividend date.
Subject to seeking best execution, the Series may direct certain security trades to brokers who have agreed to rebate a portion of the related brokerage commission to the Series in cash. In general, best execution refers to many factors, including the price paid or received for a security, the commission charged, the promptness and reliability of execution, the confidentiality and placement accorded the order, and other factors affecting the overall benefit obtained by the Series on the transaction. There were no commission rebates for the year ended Dec. 31, 2018.
The Series receives earnings credits from its custodian when positive cash balances are maintained, which may be used to offset custody fees. The expenses paid under this arrangement is included on the “Statement of operations” under “Custodian fees” with the corresponding expenses offset included under “Less expenses paid indirectly.” For the year ended Dec. 31, 2018, the Series earned $94 under this arrangement.
The Series receives earnings credits from its transfer agent when positive cash balances are maintained, which may be used to offset transfer agent fees. If the amount earned is greater than $1, the expenses paid under this arrangement is included on the “Statement of operations” under “Dividend disbursing and transfer agent fees and expenses” with the corresponding expenses offset included under “Less expenses paid indirectly.” For the year ended Dec. 31, 2018, the Series earned less than $1 under this agreement.
2. Investment Management, Administration Agreements, and Other Transactions with Affiliates
In accordance with the terms of its investment management agreement, the Series pays Delaware Management Company (DMC), a series of Macquarie Investment Management Business Trust and the investment manager, an annual fee which is calculated daily and paid monthly at the rate of 0.65% on the first $500 million of average daily net assets of the Series, 0.60% on the next $500 million, 0.55% on the next $1.5 billion, and 0.50% on average daily net assets in excess of $2.5 billion.
Jackson Square Partners, LLC (JSP), a related party of DMC, furnishes investmentsub-advisory services to the Series. For these services, DMC, not the Series, pays JSP fees based on the aggregate average daily net assets of the Series at the following annual rate: 0.39% of the first $500 million; 0.36% of the next $500 million; 0.33% of the next $1.5 billion; and 0.30% of aggregate average daily net assets in excess of $2.5 billion.
Delaware Investments Fund Services Company (DIFSC), an affiliate of DMC, provides fund accounting and financial administration oversight services to the Series. For these services, DIFSC’s fees were calculated daily and paid monthly based on the aggregate daily net assets of all funds within the Delaware Funds at the following annual rates: 0.00475% of the first $35 billion; 0.0040% of the next $10 billion; and 0.0025% of aggregate average daily net assets in excess of $45 billion (Total Fee). Each fund in the Delaware Funds pays a minimum of $4,000, which, in aggregate, is subtracted from the Total Fee. Each fund then pays its portion of the remainder of the Total Fee on a relative net asset value basis. For the year ended Dec. 31, 2018, the Series was charged $18,152 for these services. This amount is included on the “Statement of operations” under “Accounting and administration expenses.”
DIFSC is also the transfer agent and dividend disbursing agent of the Series. For these services, DIFSC’s fees are calculated daily and paid monthly at the annual rate of 0.0075% of the Series average daily net assets. This amount is included on the “Statement of operations” under “Dividend disbursing and transfer agent fees and expenses.” For the year ended Dec. 31, 2018, the Series was charged $28,104 for these services. Pursuant to asub-transfer agency agreement between DIFSC and BNY Mellon Investment Servicing (US) Inc. (BNYMIS), BNYMIS provides certainsub-transfer agency services to the Series.Sub-transfer agency fees are paid by the Series and are also included on the “Statement of operations” under “Dividend disbursing and transfer agent fees and expenses.”
Pursuant to a distribution agreement and distribution plan, the Series pays Delaware Distributors, L.P. (DDLP), the distributor and an affiliate of DMC, an annual12b-1 fee of 0.30% of the average daily net assets of the Service Class shares. Prior to May 1, 2018, DDLP had contracted to waive12b-1 fees in order to limit the12b-1 fees of the Service Class shares to 0.25% of average daily net assets. The fees are calculated daily and paid monthly. Standard Class shares pay no12b-1 fees.
As provided in the investment management agreement, the Series bears a portion of the cost of certain resources shared with DMC, including the cost of internal personnel of DMC and/or its affiliates that provide legal, tax, and regulatory reporting services to the Series. For the year ended Dec. 31, 2018, the
U.S. Growth Series-14
Delaware VIP® U.S. Growth Series
Notes to financial statements (continued)
2. Investment Management, Administration Agreements, and Other Transactions with Affiliates (continued)
Series was charged $11,131 for internal legal, tax, and regulatory reporting services provided by DMC and/or its affiliates’ employees. This amount is included on the “Statement of operations” under “Legal fees.”
Trustees’ fees include expenses accrued by the Series for each Trustee’s retainer and meeting fees. Certain officers of DMC, DIFSC, and DDLP are officers and/or Trustees of the Trust. These officers and Trustees are paid no compensation by the Series.
3. Investments
For the year ended Dec. 31, 2018, the Series made purchases and sales of investment securities other than short-term investments as follows:
| | | | |
Purchases | | $ | 145,426,951 | |
Sales | | | 197,818,253 | |
The tax cost of investments includes adjustments to net unrealized appreciation (depreciation) which may not necessarily be final tax cost basis adjustments, but approximate the tax basis unrealized gains and losses that may be realized and distributed to shareholders. At Dec. 31, 2018, the cost and unrealized appreciation (depreciation) of investments for federal income tax purposes for the Fund were as follows:
| | | | | | |
Cost of
Investments | | Aggregate
Unrealized
Appreciation
of Investments | | Aggregate
Unrealized
Depreciation
of Investments | | Net Unrealized
Appreciation
of Investments |
$284,875,753 | | $72,395,210 | | $(28,177,543) | | $44,217,667 |
US GAAP defines fair value as the price that the Series would receive to sell an asset or pay to transfer a liability in an orderly transaction between market participants at the measurement date under current market conditions. A three-level hierarchy for fair value measurements has been established based upon the transparency of inputs to the valuation of an asset or liability. Inputs may be observable or unobservable and refer broadly to the assumptions that market participants would use in pricing the asset or liability. Observable inputs reflect the assumptions market participants would use in pricing the asset or liability based on market data obtained from sources independent of the reporting entity. Unobservable inputs reflect the reporting entity’s own assumptions about the assumptions that market participants would use in pricing the asset or liability based on the best information available under the circumstances. The Series’ investment in its entirety is assigned a level based upon the observability of the inputs which are significant to the overall valuation. The three-level hierarchy of inputs is summarized below.
| | |
| Level 1 – | | Inputs are quoted prices in active markets for identical investments. (Examples: equity securities,open-end investment companies, futures contracts, exchange-traded options contracts) |
| Level 2 – | | Other observable inputs, including, but not limited to: quoted prices for similar assets or liabilities in markets that are active, quoted prices for identical or similar assets or liabilities in markets that are not active, inputs other than quoted prices that are observable for the assets or liabilities (such as interest rates, yield curves, volatilities, prepayment speeds, loss severities, credit risks, and default rates) or other market-corroborated inputs. (Examples: debt securities, government securities, swap contracts, foreign currency exchange contracts, foreign securities utilizing international fair value pricing, broker-quoted securities, fair valued securities) |
| Level 3 – | | Significant unobservable inputs, including the Series’ own assumptions used to determine the fair value of investments) (Examples: broker-quoted securities, fair valued securities) |
Level 3 investments are valued using significant unobservable inputs. The Series may also use an income-based valuation approach in which the anticipated future cash flows of the investment are discounted to calculate fair value. Discounts may also be applied due to the nature or duration of any restrictions on the disposition of the investments. Valuations may also be based upon current market prices of securities that are comparable in coupon, rating, maturity, and industry. The derived value of a Level 3 investment may not represent the value which is received upon disposition and this could impact the results of operations.
The following table summarizes the valuation of the Series’ investments by fair value hierarchy levels as of Dec. 31, 2018:
| | | | | | | | | | | | | | | | | | | | |
Securities | | Level 1 | | | | | | Level 2 | | | | | | Total | |
Assets: | | | | | | | | | | | | | | | | | | | | |
Common Stock | | $ | 318,979,679 | | | | | | | $ | — | | | | | | | | $318,979,679 | |
Short-Term Investments | | | — | | | | | | | | 10,113,741 | | | | | | | | 10,113,741 | |
| | | | | | | | | | | | | | | | | | | | |
Total Value of Securities | | $ | 318,979,679 | | | | | | | $ | 10,113,741 | | | | | | | | $329,093,420 | |
| | | | | | | | | | | | | | | | | | | | |
U.S. Growth Series-15
Delaware VIP® U.S. Growth Series
Notes to financial statements (continued)
3. Investments (continued)
During the year ended Dec. 31, 2018, there were no transfers between Level 1 investments, Level 2 investments, or Level 3 investments that had a significant impact to the Series. The Series’ policy is to recognize transfers between levels based on fair value at the beginning of the reporting period.
A reconciliation of Level 3 investments is presented when the Series has a significant amount of Level 3 investments at the beginning, interim, or end of the period in relation to the Series’ net assets. During the year ended Dec. 31, 2018, there were no Level 3 investments.
4. Dividend and Distribution Information
Income and long-term capital gain distributions are determined in accordance with federal income tax regulations, which may differ from US GAAP. Additionally, distributions from net gains on foreign currency transactions and net short-term gains on sales of investment securities are treated as ordinary income for federal income tax purposes. The tax character of dividends and distributions paid during the years ended Dec. 31, 2018 and 2017 was as follows:
| | | | | | | | |
| | | Year ended | |
| | | 12/31/18 | | | 12/31/17 | |
Ordinary income | | $ | 2,738,625 | | | $ | — | |
Long-term capital gain | | | 46,226,672 | | | | 4,017,643 | |
| | | | | | | | |
Total | | $ | 48,965,297 | | | $ | 4,017,643 | |
| | | | | | | | |
5. Components of Net Assets on a Tax Basis
As of Dec. 31, 2018, the components of net assets on a tax basis were as follows:
| | | | |
Shares of beneficial interest | | $ | 221,670,272 | |
Undistributed ordinary income | | | 2,207,101 | |
Undistributed long-term capital gains | | | 61,186,471 | |
Unrealized appreciation on investments | | | 44,217,667 | |
| | | | |
Net assets | | $ | 329,281,511 | |
| | | | |
The differences between book basis and tax basis components of net assets are primarily attributable to tax deferral of losses on wash sales.
6. Capital Shares
Transactions in capital shares were as follows:
| | | | | | | | |
| | | Year ended | |
| | | 12/31/18 | | | 12/31/17 | |
Shares sold: | | | | | | | | |
Standard Class | | | 382,239 | | | | 477,561 | |
Service Class | | | 595,706 | | | | 152,259 | |
| | |
Shares issued upon reinvestment of dividends and distributions: | | | | | | | | |
Standard Class | | | 609,424 | | | | 57,035 | |
Service Class | | | 4,361,441 | | | | 377,643 | |
| | | | | | | | |
| | | 5,948,810 | | | | 1,064,498 | |
| | | | | | | | |
Shares redeemed: | | | | | | | | |
Standard Class | | | (601,660) | | | | (1,751,708) | |
Service Class | | | (4,626,671) | | | | (6,329,532) | |
| | | | | | | | |
| | | (5,228,331) | | | | (8,081,240) | |
| | | | | | | | |
Net increase (decrease) | | | 720,479 | | | | (7,016,742) | |
| | | | | | | | |
7. Line of Credit
The Series, along with certain other funds in the Delaware Funds (Participants), was a participant in a revolving line of credit intended to be used for temporary or emergency purposes as an additional source of liquidity to fund redemptions of investor shares. Under the agreement, the Participants were charged an annual commitment fee of 0.15%, which was allocated across the Participants based on a weighted average of the respective net assets of
U.S. Growth Series-16
Delaware VIP® U.S. Growth Series
Notes to financial statements (continued)
7. Line of Credit (continued)
each Participant. The revolving line of credit available was reduced from $155,000,000 to $130,000,0000 on Sept. 6, 2018. The Participants were permitted to borrow up to a maximum ofone-third of their net assets under the agreement. Each Participant was individually, and not jointly, liable for its particular advances, if any, under the line of credit. The line of credit available under the agreement expired on Nov. 5, 2018.
On Nov. 5, 2018, the Participants entered into an amendment to the agreement for a $190,000,000 revolving line of credit. The revolving line of credit available was increased to $220,000,000 on Nov. 29, 2018. The revolving line of credit is to be used as described above and operates in substantially the same manner as the original agreement. The line of credit available under the agreement expires on Nov. 4, 2019.
The Series had no amounts outstanding as of Dec. 31, 2018, or at any time during the period then ended.
8. Offsetting
Master Repurchase Agreements
Repurchase agreements are entered into by the Series under master repurchase agreements (each, an MRA). The MRA permits the Series, under certain circumstances including an event of default (such as bankruptcy or insolvency), to offset payables and/or receivables with collateral held by and/or posted to the counterparty. As a result, one single net payment is created. Bankruptcy or insolvency laws of a particular jurisdiction may impose restrictions on or prohibitions against such a right of offset in the event of the MRA counterparty’s bankruptcy or insolvency. Based on the terms of the MRA, the Series receives securities as collateral with a market value in excess of the repurchase price at maturity. Upon a bankruptcy or insolvency of the MRA counterparty, the Series would recognize a liability with respect to such excess collateral. The liability reflects the Series’ obligation under bankruptcy law to return the excess to the counterparty. As of Dec. 31, 2018, the following table is a summary of the Series’ repurchase agreements by counterparty which are subject to offset under an MRA:
| | | | | | | | | | | | | | | | | | | | | | | | | |
Counterparty | | Repurchase
Agreements | | Fair Value of
Non-Cash
Collateral Received(a) | | Cash Collateral
Received | | Net Collateral
Received | | Net Exposure(b) |
Bank of America Merrill Lynch | | | | $1,020,968 | | | | | $ — | | | | | $(1,020,968) | | | | | $(1,020,968) | | | $— |
Bank of Montreal | | | | 2,807,662 | | | | | (2,807,662) | | | | | — | | | | | $(2,807,662) | | | — |
BNP Paribas | | | | 4,591,016 | | | | | (4,591,016) | | | | | — | | | | | $(4,591,016) | | | — |
Total | | | | $8,419,646 | | | | | $(7,398,678) | | | | | $(1,020,968) | | | | | $(8,419,646) | | | $— |
(a)The value of the related collateral received exceeded the value of the repurchase agreements as of Dec. 31, 2018.
(b)Net exposure represents the receivable (payable) that would be due from (to) the counterparty in an event of default
9. Securities Lending
The Series, along with other funds in the Delaware Funds, may lend its securities pursuant to a security lending agreement (Lending Agreement) with The Bank of New York Mellon (BNY Mellon). At the time a security is loaned, the borrower must post collateral equal to the required percentage of the market value of the loaned security, including any accrued interest. The required percentage is: (1) 102% with respect to US securities and foreign securities that are denominated and payable in US dollars; and (2) 105% with respect to foreign securities. With respect to each loan, if on any business day, the aggregate market value of securities collateral plus cash collateral held is less than the aggregate market value of the securities which are the subject of such loan, the borrower will be notified to provide additional collateral by the end of the following business day which, together with the collateral already held, will be not less than the applicable initial collateral requirements for such security loan. If the aggregate market value of securities collateral and cash collateral held with respect to a security loan exceeds the applicable initial collateral requirement, upon the request of the borrower, BNY Mellon must return enough collateral to the borrower by the end of the following business day to reduce the value of the remaining collateral to the applicable initial collateral requirement for such security loan. As a result of the foregoing, the value of the collateral held with respect to a loaned security on any particular day may be more or less than the value of the security on loan. The collateral percentage with respect to the market value of the loaned security is determined by the security lending agent.
Cash collateral received by each series of the Trust is generally invested in a series of individual separate accounts, each corresponding to a series. The investment guidelines permit each separate account to hold certain securities that would be considered eligible securities for a money market fund. Cash collateral received is generally invested in government securities; certain obligations issued by government sponsored enterprises; repurchase agreements collateralized by US Treasury securities; obligations issued by the central government of any Organization for Economic Cooperation and Development (OECD) country or its agencies, instrumentalities, or establishments; obligations of supranational organizations; commercial paper, notes, bonds, and other debt obligations; certificates of deposit, time deposits, and other bank obligations; and asset-backed securities. A series can also accept US government securities and letters of credit(non-cash collateral) in connection with securities loans.
U.S. Growth Series-17
Delaware VIP® U.S. Growth Series
Notes to financial statements (continued)
9. Securities Lending (continued)
In the event of default or bankruptcy by the lending agent, realization and/or retention of the collateral may be subject to legal proceedings. In the event the borrower fails to return loaned securities and the collateral received is insufficient to cover the value of the loaned securities and provided such collateral shortfall is not the result of investment losses, the lending agent has agreed to pay the amount of the shortfall to the Series or, at the discretion of the lending agent, replace the loaned securities. The Series continues to record dividends or interest, as applicable, on the securities loaned and is subject to changes in value of the securities loaned that may occur during the term of the loan. The Series has the right under the Lending Agreement to recover the securities from the borrower on demand. With respect to security loans collateralized bynon-cash collateral, the Series receives loan premiums paid by the borrower. With respect to security loans collateralized by cash collateral, the earnings from the collateral investments are shared among the Series, the security lending agent, and the borrower. The Series records security lending income net of allocations to the security lending agent and the borrower.
The Series may incur investment losses as a result of investing securities lending collateral. This could occur if an investment in the collateral investment account defaulted or became impaired. Under those circumstances, the value of a Series’ cash collateral account may be less than the amount the Series would be required to return to the borrowers of the securities and the Series would be required to make up for this shortfall.
During the year ended Dec. 31, 2018, the Series had no securities out on loan.
10. Credit and Market Risk
The Series invests in growth stocks (such as those in the financial services sector), which reflect projections of future earnings and revenue. These prices may rise or fall dramatically depending on whether those projections are met. These companies’ stock prices may be more volatile, particularly over the short term.
The Series may invest up to 15% of its net assets in illiquid securities, which may include securities with contractual restrictions on resale, securities exempt from registration under Rule 144A, promulgated under Securities Act of 1933, as amended, and other securities which may not be readily marketable. The relative illiquidity of these securities may impair the Series from disposing of them in a timely manner and at a fair price when it is necessary or desirable to do so. While maintaining oversight, the Board has delegated to DMC, theday-to-day functions of determining whether individual securities are liquid for purposes of the Series’ limitation on investments in illiquid securities. Securities eligible for resale pursuant to Rule 144A, which are determined to be liquid, are not subject to the Series’ 15% limit on investments in illiquid securities. As of Dec. 31, 2018, there were no Rule 144A securities held by the Series. Restricted securities are valued to the security valuation procedures in Note 1.
11. Contractual Obligations
The Series enters into contracts in the normal course of business that contain a variety of indemnifications. The Series’ maximum exposure under these arrangements is unknown. However, the Series has not had prior claims or losses pursuant to these contracts. Management has reviewed the Series’ existing contracts and expects the risk of loss to be remote.
12. Recent Accounting Pronouncements
In August 2018, the FASB issued an Accounting Standards Update, ASU2018-13, which changes certain fair value measurement disclosure requirements. ASU2018-13, in addition to other modifications and additions, removes the requirement to disclose the amount and reasons for transfers between Level 1 and Level 2 of the fair value hierarchy, the policy for the timing of transfers between levels and the valuation process for Level 3 fair value measurements. ASU2018-13 is effective for fiscal years, and interim periods within those fiscal years, beginning after Dec. 15, 2019. At this time, management is evaluating the implications of these changes on the financial statements.
In August 2018, the Securities and Exchange Commission (SEC) adopted amendments to RegulationS-X to update and simplify the disclosure requirements for registered investment companies by eliminating requirements that are redundant or duplicative of US GAAP requirements or other SEC disclosure requirements. The new amendments require the presentation of the total, rather than the components, of distributable earnings on the “Statement of assets and liabilities” and the total, rather than the components, of dividends from net investment income and distributions from net realized gains on the “Statements of changes in net assets.” The amendments also removed the requirement for the parenthetical disclosure of undistributed net investment income on the “Statements of changes in net assets” and certain tax adjustments that were reflected in the “Notes to financial statements.” All of these have been reflected in the Fund’s financial statements.
13. Subsequent Events
Management has determined that no material events or transactions occurred subsequent to Dec. 31, 2018, that would require recognition or disclosure in the Series’ financial statements.
U.S. Growth Series-18
Delaware VIP® Trust — Delaware VIP U.S. Growth Series
Report of independent registered public accounting firm
To the Board of Trustees of Delaware VIP® Trust and Shareholders of Delaware VIP U.S. Growth Series
Opinion on the Financial Statements
We have audited the accompanying statement of assets and liabilities, including the schedule of investments, of Delaware VIP U.S. Growth Series (one of the series constituting Delaware VIP® Trust, referred to hereafter as the “Series”) as of December 31, 2018, the related statement of operations for the year ended December 31, 2018, the statements of changes in net assets for each of the two years in the period ended December 31, 2018, including the related notes, and the financial highlights for each of the five years in the period ended December 31, 2018 (collectively referred to as the “financial statements”). In our opinion, the financial statements present fairly, in all material respects, the financial position of the Series as of December 31, 2018, the results of its operations for the year then ended, the changes in its net assets for each of the two years in the period ended December 31, 2018 and the financial highlights for each of the five years in the period ended December 31, 2018 in conformity with accounting principles generally accepted in the United States of America.
Basis for Opinion
These financial statements are the responsibility of the Series’ management. Our responsibility is to express an opinion on the Series’ financial statements based on our audits. We are a public accounting firm registered with the Public Company Accounting Oversight Board (United States) (PCAOB) and are required to be independent with respect to the Series in accordance with the U.S. federal securities laws and the applicable rules and regulations of the Securities and Exchange Commission and the PCAOB.
We conducted our audits of these financial statements in accordance with the standards of the PCAOB. Those standards require that we plan and perform the audit to obtain reasonable assurance about whether the financial statements are free of material misstatement, whether due to error or fraud.
Our audits included performing procedures to assess the risks of material misstatement of the financial statements, whether due to error or fraud, and performing procedures that respond to those risks. Such procedures included examining, on a test basis, evidence regarding the amounts and disclosures in the financial statements. Our audits also included evaluating the accounting principles used and significant estimates made by management, as well as evaluating the overall presentation of the financial statements. Our procedures included confirmation of securities owned as of December 31, 2018 by correspondence with the custodian and brokers. We believe that our audits provide a reasonable basis for our opinion.
|
/s/ PricewaterhouseCoopers LLP |
Philadelphia, Pennsylvania |
February 14, 2019 |
We have served as the auditor of one or more investment companies in Delaware Funds® by Macquarie since 2010.
Delaware VIP® Trust — Delaware VIP U.S. Growth Series
Other Series information (Unaudited)
Board consideration of investment advisory andsub-advisory agreements for Delaware VIP U.S. Growth Series
At a meeting held on Aug.15-16, 2018 (the “Annual Meeting”), the Board of Trustees (the “Board”), including a majority of disinterested or independent Trustees, approved the renewal of the Investment Advisory Agreement and InvestmentSub-Advisory Agreement for Delaware VIP U.S. Growth Series (the “Series”). In making its decision, the Board considered information furnished at regular quarterly Board meetings, including reports detailing Series performance, investment strategies, and expenses, as well as information prepared specifically in connection with the renewal of the Investment Advisory Agreement. Information furnished specifically in connection with the renewal of the Investment Advisory Agreement with Delaware Management Company (“DMC”), a series of Macquarie Investment Management Business Trust (“MIMBT”) andSub-Advisory Agreement with Jackson Square Partners LLC (“JSP”), included materials provided by DMC and its affiliates (collectively, “Macquarie Investment Management”) and JSP, as applicable, concerning, among other things, the nature, extent, and quality of services provided to the Series; the costs of such services to the Series; economies of scale; and the investment manager’s financial condition and profitability. In addition, in connection with the Annual Meeting, materials were provided to the Trustees in May 2018, including reports provided by Broadridge Financial Solutions (“Broadridge”). The Broadridge reports compared the Series’ investment performance and expenses with those of other comparable mutual funds. The Independent Trustees reviewed and discussed the Broadridge reports with independent legal counsel to the Independent Trustees. In addition to the information noted above, the Board also requested and received information regarding DMC’s or JSP’s, as applicable, policy with respect to advisory fee levels and its breakpoint philosophy; the structure of portfolio manager compensation; comparative client fee information; and any constraints or limitations on the availability of securities for certain investment styles, which had in the past year inhibited, or which were likely in the future to inhibit, the investment manager’s ability to invest fully in accordance with Series policies.
In considering information relating to the approval of the Series’ Investment Advisory andSub-Advisory Agreements, the Independent Trustees received assistance and advice from and met separately with independent legal counsel to the Independent Trustees and also received assistance and advice from an experienced and knowledgeable independent fund consultant, JDL Consultants, LLC (“JDL”). Although the Board gave attention to all information furnished, the following discussion identifies, under separate headings, the primary factors taken into account by the Board during its contract renewal considerations.
Nature, extent, and quality of services.The Board considered the services provided by DMC to the Series and its shareholders. In reviewing the nature, extent, and quality of services, the Board considered reports furnished to it throughout the year, which covered matters such as the relative performance of the Series, compliance of portfolio managers with the investment policies, strategies and restrictions for the Series, compliance by DMC and Delaware Distributors, L.P. (together, “Management”) personnel with the Code of Ethics adopted throughout the Delaware Funds® by Macquarie (the “Delaware Funds”), and adherence to fair value pricing procedures as established by the Board. The Board was pleased with the current staffing of DMC and the emphasis placed on research in the investment process. The Board recognized DMC’s receipt of certain favorable industry distinctions during the past several years. The Board gave favorable consideration to DMC’s efforts to control expenses while maintaining service levels committed to Series matters. The Board was satisfied with the nature, extent, and quality of the overall services provided by DMC.
Nature, extent, and quality of services.The Board considered the services provided by JSP to the Series and its shareholders. In reviewing the nature, extent, and quality of services, the Board considered reports furnished to it throughout the year at regular Board Meetings covering matters such as relative performance of the Series, compliance of portfolio managers with the investment policies, strategies and restrictions for the Series, the compliance of JSP personnel with its Code of Ethics and adherence to fair value pricing procedures as established by the Board. The Board was pleased with the current staffing of JSP and the emphasis placed on research in the investment process. The Board was satisfied with the nature, extent, and quality of the overall services provided by JSP.
Investment performance.The Board placed significant emphasis on the investment performance of the Series in view of the importance of investment performance to shareholders. Although the Board considered performance reports and discussions with portfolio managers at Board meetings throughout the year, the Board gave particular weight to the Broadridge reports furnished for the Annual Meeting. The Broadridge reports prepared for the Series showed the investment performance of its Standard Class shares in comparison to a group of similar funds as selected by Broadridge (the “Performance Universe”). A fund with the best performance ranked first, and a fund with the poorest performance ranked last. The highest/best performing 25% of funds in the Performance Universe make up the first quartile; the next 25%, the second quartile; the next 25%, the third quartile; and the poorest/worst performing 25% of funds in the Performance Universe make up the fourth quartile. Comparative annualized performance for the Series was shown for the past1-,3-,5- and10-year periods, as applicable, ended Jan. 31, 2018. The Board’s objective is that the Series’ performance for the1-,3- and5-year periods be at or above the median of its Performance Universe.
The Performance Universe for the Series consisted of the Series and alllarge-cap growth funds underlying variable insurance products as selected by Broadridge. The Broadridge report comparison showed that the Series’ total return for the1- and10-year periods was in the third quartile of its Performance Universe. The report further showed that the Series’ total return for the3- and5-year periods was in the fourth quartile of its Performance Universe. The Board observed that the Series’ performance was not in line with the Board’s objective. In evaluating the Series’ performance, the Board
Delaware VIP® Trust — Delaware VIP U.S. Growth Series
Other Series information (Unaudited)
Board consideration of investment advisory andsub-advisory agreements for Delaware VIP U.S. Growth Series (continued)
considered the numerous investment and performance reports delivered by Management personnel to the Board’s Investments Committee. The Board was satisfied that Management was taking action to improve Series performance and to meet the Board’s performance objective.
Comparative expenses.The Board considered expense data for the Delaware Funds. Management provided the Board with information on pricing levels and fee structures for the Series as of its most recently completed fiscal year. The Board also focused on the comparative analysis of effective management fees and total expense ratios of the Series versus effective management fees and expense ratios of a group of similar funds as selected by Broadridge (the “Expense Group”). In reviewing comparative costs, the Series’ contractual management fee and the actual management fee incurred by the Series were compared with the contractual management fees (assuming all funds in the Expense Group were similar in size to the Series) and actual management fees (as reported by each fund) within the Expense Group, taking into account any applicable breakpoints and fee waivers. The Series’ total expenses were also compared with those of its Expense Group. The Broadridge total expenses, for comparative consistency, were shown by Broadridge for Standard Class shares which do not charge12b-1 andnon-12b-1 service fees. The Board’s objective is for the Series’ total expense ratio to be competitive with those of the peer funds within its Expense Group.
The expense comparisons for the Series showed that the actual management fee was in the quartile with the second lowest expenses of its Expense Group and its total expenses were in the quartile with the lowest expenses of its Expense Group. The Board was satisfied with the management fee and total expenses of the Series in comparison to those of its Expense Group.
Management profitability.The Board considered the level of profits realized by DMC in connection with the operation of the Series. In this respect, the Board reviewed the Investment Management Profitability Analysis that addressed the overall profitability of DMC’s business in providing management and other services to each of the individual funds and the Delaware Funds as a whole. Specific attention was given to the methodology used by DMC in allocating costs for the purpose of determining profitability. Management stated that the level of profits of DMC, to a certain extent, reflects recent operational cost savings and efficiencies initiated by DMC. The Board considered DMC’s efforts to improve services provided to Fund shareholders and to meet additional regulatory and compliance requirements resulting from recent industry-wide Securities and Exchange Commission initiatives. The Board also considered the extent to which DMC might derive ancillary benefits from fund operations, including the potential for procuring additional business as a result of the prestige and visibility associated with its role as service provider to the Delaware Funds and the benefits from allocation of fund brokerage to improve trading efficiencies. As part of its work, the Board also reviewed a report prepared by JDL regarding MIMBT profitability as compared to certain peer fund complexes and the Independent Trustees met with JDL personnel to discuss DMC’s profitability in such context. The Board found that the management fees were reasonable in light of the services rendered and the profitability of DMC.
Management profitability.Trustees were also given available information on profits being realized by JSP in relation to the services being provided to the Series and in relation to JSP’s overall investment advisory business, but believed such information to be of limited relevance because thesub-advisory fees are paid by DMC out of its management fee, and changes in the level ofsub-advisory fees have no impact on Series expenses. The Board was also provided information on potentialfall-out benefits derived or to be derived by JSP in connection with its relationship to the Series, such as reputational enhancement, soft dollar arrangements or commissions paid to affiliated broker-dealers, as applicable.
Economies of scale.The Trustees considered whether economies of scale are realized by DMC as the Series’ assets increase and the extent to which any economies of scale are reflected in the level of management fees charged. The Trustees reviewed the Series’ advisory fee pricing and structure approved by the Board and shareholders, which includes breakpoints, and which applies to most funds in the Delaware Funds complex. Breakpoints in the advisory fee occur when the advisory fee rate is reduced on assets in excess of specified levels. Breakpoints result in a lower advisory fee, than would otherwise be the case in the absence of breakpoints, when the asset levels specified in the breakpoints are exceeded. Although, as of March 31, 2018, the Series has not reached a size at which the advantages of any breakpoints in the applicable fee schedule, the Board recognized that the fee was structured so that, if the Series increases sufficiently in size, then economies of scale may be shared.
Tax Information
All disclosures are based on financial information available as of the date of this annual report and, accordingly are subject to change. For any and all items requiring reporting, it is the intention of the Series to report the maximum amount permitted under the Internal Revenue Code and the regulations thereunder.
U.S. Growth Series-21
Delaware VIP® Trust — Delaware VIP U.S. Growth Series
Other Series information (Unaudited)
For the year ended Dec. 31, 2018, the Series reports distributions paid during the year as follows:
| | | | |
(A) Long-Term Capital Gain Distributions (Tax Basis) | | (B)
Ordinary Income
Distributions
(Tax Basis) | | Total
Distributions
(Tax Basis) |
| 94.41% | | 5.59% | | 100.00% |
(A) and (B) are based on a percentage of the Series’ total distributions.
U.S. Growth Series-22
Delaware Funds® by Macquarie
Board of trustees / directors and officers addendum
A mutual fund is governed by a Board of Trustees/Directors (“Trustees”), which has oversight responsibility for the management of a fund’s business affairs. Trustees establish procedures and oversee and review the performance of the investment manager, the distributor, and others who perform services for the fund. The independent fund trustees, in particular, are advocates for shareholder interests. Each trustee has served in that capacity since he or she was elected to or appointed to the Board of Trustees, and will continue to serve until his or her retirement or the election of a new trustee in his or her place. The following is a list of the Trustees and Officers with certain background and related information.
| | | | | | | | | | |
Name, Address, and Birth Date | | Position(s) Held with Fund(s) | | Length of Time
Served | | Principal Occupation(s) During the Past Five Years | | Number of
Portfolios in Fund
Complex Overseen by Trustee or Officer | | Other Directorships Held by Trustee or Officer |
INTERESTED TRUSTEE | | | | | | | | | | |
| | | | | |
Shawn K. Lytle1,3 2005 Market Street Philadelphia, PA 19103 February 1970 | | President, Chief Executive Officer, and Trustee | | President and Chief Executive Officer since August 2015 Trustee since September 2015 | | President — Macquarie Investment Management2 (June 2015-Present) Regional Head of Americas — UBS Global Asset Management (April2010-May 2015) | | 59 | | Trustee — UBS Relationship Funds, SMA Relationship Trust, and UBS Funds (May 2010–April 2015) |
| INDEPENDENT TRUSTEES | | | | | | | | | | |
| | | | | |
Thomas L. Bennett 2005 Market Street Philadelphia, PA 19103 | | Chair and Trustee | | Trustee since March 2005 | | Private Investor (March 2004–Present) | | 59 | | None |
October 1947 | | | | Chair since March 2015 | | | | | | |
Jerome D. Abernathy 2005 Market Street Philadelphia, PA 19103 July 1959 | | Trustee | | Since January 2019 | | Managing Member, Stonebrook Capital Management, LLC (financial technology: macro factors and databases) (January 1993–Present) | | 59 | | None |
Ann D. Borowiec 2005 Market Street Philadelphia, PA 19103 November 1958 | | Trustee | | Since March 2015 | | Chief Executive Officer, Private Wealth Management (2011–2013) and Market Manager, New Jersey Private Bank (2005–2011) — J.P. Morgan Chase & Co. | | 59 | | Director — Banco Santander International (October 2016-Present) Director — Santander Bank, N.A. (December 2016-Present) |
Joseph W. Chow 2005 Market Street Philadelphia, PA 19103 January 1953 | | Trustee | | Since January 2013 | | Private Investor (April 2011–Present) | | 59 | | Director and Audit Committee Member — Hercules Technology Growth Capital, Inc. (July 2004–July 2014) |
John A. Fry 2005 Market Street Philadelphia, PA 19103 May 1960 | | Trustee | | Since January 2001 | | President — Drexel University (August 2010–Present) President — Franklin & Marshall College (July 2002–July 2010) | | 59 | | Director; Compensation Committee and Governance Committee Member — Community Health Systems Director — Drexel Morgan & Co. Director and Audit Committee Member — vTv Therapeutics LLC Director and Audit Committee Member — FS Credit Real Estate Income Trust, Inc. |
Lucinda S. Landreth 2005 Market Street Philadelphia, PA 19103 June 1947 | | Trustee | | Since March 2005 | | Private Investor (2004–Present) | | 59 | | None |
U.S. Growth Series-23
| | | | | | | | | | |
Name, Address, and Birth Date | | Position(s) Held with Fund(s) | | Length of Time Served | | Principal Occupation(s) During the Past Five Years | | Number of
Portfolios in Fund
Complex Overseen
by Trustee or Officer | | Other Directorships Held by Trustee or Officer |
| | | | | |
Frances A. Sevilla-Sacasa 2005 Market Street Philadelphia, PA 19103 January 1956 | | Trustee | | Since September 2011 | | Private Investor(January 2017-Present) Chief Executive Officer — Banco Itaú International (April 2012–December 2016) Executive Advisor to Dean (August 2011–March 2012) and Interim Dean (January 2011–July 2011) — University of Miami School of Business Administration President — U.S. Trust, Bank of America Private Wealth Management (Private Banking) (July 2007–December 2008) | | 59 | | Trust Manager and Audit Committee Chair — Camden Property Trust (August 2011-Present) Director — Carrizo Oil & Gas, Inc. (March 2018-Present) |
| | | | | |
Thomas K. Whitford 2005 Market Street Philadelphia, PA 19103 March 1956 | | Trustee | | Since January 2013 | | Vice Chairman (2010–April 2013) — PNC Financial Services Group | | 59 | | Director — HSBC North America Holdings Inc.(December 2013-Present) Director — HSBC USA Inc. .(July 2014-Present) Director — HSBC Bank USA, National Association(July 2014-March 2017) Director — HSBC Finance Corporation (December 2013-April 2018) |
| | | | | |
Christianna Wood 2005 Market Street Philadelphia, PA 19103 March 1956 | | Trustee | | Since January 2019 | | Chief Executive Officer and President — Gore Creek Capital, Ltd. (August 2009–Present) | | 59 | | Director and Audit Committee Member — H&R Block Corporation (July 2008-Present) Director and Audit Committee Member — Grange Insurance (2013-Present) Trustee and Audit Committee Member — The Merger Fund (2013-Present), The Merger Fund VL (2013-Present); WCM Alternatives: Event-Driven Fund (2013-Present), and WCM Alternatives: Credit Event Fund (December 2017-Present) Director — International Securities Exchange (2010-2016) |
| | | | | |
Janet L. Yeomans 2005 Market Street Philadelphia, PA 19103 July 1948 | | Trustee | | Since April 1999 | | Vice President and Treasurer (January 2006–July 2012), Vice President — Mergers & Acquisitions (January 2003–January 2006), and Vice President and Treasurer (July 1995–January 2003) — 3M Company | | 59 | | Director; Personnel and Compensation Committee Chair; Member of Nominating, Investments, and Audit Committees for various periods throughout directorship — Okabena Company (2009-2017) |
U.S. Growth Series-24
| | | | | | | | | | |
Name, Address, and Birth Date | | Position(s) Held with Fund(s) | | Length of Time Served | | Principal Occupation(s)
During the Past Five Years | | Number of
Portfolios in Fund
Complex Overseen
by Trustee or Officer | | Other
Directorships
Held by
Trustee
or Officer |
| OFFICERS | | | | | | | | | | |
| | | | | |
David F. Connor 2005 Market Street Philadelphia, PA 19103 December 1963 | | Senior Vice President, General Counsel, and Secretary | | Senior Vice President, since May 2013; General Counsel since May 2015; Secretary since October 2005 | | David F. Connor has served in various capacities at different times at Macquarie Investment Management. | | 59 | | None3 |
| | | | | |
Daniel V. Geatens 2005 Market Street Philadelphia, PA 19103 October 1972 | | Vice President and Treasurer | | Vice President and Treasurer since October 2007 | | Daniel V. Geatens has served in various capacities at different times at Macquarie Investment Management. | | 59 | | None3 |
| | | | | |
Richard Salus 2005 Market Street Philadelphia, PA 19103 October 1963 | | Senior Vice President and Chief Financial Officer | | Senior Vice President and Chief Financial Officer since November 2006 | | Richard Salus has served in various capacities at different times at Macquarie Investment Management. | | 59 | | None3 |
|
1 Shawn K. Lytle is considered to be an “Interested Trustee” because he is an executive officer of the Fund’s(s’) investment advisor. 2 Macquarie Investment Management is the marketing name for Macquarie Management Holdings, Inc. and its subsidiaries, including the Fund’s(s’) investment advisor, principal underwriter, and its transfer agent. 3 Shawn K. Lytle, David F. Connor, Daniel V. Geatens, and Richard Salus serve in similar capacities for the six portfolios of the Optimum Fund Trust, which have the same investment advisor, principal underwriter, and transfer agent as the registrant. Mr. Geatens also serves as the Chief Financial Officer and Treasurer for Macquarie Global Infrastructure Total Return Fund Inc., which has an affiliated investment manager. |
The Statement of Additional Information for the Fund(s) includes additional information about the Trustees and Officers and is available, without charge, upon request by calling 800523-1918.
U.S. Growth Series-25
| | | | |
| | |
| | The Series files its complete schedule of portfolio holdings with the Securities and Exchange Commission (SEC) for the first and third quarters of each fiscal year on FormN-Q. The Series’ FormsN-Q, as well as a description of the policies and procedures that the Series uses to determine how to vote proxies (if any) relating to portfolio securities are available without charge (i) upon request, by calling 800523-1918; and (ii) on the SEC’s website at sec.gov. In addition, a description of the policies and procedures that the Series uses to determine how to vote proxies (if any) relating to portfolio securities and the Schedule of Investments included in the Series’ most recent FormN-Q are available without charge on the Series’ website at delawarefunds.com/vip/literature. The Series’ FormsN-Q may be reviewed and copied at the SEC’s Public Reference Room in Washington, DC; information on the operation of the Public Reference Room may be obtained by calling 800SEC-0330. Information (if any) regarding how the Series voted proxies relating to portfolio securities during the most recently disclosed12-month period ended June 30 is available without charge (i) through the Series’ website at delawarefunds.com/proxy; and (ii) on the SEC’s website at sec.gov. | | |
| | |
| AR-VIPUSG 22048 (2/19) (730130) | | U.S. Growth Series-26 |
| | |
| | |
| |
 | |  |
| | |
| |
| | Annual report |
| | |
Delaware VIP® Trust
Delaware VIP Value Series
December 31, 2018
Table of contents
Other than Macquarie Bank Limited (MBL), none of the entities noted are authorized deposit-taking institutions for the purposes of the Banking Act 1959 (Commonwealth of Australia). The obligations of these entities do not represent deposits or other liabilities of MBL. MBL does not guarantee or otherwise provide assurance in respect of the obligations of these entities, unless noted otherwise. The Series is governed by US laws and regulations.
Unless otherwise noted, views expressed herein are current as of Dec. 31, 2018, and subject to change for events occurring after such date.
The Series is not FDIC insured and is not guaranteed. It is possible to lose the principal amount invested.
Advisory services provided by Delaware Management Company, a series of Macquarie Investment Management Business Trust (MIMBT), a US registered investment advisor.
The Series is distributed byDelaware Distributors, L.P.(DDLP), an affiliate of MIMBT and Macquarie Group Limited. Macquarie Investment Management (MIM), a member of Macquarie Group, is the marketing name for certain companies comprising the asset management division of Macquarie Group Limited and its subsidiaries and affiliates worldwide.
This material may be used in conjunction with the offering of shares in Delaware VIP Value Series only if preceded or accompanied by the Series’ current prospectus or the summary prospectus.
© 2019 Macquarie Management Holdings, Inc.
All third-party marks cited are the property of their respective owners.
| | |
| Delaware VIP®Trust — Delaware VIP Value Series | | |
| Portfolio management review | | January 8, 2019 |
For the fiscal year ended Dec. 31, 2018, Delaware VIP Value Series (the “Series”) Standard Class shares declined 2.73% and Service Class shares fell 3.00%. Both figures reflect all dividends reinvested. The Series outperformed its benchmark, the Russell 1000® Value Index, which declined 8.27% for the same period.
The broad-market S&P 500® Index posted its weakest yearly return since 2008 following a bigsell-off in the fourth quarter that included some of the largest, most popular growth stocks. A number of developments appeared to contribute to unease among investors, including slowing global growth, stalled tariff negotiations, a rising budget deficit, higher borrowing rates, turnover in the Trump administration and, in the final weeks of December, the federal government shutdown.
Following through on its plan to continue “normalizing” short-term interest rates, the Federal Open Market Committee implemented its fourth rate hike of the year and ninth since December 2015. The federal funds target range now stands at 2.25% to 2.50%.
Inflation levels remained modest. The Core US Consumer Price Index (Core CPI), which excludes food and energy prices, was 2.2% higher in November than a year earlier. The Core Personal Consumption Expenditures Price Index (Core PCE), the Federal Reserve’s preferred gauge, rose 1.9% during the same period. On the employment front,non-farm payrolls continued growing at a healthy pace, averaging 220,000 a month in 2018. The unemployment rate ended the year at 3.9%, slightly above the 3.7% reading for both October and November – the lowest rate in 49 years. (Sources: US Bureau of Economic Analysis, US Bureau of Labor Statistics.)
Oil prices plummeted after hitting a four-year high on Oct. 3. Brent crude, the international benchmark, was down nearly 20% in 2018, ending the year at $53.80 a barrel. West Texas Intermediate fell by a slightly larger amount. Several developments helped push prices lower, including investors’ fear of slower global growth, higher production from Iran following the Trump administration’s sanction waivers, rising crude inventories, and negative market psychology from low takeaway capacity in the Permian Basin.
Investments in the information technology and healthcare sectors made large contributions to relative performance. The Series’ position inCA Technologies, a provider of IT management software and solutions, led the way in technology. In July, the company agreed to be acquired by semiconductor developer Broadcom in anall-cash deal worth $18.9 billion – a premium to CA’s share price at that time.
In the healthcare sector, an overweight allocation contributed to the Series’ relative returns. Global pharmaceutical makerMerck & Co. Inc.was the top performer. The company has seen solid demand for its cancer drug, Keytruda®. This market-leading immunotherapy treatment continued to show efficacy across a range of studies and gained approvals (by the US Food and Drug Administration and similar entities in other countries) to treat various cancers.
Another strong contributor was healthcare sector holdingAbbott Laboratories, a diversified medical products manufacturer. The company continued to execute well, particularly in its medical devices business, and announced positive clinical trial results for an important cardiovascular device.
Stock selection and an underweight allocation in the utilities sector hurt the Series’ relative performance the most during the12-month period. The Series’ one holding in the sector, Southern California-basedEdison International, came under pressure in response to investors’ concerns about liabilities associated with the wildfires in its service area. Despite the scale and destruction of the Woolsey fire, we believed the market had overly discounted Edison’s current and future wildfire liability risk. That said, we will continue to closely monitor the stock’s valuation discount, the California utility business environment, and any company-specific changes.
Halliburton Co., a provider of energy services, was a significant detractor from the Series’ performance. The company’s operations have remained under pressure as international markets have been slow to recover, exploration and production budgets in the United States have been pared back, and activity levels have fallen, notably in the Permian Basin. To this last point, thebuild-out of pipelines and other infrastructure in the Permian Basin should lead to a rebound in activity levels, in our view.
Another healthcare stock, pharmaceutical and medical-products distributorCardinal Health Inc.was a notable detractor. Several developments have pressured the company’s shares, including weak performance in its Cordis medical-device unit, higher-than-expected deflation in generic drug pricing, and investors’ concerns about increasing competition in the pharmaceutical supply chain.
During the fiscal year, there was one full position sale and purchase in the Series. We exited the Series’ position in integrated oil companyChevron Corp., reducing our target weight in the energy sector from 15% to 12%. A longtime Series holding that had been a solid performer, Chevron’s shares were near theirall-time high reached in 2014 before theoil-market correction, and within 10% of our price target. We used the proceeds of this sale to purchaseAmerican International Group Inc. (AIG), a leading global multi-line insurer that we found attractively valued. AIG has significantly changed since it nearly went bankrupt during the global financial crisis. More recently, AIG has faced new challenges owing to poor underwriting in its core property and casualty
Unless otherwise noted, views expressed herein are current as of Dec. 31, 2018, and subject to change.
Value Series-1
| | |
| Delaware VIP®Trust — Delaware VIP Value Series | | |
| Portfolio management review (continued) | | January 8, 2019 |
business. This led to significant reserve charges and turnover in senior- andmid-level management. Consequently, financial and share-price performance was weak relative to peers. Valuation looked attractive to us and a new, highly regarded management team took steps to improve balance-sheet strength and underwriting discipline. In our view, AIG offers attractive upside potential if it can deliver on its business turnaround. The purchase raised the Series’ target weight in the financial sector to 15%.
Throughout the fiscal year, we maintained our value-oriented approach to managing the Series. In all market conditions, we try to look past the industry’s short-term concerns about companies and focus on their long-term revenue, earnings, and cash-flow potential. Although high valuations have tempered our performance expectations for the US equity market, our long-term outlook for stocks – especially those value-oriented, higher-quality stocks that we emphasize in the Series – remains positive.
Unless otherwise noted, views expressed herein are current as of Dec. 31, 2018, and subject to change.
Value Series-2
Delaware VIP® Trust — Delaware VIP Value Series
Performance summary
The performance quoted represents past performance and does not guarantee future results. Investment return and principal value of an investment will fluctuate so that shares, when redeemed, may be worth more or less than their original cost. Current performance may be lower or higher than the performance quoted.
Carefully consider the Series’ investment objectives, risk factors, charges, and expenses before investing. This and other information can be found in the Series’ prospectus and its summary prospectus, which may be obtained by visiting delawarefunds.com/vip/literature or calling 800523-1918. Investors should read the prospectus and the summary prospectus carefully before investing.
| | | | | | | | | | | | | | | | | | | | | | | | |
| Delaware VIP Value Series | | | | | | | | | | | | | | | | | | |
| Average annual total returns | | | | | | | | | | | | | | | | | | |
| For periods ended December 31, 2018 | | 1 year | | | 3 years | | | 5 years | | | 10 years | | | Lifetime | | | | |
Standard Class shares (commenced operations on July 28, 1988) | | | -2.73% | | | | +8.27% | | | | +7.58% | | | | +12.69% | | | | +8.74% | | | | | |
| | | | | | | | | | | | | | | | | | | | | | | | |
Service Class shares (commenced operations on May 1, 2000) | | | -3.00% | | | | +7.98% | | | | +7.30% | | | | +12.40% | | | | +7.17% | | | | | |
| | | | | | | | | | | | | | | | | | | | | | | | |
Russell 1000 Value Index | | | -8.27% | | | | +6.95% | | | | +5.95% | | | | +11.18% | | | | n/a | | | | | |
Returns reflect the reinvestment of all distributions. Please see page 4 for a description of the index.
As described in the Series’ most recent prospectus, the net expense ratio for Service Class shares of the Series was 0.95%, while total operating expenses for Standard Class and Service Class shares were 0.70% and 1.00%, respectively. The management fee for Standard Class and Service Class shares was 0.63%. Please see the “Financial highlights” section in this report for the most recent expense ratios.
The Series pays Delaware Distributors, L.P. (DDLP), the distributor and an affiliate of DMC, an annual12b-1 fee of 0.30% of the average daily net assets of the Service Class shares. Prior to May 1, 2018, DDLP had contracted to waive12b-1 fees in order to limit12b-1 fees of the Service Class shares to 0.25% of average daily net assets.
Earnings from a variable annuity or variable life investment compoundtax-free until withdrawal, and as a result, no adjustments were made for income taxes.
Expense limitations were in effect for both classes during certain periods shown in the Series performance table above and in the Performance of a $10,000 Investment graph on the next page.
Performance data do not reflect insurance fees related to a variable annuity or variable life investment or the deferred sales charge that would apply to certain withdrawals of investments held for fewer than eight years. Performance shown here would have been reduced if such fees were included and the expense limitation removed. For more information about fees, consult your variable annuity or variable life prospectus.
Investments in variable products involve risk.
Please read both the contract and underlying prospectus for specific details regarding the product’s risk profile.
Value Series-3
Delaware VIP Value Series
Performance summary (continued)
| | | | |
| For period beginning Dec. 31, 2008 through Dec. 31, 2018 | | Starting value | | Ending value |
— Delaware VIP Value Series (Standard Class) | | $10,000 | | $33,014 |
- - Russell 1000 Value Index | | $10,000 | | $28,853 |
The graph shows a $10,000 investment in the Delaware VIP Value Series Standard Class shares for the period from Dec. 31, 2008 through Dec. 31, 2018.
The graph also shows $10,000 invested in the Russell 1000 Value Index for the period from Dec. 31, 2008 through Dec. 31, 2018. The Russell 1000 Value Index measures the performance of thelarge-cap value segment of the US equity universe. It includes those Russell 1000 companies with lowerprice-to-book ratios and lower forecasted growth values.
The S&P 500 Index, mentioned on page 1, measures the performance of 500 mostlylarge-cap stocks weighted by market value, and is often used to represent performance of the US stock market.
The Core US Consumer Price Index (Core CPI), mentioned on page 1, is a measure of inflation that is calculated by the US Department of Labor, representing changes in prices of all goods and services, excluding those with high price volatility, such as food and energy, purchased for consumption by urban households.
The Core Personal Consumption Expenditures Price Index (Core PCE), mentioned on page 1, measures the prices paid by consumers for goods and services excluding food and energy prices, because of the volatility caused by movements in food and energy prices, to reveal underlying inflation trends.
Frank Russell Company (“Russell”) is the source and owner of the trademarks, service marks, and copyrights related to the Russell Indexes. Russell® is a trademark of the Frank Russell Company.
Index performance returns do not reflect any management fees, transaction costs or expenses. Indices are unmanaged and one cannot invest directly in an index.
Performance of Service Class shares will vary due to different charges and expenses.
Past performance is not a guarantee of future results.
Value Series-4
Delaware VIP® Trust — Delaware VIP Value Series
Disclosure of Series expenses
For thesix-month period from July 1, 2018 to December 31, 2018 (Unaudited)
As a shareholder of the Series, you incur ongoing costs, which may include management fees; distribution and service(12b-1) fees; and other Series expenses. This example is intended to help you understand your ongoing costs (in dollars) of investing in the Series and to compare these costs with the ongoing costs of investing in other mutual funds.
The example is based on an investment of $1,000 invested at the beginning of the period and held for the entiresix-month period from July 1, 2018 to Dec. 31, 2018.
Actual expenses
The first section of the table shown, “Actual Series return,” provides information about actual account values and actual expenses. You may use the information in this section of the table, together with the amount you invested, to estimate the expenses that you paid over the period. Simply divide your account value by $1,000 (for example, an $8,600 account value divided by $1,000 = 8.6), then multiply the result by the number in the first section under the heading entitled “Expenses Paid During Period” to estimate the expenses you paid on your account during the period.
Hypothetical example for comparison purposes
The second section of the table shown, “Hypothetical 5% return,” provides information about hypothetical account values and hypothetical expenses based on the Series’ actual expense ratio and an assumed rate of return of 5% per year before expenses, which is not the Series’ actual return. The hypothetical account values and expenses may not be used to estimate the actual ending account balance or expenses you paid for the period. You may use this information to compare the ongoing costs of investing in the Series and other funds. To do so, compare the 5% hypothetical example with the 5% hypothetical examples that appear in the shareholder reports of other funds.
Please note that the expenses shown in the table are meant to highlight your ongoing costs only. As a shareholder of the Series, you do not incur any transaction costs, such as sales charges (loads), redemption fees or exchange fees, but shareholders of other funds may incur such costs. Also, the fees related to the variable annuity investment or the deferred sales charge that could apply have not been included. Therefore, the second section of the table is useful in comparing ongoing costs only, and will not help you determine the relative total costs of owning different funds. The Series’ expenses shown in the table assume reinvestment of all dividends and distributions.
Expense analysis of an investment of $1,000
| | | | | | | | | | | | | | | | |
| | | Beginning
Account
Value
7/1/18 | | | Ending
Account
Value
12/31/18 | | | Annualized
Expense
Ratio | | | Expenses
Paid During
Period
7/1/18 to
12/31/18* | |
| | | | |
Actual Series return† | | | | | | | | | | | | | | | | |
Standard Class | | | $1,000.00 | | | | $961.30 | | | | 0.69% | | | | $3.41 | |
Service Class | | | 1,000.00 | | | | 959.80 | | | | 0.99% | | | | 4.89 | |
Hypothetical 5% return(5% return before expenses) | |
Standard Class | | | $1,000.00 | | | | $1,021.73 | | | | 0.69% | | | | $3.52 | |
Service Class | | | 1,000.00 | | | | 1,020.21 | | | | 0.99% | | | | 5.04 | |
*“Expenses Paid During Period” are equal to the Series’ annualized expense ratio, multiplied by the average account value over the period, multiplied by 184/365 (to reflect theone-half year period).
†Because actual returns reflect only the most recentsix-month period, the returns shown may differ significantly from fiscal year returns.
Value Series-5
Delaware VIP® Trust — Delaware VIP Value Series
Security type / sector allocation and top 10 equity holdings
As of December 31, 2018 (Unaudited)
Sector designations may be different than the sector designations presented in other Series materials. The sector designations may represent the investment manager’s internal sector classifications.
| | | | |
| Security type / sector | | Percentage of
net assets |
| |
Common Stock | | | 96.04 | % |
Communication Services | | | 5.72 | % |
Consumer Discretionary | | | 6.43 | % |
Consumer Staples | | | 6.00 | % |
Energy | | | 11.15 | % |
Financials | | | 14.77 | % |
Healthcare | | | 24.50 | % |
Industrials | | | 8.95 | % |
Information Technology | | | 9.46 | % |
Materials | | | 2.81 | % |
Real Estate | | | 3.10 | % |
Utilities | | | 3.15 | % |
Short-Term Investments | | | 4.44 | % |
Total Value of Securities | | | 100.48 | % |
Liabilities Net of Receivables and Other Assets | | | (0.48 | %) |
Total Net Assets | | | 100.00 | % |
Holdings are for informational purposes only and are subject to change at any time. They are not a recommendation to buy, sell, or hold any security.
| | | | |
| Top 10 equity holdings | | Percentage
of net assets |
| |
Waste Management | | | 3.43 | % |
Pfizer | | | 3.42 | % |
Abbott Laboratories | | | 3.39 | % |
Merck & Co. | | | 3.32 | % |
Dollar Tree | | | 3.30 | % |
Intel | | | 3.24 | % |
Marsh & McLennan | | | 3.18 | % |
Mondelez International Class A | | | 3.16 | % |
Edison International | | | 3.15 | % |
Lowe’s | | | 3.13 | % |
Value Series-6
Delaware VIP®Trust — Delaware VIP Value Series
Schedule of investments
December 31, 2018
| | | | | | | | |
| | | Number of
shares | | | Value (US $) | |
| |
Common Stock – 96.04% | | | | | |
Communication Services – 5.72% | |
AT&T | | | 697,324 | | | $ | 19,901,627 | |
Verizon Communications | | | 396,800 | | | | 22,308,096 | |
| | | | | | | | |
| | | | | | | 42,209,723 | |
| | | | | | | | |
Consumer Discretionary – 6.43% | |
Dollar Tree † | | | 269,400 | | | | 24,332,208 | |
Lowe’s | | | 250,100 | | | | 23,099,236 | |
| | | | | | | | |
| | | | | | | 47,431,444 | |
| | | | | | | | |
Consumer Staples – 6.00% | |
Archer-Daniels-Midland | | | 511,500 | | | | 20,956,155 | |
Mondelez International Class A | | | 583,100 | | | | 23,341,493 | |
| | | | | | | | |
| | | | | | | 44,297,648 | |
| | | | | | | | |
Energy – 11.15% | | | | | | | | |
ConocoPhillips | | | 346,400 | | | | 21,598,040 | |
Halliburton | | | 740,900 | | | | 19,693,122 | |
Marathon Oil | | | 1,452,657 | | | | 20,831,101 | |
Occidental Petroleum | | | 327,500 | | | | 20,101,950 | |
| | | | | | | | |
| | | | | | | 82,224,213 | |
| | | | | | | | |
Financials – 14.77% | | | | | |
Allstate | | | 265,500 | | | | 21,938,265 | |
American International Group | | | 553,600 | | | | 21,817,376 | |
Bank of New York Mellon | | | 446,400 | | | | 21,012,048 | |
BB&T | | | 478,800 | | | | 20,741,616 | |
Marsh & McLennan | | | 293,700 | | | | 23,422,575 | |
| | | | | | | | |
| | | | | | | 108,931,880 | |
| | | | | | | | |
Healthcare – 24.50% | | | | | |
Abbott Laboratories | | | 346,000 | | | | 25,026,180 | |
Cardinal Health | | | 478,500 | | | | 21,341,100 | |
Cigna | | | 115,619 | | | | 21,958,347 | |
CVS Health | | | 322,300 | | | | 21,117,096 | |
Johnson & Johnson | | | 168,200 | | | | 21,706,210 | |
Merck & Co. | | | 320,800 | | | | 24,512,328 | |
Pfizer | | | 577,541 | | | | 25,209,665 | |
Quest Diagnostics | | | 238,000 | | | | 19,818,260 | |
| | | | | | | | |
| | | | | | | 180,689,186 | |
| | | | | | | | |
Industrials – 8.95% | | | | | |
Northrop Grumman | | | 84,200 | | | | 20,620,580 | |
Raytheon | | | 131,000 | | | | 20,088,850 | |
Waste Management | | | 284,400 | | | | 25,308,756 | |
| | | | | | | | |
| | | | | | | 66,018,186 | |
| | | | | | | | |
Information Technology – 9.46% | |
Cisco Systems | | | 532,800 | | | | 23,086,224 | |
Intel | | | 509,600 | | | | 23,915,528 | |
Oracle | | | 504,000 | | | | 22,755,600 | |
| | | | | | | | |
| | | | | | | 69,757,352 | |
| | | | | | | | |
Materials – 2.81% | | | | | | | | |
DowDuPont | | | 387,156 | | | | 20,705,103 | |
| | | | | | | | |
| | | | | | | 20,705,103 | |
| | | | | | | | |
| | | | | | | | |
| | | Number of | | | Value | |
| | | shares | | | (US $) | |
|
Common Stock (continued) | |
Real Estate – 3.10% | | | | | |
Equity Residential | | | 346,800 | | | $ | 22,892,268 | |
| | | | | | | | |
| | | | | | | 22,892,268 | |
| | | | | | | | |
Utilities – 3.15% | | | | | | | | |
Edison International | | | 409,200 | | | | 23,230,284 | |
| | | | | | | | |
| | | | | | | 23,230,284 | |
| | | | | | | | |
Total Common Stock
(cost $467,203,184) | | | | | | | 708,387,287 | |
| | | | | | | | |
| | | Principal | | | | |
| | | amount° | | | | |
Short-Term Investments – 4.44% | |
Discount Note – 0.69%≠ | |
Federal Home Loan Bank 1.05% 1/2/19 | | | 5,107,987 | | | | 5,107,987 | |
| | | | | | | | |
| | | | | | | 5,107,987 | |
| | | | | | | | |
Repurchase Agreements – 3.57% | |
Bank of America Merrill Lynch 2.95%, dated 12/31/18, to be repurchased on 1/2/19, repurchase at $3,193,015 (cash collateralized of $3,192,492) | | | 3,192,492 | | | | 3,192,492 | |
Bank of Montreal 2.60%, dated 12/31/18, to be repurchased on 1/2/19, repurchase price $8,780,621 (collateralized by US government obligations 0.00%–3.75% 1/24/19–2/15/47; market value $8,954,941) | | | 8,779,353 | | | | 8,779,353 | |
Value Series–7
Delaware VIP® Value Series
Schedule of investments (continued)
| | | | | | | | |
| | | Principal | | | Value | |
| | | amount° | | | (US $) | |
Short-Term Investments (continued) | |
Repurchase Agreements (continued) | |
BNP Paribas
2.93%, dated 12/31/18, to be repurchased on 1/2/19, repurchase price $14,358,111 (collateralized by US government obligations 0.00%–8.00% 2/15/19–8/15/46; market value $14,642,890) | | | 14,355,774 | | | $ | 14,355,774 | |
| | | | | | | | |
| | | | | | | 26,327,619 | |
| | | | | | | | |
| | | | | | | | |
| | | Principal | | | Value | |
| | | amount° | | | (US $) | |
Short-Term Investments (continued) | |
US Treasury Obligation – 0.18%≠ | |
US Treasury Bill 1.493% 1/3/19 | | | 1,329,149 | | | $ | 1,329,065 | |
| | | | | | | | |
| | | | | | | 1,329,065 | |
| | | | | | | | |
Total Short-Term Investments
(cost $32,764,291) | | | | 32,764,671 | |
| | | | | | | | |
| | | | |
Total Value of Securities – 100.48%
(cost $499,967,475) | | $ | 741,151,958 | |
≠ The rate shown is the effective yield at the time of purchase.
° Principal amount shown is stated in USD unless noted that the security is denominated in another currency.
†Non-income producing security.
USD – US Dollar
See accompanying notes, which are an integral part of the financial statements.
Value Series-8
| | |
Delaware VIP®Trust — Delaware VIP Value Series | | |
Statement of assets and liabilities | | December 31, 2018 |
| | | | |
Assets: | | | | |
Investments, at value1 | | $ | 741,151,958 | |
Cash | | | 1,012 | |
Dividends and interest receivable | | | 1,452,249 | |
Receivable for series shares sold | | | 59,358 | |
| | | | |
Total assets | | | 742,664,577 | |
| | | | |
Liabilities: | | | | |
Payable for securities purchased | | | 3,131,578 | |
Payable for series shares redeemed | | | 1,361,511 | |
Investment management fees payable to affiliates | | | 405,791 | |
Distribution fees payable to affiliates | | | 92,120 | |
Other accrued expenses | | | 72,005 | |
Dividend disbursing and transfer agent fees and expenses payable to affiliates | | | 4,807 | |
Accounting and administration expenses payable to affiliates | | | 2,824 | |
Trustees’ fees and expenses payable to affiliates | | | 1,995 | |
Legal fees payable to affiliates | | | 1,388 | |
Reports and statements to shareholders expenses payable to affiliates | | | 547 | |
| | | | |
Total liabilities | | | 5,074,566 | |
| | | | |
Total Net Assets | | $ | 737,590,011 | |
| | | | |
| |
Net Assets Consist of: | | | | |
Paid-in capital | | $ | 432,156,112 | |
Total distributable earnings (loss) | | | 305,433,899 | |
| | | | |
Total Net Assets | | $ | 737,590,011 | |
| | | | |
| |
Net Asset Value: | | | | |
Standard Class: | | | | |
Net assets | | $ | 388,644,166 | |
Shares of beneficial interest outstanding, unlimited authorization, no par | | | 13,726,438 | |
Net asset value per share | | $ | 28.31 | |
| |
Service Class: | | | | |
Net assets | | $ | 348,945,845 | |
Shares of beneficial interest outstanding, unlimited authorization, no par | | | 12,372,505 | |
Net asset value per share | | $ | 28.20 | |
| |
| ________________ | | | | |
1Investments, at cost | | $ | 499,967,475 | |
See accompanying notes, which are an integral part of the financial statements.
Value Series-9
| | |
Delaware VIP®Trust — | | Delaware VIP Trust — |
Delaware VIP Value Series | | Delaware VIP Value Series |
Statement of operations | | Statements of changes in net assets |
Year ended December 31, 2018 | | |
| | | | |
Investment Income: | | | | |
Dividends | | $ | 19,376,370 | |
Interest | | | 232,990 | |
| | | | |
| | | 19,609,360 | |
| | | | |
Expenses: | | | | |
Management fees | | | 5,036,841 | |
Distribution expenses-Service Class | | | 1,116,625 | |
Accounting and administration expenses | | | 176,144 | |
Reports and statements to shareholders expenses | | | 69,665 | |
Dividend disbursing and transfer agent fees and expenses | | | 66,672 | |
Legal fees | | | 45,325 | |
Trustees’ fees and expenses | | | 38,275 | |
Audit and tax fees | | | 34,075 | |
Custodian fees | | | 20,004 | |
Registration fees | | | 2,079 | |
Other | | | 20,762 | |
| | | | |
| | | 6,626,467 | |
Less waived distribution expenses-Service Class | | | (60,382 | ) |
Less expenses paid indirectly | | | (983 | ) |
| | | | |
Total operating expenses | | | 6,565,102 | |
| | | | |
Net Investment Income | | | 13,044,258 | |
| | | | |
| |
Net Realized and Unrealized Gain (Loss): | | | | |
Net realized gain on investments | | | 56,062,721 | |
Net change in unrealized appreciation (depreciation) of investments | | | (89,340,596 | ) |
| | | | |
| |
Net Realized and Unrealized Loss | | | (33,277,875 | ) |
| | | | |
Net Decrease in Net Assets Resulting from Operations | | $ | (20,233,617 | ) |
| | | | |
| | | | | | | | |
| | | Year ended | |
| | | 12/31/18 | | | 12/31/17 | |
Increase (Decrease) in Net Assets from Operations: | | | | | | | | |
Net investment income | | $ | 13,044,258 | | | $ | 12,276,547 | |
Net realized gain | | | 56,062,721 | | | | 46,724,022 | |
Net change in unrealized appreciation (depreciation) | | | (89,340,596 | ) | | | 43,743,221 | |
| | | | | | | | |
Net increase (decrease) in net assets resulting from operations | | | (20,233,617 | ) | | | 102,743,790 | |
| | | | | | | | |
Dividends and Distributions to Shareholders from: | | | | | | | | |
Distributable earnings*: | | | | | | | | |
Standard Class | | | (33,362,526 | ) | | | (22,795,807 | ) |
Service Class | | | (27,989,816 | ) | | | (18,144,766 | ) |
| | | | | | | | |
| | | (61,352,342 | ) | | | (40,940,573 | ) |
| | | | | | | | |
|
Capital Share Transactions: | |
Proceeds from shares sold: | | | | | | | | |
Standard Class | | | 11,383,861 | | | | 12,865,735 | |
Service Class | | | 35,186,107 | | | | 16,646,009 | |
Net asset value of shares issued upon reinvestment of dividends and distributions: | | | | | | | | |
Standard Class | | | 33,362,526 | | | | 22,795,807 | |
Service Class | | | 27,989,816 | | | | 18,144,766 | |
| | | | | | | | |
| | | 107,922,310 | | | | 70,452,317 | |
| | | | | | | | |
Cost of shares redeemed: | | | | | | | | |
Standard Class | | | (45,227,144 | ) | | | (76,487,482 | ) |
Service Class | | | (47,969,409 | ) | | | (56,438,162 | ) |
| | | | | | | | |
| | | (93,196,553 | ) | | | (132,925,644 | ) |
| | | | | | | | |
Increase (decrease) in net assets derived from capital share transactions | | | 14,725,757 | | | | (62,473,327 | ) |
| | | | | | | | |
Net Decrease in Net Assets | | | (66,860,202 | ) | | | (670,110 | ) |
| | |
Net Assets: | | | | | | | | |
Beginning of year | | | 804,450,213 | | | | 805,120,323 | |
| | | | | | | | |
End of year1 | | $ | 737,590,011 | | | $ | 804,450,213 | |
| | | | | | | | |
|
1 Net Assets - End of year includes undistributed net investment income of $12,271,080 in 2017. The Securities and Exchange Commission eliminated the requirement to disclose undistributed (distributions in excess of) net investment income in 2018. |
* For the year ended Dec. 31, 2018, the Series has adopted amendments to RegulationS-X (see Note 12 in “Notes to financial statements”). For the year ended Dec. 31, 2017, the dividends and distributions to shareholders were as follows: |
| | | | | | | | |
| | | Standard Class | | | Service Class | |
Dividends from net investment income | | | $ (7,573,948 | ) | | | $ (5,452,064 | ) |
Distributions from net realized gain | | | (15,221,859 | ) | | | (12,692,702 | ) |
See accompanying notes, which are an integral part of the financial statements.
Value Series-10
Delaware VIP® Trust — Delaware VIP Value Series
Financial highlights
Selected data for each share of the Series outstanding throughout each period were as follows:
| | | | | | | | | | | | | | | | | | | | |
| | | Delaware VIP Value Series Standard Class | |
| | | Year ended | |
| | | 12/31/18 | | | 12/31/17 | | | 12/31/16 | | | 12/31/15 | | | 12/31/14 | |
Net asset value, beginning of period | | $ | 31.57 | | | $ | 29.25 | | | $ | 28.64 | | | $ | 29.24 | | | $ | 26.09 | |
| | | | | |
Income (loss) from investment operations: | | | | | | | | | | | | | | | | | | | | |
Net investment income1 | | | 0.54 | | | | 0.48 | | | | 0.52 | | | | 0.55 | | | | 0.48 | |
Net realized and unrealized gain (loss) | | | (1.29 | ) | | | 3.38 | | | | 3.39 | | | | (0.65 | ) | | | 3.12 | |
| | | | | | | | | | | | | | | | | | | | |
Total from investment operations | | | (0.75 | ) | | | 3.86 | | | | 3.91 | | | | (0.10 | ) | | | 3.60 | |
| | | | | | | | | | | | | | | | | | | | |
| | | | | |
Less dividends and distributions from: | | | | | | | | | | | | | | | | | | | | |
Net investment income | | | (0.53 | ) | | | (0.51 | ) | | | (0.59 | ) | | | (0.50 | ) | | | (0.45 | ) |
Net realized gain | | | (1.98 | ) | | | (1.03 | ) | | | (2.71 | ) | | | — | | | | — | |
| | | | | | | | | | | | | | | | | | | | |
Total dividends and distributions | | | (2.51 | ) | | | (1.54 | ) | | | (3.30 | ) | | | (0.50 | ) | | | (0.45 | ) |
| | | | | | | | | | | | | | | | | | | | |
| | | | | |
Net asset value, end of period | | $ | 28.31 | | | $ | 31.57 | | | $ | 29.25 | | | $ | 28.64 | | | $ | 29.24 | |
| | | | | | | | | | | | | | | | | | | | |
| | | | | |
Total return2 | | | (2.73% | ) | | | 13.80% | | | | 14.65% | | | | (0.41% | ) | | | 14.00% | |
| | | | | |
Ratios and supplemental data: | | | | | | | | | | | | | | | | | | | | |
Net assets, end of period (000 omitted) | | $ | 388,644 | | | $ | 431,874 | | | $ | 439,265 | | | $ | 389,570 | | | $ | 523,240 | |
Ratio of expenses to average net assets | | | 0.69% | | | | 0.70% | | | | 0.70% | | | | 0.71% | | | | 0.71% | |
Ratio of net investment income to average net assets | | | 1.77% | | | | 1.64% | | | | 1.87% | | | | 1.88% | | | | 1.74% | |
Portfolio turnover | | | 13% | | | | 11% | | | | 17% | | | | 17% | | | | 12% | |
| 1 | The average shares outstanding method has been applied for per share information. |
| 2 | Total return is based on the change in net asset value of a share during the period and assumes reinvestment of dividends and distributions at net asset value. Total return does not include fees, charges, or expenses imposed by the variable annuity and life insurance contracts for which Delaware VIP Trust serves as an underlying investment vehicle. |
See accompanying notes, which are an integral part of the financial statements.
Value Series-11
Delaware VIP® Value Series
Financial highlights (continued)
Selected data for each share of the Series outstanding throughout each period were as follows:
| | | | | | | | | | | | | | | | | | | | |
| | | Delaware VIP Value Series Service Class | |
| | | Year ended | |
| | | 12/31/18 | | | 12/31/17 | | | 12/31/16 | | | 12/31/15 | | | 12/31/14 | |
Net asset value, beginning of period | | $ | 31.46 | | | $ | 29.15 | | | $ | 28.56 | | | $ | 29.16 | | | $ | 26.03 | |
| | | | | |
Income (loss) from investment operations: | | | | | | | | | | | | | | | | | | | | |
Net investment income1 | | | 0.45 | | | | 0.41 | | | | 0.45 | | | | 0.47 | | | | 0.41 | |
Net realized and unrealized gain (loss) | | | (1.28 | ) | | | 3.37 | | | | 3.37 | | | | (0.64 | ) | | | 3.12 | |
| | | | | | | | | | | | | | | | | | | | |
Total from investment operations | | | (0.83 | ) | | | 3.78 | | | | 3.82 | | | | (0.17 | ) | | | 3.53 | |
| | | | | | | | | | | | | | | | | | | | |
| | | | | |
Less dividends and distributions from: | | | | | | | | | | | | | | | | | | | | |
Net investment income | | | (0.45 | ) | | | (0.44 | ) | | | (0.52 | ) | | | (0.43 | ) | | | (0.40 | ) |
Net realized gain | | | (1.98 | ) | | | (1.03 | ) | | | (2.71 | ) | | | — | | | | — | |
| | | | | | | | | | | | | | | | | | | | |
Total dividends and distributions | | | (2.43 | ) | | | (1.47 | ) | | | (3.23 | ) | | | (0.43 | ) | | | (0.40 | ) |
| | | | | | | | | | | | | | | | | | | | |
| | | | | |
Net asset value, end of period | | $ | 28.20 | | | $ | 31.46 | | | $ | 29.15 | | | $ | 28.56 | | | $ | 29.16 | |
| | | | | | | | | | | | | | | | | | | | |
| | | | | |
Total return2 | | | (3.00% | ) | | | 13.53% | | | | 14.32% | | | | (0.64% | ) | | | 13.70% | |
| | | | | |
Ratios and supplemental data: | | | | | | | | | | | | | | | | | | | | |
Net assets, end of period (000 omitted) | | $ | 348,946 | | | $ | 372,576 | | | $ | 365,855 | | | $ | 304,570 | | | $ | 330,528 | |
Ratio of expenses to average net assets | | | 0.97% | | | | 0.95% | | | | 0.95% | | | | 0.96% | | | | 0.96% | |
Ratio of expenses to average net assets prior to fees waived | | | 0.99% | | | | 1.00% | | | | 1.00% | | | | 1.01% | | | | 1.01% | |
Ratio of net investment income to average net assets | | | 1.49% | | | | 1.39% | | | | 1.62% | | | | 1.63% | | | | 1.49% | |
Ratio of net investment income to average net assets prior to fees waived | | | 1.47% | | | | 1.34% | | | | 1.57% | | | | 1.58% | | | | 1.44% | |
Portfolio turnover | | | 13% | | | | 11% | | | | 17% | | | | 17% | | | | 12% | |
| 1 | The average shares outstanding method has been applied for per share information. |
| 2 | Total return is based on the change in net asset value of a share during the period and assumes reinvestment of dividends and distributions at net asset value. Total return during all of the periods shown reflects a waiver by the distributor. Performance would have been lower had the waiver not been in effect. Total return does not include fees, charges, or expenses imposed by the variable annuity and life insurance contracts for which Delaware VIP Trust serves as an underlying investment vehicle. |
See accompanying notes, which are an integral part of the financial statements.
Value Series-12
Delaware VIP® Trust — Delaware VIP Value Series
Notes to financial statements
December 31, 2018
Delaware VIP Trust (Trust) is organized as a Delaware statutory trust and offers 10 series: Delaware VIP Diversified Income Series, Delaware VIP Emerging Markets Series, Delaware VIP High Yield Series, Delaware VIP International Value Equity Series, Delaware VIP Limited-Term Diversified Income Series, Delaware VIP REIT Series, Delaware VIP Small Cap Value Series, Delaware VIP Smid Cap Core Series, Delaware VIP U.S. Growth Series, and Delaware VIP Value Series. These financial statements and the related notes pertain to Delaware VIP Value Series (Series). The Trust is anopen-end investment company. The Series is considered diversified under the Investment Company Act of 1940, as amended, and offers Standard Class and Service Class shares. The Standard Class shares do not carry a distribution and service(12b-1) fee and the Service Class shares carry a12b-1 fee. The shares of the Series are sold only to separate accounts of life insurance companies.
The investment objective of the Series is to seek long-term capital appreciation.
1. Significant Accounting Policies
The Series is an investment company and follows accounting and reporting guidance under Financial Accounting Standards Board (FASB) Accounting Standards Codification Topic 946, Financial Services - Investment Companies. The following accounting policies are in accordance with US generally accepted accounting principles (US GAAP) and are consistently followed by the Series.
Security Valuation — Equity securities, except those traded on the Nasdaq Stock Market LLC (Nasdaq), are valued at the last quoted sales price as of the time of the regular close of the New York Stock Exchange on the valuation date. Equity securities traded on the Nasdaq are valued in accordance with the Nasdaq Official Closing Price, which may not be the last sales price. If, on a particular day, an equity security does not trade, the mean between the bid and ask prices will be used, which approximates fair value. US government and agency securities are valued at the mean between the bid and ask prices, which approximates fair value. Investments in repurchase agreements are generally valued at par, which approximates fair value, each business day. Generally, other securities and assets for which market quotations are not readily available are valued at fair value as determined in good faith under the direction of the Trust’s Board of Trustees (Board). In determining whether market quotations are readily available or fair valuation will be used, various factors will be taken into consideration, such as market closures or suspension of trading in a security. Restricted securities are valued at fair value using methods approved by the Board.
Federal Income Taxes — No provision for federal income taxes has been made as the Series intends to continue to qualify for federal income tax purposes as a regulated investment company under Subchapter M of the Internal Revenue Code of 1986, as amended, and make the requisite distributions to shareholders. The Series evaluates tax positions taken or expected to be taken in the course of preparing the Series’ tax returns to determine whether the tax positions are“more-likely-than-not” of being sustained by the applicable tax authority. Tax positions not deemed to meet the“more-likely-than-not” threshold are recorded as a tax benefit or expense in the current year. Management has analyzed the Series’ tax positions taken or expected to be taken on the Series’ federal income tax returns through the year ended Dec. 31, 2018, and for all open tax years (years ended Dec. 31, 2015–Dec. 31, 2017), and has concluded that no provision for federal income tax is required in the Series’ financial statements. If applicable, the Series recognizes interest accrued on unrecognized tax benefits in interest expense and penalties in other expenses on the “Statement of operations.” During the year ended Dec. 31, 2018, the Series did not incur any interest or tax penalties.
Class Accounting — Investment income, common expenses, and realized and unrealized gain (loss) on investments are allocated to the classes of the Series on the basis of daily net assets of each class. Distribution expenses relating to a specific class are charged directly to that class.
Repurchase Agreements — The Series may purchase certain US government securities subject to the counterparty’s agreement to repurchase them at an agreed upon date and price. The counterparty will be required on a daily basis to maintain the value of the collateral subject to the agreement at not less than the repurchase price (including accrued interest). The agreements are conditioned upon the collateral being deposited under the Federal Reserve book-entry system with the Series’ custodian or a third-partysub-custodian. In the event of default or bankruptcy by the other party to the agreement, retention of the collateral may be subject to legal proceedings. All open repurchase agreements as of the date of this report were entered into on Dec. 31, 2018, and matured on the next business day.
Use of Estimates — The preparation of financial statements in conformity with US GAAP requires management to make estimates and assumptions that affect the fair value of investments, the reported amounts of assets and liabilities and disclosure of contingent assets and liabilities at the date of the financial statements, and the reported amounts of revenues and expenses during the reporting period. Actual results could differ from those estimates and the differences could be material.
Other — Expenses directly attributable to the Series are charged directly to the Series. Other expenses common to various funds within the Delaware Funds® by Macquarie (Delaware Funds) are generally allocated among such funds on the basis of average net assets. Management fees and certain other expenses are paid monthly. Security transactions are recorded on the date the securities are purchased or sold (trade date) for financial reporting purposes. Costs used in calculating realized gains and losses on the sale of investment securities are those of the specific securities sold. Dividend income is recorded on theex-dividend date and interest income is recorded on the accrual basis. Discounts and premiums on debt securities are accreted or amortized to interest income, respectively, over the lives of the respective securities using the effective interest method. The Series declares
Value Series-13
Delaware VIP® Value Series
Notes to financial statements (continued)
1. Significant Accounting Policies (continued)
and pays distributions from net investment income and distributions from net realized gain on investments, if any, following the close of the fiscal year. The Series may distribute more frequently, if necessary for tax purposes. Dividends and distributions, if any, are recorded on theex-dividend date.
Subject to seeking best execution, the Series may direct certain security trades to brokers who have agreed to rebate a portion of the related brokerage commission to the Series in cash. In general, best execution refers to many factors, including the price paid or received for a security, the commission charged, the promptness and reliability of execution, the confidentiality and placement accorded the order, and other factors affecting the overall benefit obtained by the Series on the transaction. There were no commission rebates for the year ended Dec. 31, 2018.
The Series receives earnings credits from its custodian when positive cash balances are maintained, which may be used to offset custody fees. The expenses paid under this arrangement are included on the “Statement of operations” under “Custodian fees” with the corresponding expenses offset included under “Less expenses paid indirectly.” For the year ended Dec. 31, 2018, the Series earned $982 under this arrangement.
The Series receives earnings credits from its transfer agent when positive cash balances are maintained, which may be used to offset transfer agent fees. If the amount earned is greater than $1, the expenses paid under this arrangement are included on the “Statement of operations” under “Dividend disbursing and transfer agent fees and expenses” with the corresponding expenses offset included under “Less expenses paid indirectly.” For the year ended Dec. 31, 2018, the Series earned $1 under this arrangement.
2. Investment Management, Administration Agreements, and Other Transactions with Affiliates
In accordance with the terms of its investment management agreement, the Series pays Delaware Management Company (DMC), a series of Macquarie Investment Management Business Trust and the investment manager, an annual fee which is calculated daily and paid monthly at the rate of 0.65% on the first $500 million of average daily net assets of the Series, 0.60% on the next $500 million, 0.55% on the next $1.5 billion, and 0.50% on average daily net assets in excess of $2.5 billion.
Delaware Investments Fund Services Company (DIFSC), an affiliate of DMC, provides fund accounting and financial administration oversight services to the Series. For these services, DIFSC’s fees are calculated daily and paid monthly based on the aggregate daily net assets of all funds within the Delaware Funds at the following annual rates: 0.00475% of the first $35 billion; 0.0040% of the next $10 billion; and 0.0025% of aggregate average daily net assets in excess of $45 billion (Total Fee). Each fund in the Delaware Funds pays a minimum of $4,000, which, in aggregate, is subtracted from the Total Fee. Each fund then pays its portion of the remainder of the Total Fee on a relative net asset value basis. For the year ended Dec. 31, 2018, the Series was charged $34,136, for these services. This amount is included on the “Statement of operations” under “Accounting and administration expenses.”
DIFSC is also the transfer agent and dividend disbursing agent of the Series. For these services, DIFSC’s fees are calculated daily and paid monthly at the annual rate of 0.0075% of the Series’ average daily net assets. This amount is included on the “Statement of operations” under “Dividend disbursing and transfer agent fees and expenses.” For the year ended Dec. 31, 2018, the Series was charged $59,835 for these services. Pursuant to asub-transfer agency agreement between DIFSC and BNY Mellon Investment Servicing (US) Inc. (BNYMIS), BNYMIS provides certainsub-transfer agency services to the Series.Sub-transfer agency fees are paid by the Series and are also included on the “Statement of operations” under “Dividend disbursing and transfer agent fees and expenses.”
Pursuant to a distribution agreement and distribution plan, the Series pays Delaware Distributors, L.P. (DDLP), the distributor and an affiliate of DMC, an annual12b-1 fee of 0.30% of the average daily net assets of the Service Class shares. Prior to May 1, 2018, DDLP had contracted to waive12b-1 fees in order to limit12b-1 fees of the Service Class shares to 0.25% of average daily net assets. The fees are calculated daily and paid monthly. Standard Class shares pay no12b-1 fees.
As provided in the investment management agreement, the Series bears a portion of the cost of certain resources shared with DMC, including the cost of internal personnel of DMC and/or its affiliates that provide legal, tax, and regulatory reporting services to the Series. For the year ended Dec. 31, 2018, the Series was charged $23,666 for internal legal, tax, and regulatory reporting services provided by DMC and/or its affiliates’ employees. This amount is included on the “Statement of operations” under “Legal fees.”
Trustees’ fees include expenses accrued by the Series for each Trustee’s retainer and meeting fees. Certain officers of DMC, DIFSC, and DDLP are officers and/or Trustees of the Trust. These officers and Trustees are paid no compensation by the Series.
Value Series-14
Delaware VIP® Value Series
Notes to financial statements (continued)
3. Investments
For the year ended Dec. 31, 2018, the Series made purchases and sales of investment securities other than short-term investments as follows:
| | | | |
Purchases | | $ | 105,465,311 | |
Sales | | | 171,215,136 | |
The tax cost of investments includes adjustments to net unrealized appreciation (depreciation) which may not necessarily be the final tax cost basis adjustments, but approximate the tax basis unrealized gains and losses that may be realized and distributed to shareholders. At Dec. 31, 2018, the cost and unrealized appreciation (depreciation) of investments for federal income tax purposes for the Series were as follows:
| | | | | | |
| | | Aggregate | | Aggregate | | |
| | | Unrealized | | Unrealized | | Net Unrealized |
| Cost of | | Appreciation | | Depreciation | | Appreciation |
Investments | | of Investments | | of Investments | | of Investments |
| $504,449,511 | | $256,740,835 | | $(20,038,388) | | $236,702,447 |
US GAAP defines fair value as the price that the Series would receive to sell an asset or pay to transfer a liability in an orderly transaction between market participants at the measurement date under current market conditions. A three-level hierarchy for fair value measurements has been established based upon the transparency of inputs to the valuation of an asset or liability. Inputs may be observable or unobservable and refer broadly to the assumptions that market participants would use in pricing the asset or liability. Observable inputs reflect the assumptions market participants would use in pricing the asset or liability based on market data obtained from sources independent of the reporting entity. Unobservable inputs reflect the reporting entity’s own assumptions about the assumptions that market participants would use in pricing the asset or liability based on the best information available under the circumstances. The Series’ investment in its entirety is assigned a level based upon the observability of the inputs which are significant to the overall valuation. The three-level hierarchy of inputs is summarized below.
| | | | |
| Level 1 | | – | | Inputs are quoted prices in active markets for identical investments. (Examples: equity securities,open-end investment companies, futures contracts, exchange-traded options contracts) |
| Level 2 | | – | | Other observable inputs, including, but not limited to: quoted prices for similar assets or liabilities in markets that are active, quoted prices for identical or similar assets or liabilities in markets that are not active, inputs other than quoted prices that are observable for the assets or liabilities (such as interest rates, yield curves, volatilities, prepayment speeds, loss severities, credit risks and default rates) or other market-corroborated inputs. (Examples: debt securities, government securities, swap contracts, foreign currency exchange contracts, foreign securities utilizing international fair value pricing, broker-quoted securities, fair valued securities) |
| Level 3 | | – | | Significant unobservable inputs including the Series’ own assumptions used to determine the fair value of investments. (Examples: broker-quoted securities, fair valued securities) |
Level 3 investments are valued using significant unobservable inputs. The Series may also use an income-based valuation approach in which the anticipated future cash flows of the investment are discounted to calculate fair value. Discounts may also be applied due to the nature or duration of any restrictions on the disposition of the investments. Valuations may also be based upon current market prices of securities that are comparable in coupon, rating, maturity, and industry. The derived value of a Level 3 investment may not represent the value which is received upon disposition and this could impact the results of operations.
The following table summarizes the valuation of the Series’ investments by fair value hierarchy levels as of Dec. 31, 2018:
| | | | | | | | | | | | |
| Securities | | Level 1 | | | Level 2 | | | Total | |
Assets: | | | | | | | | | | | | |
Common Stock | | $ | 708,387,287 | | | $ | — | | | $ | 708,387,287 | |
Short-Term Investments | | | — | | | | 32,764,671 | | | | 32,764,671 | |
| | | | | | | | | | | | |
Total Value of Securities | | $ | 708,387,287 | | | $ | 32,764,671 | | | $ | 741,151,958 | |
| | | | | | | | | | | | |
During the year ended Dec. 31, 2018, there were no transfers between Level 1 investments, Level 2 investments, or Level 3 investments that had a significant impact to the Series. The Series’ policy is to recognize transfers between levels based on fair value at the beginning of the reporting period.
A reconciliation of Level 3 investments is presented when the Series has a significant amount of Level 3 investments at the beginning, interim, or end of the period in relation to the Series’ net assets. During the year ended Dec. 31, 2018, there were no Level 3 investments.
Value Series-15
Delaware VIP® Value Series
Notes to financial statements (continued)
4. Dividend and Distribution Information
Income and long-term capital gain distributions are determined in accordance with federal income tax regulations, which may differ from US GAAP. Additionally, distributions from net short-term gains on sales of investment securities are treated as ordinary income for federal income tax purposes. The tax character of dividends and distributions paid during the years ended Dec. 31, 2018 and 2017 was as follows:
| | | | | | | | |
| | | Year ended | |
| | | 12/31/18 | | | 12/31/17 | |
Ordinary income | | $ | 16,351,471 | | | $ | 19,292,546 | |
Long-term capital gain | | | 45,000,871 | | | | 21,648,027 | |
| | | | | | | | |
Total | | $ | 61,352,342 | | | $ | 40,940,573 | |
| | | | | | | | |
5. Components of Net Assets on a Tax Basis
As of Dec. 31, 2018, the components of net assets on a tax basis were as follows:
| | | | |
Shares of beneficial interest | | $ | 432,156,112 | |
Undistributed ordinary income | | | 15,057,130 | |
Undistributed long-term capital gains | | | 53,674,322 | |
Net unrealized appreciation on investments | | | 236,702,447 | |
| | | | |
Net assets | | $ | 737,590,011 | |
| | | | |
The differences between book basis and tax basis components of net assets are primarily attributable to tax deferral of losses on wash sales.
6. Capital Shares
Transactions in capital shares were as follows:
| | | | | | | | |
| | | Year ended | |
| | | 12/31/18 | | | 12/31/17 | |
Shares sold: | | | | | | | | |
Standard Class | | | 384,160 | | | | 434,236 | |
Service Class | | | 1,154,221 | | | | 570,285 | |
Shares issued upon reinvestment of dividends and distributions: | | | | | | | | |
Standard Class | | | 1,124,453 | | | | 804,085 | |
Service Class | | | 944,964 | | | | 641,158 | |
| | | | | | | | |
| | | 3,607,798 | | | | 2,449,764 | |
| | | | | | | | |
Shares redeemed: | | | | | | | | |
Standard Class | | | (1,464,041 | ) | | | (2,575,412 | ) |
Service Class | | | (1,570,472 | ) | | | (1,916,541 | ) |
| | | | | | | | |
| | | (3,034,513 | ) | | | (4,491,953 | ) |
| | | | | | | | |
Net increase (decrease) | | | 573,285 | | | | (2,042,189 | ) |
| | | | | | | | |
7. Line of Credit
The Series, along with certain other funds in the Delaware Funds (Participants), was a participant in a revolving line of credit to be used for temporary or emergency purposes as an additional source of liquidity to fund redemptions of investor shares. The revolving line of credit available was reduced from $155,000,000 to $130,000,000 on Sep. 6, 2018. Under the agreement, the Participants were charged an annual commitment fee of 0.15%, which was allocated across the Participants based on a weighted average of the respective net assets of each Participant. The Participants were permitted to borrow up to a maximum ofone-third of their net assets under the agreement. Each Participant was individually, and not jointly, liable for its particular advances, if any, under the line of credit. The line of credit available under the agreement expired on Nov. 5, 2018.
On Nov. 5, 2018, the Participants entered into an amendment to the agreement for a $190,000,000 revolving line of credit. The revolving line of credit was increased to $220,000,000 on Nov. 29, 2018. The revolving line of credit is to be used as described above and operates in substantially the same manner as the original agreement. The line of credit available under the agreement expires on Nov. 4, 2019.
The Series had no amounts outstanding as of Dec. 31, 2018, or at any time during the year then ended.
Value Series-16
Delaware VIP® Value Series
Notes to financial statements (continued)
8. Offsetting
Master Repurchase Agreements
Repurchase agreements are entered into by the Series under master repurchase agreements (each, an MRA). The MRA permits the Series, under certain circumstances including an event of default (such as bankruptcy or insolvency), to offset payables and/or receivables with collateral held by and/or posted to the counterparty. As a result, one single net payment is created. Bankruptcy or insolvency laws of a particular jurisdiction may impose restrictions on or prohibitions against such a right of offset in the event of the MRA counterparty’s bankruptcy or insolvency. Based on the terms of the MRA, the Series receives securities as collateral with a market value in excess of the repurchase price at maturity. Upon a bankruptcy or insolvency of the MRA counterparty, the Series would recognize a liability with respect to such excess collateral. The liability reflects the Series’ obligation under bankruptcy law to return the excess to the counterparty. As of Dec. 31, 2018, the following table is a summary of the Series’ repurchase agreements by counterparty which are subject to offset under an MRA:
| | | | | | | | | | | | | | | | | | | | | | | | | | | | | | | | | | | |
| | | | | Fair Value of | | | | | | | | | | |
| | | | | Non-Cash | | | | | | | | | | |
| | | Repurchase | | Collateral | | Cash Collateral | | Net Collateral | | | | | | |
Counterparty | | Agreements | | Received(a) | | Received | | Received | | Net Exposure(b) |
Bank of America Merrill Lynch | | | $ | 3,192,492 | | | | $ | — | | | | | $(3,192,492 | ) | | | $ | (3,192,492 | ) | | | | | | | | | $— | | | |
Bank of Montreal | | | | 8,779,353 | | | | | (8,779,353 | ) | | | | — | | | | | (8,779,353 | ) | | | | | | | | | — | | | |
BNP Paribas | | | | 14,355,774 | | | | | (14,355,774 | ) | | | | — | | | | | (14,355,774 | ) | | | | | | | | | — | | | |
| | | | | | | | | | | | | | | | | | | | | | | | | | | | | | | | |
Total | | | $ | 26,327,619 | | | | $ | (23,135,127 | ) | | | | $(3,192,492 | ) | | | $ | (26,327,619 | ) | | | | | | | | | $— | | | |
| | | | | | | | | | | | | | | | | | | | | | | | | | | | | | | | |
(a)The value of the related collateral received exceeded the value of the repurchase agreements as of Dec. 31, 2018.
(b)Net exposure represents the receivable (payable) that would be due from (to) the counterparty in an event of default.
9. Securities Lending
The Series, along with other funds in the Delaware Funds, may lend its securities pursuant to a security lending agreement (Lending Agreement) with The Bank of New York Mellon (BNY Mellon). At the time a security is loaned, the borrower must post collateral equal to the required percentage of the market value of the loaned security, including any accrued interest. The required percentage is: (1) 102% with respect to US securities and foreign securities that are denominated and payable in US dollars; and (2) 105% with respect to foreign securities. With respect to each loan, if on any business day the aggregate market value of securities collateral plus cash collateral held is less than the aggregate market value of the securities that are the subject of such loan, the borrower will be notified to provide additional collateral by the end of the following business day, which, together with the collateral already held, will be not less than the applicable initial collateral requirements for such security loan. If the aggregate market value of securities collateral and cash collateral held with respect to a security loan exceeds the applicable initial collateral requirement, upon the request of the borrower, BNY Mellon must return enough collateral to the borrower by the end of the following business day to reduce the value of the remaining collateral to the applicable initial collateral requirement for such security loan. As a result of the foregoing, the value of the collateral held with respect to a loaned security on any particular day may be more or less than the value of the security on loan. The collateral percentage with respect to the market value of the loaned security is determined by the security lending agent.
Cash collateral received by each series of the Trust is generally invested in a series of individual separate accounts, each corresponding to a series. The investment guidelines permit each separate account to hold certain securities that would be considered eligible securities for a money market fund. Cash collateral received is generally invested in government securities; certain obligations issued by government sponsored enterprises; repurchase agreements collateralized by US Treasury securities; obligations issued by the central government of any Organization for Economic Cooperation and Development (OECD) country or its agencies, instrumentalities, or establishments; obligations of supranational organizations; commercial paper, notes, bonds, and other debt obligations; certificates of deposit, time deposits, and other bank obligations; and asset-backed securities. The Series can also accept US government securities and letters of credit(non-cash collateral) in connection with securities loans.
In the event of default or bankruptcy by the lending agent, realization and/or retention of the collateral may be subject to legal proceedings. In the event the borrower fails to return loaned securities and the collateral received is insufficient to cover the value of the loaned securities and provided such collateral shortfall is not the result of investment losses, the lending agent has agreed to pay the amount of the shortfall to the Series or, at the discretion of the lending agent, replace the loaned securities. The Series continues to record dividends or interest, as applicable, on the securities loaned and is subject to changes in value of the securities loaned that may occur during the term of the loan. The Series has the right under the Lending Agreement to recover the securities from the borrower on demand. With respect to security loans collateralized bynon-cash collateral, the Series receives loan premiums paid by the borrower. With respect to security loans collateralized by cash collateral, the earnings from the collateral investments are shared among the Series, the security lending agent, and the borrower. The Series records security lending income net of allocations to the security lending agent and the borrower.
Value Series-17
Delaware VIP® Value Series
Notes to financial statements (continued)
9. Securities Lending (continued)
The Series may incur investment losses as a result of investing securities lending collateral. This could occur if an investment in the collateral investment account defaulted or became impaired. Under those circumstances, the value of a Series’ cash collateral account may be less than the amount the Series would be required to return to the borrowers of the securities and the Series would be required to make up for this shortfall.
During the year ended Dec. 31, 2018, the Series had no securities out on loan.
10. Credit and Market Risk
The Series may invest up to 10% of its net assets in illiquid securities, which may include securities with contractual restrictions on resale, securities exempt from registration under Rule 144A, promulgated under the Securities Act of 1933, as amended, and other securities which may not be readily marketable. The relative illiquidity of these securities may impair the Series from disposing of them in a timely manner and at a fair price when it is necessary or desirable to do so. While maintaining oversight, the Board has delegated to DMC, theday-to-day functions of determining whether individual securities are liquid for purposes of the Series’ limitation on investments in illiquid securities. Securities eligible for resale pursuant to Rule 144A, which are determined to be liquid, are not subject to the Series’ 10% limit on investments in illiquid securities. As of Dec. 31, 2018, there were no Rule 144A securities held by the Series. Restricted securities are valued pursuant to the security valuation procedures described in Note 1.
11. Contractual Obligations
The Series enters into contracts in the normal course of business that contain a variety of indemnifications. The Series’ maximum exposure under these arrangements is unknown. However, the Series has not had prior claims or losses pursuant to these contracts. Management has reviewed the Series’ existing contracts and expects the risk of loss to be remote.
12. Recent Accounting Pronouncements
In August 2018, the FASB issued an Accounting Standards Update, ASU2018-13, which changes certain fair value measurement disclosure requirements. The ASU2018-13, in addition to other modifications and additions, removes the requirement to disclose the amount and reasons for transfers between Level 1 and Level 2 of the fair value hierarchy, the policy for the timing of transfers between levels and the valuation process for Level 3 fair value measurements. The ASU2018-13 is effective for fiscal years, and interim periods within those fiscal years, beginning after Dec. 15, 2019. At this time, management is evaluating the implications of these changes on the financial statements.
In August 2018, the Securities and Exchange Commission (SEC) adopted amendments to RegulationS-X to update and simplify the disclosure requirements for registered investment companies by eliminating requirements that are redundant or duplicative of US GAAP requirements or other SEC disclosure requirements. The new amendments require the presentation of the total, rather than the components, of distributable earnings on the “Statement of assets and liabilities” and the total, rather than the components, of dividends from net investment income and distributions from net realized gains on the “Statements of changes in net assets.” The amendments also removed the requirement for the parenthetical disclosure of undistributed net investment income on the “Statements of changes in net assets” and certain tax adjustments that were reflected in the “Notes to financial statements.” All of these have been reflected in the Series’ financial statements.
13. Subsequent Events
Management has determined that no material events or transactions occurred subsequent to Dec. 31, 2018, that would require recognition or disclosure in the Series’ financial statements.
Value Series-18
Delaware VIP® Trust — Delaware VIP Value Series
Report of independent registered public accounting firm
To the Board of Trustees of Delaware VIP® Trust and Shareholders of Delaware VIP Value Series
Opinion on the Financial Statements
We have audited the accompanying statement of assets and liabilities, including the schedule of investments, of Delaware VIP Value Series (one of the series constituting Delaware VIP® Trust, referred to hereafter as the “Series”) as of December 31, 2018, the related statement of operations for the year ended December 31, 2018, the statements of changes in net assets for each of the two years in the period ended December 31, 2018, including the related notes, and the financial highlights for each of the five years in the period ended December 31, 2018 (collectively referred to as the “financial statements”). In our opinion, the financial statements present fairly, in all material respects, the financial position of the Series as of December 31, 2018, the results of its operations for the year then ended, the changes in its net assets for each of the two years in the period ended December 31, 2018 and the financial highlights for each of the five years in the period ended December 31, 2018 in conformity with accounting principles generally accepted in the United States of America.
Basis for Opinion
These financial statements are the responsibility of the Series’ management. Our responsibility is to express an opinion on the Series’ financial statements based on our audits. We are a public accounting firm registered with the Public Company Accounting Oversight Board (United States) (PCAOB) and are required to be independent with respect to the Series in accordance with the U.S. federal securities laws and the applicable rules and regulations of the Securities and Exchange Commission and the PCAOB.
We conducted our audits of these financial statements in accordance with the standards of the PCAOB. Those standards require that we plan and perform the audit to obtain reasonable assurance about whether the financial statements are free of material misstatement, whether due to error or fraud.
Our audits included performing procedures to assess the risks of material misstatement of the financial statements, whether due to error or fraud, and performing procedures that respond to those risks. Such procedures included examining, on a test basis, evidence regarding the amounts and disclosures in the financial statements. Our audits also included evaluating the accounting principles used and significant estimates made by management, as well as evaluating the overall presentation of the financial statements. Our procedures included confirmation of securities owned as of December 31, 2018 by correspondence with the custodian and brokers; when replies were not received from brokers, we performed other auditing procedures. We believe that our audits provide a reasonable basis for our opinion.
/s/ PricewaterhouseCoopers LLP
Philadelphia, Pennsylvania
February 14, 2019
We have served as the auditor of one or more investment companies in Delaware Funds® by Macquarie since 2010.
Value Series-19
Delaware VIP® Trust — Delaware VIP Value Series
Other Series information (Unaudited)
Board consideration of investment advisory agreement for Delaware VIP Value Series
At a meeting held on Aug.15-16, 2018 (the “Annual Meeting”), the Board of Trustees (the “Board”), including a majority of disinterested or independent Trustees, approved the renewal of the Investment Advisory Agreement for Delaware VIP Value Series (the “Series”). In making its decision, the Board considered information furnished at regular quarterly Board meetings, including reports detailing Series performance, investment strategies, and expenses, as well as information prepared specifically in connection with the renewal of the Investment Advisory Agreement. Information furnished specifically in connection with the renewal of the Investment Advisory Agreement with Delaware Management Company (“DMC”), a series of Macquarie Investment Management Business Trust (“MIMBT”) included materials provided by DMC and its affiliates (collectively, “Macquarie Investment Management”) concerning, among other things, the nature, extent, and quality of services provided to the Series; the costs of such services to the Series; economies of scale; and the investment manager’s financial condition and profitability. In addition, in connection with the Annual Meeting, materials were provided to the Trustees in May 2018, including reports provided by Broadridge Financial Solutions (“Broadridge”). The Broadridge reports compared the Series’ investment performance and expenses with those of other comparable mutual funds. The Independent Trustees reviewed and discussed the Broadridge reports with independent legal counsel to the Independent Trustees. In addition to the information noted above, the Board also requested and received information regarding DMC’s policy with respect to advisory fee levels and its breakpoint philosophy; the structure of portfolio manager compensation; comparative client fee information; and any constraints or limitations on the availability of securities for certain investment styles, which had in the past year inhibited, or which were likely in the future to inhibit, the investment manager’s ability to invest fully in accordance with Series policies.
In considering information relating to the approval of the Series’ Investment Advisory Agreement the Independent Trustees received assistance and advice from and met separately with independent legal counsel to the Independent Trustees and also received assistance and advice from an experienced and knowledgeable independent fund consultant, JDL Consultants, LLC (“JDL”). Although the Board gave attention to all information furnished, the following discussion identifies, under separate headings, the primary factors taken into account by the Board during its contract renewal considerations.
Nature, extent, and quality of services.The Board considered the services provided by DMC to the Series and its shareholders. In reviewing the nature, extent, and quality of services, the Board considered reports furnished to it throughout the year, which covered matters such as the relative performance of the Series, compliance of portfolio managers with the investment policies, strategies and restrictions for the Series, compliance by DMC and Delaware Distributors, L.P. (together, “Management”) personnel with the Code of Ethics adopted throughout the Delaware Funds® by Macquarie (the “Delaware Funds”), and adherence to fair value pricing procedures as established by the Board. The Board was pleased with the current staffing of DMC and the emphasis placed on research in the investment process. The Board recognized DMC’s receipt of certain favorable industry distinctions during the past several years. The Board gave favorable consideration to DMC’s efforts to control expenses while maintaining service levels committed to Series matters. The Board was satisfied with the nature, extent, and quality of the overall services provided by DMC.
Investment performance.The Board placed significant emphasis on the investment performance of the Series in view of the importance of investment performance to shareholders. Although the Board considered performance reports and discussions with portfolio managers at Board meetings throughout the year, the Board gave particular weight to the Broadridge reports furnished for the Annual Meeting. The Broadridge reports prepared for the Series showed the investment performance of its Standard Class shares in comparison to a group of similar funds as selected by Broadridge (the “Performance Universe”). A fund with the best performance ranked first, and a fund with the poorest performance ranked last. The highest/best performing 25% of funds in the Performance Universe make up the first quartile; the next 25%, the second quartile; the next 25%, the third quartile; and the poorest/worst performing 25% of funds in the Performance Universe make up the fourth quartile. Comparative annualized performance for the Series was shown for the past1-,3-,5-, and10-year periods, as applicable, ended Jan. 31, 2018. The Board’s objective is that the Series’ performance for the1-,3-, and5-year periods be at or above the median of its Performance Universe.
The Performance Universe for the Series consisted of the Series and alllarge-cap value funds underlying variable insurance products as selected by Broadridge. The Broadridge report comparison showed that the Series’ total return for the1- and3-year periods was in the second quartile of its Performance Universe. The report further showed that the Series’ total return for the5- and10-year periods was in the first quartile of its Performance Universe. The Board was satisfied with performance.
Comparative expenses.The Board considered expense data for the Delaware Funds. Management provided the Board with information on pricing levels and fee structures for the Series as of its most recently completed fiscal year. The Board also focused on the comparative analysis of effective management fees and total expense ratios of the Series versus effective management fees and expense ratios of a group of similar funds as selected by Broadridge (the “Expense Group”). In reviewing comparative costs, the Series’ contractual management fee and the actual management fee incurred by the Series were compared with the contractual management fees (assuming all funds in the Expense Group were similar in size to the Series) and actual management fees (as reported by each fund) within the Expense Group, taking into account any applicable breakpoints and fee waivers. The Series’ total expenses were also compared with those of its Expense Group. The Broadridge total expenses, for comparative consistency, were shown by Broadridge for Standard Class
Value Series-20
Delaware VIP® Trust — Delaware VIP Value Series
Other Series information (Unaudited)
Board consideration of investment advisory agreement for Delaware VIP Value Series (continued)
shares which do not charge12b-1 andnon-12b-1 service fees. The Board’s objective is for the Series’ total expense ratio to be competitive with those of the peer funds within its Expense Group.
The expense comparisons for the Series showed that the actual management fee was in the quartile with the lowest expenses of its Expense Group and its and total expenses were in the quartile with the second lowest expenses of its Expense Group. The Board was satisfied with the management fee and total expenses of the Series in comparison to those of its Expense Group.
Management profitability.The Board considered the level of profits realized by DMC in connection with the operation of the Series. In this respect, the Board reviewed the Investment Management Profitability Analysis that addressed the overall profitability of DMC’s business in providing management and other services to each of the individual funds and the Delaware Funds as a whole. Specific attention was given to the methodology used by DMC in allocating costs for the purpose of determining profitability. Management stated that the level of profits of DMC, to a certain extent, reflects recent operational cost savings and efficiencies initiated by DMC. The Board considered DMC’s efforts to improve services provided to Fund shareholders and to meet additional regulatory and compliance requirements resulting from recent industry-wide Securities and Exchange Commission initiatives. The Board also considered the extent to which DMC might derive ancillary benefits from fund operations, including the potential for procuring additional business as a result of the prestige and visibility associated with its role as service provider to the Delaware Funds and the benefits from allocation of fund brokerage to improve trading efficiencies. As part of its work, the Board also reviewed a report prepared by JDL regarding MIMBT profitability as compared to certain peer fund complexes and the Independent Trustees met with JDL personnel to discuss DMC’s profitability in such context. The Board found that the management fees were reasonable in light of the services rendered and the profitability of DMC.
Economies of scale.The Trustees considered whether economies of scale are realized by DMC as the Series’ assets increase and the extent to which any economies of scale are reflected in the level of management fees charged. The Trustees reviewed the Series’ advisory fee pricing and structure approved by the Board and shareholders, which includes breakpoints, and which applies to most funds in the Delaware Funds complex. Breakpoints in the advisory fee occur when the advisory fee rate is reduced on assets in excess of specified levels. Breakpoints result in a lower advisory fee, than would otherwise be the case in the absence of breakpoints, when the asset levels specified in the breakpoints are exceeded. The Board noted that, as of March 31, 2018, the Series’ assets exceeded the first breakpoint level. The Board believed that, given the extent to which economies of scale might be realized by DMC and its affiliates, the schedule of fees under the Investment Advisory Agreement provides a sharing of benefits with the Series and its shareholders.
Tax Information
All disclosures are based on financial information available as of the date of this annual report and, accordingly are subject to change. For any and all items requiring reporting, it is the intention of the Series to report the maximum amount permitted under the Internal Revenue Code and the regulations thereunder.
For the year ended Dec. 31, 2018, the Series reports distributions paid during the year as follows:
| | | | | | |
| (A) | | | | | | |
| Long-Term | | (B) | | | | |
| Capital Gain | | Ordinary Income | | Total | | (C) |
| Distributions | | Distributions | | Distributions | | Qualifying |
Tax Basis | | (Tax Basis) | | (Tax Basis) | | Dividends1 |
| 73.35% | | 26.65% | | 100.00% | | 100.00% |
(A) and (B) are based on a percentage of the Series total distributions.
(C) is based on a percentage of the Series ordinary income distributions.
1Qualifying dividends represent dividends which qualify for the corporate dividends received deduction.
Value Series-21
Delaware Funds® by Macquarie
Board of trustees/directors and officers addendum
A mutual fund is governed by a Board of Trustees/Directors (“Trustees”), which has oversight responsibility for the management of a fund’s business affairs. Trustees establish procedures and oversee and review the performance of the investment manager, the distributor, and others who perform services for the fund. The independent fund trustees, in particular, are advocates for shareholder interests. Each trustee has served in that capacity since he or she was elected to or appointed to the Board of Trustees, and will continue to serve until his or her retirement or the election of a new trustee in his or her place. The following is a list of the Trustees and Officers with certain background and related information.
| | | | | | | | | | |
Name, Address, and Birth Date | | Position(s)
Held with
Fund(s) | | Length of Time
Served | | Principal Occupation(s) During the Past Five Years | | Number of Portfolios in Fund
Complex Overseen
by Trustee
or Officer | | Other Directorships Held by Trustee or Officer |
INTERESTED TRUSTEE | | | | | | | | |
| | | | | |
Shawn K. Lytle1,3 2005 Market Street Philadelphia, PA 19103 February 1970 | | President, Chief Executive Officer, and Trustee | | President and Chief Executive Officer since August 2015 Trustee since September 2015 | | President — Macquarie Investment Management2(June 2015-Present) Regional Head of Americas — UBS Global Asset Management (April2010-May 2015) | | 59 | | Trustee — UBS Relationship Funds, SMA Relationship Trust, and UBS Funds (May 2010–April 2015) |
INDEPENDENT TRUSTEES | | | | | | | | |
| | | | | |
Thomas L. Bennett 2005 Market Street Philadelphia, PA 19103 October 1947 | | Chair and Trustee | | Trustee since March 2005 Chair since March 2015 | | Private Investor (March 2004–Present) | | 59 | | None |
Jerome D. Abernathy 2005 Market Street Philadelphia, PA 19103 July 1959 | | Trustee | | Since January 2019 | | Managing Member, Stonebrook Capital Management, LLC (financial technology: macro factors and databases) (January 1993–Present) | | 59 | | None |
Ann D. Borowiec 2005 Market Street Philadelphia, PA 19103 November 1958 | | Trustee | | Since March 2015 | | Chief Executive Officer, Private Wealth Management (2011–2013) and Market Manager, New Jersey Private Bank (2005–2011) — J.P. Morgan Chase & Co. | | 59 | | Director — Banco Santander International (October 2016-Present) Director — Santander Bank, N.A.(December 2016-Present) |
Joseph W. Chow 2005 Market Street Philadelphia, PA 19103 January 1953 | | Trustee | | Since January 2013 | | Private Investor (April 2011–Present) | | 59 | | Director and Audit Committee Member — Hercules Technology Growth Capital, Inc. (July 2004–July 2014) |
John A. Fry 2005 Market Street Philadelphia, PA 19103 May 1960 | | Trustee | | Since January 2001 | | President — Drexel University (August 2010–Present) President — Franklin & Marshall College (July 2002–July 2010) | | 59 | | Director; Compensation Committee and Governance Committee Member — Community Health Systems Director — Drexel Morgan & Co. Director and Audit Committee Member — vTv Therapeutics LLC Director and Audit Committee Member — FS Credit Real Estate Income Trust, Inc. |
Lucinda S. Landreth 2005 Market Street Philadelphia, PA 19103 June 1947 | | Trustee | | Since March 2005 | | Private Investor (2004–Present) | | 59 | | None |
Value Series-22
| | | | | | | | | | |
Name, Address, and Birth Date | | Position(s) Held with
Fund(s) | | Length of Time
Served | | Principal Occupation(s) During the Past Five Years | | Number of Portfolios in Fund
Complex Overseen
by Trustee
or Officer | | Other Directorships Held by Trustee or Officer |
Frances A. Sevilla-Sacasa 2005 Market Street Philadelphia, PA 19103 January 1956 | | Trustee | | Since September 2011 | | Private Investor (January 2017-Present) Chief Executive Officer — Banco Itaú International (April 2012–December 2016) Executive Advisor to Dean (August 2011–March 2012) and Interim Dean (January 2011–July 2011) — University of Miami School of Business Administration President — U.S. Trust, Bank of America Private Wealth Management (Private Banking) (July 2007–December 2008) | | 59 | | Trust Manager and Audit Committee Chair — Camden Property Trust (August 2011-Present) Director — Carrizo Oil & Gas, Inc. (March 2018-Present) |
Thomas K. Whitford 2005 Market Street Philadelphia, PA 19103 March 1956 | | Trustee | | Since January 2013 | | Vice Chairman (2010–April 2013) — PNC Financial Services Group | | 59 | | Director — HSBC North America Holdings Inc. (December 2013-Present) Director — HSBC USA Inc. (July 2014-Present) Director — HSBC Bank USA, National Association (July 2014-March 2017) Director — HSBC Finance Corporation (December 2013-April 2018) |
Christianna Wood 2005 Market Street Philadelphia, PA 19103 March 1956 | | Trustee | | Since January 2019 | | Chief Executive Officer and President — Gore Creek Capital, Ltd. (August 2009–Present) | | 59 | | Director and Audit Committee Member — H&R Block Corporation (July 2008-Present) Director and Audit Committee Member — Grange Insurance (2013-Present) Trustee and Audit Committee Member — The Merger Fund (2013-Present), The Merger Fund VL (2013-Present); WCM Alternatives: Event-Driven Fund (2013-Present), and WCM Alternatives: Credit Event Fund (December 2017-Present) Director — International Securities Exchange (2010-2016) |
Janet L. Yeomans 2005 Market Street Philadelphia, PA 19103 July 1948 | | Trustee | | Since April 1999 | | Vice President and Treasurer (January 2006–July 2012), Vice President — Mergers & Acquisitions (January 2003–January 2006), and Vice President and Treasurer (July 1995–January 2003) — 3M Company | | 59 | | Director; Personnel and Compensation Committee Chair; Member of Nominating, Investments, and Audit Committees for various periods throughout directorship — Okabena Company (2009-2017) |
Value Series-23
| | | | | | | | | | |
Name, Address, and Birth Date | | Position(s) Held with
Fund(s) | | Length of Time
Served | | Principal Occupation(s) During the Past Five Years | | Number of Portfolios in Fund
Complex Overseen
by Trustee
or Officer | | Other Directorships Held by Trustee or Officer |
OFFICERS | | | | | | | | |
| | | | | |
David F. Connor 2005 Market Street Philadelphia, PA 19103 December 1963 | | Senior Vice President, General Counsel, and Secretary | | Senior Vice President, since May 2013; General Counsel since May 2015; Secretary since October 2005 | | David F. Connor has served in various capacities at different times at Macquarie Investment Management. | | 59 | | None3 |
Daniel V. Geatens 2005 Market Street Philadelphia, PA 19103 October 1972 | | Vice President and Treasurer | | Vice President and Treasurer since October 2007 | | Daniel V. Geatens has served in various capacities at different times at Macquarie Investment Management. | | 59 | | None3 |
Richard Salus 2005 Market Street Philadelphia, PA 19103 October 1963 | | Senior Vice President and Chief Financial Officer | | Senior Vice President and Chief Financial Officer since November 2006 | | Richard Salus has served in various capacities at different times at Macquarie Investment Management. | | 59 | | None3 |
|
1 Shawn K. Lytle is considered to be an “Interested Trustee” because he is an executive officer of the Fund’s(s’) investment advisor. 2 Macquarie Investment Management is the marketing name for Macquarie Management Holdings, Inc. and its subsidiaries, including the Fund’s(s’) investment advisor, principal underwriter, and its transfer agent. 3 Shawn K. Lytle, David F. Connor, Daniel V. Geatens, and Richard Salus serve in similar capacities for the six portfolios of the Optimum Fund Trust, which have the same investment advisor, principal underwriter, and transfer agent as the registrant. Mr. Geatens also serves as the Chief Financial Officer and Treasurer for Macquarie Global Infrastructure Total Return Fund Inc., which has an affiliated investment manager. |
The Statement of Additional Information for the Fund(s) includes additional information about the Trustees and Officers and is available, without charge, upon request by calling 800523-1918.
Value Series-24
| | | | |
| | The Series files its complete schedule of portfolio holdings with the Securities and Exchange Commission (SEC) for the first and third quarters of each fiscal year on FormN-Q. The Series’ FormsN-Q, as well as a description of the policies and procedures that the Series uses to determine how to vote proxies (if any) relating to portfolio securities are available without charge (i) upon request, by calling 800523-1918; and (ii) on the SEC’s website at sec.gov. In addition, a description of the policies and procedures that the Series uses to determine how to vote proxies (if any) relating to portfolio securities and the Schedule of Investments included in the Series’ most recent FormN-Q are available without charge on the Series’ website at delawarefunds.com/vip/literature. The Series’ FormsN-Q may be reviewed and copied at the SEC’s Public Reference Room in Washington, DC; information on the operation of the Public Reference Room may be obtained by calling 800SEC-0330. Information (if any) regarding how the Series voted proxies relating to portfolio securities during the most recently disclosed12-month period ended June 30 is available without charge (i) through the Series’ website at delawarefunds.com/proxy; and (ii) on the SEC’s website at sec.gov. | | |
| | |
| AR-VIPV 22049 (2/19) (730130) | | ValueSeries-25 |
Item 2. Code of Ethics
The registrant has adopted a code of ethics that applies to the registrant’s principal executive officer, principal financial officer, principal accounting officer or controller, or persons performing similar functions, regardless of whether these individuals are employed by the registrant or a third party. A copy of the registrant’s Code of Business Ethics has been posted on the Delaware Funds®by Macquarie Internet Web site at www.delawarefunds.com. Any amendments to the Code of Business Ethics, and information on any waiver from its provisions granted by the registrant, will also be posted on this Web site within five business days of such amendment or waiver and will remain on the Web site for at least 12 months.
Item 3. Audit Committee Financial Expert
The registrant’s Board of Trustees has determined that certain members of the registrant’s Audit Committee are audit committee financial experts, as defined below. For purposes of this item, an “audit committee financial expert” is a person who has the following attributes:
a. An understanding of generally accepted accounting principles and financial statements;
b. The ability to assess the general application of such principles in connection with the accounting for estimates, accruals, and reserves;
c. Experience preparing, auditing, analyzing, or evaluating financial statements that present a breadth and level of complexity of accounting issues that are generally comparable to the breadth and complexity of issues that can reasonably be expected to be raised by the registrant’s financial statements, or experience actively supervising one or more persons engaged in such activities;
d. An understanding of internal controls and procedures for financial reporting; and
e. An understanding of audit committee functions.
An “audit committee financial expert” shall have acquired such attributes through:
a. Education and experience as a principal financial officer, principal accounting officer, controller, public accountant, or auditor or experience in one or more positions that involve the performance of similar functions;
b. Experience actively supervising a principal financial officer, principal accounting officer, controller, public accountant, auditor, or person performing similar functions;
c. Experience overseeing or assessing the performance of companies or public accountants with respect to the preparation, auditing, or evaluation of financial statements; or
d. Other relevant experience.
The registrant’s Board of Trustees/Directors has also determined that each member of the registrant’s Audit Committee is independent. In order to be “independent” for purposes of this item, the Audit Committee member may not: (i) other than in his or her capacity as a member of the Board of Trustees/Directors or any committee thereof, accept directly or indirectly any consulting, advisory or other compensatory fee from the issuer; or (ii) be an “interested person” of the registrant as defined in Section 2(a)(19) of the Investment Company Act of 1940.
The names of the audit committee financial experts on the registrant’s Audit Committee are set forth below:
John A. Fry
Lucinda S. Landreth
Thomas K. Whitford
Christianna Wood
Janet L. Yeomans
Item 4. Principal Accountant Fees and Services
(a) Audit fees.
The aggregate fees billed for services provided to the registrant by its independent auditors for the audit of the registrant’s annual financial statements and for services normally provided by the independent auditors in connection with statutory and regulatory filings or engagements were $337,050 for the fiscal year ended December 31, 2018.
The aggregate fees billed for services provided to the registrant by its independent auditors for the audit of the registrant’s annual financial statements and for services normally provided by the independent auditors in connection with statutory and regulatory filings or engagements were $327,640 for the fiscal year ended December 31, 2017.
(b) Audit-related fees.
The aggregate fees billed by the registrant’s independent auditors for services relating to the performance of the audit of the registrant’s financial statements and not reported under paragraph (a) of this Item were $0 for the fiscal year ended December 31, 2018.
The aggregate fees billed by the registrant’s independent auditors for services relating to the performance of the audit of the financial statements of the registrant’s investment adviser and other service providers under common control with the adviser and that relate directly to the operations or financial reporting of the registrant were $640,000 for the registrant’s fiscal year ended December 31, 2018. The percentage of these fees relating to services approved by the registrant’s Audit Committee pursuant to thede minimis exception from the pre-approval requirement in Rule 2-01(c)(7)(i)(C) of Regulation S-X was 0%. These audit-related services were as follows: year-end audit procedures; group reporting and subsidiary statutory audits.
The aggregate fees billed by the registrant’s independent auditors for services relating to the performance of the audit of the registrant’s financial statements and not reported under paragraph (a) of this Item were $0 for the fiscal year ended December 31, 2017.
The aggregate fees billed by the registrant’s independent auditors for services relating to the performance of the audit of the financial statements of the registrant’s investment adviser and other service providers under common control with the adviser and that relate directly to the operations or financial reporting of the registrant were $640,000 for the registrant’s fiscal year ended December 31, 2017. The percentage of these fees relating to services approved by the registrant’s Audit Committee pursuant to thede minimis exception from the pre-approval requirement in Rule 2-01(c)(7)(i)(C) of Regulation S-X was 0%. These audit-related services were as follows: year-end audit procedures; group reporting and subsidiary statutory audits.
(c)Tax fees.
The aggregate fees billed by the registrant’s independent auditors for tax-related services provided to the registrant were $51,372 for the fiscal year ended December 31, 2018. The percentage of these fees relating to services approved by the registrant’s Audit Committee pursuant to thede minimis exception from the pre-approval requirement in Rule 2-01(c)(7)(i)(C) of Regulation S-X was 0%. These tax-related services were as follows: review of income tax returns and review of annual excise distribution calculations.
The aggregate fees billed by the registrant’s independent auditors for tax-related services provided to the registrant’s investment adviser and other service providers under common control with the adviser and that relate directly to the operations or financial reporting of the registrant were $0 for the registrant’s fiscal year ended December 31, 2018. The percentage of these fees relating to services approved by the registrant’s Audit Committee pursuant to the de minimis exception from the pre-approval requirement in Rule 2-01(c)(7)(i)(C) of Regulation S-X was 0%.
The aggregate fees billed by the registrant’s independent auditors for tax-related services provided to the registrant were $51,322 for the fiscal year ended December 31, 2017. The percentage of these fees relating to services approved by the registrant’s Audit Committee pursuant to thede minimis exception from the pre-approval requirement in Rule 2-01(c)(7)(i)(C) of Regulation S-X was 0%. These tax-related services were as follows: review of income tax returns and review of annual excise distribution calculations.
The aggregate fees billed by the registrant’s independent auditors for tax-related services provided to the registrant’s investment adviser and other service providers under common control with the adviser and that relate directly to the operations or financial reporting of the registrant were $0 for the registrant’s fiscal year ended December 31, 2017. The percentage of these fees relating to services approved by the registrant’s Audit Committee pursuant to thede minimis exception from the pre-approval requirement in Rule 2-01(c)(7)(i)(C) of Regulation S-X was 0%.
(d) All other fees.
The aggregate fees billed for all services provided by the independent auditors to the registrant other than those set forth in paragraphs (a), (b) and (c) of this Item were $0 for the fiscal year ended December 31, 2018.
The aggregate fees billed for all services other than those set forth in paragraphs (b) and (c) of this Item provided by the registrant’s independent auditors to the registrant’s adviser and other service providers under common control with the adviser and that relate directly to the operations or financial reporting of the registrant were $0 for the registrant’s fiscal year ended December 31, 2018. The percentage of these fees relating to services approved by the registrant’s Audit Committee pursuant to thede minimis exception from the pre-approval requirement in Rule 2-01(c)(7)(i)(C) of Regulation S-X was 0%.
The aggregate fees billed for all services provided by the independent auditors to the registrant other than those set forth in paragraphs (a), (b) and (c) of this Item were $0 for the fiscal year ended December 31, 2017.
The aggregate fees billed for all services other than those set forth in paragraphs (b) and (c) of this Item provided by the registrant’s independent auditors to the registrant’s adviser and other service providers under common control with the adviser and that relate directly to the operations or financial reporting of the registrant were $0 for the registrant’s fiscal year ended December 31, 2017. The percentage of these fees relating to services approved by the registrant’s Audit Committee pursuant to thede minimis exception from the pre-approval requirement in Rule 2-01(c)(7)(i)(C) of Regulation S-X was 0%.
(e) The registrant’s Audit Committee has established pre-approval policies and procedures as permitted by Rule 2-01(c)(7)(i)(B) of Regulation S-X (the “Pre-Approval Policy”) with respect to services provided by the registrant’s independent auditors. Pursuant to the Pre-Approval Policy, the Audit Committee has pre-approved the services set forth in the table below with respect to the registrant up to the specified fee limits. Certain fee limits are based on aggregate fees to the registrant and other registrants within the Delaware Funds®by Macquarie.
| Service | Range of Fees |
| Audit Services | |
| Statutory audits or financial audits for new Funds | up to $40,000 per Fund |
| Services associated with SEC registration statements (e.g., Form N-1A, Form N-14, etc.), periodic reports and other documents filed with the SEC or other documents issued in connection with securities offerings (e.g., comfort letters for closed-end Fund offerings, consents), and assistance in responding to SEC comment letters | up to $10,000 per Fund |
| Consultations by Fund management as to the accounting or disclosure treatment of transactions or events and/or the actual or potential impact of final or proposed rules, standards or interpretations by the SEC, FASB, or other regulatory or standard-setting bodies (Note: Under SEC rules, some consultations may be considered “audit-related services” rather than “audit services”) | up to $25,000 in the aggregate |
| Audit-Related Services | |
| Consultations by Fund management as to the accounting or disclosure treatment of transactions or events and /or the actual or potential impact of final or proposed rules, standards or interpretations by the SEC, FASB, or other regulatory or standard-setting bodies (Note: Under SEC rules, some consultations may be considered “audit services” rather than “audit-related services”) | up to $25,000 in the aggregate |
| Tax Services | |
| U.S. federal, state and local and international tax planning and advice (e.g., consulting on statutory, regulatory or administrative developments, evaluation of Funds’ tax compliance function, etc.) | up to $25,000 in the aggregate |
| U.S. federal, state and local tax compliance (e.g., excise distribution reviews, etc.) | up to $5,000 per Fund |
| Review of federal, state, local and international income, franchise and other tax returns | up to $5,000 per Fund |
Under the Pre-Approval Policy, the Audit Committee has also pre-approved the services set forth in the table below with respect to the registrant’s investment adviser and other entities controlling, controlled by or under common control with the investment adviser that provide ongoing services to the registrant (the “Control Affiliates”) up to the specified fee limit. This fee limit is based on aggregate fees to the investment adviser and its Control Affiliates.
| Service | Range of Fees |
| Non-Audit Services | |
| Services associated with periodic reports and other documents filed with the SEC and assistance in responding to SEC comment letters | up to $10,000 in the aggregate |
The Pre-Approval Policy requires the registrant’s independent auditors to report to the Audit Committee at each of its regular meetings regarding all services initiated since the last such report was rendered, including those services authorized by the Pre-Approval Policy.
(f) Not applicable.
(g) The aggregate non-audit fees billed by the registrant’s independent auditors for services rendered to the registrant and to its investment adviser and other service providers under common control with the adviser were $11,748,000 and $11,180,000 for the registrant’s fiscal years ended December 31, 2018 and December 31, 2017, respectively.
(h) In connection with its selection of the independent auditors, the registrant’s Audit Committee has considered the independent auditors’ provision of non-audit services to the registrant’s investment adviser and other service providers under common control with the adviser that were not required to be pre-approved pursuant to Rule 2-01(c)(7)(ii) of Regulation S-X. The Audit Committee has determined that the independent auditors’ provision of these services is compatible with maintaining the auditors’ independence.
Item 5. Audit Committee of Listed Registrants
Not applicable.
Item 6. Investments
(a) Included as part of report to shareholders filed under Item 1 of this Form N-CSR.
(b) Divestment of securities in accordance with Section 13(c) of the Investment Company Act of 1940.
Not applicable.
Item 7. Disclosure of Proxy Voting Policies and Procedures for Closed-End Management Investment Companies
Not applicable.
Item 8. Portfolio Managers of Closed-End Management Investment Companies
Not applicable.
Item 9. Purchases of Equity Securities by Closed-End Management Investment Company and Affiliated Purchasers
Not applicable.
Item 10. Submission of Matters to a Vote of Security Holders
Not applicable.
Item 11. Controls and Procedures
The registrant’s principal executive officer and principal financial officer have evaluated the registrant’s disclosure controls and procedures within 90 days of the filing of this report and have concluded that they are effective in providing reasonable assurance that the information required to be disclosed by the registrant in its reports or statements filed under the Securities Exchange Act of 1934 is recorded, processed, summarized and reported within the time periods specified in the rules and forms of the Securities and Exchange Commission.
There were no significant changes in the registrant’s internal control over financial reporting that occurred during the second fiscal quarter of the period covered by the report to stockholders included herein (i.e., the registrant’s fourth fiscal quarter) that have materially affected, or are reasonably likely to materially affect, the registrant’s internal control over financial reporting.
Item 12. Disclosure of Securities Lending Activities for Closed-End Management Investment Companies
Not applicable.
Item 13. Exhibits
(a) (1) Code of Ethics
Not applicable.
(2) Certifications of Principal Executive Officer and Principal Financial Officer pursuant to Rule 30a-2 under the Investment Company Act of 1940 are attached hereto as Exhibit 99.CERT.
(3) Written solicitations to purchase securities pursuant to Rule 23c-1 under the Securities Exchange Act of 1934.
Not applicable.
(b) Certifications pursuant to Section 906 of the Sarbanes-Oxley Act of 2002 are furnished herewith as Exhibit 99.906CERT.
SIGNATURES
Pursuant to the requirements of the Securities Exchange Act of 1934 and the Investment Company Act of 1940, the registrant has duly caused this report to be signed on its behalf, by the undersigned, thereunto duly authorized.
DELAWARE VIP®TRUST
| SHAWN K. LYTLE |
| By: | Shawn K. Lytle |
| Title: | President and Chief Executive Officer |
| Date: | March 6, 2019 |
Pursuant to the requirements of the Securities Exchange Act of 1934 and the Investment Company Act of 1940, this report has been signed below by the following persons on behalf of the registrant and in the capacities and on the dates indicated.
| SHAWN K. LYTLE |
| By: | Shawn K. Lytle |
| Title: | President and Chief Executive Officer |
| Date: | March 6, 2019 |
| |
| RICHARD SALUS |
| By: | Richard Salus |
| Title: | Chief Financial Officer |
| Date: | March 6, 2019 |


