Item 1. Reports to Stockholders

Delaware VIP® Trust
Delaware VIP Diversified Income Series
December 31, 2019
|
Beginning on or about June 1, 2021, as permitted by regulations adopted by the Securities and Exchange Commission, paper copies of your Series’ shareholder reports will no longer be sent to you by mail, unless you specifically request them from the Series or from your financial intermediary, such as a broker/dealer, bank, or insurance company. Instead, you will be notified by mail each time a report is posted on the website and provided with a link to access the report. If you already elected to receive shareholder reports electronically, you will not be affected by this change and you do not need to take any action. You may elect to receive paper copies of all future shareholder reports free of charge. You can inform the Series that you wish to continue receiving paper copies of your shareholder reports by contacting us at 800523-1918. If you own these shares through a financial intermediary, you may contact your financial intermediary to elect to continue to receive paper copies of your shareholder reports. Your election to receive reports in paper will apply to all funds held with the Delaware Funds® by Macquarie or your financial intermediary. |
Table of contents
Other than Macquarie Bank Limited (MBL), none of the entities noted are authorized deposit-taking institutions for the purposes of the Banking Act 1959 (Commonwealth of Australia). The obligations of these entities do not represent deposits or other liabilities of MBL. MBL does not guarantee or otherwise provide assurance in respect of the obligations of these entities, unless noted otherwise. The Series is governed by US laws and regulations.
Unless otherwise noted, views expressed herein are current as of Dec. 31, 2019, and subject to change for events occurring after such date.
The Series is not FDIC insured and is not guaranteed. It is possible to lose the principal amount invested.
Advisory services provided by Delaware Management Company, a series of Macquarie Investment Management Business Trust (MIMBT), a US registered investment advisor.
The Series is distributed byDelaware Distributors, L.P.(DDLP), an affiliate of MIMBT and Macquarie Group Limited. Macquarie Investment Management (MIM) is the marketing name for certain companies comprising the asset management division of Macquarie Group Limited and its subsidiaries and affiliates worldwide.
This material may be used in conjunction with the offering of shares in Delaware VIP® Diversified Income Series only if preceded or accompanied by the Series’ current prospectus or the summary prospectus.
© 2020 Macquarie Management Holdings, Inc.
All third-party marks cited are the property of their respective owners.
| | |
Delaware VIP®Trust — Delaware VIP Diversified Income Series |
Portfolio management review | | January 7, 2020 (Unaudited) |
The investment objective of the Series is to seek maximum long-term total return consistent with reasonable risk.
For the fiscal year ended Dec. 31, 2019, Delaware VIP Diversified Income Series (the “Series”) Standard Class shares gained 10.43% and Service Class shares gained 10.08%. Both figures reflect all dividends reinvested. The Series’ benchmark, the Bloomberg Barclays US Aggregate Index, advanced 8.72% for the same period.
The major theme of the Series’ fiscal year was the great monetary policy pivot. The period began with the US Treasury yield above 3% and the US Federal Reserve contemplating four additional rate hikes heading into 2019. While the Fed had raised rates at the end of the prior fiscal period, by early 2019 it was apparent that further hikes were untenable. The US economy, though among the strongest globally, was no longer able to sustain a10-year interest rate above 3% or a federal funds rate in themid-2% range.
As 2019 began, economic indicators in the United States began to flash yellow while global financial conditions were flashing red. The liquidity-induced risk-assets selloff at the end of 2018 reflected the ongoing unhealthy dependence of asset prices on monetary policy. Bymid-2019, there were other signs of an impending global slowdown as well, including corporate earnings’ deceleration, declining global manufacturing activity, the continuingUS-China trade war, and the ongoing Brexit drama. Many investors saw the yield-curve inversion and the August peak of $17 trillion worldwide in negative-yielding debt as signals of a potential recession.
This prompted the Fed and central banks in Australia, Europe, and the United Kingdom to shift to a more accommodative monetary policy. In the US, the Fed first signaled a hold on further rate hikes and then terminated quantitative tightening (QT) and balance-sheet reductions. Three interest rate cuts, of 0.25 percentage points each, followed in July, September, and October.
The substantial liquidity infusion coupled with the December announcement of a Phase 1 trade agreement with China, sent both interest rates and risk premiums significantly lower. Fixed income delivered its best total return since 2002, finishing the year with investors rushing in search of yield. We believe the fiscal year was a good example of the potential benefit of owning bonds as part of a diversified investment portfolio. During the period, bonds provided a stabilizing benefit and a return competitive with that of equities.
Entering fiscal year 2019, we assessed that long-standing secular factors would continue to drive asset markets and global economic growth and inflation. These included aging demographics, rising debt, and increased digitization, which have for decades held down growth and inflation. In recent years, two additional themes have emerged: increased dependency of asset prices on monetary policy, and deglobalization, seen in the form of rising populism. With that as a backdrop, we resisted reacting to short-term headlines, such as Brexit, the US trade war with China, or pockets of global unrest. Instead, we focused on the underlying issues.
Because we believed that the Fed would have to pivot on its monetary policy, we didn’t react defensively to the market volatility in the fourth quarter of 2018, which preceded this fiscal year. Instead, we added duration as the10-year Treasury yield rose above 3%. We also were comfortable holding additional credit risk at that time. That decision benefited Series returns. However, as monetary policy pivoted in 2019 and credit spreads narrowed below long-term averages, we began to cut the Series’ exposure to convertible bonds, high yield bonds, and emerging markets debt, and eliminated local-currency exposure. We also shifted to a more-defensive positioning in the various risk sectors. The objective was to build a capital cushion in the form of higher-quality securities, particularly Treasurys.
Overall, sector allocation was the largest contributor to the Series’ relative performance. The key contributors to returns were the spread sectors, where the Series had been overweight at the start of the12-month period, including high yield bonds, emerging markets debt, and investment grade corporates. The latter includedBBB-rated securities, which we thought had been fundamentally misunderstood and mispriced.
Individual securities contributing to Series performance included Brazilian quasi-corporate and corporate securities, from issuers that included energy firmPetrobras Global Finance BV,which benefited from improved risk sentiment in emerging markets generally and ade-escalation of political risk in Brazil. Within corporate bonds, subordinated bonds issued by financial institutions – includingLloyds Banking Group PLC, Credit Suisse Group AG, and Royal Bank of Scotland Group PLC– benefited from a strong technical tailwind created by the lack of new issuance of credit in that sector and strong bank fundamentals. We began monetizing returns when spreads compressed to fair value. This was the case with the Lloyds position.
Within investment grade corporate bonds, security selection in the technology, media, and telecommunications (TMT) sector was positive, including an overweight to long-maturity bonds issued byVerizon Communications Inc., which had improving credit quality throughout the year accompanied by significant spread compression.
The Series also benefited from the reversal of a liability related to a General Motors Corp. term loan previously held by the Series. We welcomed this development since the loan had earlier negatively affected performance.
Diversified Income Series-1
| | |
| Delaware VIP® Trust — Delaware VIP Diversified Income Series |
| Portfolio management review (continued) | | January 7, 2020 (Unaudited) |
The Series’ allocation to interest-only mortgage-backed securities (MBS), established as a hedge against rising interest rates prior to this fiscal year, detracted from performance once interest rates began to decline, even though we gradually reduced the Series’ exposure to zero throughout the period.
Within high yield bonds, despite the Series’ underweight to the energy sector, exposure to energy firmAlta Mesa Holdings LPhurt performance. The issue was the Series’ largest corporate high yield detractor. The company reported year-over-year results that were much weaker than expected. Because we believed Alta Mesa’s business model had deteriorated, we decided to exit the position.
Within emerging markets, exposure to Argentine securities, which posed increased risk following the negative effect of the country’s surprising election results, hurt the Series’ performance. However, the Series’ overweight to the country was relatively small, and the bulk of the exposure was in corporate securities, which significantly outperformed the country’s sovereign bonds. Because we believe the risks of possible restructuring are already priced into these bonds, we retained the Series’ exposure to Argentine sovereign and corporate bonds.
As the fiscal year ended,10-year Treasury yields were nearall-time lows, negative interest rates appeared to be here to stay, global monetary policy remained firmly committed to supporting economic growth, and yield spreads and risk premiums broadly reflected this improved landscape. We believe the challenge for 2020 lies in balancing the risks – including the yield curve inversion of 2019, which signaled a potential recession – and evolving themes related to the dislocations caused by the record, decade-long US economic expansion.
These themes are manifested globally by the increase in populism and deglobalization. TheUS-China trade war, even if resolved, would not entirely erase the global uncertainties related to protectionism, which have made decision-making more challenging for business leaders, in our view. The increase in popular uprisings globally have created a further challenge as have uncertainties pertaining to the 2020 US election. As a counterbalance, however, we thinklow-to-negative interest rates and a global glut of savings as the population ages should likely generate continued support for US dollar-denominated fixed income securities, especially higher-quality segments that offer not only some of the highest interest rates globally but a unique safe haven in times of uncertainty.
The Series used derivatives during the fiscal year, including foreign currency exchange contracts, futures contracts, swap contracts, and options. The use of derivatives was limited, mostly related to US interest rate futures intended to provide a relatively efficient way to express a view or to hedge portfolio risk. These derivatives did not have a material effect on Series performance.
|
| Unless otherwise noted, views expressed herein are current as of Dec. 31, 2019, and subject to change. |
Diversified Income Series-2
| | |
| Delaware VIP® Trust — Delaware VIP Diversified Income Series |
| Performance summary (Unaudited) | | |
The performance quoted represents past performance and does not guarantee future results. Investment return and principal value of an investment will fluctuate so that shares, when redeemed, may be worth more or less than their original cost. Current performance may be lower or higher than the performance quoted.
Carefully consider the Series’ investment objectives, risk factors, charges, and expenses before investing. This and other information can be found in the Series’ prospectus and its summary prospectus, which may be obtained by visiting delawarefunds.com/vip/literature or calling 800523-1918. Investors should read the prospectus and the summary prospectus carefully before investing.
| | | | | | | | | | | | | | | | | | | | |
Delaware VIP Diversified Income Series | | | | | | | | | | | | | | | | | | | | |
Average annual total returns | | | | | | | | | | | | | | | | | | | | |
| For periods ended December 31, 2019 | | 1 year | | | 3 year | | | 5 year | | | 10 year | | | Lifetime | |
Standard Class shares (commenced operations on May 16, 2003) | | | +10.43% | | | | +4.38% | | | | +3.09% | | | | +4.09% | | | | +5.37% | |
| | | | | | | | | | | | | | | | | | | | |
Service Class shares (commenced operations on May 16, 2003) | | | +10.08% | | | | +4.10% | | | | +2.83% | | | | +3.83% | | | | +5.10% | |
| | | | | | | | | | | | | | | | | | | | |
Bloomberg Barclays US Aggregate Index | | | +8.72% | | | | +4.03% | | | | +3.05% | | | | +3.75% | | | | n/a | |
Returns reflect the reinvestment of all distributions. Please see page 4 for a description of the index.
As described in the Series’ most recent prospectus, the net expense ratio for Service Class shares of the Series was 0.90%, while total operating expenses for Standard Class and Service Class shares were 0.65% and 0.95%, respectively. The management fee for Standard Class and Service Class shares was 0.58%. The Series’ investment manager, Delaware Management Company (Manager), has contractually agreed to waive all or a portion of its investment advisory fees and/or pay/reimburse expenses (excluding any12b-1 fees, acquired fund fees and expenses, taxes, interest, short sale and dividend interest expenses, brokerage fees, certain insurance costs, and nonroutine expenses or costs, including, but not limited to, those relating to reorganizations, litigation, conducting shareholder meetings, and liquidations) in order to prevent annual series operating expenses from exceeding 0.60% of the Series’ average daily net assets from Jan. 1, 2019 through Dec. 31, 2019.*
The Series pays Delaware Distributors, L.P. (DDLP), the distributor and an affiliate of DMC, an annual12b-1 fee of 0.30% of the average daily net assets of the Service Class shares. Prior to May 1, 2018, DDLP had contracted to waive12b-1 fees in order to limit12b-1 fees of the Service Class shares to 0.25% of average daily net assets.
Earnings from a variable annuity or variable life investment compoundtax-free until withdrawal, and as a result, no adjustments were made for income taxes.
Expense limitations were in effect for both classes during certain periods shown in the Series performance table above and in the Performance of a $10,000 Investment graph on the next page.
Performance data do not reflect insurance fees related to a variable annuity or variable life investment or the deferred sales charge that would apply to certain withdrawals of investments held for fewer than eight years. Performance shown here would have been reduced if such fees were included and the expense limitation removed. For more information about fees, consult your variable annuity or variable life prospectus.
Investments in variable products involve risk.
Fixed income securities and bond funds can lose value, and investors can lose principal, as interest rates rise. They also may be affected by economic conditions that hinder an issuer’s ability to make interest and principal payments on its debt.
The Series may also be subject to prepayment risk, the risk that the principal of a bond that is held by a portfolio will be prepaid prior to maturity, at the time when interest rates are lower than what the bond was paying. The Series may then have to reinvest that money at a lower interest rate.
The Series may invest in derivatives, which may involve additional expenses and are subject to risk, including the risk that an underlying security or securities index moves in the opposite direction from what the portfolio manager anticipated. A derivatives transaction depends upon the counterparties’ ability to fulfill their contractual obligations.
High yielding,non-investment-grade bonds (junk bonds) involve higher risk than investment grade bonds. The high yield secondary market is particularly susceptible to liquidity problems when institutional investors, such as mutual funds and certain other financial institutions, temporarily stop buying bonds for regulatory, financial, or other reasons. In addition, a less liquid secondary market makes it more difficult for the Fund to obtain precise valuations of the high yield securities in its portfolio.
Diversified Income Series-3
Delaware VIP® Diversified Income Series
Performance summary (Unaudited) (continued)
The Series may experience portfolio turnover in excess of 100%, which could result in higher transaction costs and higher taxes when fund shares are held in a taxable account.
International investments entail risks not ordinarily associated with US investments including fluctuation in currency values, differences in accounting principles, or economic or political instability in other nations. Investing in emerging markets can be riskier than investing in established foreign markets due to increased volatility and lower trading volume.
If and when the Series invests in forward foreign currency contracts or uses other investments to hedge against currency risks, the Series will be subject to special risks, including counterparty risk.
This document may mention bond ratings published by nationally recognized statistical rating organizations (NRSROs) Standard & Poor’s, Moody’s Investors Service, and Fitch, Inc. For securities rated by an NRSRO other than S&P, the rating is converted to the equivalent S&P credit rating. Bonds rated AAA are rated as having the highest quality and are generally considered to have the lowest degree of investment risk. Bonds rated AA are considered to be of high quality, but with a slightly higher degree of risk than bonds rated AAA. Bonds rated A are considered to have many favorable investment qualities, though they are somewhat more susceptible to adverse economic conditions. Bonds rated BBB are believed to be of medium-grade quality and generally riskier over the long term.
Mortgage-backed securities are fixed income securities that represent pools of mortgages, with investors receiving principal and interest payments as the underlying mortgage loans are paid back. Many are issued and guaranteed against default by the US government or its agencies or instrumentalities, such as Freddie Mac, Fannie Mae, and Ginnie Mae. Others are issued by private financial institutions, with some fully collateralized by certificates issued or guaranteed by the US government or its agencies or instrumentalities.
LIBOR risk is the risk that potential changes related to the use of the London interbank offered rate (LIBOR) could have adverse impacts on financial instruments which reference LIBOR. The potential abandonment of LIBOR could affect the value and liquidity of instruments which reference LIBOR.
Please read both the contract and underlying prospectus for specific details regarding the product’s risk profile.
*The aggregate contractual waiver period covering this report is from April 30, 2018 through April 30, 2020.
| | | | | | |
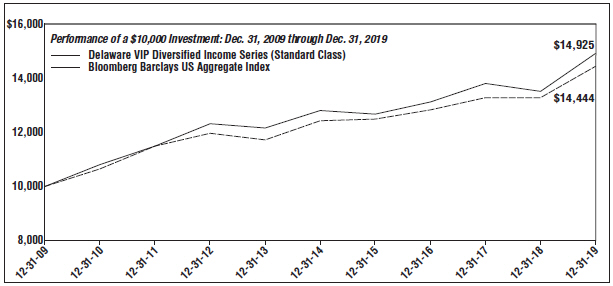
| For period beginning Dec. 31, 2009 through Dec. 31, 2019 | | Starting value | | Ending value |
–– Delaware VIP Diversified Income Series (Standard Class) | | $10,000 | | $14,925 |
– – Bloomberg Barclays US Aggregate Index | | $10,000 | | $14,444 |
The graph shows a $10,000 investment in the Delaware VIP Diversified Income Series Standard Class shares for the period from Dec. 31, 2009 through Dec. 31, 2019.
The graph also shows $10,000 invested in the Bloomberg Barclays US Aggregate Index for the period from Dec. 31, 2009 through Dec. 31, 2019. The Bloomberg Barclays US Aggregate Index is a broad composite that tracks the investment grade domestic bond market.
Diversified Income Series-4
Delaware VIP® Diversified Income Series
Performance summary (Unaudited) (continued)
Index performance returns do not reflect any management fees, transaction costs or expenses. Indices are unmanaged and one cannot invest directly in an index.
Performance of Service Class shares will vary due to different charges and expenses.
Past performance is not a guarantee of future results.
Diversified Income Series-5
Delaware VIP® Trust — Delaware VIP Diversified Income Series
Disclosure of Series expenses
For thesix-month period from July 1, 2019 to December 31, 2019 (Unaudited)
As a shareholder of the Series, you incur ongoing costs, which may include management fees; distribution and service(12b-1) fees; and other Series expenses. This example is intended to help you understand your ongoing costs (in dollars) of investing in the Series and to compare these costs with the ongoing costs of investing in other mutual funds.
The example is based on an investment of $1,000 invested at the beginning of the period and held for the entiresix-month period from July 1, 2019 to Dec. 31, 2019.
Actual expenses
The first section of the table shown, “Actual Series return,” provides information about actual account values and actual expenses. You may use the information in this section of the table, together with the amount you invested, to estimate the expenses that you paid over the period. Simply divide your account value by $1,000 (for example, an $8,600 account value divided by $1,000 = 8.6), then multiply the result by the number in the first section under the heading entitled “Expenses Paid During Period” to estimate the expenses you paid on your account during the period.
Hypothetical example for comparison purposes
The second section of the table shown, “Hypothetical 5% return,” provides information about hypothetical account values and hypothetical expenses based on the Series’ actual expense ratio and an assumed rate of return of 5% per year before expenses, which is not the Series’ actual return. The hypothetical account values and expenses may not be used to estimate the actual ending account balance or expenses you paid for the period. You may use this information to compare the ongoing costs of investing in the Series and other funds. To do so, compare this 5% hypothetical example with the 5% hypothetical examples that appear in the shareholder reports of other funds.
Please note that the expenses shown in the table are meant to highlight your ongoing costs only. As a shareholder of the Series, you do not incur any transaction costs, such as sales charges (loads), redemption fees or exchange fees, but shareholders of other funds may incur such costs. Also, the fees related to the variable annuity investment or the deferred sales charge that could apply have not been included. Therefore, the second section of the table is useful in comparing ongoing costs only, and will not help you determine the relative total costs of owning different funds. The Series’ expenses shown in the table reflect fee waivers in effect and assume reinvestment of all dividends and distributions.
Expense analysis of an investment of $1,000
| | | | | | | | | | | | | | | | |
| | | Beginning
Account
Value
7/1/19 | | | Ending
Account
Value
12/31/19 | | | Annualized
Expense
Ratio | | | Expenses
Paid During
Period
7/1/19 to
12/31/19* | |
| | | | |
Actual Series return† | | | | | | | | | | | | | | | | |
Standard Class | | | $1,000.00 | | | | $1,025.90 | | | | 0.60% | | | | $3.06 | |
Service Class | | | 1,000.00 | | | | 1,024.10 | | | | 0.90% | | | | 4.59 | |
|
Hypothetical 5% return(5% return before expenses) | |
Standard Class | | | $1,000.00 | | | | $1,022.18 | | | | 0.60% | | | | $3.06 | |
Service Class | | | 1,000.00 | | | | 1,020.67 | | | | 0.90% | | | | 4.58 | |
*“Expenses Paid During Period” are equal to the Series’ annualized expense ratio, multiplied by the average account value over the period, multiplied by 184/365 (to reflect theone-half year period).
| † | Because actual returns reflect only the most recentsix-month period, the returns shown may differ significantly from fiscal year returns. |
In addition to the Series’ expenses reflected above, the Series also indirectly bears its portion of the fees and expenses of the investment companies (Underlying Funds) in which it invests. The table above does not reflect the expenses of the Underlying Funds.
Diversified Income Series-6
Delaware VIP® Trust — Delaware VIP Diversified Income Series
Security type / sector allocation
As of December 31, 2019 (Unaudited)
Sector designations may be different than the sector designations presented in other Series materials. The sector designations may represent the investment manager’s internal sector classifications.
| | | | | |
| Security type / sector | | Percentage of net assets |
Agency Asset-Backed Security | | | | 0.00 | % |
Agency Collateralized Mortgage Obligations | | | | 1.31 | % |
Agency Commercial Mortgage-Backed Securities | | | | 0.94 | % |
Agency Mortgage-Backed Securities | | | | 19.12 | % |
Collateralized Debt Obligations | | | | 1.91 | % |
Corporate Bonds | | | | 36.59 | % |
Banking | | | | 5.58 | % |
Basic Industry | | | | 2.72 | % |
Brokerage | | | | 0.17 | % |
Capital Goods | | | | 1.62 | % |
Communications | | | | 5.41 | % |
Consumer Cyclical | | | | 1.49 | % |
ConsumerNon-Cyclical | | | | 4.31 | % |
Electric | | | | 4.50 | % |
Energy | | | | 5.09 | % |
Finance Companies | | | | 1.26 | % |
Insurance | | | | 0.61 | % |
Natural Gas | | | | 0.35 | % |
Real Estate Investment Trusts | | | | 0.55 | % |
Technology | | | | 2.05 | % |
Transportation | | | | 0.75 | % |
Utilities | | | | 0.13 | % |
Loan Agreements | | | | 3.89 | % |
Municipal Bonds | | | | 0.08 | % |
Non-Agency Asset-Backed Securities | | | | 2.59 | % |
Non-Agency Collateralized Mortgage Obligations | | | | 1.56 | % |
Non-Agency Commercial Mortgage-Backed Securities | | | | 7.36 | % |
Sovereign Bonds | | | | 1.74 | % |
Supranational Banks | | | | 0.07 | % |
| | | | | |
| Security type / sector | | Percentage of
net assets |
US Treasury Obligations | | | | 18.01 | % |
Common Stock | | | | 0.00 | % |
Preferred Stock | | | | 0.01 | % |
Short-Term Investments | | | | 4.07 | % |
Total Value of Securities | | | | 99.25 | % |
Receivables and Other Assets Net of Liabilities | | | | 0.75 | % |
Total Net Assets | | | | 100.00 | % |
Diversified Income Series-7
Delaware VIP® Trust — Delaware VIP Diversified Income Series
Schedule of investments
December 31, 2019
| | | | | | | | |
| | | Principal amount° | | | Value (US $) | |
| | |
Agency Asset-Backed Security – 0.00% | | | | | | | | |
Fannie Mae REMIC Trust Series2002-W11 AV1 1.982% (LIBOR01M + 0.34%, Floor 0.17%) 11/25/32 • | | | 642 | | | $ | 630 | |
| | | | | | | | |
Total Agency Asset-Backed Security
(cost $642) | | | | | | | 630 | |
| | | | | | | | |
| | |
Agency Collateralized Mortgage
Obligations – 1.31% | | | | | | | | |
Fannie Mae Connecticut Avenue Securities | | | | | | | | |
Series2017-C04 2M2 4.642% (LIBOR01M + 2.85%) 11/25/29 • | | | 990,000 | | | | 1,023,797 | |
Series2018-C02 2M2 3.992% (LIBOR01M + 2.20%, Floor 2.20%) 8/25/30 • | | | 1,492,137 | | | | 1,505,065 | |
Series2018-C03 1M2 3.942% (LIBOR01M + 2.15%, Floor 2.15%) 10/25/30 • | | | 1,750,000 | | | | 1,763,415 | |
Series2018-C05 1M2 4.142% (LIBOR01M + 2.35%, Floor 2.35%) 1/25/31 • | | | 1,295,000 | | | | 1,313,454 | |
Fannie Mae Grantor Trust | | | | | | | | |
Series1999-T2 A1 7.50% 1/19/39 • | | | 256 | | | | 277 | |
Series2004-T1 1A2 6.50% 1/25/44 | | | 3,549 | | | | 4,047 | |
Fannie Mae Interest Strip Series 419 C3 3.00% 11/25/43S | | | 1,009,636 | | | | 166,755 | |
Fannie Mae REMIC Trust | | | | | | | | |
Series2002-W6 2A1 7.00% 6/25/42 • | | | 11,420 | | | | 12,645 | |
Series2004-W11 1A2 6.50% 5/25/44 | | | 19,252 | | | | 22,001 | |
Fannie Mae REMICs | | | | | | | | |
Series2010-116 Z 4.00% 10/25/40 | | | 25,184 | | | | 26,469 | |
Series2013-28 YB 3.00% 4/25/43 | | | 52,000 | | | | 53,148 | |
Series2013-44 Z 3.00% 5/25/43 | | | 73,726 | | | | 72,928 | |
Series2015-89 AZ 3.50% 12/25/45 | | | 370,239 | | | | 381,702 | |
Series2017-40 GZ 3.50% 5/25/47 | | | 886,924 | | | | 921,970 | |
Series2017-77 HZ 3.50% 10/25/47 | | | 1,267,881 | | | | 1,301,880 | |
Series2017-94 CZ 3.50% 11/25/47 | | | 794,975 | | | | 812,778 | |
Freddie Mac REMICs | | | | | | | | |
Series 4665 NI 3.50% 7/15/41S | | | 5,004,696 | | | | 263,920 | |
Series 4673 WI 3.50% 9/15/43S | | | 1,471,894 | | | | 95,523 | |
Series 4676 KZ 2.50% 7/15/45 | | | 865,781 | | | | 835,599 | |
Freddie Mac Structured Agency Credit Risk Debt Notes | | | | | | | | |
Series 2015-DNA3 M2 4.642% (LIBOR01M + 2.85%) 4/25/28 • | | | 381,276 | | | | 384,937 | |
Series 2016-DNA3 M2 3.792% (LIBOR01M + 2.00%) 12/25/28 • | | | 86,696 | | | | 86,823 | |
| | | | | | | | |
| | | Principal amount° | | | Value (US $) | |
| | |
Agency Collateralized Mortgage Obligations (continued) | | | | | | | | |
Freddie Mac Structured Agency Credit Risk Debt Notes | | | | | | | | |
Series 2016-DNA4 M2 3.092% (LIBOR01M + 1.30%, Floor 1.30%) 3/25/29 • | | | 245,674 | | | $ | 246,165 | |
Series 2017-DNA1 M2 5.042% (LIBOR01M + 3.25%, Floor 3.25%) 7/25/29 • | | | 2,250,000 | | | | 2,364,708 | |
Series 2017-DNA3 M2 4.292% (LIBOR01M + 2.50%) 3/25/30 • | | | 6,530,000 | | | | 6,682,806 | |
Series 2017-HQA2 M2AS 2.842% (LIBOR01M + 1.05%) 12/25/29 • | | | 700,000 | | | | 694,912 | |
Series 2018-HQA1 M2 4.092% (LIBOR01M + 2.30%) 9/25/30 • | | | 2,000,000 | | | | 2,022,471 | |
Freddie Mac Structured Agency Credit Risk REMIC Series 2019-HQA4 M2 144A 3.842% (LIBOR01M + 2.05%) 11/25/49 #• | | | 4,000,000 | | | | 4,020,286 | |
Freddie Mac Structured Pass Through Certificates | | | | | | | | |
SeriesT-54 2A 6.50% 2/25/43◆ | | | 8,785 | | | | 10,217 | |
SeriesT-58 2A 6.50% 9/25/43◆ | | | 3,068 | | | | 3,457 | |
GNMA | | | | | | | | |
Series2013-113 LY 3.00% 5/20/43 | | | 378,000 | | | | 389,040 | |
Series2015-74 CI 3.00% 10/16/39S | | | 1,818,579 | | | | 148,853 | |
Series2015-142 AI 4.00% 2/20/44S | | | 481,328 | | | | 40,974 | |
Series2016-156 PB 2.00% 11/20/46 | | | 794,000 | | | | 720,412 | |
Series2017-18 QI 4.00% 3/16/41S | | | 2,102,862 | | | | 255,605 | |
Series2017-34 DY 3.50% 3/20/47 | | | 2,067,000 | | | | 2,209,493 | |
Series2017-56 JZ 3.00% 4/20/47 | | | 764,724 | | | | 779,733 | |
Series2017-107 QZ 3.00% 8/20/45 | | | 577,326 | | | | 576,974 | |
Series2017-130 YJ 2.50% 8/20/47 | | | 665,000 | | | | 663,629 | |
Series2018-34 TY 3.50% 3/20/48 | | | 476,000 | | | | 493,166 | |
| | | | | | | | |
Total Agency Collateralized
Mortgage Obligations
(cost $32,751,389) | | | | 33,372,034 | |
| | | | | | | | |
| | |
Agency Commercial Mortgage-Backed Securities – 0.94% | | | | | | | | |
Freddie Mac Multifamily Structured Pass Through Certificates | | | | | | | | |
Series X3FX A2FX 3.00% 6/25/27◆ | | | 2,545,000 | | | | 2,624,474 | |
FREMF Mortgage Trust | | | | | | | | |
Series2010-K8 B 144A 5.278% 9/25/43 #• | | | 2,040,000 | | | | 2,057,551 | |
Series2011-K15 B 144A 4.961% 8/25/44 #• | | | 195,000 | | | | 202,049 | |
Series2012-K18 B 144A 4.249% 1/25/45 #• | | | 2,000,000 | | | | 2,071,236 | |
Series2012-K22 B 144A 3.687% 8/25/45 #• | | | 1,730,000 | | | | 1,785,495 | |
Diversified Income Series-8
Delaware VIP® Diversified Income Series
Schedule of investments (continued)
| | | | | | | | |
| | | Principal amount° | | | Value (US $) | |
| | |
Agency Commercial Mortgage-Backed Securities (continued) | | | | | | | | |
FREMF Mortgage Trust | | | | | | | | |
Series2013-K25 C 144A 3.619%
11/25/45 #• | | | 1,500,000 | | | $ | 1,527,522 | |
Series2013-K28 B 144A 3.49% 6/25/46 #• | | | 2,400,000 | | | | 2,451,138 | |
Series 2013-K713 B 144A 3.169% 4/25/46 #• | | | 605,000 | | | | 604,511 | |
Series 2013-K713 C 144A 3.169% 4/25/46 #• | | | 2,275,000 | | | | 2,274,817 | |
Series2014-K37 B 144A 4.559% 1/25/47 #• | | | 1,500,000 | | | | 1,614,960 | |
Series 2014-K717 B 144A 3.63% 11/25/47 #• | | | 3,205,000 | | | | 3,271,901 | |
Series 2014-K717 C 144A 3.63% 11/25/47 #• | | | 1,055,000 | | | | 1,072,081 | |
Series2016-K53 B 144A 4.02% 3/25/49 #• | | | 530,000 | | | | 553,783 | |
Series 2016-K722 B 144A 3.843% 7/25/49 #• | | | 580,000 | | | | 599,714 | |
Series2017-K71 B 144A 3.753% 11/25/50 #• | | | 1,175,000 | | | | 1,213,838 | |
| | | | | | | | |
Total Agency Commercial
Mortgage-Backed Securities
(cost $23,575,489) | | | | 23,925,070 | |
| | | | | | | | |
Agency Mortgage-Backed
Securities – 19.12% | | | | | |
Fannie Mae S.F. 30 yr | | | | | | | | |
3.00% 10/1/46 | | | 14,363,644 | | | | 14,701,881 | |
3.00% 4/1/47 | | | 1,839,002 | | | | 1,881,482 | |
3.00% 11/1/48 | | | 3,677,696 | | | | 3,764,227 | |
3.00% 7/1/49 | | | 2,238,909 | | | | 2,270,816 | |
3.00% 10/1/49 | | | 12,279,699 | | | | 12,472,046 | |
3.00% 11/1/49 | | | 19,542,289 | | | | 19,812,184 | |
3.00% 12/1/49 | | | 20,597,000 | | | | 21,056,373 | |
3.00% 1/1/50 | | | 15,448,000 | | | | 15,659,061 | |
3.50% 2/1/48 | | | 5,476,606 | | | | 5,749,749 | |
3.50% 3/1/48 | | | 10,620,113 | | | | 11,018,968 | |
3.50% 7/1/48 | | | 20,596,776 | | | | 21,361,454 | |
3.50% 6/1/49 | | | 51,165,324 | | | | 52,564,767 | |
3.50% 11/1/49 | | | 22,339,906 | | | | 23,007,599 | |
4.00% 4/1/48 | | | 19,987,292 | | | | 21,019,859 | |
4.00% 4/1/49 | | | 50,386,686 | | | | 52,352,598 | |
4.50% 11/1/39 | | | 699,665 | | | | 770,657 | |
4.50% 6/1/40 | | | 769,537 | | | | 834,632 | |
4.50% 7/1/40 | | | 733,219 | | | | 795,062 | |
4.50% 8/1/41 | | | 1,771,680 | | | | 1,964,000 | |
4.50% 5/1/46 | | | 147,810 | | | | 160,377 | |
4.50% 4/1/48 | | | 811,277 | | | | 880,392 | |
4.50% 12/1/48 | | | 784,427 | | | | 828,196 | |
4.50% 1/1/49 | | | 10,726,967 | | | | 11,632,827 | |
| | | | | | | | |
| | | Principal amount° | | | Value (US $) | |
| | |
Agency Mortgage-Backed Securities (continued) | | | | | | | | |
Fannie Mae S.F. 30 yr | | | | | | | | |
4.50% 11/1/49 | | | 4,741,620 | | | $ | 5,002,884 | |
5.00% 6/1/44 | | | 1,845,816 | | | | 2,054,003 | |
5.00% 7/1/47 | | | 1,165,916 | | | | 1,283,548 | |
5.00% 7/1/49 | | | 6,256,662 | | | | 6,828,163 | |
5.50% 5/1/44 | | | 19,130,188 | | | | 21,495,908 | |
5.50% 8/1/48 | | | 1,815,316 | | | | 1,991,578 | |
6.00% 6/1/41 | | | 4,053,663 | | | | 4,647,025 | |
6.00% 7/1/41 | | | 12,524,895 | | | | 14,359,196 | |
6.00% 7/1/41 | | | 8,237,061 | | | | 9,441,270 | |
6.00% 1/1/42 | | | 3,470,057 | | | | 3,978,266 | |
Fannie Mae S.F. 30 yr TBA 3.50% 1/1/49y | | | 1,626,000 | | | | 1,671,773 | |
Freddie Mac S.F. 30 yr | | | | | | | | |
3.00% 12/1/48 | | | 30,828,801 | | | | 31,457,620 | |
3.00% 11/1/49 | | | 15,440,229 | | | | 15,682,083 | |
3.00% 12/1/49 | | | 4,442,000 | | | | 4,513,525 | |
3.00% 1/1/50 | | | 3,361,000 | | | | 3,435,234 | |
3.50% 11/1/48 | | | 6,545,728 | | | | 6,906,054 | |
3.50% 10/1/49 | | | 8,796,702 | | | | 9,051,588 | |
4.00% 10/1/47 | | | 11,270,149 | | | | 11,840,918 | |
4.50% 7/1/45 | | | 5,847,050 | | | | 6,352,273 | |
5.00% 12/1/44 | | | 2,662,459 | | | | 2,936,621 | |
5.50% 6/1/41 | | | 3,550,010 | | | | 3,987,718 | |
5.50% 9/1/41 | | | 6,482,079 | | | | 7,281,033 | |
6.00% 7/1/40 | | | 9,909,523 | | | | 11,366,773 | |
GNMA II S.F. 30 yr | | | | | | | | |
5.50% 5/20/37 | | | 218,709 | | | | 244,312 | |
6.00% 2/20/39 | | | 241,201 | | | | 269,418 | |
6.00% 10/20/39 | | | 979,270 | | | | 1,105,245 | |
6.00% 2/20/40 | | | 976,740 | | | | 1,107,326 | |
6.00% 4/20/46 | | | 291,207 | | | | 320,869 | |
| | | | | | | | |
Total Agency Mortgage-Backed Securities
(cost $479,734,084) | | | | | | | 487,171,431 | |
| | | | | | | | |
| | |
Collateralized Debt Obligations – 1.91% | | | | | | | | |
Apex Credit CLO | | | | | | | | |
Series2017-1A A1 144A 3.406% (LIBOR03M + 1.47%, Floor 1.47%) 4/24/29 #• | | | 3,405,000 | | | | 3,404,268 | |
Series2018-1A A2 144A 2.97% (LIBOR03M + 1.03%) 4/25/31 #• | | | 6,200,000 | | | | 6,011,718 | |
Atlas Senior Loan Fund X Series2018-10A A 144A 3.091% (LIBOR03M + 1.09%) 1/15/31 #• | | | 3,400,000 | | | | 3,378,230 | |
CFIP CLO
Series2017-1A A 144A 3.223% (LIBOR03M + 1.22%) 1/18/30 #• | | | 6,300,000 | | | | 6,294,645 | |
Diversified Income Series-9
Delaware VIP® Diversified Income Series
Schedule of investments (continued)
| | | | | | | | |
| | | Principal amount° | | | Value (US $) | |
| | |
Collateralized Debt Obligations (continued) | | | | | | | | |
Galaxy XXI CLO
Series2015-21A AR 144A 2.986% (LIBOR03M + 1.02%) 4/20/31 #• | | | 3,000,000 | | | $ | 2,970,459 | |
KKR Financial CLO
Series2013-1A A1R 144A 3.291% (LIBOR03M + 1.29%) 4/15/29 #• | | | 3,000,000 | | | | 2,998,476 | |
Man GLG US CLO
Series2018-1A A1R 144A 3.106% (LIBOR03M + 1.14%) 4/22/30 #• | | | 8,200,000 | | | | 8,119,255 | |
Mariner CLO 5
Series2018-5A A 144A 3.05% (LIBOR03M + 1.11%, Floor 1.11%) 4/25/31 #• | | | 4,600,000 | | | | 4,577,759 | |
Midocean Credit CLO IX
Series2018-9A A1 144A 3.116% (LIBOR03M + 1.15%, Floor 1.15%) 7/20/31 #• | | | 3,000,000 | | | | 2,970,906 | |
Midocean Credit CLO VIII
Series2018-8A A1 144A 3.049% (LIBOR03M + 1.15%) 2/20/31 #• | | | 3,000,000 | | | | 2,972,991 | |
Saranac CLO VII
Series2014-2A A1AR 144A 3.129% (LIBOR03M + 1.23%) 11/20/29 #• | | | 3,000,000 | | | | 2,987,055 | |
Steele Creek CLO
Series2017-1A A 144A 3.251% (LIBOR03M + 1.25%) 1/15/30 #• | | | 2,000,000 | | | | 1,999,804 | |
| | | | | | | | |
Total Collateralized Debt Obligations
(cost $49,109,095) | | | | | | | 48,685,566 | |
| | | | | | | | |
| |
Corporate Bonds – 36.59% | | | | | |
Banking – 5.58% | | | | | | | | |
Akbank T.A.S. 144A 7.20% 3/16/27 #µ | | | 1,235,000 | | | | 1,209,875 | |
Banco de Credito del Peru 144A 2.70% 1/11/25 # | | | 1,125,000 | | | | 1,120,781 | |
Banco de Credito e Inversiones 144A 4.00% 2/11/23 # | | | 710,000 | | | | 735,245 | |
Banco do Brasil 3.875% 10/10/22 | | | 590,000 | | | | 602,856 | |
Banco General 144A 4.125% 8/7/27 # | | | 976,000 | | | | 1,027,589 | |
Banco Mercantil del Norte 144A 6.75% #µy | | | 700,000 | | | | 728,375 | |
Bancolombia 4.625% 12/18/29 µ | | | 1,185,000 | | | | 1,204,256 | |
Bangkok Bank 144A 3.733% 9/25/34 #µ | | | 1,255,000 | | | | 1,272,308 | |
Banistmo 144A 3.65% 9/19/22 # | | | 1,150,000 | | | | 1,164,745 | |
Bank of America | | | | | | | | |
2.456% 10/22/25 µ | | | 1,435,000 | | | | 1,444,223 | |
3.458% 3/15/25 µ | | | 6,890,000 | | | | 7,196,150 | |
Bank of China 144A 5.00% 11/13/24 # | | | 1,120,000 | | | | 1,224,195 | |
Bank of Georgia 144A 6.00% 7/26/23 # | | | 1,105,000 | | | | 1,168,137 | |
| | | | | | | | |
| | | Principal amount° | | | Value (US $) | |
| | |
Corporate Bonds (continued) | | | | | | | | |
Banking (continued) | | | | | | | | |
BBVA Bancomer | | | | | | | | |
144A 5.125% 1/18/33 #µ | | | 514,000 | | | $ | 519,800 | |
144A 6.75% 9/30/22 # | | | 796,000 | | | | 868,070 | |
BBVA USA | | | | | | | | |
2.875% 6/29/22 | | | 3,505,000 | | | | 3,554,532 | |
3.875% 4/10/25 | | | 2,530,000 | | | | 2,657,055 | |
Credit Suisse Group | | | | | | | | |
144A 2.593% 9/11/25 #µ | | | 3,765,000 | | | | 3,778,035 | |
144A 6.25%#µy | | | 5,560,000 | | | | 6,064,881 | |
144A 7.25%#µy | | | 2,585,000 | | | | 2,887,716 | |
DBS Group Holdings 144A 4.52% 12/11/28 #µ | | | 1,175,000 | | | | 1,251,644 | |
Fifth Third Bancorp | | | | | | | | |
3.65% 1/25/24 | | | 820,000 | | | | 864,551 | |
3.95% 3/14/28 | | | 6,190,000 | | | | 6,804,902 | |
Goldman Sachs Group 6.00% 6/15/20 | | | 6,485,000 | | | | 6,599,971 | |
JPMorgan Chase & Co. | | | | | | | | |
3.702% 5/6/30 µ | | | 230,000 | | | | 247,643 | |
4.023% 12/5/24 µ | | | 8,915,000 | | | | 9,506,520 | |
5.00%µy | | | 2,930,000 | | | | 3,050,863 | |
Morgan Stanley | | | | | | | | |
3.124% (LIBOR03M + 1.22%) 5/8/24 • | | | 3,945,000 | | | | 4,017,449 | |
5.00% 11/24/25 | | | 6,125,000 | | | | 6,898,751 | |
5.50% 1/26/20 | | | 1,060,000 | | | | 1,062,269 | |
PNC Bank | | | | | | | | |
2.70% 11/1/22 | | | 490,000 | | | | 499,339 | |
4.05% 7/26/28 | | | 4,705,000 | | | | 5,163,260 | |
PNC Financial Services Group 2.60% 7/23/26 | | | 3,940,000 | | | | 3,992,726 | |
Popular 6.125% 9/14/23 | | | 680,000 | | | | 733,832 | |
Royal Bank of Scotland Group 8.625% µy | | | 4,640,000 | | | | 5,025,468 | |
Shinhan Financial Group 144A 3.34% 2/5/30 #µ | | | 890,000 | | | | 902,566 | |
Truist Bank 2.636%
9/17/29 µ | | | 10,165,000 | | | | 10,160,987 | |
Turkiye Garanti Bankasi | | | | | | | | |
144A 5.25% 9/13/22 # | | | 595,000 | | | | 607,117 | |
144A 5.875% 3/16/23 # | | | 585,000 | | | | 602,905 | |
UBS Group | | | | | | | | |
144A 4.125% 9/24/25 # | | | 5,765,000 | | | | 6,270,571 | |
6.875%µy | | | 5,110,000 | | | | 5,328,453 | |
7.125%µy | | | 785,000 | | | | 833,572 | |
US Bancorp | | | | | | | | |
3.00% 7/30/29 | | | 2,380,000 | | | | 2,459,483 | |
3.10% 4/27/26 | | | 195,000 | | | | 202,959 | |
3.375% 2/5/24 | | | 4,245,000 | | | | 4,456,148 | |
3.60% 9/11/24 | | | 2,640,000 | | | | 2,805,530 | |
3.95% 11/17/25 | | | 4,130,000 | | | | 4,540,408 | |
US Bank 3.40% 7/24/23 | | | 2,360,000 | | | | 2,465,333 | |
USB Capital IX 3.50% (LIBOR03M + 1.02%)y• | | | 3,490,000 | | | | 3,059,055 | |
Diversified Income Series-10
Delaware VIP® Diversified Income Series
Schedule of investments (continued)
| | | | | | | | |
| | | Principal amount° | | | Value (US $) | |
| | |
Corporate Bonds (continued) | | | | | | | | |
Banking (continued) | | | | | | | | |
Woori Bank 144A 4.75% 4/30/24 # | | | 1,250,000 | | | $ | 1,342,043 | |
| | | | | | | | |
| | | | | | | 142,185,142 | |
| | | | | | | | |
Basic Industry – 2.72% | | | | | |
BHP Billiton Finance USA 144A 6.25%
10/19/75 #µ | | | 6,170,000 | | | | 6,370,648 | |
Bioceanico Sovereign Certificate 144A 2.884% 6/5/34 #^ | | | 1,445,000 | | | | 1,008,755 | |
Chemours 7.00% 5/15/25 | | | 1,128,000 | | | | 1,138,812 | |
Corp Nacional del Cobre de Chile 144A 4.25% 7/17/42 # | | | 200,000 | | | | 209,368 | |
CSN Resources 144A 7.625% 2/13/23 # | | | 1,625,000 | | | | 1,735,654 | |
Cydsa 144A 6.25% 10/4/27 # | | | 895,000 | | | | 922,170 | |
Equate Petrochemical 144A 3.00% 3/3/22 # | | | 1,370,000 | | | | 1,378,857 | |
Freeport-McMoRan 5.45% 3/15/43 | | | 455,000 | | | | 472,108 | |
Georgia-Pacific 8.00% 1/15/24 | | | 5,305,000 | | | | 6,446,030 | |
Gold Fields Orogen Holdings BVI 144A 6.125% 5/15/29 # | | | 1,755,000 | | | | 1,951,297 | |
GUSAP III 144A 4.25% 1/21/30 # | | | 1,030,000 | | | | 1,048,025 | |
Hudbay Minerals 144A 7.625% 1/15/25 # | | | 395,000 | | | | 417,746 | |
Israel Chemicals 144A 6.375% 5/31/38 # | | | 765,000 | | | | 915,705 | |
Joseph T Ryerson & Son 144A 11.00%
5/15/22 # | | | 440,000 | | | | 465,297 | |
Klabin Austria 144A 7.00% 4/3/49 # | | | 1,010,000 | | | | 1,106,455 | |
Methanex 5.25% 12/15/29 | | | 6,180,000 | | | | 6,389,723 | |
Metinvest 144A 7.75% 4/23/23 # | | | 230,000 | | | | 242,716 | |
Minera Mexico 144A 4.50% 1/26/50 # | | | 1,810,000 | | | | 1,847,892 | |
Newmont Goldcorp 2.80% 10/1/29 | | | 7,585,000 | | | | 7,519,513 | |
Novelis 144A 6.25% 8/15/24 # | | | 255,000 | | | | 268,066 | |
Novolipetsk Steel Via Steel Funding DAC 144A 4.00% 9/21/24 # | | | 1,865,000 | | | | 1,962,782 | |
OCP 144A 4.50% 10/22/25 # | | | 990,000 | | | | 1,061,586 | |
Olin | | | | | | | | |
5.00% 2/1/30 | | | 2,320,000 | | | | 2,359,092 | |
5.625% 8/1/29 | | | 160,000 | | | | 169,288 | |
Orbia Advance 144A 5.50% 1/15/48 # | | | 1,380,000 | | | | 1,414,079 | |
Petkim Petrokimya Holding 144A 5.875% 1/26/23 # | | | 1,285,000 | | | | 1,294,316 | |
Phosagro OAO Via Phosagro Bond Funding DAC 144A 3.95% 11/3/21 # | | | 820,000 | | | | 841,955 | |
RPM International 4.55% 3/1/29 | | | 3,595,000 | | | | 3,893,939 | |
Sasol Financing USA | | | | | | | | |
5.875% 3/27/24 | | | 6,850,000 | | | | 7,416,103 | |
6.50% 9/27/28 | | | 595,000 | | | | 661,585 | |
Sociedad Quimica y Minera de Chile 144A 3.625% 4/3/23 # | | | 665,000 | | | | 679,241 | |
Steel Dynamics 5.50% 10/1/24 | | | 595,000 | | | | 612,916 | |
Suzano Austria 5.00% 1/15/30 | | | 1,145,000 | | | | 1,205,651 | |
| | | | | | | | |
| | | Principal amount° | | | Value (US $) | |
| | |
Corporate Bonds (continued) | | | | | | | | |
Basic Industry (continued) | | | | | | | | |
Syngenta Finance | | | | | | | | |
144A 3.933% 4/23/21 # | | | 1,615,000 | | | $ | 1,642,593 | |
144A 4.441% 4/24/23 # | | | 960,000 | | | | 1,002,551 | |
Vedanta Resources Finance II 144A 9.25% 4/23/26 # | | | 1,345,000 | | | | 1,338,053 | |
| | | | | | | | |
| | | | | | | 69,410,567 | |
| | | | | | | | |
Brokerage – 0.17% | | | | | | | | |
Jefferies Group | | | | | | | | |
4.15% 1/23/30 | | | 2,135,000 | | | | 2,262,945 | |
6.45% 6/8/27 | | | 893,000 | | | | 1,047,283 | |
6.50% 1/20/43 | | | 750,000 | | | | 893,341 | |
| | | | | | | | |
| | | | | | | 4,203,569 | |
| | | | | | | | |
Capital Goods – 1.62% | | | | | | | | |
Ardagh Packaging Finance 144A 6.00% 2/15/25 # | | | 445,000 | | | | 467,806 | |
Ashtead Capital 144A 5.25% 8/1/26 # | | | 885,000 | | | | 949,470 | |
BMC East 144A 5.50% 10/1/24 # | | | 645,000 | | | | 672,680 | |
Boise Cascade 144A 5.625% 9/1/24 # | | | 265,000 | | | | 276,372 | |
Bombardier 144A 6.00% 10/15/22 # | | | 685,000 | | | | 686,507 | |
Cemex 144A 5.45%
11/19/29 # | | | 1,705,000 | | | | 1,783,856 | |
Covanta Holding 5.875% 7/1/25 | | | 600,000 | | | | 634,749 | |
EnPro Industries 5.75% 10/15/26 | | | 240,000 | | | | 256,283 | |
Grupo Cementos de Chihuahua 144A 5.25% 6/23/24 # | | | 855,000 | | | | 888,495 | |
L3Harris Technologies | | | | | | | | |
2.90% 12/15/29 | | | 4,525,000 | | | | 4,599,608 | |
144A 3.85% 6/15/23 # | | | 1,425,000 | | | | 1,501,243 | |
Mauser Packaging Solutions Holding 144A 5.50% 4/15/24 # | | | 1,210,000 | | | | 1,249,434 | |
Northrop Grumman | | | | | | | | |
2.55% 10/15/22 | | | 4,340,000 | | | | 4,404,914 | |
3.25% 8/1/23 | | | 785,000 | | | | 818,374 | |
Roper Technologies | | | | | | | | |
2.35% 9/15/24 | | | 1,415,000 | | | | 1,423,377 | |
2.95% 9/15/29 | | | 5,240,000 | | | | 5,296,484 | |
Standard Industries 144A 5.00% 2/15/27 # | | | 1,135,000 | | | | 1,185,874 | |
TransDigm 144A 6.25% 3/15/26 # | | | 435,000 | | | | 471,751 | |
United Rentals North America 5.50% 5/15/27 | | | 1,250,000 | | | | 1,342,244 | |
Waste Management | | | | | | | | |
2.95% 6/15/24 | | | 2,625,000 | | | | 2,712,219 | |
3.45% 6/15/29 | | | 7,541,000 | | | | 8,071,404 | |
4.15% 7/15/49 | | | 1,484,000 | | | | 1,695,378 | |
| | | | | | | | |
| | | | | | | 41,388,522 | |
| | | | | | | | |
Communications – 5.41% | | | | | | | | |
Altice Finco 144A 7.625% 2/15/25 # | | | 825,000 | | | | 856,280 | |
AT&T | | | | | | | | |
4.35% 3/1/29 | | | 3,550,000 | | | | 3,947,410 | |
4.50% 3/9/48 | | | 1,915,000 | | | | 2,116,253 | |
Diversified Income Series-11
Delaware VIP® Diversified Income Series
Schedule of investments (continued)
| | | | | | | | |
| | | Principal amount° | | | Value (US $) | |
| | |
Corporate Bonds (continued) | | | | | | | | |
Communications (continued) | | | | | | | | |
C&W Senior Financing 144A 7.50% 10/15/26 # | | | 1,445,000 | | | $ | 1,568,089 | |
Charter Communications Operating | | | | | | | | |
4.464% 7/23/22 | | | 5,555,000 | | | | 5,838,293 | |
4.80% 3/1/50 | | | 1,635,000 | | | | 1,721,022 | |
4.908% 7/23/25 | | | 760,000 | | | | 837,185 | |
5.05% 3/30/29 | | | 5,770,000 | | | | 6,543,695 | |
Clear Channel Worldwide Holdings 144A 9.25% 2/15/24 # | | | 2,150,000 | | | | 2,385,608 | |
Comcast | | | | | | | | |
2.65% 2/1/30 | | | 1,330,000 | | | | 1,335,373 | |
3.45% 2/1/50 | | | 605,000 | | | | 619,800 | |
3.70% 4/15/24 | | | 7,050,000 | | | | 7,515,893 | |
4.40% 8/15/35 | | | 420,000 | | | | 492,173 | |
Comunicaciones Celulares 144A 6.875% 2/6/24 # | | | 1,265,000 | | | | 1,299,275 | |
Crown Castle International | | | | | | | | |
3.80% 2/15/28 | | | 5,075,000 | | | | 5,407,755 | |
4.30% 2/15/29 | | | 2,155,000 | | | | 2,387,250 | |
5.25% 1/15/23 | | | 2,190,000 | | | | 2,379,291 | |
CSC Holdings 144A 7.75% 7/15/25 # | | | 1,080,000 | | | | 1,154,196 | |
Digicel Group One 144A 8.25% 12/30/22 # | | | 754,000 | | | | 422,475 | |
Discovery Communications | | | | | | | | |
4.125% 5/15/29 | | | 11,195,000 | | | | 12,093,736 | |
5.20% 9/20/47 | | | 2,760,000 | | | | 3,213,186 | |
Fox | | | | | | | | |
144A 4.03% 1/25/24 # | | | 2,325,000 | | | | 2,478,646 | |
144A 4.709% 1/25/29 # | | | 5,420,000 | | | | 6,177,564 | |
Frontier Communications 144A 8.00% 4/1/27 # | | | 2,074,000 | | | | 2,171,167 | |
Gray Television 144A 5.875% 7/15/26 # | | | 885,000 | | | | 943,056 | |
GTP Acquisition Partners I 144A 2.35% 6/15/20 # | | | 1,095,000 | | | | 1,095,296 | |
IHS Netherlands Holdco 144A 7.125% 3/18/25 # | | | 1,275,000 | | | | 1,347,675 | |
Millicom International Cellular 144A 6.25% 3/25/29 # | | | 1,165,000 | | | | 1,287,139 | |
Ooredoo International Finance 144A 5.00% 10/19/25 # | | | 605,000 | | | | 676,211 | |
Sprint | | | | | | | | |
7.125% 6/15/24 | | | 550,000 | | | | 594,459 | |
7.875% 9/15/23 | | | 745,000 | | | | 823,534 | |
Sprint Communications 7.00% 8/15/20 | | | 140,000 | | | | 143,136 | |
Sprint Spectrum 144A 4.738% 3/20/25 # | | | 2,130,000 | | | | 2,261,836 | |
Telefonica Emisiones 5.52% 3/1/49 | | | 2,565,000 | | | | 3,213,227 | |
Time Warner Cable 7.30% 7/1/38 | | | 5,775,000 | | | | 7,528,406 | |
Time Warner Entertainment 8.375% 3/15/23 | | | 2,495,000 | | | | 2,945,162 | |
T-Mobile USA 6.50% 1/15/26 | | | 1,110,000 | | | | 1,192,207 | |
| | | | | | | | |
| | | Principal amount° | | | Value (US $) | |
| | |
Corporate Bonds (continued) | | | | | | | | |
Communications (continued) | | | | | | | | |
T-Mobile USA Escrow | | | | | | | | |
=† | | | 1,845,000 | | | $ | 0 | |
=† | | | 130,000 | | | | 0 | |
Turk Telekomunikasyon 144A 6.875% 2/28/25 # | | | 1,720,000 | | | | 1,843,195 | |
UPCB Finance IV 144A 5.375% 1/15/25 # | | | 1,198,000 | | | | 1,234,042 | |
VEON Holdings 144A 4.00% 4/9/25 # | | | 822,000 | | | | 857,601 | |
Verizon Communications 4.50% 8/10/33 | | | 12,400,000 | | | | 14,481,008 | |
ViacomCBS 4.375% 3/15/43 | | | 5,775,000 | | | | 6,120,507 | |
Vodafone Group | | | | | | | | |
4.25% 9/17/50 | | | 2,955,000 | | | | 3,087,755 | |
4.875% 6/19/49 | | | 8,605,000 | | | | 9,989,452 | |
Zayo Group | | | | | | | | |
144A 5.75% 1/15/27 # | | | 1,065,000 | | | | 1,085,339 | |
6.375% 5/15/25 | | | 230,000 | | | | 237,570 | |
| | | | | | | | |
| | | | | | | 137,949,428 | |
| | | | | | | | |
Consumer Cyclical – 1.49% | | | | | |
Allison Transmission 144A 5.875% 6/1/29 # | | | 335,000 | | | | 367,603 | |
AMC Entertainment Holdings 6.125% 5/15/27 | | | 1,055,000 | | | | 965,351 | |
El Puerto de Liverpool 144A 3.95% 10/2/24 # | | | 1,105,000 | | | | 1,140,001 | |
General Motors Financial 5.25% 3/1/26 . | | | 6,790,000 | | | | 7,540,713 | |
Kia Motors 144A 3.00% 4/25/23 # | | | 535,000 | | | | 540,980 | |
Live Nation Entertainment 144A 5.625% 3/15/26 # | | | 1,020,000 | | | | 1,089,204 | |
Lowe’s | | | | | | | | |
4.05% 5/3/47 | | | 925,000 | | | | 997,842 | |
4.55% 4/5/49 | | | 11,480,000 | | | | 13,532,701 | |
MGM Growth Properties Operating Partnership 144A 5.75% 2/1/27 # | | | 265,000 | | | | 296,469 | |
MGM Resorts International 5.75% 6/15/25 | | | 700,000 | | | | 785,743 | |
Murphy Oil USA 5.625% 5/1/27 | | | 775,000 | | | | 833,394 | |
Penn National Gaming 144A 5.625% 1/15/27 # | | | 1,299,000 | | | | 1,376,489 | |
Prime Security Services Borrower | | | | | | | | |
144A 5.75% 4/15/26 # | | | 185,000 | | | | 201,419 | |
144A 9.25% 5/15/23 # | | | 380,000 | | | | 399,237 | |
Resorts World Las Vegas 144A 4.625% 4/16/29 # | | | 800,000 | | | | 844,089 | |
Royal Caribbean Cruises 3.70% 3/15/28 | | | 3,875,000 | | | | 3,986,140 | |
Scientific Games International 144A 8.25% 3/15/26 # | | | 880,000 | | | | 971,849 | |
Shimao Property Holdings 5.60% 7/15/26 | | | 855,000 | | | | 895,913 | |
Diversified Income Series-12
Delaware VIP® Diversified Income Series
Schedule of investments (continued)
| | | | | | | | |
| | | Principal amount° | | | Value (US $) | |
| | |
Corporate Bonds (continued) | | | | | | | | |
Consumer Cyclical (continued) | | | | | | | | |
Wynn Macau 144A 5.50% 10/1/27 # | | | 1,165,000 | | | $ | 1,214,306 | |
| | | | | | | | |
| | | | | | | 37,979,443 | |
| | | | | | | | |
ConsumerNon-Cyclical – 4.31% | | | | | |
AbbVie | | | | | | | | |
144A 2.95% 11/21/26 # | | | 4,580,000 | | | | 4,655,544 | |
144A 4.05% 11/21/39 # | | | 3,035,000 | | | | 3,218,300 | |
Alcon Finance | | | | | | | | |
144A 2.75% 9/23/26 # | | | 670,000 | | | | 682,678 | |
144A 3.00% 9/23/29 # | | | 8,302,000 | | | | 8,451,486 | |
Anheuser-Busch InBev Worldwide | | | | | | | | |
3.65% 2/1/26 | | | 5,540,000 | | | | 5,905,947 | |
4.15% 1/23/25 | | | 5,315,000 | | | | 5,785,927 | |
Bausch Health 144A 5.50% 11/1/25 # | | | 885,000 | | | | 926,670 | |
BRF 144A 4.875%
1/24/30 # | | | 1,280,000 | | | | 1,321,933 | |
Bristol-Myers Squibb 144A 2.90% 7/26/24 # | | | 7,560,000 | | | | 7,804,753 | |
Charles River Laboratories International 144A 5.50% 4/1/26 # | | | 795,000 | | | | 856,471 | |
Cigna | | | | | | | | |
2.891% (LIBOR03M + 0.89%) 7/15/23 • | | | 1,770,000 | | | | 1,780,622 | |
4.125% 11/15/25 | | | 6,384,000 | | | | 6,929,683 | |
Constellation Brands 3.15% 8/1/29 | | | 8,505,000 | | | | 8,607,574 | |
Cott Holdings 144A 5.50% 4/1/25 # | | | 645,000 | | | | 675,370 | |
CVS Health | | | | | | | | |
4.10% 3/25/25 | | | 1,155,000 | | | | 1,239,668 | |
4.30% 3/25/28 | | | 10,960,000 | | | | 11,969,695 | |
5.05% 3/25/48 | | | 65,000 | | | | 76,919 | |
DH Europe Finance II | | | | | | | | |
2.60% 11/15/29 | | | 3,945,000 | | | | 3,933,133 | |
3.25% 11/15/39 | | | 3,355,000 | | | | 3,384,619 | |
DP World Crescent 144A 3.908% 5/31/23 # | | | 400,000 | | | | 414,576 | |
Encompass Health | | | | | | | | |
5.75% 11/1/24 | | | 677,000 | | | | 686,028 | |
5.75% 9/15/25 | | | 610,000 | | | | 640,753 | |
Gilead Sciences 4.15% 3/1/47 | | | 8,220,000 | | | | 9,143,340 | |
HCA | | | | | | | | |
5.875% 2/15/26 | | | 1,225,000 | | | | 1,395,251 | |
7.58% 9/15/25 | | | 80,000 | | | | 96,400 | |
JBS Investments II | | | | | | | | |
144A 5.75% 1/15/28 # | | | 845,000 | | | | 892,616 | |
144A 7.00% 1/15/26 # | | | 815,000 | | | | 888,065 | |
JBS USA 144A 5.75% 6/15/25 # | | | 1,015,000 | | | | 1,053,484 | |
Kernel Holding | | | | | | | | |
144A 6.50% 10/17/24 # | | | 855,000 | | | | 886,635 | |
144A 8.75% 1/31/22 # | | | 785,000 | | | | 848,941 | |
Mars | �� | | | | | | | |
144A 3.20% 4/1/30 # | | | 825,000 | | | | 873,275 | |
144A 3.95% 4/1/49 # | | | 4,825,000 | | | | 5,451,843 | |
MHP 144A 7.75%
5/10/24 # | | | 965,000 | | | | 1,045,119 | |
| | | | | | | | |
| | | Principal amount° | | | Value (US $) | |
| | |
Corporate Bonds (continued) | | | | | | | | |
ConsumerNon-Cyclical (continued) | | | | | | | | |
New York and Presbyterian Hospital 4.063% 8/1/56 | | | 1,630,000 | | | $ | 1,795,223 | |
Post Holdings 144A 5.75% 3/1/27 # | | | 720,000 | | | | 773,872 | |
Rede D’or Finance 144A 4.95% 1/17/28 # | | | 1,195,000 | | | | 1,239,048 | |
Tenet Healthcare 5.125% 5/1/25 | | | 1,370,000 | | | | 1,414,525 | |
Teva Pharmaceutical Finance Netherlands III 6.75% 3/1/28 | | | 1,445,000 | | | | 1,469,652 | |
Universal Health Services 144A 5.00% 6/1/26 # | | | 485,000 | | | | 510,025 | |
| | | | | | | | |
| | | | | | | 109,725,663 | |
| | | | | | | | |
Electric – 4.50% | | | | | | | | |
AEP Texas 3.45% 1/15/50 | | | 685,000 | | | | 686,452 | |
AES Gener 144A 7.125% 3/26/79 #µ | | | 1,115,000 | | | | 1,172,189 | |
American Transmission Systems 144A 5.25% 1/15/22 # | | | 3,930,000 | | | | 4,159,302 | |
Azure Power Energy 144A 5.50% 11/3/22 # | | | 820,000 | | | | 838,061 | |
CenterPoint Energy | | | | | | | | |
3.85% 2/1/24 | | | 1,645,000 | | | | 1,735,118 | |
4.25% 11/1/28 | | | 5,198,000 | | | | 5,641,921 | |
CLP Power Hong Kong Financing 2.875% 4/26/23 | | | 545,000 | | | | 551,375 | |
ComEd Financing III 6.35% 3/15/33 | | | 2,055,000 | | | | 2,201,419 | |
Duke Energy 4.875% µy | | | 3,655,000 | | | | 3,838,390 | |
Duke Energy Indiana 3.25% 10/1/49 | | | 2,480,000 | | | | 2,478,473 | |
Emera 6.75% 6/15/76 µ | | | 484,000 | | | | 547,656 | |
Engie Energia Chile 144A 4.50% 1/29/25 # | | | 470,000 | | | | 499,267 | |
Entergy Arkansas 4.20% 4/1/49 | | | 1,930,000 | | | | 2,253,413 | |
Entergy Louisiana 4.95% 1/15/45 | | | 545,000 | | | | 584,383 | |
Entergy Mississippi 3.85% 6/1/49 | | | 3,060,000 | | | | 3,339,870 | |
Entergy Texas 3.55% 9/30/49 | | | 1,380,000 | | | | 1,407,824 | |
Evergy 4.85% 6/1/21 | | | 535,000 | | | | 551,869 | |
Evergy Metro 3.65% 8/15/25 | | | 3,445,000 | | | | 3,674,041 | |
Exelon | | | | | | | | |
3.497% 6/1/22 | | | 2,700,000 | | | | 2,772,579 | |
3.95% 6/15/25 | | | 1,045,000 | | | | 1,123,680 | |
FirstEnergy Transmission 144A 4.55% 4/1/49 # | | | 1,005,000 | | | | 1,150,258 | |
Interstate Power & Light 4.10% 9/26/28 | | | 6,990,000 | | | | 7,664,861 | |
Israel Electric 144A 5.00% 11/12/24 # | | | 1,110,000 | | | | 1,222,904 | |
Kallpa Generacion 144A 4.125% 8/16/27 # | | | 1,694,000 | | | | 1,730,603 | |
Listrindo Capital 144A 4.95% 9/14/26 # | | | 1,190,000 | | | | 1,209,950 | |
Louisville Gas & Electric 4.25% 4/1/49 | | | 5,265,000 | | | | 6,065,333 | |
MidAmerican Energy 3.15% 4/15/50 | | | 1,770,000 | | | | 1,747,142 | |
Mong Duong Finance Holdings 144A 5.125% 5/7/29 # | | | 1,897,000 | | | | 1,945,093 | |
Diversified Income Series-13
Delaware VIP® Diversified Income Series
Schedule of investments (continued)
| | | | | | | | |
| | | Principal amount° | | | Value (US $) | |
| | |
Corporate Bonds (continued) | | | | | | | | |
Electric (continued) | | | | | | | | |
National Rural Utilities Cooperative Finance | | | | | | | | |
4.75% 4/30/43 µ | | | 1,090,000 | | | $ | 1,137,989 | |
5.25% 4/20/46 µ | | | 129,000 | | | | 139,843 | |
Nevada Power 2.75% 4/15/20 | | | 2,355,000 | | | | 2,360,374 | |
NextEra Energy Capital Holdings | | | | | | | | |
2.90% 4/1/22 | | | 5,230,000 | | | | 5,337,155 | |
3.15% 4/1/24 | | | 2,530,000 | | | | 2,623,326 | |
NV Energy 6.25% 11/15/20 | | | 1,860,000 | | | | 1,925,667 | |
PacifiCorp 3.50% 6/15/29 | | | 3,170,000 | | | | 3,420,052 | |
Pennsylvania Electric 5.20% 4/1/20 | | | 220,000 | | | | 221,586 | |
Perusahaan Listrik Negara | | | | | | | | |
144A 4.125%
5/15/27 # | | | 475,000 | | | | 501,884 | |
144A 5.25% 5/15/47 # | | | 528,000 | | | | 592,910 | |
Saudi Electricity Global Sukuk Co. 4 4.222% 1/27/24 | | | 1,135,000 | | | | 1,207,507 | |
Southern California Edison | | | | | | | | |
4.00% 4/1/47 | | | 1,745,000 | | | | 1,834,537 | |
4.20% 3/1/29 | | | 4,470,000 | | | | 4,949,374 | |
4.875% 3/1/49 | | | 4,680,000 | | | | 5,543,224 | |
Southwestern Electric Power 4.10% 9/15/28 | | | 8,995,000 | | | | 9,839,002 | |
State Grid Overseas Investment 2016 144A 2.25% 5/4/20 # | | | 779,000 | | | | 778,973 | |
Trans-Allegheny Interstate Line 144A 3.85% 6/1/25 # | | | 1,190,000 | | | | 1,262,555 | |
Vistra Operations 144A 5.50% 9/1/26 # | | | 1,395,000 | | | | 1,481,940 | |
Xcel Energy | | | | | | | | |
2.60% 12/1/29 | | | 845,000 | | | | 836,950 | |
3.50% 12/1/49 | | | 5,630,000 | | | | 5,730,564 | |
| | | | | | | | |
| | | | | | | 114,518,838 | |
| | | | | | | | |
Energy – 5.09% | | | | | | | | |
Abu Dhabi Crude Oil Pipeline 144A 4.60% 11/2/47 # | | | 780,000 | | | | 903,337 | |
AES Andres 144A 7.95% 5/11/26 # | | | 1,535,000 | | | | 1,633,405 | |
AmeriGas Partners 5.875% 8/20/26 | | | 955,000 | | | | 1,054,654 | |
Crestwood Midstream Partners 6.25% 4/1/23 | | | 1,030,000 | | | | 1,052,748 | |
Energy Transfer Operating | | | | | | | | |
5.25% 4/15/29 | | | 3,485,000 | | | | 3,914,183 | |
6.25% 4/15/49 | | | 2,040,000 | | | | 2,458,548 | |
6.625%µy | | | 3,355,000 | | | | 3,175,575 | |
Energy Transfer Partners 5.00% 10/1/22 | | | 5,205,000 | | | | 5,520,169 | |
Eni 144A 4.25% 5/9/29 # | | | 5,615,000 | | | | 6,163,099 | |
Gazprom PJSC Via Gaz Capital 144A 4.95% 3/23/27 # | | | 1,240,000 | | | | 1,384,467 | |
Genesis Energy 6.75% 8/1/22 | | | 615,000 | | | | 622,245 | |
Geopark 144A 6.50% 9/21/24 # | | | 1,165,000 | | | | 1,217,920 | |
Gran Tierra Energy 144A 7.75% 5/23/27 # | | | 1,420,000 | | | | 1,331,758 | |
| | | | | | | | |
| | | Principal amount° | | | Value (US $) | |
| | |
Corporate Bonds (continued) | | | | | | | | |
Energy (continued) | | | | | | | | |
Greenko Solar Mauritius 144A 5.95% 7/29/26 # | | | 2,555,000 | | | $ | 2,582,663 | |
KazMunayGas National 144A 6.375% 10/24/48 # | | | 892,000 | | | | 1,150,894 | |
KazTransGas JSC 144A 4.375% 9/26/27 # | | | 2,325,000 | | | | 2,443,524 | |
Marathon Oil 4.40% 7/15/27 | | | 5,815,000 | | | | 6,322,336 | |
MPLX | | | | | | | | |
4.00% 3/15/28 | | | 720,000 | | | | 745,450 | |
4.125% 3/1/27 | | | 3,915,000 | | | | 4,111,401 | |
5.50% 2/15/49 | | | 6,320,000 | | | | 7,169,888 | |
Murphy Oil 5.875% 12/1/27 | | | 467,000 | | | | 490,934 | |
Noble Energy | | | | | | | | |
3.25% 10/15/29 | | | 3,785,000 | | | | 3,819,726 | |
3.90% 11/15/24 | | | 2,320,000 | | | | 2,451,915 | |
4.20% 10/15/49 | | | 1,345,000 | | | | 1,353,444 | |
4.95% 8/15/47 | | | 3,145,000 | | | | 3,481,676 | |
5.05% 11/15/44 | | | 665,000 | | | | 741,513 | |
NuStar Logistics 5.625% 4/28/27 | | | 420,000 | | | | 432,327 | |
Oasis Petroleum 144A 6.25% 5/1/26 # | | | 1,240,000 | | | | 1,032,331 | |
Occidental Petroleum | | | | | | | | |
2.90% 8/15/24 | | | 2,590,000 | | | | 2,632,788 | |
3.50% 8/15/29 | | | 3,000,000 | | | | 3,060,709 | |
Oil and Gas Holding 144A 7.625% 11/7/24 # | | | 404,000 | | | | 469,966 | |
ONEOK 7.50% 9/1/23 | | | 5,305,000 | | | | 6,191,967 | |
Pertamina Persero 144A 3.65% 7/30/29 # | | | 410,000 | | | | 430,351 | |
Petrobras Global Finance | | | | | | | | |
144A 5.093% 1/15/30 # | | | 4,854,000 | | | | 5,207,177 | |
6.90% 3/19/49 | | | 223,000 | | | | 261,975 | |
7.25% 3/17/44 | | | 615,000 | | | | 748,108 | |
Petroleos Mexicanos | | | | | | | | |
6.50% 3/13/27 | | | 1,109,000 | | | | 1,180,605 | |
6.75% 9/21/47 | | | 310,000 | | | | 311,648 | |
144A 6.84% 1/23/30 # | | | 3,984,000 | | | | 4,255,271 | |
144A 7.69% 1/23/50 # | | | 1,015,000 | | | | 1,111,197 | |
Precision Drilling 144A 7.125% 1/15/26 # | | | 420,000 | | | | 400,196 | |
Sabine Pass Liquefaction | | | | | | | | |
5.625% 3/1/25 | | | 3,420,000 | | | | 3,850,674 | |
5.75% 5/15/24 | | | 5,868,000 | | | | 6,545,515 | |
Saudi Arabian Oil | | | | | | | | |
144A 2.875% 4/16/24 # | | | 1,030,000 | | | | 1,045,352 | |
144A 4.25% 4/16/39 # | | | 1,280,000 | | | | 1,370,406 | |
Schlumberger Holdings 144A 4.30% 5/1/29 # | | | 4,825,000 | | | | 5,295,271 | |
Sinopec Group Overseas Development 2018 144A 2.50% 8/8/24 # | | | 1,880,000 | | | | 1,888,444 | |
Southwestern Energy 7.75% 10/1/27 | | | 2,790,000 | | | | 2,591,143 | |
Diversified Income Series-14
Delaware VIP® Diversified Income Series
Schedule of investments (continued)
| | | | | | | | |
| | | Principal amount° | | | Value (US $) | |
| | |
Corporate Bonds (continued) | | | | | | | | |
Energy (continued) | | | | | | | | |
Summit Midstream Holdings 5.75% 4/15/25 | | | 450,000 | | | $ | 344,999 | |
Targa Resources Partners 5.375% 2/1/27 | | | 855,000 | | | | 888,644 | |
Tecpetrol 144A 4.875% 12/12/22 # | | | 1,680,000 | | | | 1,710,694 | |
Transcanada Trust 5.50% 9/15/79 µ | | | 4,840,000 | | | | 5,091,680 | |
Transocean 144A 9.00% 7/15/23 # | | | 170,000 | | | | 179,917 | |
Transocean Proteus 144A 6.25% 12/1/24 # | | | 553,000 | | | | 571,202 | |
Transportadora de Gas del Sur 144A 6.75%
5/2/25 # | | | 1,305,000 | | | | 1,155,904 | |
Tullow Oil 144A 7.00% 3/1/25 # | | | 815,000 | | | | 688,113 | |
YPF | | | | | | | | |
144A 8.50% 6/27/29 # | | | 1,245,000 | | | | 1,136,495 | |
144A 42.875% (BADLARPP + 4.00%) 7/7/20 #• | | | 1,535,000 | | | | 387,967 | |
| | | | | | | | |
| | | | | | | 129,766,508 | |
| | | | | | | | |
| |
Finance Companies – 1.26% | | | | | |
AerCap Ireland Capital 3.65% 7/21/27 | | | 8,300,000 | | | | 8,550,369 | |
Aviation Capital Group | | | | | | | | |
144A 4.375%
1/30/24 # | | | 3,060,000 | | | �� | 3,224,242 | |
144A 4.875%
10/1/25 # | | | 3,245,000 | | | | 3,495,370 | |
Avolon Holdings Funding | | | | | | | | |
144A 3.95% 7/1/24 # | | | 7,195,000 | | | | 7,506,903 | |
144A 4.375% 5/1/26 # | | | 4,270,000 | | | | 4,515,739 | |
BOC Aviation 144A 2.375% 9/15/21 # | | | 920,000 | | | | 917,654 | |
International Lease Finance 8.625% 1/15/22 | | | 3,390,000 | | | | 3,814,141 | |
| | | | | | | | |
| | | | | | | 32,024,418 | |
| | | | | | | | |
Insurance – 0.61% | | | | | | | | |
AIA Group 3.125% 3/13/23 | | | 890,000 | | | | 907,712 | |
AssuredPartners 144A 7.00% 8/15/25 # | | | 569,000 | | | | 580,204 | |
HUB International 144A 7.00% 5/1/26 # | | | 130,000 | | | | 137,803 | |
MetLife 144A 9.25% 4/8/38 # | | | 2,655,000 | | | | 3,913,722 | |
Prudential Financial | | | | | | | | |
3.70% 3/13/51 | | | 3,275,000 | | | | 3,445,194 | |
5.375% 5/15/45 µ | | | 2,755,000 | | | | 2,982,535 | |
USI 144A 6.875% 5/1/25 # | | | 1,743,000 | | | | 1,786,035 | |
WellCare Health Plans 144A 5.375% 8/15/26 # | | | 1,645,000 | | | | 1,754,968 | |
| | | | | | | | |
| | | | | | | 15,508,173 | |
| | | | | | | | |
Natural Gas – 0.35% | | | | | | | | |
Brooklyn Union Gas 144A 3.865% 3/4/29 # | | | 6,330,000 | | | | 6,870,539 | |
NiSource 5.65% µy | | | 2,080,000 | | | | 2,133,487 | |
| | | | | | | | |
| | | | | | | 9,004,026 | |
| | | | | | | | |
Real Estate Investment Trusts – 0.55% | | | | | | | | |
American Tower Trust #1 144A 3.07% 3/15/23 # | | | 3,070,000 | | | | 3,110,977 | |
| | | | | | | | |
| | | Principal amount° | | | Value (US $) | |
| | |
Corporate Bonds (continued) | | | | | | | | |
Real Estate Investment Trusts (continued) | | | | | | | | |
Arabian Centres Sukuk 144A 5.375% 11/26/24 # | | | 810,000 | | | $ | 834,810 | |
Corporate Office Properties | | | | | | | | |
3.60% 5/15/23 | | | 1,750,000 | | | | 1,800,859 | |
5.25% 2/15/24 | | | 1,755,000 | | | | 1,888,636 | |
CubeSmart | | | | | | | | |
3.00% 2/15/30 | | | 3,415,000 | | | | 3,376,048 | |
3.125% 9/1/26 | | | 1,825,000 | | | | 1,856,308 | |
Kaisa Group Holdings 144A 11.95% 10/22/22 # | | | 1,025,000 | | | | 1,070,489 | |
| | | | | | | | |
| | | | | | | 13,938,127 | |
| | | | | | | | |
| | |
Technology – 2.05% | | | | | | | | |
Baidu 3.875% 9/29/23 | | | 1,415,000 | | | | 1,476,370 | |
Broadcom 144A 3.125% 4/15/21 # | | | 6,425,000 | | | | 6,503,263 | |
CDK Global 5.00% 10/15/24 | | | 1,870,000 | | | | 2,028,931 | |
CommScope Technologies 144A 5.00% 3/15/27 # | | | 374,000 | | | | 352,504 | |
Equinix 5.375% 5/15/27 | | | 850,000 | | | | 924,698 | |
Global Payments | | | | | | | | |
2.65% 2/15/25 | | | 4,950,000 | | | | 4,973,511 | |
3.20% 8/15/29 | | | 3,600,000 | | | | 3,679,011 | |
Infor US 6.50% 5/15/22 | | | 170,000 | | | | 172,853 | |
Intel | | | | | | | | |
2.45% 11/15/29 | | | 3,540,000 | | | | 3,529,483 | |
3.25% 11/15/49 | | | 2,950,000 | | | | 2,971,809 | |
International Business Machines 3.00% 5/15/24 | | | 9,490,000 | | | | 9,833,079 | |
Iron Mountain US Holdings 144A 5.375% 6/1/26 # | | | 990,000 | | | | 1,037,369 | |
NXP | | | | | | | | |
144A 4.125% 6/1/21 # | | | 4,875,000 | | | | 4,998,873 | |
144A 4.30% 6/18/29 # | | | 1,270,000 | | | | 1,374,112 | |
144A 4.875% 3/1/24 # | | | 6,435,000 | | | | 7,019,570 | |
Tencent Holdings 144A 3.28% 4/11/24 # | | | 1,305,000 | | | | 1,343,163 | |
| | | | | | | | |
| | | | | | | 52,218,599 | |
| | | | | | | | |
Transportation – 0.75% | | | | | | | | |
Adani Ports & Special Economic Zone 144A 4.375% 7/3/29 # | | | 1,050,000 | | | | 1,089,077 | |
Aeropuertos Argentina 2000 144A 6.875% 2/1/27 # | | | 1,354,844 | | | | 1,305,015 | |
ASG Finance Designated Activity 144A 7.875% 12/3/24 # | | | 1,201,000 | | | | 1,169,498 | |
DAE Funding 144A 5.75% 11/15/23 # | | | 1,488,000 | | | | 1,564,878 | |
FedEx 4.05% 2/15/48 | | | 11,275,000 | | | | 10,879,271 | |
Latam Finance 144A 7.00% 3/1/26 # | | | 1,110,000 | | | | 1,203,623 | |
Lima Metro Line 2 Finance 144A 4.35% 4/5/36 # | | | 1,100,000 | | | | 1,168,403 | |
Diversified Income Series-15
Delaware VIP® Diversified Income Series
Schedule of investments (continued)
| | | | | | | | |
| | | Principal amount° | | | Value (US $) | |
| | |
Corporate Bonds (continued) | | | | | | | | |
Transportation (continued) | | | | | | | | |
Rutas 2 and 7 Finance 144A 3.411% 9/30/36 #^ | | | 985,000 | | | $ | 641,171 | |
| | | | | | | | |
| | | | | | | 19,020,936 | |
| | | | | | | | |
| | |
Utilities – 0.13% | | | | | | | | |
Aegea Finance 144A 5.75% 10/10/24 # | | | 855,000 | | | | 902,388 | |
Empresas Publicas de Medellin 144A 4.25% 7/18/29 # | | | 1,240,000 | | | | 1,292,145 | |
Infraestructura Energetica Nova 144A 4.875% 1/14/48 # | | | 1,280,000 | | | | 1,223,597 | |
| | | | | | | | |
| | | | | | | 3,418,130 | |
| | | | | | | | |
| | |
Total Corporate Bonds
(cost $897,727,988) | | | | | | | 932,260,089 | |
| | | | | | | | |
| |
Loan Agreements – 3.89% | | | | | |
Acrisure Tranche B 1st Lien 6.195% (LIBOR03M + 4.25%) 11/22/23 • | | | 1,115,626 | | | | 1,117,857 | |
ADT Tranche B 1st Lien 4.944% (LIBOR01M + 3.25%) 1/3/20 • | | | 1,226,925 | | | | 1,231,697 | |
Altice France Tranche B13 1st Lien 5.74% (LIBOR01M + 4.00%) 8/14/26 • | | | 351,450 | | | | 353,427 | |
AMC Entertainment Holdings Tranche B1 1st Lien 4.80% (LIBOR01M + 3.00%) 1/31/20 • | | | 1,321,018 | | | | 1,332,246 | |
American Airlines Tranche B 1st Lien 3.74% (LIBOR01M + 2.00%) 1/15/20 • | | | 1,462,708 | | | | 1,469,381 | |
Applied Systems 2nd Lien 8.945% (LIBOR03M + 7.00%) 9/19/25 | | | 1,609,023 | | | | 1,651,260 | |
Aramark Services Tranche B3 3.549% (LIBOR01M + 1.75%) 3/11/25 • | | | 979,296 | | | | 984,651 | |
AssuredPartners Tranche B 1st Lien 5.299% (LIBOR01M + 3.50%) 10/22/24 • | | | 310,466 | | | | 311,785 | |
athenahealth Tranche B 1st Lien 6.401% (LIBOR03M + 4.50%) 2/11/26 • | | | 952,800 | | | | 959,144 | |
Avis Budget Car Rental Tranche B 1st Lien 3.80% (LIBOR01M + 2.00%) 2/7/25 • | | | 744,035 | | | | 749,266 | |
Ball Metalpack Finco Tranche B 2nd Lien 10.659% (LIBOR03M + 8.75%) 7/24/26 • | | | 213,000 | | | | 172,131 | |
Bausch Health Americas Tranche B 1st Lien 4.74% (LIBOR01M + 3.00%) 1/16/20 • | | | 727,964 | | | | 733,310 | |
Berry Global Tranche U 4.215% (LIBOR03M + 2.50%) 1/2/20 • | | | 1,551,205 | | | | 1,558,207 | |
Berry Global Tranche W 3.715% (LIBOR01M + 2.00%) 10/1/22 • | | | 2,175,000 | | | | 2,186,458 | |
| | | | | | | | |
| | | Principal amount° | | | Value (US $) | |
| | |
Loan Agreements (continued) | | | | | | | | |
Blue Ribbon 1st Lien 5.891% (LIBOR03M + 4.00%) 11/15/21 • | | | 629,896 | | | $ | 544,939 | |
Boxer Parent Tranche B 1st Lien 6.049% (LIBOR01M + 4.25%) 1/31/20 | | | 1,020,539 | | | | 1,010,492 | |
Buckeye Partners 1st Lien 4.441% (LIBOR01M + 2.75%) 11/1/26 • | | | 1,588,000 | | | | 1,603,550 | |
Builders FirstSource 1st Lien 4.799% (LIBOR01M + 3.00%) 2/29/24 • | | | 45,263 | | | | 45,477 | |
BWay Holding Tranche B 1st Lien 5.234% (LIBOR03M + 3.25%) 4/3/24 • | | | 486,099 | | | | 485,263 | |
Calpine Tranche B9 4.20% (LIBOR03M + 2.25%) 4/5/26 • | | | 597,000 | | | | 600,571 | |
Change Healthcare Holdings Tranche B 1st Lien 4.299% (LIBOR01M + 2.50%) 1/31/20 • | | | 535,245 | | | | 537,865 | |
Charter Communications Operating Tranche B2 3.55% (LIBOR01M + 1.75%) 2/1/27 • | | | 1,164,252 | | | | 1,173,075 | |
Chemours TrancheB-2 3.55% (LIBOR01M + 1.75%) 1/31/20 • | | | 2,858,569 | | | | 2,799,611 | |
Chuck E. Cheese Tranche B 8.299% (LIBOR01M + 6.50%) 1/31/20 • | | | 248,378 | | | | 239,436 | |
CityCenter Holdings Tranche B 4.049% (LIBOR01M + 2.25%) 1/31/20 • | | | 1,368,467 | | | | 1,376,038 | |
Coral US Tranche B4 1st Lien 5.049% (LIBOR01M + 3.25%) 2/2/26 • | | | 192,427 | | | | 193,855 | |
Core & Main Tranche B 1st Lien 4.528% (LIBOR03M + 2.75%) 3/2/20 • | | | 1,483,509 | | | | 1,484,114 | |
CPI Holdco 1st Lien 6.195% (LIBOR03M + 4.25%) 3/31/20 • | | | 312,000 | | | | 313,365 | |
CSC Holdings Tranche B 1st Lien 3.99% (LIBOR01M + 2.25%) 1/15/20 • | | | 789,750 | | | | 791,724 | |
CSC Holdings Tranche B5 4.24% (LIBOR01M + 2.50%) 4/15/27 • | | | 790,000 | | | | 795,267 | |
Datto 6.049% (LIBOR01M + 4.25%) 1/31/20 • | | | 820,875 | | | | 828,571 | |
DaVita Tranche B 4.049% (LIBOR01M + 2.25%) 1/31/20 • | | | 1,636,898 | | | | 1,650,623 | |
Delek US Holdings Tranche B 4.049% (LIBOR01M + 2.25%) 3/31/25 • | | | 894,097 | | | | 893,632 | |
DTZ US Borrower Tranche B 5.049% (LIBOR01M + 3.25%) 8/21/25 • | | | 715,938 | | | | 719,629 | |
Edgewater Generation Tranche B 5.549% (LIBOR01M + 3.75%) 1/31/20 • | | | 529,650 | | | | 509,347 | |
Ensemble RCM 5.659% (LIBOR03M + 3.75%) 2/3/20 • | | | 786,030 | | | | 792,417 | |
ExamWorks Group Tranche B1 1st Lien 5.049% (LIBOR01M + 3.25%) 7/27/23 • | | | 1,981,193 | | | | 1,999,767 | |
Diversified Income Series-16
Delaware VIP® Diversified Income Series
Schedule of investments (continued)
| | | | | | | | |
| | | Principal amount° | | | Value (US $) | |
| | |
Loan Agreements (continued) | | | | | | | | |
Extended Stay Tranche B 3.702% (LIBOR01M + 2.00%) 1/31/20 | | | 1,178,605 | | | $ | 1,190,023 | |
Flying Fortress Holdings Tranche B 1st Lien 3.695% (LIBOR03M + 1.75%) 3/31/20 • | | | 421,167 | | | | 423,305 | |
Garda World Security Tranche B 1st Lien 6.66% (LIBOR03M + 4.75%) 2/27/20 • | | | 802,000 | | | | 807,681 | |
Gardner Denver Tranche B 1st Lien 4.549% (LIBOR01M + 2.75%) 7/30/24 • | | | 848,735 | | | | 855,012 | |
Gates Global Tranche B2 1st Lien 4.549% (LIBOR01M + 2.75%) 1/31/20 • | | | 1,103,701 | | | | 1,106,461 | |
Gentiva Health Services 1st Lien 5.563% (LIBOR01M + 3.75%) 7/2/25 • | | | 1,964,271 | | | | 1,977,160 | |
Granite Generation Tranche B 1st Lien 5.571% (LIBOR03M + 2.75%) 3/31/20 • | | | 1,831,200 | | | | 1,817,466 | |
Gray Television Tranche B2 1st Lien 3.947% (LIBOR01M + 2.25%) 1/2/20 • | | | 1,592,396 | | | | 1,598,491 | |
GVC Holdings Tranche B2 1st Lien 4.446% (LIBOR06M + 2.25%) 3/29/24 • | | | 1,429,235 | | | | 1,438,764 | |
HCA Tranche B10 1st Lien 3.549% (LIBOR01M + 1.75%) 1/31/20 • | | | 3,027,754 | | | | 3,048,839 | |
Hilton Worldwide Finance Tranche B2 3.542% (LIBOR01M + 1.75%) 1/27/20 • | | | 188,754 | | | | 190,406 | |
Howden Tranche B 7.211% (LIBOR03M + 5.25%) 3/31/20 • | | | 341,145 | | | | 342,851 | |
HUB International Tranche B 1st Lien 4.69% (LIBOR03M + 2.75%) 4/25/25 • | | | 1,970,000 | | | | 1,971,692 | |
INEOS US Finance Tranche B 1st Lien 3.799% (LIBOR01M + 2.00%) 4/1/24 • | | | 725,386 | | | | 726,791 | |
Inmarsat Tranche B 0.00% 12/12/26 X | | | 535,310 | | | | 540,195 | |
Invictus 1st Lien 4.927% (LIBOR03M + 3.00%) 1/31/20 • | | | 601,291 | | | | 584,004 | |
IQVIA Tranche B3 3.695% (LIBOR03M + 1.75%) 3/31/20 • | | | 1,462,725 | | | | 1,471,319 | |
Iron Mountain Tranche B 3.549% (LIBOR01M + 1.75%) 1/2/26 • | | | 1,944,317 | | | | 1,942,680 | |
JBS USA LUX Tranche B 3.702% (LIBOR01M + 2.00%) 1/31/20 | | | 387,075 | | | | 390,289 | |
Kronos Tranche B 1st Lien 4.909% (LIBOR03M + 3.00%) 11/1/23 • | | | 865,697 | | | | 871,108 | |
| | | | | | | | |
| | | Principal amount° | | | Value (US $) | |
| | |
Loan Agreements (continued) | | | | | | | | |
Merrill Communications Tranche B 1st Lien 7.089% (LIBOR03M + 5.00%) 1/3/20 | | | 427,000 | | | $ | 430,203 | |
MGM Growth Properties Operating Partnership Tranche B 3.799% (LIBOR01M + 2.00%) 3/21/25 • | | | 1,083,823 | | | | 1,090,500 | |
Microchip Technology 1st Lien 3.80% (LIBOR01M + 2.00%) 1/31/20 • | | | 1,365,368 | | | | 1,379,021 | |
NFP Tranche B 1st Lien 4.799% (LIBOR01M + 3.00%) 1/31/20 • | | | 1,214,774 | | | | 1,211,845 | |
ON Semiconductor Tranche B4 1st Lien 3.799% (LIBOR01M + 2.00%) 9/16/26 • | | | 1,704,163 | | | | 1,718,595 | |
Penn National Gaming Tranche B1 1st Lien 4.049% (LIBOR01M + 2.25%) 1/31/20 • | | | 1,410,750 | | | | 1,418,842 | |
Perstorp Holding Tranche B 6.695% (LIBOR03M + 4.75%) 3/31/20 • | | | 1,072,893 | | | | 1,019,248 | |
PQ Tranche B 1st Lien 4.427% (LIBOR03M + 2.50%) 1/31/20 • | | | 2,172,180 | | | | 2,186,300 | |
Pregis TopCo 1st Lien 5.799% (LIBOR01M + 4.00%) 1/31/20 | | | 571,000 | | | | 572,071 | |
Prestige Brands Tranche B4 1st Lien 3.799% (LIBOR01M + 2.00%) 1/31/20 • | | | 1,073,662 | | | | 1,082,553 | |
Radiate Holdco Tranche B 4.799% (LIBOR01M + 3.00%) 1/31/20 • | | | 933,857 | | | | 938,308 | |
Russell Investments US Institutional Holdco Tranche B 1st Lien 5.049% (LIBOR01M + 3.25%) 6/1/23 | | | 992,288 | | | | 994,397 | |
Scientific Games International Tranche B5 1st Lien 4.549% (LIBOR01M + 2.75%) 1/31/20 • | | | 1,148,647 | | | | 1,153,364 | |
SFR Tranche B11 1st Lien 4.549% (LIBOR01M + 2.75%) 1/31/20 • | | | 869,582 | | | | 865,054 | |
Sinclair Television Group Tranche B2 1st Lien 4.05% (LIBOR01M + 2.25%) 1/3/24 • | | | 1,201,413 | | | | 1,203,905 | |
Sprint Communications Tranche B 4.813% (LIBOR01M + 3.00%) 2/2/24 • | | | 752,400 | | | | 751,450 | |
Sprint Communications Tranche B 1st Lien 4.313% (LIBOR01M + 2.50%) 2/2/24 • | | | 1,552,084 | | | | 1,541,888 | |
SS&C Technologies Tranche B3 1st Lien 4.049% (LIBOR01M + 2.25%) 1/31/20 • | | | 748,099 | | | | 753,884 | |
SS&C Technologies Tranche B4 1st Lien 4.049% (LIBOR01M + 2.25%) 1/31/20 • | | | 518,694 | | | | 522,705 | |
Diversified Income Series-17
Delaware VIP® Diversified Income Series
Schedule of investments (continued)
| | | | | | | | |
| | | Principal amount° | | | Value (US $) | |
| | |
Loan Agreements (continued) | | | | | | | | |
Staples Tranche B1 0.00% 4/16/26 X | | | 418,000 | | | $ | 411,294 | |
Stars Group Holdings Tranche B 5.446% (LIBOR03M + 3.50%) 7/10/25 | | | 236,439 | | | | 238,821 | |
Surgery Center Holdings 1st Lien 5.05% (LIBOR01M + 3.25%) 9/2/24 • | | | 511,384 | | | | 510,489 | |
Tecta America 1st Lien 6.299% (LIBOR01M + 4.50%) 11/20/25 • | | | 856,350 | | | | 834,941 | |
Telenet Financing USD Tranche AN 3.99% (LIBOR01M + 2.25%) 8/17/26 • | | | 1,480,000 | | | | 1,490,638 | |
Titan Acquisition1st Lien 4.799% (LIBOR01M + 3.00%) 3/28/25 • | | | 340,743 | | | | 335,717 | |
TransDigm Tranche F 4.299% (LIBOR01M + 2.50%) 6/9/23 • | | | 1,776,673 | | | | 1,784,446 | |
Trident TPI Holdings Tranche B 1st Lien 4.799% (LIBOR01M + 3.00%) 10/17/24 • | | | 653,352 | | | | 636,746 | |
UGI Tranche B 1st Lien 5.549% (LIBOR01M + 3.75%) 1/31/20 | | | 732,320 | | | | 736,897 | |
Ultimate Software Group 1st Lien 5.549% (LIBOR01M + 3.75%) 5/4/26 • | | | 1,695,525 | | | | 1,706,829 | |
United Rentals North America Tranche B 1st Lien 3.549% (LIBOR01M + 1.75%) 10/31/25 • | | | 123,438 | | | | 124,385 | |
US Foods Tranche B 3.799% (LIBOR01M + 2.00%) 1/31/20 • | | | 1,650,863 | | | | 1,659,960 | |
USI Tranche B 5.945% (LIBOR03M + 4.00%) 3/31/20 • | | | 347,071 | | | | 348,806 | |
USI Tranche B 1st Lien 4.945% (LIBOR03M + 3.00%) 3/31/20 • | | | 2,877,204 | | | | 2,880,441 | |
USIC Holdings Tranche B 5.049% (LIBOR01M + 3.25%) 1/31/20 • | | | 403,289 | | | | 401,777 | |
Vistra Operations Tranche B3 3.537% (LIBOR01M + 1.75%) 1/31/20 • | | | 2,003,096 | | | | 2,017,244 | |
Zayo Group Tranche B2 1st Lien 4.049% (LIBOR01M + 2.25%) 1/31/20 • | | | 2,093,757 | | | | 2,102,626 | |
ZelisRedCard Tranche B 1st Lien 6.549% (LIBOR01M + 4.75%) 1/31/20 • | | | 455,200 | | | | 458,045 | |
| | | | | | | | |
Total Loan Agreements
(cost $98,669,991) | | | | | | | 99,008,220 | |
| | | | | | | | |
| | |
Municipal Bonds – 0.08% | | | | | | | | |
South Carolina Public Service Authority
Series D 4.77% 12/1/45 | | | 340,000 | | | | 402,427 | |
State of California Various Purposes (Taxable Build America Bonds) 7.55% 4/1/39 | | | 925,000 | | | | 1,485,513 | |
| | | | | | | | |
Total Municipal Bonds
(cost $1,761,513) | | | | | | | 1,887,940 | |
| | | | | | | | |
| | | | | | | | |
| | | Principal amount° | | | Value (US $) | |
| | |
Non-Agency Asset-Backed Securities – 2.59% | | | | | | | | |
American Express Credit Account Master Trust | | | | | | | | |
Series2018-5 A 2.08% (LIBOR01M + 0.34%) 12/15/25 • | | | 960,000 | | | $ | 959,715 | |
Series2018-6 A 3.06% 2/15/24 | | | 2,260,000 | | | | 2,300,592 | |
Series2018-7 A 2.10% (LIBOR01M + 0.36%) 2/17/26 • | | | 500,000 | | | | 499,806 | |
Barclays Dryrock Issuance Trust Series2017-1 A 2.07% (LIBOR01M + 0.33%, Floor 0.33%) 3/15/23 • | | | 540,000 | | | | 540,355 | |
Chesapeake Funding II Series2017-3A A2 144A 2.08% (LIBOR01M + 0.34%) 8/15/29 #• | | | 1,447,783 | | | | 1,446,968 | |
Citicorp Residential Mortgage Trust
Series2006-3 A5 5.21% 11/25/36 • | | | 1,712,988 | | | | 1,739,415 | |
CNH Equipment Trust
Series2019-B A2 2.55% 9/15/22 | | | 5,445,000 | | | | 5,464,208 | |
Discover Card Execution Note Trust Series2017-A7 A7 2.10% (LIBOR01M + 0.36%) 4/15/25 • | | | 1,525,000 | | | | 1,525,074 | |
Hardee’s Funding | | | | | | | | |
Series2018-1A A2I 144A 4.25% 6/20/48 # | | | 1,802,188 | | | | 1,812,640 | |
Series2018-1A A2II 144A 4.959% 6/20/48 # | | | 1,234,375 | | | | 1,263,531 | |
HOA Funding
Series2014-1A A2 144A 4.846% 8/20/44 # | | | 4,385,500 | | | | 4,386,246 | |
Mercedes-Benz Auto Lease Trust
Series2019-B A2 2.01% 12/15/21 | | | 1,000,000 | | | | 1,000,611 | |
Mercedes-Benz Master Owner Trust | | | | | | | | |
Series2018-BA A 144A 2.08% (LIBOR01M + 0.34%) 5/15/23 #• | | | 1,000,000 | | | | 1,001,238 | |
Series2019-AA A 144A 2.09% (LIBOR01M + 0.35%) 5/15/23 #• | | | 5,675,000 | | | | 5,678,291 | |
Navistar Financial Dealer Note Master Owner Trust II Series2018-1 A 144A 2.422% (LIBOR01M + 0.63%, Floor 0.63%) 9/25/23 #• | | | 950,000 | | | | 951,569 | |
Nissan Master Owner Trust Receivables Series2019-B A 2.17% (LIBOR01M + 0.43%) 11/15/23 • | | | 1,250,000 | | | | 1,251,863 | |
Penarth Master Issuer
Series2018-2A A1 144A 2.195% (LIBOR01M + 0.45%) 9/18/22 #• | | | 3,865,000 | | | | 3,866,376 | |
PFS Financing
Series2018-E A 144A 2.19% (LIBOR01M + 0.45%) 10/17/22 #• | | | 5,500,000 | | | | 5,500,792 | |
Diversified Income Series-18
Delaware VIP® Diversified Income Series
Schedule of investments (continued)
| | | | | | | | |
| | | Principal amount° | | | Value (US $) | |
| | |
Non-Agency Asset-Backed Securities (continued) | | | | | | | | |
Taco Bell Funding
Series2016-1A A2II 144A 4.377% 5/25/46 # | | | 1,706,250 | | | $ | 1,717,511 | |
Towd Point Mortgage Trust | | | | | | | | |
Series2015-5 A1B 144A 2.75% 5/25/55 #• | | | 545,655 | | | | 545,213 | |
Series2015-6 A1B 144A 2.75% 4/25/55 #• | | | 683,346 | | | | 683,461 | |
Series2016-1 A1B 144A 2.75% 2/25/55 #• | | | 351,361 | | | | 351,501 | |
Series2016-2 A1 144A 3.00% 8/25/55 #• | | | 428,763 | | | | 432,373 | |
Series2016-3 A1 144A 2.25% 4/25/56 #• | | | 538,392 | | | | 536,998 | |
Series2017-1 A1 144A 2.75% 10/25/56 #• | | | 528,572 | | | | 532,044 | |
Series2017-2 A1 144A 2.75% 4/25/57 #• | | | 287,305 | | | | 289,145 | |
Series2017-4 M1 144A 3.25% 6/25/57 #• | | | 1,505,000 | | | | 1,519,570 | |
Series2018-1 A1 144A 3.00% 1/25/58 #• | | | 529,652 | | | | 535,065 | |
Toyota Auto Receivables Owner Trust Series2019-B A2A 2.59% 2/15/22 | | | 4,575,000 | | | | 4,586,705 | |
Trafigura Securitisation Finance | | | | | | | | |
Series2017-1A A1 144A 2.59% (LIBOR01M + 0.85%) 12/15/20 #• | | | 1,800,000 | | | | 1,801,755 | |
Series2018-1A A1 144A 2.47% (LIBOR01M + 0.73%) 3/15/22 #• | | | 3,340,000 | | | | 3,331,339 | |
Vantage Data Centers Issuer
Series2018-1A A2 144A 4.072% 2/16/43 # | | | 883,500 | | | | 910,617 | |
Verizon Owner Trust | | | | | | | | |
Series2017-1A A 144A 2.06% 9/20/21 # | | | 383,002 | | | | 383,024 | |
Series2019-B A1B 2.215% (LIBOR01M + 0.45%) 12/20/23 • | | | 2,000,000 | | | | 2,005,366 | |
Volvo Financial Equipment Master Owner Trust
Series2017-A A 144A 2.24% (LIBOR01M + 0.50%) 11/15/22 #• | | | 3,500,000 | | | | 3,507,969 | |
Wendys Funding
Series2018-1A A2I 144A 3.573% 3/15/48 # | | | 1,151,500 | | | | 1,163,533 | |
| | | | | | | | |
TotalNon-Agency Asset-Backed Securities
(cost $65,694,049) | | | | | | | 66,022,479 | |
| | | | | | | | |
| | | | | | | | |
| | | Principal amount° | | | Value (US $) | |
| |
Non-Agency Collateralized
Mortgage Obligations – 1.56% | | | | | |
Chase Home Lending Mortgage Trust | | | | | | | | |
Series 2019-ATR1 A4 144A 4.00% 4/25/49 #• | | | 541,848 | | | $ | 545,101 | |
Series 2019-ATR2 A3 144A 3.50% 7/25/49 #• | | | 1,125,157 | | | | 1,143,353 | |
Citicorp Mortgage Securities Trust
Series2006-3 1A9 5.75% 6/25/36 | | | 51,978 | | | | 52,240 | |
Connecticut Avenue Securities Trust | | | | | | | | |
Series2018-R07 1M2 144A 4.192% (LIBOR01M + 2.40%) 4/25/31 #• | | | 1,737,383 | | | | 1,757,472 | |
Series2019-R01 2M2 144A 4.242% (LIBOR01M + 2.45%) 7/25/31 #• | | | 1,200,000 | | | | 1,214,610 | |
Flagstar Mortgage Trust | | | | | | | | |
Series2018-1 A5 144A 3.50% 3/25/48 #• | | | 975,987 | | | | 984,897 | |
Series2018-5 A7 144A 4.00% 9/25/48 #• | | | 514,568 | | | | 516,943 | |
Galton Funding Mortgage Trust
Series2018-1 A43 144A 3.50% 11/25/57 #• | | | 612,951 | | | | 615,105 | |
Holmes Master Issuer
Series2018-2A A2 144A 2.421% (LIBOR03M + 0.42%) 10/15/54 #• | | | 1,418,852 | | | | 1,418,434 | |
JPMorgan Mortgage Trust | | | | | | | | |
Series2014-2 B1 144A 3.405% 6/25/29 #• | | | 560,433 | | | | 566,489 | |
Series2014-2 B2 144A 3.405% 6/25/29 #• | | | 209,482 | | | | 210,941 | |
Series 2014-IVR6 2A4 144A 2.50% 7/25/44 #• | | | 1,050,000 | | | | 1,049,181 | |
Series2015-4 B1 144A 3.62% 6/25/45 #• | | | 1,027,630 | | | | 1,051,902 | |
Series2015-4 B2 144A 3.62% 6/25/45 #• | | | 737,213 | | | | 750,030 | |
Series2015-5 B2 144A 3.172% 5/25/45 #• | | | 1,184,938 | | | | 1,174,225 | |
Series2015-6 B1 144A 3.597% 10/25/45 #• | | | 705,532 | | | | 719,245 | |
Series2015-6 B2 144A 3.597% 10/25/45 #• | | | 683,484 | | | | 693,281 | |
Series2016-4 B1 144A 3.896% 10/25/46 #• | | | 500,042 | | | | 519,394 | |
Series2016-4 B2 144A 3.896% 10/25/46 #• | | | 857,871 | | | | 885,642 | |
Series2017-1 B3 144A 3.539% 1/25/47 #• | | | 1,686,211 | | | | 1,695,699 | |
Series2017-2 A3 144A 3.50% 5/25/47 #• | | | 659,118 | | | | 670,980 | |
Series2018-3 A5 144A 3.50% 9/25/48 #• | | | 884,612 | | | | 896,719 | |
Diversified Income Series-19
Delaware VIP® Diversified Income Series
Schedule of investments (continued)
| | | | | | | | |
| | | Principal amount° | | | Value (US $) | |
| | |
Non-Agency Collateralized Mortgage Obligations (continued) | | | | | | | | |
JPMorgan Mortgage Trust | | | | | | | | |
Series2018-6 1A4 144A 3.50% 12/25/48 #• | | | 515,047 | | | $ | 517,739 | |
Series 2018-7FRB A2 144A 2.458% (LIBOR01M + 0.75%) 4/25/46 #• | | | 868,743 | | | | 868,183 | |
JPMorgan Trust
Series2015-1 B2 144A 3.219% 12/25/44 #• | | | 1,295,639 | | | | 1,290,743 | |
New Residential Mortgage Loan Trust
Series 2018-RPL1 A1 144A 3.50% 12/25/57 #• | | | 797,603 | | | | 818,150 | |
Permanent Master Issuer
Series2018-1A 1A1 144A 2.366% (LIBOR03M + 0.38%) 7/15/58 #• | | | 1,000,000 | | | | 999,874 | |
Sequoia Mortgage Trust | | | | | | | | |
Series2014-2 A4 144A 3.50% 7/25/44 #• | | | 467,913 | | | | 474,925 | |
Series2015-1 B2 144A 3.877% 1/25/45 #• | | | 790,465 | | | | 807,882 | |
Series2015-2 B2 144A 3.738% 5/25/45 #• | | | 4,857,460 | | | | 4,974,514 | |
Series2017-4 A1 144A 3.50% 7/25/47 #• | | | 673,495 | | | | 684,404 | |
Series2017-5 B1 144A 3.854% 8/25/47 #• | | | 3,517,974 | | | | 3,654,055 | |
Series2018-5 A4 144A 3.50% 5/25/48 #• | | | 980,130 | | | | 991,731 | |
Series2018-8 A4 144A 4.00% 11/25/48 #• | | | 1,347,604 | | | | 1,358,290 | |
Silverstone Master Issuer Series2018-1A 1A 144A 2.356% (LIBOR03M + 0.39%) 1/21/70 #• | | | 2,720,000 | | | | 2,711,432 | |
Washington Mutual Mortgage Pass Through Certificates Trust
Series2005-1 5A2 6.00% 3/25/35◆ | | | 6,206 | | | | 617 | |
Wells Fargo Mortgage-Backed Securities Trust | | | | | | | | |
Series2006-AR5 2A1 5.188% 4/25/36 • | | | 100,438 | | | | 99,296 | |
Series 2007-AR10 2A1 4.596% 1/25/38 • | | | 486,188 | | | | 452,484 | |
| | | | | | | | |
TotalNon-Agency Collateralized Mortgage Obligations
(cost $39,304,065) | | | | | | | 39,836,202 | |
| | | | | | | | |
| | | | | | | | |
| | | Principal amount° | | | Value (US $) | |
| | |
Non-Agency Commercial | | | | | | | | |
Mortgage-Backed | | | | | | | | |
Securities – 7.36% | | | | | | | | |
BANK | | | | | | | | |
Series 2017-BNK5 A5 3.39% 6/15/60 | | | 3,645,000 | | | $ | 3,851,798 | |
Series 2017-BNK5 B 3.896% 6/15/60 • | | | 1,500,000 | | | | 1,566,708 | |
Series 2017-BNK7 A5 3.435% 9/15/60 | | | 2,645,000 | | | | 2,802,683 | |
Series 2019-BN20 A3 3.011% 9/15/61 | | | 1,850,000 | | | | 1,903,190 | |
Series 2019-BN21 A5 2.851% 10/17/52 | | | 5,000,000 | | | | 5,075,899 | |
BENCHMARK Mortgage Trust | | | | | | | | |
Series2018-B1 A5 3.666% 1/15/51 • | | | 1,270,000 | | | | 1,366,077 | |
Series2018-B3 A5 4.025% 4/10/51 | | | 1,075,000 | | | | 1,184,471 | |
Benchmark Mortgage Trust Series2019-B9 A5 4.016% 3/15/52 | | | 8,710,000 | | | | 9,638,883 | |
Cantor Commercial Real Estate Lending | | | | | | | | |
Series2019-CF1 A5 3.786% 5/15/52 | | | 7,460,000 | | | | 8,112,312 | |
Series2019-CF2 A5 2.874% 11/15/52 | | | 6,500,000 | | | | 6,589,545 | |
Series2019-CF3 A4 3.006% 1/15/53 | | | 1,500,000 | | | | 1,537,195 | |
CD Mortgage Trust | | | | | | | | |
Series2016-CD2 A3 3.248% 11/10/49 | | | 12,150,000 | | | | 12,684,991 | |
Series2019-CD8 A4 2.912% 8/15/57 | | | 2,650,000 | | | | 2,699,645 | |
CFCRE Commercial Mortgage Trust | | | | | | | | |
Series2011-C2 C 144A 5.741% 12/15/47 #• | | | 880,000 | | | | 917,826 | |
Series2016-C7 A3 3.839% 12/10/54 | | | 5,695,000 | | | | 6,126,962 | |
Citigroup Commercial Mortgage Trust | | | | | | | | |
Series 2014-GC25 A4 3.635% 10/10/47 | | | 1,935,000 | | | | 2,038,098 | |
Series 2015-GC27 A5 3.137% 2/10/48 | | | 2,780,000 | | | | 2,871,692 | |
Series2016-P3 A4 3.329% 4/15/49 | | | 3,100,000 | | | | 3,249,249 | |
Series2017-C4 A4 3.471% 10/12/50 | | | 1,560,000 | | | | 1,657,632 | |
Series2018-C5 A4 4.228% 6/10/51 • | | | 2,100,000 | | | | 2,345,593 | |
Series2019-C7 A4 3.102% 12/15/72 | | | 1,450,000 | | | | 1,498,051 | |
COMM Mortgage Trust | | | | | | | | |
Series2013-CR6 AM 144A 3.147% 3/10/46 # | | | 3,050,000 | �� | | | 3,102,895 | |
Series2013-WWP A2 144A 3.424% 3/10/31 # | | | 2,540,000 | | | | 2,639,397 | |
Series 2014-CR19 A5 3.796% 8/10/47 | | | 9,707,000 | | | | 10,284,435 | |
Series 2014-CR20 AM 3.938% 11/10/47 | | | 7,775,000 | | | | 8,158,711 | |
Series2015-3BP A 144A 3.178% 2/10/35 # | | | 3,960,000 | | | | 4,098,406 | |
Diversified Income Series-20
Delaware VIP® Diversified Income Series
Schedule of investments (continued)
| | | | | | | | |
| | | Principal amount° | | | Value (US $) | |
| | |
Non-Agency Commercial Mortgage-Backed Securities (continued) | | | | | | | | |
COMM Mortgage Trust Series 2015-CR23 A4 3.497% 5/10/48 | | | 1,910,000 | | | $ | 2,009,750 | |
DB-JPM Mortgage Trust | | | | | | | | |
Series2016-C1 A4 3.276% 5/10/49 | | | 1,790,000 | | | | 1,867,613 | |
Series2016-C3 A5 2.89% 8/10/49 | | | 1,985,000 | | | | 2,029,226 | |
DB-UBS Mortgage Trust
Series 2011-LC1A C 144A 5.702% 11/10/46 #• | | | 1,265,000 | | | | 1,294,938 | |
GS Mortgage Securities
Corp II
Series 2018-GS10 C 4.412% 7/10/51 • | | | 1,100,000 | | | | 1,176,280 | |
GS Mortgage Securities Trust | | | | | | | | |
Series2010-C1 C 144A 5.635% 8/10/43 #• | | | 1,010,000 | | | | 1,019,063 | |
Series 2015-GC32 A4 3.764% 7/10/48 | | | 1,240,000 | | | | 1,323,477 | |
Series2017-GS5 A4 3.674% 3/10/50 | | | 2,980,000 | | | | 3,187,856 | |
Series2017-GS6 A3 3.433% 5/10/50 | | | 4,410,000 | | | | 4,653,946 | |
Series2018-GS9 A4 3.992% 3/10/51 • | | | 1,370,000 | | | | 1,500,826 | |
Series2018-GS9 C 4.363% 3/10/51 • | | | 400,000 | | | | 423,939 | |
Series 2019-GC39 A4 3.567% 5/10/52 | | | 820,000 | | | | 878,994 | |
Series 2019-GC42 A4 3.001% 9/1/52 | | | 3,750,000 | | | | 3,849,671 | |
JPM-BB Commercial
Mortgage Securities Trust | | | | | |
Series2015-C31 A3 3.801% 8/15/48 | | | 3,395,000 | | | | 3,631,004 | |
Series2015-C33 A4 3.77% 12/15/48 | | | 4,710,000 | | | | 5,039,978 | |
JPM-DB Commercial
Mortgage Securities Trust | | | | | |
Series2016-C2 A4 3.144% 6/15/49 | | | 2,080,000 | | | | 2,154,546 | |
Series2017-C7 A5 3.409% 10/15/50 | | | 3,425,000 | | | | 3,613,194 | |
JPMorgan Chase Commercial
Mortgage Securities Trust | | | | | |
Series 2013-LC11 B 3.499% 4/15/46 | | | 2,445,000 | | | | 2,486,860 | |
Series2015-JP1 A5 3.914% 1/15/49 | | | 1,590,000 | | | | 1,713,604 | |
Series2016-JP2 A4 2.822% 8/15/49 | | | 4,995,000 | | | | 5,083,783 | |
Series2016-JP2 AS 3.056% 8/15/49 | | | 3,095,000 | | | | 3,124,788 | |
Series 2016-WIKI A 144A 2.798% 10/5/31 # | | | 1,610,000 | | | | 1,620,177 | |
Series 2016-WIKI B 144A 3.201% 10/5/31 # | | | 1,490,000 | | | | 1,501,531 | |
LB-UBS Commercial Mortgage Trust
Series2006-C6 AJ 5.452% 9/15/39 • | | | 1,020,476 | | | | 543,345 | |
Morgan Stanley BAML Trust | | | | | | | | |
Series2014-C17 A5 3.741% 8/15/47 | | | 1,640,000 | | | | 1,729,447 | |
Series2015-C26 A5 3.531% 10/15/48 | | | 1,970,000 | | | | 2,077,816 | |
| | | | | | | | |
| | | Principal amount° | | | Value (US $) | |
| | |
Non-Agency Commercial Mortgage-Backed Securities (continued) | | | | | | | | |
Morgan Stanley Bank of America Merrill Lynch Trust
Series2016-C29 A4 3.325% 5/15/49 | | | 1,620,000 | | | $ | 1,692,263 | |
Morgan Stanley Capital I Trust | | | | | | | | |
Series 2006-HQ10 B 5.448% 11/12/41 • | | | 1,604,590 | | | | 1,461,151 | |
Series2006-T21 B 144A 5.576% 10/12/52 #• | | | 695,202 | | | | 695,286 | |
UBS Commercial Mortgage Trust | | | | | | | | |
Series2012-C1 A3 3.40% 5/10/45 | | | 1,255,927 | | | | 1,280,681 | |
Series2018-C9 A4 4.117% 3/15/51 • | | | 2,365,000 | | | | 2,617,217 | |
UBS-Barclays Commercial Mortgage Trust
Series2013-C5 B 144A 3.649% 3/10/46 #• | | | 1,000,000 | | | | 1,018,763 | |
Wells Fargo Commercial Mortgage Trust | | | | | | | | |
Series 2014-LC18 A5 3.405% 12/15/47 | | | 1,175,000 | | | | 1,229,173 | |
Series 2015-NXS3 A4 3.617% 9/15/57 | | | 1,250,000 | | | | 1,326,673 | |
Series 2016-BNK1 A3 2.652% 8/15/49 | | | 2,575,000 | | | | 2,593,193 | |
Series2017-C38 A5 3.453% 7/15/50 | | | 2,240,000 | | | | 2,372,690 | |
WF-RBS Commercial Mortgage Trust
Series2012-C10 A3 2.875% 12/15/45 | | | 3,605,000 | | | | 3,663,628 | |
| | | | | | | | |
TotalNon-Agency Commercial
Mortgage-Backed Securities
(cost $184,429,345) | | | | 187,488,714 | |
| | | | | | | | |
| |
Sovereign Bonds – 1.74%D | | | | | |
Angola – 0.01% | | | | | | | | |
Angolan Government International Bond 144A 8.00% 11/26/29 # | | | 329,000 | | | | 351,938 | |
| | | | | | | | |
| | | | | | | 351,938 | |
| | | | | | | | |
| | |
Argentina – 0.06% | | | | | | | | |
Argentine Republic Government International Bond | | | | | | | | |
5.625% 1/26/22 | | | 2,914,000 | | | | 1,516,189 | |
6.875% 1/11/48 | | | 328,000 | | | | 158,157 | |
| | | | | | | | |
| | | | | | | 1,674,346 | |
| | | | | | | | |
| | |
Azerbaijan – 0.04% | | | | | | | | |
Republic of Azerbaijan International Bond 144A 4.75% 3/18/24 # | | | 861,000 | | | | 923,949 | |
| | | | | | | | |
| | | | | | | 923,949 | |
| | | | | | | | |
Diversified Income Series-21
Delaware VIP® Diversified Income Series
Schedule of investments (continued)
| | | | | | | | |
| | | Principal amount° | | | Value (US $) | |
| |
Sovereign BondsD (continued) | | | | | |
Belarus – 0.01% | | | | | | | | |
Republic of Belarus International Bond 144A 6.20% 2/28/30 # | | | 200,000 | | | $ | 212,969 | |
| | | | | | | | |
| | | | | | | 212,969 | |
| | | | | | | | |
| | |
Brazil – 0.02% | | | | | | | | |
Brazilian Government International Bond 4.75% 1/14/50 | | | 525,000 | | | | 518,716 | |
| | | | | | | | |
| | | | | | | 518,716 | |
| | | | | | | | |
| | |
Chile – 0.01% | | | | | | | | |
Chile Government International Bond 3.50% 1/25/50 | | | 200,000 | | | | 207,062 | |
| | | | | | | | |
| | | | | | | 207,062 | |
| | | | | | | | |
| | |
Colombia – 0.05% | | | | | | | | |
Colombia Government International Bond | | | | | | | | |
4.00% 2/26/24 | | | 732,000 | | | | 772,033 | |
5.00% 6/15/45 | | | 442,000 | | | | 514,901 | |
| | | | | | | | |
| | | | | | | 1,286,934 | |
| | | | | | | | |
| |
Dominican Republic – 0.08% | | | | | |
Dominican Republic International Bond 144A 6.00% 7/19/28 # | | | 1,760,000 | | | | 1,960,829 | |
| | | | | | | | |
| | | | | | | 1,960,829 | |
| | | | | | | | |
| | |
Ecuador – 0.06% | | | | | | | | |
Ecuador Government International Bond 144A 10.75% 1/31/29 # | | | 1,592,000 | | | | 1,556,733 | |
| | | | | | | | |
| | | | | | | 1,556,733 | |
| | | | | | | | |
| | |
Egypt – 0.34% | | | | | | | | |
Egypt Government International Bond | | | | | | | | |
144A 5.577% 2/21/23 # | | | 6,735,000 | | | | 7,058,960 | |
144A 7.60% 3/1/29 # | | | 481,000 | | | | 527,330 | |
144A 8.70% 3/1/49 # | | | 879,000 | | | | 985,675 | |
| | | | | | | | |
| | | | | | | 8,571,965 | |
| | | | | | | | |
| | |
El Salvador – 0.03% | | | | | | | | |
El Salvador Government International Bond 144A 7.125% 1/20/50 # | | | 675,000 | | | | 720,775 | |
| | | | | | | | |
| | | | | | | 720,775 | |
| | | | | | | | |
| | |
Ghana – 0.03% | | | | | | | | |
Ghana Government International Bond 144A 7.875% 3/26/27 # | | | 752,000 | | | | 792,274 | |
| | | | | | | | |
| | | | | | | 792,274 | |
| | | | | | | | |
| | |
Guatemala – 0.02% | | | | | | | | |
Guatemala Government Bond 144A 4.875% 2/13/28 # | | | 387,000 | | | | 412,777 | |
| | | | | | | | |
| | | | | | | 412,777 | |
| | | | | | | | |
| | |
Indonesia – 0.03% | | | | | | | | |
Indonesia Government International Bond 144A 3.375% 4/15/23 # | | | 450,000 | | | | 464,006 | |
| | | | | | | | |
| | | Principal amount° | | | Value (US $) | |
Sovereign BondsD(continued) | | | | | |
Indonesia (continued) | | | | | | | | |
Indonesia Government International Bond
144A 4.625% 4/15/43 # | | | 230,000 | | | $ | 258,255 | |
| | | | | | | | |
| | | | | | | 722,261 | |
| | | | | | | | |
| | |
Ivory Coast – 0.03% | | | | | | | | |
Ivory Coast Government International Bond 144A 6.125% 6/15/33 # | | | 892,000 | | | | 901,992 | |
| | | | | | | | |
| | | | | | | 901,992 | |
| | | | | | | | |
| | |
Jordan – 0.01% | | | | | | | | |
Jordan Government International Bond 144A 5.75% 1/31/27 # | | | 244,000 | | | | 258,061 | |
| | | | | | | | |
| | | | | | | 258,061 | |
| | | | | | | | |
| | |
Kenya – 0.07% | | | | | | | | |
Kenya Government International Bond 144A 8.00% 5/22/32 # | | | 1,585,000 | | | | 1,731,078 | |
| | | | | | | | |
| | | | | | | 1,731,078 | |
| | | | | | | | |
| | |
Lebanon – 0.02% | | | | | | | | |
Lebanon Government International Bond 6.25% 5/27/22 | | | 1,082,000 | | | | 527,724 | |
| | | | | | | | |
| | | | | | | 527,724 | |
| | | | | | | | |
| | |
Mexico – 0.03% | | | | | | | | |
Mexico Government International Bond | | | | | | | | |
3.625% 3/15/22 | | | 448,000 | | | | 462,112 | |
4.60% 2/10/48 | | | 378,000 | | | | 415,212 | |
| | | | | | | | |
| | | | | | | 877,324 | |
| | | | | | | | |
| | |
Mongolia – 0.06% | | | | | | | | |
Mongolia Government International Bond 144A 5.625% 5/1/23 # | | | 1,504,000 | | | | 1,551,310 | |
| | | | | | | | |
| | | | | | | 1,551,310 | |
| | | | | | | | |
| | |
Nigeria – 0.03% | | | | | | | | |
Nigeria Government International Bond 144A 7.875% 2/16/32 # | | | 852,000 | | | | 886,553 | |
| | | | | | | | |
| | | | | | | 886,553 | |
| | | | | | | | |
| | |
Panama – 0.01% | | | | | | | | |
Panama Government International Bond 4.50% 5/15/47 | | | 218,000 | | | | 259,842 | |
| | | | | | | | |
| | | | | | | 259,842 | |
| | | | | | | | |
| | |
Paraguay – 0.02% | | | | | | | | |
Paraguay Government International Bond 144A 5.40% 3/30/50 # | | | 445,000 | | | | 514,947 | |
| | | | | | | | |
| | | | | | | 514,947 | |
| | | | | | | | |
| | |
Peru – 0.03% | | | | | | | | |
Peruvian Government International Bond 2.844% 6/20/30 | | | 644,000 | | | | 666,120 | |
| | | | | | | | |
| | | | | | | 666,120 | |
| | | | | | | | |
Diversified Income Series-22
Delaware VIP® Diversified Income Series
Schedule of investments (continued)
| | | | | | | | |
| | | Principal amount° | | | Value (US $) | |
| | |
Sovereign BondsD(continued) | | | | | | | | |
| | |
Qatar – 0.05% | | | | | | | | |
Qatar Government International Bond 144A 4.00% 3/14/29 # | | | 1,205,000 | | | $ | 1,347,192 | |
| | | | | | | | |
| | | | | | | 1,347,192 | |
| | | | | | | | |
| | |
Russia – 0.11% | | | | | | | | |
Russian Foreign Bond - Eurobond 144A | | | | | | | | |
4.25% 6/23/27 # | | | 1,600,000 | | | | 1,750,109 | |
144A 5.25% 6/23/47 # | | | 800,000 | | | | 1,003,316 | |
| | | | | | | | |
| | | | | | | 2,753,425 | |
| | | | | | | | |
| | |
Saudi Arabia – 0.03% | | | | | | | | |
Saudi Government International Bond
144A 3.625% 3/4/28 # | | | 730,000 | | | | 772,138 | |
| | | | | | | | |
| | | | | | | 772,138 | |
| | | | | | | | |
| | |
Senegal – 0.03% | | | | | | | | |
Senegal Government International Bond 144A 6.75% 3/13/48 # | | | 873,000 | | | | 880,798 | |
| | | | | | | | |
| | | | | | | 880,798 | |
| | | | | | | | |
| | |
South Africa – 0.02% | | | | | | | | |
Republic of South Africa Government International Bond 5.75% 9/30/49 | | | 413,000 | | | | 403,041 | |
| | | | | | | | |
| | | | | | | 403,041 | |
| | | | | | | | |
| | |
Sri Lanka – 0.09% | | | | | | | | |
Sri Lanka Government International Bond | | | | | | | | |
144A 5.875% 7/25/22 # | | | 409,000 | | | | 410,094 | |
144A 6.20% 5/11/27 # | | | 742,000 | | | | 697,404 | |
144A 7.55% 3/28/30 # | | | 1,110,000 | | | | 1,104,177 | |
| | | | | | | | |
| | | | | | | 2,211,675 | |
| | | | | | | | |
| | |
Turkey – 0.08% | | | | | | | | |
Turkey Government International Bond | | | | | | | | |
5.75% 5/11/47 | | | 220,000 | | | | 195,493 | |
6.35% 8/10/24 | | | 850,000 | | | | 890,119 | |
7.625% 4/26/29 | | | 922,000 | | | | 1,020,785 | |
| | | | | | | | |
| | | | | | | 2,106,397 | |
| | | | | | | | |
| | |
Ukraine – 0.13% | | | | | | | | |
Ukraine Government International Bond | | | | | | | | |
144A 7.75% 9/1/26 # | | | 1,720,000 | | | | 1,884,881 | |
144A 9.75% 11/1/28 # | | | 1,220,000 | | | | 1,486,723 | |
| | | | | | | | |
| | | | | | | 3,371,604 | |
| | | | | | | | |
| | |
Uruguay – 0.05% | | | | | | | | |
Uruguay Government International Bond 4.375% 1/23/31 | | | 1,117,110 | | | | 1,251,442 | |
| | | | | | | | |
| | | | | | | 1,251,442 | |
| | | | | | | | |
| | |
Uzbekistan – 0.05% | | | | | | | | |
Republic of Uzbekistan Bond 144A 5.375% 2/20/29 # | | | 1,094,000 | | | | 1,218,486 | |
| | | | | | | | |
| | | | | | | 1,218,486 | |
| | | | | | | | |
| | |
Total Sovereign Bonds (cost $42,726,870) | | | | | | | 44,404,677 | |
| | | | | | | | |
| | | | | | | | |
| | | Principal amount° | | | Value (US $) | |
| |
Supranational Banks – 0.07% | | | | | |
Banque Ouest Africaine de Developpement | | | | | | | | |
144A 4.70% 10/22/31 # | | | 508,000 | | | $ | 517,225 | |
144A 5.00% 7/27/27 # | | | 1,182,000 | | | | 1,255,875 | |
| | | | | | | | |
| |
Total Supranational Banks
(cost $1,667,235) | | | | 1,773,100 | |
| | | | | | | | |
| |
US Treasury Obligations – 18.01% | | | | | |
US Treasury Bonds | | | | | | | | |
2.375% 11/15/49 | | | 18,250,000 | | | | 18,172,952 | |
4.50% 2/15/36 | | | 22,675,000 | | | | 30,045,420 | |
US Treasury Notes | | | | | | | | |
1.50% 9/30/24 | | | 235,960,000 | | | | 233,812,575 | |
1.50% 11/30/24 | | | 22,255,000 | | | | 22,056,693 | |
1.625% 8/15/29 | | | 121,725,000 | | | | 118,513,432 | |
1.75% 7/31/21 | | | 1,150,000 | | | | 1,152,732 | |
US Treasury Strip Principal 2.26% 5/15/44 | | | 63,485,000 | | | | 35,140,903 | |
| | | | | | | | |
| |
Total US Treasury Obligations
(cost $463,539,920) | | | | 458,894,707 | |
| | | | | | | | |
| | |
| | | Number of
shares | | | | |
| | |
Common Stock – 0.00% | | | | | | | | |
Adelphia Recovery Trust =† | | | 1 | | | | 0 | |
Century
Communications =† | | | 2,500,000 | | | | 0 | |
| | | | | | | | |
Total Common Stock (cost $75,684) | | | | | | | 0 | |
| | | | | | | | |
Preferred Stock – 0.01% | | | | | | | | |
USB Realty 144A 3.148% (LIBOR03M + 1.147%) #• | | | 300,000 | | | | 259,206 | |
| | | | | | | | |
Total Preferred Stock (cost $240,814) | | | | | | | 259,206 | |
| | | | | | | | |
Diversified Income Series-23
Delaware VIP® Diversified Income Series
Schedule of investments (continued)
| | | | | | | | |
| | | Number of shares | | | Value (US $) | |
| |
Short-Term Investments – 4.07% | | | | | |
Money Market Mutual Funds – 2.14% | | | | | | | | |
BlackRock FedFund – Institutional Shares(seven-day effective yield 1.52%) | | | 10,910,858 | | | $ | 10,910,858 | |
Fidelity Investments Money Market Government Portfolio – Class I(seven-day effective yield 1.49%) | | | 10,910,858 | | | | 10,910,858 | |
GS Financial Square Government Fund – Institutional Shares(seven-day effective yield 1.51%) | | | 10,910,858 | | | | 10,910,858 | |
Morgan Stanley Government Portfolio – Institutional Share Class(seven-day effective yield 1.48%) | | | 10,910,858 | | | | 10,910,858 | |
| | | | | | | | |
| | | Number of shares | | | Value (US $) | |
| |
Short-Term Investments
(continued) | | | | | |
Money Market Mutual Funds (continued) | | | | | | | | |
State Street Institutional US Government Money Market Fund – Investor Class(seven-day effective yield 1.45%) | | | 10,910,858 | | | $ | 10,910,858 | |
| | | | | | | | |
| | | | | | | 54,554,290 | |
| | | | | | | | |
| | | Principal
amount° | | | | |
| |
US Treasury Obligation – 1.93%≠ | | | | | |
US Treasury Bill 1.25% 1/31/20 | | | 49,110,000 | | | | 49,094,594 | |
| | | | | | | | |
| | | | | | | 49,094,594 | |
| | | | | | | | |
Total Short-Term Investments
(cost $103,638,630) | | | | 103,648,884 | |
| | | | | | | | |
| | | | | | |
Total Value of Securities – 99.25%
(cost $2,484,646,803) | | | | $ | 2,528,638,949 | |
| | | | | | |
| # | Security exempt from registration under Rule 144A of the Securities Act of 1933, as amended. At Dec. 31, 2019, the aggregate value of Rule 144A securities was $510,617,346, which represents 20.04% of the Series’ net assets. See Note 11 in “Notes to financial statements.” |
| ¨ | Pass Through Agreement. Security represents the contractual right to receive a proportionate amount of underlying payments due to the counterparty pursuant to various agreements related to the rescheduling of obligations and the exchange of certain notes. |
| = | The value of this security was determined using significant unobservable inputs and is reported as a Level 3 security in the disclosure table located in Note 3 in “Notes to financial statements.” |
| ≠ | The rate shown is the effective yield at the time of purchase. |
| ° | Principal amount shown is stated in USD unless noted that the security is denominated in another currency. |
| D | Securities have been classified by country of origin. |
| m | Fixed to variable rate investment. The rate shown reflects the fixed rate in effect at Dec. 31, 2019. Rate will reset at a future date. |
| S | Interest only security. An interest only security is the interest only portion of a fixed income security, which is separated and sold individually from the principal portion of the security. |
| y | No contractual maturity date. |
| † | Non-income producing security. |
| • | Variable rate investment. Rates reset periodically. Rate shown reflects the rate in effect at Dec. 31, 2019. For securities based on a published reference rate and spread, the reference rate and spread are indicated in their description above. The reference rate descriptions (i.e. LIBOR03M, LIBOR06M, etc.) used in this report are identical for different securities, but the underlying reference rates may differ due to the timing of the reset period. Certain variable rate securities are not based on a published reference rate and spread but are determined by the issuer or agent and are based on current market conditions, or for mortgage-backed securities, are impacted by the individual mortgages which are paying off over time. These securities do not indicate a reference rate and spread in their description above. |
| X | This loan will settle after Dec. 31, 2019, at which time the interest rate, based on the LIBOR and the agreed upon spread on trade date, will be reflected. |
| ^ | Zero-coupon security. The rate shown is the effective yield at the time of purchase. |
Unfunded Loan Commitments1
The Series may invest in floating rate loans. In connection with these investments, the Series may also enter into unfunded corporate loan commitments (commitments). Commitments may obligate the Series to furnish temporary financing to a borrower until permanent financing can be arranged. In connection with these commitments, the Series earns a commitment fee, typically set as a percentage of the commitment amount. The following unfunded loan commitment was outstanding at Dec. 31, 2019:
| | | | | | |
Borrower | | Principal Amount | | Value | | Unrealized Appreciation
(Depreciation) |
Inmarsat Tranche B 0.00% 12/12/26 | | $773,690 | | $780,750 | | $22,534 |
Diversified Income Series-24
Delaware VIP® Diversified Income Series
Schedule of investments (continued)
The following futures contracts were outstanding at Dec. 31, 2019:2
Futures Contracts
| | | | | | | | | | | | | | | | | | | | | | |
Contracts to Buy (Sell) | | Notional
Amount | | | Notional
Cost (Proceeds) | | | Expiration
Date | | | Value/
Unrealized
Depreciation | | | Variation Margin
Due from
(Due to) Brokers | |
614 | | US Treasury 5 yr Notes | | $ | 72,826,159 | | | $ | 73,053,065 | | | | 3/31/20 | | | $ | (226,906 | ) | | $ | (14,386 | ) |
1,004 | | US Treasury 10 yr Notes | | | 128,935,568 | | | | 129,497,235 | | | | 3/20/20 | | | | (561,667 | ) | | | (109,807 | ) |
634 | | US Treasury Long Bond | | | 98,844,563 | | | | 100,864,482 | | | | 3/20/20 | | | | (2,019,919 | ) | | | (217,938 | ) |
| | | | | | | | | | | | | | | | | | | | | | |
Total Futures Contracts | | | | | | $ | 303,414,782 | | | | | | | $ | (2,808,492 | ) | | $ | (342,131 | ) |
| | | | | | | | | | | | | | | | | | | | | | |
The use of futures contracts involves elements of market risk and risks in excess of the amounts disclosed in these financial statements. The notional amounts presented above represent the Series’ total exposure in such contracts, whereas only the variation margin is reflected in the Series’ net assets.
1See Note 11 in “Notes to financial statements.”
2See Note 8 in “Notes to financial statements.”
Summary of abbreviations:
BADLARPP – Argentina Term Deposit Rate
BAML – Bank of America Merrill Lynch
BB – Barclays Bank
CLO – Collateralized Loan Obligation
DB – Deutsche Bank
FREMF – Freddie Mac Multifamily
GNMA – Government National Mortgage Association
GS – Goldman Sachs
ICE – Intercontinental Exchange
JPM – JPMorgan
LB – Lehman Brothers
LIBOR – London Interbank Offered Rate
LIBOR01M – ICE LIBOR USD 1 Month
LIBOR03M – ICE LIBOR USD 3 Month
LIBOR06M – ICE LIBOR USD 6 Month
RBS – Royal Bank of Scotland
REMIC – Real Estate Mortgage Investment Conduit
S.F. – Single Family
TBA – To be announced
USD – US Dollar
WF – Wells Fargo
yr – Year
See accompanying notes, which are an integral part of the financial statements.
Diversified Income Series-25
| | | | |
| Delaware VIP®Trust — Delaware VIP Diversified Income Series | | | | |
| Statement of assets and liabilities | | | December 31, 2019 | |
| | | | |
Assets: | | | | |
Investments, at value1 | | $ | 2,528,638,949 | |
Cash | | | 4,330,876 | |
Cash collateral due from brokers | | | 3,296,200 | |
Foreign currencies, at value2 | | | 215,932 | |
Dividends and interest receivable | | | 17,186,014 | |
Receivable for series shares sold | | | 929,938 | |
Receivable for securities sold | | | 452,077 | |
| | | | |
Total assets | | | 2,555,049,986 | |
| | | | |
Liabilities: | | | | |
Payable for securities purchased | | | 4,452,084 | |
Management fees payable to affiliates | | | 1,253,618 | |
Distribution fees payable to affiliates | | | 557,166 | |
Variation margin due to broker on futures contracts | | | 342,131 | |
Other accrued expenses payable | | | 295,516 | |
Other liabilities | | | 172,827 | |
Payable for series shares redeemed | | | 51,782 | |
Trustees’ fees and expenses payable to affiliates | | | 24,900 | |
Dividend disbursing and transfer agent fees and expenses payable to affiliates | | | 16,147 | |
Accounting and administration expenses payable to affiliates | | | 7,483 | |
Legal fees payable to affiliates | | | 3,920 | |
Reports and statements to shareholders expenses payable to affiliates | | | 1,219 | |
| | | | |
Total liabilities | | | 7,178,793 | |
| | | | |
Total Net Assets | | $ | 2,547,871,193 | |
| | | | |
| |
Net Assets Consist of: | | | | |
Paid-in capital | | $ | 2,461,637,714 | |
Total distributable earnings (loss) | | | 86,233,479 | |
| | | | |
Total Net Assets | | $ | 2,547,871,193 | |
| | | | |
Diversified Income Series-26
Delaware VIP® Trust — Delaware VIP Diversified Income Series
Statement of assets and liabilities (continued)
| | | | |
Net Asset Value: | | | | |
Standard Class: | | | | |
Net assets | | $ | 348,696,781 | |
Shares of beneficial interest outstanding, unlimited authorization, no par | | | 32,553,526 | |
Net asset value per share | | $ | 10.71 | |
| |
Service Class: | | | | |
Net assets | | $ | 2,199,174,412 | |
Shares of beneficial interest outstanding, unlimited authorization, no par | | | 206,946,912 | |
Net asset value per share | | $ | 10.63 | |
| |
1Investments, at cost | | $ | 2,484,646,803 | |
2Foreign currencies, at cost | | | 227,751 | |
See accompanying notes, which are an integral part of the financial statements.
Diversified Income Series-27
Delaware VIP® Trust —
Delaware VIP Diversified Income Series
Statement of operations
Year ended December 31, 2019
| | | | |
Investment Income: | | | | |
Interest | | $ | 85,360,411 | |
Dividends | | | 1,577,145 | |
Foreign tax withheld | | | (6,438 | ) |
| | | | |
| | | 86,931,118 | |
| | | | |
Expenses: | | | | |
Management fees | | | 14,249,021 | |
Distribution expenses – Service Class | | | 6,372,347 | |
Accounting and administration expenses | | | 465,481 | |
Reports and statements to shareholders expenses | | | 368,946 | |
Dividend disbursing and transfer agent fees and expenses | | | 204,498 | |
Trustees’ fees and expenses | | | 144,936 | |
Legal fees | | | 113,945 | |
Custodian fees | | | 94,958 | |
Audit and tax fees | | | 54,853 | |
Registration fees | | | 147 | |
Other | | | 178,513 | |
| | | | |
| | | 22,247,645 | |
Less expenses waived | | | (606,047 | ) |
Less expenses paid indirectly | | | (61,217 | ) |
| | | | |
Total operating expenses | | | 21,580,381 | |
| | | | |
Net Investment Income | | | 65,350,737 | |
| | | | |
| |
Net Realized and Unrealized Gain (Loss): | | | | |
Net realized gain (loss) on: | | | | |
Investments*1 | | | 59,711,630 | |
Foreign currencies | | | (5,798,186 | ) |
Foreign currency exchange contracts | | | (133,391 | ) |
Futures contracts | | | 28,937,449 | |
Options purchased | | | (348,165 | ) |
Swap contracts | | | 1,541,840 | |
| | | | |
Net realized gain | | | 83,911,177 | |
| | | | |
Net change in unrealized appreciation (depreciation) of: | | | | |
Investments | | | 101,735,968 | |
Foreign currencies | | | 28,968 | |
Foreign currency exchange contracts | | | (235,266 | ) |
Futures contracts | | | (16,917,884 | ) |
Swap contracts | | | 521,333 | |
| | | | |
Net change in unrealized appreciation (depreciation) | | | 85,133,119 | |
| | | | |
Net Realized and Unrealized Gain | | | 169,044,296 | |
| | | | |
| |
Net Increase in Net Assets Resulting from Operations | | $ | 234,395,033 | |
| | | | |
*Includes $3,045,916 related to the General Motors term loan litigation. See Note 13 in “Notes to financial statements.”
| 1Includes | $97,784 capital gains taxes paid. |
Delaware VIP Trust —
Delaware VIP Diversified Income Series
Statements of changes in net assets
| | | | | | | | |
| | | Year ended | |
| | | 12/31/19 | | | 12/31/18 | |
Increase (Decrease) in Net Assets from Operations: | | | | | | | | |
Net investment income | | $ | 65,350,737 | | | $ | 77,467,662 | |
Net realized gain (loss) | | | 83,911,177 | | | | (68,248,680 | ) |
Net change in unrealized appreciation (depreciation) | | | 85,133,119 | | | | (68,200,134 | ) |
| | | | | | | | |
Net increase (decrease) in net assets resulting from operations | | | 234,395,033 | | | | (58,981,152 | ) |
| | | | | | | | |
| | |
Dividends and Distributions to Shareholders from: | | | | | | | | |
Distributable earnings: | | | | | | | | |
Standard Class | | | (9,363,664 | ) | | | (10,363,469 | ) |
Service Class | | | (55,710,819 | ) | | | (64,115,915 | ) |
| | | | | | | | |
| | | (65,074,483 | ) | | | (74,479,384 | ) |
| | | | | | | | |
| |
Capital Share Transactions: | | | | | |
Proceeds from shares sold: | | | | | | | | |
Standard Class | | | 37,866,692 | | | | 26,765,650 | |
Service Class | | | 127,564,154 | | | | 104,428,900 | |
Net asset value of shares issued upon reinvestment of dividends and distributions: | | | | | | | | |
Standard Class | | | 9,363,664 | | | | 10,363,469 | |
Service Class | | | 55,710,819 | | | | 64,115,915 | |
| | | | | | | | |
| | | 230,505,329 | | | | 205,673,934 | |
| | | | | | | | |
Cost of shares redeemed: | | | | | | | | |
Standard Class | | | (44,539,571 | ) | | | (29,938,183 | ) |
Service Class | | | (164,435,773 | ) | | | (203,694,779 | ) |
| | | | | | | | |
| | | (208,975,344 | ) | | | (233,632,962 | ) |
| | | | | | | | |
Increase (Decrease) in net assets derived from capital share transactions | | | 21,529,985 | | | | (27,959,028 | ) |
| | | | | | | | |
Net Increase (Decrease) in Net Assets | | | 190,850,535 | | | | (161,419,564 | ) |
| | |
Net Assets: | | | | | | | | |
Beginning of year | | | 2,357,020,658 | | | | 2,518,440,222 | |
| | | | | | | | |
End of year | | $ | 2,547,871,193 | | | $ | 2,357,020,658 | |
| | | | | | | | |
See accompanying notes, which are an integral part of the financial statements.
Diversified Income Series-28
Delaware VIP® Trust — Delaware VIP Diversified Income Series
Financial highlights
Selected data for each share of the Series outstanding throughout each period were as follows:
| | | | | | | | | | | | | | | | | | | | |
| | | Delaware VIP Diversified Income Series Standard Class
Year ended | |
| | | 12/31/19 | | | 12/31/18 | | | 12/31/17 | | | 12/31/16 | | | 12/31/15 | |
Net asset value, beginning of period | | $ | 9.99 | | | $ | 10.54 | | | $ | 10.29 | | | $ | 10.29 | | | $ | 10.84 | |
| | | | | |
Income (loss) from investment operations: | | | | | | | | | | | | | | | | | | | | |
Net investment income1 | | | 0.31 | | | | 0.34 | | | | 0.34 | | | | 0.27 | | | | 0.35 | |
Net realized and unrealized gain (loss) | | | 0.71 | | | | (0.56 | ) | | | 0.19 | | | | 0.09 | | | | (0.45 | ) |
| | | | | | | | | | | | | | | | | | | | |
Total from investment operations | | | 1.02 | | | | (0.22 | ) | | | 0.53 | | | | 0.36 | | | | (0.10 | ) |
| | | | | | | | | | | | | | | | | | | | |
| | | | | |
Less dividends and distributions from: | | | | | | | | | | | | | | | | | | | | |
Net investment income | | | (0.30 | ) | | | (0.33 | ) | | | (0.28 | ) | | | (0.36 | ) | | | (0.33 | ) |
Net realized gain | | | — | | | | — | | | | — | | | | — | | | | (0.12 | ) |
| | | | | | | | | | | | | | | | | | | | |
Total dividends and distributions | | | (0.30 | ) | | | (0.33 | ) | | | (0.28 | ) | | | (0.36 | ) | | | (0.45 | ) |
| | | | | | | | | | | | | | | | | | | | |
| | | | | |
Net asset value, end of period | | $ | 10.71 | | | $ | 9.99 | | | $ | 10.54 | | | $ | 10.29 | | | $ | 10.29 | |
| | | | | | | | | | | | | | | | | | | | |
| | | | | |
Total return2 | | | 10.43%3,4 | | | | (2.12% | ) | | | 5.22% | | | | 3.52% | | | | (1.08% | ) |
| | | | | |
Ratios and supplemental data: | | | | | | | | | | | | | | | | | | | | |
Net assets, end of period (000 omitted) | | | $348,697 | | | | $323,184 | | | | $333,226 | | | | $322,535 | | | | $339,023 | |
Ratio of expenses to average net assets5 | | | 0.62% | | | | 0.65% | | | | 0.66% | | | | 0.67% | | | | 0.67% | |
Ratio of expenses to average net assets prior to fees waived5 | | | 0.64% | | | | 0.65% | | | | 0.66% | | | | 0.67% | | | | 0.67% | |
Ratio of net investment income to average net assets | | | 2.92% | | | | 3.38% | | | | 3.22% | | | | 2.63% | | | | 3.29% | |
Ratio of net investment income to average net assets prior to fees waived | | | 2.90% | | | | 3.38% | | | | 3.22% | | | | 2.63% | | | | 3.29% | |
Portfolio turnover | | | 171% | | | | 143% | | | | 145% | | | | 247% | | | | 250% | |
| 1 | The average shares outstanding method has been applied for per share information. |
| 2 | Total return is based on the change in net asset value of a share during the period and assumes reinvestment of dividends and distributions at net asset value. Total return does not include fees, charges, or expenses imposed by the variable annuity and life insurance contracts for which Delaware VIP Trust serves as an underlying investment vehicle. |
| 3 | General Motors term loan litigation were included in total return. If excluded, the impact on the total return would be 0.13% lower. See Note 13 in “Notes to financial statements.” |
| 4 | Total return during the period reflects a waiver by the manager and/or distributor. Performance would have been lower had the waiver not been in effect. |
| 5 | Expense ratios do not include expenses of the Underlying Funds in which the Series invests. |
See accompanying notes, which are an integral part of the financial statements.
Diversified Income Series-29
Delaware VIP® Diversified Income Series
Financial highlights (continued)
Selected data for each share of the Series outstanding throughout each period were as follows:
| | | | | | | | | | | | | | | | | | | | |
| | | Delaware VIP Diversified Income Series Service Class Year ended | |
| | | 12/31/19 | | | 12/31/18 | | | 12/31/17 | | | 12/31/16 | | | 12/31/15 | |
Net asset value, beginning of period | | $ | 9.92 | | | $ | 10.46 | | | $ | 10.22 | | | $ | 10.22 | | | $ | 10.77 | |
| | | | | |
Income (loss) from investment operations: | | | | | | | | | | | | | | | | | | | | |
Net investment income1 | | | 0.27 | | | | 0.31 | | | | 0.31 | | | | 0.25 | | | | 0.32 | |
Net realized and unrealized gain (loss) | | | 0.71 | | | | (0.55 | ) | | | 0.18 | | | | 0.08 | | | | (0.45 | ) |
| | | | | | | | | | | | | | | | | | | | |
Total from investment operations | | | 0.98 | | | | (0.24 | ) | | | 0.49 | | | | 0.33 | | | | (0.13 | ) |
| | | | | | | | | | | | | | | | | | | | |
| | | | | |
Less dividends and distributions from: | | | | | | | | | | | | | | | | | | | | |
Net investment income | | | (0.27 | ) | | | (0.30 | ) | | | (0.25 | ) | | | (0.33 | ) | | | (0.30 | ) |
Net realized gain | | | — | | | | — | | | | — | | | | — | | | | (0.12 | ) |
| | | | | | | | | | | | | | | | | | | | |
Total dividends and distributions | | | (0.27 | ) | | | (0.30 | ) | | | (0.25 | ) | | | (0.33 | ) | | | (0.42 | ) |
| | | | | | | | | | | | | | | | | | | | |
| | | | | |
Net asset value, end of period | | $ | 10.63 | | | $ | 9.92 | | | $ | 10.46 | | | $ | 10.22 | | | $ | 10.22 | |
| | | | | | | | | | | | | | | | | | | | |
| | | | | |
Total return2 | | | 10.08%3 | | | | (2.29% | ) | | | 4.89% | | | | 3.28% | | | | (1.34% | ) |
| | | | | |
Ratios and supplemental data: | | | | | | | | | | | | | | | | | | | | |
Net assets, end of period (000 omitted) | | $ | 2,199,174 | | | $ | 2,033,837 | | | $ | 2,185,214 | | | $ | 1,914,341 | | | $ | 1,831,388 | |
Ratio of expenses to average net assets4 | | | 0.92% | | | | 0.93% | | | | 0.91% | | | | 0.92% | | | | 0.92% | |
Ratio of expenses to average net assets prior to fees waived4 | | | 0.94% | | | | 0.95% | | | | 0.96% | | | | 0.97% | | | | 0.97% | |
Ratio of net investment income to average net assets | | | 2.62% | | | | 3.10% | | | | 2.97% | | | | 2.38% | | | | 3.04% | |
Ratio of net investment income to average net assets prior to fees waived | | | 2.60% | | | | 3.08% | | | | 2.92% | | | | 2.33% | | | | 2.99% | |
Portfolio turnover | | | 171% | | | | 143% | | | | 145% | | | | 247% | | | | 250% | |
| 1 | The average shares outstanding method has been applied for per share information. |
| 2 | Total return is based on the change in net asset value of a share during the period and assumes reinvestment of dividends and distributions at net asset value. Total return during all of the periods shown reflects waivers by the manager and/or distributor. Performance would have been lower had the waivers not been in effect. Total return does not include fees, charges, or expenses imposed by the variable annuity and life insurance contracts for which Delaware VIP Trust serves as an underlying investment vehicle. |
| 3 | General Motors term loan litigation were included in total return. If excluded, the impact on the total return would be 0.13% lower. See Note 13 in “Notes to financial statements.” |
| 4 | Expense ratios do not include expenses of the Underlying Funds in which the Series invests. |
See accompanying notes, which are an integral part of the financial statements.
Diversified Income Series-30
Delaware VIP® Trust — Delaware VIP Diversified Income Series
Notes to financial statements
December 31, 2019
Delaware VIP Trust (Trust) is organized as a Delaware statutory trust and offers 22 series, each of which is treated as a separate entity for certain matters under the Investment Company Act of 1940, as amended (1940 Act). These financial statements and the related notes pertain to Delaware VIP Diversified Income Series (Series). The Trust is anopen-end investment company. The Series is considered diversified under the 1940 Act and offers Standard Class and Service Class shares. The Standard Class shares do not carry a distribution and service(12b-1) fee and the Service Class shares carry a12b-1 fee. The shares of the Series are sold only to separate accounts of life insurance companies.
1. Significant Accounting Policies
The Series follows accounting and reporting guidance under Financial Accounting Standards Board (FASB) Accounting Standards Codification Topic 946, Financial Services - Investment Companies. The following accounting policies are in accordance with US generally accepted accounting principles (US GAAP) and are consistently followed by the Series.
Security Valuation — Equity securities, except those traded on the Nasdaq Stock Market LLC (Nasdaq), are valued at the last quoted sales price as of the time of the regular close of the New York Stock Exchange on the valuation date. Equity securities traded on the Nasdaq are valued in accordance with the Nasdaq Official Closing Price, which may not be the last sales price. If, on a particular day, an equity security does not trade, the mean between the bid and ask prices will be used, which approximates fair value.Open-end investment companies are valued at their published net asset value (NAV). US government and agency securities are valued at the mean between the bid and ask prices, which approximates fair value. Other debt securities, credit default swap contracts and interest rate swap contracts are valued based upon valuations provided by an independent pricing service or broker/counterparty and reviewed by management. To the extent current market prices are not available, the pricing service may take into account developments related to the specific security, as well as transactions in comparable securities. Valuations for fixed income securities utilize matrix systems, which reflect such factors as security prices, yields, maturities, and ratings, and are supplemented by dealer and exchange quotations. For asset-backed securities, collateralized mortgage obligations, commercial mortgage securities, and US government agency mortgage securities, pricing vendors utilize matrix pricing which considers prepayment speed, attributes of the collateral, yield or price of bonds of comparable quality, coupon, maturity, and type as well as broker/dealer-supplied prices. Swap prices are derived using daily swap curves and models that incorporate a number of market data factors, such as discounted cash flows, trades, and values of the underlying reference instruments. Foreign currency exchange contracts and foreign cross currency exchange contracts are valued at the mean between the bid and ask prices, which approximates fair value. Interpolated values are derived when the settlement date of the contract is an interim date for which quotations are not available. Futures contracts and options on futures contracts are valued at the daily quoted settlement prices. Exchange-traded options are valued at the last reported sale price or, if no sales are reported, at the mean between the last reported bid and ask prices, which approximates fair value. Investments in repurchase agreements are generally valued at par, which approximates fair value, each business day. Generally, other securities and assets for which market quotations are not readily available are valued at fair value as determined in good faith under the direction of the Trust’s Board of Trustees (Board). In determining whether market quotations are readily available or fair valuation will be used, various factors will be taken into consideration, such as market closures or suspension of trading in a security. Restricted securities are valued at fair value using methods approved by the Board.
Federal and Foreign Income Taxes — No provision for federal income taxes has been made as the Series intends to continue to qualify for federal income tax purposes as a regulated investment company under Subchapter M of the Internal Revenue Code of 1986, as amended, and make the requisite distributions to shareholders. The Series evaluates tax positions taken or expected to be taken in the course of preparing the Series’ tax returns to determine whether the tax positions are“more-likely-than-not” of being sustained by the applicable tax authority. Tax positions not deemed to meet the“more-likely-than-not” threshold are recorded as a tax benefit or expense in the current year. Management has analyzed the Series’ tax positions taken or expected to be taken on the Series’ federal income tax returns through the year ended Dec. 31, 2019 and for all open tax years (years ended Dec. 31, 2016–Dec. 31, 2018), and has concluded that no provision for federal income tax is required in the Series’ financial statements. In regard to foreign taxes only, the Series has open tax years in certain foreign countries in which it invests that may date back to the inception of the Series. If applicable, the Series recognizes interest accrued on unrecognized tax benefits in interest expense and penalties in “Other expenses” on the “Statement of operations.” During the year ended Dec. 31, 2019, the Series did not incur any interest or tax penalties.
Class Accounting — Investment income, common expenses, and realized and unrealized gain (loss) on investments are allocated to the classes of the Series on the basis of daily net assets of each class. Distribution expenses relating to a specific class are charged directly to that class.
Repurchase Agreements — The Series may purchase certain US government securities subject to the counterparty’s agreement to repurchase them at an agreed upon date and price. The counterparty will be required on a daily basis to maintain the value of the collateral subject to the agreement at not less than the repurchase price (including accrued interest). The agreements are conditioned upon the collateral being deposited under the Federal Reserve book-entry system with the Series’ custodian or a third-partysub-custodian. In the event of default or bankruptcy by the other party to the agreement, retention of the collateral may be subject to legal proceedings. At Dec. 31, 2019, the Series held no investments in repurchase agreements.
To Be Announced Trades (TBA) — The Series may contract to purchase or sell securities for a fixed price at a transaction date beyond the customary settlement period (examples: when issued, delayed delivery, forward commitment, or TBA transactions) consistent with the Series’ ability to manage its
Diversified Income Series-31
Delaware VIP® Diversified Income Series
Notes to financial statements (continued)
1. Significant Accounting Policies (continued)
investment portfolio and meet redemption requests. These transactions involve a commitment by the Series to purchase or deliver securities for a predetermined price or yield with payment and delivery taking place more than three days in the future, or after a period longer than the customary settlement period for that type of security. No interest will be earned by the Series on such purchases until the securities are delivered or the transaction is completed; however, the market value may change prior to delivery.
Foreign Currency Transactions — Transactions denominated in foreign currencies are recorded at the prevailing exchange rates on the valuation date in accordance with the Series’ prospectus. The value of all assets and liabilities denominated in foreign currencies is translated daily into US dollars at the exchange rate of such currencies against the US dollar. Transaction gains or losses resulting from changes in exchange rates during the reporting period or upon settlement of the foreign currency transaction are reported in operations for the current period. The Series generally bifurcates that portion of realized gains and losses on investments in debt securities which is due to changes in foreign exchange rates from that which is due to changes in market prices of debt securities. That portion of gains (losses), attributable to changes in foreign exchange rates, is included on the “Statement of operations” under “Net realized gain (loss) on foreign currencies.” The Series reports certain foreign currency related transactions as components of realized gains (losses) for financial reporting purposes, whereas such components are treated as ordinary income (loss) for federal income tax purposes.
Use of Estimates —The preparation of financial statements in conformity with US GAAP requires management to make estimates and assumptions that affect the fair value of investments, the reported amounts of assets and liabilities and disclosure of contingent assets and liabilities at the date of the financial statements, and the reported amounts of revenues and expenses during the reporting period. Actual results could differ from those estimates and the differences could be material.
Other —Expenses directly attributable to the Series are charged directly to the Series. Other expenses common to various funds within the Delaware Funds® by Macquarie (Delaware Funds) are generally allocated among such funds on the basis of average net assets. Management fees and certain other expenses are paid monthly. Security transactions are recorded on the date the securities are purchased or sold (trade date) for financial reporting purposes. Costs used in calculating realized gains and losses on the sale of investment securities are those of the specific securities sold. Dividend income is recorded on theex-dividend date and interest income is recorded on the accrual basis. Discounts and premiums are accreted and amortized using the effective interest method. Realized gains (losses) on paydowns of asset- and mortgage-backed securities are classified as interest income. Withholding taxes and reclaims on foreign interest have been recorded in accordance with the Series’ understanding of the applicable country’s tax rules and rates. The Series may pay foreign capital gains taxes on certain foreign securities held, which are reported as components of realized losses for financial reporting purposes, whereas such components are treated as ordinary loss for federal income tax purposes. The Series declares and pays dividends from net investment income and distributions from net realized gain on investments, if any, following the close of the fiscal year. The Series may distribute more frequently, if necessary for tax purposes. Dividends and distributions, if any, are recorded on theex-dividend date.
The Series receives earnings credits from its custodian when positive cash balances are maintained, which may be used to offset custody fees. The expenses paid under this arrangement are included on the “Statement of operations” under “Custodian fees” with the corresponding expenses offset included under “Less expenses paid indirectly.” For the year ended Dec. 31, 2019, the Series earned $61,216 under this arrangement.
The Series receives earnings credits from its transfer agent when positive cash balances are maintained, which may be used to offset transfer agent fees. If the amount earned is greater than $1, the expenses paid under this arrangement are included on the “Statement of operations” under “Dividend disbursing and transfer agent fees and expenses” with the corresponding expenses offset included under “Less expenses paid indirectly.” For the year ended Dec. 31, 2019, the Series earned $1 under this arrangement.
2. Investment Management, Administration Agreements, and Other Transactions with Affiliates
In accordance with the terms of its investment management agreement, the Series pays Delaware Management Company (DMC), a series of Macquarie Investment Management Business Trust and the investment manager, an annual fee which is calculated daily and paid monthly at the rates of 0.65% on the first $500 million of average daily net assets of the Series, 0.60% on the next $500 million, 0.55% on the next $1.5 billion, and 0.50% on average daily net assets in excess of $2.5 billion.
Effective April 30, 2019, DMC has contractually agreed to waive that portion, if any, of its management fee and reimburse the Series to the extent necessary to ensure that annual operating expenses (excluding any12b-1 fees, acquired fund fees and expenses, taxes, interest, short sale dividend and interest expenses, brokerage fees, certain insurance costs, and nonroutine expenses or costs, including, but not limited to, those relating to reorganizations, litigation, conducting shareholder meetings, and liquidations), do not exceed 0.60% of the Series’ average daily net assets from April 30, 2019 through Dec. 31, 2019.* Prior to April 30, 2019, the waiver was 0.67% of the Series’ average daily net assets. These expense waivers and reimbursements may only be terminated by agreement of DMC and the Series. The waivers and reimbursements are accrued daily and received monthly.
Diversified Income Series-32
Delaware VIP® Diversified Income Series
Notes to financial statements (continued)
Effective May 30, 2019, DMC may seek investment advice and recommendations from its affiliates: Macquarie Investment Management Europe Limited, Macquarie Investment Management Austria Kapitalanlage AG, and Macquarie Investment Management Global Limited (together, the “AffiliatedSub-Advisors”). The Manager may also permit these AffiliatedSub-Advisors to execute Fund security trades on behalf of the Manager and exercise investment discretion for securities in certain markets where DMC believes it will be beneficial to utilize an AffiliatedSub-Advisor’s specialized market knowledge. Although the AffiliatedSub-Advisors serve assub-advisors, DMC has ultimate responsibility for all investment advisory services. For these services, DMC, not the Series, pays each AffiliatedSub-Advisor a portion of its investment management fee.
Delaware Investments Fund Services Company (DIFSC), an affiliate of DMC, provides fund accounting and financial administrative oversight services to the Series. For these services, DIFSC’s fees are calculated daily and paid monthly based on the aggregate daily net assets of all funds within the Delaware Funds at the following annual rates: 0.00475% of the first $35 billion; 0.0040% of the next $10 billion; and 0.0025% of aggregate average daily net assets in excess of $45 billion (Total Fee). Each fund in the Delaware Funds pays a minimum of $4,000, which, in aggregate, is subtracted from the Total Fee. Each fund then pays its portion of the remainder of the Total Fee on a relative NAV basis. This amount is included on the “Statement of operations” under “Accounting and administration expenses.” For the year ended Dec. 31, 2019, the Series was charged $93,889 for these services.
DIFSC is also the transfer agent and dividend disbursing agent of the Series. For these services, DIFSC’s fees are calculated daily and paid monthly at the annual rate of 0.0075% of the Series’ average daily net assets. This amount is included on the “Statement of operations” under “Dividend disbursing and transfer agent fees and expenses.” For the year ended Dec. 31, 2019, the Series was charged $184,111 for these services. Pursuant to asub-transfer agency agreement between DIFSC and BNY Mellon Investment Servicing (US) Inc. (BNYMIS), BNYMIS provides certainsub-transfer agency services to the Series.Sub-transfer agency fees are paid by the Series and are also included on the “Statement of operations” under “Dividend disbursing and transfer agent fees and expenses.” The fees that are calculated daily and paid as invoices are received on a monthly or quarterly basis.
Pursuant to a distribution agreement and distribution plan, the Series pays DDLP, the distributor and an affiliate of DMC, an annual12b-1 fee of 0.30% of the average daily net assets of the Service Class shares. The fees are calculated daily and paid monthly. Standard Class shares do not pay12b-1 fees.
As provided in the investment management agreement, the Series bears a portion of the cost of certain resources shared with DMC, including the cost of internal personnel of DMC and/or its affiliates that provide legal, tax, and regulatory reporting services to the Series. For the year ended Dec. 31, 2019, the Series was charged $69,527 for internal legal, tax, and regulatory reporting services provided by DMC and/or its affiliates’ employees. This amount is included on the “Statement of operations” under “Legal fees.”
Trustees’ fees include expenses accrued by the Series for each Trustee’s retainer and meeting fees. Certain officers of DMC, DIFSC, and DDLP are officers and/or Trustees of the Trust. These officers and Trustees are paid no compensation by the Series.
In addition to the management fees and other expenses of the Series, the Series indirectly bears the investment management fees and other expenses of the investment companies (Underlying Funds) in which it invests. The amount of these fees and expenses incurred indirectly by the Series will vary based upon the expense and fee levels of the Underlying Funds and the number of shares that are owned of the Underlying Funds at different times.
Cross trades for the year ended Dec. 31, 2019 were executed by the Series pursuant to procedures adopted by the Board designed to ensure compliance with Rule17a-7 under the 1940 Act. Cross trading is the buying or selling of portfolio securities between fund of investment companies, or between a series of an investment company and another entity, that are or could be considered affiliates by virtue of having a common investment advisor (or affiliated investment advisors), common directors/trustees and/or common officers. At its regularly scheduled meetings, the Board reviews such transactions for compliance with the procedures adopted by the Board. There were no securities purchases under Rule17a-7 during the year ended Dec. 31, 2019. Pursuant to these procedures, for the year ended Dec. 31, 2019, the Series engaged in securities sales of $1,913,728, which resulted in net realized losses of $25,813.
*The aggregate contractual waiver period covering this report is from April 30, 2018 through April 30, 2020.
3. Investments
For the year ended Dec. 31, 2019, the Series made purchases and sales of investment securities other than short-term investments as follows:
| | | | |
Purchases other than US government securities | | $ | 1,251,613,034 | |
Purchases of US government securities | | | 2,765,774,242 | |
Sales other than US government securities | | | 1,660,346,663 | |
Sales of US government securities | | | 2,401,585,790 | |
Diversified Income Series-33
Delaware VIP® Diversified Income Series
Notes to financial statements (continued)
3. Investments (continued)
The tax cost of investments and derivatives includes adjustments to net unrealized appreciation (depreciation) which may not necessarily be final tax cost basis adjustments, but approximate the tax basis unrealized gains and losses that may be realized and distributed to shareholders. At Dec. 31, 2019, the cost and unrealized appreciation (depreciation) of investments and derivatives for federal income tax purposes for the Series were as follows:
| | | | | | |
| Cost of | | Aggregate
Unrealized | | Aggregate
Unrealized | | Net Unrealized |
| Investments | | Appreciation of | | Depreciation of | | Appreciation of |
and Derivatives | | Investments | | Investments | | Investments |
$2,483,847,974 | | $58,036,925 | | $(16,054,442) | | $41,982,483 |
US GAAP defines fair value as the price that the Series would receive to sell an asset or pay to transfer a liability in an orderly transaction between market participants at the measurement date under current market conditions. A three-level hierarchy for fair value measurements has been established based upon the transparency of inputs to the valuation of an asset or liability. Inputs may be observable or unobservable and refer broadly to the assumptions that market participants would use in pricing the asset or liability. Observable inputs reflect the assumptions market participants would use in pricing the asset or liability based on market data obtained from sources independent of the reporting entity. Unobservable inputs reflect the reporting entity’s own assumptions about the assumptions that market participants would use in pricing the asset or liability based on the best information available under the circumstances. The Series’ investment in its entirety is assigned a level based upon the observability of the inputs which are significant to the overall valuation. The three-level hierarchy of inputs is summarized below.
| | | | |
| Level 1 | | – | | Inputs are quoted prices in active markets for identical investments. (Examples: equity securities,open-end investment companies, futures contracts, and exchange-traded options contracts) |
| Level 2 | | – | | Other observable inputs, including, but not limited to: quoted prices for similar assets or liabilities in markets that are active, quoted prices for identical or similar assets or liabilities in markets that are not active, inputs other than quoted prices that are observable for the assets or liabilities (such as interest rates, yield curves, volatilities, prepayment speeds, loss severities, credit risks, and default rates) or other market-corroborated inputs. (Examples: debt securities, government securities, swap contracts, foreign currency exchange contracts, foreign securities utilizing international fair value pricing, broker-quoted securities, and fair valued securities) |
| Level 3 | | – | | Significant unobservable inputs, including the Series’ own assumptions used to determine the fair value of investments. (Examples: broker-quoted securities and fair valued securities) |
Level 3 investments are valued using significant unobservable inputs. The Series may also use an income-based valuation approach in which the anticipated future cash flows of the investment are discounted to calculate fair value. Discounts may also be applied due to the nature or duration of any restrictions on the disposition of the investments. Valuations may also be based upon current market prices of securities that are comparable in coupon, rating, maturity, and industry. The derived value of a Level 3 investment may not represent the value which is received upon disposition and this could impact the results of operations.
Diversified Income Series-34
Delaware VIP® Diversified Income Series
Notes to financial statements (continued)
3. Investments (continued)
The following table summarizes the valuation of the Series’ investments by fair value hierarchy levels as of Dec. 31, 2019:
| | | | | | | | | | | | | | | | | | | | |
| | | Level 1 | | Level 2 | | Level 3 | | Total |
Securities | | | | | | | | | | | | | | | | | | | | |
Assets: | | | | | | | | | | | | | | | | | | | | |
Agency, Asset- & Mortgage-Backed Securities | | | $ | — | | | | $ | 837,816,560 | | | | | $— | | | | $ | 837,816,560 | |
Collateralized Debt Obligations | | | | — | | | | | 48,685,566 | | | | | — | | | | | 48,685,566 | |
Corporate Debt | | | | — | | | | | 932,260,089 | | | | | — | | | | | 932,260,089 | |
Foreign Debt | | | | — | | | | | 46,177,777 | | | | | — | | | | | 46,177,777 | |
Municipal Bonds | | | | — | | | | | 1,887,940 | | | | | — | | | | | 1,887,940 | |
Loan Agreements | | | | — | | | | | 99,008,220 | | | | | — | | | | | 99,008,220 | |
US Treasury Obligations | | | | — | | | | | 458,894,707 | | | | | — | | | | | 458,894,707 | |
Common Stock | | | | — | | | | | — | | | | | — | | | | | — | |
Preferred Stock | | | | — | | | | | 259,206 | | | | | — | | | | | 259,206 | |
Short-Term Investments1 | | | | 54,554,290 | | | | | 49,094,594 | | | | | — | | | | | 103,648,884 | |
| | | | | | | | | | | | | | | | | | | | |
Total Value of Securities | | | $ | 54,554,290 | | | | $ | 2,474,084,659 | | | | | $— | | | | $ | 2,528,638,949 | |
| | | | | | | | | | | | | | | | | | | | |
Derivatives:2 | | | | | | | | | | | | | | | | | | | | |
Liabilities: | | | | | | | | | | | | | | | | | | | | |
Futures Contracts | | | | (2,808,492) | | | | | — | | | | | — | | | | | (2,808,492 | ) |
1Security type is valued across multiple levels. Level 1 investments represent exchange-traded investments, Level 2 investments represent investments with observable inputs or matrix-priced investments, and Level 3 investments represent investments without observable inputs. The amounts attributed to Level 1 investments, Level 2 investments, and Level 3 investments represent the following percentages of the total value of these security types:
| | | | | | | | |
| | | Level 1 | | Level 2 | | Level 3 | | Total |
Short-Term Investments | | 52.63% | | 47.37% | | — | | 100.00% |
2Futures Contracts are valued at the unrealized appreciation (depreciation) on the instrument at the year end.
The securities that have been valued at zero on the “Schedule of investments” are considered to be Level 3 investments in this table.
During the year ended Dec. 31, 2019, there were no transfers between Level 1 investments, Level 2 investments, or Level 3 investments that had a significant impact to the Series. The Series’ policy is to recognize transfers between levels based on fair value at the beginning of the reporting period.
A reconciliation of Level 3 investments is presented when the Series has a significant amount of Level 3 investments at the beginning, interim, or end of the year in relation to the Series’ net assets. Management has determined not to provide a reconciliation of Level 3 investments as the Level 3 investments were not considered significant to the Series’ net assets at the beginning, interim, or end of the year. Management has determined not to provide additional disclosure on Level 3 inputs since the Level 3 investments were not considered significant to the Series’ net assets at the end of the year.
4. Dividend and Distribution Information
Income and long-term capital gain distributions are determined in accordance with federal income tax regulations, which may differ from US GAAP. Additionally, distributions from net gains on foreign currency transactions and net short-term gains on sales of investment securities are treated as ordinary income for federal income tax purposes. The tax character of dividends and distributions paid during the years ended Dec. 31, 2019 and 2018 was as follows:
| | | | | | | | |
| | | Year ended | |
| | | 12/31/19 | | | 12/31/18 | |
Ordinary income | | $ | 65,074,483 | | | $ | 74,479,384 | |
Diversified Income Series-35
Delaware VIP® Diversified Income Series
Notes to financial statements (continued)
5. Components of Net Assets on a Tax Basis
As of Dec. 31, 2019, the components of net assets on a tax basis were as follows:
| | | | |
Shares of beneficial interest | | $ | 2,461,637,714 | |
Undistributed ordinary income | | | 63,357,096 | |
Capital loss carryforwards | | | (19,106,100 | ) |
Net unrealized appreciation on investments, foreign currencies, and derivatives | | | 41,982,483 | |
| | | | |
Net assets | | $ | 2,547,871,193 | |
| | | | |
The differences between book basis and tax basis components of net assets are primarily attributable to tax deferral of losses on wash sales,mark-to-market of futures contracts, CDS adjustment, market premium adjustment on debt instruments and straddle losses.
For federal income tax purposes, capital loss carryforwards may be carried forward and applied against future capital gains. At Dec. 31, 2019, the Fund utilized $65,477,334 of capital loss carryforwards.
At Dec. 31, 2019, capital loss carryforwards available to offset future realized gains were as follows:
| | | | | | | | | | |
| | | Loss carryforward character | |
| | | | | No Expiration | | | | |
| | | Short-term | | Long-term | | | Total | |
| | $— | | | $19,106,100 | | | $ | 19,106,100 | |
6. Capital Shares
Transactions in capital shares were as follows:
| | | | | | | | |
| | | Year ended | |
| | | 12/31/19 | | | 12/31/18 | |
Shares sold: | | | | | | | | |
Standard Class | | | 3,615,992 | | | | 2,642,484 | |
Service Class | | | 12,272,389 | | | | 10,279,208 | |
| | |
Shares issued upon reinvestment of dividends and distributions: | | | | | | | | |
Standard Class | | | 927,095 | | | | 1,031,191 | |
Service Class | | | 5,548,886 | | | | 6,418,010 | |
| | | | | | | | |
| | | 22,364,362 | | | | 20,370,893 | |
| | | | | | | | |
Shares redeemed: | | | | | | | | |
Standard Class | | | (4,329,285 | ) | | | (2,963,149 | ) |
Service Class | | | (15,958,571 | ) | | | (20,497,216 | ) |
| | | | | | | | |
| | | (20,287,856 | ) | | | (23,460,365 | ) |
| | | | | | | | |
Net increase (decrease) | | | 2,076,506 | | | | (3,089,472 | ) |
| | | | | | | | |
7. Line of Credit
The Series, along with certain other funds in the Delaware Funds (Participants), was a participant in a $220,000,000 revolving line of credit intended to be used for temporary or emergency purposes as an additional source of liquidity to fund redemptions of investor shares. Under the agreement, the Participants were charged an annual commitment fee of 0.15%, which was allocated across the Participants based on a weighted average of the respective net assets of each Participant. The Participants were permitted to borrow up to a maximum ofone-third of their net assets under the agreement. Each Participant was individually, and not jointly, liable for its particular advances, if any, under the line of credit. The line of credit available under the agreement expired on Nov. 4, 2019.
On Nov. 4, 2019, the Participants entered into an amendment to the agreement for a $250,000,000 revolving line of credit. The revolving line of credit is to be used as described above and operates in substantially the same manner as the original agreement. The line of credit available under the agreement expires on Nov. 2, 2020.
The Series had no amounts outstanding as of Dec. 31, 2019, or at any time during the year then ended.
Diversified Income Series-36
Delaware VIP® Diversified Income Series
Notes to financial statements (continued)
8. Derivatives
US GAAP requires disclosures that enable investors to understand: (1) how and why an entity uses derivatives; (2) how they are accounted for; and (3) how they affect an entity’s results of operations and financial position.
Foreign Currency Exchange Contracts— The Series may enter into foreign currency exchange contracts and foreign cross currency exchange contracts as a way of managing foreign exchange rate risk. The Series may enter into these contracts to fix the US dollar value of a security that it has agreed to buy or sell for the period between the date the trade was entered into and the date the security is delivered and paid for. The Series may also use these contracts to hedge the US dollar value of securities it already owns that are denominated in foreign currencies. In addition, the Series may enter into these contracts to facilitate or expedite the settlement of portfolio transactions. The change in value is recorded as an unrealized gain or loss. When the contract is closed, a realized gain or loss is recorded equal to the difference between the value of the contract at the time it was opened and the value at the time it was closed.
The use of foreign currency exchange contracts and foreign cross currency exchange contracts does not eliminate fluctuations in the underlying prices of the securities, but does establish a rate of exchange that can be achieved in the future. Although foreign currency exchange contracts and foreign cross currency exchange contracts limit the risk of loss due to an unfavorable change in the value of the hedged currency, they also limit any potential gain that might result should the value of the currency change favorably. In addition, the Series could be exposed to risks if the counterparties to the contracts are unable to meet the terms of their contracts. The Series’ maximum risk of loss from counterparty credit risk is the value of its currency exchanged with the counterparty. The risk is generally mitigated by having a netting arrangement between the Series and the counterparty and by the posting of collateral by the counterparty to the Series to cover the Series’ exposure to the counterparty. No foreign currency exchange contracts were outstanding at Dec. 31, 2019.
During the year end Dec. 31, 2019, the Series entered into foreign currency exchange contracts to hedge the US dollar value of securities it already owns that are denominated in foreign currencies.
Futures Contracts— A futures contract is an agreement in which the writer (or seller) of the contract agrees to deliver to the buyer an amount of cash or securities equal to a specific dollar amount times the difference between the value of a specific security or index at the close of the last trading day of the contract and the price at which the agreement is made. The Series may use futures contracts in the normal course of pursuing its investment objective. The Series may invest in futures contracts to hedge its existing portfolio securities against fluctuations in value caused by changes in interest rates or market conditions. Upon entering into a futures contract, the Series deposits cash or pledges US government securities to a broker, equal to the minimum “initial margin” requirements of the exchange on which the contract is traded. Subsequent payments are received from the broker or paid to the broker each day, based on the daily fluctuation in the market value of the contract. These receipts or payments are known as “variation margin” and are recorded daily by the Series as unrealized gains or losses until the contracts are closed. When the contracts are closed, the Series records a realized gain or loss equal to the difference between the value of the contract at the time it was opened and the value at the time it was closed. Risks of entering into futures contracts include potential imperfect correlation between the futures contracts and the underlying securities and the possibility of an illiquid secondary market for these instruments. When investing in futures, there is reduced counterparty credit risk to the Series because futures are exchange-traded and the exchange’s clearinghouse, as counterparty to all exchange-traded futures, guarantees against default.
During the year ended Dec. 31, 2019, the Series entered into futures contracts to hedge the Series’ existing portfolio securities against fluctuations in value caused by changes in interest rates or market conditions and to facilitate investments in portfolio securities.
Options Contracts— The Series may enter into options contracts in the normal course of pursuing its investment objective. The Series may buy or write options contracts for any number of reasons, including without limitation: to manage the Series’ exposure to changes in securities prices caused by interest rates or market conditions and foreign currencies; as an efficient means of adjusting the Series’ overall exposure to certain markets; to protect the value of portfolio securities; and as a cash management tool. The Series may buy or write call or put options on securities, futures, swaps, swaptions, financial indices, and foreign currencies. When the Series buys an option, a premium is paid and an asset is recorded and adjusted on a daily basis to reflect the current market value of the option purchased. When the Series writes an option, a premium is received and a liability is recorded and adjusted on a daily basis to reflect the current market value of the option written. Premiums received from writing options that expire unexercised are treated by the Series on the expiration date as realized gains. The difference between the premium received and the amount paid on effecting a closing purchase transaction, including brokerage commissions, is treated as realized gain or loss. If a call option is exercised, the premium is added to the proceeds from the sale of the underlying security in determining whether the Series has a realized gain or loss. If a put option is exercised, the premium reduces the cost basis of the securities purchased by the Series. The Series, as writer of an option, bears the market risk of an unfavorable change in the price of the security underlying the written option. When writing options, the Series is subject to minimal counterparty risk because the counterparty is only obligated to pay premiums and does not bear the market risk of an unfavorable market change. No option contracts were outstanding at Dec. 31, 2019.
Diversified Income Series-37
Delaware VIP® Diversified Income Series
Notes to financial statements (continued)
8. Derivatives (continued)
During the year ended Dec. 31, 2019, the Series entered into option contracts to manage the Series’ exposure to changes in securities prices caused by interest rates or market conditions, to protect the value of portfolio securities, and to manage the Series’ exposure to changes in foreign currencies.
Swap Contracts— The Series may enter into interest rate swap contracts and CDS contracts in the normal course of pursuing its investment objective. The Series may invest in interest rate swap contracts to manage the Series’ sensitivity to interest rates or to hedge against changes in interest rates. The Series may enter into CDS contracts in order to hedge against a credit event, to enhance total return or to gain exposure to certain securities or markets. The Series will not be permitted to enter into any swap transactions unless, at the time of entering into such transactions, the unsecured long-term debt of the actual counterparty, combined with any credit enhancements, is rated at leastBBB- by Standard & Poor’s Financial Services LLC. (S&P) or Baa3 by Moody’s Investors Service, Inc. (Moody’s) or is determined to be of equivalent quality by DMC.
Interest Rate Swaps. An interest rate swap contract is an exchange of interest rates between counterparties. In one instance, an interest rate swap involves payments received by the Series from another party based on a variable or floating interest rate, in return for making payments based on a fixed interest rate. An interest rate swap can also work in reverse with the Series receiving payments based on a fixed interest rate and making payments based on a variable or floating interest rate. Interest rate swaps may be used to adjust the Series’ sensitivity to interest rates or to hedge against changes in interest rates. Periodic payments on such contracts are accrued daily and recorded as unrealized appreciation (depreciation) on swap contracts. Upon periodic payment (receipt) or termination of the contract, such amounts are recorded as realized gains or losses on swap contracts. The Series’ maximum risk of loss from counterparty credit risk is the discounted net value of the cash flows to be received from/paid to the counterparty over the interest rate swap contract’s remaining life, to the extent that the amount is positive. This risk is mitigated by (1) for bilateral swap contracts, having a netting arrangement between the Series and the counterparty and by the posting of collateral by the counterparty to the Series to cover the Series’ exposure to the counterparty and (2) for cleared swaps, trading these instruments through a central counterparty.
During the year ended Dec. 31, 2019, the Series did not enter into interest rate swap contracts.
Credit Default Swaps. A CDS contract is a risk-transfer instrument through which one party (purchaser of protection) transfers to another party (seller of protection) the financial risk of a credit event (as defined in the CDS agreement), as it relates to a particular reference security or basket of securities (such as an index). In exchange for the protection offered by the seller of protection, the purchaser of protection agrees to pay the seller of protection a periodic amount at a stated rate that is applied to the notional amount of the CDS contract. In addition, an upfront payment may be made or received by the Series in connection with an unwinding or assignment of a CDS contract. Upon the occurrence of a credit event, the seller of protection would pay the par (or other agreed-upon) value of the reference security (or basket of securities) to the counterparty. Credit events generally include, among others, bankruptcy, failure to pay, and obligation default.
During the year ended Dec. 31, 2019, the Series entered into CDS contracts as a seller of protection, as a hedge against credit events. Periodic payments (receipts) on such contracts are accrued daily and recorded as unrealized losses (gains) on swap contracts. Upon payment (receipt), such amounts are recorded as realized losses (gains) on swap contracts. Upfront payments made or received in connection with CDS contracts are amortized over the expected life of the CDS contracts as unrealized losses (gains) on swap contracts. The change in value of CDS contracts is recorded daily as unrealized appreciation or depreciation. A realized gain or loss is recorded upon a credit event (as defined in the CDS agreement) or the maturity or termination of the agreement. Initial margin and variation margin is posted to central counterparties for central cleared CDS basket trades, as determined by the applicable central counterparty.
CDS contracts may involve greater risks than if the Series had invested in the reference obligation directly. CDS contracts are subject to general market risk, liquidity risk, counterparty risk, and credit risk. The Series’ maximum risk of loss from counterparty credit risk, either as the seller of protection or the buyer of protection, is the fair value of the contract. This risk is mitigated by (1) for bilateral swap contracts, having a netting arrangement between the Series and the counterparty and by the posting of collateral by the counterparty to the Series to cover the Series’ exposure to the counterparty, and (2) for cleared swaps, trading these instruments through a central counterparty. No CDS contracts were outstanding at Dec. 31, 2019.
During the year ended Dec. 31, 2019, the Series entered into CDS contracts to hedge against credit events and to gain exposure to certain securities or markets.
Swaps Generally. For centrally cleared swaps, payments are received from the broker or paid to the broker each day, based on the daily fluctuation in the market value of the contract. These receipts or payments are known as “variation margin” and are recorded by the Series as unrealized gains or losses until the contracts are closed. When the contracts are closed, the Series records a realized gain or loss equal to the difference between the value of the contract at the time it was opened and the value at the time it was closed. The value of open swaps may differ from that which would be realized in the event the Series terminated its position in the contract on a given day. Risks of entering into these contracts include the potential inability of the counterparty to meet the terms of the contracts. This type of risk is generally limited to the amount of favorable movement in the value of the underlying security,
Diversified Income Series-38
Delaware VIP® Diversified Income Series
Notes to financial statements (continued)
8. Derivatives (continued)
instrument, or basket of instruments, if any, at the day of default. Risks also arise from potential losses from adverse market movements and such losses could exceed the unrealized amounts shown on the “Schedule of investments.”
Fair values of derivative instruments as of Dec. 31, 2019 were as follows:
| | | | | |
| | | Liability Derivatives Fair Value |
Statement of Assets and
Liabilities Location | | Interest
Rate
Contracts |
Variation margin due to broker on futures contracts* | | $(2,808,492) |
*Includes cumulative appreciation (depreciation) of futures contracts from the date the contracts were opened through Dec. 31, 2019. Only current day variation margin is reported on the “Statement of assets and liabilities.”
The effect of derivative instruments on the “Statement of operations” for the year ended Dec. 31, 2019 was as follows:
| | | | | | | | | | | | | | | | | | | | | | | | | |
| | | Net Realized Gain (Loss) on: |
| | | Foreign | | | | | | | | |
| | | Currency | | Futures | | Options | | Swap | | |
| | | Exchange Contracts | | Contracts | | Purchased | | Contracts | | Total |
Currency contracts | | | $ | (133,391 | ) | | | $ | — | | | | $ | — | | | | $ | — | | | | $ | (133,391 | ) |
Equity contracts | | | | — | | | | | (1,405,517 | ) | | | | (290,553 | ) | | | | — | | | | | (1,696,070 | ) |
Interest rate contracts | | | | — | | | | | 30,342,966 | | | | | (57,612 | ) | | | | — | | | | | 30,285,354 | |
Credit contracts | | | | — | | | | | — | | | | | — | | | | | 1,550,070 | | | | | 1,550,070 | |
| | | | | | | | | | | | | | | | | | | | | | | | | |
Total | | | $ | (133,391 | ) | | | $ | 28,937,449 | | | | $ | (348,165 | ) | | | $ | 1,550,070 | | | | $ | 30,005,963 | |
| | | | | | | | | | | | | | | | | | | | | | | | | |
| | | | | | | | | | | | | | | | | | | | |
| | | Net Change in Unrealized Appreciation (Depreciation) of: |
| | | Foreign | | | | | | |
| | | Currency | | Futures | | Swaps | | |
| | | Exchange Contracts | | Contracts | | Contracts | | Total |
Currency contracts | | | $ | (235,266 | ) | | | $ | — | | | | $ | — | | | | $ | (235,266 | ) |
Equity contracts | | | | — | | | | | (278,736 | ) | | | | — | | | | | (278,736 | ) |
Interest rate contracts | | | | — | | | | | (16,639,148 | ) | | | | — | | | | | (16,639,148 | ) |
Credit contracts | | | | — | | | | | — | | | | | 521,333 | | | | | 521,333 | |
| | | | | | | | | | | | | | | | | | | | |
Total | | | $ | (235,266 | ) | | | $ | (16,917,884 | ) | | | $ | 521,333 | | | | $ | (16,631,817 | ) |
| | | | | | | | | | | | | | | | | | | | |
The table below summarizes the average balance of derivative holdings by the Series during the year ended Dec. 31, 2019:
| | | | | | | | | | | | | | | | | | | | |
| | | Long
Derivatives
Volume | | Short
Derivatives
Volume |
Foreign currency exchange contracts (average notional value) | | | | USD | | | | | 17,496,642 | | | | | USD | | | | | 19,581,438 | |
Futures contracts (average notional value) | | | | | | | | | 373,656,568 | | | | | | | | | | 14,133,670 | |
Options contracts (average value) | | | | | | | | | 36,170 | | | | | | | | | | — | |
CDS contracts (average notional value)* | | | | | | | | | — | | | | | | | | | | 14,295,964 | |
* Long represents buying protection and short represents selling protection.
9. Offsetting
The Series entered into an International Swaps and Derivatives Association, Inc. Master Agreement (ISDA Master Agreement) or a similar agreement with certain of its derivative contract counterparties in order to better define its contractual rights and to secure rights that will help the Series mitigate its counterparty risk. An ISDA Master Agreement is a bilateral agreement between the Series and a counterparty that governs certainover-the-counter derivatives and foreign exchange contracts and typically contains, among other things, collateral posting items and netting provisions in the event of a default and/or termination event. Under an ISDA Master Agreement, the Series may, under certain circumstances, offset with the counterparty certain derivative financial instruments’ payables and/or receivables with collateral held and/or posted and create one single net payment. The provisions of the
Diversified Income Series-39
Delaware VIP® Diversified Income Series
Notes to financial statements (continued)
9. Offsetting (continued)
ISDA Master Agreement typically permit a single net payment in the event of default(close-out), including the bankruptcy or insolvency of the counterparty. However, bankruptcy or insolvency laws of a particular jurisdiction may impose restrictions on or prohibitions against the right of offset in bankruptcy, insolvency, or other events.
For financial reporting purposes, the Series does not offset derivative assets and derivative liabilities that are subject to netting arrangements on the “Statement of assets and liabilities.”
Master Securities Forward Transaction Agreements
Master Securities Forward Transaction Agreements (MFA) govern certain forward settling transactions, such as TBA securities, delayed-delivery or sale-buyback transactions by and between the Series and select counterparties. The MFA maintain provisions for, among other things, transaction initiation and confirmation, payment and transfer, events of default, termination, and maintenance of collateral. As of Dec. 31, 2019, the following table is a summary of the Series’ TBA securities by counterparty which are subject to offsetting under MFA:
| | | | | | | | | | | | |
Counterparty | | TBA
at Value | | | Cash
Collateral
Received | | Cash
Collateral
Pledged | | Net
Exposure(a) | |
Goldman Sachs Bank USA | | | $1,671,773 | | | $— | | $— | | | $1,671,773 | |
(a)Net exposure represents the receivable (payable) that would be due from (to) the counterparty in an event of default.
10. Securities Lending
The Series, along with other funds in the Delaware Funds, may lend its securities pursuant to a security lending agreement (Lending Agreement) with The Bank of New York Mellon (BNY Mellon). At the time a security is loaned, the borrower must post collateral equal to the required percentage of the market value of the loaned security, including any accrued interest. The required percentage is: (1) 102% with respect to US securities and foreign securities that are denominated and payable in US dollars; and (2) 105% with respect to foreign securities. With respect to each loan, if on any business day, the aggregate market value of securities collateral plus cash collateral held is less than the aggregate market value of the securities which are the subject of such loan, the borrower will be notified to provide additional collateral by the end of the following business day, which, together with the collateral already held, will be not less than the applicable initial collateral requirements for such security loan. If the aggregate market value of securities collateral and cash collateral held with respect to a security loan exceeds the applicable initial collateral requirement, upon the request of the borrower, BNY Mellon must return enough collateral to the borrower by the end of the following business day to reduce the value of the remaining collateral to the applicable initial collateral requirement for such security loan. As a result of the foregoing, the value of the collateral held with respect to a loaned security on any particular day may be more or less than the value of the security on loan. The collateral percentage with respect to the market value of the loaned security is determined by the security lending agent.
Cash collateral received by each Series of the Trust is generally invested in a series of individual separate accounts, each corresponding to a series. The investment guidelines permit each separate account to hold certain securities that would be considered eligible securities for a money market fund. Cash collateral received is generally invested in government securities; certain obligations issued by government sponsored enterprises; repurchase agreements collateralized by US Treasury securities; obligations issued by the central government of any Organization for Economic Cooperation and Development country or its agencies, instrumentalities, or establishments; obligations of supranational organizations; commercial paper, notes, bonds, and other debt obligations; certificates of deposit, time deposits, and other bank obligations; and asset-backed securities. The Series can also accept US government securities and letters of credit(non-cash collateral) in connection with securities loans.
In the event of default or bankruptcy by the lending agent, realization and/or retention of the collateral may be subject to legal proceedings. In the event the borrower fails to return loaned securities and the collateral received is insufficient to cover the value of the loaned securities and provided such collateral shortfall is not the result of investment losses, the lending agent has agreed to pay the amount of the shortfall to the Series or, at the discretion of the lending agent, replace the loaned securities. The Series continues to record dividends or interest, as applicable, on the securities loaned and is subject to changes in value of the securities loaned that may occur during the term of the loan. The Series has the right under the Lending Agreement to recover the securities from the borrower on demand. With respect to security loans collateralized bynon-cash collateral, the Series receives loan premiums paid by the borrower. With respect to security loans collateralized by cash collateral, the earnings from the collateral investments are shared among the Series, the security lending agent, and the borrower. The Series records security lending income net of allocations to the security lending agent, and the borrower.
Diversified Income Series-40
Delaware VIP® Diversified Income Series
Notes to financial statements (continued)
The Series may incur investment losses as a result of investing securities lending collateral. This could occur if an investment in the collateral investment account defaulted or became impaired. Under those circumstances, the value of the Series’ cash collateral account may be less than the amount the Series would be required to return to the borrowers of the securities and the Series would be required to make up for this shortfall.
During the year ended Dec. 31, 2019, the Series had no securities out on loan.
11. Credit and Market Risk
When interest rates rise, fixed income securities (i.e. debt obligations) generally will decline in value. These declines in value are greater for fixed income securities with longer maturities or durations.
The risk that potential changes related to the use of the London Interbank Offered Rate (LIBOR) could have adverse impacts on financial instruments which reference LIBOR. The potential abandonment of LIBOR could affect the value and liquidity of instruments which reference LIBOR.
Some countries in which the Series may invest require governmental approval for the repatriation of investment income, capital, or the proceeds of sales of securities by foreign investors. In addition, if there is deterioration in a country’s balance of payments or for other reasons, a country may impose temporary restrictions on foreign capital remittances abroad.
The securities exchanges of certain foreign markets are substantially smaller, less liquid, and more volatile than the major securities markets in the United States. Consequently, acquisition and disposition of securities by the Series may be inhibited. In addition, a significant portion of the aggregate market value of securities listed on the major securities exchanges in emerging markets is held by a smaller number of investors. This may limit the number of shares available for acquisition or disposition by the Series.
The Series invests in bank loans and other securities that may subject it to direct indebtedness risk, the risk that the Series will not receive payment of principal, interest, and other amounts due in connection with these investments and will depend primarily on the financial condition of the borrower. Loans that are fully secured offer the Series more protection than unsecured loans in the event of nonpayment of scheduled interest or principal, although there is no assurance that the liquidation of collateral from a secured loan would satisfy the corporate borrower’s obligation, or that the collateral can be liquidated. Some loans or claims may be in default at the time of purchase. Certain of the loans and the other direct indebtedness acquired by the Series may involve revolving credit facilities or other standby financing commitments that obligate the Series to pay additional cash on a certain date or on demand. These commitments may require the Series to increase its investment in a company at a time when the Series might not otherwise decide to do so (including at a time when the company’s financial condition makes it unlikely that such amounts will be repaid). To the extent that the Series is committed to advance additional funds, it will at all times hold and maintain cash or other high grade debt obligations in an amount sufficient to meet such commitments. When a loan agreement is purchased, the Series may pay an assignment fee. On an ongoing basis, the Series may receive a commitment fee based on the undrawn portion of the underlying line of credit portion of a loan agreement. Prepayment penalty fees are received upon the prepayment of a loan agreement by a borrower. Prepayment penalty, facility, commitment, consent, and amendment fees are recorded to income as earned or paid.
As the Series may be required to rely upon another lending institution to collect and pass on to the Series amounts payable with respect to the loan and to enforce the Series’ rights under the loan and other direct indebtedness, an insolvency, bankruptcy, or reorganization of the lending institution may delay or prevent the Series from receiving such amounts. The highly leveraged nature of many loans may make them especially vulnerable to adverse changes in economic or market conditions. Investments in such loans and other direct indebtedness may involve additional risk to the Series.
The Series invests in fixed income securities whose value is derived from an underlying pool of mortgages or consumer loans. The value of these securities is sensitive to changes in economic conditions, including delinquencies and/or defaults, and may be adversely affected by shifts in the market’s perception of the issuers and changes in interest rates. Investors receive principal and interest payments as the underlying mortgages or consumer loans are paid back. Some of these securities are collateralized mortgage obligations (CMOs). CMOs are debt securities issued by US government agencies or by financial institutions and other mortgage lenders, which are collateralized by a pool of mortgages held under an indenture. Prepayment of mortgages may shorten the stated maturity of the obligations and can result in a loss of premium, if any has been paid. Certain of these securities may be stripped (securities which provide only the principal or interest feature of the underlying security). The yield to maturity on an interest-only CMO is extremely sensitive not only to changes in prevailing interest rates, but also to the rate of principal payments (including prepayments) on the related underlying mortgage assets. A rapid rate of principal payments may have a material adverse effect on the Series’ yield to maturity. If the underlying mortgage assets experience greater than anticipated prepayments of principal, the Series may fail to fully recoup its initial investment in these securities even if the securities are rated in the highest rating categories.
The Series invests a portion of its assets in high yield fixed income securities, which are securities rated lower thanBBB- by S&P and lower than Baa3 by Moody’s, or similarly rated by another nationally recognized statistical rating organization. Investments in these higher yielding securities are generally accompanied by a greater degree of credit risk than higher rated securities. Additionally, lower rated securities may be more susceptible to adverse economic and competitive industry conditions than investment grade securities.
Diversified Income Series-41
Delaware VIP® Diversified Income Series
Notes to financial statements (continued)
11. Credit and Market Risk (continued)
The Series invests in certain obligations that may have liquidity protection to ensure that the receipt of payments due on the underlying security is timely. Such protection may be provided through guarantees, insurance policies, or letters of credit obtained by the issuer or sponsor through third parties, through various means of structuring the transaction or through a combination of such approaches. The Series will not pay any additional fees for such credit support, although the existence of credit support may increase the price of the security.
The Series may invest up to 15% of its net assets in illiquid securities, which may include securities with contractual restrictions on resale, securities exempt from registration under Rule 144A promulgated under of the Securities Act of 1933, as amended, and other securities which may not be readily marketable. The relative illiquidity of these securities may impair the Series from disposing of them in a timely manner and at a fair price when it is necessary or desirable to do so. While maintaining oversight, the Board has delegated to DMC theday-to-day functions of determining whether individual securities are liquid for purposes of the Series’ limitation on investments in illiquid securities. Securities eligible for resale pursuant to Rule 144A, which are determined to be liquid, are not subject to the Series’ 15% limit on investments in illiquid securities. Rule 144A securities have been identified on the “Schedule of investments.”
12. Contractual Obligations
The Series enters into contracts in the normal course of business that contain a variety of indemnifications. The Series’ maximum exposure under these arrangements is unknown. However, the Series has not had prior claims or losses pursuant to these contracts. Management has reviewed the Series’ existing contracts and expects the risk of loss to be remote.
13. General Motors Term Loan Litigation
The Series received notice of a litigation proceeding related to a General Motors Corporation (G.M.) term loan participation previously held by the Series in 2009. Because it was believed that the Series was a secured creditor, the Series received the full principal on the loans in 2009 after the G.M. bankruptcy. However, based upon a US Court of Appeals ruling, the Motors Liquidation Company Avoidance Action Trust sought to recover such amounts arguing that the Series was an unsecured creditor and, as an unsecured creditor, the Series should not have received payment in full. Based on available information related to the litigation and the Series’ potential exposure, the Series previously recorded a contingent liability of $4,351,308 and an asset of $1,305,392 based on the potential recoveries by the estate that resulted in a net decrease in the Series’ NAV to reflect this potential recovery.
During the year, the plaintiff and the term loan lenders, which included the Series, reached an agreement that resolved the disputes. The parties agreed to terms of a settlement agreement and presented the settlement agreement to the court for approval at a hearing on June 12, 2019. The court approved the settlement documentation and dismissed the case on July 2, 2019. The court’s approval of the settlement and dismissal of the case with prejudice became final on July 16, 2019.
The contingent liability and other asset were removed in connection with the case being settled, which resulted in the Series recognizing a gain in the amount of the liability reversed.
14. Recent Accounting Pronouncements
In March 2017, the FASB issued an Accounting Standards Update (ASU), ASU2017-08, Receivables — Nonrefundable Fees and Other Costs (Subtopic310-20), Premium Amortization on Purchased Callable Debt Securities which amends the amortization period for certain callable debt securities purchased at a premium, shortening such period to the earliest call date. ASU2017-08 does not require any accounting change for debt securities held at a discount; the discount continues to be amortized to maturity. ASU2017-08 is effective for fiscal years, and interim periods within those fiscal years, beginning after Dec. 15, 2018. Management has implemented ASU2017-08 and determined that the impact of this guidance to the Series’ net assets at the end of the year is not material.
In August 2018, the FASB issued ASU2018-13, which changes certain fair value measurement disclosure requirements. ASU2018-13, in addition to other modifications and additions, removes the requirement to disclose the amount and reasons for transfers between Level 1 and Level 2 of the fair value hierarchy, the policy for the timing of transfers between levels and the valuation process for Level 3 fair value measurements. ASU2018-13 is effective for fiscal years, and interim periods within those fiscal years, beginning after Dec. 15, 2019. At this time, management is evaluating the implications of these changes on the financial statements.
15. Subsequent Events
Management has determined that no material events or transactions occurred subsequent to Dec. 31, 2019, that would require recognition or disclosure in the Series’ financial statements.
Diversified Income Series-42
Delaware VIP® Trust — Delaware VIP Diversified Income Series
Report of independent registered public accounting firm
To the Board of Trustees of Delaware VIP® Trust and Shareholders of Delaware VIP Diversified Income Series
Opinion on the Financial Statements
We have audited the accompanying statement of assets and liabilities, including the schedule of investments, of Delaware VIP Diversified Income Series (one of the series constituting Delaware VIP® Trust, referred to hereafter as the “Series”) as of December 31, 2019, the related statement of operations for the year ended December 31, 2019, the statements of changes in net assets for each of the two years in the period ended December 31, 2019, including the related notes, and the financial highlights for each of the five years in the period ended December 31, 2019 (collectively referred to as the “financial statements”). In our opinion, the financial statements present fairly, in all material respects, the financial position of the Series as of December 31, 2019, the results of its operations for the year then ended, the changes in its net assets for each of the two years in the period ended December 31, 2019 and the financial highlights for each of the five years in the period ended December 31, 2019 in conformity with accounting principles generally accepted in the United States of America.
Basis for Opinion
These financial statements are the responsibility of the Series’ management. Our responsibility is to express an opinion on the Series’ financial statements based on our audits. We are a public accounting firm registered with the Public Company Accounting Oversight Board (United States) (PCAOB) and are required to be independent with respect to the Series in accordance with the U.S. federal securities laws and the applicable rules and regulations of the Securities and Exchange Commission and the PCAOB.
We conducted our audits of these financial statements in accordance with the standards of the PCAOB. Those standards require that we plan and perform the audit to obtain reasonable assurance about whether the financial statements are free of material misstatement, whether due to error or fraud.
Our audits included performing procedures to assess the risks of material misstatement of the financial statements, whether due to error or fraud, and performing procedures that respond to those risks. Such procedures included examining, on a test basis, evidence regarding the amounts and disclosures in the financial statements. Our audits also included evaluating the accounting principles used and significant estimates made by management, as well as evaluating the overall presentation of the financial statements. Our procedures included confirmation of securities owned as of December 31, 2019 by correspondence with the custodian, transfer agents and brokers; when replies were not received from brokers, we performed other auditing procedures. We believe that our audits provide a reasonable basis for our opinion.
/s/PricewaterhouseCoopers LLP
Philadelphia, Pennsylvania
February 21, 2020
We have served as the auditor of one or more investment companies in Delaware Funds® by Macquarie since 2010.
Diversified Income Series-43
Delaware VIP® Trust — Delaware VIP Diversified Income Series
Other Series information (Unaudited)
Board consideration of Investment Advisory andSub-Advisory Agreements for Delaware VIP Diversified Income Series at a meeting held August21-22, 2019
At a meeting held on Aug.21-22, 2019 (the “Annual Meeting”), the Board of Trustees (the “Board”), including a majority of disinterested or independent Trustees, approved the renewal of the investment advisory andsub-advisory agreements for Delaware VIP Diversified Income Series (the “Series”). In making its decision, the Board considered information furnished at regular quarterly Board meetings, including reports detailing Series performance, investment strategies, and expenses, as well as information prepared specifically in connection with the renewal of the investment advisory andsub-advisory contracts. Information furnished specifically in connection with the renewal of the Investment Management Agreement with Delaware Management Company (“DMC”), a series of Macquarie Investment Management Business Trust (“MIMBT”) and theSub-Advisory Agreements with Macquarie Investment Management Europe Limited (“MIMEL”) and Macquarie Investment Management Global Limited (“MIMGL”), included materials provided by DMC and its affiliates (collectively, “Macquarie Investment Management”), MIMEL, and MIMGL, concerning, among other things, the nature, extent, and quality of services provided to the Series; the costs of such services to the Series; economies of scale; and the investment manager’s financial condition and profitability. In addition, in connection with the Annual Meeting, materials were provided to the Trustees in May 2019, including reports provided by Broadridge Financial Solutions (“Broadridge”). The Broadridge reports compared the Series’ investment performance and expenses with those of other comparable mutual funds. The Independent Trustees reviewed and discussed the Broadridge reports with independent legal counsel to the Independent Trustees. In addition to the information noted above, the Board also requested and received information regarding DMC’s policy with respect to advisory fee levels and its breakpoint philosophy; the structure of portfolio manager compensation; comparative client fee information; and any constraints or limitations on the availability of securities for certain investment styles, which had in the past year inhibited, or which were likely in the future to inhibit, the investment manager’s ability to invest fully in accordance with Series policies.
In considering information relating to the approval of the Series’ investment advisory andsub-advisory agreements, the Independent Trustees received assistance and advice from and met separately with independent legal counsel to the Independent Trustees and also received assistance and advice from an experienced and knowledgeable independent fund consultant, JDL Consultants, LLC (“JDL”). Although the Board gave attention to all information furnished, the following discussion identifies, under separate headings, the primary factors taken into account by the Board during its contract renewal considerations.
Nature, extent, and quality of services.The Board considered the services provided by DMC to the Series and its shareholders. In reviewing the nature, extent, and quality of services, the Board considered reports furnished to it throughout the year, which covered matters such as the relative performance of the Series; compliance of portfolio managers with the investment policies, strategies, and restrictions for the Series; compliance by DMC and Delaware Distributors, L.P. (together, “Management”) personnel with the Code of Ethics adopted throughout the Delaware Funds® by Macquarie (the “Delaware Funds”); and adherence to fair value pricing procedures as established by the Board. The Board was pleased with the current staffing of DMC and the emphasis placed on research in the investment process. The Board recognized DMC’s receipt of certain favorable industry distinctions during the past several years. The Board gave favorable consideration to DMC’s efforts to control expenses while maintaining service levels committed to Series matters. The Board was satisfied with the nature, extent, and quality of the overall services provided by DMC.
Nature, extent, and quality of services.The Board considered the services provided by MIMGL to the Series and its shareholders. In reviewing the nature, extent, and quality of services, the Board considered reports furnished to it throughout the year at regular Board Meetings covering matters such as relative performance of the Series; compliance of portfolio managers with the investment policies, strategies, and restrictions for the Series; the compliance of MIMGL personnel with its Code of Ethics; and adherence to fair value pricing procedures as established by the Board. The Board was pleased with the current staffing of MIMGL and the emphasis placed on research in the investment process. The Board was satisfied with the nature, extent, and quality of the overall services provided by MIMGL.
Nature, extent, and quality of services.The Board considered the services provided by MIMEL to the Series and its shareholders. In reviewing the nature, extent, and quality of services, the Board considered reports furnished to it throughout the year at regular Board Meetings covering matters such as relative performance of the Series; compliance of portfolio managers with the investment policies, strategies, and restrictions for the Series; the compliance of MIMEL personnel with its Code of Ethics; and adherence to fair value pricing procedures as established by the Board. The Board was pleased with the current staffing of MIMEL and the emphasis placed on research in the investment process. The Board was satisfied with the nature, extent, and quality of the overall services provided by MIMEL.
Investment performance.The Board placed significant emphasis on the investment performance of the Series in view of the importance of investment performance to shareholders. Although the Board considered performance reports and discussions with portfolio managers at Board meetings throughout the year, the Board gave particular weight to the Broadridge reports furnished for the Annual Meeting. The Broadridge reports prepared for the Series showed the investment performance of its Standard Class shares in comparison to a group of similar funds as selected by Broadridge (the “Performance Universe”). A fund with the best performance ranked first, and a fund with the poorest performance ranked last. The highest/best performing 25% of funds in the Performance Universe make up the first quartile; the next 25%, the second quartile; the next 25%, the third quartile; and the poorest/worst
Diversified Income Series-44
Delaware VIP® Trust — Delaware VIP Diversified Income Series
Other Series information (Unaudited)
Board consideration of Investment Advisory andSub-Advisory Agreements for Delaware VIP Diversified Income Series at a meeting held August21-22, 2019 (continued)
performing 25% of funds in the Performance Universe make up the fourth quartile. Comparative annualized performance for the Series was shown for the past1-,3-,5-, and10-year periods, as applicable, ended Jan. 31, 2019. The Board’s objective is that the Series’ performance for the1-,3-, and5-year periods be at or above the median of its Performance Universe.
Broadridge currently classifies the Series as a core plus bond fund. Management believes that it would be more appropriate to include the Series in the general bond funds category. Accordingly, the Broadridge report prepared for the Series compares the Series’ performance to two separate Performance Universes – one, consisting of all core plus bond funds underlying variable insurance products, and the other, consisting of all general bond funds underlying variable insurance products. When compared to other core plus bond funds, the Broadridge report comparison showed that the Series’ total return for the1-year period was in the fourth quartile of its Performance Universe. The report further showed that the Series’ total return for the3- and5-year periods was in the third quartile of its Performance Universe and the Series’ total return for the10-year period was in the second quartile of its Performance Universe. When compared to other general bond funds, the Broadridge report comparison showed that the Series’ total return for the1-year period was in the third quartile of its Performance Universe. The report further showed that Series’ total return for the3-,5-, and10-year periods was in the fourth quartile of its Performance Universe. The Board observed that the Series’ performance results were not in line with the Board’s objective. In evaluating the Series’ performance, the Board considered the performance attribution included in the meeting materials, as well as the numerous investment and performance reports delivered by Management personnel to the Board’s Investments Committee. The Board was satisfied that Management was taking action to improve Series performance and to meet the Board’s performance objective.
Comparative expenses.The Board considered expense data for the Delaware Funds. Management provided the Board with information on pricing levels and fee structures for the Series as of its most recently completed fiscal year. The Board also focused on the comparative analysis of effective management fees and total expense ratios of the Series versus effective management fees and expense ratios of a group of similar funds as selected by Broadridge (the “Expense Group”). In reviewing comparative costs, the Series’ contractual management fee and the actual management fee incurred by the Series were compared with the contractual management fees (assuming all funds in the Expense Group were similar in size to the Series) and actual management fees (as reported by each fund) within the Expense Group, taking into account any applicable breakpoints and fee waivers. The Series’ total expenses were also compared with those of its Expense Group. The Broadridge total expenses, for comparative consistency, were shown by Broadridge for Standard Class shares which do not charge12b-1 andnon-12b-1 service fees. The Board’s objective is for each Series’ total expense ratio to be competitive with those of the peer funds within its Expense Group.
When compared to other core plus bond funds, the expense comparisons for the Series showed that the actual management fee and total expenses were in the quartile with the highest expenses of its Expense Group. When compared to other core plus bond/general bond funds, the expense comparisons for the Series showed that the actual management fee was in the quartile with the second highest expenses of its Expense Group and its total expenses were in the quartile with the highest expenses of its Expense Group. The Series’ total expenses were not in line with the Board’s objective. In evaluating total expenses, the Board considered fee waivers in place through April 2020 and various initiatives implemented by Management, such as the negotiation of lower fees for fund accounting, fund accounting oversight and custody services, which had created an opportunity for a further reduction in expenses. The Board was satisfied with Management’s efforts to improve the Series’ total expense ratio and to bring it in line with the Board’s objective.
Management profitability.The Board considered the level of profits realized by DMC in connection with the operation of the Series. In this respect, the Board reviewed the Investment Management Profitability Analysis that addressed the overall profitability of DMC’s business in providing management and other services to each of the individual funds and the Delaware Funds as a whole. Specific attention was given to the methodology used by DMC in allocating costs for the purpose of determining profitability. Management stated that the level of profits of DMC, to a certain extent, reflects recent operational cost savings and efficiencies initiated by DMC. The Board considered DMC’s efforts to improve services provided to fund shareholders and to meet additional regulatory and compliance requirements resulting from recent industry-wide Securities and Exchange Commission initiatives. The Board also considered the extent to which DMC might derive ancillary benefits from fund operations, including the potential for procuring additional business as a result of the prestige and visibility associated with its role as service provider to the Delaware Funds and the benefits from allocation of fund brokerage to improve trading efficiencies. As part of its work, the Board also reviewed a report prepared by JDL regarding MIMBT profitability as compared to certain peer fund complexes and the Independent Trustees discussed with JDL personnel regarding DMC’s profitability in such context. The Board found that the management fees were reasonable in light of the services rendered and the profitability of DMC.
Economies of scale.The Trustees considered whether economies of scale are realized by DMC as the Series’ assets increase and the extent to which any economies of scale are reflected in the level of management fees charged. The Trustees reviewed the Series’ advisory fee pricing and structure approved by the Board and shareholders, which includes breakpoints, and which applies to most funds in the Delaware Funds complex. Breakpoints in the advisory fee occur when the advisory fee rate is reduced on assets in excess of specified levels. Breakpoints result in a lower advisory fee, than would otherwise be the case in the absence of breakpoints, when the asset levels specified in the breakpoints are exceeded. The Board noted that, as of March 31, 2019, the
Diversified Income Series-45
Delaware VIP® Trust — Delaware VIP Diversified Income Series
Other Series information (Unaudited)
Board consideration of Investment Advisory andSub-Advisory Agreements for Delaware VIP Diversified Income Series at a meeting held August21-22, 2019 (continued)
Series’ assets exceeded the second breakpoint level. The Board believed that, given the extent to which economies of scale might be realized by DMC and its affiliates, the schedule of fees under the Investment Management Agreement provides a sharing of benefits with the Series and its shareholders.
Tax Information
All disclosures are based on financial information available as of the date of this annual report and, accordingly are subject to change. For any and all items requiring reporting, it is the intention of the Series to report the maximum amount permitted under the Internal Revenue Code and the regulations thereunder.
For the year ended Dec. 31, 2019, the Series reports distributions paid during the year as follows:
| | |
| | | (A)
Ordinary Income
Distributions
(Tax Basis) |
| | 100.00% |
(A) is based on a percentage of the Series’ total distributions.
Diversified Income Series-46
Delaware Funds® by Macquarie
Board of trustees / directors and officers addendum
A mutual fund is governed by a Board of Trustees/Directors (“Trustees”), which has oversight responsibility for the management of a fund’s business affairs. Trustees establish procedures and oversee and review the performance of the investment manager, the distributor, and others who perform services for the fund. The independent fund trustees, in particular, are advocates for shareholder interests. Each trustee has served in that capacity since he or she was elected to or appointed to the Board of Trustees, and will continue to serve until his or her retirement or the election of a new trustee in his or her place. The following is a list of the Trustees and Officers with certain background and related information.
| | | | | | | | | | |
Name, Address, and Birth Date | | Position(s) Held with Fund(s) | | Length of Time
Served | | Principal
Occupation(s)
During the Past Five Years | | Number of
Portfolios in Fund
Complex Overseen
by Trustee or Officer | | Other
Directorships
Held by Trustee or Officer |
| INTERESTED TRUSTEE | | | | | | | | | | |
| | | | | |
Shawn K. Lytle1 2005 Market Street Philadelphia, PA 19103 | | President, Chief Executive Officer, and Trustee | | President and Chief Executive Officer since August 2015 | | President — Macquarie Investment Management2(June 2015-Present) | | 95 | | Trustee — UBS Relationship Funds, SMA Relationship Trust, and UBS Funds (May 2010–April 2015) |
| | | | | |
| February 1970 | | | | Trustee since September 2015 | | Regional Head of Americas — UBS Global Asset Management (April 2010-May 2015) | | | | |
INDEPENDENT TRUSTEES | | | | | | | | | | |
Thomas L. Bennett 2005 Market Street Philadelphia, PA 19103 | | Chair and Trustee | | Trustee since March 2005 | | Private Investor (March 2004–Present) | | 95 | | None |
| | | | | |
| October 1947 | | | | Chair since March 2015 | | | | | | |
Jerome D. Abernathy 2005 Market Street Philadelphia, PA 19103 July 1959 | | Trustee | | Since January 2019 | | Managing Member, Stonebrook Capital Management, LLC (financial technology: macro factors and databases) (January 1993–Present) | | 95 | | None |
Ann D. Borowiec 2005 Market Street Philadelphia, PA 19103 November 1958 | | Trustee | | Since March 2015 | | Chief Executive Officer, Private Wealth Management (2011–2013) and Market Manager, New Jersey Private Bank (2005–2011) — J.P. Morgan Chase & Co. | | 95 | | Director — Banco Santander International (October 2016–December 2019) Director — Santander Bank, N.A. (December 2016–December 2019) |
Joseph W. Chow 2005 Market Street Philadelphia, PA 19103 | | Trustee | | Since January 2013 | | Private Investor (April 2011–Present) | | 95 | | Director and Audit Committee Member — Hercules Technology Growth Capital, Inc. |
| January 1953 | | | | | | | | | | (July 2004–July 2014) |
Diversified Income Series-47
| | | | | | | | | | |
Name, Address, and Birth Date | | Position(s) Held with Fund(s) | | Length of Time
Served | | Principal
Occupation(s)
During the Past Five Years | | Number of
Portfolios in Fund
Complex Overseen
by Trustee or Officer | | Other
Directorships
Held by Trustee or Officer |
John A. Fry 2005 Market Street Philadelphia, PA 19103 May 1960 | | Trustee | | Since January 2001 | | President — Drexel University (August 2010–Present) President — Franklin & Marshall College (July 2002–July 2010) | | 95 | | Director; Compensation Committee and Governance Committee Member — Community Health Systems (May 2004–Present) Director — Drexel Morgan & Co. (2015–Present) |
| | | | | |
| | | | | | | | | | | Director and Audit Committee Member — vTv Therapeutics LLC (2017–Present) Director and Audit Committee Member — FS Credit Real Estate Income Trust, Inc. (2018–Present) Director — Federal Reserve Bank of Philadelphia (January 2020–Present) |
Lucinda S. Landreth 2005 Market Street Philadelphia, PA 19103 June 1947 | | Trustee | | Since March 2005 | | Private Investor (2004–Present) | | 95 | | None |
Frances A. Sevilla-Sacasa 2005 Market Street Philadelphia, PA 19103 January 1956 | | Trustee | | Since September 2011 | | Private Investor (January 2017-Present) Chief Executive Officer —Banco Itaú International (April 2012–December 2016) Executive Advisor to Dean (August 2011–March 2012) and Interim Dean (January 2011–July 2011) — University of Miami School of Business Administration President — U.S. Trust, Bank of America Private Wealth Management (Private Banking) (July 2007–December 2008) | | 95 | | Trust Manager and Audit Committee Chair — Camden Property Trust (August 2011–Present) Director; Strategic Planning and Reserves Committee and Nominating and Governance Committee Member — Callon Petroleum Company (December 2019–Present) Director; Audit Committee Member — Carrizo Oil & Gas, Inc. (March 2018–December 2019) |
Thomas K. Whitford 2005 Market Street Philadelphia, PA 19103 March 1956 | | Trustee | | Since January 2013 | | Vice Chairman (2010–April 2013) — PNC Financial Services Group | | 95 | | Director — HSBC North America Holdings Inc.(December 2013-Present) Director — HSBC USA Inc. |
| | | | | | | | | | (July 2014-Present) |
| | | | | |
| | | | | | | | | | Director — HSBC Bank USA, National Association (July 2014-March 2017) |
| | | | | |
| | | | | | | | | | | Director — HSBC Finance Corporation (December 2013-April 2018) |
Diversified Income Series-48
| | | | | | | | | | |
Name, Address, and Birth Date | | Position(s) Held with Fund(s) | | Length of Time
Served | | Principal
Occupation(s)
During the Past Five Years | | Number of
Portfolios in Fund
Complex Overseen
by Trustee or Officer | | Other
Directorships
Held by Trustee or Officer |
Christianna Wood 2005 Market Street Philadelphia, PA 19103 March 1956 | | Trustee | | Since January 2019 | | Chief Executive Officer and President — Gore Creek Capital, Ltd. (August 2009–Present) | | 95 | | Director; Finance Committee and Audit Committee Member — H & R Block Corporation (July 2008–Present) Director; Chair of Investments Committee and Audit Committee Member — Grange Insurance (2013–Present) Trustee; Chair of Nominating and Governance Committee and Audit Committee Member — The Merger Fund (2013–Present), The Merger Fund VL (2013–Present); WCM Alternatives: Event-Driven Fund (2013–Present), and WCM Alternatives: Credit Event Fund (December 2017–Present) Director; Chair of Governance Committee and Audit Committee Member — International Securities Exchange (2010–2016) |
Janet L. Yeomans 2005 Market Street Philadelphia, PA 19103 July 1948 | | Trustee | | Since April 1999 | | Vice President and Treasurer (January 2006–July 2012), Vice President — Mergers & Acquisitions (January 2003–January 2006), and Vice President and Treasurer (July 1995–January 2003) — 3M Company | | 95 | | Director; Personnel and Compensation Committee Chair; Member of Nominating, Investments, and Audit Committees for various periods throughout directorship — Okabena Company (2009-2017) |
Diversified Income Series-49
| | | | | | | | | | |
Name, Address, and Birth Date | | Position(s) Held with Fund(s) | | Length of Time
Served | | Principal
Occupation(s)
During the Past Five Years | | Number of
Portfolios in Fund
Complex Overseen
by Trustee or Officer | | Other
Directorships
Held by Trustee or Officer |
| OFFICERS | | | | | | | | | | |
| | | | | |
David F. Connor 2005 Market Street Philadelphia, PA 19103 December 1963 | | Senior Vice President, General Counsel, and Secretary | | Senior Vice President, since May 2013; General Counsel since May 2015; Secretary since October 2005 | | David F. Connor has served in various capacities at different times at Macquarie Investment Management. | | 95 | | None3 |
Daniel V. Geatens 2005 Market Street Philadelphia, PA 19103 October 1972 | | Vice President and Treasurer | | Vice President and Treasurer since October 2007 | | Daniel V. Geatens has served in various capacities at different times at Macquarie Investment Management. | | 95 | | None3 |
Richard Salus 2005 Market Street Philadelphia, PA 19103 October 1963 | | Senior Vice President and Chief Financial Officer | | Senior Vice President and Chief Financial Officer since November 2006 | | Richard Salus has served in various capacities at different times at Macquarie Investment Management. | | 95 | | None |
| 1 | Shawn K. Lytle is considered to be an “Interested Trustee” because he is an executive officer of the Fund’s(s’) investment advisor. |
| 2 | Macquarie Investment Management is the marketing name for Macquarie Management Holdings, Inc. and its subsidiaries, including the Fund’s(s’) investment advisor, principal underwriter, and its transfer agent. |
| 3 | David F. Connor and Daniel V. Geatens serve in similar capacities for the six portfolios of the Optimum Fund Trust, which have the same investment advisor, principal underwriter, and transfer agent as the registrant. Mr. Geatens also serves as the Chief Financial Officer of the Optimum Fund Trust and he is the Chief Financial Officer and Treasurer for Macquarie Global Infrastructure Total Return Fund Inc. |
The Statement of Additional Information for the Fund(s) includes additional information about the Trustees and Officers and is available, without charge, upon request by calling 800523-1918.
Diversified Income Series-50
| | | | |
| | The Series files its complete schedule of portfolio holdings with the Securities and Exchange Commission (SEC) for the first and third quarters of each fiscal year on FormN-Q or FormN-PORT (available for filings after March 31, 2019). The Series’ FormsN-Q or FormsN-PORT, as well as a description of the policies and procedures that the Series uses to determine how to vote proxies (if any) relating to portfolio securities, are available without charge (i) upon request, by calling 800523-1918; and (ii) on the SEC’s website at sec.gov. In addition, a description of the policies and procedures that the Series uses to determine how to vote proxies (if any) relating to portfolio securities and the Schedule of Investments included in the Series’ most recent FormN-Q or FormN-PORT are available without charge on the Series’ website at delawarefunds.com/vip/literature. The Series’ FormsN-Q and FormsN-PORT may be reviewed and copied at the SEC’s Public Reference Room in Washington, D.C.; information on the operation of the Public Reference Room may be obtained by calling 800SEC-0330. Information (if any) regarding how the Series voted proxies relating to portfolio securities during the most recently disclosed12-month period ended June 30 is available without charge (i) through the Series’ website at delawarefunds.com/proxy; and (ii) the SEC’s website at sec.gov. | | |
| | |
| AR-VIPDIVINC 22462 (2/20) (1073909) | | Diversified Income Series-51 |

Delaware VIP® Trust
Delaware VIP Emerging Markets Series
December 31, 2019
Beginning on or about June 1, 2021, as permitted by regulations adopted by the Securities and Exchange Commission, paper copies of your Series’ shareholder reports will no longer be sent to you by mail, unless you specifically request them from the Series or from your financial intermediary, such as a broker/dealer, bank, or insurance company. Instead, you will be notified by mail each time a report is posted on the website and provided with a link to access the report.
If you already elected to receive shareholder reports electronically, you will not be affected by this change and you do not need to take any action.
You may elect to receive paper copies of all future shareholder reports free of charge. You can inform the Series that you wish to continue receiving paper copies of your shareholder reports by contacting us at 800523-1918. If you own these shares through a financial intermediary, you may contact your financial intermediary to elect to continue to receive paper copies of your shareholder reports. Your election to receive reports in paper will apply to all funds held with the Delaware Funds® by Macquarie or your financial intermediary.
Table of contents
| | | | | | | | | | |
| | 
| | Portfolio management review | | | 1 | | | |
| | | | |
| |
| | Performance summary | | | 3 | | | |
| | | | |
| |
| | Disclosure of Series expenses | | | 5 | | | |
| | | | |
| |
| | Security type / country and sector allocations | | | 6 | | | |
| | | | |
| |
| | Schedule of investments | | | 7 | | | |
| | | | |
| |
| | Statement of assets and liabilities | | | 10 | | | |
| | | | |
| |
| | Statement of operations | | | 11 | | | |
| | | | |
| |
| | Statements of changes in net assets | | | 11 | | | |
| | | | |
| |
| | Financial highlights | | | 12 | | | |
| | | | |
| |
| | Notes to financial statements | | | 14 | | | |
| | | | |
| |
| | Report of independent registered public accounting firm | | | 22 | | | |
| | | | |
| |
| | Other Series information | | | 23 | | | |
| | | | |
| |
| | Board of trustees / directors and officers addendum | | | 26 | | | |
| | | | |
| | | | | | | | | | |
| | | | |
| | | | Other than Macquarie Bank Limited (MBL), none of the entities noted are authorized deposit-taking institutions for the purposes of the Banking Act 1959 (Commonwealth of Australia). The obligations of these entities do not represent deposits or other liabilities of MBL. MBL does not guarantee or otherwise provide assurance in respect of the obligations of these entities, unless noted otherwise. The Series is governed by US laws and regulations. | | | | | | |
| | | | |
| | | | Unless otherwise noted, views expressed herein are current as of June. 30, 2019, and subject to change for events occurring after such date. | | | | | | |
| | | | |
| | | | The Series is not FDIC insured and is not guaranteed. It is possible to lose the principal amount invested. | | | | | | |
| | | | |
| | | | Advisory services provided by Delaware Management Company, a series of Macquarie Investment Management Business Trust (MIMBT), a US registered investment advisor. | | | | | | |
| | | | |
| | | | The Series is distributed byDelaware Distributors, L.P.(DDLP), an affiliate of MIMBT and Macquarie Group Limited. Macquarie Investment Management (MIM) is the marketing name for certain companies comprising the asset management division of Macquarie Group Limited and its subsidiaries and affiliates worldwide. | | | | | | |
| | | | |
| | | | This material may be used in conjunction with the offering of shares in Delaware VIP® Emerging Markets Series only if preceded or accompanied by the Series’ current prospectus or the summary prospectus. | | | | | | |
| | | | |
| | | | © 2020 Macquarie Management Holdings, Inc. | | | | | | |
| | | | |
| | | | All third-party marks cited are the property of their respective owners. | | | | | | |
Delaware VIP® Trust — Delaware VIP Emerging Markets Series
| | |
| Portfolio management review | | January 7, 2020 (Unaudited) |
The investment objective of the Series is to seek long-term capital appreciation.
For the fiscal year ended Dec. 31, 2019, Delaware VIP Emerging Markets Series (the “Series”) Standard Class shares gained 22.63% and Service Class shares gained 22.25%. Both returns reflect reinvestment of all dividends. By comparison, the Series’ benchmark, the MSCI Emerging Markets Index, gained 18.42% (net) and 18.88% (gross) for the same period.
Emerging markets lagged developed market indices amid ongoing trade tensions and concerns about slowing economic growth. Country-level performance showed large dispersion. While trade concerns pressured China, the absence thereof in Russia supported strong equity performance. Argentina was by far the weakest performer during the fiscal year after surprise primary election results precipitated a severe selloff in both equities and the peso. Sector performance was positive across sectors with technology and consumer discretionary performing the strongest while healthcare and materials performed the weakest.
Due to stock selection, India was the largest contributor to the Series’ relative performance during the12-month period. Shares ofReliance Industries Ltd.rose when the company disclosed its intent to become debt-free over the next few years. The company also announced a nonbinding agreement to sell a stake in its refining and chemicals businesses. We continue to hold a favorable view as Reliance Industries focuses on strengthening its burgeoning telecommunications, media, and retail businesses.
In Brazil, stock selection and the Series’ overweight allocation contributed to relative performance during the12-month period. Shares ofB2W Companhia Digitalrose in concert with an improved outlook for Brazil’s economy and positive developments on pension reform. We continue to believe B2W is well positioned for structural growth in Brazil’s ecommerce industry, which is still in its early stages of development.
In Taiwan, stock selection contributed to the Series’ relative performance during the fiscal year.MediaTek Inc.andTaiwan Semiconductor Manufacturing Co. Ltd.benefited from strength in 5G wireless technology-related orders and easing restrictions on Huawei. Shares ofHon Hai Precision Industry Co. Ltd.rose on the back of favorable iPhone shipments. As mobile technology penetrates more deeply into everyday products, we believe there may be attractive structural growth opportunities for all three companies.
In Russia, the Series’ overweight allocation contributed to relative performance during the12-month period. Shares ofSberbank of Russia PJSCrose as the ruble appreciated, driven by oil price strength. Additionally, shares ofYandex NVrose after the company proposed a new corporate structure that reduces regulatory uncertainty. Rising oil prices also buoyed several of the Series’ Russian energy holdings.
Conversely, China was the largest detractor from relative performance due to the Series’ underweight allocation and stock selection during the12-month period. Several of the Series’ Internet holdings detracted from performance as increased competition for online advertising and concerns about slower economic growth continued to weigh onSohu.com Ltd.,SINA Corp.,BaiduInc., andWeibo Corp.Despite these concerns, we believe that these companies remain well positioned for long-term consumption growth trends and that valuations are inexpensive.
The Series’ overweight allocation to Argentina also detracted from performance. The market fell significantly during the third quarter of 2019 after surprising primary election results led to weakness in the peso.
Mexico detracted from the Series’ relative performance due to stock selection. Shares ofGrupoTelevisaSABdeclined due to weakness in advertising; we maintain our belief that valuations, underpinned by the cable business, are compelling.
At a stock level,SK Telecom Co. Ltd.was the largest detractor from the Series’ relative performance. Shares of SK Telecom underperformed due to ongoing concerns about 5G investment spending weighing on profitability. We continue to believe that the stock’s inexpensive valuations reflect this concern and that improvement in the company’snon-telecommunications businesses can support profit growth.
Among sectors, technology was the largest contributor to performance during the12-month period, as several of the Series’ semiconductor holdings outperformed. Energy, driven by Reliance Industries and several of the Series’ Russian energy holdings, also contributed to performance. In contrast, communication services detracted the most from relative performance led by several of the Series’ Chinese Internet companies and SK Telecom. Real estate also detracted from the Series’ relative performance due to stock selection.
Our positive long-term view on emerging market equities remains intact. Despite ongoing political and macroeconomic concerns, we believe that growth prospects for emerging economies remain favorable. We continue to believe that the Chinese economy will muddle through, supported by structural growth in consumption, improvement in living standards, and targeted policies from the government. In the near-term, macro risks appear to dominate investor sentiment. However, we believe that these risks may be more manageable than the market appears to reflect.
Emerging MarketsSeries-1
Delaware VIP® Trust — Delaware VIP Emerging Markets Series
| | |
| Portfolio management review (continued) | | January 7, 2020 (Unaudited) |
Considering the varied macroeconomic backdrop that we see across emerging markets, we believe there are selective opportunities for long-term stock appreciation driven by structural demographic shifts, technology adoption, implementation of government policy, improvement in corporate governance, and industry consolidation. We have found that in markets where price action is heavily macro driven, investors can often misprice individual companies significantly.
Our investment approach remains centered on identifying individual companies that we believe possess sustainable franchises and favorable long-term growth prospects and that trade at significant discounts to their intrinsic value. We are particularly focused on companies that we expect to benefit from long-term changes in how people in emerging markets live and work. We currently hold overweight positions in South Korea, Brazil, Russia, and Mexico. Conversely, we are currently underweight China, South Africa, Saudi Arabia, and Thailand. Sectors we currently favor include communication services, energy (largely due to Series holding Reliance Industries), consumer staples, and technology. Our largest underweight is in financials.
During the fiscal year ended Dec. 31, 2019, the Series entered into foreign currency exchange contracts and foreign cross currency exchange contracts to facilitate or expedite the settlement of portfolio transactions. The foreign currency exchange contracts did not have a material effect on the Series’ performance.
Unless otherwise noted, views expressed herein are current as of Dec. 31, 2019, and subject to change.
Emerging MarketsSeries-2
Delaware VIP® Trust — Delaware VIP Emerging Markets Series
Performance summary (Unaudited)
The performance quoted represents past performance and does not guarantee future results. Investment return and principal value of an investment will fluctuate so that shares, when redeemed, may be worth more or less than their original cost. Current performance may be lower or higher than the performance quoted.
Carefully consider the Series’ investment objectives, risk factors, charges, and expenses before investing. This and other information can be found in the Series’ prospectus and its summary prospectus, which may be obtained by visiting delawarefunds.com/vip/literature or calling 800523-1918. Investors should read the prospectus and the summary prospectus carefully before investing.
| | | | | | | | | | |
Delaware VIP Emerging Markets Series
Average annual total returns
For periods ended December 31, 2019 | | 1 year | | 3 year | | 5 year | | 10 year | | Lifetime |
| Standard Class shares (commenced operations on May 1, 1997) | | +22.63% | | +13.22% | | +7.17% | | +4.53% | | +7.52% |
| Service Class shares (commenced operations on May 1, 2000) | | +22.25% | | +12.91% | | +6.88% | | +4.26% | | +9.62% |
| MSCI Emerging Markets Index (net) | | +18.42% | | +11.57% | | +5.61% | | +3.68% | | n/a |
| MSCI Emerging Markets Index (gross) | | +18.88% | | +11.99% | | +6.01% | | +4.04% | | n/a |
Returns reflect the reinvestment of all distributions. Please see page 4 for a description of the index.
As described in the Series’ most recent prospectus, the net expense ratio for Service Class shares of the Series was 1.58%, while total operating expenses for Standard Class and Service Class shares were 1.34% and 1.64%, respectively. The management fee for Standard Class and Service Class shares was 1.24%. The Series’ investment manager, Delaware Management Company (Manager), has contractually agreed to waive all or a portion of its investment advisory fees and/or pay/reimburse expenses (excluding any12b-1 fees, acquired fund fees and expenses, taxes, interest, short sale and dividend interest expenses, brokerage fees, certain insurance costs, and nonroutine expenses or costs, including, but not limited to, those relating to reorganizations, litigation, conducting shareholder meetings, and liquidations) in order to prevent annual series operating expenses from exceeding 1.28% of the Series’ average daily net assets from April 30, 2019 through Dec. 31, 2019.* Prior to April 30, 2019, the expenses were capped at 1.36% of the Series’ average daily net assets. These waivers and reimbursements may only be terminated by agreement of the Manager and the Series.
Earnings from a variable annuity or variable life investment compoundtax-free until withdrawal, and as a result, no adjustments were made for income taxes.
Expense limitations were in effect for both classes during certain periods shown in the Series performance table above and in the Performance of a $10,000 Investment graph on the next page.
Performance data do not reflect insurance fees related to a variable annuity or variable life investment or the deferred sales charge that would apply to certain withdrawals of investments held for fewer than eight years. Performance shown here would have been reduced if such fees were included and the expense limitation removed. For more information about fees, consult your variable annuity or variable life prospectus.
Investments in variable products involve risk.
International investments entail risks not ordinarily associated with US investments including fluctuation in currency values, differences in accounting principles, or economic or political instability in other nations. Investing in emerging markets can be riskier than investing in established foreign markets due to increased volatility and lower trading volume.
Investments in small and/ormedium-sized companies typically exhibit greater risk and higher volatility than larger, more established companies.
Please read both the contract and underlying prospectus for specific details regarding the product’s risk profile.
* The aggregate contractual waiver period covering this report is from May 1, 2018 through April 30, 2020.
Emerging MarketsSeries-3
Delaware VIP® Emerging Markets Series
Performance summary (Unaudited) (continued)
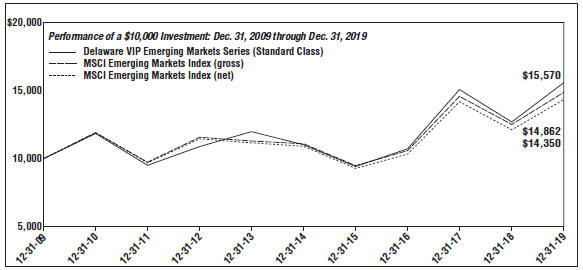
| | | | |
| For period beginning Dec. 31, 2009 through Dec. 31, 2019 | | Starting value | | Ending value |
— Delaware VIP Emerging Markets Series (Standard Class) | | $10,000 | | $15,570 |
– –MSCI Emerging Markets Index (gross) | | $10,000 | | $14,862 |
- - -MSCI Emerging Markets Index (net) | | $10,000 | | $14,350 |
The graph shows a $10,000 investment in the Delaware VIP Emerging Markets Series Standard Class shares for the period from Dec. 31, 2009 through Dec. 31, 2019.
The graph also shows $10,000 invested in the MSCI Emerging Markets Index for the period from Dec. 31, 2009 through Dec. 31, 2019. The MSCI Emerging Markets Index measures equity market performance across emerging market countries worldwide. Index “gross” return approximates the maximum possible dividend reinvestment. Index “net” return approximates the minimum possible dividend reinvestment, after deduction of withholding tax at the highest possible rate.
Index performance returns do not reflect any management fees, transaction costs or expenses. Indices are unmanaged and one cannot invest directly in an index.
Performance of Service Class shares will vary due to different charges and expenses.
Past performance is not a guarantee of future results.
Emerging MarketsSeries-4
Delaware VIP® Trust — Delaware VIP Emerging Markets Series
Disclosure of Series expenses
For thesix-month period from July 1, 2019 to December 31, 2019 (Unaudited)
As a shareholder of the Series, you incur ongoing costs, which may include management fees; distribution and service(12b-1) fees; and other Series expenses. This Example is intended to help you understand your ongoing costs (in dollars) of investing in the Series and to compare these costs with the ongoing costs of investing in other mutual funds.
The Example is based on an investment of $1,000 invested at the beginning of the period and held for the entiresix-month period from July 1, 2019 to Dec. 31, 2019.
Actual expenses
The first section of the table shown, “Actual Series Return,” provides information about actual account values and actual expenses. You may use the information in this section of the table, together with the amount you invested, to estimate the expenses that you paid over the period. Simply divide your account value by $1,000 (for example, an $8,600 account value divided by $1,000 = 8.6), then multiply the result by the number in the first section under the heading entitled “Expenses Paid During Period” to estimate the expenses you paid on your account during the period.
Hypothetical example for comparison purposes
The second section of the table shown, “Hypothetical 5% Return,” provides information about hypothetical account values and hypothetical expenses based on the Series’ actual expense ratio and an assumed rate of return of 5% per year before expenses, which is not the Series’ actual return. The hypothetical account values and expenses may not be used to estimate the actual ending account balance or expenses you paid for the period. You may use this information to compare the ongoing costs of investing in the Series and other funds. To do so, compare this 5% hypothetical example with the 5% hypothetical examples that appear in the shareholder reports of other funds.
Please note that the expenses shown in the table are meant to highlight your ongoing costs only. As a shareholder of the Series, you do not incur any transaction costs, such as sales charges (loads), redemption fees or exchange fees, but shareholders of other funds may incur such costs. Also, the fees related to the variable annuity investment or the deferred sales charge that could apply have not been included. Therefore, the second section of the table is useful in comparing ongoing costs only, and will not help you determine the relative total costs of owning different funds. The Series’ expenses shown in the table reflect fee waivers in effect and assume reinvestment of all dividends and distributions.
Expense analysis of an investment of $1,000
| | | | | | | | | | | | |
| | | Beginning
Account
Value
7/1/19 | | | Ending
Account
Value
12/31/19 | | | Annualized
Expense
Ratio | | Expenses Paid
During Period
7/1/19 to
12/31/19* |
Actual Series return† |
Standard Class | | | $1,000.00 | | | | $1,135.20 | | | 1.28% | | $6.89 |
Service Class | | | 1,000.00 | | | | 1,133.70 | | | 1.58% | | 8.50 |
Hypothetical 5% return(5% return before expenses) |
Standard Class | | | $1,000.00 | | | | $1,018.75 | | | 1.28% | | $6.51 |
Service Class | | | 1,000.00 | | | | 1,017.24 | | | 1.58% | | 8.03 |
*“Expenses Paid During Period” are equal to the Series’ annualized expense ratio, multiplied by the average account value over the period, multiplied by 184/365 (to reflect theone-half year period).
†Because actual returns reflect only the most recentsix-month period, the returns shown may differ significantly from fiscal year returns.
Emerging Markets Series-5
Delaware VIP® Trust — Delaware VIP Emerging Markets Series
Security type / country and sector allocations
As of December 31, 2019 (Unaudited)
Sector designations may be different than the sector designations presented in other Series materials. The sector designations may represent the investment manager’s internal sector classifications.
| | | | | |
| Security type / country | | Percentage of net assets |
Common Stock by Country | | | | 94.97 | % |
Argentina | | | | 1.57 | % |
Bahrain | | | | 0.07 | % |
Brazil | | | | 12.16 | % |
Chile | | | | 0.60 | % |
China/Hong Kong | | | | 28.40 | % |
India | | | | 9.51 | % |
Indonesia | | | | 0.47 | % |
Japan | | | | 0.35 | % |
Malaysia | | | | 0.12 | % |
Mexico | | | | 4.42 | % |
Peru | | | | 0.85 | % |
Republic of Korea | | | | 17.76 | % |
Russia | | | | 7.10 | % |
South Africa | | | | 0.57 | % |
Taiwan | | | | 10.14 | % |
Turkey | | | | 0.66 | % |
United Kingdom | | | | 0.22 | % |
Convertible Preferred Stock | | | | 0.04 | % |
Preferred Stock by Country | | | | 6.11 | % |
Brazil | | | | 1.49 | % |
Republic of Korea | | | | 3.01 | % |
Russia | | | | 1.61 | % |
Participation Notes | | | | 0.00 | % |
Total Value of Securities | | | | 101.12 | % |
Liabilities Net of Receivables and Other Assets | | | | (1.12 | %) |
Total Net Assets | | | | 100.00 | % |
| | | | | |
Common stock, convertible preferred
stock, preferred stock, and
participation notes by sector² | | Percentage
of net assets |
Communication Services | | | | 18.16 | % |
Consumer Discretionary | | | | 10.60 | % |
Consumer Staples | | | | 11.82 | % |
Energy | | | | 16.64 | % |
Financials | | | | 6.13 | % |
Healthcare | | | | 1.88 | % |
Industrials | | | | 1.39 | % |
Information Technology1 | | | | 29.22 | % |
Materials | | | | 3.24 | % |
Real Estate | | | | 1.05 | % |
Utilities | | | | 0.99 | % |
Total | | | | 101.12 | % |
² Narrow industries are utilized for compliance purposes for diversification whereas broad sectors are used for financial reporting.
1 To monitor compliance with the Series’ concentration guidelines, the Information Technology sector (as disclosed herein for financial reporting purposes) is divided into varioussub-categories or “industries,” in this case, Electronics, Internet and Semiconductors. As of Dec. 31, 2019, such amounts, as a percentage of total net assets, were 2.04%, 5.06%, and 22.12%, respectively. The percentage in any such single industry will comply with the Series’ concentration policy even if the percentage in the “Information Technology sector” for financial reporting purposes may exceed 25%.
Emerging Markets Series-6
Delaware VIP® Trust — Delaware VIP Emerging Markets Series
Schedule of investments
December 31, 2019
| | | | | | | | |
| | | Number of shares | | | Value (US $) | |
| |
Common Stock – 94.97%D | | | | | |
Argentina – 1.57% | | | | | | | | |
Arcos Dorado’s Holdings Class A | | | 449,841 | | | $ | 3,643,712 | |
Cablevision Holding GDR † | | | 262,838 | | | | 1,338,954 | |
Cresud ADR † | | | 352,234 | | | | 2,479,727 | |
Grupo Clarin GDR Class B 144A #=† | | | 77,680 | | | | 85,890 | |
IRSA Inversiones y Representaciones ADR † | | | 430,000 | | | | 2,975,600 | |
IRSA Propiedades Comerciales ADR | | | 16,272 | | | | 272,551 | |
| | | | | | | | |
| | | | | | | 10,796,434 | |
| | | | | | | | |
Bahrain – 0.07% | | | | | | | | |
Aluminium Bahrain GDR 144A #† | | | 91,200 | | | | 505,522 | |
| | | | | | | | |
| | | | | | | 505,522 | |
| | | | | | | | |
Brazil – 12.16% | | | | | | | | |
AES Tiete Energia | | | 334,917 | | | | 1,337,936 | |
Atacadao | | | 383,261 | | | | 2,224,661 | |
B2W Cia Digital † | | | 2,276,303 | | | | 35,570,241 | |
Banco Bradesco ADR | | | 718,080 | | | | 6,426,816 | |
Banco Santander Brasil ADR | | | 53,466 | | | | 648,543 | |
BRF ADR † | | | 788,900 | | | | 6,863,430 | |
Cia Brasileira de Distribuicao ADR | | | 118,677 | | | | 2,595,466 | |
Itau Unibanco Holding ADR | | | 1,049,325 | | | | 9,601,324 | |
Petroleo Brasileiro ADR | | | 83,906 | | | | 1,337,462 | |
Rumo † | | | 234,448 | | | | 1,521,141 | |
Telefonica Brasil ADR | | | 392,181 | | | | 5,616,032 | |
TIM Participacoes ADR | | | 264,100 | | | | 5,046,951 | |
Vale | | | 161,197 | | | | 2,135,829 | |
Vale ADR † | | | 197,300 | | | | 2,604,360 | |
| | | | | | | | |
| | | | | | | 83,530,192 | |
| | | | | | | | |
Chile – 0.60% | | | | | | | | |
Latam Airlines Group ADR | | | 140,000 | | | | 1,422,400 | |
Sociedad Quimica y Minera de Chile ADR | | | 100,000 | | | | 2,669,000 | |
| | | | | | | | |
| | | | | | | 4,091,400 | |
| | | | | | | | |
China/Hong Kong – 28.40% | | | | | | | | |
Alibaba Group Holding ADR † | | | 137,900 | | | | 29,248,590 | |
Baidu ADR † | | | 53,600 | | | | 6,775,040 | |
BeiGene † | | | 182,800 | | | | 2,345,906 | |
BeiGene ADR † | | | 11,002 | | | | 1,823,691 | |
China Mengniu Dairy † | | | 1,448,000 | | | | 5,853,471 | |
China Mobile ADR | | | 381,200 | | | | 16,113,324 | |
China Petroleum & Chemical ADR | | | 42,234 | | | | 2,540,375 | |
CNOOC | | | 3,334,000 | | | | 5,545,043 | |
Genscript Biotech † | | | 1,158,000 | | | | 2,630,366 | |
JD.com ADR † | | | 294,000 | | | | 10,357,620 | |
Kunlun Energy | | | 3,622,900 | | | | 3,198,741 | |
Kweichow Moutai Class A | | | 120,613 | | | | 20,483,968 | |
PetroChina Class H | | | 3,000,000 | | | | 1,505,332 | |
Ping An Insurance Group Co. of China Class H | | | 324,000 | | | | 3,829,473 | |
SINA † | | | 200,000 | | | | 7,986,000 | |
Sohu.com ADR † | | | 491,279 | | | | 5,492,499 | |
Tencent Holdings | | | 720,000 | | | | 34,705,029 | |
| | | | | | | | |
| | | Number of shares | | | Value (US $) | |
| |
Common StockD(continued) | | | | | |
China/Hong Kong (continued) | | | | | |
Tencent Music Entertainment Group ADR † | | | 159 | | | $ | 1,867 | |
Tianjin Development Holdings | | | 35,950 | | | | 10,519 | |
Tingyi Cayman Islands Holding | | | 1,706,000 | | | | 2,911,823 | |
Trip.com Group ADR † | | | 130,000 | | | | 4,360,200 | |
Tsingtao Brewery Class H | | | 1,499,429 | | | | 10,073,420 | |
Uni-President China Holdings | | | 2,800,000 | | | | 2,939,312 | |
Weibo ADR † | | | 40,000 | | | | 1,854,000 | |
Wuliangye Yibin Class A | | | 630,892 | | | | 12,046,879 | |
ZhongAn Online P&C Insurance Class H 144A #† | | | 109,400 | | | | 394,510 | |
| | | | | | | | |
| | | | | | | 195,026,998 | |
| | | | | | | | |
India – 9.51% | | | | | | | | |
Dr Reddy’s Laboratories ADR | | | 110,000 | | | | 4,463,800 | |
Indiabulls Real Estate GDR † | | | 44,628 | | | | 40,835 | |
Natco Pharma | | | 200,000 | | | | 1,662,834 | |
Reliance Industries | | | 1,200,000 | | | | 25,454,008 | |
Reliance Industries GDR 144A # | | | 756,027 | | | | 32,168,949 | |
Sify Technologies ADR | | | 91,200 | | | | 112,176 | |
Tata Motors ADR † | | | 110,000 | | | | 1,422,300 | |
| | | | | | | | |
| | | | | | | 65,324,902 | |
| | | | | | | | |
Indonesia – 0.47% | | | | | | | | |
Astra International | | | 6,500,000 | | | | 3,237,603 | |
| | | | | | | | |
| | | | | | | 3,237,603 | |
| | | | | | | | |
Japan – 0.35% | | | | | | | | |
Renesas Electronics † | | | 350,000 | | | | 2,391,183 | |
| | | | | | | | |
| | | | | | | 2,391,183 | |
| | | | | | | | |
Malaysia – 0.12% | | | | | | | | |
UEM Sunrise † | | | 4,748,132 | | | | 818,343 | |
| | | | | | | | |
| | | | | | | 818,343 | |
| | | | | | | | |
Mexico – 4.42% | | | | | | | | |
America Movil ADR Class L | | | 213,289 | | | | 3,412,624 | |
Banco Santander Mexico Institucion de Banca Multiple Grupo Financiero Santander ADR | | | 276,900 | | | | 1,877,382 | |
Becle | | | 1,571,000 | | | | 2,920,569 | |
Cemex ADR | | | 506,188 | | | | 1,913,391 | |
Coca-Cola Femsa ADR | | | 81,700 | | | | 4,952,654 | |
Fomento Economico Mexicano ADR | | | 39,807 | | | | 3,762,160 | |
Grupo Financiero Banorte Class O | | | 475,400 | | | | 2,654,144 | |
Grupo Lala | | | 606,200 | | | | 525,486 | |
Grupo Televisa ADR | | | 707,700 | | | | 8,301,321 | |
| | | | | | | | |
| | | | | | | 30,319,731 | |
| | | | | | | | |
Emerging Markets Series-7
Delaware VIP® Emerging Markets Series
Schedule of investments (continued)
| | | | | | | | |
| | | Number of shares | | | Value (US $) | |
|
Common StockD(continued) | |
Peru – 0.85% | | | | | | | | |
Cia de Minas Buenaventura ADR | | | 384,440 | | | $ | 5,805,044 | |
| | | | | | | | |
| | | | | | | 5,805,044 | |
| | | | | | | | |
Republic of Korea – 17.76% | |
KB Financial Group ADR | | | 72,000 | | | | 2,978,640 | |
LG Display ADR † | | | 188,309 | | | | 1,306,864 | |
LG Electronics | | | 62,908 | | | | 3,907,669 | |
LG Uplus | | | 270,507 | | | | 3,317,839 | |
Lotte | | | 69,206 | | | | 2,326,120 | |
Lotte Chilsung Beverage | | | 14,210 | | | | 1,715,110 | |
Lotte Confectionery | | | 8,599 | | | | 1,109,450 | |
Samsung Electronics | | | 907,636 | | | | 43,736,148 | |
Samsung Life Insurance | | | 71,180 | | | | 4,576,141 | |
SK Hynix | | | 360,000 | | | | 29,281,592 | |
SK Telecom | | | 25,491 | | | | 5,252,384 | |
SK Telecom ADR | | | 971,935 | | | | 22,461,418 | |
| | | | | | | | |
| | | | | | | 121,969,375 | |
| | | | | | | | |
Russia – 7.10% | | | | | |
ENEL RUSSIA PJSC GDR | | | 15,101 | | | | 11,208 | |
Etalon Group GDR 144A # | | | 354,800 | | | | 618,062 | |
Gazprom PJSC ADR | | | 1,043,900 | | | | 8,589,209 | |
LUKOIL PJSC ADR (London International Exchange) | | | 72,953 | | | | 7,235,479 | |
Mobile TeleSystems PJSC ADR | | | 119,402 | | | | 1,211,930 | |
Rosneft Oil PJSC GDR | | | 1,449,104 | | | | 10,445,142 | |
Sberbank of Russia PJSC | | | 2,219,648 | | | | 9,110,512 | |
Surgutneftegas PJSC ADR | | | 294,652 | | | | 2,376,368 | |
T Plus = | | | 25,634 | | | | 0 | |
VEON ADR | | | 756,988 | | | | 1,915,180 | |
Yandex Class A † | | | 166,000 | | | | 7,219,340 | |
| | | | | | | | |
| | | | | | | 48,732,430 | |
| | | | | | | | |
South Africa – 0.57% | |
Impala Platinum Holdings † | | | 309,000 | | | | 3,166,334 | |
Sun International † | | | 210,726 | | | | 600,312 | |
Tongaat Hulett † | | | 182,915 | | | | 157,639 | |
| | | | | | | | |
| | | | | | | 3,924,285 | |
| | | | | | | | |
Taiwan – 10.14% | | | | | | | | |
Hon Hai Precision Industry | | | 4,184,564 | | | | 12,674,998 | |
MediaTek | | | 1,045,000 | | | | 15,460,436 | |
Taiwan Semiconductor Manufacturing | | | 3,756,864 | | | | 41,482,536 | |
| | | | | | | | |
| | | | | | | 69,617,970 | |
| | | | | | | | |
Turkey – 0.66% | | | | | | | | |
Turkcell Iletisim Hizmetleri | | | 730,024 | | | | 1,693,449 | |
Turkiye Sise ve Cam Fabrikalari | | | 3,243,612 | | | | 2,873,396 | |
| | | | | | | | |
| | | | | | | 4,566,845 | |
| | | | | | | | |
| | | | | | | | | | |
| | | | | Number of
shares | | | Value (US $) | |
| |
Common StockD(continued) | | | | | |
United Kingdom – 0.22% | | | | | |
Griffin Mining † | | | | | 1,642,873 | | | $ | 1,490,662 | |
| | | | | | | | | | |
| | | | | | | | | 1,490,662 | |
| | | | | | | | | | |
Total Common Stock
(cost $542,361,542) | | | | | | | | | 652,148,919 | |
| | | | | | | | | | |
| |
Convertible Preferred Stock – 0.04% | | | | | |
CJy† | | KRW | | | 4,204 | | | | 263,195 | |
| | | | | | | | | | |
Total Convertible Preferred Stock
(cost $470,722) | | | | | | | | | 263,195 | |
| | | | | | | | | | |
| |
Preferred Stock – 6.11%D | | | | | |
Brazil – 1.49% | | | | | |
Centrais Eletricas Brasileiras Class B 3.81% | | | | | 233,700 | | | | 2,221,565 | |
Gerdau 1.37% | | | | | 389,400 | | | | 1,936,013 | |
Petroleo Brasileiro ADR 3.08% | | | | | 403,795 | | | | 6,024,621 | |
| | | | | | | | | | |
| | | | | | | | | 10,182,199 | |
| | | | | | | | | | |
Republic of Korea – 3.01% | | | | | |
CJ 3.35% | | | | | 28,030 | | | | 1,121,677 | |
Samsung Electronics 2.29% | | | | | 499,750 | | | | 19,566,139 | |
| | | | | | | | | | |
| | | | | | | | | 20,687,816 | |
| | | | | | | | | | |
Russia – 1.61% | | | | | |
Transneft PJSC 6.09% | | | | | 3,887 | | | | 11,069,257 | |
| | | | | | | | | | |
| | | | | | | | | 11,069,257 | |
| | | | | | | | | | |
Total Preferred Stock
(cost $23,548,608) | | | | | | | | | 41,939,272 | |
| | | | | | | | | | |
| |
Participation Notes – 0.00% | | | | | |
Lehman Indian Oil CW 12 LEPO 144A =† | | | | | 100,339 | | | | 0 | |
Lehman Oil & Natural Gas CW 12 LEPO =† | | | | | 146,971 | | | | 0 | |
| | | | | | | | | | |
Total Participation Notes
(cost $4,952,197) | | | | 0 | |
| | | | | | | | | | |
Emerging Markets Series-8
Delaware VIP® Emerging Markets Series
Schedule of investments (continued)
| | | | |
Total Value of Securities – 101.12%
(cost $571,333,069) | | $ | 694,351,386 | |
| # | Security exempt from registration under Rule 144A of the Securities Act of 1933, as amended. At Dec. 31, 2019, the aggregate value of Rule 144A securities was $33,772,933, which represents 4.92% of the Series’ net assets. See Note 10 in “Notes to financial statements.” |
| = | The value of this security was determined using significant unobservable inputs and is reported as a Level 3 security in the disclosure table located in Note 3 in “Notes to financial statements.” |
| D | Securities have been classified by country of origin. Aggregate classification by business sector has been presented on page 6 in “Security type / country and sector allocations.” |
| y | Exercise price and conversion date to be announced. |
| † | Non-income producing security. |
Summary of Abbreviations:
ADR – American Depositary Receipt
GDR – Global Depositary Receipt
KRW – South Korean Won
LEPO – Low Exercise Price Option
PJSC – Public Joint Stock Company
See accompanying notes, which are an integral part of the financial statements.
Emerging Markets Series-9
Delaware VIP®Trust — Delaware VIP Emerging Markets Series
| | |
| Statement of assets and liabilities | | December 31, 2019 |
| | | | |
Assets: | | | | |
Investments, at value1 | | $ | 694,351,386 | |
Foreign currencies, at value2 | | | 95,025 | |
Dividends and interest receivable | | | 2,082,528 | |
Foreign tax reclaims receivable | | | 57,183 | |
Receivable for series shares sold | | | 18,994 | |
| | | | |
Total assets | | | 696,605,116 | |
| | | | |
Liabilities: | | | | |
Cash due to custodian | | | 7,204,104 | |
Payable for series shares redeemed | | | 612,918 | |
Investment management fees payable | | | 670,483 | |
Other accrued expenses | | | 251,423 | |
Distribution fees payable to affiliates | | | 89,652 | |
Trustees’ fees and expenses payable | | | 6,452 | |
Dividend disbursing and transfer agent fees and expenses payable to affiliates | | | 4,291 | |
Accounting and administration expenses payable to affiliates | | | 2,238 | |
Legal fees payable to affiliates | | | 1,001 | |
Reports and statements to shareholders expenses payable to affiliates | | | 329 | |
Capital gains tax payable | | | 1,073,207 | |
| | | | |
Total liabilities | | | 9,916,098 | |
| | | | |
Total Net Assets | | $ | 686,689,018 | |
| | | | |
| |
Net Assets Consist of: | | | | |
Paid-in capital | | $ | 558,734,179 | |
Total distributable earnings (loss) | | | 127,954,839 | |
| | | | |
Total Net Assets | | $ | 686,689,018 | |
| | | | |
| |
Standard Class: | | | | |
Net assets | | $ | 328,523,735 | |
Shares of beneficial interest outstanding, unlimited authorization, no par | | | 13,533,969 | |
Net asset value per share | | $ | 24.27 | |
| |
Service Class: | | | | |
Net assets | | $ | 358,165,283 | |
Shares of beneficial interest outstanding, unlimited authorization, no par | | | 14,818,727 | |
Net asset value per share | | $ | 24.17 | |
1Investments, at cost | | $ | 571,333,069 | |
2Foreign currencies, at cost | | | 92,622 | |
See accompanying notes, which are an integral part of the financial statements.
Emerging Markets Series-10
Delaware VIP® Trust —
Delaware VIP Emerging Markets Series
Statement of operations
Year ended December 31, 2019
| | | | |
Investment Income: | | | | |
Dividends | | $ | 15,633,485 | |
Interest | | | 6,714 | |
Foreign tax withheld | | | (2,133,354 | ) |
| | | | |
| | | 13,506,845 | |
| | | | |
Expenses: | | | | |
Management fees | | | 7,745,128 | |
Distribution expenses - Service Class | | | 1,017,916 | |
Custodian fees | | | 226,979 | |
Accounting and administration expenses | | | 147,484 | |
Reports and statements to shareholders | | | 71,387 | |
Dividend disbursing and transfer agent fees and expenses | | | 52,255 | |
Audit and tax | | | 45,135 | |
Trustees’ fees and expenses | | | 36,715 | |
Legal fees | | | 30,935 | |
Registration fees | | | 77 | |
Other | | | 31,789 | |
| | | | |
| | | 9,405,800 | |
Less expenses waived | | | (274,311 | ) |
Less expenses paid indirectly | | | (902 | ) |
| | | | |
Total operating expenses | | | 9,130,587 | |
| | | | |
Net Investment Income | | | 4,376,258 | |
| | | | |
| |
Net Realized and Unrealized Gain (Loss): | | | | |
Net realized gain (loss) on: | | | | |
Investments | | | 12,480,264 | |
Foreign currencies | | | (125,052 | ) |
Foreign currency exchange contracts | | | (116,342 | ) |
| | | | |
Net realized gain | | | 12,238,870 | |
| | | | |
Net change in unrealized appreciation (depreciation) of: | | | | |
Investments* | | | 112,178,345 | |
Foreign currencies | | | (1,415,873 | ) |
| | | | |
Net change in unrealized appreciation (depreciation) | | | 110,762,472 | |
| | | | |
Net Realized and Unrealized Gain | | | 123,001,342 | |
| | | | |
Net Increase in Net Assets Resulting from Operations | | $ | 127,377,600 | |
| | | | |
*Includes $1,408,431 increase in capital gains taxes accrued.
Delaware VIP Trust —
Delaware VIP Emerging Markets Series
Statements of changes in net assets
| | | | | | | | |
| | | Year ended | |
| | | 12/31/19 | | | 12/31/18 | |
Increase (Decrease) in Net Assets from Operations: | | | | | | | | |
Net investment income | | $ | 4,376,258 | | | $ | 3,403,499 | |
Net realized gain | | | 12,238,870 | | | | 13,927,474 | |
Net change in unrealized appreciation (depreciation) | | | 110,762,472 | | | | (120,672,692 | ) |
| | | | | | | | |
Net increase (decrease) in net assets resulting from operations | | | 127,377,600 | | | | (103,341,719 | ) |
| | | | | | | | |
Dividends and Distributions to Shareholders from: | | | | | | | | |
Distributable earnings: | | | | | | | | |
Standard Class | | | (8,257,932 | ) | | | (9,054,720 | ) |
Service Class | | | (8,689,861 | ) | | | (12,652,674 | ) |
| | | | | | | | |
| | | (16,947,793 | ) | | | (21,707,394 | ) |
| | | | | | | | |
Capital Share Transactions: | | | | | | | | |
Proceeds from shares sold: | | | | | | | | |
Standard Class | | | 70,533,764 | | | | 51,044,803 | |
Service Class | | | 23,247,432 | | | | 40,892,411 | |
Net asset value of shares issued upon reinvestment of dividends and distributions: | | | | | | | | |
Standard Class | | | 8,257,932 | | | | 9,054,720 | |
Service Class | | | 8,689,861 | | | | 12,652,674 | |
| | | | | | | | |
| | | 110,728,989 | | | | 113,644,608 | |
| | | | | | | | |
Cost of shares redeemed: | | | | | | | | |
Standard Class | | | (36,839,690 | ) | | | (64,347,724 | ) |
Service Class | | | (57,751,699 | ) | | | (41,351,896 | ) |
| | | | | | | | |
| | | (94,591,389 | ) | | | (105,699,620 | ) |
| | | | | | | | |
Increase in net assets derived from capital share transactions | | | 16,137,600 | | | | 7,944,988 | |
| | | | | | | | |
Net Increase (Decrease) in Net Assets | | | 126,567,407 | | | | (117,104,125 | ) |
| | |
Net Assets: | | | | | | | | |
Beginning of year | | | 560,121,611 | | | | 677,225,736 | |
| | | | | | | | |
End of year | | $ | 686,689,018 | | | $ | 560,121,611 | |
| | | | | | | | |
See accompanying notes, which are an integral part of the financial statements.
Emerging Markets Series-11
Delaware VIP® Trust — Delaware VIP Emerging Markets Series
Financial highlights
Selected data for each share of the Series outstanding throughout each period were as follows:
| | | | | | | | | | | | | | | | | | | | | | | | |
| | | Delaware VIP Emerging Markets Series Standard Class | | | | |
| | | | | | Year ended | | | | | | | |
| | | 12/31/19 | | | 12/31/18 | | | 12/31/17 | | | 12/31/16 | | | 12/31/15 | | | | |
Net asset value, beginning of period | | $ | 20.36 | | | $ | 25.06 | | | $ | 17.94 | | | $ | 16.27 | | | $ | 19.54 | | | | | |
| | | | | | |
Income (loss) from investment operations: | | | | | | | | | | | | | | | | | | | | | | | | |
Net investment income1 | | | 0.19 | | | | 0.16 | | | | 0.53 | | | | 0.09 | | | | 0.13 | | | | | |
Net realized and unrealized gain (loss) | | | 4.35 | | | | (3.98 | ) | | | 6.72 | | | | 2.15 | | | | (2.86 | ) | | | | |
| | | | | | | | | | | | | | | | | | | | | | | | |
Total from investment operations | | | 4.54 | | | | (3.82 | ) | | | 7.25 | | | | 2.24 | | | | (2.73 | ) | | | | |
| | | | | | | | | | | | | | | | | | | | | | | | |
| | | | | | |
Less dividends and distributions from: | | | | | | | | | | | | | | | | | | | | | | | | |
Net investment income | | | (0.15 | ) | | | (0.80 | ) | | | (0.13 | ) | | | (0.19 | ) | | | (0.16 | ) | | | | |
Net realized gain | | | (0.48 | ) | | | (0.08 | ) | | | — | | | | (0.38 | ) | | | (0.38 | ) | | | | |
| | | | | | | | | | | | | | | | | | | | | | | | |
Total dividends and distributions | | | (0.63 | ) | | | (0.88 | ) | | | (0.13 | ) | | | (0.57 | ) | | | (0.54 | ) | | | | |
| | | | | | | | | | | | | | | | | | | | | | | | |
| | | | | | |
Net asset value, end of period | | $ | 24.27 | | | $ | 20.36 | | | $ | 25.06 | | | $ | 17.94 | | | $ | 16.27 | | | | | |
| | | | | | | | | | | | | | | | | | | | | | | | |
| | | | | | |
Total return2 | | | 22.63% | 3 | | | (15.81% | ) | | | 40.55% | 3 | | | 13.93% | 3 | | | (14.51% | ) | | | | |
| | | | | | |
Ratios and supplemental data: | | | | | | | | | | | | | | | | | | | | | | | | |
Net assets, end of period (000 omitted) | | $ | 328,524 | | | $ | 236,592 | | | $ | 291,019 | | | $ | 196,918 | | | $ | 172,098 | | | | | |
Ratio of expenses to average net assets | | | 1.30% | | | | 1.34% | | | | 1.36% | | | | 1.37% | | | | 1.37% | | | | | |
Ratio of expenses to average net assets prior to fees waived | | | 1.34% | | | | 1.34% | | | | 1.38% | | | | 1.40% | | | | 1.37% | | | | | |
Ratio of net investment income to average net assets | | | 0.86% | | | | 0.71% | | | | 2.40% | | | | 0.53% | | | | 0.70% | | | | | |
Ratio of net investment income to average net assets prior to fees waived | | | 0.82% | | | | 0.71% | | | | 2.38% | | | | 0.50% | | | | 0.70% | | | | | |
Portfolio turnover | | | 20% | | | | 11% | | | | 6% | | | | 8% | | | | 6% | | | | | |
| 1 | The average shares outstanding method has been applied for per share information. |
| 2 | Total return is based on the change in net asset value of a share during the period and assumes reinvestment of dividends and distributions at net asset value. Total return does not include fees, charges, or expenses imposed by the variable annuity and life insurance contracts for which Delaware VIP Trust serves as an underlying investment vehicle. |
| 3 | Total return during the period reflects a waiver by the manager and/or distributor. Performance would have been lower had the waiver not been in effect. |
See accompanying notes, which are an integral part of the financial statements.
Emerging Markets Series-12
Delaware VIP® Emerging Markets Series
Financial highlights (continued)
Selected data for each share of the Series outstanding throughout each period were as follows:
| | | | | | | | | | | | | | | | | | | | | | | | |
| | | Delaware VIP Emerging Markets Series Service Class | | | | |
| | | | | | Year ended | | | | | | | |
| | | 12/31/19 | | | 12/31/18 | | | 12/31/17 | | | 12/31/16 | | | 12/31/15 | | | | |
Net asset value, beginning of period | | $ | 20.28 | | | $ | 24.97 | | | $ | 17.88 | | | $ | 16.21 | | | $ | 19.48 | | | | | |
| | | | | | |
Income (loss) from investment operations: | | | | | | | | | | | | | | | | | | | | | | | | |
Net investment income1 | | | 0.12 | | | | 0.10 | | | | 0.48 | | | | 0.05 | | | | 0.08 | | | | | |
Net realized and unrealized gain (loss) | | | 4.34 | | | | (3.97 | ) | | | 6.69 | | | | 2.14 | | | | (2.86 | ) | | | | |
| | | | | | | | | | | | | | | | | | | | | | | | |
Total from investment operations | | | 4.46 | | | | (3.87 | ) | | | 7.17 | | | | 2.19 | | | | (2.78 | ) | | | | |
| | | | | | | | | | | | | | | | | | | | | | | | |
| | | | | | |
Less dividends and distributions from: | | | | | | | | | | | | | | | | | | | | | | | | |
Net investment income | | | (0.09 | ) | | | (0.74 | ) | | | (0.08 | ) | | | (0.14 | ) | | | (0.11 | ) | | | | |
Net realized gain | | | (0.48 | ) | | | (0.08 | ) | | | — | | | | (0.38 | ) | | | (0.38 | ) | | | | |
| | | | | | | | | | | | | | | | | | | | | | | | |
Total dividends and distributions | | | (0.57 | ) | | | (0.82 | ) | | | (0.08 | ) | | | (0.52 | ) | | | (0.49 | ) | | | | |
| | | | | | | | | | | | | | | | | | | | | | | | |
| | | | | | |
Net asset value, end of period | | $ | 24.17 | | | $ | 20.28 | | | $ | 24.97 | | | $ | 17.88 | | | $ | 16.21 | | | | | |
| | | | | | | | | | | | | | | | | | | | | | | | |
| | | | | | |
Total return2 | | | 22.25% | | | | (16.03% | ) | | | 40.22% | | | | 13.68% | | | | (14.77% | ) | | | | |
| | | | | | |
Ratios and supplemental data: | | | | | | | | | | | | | | | | | | | | | | | | |
Net assets, end of period (000 omitted) | | $ | 358,165 | | | $ | 323,530 | | | $ | 386,207 | | | $ | 310,258 | | | $ | 310,063 | | | | | |
Ratio of expenses to average net assets | | | 1.60% | | | | 1.62% | | | | 1.61% | | | | 1.62% | | | | 1.62% | | | | | |
Ratio of expenses to average net assets prior to fees waived | | | 1.64% | | | | 1.64% | | | | 1.68% | | | | 1.70% | | | | 1.67% | | | | | |
Ratio of net investment income to average net assets | | | 0.56% | | | | 0.43% | | | | 2.15% | | | | 0.28% | | | | 0.45% | | | | | |
Ratio of net investment income to average net assets prior to fees waived | | | 0.52% | | | | 0.41% | | | | 2.08% | | | | 0.20% | | | | 0.40% | | | | | |
Portfolio turnover | | | 20% | | | | 11% | | | | 6% | | | | 8% | | | | 6% | | | | | |
| 1 | The average shares outstanding method has been applied for per share information. |
| 2 | Total return is based on the change in net asset value of a share during the period and assumes reinvestment of dividends and distributions at net asset value. Total return during all of the periods shown reflects waivers by the manager and/or distributor. Performance would have been lower had the waivers not been in effect. Total return does not include fees, charges, or expenses imposed by the variable annuity and life insurance contracts for which Delaware VIP Trust serves as an underlying investment vehicle. |
See accompanying notes, which are an integral part of the financial statements.
Emerging Markets Series-13
Delaware VIP® Trust – Delaware VIP Emerging Markets Series
Notes to financial statements
December 31, 2019
Delaware VIP Trust (Trust) is organized as a Delaware statutory trust and offers 22 series, each of which is treated as a separate entity for certain matters under the Investment Company Act of 1940, as amended (1940 Act). These financial statements and the related notes pertain to Delaware VIP Emerging Markets Series (Series). The Trust is anopen-end investment company. The Series is considered diversified under the 1940 Act and offers Standard Class and Service Class shares. The Standard Class shares do not carry a distribution and service(12b-1) fee and the Service Class shares carry a12b-1 fee. The shares of the Series are sold only to separate accounts of life insurance companies.
1. Significant Accounting Policies
The Series follows accounting and reporting guidance under Financial Accounting Standards Board (FASB) Accounting Standards Codification Topic 946, Financial Services – Investment Companies. The following accounting policies are in accordance with US generally accepted accounting principles (US GAAP) and are consistently followed by the Series.
Security Valuation– Equity securities and exchange-traded funds (ETFs), except those traded on the Nasdaq Stock Market LLC (Nasdaq), are valued at the last quoted sales price as of the time of the regular close of the New York Stock Exchange on the valuation date. Equity securities and ETFs traded on the Nasdaq are valued in accordance with the Nasdaq Official Closing Price, which may not be the last sales price. If, on a particular day, an equity security or ETF does not trade, the mean between the bid and ask prices will be used, which approximates fair value. Equity securities listed on a foreign exchange are normally valued at the last quoted sales price on the valuation date. US government and agency securities are valued at the mean between the bid and ask prices, which approximates fair value.Open-end investment companies are valued at their published net asset value (NAV). Foreign currency exchange contracts and foreign cross currency exchange contracts are valued at the mean between the bid and ask prices, which approximates fair value.
Interpolated values are derived when the settlement date of the contract is an interim date for which quotations are not available. Investments in repurchase agreements are generally valued at par, which approximates fair value, each business day. Generally, other securities and assets for which market quotations are not readily available are valued at fair value as determined in good faith under the direction of the Trust’s Board of Trustees (Board). In determining whether market quotations are readily available or fair valuation will be used, various factors will be taken into consideration, such as market closures or suspension of trading in a security. The Series may use fair value pricing more frequently for securities traded primarily innon-US markets because, among other things, most foreign markets close well before the Series values its securities, generally as of 4:00pm Eastern time. The earlier close of these foreign markets gives rise to the possibility that significant events, including broad market moves, government actions or pronouncements, aftermarket trading, or news events may have occurred in the interim. Whenever such a significant event occurs, the Series may value foreign securities using fair value prices based on third-party vendor modeling tools (international fair value pricing). Restricted securities are valued at fair value using methods approved by the Board.
Federal and Foreign Income Taxes – No provision for federal income taxes has been made as the Series intends to continue to qualify for federal income tax purposes as a regulated investment company under Subchapter M of the Internal Revenue Code of 1986, as amended, and make the requisite distributions to shareholders. The Series evaluates tax positions taken or expected to be taken in the course of preparing the Series’ tax returns to determine whether the tax positions are“more-likely-than-not” of being sustained by the applicable tax authority. Tax positions not deemed to meet the“more-likely-than-not” threshold are recorded as a tax benefit or expense in the current year. Management has analyzed the Series’ tax positions taken or expected to be taken on the Series’ federal income tax returns through the year ended Dec. 31, 2019 and for all open tax years (years ended Dec. 31, 2016–Dec. 31, 2018), and has concluded that no provision for federal income tax is required in the Series’ financial statements. In regard to foreign taxes only, the Series has open tax years in certain foreign countries in which it invests that may date back to the inception of the Series. If applicable, the Series recognizes interest accrued on unrecognized tax benefits in interest expense and penalties in “Other expenses” on the “Statement of operations.” During the year ended Dec. 31, 2019, the Series did not incur any interest or tax penalties.
Class Accounting – Investment income, common expenses, and realized and unrealized gain (loss) on investments are allocated to the classes of the Series on the basis of daily net assets of each class. Distribution expenses relating to a specific class are charged directly to that class.
Repurchase Agreements – The Series may purchase certain US government securities subject to the counterparty’s agreement to repurchase them at an agreed upon date and price. The counterparty will be required on a daily basis to maintain the value of the collateral subject to the agreement at not less than the repurchase price (including accrued interest). The agreements are conditioned upon the collateral being deposited under the Federal Reserve book-entry system with the Series’ custodian or a third-partysub-custodian. In the event of default or bankruptcy by the other party to the agreement, retention of the collateral may be subject to legal proceedings. At Dec. 31, 2019, the Series had no open repurchase agreements.
Foreign Currency Transactions – Transactions denominated in foreign currencies are recorded at the prevailing exchange rates on the valuation date in accordance with the Series’ prospectus. The value of all assets and liabilities denominated in foreign currencies is translated daily into US dollars at the exchange rate of such currencies against the US dollar. Transaction gains or losses resulting from changes in exchange rates during the reporting period or upon settlement of the foreign currency transaction are reported in operations for the current period. The Series generally does not bifurcate that portion of realized gains and losses on investments attributable to changes in foreign exchange rates from that which is due to changes in market prices. These
Emerging Markets Series-14
Delaware VIP® Emerging Markets Series
Notes to financial statements (continued)
realized gains and losses are included on the “Statement of operations” under “Net realized and unrealized gain (loss) on investments.” The Series reports certain foreign currency related transactions as components of realized gains (losses) for financial reporting purposes, whereas such components are treated as ordinary income (loss) for federal income tax purposes.
Use of Estimates – The preparation of financial statements in conformity with US GAAP requires management to make estimates and assumptions that affect the fair value of investments, the reported amounts of assets and liabilities and disclosure of contingent assets and liabilities at the date of the financial statements, and the reported amounts of revenues and expenses during the reporting period. Actual results could differ from those estimates and the differences could be material.
Other – Expenses directly attributable to the Series are charged directly to the Series. Other expenses common to various funds within the Delaware Funds® by Macquarie (Delaware Funds) are generally allocated among such funds on the basis of average net assets. Management fees and certain other expenses are paid monthly. Security transactions are recorded on the date the securities are purchased or sold (trade date) for financial reporting purposes. Costs used in calculating realized gains and losses on the sale of investment securities are those of the specific securities sold. Dividend income is recorded on theex-dividend date and interest income is recorded on the accrual basis. Taxablenon-cash dividends are recorded as dividend income. Foreign dividends are also recorded on theex-dividend date or as soon after theex-dividend date that the Series is aware of such dividends, net of all tax withholdings, a portion of which may be reclaimable. Withholding taxes and reclaims on foreign dividends have been recorded in accordance with the Series’ understanding of the applicable country’s tax rules and rates. The Series may pay foreign capital gains taxes on certain foreign securities held, which are reported as components of realized losses for financial reporting purposes, whereas such components are treated as ordinary loss for federal income tax purposes. The Series declares and pays dividends from net investment income and distributions from net realized gain on investments, if any, following the close of the fiscal year. The Series may distribute more frequently, if necessary for tax purposes. Dividends and distributions, if any, are recorded on theex-dividend date.
The Series receives earnings credits from its custodian when positive cash balances are maintained, which may be used to offset custody fees. The expenses paid under this arrangement are included on the “Statement of operations” under “Custodian fees” with the corresponding expenses offset included under “Less expenses paid indirectly.” For the year ended Dec. 31, 2019, the Series earned $899 under this arrangement.
The Series receives earnings credits from its transfer agent when positive cash balances are maintained, which may be used to offset transfer agent fees. If the amount earned is greater than $1, the expenses paid under this arrangement are included on the “Statement of operations” under “Dividend disbursing and transfer agent fees and expenses” with the corresponding expenses offset included under “Less expenses paid indirectly.” For the year ended Dec. 31, 2019, the Series earned $3 under this arrangement.
2. Investment Management, Administration Agreements, and Other Transactions with Affiliates
In accordance with the terms of its investment management agreement, the Series pays Delaware Management Company (DMC), a series of Macquarie Investment Management Business Trust and the investment manager, an annual fee which is calculated daily and paid monthly at the rates of 1.25% on the first $500 million of average daily and paid monthly net assets of the Series, 1.20% on the next $500 million, 1.15% on the next $1.5 billion, and 1.10% on average daily net assets in excess of $2.5 billion.
Effective April 30, 2019, DMC has contractually agreed to waive that portion, if any, of its management fee and reimburse the Series to the extent necessary to ensure that annual operating expenses (excluding any12b-1 fees, acquired fund fees and expenses, taxes, interest, short sale dividend and interest expenses, brokerage fees, certain insurance costs, and nonroutine expenses or costs, including, but not limited to, those relating to reorganizations, litigation, conducting shareholder meetings, and liquidations), do not exceed 1.28% of the Series’ average daily net assets from April 30, 2019 through Dec. 31, 2019.* Prior to April 30, 2019, the expenses were capped at 1.36% of the Series’ average daily net assets. These expense waivers and reimbursements may only be terminated by agreement of DMC and the Series. The waivers and reimbursements are accrued daily and received monthly.
Effective May 30, 2019, DMC may permit its affiliates, Macquarie Investment Management Global Limited (MIMGL) and Macquarie Funds Management Hong Kong Limited (together, the “AffiliatedSub-Advisors”), to execute Fund equity security trades on behalf of the Manager. The Manager may also seek quantitative support from MIMGL. Although the AffiliatedSub-Advisors serve assub-advisors, DMC has ultimate responsibility for all investment advisory services. For these services, DMC, not the Fund, may pay each AffiliatedSub-Advisor a portion of its investment management fee.
Delaware Investments Fund Services Company (DIFSC), an affiliate of DMC, provides fund accounting and financial administration oversight services to the Series. For these services, DIFSC’s fees are calculated daily and paid monthly based on the aggregate daily net assets of all funds within the Delaware Funds at the following annual rates: 0.00475% of the first $35 billion; 0.0040% of the next $10 billion; and 0.0025% of aggregate average daily net assets in excess of $45 billion (Total Fee). Each fund in the Delaware Funds pays a minimum of $4,000, which, in aggregate, is subtracted from the Total Fee. Each fund then pays its portion of the remainder of the Total Fee on a relative NAV basis. This amount is included on the “Statement of operations” under “Accounting and administration expenses.” For the year ended Dec. 31, 2019, the Series was charged $26,851 for these services.
Emerging Markets Series-15
Delaware VIP® Emerging Markets Series
Notes to financial statements (continued)
2. Investment Management, Administration Agreements, and Other Transactions with Affiliates (continued)
DIFSC is also the transfer agent and dividend disbursing agent of the Series. For these services, DIFSC’s fees are calculated daily and paid monthly at the annual rate of 0.0075% of the Series’ average daily net assets. This amount is included on the “Statement of operations” under “Dividend disbursing and transfer agent fees and expenses.” For the year ended Dec. 31, 2019, the Series was charged $46,845 for these services. Pursuant to asub-transfer agency agreement between DIFSC and BNY Mellon Investment Servicing (US) Inc. (BNYMIS), BNYMIS provides certainsub-transfer agency services to the Series.Sub-transfer agency fees are paid directly by the Series and are also included on the “Statement of operations” under “Dividend disbursing and transfer agent fees and expenses.” The fees that are calculated daily and paid as invoices are received on a monthly or quarterly basis.
Pursuant to a distribution agreement and distribution plan, the Series pays Delaware Distributors, L.P. (DDLP), the distributor and an affiliate of DMC, an annual12b-1 fee of 0.30% of the average daily net assets of the Service Class shares. The fees are calculated daily and paid monthly. Standard Class shares do not pay12b-1 fees.
As provided in the investment management agreement, the Series bears a portion of the cost of resources shared with DMC, including the cost of internal personnel of DMC and/or its affiliates that provide legal, tax, and regulatory reporting services to the Series. For the year ended Dec. 31, 2019, the Series was charged $17,223 for internal legal, tax, and regulatory reporting services provided by DMC and/or its affiliates’ employees. These amounts are included on the “Statement of operations” under “Legal fees.”
Trustees’ fees include expenses accrued by the Series for each Trustee’s retainer and meeting fees. Certain officers of DMC, DIFSC, and DDLP are officers and/or Trustees of the Trust. These officers and Trustees are paid no compensation by the Series.
* The aggregate contractual waiver period covering this report is from May 1, 2018 through April 30, 2020.
3. Investments
For the year ended Dec. 31, 2019, the Series made purchases and sales of investment securities other than short-term investments as follows:
| | | | |
Purchases | | $ | 135,117,410 | |
Sales | | | 122,764,065 | |
The tax cost of investments includes adjustments to net unrealized appreciation (depreciation) which may not necessarily be final tax cost basis adjustments, but approximates the tax basis unrealized gains and losses that may be realized and distributed to shareholders. At Dec. 31, 2019, the cost and unrealized appreciation (depreciation) of investments and derivatives for federal income tax purposes for the Series were as follows:
| | | | | | |
Cost of
Investments
and derivatives | | Aggregate Unrealized
Appreciation of Investments
and derivatives | | Aggregate Unrealized
Depreciation of Investments
and derivatives | | Net Unrealized
Appreciation of Investments
and derivatives |
$582,413,533 | | $231,822,152 | | $(119,884,299) | | $111,937,853 |
US GAAP defines fair value as the price that the Series would receive to sell an asset or pay to transfer a liability in an orderly transaction between market participants at the measurement date under current market conditions. A three-level hierarchy for fair value measurements has been established based upon the transparency of inputs to the valuation of an asset or liability. Inputs may be observable or unobservable and refer broadly to the assumptions that market participants would use in pricing the asset or liability. Observable inputs reflect the assumptions that market participants would use in pricing the asset or liability based on market data obtained from sources independent of the reporting entity. Unobservable inputs reflect the reporting entity’s own assumptions about the assumptions that market participants would use in pricing the asset or liability based on the best information available under the circumstances. The Series’ investment in its entirety is assigned a level based upon the observability of the inputs which are significant to the overall valuation. The three-level hierarchy of inputs is summarized below and on the next page.
| | | | |
| Level 1 | | – | | Inputs are quoted prices in active markets for identical investments. (Examples: equity securities,open-end investment companies, futures contracts, and exchange-traded options contracts) |
| | |
| Level 2 | | – | | Other observable inputs, including, but not limited to: quoted prices for similar assets or liabilities in markets that are active, quoted prices for identical or similar assets or liabilities in markets that are not active, inputs other than quoted prices that are observable for the assets or liabilities (such as interest rates, yield curves, volatilities, prepayment speeds, loss severities, credit risks, and default rates) or other market-corroborated inputs. (Examples: debt securities, government securities, swap contracts, foreign currency exchange contracts, foreign securities utilizing international fair value pricing, broker-quoted securities, and fair valued securities) |
Emerging Markets Series-16
Delaware VIP® Emerging Markets Series
Notes to financial statements (continued)
| | |
| Level 3 – | | Significant unobservable inputs, including the Series’ own assumptions used to determine the fair value of investments. (Examples: broker-quoted securities and fair valued securities) |
Level 3 investments are valued using significant unobservable inputs. The Series may also use an income-based valuation approach in which the anticipated future cash flows of the investment are discounted to calculate fair value. Discounts may also be applied due to the nature or duration of any restrictions on the disposition of the investments. Valuations may also be based upon current market prices of securities that are comparable in coupon, rating, maturity, and industry. The derived value of a Level 3 investment may not represent the value which is received upon disposition and this could impact the results of operations.
The following table summarizes the valuation of the Series’ investments by fair value hierarchy levels as of Dec. 31, 2019:
| | | | | | | | | | | | | | | | |
| Securities | | Level 1 | | | Level 2 | | | Level 3 | | | Total | |
Assets: | | | | | | | | | | | | | | | | |
Common Stock | | | | | | | | | | | | | | | | |
Argentina | | $ | 9,371,590 | | | $ | 1,338,954 | | | $ | 85,890 | | | $ | 10,796,434 | |
Bahrain | | | — | | | | 505,522 | | | | — | | | | 505,522 | |
Brazil | | | 83,530,192 | | | | — | | | | — | | | | 83,530,192 | |
Chile | | | 4,091,400 | | | | — | | | | — | | | | 4,091,400 | |
China/Hong Kong | | | 195,026,998 | | | | — | | | | — | | | | 195,026,998 | |
India | | | 65,324,902 | | | | — | | | | — | | | | 65,324,902 | |
Indonesia | | | — | | | | 3,237,603 | | | | — | | | | 3,237,603 | |
Japan | | | — | | | | 2,391,183 | | | | — | | | | 2,391,183 | |
Malaysia | | | 818,343 | | | | — | | | | — | | | | 818,343 | |
Mexico | | | 30,319,731 | | | | — | | | | — | | | | 30,319,731 | |
Peru | | | 5,805,044 | | | | — | | | | — | | | | 5,805,044 | |
Republic of Korea | | | 26,746,922 | | | | 95,222,453 | | | | — | | | | 121,969,375 | |
Russia | | | 38,992,648 | | | | 9,739,782 | | | | — | | | | 48,732,430 | |
South Africa | | | 3,766,646 | | | | 157,639 | | | | — | | | | 3,924,285 | |
Taiwan | | | 69,617,970 | | | | — | | | | — | | | | 69,617,970 | |
Turkey | | | 4,566,845 | | | | — | | | | — | | | | 4,566,845 | |
United Kingdom | | | 1,490,662 | | | | — | | | | — | | | | 1,490,662 | |
Convertible Preferred Stock | | | — | | | | 263,195 | | | | — | | | | 263,195 | |
Preferred Stock1 | | | 10,182,199 | | | | 31,757,073 | | | | — | | | | 41,939,272 | |
Participation Notes | | | — | | | | — | | | | — | | | | — | |
| | | | | | | | | | | | | | | | |
Total Value of Securities | | $ | 549,652,092 | | | $ | 144,613,404 | | | $ | 85,890 | | | $ | 694,351,386 | |
| | | | | | | | | | | | | | | | |
1Security type is valued across multiple levels. The amounts attributed to Level 1 investments and Level 2 investments represent 24.28% and 75.72%, respectively, of the total market value of this security type. Level 1 investments represent exchange traded investments and Level 2 investments represent investments with observable inputs.
As a result of utilizing international fair value pricing at Dec. 31, 2019, a portion of the common stock in the portfolio was categorized as Level 2.
The securities that have been valued at zero on the “Schedule of investments” are considered to be Level 3 investments in this table.
During the year ended Dec. 31, 2019, there were no transfers between Level 1 investments, Level 2 investments, or Level 3 investments that had a significant impact to the Series. This does not include transfers between Level 1 investments and Level 2 investments due to the Series utilizing international fair value pricing during the period. In accordance with the fair valuation procedures described in Note 1, international fair value pricing of securities occurs when market volatility exceeds an established rolling threshold. If the threshold is exceeded on a given date, then prices of international securities (those that traded on exchanges that close at a different time than the time that the Series’ NAV is determined) are established using a separate pricing feed from a third-party vendor designed to establish a price for each such security as of the time that the Series’ NAV is determined. Further, international fair value pricing uses other observable market-based inputs in place of the closing exchange price due to the events occurring after the close of the exchange or market on which the investment is principally traded, causing a change in classification between levels. The Series’ policy is to recognize transfers between levels based on fair value at the beginning of the reporting period.
A reconciliation of Level 3 investments is presented when the Series has a significant amount of Level 3 investments at the beginning, interim, or end of the period in relation to net assets. Management has determined not to provide a reconciliation of Level 3 investments as the Level 3 investments were not considered significant to the Series’ net assets at the beginning, interim, or end of the period. Management has determined not to provide additional disclosure on Level 3 inputs since the Level 3 investments are not considered significant to the Series’ net assets at the end of the year.
Emerging Markets Series-17
Delaware VIP® Emerging Markets Series
Notes to financial statements (continued)
4. Dividend and Distribution Information
Income and long-term capital gain distributions are determined in accordance with federal income tax regulations, which may differ from US GAAP. Additionally, distributions from net gains on foreign currency transactions and net short-term gains on sales of investment securities are treated as ordinary income for federal income tax purposes. The tax character of dividends and distributions paid during the years ended Dec. 31, 2019 and 2018 was as follows:
| | | | | | | | |
| | | Year ended | |
| | | 12/31/19 | | | 12/31/18 | |
Ordinary income | | $ | 4,437,571 | | | $ | 21,707,394 | |
Long-term capital gain | | | 12,510,222 | | | | — | |
| | | | | | | | |
| | $ | 16,947,793 | | | $ | 21,707,394 | |
| | | | | | | | |
5. Components of Net Assets on a Tax Basis
As of Dec. 31, 2019, the components of net assets on a tax basis were as follows:
| | | | |
Shares of beneficial interest | | $ | 558,734,179 | |
Undistributed ordinary income | | | 4,270,660 | |
Undistributed long-term capital gains | | | 11,746,326 | |
Unrealized appreciation on investments, foreign currencies, and derivatives | | | 111,937,853 | |
| | | | |
Net assets | | $ | 686,689,018 | |
| | | | |
The differences between the book basis and tax basis components of net assets are primarily attributable to tax deferral of losses on wash sales and securities no longer considered PFICs.
6. Capital Shares
Transactions in capital shares were as follows:
| | | | | | | | |
| | | Year ended | |
| | | 12/31/19 | | | 12/31/18 | |
Shares sold: | | | | | | | | |
Standard Class | | | 3,214,805 | | | | 2,222,882 | |
Service Class | | | 1,082,423 | | | | 1,778,979 | |
Shares issued upon reinvestment of dividends and distributions: | | | | | | | | |
Standard Class | | | 373,662 | | | | 373,545 | |
Service Class | | | 394,098 | | | | 523,054 | |
| | | | | | | | |
| | | 5,064,988 | | | | 4,898,460 | |
| | | | | | | | |
| | |
Shares redeemed: | | | | | | | | |
Standard Class | | | (1,672,952 | ) | | | (2,591,433 | ) |
Service Class | | | (2,612,730 | ) | | | (1,815,773 | ) |
| | | | | | | | |
| | | (4,285,682 | ) | | | (4,407,206 | ) |
| | | | | | | | |
Net increase | | | 779,306 | | | | 491,254 | |
| | | | | | | | |
7. Line of Credit
The Series, along with certain other funds in the Delaware Funds (Participants), was a participant in a $220,000,000 revolving line of credit intended to be used for temporary or emergency purposes as an additional source of liquidity to fund redemptions of investor shares. Under the agreement, the Participants were charged an annual commitment fee of 0.15%, which was allocated across the Participants based on a weighted average of the respective net assets of each Participant. The Participants were permitted to borrow up to a maximum ofone-third of their net assets under the agreement. Each Participant was individually, and not jointly, liable for its particular advances, if any, under the line of credit. The line of credit available under the agreement expired on Nov. 4, 2019.
Emerging Markets Series-18
Delaware VIP® Emerging Markets Series
Notes to financial statements (continued)
On Nov. 4, 2019, the Participants entered into an amendment to the agreement for a $250,000,000 revolving line of credit. The revolving line of credit is to be used as described above and operates in substantially the same manner as the original agreement. The line of credit available under the agreement expires on Nov. 2, 2020.
The Series had no amounts outstanding as of Dec. 31, 2019, or at any time during the year then ended.
8. Derivatives
US GAAP requires disclosures that enable investors to understand: (1) how and why an entity uses derivatives; (2) how they are accounted for; and (3) how they affect an entity’s results of operations and financial position.
Foreign Currency Exchange Contracts
The Series may enter into foreign currency exchange contracts and foreign cross currency exchange contracts as a way of managing foreign exchange rate risk. The Series may enter into these contracts to fix the US dollar value of a security that it has agreed to buy or sell for the period between the date the trade was entered into and the date the security is delivered and paid for. The Series may also use these contracts to hedge the US dollar value of securities it already owns that are denominated in foreign currencies. In addition, the Series may enter into these contracts to facilitate or expedite the settlement of portfolio transactions. The change in value is recorded as an unrealized gain or loss. When the contract is closed, a realized gain or loss is recorded equal to the difference between the value of the contract at the time it was opened and the value at the time it was closed.
The use of foreign currency exchange contracts and foreign cross currency exchange contracts does not eliminate fluctuations in the underlying prices of the securities, but does establish a rate of exchange that can be achieved in the future. Although foreign currency exchange contracts and foreign cross currency exchange contracts limit the risk of loss due to an unfavorable change in the value of the hedged currency, they also limit any potential gain that might result should the value of the currency change favorably. In addition, the Series could be exposed to risks if the counterparties to the contracts are unable to meet the terms of their contracts. The Series’ maximum risk of loss from counterparty credit risk is the value of its currency exchanged with the counterparty. The risk is generally mitigated by having a netting arrangement between the Series and the counterparty and by the posting of collateral by the counterparty to the Series to cover the Series’ exposure to the counterparty.
During the year ended Dec. 31, 2019, the Series entered into foreign currency exchange contracts and foreign cross currency exchange contracts to facilitate or expedite the settlement of portfolio transactions.
At Dec. 31, 2019, the Series experienced net realized and unrealized gains or losses attributable to foreign currency holdings, which are disclosed on the “Statement of assets and liabilities” and “Statement of operations.”
The table below summarizes the average balance of derivative holdings by the Series during the year ended Dec. 31, 2019.
| | | | | | | | |
| | | Long
Derivatives
Volume | | | Short
Derivatives
Volume | |
Foreign currency exchange contracts (average cost) | | | $85,888 | | | | $62,648 | |
9. Securities Lending
The Series, along with other funds in the Delaware Funds, may lend its securities pursuant to a security lending agreement (Lending Agreement) with The Bank of New York Mellon (BNY Mellon). At the time a security is loaned, the borrower must post collateral equal to the required percentage of the market value of the loaned security, including any accrued interest. The required percentage is: (1) 102% with respect to US securities and foreign securities that are denominated and payable in US dollars; and (2) 105% with respect to foreign securities. With respect to each loan, if on any business day the aggregate market value of securities collateral plus cash collateral held is less than the aggregate market value of the securities that are the subject of such loan, the borrower will be notified to provide additional collateral by the end of the following business day, which, together with the collateral already held, will be not less than the applicable initial collateral requirements for such security loan. If the aggregate market value of securities collateral and cash collateral held with respect to a security loan exceeds the applicable initial collateral requirement, upon the request of the borrower, BNY Mellon must return enough collateral to the borrower by the end of the following business day to reduce the value of the remaining collateral to the applicable initial collateral requirement for such security loan. As a result of the foregoing, the value of the collateral held with respect to a loaned security on any particular day may be more or less than the value of the security on loan. The collateral percentage with respect to the market value of the loaned securities is determined by the security lending agent.
Cash collateral received by each series of the Trust is generally invested in a series of individual separate accounts, each corresponding to a series. The investment guidelines permit each separate account to hold certain securities that would be considered eligible securities for a money market fund. Cash collateral received is generally invested in government securities; certain obligations issued by government sponsored enterprises; repurchase agreements
Emerging Markets Series-19
Delaware VIP® Emerging Markets Series
Notes to financial statements (continued)
9. Securities Lending (continued)
collateralized by US Treasury securities; obligations issued by the central government of any Organization for Economic Cooperation and Development country or its agencies, instrumentalities, or establishments; obligations of supranational organizations; commercial paper, notes, bonds, and other debt obligations; certificates of deposit, time deposits, and other bank obligations; and asset-backed securities. The Series can also accept US government securities and letters of credit(non-cash collateral) in connection with securities loans.
In the event of default or bankruptcy by the lending agent, realization and/or retention of the collateral may be subject to legal proceedings. In the event the borrower fails to return loaned securities and the collateral received is insufficient to cover the value of the loaned securities and provided such collateral shortfall is not the result of investment losses, the lending agent has agreed to pay the amount of the shortfall to the Series or, at the discretion of the lending agent, replace the loaned securities. The Series continues to record dividends or interest, as applicable, on the securities loaned and are subject to changes in value of the securities loaned that may occur during the term of the loan. The Series has the right under the Lending Agreement to recover the securities from the borrower on demand. With respect to security loans collateralized bynon-cash collateral, the Series receives loan premiums paid by the borrower. With respect to security loans collateralized by cash collateral, the earnings from the collateral investments are shared among the Series, the security lending agent, and the borrower. The Series records security lending income net of allocations to the security lending agent and the borrower.
The Series may incur investment losses as a result of investing securities lending collateral. This could occur if an investment in the collateral investment account defaulted or became impaired. Under those circumstances, the value of the Series’ cash collateral account may be less than the amount the Series would be required to return to the borrowers of the securities and the Series would be required to make up for this shortfall.
During the year ended Dec. 31, 2019, the Series had no securities out on loan.
10. Credit and Market Risk
Some countries in which the Series may invest require governmental approval for the repatriation of investment income, capital, or the proceeds of sales of securities by foreign investors. In addition, if there is deterioration in a country’s balance of payments or for other reasons, a country may impose temporary restrictions on foreign capital remittances abroad.
The securities exchanges of certain foreign markets are substantially smaller, less liquid, and more volatile than the major securities markets in the United States. Consequently, acquisition and disposition of securities by the Series may be inhibited. In addition, a significant portion of the aggregate market value of equity securities listed on the major securities exchanges in emerging markets is held by a smaller number of investors. This may limit the number of shares available for acquisition or disposition by the Series.
The Series may invest up to 10% of its net assets in illiquid securities, which may include securities with contractual restrictions on resale, securities exempt from registration under Rule 144A, promulgated under the Securities Act of 1933, as amended, and other securities which may not be readily marketable. The relative illiquidity of these securities may impair the Series from disposing of them in a timely manner and at a fair price when it is necessary or desirable to do so. While maintaining oversight, the Board has delegated to DMC theday-to-day functions of determining whether individual securities are liquid for purposes of the Series’ limitation on investments in illiquid securities. Securities eligible for resale pursuant to Rule 144A, which are determined to be liquid, are not subject to the Series’ 10% limit on investments in illiquid securities. Rule 144A securities have been identified on the “Schedule of investments.”
11. Contractual Obligations
The Series enters into contracts in the normal course of business that contain a variety of indemnifications. The Series’ maximum exposure under these arrangements is unknown. However, the Series has not had prior claims or losses pursuant to these contracts. Management has reviewed the Series’ existing contracts and expects the risk of loss to be remote.
12. Recent Accounting Pronouncements
In August 2018, the FASB issued an Accounting Standards Update (ASU), ASU2018-13, which changes certain fair value measurement disclosure requirements. ASU2018-13, in addition to other modifications and additions, removes the requirement to disclose the amount and reasons for transfers between Level 1 and Level 2 of the fair value hierarchy, the policy for the timing of transfers between levels and the valuation process for Level 3 fair value measurements. ASU2018-13 is effective for fiscal years, and interim periods within those fiscal years, beginning after Dec. 15, 2019. At this time, management is evaluating the implications of these changes on the financial statements.
Emerging Markets Series-20
Delaware VIP® Emerging Markets Series
Notes to financial statements (continued)
13. Subsequent Events
Management has determined that no material events or transactions occurred subsequent to Dec. 31, 2019, that would require recognition or disclosure in the Series’ financial statements.
Emerging Markets Series-21
Delaware VIP® Trust—Delaware VIP Emerging Markets Series
Report of independent registered public accounting firm
To the Board of Trustees of Delaware VIP® Trust and Shareholders of Delaware VIP Emerging Markets Series
Opinion on the Financial Statements
We have audited the accompanying statement of assets and liabilities, including the schedule of investments, of Delaware VIP Emerging Markets Series (one of the series constituting Delaware VIP® Trust, referred to hereafter as the “Series”) as of December 31, 2019, the related statement of operations for the year ended December 31, 2019, the statements of changes in net assets for each of the two years in the period ended December 31, 2019, including the related notes, and the financial highlights for each of the five years in the period ended December 31, 2019 (collectively referred to as the “financial statements”). In our opinion, the financial statements present fairly, in all material respects, the financial position of the Series as of December 31, 2019, the results of its operations for the year then ended, the changes in its net assets for each of the two years in the period ended December 31, 2019 and the financial highlights for each of the five years in the period ended December 31, 2019 in conformity with accounting principles generally accepted in the United States of America.
Basis for Opinion
These financial statements are the responsibility of the Series’ management. Our responsibility is to express an opinion on the Series’ financial statements based on our audits. We are a public accounting firm registered with the Public Company Accounting Oversight Board (United States) (PCAOB) and are required to be independent with respect to the Series in accordance with the U.S. federal securities laws and the applicable rules and regulations of the Securities and Exchange Commission and the PCAOB.
We conducted our audits of these financial statements in accordance with the standards of the PCAOB. Those standards require that we plan and perform the audit to obtain reasonable assurance about whether the financial statements are free of material misstatement, whether due to error or fraud.
Our audits included performing procedures to assess the risks of material misstatement of the financial statements, whether due to error or fraud, and performing procedures that respond to those risks. Such procedures included examining, on a test basis, evidence regarding the amounts and disclosures in the financial statements. Our audits also included evaluating the accounting principles used and significant estimates made by management, as well as evaluating the overall presentation of the financial statements. Our procedures included confirmation of securities owned as of December 31, 2019 by correspondence with the custodian. We believe that our audits provide a reasonable basis for our opinion.
|
/s/PricewaterhouseCoopers LLP |
Philadelphia, Pennsylvania |
February 21, 2020 |
We have served as the auditor of one or more investment companies in Delaware Funds® by Macquarie since 2010.
Emerging Markets Series-22
Delaware VIP® Trust — Delaware VIP Emerging Markets Series
Other Series information (Unaudited)
Board consideration of Investment Advisory andSub-Advisory Agreements for Delaware VIP Emerging Markets Series at a meeting held August21-22, 2019
At a meeting held on Aug.21-22, 2019 (the “Annual Meeting”), the Board of Trustees (the “Board”), including a majority of disinterested or independent Trustees, approved the renewal of the investment advisory andsub-advisory agreements for Delaware VIP Emerging Markets Series (the “Series”). In making its decision, the Board considered information furnished at regular quarterly Board meetings, including reports detailing Series performance, investment strategies, and expenses, as well as information prepared specifically in connection with the renewal of the investment advisory andsub-advisory contracts. Information furnished specifically in connection with the renewal of the Investment Management Agreement with Delaware Management Company (“DMC”), a series of Macquarie Investment Management Business Trust (“MIMBT”) and theSub-Advisory Agreements with Macquarie Funds Management Hong Kong Limited (“MFMHK”) and Macquarie Investment Management Global Limited (“MIMGL”), included materials provided by DMC and its affiliates (collectively, “Macquarie Investment Management”), MFMHK, and MIMGL, concerning, among other things, the nature, extent, and quality of services provided to the Series; the costs of such services to the Series; economies of scale; and the investment manager’s financial condition and profitability. In addition, in connection with the Annual Meeting, materials were provided to the Trustees in May 2019, including reports provided by Broadridge Financial Solutions (“Broadridge”). The Broadridge reports compared the Series’ investment performance and expenses with those of other comparable mutual funds. The Independent Trustees reviewed and discussed the Broadridge reports with independent legal counsel to the Independent Trustees. In addition to the information noted above, the Board also requested and received information regarding DMC’s policy with respect to advisory fee levels and its breakpoint philosophy; the structure of portfolio manager compensation; comparative client fee information; and any constraints or limitations on the availability of securities for certain investment styles, which had in the past year inhibited, or which were likely in the future to inhibit, the investment manager’s ability to invest fully in accordance with Series policies.
In considering information relating to the approval of the Series’ investment advisory andsub-advisory agreements, the Independent Trustees received assistance and advice from and met separately with independent legal counsel to the Independent Trustees and also received assistance and advice from an experienced and knowledgeable independent fund consultant, JDL Consultants, LLC (“JDL”). Although the Board gave attention to all information furnished, the following discussion identifies, under separate headings, the primary factors taken into account by the Board during its contract renewal considerations.
Nature, extent, and quality of services.The Board considered the services provided by DMC to the Series and its shareholders. In reviewing the nature, extent, and quality of services, the Board considered reports furnished to it throughout the year, which covered matters such as the relative performance of the Series; compliance of portfolio managers with the investment policies, strategies, and restrictions for the Series; compliance by DMC and Delaware Distributors, L.P. (together, “Management”) personnel with the Code of Ethics adopted throughout the Delaware Funds® by Macquarie (the “Delaware Funds”); and adherence to fair value pricing procedures as established by the Board. The Board was pleased with the current staffing of DMC and the emphasis placed on research in the investment process. The Board recognized DMC’s receipt of certain favorable industry distinctions during the past several years. The Board gave favorable consideration to DMC’s efforts to control expenses while maintaining service levels committed to Series matters. The Board was satisfied with the nature, extent, and quality of the overall services provided by DMC.
Nature, extent, and quality of services.The Board considered the services provided by MFMHK to the Series and its shareholders. In reviewing the nature, extent, and quality of services, the Board considered reports furnished to it throughout the year at regular Board Meetings covering matters such as relative performance of the Series; compliance of portfolio managers with the investment policies, strategies, and restrictions for the Series; the compliance of MFMHK personnel with its Code of Ethics; and adherence to fair value pricing procedures as established by the Board. The Board was pleased with the current staffing of MFMHK and the emphasis placed on research in the investment process. The Board was satisfied with the nature, extent, and quality of the overall services provided by MFMHK.
Nature, extent, and quality of services.The Board considered the services provided by MIMGL to the Series and its shareholders. In reviewing the nature, extent, and quality of services, the Board considered reports furnished to it throughout the year at regular Board Meetings covering matters such as relative performance of the Series; compliance of portfolio managers with the investment policies, strategies, and restrictions for the Series; the compliance of MIMGL personnel with its Code of Ethics; and adherence to fair value pricing procedures as established by the Board. The Board was pleased with the current staffing of MIMGL and the emphasis placed on research in the investment process. The Board was satisfied with the nature, extent, and quality of the overall services provided by MIMGL.
Investment performance.The Board placed significant emphasis on the investment performance of the Series in view of the importance of investment performance to shareholders. Although the Board considered performance reports and discussions with portfolio managers at Board meetings throughout the year, the Board gave particular weight to the Broadridge reports furnished for the Annual Meeting. The Broadridge reports prepared for the Series showed the investment performance of its Standard Class shares in comparison to a group of similar funds as selected by Broadridge (the “Performance Universe”). A fund with the best performance ranked first, and a fund with the poorest performance ranked last. The highest/best performing 25% of funds in the Performance Universe make up the first quartile; the next 25%, the second quartile; the next 25%, the third quartile; and the poorest/worst
Emerging Markets Series-23
Delaware VIP® Trust — Delaware VIP Emerging Markets Series
Other Series information (Unaudited)
Board consideration of Investment Advisory andSub-Advisory Agreements for Delaware VIP Emerging Markets Series at a meeting held August21-22, 2019 (continued)
performing 25% of funds in the Performance Universe make up the fourth quartile. Comparative annualized performance for the Series was shown for the past1-,3-,5-, and10-year periods, as applicable, ended Jan. 31, 2019. The Board’s objective is that the Series’ performance for the1-,3-, and5-year periods be at or above the median of its Performance Universe.
The Performance Universe for the Series consisted of the Series and all emerging markets funds underlying variable insurance products as selected by Broadridge. The Broadridge report comparison showed that the Series’ total return for the1-,3-,5-, and10-year periods was in the first quartile of its Performance Universe. The Board was satisfied with performance.
Comparative expenses.The Board considered expense data for the Delaware Funds. Management provided the Board with information on pricing levels and fee structures for the Series as of its most recently completed fiscal year. The Board also focused on the comparative analysis of effective management fees and total expense ratios of the Series versus effective management fees and expense ratios of a group of similar funds as selected by Broadridge (the “Expense Group”). In reviewing comparative costs, the Series’ contractual management fee and the actual management fee incurred by the Series were compared with the contractual management fees (assuming all funds in the Expense Group were similar in size to the Series) and actual management fees (as reported by each fund) within the Expense Group, taking into account any applicable breakpoints and fee waivers. The Series’ total expenses were also compared with those of its Expense Group. The Broadridge total expenses, for comparative consistency, were shown by Broadridge for Standard Class shares which do not charge12b-1 andnon-12b-1 service fees. The Board’s objective is for each Series’ total expense ratio to be competitive with those of the peer funds within its Expense Group.
The expense comparisons for the Series showed that the actual management fee was in the quartile with the second highest expenses of its Expense Group and its total expenses were in the quartile with the highest expenses of its Expense Group. The Series’ total expenses were not in line with the Board’s objective. In evaluating total expenses, the Board considered fee waivers in place through April 2020 and various initiatives implemented by Management, such as the negotiation of lower fees for fund accounting, fund accounting oversight and custody services, which had created an opportunity for a further reduction in expenses. The Board was satisfied with Management’s efforts to improve the Series’ total expense ratio and to bring it in line with the Board’s objective.
Management profitability.The Board considered the level of profits realized by DMC in connection with the operation of the Series. In this respect, the Board reviewed the Investment Management Profitability Analysis that addressed the overall profitability of DMC’s business in providing management and other services to each of the individual funds and the Delaware Funds as a whole. Specific attention was given to the methodology used by DMC in allocating costs for the purpose of determining profitability. Management stated that the level of profits of DMC, to a certain extent, reflects recent operational cost savings and efficiencies initiated by DMC. The Board considered DMC’s efforts to improve services provided to fund shareholders and to meet additional regulatory and compliance requirements resulting from recent industry-wide Securities and Exchange Commission initiatives. The Board also considered the extent to which DMC might derive ancillary benefits from fund operations, including the potential for procuring additional business as a result of the prestige and visibility associated with its role as service provider to the Delaware Funds and the benefits from allocation of fund brokerage to improve trading efficiencies. As part of its work, the Board also reviewed a report prepared by JDL regarding MIMBT profitability as compared to certain peer fund complexes and the Independent Trustees discussed with JDL personnel regarding DMC’s profitability in such context. The Board found that the management fees were reasonable in light of the services rendered and the profitability of DMC.
Economies of scale.The Trustees considered whether economies of scale are realized by DMC as the Series’ assets increase and the extent to which any economies of scale are reflected in the level of management fees charged. The Trustees reviewed the Series’ advisory fee pricing and structure approved by the Board and shareholders, which includes breakpoints, and which applies to most funds in the Delaware Funds complex. Breakpoints in the advisory fee occur when the advisory fee rate is reduced on assets in excess of specified levels. Breakpoints result in a lower advisory fee, than would otherwise be the case in the absence of breakpoints, when the asset levels specified in the breakpoints are exceeded. The Board noted that, as of March 31, 2019, the Series’ assets exceeded the first breakpoint level. The Board believed that, given the extent to which economies of scale might be realized by DMC and its affiliates, the schedule of fees under the Investment Management Agreement provides a sharing of benefits with the Series and its shareholders.
Emerging Markets Series-24
Delaware VIP® Trust — Delaware VIP Emerging Markets Series
Other Series information (Unaudited)
Tax Information
All disclosures are based on financial information available as of the date of this annual report and, accordingly are subject to change. For any and all items requiring reporting, it is the intention of the Series to report the maximum amount permitted under the Internal Revenue Code and the regulations thereunder.
For the year ended Dec. 31, 2019, the Series reports distributions paid during the year as follows:
| | | | | | |
(A)
Long-Term
Capital Gain
Distributions
(Tax Basis) | | (B)
Ordinary Income
Distributions
(Tax Basis) | | Total
Distributions
(Tax Basis) | | (C)
Qualifying
Dividends1
|
| 73.82% | | 26.18% | | 100.00% | | 11.09% |
(A) and (B) are based on a percentage of the Series’ total distributions.
(C) is based on a percentage of the Series’ ordinary distributions.
1Qualifying dividends represent dividends which qualify for the corporate dividends received deduction.
The Series intends to pass through foreign tax credits in the maximum amount of $1,524,105. The gross foreign source income earned during the fiscal year ended Dec. 31, 2019 by the Series was $15,500,496.
Emerging Markets Series-25
Delaware Funds® by Macquarie
Board of trustees / directors and officers addendum
A mutual fund is governed by a Board of Trustees/Directors (“Trustees”), which has oversight responsibility for the management of a fund’s business affairs. Trustees establish procedures and oversee and review the performance of the investment manager, the distributor, and others who perform services for the fund. The independent fund trustees, in particular, are advocates for shareholder interests. Each trustee has served in that capacity since he or she was elected to or appointed to the Board of Trustees, and will continue to serve until his or her retirement or the election of a new trustee in his or her place. The following is a list of the Trustees and Officers with certain background and related information.
| | | | | | | | | | |
Name, Address, and Birth Date | | Position(s) Held with Fund(s) | | Length of Time Served | | Principal Occupation(s) During the Past Five Years | | Number of
Portfolios in Fund
Complex Overseen
by Trustee or Officer | | Other
Directorships
Held by Trustee or Officer |
INTERESTED TRUSTEE | | | | | | |
| | | | | |
Shawn K. Lytle1
2005 Market Street Philadelphia, PA 19103 February 1970 | | President,
Chief Executive Officer,
and Trustee | | President and
Chief Executive Officer
since August 2015 Trustee since September 2015 | | President — Macquarie
Investment Management2
(June 2015-Present) Regional Head of
Americas — UBS Global
Asset Management
(April2010-May 2015) | | 95 | | Trustee —
UBS Relationship Funds,
SMA Relationship Trust,
and UBS Funds
(May 2010–April 2015) |
INDEPENDENT TRUSTEES | | | | | | |
| | | | | |
Thomas L. Bennett
2005 Market Street
Philadelphia, PA 19103 October 1947 | | Chair and Trustee | | Trustee since
March 2005 Chair since March 2015 | | Private Investor
(March 2004–Present) | | 95 | | None |
Jerome D. Abernathy
2005 Market Street
Philadelphia, PA 19103 July 1959 | | Trustee | | Since
January 2019 | | Managing Member,
Stonebrook Capital
Management, LLC
(financial technology: macro
factors and databases)
(January 1993–Present) | | 95 | | None |
| | | | | |
Ann D. Borowiec
2005 Market Street
Philadelphia, PA 19103 November 1958 | | Trustee | | Since
March 2015 | | Chief Executive Officer,
Private Wealth Management
(2011–2013) and Market Manager,
New Jersey Private Bank
(2005–2011) —
J.P. Morgan Chase & Co. | | 95 | | Director —
Banco Santander International
(October 2016–December 2019) Director —
Santander Bank, N.A. (December 2016–December 2019) |
| | | | | |
Joseph W. Chow
2005 Market Street
Philadelphia, PA 19103 January 1953 | | Trustee | | Since
January 2013 | | Private Investor
(April 2011–Present) | | 95 | | Director and Audit
Committee
Member — Hercules
Technology Growth
Capital, Inc.
(July 2004–July 2014) |
Emerging Markets Series-26
| | | | | | | | | | |
Name, Address,
and Birth Date | | Position(s) Held with Fund(s) | | Length of Time Served | | Principal Occupation(s) During the Past Five Years | | Number of
Portfolios in Fund
Complex Overseen
by Trustee or Officer | | Other Directorships Held by Trustee or Officer |
| John A. Fry | | Trustee | | Since | | President — | | 95 | | Director; Compensation |
| 2005 Market Street | | | | January 2001 | | Drexel University | | | | Committee |
| Philadelphia, PA 19103 | | | | | | (August 2010–Present) | | | | and Governance |
| | | | | | | | | | Committee Member — |
| May 1960 | | | | | | President — | | | | Community Health |
| | | | | | Franklin & Marshall College | | | | Systems |
| | | | | | (July 2002–July 2010) | | | | (May 2004–Present) |
| | | | | |
| | | | | | | | | | Director — |
| | | | | | | | | | Drexel Morgan & Co. |
| | | | | | | | | | (2015–Present) |
| | | | | |
| | | | | | | | | | Director and Audit |
| | | | | | | | | | Committee Member — |
| | | | | | | | | | vTv Therapeutics LLC |
| | | | | | | | | | (2017–Present) |
| | | | | |
| | | | | | | | | | Director and Audit Committee |
| | | | | | | | | | Member —FS Credit Real |
| | | | | | | | | | Estate Income Trust, Inc. |
| | | | | | | | | | (2018–Present) |
| | | | | |
| | | | | | | | | | Director —Federal Reserve |
| | | | | | | | | | Bank of Philadelphia |
| | | | | | | | | | | (January 2020–Present) |
| Lucinda S. Landreth | | Trustee | | Since | | Private Investor | | 95 | | None |
| 2005 Market Street | | | | March 2005 | | (2004–Present) | | | | |
| Philadelphia, PA 19103 | | | | | | | | | | |
| | | | | |
June 1947 | | | | | | | | | | |
| | | | | |
| Frances A. Sevilla-Sacasa | | Trustee | | Since | | Private Investor | | 95 | | Trust Manager and |
| 2005 Market Street | | | | September 2011 | | (January 2017-Present) | | | | Audit Committee |
| Philadelphia, PA 19103 | | | | | | | | | | Chair — Camden |
| | | | | | Chief Executive Officer — | | | | Property Trust |
| January 1956 | | | | | | Banco Itaú | | | | (August 2011–Present) |
| | | | | | International | | | | |
| | | | | | (April 2012–December 2016) | | | | Director; Strategic Planning |
| | | | | | | | | | and Reserves Committee |
| | | | | | Executive Advisor to Dean | | | | and Nominating |
| | | | | | (August 2011–March 2012) | | | | and Governance Committee |
| | | | | | and Interim Dean | | | | Member — Callon |
| | | | | | (January 2011–July 2011) — | | | | Petroleum Company |
| | | | | | University of Miami School of | | | | (December 2019–Present) |
| | | | | | Business Administration | | | | |
| | | | | | | | | | Director; Audit Committee |
| | | | | | President — U.S. Trust, | | | | Member — Carrizo |
| | | | | | Bank of America Private | | | | Oil & Gas, Inc. |
| | | | | | Wealth Management | | | | (March 2018–December |
| | | | | | (Private Banking) | | | | 2019) |
| | | | | | | (July 2007–December 2008) | | | | |
| Thomas K. Whitford | | Trustee | | Since | | Vice Chairman | | 95 | | Director — HSBC North |
| 2005 Market Street | | | | January 2013 | | (2010–April 2013) — | | | | America Holdings Inc. |
| Philadelphia, PA 19103 | | | | | | PNC Financial | | | | (December 2013-Present) |
| | | | | | Services Group | | | | |
| March 1956 | | | | | | | | | | Director —HSBC USA Inc. |
| | | | | | | | | | (July 2014-Present) |
| | | | | |
| | | | | | | | | | Director — |
| | | | | | | | | | HSBC Bank USA, |
| | | | | | | | | | National Association |
| | | | | | | | | | (July 2014-March 2017) |
| | | | | |
| | | | | | | | | | Director — HSBC |
| | | | | | | | | | Finance Corporation |
| | | | | | | | | | | (December 2013-April 2018) |
Emerging Markets Series-27
| | | | | | | | | | |
Name, Address, and Birth Date | | Position(s) Held with Fund(s) | | Length of Time Served | | Principal Occupation(s) During the Past Five Years | | Number of Portfolios in Fund Complex Overseen by Trustee or Officer | | Other Directorships Held by Trustee or Officer |
| Christianna Wood | | Trustee | | Since | | Chief Executive Officer | | 95 | | Director; Finance Committee |
| 2005 Market Street | | | | January 2019 | | and President — | | | | and Audit Committee |
| Philadelphia, PA 19103 | | | | | | Gore Creek Capital, Ltd. | | | | Member — H&R |
| | | | | | (August 2009–Present) | | | | Block Corporation |
| March 1956 | | | | | | | | | | (July 2008–Present) |
| | | | | |
| | | | | | | | | | Director; Chair of Investments |
| | | | | | | | | | Committee and Audit |
| | | | | | | | | | Committee Member — |
| | | | | | | | | | Grange Insurance |
| | | | | | | | | | (2013–Present) |
| | | | | |
| | | | | | | | | | Trustee; Chair of |
| | | | | | | | | | Nominating and |
| | | | | | | | | | Governance Committee |
| | | | | | | | | | and Audit Committee |
| | | | | | | | | | Member — |
| | | | | | | | | | The Merger Fund |
| | | | | | | | | | (2013–Present), |
| | | | | | | | | | The Merger Fund VL |
| | | | | | | | | | (2013–Present); |
| | | | | | | | | | WCM Alternatives: |
| | | | | | | | | | Event-Driven Fund |
| | | | | | | | | | (2013–Present), |
| | | | | | | | | | and WCM Alternatives: |
| | | | | | | | | | Credit Event Fund |
| | | | | | | | | | (December 2017–Present) |
| | | | | |
| | | | | | | | | | Director; Chair of |
| | | | | | | | | | Governance Committee |
| | | | | | | | | | and Audit Committee |
| | | | | | | | | | Member — International |
| | | | | | | | | | Securities Exchange |
| | | | | | | | | | | (2010–2016) |
| Janet L. Yeomans | | Trustee | | Since | | Vice President and Treasurer | | 95 | | Director; Personnel and |
| 2005 Market Street | | | | April 1999 | | (January 2006–July 2012), | | | | Compensation Committee |
| Philadelphia, PA 19103 | | | | | | Vice President — | | | | Chair; Member of |
| | | | | | Mergers & Acquisitions | | | | Nominating, Investments, |
| July 1948 | | | | | | (January 2003–January 2006), and | | | | and Audit Committees for |
| | | | | | Vice President and Treasurer | | | | various periods |
| | | | | | (July 1995–January 2003) — | | | | throughout directorship |
| | | | | | 3M Company | | | | — Okabena Company |
| | | | | | | | | | | (2009-2017) |
Emerging Markets Series-28
| | | | | | | | | | |
Name,
Address,
and Birth Date | | Position(s)
Held with
Fund(s) | | Length of Time
Served | | Principal Occupation(s)
During the
Past Five Years | | Number of
Portfolios in Fund
Complex Overseen
by Trustee
or Officer | | Other
Directorships
Held by
Trustee
or Officer |
| OFFICERS | | | | | | | | | | |
| | | | | |
| David F. Connor | | Senior | | Senior Vice President, | | David F. Connor has served in | | 95 | | None3 |
| 2005 Market Street | | Vice President, | | since May 2013; | | various capacities at different | | | | |
| Philadelphia, PA 19103 | | General Counsel, | | General Counsel | | times at Macquarie Investment | | | | |
| | and Secretary | | since May 2015; | | Management. | | | | |
| December 1963 | | | | Secretary since | | | | | | |
| | | | | October 2005 | | | | | | |
| | | | | |
| Daniel V. Geatens | | Vice President | | Vice President | | Daniel V. Geatens has served in | | 95 | | None3 |
| 2005 Market Street | | and Treasurer | | and Treasurer | | various capacities at different | | | | |
| Philadelphia, PA 19103 | | | | since | | times at Macquarie Investment | | | | |
| | | | October 2007 | | Management. | | | | |
| October 1972 | | | | | | | | | | |
| | | | | |
| Richard Salus | | Senior | | Senior Vice President | | Richard Salus has served in | | 95 | | None |
| 2005 Market Street | | Vice President | | and Chief Financial | | various capacities at different | | | | |
| Philadelphia, PA 19103 | | and | | Officer since | | times at Macquarie Investment | | | | |
| | Chief Financial | | November 2006 | | Management. | | | | |
| October 1963 | | Officer | | | | | | | | |
| 1 | Shawn K. Lytle is considered to be an “Interested Trustee” because he is an executive officer of the Fund’s(s’) investment advisor. |
| 2 | Macquarie Investment Management is the marketing name for Macquarie Management Holdings, Inc. and its subsidiaries, including the Fund’s(s’) investment advisor, principal underwriter, and its transfer agent. |
| 3 | David F. Connor and Daniel V. Geatens serve in similar capacities for the six portfolios of the Optimum Fund Trust, which have the same investment advisor, principal underwriter, and transfer agent as the registrant. Mr. Greatens also serves as the Chief Financial Officer of the Optimum Fund Trust and he is the Chief Financial Officer and Treasurer for Macquarie Global Infrastructure Total Return Fund Inc. |
The Statement of Additional Information for the Fund(s) includes additional information about the Trustees and Officers and is available, without charge, upon request by calling 800523-1918.
Emerging Markets Series-29
| | | | |
| | |
| | The Series files its complete schedule of portfolio holdings with the Securities and Exchange Commission (SEC) for the first and third quarters of each fiscal year on FormN-Q or FormN-PORT (available for filings after March 31, 2019). The Series’ FormsN-Q or FormsN-PORT, as well as a description of the policies and procedures that the Series uses to determine how to vote proxies (if any) relating to portfolio securities, are available without charge (i) upon request, by calling 800523-1918; and (ii) on the SEC’s website at sec.gov. In addition, a description of the policies and procedures that the Series uses to determine how to vote proxies (if any) relating to portfolio securities and the Schedule of Investments included in the Series’ most recent FormN-Q or FormN-PORT are available without charge on the Series’ website at delawarefunds.com/vip/literature. The Series’ FormsN-Q and FormsN-PORT may be reviewed and copied at the SEC’s Public Reference Room in Washington, D.C.; information on the operation of the Public Reference Room may be obtained by calling 800SEC-0330. Information (if any) regarding how the Series voted proxies relating to portfolio securities during the most recently disclosed12-month period ended June 30 is available without charge (i) through the Series’ website at delawarefunds.com/proxy; and (ii) on the SEC’s website at sec.gov. | | |
| | |
| AR-VIPEM 22463 (2/20) (1073909) | | Emerging Markets Series-30 |

Delaware VIP® Trust
Delaware VIP Smid Cap Core Series
December 31, 2019
Beginning on or about June 1, 2021, as permitted by regulations adopted by the Securities and Exchange Commission, paper copies of your Series’ shareholder reports will no longer be sent to you by mail, unless you specifically request them from the Series or from your financial intermediary, such as a broker/dealer, bank, or insurance company. Instead, you will be notified by mail each time a report is posted on the website and provided with a link to access the report.
If you already elected to receive shareholder reports electronically, you will not be affected by this change and you do not need to take any action.
You may elect to receive paper copies of all future shareholder reports free of charge. You can inform the Series that you wish to continue receiving paper copies of your shareholder reports by contacting us at 800523-1918. If you own these shares through a financial intermediary, you may contact your financial intermediary to elect to continue to receive paper copies of your shareholder reports. Your election to receive reports in paper will apply to all funds held with the Delaware Funds® by Macquarie or your financial intermediary.

Table of contents
| | |
| | Other than Macquarie Bank Limited (MBL), none of the entities noted are authorized deposit-taking institutions for the purposes of the Banking Act 1959 (Commonwealth of Australia). The obligations of these entities do not represent deposits or other liabilities of MBL. MBL does not guarantee or otherwise provide assurance in respect of the obligations of these entities, unless noted otherwise. The Series is governed by US laws and regulations. Unless otherwise noted, views expressed herein are current as of Dec. 31, 2019, and subject to change for events occurring after such date. The Series is not FDIC insured and is not guaranteed. It is possible to lose the principal amount invested. Advisory services provided by Delaware Management Company, a series of Macquarie Investment Management Business Trust (MIMBT), a US registered investment advisor. The Series is distributed byDelaware Distributors, L.P.(DDLP), an affiliate of MIMBT and Macquarie Group Limited. Macquarie Investment Management (MIM) is the marketing name for certain companies comprising the asset management division of Macquarie Group Limited and its subsidiaries and affiliates worldwide. This material may be used in conjunction with the offering of shares in Delaware VIP® Smid Cap Core Series only if preceded or accompanied by the Series’ current prospectus or the summary prospectus. © 2020 Macquarie Management Holdings, Inc. All third-party marks cited are the property of their respective owners. |
| | |
| Delaware VIP®Trust — Delaware VIP Smid Cap Core Series |
| Portfolio management review | | January 7, 2020 (Unaudited) |
The investment objective of the Series is to seek long-term capital appreciation.
For the fiscal year ended Dec. 31, 2019, Delaware VIP Smid Cap Core Series (the “Series”) Standard Class shares gained 29.63% and Service Class shares appreciated 29.25%. Both figures reflect all dividends reinvested. The Series’ benchmark, the Russell 2500TM Index, appreciated 27.77% for the same period.
Over the year, small- andmid-cap stocks underperformedlarge-cap stocks. Thesmaller-cap Russell 2000® Index gained 25.52% for the year while the Russell Midcap® Index gained 30.54%, and thelarge-cap Russell 1000® Index advanced 31.43%. Growth companies outperformed value companies during the year as the Russell 2500™ Growth Index appreciated 32.65% versus the 23.56% gain for the Russell 2500™ Value Index.
In the Russell 2500 Index, high-beta (more volatile) companies outperformed lower-beta stocks, and companies without earnings — as well as those with higherprice-to-earnings (P/E) ratios — returned more on average than companies with lower P/E ratios. Sector-level performance within the Russell 2500 Index was mostly positive with 15 of 16 sectors advancing, and only the energy sector declining. The technology, credit cyclicals, capital goods, healthcare, and transportation sectors were the strongest-performing sectors in the benchmark, each advancing more than 30% during the year. The consumer discretionary, utilities, consumer staples, and media sectors in the benchmark were relative laggards during the year, each advancing more than 10% but returning less than the benchmark on average.
On the economic front, the gross domestic product (GDP) growth rate slowed in the third quarter, measuring 2.1%. At 3.5% in December, the unemployment rate remained at historically low levels. While the Conference Board Consumer Confidence Index® (1985=100, SA) trended lower over the year, a December figure of 126.5 continued to indicate confidence. In the manufacturing sector, the Purchasing Managers’ Index (PMI) has remained below 50 five months in a row; the December report was 47.2%. The National Federation of Independent Business (NFIB) Small Business Optimism Index ended the year with a relatively strong reading of 102.7 in December as small business owners understand that they are in a supportive environment.
Stock selection was the main contributor to relative outperformance during the year. Stock selection contributed in 12 of 16 sectors for the year. Stock selection in the healthcare, basic materials, energy, and real estate investment trust (REIT) sectors were the largest contributing sectors, while stock selection detracted in the technology, credit cyclicals, consumer services, and media sectors. The Series benefited from 10 holdings announcing plans to be acquired during the year. The takeout activity occurred across sectors with four in healthcare, two in technology, and one in each basic materials, business services, energy, and transportation.
Commercial-stage, specialty biotechnology companyMedicines Co.contributed to the Series’ relative performance. During the year, the company continued to report positive readouts on its ongoing trial for inclisiran, a potentially transformational medicine that reimagines the treatment of atherosclerotic cardiovascular disease and familial hypercholesterolemia. Shortly after Medicines reported positive phase 3 trial results for inclisiran, Novartis AG entered into an agreement and plan of merger with Medicines to acquire the company at a 24% premium to its prior day’s closing price. We maintained the Series’ position in Medicines as we will receive cash for our shares when the deal closes in early January 2020.
In the basic materials sector, metals processing company,Reliance Steel & Aluminum Co., outperformed. The company reported multiple quarters of earnings beats as the company continued to execute on its strategy of providing high levels of customer service to increase orders of itsvalue-add processing. Reliance Steel & Aluminum’s focus on higher margin business and its disciplined pricing strategy enabled the company to increase its dividend and buy back its stock during the year, delivering shareholder value. We maintained the Series’ position in Reliance Steel & Aluminum as the company’s unique business model should allow for continued growth, in our view.
Glucose monitoring systems companyDexCom Inc.also outperformed. The company’s sales and earnings per share (EPS) exceeded expectations throughout the year, while the company continued to raise guidance. DexCom remains the leader in continuous glucose monitoring systems for individuals with diabetes as evidenced by its strong patient adoption. We maintained the Series’ position in DexCom as we continue to see ample opportunities for growth and margin improvement.
In the credit cyclicals sector,Tenneco Inc.detracted from performance. The company designs, manufactures, and distributes engineered products for automobiles and commercial trucks. Tenneco operates two businesses, Aftermarket and Ride Performance, which the company calls DRiV, and Powertrain Technology. Tenneco expected to spinoff the DRiV business in the second half of 2019 but delayed due toend-market headwinds that have pressured the company’s financials. The company has yet to release a new spinoff date, but it has improved its earnings since its fiscal first-quarter earnings miss in early May. We remain invested in Tenneco as its valuation is discounted and management is committed to taking strategic actions to deliver shareholder value and improve the company’s financials.
Smid Cap Core Series-1
| | |
| Delaware VIP®Trust — Delaware VIP Smid Cap Core Series |
| Portfolio management review (continued) | | January 7, 2020 (Unaudited) |
Granite Construction Inc., a civil contractor and construction-materials producer, detracted from performance. The company’s principal projects are infrastructure-related and include bridges, tunnels, rail, and road. During the fiscal year, shares of Granite underperformed as issues in its Heavy Civil group hurt the company’s earnings before interest, taxes, depreciation, and amortization (EBITDA). Management acknowledged disappointment in the results from its Heavy Civil group and accelerated a strategic review of the business that resulted in a replacement of the group’s management and implementation of a new project-pricing model to mitigate risk. While Granite’s shares are undervalued, it remains in the Series as we continue to monitor the company’s fundamentals and new projects.
Shares of multi-brand apparel companyAmerican Eagle Outfitters Inc.underperformed during the year. Beginning in May, the retail apparel industry began to pull back due to the business risk from tariffs. Like most apparel companies, American Eagle Outfitters sources through China. The company has indicated that it has already begun working with its manufacturers in China to mitigate the impact from tariffs and is always looking to geographically diversify its manufacturing partners. The company beat earnings expectations throughout the year with record revenue and comparable sales growth. American Eagle Outfitters trades at a discount to its historical valuation, has a strong free-cash flow yield, and is repurchasing its common stock. We maintained the Series’ position in American Eagle Outfitters as we think it remains well positioned for continued growth, particularly in its differentiated intimate apparel line for women, Aerie.
With respect to sector positioning, the Series ended the year with its largest relative overweight to companies in the basic materials, capital goods, healthcare, and technology sectors. The largest sector underweights were in business services, consumer services, credit cyclicals, and energy. On balance, we believe the macroeconomic environment favors active managers that can apply thorough company-level analysis when making investment decisions. We continue to maintain our strategy of investing in companies that, we believe, have strong balance sheets and cash flow, sustainable competitive advantages, and high-quality management teams with the ability to deliver value to shareholders.
Unless otherwise noted, views expressed herein are current as of Dec. 31, 2019, and subject to change.
Smid Cap Core Series-2
Delaware VIP® Trust — Delaware VIP Smid Cap Core Series
Performance summary (Unaudited)
The performance quoted represents past performance and does not guarantee future results. Investment return and principal value of an investment will fluctuate so that shares, when redeemed, may be worth more or less than their original cost. Current performance may be lower or higher than the performance quoted.
Carefully consider the Series’ investment objectives, risk factors, charges, and expenses before investing. This and other information can be found in the Series’ prospectus and its summary prospectus, which may be obtained by visiting delawarefunds.com/vip/literature or calling 800523-1918. Investors should read the prospectus and the summary prospectus carefully before investing.
| | | | | | | | | | | | | | | | | | | | |
Delaware VIP Smid Cap Core Series | | | | | | | | | | | | | | | | | | | | |
| Average annual total returns | | | | | | | | | | | | | | | |
| For periods ended December 31, 2019 | | 1 year | | | 3 year | | | 5 year | | | 10 year | | | Lifetime | |
Standard Class shares (commenced operations on July 12, 1991) | | | +29.63% | | | | +10.57% | | | | +9.50% | | | | +14.15% | | | | +10.21% | |
| | | | | | | | | | | | | | | | |
Service Class shares (commenced operations on May 1, 2000) | | | +29.25% | | | | +10.26% | | | | +9.21% | | | | +13.85% | | | | +6.67% | |
| | | | | | | | | | | | | | | | |
Russell 2500 Index | | | +27.77% | | | | +10.33% | | | | +8.93% | | | | +12.58% | | | | n/a | |
Returns reflect the reinvestment of all distributions. Please see page 4 for a description of the index.
As described in the Series’ most recent prospectus, the net expense ratio for Service Class shares of the Series was 1.11%, while total operating expenses for Standard Class and Service Class shares were 0.81% and 1.11%, respectively. The management fee for Standard Class and Service Class shares was 0.74%.
The Series pays Delaware Distributors, L.P. (DDLP), the distributor and an affiliate of DMC, an annual12b-1 fee of 0.30% of the average daily net assets of the Service Class shares.
Earnings from a variable annuity or variable life investment compoundtax-free until withdrawal, and as a result, no adjustments were made for income taxes.
Expense limitations were in effect for both classes during certain periods shown in the Series performance table above and in the Performance of a $10,000 Investment graph on the next page.
Performance data do not reflect insurance fees related to a variable annuity or variable life investment or the deferred sales charge that would apply to certain withdrawals of investments held for fewer than eight years. Performance shown here would have been reduced if such fees were included and the expense limitation removed. For more information about fees, consult your variable annuity or variable life prospectus.
Investments in variable products involve risk.
Investments in small and/ormedium-sized companies typically exhibit greater risk and higher volatility than larger, more established companies.
Holding a relatively concentrated portfolio of a limited number of securities may increase risk because each investment has a greater effect on the Series’ overall performance than would be the case for a more diversified fund.
REIT investments are subject to many of the risks associated with direct real estate ownership, including changes in economic conditions, credit risk, and interest rate fluctuations.
International investments entail risks not ordinarily associated with US investments including fluctuation in currency values, differences in accounting principles, or economic or political instability in other nations.
Investing in emerging markets can be riskier than investing in established foreign markets due to increased volatility and lower trading volume.
Please read both the contract and underlying prospectus for specific details regarding the product’s risk profile.
Smid Cap Core Series-3
Delaware VIP® Smid Cap Core Series
Performance summary (Unaudited) (continued)
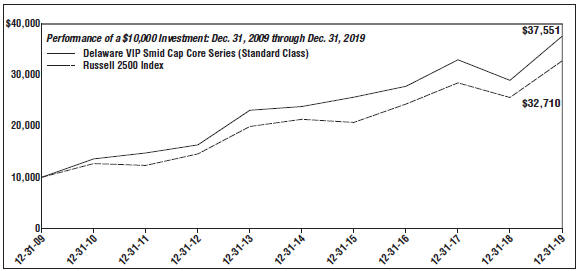
| | | | |
| For period beginning Dec. 31, 2009 through Dec. 31, 2019 | | Starting value | | Ending value |
— Delaware VIP Smid Cap Core Series (Standard Class) | | $10,000 | | $37,551 |
– – Russell 2500 Index | | $10,000 | | $32,710 |
The graph shows a $10,000 investment in the Delaware VIP Smid Cap Core Series Standard Class shares for the period from Dec. 31, 2008 through Dec. 31, 2019.
The graph also shows $10,000 invested in the Russell 2500 Index for the period from Dec. 31, 2008 through Dec. 31, 2019. The Russell 2500 Index measures the performance of the small- tomid-cap segment of the US equity universe. The Russell 2500 Index is a subset of the Russell 3000® Index, representing approximately 2,500 of the smallest securities based on a combination of their market cap and current index membership.
The Russell 1000 Index, mentioned on page 1, measures the performance of thelarge-cap segment of the US equity universe.
The Russell 2000 Index, mentioned on page 1, measures the performance of thesmall-cap segment of the US equity universe.
The Russell 2500 Growth Index, mentioned on page 1, measures the performance of the small- tomid-cap growth segment of the US equity universe. It includes those Russell 2500 companies with higherprice-to-book ratios and higher forecasted growth values.
The Russell 2500 Value Index, mentioned on page 1, measures the performance of the small- tomid-cap value segment of the US equity universe. It includes those Russell 2500 companies with lowerprice-to-book ratios and lower forecasted growth values.
The Russell Midcap Index, mentioned on page 1, measures the performance of themid-cap segment of the US equity universe. The Russell Midcap Index is a subset of the Russell 1000 Index.
The Conference Board Consumer Confidence Index, mentioned on page 1, is a barometer of the health of the US economy from the perspective of the consumer. The index is based on consumers’ perceptions of current business and employment conditions, as well as their expectations for six months hence regarding business conditions, employment, and income. The resulting relative value is then used as an “index value” and compared against each respective monthly value for 1985. In that year, the result of the index was arbitrarily set at 100, representing it as the index benchmark.
The Purchasing Managers’ Index (PMI), mentioned on page 1, is an indicator of the economic health of the manufacturing sector. A PMI reading above 50% indicates that the manufacturing economy is generally expanding; below 50% indicates that it is generally contracting.
The NFIB Small Business Optimism Index, mentioned on page 1, is a survey asking small business owners a battery of questions related to their expectations for the future and their plans to hire, build inventory, borrow, and expand.
Gross domestic product is a measure of all goods and services produced by a nation in a year.
Theprice-to-earnings ratio (P/E ratio) is a valuation ratio of a company’s current share price compared to its earnings per share. Generally, a high P/E ratio means that investors are anticipating higher growth in the future.
Smid Cap Core Series-4
Delaware VIP® Smid Cap Core Series
Performance summary (Unaudited) (continued)
Frank Russell Company is the source and owner of the trademarks, service marks, and copyrights related to the Russell Indexes. Russell® is a trademark of Frank Russell Company.
Index performance returns do not reflect any management fees, transaction costs or expenses. Indices are unmanaged and one cannot invest directly in an index.
Performance of Service Class shares will vary due to different charges and expenses.
Past performance is not a guarantee of future results.
Smid Cap Core Series-5
Delaware VIP® Trust — Delaware VIP Smid Cap Core Series
Disclosure of Series expenses
For thesix-month period from July 1, 2019 to December 31, 2019 (Unaudited)
As a shareholder of the Series, you incur ongoing costs, which may include management fees; distribution and service(12b-1) fees; and other Series expenses. This example is intended to help you understand your ongoing costs (in dollars) of investing in the Series and to compare these costs with the ongoing costs of investing in other mutual funds.
The example is based on an investment of $1,000 invested at the beginning of the period and held for the entiresix-month period from July 1, 2019 to Dec. 31, 2019.
Actual expenses
The first section of the table shown, “Actual Series return,” provides information about actual account values and actual expenses. You may use the information in this section of the table, together with the amount you invested, to estimate the expenses that you paid over the period. Simply divide your account value by $1,000 (for example, an $8,600 account value divided by $1,000 = 8.6), then multiply the result by the number in the first section under the heading entitled “Expenses Paid During Period” to estimate the expenses you paid on your account during the period.
Hypothetical example for comparison purposes
The second section of the table shown, “Hypothetical 5% Return,” provides information about hypothetical account values and hypothetical expenses based on the Series’ actual expense ratio and an assumed rate of return of 5% per year before expenses, which is not the Series’ actual return. The hypothetical account values and expenses may not be used to estimate the actual ending account balance or expenses you paid for the period. You may use this information to compare the ongoing costs of investing in the Series and other funds. To do so, compare the 5% hypothetical example with the 5% hypothetical examples that appear in the shareholder reports of other funds.
Please note that the expenses shown in the table are meant to highlight your ongoing costs only. As a shareholder of the Series, you do not incur any transaction costs, such as sales charges (loads), redemption fees or exchange fees, but shareholders of other funds may incur such costs. Also, the fees related to the variable annuity investment or the deferred sales charge that could apply have not been included. Therefore, the second section of the table is useful in comparing ongoing costs only, and will not help you determine the relative total costs of owning different funds. The Series’ expenses shown in the table assume reinvestment of all dividends and distributions.
Expense analysis of an investment of $1,000
| | | | | | | | | | | | | | |
| | | Beginning
Account
Value
7/1/19 | | | Ending
Account
Value
12/31/19 | | | Annualized
Expense
Ratio | | Expenses
Paid During
Period
7/1/19 to
12/31/19* | |
Actual Series return† | | | | |
Standard Class | | | $1,000.00 | | | | $1,071.00 | | | 0.81% | | | $4.23 | |
Service Class | | | 1,000.00 | | | | 1,069.30 | | | 1.11% | | | 5.79 | |
Hypothetical 5% return(5% return before expenses) | |
Standard Class | | | $1,000.00 | | | | $1,021.12 | | | 0.81% | | | $4.13 | |
Service Class | | | 1,000.00 | | | | 1,019.61 | | | 1.11% | | | 5.65 | |
| *“ | Expenses Paid During Period” are equal to the Series’ annualized expense ratio, multiplied by the average account value over the period, multiplied by 184/365 (to reflect theone-half year period). |
| † | Because actual returns reflect only the most recentsix-month period, the returns shown may differ significantly from fiscal year returns. |
In addition to the Series’ expenses reflected above, the Series also indirectly bears its portion of the fees and expenses of the investment companies (Underlying Funds) in which it invests. The table above does not reflect the expenses of the Underlying Funds.
Smid Cap Core Series-6
Delaware VIP® Trust — Delaware VIP Smid Cap Core Series
Security type / sector allocation and top 10 equity holdings
As of December 31, 2019 (Unaudited)
Sector designations may be different than the sector designations presented in other Series materials. The sector designations may represent the investment manager’s internal sector classifications.
| | |
| Security type / sector | | Percentage of
net assets |
Common Stock | | 97.34% |
Basic Materials | | 9.15% |
Business Services | | 3.51% |
Capital Goods | | 12.61% |
Communications Services | | 0.82% |
Consumer Discretionary | | 3.39% |
Consumer Services | | 1.93% |
Consumer Staples | | 1.85% |
Credit Cyclicals | | 1.56% |
Energy | | 1.20% |
Financial Services | | 14.44% |
Healthcare | | 14.27% |
Media | | 1.07% |
Real Estate Investment Trusts | | 9.50% |
Technology | | 16.46% |
Transportation | | 1.23% |
Utilities | | 4.35% |
Short-Term Investments | | 1.98% |
Total Value of Securities | | 99.32% |
Receivables and Other Assets Net of Liabilities | | 0.68% |
Total Net Assets | | 100.00% |
Holdings are for informational purposes only and are subject to change at any time. They are not a recommendation to buy, sell, or hold any security.
| | |
| Top 10 equity holdings | | Percentage
of net assets |
Spire | | 1.60% |
Paycom Software | | 1.58% |
Tyler Technologies | | 1.57% |
NorthWestern | | 1.56% |
Reliance Steel & Aluminum | | 1.49% |
Reinsurance Group of America | | 1.28% |
SS&C Technologies Holdings | | 1.28% |
Proofpoint | | 1.22% |
DexCom | | 1.21% |
South Jersey Industries | | 1.19% |
Smid Cap Core Series-7
Delaware VIP® Trust — Delaware VIP Smid Cap Core Series
Schedule of investments
December 31, 2019
| | | | | | | | |
| | | Number of
shares | | | Value
(US $) | |
| |
Common Stock – 97.34% | | | | | |
Basic Materials – 9.15% | | | | | |
Balchem | | | 47,213 | | | $ | 4,798,257 | |
Continental Building Products † | | | 190,342 | | | | 6,934,159 | |
Eastman Chemical | | | 65,020 | | | | 5,153,485 | |
Huntsman | | | 288,395 | | | | 6,967,623 | |
Kaiser Aluminum | | | 65,194 | | | | 7,229,363 | |
Minerals Technologies | | | 93,622 | | | | 5,395,436 | |
Neenah | | | 90,478 | | | | 6,372,366 | |
Reliance Steel & Aluminum | | | 78,174 | | | | 9,362,118 | |
Worthington Industries | | | 124,372 | | | | 5,246,011 | |
| | | | | | | | |
| | | | | | | 57,458,818 | |
| | | | | | | | |
Business Services – 3.51% | | | | | |
ABM Industries | | | 113,005 | | | | 4,261,418 | |
Aramark | | | 129,580 | | | | 5,623,772 | |
ASGN † | | | 70,835 | | | | 5,027,160 | |
Mobile Mini | | | 73,345 | | | | 2,780,509 | |
US Ecology | | | 75,025 | | | | 4,344,698 | |
| | | | | | | | |
| | | | | | | 22,037,557 | |
| | | | | | | | |
Capital Goods – 12.61% | | | | | |
Barnes Group | | | 57,304 | | | | 3,550,556 | |
Belden | | | 66,267 | | | | 3,644,685 | |
BWX Technologies | | | 66,450 | | | | 4,125,216 | |
Columbus McKinnon | | | 35,550 | | | | 1,423,067 | |
ESCO Technologies | | | 50,220 | | | | 4,645,350 | |
Federal Signal | | | 66,200 | | | | 2,134,950 | |
Gates Industrial † | | | 137,750 | | | | 1,895,440 | |
Graco | | | 77,934 | | | | 4,052,568 | |
Granite Construction | | | 137,743 | | | | 3,811,349 | |
Jacobs Engineering Group | | | 50,875 | | | | 4,570,101 | |
Kadant | | | 59,979 | | | | 6,318,188 | |
Lincoln Electric Holdings | | | 67,085 | | | | 6,489,132 | |
MasTec † | | | 52,975 | | | | 3,398,876 | |
Oshkosh | | | 61,925 | | | | 5,861,201 | |
Quanta Services | | | 94,950 | | | | 3,865,415 | |
Rexnord † | | | 113,905 | | | | 3,715,581 | |
Spirit AeroSystems Holdings Class A | | | 44,600 | | | | 3,250,448 | |
Tetra Tech | | | 22,200 | | | | 1,912,752 | |
United Rentals † | | | 34,550 | | | | 5,761,903 | |
Woodward | | | 40,075 | | | | 4,746,483 | |
| | | | | | | | |
| | | | | | | 79,173,261 | |
| | | | | | | | |
Communications Services – 0.82% | | | | | |
InterXion Holding † | | | 61,358 | | | | 5,142,414 | |
| | | | | | | | |
| | | | | | | 5,142,414 | |
| | | | | | | | |
Consumer Discretionary – 3.39% | | | | | |
American Eagle Outfitters | | | 247,000 | | | | 3,630,900 | |
Five Below † | | | 43,926 | | | | 5,616,378 | |
Malibu Boats Class A † | | | 119,266 | | | | 4,883,943 | |
Steven Madden | | | 165,777 | | | | 7,130,069 | |
| | | | | | | | |
| | | | | | | 21,261,290 | |
| | | | | | | | |
Consumer Services – 1.93% | | | | | |
Cheesecake Factory | | | 72,578 | | | | 2,820,381 | |
| | | | | | | | |
| | | Number of
shares | | | Value
(US $) | |
| |
Common Stock (continued) | | | | | |
Consumer Services (continued) | | | | | |
Chuy’s Holdings † | | | 63,634 | | | $ | 1,649,393 | |
Jack in the Box | | | 44,575 | | | | 3,478,187 | |
Wendy’s | | | 188,212 | | | | 4,180,188 | |
| | | | | | | | |
| | | | | | | 12,128,149 | |
| | | | | | | | |
Consumer Staples – 1.85% | | | | | |
Casey’s General Stores | | | 41,935 | | | | 6,667,246 | |
J&J Snack Foods | | | 26,703 | | | | 4,920,562 | |
| | | | | | | | |
| | | | | | | 11,587,808 | |
| | | | | | | | |
Credit Cyclicals – 1.56% | | | | | |
BorgWarner | | | 114,725 | | | | 4,976,771 | |
Tenneco Class A | | | 110,339 | | | | 1,445,441 | |
Toll Brothers | | | 86,000 | | | | 3,397,860 | |
| | | | | | | | |
| | | | | | | 9,820,072 | |
| | | | | | | | |
Energy – 1.20% | | | | | | | | |
Callon Petroleum † | | | 273,228 | | | | 1,319,689 | |
Diamondback Energy | | | 21,324 | | | | 1,980,147 | |
Parsley Energy Class A | | | 98,385 | | | | 1,860,460 | |
Patterson-UTI Energy | | | 177,528 | | | | 1,864,044 | |
SRC Energy † | | | 123,318 | | | | 508,070 | |
| | | | | | | | |
| | | | | | | 7,532,410 | |
| | | | | | | | |
Financial Services – 14.44% | | | | | |
Axis Capital Holdings (Bermuda) | | | 65,875 | | | | 3,915,610 | |
CenterState Bank | | | 168,125 | | | | 4,199,763 | |
East West Bancorp | | | 117,644 | | | | 5,729,263 | |
Essent Group | | | 114,393 | | | | 5,947,292 | |
First Financial Bancorp | | | 145,540 | | | | 3,702,538 | |
Great Western Bancorp | | | 140,637 | | | | 4,885,729 | |
Independent Bank Group | | | 79,975 | | | | 4,433,814 | |
Kemper | | | 32,039 | | | | 2,483,023 | |
MGIC Investment | | | 406,379 | | | | 5,758,390 | |
Primerica | | | 44,858 | | | | 5,856,660 | |
Reinsurance Group of America | | | 49,410 | | | | 8,056,795 | |
Selective Insurance Group | | | 63,663 | | | | 4,150,191 | |
Sterling Bancorp | | | 202,598 | | | | 4,270,766 | |
Stifel Financial | | | 99,651 | | | | 6,043,833 | |
Umpqua Holdings | | | 296,649 | | | | 5,250,687 | |
Valley National Bancorp | | | 356,775 | | | | 4,085,074 | |
Webster Financial | | | 75,439 | | | | 4,025,425 | |
Western Alliance Bancorp | | | 77,911 | | | | 4,440,927 | |
WSFS Financial | | | 77,986 | | | | 3,430,604 | |
| | | | | | | | |
| | | | | | | 90,666,384 | |
| | | | | | | | |
Healthcare – 14.27% | | | | | |
Agios Pharmaceuticals † | | | 94,100 | | | | 4,493,275 | |
Alkermes † | | | 98,452 | | | | 2,008,421 | |
Bio-Techne | | | 30,685 | | | | 6,735,664 | |
Catalent † | | | 100,255 | | | | 5,644,356 | |
DexCom † | | | 34,859 | | | | 7,625,058 | |
Encompass Health | | | 76,644 | | | | 5,309,130 | |
Exact Sciences † | | | 70,068 | | | | 6,479,889 | |
ICON (Ireland) † | | | 40,196 | | | | 6,922,957 | |
Smid Cap Core Series-8
Delaware VIP® Smid Cap Core Series
Schedule of investments (continued)
| | | | | | | | |
| | | Number of
shares | | | Value
(US $) | |
| |
Common Stock (continued) | | | | | |
Healthcare (continued) | | | | | |
Ligand Pharmaceuticals Class B † | | | 42,154 | | | $ | 4,396,241 | |
Medicines † | | | 79,231 | | | | 6,729,881 | |
Neurocrine Biosciences † | | | 68,395 | | | | 7,351,779 | |
Repligen † | | | 37,350 | | | | 3,454,875 | |
Supernus Pharmaceuticals † | | | 95,072 | | | | 2,255,108 | |
Ultragenyx Pharmaceutical † | | | 91,435 | | | | 3,905,189 | |
WellCare Health Plans † | | | 16,262 | | | | 5,369,875 | |
West Pharmaceutical Services | | | 49,746 | | | | 7,478,316 | |
Wright Medical Group † | | | 111,405 | | | | 3,395,624 | |
| | | | | | | | |
| | | | | | | 89,555,638 | |
| | | | | | | | |
Media – 1.07% | | | | | |
Cinemark Holdings | | | 84,374 | | | | 2,856,060 | |
Interpublic Group of Companies | | | 167,953 | | | | 3,879,714 | |
| | | | | | | | |
| | | | | | | 6,735,774 | |
| | | | | | | | |
Real Estate Investment Trusts – 9.50% | | | | | |
American Assets Trust | | | 32,324 | | | | 1,483,672 | |
Apartment Investment & Management Class A | | | 115,515 | | | | 5,966,350 | |
Brixmor Property Group | | | 231,884 | | | | 5,011,013 | |
Camden Property Trust | | | 48,605 | | | | 5,156,990 | |
Cousins Properties | | | 148,843 | | | | 6,132,332 | |
EastGroup Properties | | | 40,250 | | | | 5,339,967 | |
EPR Properties | | | 66,701 | | | | 4,711,759 | |
Equity Commonwealth | | | 69,570 | | | | 2,283,983 | |
First Industrial Realty Trust | | | 148,035 | | | | 6,144,933 | |
Kite Realty Group Trust | | | 237,183 | | | | 4,632,184 | |
Mack-Cali Realty | | | 150,263 | | | | 3,475,583 | |
Pebblebrook Hotel Trust | | | 147,797 | | | | 3,962,438 | |
Physicians Realty Trust | | | 87,332 | | | | 1,654,068 | |
RPT Realty | | | 244,574 | | | | 3,678,393 | |
| | | | | | | | |
| | | | | | | 59,633,665 | |
| | | | | | | | |
Technology – 16.46% | | | | | |
Blackbaud | | | 30,855 | | | | 2,456,058 | |
Brooks Automation | | | 115,674 | | | | 4,853,681 | |
Chegg † | | | 50,106 | | | | 1,899,518 | |
ExlService Holdings † | | | 78,741 | | | | 5,469,350 | |
Guidewire Software † | | | 67,329 | | | | 7,390,704 | |
II-VI † | | | 98,143 | | | | 3,304,475 | |
j2 Global | | | 62,435 | | | | 5,850,784 | |
LendingTree † | | | 18,182 | | | | 5,517,146 | |
MACOM Technology Solutions Holdings † | | | 59,086 | | | | 1,571,688 | |
MaxLinear † | | | 195,282 | | | | 4,143,884 | |
| | | | | | | | |
| | | Number
of shares | | | Value
(US $) | |
| |
Common Stock (continued) | | | | | |
Technology (continued) | | | | | |
NETGEAR † | | | 69,417 | | | $ | 1,701,411 | |
Paycom Software † | | | 37,452 | | | | 9,915,791 | |
Proofpoint † | | | 66,804 | | | | 7,667,763 | |
PTC † | | | 65,624 | | | | 4,914,581 | |
Semtech † | | | 103,836 | | | | 5,492,924 | |
SS&C Technologies Holdings | | | 130,504 | | | | 8,012,946 | |
SYNNEX | | | 26,580 | | | | 3,423,504 | |
Tyler Technologies † | | | 32,908 | | | | 9,873,058 | |
WNS Holdings ADR † | | | 103,620 | | | | 6,854,463 | |
Yelp † | | | 85,581 | | | | 2,980,786 | |
| | | | | | | | |
| | | | | | | 103,294,515 | |
| | | | | | | | |
Transportation – 1.23% | | | | | |
Knight-Swift Transportation Holdings | | | 161,975 | | | | 5,805,184 | |
Werner Enterprises | | | 51,878 | | | | 1,887,840 | |
| | | | | | | | |
| | | | | | | 7,693,024 | |
| | | | | | | | |
Utilities – 4.35% | | | | | |
NorthWestern | | | 136,366 | | | | 9,773,351 | |
South Jersey Industries | | | 227,089 | | | | 7,489,395 | |
Spire | | | 120,751 | | | | 10,059,766 | |
| | | | | | | | |
| | | | | | | 27,322,512 | |
| | | | | | | | |
Total Common Stock
(cost $499,438,679) | | | | 611,043,291 | |
| | | | | | | | |
| |
Short-Term Investments – 1.98% | | | | | |
Money Market Mutual Funds – 1.98% | | | | | |
BlackRock FedFund – Institutional Shares(seven-day effective yield 1.52%) | | | 2,484,843 | | | | 2,484,843 | |
Fidelity Investments Money Market Government Portfolio – Class I(seven-day effective yield 1.49%) | | | 2,484,843 | | | | 2,484,843 | |
GS Financial Square Government Fund – Institutional Shares(seven-day effective yield 1.51%) | | | 2,484,843 | | | | 2,484,843 | |
Morgan Stanley Government Portfolio – Institutional Share Class(seven-day effective yield 1.48%) | | | 2,484,844 | | | | 2,484,844 | |
State Street Institutional US Government Money Market Fund – Investor Class(seven-day effective yield 1.45%) | | | 2,484,844 | | | | 2,484,844 | |
| | | | | | | | |
Total Short-Term Investments
(cost $12,424,217) | | | | 12,424,217 | |
| | | | | | | | |
| | | | |
Total Value of Securities – 99.32%
(cost $511,862,896) | | $ | 623,467,508 | |
| | | | |
†Non-income producing security.
Smid Cap Core Series-9
Delaware VIP® Smid Cap Core Series
Schedule of investments (continued)
Summary of abbreviations:
ADR – American Depositary Receipt
GS – Goldman Sachs
See accompanying notes, which are an integral part of the financial statements.
Smid Cap Core Series-10
| | |
| Delaware VIP®Trust — Delaware VIP Smid Cap Core Series |
| Statement of assets and liabilities | | December 31, 2019 |
| | | | |
Assets: | | | | |
Investments, at value1 | | $ | 623,467,508 | |
Cash | | | 6,247,148 | |
Dividends and interest receivable | | | 649,726 | |
Foreign tax reclaims receivable | | | 142,170 | |
Receivable for series shares sold | | | 20,110 | |
| | | | |
Total assets | | | 630,526,662 | |
| | | | |
Liabilities: | | | | |
Payable for securities purchased | | | 1,887,536 | |
Investment management fees payable to affiliates | | | 391,797 | |
Payable for series shares redeemed | | | 352,602 | |
Other accrued expenses | | | 77,040 | |
Distribution fees payable to affiliates | | | 57,999 | |
Trustees’ fees and expenses payable to affiliates | | | 6,055 | |
Dividend disbursing and transfer agent fees and expenses payable to affiliates | | | 3,970 | |
Accounting and administration expenses payable to affiliates | | | 2,096 | |
Legal fees payable to affiliates | | | 969 | |
Reports and statements to shareholders expenses payable to affiliates | | | 301 | |
| | | | |
Total liabilities | | | 2,780,365 | |
| | | | |
| |
Total Net Assets | | $ | 627,746,297 | |
| | | | |
| |
Net Assets Consist of: | | | | |
Paid-in capital | | $ | 501,140,553 | |
Total distributable earnings (loss) | | | 126,605,744 | |
| | | | |
| |
Total Net Assets | | $ | 627,746,297 | |
| | | | |
| |
Net Asset Value | | | | |
Standard Class: | | | | |
Net assets | | $ | 399,267,389 | |
Shares of beneficial interest outstanding, unlimited authorization, no par | | | 17,292,914 | |
Net asset value per share | | $ | 23.09 | |
| |
Service Class: | | | | |
Net assets | | $ | 228,478,908 | |
Shares of beneficial interest outstanding, unlimited authorization, no par | | | 10,737,289 | |
Net asset value per share | | $ | 21.28 | |
| |
1Investments, at cost | | $ | 511,862,896 | |
See accompanying notes, which are an integral part of the financial statements.
Smid Cap Core Series-11
Delaware VIP®Trust —
Delaware VIP Smid Cap Core Series
Statement of operations
Year ended December 31, 2019
| | | | |
Investment Income: | | | | |
Dividends | | | $8,010,492 | |
Interest | | | 77,482 | |
| | | | |
| | | 8,087,974 | |
| | | | |
| |
Expenses: | | | | |
Management fees | | | 4,509,472 | |
Distribution expenses — Service Class | | | 663,612 | |
Accounting and administration expenses | | | 144,849 | |
Reports and statements to shareholders expenses | | | 69,355 | |
Dividend disbursing and transfer agent fees and expenses | | | 50,881 | |
Trustees’ fees and expenses | | | 35,994 | |
Audit and tax fees | | | 34,639 | |
Legal fees | | | 31,437 | |
Custodian fees | | | 17,066 | |
Registration fees | | | 150 | |
Other | | | 18,439 | |
| | | | |
| | | 5,575,894 | |
| |
Less expenses paid indirectly | | | (2,771) | |
| | | | |
Total operating expenses | | | 5,573,123 | |
| | | | |
Net Investment Income | | | 2,514,851 | |
| | | | |
| |
Net Realized and Unrealized Gain: | | | | |
Net realized gain on Investments | | | 13,930,353 | |
Net change in unrealized appreciation (depreciation) of: | | | | |
Investments | | | 137,368,151 | |
Foreign currencies | | | 5,516 | |
| | | | |
Net change in unrealized appreciation (depreciation) | | | 137,373,667 | |
| | | | |
Net Realized and Unrealized Gain | | | 151,304,020 | |
| | | | |
Net Increase in Net Assets Resulting from Operations | | | $153,818,871 | |
| | | | |
Delaware VIP Trust —
Delaware VIP Smid Cap Core Series
Statements of changes in net assets
| | | | | | | | |
| | | Year ended | |
| | | 12/31/19 | | | 12/31/18 | |
Increase (Decrease) in Net Assets from Operations: | | | | | |
Net investment income | | $ | 2,514,851 | | | $ | 2,639,871 | |
Net realized gain | | | 13,930,353 | | | | 33,701,059 | |
Net change in unrealized appreciation (depreciation) | | | 137,373,667 | | | | (109,746,969 | ) |
| | | | | | | | |
Net increase (decrease) in net assets resulting from operations | | | 153,818,871 | | | | (73,406,039 | ) |
| | | | | | | | |
Dividends and Distributions to Shareholders from: | | | | | |
Distributable earnings: | | | | | |
Standard Class | | | (23,348,937 | ) | | | (126,240,340 | ) |
Service Class | | | (13,628,667 | ) | | | (76,399,191 | ) |
| | | | | | | | |
| | | (36,977,604 | ) | | | (202,639,531 | ) |
| | | | | | | | |
| |
Capital Share Transactions: | | | | | |
Proceeds from shares sold: | | | | | |
Standard Class | | | 10,267,377 | | | | 12,579,893 | |
Service Class | | | 5,225,032 | | | | 11,843,249 | |
Net asset value of shares
based upon reinvestment of dividends and distributions: | | | | | |
Standard Class | | | 23,348,937 | | | | 126,240,340 | |
Service Class | | | 13,628,667 | | | | 76,399,191 | |
| | | | | | | | |
| | | 52,470,013 | | | | 227,062,673 | |
| | | | | | | | |
Cost of shares redeemed: | | | | | |
Standard Class | | | (52,540,344 | ) | | | (33,970,144 | ) |
Service Class | | | (29,941,388 | ) | | | (27,135,691 | ) |
| | | | | | | | |
| | | (82,481,732 | ) | | | (61,105,835 | ) |
| | | | | | | | |
Increase (decrease) in net assets derived from capital share transactions | | | (30,011,719 | ) | | | 165,956,838 | |
| | | | | | | | |
Net Increase (Decrease) in Net Assets | | | 86,829,548 | | | | (110,088,732 | ) |
| | |
Net Assets: | | | | | | | | |
Beginning of year | | | 540,916,749 | | | | 651,005,481 | |
| | | | | | | | |
End of year | | $ | 627,746,297 | | | $ | 540,916,749 | |
| | | | | | | | |
See accompanying notes, which are an integral part of the financial statements.
Smid Cap Core Series-12
Delaware VIP® Trust — Delaware VIP Smid Cap Core Series
Financial highlights
Selected data for each share of the Series outstanding throughout each period were as follows:
| | | | | | | | | | | | | | | | | | | | | | | | | |
| | | Delaware VIP Smid Cap Core Series Standard Class
Year ended |
| | | 12/31/19 | | 12/31/18 | | 12/31/171 | | 12/31/16 | | 12/31/15 |
Net asset value, beginning of period | | | $ | 18.92 | | | | $ | 30.98 | | | | $ | 28.08 | | | | $ | 29.79 | | | | $ | 30.20 | |
| | | | | |
Income (loss) from investment operations: | | | | | | | | | | | | | | | | | | | | | | | | | |
Net investment income2 | | | | 0.11 | | | | | 0.12 | | | | | 0.06 | | | | | 0.09 | | | | | 0.07 | |
Net realized and unrealized gain (loss) | | | | 5.37 | | | | | (2.59 | ) | | | | 4.89 | | | | | 2.15 | | | | | 2.21 | |
| | | | | | | | | | | | | | | | | | | | | | | | | |
Total from investment operations | | | | 5.48 | | | | | (2.47 | ) | | | | 4.95 | | | | | 2.24 | | | | | 2.28 | |
| | | | | | | | | | | | | | | | | | | | | | | | | |
| | | | | |
Less dividends and distributions from: | | | | | | | | | | | | | | | | | | | | | | | | | |
Net investment income | | | | (0.12 | ) | | | | (0.05 | ) | | | | (0.09 | ) | | | | (0.07 | ) | | | | (0.12 | ) |
Net realized gain | | | | (1.19 | ) | | | | (9.54 | ) | | | | (1.96 | ) | | | | (3.88 | ) | | | | (2.57 | ) |
| | | | | | | | | | | | | | | | | | | | | | | | | |
Total dividends and distributions | | | | (1.31 | ) | | | | (9.59 | ) | | | | (2.05 | ) | | | | (3.95 | ) | | | | (2.69 | ) |
| | | | | | | | | | | | | | | | | | | | | | | | | |
| | | | | |
Net asset value, end of period | | | $ | 23.09 | | | | $ | 18.92 | | | | $ | 30.98 | | | | $ | 28.08 | | | | $ | 29.79 | |
| | | | | | | | | | | | | | | | | | | | | | | | | |
| | | | | |
Total return3 | | | | 29.63% | | | | | (12.12% | ) | | | | 18.65% | | | | | 8.29% | | | | | 7.54% | |
| | | | | |
Ratios and supplemental data: | | | | | | | | | | | | | | | | | | | | | | | | | |
Net assets, end of period (000 omitted) | | | $ | 399,267 | | | | $ | 343,361 | | | | $ | 411,087 | | | | $ | 394,898 | | | | $ | 394,406 | |
Ratio of expenses to average net assets4 | | | | 0.81% | | | | | 0.81% | | | | | 0.81% | | | | | 0.82% | | | | | 0.83% | |
Ratio of net investment income to average net assets | | | | 0.52% | | | | | 0.51% | | | | | 0.22% | | | | | 0.33% | | | | | 0.24% | |
Portfolio turnover | | | | 14% | | | | | 18% | | | | | 112% | | | | | 15% | | | | | 23% | |
| 1 | Effective April 28, 2017, Jackson Square Partners, LLC no longer serves assub-advisor to the Series. The Series’ portfolio turnover rate increased substantially during the year ended Dec. 31, 2017. |
| 2 | The average shares outstanding method has been applied for per share information. |
| 3 | Total return is based on the change in net asset value of a share during the period and assumes reinvestment of dividends and distributions at net asset value. Total return does not include fees, charges, or expenses imposed by the variable annuity and life insurance contracts for which Delaware VIP Trust serves as an underlying investment vehicle. |
| 4 | Expense ratios do not include expenses of the Underlying Funds in which the Series invests. |
See accompanying notes, which are an integral part of the financial statements.
Smid Cap Core Series-13
Delaware VIP® Smid Cap Core Series
Financial highlights (continued)
Selected data for each share of the Series outstanding throughout each period were as follows:
| | | | | | | | | | | | | | | | | | | | | | | | | |
| | | Delaware VIP Smid Cap Core Series Service Class
Year ended |
| | | 12/31/19 | | 12/31/18 | | 12/31/171 | | 12/31/16 | | 12/31/15 |
Net asset value, beginning of period | | | | $ 17.52 | | | | | $ 29.41 | | | | | $ 26.75 | | | | | $ 28.56 | | | | | $ 29.06 | |
| | | | | |
Income (loss) from investment operations: | | | | | | | | | | | | | | | | | | | | | | | | | |
Net investment income (loss)2 | | | | 0.04 | | | | | 0.05 | | | | | (0.01 | ) | | | | 0.02 | | | | | — | 3 |
Net realized and unrealized gain (loss) | | | | 4.97 | | | | | (2.40 | ) | | | | 4.66 | | | | | 2.05 | | | | | 2.12 | |
| | | | | | | | | | | | | | | | | | | | | | | | | |
Total from investment operations | | | | 5.01 | | | | | (2.35 | ) | | | | 4.65 | | | | | 2.07 | | | | | 2.12 | |
| | | | | | | | | | | | | | | | | | | | | | | | | |
| | | | | |
Less dividends and distributions from: | | | | | | | | | | | | | | | | | | | | | | | | | |
Net investment income | | | | (0.06 | ) | | | | — | | | | | (0.03 | ) | | | | — | | | | | (0.05 | ) |
Net realized gain | | | | (1.19 | ) | | | | (9.54 | ) | | | | (1.96 | ) | | | | (3.88 | ) | | | | (2.57 | ) |
| | | | | | | | | | | | | | | | | | | | | | | | | |
Total dividends and distributions | | | | (1.25 | ) | | | | (9.54 | ) | | | | (1.99 | ) | | | | (3.88 | ) | | | | (2.62 | ) |
| | | | | | | | | | | | | | | | | | | | | | | | | |
| | | | | |
Net asset value, end of period | | | | $ 21.28 | | | | | $ 17.52 | | | | | $ 29.41 | | | | | $ 26.75 | | | | | $ 28.56 | |
| | | | | | | | | | | | | | | | | | | | | | | | | |
| | | | | |
Total return4 | | | | 29.25% | | | | | (12.40% | )5 | | | | 18.38% | 5 | | | | 8.02% | 5 | | | | 7.31% | 5 |
| | | | | | |
Ratios and supplemental data: | | | | | | | | | | | | | | | | | | | | | | | | | |
Net assets, end of period (000 omitted) | | | | $228,479 | | | | | $197,556 | | | | | $239,918 | | | | | $231,336 | | | | | $230,085 | |
Ratio of expenses to average net assets6 | | | | 1.11% | | | | | 1.09% | | | | | 1.06% | | | | | 1.07% | | | | | 1.08% | |
Ratio of expenses to average net assets prior to fees waived6 | | | | 1.11% | | | | | 1.11% | | | | | 1.11% | | | | | 1.12% | | | | | 1.13% | |
Ratio of net investment income (loss) to average net assets | | | | 0.22% | | | | | 0.23% | | | | | (0.03% | ) | | | | 0.08% | | | | | (0.01% | ) |
Ratio of net investment income (loss) to average net assets prior to fees waived | | | | 0.22% | | | | | 0.21% | | | | | (0.08% | ) | | | | 0.03% | | | | | (0.06% | ) |
Portfolio turnover | | | | 14% | | | | | 18% | | | | | 112% | | | | | 15% | | | | | 23% | |
| 1 | Effective April 28, 2017, Jackson Square Partners, LLC no longer serves assub-advisor to the Series. The Series’ portfolio turnover rate increased substantially during the year ended Dec. 31, 2017. |
| 2 | The average shares outstanding method has been applied for per share information. |
| 3 | The amount is less than $0.005 per share. |
| 4 | Total return is based on the change in net asset value of a share during the period and assumes reinvestment of dividends and distributions at net asset value. Total return does not include fees, charges, or expenses imposed by the variable annuity and life insurance contracts for which Delaware VIP Trust serves as an underlying investment vehicle. |
| 5 | Total return during the period reflects a waiver by the manager and/or distributor. Performance would have been lower had the waiver not been in effect. |
| 6 | Expense ratios do not include expenses of the Underlying Funds in which the Series invests. |
See accompanying notes, which are an integral part of the financial statements.
Smid Cap Core Series-14
Delaware VIP® Trust — Delaware VIP Smid Cap Core Series
Notes to financial statements
December 31, 2019
Delaware VIP Trust (Trust) is organized as a Delaware statutory trust and offers 22 series, each of which is treated as a separate entity for certain matters under the Investment Company Act of 1940, as amended (1940 Act). These financial statements and the related notes pertain to Delaware VIP Smid Cap Core Series (Series). The Trust is anopen-end investment company. The Series is considered diversified under the 1940 Act and offers Standard Class and Service Class shares. The Standard Class shares do not carry a distribution and service(12b-1) fee and the Service Class shares carry a12b-1 fee. The shares of the Series are sold only to separate accounts of life insurance companies.
1. Significant Accounting Policies
The Series follows accounting and reporting guidance under Financial Accounting Standards Board (FASB) Accounting Standards Codification Topic 946, Financial Services - Investment Companies. The following accounting policies are in accordance with US generally accepted accounting principles (US GAAP) and are consistently followed by the Series.
Security Valuation – Equity securities, except those traded on the Nasdaq Stock Market LLC (Nasdaq), are valued at the last quoted sales price as of the time of the regular close of the New York Stock Exchange on the valuation date. Equity securities traded on the Nasdaq are valued in accordance with the Nasdaq Official Closing Price, which may not be the last sales price. If, on a particular day, an equity security does not trade, the mean between the bid and ask prices will be used, which approximates fair value. Equity securities listed on a foreign exchange are normally valued at the last quoted sales price on the valuation date. US government and agency securities are valued at the mean between the bid and ask prices, which approximates fair value.Open-end investment companies are valued at their published net asset value (NAV). Investments in repurchase agreements are generally valued at par, which approximates fair value, each business day. Generally, other securities and assets for which market quotations are not readily available are valued at fair value as determined in good faith under the direction of the Trust’s Board of Trustees (Board). In determining whether market quotations are readily available or fair valuation will be used, various factors will be taken into consideration, such as market closures or suspension of trading in a security. The Series may use fair value pricing more frequently for securities traded primarily innon-US markets because, among other things, most foreign markets close well before the Series values its securities, generally as of 4:00pm Eastern time. The earlier close of these foreign markets gives rise to the possibility that significant events, including broad market moves, government actions or pronouncements, aftermarket trading, or news events may have occurred in the interim. Whenever such a significant event occurs, the Series may value foreign securities using fair value prices based on third-party vendor modeling tools (international fair value pricing). Restricted securities are valued at fair value using methods approved by the Board.
Federal and Foreign Income Taxes – No provision for federal income taxes has been made as the Series intends to continue to qualify for federal income tax purposes as a regulated investment company under Subchapter M of the Internal Revenue Code of 1986, as amended, and make the requisite distributions to shareholders. The Series evaluates tax positions taken or expected to be taken in the course of preparing the Series’ tax returns to determine whether the tax positions are“more-likely-than-not” of being sustained by the applicable tax authority. Tax positions not deemed to meet the“more-likely-than-not” threshold are recorded as a tax benefit or expense in the current year. Management has analyzed the Series’ tax positions taken or expected to be taken on the Series’ federal income tax returns through the year ended Dec. 31, 2019 and for all open tax years (years ended Dec. 31, 2016–Dec. 31, 2018), and has concluded that no provision for federal income tax is required in the Series’ financial statements. In regard to foreign taxes only, the Series has open tax years in certain foreign countries in which it invests in that may date back to the inception of the Series. If applicable, the Series recognizes interest accrued on unrecognized tax benefits in interest expense and penalties in “Other expenses” on the “Statement of operations.” During the year ended Dec. 31, 2019, the Series did not incur any interest or tax penalties.
Class Accounting – Investment income, common expenses, and realized and unrealized gain (loss) on investments are allocated to the various classes of the Series on the basis of daily net assets of each class. Distribution expenses relating to a specific class are charged directly to that class.
Repurchase Agreements – The Series may purchase certain US government securities subject to the counterparty’s agreement to repurchase them at an agreed upon date and price. The counterparty will be required on a daily basis to maintain the value of the collateral subject to the agreement at not less than the repurchase price (including accrued interest). The agreements are conditioned upon the collateral being deposited under the Federal Reserve book-entry system with the Series’ custodian or a third-partysub-custodian. In the event of default or bankruptcy by the other party to the agreement, retention of the collateral may be subject to legal proceedings. At Dec. 31, 2019, the Series held no investments in repurchase agreements.
Foreign Currency Transactions – Transactions denominated in foreign currencies are recorded at the prevailing exchange rates on the valuation date in accordance with the Series’ prospectus. The value of all assets and liabilities denominated in foreign currencies is translated daily into US dollars at the exchange rate of such currencies against the US dollar. Transaction gains or losses resulting from changes in exchange rates during the reporting period or upon settlement of the foreign currency transaction are reported in operations for the current period. The Series generally does not bifurcate that portion of realized gains and losses on investments which is due to changes in foreign exchange rates from that which is due to changes in market prices. These gains and losses are included on the “Statement of operations” under “Net realized and unrealized gain (loss) on investments.” The Series reports certain foreign currency related transactions as components of realized gains (losses) for financial reporting purposes, whereas such components are treated as ordinary income (loss) for federal income tax purposes.
Smid Cap Core Series-15
Delaware VIP® Smid Cap Core Series
Notes to financial statements
1. Significant Accounting Policies (continued)
Use of Estimates – The preparation of financial statements in conformity with US GAAP requires management to make estimates and assumptions that affect the fair value of investments, the reported amounts of assets and liabilities and disclosure of contingent assets and liabilities at the date of the financial statements, and the reported amounts of revenues and expenses during the reporting period. Actual results could differ from those estimates and the differences could be material.
Other – Expenses directly attributable to the Series are charged directly to the Series. Other expenses common to various funds within the Delaware Funds® by Macquarie (Delaware Funds) are generally allocated among such funds on the basis of average net assets. Management fees and certain other expenses are paid monthly. Security transactions are recorded on the date the securities are purchased or sold (trade date) for financial reporting purposes. Costs used in calculating realized gains and losses on the sale of investment securities are those of the specific securities sold. Dividend income is recorded on theex-dividend date and interest income is recorded on the accrual basis. Discounts and premiums on debt securities are accreted or amortized to interest income, respectively, over the lives of the respective securities using the effective interest method. Foreign dividends are also recorded on theex-dividend date or as soon after theex-dividend date that the Series is aware of such dividends, net of all tax withholdings, a portion of which may be reclaimable. Withholding taxes and reclaims on foreign dividends have been recorded in accordance with the Series’ understanding of the applicable country’s tax rules and rates. Distributions received from investments in real estate investment trusts (REITs) are recorded as dividend income onex-dividend date, subject to reclassification upon notice of the character of such distributions by the issuer, which are estimated. The Series declares and pays dividends from net investment income and distributions from net realized gain on investments, if any, following the close of the fiscal year. The Series may distribute more frequently, if necessary for tax purposes. Dividends and distributions, if any, are recorded on theex-dividend date.
The Series receives earnings credits from its custodian when positive cash balances are maintained, which may be used to offset custody fees. The expenses paid under this arrangement are included on the “Statement of operations” under “Custodian fees” with the corresponding expenses offset included under “Less expenses paid indirectly.” For the year ended Dec. 31, 2019, the Series earned $2,768 under this arrangement.
The Series receives earnings credits from its transfer agent when positive cash balances are maintained, which may be used to offset transfer agent fees. If the amount earned is greater than $1, the expenses paid under this arrangement are included on the “Statement of operations” under “Dividend disbursing and transfer agent fees and expenses” with the corresponding expenses offset included under “Less expenses paid indirectly.” For the year ended Dec. 31, 2019, the Series earned $3 under this arrangement.
2. Investment Management, Administration Agreements, and Other Transactions with Affiliates
In accordance with the terms of its investment management agreement, the Series pays Delaware Management Company (DMC), a series of Macquarie Investment Management Business Trust and the investment manager, an annual fee which is calculated daily and paid monthly at the rates of 0.75% on the first $500 million of average daily net assets of the Series, 0.70% on the next $500 million, 0.65% on the next $1.5 billion, and 0.60% on average daily net assets in excess of $2.5 billion.
Effective May 30, 2019, DMC may permit its affiliates, Macquarie Investment Management Global Limited (MIMGL) and Macquarie Funds Management Hong Kong Limited (together, the “AffiliatedSub-Advisors”), to execute Fund equity security trades on behalf of the Manager. The Manager may also seek quantitative support from MIMGL. Although the AffiliatedSub-Advisors serve assub-advisors, DMC has ultimate responsibility for all investment advisory services. For these services, DMC, not the Fund, may pay each AffiliatedSub-Advisor a portion of its investment management fee.
Delaware Investments Fund Services Company (DIFSC), an affiliate of DMC, provides fund accounting and financial administration oversight services to the Series. For these services, DIFSC’s fees are calculated daily and paid monthly based on the aggregate daily net assets of all funds within the Delaware Funds at the following annual rates: 0.00475% of the first $35 billion; 0.0040% of the next $10 billion; and 0.0025% of aggregate average daily net assets in excess of $45 billion (Total Fee). Each fund in the Delaware Funds pays a minimum of $4,000, which, in aggregate, is subtracted from the Total Fee. Each fund then pays its portion of the remainder of the Total Fee on a relative NAV basis. This amount is included on the “Statement of operations” under “Accounting and administration expenses.” For the year ended Dec. 31, 2019, the Series was charged $26,291 for these services.
DIFSC is also the transfer agent and dividend disbursing agent of the Series. For these services, DIFSC’s fees are calculated daily and paid monthly at the annual rate of 0.0075% of the Series’ average daily net assets. This amount is included on the “Statement of operations” under “Dividend disbursing and transfer agent fees and expenses.” For the year ended Dec. 31, 2019, the Series was charged $45,637 for these services. Pursuant to asub-transfer agency agreement between DIFSC and BNY Mellon Investment Servicing (US) Inc. (BNYMIS), BNYMIS provides certainsub-transfer agency services to the Series.Sub-transfer agency fees are paid by the Series and are also included on the “Statement of operations” under “Dividend disbursing and transfer agent fees and expenses.” The fees that are calculated daily and paid as invoices are received on a monthly or quarterly basis.
Pursuant to a distribution agreement and distribution plan, the Series pays Delaware Distributors, L.P. (DDLP), the distributor and an affiliate of DMC, an annual12b-1 fee of 0.30% of the average daily net assets of the Service Class shares. The fees are calculated daily and paid monthly. Standard Class shares do not pay12b-1 fees.
Smid Cap Core Series-16
Delaware VIP® Smid Cap Core Series
Notes to financial statements
As provided in the investment management agreement, the Series bears a portion of the cost of certain resources shared with DMC, including the cost of internal personnel of DMC and/or its affiliates that provide legal, tax, and regulatory reporting services to the Series. For the year ended Dec. 31, 2019, the Series was charged $16,953 for internal legal, tax, and regulatory reporting services provided by DMC and/or its affiliates’ employees. This amount is included on the “Statement of operations” under “Legal fees.”
Trustees’ fees include expenses accrued by the Series for each Trustee’s retainer and meeting fees. Certain officers of DMC, DIFSC, and DDLP are officers and/or Trustees of the Trust. These officers and Trustees are paid no compensation by the Series.
In addition to the management fees and other expenses of the Series, the Series indirectly bears the investment management fees and other expenses of the investment companies (Underlying Funds) in which it invests. The amount of these fees and expenses incurred indirectly by the Series will vary based upon the expense and fee levels of the Underlying Funds and the number of shares that are owned of the Underlying Funds at different times.
Cross trades for the year ended Dec. 31, 2019 were executed by the Series pursuant to procedures adopted by the Board designed to ensure compliance with Rule17a-7 under the 1940 Act. Cross trading is the buying or selling of portfolio securities between funds of investment companies, or between a fund of an investment company and another entity, that are or could be considered affiliates by virtue of having a common investment advisor (or affiliated investment advisors), common directors/trustees and or common officers. At its regularly scheduled meetings, the Board reviews such transactions for compliance with the procedures adopted by the Board. During the year ended Dec. 31, 2019. the Series engaged in securities purchases of $1,054,248 and no securities sales, which did not result in any realized gain (loss).
3. Investments
For the year ended Dec. 31, 2019, the Series made purchases and sales of investment securities other than short-term investments as follows:
| | | | |
Purchases | | $ | 86,598,769 | |
Sales | | | 153,266,326 | |
The tax cost of investments includes adjustments to net unrealized appreciation (depreciation) which may not necessarily be the final tax cost basis adjustments, but approximate the tax basis unrealized gains and losses that may be realized and distributed to shareholders. At Dec. 31, 2019, the cost and unrealized appreciation (depreciation) of investments for federal income tax purposes the Series were as follows:
| | | | | | |
Cost of Investments | | Aggregate
Unrealized Appreciation
of Investments | | Aggregate Unrealized
Depreciation
of Investments | | Net Unrealized
Appreciation
of Investments |
| $512,975,478 | | $147,212,300 | | $(36,720,270) | | $110,492,030 |
US GAAP defines fair value as the price that the Series would receive to sell an asset or pay to transfer a liability in an orderly transaction between market participants at the measurement date under current market conditions. A three-level hierarchy for fair value measurements has been established based upon the transparency of inputs to the valuation of an asset or liability. Inputs may be observable or unobservable and refer broadly to the assumptions that market participants would use in pricing the asset or liability. Observable inputs reflect the assumptions market participants would use in pricing the asset or liability based on market data obtained from sources independent of the reporting entity. Unobservable inputs reflect the reporting entity’s own assumptions about the assumptions that market participants would use in pricing the asset or liability based on the best information available under the circumstances. The Series’ investment in its entirety is assigned a level based upon the observability of the inputs which are significant to the overall valuation. The three-level hierarchy of inputs is summarized below.
| | | | |
| Level 1 | | – | | Inputs are quoted prices in active markets for identical investments. (Examples: equity securities,open-end investment companies, futures contracts, and exchange-traded options contracts) |
| Level 2 | | – | | Other observable inputs, including, but not limited to: quoted prices for similar assets or liabilities in markets that are active, quoted prices for identical or similar assets or liabilities in markets that are not active, inputs other than quoted prices that are observable for the assets or liabilities (such as interest rates, yield curves, volatilities, prepayment speeds, loss severities, credit risks, and default rates) or other market-corroborated inputs. (Examples: debt securities, government securities, swap contracts, foreign currency exchange contracts, foreign securities utilizing international fair value pricing, broker-quoted securities, and fair valued securities) |
| Level 3 | | – | | Significant unobservable inputs, including the Series’ own assumptions used to determine the fair value of investments. (Examples: broker-quoted securities and fair valued securities) |
Smid Cap Core Series-17
Delaware VIP® Smid Cap Core Series
Notes to financial statements
3. Investments (continued)
Level 3 investments are valued using significant unobservable inputs. The Series may also use an income-based valuation approach in which the anticipated future cash flows of the investment are discounted to calculate fair value. Discounts may also be applied due to the nature or duration of any restrictions on the disposition of the investments. Valuations may also be based upon current market prices of securities that are comparable in coupon, rating, maturity, and industry. The derived value of a Level 3 investment may not represent the value which is received upon disposition and this could impact the results of operations.
The following table summarizes the valuation of the Series’ investments by fair value hierarchy levels as of Dec. 31, 2019:
| | | | |
| | | Level 1 | |
Securities | | | | |
Assets: | | | | |
Common Stock | | $ | 611,043,291 | |
Short-Term Investments | | | 12,424,217 | |
| | | | |
Total Value of Securities | | $ | 623,467,508 | |
| | | | |
During the year ended Dec. 31, 2019, there were no transfers between Level 1 investments, Level 2 investments, or Level 3 investments that had a significant impact to the Series. This does not include transfers between Level 1 investments and Level 2 investments due to the Series utilizing international fair value pricing during the year. In accordance with the fair valuation procedures described in Note 1, international fair value pricing of securities in the Series occurs when market volatility exceeds an established rolling threshold. If the threshold is exceeded on a given date, then prices of international securities (those that traded on exchanges that close at a different time than the time that the Series’ NAV is determined) are established using a separate pricing feed from a third-party vendor designed to establish a price for each such security as of the time that the Series’ NAV is determined. Further, international fair value pricing uses other observable market-based inputs in place of the closing exchange price due to the events occurring after the close of the exchange or market on which the investment is principally traded, causing a change in classification between levels. The Series’ policy is to recognize transfers between levels based on fair value at the beginning of the reporting period.
A reconciliation of Level 3 investments is presented when the Series has a significant amount of Level 3 investments at the beginning, interim, or end of the year in relation to the Series’ net assets. During the year ended Dec. 31, 2019, there were no Level 3 investments.
4. Dividend and Distribution Information
Income and long-term capital gain distributions are determined in accordance with federal income tax regulations, which may differ from US GAAP. Additionally, distributions from net gains on foreign currency transactions and net short-term gains on sales of investment securities are treated as ordinary income for federal income tax purposes. The tax character of dividends and distributions paid during the years ended Dec. 31, 2019 and 2018 was as follows:
| | | | | | | | | | | | |
| | | Year ended | |
| | | 12/31/19 | | | | | | 12/31/18 | |
Ordinary income | | | $7,325,472 | | | | | | | | $20,641,354 | |
Long-term capital gains | | | 29,652,132 | | | | | | | | 181,998,177 | |
| | | | | | | | | | | | |
| | | $36,977,604 | | | | | | | | $202,639,531 | |
| | | | | | | | | | | | |
5. Components of Net Assets on a Tax Basis
As of Dec. 31, 2019, the components of net assets on a tax basis were as follows:
| | | | |
Shares of beneficial interest | | | $501,140,553 | |
Undistributed ordinary income | | | 9,302,701 | |
Undistributed long-term capital gains | | | 6,811,013 | |
Net unrealized appreciation on investments and foreign currencies | | | 110,492,030 | |
| | | | |
Net assets | | | $627,746,297 | |
| | | | |
The difference between book basis and tax basis components of net assets is primarily attributable to tax deferral of losses on wash sales.
Smid Cap Core Series-18
Delaware VIP® Smid Cap Core Series
Notes to financial statements
6. Capital Shares
Transactions in capital shares were as follows:
| | | | | | | | |
| | | Year ended | |
| | | 12/31/19 | | | 12/31/18 | |
Shares sold: | | | | | | | | |
Standard Class | | | 475,321 | | | | 502,720 | |
Service Class | | | 267,495 | | | | 529,135 | |
| | |
| Shares issued upon reinvestment of dividends and distributions: | | | | | | | | |
Standard Class | | | 1,106,060 | | | | 5,774,996 | |
Service Class | | | 698,906 | | | | 3,767,218 | |
| | | | | | | | |
| | | 2,547,782 | | | | 10,574,069 | |
| | | | | | | | |
| | |
Shares redeemed: | | | | | | | | |
Standard Class | | | (2,434,517 | ) | | | (1,398,990 | ) |
Service Class | | | (1,502,845 | ) | | | (1,181,607 | ) |
| | | | | | | | |
| | | (3,937,362 | ) | | | (2,580,597 | ) |
| | | | | | | | |
Net increase (decrease) | | | (1,389,580 | ) | | | 7,993,472 | |
| | | | | | | | |
7. Line of Credit
The Series, along with certain other funds in the Delaware Funds (Participants), was a participant in a $220,000,000 revolving line of credit intended to be used for temporary or emergency purposes as an additional source of liquidity to fund redemptions of investor shares. Under the agreement, the Participants were charged an annual commitment fee of 0.15%, which was allocated across the Participants based on a weighted average of the respective net assets of each Participant. The Participants were permitted to borrow up to a maximum ofone-third of their net assets under the agreement. Each Participant was individually, and not jointly, liable for its particular advances, if any, under the line of credit. The line of credit available under the agreement expired on Nov. 4, 2019.
On Nov. 4, 2019, the Participants entered into an amendment to the agreement for a $250,000,000 revolving line of credit. The revolving line of credit is to be used as described above and operates in substantially the same manner as the original agreement. The line of credit available under the agreement expires on Nov. 2, 2020.
The Series had no amounts outstanding as of Dec. 31, 2019, or at any time during the year then ended.
8. Securities Lending
The Series, along with other funds in the Delaware Funds, may lend its securities pursuant to a security lending agreement (Lending Agreement) with The Bank of New York Mellon (BNY Mellon). At the time a security is loaned, the borrower must post collateral equal to the required percentage of the market value of the loaned security, including any accrued interest. The required percentage is: (1) 102% with respect to US securities and foreign securities that are denominated and payable in US dollars; and (2) 105% with respect to foreign securities. With respect to each loan, if on any business day the aggregate market value of securities collateral plus cash collateral held is less than the aggregate market value of the securities that are the subject of such loan, the borrower will be notified to provide additional collateral by the end of the following business day, which, together with the collateral already held, will be not less than the applicable initial collateral requirements for such security loan. If the aggregate market value of securities collateral and cash collateral held with respect to a security loan exceeds the applicable initial collateral requirement, upon the request of the borrower, BNY Mellon must return enough collateral to the borrower by the end of the following business day to reduce the value of the remaining collateral to the applicable initial collateral requirement for such security loan. As a result of the foregoing, the value of the collateral held with respect to a loaned security on any particular day may be more or less than the value of the security on loan. The collateral percentage with respect to the market value of the loaned security is determined by the security lending agent.
Cash collateral received by each series of the Trust is generally invested in a series of individual separate accounts, each corresponding to a series. The investment guidelines permit each separate account to hold certain securities that would be considered eligible securities for a money market fund. Cash collateral received is generally invested in government securities; certain obligations issued by government sponsored enterprises; repurchase agreements collateralized by US Treasury securities; obligations issued by the central government of any Organization for Economic Cooperation and Development (OECD) country or its agencies, instrumentalities or establishments; obligations of supranational organizations, commercial paper, notes, bonds, and other
Smid Cap Core Series-19
Delaware VIP® Smid Cap Core Series
Notes to financial statements
8. Securities Lending (continued)
debt obligations; certificates of deposit, time deposits, and other bank obligations; and asset-backed securities. The Series can also accept US government securities and letters of credit(non-cash collateral) in connection with securities loans.
In the event of default or bankruptcy by the lending agent, realization and/or retention of the collateral may be subject to legal proceedings. In the event the borrower fails to return loaned securities and the collateral received is insufficient to cover the value of the loaned securities and provided such collateral shortfall is not the result of investment losses, the lending agent has agreed to pay the amount of the shortfall to the Series or, at the discretion of the lending agent, replace the loaned securities. The Series continues to record dividends or interest, as applicable, on the securities loaned and is subject to changes in value of the securities loaned that may occur during the term of the loan. The Series has the right under the Lending Agreement to recover the securities from the borrower on demand. With respect to security loans collateralized bynon-cash collateral, the Series receives loan premiums paid by the borrower. With respect to security loans collateralized by cash collateral, the earnings from the collateral investments are shared among the Series, the security lending agent, and the borrower. The Series records security lending income net of allocations to the security lending agent and the borrower.
The Series may incur investment losses as a result of investing securities lending collateral. This could occur if an investment in the collateral investment account defaulted or became impaired. Under those circumstances, the value of a Series’ cash collateral account may be less than the amount the Series would be required to return to the borrowers of the securities and the Series would be required to make up for this shortfall.
During the year ended Dec. 31, 2019, the Series had no securities out on loan.
9. Credit and Market Risk
The Series invests a significant portion of its assets in small- andmid-sized companies and may be subject to certain risks associated with ownership of securities of such companies. Investments in small- ormid-sized companies may be more volatile than investments in larger companies for a number of reasons, which include more limited financial resources or a dependence on narrow product lines.
The Series invests in REITs and is subject to the risks associated with that industry. If the Series holds real estate directly or receives rental income directly from real estate holdings, its tax status as a regulated investment company may be jeopardized. There were no direct real estate holdings during the year ended Dec. 31, 2019. The Series’ REIT holdings are also affected by interest rate changes, particularly if the REITs it holds use floating rate debt to finance their ongoing operations.
Some countries in which the Series may invest require governmental approval for the repatriation of investment income, capital or the proceeds of sales of securities by foreign investors. In addition, if there is deterioration in a country’s balance of payments or for other reasons, a country may impose temporary restrictions on foreign capital remittances abroad.
The securities exchanges of certain foreign markets are substantially smaller, less liquid and more volatile than the major securities markets in the United States. Consequently, acquisition and disposition of securities by the Series may be inhibited. In addition, a significant portion of the aggregate market value of equity securities listed on the major securities exchanges in emerging markets is held by a smaller number of investors. This may limit the number of shares available for acquisition or disposition by the Series.
The Series may invest up to 10% of its net assets in illiquid securities, which may include securities with contractual restrictions on resale, securities exempt from registration under Rule 144A promulgated under the Securities Act of 1933, as amended, and other securities which may not be readily marketable. The relative illiquidity of these securities may impair the Series from disposing of them in a timely manner and at a fair price when it is necessary or desirable to do so. While maintaining oversight, the Board has delegated to DMC theday-to-day functions of determining whether individual securities are liquid for purposes of the Series’ limitation on investments in illiquid securities. Securities eligible for resale pursuant to Rule 144A, which are determined to be liquid, are not subject to the Series’ 10% limit on investments in illiquid securities. As of Dec. 31, 2019, there were no Rule 144A securities held by the Series.
10. Contractual Obligations
The Series enters into contracts in the normal course of business that contain a variety of indemnifications. The Series’ maximum exposure under these arrangements is unknown. However, the Series has not had prior claims or losses pursuant to these contracts. Management has reviewed the Series’ existing contracts and expects the risk of loss to be remote.
11. Recent Accounting Pronouncements
In August 2018, the FASB issued an Accounting Standards Update (ASU), ASU2018-13, which changes certain fair value measurement disclosure requirements. ASU2018-13, in addition to other modifications and additions, removes the requirement to disclose the amount and reasons for transfers between Level 1 and Level 2 of the fair value hierarchy, the policy for the timing of transfers between levels and the valuation process for
Smid Cap Core Series-20
Delaware VIP® Smid Cap Core Series
Notes to financial statements
Level 3 fair value measurements. ASU2018-13 is effective for fiscal years, and interim periods within those fiscal years, beginning after Dec. 15, 2019. At this time, management is evaluating the implications of these changes on the financial statements.
12. Subsequent Events
Management has determined that no material events or transactions occurred subsequent to Dec. 31, 2019, that would require recognition or disclosure in the Series’ financial statements.
Smid Cap Core Series-21
Delaware VIP® Trust — Delaware VIP Smid Cap Core Series
Report of independent registered public accounting firm
To the Board of Trustees of Delaware VIP® Trust and Shareholders of Delaware VIP Smid Cap Core Series
Opinion on the Financial Statements
We have audited the accompanying statement of assets and liabilities, including the schedule of investments, of Delaware VIP Smid Cap Core Series (one of the series constituting Delaware VIP® Trust, referred to hereafter as the “Series”) as of December 31, 2019, the related statement of operations for the year ended December 31, 2019, the statements of changes in net assets for each of the two years in the period ended December 31, 2019, including the related notes, and the financial highlights for each of the five years in the period ended December 31, 2019 (collectively referred to as the “financial statements”). In our opinion, the financial statements present fairly, in all material respects, the financial position of the Series as of December 31, 2019, the results of its operations for the year then ended, the changes in its net assets for each of the two years in the period ended December 31, 2019 and the financial highlights for each of the five years in the period ended December 31, 2019 in conformity with accounting principles generally accepted in the United States of America.
Basis for Opinion
These financial statements are the responsibility of the Series’ management. Our responsibility is to express an opinion on the Series’ financial statements based on our audits. We are a public accounting firm registered with the Public Company Accounting Oversight Board (United States) (PCAOB) and are required to be independent with respect to the Series in accordance with the U.S. federal securities laws and the applicable rules and regulations of the Securities and Exchange Commission and the PCAOB.
We conducted our audits of these financial statements in accordance with the standards of the PCAOB. Those standards require that we plan and perform the audit to obtain reasonable assurance about whether the financial statements are free of material misstatement, whether due to error or fraud.
Our audits included performing procedures to assess the risks of material misstatement of the financial statements, whether due to error or fraud, and performing procedures that respond to those risks. Such procedures included examining, on a test basis, evidence regarding the amounts and disclosures in the financial statements. Our audits also included evaluating the accounting principles used and significant estimates made by management, as well as evaluating the overall presentation of the financial statements. Our procedures included confirmation of securities owned as of December 31, 2019 by correspondence with the custodian, transfer agents and brokers; when replies were not received from brokers, we performed other auditing procedures. We believe that our audits provide a reasonable basis for our opinion.
/s/PricewaterhouseCoopers LLP
Philadelphia, Pennsylvania
February 21, 2020
We have served as the auditor of one or more investment companies in Delaware Funds® by Macquarie since 2010.
Smid Cap Core Series-22
Delaware VIP® Trust — Delaware VIP Smid Cap Core Series
Other Series information (Unaudited)
Board consideration of Investment Advisory andSub-Advisory Agreements for Delaware VIP Smid Cap Core Series at a meeting held August21-22, 2019
At a meeting held on Aug.21-22, 2019 (the “Annual Meeting”), the Board of Trustees (the “Board”), including a majority of disinterested or independent Trustees, approved the renewal of the investment advisory andsub-advisory agreements for Delaware VIP Smid Cap Core Series (the “Series”). In making its decision, the Board considered information furnished at regular quarterly Board meetings, including reports detailing Series performance, investment strategies, and expenses, as well as information prepared specifically in connection with the renewal of the investment advisory andsub-advisory contracts. Information furnished specifically in connection with the renewal of the Investment Management Agreement with Delaware Management Company (“DMC”), a series of Macquarie Investment Management Business Trust (“MIMBT”) and theSub-Advisory Agreements with Macquarie Funds Management Hong Kong Limited (“MFMHK”) and Macquarie Investment Management Global Limited (“MIMGL”), included materials provided by DMC and its affiliates (collectively, “Macquarie Investment Management”), MFMHK, and MIMGL, concerning, among other things, the nature, extent, and quality of services provided to the Series; the costs of such services to the Series; economies of scale; and the investment manager’s financial condition and profitability. In addition, in connection with the Annual Meeting, materials were provided to the Trustees in May 2019, including reports provided by Broadridge Financial Solutions (“Broadridge”). The Broadridge reports compared the Series’ investment performance and expenses with those of other comparable mutual funds. The Independent Trustees reviewed and discussed the Broadridge reports with independent legal counsel to the Independent Trustees. In addition to the information noted above, the Board also requested and received information regarding DMC’s policy with respect to advisory fee levels and its breakpoint philosophy; the structure of portfolio manager compensation; comparative client fee information; and any constraints or limitations on the availability of securities for certain investment styles, which had in the past year inhibited, or which were likely in the future to inhibit, the investment manager’s ability to invest fully in accordance with Series policies.
In considering information relating to the approval of the Series’ investment advisory andsub-advisory agreements, the Independent Trustees received assistance and advice from and met separately with independent legal counsel to the Independent Trustees and also received assistance and advice from an experienced and knowledgeable independent fund consultant, JDL Consultants, LLC (“JDL”). Although the Board gave attention to all information furnished, the following discussion identifies, under separate headings, the primary factors taken into account by the Board during its contract renewal considerations.
Nature, extent, and quality of services.The Board considered the services provided by DMC to the Series and its shareholders. In reviewing the nature, extent, and quality of services, the Board considered reports furnished to it throughout the year, which covered matters such as the relative performance of the Series; compliance of portfolio managers with the investment policies, strategies, and restrictions for the Series; compliance by DMC and Delaware Distributors, L.P. (together, “Management”) personnel with the Code of Ethics adopted throughout the Delaware Funds® by Macquarie (the “Delaware Funds”); and adherence to fair value pricing procedures as established by the Board. The Board was pleased with the current staffing of DMC and the emphasis placed on research in the investment process. The Board recognized DMC’s receipt of certain favorable industry distinctions during the past several years. The Board gave favorable consideration to DMC’s efforts to control expenses while maintaining service levels committed to Series matters. The Board was satisfied with the nature, extent, and quality of the overall services provided by DMC.
Nature, extent, and quality of services.The Board considered the services provided by MFMHK to the Series and its shareholders. In reviewing the nature, extent, and quality of services, the Board considered reports furnished to it throughout the year at regular Board Meetings covering matters such as relative performance of the Series; compliance of portfolio managers with the investment policies, strategies, and restrictions for the Series; the compliance of MFMHK personnel with its Code of Ethics; and adherence to fair value pricing procedures as established by the Board. The Board was pleased with the current staffing of MFMHK and the emphasis placed on research in the investment process. The Board was satisfied with the nature, extent, and quality of the overall services provided by MFMHK.
Nature, extent, and quality of services.The Board considered the services provided by MIMGL to the Series and its shareholders. In reviewing the nature, extent, and quality of services, the Board considered reports furnished to it throughout the year at regular Board Meetings covering matters such as relative performance of the Series; compliance of portfolio managers with the investment policies, strategies, and restrictions for the Series; the compliance of MIMGL personnel with its Code of Ethics; and adherence to fair value pricing procedures as established by the Board. The Board was pleased with the current staffing of MIMGL and the emphasis placed on research in the investment process. The Board was satisfied with the nature, extent, and quality of the overall services provided by MIMGL.
Investment performance.The Board placed significant emphasis on the investment performance of the Series in view of the importance of investment performance to shareholders. Although the Board considered performance reports and discussions with portfolio managers at Board meetings throughout the year, the Board gave particular weight to the Broadridge reports furnished for the Annual Meeting. The Broadridge reports prepared for the Series showed the investment performance of its Standard Class shares in comparison to a group of similar funds as selected by Broadridge (the “Performance Universe”). A fund with the best performance ranked first, and a fund with the poorest performance ranked last. The highest/best performing 25% of funds in the Performance Universe make up the first quartile; the next 25%, the second quartile; the next 25%, the third quartile; and the poorest/worst
Smid Cap Core Series-23
Delaware VIP® Trust — Delaware VIP Smid Cap Core Series
Other Series information (Unaudited)
Board consideration of Investment Advisory andSub-Advisory Agreements for Delaware VIP Smid Cap Core Series at a meeting held August21-22, 2019
performing 25% of funds in the Performance Universe make up the fourth quartile. Comparative annualized performance for the Series was shown for the past1-,3-,5-, and10-year periods, as applicable, ended Jan. 31, 2019. The Board’s objective is that the Series’ performance for the1-,3-, and5-year periods be at or above the median of its Performance Universe.
Broadridge currently classifies the Series as asmall-cap core fund. However, Management believes that it would be more appropriate to include the Series in themid-cap core funds category. Accordingly, the Broadridge report prepared for the Series compares the Series’ performance to two separate Performance Universes – one, consisting of allsmall-cap core funds underlying variable insurance products, and the other, consisting of allmid-cap core funds underlying variable insurance products. When compared to othersmall-cap core funds, the Broadridge report comparison showed that the Series’ total return for the1-year period was in the second quartile of its Performance Universe. The report further showed that the Series’ total return for the3- year period was in the fourth quartile of its Performance Universe and the Series’ total return for the5- and10-year periods was in the first quartile of its Performance Universe. When compared to othermid-cap core funds, the Broadridge report comparison showed that the Series’ total return for the1-year period was in the second quartile of its Performance Universe. The report further showed that the Series’ total return for the3- year period was in the third quartile of its Performance Universe and the Series’ total return for the5- and10-year periods was in the first quartile of its Performance Universe. The Board was satisfied with performance.
Comparative expenses.The Board considered expense data for the Delaware Funds. Management provided the Board with information on pricing levels and fee structures for the Series as of its most recently completed fiscal year. The Board also focused on the comparative analysis of effective management fees and total expense ratios of the Series versus effective management fees and expense ratios of a group of similar funds as selected by Broadridge (the “Expense Group”). In reviewing comparative costs, the Series’ contractual management fee and the actual management fee incurred by the Series were compared with the contractual management fees (assuming all funds in the Expense Group were similar in size to the Series) and actual management fees (as reported by each fund) within the Expense Group, taking into account any applicable breakpoints and fee waivers. The Series’ total expenses were also compared with those of its Expense Group. The Broadridge total expenses, for comparative consistency, were shown by Broadridge for Standard Class shares which do not charge12b-1 andnon-12b-1 service fees. The Board’s objective is for each Series’ total expense ratio to be competitive with those of the peer funds within its Expense Group.
When compared to othersmall-cap core funds, the expense comparisons for the Series showed that the actual management fee was in the quartile with the lowest expenses of its Expense Group and its total expenses were in the quartile with the second lowest expenses of its Expense Group. When compared to othermid-cap core funds, the expense comparisons for the Series showed that the actual management fee and total expenses were in the quartile with the second lowest expenses of its Expense Group. The Board was satisfied with the management fee and total expenses of the Series in comparison to those of its Expense Group.
Management profitability.The Board considered the level of profits realized by DMC in connection with the operation of the Series. In this respect, the Board reviewed the Investment Management Profitability Analysis that addressed the overall profitability of DMC’s business in providing management and other services to each of the individual funds and the Delaware Funds as a whole. Specific attention was given to the methodology used by DMC in allocating costs for the purpose of determining profitability. Management stated that the level of profits of DMC, to a certain extent, reflects recent operational cost savings and efficiencies initiated by DMC. The Board considered DMC’s efforts to improve services provided to fund shareholders and to meet additional regulatory and compliance requirements resulting from recent industry-wide Securities and Exchange Commission initiatives. The Board also considered the extent to which DMC might derive ancillary benefits from fund operations, including the potential for procuring additional business as a result of the prestige and visibility associated with its role as service provider to the Delaware Funds and the benefits from allocation of fund brokerage to improve trading efficiencies. As part of its work, the Board also reviewed a report prepared by JDL regarding MIMBT profitability as compared to certain peer fund complexes and the Independent Trustees discussed with JDL personnel regarding DMC’s profitability in such context. The Board found that the management fees were reasonable in light of the services rendered and the profitability of DMC.
Economies of scale.The Trustees considered whether economies of scale are realized by DMC as the Series’ assets increase and the extent to which any economies of scale are reflected in the level of management fees charged. The Trustees reviewed the Series’ advisory fee pricing and structure approved by the Board and shareholders, which includes breakpoints, and which applies to most funds in the Delaware Funds complex. Breakpoints in the advisory fee occur when the advisory fee rate is reduced on assets in excess of specified levels. Breakpoints result in a lower advisory fee, than would otherwise be the case in the absence of breakpoints, when the asset levels specified in the breakpoints are exceeded. The Board noted that, as of March 31, 2019, the Series’ assets exceeded the first breakpoint level. The Board believed that, given the extent to which economies of scale might be realized by DMC and its affiliates, the schedule of fees under the Investment Management Agreement provides a sharing of benefits with the Series and its shareholders.
Smid Cap Core Series-24
Delaware VIP® Trust — Delaware VIP Smid Cap Core Series
Other Series information (Unaudited)
Tax Information
All disclosures are based on financial information available as of the date of this annual report and, accordingly is subject to change. For any and all items requiring reporting, it is the intention of the Fund to report the maximum amount permitted under the Internal Revenue Code and the regulations thereunder.
For the year ended Dec. 31, 2019, the Series’ reports distributions paid during the year as follows:
| | | | | | | | |
| | | (A)
Long-Term
Capital Gain
Distributions
(Tax Basis)
| | (B)
Ordinary Income
Distributions
(Tax Basis) | | Total
Distributions
(Tax Basis) | | (C) Qualifying
Dividends1 |
| | 80.19% | | 19.81% | | 100.00% | | 80.71% |
(A) and (B) are based on a percentage of the Series’ total distributions.
(C) is based on a percentage of the Series’ ordinary income distributions.
1Qualifying dividends represent dividends which qualify for the corporate dividends received deduction.
Smid Cap Core Series-25
Delaware Funds® by Macquarie
Board of trustees / directors and officers addendum
A mutual fund is governed by a Board of Trustees/Directors (“Trustees”), which has oversight responsibility for the management of a fund’s business affairs. Trustees establish procedures and oversee and review the performance of the investment manager, the distributor, and others who perform services for the fund. The independent fund trustees, in particular, are advocates for shareholder interests. Each trustee has served in that capacity since he or she was elected to or appointed to the Board of Trustees, and will continue to serve until his or her retirement or the election of a new trustee in his or her place. The following is a list of the Trustees and Officers with certain background and related information.
| | | | | | | | | | |
Name, Address, and Birth Date | | Position(s) Held with Fund(s) | | Length of Time
Served | | Principal
Occupation(s) During
the Past Five Years | | Number of
Portfolios in Fund
Complex Overseen
by Trustee or Officer | | Other Directorships
Held by Trustee or Officer |
| INTERESTED TRUSTEE | | | | | | | | |
| | | | | |
Shawn K. Lytle1 2005 Market Street Philadelphia, PA 19103 February 1970 | | President, Chief Executive Officer, and Trustee | | President and Chief Executive Officer since August 2015 Trustee since September 2015 | | President — Macquarie Investment Management2(June 2015-Present) Regional Head of Americas — UBS Global Asset Management (April2010-May 2015) | | 95 | | Trustee — UBS Relationship Funds, SMA Relationship Trust, and UBS Funds (May 2010–April 2015) |
| INDEPENDENT TRUSTEES | | | | | | | | |
| | | | | |
Thomas L. Bennett 2005 Market Street Philadelphia, PA 19103 October 1947 | | Chair and Trustee | | Trustee since
March 2005 Chair since
March 2015 | | Private Investor (March 2004–Present) | | 95 | | None |
Jerome D. Abernathy 2005 Market Street Philadelphia, PA 19103 July 1959 | | Trustee | | Since January 2019 | | Managing Member, Stonebrook Capital Management, LLC (financial technology: macro factors and databases) (January 1993–Present) | | 95 | | None |
Ann D. Borowiec 2005 Market Street Philadelphia, PA 19103 November 1958 | | Trustee | | Since
March 2015 | | Chief Executive Officer, Private Wealth Management (2011–2013) and Market Manager, New Jersey Private Bank (2005–2011) — J.P. Morgan Chase & Co. | | 95 | | Director — Banco Santander International (October 2016–December 2019) Director — Santander Bank, N.A. (December 2016–December 2019) |
Joseph W. Chow 2005 Market Street Philadelphia, PA 19103 January 1953 | | Trustee | | Since
January 2013 | | Private Investor (April 2011–Present) | | 95 | | Director and Audit Committee Member — Hercules Technology Growth Capital, Inc. (July 2004–July 2014) |
Smid Cap Core Series-26
| | | | | | | | | | |
Name, Address, and Birth Date | | Position(s) Held with Fund(s) | | Length of Time
Served | | Principal
Occupation(s) During
the Past Five Years | | Number of
Portfolios in Fund
Complex Overseen
by Trustee or Officer | | Other Directorships
Held by Trustee or Officer |
John A. Fry 2005 Market Street Philadelphia, PA 19103 May 1960 | | Trustee | | Since January 2001 | | President — Drexel University (August 2010–Present) President — Franklin & Marshall College (July 2002–July 2010) | | 95 | | Director; Compensation Committee and Governance Committee Member — Community Health Systems (May 2004–Present) Director — Drexel Morgan & Co. (2015–Present) Director and Audit Committee Member — vTv Therapeutics LLC (2017–Present) Director and Audit Committee Member — FS Credit Real Estate Income Trust, Inc. (2018–Present) Director — Federal Reserve Bank of Philadelphia (January 2020–Present) |
Lucinda S. Landreth 2005 Market Street Philadelphia, PA 19103 June 1947 | | Trustee | | Since
March 2005 | | Private Investor (2004–Present) | | 95 | | None |
Frances A. Sevilla-Sacasa 2005 Market Street Philadelphia, PA 19103 January 1956 | | Trustee | | Since
September 2011 | | Private Investor (January 2017-Present) Chief Executive Officer — Banco Itaú International (April 2012–December 2016) Executive Advisor to Dean (August 2011–March 2012) and Interim Dean (January 2011–July 2011) — University of Miami School of Business Administration President — U.S. Trust, Bank of America Private Wealth Management (Private Banking) (July 2007–December 2008) | | 95 | | Trust Manager and Audit Committee Chair — Camden Property Trust (August 2011–Present) Director; Strategic Planning and Reserves Committee and Nominating and Governance Committee Member — Callon Petroleum Company (December 2019–Present) Director; Audit Committee Member — Carrizo Oil & Gas, Inc. (March 2018–December 2019) |
Thomas K. Whitford 2005 Market Street Philadelphia, PA 19103 March 1956 | | Trustee | | Since
January 2013 | | Vice Chairman (2010–April 2013) — PNC Financial Services Group | | 95 | | Director — HSBC North America Holdings Inc. (December 2013-Present) Director — HSBC USA Inc. (July 2014-Present) Director — HSBC Bank USA, National Association (July 2014-March 2017) Director — HSBC Finance Corporation (December 2013-April 2018) |
Smid Cap Core Series-27
| | | | | | | | | | |
Name, Address, and Birth
Date | | Position(s) Held with Fund(s) | | Length of Time
Served | | Principal
Occupation(s) During
the Past Five Years | | Number of
Portfolios in Fund
Complex Overseen
by Trustee or Officer | | Other Directorships
Held by Trustee or Officer |
Christianna Wood 2005 Market Street Philadelphia, PA 19103 March 1956 | | Trustee | | Since
January 2019 | | Chief Executive Officer and President — Gore Creek Capital, Ltd. (August 2009–Present) | | 95 | | Director; Finance Committee and Audit Committee Member — H&R Block Corporation (July 2008–Present) Director; Chair of Investments Committee and Audit Committee Member — Grange Insurance (2013–Present) Trustee; Chair of Nominating and Governance Committee and Audit Committee Member — The Merger Fund (2013–Present), The Merger Fund VL (2013–Present); WCM Alternatives: Event-Driven Fund (2013–Present), and WCM Alternatives: Credit Event Fund (December 2017–Present) Director; Chair of Governance Committee and Audit Committee Member — International Securities Exchange (2010–2016) |
Janet L. Yeomans 2005 Market Street Philadelphia, PA 19103 July 1948 | | Trustee | | Since
April 1999 | | Vice President and Treasurer (January 2006–July 2012), Vice President — Mergers & Acquisitions (January 2003–January 2006), and Vice President and Treasurer (July 1995–January 2003) — 3M Company | | 95 | | Director; Personnel and Compensation Committee Chair; Member of Nominating, Investments, and Audit Committees for various periods throughout directorship — Okabena Company (2009-2017) |
Smid Cap Core Series-28
| | | | | | | | | | |
Name, Address, and Birth Date | | Position(s) Held with Fund(s) | | Length of Time
Served | | Principal
Occupation(s) During
the Past Five Years | | Number of
Portfolios in Fund
Complex Overseen
by Trustee or Officer | | Other
Directorships
Held by Trustee or Officer |
| OFFICERS | | | | | | | | | | |
| | | | | |
David F. Connor 2005 Market Street Philadelphia, PA 19103 December 1963 | | Senior Vice President, General Counsel, and Secretary | | Senior Vice President, since May 2013; General Counsel since May 2015; Secretary since October 2005 | | David F. Connor has served in various capacities at different times at Macquarie Investment Management. | | 95 | | None3 |
Daniel V. Geatens 2005 Market Street Philadelphia, PA 19103 October 1972 | | Vice President and Treasurer | | Vice President and Treasurer since October 2007 | | Daniel V. Geatens has served in various capacities at different times at Macquarie Investment Management. | | 95 | | None3 |
Richard Salus 2005 Market Street Philadelphia, PA 19103 October 1963 | | Senior Vice President and Chief Financial Officer | | Senior Vice President and Chief Financial Officer since November 2006 | | Richard Salus has served in various capacities at different times at Macquarie Investment Management. | | 95 | | None |
| 1 | Shawn K. Lytle is considered to be an “Interested Trustee” because he is an executive officer of the Fund’s(s’) investment advisor. |
| 2 | Macquarie Investment Management is the marketing name for Macquarie Management Holdings, Inc. and its subsidiaries, including the Fund’s(s’) investment advisor, principal underwriter, and its transfer agent. |
| 3 | David F. Connor and Daniel V. Geatens serve in similar capacities for the six portfolios of the Optimum Fund Trust, which have the same investment advisor, principal underwriter, and transfer agent as the registrant. Mr. Geatens also serves as the Chief Financial Officer of the Optimum Fund Trust and he is the Chief Financial Officer and Treasurer for Macquarie Global Infrastructure Total Return Fund Inc. |
The Statement of Additional Information for the Fund(s) includes additional information about the Trustees and Officers and is available, without charge, upon request by calling 800523-1918.
Smid Cap Core Series-29
| | | | |
| | The Series files its complete schedule of portfolio holdings with the Securities and Exchange Commission (SEC) for the first and third quarters of each fiscal year on FormN-Q or FormN-PORT (available for filings after March 31, 2019). The Series’ FormsN-Q or FormsN-PORT, as well as a description of the policies and procedures that the Series uses to determine how to vote proxies (if any) relating to portfolio securities, are available without charge (i) upon request, by calling 800523-1918; and (ii) on the SEC’s website at sec.gov. In addition, a description of the policies and procedures that the Series uses to determine how to vote proxies (if any) relating to portfolio securities and the Schedule of Investments included in the Series’ most recent FormN-Q or FormN-PORT are available without charge on the Series’ website at delawarefunds.com/vip/literature. The Series’ FormsN-Q and FormsN-PORT may be reviewed and copied at the SEC’s Public Reference Room in Washington, D.C.; information on the operation of the Public Reference Room may be obtained by calling 800SEC-0330. Information (if any) regarding how the Series voted proxies relating to portfolio securities during the most recently disclosed12-month period ended June 30 is available without charge (i) through the Series’ website at delawarefunds.com/proxy; and (ii) the SEC’s website at sec.gov. | | |
| | |
| AR-VIPSCC 22469 (2/20) (1073909) | | Smid Cap Core Series-30 |
Delaware VIP® Trust
Delaware VIP High Yield Series
December 31, 2019
Beginning on or about June 1, 2021, as permitted by regulations adopted by the Securities and Exchange Commission, paper copies of your Series’ shareholder reports will no longer be sent to you by mail, unless you specifically request them from the Series or from your financial intermediary, such as a broker/dealer, bank, or insurance company. Instead, you will be notified by mail each time a report is posted on the website and provided with a link to access the report.
If you already elected to receive shareholder reports electronically, you will not be affected by this change and you do not need to take any action.
You may elect to receive paper copies of all future shareholder reports free of charge. You can inform the Series that you wish to continue receiving paper copies of your shareholder reports by contacting us at 800523-1918. If you own these shares through a financial intermediary, you may contact your financial intermediary to elect to continue to receive paper copies of your shareholder reports. Your election to receive reports in paper will apply to all funds held with the Delaware Funds® by Macquarie or your financial intermediary.

Table of contents
Other than Macquarie Bank Limited (MBL), none of the entities noted are authorized deposit-taking institutions for the purposes of the Banking Act 1959 (Commonwealth of Australia). The obligations of these entities do not represent deposits or other liabilities of MBL. MBL does not guarantee or otherwise provide assurance in respect of the obligations of these entities, unless noted otherwise. The Series is governed by US laws and regulations.
Unless otherwise noted, views expressed herein are current as of Dec. 31, 2019, and subject to change for events occurring after such date.
The Series is not FDIC insured and is not guaranteed. It is possible to lose the principal amount invested.
Advisory services provided by Delaware Management Company, a series of Macquarie Investment Management Business Trust (MIMBT), a US registered investment advisor.
The Series is distributed byDelaware Distributors, L.P.(DDLP), an affiliate of MIMBT and Macquarie Group Limited. Macquarie Investment Management (MIM) is the marketing name for certain companies comprising the asset management division of Macquarie Group Limited and its subsidiaries and affiliates worldwide.
This material may be used in conjunction with the offering of shares in Delaware VIP® High Yield Series only if preceded or accompanied by the Series’ current prospectus or the summary prospectus.
© 2020 Macquarie Management Holdings, Inc.
All third-party marks cited are the property of their respective owners.
| | |
Delaware VIP®Trust — Delaware VIP High Yield Series |
Portfolio management review | | January 7, 2020 (Unaudited) |
The investment objective of the Series is to seek total return and, as a secondary objective, high current income.
For the fiscal year ended Dec. 31, 2019, Delaware VIP High Yield Series (the “Series”) Standard Class shares gained 16.43% and Service Class shares gained 16.12%. Both figures reflect all dividends reinvested. The Series outperformed its benchmark, the ICE BofA US High Yield Constrained Index, which advanced 14.41% for the same period.
High yield bonds experienced strong performance during the Series’ fiscal year, as prices and yields responded to shifts in the outlook for interest rates, oil prices, and trade negotiations. The fiscal year started with a significant rally in risk assets as the Federal Reserve reversed course from its 2018 rate hikes and West Texas Intermediate (WTI) oil prices bounced off their end of year 2018 lows. Reacting in part to the message conveyed by a global flight to quality during the fourth quarter of 2018, the Fed signaled a pause in its monetary tightening cycle, citing low inflation and uncertainty arising from theUS-China trade war as reasons to adopt a more “data dependent” stance. Along with a recovery in energy prices and an occasional (if fleeting) easing of trade tensions, risk assets rallied through the better part of 2019. High yield bond prices continued to rally through the end of the Series’ fiscal year as a Phase 1US-China trade agreement and another significant move higher in WTI oil prices allowed for higher-beta (higher-risk) spreads to compress by more than 100 basis points in December (one basis point is one hundredth of a percentage point).
The fundamental underpinnings of the high yield market remained positive during the12-month period. Corporate earnings generally met or surpassed expectations and technical factors also were generally positive as fund inflows were robust andnew-issue supply was healthy. Notably, the new supply was mostly in the form of refinancing – a healthy departure from the traditional late-cycle pattern of leveraged buyouts, in our view. Reflecting the unsettled economic and political environment, high yield credit spreads moved in a range of nearly 200 basis points over the fiscal year. On Dec. 31, 2019, the spread stood at 360 basis points over US Treasurys, down from 535 basis points at the start of the12-month period.
Among industry groups, energy was a notable outlier and the only sector to significantly underperform the broader benchmark during the Series’ fiscal year. The oil field services and exploration and production (E&P) subsectors were the key contributors to the underperformance here. The metals and mining sector also lagged the Series’ benchmark, the ICE BofA US High Yield Constrained Index, affected by concerns surrounding global growth outlooks and demand for commodities. Meanwhile, market leadership was concentrated in the rate-sensitive sectors. These included banking, insurance brokers, and financial services. (Source: Bloomberg.)
During the fiscal year, the Series’ largest sector contributors were insurance brokers and telecommunications-wireline. In both cases, strong credit selection and a sector overweight added value. The Series’ holdings in consumer lease financing lagged the benchmark return because of an underweight to the sector. The Series’ poor credit selection within the energy E&P sector also detracted from performance during the12-month period.
At the start of the fiscal year, the Series was positioned in a neutral-risk configuration, except for its overweight to the energy sector. Energy is the largest sector within high yield, and the Series outperformed in the first quarter of 2019 as WTI oil prices bounced off their lows at the end of 2018, as previously mentioned. We considered the fourth quarter 2018 selloff in energy companies overdone, and our view was rewarded when oil prices bounced back during the first three months of 2019. In part, our decision to maintain an overweight to the energy sector coming into 2019 was based on the view that deteriorating economic conditions and heightened geopolitical risks would compel the Fed to reconsider its plans to continue raising interest rates.
As the rebound in energy prices gathered steam later in the spring of 2019, we used the rally as an opportunity to reduce the Series’ weighting in that sector. We also applied this strategy to the Series’metals-and-mining and chemical holdings. Proceeds from the sale of those commodity-linked groups were deployed first in cash and then to buy higher-quality,BB-rated companies. These moves were consistent with our ongoing strategy of constructing a consolidated portfolio of higher-conviction positions. Our emphasis on fewer but higher-quality holdings also reflected the reality that companies reporting lowered forward guidance and earnings misses in the later stages of an economic cycle often experience the sharpest selloffs.
The Series’ strongest returns came fromHub International Ltd.,Tronox Holdings,andTenet Healthcare Corp.Hub International’s performance was driven by strong financial performance as the company successfully executed on both its organic and inorganic growth strategies. Tronox outperformed during the fiscal year when management successfully executed its merger and acquisition strategy by realizing stronger-than-expected synergies and cost savings. Finally, Tenet Healthcare outperformed due to strong hospital volumes and management’s ability to successfully refinance its capital structure.
Earnings shortfalls, lowered guidance, and precipitous declines in equity valuations were major factors for the Series’ leading detractors, most of which were companies in the energy sector that had significant exposure to natural gas prices. (During the fiscal year, natural gas prices fell further than either of the two major crude oil benchmarks.)
In addition to the weak pricing environment for natural gas,Alta Mesa Holdings LPreported accounting irregularities, a management shakeup, and credit deterioration. We used the rally in energy prices in early 2019 to trim the Series’ holdings in the issue and exited the position entirely by the end of the
High Yield Series-1
| | |
Delaware VIP®Trust — Delaware VIP High Yield Series |
Portfolio management review (continued) | | January 7, 2020 (Unaudited) |
fiscal period.Chesapeake Energy Corp.also detracted from the Series’ performance as the decline in natural gas prices, lower equity valuations, and a levered balance sheet weighed on bond prices across the capital structure. However, we remain confident about the company’s longer-term prospects and continue to hold the bonds. The Series’ stake inWhiting Petroleum Corp.,since liquidated, also lagged the benchmark, largely owing to consecutive quarters of missed earnings, weakness in WTI oil prices, and lower equity valuations.
At the end of the fiscal year, the Series was overweight the higher-quality,BB-rated bonds that we consider appropriate for the higher-volatility, lower rate environment that we think is likely to remain in 2020. We also maintained an underweight toB-rated bonds and an even weight toCCC-rated issuers.
Although high yield valuations are stretched by historical standards, we find it instructive to view credit spreads in the context of a global fixed income market in which $15 trillion of sovereign debt trades with a negative yield. The lack of current income in most of Europe and parts of Asia has motivated inflows to US high yield. Still, we are cognizant of the potential cyclical and geopolitical risks to high yield bonds and have positioned the Series in a slightly defensive configuration. In that regard, we believe ourbottom-up (bond by bond) approach to constructing the Series is especially suitable in these uncertain times.
Unless otherwise noted, views expressed herein are current as of Dec. 31, 2019, and subject to change.
High Yield Series-2
Delaware VIP® Trust — Delaware VIP High Yield Series
Performance summary (Unaudited)
The performance quoted represents past performance and does not guarantee future results. Investment return and principal value of an investment will fluctuate so that shares, when redeemed, may be worth more or less than their original cost. Current performance may be lower or higher than the performance quoted.
Carefully consider the Series’ investment objectives, risk factors, charges, and expenses before investing. This and other information can be found in the Series’ prospectus and its summary prospectus, which may be obtained by visiting delawarefunds.com/vip/literature or calling 800523-1918. Investors should read the prospectus and the summary prospectus carefully before investing.
| | | | | | | | | | | | | | | | |
| Delaware VIP High Yield Series | | | | | | | | | |
Average annual total returns | | | | | | | | | | | | |
| For period ended December 31, 2019 | | 1 year | | 3 year | | 5 year | | | 10 year | | | Lifetime | |
Standard Class shares (commenced operations on July 28, 1988) | | +16.43% | | +6.13% | | | +4.79% | | | | +6.71% | | | | +6.76% | |
| | | | | | | | | | | | | | |
Service Class shares (commenced operations on May 1, 2000) | | +16.12% | | +5.86% | | | +4.52% | | | | +6.43% | | | | +6.07% | |
| | | | | | | | | | | | | | |
ICE BofA US High Yield Constrained Index | | +14.41% | | +6.32% | | | +6.14% | | | | +7.48% | | | | n/a | |
Returns reflect the reinvestment of all distributions. Please see page 4 for a description of the index.
As described in the Series’ most recent prospectus, the net expense ratio for Service Class shares of the Series was 1.04% and the net expense ratio of Standard Class shares was 0.74%, while total operating expenses for Standard Class and Service Class shares were 0.75% and 1.05%, respectively. The management fee for Standard Class and Service Class shares was 0.65%. The Series’ investment manager, Delaware Management Company (Manager), has contractually agreed to waive all or a portion of its investment advisory fees and/or pay/reimburse expenses (excluding any12b-1 fees, acquired fund fees and expenses, taxes, interest, short sale and dividend interest expenses, brokerage fees, certain insurance costs, and nonroutine expenses or costs, including, but not limited to, those relating to reorganizations, litigation, conducting shareholder meetings, and liquidations) in order to prevent annual series operating expenses from exceeding 0.74% of the Series’ average daily net assets from April 30, 2019 through Dec. 31, 2019.* Prior to April 30, 2019, the waiver was 0.75% of the Series’ average daily net assets. These waivers and reimbursements may only be terminated by agreement of the Manager and the Series.
The Series’ distributor has contracted to limit the12b-1 fees for Service Class shares to 30% of average daily net assets from Jan. 1, 2019 through Dec 31, 2019.*
Earnings from a variable annuity or variable life investment compoundtax-free until withdrawal, and as a result, no adjustments were made for income taxes.
Expense limitations were in effect for both classes during certain periods shown in the Series performance table above and in the Performance of a $10,000 Investment graph on the next page.
Performance data do not reflect insurance fees related to a variable annuity or variable life investment or the deferred sales charge that would apply to certain withdrawals of investments held for fewer than eight years. Performance shown here would have been reduced if such fees were included and the expense limitation removed. For more information about fees, consult your variable annuity or variable life prospectus.
Investments in variable products involve risk.
Fixed income securities and bond funds can lose value, and investors can lose principal, as interest rates rise. They also may be affected by economic conditions that hinder an issuer’s ability to make interest and principal payments on its debt.
The Series may also be subject to prepayment risk, the risk that the principal of a bond that is held by a portfolio will be prepaid prior to maturity, at the time when interest rates are lower than what the bond was paying. The Series may then have to reinvest that money at a lower interest rate.
High yielding,non-investment-grade bonds (junk bonds) involve higher risk than investment grade bonds. The high yield secondary market is particularly susceptible to liquidity problems when institutional investors, such as mutual funds and certain other financial institutions, temporarily stop buying bonds for regulatory, financial, or other reasons. In addition, a less liquid secondary market makes it more difficult for the Fund to obtain precise valuations of the high yield securities in its portfolio.
The Series may experience portfolio turnover in excess of 100%, which could result in higher transaction costs and tax liability.
High Yield Series-3
Delaware VIP® High Yield Series
Performance summary (Unaudited) (continued)
International investments entail risks not ordinarily associated with US investments including fluctuation in currency values, differences in accounting principles, or economic or political instability in other nations. Investing in emerging markets can be riskier than investing in established foreign markets due to increased volatility and lower trading volume.
The Series may invest in derivatives, which may involve additional expenses and are subject to risk, including the risk that an underlying security or securities index moves in the opposite direction from what the portfolio manager anticipated. A derivatives transaction depends upon the counterparties’ ability to fulfill their contractual obligations.
LIBOR risk is the risk that potential changes related to the use of the London interbank offered rate (LIBOR) could have adverse impacts on financial instruments which reference LIBOR. The potential abandonment of LIBOR could affect the value and liquidity of instruments which reference LIBOR.
Please read both the contract and underlying prospectus for specific details regarding the product’s risk profile.
*The aggregate contractual waiver period covering this report is from May 1, 2018 through April 30, 2020.
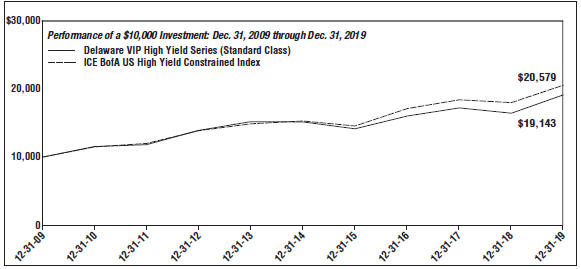
| | | | |
| For period beginning Dec. 31, 2009 through Dec. 31, 2019 | | Starting value | | Ending value |
–– ICE BofA US High Yield Constrained Index | | $10,000 | | $20,579 |
–– Delaware VIP High Yield Series (Standard Class) | | $10,000 | | $19,143 |
The graph shows a $10,000 investment in the Delaware VIP High Yield Series Standard Class shares for the period from Dec. 31, 2009 through Dec. 31, 2019.
The graph also shows $10,000 invested in the ICE BofA US High Yield Constrained Index for the period from Dec. 31, 2009 through Dec. 31, 2019. The ICE BofA US High Yield Constrained Index tracks the performance of US dollar-denominated high yield corporate debt publicly issued in the US domestic market, but caps individual issuer exposure at 2% of the benchmark.
Index performance returns do not reflect any management fees, transaction costs or expenses. Indices are unmanaged and one cannot invest directly in an index.
Performance of Service Class shares will vary due to different charges and expenses.
Past performance is not a guarantee of future results.
High Yield Series-4
Delaware VIP® Trust – Delaware VIP High Yield Series
Disclosure of Series expenses
For thesix-month period July 1, 2019 to December 31, 2019 (Unaudited)
As a shareholder of the Series, you incur ongoing costs, which may include management fees; distribution and service(12b-1) fees; and other Series expenses. This example is intended to help you understand your ongoing costs (in dollars) of investing in the Series and to compare these costs with the ongoing costs of investing in other mutual funds.
The example is based on an investment of $1,000 invested at the beginning of the period and held for the entiresix-month period from July 1, 2019 to Dec. 31, 2019.
Actual expenses
The first section of the table shown, “Actual Series Return,” provides information about actual account values and actual expenses. You may use the information in this section of the table, together with the amount you invested, to estimate the expenses that you paid over the period. Simply divide your account value by $1,000 (for example, an $8,600 account value divided by $1,000 = 8.6), then multiply the result by the number in the first section under the heading entitled “Expenses Paid During Period” to estimate the expenses you paid on your account during the period.
Hypothetical example for comparison purposes
The second section of the table shown, “Hypothetical 5% Return,” provides information about hypothetical account values and hypothetical expenses based on the Series’ actual expense ratio and an assumed rate of return of 5% per year before expenses, which is not the Series’ actual return. The hypothetical account values and expenses may not be used to estimate the actual ending account balance or expenses you paid for the period. You may use this information to compare the ongoing costs of investing in the Series and other funds. To do so, compare the 5% hypothetical example with the 5% hypothetical examples that appear in the shareholder reports of other funds.
Please note that the expenses shown in the table are meant to highlight your ongoing costs only. As a shareholder of the Series, you do not incur any transaction costs, such as sales charges (loads), redemption fees or exchange fees, but shareholders of other funds may incur such costs. Also, the fees related to the variable annuity investment or the deferred sales charge that could apply have not been included. Therefore, the second section of the table is useful in comparing ongoing costs only, and will not help you determine the relative total costs of owning different funds. The Series’ expenses shown in the table reflect fee waivers in effect and assume reinvestment of all dividends and distributions.
Expense analysis of an investment of $1,000
| | | | | | | | | | | | | | |
| | | Beginning
Account
Value
7/1/19 | | | Ending
Account
Value
12/31/19 | | | Annualized
Expense
Ratio | | Expenses
Paid During
Period
7/1/19 to
12/31/19* | |
Actual Series return† | | | | |
Standard Class | | | $1,000.00 | | | | $1,041.00 | | | 0.73% | | | $3.76 | |
Service Class | | | 1,000.00 | | | | 1,041.20 | | | 1.03% | | | 5.30 | |
Hypothetical 5% return(5% return before expenses) | |
Standard Class | | | $1,000.00 | | | | $1,021.53 | | | 0.73% | | | $3.72 | |
Service Class | | | 1,000.00 | | | | 1,020.01 | | | 1.03% | | | 5.24 | |
*“Expenses Paid During Period” are equal to the Series’ annualized expense ratio, multiplied by the average account value over the period, multiplied by 184/365 (to reflect theone-half year period).
| † | Because actual returns reflect only the most recentsix-month period, the returns shown may differ significantly from fiscal year returns. |
In addition to the Series’ expenses reflected above, the Series also indirectly bears its portion of the fees and expenses of the investment companies (Underlying Funds) in which it invests. The table above does not reflect the expenses of the Underlying Funds.
High Yield Series-5
Delaware VIP® Trust — Delaware VIP High Yield Series
Security type / sector allocation
As of December 31, 2019 (Unaudited)
Sector designations may be different than the sector designations presented in other Series materials. The sector designations may represent the investment manager’s internal sector classifications.
| | |
| Security type / sector | | Percentage of
net assets |
Corporate Bonds | | 88.33% |
Banking | | 3.57% |
Basic Industry | | 10.45% |
Capital Goods | | 6.96% |
Communications | | 7.85% |
Consumer Cyclical | | 6.50% |
ConsumerNon-Cyclical | | 2.89% |
Energy | | 12.47% |
Financial Services | | 1.41% |
Healthcare | | 6.75% |
Insurance | | 3.76% |
Media | | 12.27% |
Real Estate | | 0.91% |
Services | | 4.10% |
Technology & Electronics | | 5.91% |
Utilities | | 2.53% |
Loan Agreements | | 6.73% |
Common Stock | | 0.00% |
Short-Term Investments | | 4.37% |
Total Value of Securities | | 99.43% |
Receivables and Other Assets Net of Liabilities | | 0.57% |
Total Net Assets | | 100.00% |
High Yield Series-6
Delaware VIP® Trust – Delaware VIP High Yield Series
Schedule of investments
December 31, 2019
| | | | | | | | |
| | | Principal | | | Value | |
| | | amount° | | | (US $) | |
| |
Corporate Bonds – 88.33% | | | | | |
Banking – 3.57% | |
Ally Financial 8.00% 11/1/31 | | | 1,175,000 | | | $ | 1,633,191 | |
Credit Suisse Group 144A 6.25%#µy | | | 865,000 | | | | 943,547 | |
Popular 6.125% 9/14/23 | | | 1,930,000 | | | | 2,082,788 | |
Royal Bank of Scotland Group 8.625%µy | | | 1,885,000 | | | | 2,041,596 | |
Synovus Financial 5.90% 2/7/29 µ | | | 510,000 | | | | 541,888 | |
| | | | | | | | |
| | | | | | | 7,243,010 | |
| | | | | | | | |
Basic Industry – 10.45% | | | | | | | | |
Allegheny Technologies 5.875% 12/1/27 | | | 1,385,000 | | | | 1,454,943 | |
BMC East 144A 5.50% 10/1/24 # | | | 855,000 | | | | 891,692 | |
Boise Cascade 144A 5.625% 9/1/24 # | | | 289,000 | | | | 301,402 | |
Chemours 7.00% 5/15/25 | | | 1,020,000 | | | | 1,029,777 | |
First Quantum Minerals 144A 7.25% 5/15/22 # | | | 510,000 | | | | 513,305 | |
144A 7.50% 4/1/25 # | | | 545,000 | | | | 558,399 | |
Freeport-McMoRan 5.45% 3/15/43 | | | 1,100,000 | | | | 1,141,360 | |
Hudbay Minerals 144A 7.625% 1/15/25 # | | | 1,075,000 | | | | 1,136,904 | |
IAMGOLD 144A 7.00% 4/15/25 # | | | 510,000 | | | | 532,835 | |
Joseph T Ryerson & Son 144A 11.00% 5/15/22 # | | | 1,555,000 | | | | 1,644,402 | |
Kraton Polymers 144A 7.00% 4/15/25 # | | | 1,010,000 | | | | 1,043,138 | |
Lennar 5.00% 6/15/27 | | | 600,000 | | | | 652,709 | |
M/I Homes 5.625% 8/1/25 | | | 1,145,000 | | | | 1,202,725 | |
Mattamy Group 144A 5.25% 12/15/27 # | | | 1,040,000 | | | | 1,084,200 | |
New Enterprise Stone & Lime 144A 10.125% 4/1/22 # | | | 1,238,000 | | | | 1,314,214 | |
Novelis 144A 5.875% 9/30/26 # | | | 700,000 | | | | 746,499 | |
Olin 5.00% 2/1/30 | | | 1,055,000 | | | | 1,072,777 | |
5.625% 8/1/29 | | | 1,025,000 | | | | 1,084,501 | |
Standard Industries 144A 6.00% 10/15/25 # | | | 1,980,000 | | | | 2,086,405 | |
Steel Dynamics 5.50% 10/1/24 | | | 722,000 | | | | 743,740 | |
TPC Group 144A 10.50% 8/1/24 # | | | 980,000 | | | | 989,393 | |
| | | | | | | | |
| | | | | | | 21,225,320 | |
| | | | | | | | |
Capital Goods – 6.96% | | | | | | | | |
ARD Finance 144A PIK 6.50% 6/30/27 #T | | | 820,000 | | | | 849,356 | |
Ardagh Packaging Finance 144A 6.00% 2/15/25 # | | | 285,000 | | | | 299,606 | |
Berry Global 144A 5.625% 7/15/27 # | | | 1,160,000 | | | | 1,247,029 | |
Bombardier
144A 7.50% 3/15/25 # | | | 1,065,000 | | | | 1,100,933 | |
144A 7.875% 4/15/27 # | | | 510,000 | | | | 525,950 | |
EnPro Industries 5.75% 10/15/26 | | | 1,305,000 | | | | 1,393,541 | |
Gates Global 144A 6.25% 1/15/26 # | | | 945,000 | | | | 962,997 | |
Granite Holdings US Acquisition 144A 11.00% 10/1/27 # | | | 525,000 | | | | 533,057 | |
| | | | | | | | |
| | | Principal | | | Value | |
| | | amount° | | | (US $) | |
Corporate Bonds (continued) | |
Capital Goods (continued) | | | | | | | | |
Intertape Polymer Group 144A 7.00% 10/15/26 # | | | 1,095,000 | | | $ | 1,161,080 | |
Mauser Packaging Solutions Holding 144A 7.25% 4/15/25 # | | | 1,035,000 | | | | 1,024,640 | |
TransDigm
144A 5.50% 11/15/27 # | | | 515,000 | | | | 521,736 | |
144A 6.25% 3/15/26 # | | | 1,180,000 | | | | 1,279,691 | |
Trivium Packaging Finance 144A 5.50% 8/15/26 # | | | 705,000 | | | | 744,215 | |
144A 8.50% 8/15/27 # | | | 705,000 | | | | 785,617 | |
United Rentals North America 5.25% 1/15/30 | | | 950,000 | | | | 1,024,243 | |
Zekelman Industries 144A 9.875% 6/15/23 # | | | 652,000 | | | | 685,823 | |
| | | | | | | | |
| | | | | | | 14,139,514 | |
| | | | | | | | |
Communications – 7.85% | | | | | | | | |
C&W Senior Financing
144A 6.875% 9/15/27 # | | | 791,000 | | | | 847,677 | |
144A 7.50% 10/15/26 # | | | 520,000 | | | | 564,295 | |
CenturyLink 144A 5.125% 12/15/26 # | | | 882,000 | | | | 899,755 | |
Cincinnati Bell 144A 7.00% 7/15/24 # | | | 1,140,000 | | | | 1,198,414 | |
Connect Finco 144A 6.75% 10/1/26 # | | | 1,470,000 | | | | 1,567,387 | |
Frontier Communications 144A 8.00% 4/1/27 # | | | 1,026,000 | | | | 1,074,068 | |
Level 3 Financing 144A 3.875% 11/15/29 # | | | 1,000,000 | | | | 1,009,350 | |
Sprint
7.125% 6/15/24 | | | 1,225,000 | | | | 1,324,023 | |
7.625% 3/1/26 | | | 605,000 | | | | 668,313 | |
7.875% 9/15/23 | | | 1,650,000 | | | | 1,823,935 | |
Sprint Capital 8.75% 3/15/32 | | | 490,000 | | | | 595,644 | |
T-Mobile USA
6.00% 4/15/24 | | | 685,000 | | | | 708,968 | |
6.50% 1/15/26 | | | 1,189,000 | | | | 1,277,057 | |
T-Mobile USA Escrow=† | | | 2,290,000 | | | | 0 | |
Vodafone Group 7.00% 4/4/79 µ | | | 725,000 | | | | 851,260 | |
Zayo Group 6.375% 5/15/25 | | | 1,497,000 | | | | 1,546,274 | |
| | | | | | | | |
| | | | | | | 15,956,420 | |
| | | | | | | | |
Consumer Cyclical – 6.50% | | | | | | | | |
Allison Transmission 144A 5.875% 6/1/29 # | | | 970,000 | | | | 1,064,403 | |
AMC Entertainment Holdings 6.125% 5/15/27 | | | 1,950,000 | | | | 1,784,299 | |
Boyd Gaming 144A 4.75% 12/1/27 # | | | 465,000 | | | | 483,879 | |
6.00% 8/15/26 | | | 1,505,000 | | | | 1,620,279 | |
Golden Nugget 144A 8.75% 10/1/25 # | | | 722,000 | | | | 773,886 | |
MGM Growth Properties Operating Partnership 144A 5.75% 2/1/27 # | | | 1,510,000 | | | | 1,689,313 | |
MGM Resorts International 5.75% 6/15/25 | | | 1,130,000 | | | | 1,268,414 | |
High Yield Series-7
Delaware VIP® High Yield Series
Schedule of investments (continued)
| | | | | | | | |
| | | Principal | | | Value | |
| | | amount° | | | (US $) | |
| |
Corporate Bonds (continued) | | | | | |
Consumer Cyclical (continued) | |
Scientific Games International
144A 7.00% 5/15/28 # | | | 255,000 | | | $ | 273,322 | |
144A 7.25% 11/15/29 # | | | 350,000 | | | | 381,273 | |
144A 8.25% 3/15/26 # | | | 1,550,000 | | | | 1,711,780 | |
Staples 144A 10.75% 4/15/27 # | | | 970,000 | | | | 986,345 | |
William Carter 144A 5.625% 3/15/27 # | | | 1,090,000 | | | | 1,174,281 | |
| | | | | | | | |
| | | | | | | 13,211,474 | |
| | | | | | | | |
| |
ConsumerNon-Cyclical – 2.89% | | | | | |
JBS USA
144A 5.50% 1/15/30 # | | | 525,000 | | | | 564,874 | |
144A 5.75% 6/15/25 # | | | 190,000 | | | | 197,204 | |
144A 6.50% 4/15/29 # | | | 720,000 | | | | 801,454 | |
144A 6.75% 2/15/28 # | | | 1,085,000 | | | | 1,200,943 | |
Pilgrim’s Pride 144A 5.75% 3/15/25 # | | | 945,000 | | | | 978,751 | |
Post Holdings 144A 5.50% 12/15/29 # | | | 1,035,000 | | | | 1,105,535 | |
Spectrum Brands 144A 5.00% 10/1/29 # | | | 995,000 | | | | 1,030,171 | |
| | | | | | | | |
| | | | | | | 5,878,932 | |
| | | | | | | | |
| |
Energy – 12.47% | | | | | |
AmeriGas Partners 5.875% 8/20/26 | | | 1,205,000 | | | | 1,330,742 | |
Cheniere Corpus Christi Holdings 7.00% 6/30/24 | | | 1,715,000 | | | | 1,979,925 | |
Cheniere Energy Partners 144A 4.50% 10/1/29 # | | | 965,000 | | | | 993,419 | |
Crestwood Midstream Partners 144A 5.625% 5/1/27 # | | | 1,140,000 | | | | 1,158,553 | |
DCP Midstream Operating 5.125% 5/15/29 | | | 1,085,000 | | | | 1,127,695 | |
Genesis Energy 6.50% 10/1/25 | | | 1,685,000 | | | | 1,634,433 | |
Gulfport Energy 6.375% 1/15/26 | | | 805,000 | | | | 501,392 | |
Hess Midstream Operations 144A 5.125% 6/15/28 # | | | 605,000 | | | | 613,319 | |
Murphy Oil
5.875% 12/1/27 | | | 1,520,000 | | | | 1,597,900 | |
5.875% 12/1/42 | | | 575,000 | | | | 530,975 | |
Murphy Oil USA 4.75% 9/15/29 | | | 435,000 | | | | 460,195 | |
5.625% 5/1/27 | | | 1,600,000 | | | | 1,720,556 | |
NuStar Logistics 6.00% 6/1/26 | | | 1,340,000 | | | | 1,419,561 | |
Oasis Petroleum 144A 6.25% 5/1/26 # | | | 1,105,000 | | | | 919,940 | |
PDC Energy 6.125% 9/15/24 | | | 168,000 | | | | 170,590 | |
Precision Drilling 144A 7.125% 1/15/26 # | | | 1,725,000 | | | | 1,643,662 | |
Southwestern Energy 7.75% 10/1/27 | | | 1,920,000 | | | | 1,783,152 | |
Summit Midstream Holdings 5.75% 4/15/25 | | | 1,125,000 | | | | 862,498 | |
Targa Resources Partners 5.375% 2/1/27 | | | 1,140,000 | | | | 1,184,859 | |
5.875% 4/15/26 | | | 975,000 | | | | 1,037,765 | |
Transocean 144A 9.00% 7/15/23 # | | | 1,495,000 | | | | 1,582,211 | |
| | | | | | | | |
| | | Principal | | | Value | |
| | | amount° | | | (US $) | |
Corporate Bonds (continued) | |
Energy (continued) | | | | | | | | |
WPX Energy 5.25% 10/15/27 | | | 1,025,000 | | | $ | 1,083,271 | |
| | | | | | | | |
| | | | | | | 25,336,613 | |
| | | | | | | | |
| |
Financial Services – 1.41% | | | | | |
DAE Funding 144A 5.75% 11/15/23 # | | | 1,110,000 | | | | 1,167,348 | |
NFP 144A 8.00% 7/15/25 # | | | 525,000 | | | | 537,030 | |
Springleaf Finance 5.375% 11/15/29 | | | 780,000 | | | | 815,607 | |
VistaJet Malta Finance 144A 10.50% 6/1/24 # | | | 365,000 | | | | 347,511 | |
| | | | | | | | |
| | | | | | | 2,867,496 | |
| | | | | | | | |
| |
Healthcare – 6.75% | | | | | |
AMN Healthcare 144A 4.625% 10/1/27 # | | | 525,000 | | | | 527,807 | |
Bausch Health 144A 5.50% 11/1/25 # | | | 2,015,000 | | | | 2,109,876 | |
Catalent Pharma Solutions 144A 5.00% 7/15/27 # | | | 350,000 | | | | 367,273 | |
Charles River Laboratories International 144A 5.50% 4/1/26 # | | | 1,554,000 | | | | 1,674,159 | |
Eagle Holding Co II 144A PIK 7.75% 5/15/22 #T | | | 1,085,000 | | | | 1,103,619 | |
Encompass Health 4.75% 2/1/30 | | | 335,000 | | | | 348,182 | |
5.75% 11/1/24 | | | 462,000 | | | | 468,161 | |
Hadrian Merger 144A 8.50% 5/1/26 # | | | 1,150,000 | | | | 1,180,587 | |
HCA
5.375% 2/1/25 | | | 925,000 | | | | 1,024,821 | |
5.875% 2/1/29 | | | 530,000 | | | | 613,475 | |
7.58% 9/15/25 | | | 580,000 | | | | 698,900 | |
Select Medical 144A 6.25% 8/15/26 # | | | 845,000 | | | | 916,280 | |
Tenet Healthcare
6.875% 11/15/31 | | | 415,000 | | | | 424,482 | |
8.125% 4/1/22 | | | 2,035,000 | | | | 2,254,841 | |
| | | | | | | | |
| | | | | | | 13,712,463 | |
| | | | | | | | |
| |
Insurance – 3.76% | | | | | |
Centene 144A 4.625% 12/15/29 # | | | 505,000 | | | | 533,129 | |
GTCR AP Finance 144A 8.00% 5/15/27 # | | | 830,000 | | | | 865,563 | |
HUB International 144A 7.00% 5/1/26 # | | | 1,225,000 | | | | 1,298,531 | |
SBL Holdings 144A 5.125% 11/13/26 # | | | 860,000 | | | | 865,188 | |
USI 144A 6.875% 5/1/25 # | | | 1,585,000 | | | | 1,624,134 | |
WellCare Health Plans 144A 5.375% 8/15/26 # | | | 2,290,000 | | | | 2,443,087 | |
| | | | | | | | |
| | | | | | | 7,629,632 | |
| | | | | | | | |
| |
Media – 12.27% | | | | | |
Altice Luxembourg
144A 7.625% 2/15/25 # | | | 980,000 | | | | 1,021,650 | |
144A 10.50% 5/15/27 # | | | 904,000 | | | | 1,032,278 | |
CCO Holdings
144A 5.375% 6/1/29 # | | | 995,000 | | | | 1,064,003 | |
144A 5.50% 5/1/26 # | | | 160,000 | | | | 168,972 | |
144A 5.75% 2/15/26 # | | | 2,065,000 | | | | 2,182,436 | |
High Yield Series-8
Delaware VIP® High Yield Series
Schedule of investments (continued)
| | | | | | | | |
| | | Principal | | | Value | |
| | | amount° | | | (US $) | |
| |
Corporate Bonds (continued) | | | | | |
Media (continued) | |
CCO Holdings 144A 5.875% 5/1/27 # | | | 985,000 | | | $ | 1,043,925 | |
Clear Channel Worldwide Holdings 144A 9.25% 2/15/24 # | | | 1,566,000 | | | | 1,737,610 | |
CSC Holdings
144A 5.75% 1/15/30 # | | | 1,050,000 | | | | 1,122,187 | |
6.75% 11/15/21 | | | 965,000 | | | | 1,040,753 | |
144A 7.50% 4/1/28 # | | | 945,000 | | | | 1,070,045 | |
144A 7.75% 7/15/25 # | | | 530,000 | | | | 566,411 | |
Cumulus Media New Holdings 144A 6.75% 7/1/26 # | | | 1,055,000 | | | | 1,132,146 | |
Diamond Sports Group 144A 6.625% 8/15/27 # | | | 1,805,000 | | | | 1,758,702 | |
Gray Television 144A 7.00% 5/15/27 # | | | 1,060,000 | | | | 1,179,886 | |
LCPR Senior Secured Financing 144A 6.75% 10/15/27 # | | | 525,000 | | | | 557,471 | |
Netflix 144A 4.875% 6/15/30 # | | | 520,000 | | | | 529,087 | |
144A 5.375% 11/15/29 # | | | 365,000 | | | | 389,393 | |
Nexstar Broadcasting 144A 5.625% 7/15/27 # | | | 1,735,000 | | | | 1,831,553 | |
Radiate Holdco 144A 6.625% 2/15/25 # | | | 1,565,000 | | | | 1,585,212 | |
Scripps Escrow 144A 5.875% 7/15/27 # | | | 700,000 | | | | 734,545 | |
Sirius XM Radio 144A 5.375% 4/15/25 # | | | 1,050,000 | | | | 1,087,133 | |
Terrier Media Buyer 144A 8.875% 12/15/27 # | | | 845,000 | | | | 895,700 | |
VTR Finance 144A 6.875% 1/15/24 # | | | 1,170,000 | | | | 1,198,764 | |
| | | | | | | | |
| | | | | | | 24,929,862 | |
| | | | | | | | |
| |
Real Estate – 0.91% | | | | | |
HAT Holdings I 144A 5.25% 7/15/24 # | | | 1,760,000 | | | | 1,853,870 | |
| | | | | | | | |
| | | | | | | 1,853,870 | |
| | | | | | | | |
| |
Services – 4.10% | | | | | |
Advanced Disposal Services 144A 5.625% 11/15/24 # | | | 705,000 | | | | 735,255 | |
Avis Budget Car Rental 144A 6.375% 4/1/24 # | | | 376,000 | | | | 391,196 | |
Clean Harbors 144A 5.125% 7/15/29 # | | | 610,000 | | | | 656,023 | |
Covanta Holding 6.00% 1/1/27 | | | 1,015,000 | | | | 1,073,715 | |
Iron Mountain US Holdings 144A 5.375% 6/1/26 # | | | 1,770,000 | | | | 1,854,690 | |
Prime Security Services Borrower 144A 5.75% 4/15/26 # | | | 965,000 | | | | 1,050,648 | |
144A 9.25% 5/15/23 # | | | 151,000 | | | | 158,644 | |
Tms International Holding 144A 7.25% 8/15/25 # | | | 560,000 | | | | 507,968 | |
United Rentals North America
5.875% 9/15/26 | | | 1,025,000 | | | | 1,102,157 | |
6.50% 12/15/26 | | | 730,000 | | | | 803,666 | |
| | | | | | | | |
| | | | | | | 8,333,962 | |
| | | | | | | | |
| | | | | | | | |
| | | Principal | | | Value | |
| | | amount° | | | (US $) | |
Corporate Bonds (continued) | |
Technology & Electronics – 5.91% | |
Banff Merger Sub 144A 9.75% 9/1/26 # | | | 1,080,000 | | | $ | 1,096,227 | |
Broadcom 3.50% 1/15/28 | | | 1,055,000 | | | | 1,062,286 | |
Camelot Finance 144A 4.50% 11/1/26 # | | | 855,000 | | | | 880,115 | |
CDK Global 5.875% 6/15/26 | | | 1,464,000 | | | | 1,566,670 | |
CommScope Technologies 144A 5.00% 3/15/27 # | | | 312,000 | | | | 294,068 | |
144A 6.00% 6/15/25 # | | | 970,000 | | | | 973,521 | |
Micron Technology 4.663% 2/15/30 | | | 1,055,000 | | | | 1,162,131 | |
NCR 144A 6.125% 9/1/29 # | | | 1,030,000 | | | | 1,119,579 | |
RP Crown Parent 144A 7.375% 10/15/24 # | | | 1,638,000 | | | | 1,706,247 | |
SS&C Technologies 144A 5.50% 9/30/27 # | | | 1,024,000 | | | | 1,095,040 | |
Verscend Escrow 144A 9.75% 8/15/26 # | | | 950,000 | | | | 1,041,461 | |
| | | | | | | | |
| | | | | | | 11,997,345 | |
| | | | | | | | |
| |
Utilities – 2.53% | | | | | |
Calpine 144A 5.25% 6/1/26 # | | | 965,000 | | | | 1,007,047 | |
TerraForm Power Operating
144A 4.75% 1/15/30 # | | | 1,000,000 | | | | 1,019,350 | |
144A 5.00% 1/31/28 # | | | 500,000 | | | | 529,580 | |
Vistra Operations 144A 5.00% 7/31/27 # | | | 494,000 | | | | 517,134 | |
144A 5.50% 9/1/26 # | | | 1,336,000 | | | | 1,419,263 | |
144A 5.625% 2/15/27 # | | | 605,000 | | | | 638,638 | |
| | | | | | | | |
| | | | | | | 5,131,012 | |
| | | | | | | | |
Total Corporate Bonds (cost $172,171,443) | | | | | | | 179,446,925 | |
| | | | | | | | |
| |
Loan Agreements – 6.73% | | | | | |
Air Medical Group Holdings Tranche B 1st Lien 5.035% (LIBOR01M + 3.25%) 4/28/22 | | | 578,573 | | | | 567,544 | |
Applied Systems 2nd Lien 8.945% (LIBOR03M + 7.00%) 9/19/25 | | | 1,940,398 | | | | 1,991,333 | |
Apro Tanche B 5.842% (LIBOR03M + 4.00%) 10/28/26 • | | | 563,889 | | | | 568,823 | |
Blue Ribbon 1st Lien 5.891% (LIBOR03M + 4.00%) 11/15/21 • | | | 357,005 | | | | 308,854 | |
BW Gas & Convenience Holdings Tranche B 8.00% (LIBOR03M + 6.25%) 11/18/24 • | | | 529,000 | | | | 527,677 | |
CEC Entertainment Tranche B 8.299% (LIBOR01M + 6.50%) 8/17/26 • | | | 523,688 | | | | 504,835 | |
Chesapeake Energy 9.928% (LIBOR03M + 8.00%) 6/9/24 • | | | 905,000 | | | | 934,413 | |
Frontier Communications TrancheB-1 1st Lien 5.55% (LIBOR01M + 3.75%) 6/15/24 • | | | 1,025,379 | | | | 1,032,941 | |
Granite Generation Tranche B 7.50% (PRIME03M + 3.75%) 11/9/26 • | | | 824,000 | | | | 817,820 | |
High Yield Series-9
Delaware VIP® High Yield Series
Schedule of investments (continued)
| | | | | | | | |
| | | Principal | | | Value | |
| | | amount° | | | (US $) | |
| |
Loan Agreements (continued) | | | | | |
Granite US Holdings Tranche B 7.211% (LIBOR03M + 5.25%) 9/30/26 • | | | 534,660 | | | $ | 537,333 | |
Kronos 2nd Lien 10.159% (LIBOR03M + 8.25%) 11/1/24 | | | 922,000 | | | | 947,355 | |
LCPR Loan Financing Tranche B 6.74% (LIBOR01M + 5.00%) 10/22/26 • | | | 396,000 | | | | 401,940 | |
Merrill Communications Tranche B 1st Lien 7.089% (LIBOR03M + 5.00%) 10/5/26 | | | 735,000 | | | | 740,513 | |
Panther BF Aggregator 2 Tranche B 1st Lien 5.305% (LIBOR01M + 3.50%) 4/30/26 • | | | 608,475 | | | | 612,146 | |
Prime Security Services Borrower TrancheB-1 4.944% (LIBOR01M + 3.25%) 9/23/26 • | | | 516,705 | | | | 518,714 | |
Stars Group Holdings Tranche B 5.446% (LIBOR03M + 3.50%) 7/10/25 | | | 564,495 | | | | 570,182 | |
Summit Midstream Partners Holdings Tranche B 1st Lien 7.799% (LIBOR01M + 6.00%) 5/13/22 • | | | 427,947 | | | | 420,458 | |
Terrier Media Buyer Tranche B 0.00% 12/17/26 X | | | 434,000 | | | | 438,883 | |
Vantage Specialty Chemicals 2nd Lien 10.159% (LIBOR03M + 8.25%) 10/20/25 • | | | 570,000 | | | | 515,850 | |
| | | | | | | | |
| | | Principal | | | Value | |
| | | amount° | | | (US $) | |
Loan Agreements (continued) | | | | | | | | |
Verscend Holding Tranche B 6.299% (LIBOR01M + 4.50%) 8/27/25 • | | | 711,430 | | | $ | 717,210 | |
| | | | | | | | |
Total Loan Agreements (cost $13,632,637) | | | | | | | 13,674,824 | |
| | | | | | | | |
| | | Number of | | | | |
| | | shares | | | | |
| |
Common Stock – 0.00% | | | | | |
Century Communications =† | | | 2,820,000 | | | | 0 | |
| | | | | | | | |
Total Common Stock (cost $85,371) | | | | | | | 0 | |
| | | | | | | | |
| |
Short-Term Investments – 4.37% | | | | | |
Money Market Mutual Funds – 4.37% | | | | | | | | |
BlackRock FedFund – Institutional | | | | | | | | |
Shares(seven-day effective yield 1.52%) | | | 1,773,577 | | | | 1,773,577 | |
Fidelity Investments Money Market Government Portfolio – Class I(seven-day effective yield 1.49%) | | | 1,773,577 | | | | 1,773,577 | |
GS Financial Square Government Fund – Institutional Shares(seven-day effective yield 1.51%) | | | 1,773,577 | | | | 1,773,577 | |
Morgan Stanley Government Portfolio – Institutional Share Class(seven-day effective yield 1.48%) | | | 1,773,577 | | | | 1,773,577 | |
State Street Institutional US Government Money Market Fund – Investor Class(seven-day effective yield 1.45%) | | | 1,773,577 | | | | 1,773,577 | |
| | | | | | | | |
Total Short-Term Investments(cost $8,867,885) | | | | | | | 8,867,885 | |
| | | | | | | | |
| | | | |
Total Value of Securities – 99.43%
(cost $194,757,336) | | $ | 201,989,634 | |
| | | | |
| # | Security exempt from registration under Rule 144A of the Securities Act of 1933, as amended. At Dec. 31, 2019, the aggregate value of Rule 144A securities was $115,993,324, which represents 57.10% of the Series’ net assets. See Note 9 in “Notes to financial statements.” |
| T | PIK. 100% of the income received was in the form of cash. |
| = | The value of this security was determined using significant unobservable inputs and is reported as a Level 3 security in the disclosure table located in Note 3 in “Notes to financial statements.” |
| ° | Principal amount shown is stated in USD unless noted that the security is denominated in another currency. |
| µ | Fixed to variable rate investment. The rate shown reflects the fixed rate in effect at Dec. 31, 2019. Rate will reset at a future date. |
| y | No contractual maturity date. |
| † | Non-income producing security. |
| • | Variable rate investment. Rates reset periodically. Rate shown reflects the rate in effect at Dec. 31, 2019. For securities based on a published reference rate and spread, the reference rate and spread are indicated in their description above. The reference rate descriptions (i.e. LIBOR03M, LIBOR06M, etc.) used in this report are identical for different securities, but the underlying reference rates may differ due to the timing of the reset period. Certain variable rate securities are not based on a published reference rate and spread but are determined by the issuer or agent and are based on current market conditions, or for mortgage-backed securities, are impacted by the individual mortgages which are paying off over time. These securities do not indicate a reference rate and spread in their description above. |
| X | This loan will settle after Dec. 31, 2019, at which time the interest rate, based on the LIBOR and the agreed upon spread on trade date, will be reflected. |
High Yield Series-10
Delaware VIP® High Yield Series
Schedule of investments (continued)
Unfunded Commitments
The Series may invest in floating rate loans. In connection with these investments, the Series may also enter into unfunded corporate loan commitments (commitments). Commitments may obligate the Series to furnish temporary financing to a borrower until permanent financing can be arranged. In connection with these commitments, the Series earns a commitment fee, typically set as a percentage of the commitment amount. The following unfunded loan commitment was outstanding at Dec. 31, 2019:
| | | | | | |
Borrower | | Principal Amount | | Value | | Unrealized Appreciation
(Depreciation) |
APRO Tranche B-DD 2.00% (LIBOR03M+4.00%) 10/28/26 | | $161,111 | | $162,521 | | $1,410 |
Summary of abbreviations:
GS – Goldman Sachs
ICE – Intercontinental Exchange
LIBOR – London Interbank Offered Rate
LIBOR01M – ICE LIBOR USD 1 Month
LIBOR03M – ICE LIBOR USD 3 Month
LIBOR06M – ICE LIBOR USD 6 Month
PIK –Payment-in-kind
USD – US dollar
See accompanying notes, which are an integral part of the financial statements.
High Yield Series-11
| | | | |
| Delaware VIP®Trust — Delaware VIP High Yield Series | | | | |
| Statement of assets and liabilities | | | December 31, 2019 | |
| | | | |
Assets: | | | | |
Investments, at value1 | | $ | 201,989,634 | |
Dividend and interest receivable | | | 2,870,858 | |
Receivable for securities sold | | | 203,425 | |
Other assets | | | 1,410 | |
Receivable for series shares sold | | | 10,368 | |
| | | | |
| |
Total assets | | | 205,075,695 | |
| | | | |
| |
Liabilities: | | | | |
Payable for securities purchased | | | 1,595,246 | |
Investment management fees payable to affiliates | | | 114,386 | |
Cash due to custodian | | | 65,143 | |
Payable for series shares redeemed | | | 64,953 | |
Other accrued expenses | | | 50,079 | |
Distribution fees payable to affiliates | | | 31,374 | |
Trustees’ fees and expenses payable | | | 2,019 | |
Dividend disbursing and transfer agent fees and expenses payable to affiliates | | | 1,291 | |
Accounting and administration expenses payable to affiliates | | | 911 | |
Legal fees payable to affiliates | | | 313 | |
Reports and statements to shareholders expenses payable to affiliates | | | 97 | |
| | | | |
| |
Total liabilities | | | 1,925,812 | |
| | | | |
| |
Total Net Assets | | $ | 203,149,883 | |
| | | | |
| |
Net Assets Consist of: | | | | |
Paid-in capital | | $ | 221,529,454 | |
Total distributable earnings (loss) | | | (18,379,571 | ) |
| | | | |
Total Net Assets | | $ | 203,149,883 | |
| | | | |
| |
Net Asset Value: | | | | |
Standard Class: | | | | |
Net assets | | $ | 79,463,414 | |
Shares of beneficial interest outstanding, unlimited authorization, no par | | | 15,648,999 | |
Net asset value per share | | $ | 5.08 | |
| |
Service Class: | | | | |
Net assets | | $ | 123,686,469 | |
Shares of beneficial interest outstanding, unlimited authorization, no par | | | 24,464,154 | |
Net asset value per share | | $ | 5.06 | |
| | | | |
1Investments, at cost | | $ | 194,757,336 | |
See accompanying notes, which are an integral part of the financial statements.
High Yield Series-12
Delaware VIP®Trust —
Delaware VIP High Yield Series
Statement of operations
Year ended December 31, 2019
| | | | |
Investment Income: | | | | |
Interest | | $ | 12,238,521 | |
Dividends | | | 129,243 | |
| | | | |
| |
| | | 12,367,764 | |
| | | | |
Expenses: | | | | |
Management fees | | | 1,326,758 | |
Distribution expenses – Service Class | | | 374,255 | |
Accounting and administration expenses | | | 75,078 | |
Reports and statements to shareholders expenses | | | 44,486 | |
Audit and tax fees | | | 42,682 | |
Dividend disbursing and transfer agent fees and expenses | | | 17,106 | |
Trustees’ fees and expenses | | | 12,114 | |
Legal fees | | | 9,862 | |
Custodian fees | | | 9,295 | |
Registration fees | | | 147 | |
Other | | | 22,715 | |
| | | | |
| | | 1,934,498 | |
Less expenses waived | | | (41,660 | ) |
Less expenses paid indirectly | | | (1,698 | ) |
| | | | |
Total operating expenses | | | 1,891,140 | |
| | | | |
Net Investment Income | | | 10,476,624 | |
| | | | |
|
Net Realized and Unrealized Gain (Loss): | |
Net realized loss on investments* | | | (1,923,638 | ) |
Net change in unrealized appreciation (depreciation) of investments | | | 21,590,972 | |
| | | | |
Net Realized and Unrealized Gain | | | 19,667,334 | |
| | | | |
Net Increase in Net Assets Resulting from Operations | | $ | 30,143,958 | |
| | | | |
*Includes $2,148,795 related to the General Motors term loan litigation. See Note 11 in “Notes to financial statements.”
Delaware VIP Trust —
Delaware VIP High Yield Series
Statements of changes in net assets
| | | | | | | | |
| | | Year ended | |
| | | 12/31/19 | | | 12/31/18 | |
Increase (Decrease) in Net Assets from Operations: | | | | | | | | |
Net investment income | | $ | 10,476,624 | | | $ | 12,784,077 | |
Net realized loss | | | (1,923,638 | ) | | | (2,031,094 | ) |
Net change in unrealized appreciation (depreciation) | | | 21,590,972 | | | | (21,186,613 | ) |
| | | | | | | | |
Net increase (decrease) in net assets resulting from operations | | | 30,143,958 | | | | (10,433,630 | ) |
| | | | | | | | |
| |
Dividends and Distributions to Shareholders from: | | | | | |
Distributable earnings: | | | | | | | | |
Standard Class | | | (5,240,447 | ) | | | (5,963,938 | ) |
Service Class | | | (8,090,946 | ) | | | (8,454,447 | ) |
| | | | | | | | |
| | |
| | | (13,331,393 | ) | | | (14,418,385 | ) |
| | | | | | | | |
|
Capital Share Transactions: | |
Proceeds from shares sold: | | | | | | | | |
Standard Class | | | 5,881,247 | | | | 15,912,072 | |
Service Class | | | 14,379,364 | | | | 16,527,138 | |
Net asset value of shares issued upon reinvestment of dividends and distributions: | | | | | | | | |
Standard Class | | | 5,240,447 | | | | 5,963,938 | |
Service Class | | | 8,090,946 | | | | 8,454,447 | |
| | | | | | | | |
| | |
| | | 33,592,004 | | | | 46,857,595 | |
| | | | | | | | |
| | |
Cost of shares redeemed: | | | | | | | | |
Standard Class | | | (13,886,413 | ) | | | (38,683,697 | ) |
Service Class | | | (27,423,040 | ) | | | (41,242,107 | ) |
| | | | | | | | |
| | |
| | | (41,309,453 | ) | | | (79,925,804 | ) |
| | | | | | | | |
Decrease in net assets derived from capital share transactions | | | (7,717,449 | ) | | | (33,068,209 | ) |
| | | | | | | | |
Net Increase (Decrease) in Net Assets | | | 9,095,116 | | | | (57,920,224 | ) |
| | |
Net Assets: | | | | | | | | |
Beginning of year | | | 194,054,767 | | | | 251,974,991 | |
| | | | | | | | |
End of year | | $ | 203,149,883 | | | $ | 194,054,767 | |
| | | | | | | | |
See accompanying notes, which are an integral part of the financial statements.
High Yield Series-13
Delaware VIP® Trust — Delaware VIP High Yield Series
Financial highlights
Selected data for each share of the Series outstanding throughout each period were as follows:
| | | | | | | | | | | | | | | | | | | | | | | | | |
| | | Delaware VIP High Yield Series Standard Class Year ended |
| | | 12/31/19 | | 12/31/18 | | 12/31/17 | | 12/31/16 | | 12/31/15 |
Net asset value, beginning of period | | | | $ 4.67 | | | | | $ 5.20 | | | | | $ 5.14 | | | | | $ 4.89 | | | | | $ 5.67 | |
| | | | | |
Income (loss) from investment operations: | | | | | | | | | | | | | | | | | | | | | | | | | |
Net investment income1 | | | | 0.26 | | | | | 0.28 | | | | | 0.28 | | | | | 0.29 | | | | | 0.34 | |
Net realized and unrealized gain (loss) | | | | 0.48 | | | | | (0.50 | ) | | | | 0.09 | | | | | 0.32 | | | | | (0.67 | ) |
| | | | | | | | | | | | | | | | | | | | | | | | | |
Total from investment operations | | | | 0.74 | | | | | (0.22 | ) | | | | 0.37 | | | | | 0.61 | | | | | (0.33 | ) |
| | | | | | | | | | | | | | | | | | | | | | | | | |
| | | | | |
Less dividends and distributions from: | | | | | | | | | | | | | | | | | | | | | | | | | |
Net investment income | | | | (0.33 | ) | | | | (0.31 | ) | | | | (0.31 | ) | | | | (0.36 | ) | | | | (0.37 | ) |
Net realized gain | | | | — | | | | | — | | | | | — | | | | | — | | | | | (0.08 | ) |
| | | | | | | | | | | | | | | | | | | | | | | | | |
Total dividends and distributions | | | | (0.33 | ) | | | | (0.31 | ) | | | | (0.31 | ) | | | | (0.36 | ) | | | | (0.45 | ) |
| | | | | | | | | | | | | | | | | | | | | | | | | |
| | | | | |
Net asset value, end of period | | | | $ 5.08 | | | | | $ 4.67 | | | | | $ 5.20 | | | | | $ 5.14 | | | | | $ 4.89 | |
| | | | | | | | | | | | | | | | | | | | | | | | | |
| | | | | |
Total return2 | | | | 16.43% | 3,4 | | | | (4.47% | ) | | | | 7.49% | | | | | 13.16% | 4 | | | | (6.60% | )4 |
| | | | | |
Ratios and supplemental data: | | | | | | | | | | | | | | | | | | | | | | | | | |
Net assets, end of period (000 omitted) | | | | $ 79,463 | | | | | $ 75,568 | | | | | $102,359 | | | | | $112,614 | | | | | $111,748 | |
Ratio of expenses to average net assets5 | | | | 0.74% | | | | | 0.75% | | | | | 0.75% | | | | | 0.74% | | | | | 0.75% | |
Ratio of expenses to average net assets prior to fees waived5 | | | | 0.76% | | | | | 0.75% | | | | | 0.75% | | | | | 0.75% | | | | | 0.76% | |
Ratio of net investment income to average net assets | | | | 5.32% | | | | | 5.60% | | | | | 5.35% | | | | | 5.95% | | | | | 6.25% | |
Ratio of net investment income to average net assets prior to fees waived | | | | 5.30% | | | | | 5.60% | | | | | 5.35% | | | | | 5.94% | | | | | 6.24% | |
Portfolio turnover | | | | 87% | | | | | 96% | | | | | 86% | | | | | 112% | | | | | 99% | |
| 1 | The average shares outstanding method has been applied for per share information. |
| 2 | Total return is based on the change in net asset value of a share during the period and assumes reinvestment of dividends and distributions at net asset value. Total return does not include fees, charges, or expenses imposed by the variable annuity and life insurance contracts for which Delaware VIP Trust serves as an underlying investment vehicle. |
| 3 | General Motors term loan litigation were included in total return. If excluded, the impact on the total return would be 1.11% lower. See Note 11 in “Notes to financial statements.” |
| 4 | Total return during the period reflects a waiver by the manager and/or distributor. Performance would have been lower had the waiver not been in effect. |
| 5 | Expense ratios do not include expenses of the Underlying Funds in which the Series invests. |
See accompanying notes, which are an integral part of the financial statements.
High Yield Series-14
Delaware VIP® High Yield Series
Financial highlights (continued)
Selected data for each share of the Series outstanding throughout each period were as follows:
| | | | | | | | | | | | | | | | | | | | | | | | | |
| | | Delaware VIP High Yield Series Service Class Year ended |
| | | 12/31/19 | | 12/31/18 | | 12/31/17 | | 12/31/16 | | 12/31/15 |
Net asset value, beginning of period | | | | $ 4.65 | | | | | $ 5.18 | | | | | $ 5.12 | | | | | $ 4.87 | | | | | $ 5.65 | |
| | | | | |
Income (loss) from investment operations: | | | | | | | | | | | | | | | | | | | | | | | | | |
Net investment income1 | | | | 0.25 | | | | | 0.26 | | | | | 0.26 | | | | | 0.28 | | | | | 0.32 | |
Net realized and unrealized gain (loss) | | | | 0.48 | | | | | (0.49 | ) | | | | 0.10 | | | | | 0.32 | | | | | (0.66 | ) |
| | | | | | | | | | | | | | | | | | | | | | | | | |
Total from investment operations | | | | 0.73 | | | | | (0.23 | ) | | | | 0.36 | | | | | 0.60 | | | | | (0.34 | ) |
| | | | | | | | | | | | | | | | | | | | | | | | | |
| | | | | |
Less dividends and distributions from: | | | | | | | | | | | | | | | | | | | | | | | | | |
Net investment income | | | | (0.32 | ) | | | | (0.30 | ) | | | | (0.30 | ) | | | | (0.35 | ) | | | | (0.36 | ) |
Net realized gain | | | | — | | | | | — | | | | | — | | | | | — | | | | | (0.08 | ) |
| | | | | | | | | | | | | | | | | | | | | | | | | |
Total dividends and distributions | | | | (0.32 | ) | | | | (0.30 | ) | | | | (0.30 | ) | | | | (0.35 | ) | | | | (0.44 | ) |
| | | | | | | | | | | | | | | | | | | | | | | | | |
| | | | | |
Net asset value, end of period | | | | $ 5.06 | | | | | $ 4.65 | | | | | $ 5.18 | | | | | $ 5.12 | | | | | $ 4.87 | |
| | | | | | | | | | | | | | | | | | | | | | | | | |
| | | | | |
Total return2 | | | | 16.12%3 | | | | | (4.76% | ) | | | | 7.26% | | | | | 12.91% | | | | | (6.87% | ) |
| | | | | |
Ratios and supplemental data: | | | | | | | | | | | | | | | | | | | | | | | | | |
Net assets, end of period (000 omitted) | | | | $123,687 | | | | | $118,487 | | | | | $149,616 | | | | | $160,831 | | | | | $162,513 | |
Ratio of expenses to average net assets4 | | | | 1.04% | | | | | 1.03% | | | | | 1.00% | | | | | 0.99% | | | | | 1.00% | |
Ratio of expenses to average net assets prior to fees waived4 | | | | 1.06% | | | | | 1.05% | | | | | 1.05% | | | | | 1.05% | | | | | 1.06% | |
Ratio of net investment income to average net assets | | | | 5.02% | | | | | 5.32% | | | | | 5.10% | | | | | 5.70% | | | | | 6.00% | |
Ratio of net investment income to average net assets prior to fees waived | | | | 5.00% | | | | | 5.30% | | | | | 5.05% | | | | | 5.64% | | | | | 5.94% | |
Portfolio turnover | | | | 87% | | | | | 96% | | | | | 86% | | | | | 112% | | | | | 99% | |
| 1 | The average shares outstanding method has been applied for per share information. |
| 2 | Total return is based on the change in net asset value of a share during the period and assumes reinvestment of dividends and distributions at net asset value. Total return during all of the periods shown reflects waivers by the manager and/or distributor. Performance would have been lower had the waivers not been in effect. Total return does not include fees, charges, or expenses imposed by the variable annuity and life insurance contracts for which Delaware VIP Trust serves as an underlying investment vehicle. |
| 3 | General Motors term loan litigation were included in total return. If excluded, the impact on the total return would be 1.11% lower. See Note 11 in “Notes to financial statements.” |
| 4 | Expense ratios do not include expenses of the Underlying Funds in which the Series invests. |
See accompanying notes, which are an integral part of the financial statements.
High YieldSeries-15
Delaware VIP® Trust — Delaware VIP High Yield Series
Notes to financial statements
December 31, 2019
Delaware VIP Trust (Trust) is organized as a Delaware statutory trust and offers 22 series, each of which is treated as a separate entity for certain matters under the Investment Company Act of 1940, as amended (1940 Act). These financial statements and the related notes pertain to Delaware VIP High Yield Series (Series). The Trust is anopen-end investment company. The Series is considered diversified under the 1940 Act and offers Standard Class and Service Class shares. The Standard Class shares do not carry a distribution and service(12b-1) fee and the Service Class shares carry a12b-1 fee. The shares of the Series are sold only to separate accounts of life insurance companies.
1. Significant Accounting Policies
The Series follows accounting and reporting guidance under Financial Accounting Standards Board (FASB) Accounting Standards Codification Topic 946, Financial Services – Investment Companies. The following accounting policies are in accordance with US generally accepted accounting principles (US GAAP) and are consistently followed by the Series.
Security Valuation — Equity securities, except those traded on the Nasdaq Stock Market LLC (Nasdaq), are valued at the last quoted sales price as of the time of the regular close of the New York Stock Exchange on the valuation date. Equity securities traded on the Nasdaq are valued in accordance with the Nasdaq Official Closing Price, which may not be the last sales price. If, on a particular day, an equity security does not trade, the mean between the bid and ask prices will be used, which approximates fair value.Open-end investment companies are valued at their published net asset value (NAV). US government and agency securities are valued at the mean between the bid and ask prices, which approximates fair value. Other debt securities are valued based upon valuations provided by an independent pricing service or broker and reviewed by management. To the extent current market prices are not available, the pricing service may take into account developments related to the specific security, as well as transactions in comparable securities. Valuations for fixed income securities utilize matrix systems, which reflect such factors as security prices, yields, maturities, and ratings, and are supplemented by dealer and exchange quotations. Investments in repurchase agreements are generally valued at par, which approximates fair value, each business day. Generally, other securities and assets for which market quotations are not readily available are valued at fair value as determined in good faith under the direction of the Trust’s Board of Trustees (Board). In determining whether market quotations are readily available or fair valuation will be used, various factors will be taken into consideration, such as market closures or suspension of trading in a security. Restricted securities are valued at fair value using methods approved by the Board.
Federal Income Taxes — No provision for federal income taxes has been made as the Series intends to continue to qualify for federal income tax purposes as a regulated investment company under Subchapter M of the Internal Revenue Code of 1986, as amended, and make the requisite distributions to shareholders. The Series evaluates tax positions taken or expected to be taken in the course of preparing the Series’ tax returns to determine whether the tax positions are“more-likely-than-not” of being sustained by the applicable tax authority. Tax positions not deemed to meet the“more-likely-than-not” threshold are recorded as a tax benefit or expense in the current year. Management has analyzed the Series’ tax positions taken or expected to be taken on the Series’ federal income tax returns through the year ended Dec. 31, 2019 and for all open tax years (years ended Dec. 31, 2016–Dec. 31, 2018), and has concluded that no provision for federal income tax is required in the Series’ financial statements. If applicable, the Series recognizes interest accrued on unrecognized tax benefits in interest expense and penalties in “Other expenses” on the “Statement of operations.” During the year ended Dec. 31, 2019, the Series did not incur any interest or tax penalties.
Class Accounting — Investment income, common expenses, and realized and unrealized gain (loss) on investments are allocated to the classes of the Series on the basis of daily net assets of each class. Distribution expenses relating to a specific class are charged directly to that class.
Repurchase Agreements — The Series may purchase certain US government securities subject to the counterparty’s agreement to repurchase them at an agreed upon date and price. The counterparty will be required on a daily basis to maintain the value of the collateral subject to the agreement at not less than the repurchase price (including accrued interest). The agreements are conditioned upon the collateral being deposited under the Federal Reserve book-entry system with the Series’ custodian or a third-partysub-custodian. In the event of default or bankruptcy by the other party to the agreement, retention of the collateral may be subject to legal proceedings. At Dec. 31, 2019, the Series held no investments in repurchase agreements.
Use of Estimates — The preparation of financial statements in conformity with US GAAP requires management to make estimates and assumptions that affect the fair value of investments, the reported amounts of assets and liabilities and disclosure of contingent assets and liabilities at the date of the financial statements, and the reported amounts of revenues and expenses during the reporting period. Actual results could differ from those estimates and the differences could be material.
Other — Expenses directly attributable to the Series are charged directly to the Series. Other expenses common to various funds within the Delaware Funds® by Macquarie (Delaware Funds) are generally allocated among such funds on the basis of average net assets. Management fees and certain other expenses are paid monthly. Security transactions are recorded on the date the securities are purchased or sold (trade date) for financial reporting purposes. Costs used in calculating realized gains and losses on the sale of investment securities are those of the specific securities sold. Dividend income is recorded on theex-dividend date and interest income is recorded on the accrual basis. Discounts and premiums are accreted and amortized using the effective interest method. The Series declares and pays dividends from net investment income and distributions from net realized gain
High Yield Series-16
Delaware VIP® High Yield Series
Notes to financial statements (continued)
on investments, if any, following the close of the fiscal year. The Series may distribute more frequently, if necessary for tax purposes. Dividends and distributions, if any, are recorded on theex-dividend date.
The Series receives earnings credits from its custodian when positive cash balances are maintained, which may be used to offset custody fees. The expenses paid under this arrangement are included on the “Statement of operations” under “Custodian fees” with the corresponding expenses offset included under “Less expenses paid indirectly.” For the year ended Dec. 31, 2019, the Series earned $1,697 under this arrangement.
The Series receives earnings credits from its transfer agent when positive cash balances are maintained, which may be used to offset transfer agent fees. If the amount earned is greater than $1, the expenses paid under this arrangement are included on the “Statement of operations” under “Dividend disbursing and transfer agent fees and expenses” with the corresponding expenses offset included under “Less expenses paid indirectly.” For the year ended Dec. 31, 2019, the Series earned $1 under this arrangement.
2. Investment Management, Administration Agreements, and Other Transactions with Affiliates
In accordance with the terms of its investment management agreement, the Series pays Delaware Management Company (DMC), a series of Macquarie Investment Management Business Trust (MIMBT) and the investment manager, an annual fee which is calculated daily and paid monthly at the rates of 0.65% on the first $500 million of average daily net assets of the Series, 0.60% on the next $500 million, 0.55% on the next $1.5 billion, and 0.50% on average daily net assets in excess of $2.5 billion.
Effective April 30, 2019, DMC has contractually agreed to waive all or a portion of its investment advisory fees and/or pay/reimburse expenses (excluding any12b-1 fee, acquired fund fees and expenses, taxes, interest, short sale and dividend interest expenses, brokerage fees, certain insurance costs, and nonroutine expenses or costs, including, but not limited to, those relating to reorganizations, litigation, conducting shareholder meetings, and liquidations) in order to prevent annual series operating expenses from exceeding 0.74% of the Series’ average daily net assets from April 30, 2019 through Dec. 31, 2019.* Prior to April 30, 2019, the waiver was 0.75% of the Series’ average daily net assets. The waiver and reimbursement are accrued daily and received monthly. This waiver and reimbursement may only be terminated by agreement of DMC and the Series.
Effective May 30, 2019, DMC may seek investment advice and recommendations from its affiliates: Macquarie Investment Management Europe Limited, Macquarie Investment Management Austria Kapitalanlage AG, and Macquarie Investment Management Global Limited (MIMGL) (together, the “AffiliatedSub-Advisors”). The Manager may also permit these AffiliatedSub-Advisors to execute Fund security trades on behalf of the Manager and exercise investment discretion for securities in certain markets where DMC believes it will be beneficial to utilize an AffiliatedSub-Advisor’s specialized market knowledge. Although the AffiliatedSub-Advisors serve assub-advisors, DMC has ultimate responsibility for all investment advisory services. For these services, DMC, not the Fund, pays each AffiliatedSub-Advisor a portion of its investment management fee.
Delaware Investments Fund Services Company (DIFSC), an affiliate of DMC, provides fund accounting and financial administration oversight services to the Series. For these services, DIFSC’s fees are calculated daily and paid monthly based on the aggregate daily net assets of all funds within the Delaware Funds at the following annual rates: 0.00475% of the first $35 billion; 0.0040% of the next $10 billion; and 0.0025% of aggregate average daily net assets in excess of $45 billion (Total Fee). Each fund in the Delaware Funds pays a minimum of $4,000, which, in aggregate, is subtracted from the Total Fee. Each fund then pays its portion of the remainder of the Total Fee on a relative NAV basis. This amount is included on the “Statement of operations” under “Accounting and administration expenses.” For the year ended Dec. 31, 2019, the Series was charged $11,481 for these services.
DIFSC is also the transfer agent and dividend disbursing agent of the Series. For these services, DIFSC’s fees are calculated daily and paid monthly at the annual rate of 0.0075% of the Series’ average daily net assets. This amount is included on the “Statement of operations” under “Dividend disbursing and transfer agent fees and expenses.” For the year ended Dec. 31, 2019, the Series was charged $15,309 for these services. Pursuant to asub-transfer agency agreement between DIFSC and BNY Mellon Investment Servicing (US) Inc. (BNYMIS), BNYMIS provides certainsub-transfer agency services to the Series.Sub-transfer agency fees are paid by the Series and are also included on the “Statement of operations” under “Dividend disbursing and transfer agent fees and expenses.” The fees that are calculated daily and paid as invoices are received on a monthly or quarterly basis.
Pursuant to a distribution agreement and distribution plan, the Series pays Delaware Distributors, L.P. (DDLP), the distributor and an affiliate of DMC, an annual12b-1 fee of 0.30% of the average daily net assets of the Service Class shares. The fees are calculated daily and paid monthly. Standard Class shares do not pay12b-1 fees.
As provided in the investment management agreement, the Series bears a portion of the cost of certain resources shared with DMC, including the cost of internal personnel of DMC and/or its affiliates that provide legal, tax, and regulatory reporting services to the Series. For the year ended Dec. 31, 2019, the Series was charged $5,789 for internal legal, tax, and regulatory reporting services provided by DMC and/or its affiliates’ employees. This amount is included on the “Statement of operations” under “Legal fees.”
Trustees’ fees include expenses accrued by the Series for each Trustee’s retainer and meeting fees. Certain officers of DMC, DIFSC, and DDLP are officers and/or Trustees of the Trust. These officers and Trustees are paid no compensation by the Series.
High Yield Series-17
Delaware VIP® High Yield Series
Notes to financial statements (continued)
2. Investment Management, Administration Agreements, and Other Transactions with Affiliates (continued)
In addition to the management fees and other expenses of the Series, the Series indirectly bears the investment management fees and other expenses of the investment companies (Underlying Funds) in which it invests. The amount of these fees and expenses incurred indirectly by the Series will vary based upon the expense and fee levels of the Underlying Funds and the number of shares that are owned of the Underlying Funds at different times.
*The aggregate contractual waiver period covering this report is from May 1, 2018 through April 30, 2020.
3. Investments
For the year ended Dec. 31, 2019, the Series made purchases and sales of investment securities other than short-term investments as follows:
| | | | |
Purchases | | $ | 169,858,026 | |
Sales | | | 185,677,834 | |
The tax cost of investments includes adjustments to net unrealized appreciation (depreciation) which may not necessarily be the final tax cost basis adjustments, but approximate the tax basis unrealized gains and losses that may be realized and distributed to shareholders. At Dec. 31, 2019, the cost and unrealized appreciation (depreciation) of investments for federal income tax purposes for the Series were as follows:
| | | | | | |
Cost of
Investments | | Aggregate
Unrealized
Appreciation
of Investments | | Aggregate
Unrealized
Depreciation
of Investments | | Net Unrealized
Appreciation
of Investments |
| $195,616,089 | | $8,572,658 | | $(2,199,113) | | $6,373,545 |
US GAAP defines fair value as the price that the Series would receive to sell an asset or pay to transfer a liability in an orderly transaction between market participants at the measurement date under current market conditions. A three-level hierarchy for fair value measurements has been established based upon the transparency of inputs to the valuation of an asset or liability. Inputs may be observable or unobservable and refer broadly to the assumptions that market participants would use in pricing the asset or liability. Observable inputs reflect the assumptions market participants would use in pricing the asset or liability based on market data obtained from sources independent of the reporting entity. Unobservable inputs reflect the reporting entity’s own assumptions about the assumptions that market participants would use in pricing the asset or liability based on the best information available under the circumstances. The Series’ investment in its entirety is assigned a level based upon the observability of the inputs which are significant to the overall valuation. The three-level hierarchy of inputs is summarized below.
| | | | |
| Level 1 | | – | | Inputs are quoted prices in active markets for identical investments. (Examples: equity securities,open-end investment companies, futures contracts, exchange-traded options contracts) |
| | |
| Level 2 | | – | | Other observable inputs, including, but not limited to: quoted prices for similar assets or liabilities in markets that are active, quoted prices for identical or similar assets or liabilities in markets that are not active, inputs other than quoted prices that are observable for the assets or liabilities (such as interest rates, yield curves, volatilities, prepayment speeds, loss severities, credit risks, and default rates) or other market-corroborated inputs. (Examples: debt securities, government securities, swap contracts, foreign currency exchange contracts, foreign securities utilizing international fair value pricing, broker-quoted securities, fair valued securities) |
| | |
| Level 3 | | – | | Significant unobservable inputs, including the Series’ own assumptions used to determine the fair value of investments. (Examples: broker-quoted securities, fair valued securities) |
Level 3 investments are valued using significant unobservable inputs. The Series may also use an income-based valuation approach in which the anticipated future cash flows of the investment are discounted to calculate fair value. Discounts may also be applied due to the nature or duration of any restrictions on the disposition of the investments. Valuations may also be based upon current market prices of securities that are comparable in coupon, rating, maturity, and industry. The derived value of a Level 3 investment may not represent the value which is received upon disposition and this could impact the results of operations.
High Yield Series-18
Delaware VIP® High Yield Series
Notes to financial statements (continued)
The following table summarizes the valuation of the Series’ investments by fair value hierarchy levels as of Dec. 31, 2019:
| | | | | | | | | | | | | | | | | | | | |
Securities | | Level 1 | | Level 2 | | Level 3 | | Total |
| | | | |
Assets: | | | | | | | | | | | | | | | | | | | | |
| | | | |
Corporate Debt | | | $ | — | | | | $ | 179,446,925 | | | | | $— | | | | $ | 179,446,925 | |
Loan Agreements1 | | | | — | | | | | 13,674,824 | | | | | — | | | | | 13,674,824 | |
Common Stock | | | | — | | | | | — | | | | | — | | | | | — | |
Short-Term Investments | | | | 8,867,885 | | | | | — | | | | | — | | | | | 8,867,885 | |
| | | | | | | | | | | | | | | | | | | | |
Total Value of Securities | | | $ | 8,867,885 | | | | $ | 193,121,749 | | | | | $— | | | | $ | 201,989,634 | |
| | | | | | | | | | | | | | | | | | | | |
1Loan agreements are valued across Level 2 and Level 3.
The securities that have been valued at zero on the “Schedule of investments” are considered to be a Level 3 investments in this table.
During the year ended Dec. 31, 2019, there were no transfers between Level 1 investments, Level 2 investments, or Level 3 investments that had a significant impact to the Series. The Series’ policy is to recognize transfers between levels based on fair value at the beginning of the reporting period.
A reconciliation of Level 3 investments is presented when the Series has a significant amount of Level 3 investments at the beginning, interim, or end of the period in relation to the Series’ net assets. Management has determined not to provide a reconciliation of Level 3 investments as the Level 3 investments were not considered significant to the Series’ net assets at the beginning, interim, or end of the period. Management has determined not to provide additional disclosure on Level 3 Investments inputs since the Level 3 investments are not considered significant to the Series’ net assets at the end of the period.
4. Dividend and Distribution Information
Income and long-term capital gain distributions are determined in accordance with federal income tax regulations, which may differ from US GAAP. Additionally, distributions from net short-term gains on sales of investment securities are treated as ordinary income for federal income tax purposes. The tax character of dividends and distributions paid during the years ended Dec. 31, 2019 and 2018 was as follows:
| | | | | | | | |
| | | Year ended | |
| | |
| | | 12/31/19 | | | 12/31/18 | |
Ordinary Income | | | $13,331,393 | | | | $14,418,385 | |
5. Components of Net Assets on a Tax Basis
As of Dec. 31, 2019, the components of net assets on a tax basis were as follows:
| | | | |
Shares of beneficial interest | | | $221,529,454 | |
Undistributed ordinary income | | | 10,980,423 | |
Capital loss carryforwards | | | (35,733,539 | ) |
Net unrealized appreciation of investments | | | 6,373,545 | |
| | | | |
Net assets | | | $203,149,883 | |
| | | | |
The differences between book basis and tax basis components of net assets are primarily attributable to tax deferral of losses on wash sales and tax treatment of market discount and premium on debt instruments.
At Dec. 31, 2019, capital loss carryforwards available to offset future realized capital gains were as follows:
| | | | |
Loss carryforward character No Expiration |
| | |
Short-term | | Long-term | | Total |
$13,574,333 | | $22,159,206 | | $35,733,539 |
High Yield Series-19
Delaware VIP® High Yield Series
Notes to financial statements (continued)
6. Capital Shares
Transactions in capital shares were as follows:
| | | | | | | | |
| | | Year ended | |
| | | 12/31/19 | | | 12/31/18 | |
Shares sold: | | | | | | | | |
Standard Class | | | 1,198,436 | | | | 3,232,018 | |
Service Class | | | 2,929,268 | | | | 3,276,383 | |
Shares issued upon reinvestment of dividends and distributions: | | | | | | | | |
Standard Class | | | 1,103,252 | | | | 1,229,678 | |
Service Class | | | 1,706,951 | | | | 1,746,787 | |
| | | | | | | | |
| | | 6,937,907 | | | | 9,484,866 | |
| | | | | | | | |
Shares redeemed: | | | | | | | | |
Standard Class | | | (2,832,201 | ) | | | (7,968,834 | ) |
Service Class | | | (5,651,948 | ) | | | (8,437,338 | ) |
| | | | | | | | |
| | | (8,484,149 | ) | | | (16,406,172 | ) |
| | | | | | | | |
Net decrease | | | (1,546,242 | ) | | | (6,921,306 | ) |
| | | | | | | | |
7. Line of Credit
The Series, along with certain other funds in the Delaware Funds (Participants), was a participant in a $220,000,000 revolving line of credit intended to be used for temporary or emergency purposes as an additional source of liquidity to fund redemptions of investor shares. Under the agreement, the Participants were charged an annual commitment fee of 0.15%, which was allocated across the Participants based on a weighted average of the respective net assets of each Participant. The Participants were permitted to borrow up to a maximum ofone-third of their net assets under the agreement. Each Participant was individually, and not jointly, liable for its particular advances, if any, under the line of credit. The line of credit available under the agreement expired on Nov. 4, 2019.
On Nov. 4, 2019, the Participants entered into an amendment to the agreement for a $250,000,000 revolving line of credit. The revolving line of credit is to be used as described above and operates in substantially the same manner as the original agreement. The line of credit available under the agreement expires on Nov. 2, 2020.
The Series had no amounts outstanding as of Dec. 31, 2019, or at any time during the year then ended.
8. Securities Lending
The Series, along with other funds in the Delaware Funds, may lend its securities pursuant to a security lending agreement (Lending Agreement) with The Bank of New York Mellon (BNY Mellon). At the time a security is loaned, the borrower must post collateral equal to the required percentage of the market value of the loaned security, including any accrued interest. The required percentage is: (1) 102% with respect to US securities and foreign securities that are denominated and payable in US dollars; and (2) 105% with respect to foreign securities. With respect to each loan, if on any business day the aggregate market value of securities collateral plus cash collateral held is less than the aggregate market value of the securities which are the subject of such loan, the borrower will be notified to provide additional collateral by the end of the following business day, which, together with the collateral already held, will be not less than the applicable initial collateral requirements for such security loan. If the aggregate market value of securities collateral and cash collateral held with respect to a security loan exceeds the applicable initial collateral requirement, upon the request of the borrower, BNY Mellon must return enough collateral to the borrower by the end of the following business day to reduce the value of the remaining collateral to the applicable initial collateral requirement for such security loan. As a result of the foregoing, the value of the collateral held with respect to a loaned security on any particular day may be more or less than the value of the security on loan. The collateral percentage with respect to the market value of the loaned security is determined by the security lending agent.
Cash collateral received by each series of the Trust is generally invested in a series of individual separate accounts, each corresponding to a series. The investment guidelines permit each separate account to hold certain securities that would be considered eligible securities for a money market fund. Cash collateral received is generally invested in government securities; certain obligations issued by government sponsored enterprises; repurchase agreements collateralized by US Treasury securities; obligations issued by the central government of any Organization for Economic Cooperation and Development (OECD) country or its agencies, instrumentalities, or establishments; obligations of supranational organizations; commercial paper, notes, bonds, and other
High Yield Series-20
Delaware VIP® High Yield Series
Notes to financial statements (continued)
debt obligations; certificates of deposit, time deposits, and other bank obligations; and asset-backed securities. The Series can also accept US government securities and letters of credit(non-cash collateral) in connection with securities loans.
In the event of default or bankruptcy by the lending agent, realization and/or retention of the collateral may be subject to legal proceedings. In the event the borrower fails to return loaned securities and the collateral received is insufficient to cover the value of the loaned securities and provided such collateral shortfall is not the result of investment losses, the lending agent has agreed to pay the amount of the shortfall to the Series or, at the discretion of the lending agent, replace the loaned securities. The Series continues to record dividends or interest, as applicable, on the securities loaned and is subject to changes in value of the securities loaned that may occur during the term of the loan. The Series has the right under the Lending Agreement to recover the securities from the borrower on demand. With respect to security loans collateralized bynon-cash collateral, the Series receives loan premiums paid by the borrower. With respect to security loans collateralized by cash collateral, the earnings from the collateral investments are shared among the Series, the security lending agent, and the borrower. The Series records security lending income net of allocations to the security lending agent and the borrower.
The Series may incur investment losses as a result of investing securities lending collateral. This could occur if an investment in the collateral investment account defaulted or became impaired. Under those circumstances, the value of the Series’ cash collateral account may be less than the amount the Series would be required to return to the borrowers of the securities and the Series would be required to make up for this shortfall.
During the year ended Dec. 31, 2019, the Series had no securities out on loan.
9. Credit and Market Risk
When interest rates rise, fixed income securities (i.e. debt obligations) generally will decline in value. These declines in value are greater for fixed income securities with longer maturities or durations.
The risk that potential changes related to the use of the London Interbank Offered Rate (LIBOR) could have adverse impacts on financial instruments which reference LIBOR. The potential abandonment of LIBOR could affect the value and liquidity of instruments which reference LIBOR.
The Series invests in high yield fixed income securities, which are securities rated lower thanBBB- by Standard & Poor’s Financial Services LLC and lower than Baa3 by Moody’s Investors Service, Inc., or similarly rated by another nationally recognized statistical rating organization. Investments in these higher yielding securities are generally accompanied by a greater degree of credit risk than higher rated securities. Additionally, lower rated securities may be more susceptible to adverse economic and competitive industry conditions than investment grade securities.
The Series invests in certain obligations that may have liquidity protection designed to ensure that the receipt of payments due on the underlying security is timely. Such protection may be provided through guarantees, insurance policies, or letters of credit obtained by the issuer or sponsor through third parties, through various means of structuring the transaction, or through a combination of such approaches. The Series will not pay any additional fees for such credit support, although the existence of credit support may increase the price of the security.
The Series invests in bank loans and other securities that may subject it to direct indebtedness risk, the risk that the Series will not receive payment of principal, interest, and other amounts due in connection with these investments and will depend primarily on the financial condition of the borrower. Loans that are fully secured offer the Series more protection than unsecured loans in the event of nonpayment of scheduled interest or principal, although there is no assurance that the liquidation of collateral from a secured loan would satisfy the corporate borrower’s obligation, or that the collateral can be liquidated. Some loans or claims may be in default at the time of purchase. Certain of the loans and the other direct indebtedness acquired by the Series may involve revolving credit facilities or other standby financing commitments that obligate the Series to pay additional cash on a certain date or on demand. These commitments may require the Series to increase its investment in a company at a time when the Series might not otherwise decide to do so (including at a time when the company’s financial condition makes it unlikely that such amounts will be repaid). To the extent that the Series is committed to advance additional funds, it will at all times hold and maintain cash or other high grade debt obligations in an amount sufficient to meet such commitments. When a loan agreement is purchased, the Series may pay an assignment fee. On an ongoing basis, the Series may receive a commitment fee based on the undrawn portion of the underlying line of credit portion of a loan agreement. Prepayment penalty fees are received upon the prepayment of a loan agreement by a borrower. Prepayment penalty, facility, commitment, consent and amendment fees are recorded to income as earned or paid.
As the Series may be required to rely upon another lending institution to collect and pass on to the Series amounts payable with respect to the loan and to enforce the Series’ rights under the loan and other direct indebtedness, an insolvency, bankruptcy, or reorganization of the lending institution may delay or prevent the Series from receiving such amounts. The highly leveraged nature of many loans may make them especially vulnerable to adverse changes in economic or market conditions. Investments in such loans and other direct indebtedness may involve additional risk to the Series.
The Series may invest up to 15% of its net assets in illiquid securities, which may include securities with contractual restrictions on resale, securities exempt from registration under Rule 144A promulgated under the Securities Act of 1933, as amended, and other securities which may not be readily marketable. The relative illiquidity of these securities may impair the Series from disposing of them in a timely manner and at a fair price when it is necessary or desirable to do so. While maintaining oversight, the Board has delegated to DMC, theday-to-day functions of determining whether individual
High Yield Series-21
Delaware VIP® High Yield Series
Notes to financial statements (continued)
securities are liquid for purposes of the Series’ limitation on investments in illiquid securities. Securities eligible for resale pursuant to Rule 144A, which are determined to be liquid, are not subject to the Series’ 15% limit on investments in illiquid securities. Rule 144A securities have been identified on the “Schedule of investments.”
10. Contractual Obligations
The Series enters into contracts in the normal course of business that contain a variety of indemnifications. The Series’ maximum exposure under these arrangements is unknown. However, the Series has not had prior claims or losses pursuant to these contracts. Management has reviewed the Series’ existing contracts and expects the risk of loss to be remote.
11. General Motors Term Loan Litigation
The Series received notice of a litigation proceeding related to a General Motors Corporation (G.M.) term loan participation previously held by the Series in 2009. Because it was believed that the Series was a secured creditor, the Series received the full principal on the loans in 2009 after the G.M. bankruptcy. However, based upon a US Court of Appeals ruling, the Motors Liquidation Company Avoidance Action Trust sought to recover such amounts arguing that the Series was an unsecured creditor and, as an unsecured creditor, the Series should not have received payment in full. Based on available information related to the litigation and the Series’ potential exposure, the Series previously recorded a contingent liability of $3,069,708 and an asset of $920,913 based on the potential recoveries by the estate that resulted in a net decrease in the Series’ NAV to reflect this potential recovery.
During the year, the plaintiff and the term loan lenders, which included the Series, reached an agreement that resolved the disputes. The parties agreed to terms of a settlement agreement and presented the settlement agreement to the court for approval at a hearing on June 12, 2019. The court approved the settlement documentation and dismissed the case on July 2, 2019. The court’s approval of the settlement and dismissal of the case with prejudice became final on July 16, 2019.
The contingent liability and other asset were removed in connection with the case being settled, which resulted in the Series recognizing a gain in the amount of the liability reversed.
12. Recent Accounting Pronouncements
In March 2017, the FASB issued an Accounting Standards Update (ASU), ASU2017-08, Receivables — Nonrefundable Fees and Other Costs (Subtopic310-20), Premium Amortization on Purchased Callable Debt Securities which amends the amortization period for certain callable debt securities purchased at a premium, shortening such period to the earliest call date. ASU2017-08 does not require any accounting change for debt securities held at a discount; the discount continues to be amortized to maturity. ASU2017-08 is effective for fiscal years, and interim periods within those fiscal years, beginning after Dec. 15, 2018. Management has implemented ASU2017-08 and determined that the impact of this guidance to the Series’ net assets at the end of the year is not material.
In August 2018, the FASB issued ASU2018-13, which changes certain fair value measurement disclosure requirements. ASU2018-13, in addition to other modifications and additions, removes the requirement to disclose the amount and reasons for transfers between Level 1 and Level 2 of the fair value hierarchy, the policy for the timing of transfers between levels and the valuation process for Level 3 fair value measurements. ASU2018-13 is effective for fiscal years, and interim periods within those fiscal years, beginning after Dec. 15, 2019. At this time, management is evaluating the implications of these changes on the financial statements.
13. Subsequent Events
Management has determined that no material events or transactions occurred subsequent to Dec. 31, 2019, that would require recognition or disclosure in the Series’ financial statements.
High Yield Series-22
Delaware VIP® Trust — Delaware VIP High Yield Series
Report of independent registered public accounting firm
To the Board of Trustees of Delaware VIP® Trust and Shareholders of Delaware VIP High Yield Series
Opinion on the Financial Statements
We have audited the accompanying statement of assets and liabilities, including the schedule of investments, of Delaware VIP High Yield Series (one of the series constituting Delaware VIP® Trust, referred to hereafter as the “Series”) as of December 31, 2019, the related statement of operations for the year ended December 31, 2019, the statements of changes in net assets for each of the two years in the period ended December 31, 2019, including the related notes, and the financial highlights for each of the five years in the period ended December 31, 2019 (collectively referred to as the “financial statements”). In our opinion, the financial statements present fairly, in all material respects, the financial position of the Series as of December 31, 2019, the results of its operations for the year then ended, the changes in its net assets for each of the two years in the period ended December 31, 2019 and the financial highlights for each of the five years in the period ended December 31, 2019 in conformity with accounting principles generally accepted in the United States of America.
Basis for Opinion
These financial statements are the responsibility of the Series’ management. Our responsibility is to express an opinion on the Series’ financial statements based on our audits. We are a public accounting firm registered with the Public Company Accounting Oversight Board (United States) (PCAOB) and are required to be independent with respect to the Series in accordance with the U.S. federal securities laws and the applicable rules and regulations of the Securities and Exchange Commission and the PCAOB.
We conducted our audits of these financial statements in accordance with the standards of the PCAOB. Those standards require that we plan and perform the audit to obtain reasonable assurance about whether the financial statements are free of material misstatement, whether due to error or fraud.
Our audits included performing procedures to assess the risks of material misstatement of the financial statements, whether due to error or fraud, and performing procedures that respond to those risks. Such procedures included examining, on a test basis, evidence regarding the amounts and disclosures in the financial statements. Our audits also included evaluating the accounting principles used and significant estimates made by management, as well as evaluating the overall presentation of the financial statements. Our procedures included confirmation of securities owned as of December 31, 2019 by correspondence with the custodian, transfer agents and brokers. We believe that our audits provide a reasonable basis for our opinion.
/s/PricewaterhouseCoopers LLP
Philadelphia, Pennsylvania
February 21, 2020
We have served as the auditor of one or more investment companies in Delaware Funds® by Macquarie since 2010.
High Yield Series-23
Delaware VIP® Trust — Delaware VIP High Yield Series
Other Series information (Unaudited)
Board consideration of Investment Advisory andSub-Advisory Agreements for Delaware VIP High Yield Series at a meeting held August21-22, 2019
At a meeting held on Aug.21-22, 2019 (the “Annual Meeting”), the Board of Trustees (the “Board”), including a majority of disinterested or independent Trustees, approved the renewal of the investment advisory andsub-advisory agreements for Delaware VIP High Yield Series (the “Series”). In making its decision, the Board considered information furnished at regular quarterly Board meetings, including reports detailing Series performance, investment strategies, and expenses, as well as information prepared specifically in connection with the renewal of the investment advisory andsub-advisory contracts. Information furnished specifically in connection with the renewal of the Investment Management Agreement with Delaware Management Company (“DMC”), a series of Macquarie Investment Management Business Trust (“MIMBT”) and theSub-Advisory Agreements with Macquarie Investment Management Europe Limited (“MIMEL”) and Macquarie Investment Management Global Limited (“MIMGL”), included materials provided by DMC and its affiliates (collectively, “Macquarie Investment Management”), MIMEL, and MIMGL, concerning, among other things, the nature, extent, and quality of services provided to the Series; the costs of such services to the Series; economies of scale; and the investment manager’s financial condition and profitability. In addition, in connection with the Annual Meeting, materials were provided to the Trustees in May 2019, including reports provided by Broadridge Financial Solutions (“Broadridge”). The Broadridge reports compared the Series’ investment performance and expenses with those of other comparable mutual funds. The Independent Trustees reviewed and discussed the Broadridge reports with independent legal counsel to the Independent Trustees. In addition to the information noted above, the Board also requested and received information regarding DMC’s policy with respect to advisory fee levels and its breakpoint philosophy; the structure of portfolio manager compensation; comparative client fee information; and any constraints or limitations on the availability of securities for certain investment styles, which had in the past year inhibited, or which were likely in the future to inhibit, the investment manager’s ability to invest fully in accordance with Series policies.
In considering information relating to the approval of the Series’ investment advisory andsub-advisory agreements, the Independent Trustees received assistance and advice from and met separately with independent legal counsel to the Independent Trustees and also received assistance and advice from an experienced and knowledgeable independent fund consultant, JDL Consultants, LLC (“JDL”). Although the Board gave attention to all information furnished, the following discussion identifies, under separate headings, the primary factors taken into account by the Board during its contract renewal considerations.
Nature, extent, and quality of services.The Board considered the services provided by DMC to the Series and its shareholders. In reviewing the nature, extent, and quality of services, the Board considered reports furnished to it throughout the year, which covered matters such as the relative performance of the Series; compliance of portfolio managers with the investment policies, strategies, and restrictions for the Series; compliance by DMC and Delaware Distributors, L.P. (together, “Management”) personnel with the Code of Ethics adopted throughout the Delaware Funds® by Macquarie (the “Delaware Funds”); and adherence to fair value pricing procedures as established by the Board. The Board was pleased with the current staffing of DMC and the emphasis placed on research in the investment process. The Board recognized DMC’s receipt of certain favorable industry distinctions during the past several years. The Board gave favorable consideration to DMC’s efforts to control expenses while maintaining service levels committed to Series matters. The Board was satisfied with the nature, extent, and quality of the overall services provided by DMC.
Nature, extent, and quality of services.The Board considered the services provided by MIMEL to the Series and its shareholders. In reviewing the nature, extent, and quality of services, the Board considered reports furnished to it throughout the year at regular Board Meetings covering matters such as relative performance of the Series; compliance of portfolio managers with the investment policies, strategies, and restrictions for the Series; the compliance of MIMEL personnel with its Code of Ethics; and adherence to fair value pricing procedures as established by the Board. The Board was pleased with the current staffing of MIMEL and the emphasis placed on research in the investment process. The Board was satisfied with the nature, extent, and quality of the overall services provided by MIMEL.
Nature, extent, and quality of services.The Board considered the services provided by MIMGL to the Series and its shareholders. In reviewing the nature, extent, and quality of services, the Board considered reports furnished to it throughout the year at regular Board Meetings covering matters such as relative performance of the Series; compliance of portfolio managers with the investment policies, strategies, and restrictions for the Series; the compliance of MIMGL personnel with its Code of Ethics; and adherence to fair value pricing procedures as established by the Board. The Board was pleased with the current staffing of MIMGL and the emphasis placed on research in the investment process. The Board was satisfied with the nature, extent, and quality of the overall services provided by MIMGL.
Investment performance.The Board placed significant emphasis on the investment performance of the Series in view of the importance of investment performance to shareholders. Although the Board considered performance reports and discussions with portfolio managers at Board meetings throughout the year, the Board gave particular weight to the Broadridge reports furnished for the Annual Meeting. The Broadridge reports prepared for the Series showed the investment performance of its Standard Class shares in comparison to a group of similar funds as selected by Broadridge (the “Performance Universe”). A fund with the best performance ranked first, and a fund with the poorest performance ranked last. The highest/best performing 25% of funds in the Performance Universe make up the first quartile; the next 25%, the second quartile; the next 25%, the third quartile; and the poorest/worst
Value Series-24
Delaware VIP® Trust — Delaware VIP High Yield Series
Other Series information (Unaudited)
Board consideration of Investment Advisory andSub-Advisory Agreements for Delaware VIP High Yield Series at a meeting held August21-22,2019 (continued)
performing 25% of funds in the Performance Universe make up the fourth quartile. Comparative annualized performance for the Series was shown for the past1-,3-,5-, and10-year periods, as applicable, ended Jan. 31, 2019. The Board’s objective is that the Series’ performance for the1-,3-, and5-year periods be at or above the median of its Performance Universe.
The Performance Universe for the Series consisted of the Series and all high yield funds underlying variable insurance products as selected by Broadridge. The Broadridge report comparison showed that the Series’ total return for the1- and5-year periods was in the fourth quartile of its Performance Universe. The report further showed that the Series’ total return for the3- and10-year periods was in the third quartile of its Performance Universe. The Board observed that the Series’ performance results were not in line with the Board’s objective. In evaluating the Series’ performance, the Board considered the performance attribution included in the meeting materials, as well as the numerous investment and performance reports delivered by Management personnel to the Board’s Investments Committee. The Board was satisfied that Management was taking action to improve Series performance and to meet the Board’s performance objective.
Comparative expenses.The Board considered expense data for the Delaware Funds. Management provided the Board with information on pricing levels and fee structures for the Series as of its most recently completed fiscal year. The Board also focused on the comparative analysis of effective management fees and total expense ratios of the Series versus effective management fees and expense ratios of a group of similar funds as selected by Broadridge (the “Expense Group”). In reviewing comparative costs, the Series’ contractual management fee and the actual management fee incurred by the Series were compared with the contractual management fees (assuming all funds in the Expense Group were similar in size to the Series) and actual management fees (as reported by each fund) within the Expense Group, taking into account any applicable breakpoints and fee waivers. The Series’ total expenses were also compared with those of its Expense Group. The Broadridge total expenses, for comparative consistency, were shown by Broadridge for Standard Class shares which do not charge12b-1 andnon-12b-1 service fees. The Board’s objective is for each Series’ total expense ratio to be competitive with those of the peer funds within its Expense Group.
The expense comparisons for the Series showed that the actual management fee was in the quartile with the second lowest expenses of its Expense Group and its total expenses were in the quartile with the second highest expenses of its Expense Group. The Series’ total expenses were not in line with the Board’s objective. In evaluating total expenses, the Board considered fee waivers in place through April 2020 and various initiatives implemented by Management, such as the negotiation of lower fees for fund accounting, fund accounting oversight and custody services, which had created an opportunity for a further reduction in expenses. The Board was satisfied with Management’s efforts to improve the Series’ total expense ratio and to bring it in line with the Board’s objective.
Management profitability.The Board considered the level of profits realized by DMC in connection with the operation of the Series. In this respect, the Board reviewed the Investment Management Profitability Analysis that addressed the overall profitability of DMC’s business in providing management and other services to each of the individual funds and the Delaware Funds as a whole. Specific attention was given to the methodology used by DMC in allocating costs for the purpose of determining profitability. Management stated that the level of profits of DMC, to a certain extent, reflects recent operational cost savings and efficiencies initiated by DMC. The Board considered DMC’s efforts to improve services provided to fund shareholders and to meet additional regulatory and compliance requirements resulting from recent industry-wide Securities and Exchange Commission initiatives. The Board also considered the extent to which DMC might derive ancillary benefits from fund operations, including the potential for procuring additional business as a result of the prestige and visibility associated with its role as service provider to the Delaware Funds and the benefits from allocation of fund brokerage to improve trading efficiencies. As part of its work, the Board also reviewed a report prepared by JDL regarding MIMBT profitability as compared to certain peer fund complexes and the Independent Trustees discussed with JDL personnel regarding DMC’s profitability in such context. The Board found that the management fees were reasonable in light of the services rendered and the profitability of DMC.
Economies of scale.The Trustees considered whether economies of scale are realized by DMC as the Series’ assets increase and the extent to which any economies of scale are reflected in the level of management fees charged. The Trustees reviewed the Series’ advisory fee pricing and structure approved by the Board and shareholders, which includes breakpoints, and which applies to most funds in the Delaware Funds complex. Breakpoints in the advisory fee occur when the advisory fee rate is reduced on assets in excess of specified levels. Breakpoints result in a lower advisory fee, than would otherwise be the case in the absence of breakpoints, when the asset levels specified in the breakpoints are exceeded. Although, as of March 31, 2019, the Series had not reached a size at which it could take advantage of any breakpoints in the applicable fee schedule, the Board recognized that the fee was structured so that, if the Series increases sufficiently in size, then economies of scale may be shared.
Value Series-25
Delaware VIP® Trust — Delaware VIP High Yield Series
Other Series information (Unaudited)
Tax Information
All disclosures are based on financial information available as of the date of this annual report and, accordingly is subject to change. For any and all items requiring reporting, it is the intention of the Fund to report the maximum amount permitted under the Internal Revenue Code and the regulations thereunder.
For the year ended Dec. 31, 2019, the Series’ reports distributions paid during the year as follows:
|
| (A) |
| Ordinary Income |
| Distributions |
| (Tax Basis) |
100.00% |
(A) is based on a percentage of the Series’ total distributions.
Value Series-26
Delaware Funds® by Macquarie
BOARD OF TRUSTEES / DIRECTORS AND OFFICERS ADDENDUM
A mutual fund is governed by a Board of Trustees/Directors (“Trustees”), which has oversight responsibility for the management of a fund’s business affairs. Trustees establish procedures and oversee and review the performance of the investment manager, the distributor, and others who perform services for the fund. The independent fund trustees, in particular, are advocates for shareholder interests. Each trustee has served in that capacity since he or she was elected to or appointed to the Board of Trustees, and will continue to serve until his or her retirement or the election of a new trustee in his or her place. The following is a list of the Trustees and Officers with certain background and related information.
| | | | | | | | | | |
Name, Address, and Birth Date | | Position(s) Held with Fund(s) | | Length of Time
Served | | Principal
Occupation(s)
During the Past Five Years | | Number of
Portfolios in Fund
Complex Overseen
by Trustee or Officer | | Other
Directorships
Held by Trustee
or Officer |
| INTERESTED TRUSTEE | | | | | | |
| | | | | |
Shawn K. Lytle1
2005 Market Street Philadelphia, PA 19103 February 1970 | | President,
Chief Executive Officer, and Trustee | | President and
Chief Executive Officer since August 2015 Trustee since September 2015 | | President — Macquarie Investment Management2(June 2015-Present) Regional Head of Americas — UBS Global Asset Management
(April2010-May 2015) | | 95 | | Trustee —
UBS Relationship Funds, SMA Relationship Trust, and UBS Funds
(May 2010–April 2015) |
| INDEPENDENT TRUSTEES | | | | | | |
| | | | | |
Thomas L. Bennett
2005 Market Street Philadelphia, PA 19103 October 1947 | | Chair and Trustee | | Trustee since
March 2005
Chair since March 2015 | | Private Investor
(March 2004–Present) | | 95 | | None |
Jerome D. Abernathy
2005 Market Street Philadelphia, PA 19103 July 1959 | | Trustee | | Since
January 2019 | | Managing Member, Stonebrook Capital Management, LLC (financial technology: macro factors and databases) (January 1993–Present) | | 95 | | None |
Ann D. Borowiec
2005 Market Street Philadelphia, PA 19103
November 1958 | | Trustee | | Since
March 2015 | | Chief Executive Officer, Private Wealth Management
(2011–2013) and Market Manager, New Jersey Private Bank (2005–2011) —
J.P. Morgan Chase & Co. | | 95 | | Director —
Banco Santander International (October 2016–December 2019)
Director —
Santander Bank, N.A. (December 2016–December 2019) |
Joseph W. Chow
2005 Market Street Philadelphia, PA 19103 January 1953 | | Trustee | | Since
January 2013 | | Private Investor
(April 2011–Present) | | 95 | | Director and Audit
Committee Member — Hercules Technology Growth Capital, Inc.
(July 2004–July 2014) |
High Yield Series-27
| | | | | | | | | | |
Name, Address, and Birth Date | | Position(s) Held with Fund(s) | | Length of Time
Served | | Principal
Occupation(s)
During the Past Five Years | | Number of
Portfolios in Fund
Complex Overseen
by Trustee or Officer | | Other
Directorships
Held by Trustee
or Officer |
| | | | | |
John A. Fry
2005 Market Street Philadelphia, PA 19103 May 1960 | | Trustee | | Since
January 2001 | | President —
Drexel University (August 2010–Present) President — Franklin & Marshall College (July 2002–July 2010) | | 95 | | Director; Compensation Committee
and Governance Committee Member — Community Health Systems
(May 2004–Present) Director — Drexel Morgan & Co.
(2015–Present) Director and Audit Committee Member — vTv Therapeutics LLC
(2017–Present) Director and Audit Committee Member — FS Credit Real Estate Income Trust, Inc.
(2018–Present) Director — Federal Reserve Bank of Philadelphia
(January 2020–Present) |
| | | | | |
Lucinda S. Landreth
2005 Market Street Philadelphia, PA 19103 June 1947 | | Trustee | | Since
March 2005 | | Private Investor
(2004–Present) | | 95 | | None |
| | | | | |
Frances A. Sevilla-Sacasa
2005 Market Street Philadelphia, PA 19103 January 1956 | | Trustee | | Since
September 2011 | | Private Investor
(January 2017-Present) Chief Executive Officer — Banco Itaú International
(April 2012–December 2016) Executive Advisor to Dean (August 2011–March 2012)
and Interim Dean (January 2011–July 2011) —
University of Miami School of
Business Administration President — U.S. Trust, Bank of America Private
Wealth Management
(Private Banking)
(July 2007–December 2008) | | 95 | | Trust Manager and
Audit Committee
Chair — Camden
Property Trust
(August 2011–Present) Director; Strategic Planning and Reserves Committee and Nominating
and Governance Committee
Member — Callon Petroleum Company (December 2019–Present) Director; Audit Committee Member — Carrizo Oil & Gas,Inc.
(March 2018–December 2019) |
| | | | | |
Thomas K. Whitford
2005 Market Street Philadelphia, PA 19103 March 1956 | | Trustee | | Since
January 2013 | | Vice Chairman
(2010–April 2013) —
PNC Financial
Services Group | | 95 | | Director — HSBC North America Holdings Inc.(December 2013-Present) Director — HSBC USA Inc.
(July 2014-Present) Director —
HSBC Bank USA, National Association(July 2014-March 2017) Director — HSBC
Finance Corporation(December 2013-April 2018) |
High Yield Series-28
| | | | | | | | | | |
Name, Address, and Birth Date | | Position(s) Held with Fund(s) | | Length of Time
Served | | Principal
Occupation(s)
During the Past Five Years | | Number of
Portfolios in Fund
Complex Overseen
by Trustee or Officer | | Other
Directorships
Held by Trustee
or Officer |
| | | | | |
Christianna Wood
2005 Market Street Philadelphia, PA 19103 March 1956 | | Trustee | | Since
January 2019 | | Chief Executive Officer
and President —
Gore Creek Capital, Ltd.
(August 2009–Present) | | 95 | | Director; Finance Committee and Audit Committee Member — H&R Block Corporation
(July 2008–Present) Director; Chair of Investments Committee and Audit
Committee Member —
Grange Insurance
(2013–Present) Trustee; Chair of Nominating and Governance Committee and Audit Committee Member — The Merger Fund
(2013–Present), The Merger Fund VL
(2013–Present); WCM Alternatives: Event-Driven Fund (2013–Present), and WCM Alternatives:
Credit Event Fund
(December 2017–Present) Director; Chair of Governance Committee and Audit Committee Member — International Securities Exchange
(2010–2016) |
| | | | | |
Janet L. Yeomans
2005 Market Street Philadelphia, PA 19103 July 1948 | | Trustee | | Since
April 1999 | | Vice President and Treasurer (January 2006–July 2012),
Vice President —
Mergers & Acquisitions (January 2003–January 2006), and
Vice President and Treasurer (July 1995–January 2003) — 3M Company | | 95 | | Director; Personnel and Compensation Committee Chair; Member of Nominating, Investments, and Audit Committees for various periods throughout directorship — Okabena Company
(2009-2017) |
High Yield Series-29
| | | | | | | | | | |
Name, Address, and Birth Date | | Position(s) Held with Fund(s) | | Length of Time
Served | | Principal
Occupation(s)
During the Past Five Years | | Number of
Portfolios in Fund
Complex Overseen
by Trustee or Officer | | Other
Directorships
Held by Trustee
or Officer |
OFFICERS | | | | | | | | | | |
| | | | | |
David F. Connor
2005 Market Street Philadelphia, PA 19103 December 1963 | | Senior
Vice President, General Counsel,
and Secretary | | Senior Vice President,
since May 2013;
General Counsel since May 2015; Secretary since October 2005 | | David F. Connor has served in various capacities at different times at Macquarie Investment Management. | | 95 | | None3 |
| | | | | |
Daniel V. Geatens
2005 Market Street Philadelphia, PA 19103 October 1972 | | Vice President
and Treasurer | | Vice President and Treasurer since October 2007 | | Daniel V. Geatens has served in various capacities at different times at Macquarie Investment Management. | | 95 | | None3 |
| | | | | |
Richard Salus
2005 Market Street Philadelphia, PA 19103 October 1963 | | Senior
Vice President
and
Chief Financial
Officer | | Senior Vice President and Chief Financial Officer since November 2006 | | Richard Salus has served in various capacities at different times at Macquarie Investment Management. | | 95 | | None |
| 1 | Shawn K. Lytle is considered to be an “Interested Trustee” because he is an executive officer of the Fund’s(s’) investment advisor. |
| 2 | Macquarie Investment Management is the marketing name for Macquarie Management Holdings, Inc. and its subsidiaries, including the Fund’s(s’) investment advisor, principal underwriter, and its transfer agent. |
| 3 | David F. Connor and Daniel V. Geatens serve in similar capacities for the six portfolios of the Optimum Fund Trust, which have the same investment advisor, principal underwriter, and transfer agent as the registrant. Mr. Geatens also serves as the Chief Financial Officer of the Optimum Fund Trust and he is the Chief Financial Officer and Treasurer for Macquarie Global Infrastructure Total Return Fund Inc. |
The Statement of Additional Information for the Fund(s) includes additional information about the Trustees and Officers and is available, without charge, upon request by calling 800523-1918.
High Yield Series-30
| | | | |
| | The Series files its complete schedule of portfolio holdings with the Securities and Exchange Commission (SEC) for the first and third quarters of each fiscal year on FormN-Q or FormN-PORT (available for filings after March 31, 2019). The Series’ FormsN-Q or FormsN-PORT, as well as a description of the policies and procedures that the Series uses to determine how to vote proxies (if any) relating to portfolio securities, are available without charge (i) upon request, by calling 800523-1918; and (ii) on the SEC’s website at sec.gov. In addition, a description of the policies and procedures that the Series uses to determine how to vote proxies (if any) relating to portfolio securities and the Schedule of Investments included in the Series’ most recent FormN-Q or FormN-PORT are available without charge on the Series’ website at delawarefunds.com/vip/literature. The Series’ FormsN-Q and FormsN-PORT may be reviewed and copied at the SEC’s Public Reference Room in Washington, D.C.; information on the operation of the Public Reference Room may be obtained by calling 800SEC-0330. Information (if any) regarding how the Series voted proxies relating to portfolio securities during the most recently disclosed12-month period ended June 30 is available without charge (i) through the Series’ website at delawarefunds.com/proxy; and (ii) on the SEC’s website at sec.gov. | | |
| | |
| AR-VIPHY 22464 (2/20) (1073909) | | High Yield Series-31 |

Delaware VIP® Trust
Delaware VIP International Value Equity Series
December 31, 2019
| | | | |
| | Beginning on or about June 1, 2021, as permitted by regulations adopted by the Securities and Exchange Commission, paper copies of your Series’ shareholder reports will no longer be sent to you by mail, unless you specifically request them from the Series or from your financial intermediary, such as a broker/dealer, bank, or insurance company. Instead, you will be notified by mail each time a report is posted on the website and provided with a link to access the report. If you already elected to receive shareholder reports electronically, you will not be affected by this change and you do not need to take any action. You may elect to receive paper copies of all future shareholder reports free of charge. You can inform the Series that you wish to continue receiving paper copies of your shareholder reports by contacting us at 800523-1918. If you own these shares through a financial intermediary, you may contact your financial intermediary to elect to continue to receive paper copies of your shareholder reports. Your election to receive reports in paper will apply to all funds held with the Delaware Funds® by Macquarie or your financial intermediary. | | |

Table of contents
| | | | | | | | |
| | | | |
| |  | | Portfolio management review | | 1 | | |
| | | | |
| | | | Performance summary | | 3 | | |
| | | | |
| | | | Disclosure of Series expenses | | 5 | | |
| | | | |
| | | | Security type / country and sector allocations | | 6 | | |
| | | | |
| | | | Schedule of investments | | 7 | | |
| | | | |
| | | | Statement of assets and liabilities | | 10 | | |
| | | | |
| | | | Statement of operations | | 11 | | |
| | | | |
| | | | Statements of changes in net assets | | 11 | | |
| | | | |
| | | | Financial highlights | | 12 | | |
| | | | |
| | | | Notes to financial statements | | 14 | | |
| | | | |
| | | | Report of independent registered public accounting firm | | 22 | | |
| | | | |
| | | | Other Series information | | 23 | | |
| | | | |
| | | | Board of trustees / directors and officers addendum | | 26 | | |
| | |
| | | | |
| | |
| | | | Other than Macquarie Bank Limited (MBL), none of the entities noted are authorized deposit-taking institutions for the purposes of the Banking Act 1959 (Commonwealth of Australia). The obligations of these entities do not represent deposits or other liabilities of MBL. MBL does not guarantee or otherwise provide assurance in respect of the obligations of these entities, unless noted otherwise. The Series is governed by US laws and regulations. Unless otherwise noted, views expressed herein are current as of Dec. 31, 2019, and subject to change for events occurring after such date. The Series is not FDIC insured and is not guaranteed. It is possible to lose the principal amount invested. Advisory services provided by Delaware Management Company, a series of Macquarie Investment Management Business Trust (MIMBT), a US registered investment advisor. The Series is distributed byDelaware Distributors, L.P.(DDLP), an affiliate of MIMBT and Macquarie Group Limited. Macquarie Investment Management (MIM) is the marketing name for certain companies comprising the asset management division of Macquarie Group Limited and its subsidiaries and affiliates worldwide. This material may be used in conjunction with the offering of shares in Delaware VIP® International Value Equity Series only if preceded or accompanied by the Series’ current prospectus or the summary prospectus. © 2020 Macquarie Management Holdings, Inc. All third-party marks cited are the property of their respective owners. |
| | |
Delaware VIP®Trust — Delaware VIP International Value Equity Series |
| Portfolio management review | | January 7, 2020 (Unaudited) |
The investment objective of the Series is to seek long-term growth without undue risk to principal.
Effective March 1, 2019, portfolio managers of Delaware VIP International Value Equity Series (the “Series”) changed. The new portfolio managers repositioned the Series’ investment portfolio in accordance with its current investment process beginning after April 15, 2019. Because everyone’s tax situation is unique, you should consult your tax professional about federal, state, local, or foreign tax consequences before making an investment in the Series. Please read the latest prospectus for more information concerning this event.
For the fiscal year ended Dec. 31, 2019, the Series’ Standard Class shares gained 19.31% and Service Class shares gained 18.95%. Both figures reflect all dividends reinvested. The Series’ benchmark, the MSCI EAFE (Europe, Australasia, Far East) Index, advanced 22.01% (net) and 22.66% (gross) for the same period.
During the fourth quarter of 2018, prior to the fiscal year, there was a sharp decline in the valuation of risky assets. But early in 2019, equity prices began to recover. There were plenty of reasons, in our view, for equity investors to be concerned, notably the continuing disputes between the United States and several of its most important trading partners. The looming prospect of Brexit continued to create doubt about the United Kingdom’s economic and political outlook. Despite these uncertainties, equities generally performed well over the 12 months ended Dec. 31, 2019.
During the fiscal year, the spot price of West Texas Intermediate (WTI) oil rose by nearly 35%, while the spot price of gold climbed about 18%. Broader-based commodity indices also showed fairly strong performance. The total return of the energy-intensive S&P GSCI was about 18% for the year, while the broad-based Thomson Reuters/CoreCommodity CRB Index rose almost 12% over the12-month period.
Risk-free interest rates continued to decline over the course of the fiscal year. The yield on US10-year Treasurys was 2.7% at the end of December 2018, but fell to roughly 1.8% by the end of December 2019. In Japan, the yield on10-year government bonds was roughly zero at the end of December 2018, dipped into negative territorymid-year, and then returned to near zero by the end of the year. In Germany,10-year government bonds offered barely positive yields at the end of December 2018, dropping to negative levels at the end of December 2019.
These declines in interest rates led to unusually high total returns for fixed income investors over the12-month period, but it seems unlikely, in our view, that risk-free interest rates around the world can continue to decline significantly from current levels. The limited scope for further declines in interest rates may cause equities to look relatively more appealing, for asset owners with longer investment horizons. Although some market observers believe that falling interest rates and weak commodity returns indicate an economic slowdown, equity investors appeared to shrug off these warning signals.
During the 12 months ended Dec. 31, 2019, growth equity indices tended to generate stronger returns than value equity indices. This was a headwind for the Series, which by design tends to be overweight in value stocks and underweight in growth relative to its benchmark, which contains both growth and value holdings. It is, therefore, not surprising to us that the Series delivered disappointing active returns during the fiscal year relative to its benchmark.
We invest with the mindset of long-term business owners, and our research is therefore focused on how well a company can deploy its capital and redeploy retained earnings. Therefore, the Series’ portfolio is builtbottom-up (stock by stock) by selecting company stocks based on quantitative insights and qualitative assessments.
We use a multivariate risk model to analyze the various contributors to and detractors from the Series’ performance against its benchmark. For the fiscal year ended Dec. 31, 2019, active country and sector weights were generally helpful to performance, both before and after the changeover to a new management team.
Over the full period, style effects also helped boost active returns. The Series’ underweight in earnings variability and residual volatility were helpful to its performance relative to its benchmark. Conversely, the Series’ underweights in beta (higher risk) and in growth both slightly detracted from performance.
In terms of individual holdings, three of the largest contributors to the Series’ active performance were German sportswear makeradidas AG,Japanese telecommunications firmKDDI Corp., and Swiss pharmaceutical manufacturerRoche Holding AG,which all rose more than 20% in US dollar terms during the Series’ fiscal year. From January through July, adidas rose steadily, buoyed by positive earnings reports, and its price held roughly steady thereafter. KDDI declined in the first few months of 2019 due to investors’ concern about a possible price war in the Japanese telecommunications market, but then showed an impressive recovery from early April onward as the situation became clearer. Roche rose strongly during the second half of 2019, after issuing strong quarterly earnings reports and increased management guidance for the full year.
International Value EquitySeries-1
| | |
| Delaware VIP®Trust — Delaware VIP International Value Equity Series |
| Portfolio management review (continued) | | January 7, 2020 (Unaudited) |
Conversely, three of the largest detractors from performance during the fiscal year were German healthcare firmFresenius Medical Care AG & Co. KGaA, Japanese power tool producerMakita Corp., and French media firmPublicis Groupe S.A.Although Fresenius Medical Care began the fiscal year strongly, it declined from the end of April to the end of October as investors became concerned about possible changes in the structure of US healthcare payments to dialysis providers. Makita’s quarterly reports of operating income were below consensus estimates several times during the year, and its stock price suffered accordingly. In somewhat similar fashion, shares of Publicis Groupe fell after the company reported revenues that were lower than the market expected. Nevertheless, all three companies remained in the Series’ portfolio at the end of December 2019, as we believe their overall risk-reward profiles are still attractive over the medium to long term.
Unless otherwise noted, views expressed herein are current as of Dec. 31, 2019, and subject to change.
International Value EquitySeries-2
Delaware VIP® Trust — Delaware VIP International Value Equity Series
Performance summary (Unaudited)
The performance quoted represents past performance and does not guarantee future results. Investment return and principal value of an investment will fluctuate so that shares, when redeemed, may be worth more or less than their original cost. Current performance may be lower or higher than the performance quoted.
Carefully consider the Series’ investment objectives, risk factors, charges, and expenses before investing. This and other information can be found in the Series’ prospectus and its summary prospectus, which may be obtained by visiting delawarefunds.com/vip/literature or calling 800523-1918. Investors should read the prospectus and the summary prospectus carefully before investing.
| | | | | | | | | | |
| Delaware VIP International Value Equity Series | | | | | | |
| Average annual total returns | | | | | | | | | | |
| For periods ended December 31, 2019 | | 1 year | | 3 year | | 5 year | | 10 year | | Lifetime |
Standard Class shares (commenced operations on Oct. 29, 1992) | | +19.31% | | +6.38% | | +4.74% | | +4.45% | | +6.38% |
| | | | | | | | | | | |
Service Class shares (commenced operations on May 1, 2000) | | +18.95% | | +6.07% | | +4.45% | | +4.18% | | +4.66% |
| | | | | | | | | | | |
MSCI EAFE Index (net) | | +22.01% | | +9.56% | | +5.67% | | +5.50% | | n/a |
| | | | | | | | | | | |
MSCI EAFE Index (gross) | | +22.66% | | +10.11% | | +6.18% | | +5.99% | | n/a |
Returns reflect the reinvestment of all distributions. Please see page 4 for a description of the index.
As described in the Series’ most recent prospectus, the net expense ratio for Service Class shares of the Series was 1.34%, while total operating expenses for Standard Class and Service Class shares were 1.04% and 1.34%, respectively. The management fee for Standard Class and Service Class shares was 0.85%. The Series’ investment manager, Delaware Management Company (Manager), has contractually agreed to waive all or a portion of its investment advisory fees and/or pay/reimburse expenses (excluding any12b-1 fees, acquired fund fees and expenses, taxes, interest, short sale and dividend interest expenses, brokerage fees, certain insurance costs, and nonroutine expenses or costs, including, but not limited to, those relating to reorganizations, litigation, conducting shareholder meetings, and liquidations) in order to prevent annual series operating expenses from exceeding 1.04% of the Series’ average daily net assets from Jan. 1, 2019 through Dec. 31, 2019.* These waivers and reimbursements may only be terminated by agreement of the Manager and the Series.
Earnings from a variable annuity or variable life investment compoundtax-free until withdrawal, and as a result, no adjustments were made for income taxes.
Expense limitations were in effect for both classes during certain periods shown in the Series performance table above and in the Performance of a $10,000 Investment graph on the next page.
Performance data do not reflect insurance fees related to a variable annuity or variable life investment or the deferred sales charge that would apply to certain withdrawals of investments held for fewer than eight years. Performance shown here would have been reduced if such fees were included and the expense limitation removed. For more information about fees, consult your variable annuity or variable life prospectus.
Investments in variable products involve risk.
International investments entail risks not ordinarily associated with US investments including fluctuation in currency values, differences in accounting principles, or economic or political instability in other nations.
Investing in emerging markets can be riskier than investing in established foreign markets due to increased volatility and lower trading volume.
Please read both the contract and underlying prospectus for specific details regarding the product’s risk profile.
*The aggregate contractual waiver period covering this report is from May 1, 2018 through April 30, 2020.
International Value EquitySeries-3
Delaware VIP® International Value Equity Series
Performance summary (Unaudited) (continued)
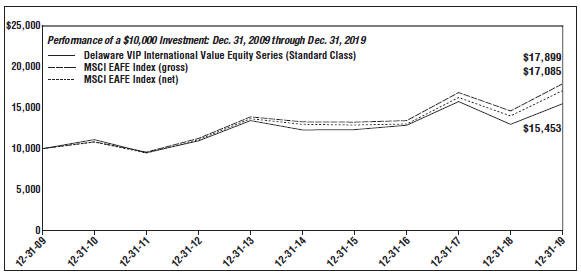
| | | | |
| For period beginning Dec. 31, 2009 through Dec. 31, 2019 | | Starting value | | Ending value |
– – MSCI EAFE Index (gross) | | $10,000 | | $17,899 |
--- MSCI EAFE Index (net) | | $10,000 | | $17,085 |
– – Delaware VIP International Value Equity Series (Standard Class) | | $10,000 | | $15,453 |
The graph shows a $10,000 investment in the Delaware VIP International Value Equity Series Standard Class shares for the period from Dec. 31, 2009 through Dec. 31, 2019.
The graph also shows $10,000 invested in the MSCI EAFE Index for the period from Dec. 31, 2009 through Dec. 31, 2019. The MSCI EAFE (Europe, Australasia, Far East) Index represents large- andmid-cap stocks across 21 developed markets, excluding the United States and Canada. The index covers approximately 85% of the free float-adjusted market capitalization in each country. Index “net” return approximates the minimum possible dividend reinvestment, after deduction of withholding tax at the highest possible rate. Index “gross” return approximates the maximum possible dividend reinvestment.
The S&P GSCI (formerly Goldman Sachs Commodity Index), mentioned on page 1, is a world production-weighted index composed of the principal physical commodities that are the subject of active, liquid futures markets.
The Thomson Reuters/CoreCommodity CRB Index, mentioned on page 1, is a widely recognized measure of global commodities markets. It is made up of 19 components considered to be significant commodities, including silver, sugar, wheat, aluminum, and soybeans.
Index performance returns do not reflect any management fees, transaction costs or expenses. Indices are unmanaged and one cannot invest directly in an index.
Performance of Service Class shares will vary due to different charges and expenses.
Past performance is not a guarantee of future results.
International Value EquitySeries-4
Delaware VIP® Trust — Delaware VIP International Value Equity Series
Disclosure of Series expenses
For thesix-month period from July 1, 2019 to December 31, 2019 (Unaudited)
As a shareholder of the Series, you incur ongoing costs, which may include management fees; distribution and service(12b-1) fees; and other Series expenses. This example is intended to help you understand your ongoing costs (in dollars) of investing in the Series and to compare these costs with the ongoing costs of investing in other mutual funds.
The example is based on an investment of $1,000 invested at the beginning of the period and held for the entiresix-month period from July 1, 2019 to Dec. 31, 2019.
Actual expenses
The first section of the table shown, “Actual Series return,” provides information about actual account values and actual expenses. You may use the information in this section of the table, together with the amount you invested, to estimate the expenses that you paid over the period. Simply divide your account value by $1,000 (for example, an $8,600 account value divided by $1,000 = 8.6), then multiply the result by the number in the first section under the heading entitled “Expenses Paid During Period” to estimate the expenses you paid on your account during the period.
Hypothetical example for comparison purposes
The second section of the table shown, “Hypothetical 5% return,” provides information about hypothetical account values and hypothetical expenses based on the Series’ actual expense ratio and an assumed rate of return of 5% per year before expenses, which is not the Series’ actual return. The hypothetical account values and expenses may not be used to estimate the actual ending account balance or expenses you paid for the period. You may use this information to compare the ongoing costs of investing in the Series and other funds. To do so, compare this 5% hypothetical example with the 5% hypothetical examples that appear in the shareholder reports of other funds.
Please note that the expenses shown in the table are meant to highlight your ongoing costs only. As a shareholder of the Series, you do not incur any transaction costs, such as sales charges (loads), redemption fees or exchange fees, but shareholders of other funds may incur such costs. Also, the fees related to the variable annuity investment or the deferred sales charge that could apply have not been included. Therefore, the second section of the table is useful in comparing ongoing costs only, and will not help you determine the relative total costs of owning different funds. The Series’ expenses shown in the table reflect fee waivers in effect and assume reinvestment of all dividends and distributions.
Expense analysis of an investment of $1,000
| | | | | | | | | | | | | | |
| | | Beginning
Account
Value
7/1/19 | | | Ending
Account
Value
12/31/19 | | | Annualized
Expense
Ratio | | Expenses
Paid During
Period
7/1/19 to
12/31/19* | |
Actual Series return† | | | | |
Standard Class | | | $1,000.00 | | | | $1,041.50 | | | 1.04% | | | $5.35 | |
Service Class | | | 1,000.00 | | | | 1,039.90 | | | 1.34% | | | 6.89 | |
Hypothetical 5% return(5% return before expenses) | |
Standard Class | | | $1,000.00 | | | | $1,019.96 | | | 1.04% | | | $5.30 | |
Service Class | | | 1,000.00 | | | | 1,018.45 | | | 1.34% | | | 6.82 | |
| *“ | Expenses Paid During Period” are equal to the Series’ annualized expense ratio, multiplied by the average account value over the period, multiplied by 184/365 (to reflect theone-half year period). |
| † | Because actual returns reflect only the most recentsix-month period, the returns shown may differ significantly from fiscal year returns. |
International Value Equity Series-5
Delaware VIP® Trust — Delaware VIP International Value Equity Series
Security type / country and sector allocations
As of December 31, 2019 (Unaudited)
Sector designations may be different than the sector designations presented in other Series materials. The sector designations may represent the investment manager’s internal sector classifications.
| | |
| Security type / sector | | Percentage of
net assets |
Common Stock by Country | | 97.37% |
Denmark | | 6.68% |
France | | 25.15% |
Germany | | 6.57% |
Ireland | | 1.42% |
Japan | | 21.37% |
Netherlands | | 7.10% |
Sweden | | 3.92% |
Switzerland | | 15.23% |
United Kingdom | | 9.93% |
Exchange-Traded Fund | | 2.42% |
Securities Lending Collateral | | 3.05% |
Total Value of Securities | | 102.84% |
Obligation to Return Securities Lending Collateral | | (3.05%) |
Receivables and Other Assets Net of Liabilities | | 0.21% |
Total Net Assets | | 100.00% |
| |
| Common stock by sector | | Percentage of
net assets |
Consumer Discretionary | | 23.77% |
Consumer Staples1 | | 37.86% |
Healthcare | | 18.20% |
Industrials | | 11.96% |
Materials | | 5.58% |
Total | | 97.37% |
| 1 | To monitor compliance with the Series’ concentration guidelines, the Consumer Staples sector (as disclosed herein for financial reporting purposes) is divided into varioussub-categories or “industries,” in this case, Beverages, Cosmetics, Food and Retail. As of Dec. 31, 2019, such amounts, as a percentage of total net assets, were 8.33%, 1.77%, 25.54% and 2.22%, respectively. The percentage in any such single industry will comply with the Series’ concentration policy even if the percentage in the “Consumer Staples sector” for financial reporting purposes may exceed 25%. |
International Value Equity Series-6
Delaware VIP® Trust — Delaware VIP International Value Equity Series
Schedule of investments
December 31, 2019
| | | | | | | | |
| | | Number of | | | Value | |
| | | shares | | | (US $) | |
| |
Common Stock – 97.37%D | | | | | |
Denmark – 6.68% | | | | | | | | |
Novo Nordisk Class B | | | 58,980 | | | $ | 3,417,822 | |
| | | | | | | | |
| | | | | | | 3,417,822 | |
| | | | | | | | |
France – 25.15% | | | | | | | | |
Air Liquide | | | 20,180 | | | | 2,856,651 | |
Danone | | | 40,220 | | | | 3,333,982 | |
Orange† | | | 130,710 | | | | 1,923,620 | |
Publicis Groupe | | | 54,850 | | | | 2,483,159 | |
Sodexo | | | 19,240 | | | | 2,280,086 | |
| | | | | | | | |
| | | | | | | 12,877,498 | |
| | | | | | | | |
Germany – 6.57% | | | | | | | | |
adidas AG | | | 2,570 | | | | 835,427 | |
Fresenius Medical Care AG & Co. | | | 34,350 | | | | 2,529,116 | |
| | | | | | | | |
| | | | | | | 3,364,543 | |
| | | | | | | | |
Ireland – 1.42% | | | | | | | | |
Kerry Group Class A | | | 5,840 | | | | 727,786 | |
| | | | | | | | |
| | | | | | | 727,786 | |
| | | | | | | | |
Japan – 21.37% | | | | | | | | |
Asahi Group Holdings * | | | 31,400 | | | | 1,432,484 | |
Kao* | | | 11,000 | | | | 907,226 | |
KDDI | | | 77,000 | | | | 2,297,401 | |
Kirin Holdings * | | | 29,300 | | | | 639,519 | |
Lawson | | | 20,000 | | | | 1,135,253 | |
Makita | | | 38,600 | | | | 1,333,046 | |
Secom | | | 8,100 | | | | 722,866 | |
Seven & i Holdings | | | 67,500 | | | | 2,474,242 | |
| | | | | | | | |
| | | | | | | 10,942,037 | |
| | | | | | | | |
Netherlands – 7.10% | | | | | | | | |
Koninklijke Ahold Delhaize | | | 145,240 | | | | 3,632,206 | |
| | | | | | | | |
| | | | | | | 3,632,206 | |
| | | | | | | | |
Sweden – 3.92% | | | | | | | | |
Securitas Class B | | | 116,580 | | | | 2,008,583 | |
| | | | | | | | |
| | | | | | | 2,008,583 | |
| | | | | | | | |
Switzerland – 15.23% | | | | | | | | |
Nestle | | | 26,850 | | | | 2,906,923 | |
Roche Holding | | | 10,380 | | | | 3,373,529 | |
Swatch Group | | | 5,440 | | | | 1,518,877 | |
| | | | | | | | |
| | | | | | | 7,799,329 | |
| | | | | | | | |
United Kingdom – 9.93% | | | | | | | | |
Diageo | | | 51,760 | | | | 2,194,304 | |
G4S | | | 713,720 | | | | 2,060,958 | |
Next | | | 8,920 | | | | 829,207 | |
| | | | | | | | |
| | | | | | | 5,084,469 | |
| | | | | | | | |
Total Common Stock
(cost $47,957,000) | | | | 49,854,273 | |
| | | | | | | | |
| | | | | | | | |
| | | Number of | | | Value | |
| | | shares | | | (US $) | |
| |
Exchange-Traded Funds – 2.42% | | | | | |
iShares MSCI EAFE ETF | | | 1,090 | | | $ | 75,690 | |
Vanguard FTSE Developed Markets ETF* | | | 26,440 | | | | 1,164,946 | |
| | | | | | | | |
Total Exchange-Traded Funds
(cost $1,193,941) | | | | 1,240,636 | |
| | | | | | | | |
Total Value of Securities Before
Securities Lending
Collateral – 99.79%
(cost $49,150,941) | | | | | | | 51,094,909 | |
| | | | | | | | |
| | |
| | | Principal | | | | |
| | | amount° | | | | |
|
Securities Lending Collateral – 3.05% ** | |
Certificate of Deposit – 0.14% ≠ | | | | | |
Bank of Nova Scotia (Toronto) 1.55% 1/2/20 | | | 70,000 | | | | 70,000 | |
| | | | | | | | |
| | | | | | | 70,000 | |
| | | | | | | | |
Repurchase Agreements – 2.91% | | | | | |
Bank of Montreal
1.55%, dated 12/31/19, to be repurchased on 1/2/20, repurchase price $363,336 (collateralized by US government obligations0.125%-7.875%2/15/21-10/15/24; market value $370,571) | | | 363,305 | | | | 363,305 | |
Bank of Nova Scotia
1.55%, dated 12/31/19, to be repurchased on 1/2/20, repurchase price $363,336 (collateralized by US government obligations0.125%-2.75%11/15/20-10/31/24; market value $370,603) | | | 363,305 | | | | 363,305 | |
BofA Securities
1.55%, dated 12/31/19, to be repurchased on 1/2/20, repurchase price $363,336 (collateralized by US government obligations1.75%-2.00%6/15/22-6/30/24; market value $370,572) | | | 363,305 | | | | 363,305 | |
Credit Agricole
1.55%, dated 12/31/19, to be repurchased on 1/2/20, repurchase price $363,336 (collateralized by US government obligations 0.125% 1/15/22; market value $370,571) | | | 363,305 | | | | 363,305 | |
International Value Equity Series–7
Delaware VIP® International Value Equity Series
Schedule of investments (continued)
| | | | | | | | |
| | | Principal | | | Value | |
| | | amount° | | | (US $) | |
|
Securities Lending Collateral ** (continued) | |
Repurchase Agreements (continued) | | | | | |
JP Morgan Securities
1.55%, dated 12/31/19, to be repurchased on 1/2/20, repurchase price $37,680 (collateralized by US government obligations1.75%-2.875%9/15/21-6/30/24; market value $38,431) | | | 37,677 | | | $ | 37,677 | |
| | | | | | | | |
| | | | | | | 1,490,897 | |
| | | | | | | | |
Total Securities Lending Collateral
(cost $1,560,897) | | | | | | | 1,560,897 | |
| | | | | | | | |
| | | | | | | | |
Total Value of Securities – 102.84%
(cost $50,711,838) | | | | | | $ | 52,655,806∎ | |
| | | | | | | | |
| * | Fully or partially on loan. |
| ** | See Note 10 in “Notes to financial statements” for additional information on securities lending collateral. |
≠ The rate shown is the effective yield at the time of purchase.
| ∎ | Includes $4,117,820 of securities loaned for which the counterparty pledged additionalnon-cash collateral valued at $2,836,355. |
| ° | Principal amount shown is stated in USD unless noted that the security is denominated in another currency. |
| D | Securities have been classified by country of origin. Aggregate classification by business sector has been presented on page 6 in “Security type / country and sector allocations.” |
| † | Non-income producing security. |
The following foreign currency exchange contract was outstanding at Dec. 31, 2019:1
Foreign Currency Exchange Contracts
| | | | | | | | | | | | |
Counterparty | | Currency to
Receive (Deliver) | | In Exchange For | | Settlement
Date | | Unrealized
Appreciation |
BNYM | | GBP | | (5,129) | | USD | | 6,800 | | 1/2/20 | | $7 |
1See Note 8 in “Notes to financial statements.”
The use of foreign currency exchange contracts involves elements of market risk and risks in excess of the amounts disclosed in these financial statements. The foreign currency exchange contracts presented above represent the Series’ total exposure in such contracts, whereas only the net unrealized appreciation (depreciation) is reflected in the Series’ net assets.
Summary of abbreviations:
BNYM – Bank of New York Mellon
EAFE – Europe Australasia Far East
ETF – Exchange-Traded Fund
FTSE – Financial Times Stock Exchange
GBP – British Pound Sterling
MSCI – Morgan Stanley Capital International
USD – US Dollar
See accompanying notes, which are an integral part of financial statements.
International Value Equity Series-8
This page intentionally left blank.
| | | | |
| Delaware VIP®Trust — Delaware VIP International Value Equity Series | | | | |
| Statement of assets and liabilities | | | December 31, 2019 | |
| | | | |
Assets: | | | | |
Investments, at value1 | | $ | 51,094,909 | |
Short-term investments held as collateral for loaned securities, at value2 | | | 1,560,897 | |
Foreign currencies, at value3 | | | 171,675 | |
Foreign tax reclaims receivable | | | 217,391 | |
Dividends and interest receivable | | | 31,323 | |
Receivable for securities sold | | | 20,685 | |
Receivable for series shares sold | | | 14,385 | |
Securities lending income receivable | | | 435 | |
Unrealized appreciation on foreign currency exchange contracts | | | 7 | |
| | | | |
Total assets | | | 53,111,707 | |
| | | | |
Liabilities: | | | | |
Cash due to custodian | | | 138,948 | |
Obligation to return securities lending collateral | | | 1,560,346 | |
Payable for series shares redeemed | | | 136,288 | |
Other accrued expenses | | | 38,475 | |
Investment management fees payable to affiliates | | | 34,871 | |
Trustees’ fees and expenses payable | | | 501 | |
Accounting and administration expenses payable to affiliates | | | 483 | |
Dividend disbursing and transfer agent fees and expenses payable to affiliates | | | 323 | |
Distribution fees payable to affiliates | | | 169 | |
Legal fees payable to affiliates | | | 79 | |
Reports and statements to shareholders expenses payable to affiliates | | | 25 | |
Other liabilities | | | 618 | |
| | | | |
Total liabilities | | | 1,911,126 | |
| | | | |
Total Net Assets | | $ | 51,200,581 | |
| | | | |
| |
Net Assets Consist of: | | | | |
Paid-in capital | | $ | 46,446,821 | |
Total distributable earnings (loss) | | | 4,753,760 | |
| | | | |
Total Net Assets | | $ | 51,200,581 | |
| | | | |
| |
Net Assets Value: | | | | |
Standard Class: | | | | |
Net assets | | $ | 50,496,220 | |
Shares of beneficial interest outstanding, unlimited authorization, no par | | | 4,101,733 | |
Net asset value per share | | $ | 12.31 | |
| |
Service Class: | | | | |
Net assets | | $ | 704,361 | |
Shares of beneficial interest outstanding, unlimited authorization, no par | | | 57,439 | |
Net asset value per share | | $ | 12.26 | |
| | | | |
1Investments, at cost | | $ | 49,150,941 | |
2Short-term investments held as collateral for loaned securities, at cost | | | 1,560,897 | |
3Foreign currencies, at cost | | | 172,775 | |
See accompanying notes, which are an integral part of the financial statements.
International Value Equity Series-10
Delaware VIP®Trust —
Delaware VIP International Value Equity Series
Statement of operations
Year ended December 31, 2019
| | | | |
Investment Income: | | | | |
Dividends | | $ | 1,530,129 | |
Securities lending income | | | 4,433 | |
Interest | | | 2,144 | |
Foreign tax withheld | | | (157,604 | ) |
| | �� | | |
| |
| | | 1,379,102 | |
| | | | |
|
Expenses: | |
Management fees | | | 417,823 | |
Accounting and administration expenses | | | 48,313 | |
Audit and tax fees | | | 37,522 | |
Custodian fees | | | 16,579 | |
Reports and statements to shareholders expenses | | | 15,252 | |
Legal fees | | | 9,770 | |
Dividend disbursing and transfer agent fees and expenses | | | 4,248 | |
Trustees’ fees and expenses | | | 2,896 | |
Distribution expenses – Service Class | | | 1,905 | |
Registration fees | | | 10 | |
Other | | | 11,241 | |
| | | | |
| |
| | | 565,559 | |
Less expenses waived | | | (52,945 | ) |
Less expenses paid indirectly | | | (10 | ) |
| | | | |
Total operating expenses | | | 512,604 | |
| | | | |
Net Investment Income | | | 866,498 | |
| | | | |
|
Net Realized and Unrealized Gain (Loss): | |
Net realized gain (loss) on: | | | | |
Investments | | | 2,815,293 | |
Foreign currencies | | | (2,301 | ) |
Foreign currency exchange contracts | | | (42,762 | ) |
| | | | |
Net realized gain | | | 2,770,230 | |
| | | | |
Net change in unrealized appreciation (depreciation) of: | | | | |
Investments | | | 4,854,154 | |
Foreign currencies | | | 501 | |
Foreign currency exchange contracts | | | 7 | |
| | | | |
Net change in unrealized appreciation (depreciation) | | | 4,854,662 | |
| | | | |
Net Realized and Unrealized Gain | | | 7,624,892 | |
| | | | |
Net Increase in Net Assets Resulting from Operations | | $ | 8,491,390 | |
| | | | |
Delaware VIP Trust —
Delaware VIP International Value Equity Series
Statements of changes in net assets
| | | | | | | | |
| | | Year ended | |
| | | 12/31/19 | | | 12/31/18 | |
Increase (Decrease) in Net Assets from Operations: | | | | | | | | |
Net investment income | | $ | 866,498 | | | $ | 1,096,769 | |
Net realized gain | | | 2,770,230 | | | | 894,559 | |
Net change in unrealized appreciation (depreciation) | | | 4,854,662 | | | | (11,331,690 | ) |
| | | | | | | | |
Net increase (decrease) in net assets resulting from operations | | | 8,491,390 | | | | (9,340,362 | ) |
| | | | | | | | |
| |
Dividends and Distributions to Shareholders from: | | | | | |
Distributable earnings: | | | | | | | | |
Standard Class | | | (1,885,628 | ) | | | (1,385,108 | ) |
Service Class | | | (27,349 | ) | | | (11,061 | ) |
| | | | | | | | |
| | | (1,912,977 | ) | | | (1,396,169 | ) |
| | | | | | | | |
| |
Capital Share Transactions: | | | | | |
Proceeds from shares sold: | | | | | |
Standard Class | | | 3,001,321 | | | | 4,315,587 | |
Service Class | | | 272,794 | | | | 319,083 | |
Net asset value of shares issued upon reinvestment of dividends and distributions: | | | | | | | | |
Standard Class | | | 1,885,628 | | | | 1,385,108 | |
Service Class | | | 27,348 | | | | 11,061 | |
| | | | | | | | |
| | | 5,187,091 | | | | 6,030,839 | |
| | | | | | | | |
Cost of shares redeemed: | | | | | |
Standard Class | | | (4,312,975 | ) | | | (3,274,187 | ) |
Service Class | | | (201,163 | ) | | | (45,267 | ) |
| | | | | | | | |
| | | (4,514,138 | ) | | | (3,319,454 | ) |
| | | | | | | | |
Increase in net assets derived from capital share transactions | | | 672,953 | | | | 2,711,385 | |
| | | | | | | | |
Net Increase (Decrease) in Net Assets | | | 7,251,366 | | | | (8,025,146 | ) |
| |
Net Assets: | | | | | |
Beginning of year | | | 43,949,215 | | | | 51,974,361 | |
| | | | | | | | |
End of year | | $ | 51,200,581 | | | $ | 43,949,215 | |
| | | | | | | | |
See accompanying notes, which are an integral part of the financial statements.
International Value Equity Series-11
Delaware VIP® Trust — Delaware VIP International Value Equity Series
Financial highlights
Selected data for each share of the Series outstanding throughout each period were as follows:
| | | | | | | | | | | | | | | | | | | | | | | | | |
| | | Delaware VIP International Value Equity Series Standard Class
Year ended |
| | | 12/31/19 | | 12/31/18 | | 12/31/17 | | 12/31/16 | | 12/31/15 |
Net asset value, beginning of period | | | $ | 10.73 | | | | $ | 13.39 | | | | $ | 11.11 | | | | $ | 10.84 | | | | $ | 10.99 | |
| | | | | |
Income (loss) from investment operations: | | | | | | | | | | | | | | | | | | | | | | | | | |
Net investment income1 | | | | 0.21 | | | | | 0.27 | | | | | 0.25 | | | | | 0.19 | | | | | 0.19 | |
Net realized and unrealized gain (loss) | | | | 1.83 | | | | | (2.57 | ) | | | | 2.22 | | | | | 0.26 | | | | | (0.11 | ) |
| | | | | | | | | | | | | | | | | | | | | | | | | |
Total from investment operations | | | | 2.04 | | | | | (2.30 | ) | | | | 2.47 | | | | | 0.45 | | | | | 0.08 | |
| | | | | | | | | | | | | | | | | | | | | | | | | |
| | | | | |
Less dividends and distributions from: | | | | | | | | | | | | | | | | | | | | | | | | | |
Net investment income | | | | (0.26 | ) | | | | (0.36 | ) | | | | (0.19 | ) | | | | (0.18 | ) | | | | (0.23 | ) |
Net realized gain | | | | (0.20 | ) | | | | — | | | | | — | | | | | — | | | | | — | |
| | | | | | | | | | | | | | | | | | | | | | | | | |
Total dividends and distributions | | | | (0.46 | ) | | | | (0.36 | ) | | | | (0.19 | ) | | | | (0.18 | ) | | | | (0.23 | ) |
| | | | | | | | | | | | | | | | | | | | | | | | | |
| | | | | |
Net asset value, end of period | | | $ | 12.31 | | | | $ | 10.73 | | | | $ | 13.39 | | | | $ | 11.11 | | | | $ | 10.84 | |
| | | | | | | | | | | | | | | | | | | | | | | | | |
| | | | | |
Total return2 | | | | 19.31% | 3 | | | | (17.64% | )3 | | | | 22.51% | | | | | 4.19% | | | | | 0.49% | |
| | | | | |
Ratios and supplemental data: | | | | | | | | | | | | | | | | | | | | | | | | | |
Net assets, end of period (000 omitted) | | | $ | 50,496 | | | | $ | 43,416 | | | | $ | 51,613 | | | | $ | 65,633 | | | | $ | 62,285 | |
Ratio of expenses to average net assets | | | | 1.04% | | | | | 1.06% | | | | | 1.06% | | | | | 1.02% | | | | | 1.04% | |
Ratio of expenses to average net assets prior to fees waived | | | | 1.15% | | | | | 1.10% | | | | | 1.06% | | | | | 1.02% | | | | | 1.04% | |
Ratio of net investment income to average net assets | | | | 1.77% | | | | | 2.21% | | | | | 2.00% | | | | | 1.78% | | | | | 1.66% | |
Ratio of net investment income to average net assets prior to fees waived | | | | 1.66% | | | | | 2.17% | | | | | 2.00% | | | | | 1.78% | | | | | 1.66% | |
Portfolio turnover | | | | 137%4 | | | | | 13% | | | | | 15% | | | | | 19% | | | | | 11% | |
| 1 | The average shares outstanding method has been applied for per share information. |
| 2 | Total return is based on the change in net asset value of a share during the period and assumes reinvestment of dividends and distributions at net asset value. Total return does not include fees, charges, or expenses imposed by the variable annuity and life insurance contracts for which Delaware VIP Trust serves as an underlying investment vehicle. |
| 3 | Total return during the period reflects a waiver by the manager and/or distributor. Performance would have been lower had the waiver not been in effect. |
| 4 | The Fund’s portfolio turnover rate increased substantially during the year ended Dec. 31, 2019 due to a change in the Fund’s portfolio managers and associated repositioning. |
See accompanying notes, which are an integral part of the financial statements.
International Value Equity Series-12
Delaware VIP® International Value Equity Series
Financial highlights (continued)
Selected data for each share of the Series outstanding throughout each period were as follows:
| | | | | | | | | | | | | | | | | | | | | | | | | |
| | | Delaware VIP International Value Equity Series Service Class
Year ended |
| | | 12/31/19 | | 12/31/18 | | 12/31/17 | | 12/31/16 | | 12/31/15 |
Net asset value, beginning of period | | | $ | 10.70 | | | | $ | 13.36 | | | | $ | 11.09 | | | | $ | 10.82 | | | | $ | 10.97 | |
| | | | | |
Income (loss) from investment operations: | | | | | | | | | | | | | | | | | | | | | | | | | |
Net investment income1 | | | | 0.17 | | | | | 0.24 | | | | | 0.22 | | | | | 0.16 | | | | | 0.16 | |
Net realized and unrealized gain (loss) | | | | 1.83 | | | | | (2.57 | ) | | | | 2.21 | | | | | 0.26 | | | | | (0.11 | ) |
| | | | | | | | | | | | | | | | | | | | | | | | | |
Total from investment operations | | | | 2.00 | | | | | (2.33 | ) | | | | 2.43 | | | | | 0.42 | | | | | 0.05 | |
| | | | | | | | | | | | | | | | | | | | | | | | | |
| | | | | |
Less dividends and distributions from: | | | | | | | | | | | | | | | | | | | | | | | | | |
Net investment income | | | | (0.24 | ) | | | | (0.33 | ) | | | | (0.16 | ) | | | | (0.15 | ) | | | | (0.20 | ) |
Net realized gain | | | | (0.20 | ) | | | | — | | | | | — | | | | | — | | | | | — | |
| | | | | | | | | | | | | | | | | | | | | | | | | |
Total dividends and distributions | | | | (0.44 | ) | | | | (0.33 | ) | | | | (0.16 | ) | | | | (0.15 | ) | | | | (0.20 | ) |
| | | | | | | | | | | | | | | | | | | | | | | | | |
| | | | | |
Net asset value, end of period | | | $ | 12.26 | | | | $ | 10.70 | | | | $ | 13.36 | | | | $ | 11.09 | | | | $ | 10.82 | |
| | | | | | | | | | | | | | | | | | | | | | | | | |
| | | | | |
Total return2 | | | | 18.95% | | | | | (17.90% | ) | | | | 22.18% | | | | | 3.92% | | | | | 0.24% | |
| | | | | |
Ratios and supplemental data: | | | | | | | | | | | | | | | | | | | | | | | | | |
Net assets, end of period (000 omitted) | | | $ | 705 | | | | $ | 533 | | | | $ | 361 | | | | $ | 330 | | | | $ | 147 | |
Ratio of expenses to average net assets | | | | 1.34% | | | | | 1.35% | | | | | 1.31% | | | | | 1.27% | | | | | 1.29% | |
Ratio of expenses to average net assets prior to fees waived | | | | 1.45% | | | | | 1.40% | | | | | 1.36% | | | | | 1.32% | | | | | 1.34% | |
Ratio of net investment income to average net assets | | | | 1.47% | | | | | 1.92% | | | | | 1.75% | | | | | 1.53% | | | | | 1.41% | |
Ratio of net investment income to average net assets prior to fees waived | | | | 1.36% | | | | | 1.87% | | | | | 1.70% | | | | | 1.48% | | | | | 1.36% | |
Portfolio turnover | | | | 137%3 | | | | | 13% | | | | | 15% | | | | | 19% | | | | | 11% | |
| 1 | The average shares outstanding method has been applied for per share information. |
| 2 | Total return is based on the change in net asset value of a share during the period and assumes reinvestment of dividends and distributions at net asset value. Total return during all of the periods shown reflects waivers by the manager and/or distributor. Performance would have been lower had the waivers not been in effect. Total return does not include fees, charges, or expenses imposed by the variable annuity and life insurance contracts for which Delaware VIP Trust serves as an underlying investment vehicle. |
| 3 | The Fund’s portfolio turnover rate increased substantially during the year ended Dec. 31, 2019 due to a change in the Fund’s portfolio managers and associated repositioning. |
See accompanying notes, which are an integral part of the financial statements.
International Value Equity Series-13
Delaware VIP® Trust — Delaware VIP International Value Equity Series
Notes to financial statements
December 31, 2019
Delaware VIP Trust (Trust) is organized as a Delaware statutory trust and offers 22 series, each of which is treated as a separate entity for certain matters under the Investment Company Act of 1940, as amended (1940 Act). These financial statements and the related notes pertain to Delaware VIP International Value Equity Series (Series). The Trust is anopen-end investment company. The Series is considered diversified under the 1940 Act and offers Standard Class and Service Class shares. The Standard Class shares do not carry a distribution and service(12b-1) fee and the Service Class shares carry a12b-1 fee. The shares of the Series are sold only to separate accounts of life insurance companies.
1. Significant Accounting Policies
The Series follows accounting and reporting guidance under Financial Accounting Standards Board (FASB) Accounting Standards Codification Topic 946, Financial Services – Investment Companies. The following accounting policies are in accordance with US generally accepted accounting principles (US GAAP) and are consistently followed by the Series.
Security Valuation – Equity securities, except those traded on the Nasdaq Stock Market LLC (Nasdaq), are valued at the last quoted sales price as of the time of the regular close of the New York Stock Exchange on the valuation date. Equity securities traded on the Nasdaq are valued in accordance with the Nasdaq Official Closing Price, which may not be the last sales price. If, on a particular day, an equity security does not trade, the mean between the bid and ask prices will be used, which approximates fair value. Equity securities listed on a foreign exchange are normally valued at the last quoted sales price on the valuation date. US government and agency securities are valued at the mean between the bid and ask prices, which approximates fair value. Investments in repurchase agreements are generally valued at par, which approximates fair value, each business day.Open-end investment companies are valued at their published net asset value (NAV). Foreign currency exchange contracts and foreign cross currency exchange contracts are valued at the mean between the bid and ask prices, which approximates fair value. Interpolated values are derived when the settlement date of the contract is an interim date for which quotations are not available. Generally, other securities and assets for which market quotations are not readily available are valued at fair value as determined in good faith under the direction of the Trust’s Board of Trustees (Board). In determining whether market quotations are readily available or fair valuation will be used, various factors will be taken into consideration, such as market closures or suspension of trading in a security. The Series may use fair value pricing more frequently for securities traded primarily innon-US markets because, among other things, most foreign markets close well before the Series values its securities, generally as of 4:00pm Eastern time. The earlier close of these foreign markets gives rise to the possibility that significant events, including broad market moves, government actions or pronouncements, aftermarket trading, or news events may have occurred in the interim. Whenever such a significant event occurs, the Series may value foreign securities using fair value prices based on third-party vendor modeling tools (international fair value pricing). Restricted securities are valued at fair value using methods approved by the Board.
Federal and Foreign Income Taxes – No provision for federal income taxes has been made as the Series intends to continue to qualify for federal income tax purposes as a regulated investment company under Subchapter M of the Internal Revenue Code of 1986, as amended, and make the requisite distributions to shareholders. The Series evaluates tax positions taken or expected to be taken in the course of preparing the Series’ tax returns to determine whether the tax positions are“more-likely-than-not” of being sustained by the applicable tax authority. Tax positions not deemed to meet the“more-likely-than-not” threshold are recorded as a tax benefit or expense in the current year. Management has analyzed the Series’ tax positions taken or expected to be taken on the Series’ federal income tax returns through the year ended Dec. 31, 2019 and for all open tax years (years ended Dec. 31, 2016–Dec. 31, 2018), and has concluded that no provision for federal income tax is required in the Series’ financial statements. If applicable, the Series recognizes interest accrued on unrecognized tax benefits in interest expense and penalties in “Other expenses” on the “Statement of operations.” During the year ended Dec. 31, 2019, the Series did not incur any interest or tax penalties. In regard to foreign taxes only, the Series has open tax years in certain foreign countries in which it invests in that may date back to the inception of the Series.
Class Accounting – Investment income, common expenses, and realized and unrealized gain (loss) on investments are allocated to the classes of the Series on the basis of daily net assets of each class. Distribution expenses relating to a specific class are charged directly to that class.
Repurchase Agreements – The Series may purchase certain US government securities subject to the counterparty’s agreement to repurchase them at an agreed upon date and price. The counterparty will be required on a daily basis to maintain the value of the collateral subject to the agreement at not less than the repurchase price (including accrued interest). The agreements are conditioned upon the collateral being deposited under the Federal Reserve book-entry system with the Series’ custodian or a third-partysub-custodian. In the event of default or bankruptcy by the other party to the agreement, retention of the collateral may be subject to legal proceedings. All open repurchase agreements as of the date of this report were entered into on Dec. 31, 2019, and matured on the next business day.
Foreign Currency Transactions – Transactions denominated in foreign currencies are recorded at the prevailing exchange rates on the valuation date in accordance with the Series’ prospectus. The value of all assets and liabilities denominated in foreign currencies is translated daily into US dollars at the exchange rate of such currencies against the US dollar. Transaction gains or losses resulting from changes in exchange rates during the reporting period or upon settlement of the foreign currency transaction are reported in operations for the current period. The Series generally does not bifurcate that portion of realized gains and losses on investments attributable to changes in foreign exchange rates from that which is due to changes in market prices. These gains and losses are included on the “Statement of operations” under “Net realized gain (loss) on investments.” The Series reports certain foreign currency
International Value Equity Series-14
Delaware VIP® International Value Equity Series
Notes to financial statements (continued)
related transactions as components of realized gains (losses) for financial reporting purposes, whereas such components are treated as ordinary income (loss) for federal income tax purposes.
Use of Estimates – The preparation of financial statements in conformity with US GAAP requires management to make estimates and assumptions that affect the fair value of investments, the reported amounts of assets and liabilities and disclosure of contingent assets and liabilities at the date of the financial statements, and the reported amounts of revenues and expenses during the reporting period. Actual results could differ from those estimates and the differences could be material.
Other – Expenses directly attributable to the Series are charged directly to the Series. Other expenses common to various funds within the Delaware Funds® by Macquarie (Delaware Funds) are generally allocated among such funds on the basis of average net assets. Management fees and certain other expenses are paid monthly. Security transactions are recorded on the date the securities are purchased or sold (trade date) for financial reporting purposes. Costs used in calculating realized gains and losses on the sale of investment securities are those of the specific securities sold. Dividend income is recorded on theex-dividend date and interest income is recorded on the accrual basis. Discounts and premiums on debt securities are accreted or amortized to interest income, respectively, over the lives of the respective securities using the effective interest method. Taxablenon-cash dividends are recorded as dividend income. Foreign dividends are also recorded on theex-dividend date or as soon after theex-dividend date that the Series is aware of such dividends, net of all tax withholdings, a portion of which may be reclaimable. Withholding taxes and reclaims on foreign dividends have been recorded in accordance with the Series’ understanding of the applicable country’s tax rules and rates. The Series declares and pays dividends from net investment income and distributions from net realized gain on investments, if any, following the close of the fiscal year. The Series may distribute more frequently, if necessary for tax purposes. Dividends and distributions, if any, are recorded on theex-dividend date.
The Series receives earnings credits from its custodian when positive cash balances are maintained, which may be used to offset custody fees. The expenses paid under this arrangement are included on the “Statement of operations” under “Custodian fees” with the corresponding expenses offset included under “Less expenses paid indirectly.” For the year ended Dec. 31, 2019, the Series earned $8 under this arrangement.
The Series receives earnings credits from its transfer agent when positive cash balances are maintained, which may be used to offset transfer agent fees. If the amount earned is greater than $1, the expenses paid under this arrangement are included on the “Statement of operations” under “Dividend disbursing and transfer agent fees and expenses” with the corresponding expenses offset included under “Less expenses paid indirectly.” For the year ended Dec. 31, 2019, the Series earned $2 under this arrangement.
2. Investment Management, Administration Agreements, and Other Transactions with Affiliates
In accordance with the terms of its investment management agreement, the Series pays Delaware Management Company (DMC), a series of Macquarie Investment Management Business Trust and the investment manager, an annual fee which is calculated daily and paid monthly at the rates of 0.85% on the first $500 million of average daily net assets of the Series, 0.80% on the next $500 million, 0.75% on the next $1.5 billion, and 0.70% on average daily net assets in excess of $2.5 billion.
DMC has contractually agreed to waive all or a portion of its investment advisory fees and/or pay/reimburse expenses (excluding any12b-1 fee, acquired fund fees and expenses, taxes, interest, short sale and dividend interest expenses, brokerage fees, certain insurance costs, and nonroutine expenses or costs, including, but not limited to, those relating to reorganizations, litigation, conducting shareholder meetings, and liquidations) in order to prevent annual series operating expenses from exceeding 1.04% of the Series’ average daily net assets from Jan. 1, 2019 through Dec. 31, 2019.* This waiver and reimbursement may only be terminated by agreement of DMC and the Series. The waiver and reimbursement are accrued daily and received monthly.
Effective May 30, 2019, DMC may permit its affiliates, Macquarie Investment Management Global Limited (MIMGL) and Macquarie Funds Management Hong Kong Limited (together, the “AffiliatedSub-Advisors”), to execute Fund equity security trades on behalf of the Manager. The Manager may also seek quantitative support from MIMGL. Although the AffiliatedSub-Advisors serve assub-advisors, DMC has ultimate responsibility for all investment advisory services. For these services, DMC, not the Fund, may pay each AffiliatedSub-Advisor a portion of its investment management fee.
Delaware Investments Fund Services Company (DIFSC), an affiliate of DMC, provides fund accounting and financial administration oversight services to the Series. For these services, DIFSC’s fees are calculated daily and paid monthly based on the aggregate daily net assets of all funds within the Delaware Funds at the following annual rates: 0.00475% of the first $35 billion; 0.0040% of the next $10 billion; and 0.0025% of aggregate average daily net assets in excess of $45 billion (Total Fee). Each Fund in the Delaware Funds pays a minimum of $4,000, which, in aggregate, is subtracted from the Total Fee. Each fund then pays its portion of the remainder of the Total Fee on a relative NAV basis. This amount is included on the “Statement of operations” under “Accounting and administration expenses.” For the year ended Dec. 31, 2019, the Series was charged $5,800 for these services.
DIFSC is also the transfer agent and dividend disbursing agent of the Series. For these services, DIFSC’s fees are calculated daily and paid monthly at the annual rate of 0.0075% of the Series’ average daily net assets. This amount is included on the “Statement of operations” under “Dividend disbursing and transfer agent fees and expenses.” For the year ended Dec. 31, 2019, the Series was charged $3,687 for these services. Pursuant to asub-transfer agency
Emerging Markets Series-17
Delaware VIP® International Value Equity Series
Notes to financial statements (continued)
2. Investment Management, Administration Agreements, and Other Transactions with Affiliates (continued)
agreement between DIFSC and BNY Mellon Investment Servicing (US) Inc. (BNYMIS), BNYMIS provides certainsub-transfer agency services to the Series.Sub-transfer agency fees are paid by the Series and are also included on the “Statement of operations” under “Dividend disbursing and transfer agent fees and expenses.” The fees that are calculated daily and paid as invoices are received on a monthly or quarterly basis.
Pursuant to a distribution agreement and distribution plan, the Series pays Delaware Distributors, L.P. (DDLP), the distributor and an affiliate of DMC, an annual12b-1 fee of 0.30% of the average daily net assets of the Service Class shares. The fees are calculated daily and paid monthly. Standard Class shares do not pay12b-1 fees.
As provided in the investment management agreement, the Series bears a portion of the cost of certain resources shared with DMC, including the cost of internal personnel of DMC and/or its affiliates that provide legal, tax, and regulatory reporting services to the Series. For the year ended Dec. 31, 2019, the Series was charged $7,790 for internal legal, tax, and regulatory reporting services provided by DMC and/or its affiliates’ employees. This amount is included on the “Statement of operations” under “Legal fees.”
Trustees’ fees include expenses accrued by the Series for each Trustee’s retainer and meeting fees. Certain officers of DMC, DIFSC, and DDLP are officers and/or Trustees of the Trust. These officers and Trustees are paid no compensation by the Series.
*The aggregate contractual waiver period covering this report is from May 1, 2018 through April 30, 2020.
3. Investments
For the year ended Dec. 31, 2019, the Series made purchases and sales of investment securities other than short-term investments as follows:
| | | | |
Purchases | | $ | 66,318,571 | |
Sales | | | 66,298,744 | |
The tax cost of investments includes adjustments to net unrealized appreciation (depreciation) which may not necessarily be final tax cost basis adjustments, but approximate the tax basis unrealized gains and losses that may be realized and distributed to shareholders. At Dec. 31, 2019, the cost and unrealized appreciation (depreciation) of investments in the Series for federal income tax purposes were as follows:
| | | | | | |
Cost of Investments | | Aggregate
Unrealized
Appreciation
of Investments | | Aggregate
Unrealized
Depreciation
of Investments | | Net Unrealized
Appreciation
of Investments |
| $50,761,555 | | $3,688,261 | | $(1,794,003) | | $1,894,258 |
US GAAP defines fair value as the price that the Series would receive to sell an asset or pay to transfer a liability in an orderly transaction between market participants at the measurement date under current market conditions. A three-level hierarchy for fair value measurements has been established based upon the transparency of inputs to the valuation of an asset or liability. Inputs may be observable or unobservable and refer broadly to the assumptions that market participants would use in pricing the asset or liability. Observable inputs reflect the assumptions market participants would use in pricing the asset or liability based on market data obtained from sources independent of the reporting entity. Unobservable inputs reflect the reporting entity’s own assumptions about the assumptions that market participants would use in pricing the asset or liability based on the best information available under the circumstances. The Series’ investment in its entirety is assigned a level based upon the observability of the inputs which are significant to the overall valuation. The three-level hierarchy of inputs is summarized below.
| | | | |
| Level 1 | | – | | Inputs are quoted prices in active markets for identical investments. (Examples: equity securities,open-end investment companies, futures contracts, and exchange-traded options contracts) |
| Level 2 | | – | | Other observable inputs, including, but not limited to: quoted prices for similar assets or liabilities in markets that are active, quoted prices for identical or similar assets or liabilities in markets that are not active, inputs other than quoted prices that are observable for the assets or liabilities (such as interest rates, yield curves, volatilities, prepayment speeds, loss severities, credit risks, and default rates) or other market-corroborated inputs. (Examples: debt securities, government securities, swap contracts, foreign currency exchange contracts, foreign securities utilizing international fair value pricing, broker-quoted securities, and fair valued securities) |
| Level 3 | | – | | Significant unobservable inputs, including the Series’ own assumptions used to determine the fair value of investments. (Examples: broker-quoted securities and fair valued securities) |
Level 3 investments are valued using significant unobservable inputs. The Series may also use an income-based valuation approach in which the anticipated future cash flows of the investment are discounted to calculate fair value. Discounts may also be applied due to the nature or duration of any restrictions on the disposition of the investments. Valuations may also be based upon current market prices of securities that are comparable in coupon,
Emerging Markets Series-18
Delaware VIP® International Value Equity Series
Notes to financial statements (continued)
rating, maturity, and industry. The derived value of a Level 3 investment may not represent the value which is received upon disposition and this could impact the results of operations.
The following table summarizes the valuation of the Series’ investments by fair value hierarchy levels as of Dec. 31, 2019:
| | | | | | | | | | | | |
Securities | | Level 1 | | | Level 2 | | | Total | |
Assets: | | | | | | | | | | | | |
Common Stock | | | | | | | | | | | | |
Denmark | | | — | | | | 3,417,822 | | | | 3,417,822 | |
France | | | 12,877,498 | | | | — | | | | 12,877,498 | |
Germany | | | 835,427 | | | | 2,529,116 | | | | 3,364,543 | |
Ireland | | | 727,786 | | | | — | | | | 727,786 | |
Japan | | | — | | | | 10,942,037 | | | | 10,942,037 | |
Netherlands | | | 3,632,206 | | | | — | | | | 3,632,206 | |
Sweden | | | — | | | | 2,008,583 | | | | 2,008,583 | |
Switzerland | | | — | | | | 7,799,329 | | | | 7,799,329 | |
United Kingdom | | | 5,084,469 | | | | — | | | | 5,084,469 | |
Exchange-Traded Funds | | | 1,240,636 | | | | — | | | | 1,240,636 | |
Securities Lending Collateral | | | — | | | | 1,560,897 | | | | 1,560,897 | |
| | | | | | | | | | | | |
Total Value of Securities | | $ | 24,398,022 | | | $ | 28,257,784 | | | $ | 52,655,806 | |
| | | | | | | | | | | | |
| | | |
Derivatives* | | | | | | | | | | | | |
Assets: | | | | | | | | | | | | |
Foreign Currency Exchange Contracts | | $ | — | | | $ | 7 | | | $ | 7 | |
*Foreign currency exchange contracts are valued at the unrealized appreciation (depreciation) on the instrument at the year end.
As a result of utilizing international fair value pricing at Dec. 31, 2019, a portion of the common stock in the portfolio was categorized as Level 2.
During the year ended Dec. 31, 2019, there were no transfers between Level 1 investments, Level 2 investments, or Level 3 investments that had a significant impact to the Series. This does not include transfers between Level 1 investments and Level 2 investments due to the Series utilizing international fair value pricing during the year. In accordance with the fair valuation procedures described in Note 1, international fair value pricing of securities in the Series’ occurs when market volatility exceeds an established rolling threshold. If the threshold is exceeded on a given date, then prices of international securities (those that traded on exchanges that close at a different time than the time that the Series’ NAV is determined) are established using a separate pricing feed from a third-party vendor designed to establish a price for each such security as of the time that the Series’ NAV is determined. Further, international fair value pricing uses other observable market-based inputs in place of the closing exchange price due to the events occurring after the close of the exchange or market on which the investment is principally traded, causing a change in classification between levels. The Series’ policy is to recognize transfers between levels based on fair value at the beginning of the reporting period.
A reconciliation of Level 3 investments is presented when the Series has a significant amount of Level 3 investments at the beginning, interim, or end of the year in relation to net assets. During the year ended Dec. 31, 2019, there were no Level 3 investments.
Emerging Markets Series-19
Delaware VIP® International Value Equity Series
Notes to financial statements (continued)
4. Dividend and Distribution Information
Income and long-term capital gain distributions are determined in accordance with federal income tax regulations, which may differ from US GAAP. Additionally, distributions from net gains on foreign currency transactions and net short-term gains on sales of investment securities are treated as ordinary income for federal income tax purposes. The tax character of dividends and distributions paid during the years ended Dec. 31, 2019 and 2018 was as follows:
| | | | | | | | |
| | | Year ended | |
| | | 12/31/19 | | | 12/31/18 | |
Ordinary income | | | $1,074,943 | | | | $1,396,169 | |
Long-term capital gain | | | 838,034 | | | | — | |
| | | | | | | | |
Total | | | $1,912,977 | | | | $1,396,169 | |
| | | | | | | | |
5. Components of Net Assets on a Tax Basis
As of Dec. 31, 2019, the components of net assets on a tax basis were as follows:
| | | | |
| |
Shares of beneficial interest | | $ | 46,446,821 | |
Undistributed ordinary income | | | 820,086 | |
Undistributed long-term capital gains | | | 2,039,416 | |
Net unrealized appreciation on investments, foreign currencies, and derivatives | | | 1,894,258 | |
| | | | |
Net assets | | $ | 51,200,581 | |
| | | | |
6. Capital Shares
Transactions in capital shares were as follows:
| | | | | | | | |
| | | Year ended | |
| | | 12/31/19 | | | 12/31/18 | |
Shares sold: | | | | | | | | |
Standard Class | | | 259,029 | | | | 352,272 | |
Service Class | | | 22,673 | | | | 25,616 | |
Shares issued upon reinvestment of dividends and distributions: | | | | | | | | |
Standard Class | | | 161,718 | | | | 107,041 | |
Service Class | | | 2,350 | | | | 856 | |
| | | | | | | | |
| | | 445,770 | | | | 485,785 | |
| | | | | | | | |
Shares redeemed: | | | | | | | | |
Standard Class | | | (365,370 | ) | | | (266,457 | ) |
Service Class | | | (17,369 | ) | | | (3,703 | ) |
| | | | | | | | |
| | | (382,739 | ) | | | (270,160 | ) |
| | | | | | | | |
Net increase | | | 63,031 | | | | 215,625 | |
| | | | | | | | |
7. Line of Credit
The Series, along with certain other funds in the Delaware Funds (Participants), was a participant in a $220,000,000 revolving line of credit intended to be used for temporary or emergency purposes as an additional source of liquidity to fund redemptions of investor shares. Under the agreement, the Participants were charged an annual commitment fee of 0.15%, which was allocated across the Participants based on a weighted average of the respective net assets of each Participant. The Participants were permitted to borrow up to a maximum ofone-third of their net assets under the agreement. Each Participant was individually, and not jointly, liable for its particular advances, if any, under the line of credit. The line of credit available under the agreement expired on Nov. 4, 2019.
On Nov. 4, 2019, the Participants entered into an amendment to the agreement for a $250,000,000 revolving line of credit. The revolving line of credit is to be used as described above and operates in substantially the same manner as the original agreement. The line of credit available under the agreement expires on Nov. 2, 2020.
The Series had no amounts outstanding as of Dec. 31, 2019, or at any time during the year then ended.
Emerging Markets Series-20
Delaware VIP® International Value Equity Series
Notes to financial statements (continued)
8. Derivatives
US GAAP requires disclosures that enable investors to understand: (1) how and why an entity uses derivatives; (2) how they are accounted for; and (3) how they affect an entity’s results of operations and financial position.
Foreign Currency Exchange Contracts
The Series may enter into foreign currency exchange contracts and foreign cross currency exchange contracts as a way of managing foreign exchange rate risk. The Series may enter into these contracts to fix the US dollar value of a security that it has agreed to buy or sell for the period between the date the trade was entered into and the date the security is delivered and paid for. The Series may also use these contracts to hedge the US dollar value of securities it already owns that are denominated in foreign currencies. In addition, the Series may enter into these contracts to facilitate or expedite the settlement of portfolio transactions. The change in value is recorded as an unrealized gain or loss. When the contract is closed, a realized gain or loss is recorded equal to the difference between the value of the contract at the time it was opened and the value at the time it was closed.
The use of foreign currency exchange contracts and foreign cross currency exchange contracts does not eliminate fluctuations in the underlying prices of the securities, but does establish a rate of exchange that can be achieved in the future. Although foreign currency exchange contracts and foreign cross currency exchange contracts limit the risk of loss due to an unfavorable change in the value of the hedged currency, they also limit any potential gain that might result should the value of the currency change favorably. In addition, the Series could be exposed to risks if the counterparties to the contracts are unable to meet the terms of their contracts. The Series’ maximum risk of loss from counterparty credit risk is the value of its currency exchanged with the counterparty. The risk is generally mitigated by having a netting arrangement between the Series and the counterparty and by the posting of collateral by the counterparty to the Series to cover the Series’ exposure to the counterparty.
During the year ended Dec. 31, 2019, the Series entered into foreign currency exchange contracts and foreign cross currency exchange contracts to fix the US dollar value of a security between trade date and settlement date and to facilitate or expedite the settlement of portfolio transactions.
During the year ended Dec. 31, 2019, the Series experienced net realized gains or losses attributable to foreign currency holdings, which is disclosed on the “Statement of assets and liabilities” and “Statement of operations.”
The table below summarizes the average balance of derivative holdings by the Series during the year ended Dec. 31, 2019.
| | | | |
| | | Long Derivatives | | Short Derivatives |
| | | Volume | | Volume |
Foreign currency exchange contracts
(Average notional value) | | $328,854 | | $296,654 |
9. Offsetting
The Series entered into an International Swaps and Derivatives Association, Inc. Master Agreement (ISDA Master Agreement) or a similar agreement with certain of its derivative contract counterparties in order to better define its contractual rights and to secure rights that will help the Series mitigate its counterparty risk. An ISDA Master Agreement is a bilateral agreement between the Series and a counterparty that governs certainover-the-counter (OTC) derivatives and foreign exchange contracts and typically contains, among other things, collateral posting items and netting provisions in the event of a default and/or termination event. Under an ISDA Master Agreement, the Series may, under certain circumstances, offset with the counterparty certain derivative financial instrument’s payables and/or receivables with collateral held and/or posted and create one single net payment. The provisions of the ISDA Master Agreement typically permit a single net payment in the event of default(close-out), including the bankruptcy or insolvency of the counterparty. However, bankruptcy or insolvency laws of a particular jurisdiction may impose restrictions on or prohibitions against the right of offset in bankruptcy, insolvency, or other events.
For financial reporting purposes, the Series does not offset derivative assets and derivative liabilities that are subject to netting arrangements on the “Statement of assets and liabilities.”
At Dec. 31, 2019, the Series had the following assets and liabilities subject to offsetting provisions:
Offsetting of Financial Assets and Liabilities and Derivatives Assets and Liabilities
| | | | | | |
Counterparty | | Gross Value of
Derivative Asset | | Gross Value of
Derivative Liability | | Net Position |
BNY Mellon | | $7 | | $— | | $7 |
International Value Equity Series-19
Delaware VIP® International Value Equity Series
Notes to financial statements (continued)
| | | | | | | | | | | | |
Counterparty | | Net Position | | Fair Value of
Non-Cash
Collateral Received(a) | | Cash Collateral
Received | | Fair Value of
Non-Cash
Collateral Pledged | | Cash Collateral
Pledged | | Net Exposure(b) |
BNY Mellon | | $7 | | $— | | $— | | $— | | $— | | $7 |
Securities Lending
Securities lending transactions are entered into by the Series under master securities lending agreements (each, an “MSLA”) which provide the right, in the event of default (including bankruptcy or insolvency), for thenon-defaulting party to liquidate the collateral and calculate a net exposure to the defaulting party or request additional collateral. In the event that a borrower defaults, the Series, as lender, would offset the market value of the collateral received against the market value of the securities loaned. When the value of the collateral is greater than that of the market value of the securities loaned, the lender is left with a net amount payable to the defaulting party. However, bankruptcy or insolvency laws of a particular jurisdiction may impose restrictions on or prohibitions against such a right of offset in the event of an MLSA counterparty’s bankruptcy or insolvency. Under the MSLA, the borrower can resell orre-pledge the loaned securities, and the Series can reinvest cash collateral, or, upon an event of default, resell, orre-pledge the collateral (see also Note 8).
As of Dec. 31, 2019, the following table is a summary of the Series securities lending agreement by counterparty which are subject to offset under an MSLA:
| | | | | | | | | | |
Counterparty | | Securities Loaned
at Value | | Cash Collateral
Received -
Invested in Securities(a) | | Fair Value of
Non-Cash Collateral
Received | | Net Collateral
Received | | Net
Exposure(b) |
BNY Mellon | | $4,117,820 | | $1,281,465 | | $2,836,355 | | $4,117,820 | | $— |
(a)The value of the related collateral received exceeded the value of the securities loaned at value, as applicable, as of Dec. 31, 2019.
(b)Net exposure represents the receivable (payable) that would be due from (to) the counterparty in the event of default.
10. Securities Lending
The Series, along with other funds in the Delaware Funds, may lend its securities pursuant to a security lending agreement (Lending Agreement) with The Bank of New York Mellon (BNY Mellon). At the time a security is loaned, the borrower must post collateral equal to the required percentage of the market value of the loaned security, including any accrued interest. The required percentage is: (1) 102% with respect to US securities and foreign securities that are denominated and payable in US dollars; and (2) 105% with respect to foreign securities. With respect to each loan, if on any business day, the aggregate market value of securities collateral plus cash collateral held is less than the aggregate market value of the securities which are the subject of such loan, the borrower will be notified to provide additional collateral by the end of the following business day, which, together with the collateral already held, will be not less than the applicable initial collateral requirements for such security loan. If the aggregate market value of securities collateral and cash collateral held with respect to a security loan exceeds the applicable initial collateral requirement, upon the request of the borrower, BNY Mellon must return enough collateral to the borrower by the end of the following business day to reduce the value of the remaining collateral to the applicable initial collateral requirement for such security loan. As a result of the foregoing, the value of the collateral held with respect to a loaned security on any particular day, may be more or less than the value of the security on loan. The collateral percentage with respect to the market value of the loaned security is determined by the security lending agent.
Cash collateral received by each series of the Trust is generally invested in a series of individual separate accounts, each corresponding to a series. The investment guidelines permit each separate account to hold certain securities that would be considered eligible securities for a money market fund. Cash collateral received is generally invested in government securities; certain obligations issued by government sponsored enterprises; repurchase agreements collateralized by US Treasury securities; obligations issued by the central government of any Organization for Economic Cooperation and Development (OECD) country or its agencies, instrumentalities, or establishments; obligations of supranational organizations; commercial paper, notes, bonds, and other debt obligations; certificates of deposit, time deposits, and other bank obligations; and asset-backed securities as disclosed on the “Schedule of Investments.” Securities purchased with cash collateral are valued at the market value. The Series can also accept US government securities and letters of credit(non-cash collateral) in connection with securities loans.
In the event of default or bankruptcy by the lending agent, realization and/or retention of the collateral may be subject to legal proceedings. In the event the borrower fails to return loaned securities and the collateral received is insufficient to cover the value of the loaned securities and provided such collateral shortfall is not the result of investment losses, the lending agent has agreed to pay the amount of the shortfall to the Series or, at the discretion of the lending agent, replace the loaned securities. The Series continues to record dividends or interest, as applicable, on the securities loaned and is subject to changes in value of the securities loaned that may occur during the term of the loan. The Series has the right under the Lending Agreement to recover the securities from the borrower on demand. With respect to security loans collateralized bynon-cash collateral, the Series receives loan premiums paid by the
International Value Equity Series-20
Delaware VIP® International Value Equity Series
Notes to financial statements (continued)
10. Securities Lending (continued)
borrower. With respect to security loans collateralized by cash collateral, the earnings from the collateral investments are shared among the Series, the security lending agent, and the borrower. The Series records security lending income net of allocations to the security lending agent and the borrower.
The Series may incur investment losses as a result of investing securities lending collateral. This could occur if an investment in the collateral investment account defaulted or became impaired. Under those circumstances, the value of the Series’ cash collateral account may be less than the amount the Series would be required to return to the borrowers of the securities and the Series would be required to make up for this shortfall.
The following table reflects a breakdown of transactions in securities lending collateral accounted for as secured borrowings, the gross obligation by the type of collateral pledged, and the remaining contractual maturity of those transactions as of Dec. 31, 2019:
Remaining Contractual Maturity of the Agreements as of Dec. 31, 2019
| | | | | | | | | | |
Securities Lending Transactions | | Overnight
and
Continuous | | Under
30 days | | Between
30 and 90 days | | Over
90 days | | Total |
Certificates of Deposits and Repurchase Agreements | | $1,560,897 | | $ — | | $ — | | $ — | | $1,560,897 |
At Dec. 31, 2019, the value of securities on loan was $4,117,820 for which the Series received cash collateral of $1,560,897 andnon-cash collateral of $2,836,355. At Dec. 31, 2019, the value of invested collateral was $1,560,897. Investments purchased with cash collateral are presented on the “Schedule of investments” under the caption “Securities Lending Collateral.”
11. Credit and Market Risk
Some countries in which the Series may invest require governmental approval for the repatriation of investment income, capital, or the proceeds of sales of securities by foreign investors. In addition, if there is deterioration in a country’s balance of payments or for other reasons, a country may impose temporary restrictions on foreign capital remittances abroad.
The securities exchanges of certain foreign markets are substantially smaller, less liquid, and more volatile than the major securities markets in the US. Consequently, acquisition and disposition of securities by the Series may be inhibited. In addition, a significant portion of the aggregate market value of equity securities listed on the major securities exchanges in emerging markets is held by a smaller number of investors. This may limit the number of shares available for acquisition or disposition by the Series.
The Series may invest up to 10% of its net assets in illiquid securities, which may include securities with contractual restrictions on resale, securities exempt from registration under Rule 144A promulgated under the Securities Act of 1933, as amended, and other securities which may not be readily marketable. The relative illiquidity of these securities may impair the Series from disposing of them in a timely manner and at a fair price when it is necessary or desirable to do so. While maintaining oversight, the Board has delegated to DMC theday-to-day functions of determining whether individual securities are liquid for purposes of the Series’ limitation on investments in illiquid securities. Securities eligible for resale pursuant to Rule 144A, which are determined to be liquid, are not subject to the Series’ 10% limit on investments in illiquid securities. As of Dec. 31, 2019, there were no Rule 144A securities held by the Series.
12. Contractual Obligations
The Series enters into contracts in the normal course of business that contain a variety of indemnifications. The Series’ maximum exposure under these arrangements is unknown. However, the Series has not had prior claims or losses pursuant to these contracts. Management has reviewed the Series’ existing contracts and expects the risk of loss to be remote.
13. Recent Accounting Pronouncements
In August 2018, the FASB issued an Accounting Standards Update (ASU), ASU2018-13, which changes certain fair value measurement disclosure requirements. ASU2018-13, in addition to other modifications and additions, removes the requirement to disclose the amount and reasons for transfers between Level 1 and Level 2 of the fair value hierarchy, the policy for the timing of transfers between levels and the valuation process for Level 3 fair value measurements. ASU2018-13 is effective for fiscal years, and interim periods within those fiscal years, beginning after Dec. 15, 2019. At this time, management is evaluating the implications of these changes on the financial statements.
14. Subsequent Events
Management has determined that no material events or transactions occurred subsequent to Dec. 31, 2019, that would require recognition or disclosure in the Series’ financial statements.
International Value Equity Series-21
Delaware VIP® Trust — Delaware VIP International Value Equity Series
Report of independent registered public accounting firm
To the Board of Trustees of Delaware VIP® Trust and Shareholders of Delaware VIP International Value Equity Series
Opinion on the Financial Statements
We have audited the accompanying statement of assets and liabilities, including the schedule of investments, of Delaware VIP International Value Equity Series (one of the series constituting Delaware VIP® Trust, referred to hereafter as the “Series”) as of December 31, 2019, the related statement of operations for the year ended December 31, 2019, the statements of changes in net assets for each of the two years in the period ended December 31, 2019, including the related notes, and the financial highlights for each of the five years in the period ended December 31, 2019 (collectively referred to as the “financial statements”). In our opinion, the financial statements present fairly, in all material respects, the financial position of the Series as of December 31, 2019, the results of its operations for the year then ended, the changes in its net assets for each of the two years in the period ended December 31, 2019 and the financial highlights for each of the five years in the period ended December 31, 2019 in conformity with accounting principles generally accepted in the United States of America.
Basis for Opinion
These financial statements are the responsibility of the Series’ management. Our responsibility is to express an opinion on the Series’ financial statements based on our audits. We are a public accounting firm registered with the Public Company Accounting Oversight Board (United States) (PCAOB) and are required to be independent with respect to the Series in accordance with the U.S. federal securities laws and the applicable rules and regulations of the Securities and Exchange Commission and the PCAOB.
We conducted our audits of these financial statements in accordance with the standards of the PCAOB. Those standards require that we plan and perform the audit to obtain reasonable assurance about whether the financial statements are free of material misstatement, whether due to error or fraud.
Our audits included performing procedures to assess the risks of material misstatement of the financial statements, whether due to error or fraud, and performing procedures that respond to those risks. Such procedures included examining, on a test basis, evidence regarding the amounts and disclosures in the financial statements. Our audits also included evaluating the accounting principles used and significant estimates made by management, as well as evaluating the overall presentation of the financial statements. Our procedures included confirmation of securities owned as of December 31, 2019 by correspondence with the custodian and brokers. We believe that our audits provide a reasonable basis for our opinion.
/s/PricewaterhouseCoopers LLP
Philadelphia, Pennsylvania
February 21, 2020
We have served as the auditor of one or more investment companies in Delaware Funds® by Macquarie since 2010.
International Value Equity Series-22
Delaware VIP® Trust — Delaware VIP International Value Equity Series
Other Series information (Unaudited)
Board consideration of Investment Advisory andSub-Advisory Agreements for Delaware VIP International Value Equity Series at a meeting held August21-22, 2019
At a meeting held on Aug.21-22, 2019 (the “Annual Meeting”), the Board of Trustees (the “Board”), including a majority of disinterested or independent Trustees, approved the renewal of the investment advisory andsub-advisory agreements for Delaware VIP International Value Equity Series (the “Series”). In making its decision, the Board considered information furnished at regular quarterly Board meetings, including reports detailing Series performance, investment strategies, and expenses, as well as information prepared specifically in connection with the renewal of the investment advisory andsub-advisory contracts. Information furnished specifically in connection with the renewal of the Investment Management Agreement with Delaware Management Company (“DMC”), a series of Macquarie Investment Management Business Trust (“MIMBT”) and theSub-Advisory Agreements with Macquarie Funds Management Hong Kong Limited (“MFMHK”) and Macquarie Investment Management Global Limited (“MIMGL”), included materials provided by DMC and its affiliates (collectively, “Macquarie Investment Management”), MFMHK, and MIMGL, concerning, among other things, the nature, extent, and quality of services provided to the Series; the costs of such services to the Series; economies of scale; and the investment manager’s financial condition and profitability. In addition, in connection with the Annual Meeting, materials were provided to the Trustees in May 2019, including reports provided by Broadridge Financial Solutions (“Broadridge”). The Broadridge reports compared the Series’ investment performance and expenses with those of other comparable mutual funds. The Independent Trustees reviewed and discussed the Broadridge reports with independent legal counsel to the Independent Trustees. In addition to the information noted above, the Board also requested and received information regarding DMC’s policy with respect to advisory fee levels and its breakpoint philosophy; the structure of portfolio manager compensation; comparative client fee information; and any constraints or limitations on the availability of securities for certain investment styles, which had in the past year inhibited, or which were likely in the future to inhibit, the investment manager’s ability to invest fully in accordance with Series policies.
In considering information relating to the approval of the Series’ investment advisory andsub-advisory agreements, the Independent Trustees received assistance and advice from and met separately with independent legal counsel to the Independent Trustees and also received assistance and advice from an experienced and knowledgeable independent fund consultant, JDL Consultants, LLC (“JDL”). Although the Board gave attention to all information furnished, the following discussion identifies, under separate headings, the primary factors taken into account by the Board during its contract renewal considerations.
Nature, extent, and quality of services.The Board considered the services provided by DMC to the Series and its shareholders. In reviewing the nature, extent, and quality of services, the Board considered reports furnished to it throughout the year, which covered matters such as the relative performance of the Series; compliance of portfolio managers with the investment policies, strategies, and restrictions for the Series; compliance by DMC and Delaware Distributors, L.P. (together, “Management”) personnel with the Code of Ethics adopted throughout the Delaware Funds® by Macquarie (the “Delaware Funds”); and adherence to fair value pricing procedures as established by the Board. The Board was pleased with the current staffing of DMC and the emphasis placed on research in the investment process. The Board recognized DMC’s receipt of certain favorable industry distinctions during the past several years. The Board gave favorable consideration to DMC’s efforts to control expenses while maintaining service levels committed to Series matters. The Board was satisfied with the nature, extent, and quality of the overall services provided by DMC.
Nature, extent, and quality of services.The Board considered the services provided by MFMHK to the Series and its shareholders. In reviewing the nature, extent, and quality of services, the Board considered reports furnished to it throughout the year at regular Board Meetings covering matters such as relative performance of the Series; compliance of portfolio managers with the investment policies, strategies. and restrictions for the Series; the compliance of MFMHK personnel with its Code of Ethics; and adherence to fair value pricing procedures as established by the Board. The Board was pleased with the current staffing of MFMHK and the emphasis placed on research in the investment process. The Board was satisfied with the nature, extent, and quality of the overall services provided by MFMHK.
Nature, extent, and quality of services.The Board considered the services provided by MIMGL to the Series and its shareholders. In reviewing the nature, extent, and quality of services, the Board considered reports furnished to it throughout the year at regular Board Meetings covering matters such as relative performance of the Series; compliance of portfolio managers with the investment policies, strategies, and restrictions for the Series; the compliance of MIMGL personnel with its Code of Ethics; and adherence to fair value pricing procedures as established by the Board. The Board was pleased with the current staffing of MIMGL and the emphasis placed on research in the investment process. The Board was satisfied with the nature, extent, and quality of the overall services provided by MIMGL.
Investment performance.The Board placed significant emphasis on the investment performance of the Series in view of the importance of investment performance to shareholders. Although the Board considered performance reports and discussions with portfolio managers at Board meetings throughout the year, the Board gave particular weight to the Broadridge reports furnished for the Annual Meeting. The Broadridge reports prepared for the Series showed the investment performance of its Standard Class shares in comparison to a group of similar funds as selected by Broadridge (the “Performance Universe”). A fund with the best performance ranked first, and a fund with the poorest performance ranked last. The highest/best performing 25% of funds in the Performance Universe make up the first quartile; the next 25%, the second quartile; the next 25%, the third quartile; and the poorest/worst
International Value Equity Series-23
Delaware VIP® Trust — Delaware VIP International Value Equity Series
Other Series information (Unaudited)
Board consideration of Investment Advisory andSub-Advisory Agreements for Delaware VIP International Value Equity Series at a meeting held August21-22, 2019 (continued)
performing 25% of funds in the Performance Universe make up the fourth quartile. Comparative annualized performance for the Series was shown for the past1-,3-,5-, and10-year periods, as applicable, ended Jan. 31, 2019. The Board’s objective is that the Series’ performance for the1-,3-, and5-year periods be at or above the median of its Performance Universe.
The Performance Universe for the Series consisted of the Series and all internationalmulti-cap value funds underlying variable insurance products as selected by Broadridge. The Broadridge report comparison showed that the Series’ total return for the1- and3-year periods was in the third quartile of its Performance Universe. The report further showed that the Series’ total return for the5- and10-year periods was in the second quartile of its Performance Universe. The Board was satisfied with performance.
Comparative expenses.The Board considered expense data for the Delaware Funds. Management provided the Board with information on pricing levels and fee structures for the Series as of its most recently completed fiscal year. The Board also focused on the comparative analysis of effective management fees and total expense ratios of the Series versus effective management fees and expense ratios of a group of similar funds as selected by Broadridge (the “Expense Group”). In reviewing comparative costs, the Series’ contractual management fee and the actual management fee incurred by the Series were compared with the contractual management fees (assuming all funds in the Expense Group were similar in size to the Series) and actual management fees (as reported by each fund) within the Expense Group, taking into account any applicable breakpoints and fee waivers. The Series’ total expenses were also compared with those of its Expense Group. The Broadridge total expenses, for comparative consistency, were shown by Broadridge for Standard Class shares which do not charge12b-1 andnon-12b-1 service fees. The Board’s objective is for each Series’ total expense ratio to be competitive with those of the peer funds within its Expense Group.
The expense comparisons for the Series showed that the actual management fee was in the quartile with the highest expenses of its Expense Group and its total expenses were in the quartile with the second highest expenses of its Expense Group. The Series’ total expenses were not in line with the Board’s objective. In evaluating total expenses, the Board considered fee waivers in place through April 2020 and various initiatives implemented by Management, such as the negotiation of lower fees for fund accounting, fund accounting oversight and custody services, which had created an opportunity for a further reduction in expenses. The Board was satisfied with Management’s efforts to improve the Series’ total expense ratio and to bring it in line with the Board’s objective.
Management profitability.The Board considered the level of profits realized by DMC in connection with the operation of the Series. In this respect, the Board reviewed the Investment Management Profitability Analysis that addressed the overall profitability of DMC’s business in providing management and other services to each of the individual funds and the Delaware Funds as a whole. Specific attention was given to the methodology used by DMC in allocating costs for the purpose of determining profitability. Management stated that the level of profits of DMC, to a certain extent, reflects recent operational cost savings and efficiencies initiated by DMC. The Board considered DMC’s efforts to improve services provided to fund shareholders and to meet additional regulatory and compliance requirements resulting from recent industry-wide Securities and Exchange Commission initiatives. The Board also considered the extent to which DMC might derive ancillary benefits from fund operations, including the potential for procuring additional business as a result of the prestige and visibility associated with its role as service provider to the Delaware Funds and the benefits from allocation of fund brokerage to improve trading efficiencies. As part of its work, the Board also reviewed a report prepared by JDL regarding MIMBT profitability as compared to certain peer fund complexes and the Independent Trustees discussed with JDL personnel regarding DMC’s profitability in such context. The Board found that the management fees were reasonable in light of the services rendered and the profitability of DMC.
Economies of scale.The Trustees considered whether economies of scale are realized by DMC as the Series’ assets increase and the extent to which any economies of scale are reflected in the level of management fees charged. The Trustees reviewed the Series’ advisory fee pricing and structure approved by the Board and shareholders, which includes breakpoints, and which applies to most funds in the Delaware Funds complex. Breakpoints in the advisory fee occur when the advisory fee rate is reduced on assets in excess of specified levels. Breakpoints result in a lower advisory fee, than would otherwise be the case in the absence of breakpoints, when the asset levels specified in the breakpoints are exceeded. Although, as of March 31, 2019, the Series had not reached a size at which it could take advantage of any breakpoints in the applicable fee schedule, the Board recognized that the fee was structured so that, if the Series increases sufficiently in size, then economies of scale may be shared.
International Value Equity Series-24
Delaware VIP® Trust — Delaware VIP International Value Equity Series
Other Series information (Unaudited)
Tax Information
All disclosures are based on financial information available as of the date of this annual report and, accordingly are subject to change. For any and all items requiring reporting, it is the intention of the Series to report the maximum amount permitted under the Internal Revenue Code and the regulations thereunder.
For the year ended Dec. 31, 2019, the Series reports distributions paid during the year as follows:
| | | | | | |
| | | (A)
Long-Term
Captial Gain
Distributions
(Tax Basis) | | (B)
Ordinary Income
Distributions
(Tax Basis) | | Total
Distributions
(Tax Basis) |
| | 43.81% | | 56.19% | | 100.00% |
(A) and (B) are based on a percentage of the Series’ total distributions.
The Series intends to pass through foreign tax credits in the maximum amount of $83,592. The gross foreign source income earned during the fiscal year 2019 by the Series was $1,500,770.
International Value Equity Series-25
Delaware Funds® by Macquarie
Board of trustees / directors and officers addendum
A mutual fund is governed by a Board of Trustees/Directors (“Trustees”), which has oversight responsibility for the management of a fund’s business affairs. Trustees establish procedures and oversee and review the performance of the investment manager, the distributor, and others who perform services for the fund. The independent fund trustees, in particular, are advocates for shareholder interests. Each trustee has served in that capacity since he or she was elected to or appointed to the Board of Trustees, and will continue to serve until his or her retirement or the election of a new trustee in his or her place. The following is a list of the Trustees and Officers with certain background and related information.
| | | | | | | | | | |
Name, Address, and Birth Date | | Position(s) Held with Fund(s) | | Length of Time
Served | | Principal
Occupation(s)
During the Past Five Years | | Number of
Portfolios in Fund
Complex Overseen
by Trustee or Officer | | Other
Directorships
Held by Trustee or Officer |
| INTERESTED TRUSTEE | | | | | | |
| | | | | |
Shawn K. Lytle1
2005 Market Street Philadelphia, PA 19103 February 1970 | | President,
Chief Executive Officer, and Trustee | | President and Chief Executive Officer since August 2015 Trustee since
September 2015 | | President — Macquarie Investment Management2(June 2015-Present) Regional Head of Americas — UBS Global Asset Management
(April 2010-May 2015) | | 95 | | Trustee —
UBS Relationship Funds, SMA Relationship Trust, and UBS Funds
(May 2010–April 2015) |
| INDEPENDENT TRUSTEES | | | | | | |
| | | | | |
Thomas L. Bennett
2005 Market Street Philadelphia, PA 19103 October 1947 | | Chair and Trustee | | Trustee since March 2005 Chair since March 2015 | | Private Investor
(March 2004–Present) | | 95 | | None |
| | | | | |
Jerome D. Abernathy
2005 Market Street Philadelphia, PA 19103 July 1959 | | Trustee | | Since
January 2019 | | Managing Member, Stonebrook Capital Management, LLC (financial technology: macro factors and databases) (January 1993–Present) | | 95 | | None |
| | | | | |
Ann D. Borowiec
2005 Market Street Philadelphia, PA 19103 November 1958 | | Trustee | | Since
March 2015 | | Chief Executive Officer, Private Wealth Management (2011–2013) and Market Manager, New Jersey Private Bank (2005–2011) — J.P. Morgan Chase & Co. | | 95 | | Director —
Banco Santander International (October 2016–December 2019) Director —
Santander Bank, N.A. (December 2016–December 2019) |
| | | | | |
Joseph W. Chow
2005 Market Street Philadelphia, PA 19103 January 1953 | | Trustee | | Since
January 2013 | | Private Investor
(April 2011–Present) | | 95 | | Director and Audit
Committee Member — Hercules Technology Growth
Capital, Inc. (July 2004–July 2014) |
International Value Equity Series-26
| | | | | | | | | | |
Name, Address, and Birth Date | | Position(s) Held with Fund(s) | | Length of Time
Served | | Principal
Occupation(s)
During the Past Five Years | | Number of
Portfolios in Fund
Complex Overseen
by Trustee or Officer | | Other
Directorships
Held by Trustee or Officer |
| | | | | |
John A. Fry
2005 Market Street Philadelphia, PA 19103 May 1960 | | Trustee | | Since January 2001 | | President —
Drexel University (August 2010–Present) President — Franklin & Marshall College (July 2002–July 2010) | | 95 | | Director; Compensation Committee
and Governance Committee Member — Community Health Systems
(May 2004–Present) Director —
Drexel Morgan & Co.
(2015–Present) Director and Audit Committee Member — vTv Therapeutics LLC
(2017–Present) Director and Audit Committee Member — FS Credit Real Estate Income Trust, Inc. (2018–Present) Director — Federal Reserve Bank of Philadelphia (January 2020–Present) |
| | | | | |
Lucinda S. Landreth
2005 Market Street Philadelphia, PA 19103 June 1947 | | Trustee | | Since March 2005 | | Private Investor
(2004–Present) | | 95 | | None |
| | | | | |
Frances A. Sevilla-Sacasa2005 Market Street Philadelphia, PA 19103 January 1956 | | Trustee | | Since September 2011 | | Private Investor(January 2017-Present) Chief Executive Officer — Banco Itaú International
(April 2012–December 2016) Executive Advisor to Dean (August 2011–March 2012) and Interim Dean (January 2011–July 2011) — University of Miami School of Business Administration President — U.S. Trust, Bank of America Private Wealth Management (Private Banking)
(July 2007–December 2008) | | 95 | | Trust Manager and
Audit Committee
Chair — Camden
Property Trust
(August 2011–Present) Director; Strategic Planning and Reserves Committee and Nominating and Governance Committee Member — Callon Petroleum Company (December 2019–Present) Director; Audit Committee Member — Carrizo
Oil &Gas, Inc.
(March 2018–December 2019) |
| | | | | |
Thomas K. Whitford
2005 Market Street Philadelphia, PA 19103 March 1956 | | Trustee | | Since January 2013 | | Vice Chairman
(2010–April 2013) — PNC Financial Services Group | | 95 | | Director — HSBC North America Holdings Inc.(December 2013-Present) Director — HSBC USA Inc. (July 2014-Present) Director —
HSBC Bank USA, National Association(July 2014-March 2017) Director — HSBC Finance Corporation(December 2013-April 2018) |
International Value Equity Series-27
| | | | | | | | | | |
Name, Address, and Birth Date | | Position(s) Held with Fund(s) | | Length of Time
Served | | Principal
Occupation(s)
During the Past Five Years | | Number of
Portfolios in Fund
Complex Overseen
by Trustee or Officer | | Other
Directorships
Held by Trustee or Officer |
| | | | | |
Christianna Wood
2005 Market Street Philadelphia, PA 19103 March 1956 | | Trustee | | Since January 2019 | | Chief Executive Officer
and President — Gore Creek Capital, Ltd. (August 2009–Present) | | 95 | | Director; Finance Committee and Audit Committee Member — H&R Block Corporation
(July 2008–Present) Director; Chair of Investments Committee and Audit Committee Member — Grange Insurance
(2013–Present) Trustee; Chair of Nominating and Governance Committee and Audit Committee Member —
The Merger Fund
(2013–Present), The Merger Fund VL (2013–Present); WCM Alternatives: Event-Driven Fund
(2013–Present), and WCM Alternatives: Credit Event Fund
(December 2017–Present) Director; Chair of Governance Committee and Audit Committee Member — International Securities Exchange
(2010–2016) |
| | | | | |
Janet L. Yeomans
2005 Market Street Philadelphia, PA 19103 July 1948 | | Trustee | | Since April 1999 | | Vice President and Treasurer (January 2006–July 2012), Vice President — Mergers & Acquisitions (January 2003–January 2006), and Vice President and Treasurer (July 1995–January 2003) — 3M Company | | 95 | | Director; Personnel and Compensation Committee Chair; Member of Nominating, Investments, and Audit Committees for various periods throughout directorship — Okabena Company
(2009-2017) |
International Value Equity Series-28
| | | | | | | | | | |
Name, Address, and Birth Date | | Position(s) Held with Fund(s) | | Length of Time
Served | | Principal
Occupation(s)
During the Past Five Years | | Number of
Portfolios in Fund
Complex Overseen
by Trustee or Officer | | Other
Directorships
Held by Trustee or Officer |
| OFFICERS | | | | | | | | | | |
| | | | | |
David F. Connor
2005 Market Street Philadelphia, PA 19103 December 1963 | | Senior
Vice President,
General Counsel, and Secretary | | Senior Vice President, since May 2013; General Counsel since May 2015; Secretary since October 2005 | | David F. Connor has served in various capacities at different times at Macquarie Investment Management. | | 95 | | None3 |
| | | | | |
Daniel V. Geatens
2005 Market Street Philadelphia, PA 19103 October 1972 | | Vice President and Treasurer | | Vice President
and Treasurer since
October 2007 | | Daniel V. Geatens has served in various capacities at different times at Macquarie Investment Management. | | 95 | | None3 |
| | | | | |
Richard Salus
2005 Market Street Philadelphia, PA 19103 October 1963 | | Senior
Vice President and
Chief Financial
Officer | | Senior Vice President and Chief Financial Officer since November 2006 | | Richard Salus has served in various capacities at different times at Macquarie Investment Management. | | 95 | | None |
| 1 | Shawn K. Lytle is considered to be an “Interested Trustee” because he is an executive officer of the Fund’s(s’) investment advisor. |
| 2 | Macquarie Investment Management is the marketing name for Macquarie Management Holdings, Inc. and its subsidiaries, including the Fund’s(s’) investment advisor, principal underwriter, and its transfer agent. |
| 3 | David F. Connor and Daniel V. Geatens serve in similar capacities for the six portfolios of the Optimum Fund Trust, which have the same investment advisor, principal underwriter, and transfer agent as the registrant. Mr. Geatens also serves as the Chief Financial Officer of the Optimum Fund Trust and he is the Chief Financial Officer and Treasurer for Macquarie Global Infrastructure Total Return Fund Inc. |
The Statement of Additional Information for the Fund(s) includes additional information about the Trustees and Officers and is available, without charge, upon request by calling 800523-1918.
International Value Equity Series-29
| | | | |
| | The Series files its complete schedule of portfolio holdings with the Securities and Exchange Commission (SEC) for the first and third quarters of each fiscal year on FormN-Q or FormN-PORT (available for filings after March 31, 2019). The Series’ FormsN-Q or FormsN-PORT, as well as a description of the policies and procedures that the Series uses to determine how to vote proxies (if any) relating to portfolio securities, are available without charge (i) upon request, by calling 800523-1918; and (ii) on the SEC’s website at sec.gov. In addition, a description of the policies and procedures that the Series uses to determine how to vote proxies (if any) relating to portfolio securities and the Schedule of Investments included in the Series’ most recent FormN-Q or FormN-PORT are available without charge on the Series’ website at delawarefunds.com/vip/literature. The Series’ FormsN-Q and FormsN-PORT may be reviewed and copied at the SEC’s Public Reference Room in Washington, D.C.; information on the operation of the Public Reference Room may be obtained by calling 800SEC-0330. Information (if any) regarding how the Series voted proxies relating to portfolio securities during the most recently disclosed12-month period ended June 30 is available without charge (i) through the Series’ website at delawarefunds.com/proxy; and (ii) on the SEC’s website at sec.gov. | | |
| | |
| AR-VIPIVE 22465 (2/20) (1073909) | | International Value EquitySeries-30 |

Delaware VIP® Trust
Delaware VIP Limited-Term Diversified Income Series
December 31, 2019
Beginning on or about June 1, 2021, as permitted by regulations adopted by the Securities and Exchange Commission, paper copies of your Series’ shareholder reports will no longer be sent to you by mail, unless you specifically request them from the Series or from your financial intermediary, such as a broker/dealer, bank, or insurance company. Instead, you will be notified by mail each time a report is posted on the website and provided with a link to access the report.
If you already elected to receive shareholder reports electronically, you will not be affected by this change and you do not need to take any action.
You may elect to receive paper copies of all future shareholder reports free of charge. You can inform the Series that you wish to continue receiving paper copies of your shareholder reports by contacting us at 800523-1918. If you own these shares through a financial intermediary, you may contact your financial intermediary to elect to continue to receive paper copies of your shareholder reports. Your election to receive reports in paper will apply to all funds held with the Delaware Funds® by Macquarie or your financial intermediary.

Table of contents
| | | | | | | | | | |
| | | |
 | | Portfolio management review | | | 1 | | | | | |
| | | |
| | Performance summary | | | 3 | | | | | |
| | | |
| | Disclosure of Series expenses | | | 6 | | | | | |
| | | |
| | Security type / sector allocation | | | 7 | | | | | |
| | | |
| | Schedule of investments | | | 8 | | | | | |
| | | |
| | Statement of assets and liabilities | | | 15 | | | | | |
| | | |
| | Statement of operations | | | 16 | | | | | |
| | | |
| | Statements of changes in net assets | | | 16 | | | | | |
| | | |
| | Financial highlights | | | 17 | | | | | |
| | | |
| | Notes to financial statements | | | 19 | | | | | |
| | | |
| | Report of independent registered public accounting firm | | | 27 | | | | | |
| | | |
| | Other Series information | | | 28 | | | | | |
| | | |
| | Board of trustees / directors and officers addendum | | | 31 | | | | | |
| |
| | | |
| |
| | Other than Macquarie Bank Limited (MBL), none of the entities noted are authorized deposit-taking institutions for the purposes of the Banking Act 1959 (Commonwealth of Australia). The obligations of these entities do not represent deposits or other liabilities of MBL. MBL does not guarantee or otherwise provide assurance in respect of the obligations of these entities, unless noted otherwise. The Series is governed by US laws and regulations. Unless otherwise noted, views expressed herein are current as of Dec. 31, 2019, and subject to change for events occurring after such date. The Series is not FDIC insured and is not guaranteed. It is possible to lose the principal amount invested. Advisory services provided by Delaware Management Company, a series of Macquarie Investment Management Business Trust (MIMBT), a US registered investment advisor. The Series is distributed byDelaware Distributors, L.P.(DDLP), an affiliate of MIMBT and Macquarie Group Limited. Macquarie Investment Management (MIM) is the marketing name for certain companies comprising the asset management division of Macquarie Group Limited and its subsidiaries and affiliates worldwide. This material may be used in conjunction with the offering of shares in Delaware VIP® Limited-Term Diversified Income Series only if preceded or accompanied by the Series’ current prospectus or the summary prospectus. © 2020 Macquarie Management Holdings, Inc. All third-party marks cited are the property of their respective owners. | |
Delaware VIP®Trust — Delaware VIP Limited-Term Diversified Income Series
| | |
| Portfolio management review | | January 7, 2020 (Unaudited) |
The investment objective of the Series is to seek maximum total return, consistent with reasonable risk.
For the fiscal year ended Dec. 31, 2019, Delaware VIP Limited-Term Diversified Income Series (the “Series”) Standard Class shares gained 5.21%, and Service Class shares gained 4.81%. Both figures reflect all distributions reinvested. For the same period, the Series’ benchmark, the Bloomberg Barclays 1–3 Year US Government/Credit Index, advanced 4.03%.
The major theme of the Series’ fiscal year was the great monetary policy pivot. As 2019 began, the US Federal Reserve was contemplating four additional rate hikes, adding to the increases implemented in 2018. It soon became apparent, however, that further hikes were untenable. The US economy, though among the strongest globally, was no longer able to sustain a10-year interest rate above 3% or a federal funds rate in the mid-2% range.
As 2019 began, US economic indicators started to flash yellow while global financial conditions were flashing red. At the end of 2018, a sharp drop in liquidity led to a dramatic widening of credit spreads – the difference between yields on corporate bonds and yields on Treasury securities – and a significant decline in equities, reflecting the ongoing unhealthy dependence of asset prices on monetary policy. Bymid-2019, there were other signs of an impending global slowdown as well, including corporate earnings’ deceleration, the continuingUS-China trade dispute, and the ongoing Brexit drama. The growing number of populist uprisings, including those in Latin American nations, Hong Kong, and Lebanon was also significant. All of this contributed to a rise in global unease.
This prompted the Fed and central banks in Australia, Europe, and the United Kingdom to shift to a more accommodative monetary policy. In the US, after signaling a hold on further rate hikes early in 2019, the Fed terminated quantitative tightening and balance-sheet reductions. Three interest rate cuts of 0.25 percentage points each followed in August, September, and October.
The Series entered the year with a barbell positioning – a strategy that involves purchasing both short- and long-term bonds in an attempt to seek better risk adjusted returns. The anchor on the short end contained about 35% of the Series’ assets in floating-rate securities, primarily in asset-backed securities. Much of those asset-backed floaters were prime consumer receivables at the top of the capital structure in auto loans and consumer credit card loans. That anchor allows the Series to own other, somewhat more volatile, securities – particularly corporate credit – on the long end of the barbell. Because they are further out on the yield curve, they provide the opportunity to pick up income while allowing the Series to maintain a similar duration overall to the benchmark. This enables a potential yield advantage over the index without taking additional interest rate risk relative to the benchmark.
Early in the year, the Series, by design, had three times as much exposure to corporate credit as the index. This overweighting to credit risk was favorable as the Fed pivoted to a more accommodative monetary policy as it supported riskier assets. The Series’ curve position was also positive since it was beneficial to be further up the yield curve within corporate credit.
As the year progressed, valuations became less attractive. Accordingly, about halfway through the year, we reduced the Series’ corporate credit exposure from three times to two times that of the benchmark and maintained our yield advantage over the benchmark. We waited for market dynamics to shift and valuations to approach what we felt was close to their full potential before repositioning holdings as we believed the Series was positioned well for the Fed’s pivot.
The biggest driver of the Series’ relative performance was an overweight to corporate credit during a year in which investors embraced risk assets. Within corporate credit, our overweight to financials, particularly banking, added to relative performance, compounded by strong security selection within the corporate sector.
Our floating rate positions were major detractors from the Series’ relative performance as these positions produced lower-than-benchmark returns. But because the Series uses the sector as a barbell anchor, we were willing to trade off lower yields there in exchange for potentially much higher returns elsewhere. The Series’ position in mortgage-backed securities (MBS) also detracted. We had some interest-only securities andshort-end securities in place as protection in case rates rose. However, rates didn’t rise, and these securities performed quite poorly, dragging down the Series’ overall performance within mortgages. Because mortgages are anout-of-benchmark sector and underperformed the benchmark, that allocation also detracted from performance.
When we assess market risks, we consider that geopolitical concerns, including the 2020 US election, are likely to be a factor along with persistent weak global growth. Corporate credit exposure also involves some risk, in part because we’re still at full valuations. To offset that to a certain extent, the Series is maintaining high-quality duration within its Treasury holdings.
As needed, we can shift assets from corporate bonds to longer-term Treasurys. Within Treasurys, we can extend a number of shorter floating-rate securities further out while doing the reverse within corporate credit, bringing down duration there as an offset. Because we don’t want duration or interest rate movement to determine how the Series performs, we remain close to the benchmark on duration. That allows security selection within corporate credit
Limited-Term Diversified Income Series-1
Delaware VIP®Trust — Delaware VIP Limited-Term Diversified Income Series
| | |
| Portfolio management review (continued) | | January 7, 2020 (Unaudited) |
and mortgages to drive our performance going forward. We believe that’s where we can possibly gain a yield advantage without taking additional interest rate risk relative to the benchmark.
Although there certainly are risks ahead in corporate credit, we remain confident in our allocation. If the market experiences heightened volatility, we can expect the Fed to support risk assets. We believe that opportunities remain within corporate credit, particularly in higher-quality issues. For example, because banks are highly regulated, they are less exposed to event risk. Overall, the Series is much closer to neutral on a market value basis as it has become harder to find value within corporate credit.
During 2019, the Series used financial futures and high yield credit default swaps. We used financial futures to manage duration, which fluctuated regularly throughout the year. The Series used high yield credit default swaps to offset some of its high yield and bank loan exposure. As a hedge, credit default swaps averaged about 8% to 10% of the Series’ allocation throughout the year while the Series’ high yield and bank loan exposure averaged about 12%. Although the high yield credit default swaps detracted from Series performance by about 65 basis points, the net effect was just 5 basis points after considering the positive returns generated by high yield bonds and bank loans. (A basis point equals one hundredth of a percentage point.)
Unless otherwise noted, views expressed herein are current as of Dec. 31, 2019, and subject to change.
Limited-Term Diversified Income Series-2
Delaware VIP® Trust — Delaware VIP Limited-Term Diversified Income Series
Performance summary (Unaudited)
The performance quoted represents past performance and does not guarantee future results. Investment return and principal value of an investment will fluctuate so that shares, when redeemed, may be worth more or less than their original cost. Current performance may be lower or higher than the performance quoted.
Carefully consider the Series’ investment objectives, risk factors, charges, and expenses before investing. This and other information can be found in the Series’ prospectus and its summary prospectus, which may be obtained by visiting delawarefunds.com/vip/literature or calling 800523-1918. Investors should read the prospectus and the summary prospectus carefully before investing.
| | | | | | | | | | |
| Delaware VIP Limited-Term Diversified Income Series | | | | | | |
| Average annual total returns | | | | | | | | | | |
| For periods ended December 31, 2019 | | 1 year | | 3 year | | 5 year | | 10 year | | Lifetime |
Standard Class shares (commenced operations on July 28, 1988) | | +5.21% | | +2.52% | | +2.09% | | +2.11% | | +4.73% |
| | | | | | | | | | | |
Service Class shares (commenced operations on May 1, 2000) | | +4.81% | | +2.24% | | +1.81% | | +1.85% | | +3.55% |
| | | | | | | | | | | |
Bloomberg Barclays 1–3 Year US Government/Credit Index | | +4.03% | | +2.15% | | +1.67% | | +1.54% | | n/a |
Returns reflect the reinvestment of all distributions. Please see page 4 for a description of the index.
As described in the Series’ most recent prospectus, the net expense ratio for Service Class shares of the Series was 0.84%, while total operating expenses for Standard Class and Service Class shares were 0.54% and 0.84%, respectively. The management fee for Standard Class and Service Class shares was 0.48%. The Series’ investment manager, Delaware Management Company (Manager), has contractually agreed to waive all or a portion of its investment advisory fees and/or pay/reimburse expenses (excluding any12b-1 fees, acquired fund fees and expenses, taxes, interest, short sale and dividend interest expenses, brokerage fees, certain insurance costs, and nonroutine expenses or costs, including, but not limited to, those relating to reorganizations, litigation, conducting shareholder meetings, and liquidations) in order to prevent annual series operating expenses from exceeding 0.55% of the Series’ average daily net assets from April 30, 2019 through Dec. 31, 2019.* Prior to April 30, 2019, the expenses were capped at 0.56% of the Series’ average daily net assets.
The Series pays Delaware Distributors, L.P. (DDLP), the distributor and an affiliate of DMC, an annual12b-1 fee of 0.30% of the average daily net assets of the Service Class shares. Prior to May 1, 2018, DDLP had contracted to waive12b-1 fees in order to limit12b-1 fees of the Service Class shares to 0.25% of average daily net assets. These waivers and reimbursements may only be terminated by agreement of the Manager and the Series.
Earnings from a variable annuity or variable life investment compoundtax-free until withdrawal, and as a result, no adjustments were made for income taxes.
Expense limitations were in effect for both classes during certain periods shown in the Series performance table above and in the Performance of a $10,000 Investment graph on the next page.
Performance data do not reflect insurance fees related to a variable annuity or variable life investment or the deferred sales charge that would apply to certain withdrawals of investments held for fewer than eight years. Performance shown here would have been reduced if such fees were included and the expense limitation removed. For more information about fees, consult your variable annuity or variable life prospectus.
Investments in variable products involve risk.
Fixed income securities and bond portfolios can lose value, and investors can lose principal, as interest rates rise. They also may be affected by economic conditions that hinder an issuer’s ability to make interest and principal payments on its debt.
The Series may also be subject to prepayment risk, the risk that the principal of a fixed income security that is held by the Series may be prepaid prior to maturity, at the time when interest rates are lower than what the bond was paying. The Series may then have to reinvest that money at a lower interest rate.
High yielding,non-investment-grade bonds (junk bonds) involve higher risk than investment grade bonds. The high yield secondary market is particularly susceptible to liquidity problems when institutional investors, such as mutual funds and certain other financial institutions, temporarily stop buying bonds for regulatory, financial, or other reasons. In addition, a less liquid secondary market makes it more difficult for the Series to obtain precise valuations of the high yield securities in its portfolio.
The Series may invest in derivatives, which may involve additional expenses and are subject to risk, including the risk that an underlying security or securities index moves in the opposite direction from what the portfolio manager anticipated. A derivatives transaction depends upon the counterparties’ ability to fulfill their contractual obligations.
Limited-Term Diversified Income Series-3
Delaware VIP® Limited-Term Diversified Income Series
Performance summary (Unaudited) (continued)
International investments entail risks not ordinarily associated with US investments including fluctuation in currency values, differences in accounting principles, or economic or political instability in other nations. Investing in emerging markets can be riskier than investing in established foreign markets due to increased volatility and lower trading volume.
If and when the Series invests in forward foreign currency contracts or use other investments to hedge against currency risks, the Series will be subject to special risks, including counterparty risk.
Diversification may not protect against market risk.
The Series may experience portfolio turnover in excess of 100%, which could result in higher transaction costs and tax liability.
An investment in asset-backed securities may involve risks. Asset-backed securities are often backed by a pool of assets representing the obligations of a number of different parties. The rate of principal payment on asset-backed securities generally depends on the rate of principal payments received on the underlying assets.
Mortgage-backed securities are fixed income securities that represent pools of mortgages, with investors receiving principal and interest payments as the underlying mortgage loans are paid back. Many are issued and guaranteed against default by the US government or its agencies or instrumentalities, such as Freddie Mac, Fannie Mae, and Ginnie Mae. Others are issued by private financial institutions, with some fully collateralized by certificates issued or guaranteed by the US government or its agencies or instrumentalities.
LIBOR risk is the risk that potential changes related to the use of the London interbank offered rate (LIBOR) could have adverse impacts on financial instruments which reference LIBOR. The potential abandonment of LIBOR could affect the value and liquidity of instruments which reference LIBOR.
Please read both the contract and underlying prospectus for specific details regarding the product’s risk profile.
*The aggregate contractual waiver period covering this report is from May 1, 2018 through April 30, 2020.
| | | | |
| For period beginning Dec. 31, 2009, through Dec. 31, 2019 | | Starting value | | Ending value |
–– Delaware VIP Limited-Term Diversified Income Series (Standard Class) | | $10,000 | | $12,324 |
–– Bloomberg Barclays 1–3 Year US Government / Credit Index | | $10,000 | | $11,654 |
The graph shows a $10,000 investment in the Delaware VIP Limited-Term Diversified Income Series Standard Class shares for the period from Dec. 31, 2009 through Dec. 31, 2019.
Limited-Term Diversified Income Series-4
Delaware VIP® Limited-Term Diversified Income Series
Performance summary (Unaudited) (continued)
The graph also shows $10,000 invested in the Bloomberg Barclays 1–3 Year US Government/Credit Index for the period from Dec. 31, 2009 through Dec. 31, 2019. The Bloomberg Barclays 1–3 Year US Government/Credit Index is a market value-weighted index of government fixed-rate debt securities and investment grade US and foreign fixed-rate debt securities with average maturities of one to three years.
Index performance returns do not reflect any management fees, transaction costs or expenses. Indices are unmanaged and one cannot invest directly in an index.
Performance of Service Class shares will vary due to different charges and expenses.
Past performance is not a guarantee of future results.
Limited-Term Diversified Income Series-5
Delaware VIP® Trust — Delaware VIP Limited-Term Diversified Income Series
Disclosure of Series expenses
For thesix-month period from July 1, 2019 to December 31, 2019 (Unaudited)
As a shareholder of the Series, you incur ongoing costs, which may include management fees; distribution and service(12b-1) fees; and other Series expenses. This example is intended to help you understand your ongoing costs (in dollars) of investing in the Series and to compare these costs with the ongoing costs of investing in other mutual funds.
The example is based on an investment of $1,000 invested at the beginning of the period and held for the entiresix-month period from July 1, 2019 to Dec. 31, 2019.
Actual expenses
The first section of the table shown, “Actual Series return,” provides information about actual account values and actual expenses. You may use the information in this section of the table, together with the amount you invested, to estimate the expenses that you paid over the period. Simply divide your account value by $1,000 (for example, an $8,600 account value divided by $1,000 = 8.6), then multiply the result by the number in the first section under the heading entitled “Expenses Paid During Period” to estimate the expenses you paid on your account during the period.
Hypothetical example for comparison purposes
The second section of the table shown, “Hypothetical 5% return,” provides information about hypothetical account values and hypothetical expenses based on the Series’ actual expense ratio and an assumed rate of return of 5% per year before expenses, which is not the Series’ actual return. The hypothetical account values and expenses may not be used to estimate the actual ending account balance or expenses you paid for the period. You may use this information to compare the ongoing costs of investing in the Series and other funds. To do so, compare the 5% hypothetical example with the 5% hypothetical examples that appear in the shareholder reports of other funds.
Please note that the expenses shown in the table are meant to highlight your ongoing costs only. As a shareholder of the Series, you do not incur any transaction costs, such as sales charges (loads), redemption fees or exchange fees, but shareholders of other funds may incur such costs. Also, the fees related to the variable annuity investment or the deferred sales charge that could apply have not been included. Therefore, the second section of the table is useful in comparing ongoing costs only, and will not help you determine the relative total costs of owning different funds. The Series’ expenses shown in the table reflect fee waivers in effect and assume reinvestment of all dividends and distributions.
Expense analysis of an investment of $1,000
| | | | | | | | | | | | | | |
| | | Beginning
Account
Value
7/1/19 | | | Ending
Account
Value
12/31/19 | | | Annualized
Expense
Ratio | | Expenses
Paid During
Period
7/1/19 to
12/31/19* | |
Actual Series return† | | | | |
Standard Class | | | $1,000.00 | | | | $1,016.10 | | | 0.54% | | | $2.74 | |
Service Class | | | 1,000.00 | | | | 1,014.60 | | | 0.84% | | | 4.27 | |
Hypothetical 5% return(5% return before expenses) | |
Standard Class | | | $1,000.00 | | | | $1,022.48 | | | 0.54% | | | $2.75 | |
Service Class | | | 1,000.00 | | | | 1,020.97 | | | 0.84% | | | 4.28 | |
| * | “Expenses Paid During Period” are equal to the Series’ annualized expense ratio, multiplied by the average account value over the period, multiplied by 184/365 (to reflect theone-half year period). |
| † | Because actual returns reflect only the most recentsix-month period, the returns shown may differ significantly from fiscal year returns. |
In addition to the Series’ expenses reflected above, the Series also indirectly bears its portion of the fees and expenses of the investment companies (Underlying Funds) in which it invests. The table above does not reflect the expenses of the Underlying Funds.
Limited-Term Diversified Income Series-6
Delaware VIP® Trust — Delaware VIP Limited-Term Diversified Income Series
Security type / sector allocation
As of December 31, 2019 (Unaudited)
Sector designations may be different than the sector designations presented in other Series materials. The sector designations may represent the investment manager’s internal sector classifications.
| | |
| Security type / sector | | Percentage of
net assets |
Agency Collateralized Mortgage Obligations | | 0.36% |
Agency Commercial Mortgage-Backed Securities | | 0.29% |
Agency Mortgage-Backed Securities | | 15.22% |
Corporate Bonds | | 32.02% |
Banking | | 13.66% |
Basic Industry | | 0.35% |
Capital Goods | | 1.40% |
Communications | | 3.05% |
Consumer Cyclical | | 0.48% |
ConsumerNon-Cyclical | | 2.84% |
Electric | | 4.09% |
Energy | | 2.37% |
Finance Companies | | 1.54% |
Insurance | | 0.30% |
Natural Gas | | 0.14% |
Technology | | 1.80% |
Non-Agency Asset-Backed Securities | | 23.19% |
Non-Agency Collateralized Mortgage Obligations | | 0.40% |
Non-Agency Commercial Mortgage-Backed Security | | 0.03% |
Sovereign Bond | | 1.04% |
Supranational Banks | | 1.77% |
US Treasury Obligations | | 20.31% |
Preferred Stock | | 0.20% |
Short-Term Investments | | 4.66% |
Total Value of Securities | | 99.49% |
Receivables and Other Assets Net of Liabilities | | 0.51% |
Total Net Assets | | 100.00% |
Limited-Term Diversified Income Series-7
Delaware VIP® Trust — Delaware VIP Limited-Term Diversified Income Series
Schedule of investments
December 31, 2019
| | | | | | | | |
| | | Principal | | | Value | |
| | | amount° | | | (US $) | |
| |
Agency Collateralized Mortgage Obligations – 0.36% | | | | | |
Fannie Mae Connecticut Avenue Securities | | | | | | | | |
Series2017-C01 1M1 3.092% (LIBOR01M + 1.3%) 7/25/29 • | | | 86,277 | | | $ | 86,356 | |
Fannie Mae Grantor Trust | | | | | | | | |
Series2001-T5 A2 6.979% 6/19/41 • | | | 9,565 | | | | 10,818 | |
FDIC Guaranteed Notes Trust | | | | | | | | |
Series2010-S2 1A 144A 2.281% (LIBOR01M + 0.5%, Cap 10.00%, Floor 0.45%) 11/29/37 #• | | | 353,638 | | | | 353,531 | |
Freddie Mac REMICs | | | | | | | | |
Series 3067 FA 2.09% (LIBOR01M + 0.35%, Cap 7.00%, Floor 0.35%) 11/15/35 • | | | 553,457 | | | | 550,976 | |
Series 3800 AF 2.24% (LIBOR01M + 0.5%, Cap 7.00%, Floor 0.50%) 2/15/41 • | | | 1,122,265 | | | | 1,124,356 | |
Freddie Mac Structured Agency Credit Risk Debt Notes | | | | | | | | |
Series 2015-DNA3 M2 4.642% (LIBOR01M + 2.85%) 4/25/28 • | | | 245,297 | | | | 247,652 | |
Series 2016-DNA3 M2 3.792% (LIBOR01M + 2%) 12/25/28 • | | | 55,540 | | | | 55,621 | |
Series 2016-DNA4 M2 3.092% (LIBOR01M + 1.3%, Floor 1.3%) 3/25/29 • | | | 213,629 | | | | 214,056 | |
Series 2017-DNA3 M2 4.292% (LIBOR01M + 2.5%) 3/25/30 • | | | 450,000 | | | | 460,530 | |
Series 2017-HQA2 M2AS 2.842% (LIBOR01M + 1.05%) 12/25/29 • | | | 1,000,000 | | | | 992,731 | |
Freddie Mac Structured Pass Through Certificates | | | | | | | | |
SeriesT-54 2A 6.50% 2/25/43◆ | | | 627 | | | | 730 | |
SeriesT-58 2A 6.50% 9/25/43◆ | | | 13,039 | | | | 14,692 | |
NCUA Guaranteed Notes Trust | | | | | | | | |
Series2011-R2 1A 2.113% (LIBOR01M + 0.4%, Cap 8.00%, Floor 0.4%) 2/6/20 • | | | 678,213 | | | | 678,213 | |
| | | | | | | | |
Total Agency Collateralized Mortgage Obligations (cost $4,778,415) | | | | | | | 4,790,262 | |
| | | | | | | | |
Agency Commercial Mortgage-Backed Securities – 0.29% | | | | | | | | |
FREMF Mortgage Trust | | | | | | | | |
Series2011-K15 B 144A 4.961% 8/25/44 #• | | | 125,000 | | | | 129,519 | |
Series2012-K22 B 144A 3.687% 8/25/45 #• | | | 1,115,000 | | | | 1,150,767 | |
Series 2014-K717 B 144A 3.63% 11/25/47 #• | | | 635,000 | | | | 648,255 | |
| | | | | | | | |
| | | Principal | | | Value | |
| | | amount° | | | (US $) | |
Agency Commercial Mortgage-Backed Securities (continued) | | | | | | | | |
FREMF Mortgage Trust | | | | | | | | |
Series 2014-K717 C 144A 3.63% 11/25/47 #• | | | 215,000 | | | $ | 218,481 | |
Series 2016-K722 B 144A 3.843% 7/25/49 #• | | | 535,000 | | | | 553,184 | |
NCUA Guaranteed Notes Trust | | | | | | | | |
Series2011-C1 2A 2.243% (LIBOR01M + 0.53%, Cap 8.00%, Floor 0.53%) 3/9/21 • | | | 1,215,194 | | | | 1,214,820 | |
| | | | | | | | |
Total Agency Commercial Mortgage-Backed Securities
(cost $3,889,130) | | | | | | | 3,915,026 | |
| | | | | | | | |
Agency Mortgage-Backed Securities – 15.22% | | | | | | | | |
Fannie Mae ARM 3.858%(LIBOR12M + 1.608%, Cap 9.752%, Floor 1.608%) 9/1/38 • | | | 116,648 | | | | 121,082 | |
Fannie Mae S.F. 30 yr | | | | | | | | |
4.50% 11/1/39 | | | 466,528 | | | | 513,864 | |
4.50% 7/1/40 | | | 463,700 | | | | 502,810 | |
4.50% 8/1/41 | | | 1,122,140 | | | | 1,243,951 | |
4.50% 2/1/46 | | | 13,783,094 | | | | 14,963,110 | |
4.50% 5/1/46 | | | 972,280 | | | | 1,054,948 | |
4.50% 11/1/47 | | | 11,549,122 | | | | 12,572,265 | |
4.50% 4/1/48 | | | 5,319,222 | | | | 5,772,379 | |
4.50% 12/1/48 | | | 7,426,094 | | | | 7,840,450 | |
5.00% 6/1/44 | | | 1,054,752 | | | | 1,173,716 | |
5.00% 7/1/47 | | | 3,737,857 | | | | 4,109,367 | |
5.00% 8/1/48 | | | 27,682,075 | | | | 30,236,464 | |
5.00% 12/1/48 | | | 24,665,033 | | | | 26,861,528 | |
5.50% 5/1/44 | | | 50,293,006 | | | | 56,500,702 | |
5.50% 8/1/48 | | | 1,021,843 | | | | 1,121,061 | |
6.00% 6/1/41 | | | 2,194,134 | | | | 2,515,305 | |
6.00% 7/1/41 | | | 5,427,327 | | | | 11,645,447 | |
6.00% 1/1/42 | | | 1,912,267 | | | | 2,192,329 | |
Freddie Mac ARM | | | | | | | | |
3.65% (LIBOR12M + 1.775%, Cap 11.228%, Floor 1.775%) 10/1/37 • | | | 33,495 | | | | 35,054 | |
4.555% (LIBOR12M + 1.93%, Cap 10.015%, Floor 1.93%) 8/1/38 • | | | 2,103 | | | | 2,166 | |
Freddie Mac S.F. 30 yr | | | | | | | | |
4.50% 5/1/40 | | | 2,748,621 | | | | 3,019,443 | |
4.50% 3/1/42 | | | 759,268 | | | | 824,955 | |
4.50% 7/1/45 | | | 1,529,122 | | | | 1,661,248 | |
5.00% 12/1/44 | | | 2,778,607 | | | | 3,064,729 | |
5.50% 6/1/41 | | | 1,977,341 | | | | 2,221,143 | |
5.50% 9/1/41 | | | 3,427,572 | | | | 3,850,039 | |
6.00% 7/1/40 | | | 5,645,124 | | | | 6,475,271 | |
GNMA II S.F. 30 yr | | | | | | | | |
5.00% 9/20/46 | | | 489,901 | | | | 541,555 | |
Limited-Term Diversified Income Series-8
Delaware VIP® Limited-Term Diversified Income Series
Schedule of investments (continued)
| | | | | | | | |
| | | Principal | | | Value | |
| | | amount° | | | (US $) | |
| |
Agency Mortgage-Backed Securities (continued) | | | | | |
GNMA II S.F. 30 yr | | | | | | | | |
5.50% 5/20/37 | | | 142,301 | | | $ | 158,959 | |
6.00% 2/20/39 | | | 154,804 | | | | 172,914 | |
6.00% 10/20/39 | | | 601,418 | | | | 678,786 | |
6.00% 2/20/40 | | | 622,394 | | | | 705,605 | |
6.00% 4/20/46 | | | 188,071 | | | | 207,228 | |
6.50% 6/20/39 | | | 501,004 | | | | 574,801 | |
| | | | | | | | |
Total Agency Mortgage-Backed Securities (cost $201,134,439) | | | | 205,134,674 | |
| | | | | | | | |
| |
Corporate Bonds – 32.02% | | | | | |
Banking – 13.66% | | | | | |
Banco Santander 3.50% 4/11/22 | | | 3,800,000 | | | | 3,903,360 | |
Bank of America | | | | | | | | |
2.456% 10/22/25 µ | | | 1,235,000 | | | | 1,242,938 | |
3.458% 3/15/25 µ | | | 2,590,000 | | | | 2,705,084 | |
5.625% 7/1/20 | | | 7,475,000 | | | | 7,612,800 | |
Bank of Montreal 3.10% 4/13/21 | | | 3,170,000 | | | | 3,221,884 | |
BBVA USA | | | | | | | | |
2.875% 6/29/22 | | | 7,155,000 | | | | 7,256,112 | |
3.875% 4/10/25 | | | 250,000 | | | | 262,555 | |
Citibank | | | | | | | | |
3.165% 2/19/22 µ | | | 8,670,000 | | | | 8,782,872 | |
3.40% 7/23/21 | | | 2,170,000 | | | | 2,216,806 | |
Citizens Bank 2.629% (LIBOR03M + 0.72%) 2/14/22 • | | | 7,515,000 | | | | 7,559,400 | |
Citizens Financial Group 2.85% 7/27/26 . | | | 4,550,000 | | | | 4,634,516 | |
Commonwealth Bank of Australia 2.40% 11/2/20 | | | 8,600,000 | | | | 8,640,276 | |
Credit Suisse Group | | | | | | | | |
144A 2.593% 9/11/25 #µ | | | 2,005,000 | | | | 2,011,942 | |
144A 4.207% 6/12/24 #µ | | | 2,935,000 | | | | 3,104,269 | |
144A 7.25%#µy | | | 2,425,000 | | | | 2,708,980 | |
Credit Suisse Group Funding Guernsey | | | | | | | | |
3.80% 6/9/23 | | | 1,640,000 | | | | 1,716,946 | |
Fifth Third Bancorp | | | | | | | | |
2.375% 1/28/25 | | | 1,435,000 | | | | 1,436,946 | |
3.65% 1/25/24 | | | 1,500,000 | | | | 1,581,496 | |
Goldman Sachs Group | | | | | | | | |
6.00% 6/15/20 | | | 7,860,000 | | | | 7,999,348 | |
Huntington Bancshares 2.30% 1/14/22 | | | 2,670,000 | | | | 2,684,401 | |
Huntington National Bank | | | | | | | | |
2.50% 8/7/22 | | | 1,400,000 | | | | 1,415,296 | |
3.125% 4/1/22 | | | 3,810,000 | | | | 3,894,849 | |
JPMorgan Chase & Co. | | | | | | | | |
4.023% 12/5/24 µ | | | 13,570,000 | | | | 14,470,384 | |
5.00%µy | | | 2,535,000 | | | | 2,639,569 | |
KeyBank 2.40% 6/9/22 | | | 495,000 | | | | 500,126 | |
Lloyds Banking Group 2.907% 11/7/23 µ | | | 3,325,000 | | | | 3,374,844 | |
Morgan Stanley | | | | | | | | |
2.75% 5/19/22 | | | 260,000 | | | | 264,764 | |
| | | | | | | | |
| | | Principal | | | Value | |
| | | amount° | | | (US $) | |
| |
Corporate Bonds (continued) | | | | | |
Banking (continued) | | | | | | | | |
Morgan Stanley | | | | | | | | |
3.124% (LIBOR03M + 1.22%) 5/8/24 • | | | 6,010,000 | | | $ | 6,120,372 | |
3.737% 4/24/24 µ | | | 1,045,000 | | | | 1,092,150 | |
5.00% 11/24/25 | | | 600,000 | | | | 675,796 | |
5.50% 1/26/20 | | | 4,605,000 | | | | 4,614,857 | |
PNC Bank 2.201% (LIBOR03M + 0.31%) 6/10/21 • | | | 10,125,000 | | | | 10,129,843 | |
2.70% 11/1/22 | | | 505,000 | | | | 514,624 | |
Regions Financial | | | | | | | | |
2.75% 8/14/22 | | | 1,090,000 | | | | 1,109,515 | |
3.80% 8/14/23 | | | 1,975,000 | | | | 2,090,664 | |
Royal Bank of Scotland Group 8.625%µy | | | 2,095,000 | | | | 2,269,042 | |
Santander UK | | | | | | | | |
2.125% 11/3/20 | | | 3,250,000 | | | | 3,254,154 | |
144A 5.00% 11/7/23 # | | | 1,610,000 | | | | 1,733,683 | |
Truist Bank | | | | | | | | |
2.15% 12/6/24 | | | 4,955,000 | | | | 4,945,850 | |
2.636% 9/17/29 µ | | | 4,426,000 | | | | 4,424,253 | |
Truist Financial 3.75% 12/6/23 | | | 4,600,000 | | | | 4,876,634 | |
UBS Group | | | | | | | | |
144A 2.65% 2/1/22 # | | | 1,795,000 | | | | 1,813,287 | |
144A 3.00% 4/15/21 # | | | 5,915,000 | | | | 5,994,109 | |
6.875%µy | | | 390,000 | | | | 406,674 | |
US Bancorp 3.375% 2/5/24 | | | 2,330,000 | | | | 2,445,895 | |
US Bank | | | | | | | | |
2.05% 10/23/20 | | | 14,455,000 | | | | 14,474,683 | |
3.40% 7/24/23 | | | 1,340,000 | | | | 1,399,808 | |
USB Capital IX 3.50% (LIBOR03M + 1.02%)y• | | | 1,340,000 | | | | 1,174,537 | |
Zions Bancorp 3.35% 3/4/22 | | | 775,000 | | | | 795,147 | |
| | | | | | | | |
| | | | | | | 184,198,340 | |
| | | | | | | | |
| |
Basic Industry – 0.35% | | | | | |
Georgia-Pacific 144A 5.40% 11/1/20 # | | | 2,365,000 | | | | 2,430,844 | |
Syngenta Finance | | | | | | | | |
144A 3.933% 4/23/21 # | | | 1,445,000 | | | | 1,469,688 | |
144A 4.441% 4/24/23 # | | | 845,000 | | | | 882,454 | |
| | | | | | | | |
| | | | | | | 4,782,986 | |
| | | | | | | | |
| |
Capital Goods – 1.40% | | | | | |
General Electric 2.271% (LIBOR03M + 0.38%) 5/5/26 • | | | 305,000 | | | | 289,891 | |
2.70% 10/9/22 | | | 1,430,000 | | | | 1,449,479 | |
Roper Technologies 2.35% 9/15/24 | | | 5,985,000 | | | | 6,020,431 | |
United Technologies 2.30% 5/4/22 | | | 6,550,000 | | | | 6,601,311 | |
Waste Management 2.95% 6/15/24 | | | 4,330,000 | | | | 4,473,870 | |
| | | | | | | | |
| | | | | | | 18,834,982 | |
| | | | | | | | |
Limited-Term Diversified Income Series-9
Delaware VIP® Limited-Term Diversified Income Series
Schedule of investments (continued)
| | | | | | | | |
| | | Principal | | | Value | |
| | | amount° | | | (US $) | |
| |
Corporate Bonds (continued) | | | | | |
Communications – 3.05% | | | | | |
American Tower Trust #1 144A 3.07% 3/15/23 # | | | 1,575,000 | | | $ | 1,596,022 | |
AT&T 3.067% (LIBOR03M + 1.18%) 6/12/24 • | | | 5,055,000 | | | | 5,146,017 | |
4.35% 3/1/29 | | | 395,000 | | | | 439,219 | |
Comcast 2.631% (LIBOR03M + 0.63%) 4/15/24 • | | | 6,500,000 | | | | 6,569,373 | |
2.65% 2/1/30 | | | 890,000 | | | | 893,596 | |
Crown Castle International 5.25% 1/15/23 | | | 2,095,000 | | | | 2,276,080 | |
Fox | | | | | | | | |
144A 3.666% 1/25/22 # | | | 6,580,000 | | | | 6,794,723 | |
144A 4.03% 1/25/24 # | | | 4,025,000 | | | | 4,290,990 | |
GTP Acquisition Partners I 144A 2.35% 6/15/20 # | | | 1,080,000 | | | | 1,080,292 | |
Sprint Spectrum 144A 4.738% 3/20/25 # | | | 1,745,000 | | | | 1,853,007 | |
Time Warner Entertainment 8.375% 3/15/23 | | | 8,635,000 | | | | 10,192,977 | |
| | | | | | | | |
| | | | | | | 41,132,296 | |
| | | | | | | | |
| |
Consumer Cyclical – 0.48% | | | | | |
General Motors Financial 3.45% 4/10/22 | | | 2,145,000 | | | | 2,193,866 | |
4.15% 6/19/23 | | | 1,290,000 | | | | 1,357,433 | |
5.10% 1/17/24 | | | 2,680,000 | | | | 2,909,754 | |
| | | | | | | | |
| | | | | | | 6,461,053 | |
| | | | | | | | |
| |
ConsumerNon-Cyclical – 2.84% | | | | | |
AbbVie 144A 2.60% 11/21/24 # | | | 1,695,000 | | | | 1,706,618 | |
144A 2.95% 11/21/26 # | | | 1,980,000 | | | | 2,012,659 | |
Alcon Finance 144A 2.75% 9/23/26 # | | | 4,665,000 | | | | 4,753,270 | |
Anheuser-Busch InBev Worldwide 3.65% 2/1/26 | | | 4,980,000 | | | | 5,308,956 | |
Bristol-Myers Squibb 144A 2.90% 7/26/24 # | | | 5,320,000 | | | | 5,492,234 | |
Cigna 2.891% (LIBOR03M + 0.89%) 7/15/23 • | | | 6,130,000 | | | | 6,166,787 | |
3.75% 7/15/23 | | | 1,630,000 | | | | 1,709,746 | |
CVS Health 3.35% 3/9/21 | | | 4,582,000 | | | | 4,658,204 | |
Keurig Dr Pepper 3.551% 5/25/21 | | | 2,550,000 | | | | 2,604,774 | |
Molson Coors Beverage 2.10% 7/15/21 . | | | 3,845,000 | | | | 3,848,408 | |
| | | | | | | | |
| | | | | | | 38,261,656 | |
| | | | | | | | |
| |
Electric – 4.09% | | | | | |
AEP Texas 2.40% 10/1/22 | | | 5,720,000 | | | | 5,772,254 | |
Arizona Public Service 2.20% 1/15/20 | | | 4,953,000 | | | | 4,953,054 | |
CenterPoint Energy 3.85% 2/1/24 | | | 2,970,000 | | | | 3,132,705 | |
| | | | | | | | |
| | | Principal | | | Value | |
| | | amount° | | | (US $) | |
Corporate Bonds (continued) | | | | | |
Electric (continued) | | | | | | | | |
Cleveland Electric Illuminating 5.50% 8/15/24 | | | 4,805,000 | | | $ | 5,492,610 | |
Duke Energy | | | | | | | | |
1.80% 9/1/21 | | | 3,140,000 | | | | 3,137,163 | |
4.875%µy | | | 2,660,000 | | | | 2,793,466 | |
Entergy 4.00% 7/15/22 | | | 3,797,000 | | | | 3,963,108 | |
Entergy Louisiana 4.05% 9/1/23 | | | 480,000 | | | | 510,351 | |
Exelon 2.85% 6/15/20 | | | 3,500,000 | | | | 3,508,027 | |
IPALCO Enterprises 3.45% 7/15/20 | | | 4,765,000 | | | | 4,786,605 | |
Nevada Power 2.75% 4/15/20 | | | 2,110,000 | | | | 2,114,815 | |
NextEra Energy Capital Holdings 3.15% 4/1/24 | | | 4,045,000 | | | | 4,194,212 | |
NRG Energy 144A 3.75% 6/15/24 # | | | 3,960,000 | | | | 4,094,710 | |
NV Energy 6.25% 11/15/20 | | | 2,350,000 | | | | 2,432,966 | |
Vistra Operations 144A 3.55% 7/15/24 # . | | | 4,230,000 | | | | 4,285,803 | |
| | | | | | | | |
| | | | | | | 55,171,849 | |
| | | | | | | | |
| |
Energy – 2.37% | | | | | |
Continental Resources 3.80% 6/1/24 | | | 2,915,000 | | | | 3,015,435 | |
Exxon Mobil 2.019% 8/16/24 | | | 5,330,000 | | | | 5,346,800 | |
Marathon Oil 2.80% 11/1/22 | | | 2,310,000 | | | | 2,348,432 | |
Occidental Petroleum | | | | | | | | |
2.90% 8/15/24 | | | 3,435,000 | | | | 3,491,748 | |
3.50% 8/15/29 | | | 1,210,000 | | | | 1,234,486 | |
ONEOK 7.50% 9/1/23 | | | 4,745,000 | | | | 5,538,338 | |
Sabine Pass Liquefaction 5.75% 5/15/24 | | | 4,250,000 | | | | 4,740,702 | |
Schlumberger Holdings 144A 3.75% 5/1/24 # | | | 5,865,000 | | | | 6,179,771 | |
| | | | | | | | |
| | | | | | | 31,895,712 | |
| | | | | | | | |
| |
Finance Companies – 1.54% | | | | | |
AerCap Ireland Capital 3.65% 7/21/27 | | | 3,250,000 | | | | 3,348,036 | |
Aviation Capital Group | | | | | | | | |
144A 2.875% 1/20/22 # | | | 5,430,000 | | | | 5,468,632 | |
144A 4.375% 1/30/24 # | | | 335,000 | | | | 352,981 | |
Avolon Holdings Funding 144A 3.95% 7/1/24 # | | | 3,485,000 | | | | 3,636,075 | |
144A 4.375% 5/1/26 # | | | 620,000 | | | | 655,681 | |
International Lease Finance 8.625% 1/15/22 | | | 6,480,000 | | | | 7,290,747 | |
| | | | | | | | |
| | | | | | | 20,752,152 | |
| | | | | | | | |
| |
Insurance – 0.30% | | | | | |
AXA Equitable Holdings 3.90% 4/20/23 | | | 3,840,000 | | | | 4,024,049 | |
| | | | | | | | |
| | | | | | | 4,024,049 | |
| | | | | | | | |
| |
Natural Gas – 0.14% | | | | | |
NiSource 5.65%µy | | | 1,850,000 | | | | 1,897,573 | |
| | | | | | | | |
| | | | | | | 1,897,573 | |
| | | | | | | | |
| |
Technology – 1.80% | | | | | |
Apple 2.05% 9/11/26 | | | 1,115,000 | | | | 1,106,856 | |
Global Payments 2.65% 2/15/25 | | | 2,055,000 | | | | 2,064,761 | |
Limited-Term Diversified Income Series-10
Delaware VIP® Limited-Term Diversified Income Series
Schedule of investments (continued)
| | | | | | | | |
| | | Principal | | | Value | |
| | | amount° | | | (US $) | |
|
Corporate Bonds (continued) | |
Technology (continued) | |
Global Payments
3.20% 8/15/29 | | | 1,440,000 | | | $ | 1,471,605 | |
Intel 2.45% 11/15/29 | | | 2,110,000 | | | | 2,103,731 | |
International Business Machines 3.00% 5/15/24 | | | 3,825,000 | | | | 3,963,280 | |
Microchip Technology 3.922% 6/1/21 | | | 1,240,000 | | | | 1,268,275 | |
4.333% 6/1/23 | | | 2,250,000 | | | | 2,377,321 | |
Micron Technology 4.975% 2/6/26 | | | 2,275,000 | | | | 2,525,510 | |
NXP 144A 4.875% 3/1/24 # | | | 6,825,000 | | | | 7,444,998 | |
| | | | | | | | |
| | | | | | | 24,326,337 | |
| | | | | | | | |
Total Corporate Bonds
(cost $420,555,892) | | | | 431,738,985 | |
| | | | | | | | |
Non-Agency Asset-Backed
Securities – 23.19% | | | | | |
American Express Credit Account Master Trust | | | | | | | | |
Series2017-2 A 2.19% (LIBOR01M + 0.45%) 9/16/24 • | | | 10,260,000 | | | | 10,309,398 | |
Series2017-5 A 2.12% (LIBOR01M + 0.38%) 2/18/25 • | | | 2,425,000 | | | | 2,432,665 | |
Series2018-5 A 2.08% (LIBOR01M + 0.34%) 12/15/25 • | | | 13,040,000 | | | | 13,036,122 | |
Series2018-6 A
3.06% 2/15/24 | | | 7,155,000 | | | | 7,283,512 | |
Series2018-7 A 2.10% (LIBOR01M + 0.36%) 2/17/26 • | | | 5,650,000 | | | | 5,647,808 | |
Series2019-2 A 2.67% 11/15/24 | | | 8,000,000 | | | | 8,137,994 | |
ARI Fleet Lease Trust | | | | | | | | |
Series2018-B A2 144A 3.22% 8/16/27 # | | | 6,638,504 | | | | 6,696,356 | |
BA Credit Card Trust | | | | | | | | |
Series2017-A1 A1 1.95% 8/15/22 | | | 6,430,000 | | | | 6,430,643 | |
Series2018-A3 A3 3.10% 12/15/23 | | | 1,760,000 | | | | 1,792,684 | |
Barclays Dryrock Issuance Trust | | | | | | | | |
Series2017-1 A 2.07% (LIBOR01M + 0.33%, Floor 0.33%) 3/15/23 • | | | 6,410,000 | | | | 6,414,210 | |
BMW Floorplan Master Owner Trust | | | | | | | | |
Series2018-1 A2 144A 2.06% (LIBOR01M + 0.32%) 5/15/23 #• | | | 2,200,000 | | | | 2,203,255 | |
Cabela’s Credit Card Master Note Trust | | | | | | | | |
Series2015-1A A1 2.26% 3/15/23 | | | 5,805,000 | | | | 5,807,374 | |
CarMax Auto Owner Trust | | | | | | | | |
Series2018-1 A2B 1.89% (LIBOR01M + 0.15%) 5/17/21 • | | | 68,749 | | | | 68,749 | |
Chase Issuance Trust | | | | | | | | |
Series2015-A4 A4 1.84% 4/15/22 | | | 7,895,000 | | | | 7,893,177 | |
Series2016-A3 A3 2.29% (LIBOR01M + 0.55%) 6/15/23 • | | | 12,935,000 | | | | 13,015,064 | |
| | | | | | | | |
| | | Principal | | | Value | |
| | | amount° | | | (US $) | |
|
Non-Agency Asset-Backed Securities (continued) | |
Chase Issuance Trust | | | | | | | | |
Series2017-A1 A 2.04% (LIBOR01M + 0.30%) 1/15/22 • | | | 3,440,000 | | | $ | 3,440,448 | |
Series2017-A2 A 2.14% (LIBOR01M + 0.40%) 3/15/24 • | | | 4,555,000 | | | | 4,566,935 | |
Series2018-A1 A1 1.94% (LIBOR01M + 0.20%) 4/17/23 • | | | 5,240,000 | | | | 5,245,227 | |
Chesapeake Funding II | | | | | | | | |
Series2017-2A A2 144A 2.19% (LIBOR01M + 0.45%, Floor 0.45%) 5/15/29 #• | | | 1,190,861 | | | | 1,191,768 | |
Series2017-4A A2 144A 2.08% (LIBOR01M + 0.34%) 11/15/29 #• | | | 2,388,266 | | | | 2,386,640 | |
Citibank Credit Card Issuance Trust | | | | | | | | |
Series2016-A3 A3 2.20% (LIBOR01M + 0.49%) 12/7/23 • | | | 15,395,000 | | | | 15,485,721 | |
Series2017-A7 A7 2.08% (LIBOR01M + 0.37%) 8/8/24 • | | | 19,325,000 | | | | 19,374,702 | |
Series2018-A1 A1 2.49% 1/20/23 | | | 1,485,000 | | | | 1,495,120 | |
Series2018-A2 A2 2.095% (LIBOR01M + 0.33%) 1/20/25 • | | | 3,300,000 | | | | 3,300,661 | |
Series2018-A4 A4 2.05% (LIBOR01M + 0.34%) 6/7/25 • | | | 1,990,000 | | | | 1,988,223 | |
CNH Equipment Trust | | | | | | | | |
Series2019-A A2 2.96% 5/16/22 | | | 4,076,912 | | | | 4,093,477 | |
Discover Card Execution Note Trust | | | | | | | | |
Series2017-A7 A7 2.10% (LIBOR01M + 0.36%) 4/15/25 • | | | 10,490,000 | | | | 10,490,511 | |
Series2018-A2 A2 2.07% (LIBOR01M + 0.33%) 8/15/25 • | | | 9,375,000 | | | | 9,369,705 | |
Series2018-A3 A3 1.97% (LIBOR01M + 0.23%, Floor 0.23%) 12/15/23 • | | | 6,920,000 | | | | 6,926,141 | |
Enterprise Fleet Financing | | | | | | | | |
Series2017-2 A2 144A 1.97% 1/20/23 # | | | 2,477,366 | | | | 2,476,408 | |
Ford Credit Auto Lease Trust | | | | | | | | |
Series2019-B A2A 2.28% 2/15/22 | | | 5,650,000 | | | | 5,667,230 | |
Ford Credit Auto Owner Trust | | | | | | | | |
Series2017-A A3 1.67% 6/15/21 | | | 1,418,709 | | | | 1,417,764 | |
Series2017-C A3 2.01% 3/15/22 | | | 1,506,537 | | | | 1,507,237 | |
Ford Credit Floorplan Master Owner Trust A | | | | | | | | |
Series2017-1 A2 2.16% (LIBOR01M + 0.42%) 5/15/22 • | | | 425,000 | | | | 425,347 | |
Series2017-2 A2 2.09% (LIBOR01M + 0.35%, Floor 0.62%) 9/15/22 • | | | 17,200,000 | | | | 17,212,129 | |
Series2018-1 A2 2.02% (LIBOR01M + 0.28%) 5/15/23 • | | | 1,725,000 | | | | 1,723,824 | |
Limited-Term Diversified Income Series-11
Delaware VIP® Limited-Term Diversified Income Series
Schedule of investments (continued)
| | | | | | | | |
| | | Principal | | | Value | |
| | | amount° | | | (US $) | |
| |
Non-Agency Asset-Backed Securities (continued) | | | | | |
GMF Floorplan Owner Revolving Trust | | | | | | | | |
Series2017-1 A1 144A 2.22% 1/18/22 # | | | 2,150,000 | | | $ | 2,149,954 | |
Series2017-1 A2 144A 2.31% (LIBOR01M + 0.57%) 1/18/22 #• | | | 500,000 | | | | 500,065 | |
Great American Auto Leasing | | | | | | | | |
Series2019-1 A2 144A 2.97% 6/15/21 # | | | 4,314,957 | | | | 4,332,356 | |
HOA Funding | | | | | | | | |
Series2014-1A A2 144A 4.846% 8/20/44 # | | | 326,675 | | | | 326,731 | |
Hyundai Auto Lease Securitization Trust | | | | | | | | |
Series2017-C A3 144A 2.12% 2/16/21 # | | | 747,159 | | | | 747,150 | |
Series2018-A A3 144A 2.81% 4/15/21 # | | | 1,094,380 | | | | 1,097,263 | |
Hyundai Auto Receivables Trust | | | | | | | | |
Series2019-B A2 1.93% 7/15/22 | | | 3,000,000 | | | | 2,999,989 | |
Invitation Homes Trust | | | | | | | | |
Series 2018-SFR1 A 144A 2.437% (LIBOR01M + 0.70%) 3/17/37 #• | | | 3,203,621 | | | | 3,176,649 | |
John Deere Owner Trust | | | | | | | | |
Series2019-B A2 2.28% 5/16/22 | | | 3,700,000 | | | | 3,707,915 | |
Mercedes-Benz Auto Lease Trust | | | | | | | | |
Series2018-B A2 3.04% 12/15/20 | | | 1,479,897 | | | | 1,481,634 | |
Series2019-B A2 2.01% 12/15/21 | | | 1,000,000 | | | | 1,000,611 | |
Mercedes-Benz Master Owner Trust | | | | | | | | |
Series2017-BA A 144A 2.16% (LIBOR01M + 0.42%) 5/16/22 #• | | | 7,080,000 | | | | 7,087,186 | |
Series2018-BA A 144A 2.08% (LIBOR01M + 0.34%) 5/15/23 #• | | | 2,400,000 | | | | 2,402,972 | |
MMAF Equipment Finance | | | | | | | | |
Series2015-AA A5 144A 2.49% 2/19/36 # | | | 1,345,713 | | | | 1,354,208 | |
Navistar Financial Dealer Note Master | | | | | | | | |
Owner Trust II | | | | | | | | |
Series2018-1 A 144A 2.422% (LIBOR01M + 0.63%, Floor 0.63%) 9/25/23 #• | | | 600,000 | | | | 600,991 | |
Nissan Master Owner Trust Receivables | | | | | | | | |
Series2017-B A 2.17% (LIBOR01M + 0.43%) 4/18/22 • | | | 2,170,000 | | | | 2,171,139 | |
Series2017-C A 2.06% (LIBOR01M + 0.32%) 10/17/22 • | | | 3,720,000 | | | | 3,722,534 | |
PFS Financing | | | | | | | | |
Series2018-A A 144A 2.14% (LIBOR01M + 0.40%) 2/17/22 #• | | | 610,000 | | | | 609,529 | |
Series2018-C A 144A 2.22% (LIBOR01M + 0.48%) 4/15/22 #• | | | 2,900,000 | | | | 2,898,878 | |
| | | | | | | | |
| | | Principal | | | Value | |
| | | amount° | | | (US $) | |
Non-Agency Asset-Backed Securities (continued) | | | | | | | | |
PFS Financing | | | | | | | | |
Series2018-E A 144A 2.19% (LIBOR01M + 0.45%) 10/17/22 #• | | | 3,090,000 | | | $ | 3,090,445 | |
Popular ABS Mortgage Pass Through Trust | | | | | | | | |
Series2006-C A4 2.042% (LIBOR01M + 0.25%, Cap 14.00%, Floor 0.25%) 7/25/36◆• | | | 439,039 | | | | 437,699 | |
Tesla Auto Lease Trust | | | | | | | | |
Series2018-B A 144A 3.71% 8/20/21 # | | | 3,506,693 | | | | 3,552,155 | |
Series2019-A A2 144A 2.13% 4/20/22 # | | | 4,150,000 | | | | 4,148,146 | |
Towd Point Mortgage Trust | | | | | | | | |
Series2015-5 A1B 144A 2.75% 5/25/55 #• | | | 345,240 | | | | 344,961 | |
Series2015-6 A1B 144A 2.75% 4/25/55 #• | | | 432,359 | | | | 432,431 | |
Toyota Auto Receivables Owner Trust | | | | | | | | |
Series2018-C A2B 1.86% (LIBOR01M + 0.12%) 8/16/21 • | | | 1,101,040 | | | | 1,100,774 | |
Trafigura Securitisation Finance | | | | | | | | |
Series2017-1A A1 144A 2.59% (LIBOR01M + 0.85%) 12/15/20 #• | | | 7,415,000 | | | | 7,422,230 | |
Series2018-1A A1 144A 2.47% (LIBOR01M + 0.73%) 3/15/22 #• | | | 250,000 | | | | 249,352 | |
Verizon Owner Trust | | | | | | | | |
Series2016-2A A 144A 1.68% 5/20/21 # | | | 217,954 | | | | 217,911 | |
Series2017-1A A 144A 2.06% 9/20/21 # | | | 1,130,093 | | | | 1,130,157 | |
Series2017-3A A1A 144A 2.06% 4/20/22 # | | | 4,712,089 | | | | 4,713,640 | |
Series2017-3A A1B 144A 2.035% (LIBOR01M + 0.27%) 4/20/22 #• | | | 7,716,045 | | | | 7,719,401 | |
Series2019-B A1B 2.215% (LIBOR01M + 0.45%) 12/20/23 • | | | 1,500,000 | | | | 1,504,024 | |
Volkswagen Auto Loan Enhanced Trust | | | | | | | | |
Series2018-1 A2B 1.945% (LIBOR01M + 0.18%) 7/20/21 • | | | 370,625 | | | | 370,634 | |
Volvo Financial Equipment Master Owner Trust | | | | | | | | |
Series2017-A A 144A 2.24% (LIBOR01M + 0.50%) 11/15/22 #• | | | 15,000,000 | | | | 15,034,152 | |
Limited-Term Diversified Income Series-12
Delaware VIP® Limited-Term Diversified Income Series
Schedule of investments (continued)
| | | | | | | | |
| | | Principal | | | Value | |
| | | amount° | | | (US $) | |
| |
Non-Agency Asset-Backed Securities (continued) | | | | | |
Wheels SPV 2 | | | | | | | | |
Series2018-1A A2 144A 3.06% 4/20/27 # | | | 1,921,530 | | | $ | 1,931,884 | |
| | | | | | | | |
TotalNon-Agency Asset-Backed Securities
(cost $311,936,334) | | | | | | | 312,721,979 | |
| | | | | | | | |
Non-Agency Collateralized Mortgage Obligations – 0.40% | | | | | |
Galton Funding Mortgage Trust | | | | | | | | |
Series2018-1 A43 144A 3.50% 11/25/57 #• | | | 345,053 | | | | 346,265 | |
JPMorgan Mortgage Trust | | | | | | | | |
Series 2014-IVR6 2A4 144A 2.50% 7/25/44 #• | | | 650,000 | | | | 649,493 | |
Sequoia Mortgage Trust | | | | | | | | |
Series2014-2 A4 144A 3.50% 7/25/44 #• | | | 288,185 | | | | 292,504 | |
Series2017-4 A1 144A 3.50% 7/25/47 #• | | | 394,573 | | | | 400,964 | |
Silverstone Master Issuer | | | | | | | | |
Series2018-1A 1A 144A 2.356% (LIBOR03M + 0.39%) 1/21/70 #• | | | 3,740,000 | | | | 3,728,219 | |
| | | | | | | | |
TotalNon-Agency Collateralized Mortgage Obligations
(cost $5,410,854) | | | | 5,417,445 | |
| | | | | | | | |
Non-Agency Commercial Mortgage-Backed Security – 0.03% | | | | | |
LB-UBS Commercial Mortgage Trust | | | | | | | | |
Series2006-C6 AJ 5.452% 9/15/39 • | | | 664,496 | | | | 353,806 | |
| | | | | | | | |
TotalNon-Agency Commercial Mortgage-Backed Security (cost $704,683) | | | | | | | 353,806 | |
Sovereign Bond – 1.04% | | | | | |
Japan – 1.04% | | | | | | | | |
Japan Bank for International Cooperation 2.48% (LIBOR03M + 0.57%) 2/24/20 • | | | 14,030,000 | | | | 14,042,090 | |
| | | | | | | | |
Total Sovereign Bond (cost $14,136,025) | | | | | | | 14,042,090 | |
| | | | | | | | |
Supranational Banks – 1.77% | | | | | |
Inter-American Development Bank 1.71% (LIBOR01M + 0.00%) 10/9/20 • | | | 10,530,000 | | | | 10,524,907 | |
| | | | | | | | |
| | | Principal | | | Value | |
| | | amount° | | | (US $) | |
Supranational Banks (continued) | | | | | | | | |
International Bank for Reconstruction & Development 2.20% 9/23/22 | �� | | 13,310,000 | | | $ | 13,311,445 | |
| | | | | | | | |
Total Supranational Banks (cost $23,827,860) | | | | 23,836,352 | |
| | | | | | | | |
US Treasury Obligations – 20.31% | | | | | |
US Treasury Floating Rate Note 1.826% (USBMMY3M + 0.30%) 10/31/21 • | | | 65,490,000 | | | | 65,611,975 | |
US Treasury Notes 1.50% 9/30/24 | | | 171,875,000 | | | | 170,310,800 | |
1.50% 11/30/24 | | | 13,580,000 | | | | 13,458,993 | |
1.625% 8/15/29 | | | 24,840,000 | | | | 24,184,626 | |
2.25% 3/31/21 | | | 320,000 | | | | 322,475 | |
| | | | | | | | |
Total US Treasury Obligations
(cost $275,306,896) | | | | 273,888,869 | |
| | | | | | | | |
| | | Number of | | | | |
| | | shares | | | | |
Preferred Stock – 0.20% | | | | | | | | |
Morgan Stanley 5.55% µ | | | 2,500,000 | | | | 2,550,175 | |
USB Realty 144A 3.148% (LIBOR03M + 1.147%)#• | | | 200,000 | | | | 172,804 | |
| | | | | | | | |
Total Preferred Stock (cost $2,655,000) | | | | | | | 2,722,979 | |
| | | | | | | | |
Short-Term Investments – 4.66% | | | | | |
Money Market Mutual Funds – 1.29% | | | | | |
BlackRock FedFund – Institutional Shares(seven-day effective yield 1.52%) | | | 3,485,229 | | | | 3,485,229 | |
Fidelity Investments Money Market Government Portfolio – Class I(seven-day effective yield 1.49%) | | | 3,485,229 | | | | 3,485,229 | |
GS Financial Square Government Fund – Institutional Shares(seven-day effective yield 1.51%) | | | 3,485,229 | | | | 3,485,229 | |
Morgan Stanley Government Portfolio – Institutional Share Class(seven-day effective yield 1.48%) | | | 3,485,229 | | | | 3,485,229 | |
State Street Institutional US Government Money Market Fund – Investor Class(seven-day effective yield 1.45%) | | | 3,485,229 | | | | 3,485,229 | |
| | | | | | | | |
| | | | | | | 17,426,145 | |
| | | | | | | | |
| | | Principal | | | | | |
| | | amount° | | | | | |
US Treasury Obligation – 3.37%≠ | | | | | |
US Treasury Bill 1.25% 1/31/20 | | | 45,415,000 | | | | 45,400,753 | |
| | | | | | | | |
| | | | | | | 45,400,753 | |
| | | | | | | | |
Total Short-Term Investments
(cost $62,771,354) | | | | | | | 62,826,898 | |
| | | | | | | | |
Limited-Term Diversified Income Series-13
Delaware VIP® Limited-Term Diversified Income Series
Schedule of investments (continued)
| | | | |
Total Value of Securities – 99.49%
(cost $1,327,106,882) | | $ | 1,341,389,365 | |
| | | | |
| # | Security exempt from registration under Rule 144A of the Securities Act of 1933, as amended. At Dec. 31, 2019, the aggregate value of Rule 144A securities was $184,716,932, which represents 13.70% of the Series’ net assets. See Note 10 in “Notes to financial statements.” |
| ◆ | Pass Through Agreement. Security represents the contractual right to receive a proportionate amount of underlying payments due to the counterparty pursuant to various agreements related to the rescheduling of obligations and the exchange of certain notes. |
| ≠ | The rate shown is the effective yield at the time of purchase. |
| ° | Principal amount shown is stated in USD unless noted that the security is denominated in another currency. |
| µ | Fixed to variable rate investment. The rate shown reflects the fixed rate in effect at Dec. 31, 2019. Rate will reset at a future date. |
| y | No contractual maturity date. |
| • | Variable rate investment. Rates reset periodically. Rate shown reflects the rate in effect at Dec. 31, 2019. For securities based on a published reference rate and spread, the reference rate and spread are indicated in their description above. The reference rate descriptions (i.e. LIBOR03M, LIBOR06M, etc.) used in this report are identical for different securities, but the underlying reference rates may differ due to the timing of the reset period. Certain variable rate securities are not based on a published reference rate and spread but are determined by the issuer or agent and are based on current market conditions, or for mortgage-backed securities, are impacted by the individual mortgages which are paying off over time. These securities do not indicate a reference rate and spread in their description above. |
Summary of abbreviations:
ARM – Adjustable Rate Mortgage
BA – Bank of America
FDIC – Federal Deposit Insurance Corporation
FREMF – Freddie Mac Multifamily
GNMA – Government National Mortgage Association
GS – Goldman Sachs
ICE – Intercontinental Exchange
LB – Lehman Brothers
LIBOR – London Interbank Offered Rate
LIBOR01M – ICE LIBOR USD 12 Month
LIBOR03M – ICE LIBOR USD 3 Month
LIBOR06M – ICE LIBOR USD 6 Month
LIBOR12M – ICE LIBOR USD 1 Year
NCUA – National Credit Union Administration
REMIC – Real Estate Mortgage Investment Conduit
ROLS – Residual Options Long
S.F. – Single Family
USBMMY03M – US Treasury 3 Month Bill Money Market Yield
USD – US Dollar
yr – Year
See accompanying notes, which are an integral part of the financial statements.
Limited-Term Diversified Income Series-14
| | | | |
| Delaware VIP®Trust — Delaware VIP Limited-Term Diversified Income Series | | | | |
| Statement of assets and liabilities | | | December 31, 2019 | |
| | | | |
Assets: | | | | |
Investments, at value1 | | $ | 1,341,389,365 | |
Dividends and interest receivable | | | 6,770,068 | |
Receivable for series shares sold | | | 1,941,585 | |
Receivable for securities sold | | | 113 | |
| | | | |
| |
Total assets | | | 1,350,101,131 | |
| | | | |
Liabilities: | | | | |
Cash due to custodian | | | 104,730 | |
Distribution payable | | | 690,854 | |
Investment management fees payable to affiliates | | | 543,939 | |
Distribution fees payable to affiliates | | | 308,599 | |
Reports and statements to shareholders expenses payable tonon-affiliates | | | 71,448 | |
Other accrued expenses | | | 66,589 | |
Payable for series shares redeemed | | | 15,465 | |
Trustees’ fees and expenses payable to affiliates | | | 13,275 | |
Dividend disbursing and transfer agent fees and expenses payable to affiliates | | | 8,535 | |
Audit and tax fees payable | | | 4,450 | |
Accounting and administration expenses payable to affiliates | | | 4,116 | |
Legal fees payable to affiliates | | | 2,076 | |
Reports and statements to shareholders expenses payable to affiliates | | | 645 | |
| | | | |
| |
Total liabilities | | | 1,834,721 | |
| | | | |
| |
Total Net Assets | | $ | 1,348,266,410 | |
| | | | |
| |
Net Assets Consist of: | | | | |
Paid-in capital | | $ | 1,367,825,840 | |
Total distributable earnings (loss) | | | (19,559,430 | ) |
| | | | |
Total Net Assets | | $ | 1,348,266,410 | |
| | | | |
| |
Net Asset Value | | | | |
Standard Class: | | | | |
Net assets | | $ | 131,920,521 | |
Shares of beneficial interest outstanding, unlimited authorization, no par | | | 13,437,669 | |
Net asset value per share | | $ | 9.82 | |
| |
Service Class: | | | | |
Net assets | | $ | 1,216,345,889 | |
Shares of beneficial interest outstanding, unlimited authorization, no par | | | 124,727,023 | |
Net asset value per share | | $ | 9.75 | |
| | | | |
1Investments, at cost | | $ | 1,327,106,882 | |
See accompanying notes, which are an integral part of the financial statements.
Limited-Term Diversified Income Series-15
Delaware VIP® Trust—
Delaware VIP Limited-Term Diversified Income Series
Statement of operations
Year ended December 31, 2019
| | | | |
Investment Income: | | | | |
Interest | | $ | 38,264,644 | |
Dividends | | | 346,881 | |
| | | | |
| | | 38,611,525 | |
| | | | |
Expenses: | | | | |
Management fees | | | 6,555,586 | |
Distribution expenses – Service Class | | | 3,652,307 | |
Accounting and administration expenses | | | 277,238 | |
Reports and statements to shareholders expenses | | | 159,863 | |
Dividend disbursing and transfer agent fees and expenses | | | 114,599 | |
Trustees’ fees and expenses | | | 81,879 | |
Legal fees | | | 78,983 | |
Audit and tax fees | | | 53,031 | |
Custodian fees | | | 40,217 | |
Registration fees | | | 147 | |
Other | | | 71,312 | |
| | | | |
| | | 11,085,162 | |
Less expenses paid indirectly | | | (11,600 | ) |
| | | | |
Total operating expenses | | | 11,073,562 | |
| | | | |
Net Investment Income | | | 27,537,963 | |
| | | | |
Net Realized and Unrealized Gain (Loss): | | | | |
Net realized gain (loss) on: | | | | |
Investments | | | 13,161,578 | |
Swap contracts | | | (577,640 | ) |
| | | | |
Net realized gain | | | 12,583,938 | |
| | | | |
Net change in unrealized appreciation (depreciation) of: | | | | |
Investments | | | 27,509,294 | |
Swap contracts | | | (1,045,748 | ) |
| | | | |
Net change in unrealized appreciation (depreciation) | | | 26,463,546 | |
| | | | |
Net Realized and Unrealized Gain | | | 39,047,484 | |
| | | | |
Net Increase in Net Assets Resulting from Operations | | $ | 66,585,447 | |
| | | | |
Delaware VIP Trust—
Delaware VIP Limited-Term Diversified Income Series
Statements of changes in net assets
| | | | | | | | |
| | | Year ended | |
| | | 12/31/19 | | | 12/31/18 | |
Increase (Decrease) in Net Assets from Operations: | | | | | | | | |
Net investment income | | $ | 27,537,963 | | | $ | 26,199,419 | |
Net realized gain (loss) | | | 12,583,938 | | | | (13,569,780 | ) |
Net change in unrealized appreciation (depreciation) | | | 26,463,546 | | | | (12,400,759 | ) |
| | | | | | | | |
Net increase in net assets resulting from operations | | | 66,585,447 | | | | 228,880 | |
| | | | | | | | |
| |
Dividends and Distributions to Shareholders from: | | | | | |
Distributable earnings: | | | | | | | | |
Standard Class | | | (4,305,301 | ) | | | (3,043,622 | ) |
Service Class | | | (29,445,479 | ) | | | (31,121,454 | ) |
| | | | | | | | |
| | | (33,750,780 | ) | | | (34,165,076 | ) |
| | | | | | | | |
| |
Capital Share Transactions: | | | | | |
Proceeds from shares sold: | | | | | | | | |
Standard Class | | | 28,692,698 | | | | 178,484,132 | |
Service Class | | | 54,182,824 | | | | 41,914,297 | |
Net asset value of shares based upon reinvestment of dividends and distributions: | | | | | | | | |
Standard Class | | | 4,255,557 | | | | 2,913,489 | |
Service Class | | | 29,530,672 | | | | 30,855,015 | |
| | | | | | | | |
| | | 116,661,751 | | | | 254,166,933 | |
| | | | | | | | |
Cost of shares redeemed: | | | | | | | | |
Standard Class | | | (165,315,838 | ) | | | (18,087,997 | ) |
Service Class | | | (116,259,977 | ) | | | (139,860,998 | ) |
| | | | | | | | |
| | | (281,575,815 | ) | | | (157,948,995 | ) |
| | | | | | | | |
Increase (decrease) in net assets derived from capital share transactions | | | (164,914,064 | ) | | | 96,217,938 | |
| | | | | | | | |
Net Increase (Decrease) in Net Assets | | | (132,079,397 | ) | | | 62,281,742 | |
| |
Net Assets: | | | | | |
Beginning of year | | | 1,480,345,807 | | | | 1,418,064,065 | |
| | | | | | | | |
End of year | | $ | 1,348,266,410 | | | $ | 1,480,345,807 | |
| | | | | | | | |
See accompanying notes, which are an integral part of the financial statements.
Limited-Term Diversified Income Series-16
Delaware VIP® Trust — Delaware VIP Limited-Term Diversified Income Series
Financial highlights
Selected data for each share of the Series outstanding throughout each period were as follows:
| | | | | | | | | | | | | | | | | | | | | | | | | |
| | | Delaware VIP Limited-Term Diversified Income Series Standard Class
Year ended |
| | | 12/31/19 | | 12/31/18 | | 12/31/17 | | 12/31/16 | | 12/31/15 |
Net asset value, beginning of period | | | | $ 9.59 | | | | | $ 9.83 | | | | | $ 9.82 | | | | | $ 9.78 | | | | | $ 9.87 | |
| | | | | |
Income (loss) from investment operations: | | | | | | | | | | | | | | | | | | | | | | | | | |
Net investment income1 | | | | 0.22 | | | | | 0.21 | | | | | 0.15 | | | | | 0.11 | | | | | 0.13 | |
Net realized and unrealized gain (loss) | | | | 0.27 | | | | | (0.19 | ) | | | | 0.06 | | | | | 0.09 | | | | | (0.05 | ) |
| | | | | | | | | | | | | | | | | | | | | | | | | |
Total from investment operations | | | | 0.49 | | | | | 0.02 | | | | | 0.21 | | | | | 0.20 | | | | | 0.08 | |
| | | | | | | | | | | | | | | | | | | | | | | | | |
| | | | | |
Less dividends and distributions from: | | | | | | | | | | | | | | | | | | | | | | | | | |
Net investment income | | | | (0.26 | ) | | | | (0.26 | ) | | | | (0.20 | ) | | | | (0.16 | ) | | | | (0.17 | ) |
| | | | | | | | | | | | | | | | | | | | | | | | | |
Total dividends and distributions | | | | (0.26 | ) | | | | (0.26 | ) | | | | (0.20 | ) | | | | (0.16 | ) | | | | (0.17 | ) |
| | | | | | | | | | | | | | | | | | | | | | | | | |
| | | | | |
Net asset value, end of period | | | | $ 9.82 | | | | | $ 9.59 | | | | | $ 9.83 | | | | | $ 9.82 | | | | | $ 9.78 | |
| | | | | | | | | | | | | | | | | | | | | | | | | |
| | | | | |
Total return2 | | | | 5.21% | | | | | 0.24% | | | | | 2.17% | | | | | 2.09% | | | | | 0.78% | |
| | | | | |
Ratios and supplemental data: | | | | | | | | | | | | | | | | | | | | | | | | | |
Net assets, end of period (000 omitted) | | | | $131,920 | | | | | $260,009 | | | | | $98,895 | | | | | $81,412 | | | | | $62,646 | |
Ratio of expenses to average net assets3 | | | | 0.54% | | | | | 0.54% | | | | | 0.55% | | | | | 0.55% | | | | | 0.56% | |
Ratio of net investment income to average net assets | | | | 2.27% | | | | | 2.14% | | | | | 1.49% | | | | | 1.15% | | | | | 1.36% | |
Portfolio turnover | | | | 97% | | | | | 125% | | | | | 135% | | | | | 143% | | | | | 128% | |
| 1 | The average shares outstanding have been applied for per share information. |
| 2 | Total return is based on the change in net asset value of a share during the period and assumes reinvestment of dividends and distributions at net asset value. Total return does not include fees, charges, or expenses imposed by the variable annuity and life insurance contracts for which Delaware VIP Trust serves as an underlying investment vehicle. |
| 3 | Expense ratios do not include expenses of the Underlying Funds in which the Series invests. |
See accompanying notes, which are an integral part of the financial statements.
Limited-Term Diversified Income Series-17
Delaware VIP® Limited-Term Diversified Income Series
Financial highlights (continued)
Selected data for each share of the Series outstanding throughout each period were as follows:
| | | | | | | | | | | | | | | | | | | | | | | | | |
| | | Delaware VIP Limited-Term Diversified Income Series Service Class
Year ended |
| | | 12/31/19 | | 12/31/18 | | 12/31/17 | | 12/31/16 | | 12/31/15 |
Net asset value, beginning of period | | | | $ 9.53 | | | | | $ 9.76 | | | | | $ 9.75 | | | | | $ 9.72 | | | | | $ 9.80 | |
| | | | | |
Income (loss) from investment operations: | | | | | | | | | | | | | | | | | | | | | | | | | |
Net investment income1 | | | | 0.19 | | | | | 0.18 | | | | | 0.12 | | | | | 0.09 | | | | | 0.11 | |
Net realized and unrealized gain (loss) | | | | 0.26 | | | | | (0.18 | ) | | | | 0.07 | | | | | 0.08 | | | | | (0.05 | ) |
| | | | | | | | | | | | | | | | | | | | | | | | | |
Total from investment operations | | | | 0.45 | | | | | — | | | | | 0.19 | | | | | 0.17 | | | | | 0.06 | |
| | | | | | | | | | | | | | | | | | | | | | | | | |
| | | | | |
Less dividends and distributions from: | | | | | | | | | | | | | | | | | | | | | | | | | |
Net investment income | | | | (0.23 | ) | | | | (0.23 | ) | | | | (0.18 | ) | | | | (0.14 | ) | | | | (0.14 | ) |
| | | | | | | | | | | | | | | | | | | | | | | | | |
Total dividends and distributions | | | | (0.23 | ) | | | | (0.23 | ) | | | | (0.18 | ) | | | | (0.14 | ) | | | | (0.14 | ) |
| | | | | | | | | | | | | | | | | | | | | | | | | |
| | | | | |
Net asset value, end of period | | | | $ 9.75 | | | | | $ 9.53 | | | | | $ 9.76 | | | | | $ 9.75 | | | | | $ 9.72 | |
| | | | | | | | | | | | | | | | | | | | | | | | | |
| | | | | |
Total return2 | | | | 4.81% | | | | | 0.04% | 3 | | | | 1.92% | 3 | | | | 1.73% | 3 | | | | 0.62% | 3 |
| | | | | | |
Ratios and supplemental data: | | | | | | | | | | | | | | | | | | | | | | | | | |
Net assets, end of period (000 omitted) | | | | $1,216,346 | | | | | $1,220,337 | | | | | $1,319,169 | | | | | $1,325,979 | | | | | $1,370,899 | |
Ratio of expenses to average net assets4 | | | | 0.84% | | | | | 0.82% | | | | | 0.80% | | | | | 0.80% | | | | | 0.81% | |
Ratio of expenses to average net assets prior to fees waived4 | | | | 0.84% | | | | | 0.84% | | | | | 0.85% | | | | | 0.85% | | | | | 0.86% | |
Ratio of net investment income to average net assets | | | | 1.97% | | | | | 1.86% | | | | | 1.24% | | | | | 0.90% | | | | | 1.11% | |
Ratio of net investment income to average net assets prior to fees waived | | | | 1.97% | | | | | 1.84% | | | | | 1.19% | | | | | 0.85% | | | | | 1.06% | |
Portfolio turnover | | | | 97% | | | | | 125% | | | | | 135% | | | | | 143% | | | | | 128% | |
| 1 | The average shares outstanding have been applied for per share information. |
| 2 | Total return is based on the change in net asset value of a share during the period and assumes reinvestment of dividends and distributions at net asset value. |
| 3 | Total return during the period reflects a waiver by the manager and/or distributor. Performance would have been lower had the waiver not been in effect. |
| 4 | Expense ratios do not include expenses of the Underlying Funds in which the Series invests. |
See accompanying notes, which are an integral part of the financial statements.
Emerging Markets Series-18
Delaware VIP® Trust — Delaware VIP Limited-Term Diversified Income Series
Notes to financial statements
December 31, 2019
Delaware VIP Trust (Trust) is organized as a Delaware statutory trust and offers 22 series, each of which is treated as a separate entity for certain matters under the Investment Company Act of 1940, as amended (1940 Act). These financial statements and the related notes pertain to Delaware VIP Limited-Term Diversified Income Series (Series). The Trust is anopen-end investment company. The Series is considered diversified under the 1940 Act and offers Standard Class and Service Class shares. The Standard Class shares do not carry a distribution and service(12b-1) fee and the Service Class shares carry a12b-1 fee. The shares of the Series are sold only to separate accounts of life insurance companies.
1. Significant Accounting Policies
The Series follows accounting and reporting guidance under Financial Accounting Standards Board (FASB) Accounting Standards Codification Topic 946, Financial Services - Investment Companies. The following accounting policies are in accordance with US generally accepted accounting principles (US GAAP) and are consistently followed by the Series.
Security Valuation — Debt securities and credit default swap (CDS) contracts are valued based upon valuations provided by an independent pricing service or broker/counterparty and reviewed by management. To the extent current market prices are not available, the pricing service may take into account developments related to the specific security, as well as transactions in comparable securities. US government and agency securities are valued at the mean between the bid and ask prices, which approximates fair value.Open-end investment companies are valued at their published net asset value (NAV). Valuations for fixed income securities utilize matrix systems, which reflect such factors as security prices, yields, maturities, and ratings, and are supplemented by dealer and exchange quotations. For asset-backed securities, collateralized mortgage obligations, commercial mortgage securities, and US government agency mortgage securities, pricing vendors utilize matrix pricing which considers prepayment speed, attributes of the collateral, yield or price of bonds of comparable quality, coupon, maturity, and type as well as broker/dealer-supplied prices. Equity securities, except those traded on the Nasdaq Stock Market LLC (Nasdaq), are valued at the last quoted sales price as of the time of the regular close of the New York Stock Exchange on the valuation date. Equity securities traded on the Nasdaq are valued in accordance with the Nasdaq Official Closing Price, which may not be the last sales price. If, on a particular day, an equity security does not trade, the mean between the bid and ask prices will be used, which approximates fair value. Swap prices are derived using daily swap curves and models that incorporate a number of market data factors, such as discounted cash flows, trades, and values of the underlying reference instruments. Investments in repurchase agreements are generally valued at par, which approximates fair value, each business day. Generally, other securities and assets for which market quotations are not readily available are valued at fair value as determined in good faith under the direction of the Trust’s Board of Trustees (Board). In determining whether market quotations are readily available or fair valuation will be used, various factors will be taken into consideration, such as market closures or suspension of a trading in a security. Restricted securities are valued at fair value using methods approved by the Board.
Federal and Foreign Income Taxes — No provision for federal income taxes has been made as the Series intends to continue to qualify for federal income tax purposes as a regulated investment company under Subchapter M of the Internal Revenue Code of 1986, as amended, and make the requisite distributions to shareholders. The Series evaluates tax positions taken or expected to be taken in the course of preparing the Series’ tax returns to determine whether the tax positions are“more-likely-than-not” of being sustained by the applicable tax authority. Tax positions not deemed to meet the“more-likely-than-not” threshold are recorded as a tax benefit or expense in the current year. Management has analyzed the Series’ tax positions taken or expected to be taken on the Series’ federal income tax returns through the year ended Dec. 31, 2019 and for all open tax years (years ended Dec. 31, 2016–Dec. 31, 2018), and has concluded that no provision for federal income tax is required in the Series’ financial statements. In regard to foreign taxes only, the Series has open tax years in certain foreign countries in which it invests that may date back to the inception of the Series. If applicable, the Series recognizes interest accrued on unrecognized tax benefits in interest expense and penalties in “Other expenses” on the “Statement of operations.” During the year ended Dec. 31, 2019, the Series did not incur any interest or tax penalties.
Class Accounting — Investment income and common expenses are allocated to the classes of the Series on the basis of “settled shares” of each class in relation to the net assets of the Series. Realized and unrealized gain (loss) on investments is allocated to the classes of the Series on the basis of daily net assets of each class. Distribution expenses relating to a specific class are charged directly to that class.
Repurchase Agreements — The Series may purchase certain US government securities subject to the counterparty’s agreement to repurchase them at an agreed upon date and price. The counterparty will be required on a daily basis to maintain the value of the collateral subject to the agreement at not less than the repurchase price (including accrued interest). The agreements are conditioned upon the collateral being deposited under the Federal Reserve book-entry system with the Series’ custodian or a third-partysub-custodian. In the event of default or bankruptcy by the other party to the agreement, retention of the collateral may be subject to legal proceedings. All open repurchase agreements as of the date of this report were entered into on June 30, 2019, and matured on the next business day. At June 30, 2019, the Series held no investments in repurchase agreements.
To Be Announced Trades (TBA) — The Series may contract to purchase or sell securities for a fixed price at a transaction date beyond the customary settlement period (examples: when issued, delayed delivery, forward commitment, or TBA transactions) consistent with the Series’ ability to manage its investment portfolio and meet redemption requests. These transactions involve a commitment by the Series to purchase or sell securities for a predetermined price or yield with payment and delivery taking place more than three days in the future, or after a period longer than the customary
Limited-Term Diversified Income Series-19
Delaware VIP® Limited-Term Diversified Income Series
Notes to financial statements (continued)
1. Significant Accounting Policies (continued)
settlement period for that type of security. No interest will be earned by the Series on such purchases until the securities are delivered or the transaction is completed; however, the market value may change prior to delivery.
Use of Estimates — The preparation of financial statements in conformity with US GAAP requires management to make estimates and assumptions that affect the fair value of investments, the reported amounts of assets and liabilities and disclosure of contingent assets and liabilities at the date of the financial statements, and the reported amounts of revenues and expenses during the reporting period. Actual results could differ from those estimates and the differences could be material.
Other — Expenses directly attributable to the Series are charged directly to the Series. Other expenses common to various funds within the Delaware Funds® by Macquarie (Delaware Funds) are generally allocated among such funds on the basis of average net assets. Management fees and certain other expenses are paid monthly. Security transactions are recorded on the date the securities are purchased or sold (trade date) for financial reporting purposes. Costs used in calculating realized gains and losses on the sale of investment securities are those of the specific securities sold. Interest income is recorded on the accrual basis. Discounts and premiums are accreted and amortized using the effective interest method. Realized gains (losses) on paydowns of mortgage- and asset-backed securities are classified as interest income. The Series declares dividends daily from net investment income and pays the dividends monthly and declares and pays distributions from net realized gain on investments, if any, following the close of the fiscal year. The Series may distribute more frequently, if necessary for tax purposes. Dividends and distributions, if any, are recorded on theex-dividend date.
The Series receives earnings credits from its custodian when positive cash balances are maintained, which may be used to offset custody fees. The expenses paid under this arrangement are included on the “Statement of operations” under “Custodian fees” with the corresponding expenses offset included under “Less expenses paid indirectly.” For the year ended Dec. 31, 2019, the Series earned $11,598 under this arrangement.
The Series receives earnings credits from its transfer agent when positive cash balances are maintained, which may be used to offset transfer agent fees. If the amount earned is greater than $1, the expenses paid under this arrangement are included on the “Statement of operations” under “Dividend disbursing and transfer agent fees and expenses” with the corresponding expenses offset included under “Less expenses paid indirectly.” For the year ended Dec. 31, 2019, the Series earned $2 under this arrangement.
2. Investment Management, Administration Agreements, and Other Transactions with Affiliates
In accordance with the terms of its investment management agreement, the Series pays Delaware Management Company (DMC), a series of Macquarie Investment Management Business Trust and the investment manager, an annual fee which is calculated daily and paid monthly at the rates of 0.50% on the first $500 million of average daily net assets of the Series, 0.475% on the next $500 million, 0.45% on the next $1.5 billion, and 0.425% on average daily net assets in excess of $2.5 billion.
Effective May 30, 2019, DMC may seek investment advice and recommendations from its affiliates: Macquarie Investment Management Europe Limited, Macquarie Investment Management Austria Kapitalanlage AG, and Macquarie Investment Management Global Limited (together, the “AffiliatedSub-Advisors”). The Manager may also permit these AffiliatedSub-Advisors to execute Fund security trades on behalf of the Manager and exercise investment discretion for securities in certain markets where DMC believes it will be beneficial to utilize an AffiliatedSub-Advisor’s specialized market knowledge. Although the AffiliatedSub-Advisors serve assub-advisors, DMC has ultimate responsibility for all investment advisory services. For these services, DMC, not the Series, pays each AffiliatedSub-Advisor a portion of its investment management fee.
DMC has contractually agreed to waive that portion, if any, of its management fee and reimburse the Series to the extent necessary to ensure that annual operating expenses (excluding any12b-1 fees, acquired fund fees and expenses, taxes, interest, short sale dividend and interest expenses, brokerage fees, certain insurance costs, and nonroutine expenses or costs, including, but not limited to, those relating to reorganizations, litigation, conducting shareholder meetings, and liquidations), do not exceed 0.55% of the Series’ average daily net assets from April 30, 2019 through Dec. 31, 2019.* Prior to April 30, 2019, the expenses were capped at 0.56% of the Series’ average daily net assets. These expense waivers and reimbursements may only be terminated by agreement of DMC and the Series. The waivers and reimbursements are accrued daily and received monthly.
Delaware Investments Fund Services Company (DIFSC), an affiliate of DMC, provides fund accounting and financial administration oversight services to the Series. For these services, DIFSC’s fees are calculated daily and paid monthly based on the aggregate daily net assets of all funds within the Delaware Funds at the following annual rates: 0.00475% of the first $35 billion; 0.0040% of the next $10 billion; and 0.0025% of aggregate average daily net assets in excess of $45 billion (Total Fee). Each fund in the Delaware Funds pays a minimum of $4,000, which, in aggregate, is subtracted from the Total Fee. Each fund then pays its portion of the remainder of the Total Fee on a relative NAV basis. This amount is included on the “Statement of operations” under “Accounting and administration expenses.” For the year ended Dec. 31, 2019, the Series was charged $54,383 for these services.
DIFSC is also the transfer agent and dividend disbursing agent of the Series. For these services, DIFSC’s fees are calculated daily and paid monthly at the annual rate of 0.0075% of the Series’ average daily net assets. This amount is included on the “Statement of operations” under “Dividend disbursing and
Limited-Term Diversified Income Series-20
Delaware VIP® Limited-Term Diversified Income Series
Notes to financial statements (continued)
transfer agent fees and expenses.” For the year ended Dec. 31, 2019, the Series was charged $103,010 for these services. Pursuant to asub-transfer agency agreement between DIFSC and BNY Mellon Investment Servicing (US) Inc. (BNYMIS), BNYMIS provides certainsub-transfer agency services to the Series.Sub-transfer agency fees are paid by the Series and are also included on the “Statement of operations” under “Dividend disbursing and transfer agent fees and expenses.” The fees that are calculated daily and paid as invoices are received on a monthly or quarterly basis.
Pursuant to a distribution agreement and distribution plan, the Series pays Delaware Distributors, L.P. (DDLP), the distributor and an affiliate of DMC, an annual12b-1 fee of 0.30% of the average daily net assets of the Service Class shares. The fees are calculated daily and paid monthly. Standard Class shares do not pay12b-1 fees.
As provided in the investment management agreement, the Series bears a portion of the cost of certain resources shared with DMC, including the cost of internal personnel of DMC and/or its affiliates that provide legal, tax, and regulatory reporting services to the Series. For the year ended Dec. 31, 2019, the Series was charged $39,530 for internal legal, tax, and regulatory reporting services provided by DMC and/or its affiliates’ employees. This amount is included on the “Statement of operations” under “Legal fees.”
Trustees’ fees include expenses accrued by the Series for each Trustee’s retainer and meeting fees. Certain officers of DMC, DIFSC, and DDLP are officers and/or Trustees of the Trust. These officers and Trustees are paid no compensation by the Series.
In addition to the management fees and other expenses of the Series, the Series indirectly bears the investment management fees and other expenses of the investment companies (Underlying Funds) in which it invests. The amount of these fees and expenses incurred indirectly by the Series will vary based upon the expense and fee levels of the Underlying Funds and the number of shares that are owned of the Underlying Funds at different times.
*The aggregate contractual waiver period covering this report is from May 1, 2018 through April 30, 2020.
3. Investments
For the year ended Dec. 31, 2019, the Series made purchases and sales of investment securities other than short-term investments as follows:
| | | | |
Purchases other than US government securities | | $ | 500,226,847 | |
Purchases of US government securities | | | 733,925,044 | |
Sales other than US government securities | | | 771,544,694 | |
Sales of US government securities | | | 702,759,915 | |
The tax cost of investments includes adjustments to net unrealized appreciation (depreciation) which may not necessarily be final tax cost basis adjustments, but approximate the tax basis unrealized gains and losses that may be realized and distributed to shareholders. At Dec. 31, 2019, the cost and unrealized appreciation (depreciation) of investments for federal income tax purposes for the Series were as follows:
| | | | | | |
Cost of Investments | | Aggregate
Unrealized
Appreciation of Investments | | Aggregate
Unrealized
Depreciation
of Investments | | Net Unrealized
Appreciation
of Investments |
| $1,333,061,638 | | $14,267,038 | | $(5,939,311) | | $8,327,727 |
US GAAP defines fair value as the price that the Series would receive to sell an asset or pay to transfer a liability in an orderly transaction between market participants at the measurement date under current market conditions. A three-level hierarchy for fair value measurements has been established based upon the transparency of inputs to the valuation of an asset or liability. Inputs may be observable or unobservable and refer broadly to the assumptions that market participants would use in pricing the asset or liability. Observable inputs reflect the assumptions market participants would use in pricing the asset or liability based on market data obtained from sources independent of the reporting entity. Unobservable inputs reflect the reporting entity’s own assumptions about the assumptions that market participants would use in pricing the asset or liability based on the best information available under the circumstances. The Series’ investment in its entirety is assigned a level based upon the observability of the inputs which are significant to the overall valuation. The three-level hierarchy of inputs is summarized below.
| | | | |
| Level 1 | | – | | Inputs are quoted prices in active markets for identical investments. (Examples: equity securities,open-end investment companies, futures contracts, and exchange-traded options contracts) |
| Level 2 | | – | | Other observable inputs, including but not limited to: quoted prices for similar assets or liabilities in markets that are active, quoted prices for identical or similar assets or liabilities in markets that are not active, inputs other than quoted prices that are observable for the assets or liabilities (such as interest rates, yield curves, volatilities, prepayment speeds, loss severities, credit risks, and default rates) or other market-corroborated inputs. (Examples: debt securities, government securities, swap contracts, foreign currency exchange contracts, foreign securities utilizing international fair value pricing, broker-quoted securities, and fair valued securities) |
Limited-Term Diversified Income Series-21
Delaware VIP® Limited-Term Diversified Income Series
Notes to financial statements (continued)
3. Investments (continued)
| | | | |
| Level 3 | | – | | Significant unobservable inputs, including the Series’ own assumptions used to determine the fair value of investments. (Examples: broker-quoted securities and fair valued securities) |
Level 3 investments are valued using significant unobservable inputs. The Series may also use an income-based valuation approach in which the anticipated future cash flows of the investment are discounted to calculate fair value. Discounts may also be applied due to the nature or duration of any restrictions on the disposition of the investments. Valuations may also be based upon current market prices of securities that are comparable in coupon, rating, maturity, and industry. The derived value of a Level 3 investment may not represent the value which is received upon disposition and this could impact the results of operations.
The following table summarizes the valuation of the Series’ investments by fair value hierarchy levels as of Dec. 31, 2019:
| | | | | | | | | | | | |
| | | Level 1 | | | Level 2 | | | Total | |
| Securities: | | | | | | | | | | | | |
Assets: | | | | | | | | | | | | |
Agency, Asset- & Mortgage-Backed Securities | | $ | — | | | $ | 532,333,192 | | | $ | 532,333,192 | |
Corporate Debt | | | — | | | | 431,738,985 | | | | 431,738,985 | |
Foreign Debt | | | — | | | | 37,878,442 | | | | 37,878,442 | |
US Treasury Obligations | | | — | | | | 273,888,869 | | | | 273,888,869 | |
Preferred Stock | | | — | | | | 2,722,979 | | | | 2,722,979 | |
Short-Term Investments | | | 17,426,145 | | | | 45,400,753 | | | | 62,826,898 | |
| | | | | | | | | | | | |
Total Value of Securities | | $ | 17,426,145 | | | $ | 1,323,963,220 | | | $ | 1,341,389,365 | |
| | | | | | | | | | | | |
1Security type is valued across multiple levels. Level 1 investments represent exchange-traded investments and Level 2 investments represent investments with observable inputs or matrix-price investments. The amounts attributed to Level 1 and Level 2 investments represent 27.74% and 72.26% of the total market value of these types of securities.
During the year ended Dec. 31, 2019, there were no transfers between Level 1 investments, Level 2 investments, or Level 3 investments that had a significant impact to the Series. The Series’ policy is to recognize transfers between levels based on fair value at the beginning of the reporting period.
A reconciliation of Level 3 investments is presented when the Series has a significant amount of Level 3 investments at the beginning, interim, or end of the period in relation to the Series’ net assets. During the year ended Dec. 31, 2019, there were no Level 3 investments.
4. Dividend and Distribution Information
Income and long-term capital gain distributions are determined in accordance with federal income tax regulations, which may differ from US GAAP. Additionally, distributions from net short-term gains on sales of investment securities are treated as ordinary income for federal income tax purposes. The tax character of dividends and distributions paid during the years ended Dec. 31, 2019 and 2018 were as follows:
| | | | | | | | |
| | | Year ended | |
| | | 12/31/19 | | | 12/31/18 | |
Ordinary income | | | $33,750,780 | | | | $34,165,076 | |
5. Components of Net Assets on a Tax Basis
As of Dec. 31, 2019, the components of net assets on a tax basis were as follows:
| | | | |
Shares of beneficial interest | | | $1,367,825,840 | |
Undistributed ordinary income | | | 60,545 | |
Distributions payable | | | (690,854 | ) |
Capital loss carryforwards | | | (27,256,848 | ) |
Net unrealized appreciation on investments and derivatives | | | 8,327,727 | |
| | | | |
Net assets | | | $1,348,266,410 | |
| | | | |
The differences between book basis and tax basis components of net assets are primarily attributable to tax deferral of losses on wash sales, CDS contracts, and tax treatment of market discount and premium on debt instruments.
Limited-Term Diversified Income Series-22
Delaware VIP® Limited-Term Diversified Income Series
Notes to financial statements (continued)
For federal income tax purposes, $7,133,933 of capital loss carryforwards from prior years was utilized in the year ended Dec. 31, 2019.
At Dec. 31, 2019, capital loss carryforwards available to offset future realized capital gains were as follows:
| | | | | | | | |
| Loss carryforward character | |
| Short-term | | Long-term | | | Total | |
| $5,342,921 | | $ | 21,913,927 | | | $ | 27,256,848 | |
6. Capital Shares
Transactions in capital shares were as follows:
| | | | | | | | |
| | | Year ended | |
| | | 12/31/19 | | | 12/31/18 | |
Shares sold: | | | | | | | | |
Standard Class | | | 2,945,915 | | | | 18,614,807 | |
Service Class | | | 5,594,251 | | | | 4,354,095 | |
Shares issued upon reinvestment of dividends and distributions: | | | | | | | | |
Standard Class | | | 437,511 | | | | 302,220 | |
Service Class | | | 3,049,373 | | | | 3,219,800 | |
| | | | | | | | |
| | | 12,027,050 | | | | 26,490,922 | |
| | | | | | | | |
Shares redeemed: | | | | | | | | |
Standard Class | | | (17,056,074 | ) | | | (1,869,984 | ) |
Service Class | | | (12,012,320 | ) | | | (14,614,581 | ) |
| | | | | | | | |
| | | (29,068,394 | ) | | | (16,484,565 | ) |
| | | | | | | | |
Net increase (decrease) | | | (17,041,344 | ) | | | 10,006,357 | |
| | | | | | | | |
7. Line of Credit
The Series, along with certain other funds in the Delaware Funds® by Macquarie (Participants), was a participant in a $220,000,000 revolving line of credit intended to be used for temporary or emergency purposes as an additional source of liquidity to fund redemptions of investor shares. Under the agreement, the Participants were charged an annual commitment fee of 0.15%, which was allocated across the Participants based on a weighted average of the respective net assets of each Participant. The Participants were permitted to borrow up to a maximum ofone-third of their net assets under the agreement. Each Participant was individually, and not jointly, liable for its particular advances, if any, under the line of credit. The line of credit available under the agreement expired on Nov. 4, 2019.
On Nov. 4, 2019, the Participants entered into an amendment to the agreement for a $250,000,000 revolving line of credit. The revolving line of credit is to be used as described above and operates in substantially the same manner as the original agreement. The line of credit available under the agreement expires on Nov. 2, 2020.
The Series had no amounts outstanding as of Dec. 31, 2019 or at any time during the year then ended.
8. Derivatives
US GAAP requires disclosures that enable investors to understand: (1) how and why an entity uses derivatives; (2) how they are accounted for; and (3) how they affect an entity’s results of operations and financial position.
Swap Contracts
The Series may enter into CDS contracts in the normal course of pursuing its investment objective. The Series may enter into CDS contracts in order to hedge against a credit event, to enhance total return or to gain exposure to certain securities or markets. The Series will not be permitted to enter into any swap transactions unless, at the time of entering into such transactions, the unsecured long-term debt of the actual counterparty, combined with any credit enhancements, is rated at leastBBB- by Standard & Poor’s Financial Services LLC (S&P) or Baa3 by Moody’s Investors Service, Inc. (Moody’s) or is determined to be of equivalent credit quality by DMC.
Credit Default Swaps. A CDS contract is a risk-transfer instrument through which one party (purchaser of protection) transfers to another party (seller of protection) the financial risk of a credit event (as defined in the CDS agreement), as it relates to a particular reference security or basket of securities (such as an index). In exchange for the protection offered by the seller of protection, the purchaser of protection agrees to pay the seller of protection a periodic
Limited-Term Diversified Income Series-23
Delaware VIP® Limited-Term Diversified Income Series
Notes to financial statements (continued)
8. Derivatives (continued)
amount at a stated rate that is applied to the notional amount of the CDS contract. In addition, an upfront payment may be made or received by the Series in connection with an unwinding or assignment of a CDS contract. Upon the occurrence of a credit event, the seller of protection would pay the par (or other agreed-upon) value of the reference security (or basket of securities) to the counterparty. Credit events generally include, among others, bankruptcy, failure to pay, and obligation default.
During the year ended Dec. 31, 2019, the Series entered into CDS contracts as a purchaser of protection. Periodic payments (receipt) on such contracts are accrued daily and recorded as unrealized losses (gains) on swap contracts. Upon payment (receipt), such amounts are recorded as realized losses (gains) on swap contracts. Upfront payments made or received in connection with CDS contracts are amortized over the expected life of the CDS contracts as unrealized losses (gains) on swap contracts. The change in value of CDS contracts is recorded daily as unrealized appreciation or depreciation. A realized gain or loss is recorded upon a credit event (as defined in the CDS agreement) or the maturity or termination of the agreement. Initial margin and variation margin are posted to central counterparties for centrally cleared CDS basket trades, as determined by the applicable central counterparty. During the year ended Dec. 31, 2019, the Series did not enter into any CDS contracts as a seller of protection.
CDS contracts may involve greater risks than if the Series had invested in the reference obligation directly. CDS contracts are subject to general market risk, liquidity risk, counterparty risk, and credit risk. The Series’ maximum risk of loss from counterparty credit risk, either as the seller of protection or the buyer of protection, is the fair value of the contract. This risk is mitigated by (1) For bilateral swap contracts, having a netting arrangement between the Series and the counterparty and by the posting of collateral by the counterparty to the Series to cover the Series’ exposure to the counterparty, and (2) for cleared swaps, trading these instruments through a central counterparty. No CDS contracts were outstanding at Dec. 31, 2019.
During the year ended Dec. 31, 2019, the Series entered in to CDS contracts to hedge against credit events.
Swaps Generally. The value of open swaps may differ from that which would be realized in the event the Series terminated its position in the contract on a given day. Risks of entering into these contracts include the potential inability of the counterparty to meet the terms of the contracts. This type of risk is generally limited to the amount of favorable movement in the value of the underlying security, instrument or basket of instruments, if any, at the day of default. Risks also arise from potential losses from adverse market movements and such losses could exceed the unrealized amounts shown on the “Schedule of investments.”
The table below summarizes the average balance of derivative holdings by the Series during the year ended Dec. 31, 2019.
| | | | |
| | | Long
Derivative | | Short
Derivative |
| | | Volume | | Volume |
CDS contracts (average notional value)* | | $15,651,429 | | $— |
*Long represents buying protection and short represents selling protection.
9. Securities Lending
The Series, along with other funds in the Delaware Funds, may lend its securities pursuant to a security lending agreement (Lending Agreement) with The Bank of New York Mellon (BNY Mellon). At the time a security is loaned, the borrower must post collateral equal to the required percentage of the market value of the loaned security, including any accrued interest. The required percentage is: (1) 102% with respect to US securities and foreign securities that are denominated and payable in US dollars; and (2) 105% with respect to foreign securities. With respect to each loan, if on any business day the aggregate market value of securities collateral plus cash collateral held is less than the aggregate market value of the securities which are the subject of such loan, the borrower will be notified to provide additional collateral by the end of the following business day, which, together with the collateral already held, will be not less than the applicable initial collateral requirements for such security loan. If the aggregate market value of securities collateral and cash collateral held with respect to a security loan exceeds the applicable initial collateral requirement, upon the request of the borrower, BNY Mellon must return enough collateral to the borrower by the end of the following business day to reduce the value of the remaining collateral to the applicable initial collateral requirement for such security loan. As a result of the foregoing, the value of the collateral held with respect to a loaned security on any particular day may be more or less than the value of the security on loan. The collateral percentage with respect to the market value of the loaned security is determined by the security lending agent.
Cash collateral received by each series of the Trust is generally invested in a series of individual separate accounts, each corresponding to a series. The investment guidelines permit each separate account to hold certain securities that would be considered eligible securities for a money market fund. Cash collateral received is generally invested in government securities; certain obligations issued by government sponsored enterprises; repurchase agreements collateralized by US Treasury securities; obligations issued by the central government of any Organization for Economic Cooperation and Development (OECD) country or its agencies, instrumentalities, or establishments; obligations of supranational organizations; commercial paper, notes, bonds, and other
Limited-Term Diversified Income Series-24
Delaware VIP® Limited-Term Diversified Income Series
Notes to financial statements (continued)
debt obligations; certificates of deposit, time deposits, and other bank obligations; and asset-backed securities. A series can also accept US government securities and letters of credit(non-cash collateral) in connection with securities loans.
In the event of default or bankruptcy by the lending agent, realization and/or retention of the collateral may be subject to legal proceedings. In the event the borrower fails to return loaned securities and the collateral received is insufficient to cover the value of the loaned securities and provided such collateral shortfall is not the result of investment losses, the lending agent has agreed to pay the amount of the shortfall to the Series or, at the discretion of the lending agent, replace the loaned securities. The Series continues to record dividends or interest, as applicable, on the securities loaned and is subject to changes in value of the securities loaned that may occur during the term of the loan. The Series has the right under the Lending Agreement to recover the securities from the borrower on demand. With respect to security loans collateralized bynon-cash collateral, the Series receives loan premiums paid by the borrower. With respect to security loans collateralized by cash collateral, the earnings from the collateral investments are shared among the Series, the security lending agent, and the borrower. The Series records security lending income net of allocations to the security lending agent and the borrower.
The Series may incur investment losses as a result of investing securities lending collateral. This could occur if an investment in the collateral investment account defaulted or became impaired. Under those circumstances, the value of a Series’ cash collateral account may be less than the amount the Series would be required to return to the borrowers of the securities and the Series would be required to make up for this shortfall.
During the year ended Dec. 31, 2019, the Series had no securities out on loan.
10. Credit and Market Risk
When interest rates rise, fixed income securities (i.e. debt obligations) generally will decline in value. These declines in value are greater for fixed income securities with longer maturities or durations.
The risk that potential changes related to the use of the London Interbank Offered Rate (LIBOR) could have adverse impacts on financial instruments which reference LIBOR. The potential abandonment of LIBOR could affect the value and liquidity of instruments which reference LIBOR.
The Series invests in fixed income securities whose value is derived from an underlying pool of mortgages or consumer loans. The value of these securities is sensitive to changes in economic conditions, including delinquencies and/or defaults, and may be adversely affected by shifts in the market’s perception of the issuers and changes in interest rates. Investors receive principal and interest payments as the underlying mortgages and consumer loans are paid back. Some of these securities are collateralized mortgage obligations (CMOs). CMOs are debt securities issued by US government agencies or by financial institutions and other mortgage lenders, which are collateralized by a pool of mortgages held under an indenture. Prepayment of mortgages may shorten the stated maturity of the obligations and can result in a loss of premium, if any has been paid. Certain of these securities may be stripped (securities which provide only the principal or interest feature of the underlying security). The yield to maturity on an interest-only CMO is extremely sensitive not only to changes in prevailing interest rates, but also to the rate of principal payments (including prepayments) on the related underlying mortgage assets. A rapid rate of principal payments may have a material adverse effect on the Series’ yield to maturity. If the underlying mortgage assets experience greater than anticipated prepayments of principal, the Series may fail to recoup its initial investment in these securities even if the securities are rated in the highest rating categories.
The Series invests in high yield fixed income securities, which are securities rated lower thanBBB- by Standard & Poor’s Financial Services LLC and lower than Baa3 by Moody’s Investors Service, Inc. or similarly rated by another nationally recognized statistical rating organization. Investments in these higher yielding securities are generally accompanied by a greater degree of credit risk than higher-rated securities. Additionally, lower-rated securities may be more susceptible to adverse economic and competitive industry conditions than investment grade securities.
The Series invests in certain obligations held by the Series that may have liquidity protection designed to ensure that the receipt of payments due on the underlying security is timely. Such protection may be provided through guarantees, insurance policies or letter of credit obtained by the issuer or sponsor through third parties, through various means of structuring the transaction or through a combination of such approaches. The Series will not pay any additional fees for such credit support, although the existence of credit support may increase the price of the security.
The Series may invest up to 15% of its net assets in illiquid securities, which may include securities with contractual restrictions on resale, securities exempt from registration under Rule 144A promulgated under the Securities Act of 1933, as amended, and other securities which may not be readily marketable. The relative illiquidity of these securities may impair the Series from disposing of them in a timely manner and at a fair price when it is necessary or desirable to do so. While maintaining oversight, the Board has delegated to DMC theday-to-day functions of determining whether individual securities are liquid for purposes of the Series’ limitation on investments in illiquid securities. Securities eligible for resale pursuant to Rule 144A, which are determined to be liquid, are not subject to the Series’ 15% limit on investments in illiquid securities. As of Dec. 31, 2019, Rule 144A securities have been identified on the “Schedule of investments.”
Limited-Term Diversified Income Series-25
Delaware VIP® Limited-Term Diversified Income Series
Notes to financial statements (continued)
11. Contractual Obligations
The Series enters into contracts in the normal course of business that contain a variety of indemnifications. The Series’ maximum exposure under these arrangements is unknown. However, the Series has not had prior claims or losses pursuant to these contracts. Management has reviewed the Series’ existing contracts and expects the risk of loss to be remote.
12. Recent Accounting Pronouncements
In March 2017, the FASB issued an Accounting Standards Update (ASU), ASU2017-08, Receivables — Nonrefundable Fees and Other Costs (Subtopic310-20), Premium Amortization on Purchased Callable Debt Securities which amends the amortization period for certain callable debt securities purchased at a premium, shortening such period to the earliest call date. ASU2017-08 does not require any accounting change for debt securities held at a discount; the discount continues to be amortized to maturity. ASU2017-08 is effective for fiscal years, and interim periods within those fiscal years, beginning after Dec. 15, 2018. Management has implemented ASU2017-08 and determined that the impact of this guidance to the Series’ net assets at the end of the year is not material.
In August 2018, the FASB issued ASU2018-13, which changes certain fair value measurement disclosure requirements. ASU2018-13, in addition to other modifications and additions, removes the requirement to disclose the amount and reasons for transfers between Level 1 and Level 2 of the fair value hierarchy, the policy for the timing of transfers between levels and the valuation process for Level 3 fair value measurements. ASU2018-13 is effective for fiscal years, and interim periods within those fiscal years, beginning after Dec. 15, 2019. At this time, management is evaluating the implications of these changes on the financial statements.
13. Subsequent Events
Management has determined that no material events or transactions occurred subsequent to Dec. 31, 2019, that would require recognition or disclosure in the Series’ financial statements.
Limited-Term Diversified Income Series-26
Delaware VIP® Trust — Delaware VIP Limited-Term Diversified Income Series
Report of independent registered public accounting firm
To the Board of Trustees of Delaware VIP® Trust and Shareholders of Delaware VIP Limited-Term Diversified Income Series
Opinion on the Financial Statements
We have audited the accompanying statement of assets and liabilities, including the schedule of investments, of Delaware VIP Limited-Term Diversified Income Series (one of the series constituting Delaware VIP® Trust, referred to hereafter as the “Series”) as of December 31, 2019, the related statement of operations for the year ended December 31, 2019, the statements of changes in net assets for each of the two years in the period ended December 31, 2019, including the related notes, and the financial highlights for each of the five years in the period ended December 31, 2019 (collectively referred to as the “financial statements”). In our opinion, the financial statements present fairly, in all material respects, the financial position of the Series as of December 31, 2019, the results of its operations for the year then ended, the changes in its net assets for each of the two years in the period ended December 31, 2019 and the financial highlights for each of the five years in the period ended December 31, 2019 in conformity with accounting principles generally accepted in the United States of America.
Basis for Opinion
These financial statements are the responsibility of the Series’ management. Our responsibility is to express an opinion on the Series’ financial statements based on our audits. We are a public accounting firm registered with the Public Company Accounting Oversight Board (United States) (PCAOB) and are required to be independent with respect to the Series in accordance with the U.S. federal securities laws and the applicable rules and regulations of the Securities and Exchange Commission and the PCAOB.
We conducted our audits of these financial statements in accordance with the standards of the PCAOB. Those standards require that we plan and perform the audit to obtain reasonable assurance about whether the financial statements are free of material misstatement, whether due to error or fraud.
Our audits included performing procedures to assess the risks of material misstatement of the financial statements, whether due to error or fraud, and performing procedures that respond to those risks. Such procedures included examining, on a test basis, evidence regarding the amounts and disclosures in the financial statements. Our audits also included evaluating the accounting principles used and significant estimates made by management, as well as evaluating the overall presentation of the financial statements. Our procedures included confirmation of securities owned as of December 31, 2019 by correspondence with the custodian and transfer agents. We believe that our audits provide a reasonable basis for our opinion.
/s/PricewaterhouseCoopers LLP
Philadelphia, Pennsylvania
February 21, 2020
We have served as the auditor of one or more investment companies in Delaware Funds® by Macquarie since 2010.
Limited-Term Diversified Income Series-27
Delaware VIP® Trust — Delaware VIP Limited-Term Diversified Income Series
Other Series information (Unaudited)
Board consideration of Investment Advisory andSub-Advisory Agreements for Delaware VIP Limited-Term Diversified Income Series at a meeting held August21-22, 2019
At a meeting held on Aug.21-22, 2019 (the “Annual Meeting”), the Board of Trustees (the “Board”), including a majority of disinterested or independent Trustees, approved the renewal of the investment advisory andsub-advisory agreements for Delaware VIP Limited-Term Diversified Income Series (the “Series”). In making its decision, the Board considered information furnished at regular quarterly Board meetings, including reports detailing Series performance, investment strategies, and expenses, as well as information prepared specifically in connection with the renewal of the investment advisory andsub-advisory contracts. Information furnished specifically in connection with the renewal of the Investment Management Agreement with Delaware Management Company (“DMC”), a series of Macquarie Investment Management Business Trust (“MIMBT”) and theSub-Advisory Agreements with Macquarie Investment Management Europe Limited (“MIMEL”) and Macquarie Investment Management Global Limited (“MIMGL”), included materials provided by DMC and its affiliates (collectively, “Macquarie Investment Management”), MIMEL, and MIMGL, concerning, among other things, the nature, extent, and quality of services provided to the Series; the costs of such services to the Series; economies of scale; and the investment manager’s financial condition and profitability. In addition, in connection with the Annual Meeting, materials were provided to the Trustees in May 2019, including reports provided by Broadridge Financial Solutions (“Broadridge”). The Broadridge reports compared the Series’ investment performance and expenses with those of other comparable mutual funds. The Independent Trustees reviewed and discussed the Broadridge reports with independent legal counsel to the Independent Trustees. In addition to the information noted above, the Board also requested and received information regarding DMC’s policy with respect to advisory fee levels and its breakpoint philosophy; the structure of portfolio manager compensation; comparative client fee information; and any constraints or limitations on the availability of securities for certain investment styles, which had in the past year inhibited, or which were likely in the future to inhibit, the investment manager’s ability to invest fully in accordance with Series policies.
In considering information relating to the approval of the Series’ investment advisory andsub-advisory agreements, the Independent Trustees received assistance and advice from and met separately with independent legal counsel to the Independent Trustees and also received assistance and advice from an experienced and knowledgeable independent fund consultant, JDL Consultants, LLC (“JDL”). Although the Board gave attention to all information furnished, the following discussion identifies, under separate headings, the primary factors taken into account by the Board during its contract renewal considerations.
Nature, extent, and quality of services.The Board considered the services provided by DMC to the Series and its shareholders. In reviewing the nature, extent, and quality of services, the Board considered reports furnished to it throughout the year, which covered matters such as the relative performance of the Series; compliance of portfolio managers with the investment policies, strategies, and restrictions for the Series; compliance by DMC and Delaware Distributors, L.P. (together, “Management”) personnel with the Code of Ethics adopted throughout the Delaware Funds® by Macquarie (the “Delaware Funds”); and adherence to fair value pricing procedures as established by the Board. The Board was pleased with the current staffing of DMC and the emphasis placed on research in the investment process. The Board recognized DMC’s receipt of certain favorable industry distinctions during the past several years. The Board gave favorable consideration to DMC’s efforts to control expenses while maintaining service levels committed to Series matters. The Board was satisfied with the nature, extent, and quality of the overall services provided by DMC.
Nature, extent, and quality of services.The Board considered the services provided by MIMGL to the Series and its shareholders. In reviewing the nature, extent, and quality of services, the Board considered reports furnished to it throughout the year at regular Board Meetings covering matters such as relative performance of the Series; compliance of portfolio managers with the investment policies, strategies, and restrictions for the Series; the compliance of MIMGL personnel with its Code of Ethics; and adherence to fair value pricing procedures as established by the Board. The Board was pleased with the current staffing of MIMGL and the emphasis placed on research in the investment process. The Board was satisfied with the nature, extent, and quality of the overall services provided by MIMGL.
Nature, extent, and quality of services.The Board considered the services provided by MIMEL to the Series and its shareholders. In reviewing the nature, extent, and quality of services, the Board considered reports furnished to it throughout the year at regular Board Meetings covering matters such as relative performance of the Series; compliance of portfolio managers with the investment policies, strategies, and restrictions for the Series; the compliance of MIMEL personnel with its Code of Ethics; and adherence to fair value pricing procedures as established by the Board. The Board was pleased with the current staffing of MIMEL and the emphasis placed on research in the investment process. The Board was satisfied with the nature, extent, and quality of the overall services provided by MIMEL.
Limited-Term Diversified Income Series-28
Delaware VIP® Trust — Delaware VIP Limited-Term Diversified Income Series
Other Series information (Unaudited)
Board consideration of Investment Advisory andSub-Advisory Agreements for Delaware VIP Limited-Term Diversified Income Series at a meeting held August21-22, 2019 (continued)
Investment performance.The Board placed significant emphasis on the investment performance of the Series in view of the importance of investment performance to shareholders. Although the Board considered performance reports and discussions with portfolio managers at Board meetings throughout the year, the Board gave particular weight to the Broadridge reports furnished for the Annual Meeting. The Broadridge reports prepared for the Series showed the investment performance of its Standard Class shares in comparison to a group of similar funds as selected by Broadridge (the “Performance Universe”). A fund with the best performance ranked first, and a fund with the poorest performance ranked last. The highest/best performing 25% of funds in the Performance Universe make up the first quartile; the next 25%, the second quartile; the next 25%, the third quartile; and the poorest/worst performing 25% of funds in the Performance Universe make up the fourth quartile. Comparative annualized performance for the Series was shown for the past1-,3-,5-, and10-year periods, as applicable, ended Jan. 31, 2019. The Board’s objective is that the Series’ performance for the1-,3-, and5-year periods be at or above the median of its Performance Universe.
The Performance Universe for the Series consisted of the Series and all short-intermediate investment-grade debt funds underlying variable insurance products as selected by Broadridge. The Broadridge report comparison showed that the Series’ total return for the1-year period was in the fourth quartile of its Performance Universe. The report further showed that the Series’ total return for the3-,5-, and10-year periods was in the second quartile of its Performance Universe. The Board was satisfied with performance.
Comparative expenses.The Board considered expense data for the Delaware Funds. Management provided the Board with information on pricing levels and fee structures for the Series as of its most recently completed fiscal year. The Board also focused on the comparative analysis of effective management fees and total expense ratios of the Series versus effective management fees and expense ratios of a group of similar funds as selected by Broadridge (the “Expense Group”). In reviewing comparative costs, the Series’ contractual management fee and the actual management fee incurred by the Series were compared with the contractual management fees (assuming all funds in the Expense Group were similar in size to the Series) and actual management fees (as reported by each fund) within the Expense Group, taking into account any applicable breakpoints and fee waivers. The Series’ total expenses were also compared with those of its Expense Group. The Broadridge total expenses, for comparative consistency, were shown by Broadridge for Standard Class shares which do not charge12b-1 andnon-12b-1 service fees. The Board’s objective is for each Series’ total expense ratio to be competitive with those of the peer funds within its Expense Group.
The expense comparisons for the Series showed that the actual management fee was in the quartile with the second highest expenses of its Expense Group and total expenses were in the quartile with the highest expenses of its Expense Group. The Series’ total expenses were not in line with the Board’s objective. In evaluating total expenses, the Board considered fee waivers in place through April 2020 and various initiatives implemented by Management, such as the negotiation of lower fees for fund accounting, fund accounting oversight and custody services, which had created an opportunity for a further reduction in expenses. The Board was satisfied with Management’s efforts to improve the Series’ total expense ratio and to bring it in line with the Board’s objective.
Management profitability.The Board considered the level of profits realized by DMC in connection with the operation of the Series. In this respect, the Board reviewed the Investment Management Profitability Analysis that addressed the overall profitability of DMC’s business in providing management and other services to each of the individual funds and the Delaware Funds as a whole. Specific attention was given to the methodology used by DMC in allocating costs for the purpose of determining profitability. Management stated that the level of profits of DMC, to a certain extent, reflects recent operational cost savings and efficiencies initiated by DMC. The Board considered DMC’s efforts to improve services provided to fund shareholders and to meet additional regulatory and compliance requirements resulting from recent industry-wide Securities and Exchange Commission initiatives. The Board also considered the extent to which DMC might derive ancillary benefits from fund operations, including the potential for procuring additional business as a result of the prestige and visibility associated with its role as service provider to the Delaware Funds and the benefits from allocation of fund brokerage to improve trading efficiencies. As part of its work, the Board also reviewed a report prepared by JDL regarding MIMBT profitability as compared to certain peer fund complexes and the Independent Trustees discussed with JDL personnel regarding DMC’s profitability in such context. The Board found that the management fees were reasonable in light of the services rendered and the profitability of DMC.
Economies of scale.The Trustees considered whether economies of scale are realized by DMC as the Series’ assets increase and the extent to which any economies of scale are reflected in the level of management fees charged. The Trustees reviewed the Series’ advisory fee pricing and structure approved by the Board and shareholders, which includes breakpoints, and which applies to most funds in the Delaware Funds complex. Breakpoints in the advisory fee occur when the advisory fee rate is reduced on assets in excess of specified levels. Breakpoints result in a lower advisory fee, than would otherwise be the case in the absence of breakpoints, when the asset levels specified in the breakpoints are exceeded. The Board noted that, as of March 31, 2019, the Series’ assets exceeded the second breakpoint level. The Board believed that, given the extent to which economies of scale might be realized by DMC and its affiliates, the schedule of fees under the Investment Management Agreement provides a sharing of benefits with the Series and its shareholders.
Limited-Term Diversified Income Series-29
Delaware VIP® Trust — Delaware VIP Limited-Term Diversified Income Series
Other Series information (Unaudited)
Tax Information
All disclosures are based on financial information available as of the date of this annual report and, accordingly are subject to change. For any and all items requiring reporting, it is the intention of the Series to report the maximum amount permitted under the Internal Revenue Code and the regulations thereunder.
For the year ended Dec. 31, 2019, the Series reports distributions paid during the year as follows:
|
| (A) |
| Ordinary Income |
| Distributions |
| (Tax Basis) |
100.00% |
(A) is based on a percentage of the Series’ total distributions.
Limited-Term Diversified Income Series-30
DelawareFunds® by Macquarie
Board of trustees / directors and officers addendum
A mutual fund is governed by a Board of Trustees/Directors (“Trustees”), which has oversight responsibility for the management of a fund’s business affairs. Trustees establish procedures and oversee and review the performance of the investment manager, the distributor, and others who perform services for the fund. The independent fund trustees, in particular, are advocates for shareholder interests. Each trustee has served in that capacity since he or she was elected to or appointed to the Board of Trustees, and will continue to serve until his or her retirement or the election of a new trustee in his or her place. The following is a list of the Trustees and Officers with certain background and related information.
| | | | | | | | | | |
Name, Address, and Birth Date | | Position(s) Held with Fund(s) | | Length of Time
Served | | Principal
Occupation(s)
During the Past Five Years | | Number of
Portfolios in Fund
Complex Overseen
by Trustee or Officer | | Other
Directorships
Held by Trustee or Officer |
INTERESTED TRUSTEE | | | | | | | | | | |
| | | | | |
Shawn K. Lytle1 2005 Market Street Philadelphia, PA 19103 February 1970 | | President, Chief Executive Officer, and Trustee | | President and Chief Executive Officer since August 2015 Trustee since September 2015 | | President — Macquarie Investment Management2 (June 2015-Present) Regional Head of Americas — UBS Global Asset Management (April 2010-May 2015) | | 95 | | Trustee — UBS Relationship Funds, SMA Relationship Trust, and UBS Funds (May 2010–April 2015) |
| INDEPENDENT TRUSTEES | | | | | | |
| | | | | |
Thomas L. Bennett 2005 Market Street Philadelphia, PA 19103 | | Chair and Trustee | | Trustee since March 2005 | | Private Investor (March 2004–Present) | | 95 | | None |
| | | | | |
| October 1947 | | | | Chair since March 2015 | | | | | | |
| | | | | |
Jerome D. Abernathy
2005 Market Street Philadelphia, PA 19103 July 1959 | | Trustee | | Since January 2019 | | Managing Member, Stonebrook Capital Management, LLC (financial technology: macro factors and databases) (January 1993–Present) | | 95 | | None |
| | | | | | |
Ann D. Borowiec 2005 Market Street Philadelphia, PA 19103 November 1958 | | Trustee | | Since March 2015 | | Chief Executive Officer, Private Wealth Management (2011–2013) and Market Manager, New Jersey Private Bank (2005–2011) — J.P. Morgan Chase & Co. | | 95 | | Director — Banco Santander International (October 2016–December 2019) Director — Santander Bank, N.A. (December 2016–December 2019) |
| | | | | | |
Joseph W. Chow 2005 Market Street Philadelphia, PA 19103 January 1953 | | Trustee | | Since January 2013 | | Private Investor (April 2011–Present) | | 95 | | Director and Audit Committee Member — Hercules Technology Growth Capital, Inc. (July 2004-July 2014) |
Limited-Term Diversified Income Series-31
| | | | | | | | | | |
Name, Address, and Birth Date | | Position(s) Held with Fund(s) | | Length of Time
Served | | Principal
Occupation(s)
During the Past Five Years | | Number of
Portfolios in Fund
Complex Overseen
by Trustee or Officer | | Other
Directorships
Held by Trustee or Officer |
| | | | | |
John A. Fry 2005 Market Street Philadelphia, PA 19103 May 1960 | | Trustee | | Since January 2001 | | President — Drexel University (August 2010–Present) President — Franklin & Marshall College (July 2002–July 2010) | | 95 | | Director; Compensation Committee and Governance Committee Member — Community Health Systems (May 2004–Present) |
| | | | | |
| | | | | | | | | | Director — Drexel Morgan & Co. (2015–Present) |
| | | | | |
| | | | | | | | | | Director and Audit Committee Member — vTv Therapeutics LLC (2017–Present) |
| | | | | |
| | | | | | | | | | Director and Audit Committee Member — FS Credit Real Estate Income Trust, Inc. (2018–Present) |
| | | | | |
| | | | | | | | | | | Director — Federal Reserve Bank of Philadelphia (January 2020–Present) |
| | | | | |
Lucinda S. Landreth 2005 Market Street Philadelphia, PA 19103 June 1947 | | Trustee | | Since March 2005 | | Private Investor (2004–Present) | | 95 | | None |
| | | | | |
Frances A. Sevilla-Sacasa 2005 Market Street Philadelphia, PA 19103 January 1956 | | Trustee | | Since September 2011 | | Private Investor (January 2017-Present) Chief Executive Officer — Banco Itaú International (April 2012–December 2016) Executive Advisor to Dean (August 2011–March 2012) and Interim Dean (January 2011–July 2011) — University of Miami School of Business Administration President — U.S. Trust, Bank of America Private Wealth Management (Private Banking) (July 2007–December 2008) | | 95 | | Trust Manager and Audit Committee Chair — Camden Property Trust (August 2011–Present) Director; Strategic Planning and Reserves Committee and Nominating and Governance Committee Member — Callon Petroleum Company (December 2019–Present) Director; Audit Committee Member — Carrizo Oil & Gas, Inc. (March 2018–December 2019) |
| | | | | |
Thomas K. Whitford 2005 Market Street Philadelphia, PA 19103 March 1956 | | Trustee | | Since January 2013 | | Vice Chairman (2010–April 2013) — PNC Financial Services Group | | 95 | | Director — HSBC North America Holdings Inc. (December 2013-Present) Director — HSBC USA Inc. (July 2014-Present) Director — HSBC Bank USA, National Association (July 2014-March 2017) Director — HSBC Finance Corporation (December 2013-April 2018) |
Limited-Term Diversified Income Series-32
| | | | | | | | | | |
Name, Address, and Birth Date | | Position(s) Held with Fund(s) | | Length of Time
Served | | Principal
Occupation(s)
During the Past
Five Years | | Number of
Portfolios in Fund
Complex Overseen
by Trustee or Officer | | Other
Directorships
Held by Trustee or Officer |
Christianna Wood 2005 Market Street Philadelphia, PA 19103 March 1956 | | Trustee | | Since January 2019 | | Chief Executive Officer and President — Gore Creek Capital, Ltd. (August 2009–Present) | | 95 | | Director; Finance Committee and Audit Committee Member — H&R Block Corporation (July 2008–Present) |
| | | | | |
| | | | | | | | | | Director; Chair of Investments Committee and Audit Committee Member — Grange Insurance (2013–Present) |
| | | | | |
| | | | | | | | | | Trustee; Chair of Nominating and Governance Committee and Audit Committee Member — The Merger Fund (2013–Present), The Merger Fund VL (2013–Present); WCM Alternatives: Event-Driven Fund (2013–Present), and WCM Alternatives: Credit Event Fund (December 2017–Present) |
| | | | | |
| | | | | | | | | | | Director; Chair of Governance Committee and Audit Committee Member — International Securities Exchange (2010–2016) |
Janet L. Yeomans 2005 Market Street Philadelphia, PA 19103 July 1948 | | Trustee | | Since April 1999 | | Vice President and Treasurer (January 2006–July 2012), Vice President — Mergers & Acquisitions (January 2003–January 2006), and Vice President and Treasurer (July 1995–January 2003) — 3M Company | | 95 | | Director; Personnel and Compensation Committee Chair; Member of Nominating, Investments, and Audit Committees for various periods throughout directorship —Okabena Company (2009-2017) |
Limited-Term Diversified Income Series-33
| | | | | | | | | | |
Name, Address, and Birth Date | | Position(s) Held with Fund(s) | | Length of Time
Served | | Principal
Occupation(s)
During the Past Five Years | | Number of
Portfolios in Fund
Complex Overseen
by Trustee or Officer | | Other
Directorships
Held by Trustee or Officer |
| OFFICERS | | | | | | | | | | |
| | | | | |
David F. Connor 2005 Market Street Philadelphia, PA 19103 December 1963 | | Senior
Vice President, General Counsel, and Secretary | | Senior Vice President, since May 2013; General Counsel since May 2015; Secretary since October 2005 | | David F. Connor has served in various capacities at different times at Macquarie Investment Management. | | 95 | | None3 |
| | | | | |
Daniel V. Geatens 2005 Market Street Philadelphia, PA 19103 October 1972 | | Vice President
and Treasurer | | Vice President and Treasurer since October 2007 | | Daniel V. Geatens has served in various capacities at different times at Macquarie Investment Management. | | 95 | | None3 |
| | | | | |
Richard Salus 2005 Market Street Philadelphia, PA 19103 October 1963 | | Senior Vice President
and
Chief Financial Officer | | Senior Vice President and Chief Financial Officer since November 2006 | | Richard Salus has served in various capacities at different times at Macquarie Investment Management. | | 95 | | None |
| 1 | Shawn K. Lytle is considered to be an “Interested Trustee” because he is an executive officer of the Fund’s(s’) investment advisor. |
| 2 | Macquarie Investment Management is the marketing name for Macquarie Management Holdings, Inc. and its subsidiaries, including the Fund’s(s’) investment advisor, principal underwriter, and its transfer agent. |
| 3 | David F. Connor and Daniel V. Geatens serve in similar capacities for the six portfolios of the Optimum Fund Trust, which have the same investment advisor, principal underwriter, and transfer agent as the registrant. Mr. Geatens also serves as the Chief Financial Officer of the Optimum Fund Trust and he is the Chief Financial Officer and Treasurer for Macquarie Global Infrastructure Total Return Fund Inc. |
The Statement of Additional Information for the Fund(s) includes additional information about the Trustees and Officers and is available, without charge, upon request by calling 800523-1918.
Limited-Term Diversified Income Series-34
| | | | |
| | The Series files its complete schedule of portfolio holdings with the Securities and Exchange Commission (SEC) for the first and third quarters of each fiscal year on FormN-Q or FormN-PORT (available for filings after March 31, 2019). The Series’ FormsN-Q or FormsN-PORT, as well as a description of the policies and procedures that the Series uses to determine how to vote proxies (if any) relating to portfolio securities, are available without charge (i) upon request, by calling 800523-1918; and (ii) on the SEC’s website at sec.gov. In addition, a description of the policies and procedures that the Series uses to determine how to vote proxies (if any) relating to portfolio securities and the Schedule of Investments included in the Series’ most recent FormN-Q or FormN-PORT are available without charge on the Series’ website at delawarefunds.com/vip/literature. The Series’ FormsN-Q and FormsN-PORT may be reviewed and copied at the SEC’s Public Reference Room in Washington, D.C.; information on the operation of the Public Reference Room may be obtained by calling 800SEC-0330. Information (if any) regarding how the Series voted proxies relating to portfolio securities during the most recently disclosed12-month period ended June 30 is available without charge (i) through the Series’ website at delawarefunds.com/proxy; and (ii) on the SEC’s website at sec.gov. | | |
| | |
| AR-VIPLTD 22466 (2/20) (1073909) | | Limited-Term Diversified Income Series-35 |

Delaware VIP® Trust
Delaware VIP REIT Series
December 31, 2019
Beginning on or about June 1, 2021, as permitted by regulations adopted by the Securities and Exchange Commission, paper copies of your Series’ shareholder reports will no longer be sent to you by mail, unless you specifically request them from the Series or from your financial intermediary, such as a broker/dealer, bank, or insurance company. Instead, you will be notified by mail each time a report is posted on the website and provided with a link to access the report.
If you already elected to receive shareholder reports electronically, you will not be affected by this change and you do not need to take any action.
You may elect to receive paper copies of all future shareholder reports free of charge. You can inform the Series that you wish to continue receiving paper copies of your shareholder reports by contacting us at 800523-1918. If you own these shares through a financial intermediary, you may contact your financial intermediary to elect to continue to receive paper copies of your shareholder reports. Your election to receive reports in paper will apply to all funds held with the Delaware Funds® by Macquarie or your financial intermediary.

Table of contents
Other than Macquarie Bank Limited (MBL), none of the entities noted are authorized deposit-taking institutions for the purposes of the Banking Act 1959 (Commonwealth of Australia). The obligations of these entities do not represent deposits or other liabilities of MBL. MBL does not guarantee or otherwise provide assurance in respect of the obligations of these entities, unless noted otherwise. The Series is governed by US laws and regulations.
Unless otherwise noted, views expressed herein are current as of Dec. 31, 2019, and subject to change for events occurring after such date.
The Series is not FDIC insured and is not guaranteed. It is possible to lose the principal amount invested.
Advisory services provided by Delaware Management Company, a series of Macquarie Investment Management Business Trust (MIMBT), a US registered investment advisor.
The Series is distributed byDelaware Distributors, L.P.(DDLP), an affiliate of MIMBT and Macquarie Group Limited. Macquarie Investment Management (MIM) is the marketing name for certain companies comprising the asset management division of Macquarie Group Limited and its subsidiaries and affiliates worldwide.
This material may be used in conjunction with the offering of shares in Delaware VIP® REIT Series only if preceded or accompanied by the Series’ current prospectus or the summary prospectus.
© 2020 Macquarie Management Holdings, Inc.
All third-party marks cited are the property of their respective owners.
| | |
Delaware VIP®Trust — Delaware VIP REIT Series |
Portfolio management review | | January 7, 2020 (Unaudited) |
The investment objectives of the Series are to seek maximum long-term total return, with capital appreciation as a secondary objective.
For the fiscal year ended Dec. 31, 2019, Delaware VIP REIT Series (the “Series”) Standard Class shares gained 26.81% and Service Class shares gained 26.50% (both figures reflect returns with all dividends reinvested). The Series’ benchmark, the FTSE Nareit Equity REITs Index, gained 26.00% for the same period.
Following a difficult end to 2018, conditions for investors in real estate securities turned sharply positive during the first quarter of 2019 and remained that way for most of the rest of the period. Global financial markets marched ahead, as central banks around the world – including the US Federal Reserve, which gradually shifted from a policy of raising interest rates to one of cutting them – signaled their intent to provide monetary support for their respective economies. This shift took place against a backdrop of consistent US economic growth with few signs of inflation.
US real estate investment trust (REIT) common stocks were significant beneficiaries of this environment, since these securities’ relatively high yields made them increasingly attractive to investors as interest rates fell. Most REIT segments performed well, with especially favorable results in the tech (data center and mobile communication tower REITs, among others), manufactured homes, and industrial sectors. Due to relatively weak industry fundamentals, lodging and regional mall REITs were among the weakest-performing sectors during the fiscal year.
Compared with the benchmark, the Series benefited from favorable picks in the tech sector, led by strong-performingout-of-benchmark positions inAmerican Tower Corp.andSBA Communications Corp., two REITs that own and operate mobile communication towers. These companies benefited from their predictable cash flow from long leases, low capital-spending requirements, and strong demand as the wireless communications industry transitions to 5G technology.
Positions in manufactured housing REITsSun Communities Inc.andEquity LifeStyle Properties Inc.also added value. Both companies benefited from their strong fundamentals and from investors’ willingness to pay a premium for the companies’ steady cash-flow growth in a generallylow-growth environment.
Industrial property ownerRexford Industrial Realty Inc.also contributed. Rexford and other industrial REITs – including industry leaderPrologis Inc., another relative contributor for the fiscal year – have been prime beneficiaries of the global shift toward online shopping as an alternative tobrick-and-mortar retail. Rexford further benefited from low vacancies and high rents in Southern California, where its properties are concentrated.
The Series’ significant relative underweighting in self-storage operatorPublic Storagealso contributed. The company significantly lagged the overall real estate market for the fiscal year, as it reported weaker-than-expected third-quarter financial results. We chose to underweight Public Storage in favor of two self-storage competitors that we believed provided a better risk-rewardtrade-off –CubeSmartandExtra Space Storage Inc.– both of which modestly detracted from relative performance for the fiscal year.
The Series’ biggest individual detractor by far was anout-of-index position inBrookdale Senior Living Inc., an operator of senior-care facilities whose shares underperformed the sector by a wide margin. The company has struggled for some time due to what we have viewed as poor operational execution and capital-allocation decisions. Despite these recent challenges, we remain enthusiastic about Brookdale Senior Living’s longer-term upside potential, given an opportunity for new management to unlock value for shareholders, as well as improving fundamentals in the senior-housing industry.
Another notable detractor wasPark Hotels & Resorts Inc.This lodging company’s acquisition of Chesapeake Lodging Trust put further pressure on the stock, as many investors appeared to question the transaction’s near-term financial impact. The Series’ lack of a position in benchmark componentMid-America Apartment Communities Inc. also hampered results. AsMid-America Apartment Communities and other apartment REITs enjoyed strong performance, the lack of exposure to this stock proved particularly detrimental.
Of final note, a modest cash allocation weighed on relative performance in a rising market for real estate securities.
Throughout the fiscal year, our management strategy remained consistent, as it does regardless of the underlying economic or market conditions in which we operate. We prioritized those areas of the REIT market that we believed had the potential to benefit from a strong fundamental backdrop for commercial real estate, and that offered what we saw as attractively valued securities available for investment. We also regularly emphasized companies with good balance sheets, favorable management execution and corporate governance, and the opportunity to continue to grow their cash flow and prudently raise capital.
Our priority was to continue to find areas of the real estate securities market that we believed offered the potential for sustainable and accelerating growth. This focus led us to a variety of sectors, such as manufactured housing, which we liked for its business strength, solid net operating income (NOI) growth, low capital spending requirements, and favorable long-term demographics.
REITSeries-1
| | |
Delaware VIP®Trust — Delaware VIP REIT Series |
Portfolio management review (continued) | | January 7, 2020 (Unaudited) |
We also maintained an overweighting in the apartment REIT sector, reflecting strong demand as millennials increasingly have favored renting rather than owning homes. In addition, we maintained the Series’ overweight in industrial REITs, which we believed could benefit from global trends favoring the growth of ecommerce.
We further underweighted the lodging and retail sectors. Lodging REITs generally remained unattractive to us because of their high asset prices and weak fundamentals. The retail sector, meanwhile, continued to struggle, as landlords sought to manage store closures and a shift toward smaller store formats.
Unless otherwise noted, views expressed herein are current as of Dec. 31, 2019, and subject to change.
REITSeries-2
Delaware VIP® Trust — Delaware VIP REIT Series
Performance summary (Unaudited)
The performance quoted represents past performance and does not guarantee future results. Investment return and principal value of an investment will fluctuate so that shares, when redeemed, may be worth more or less than their original cost. Current performance may be lower or higher than the performance quoted.
Carefully consider the Series’ investment objectives, risk factors, charges, and expenses before investing. This and other information can be found in the Series’ prospectus and its summary prospectus, which may be obtained by visiting delawarefunds.com/vip/literature or calling 800523-1918. Investors should read the prospectus and the summary prospectus carefully before investing.
| | | | | | | | | | |
| Delaware VIP REIT Series | | | | | | | | | | |
| Average annual total returns | | | | | | | | | | |
| For periods ended December 31, 2019 | | 1 year | | 3 year | | 5 year | | 10 year | | Lifetime |
Standard Class shares (commenced operations on May 4, 1998) | | +26.81% | | +6.11% | | +5.58% | | +11.08% | | +9.05% |
| | | | | | | | | | |
Service Class shares (commenced operations on May 1, 2000) | | +26.50% | | +5.81% | | +5.31% | | +10.78% | | +9.92% |
| | | | | | | | | | |
FTSE Nareit Equity REITs Index | | +26.00% | | +8.14% | | +7.21% | | +11.94% | | n/a |
Returns reflect the reinvestment of all distributions. Please see page 4 for a description of the index.
As described in the Series’ most recent prospectus, the net expense ratio for Service Class shares of the Series was 1.13%, while total operating expenses for Standard Class and Service Class shares were 0.83% and 1.13%, respectively. The management fee for Standard Class and Service Class shares was 0.75%. The Series’ investment manager, Delaware Management Company (Manager), has contractually agreed to waive all or a portion of its investment advisory fees and/or pay/reimburse expenses (excluding any12b-1 fees, acquired fund fees and expenses, taxes, interest, short sale and dividend interest expenses, brokerage fees, certain insurance costs, and nonroutine expenses or costs, including, but not limited to, those relating to reorganizations, litigation, conducting shareholder meetings, and liquidations) in order to prevent annual series operating expenses from exceeding 0.83% of the Series’ average daily net assets from April 30, 2019 through Dec. 31, 2019.*
The Series pays Delaware Distributors, L.P. (DDLP), the distributor and an affiliate of DMC, an annual12b-1 fee of 0.30% of the average daily net assets of the Service Class shares. Prior to May 1, 2018, DDLP had contracted to waive12b-1 fees in order to limit12b-1 fees of the Service Class shares to 0.25% of average daily net assets.
Earnings from a variable annuity or variable life investment compoundtax-free until withdrawal, and as a result, no adjustments were made for income taxes.
Expense limitations were in effect for both classes during certain periods shown in the Series performance chart above and in the Performance of a $10,000 Investment chart on the next page.
Performance data do not reflect insurance fees related to a variable annuity or variable life investment or the deferred sales charge that would apply to certain withdrawals of investments held for fewer than eight years. Performance shown here would have been reduced if such fees were included and the expense limitation removed. For more information about fees, consult your variable annuity or variable life prospectus.
Investments in variable products involve risk.
Narrowly focused investments may exhibit higher volatility than investments in multiple industry sectors.
REIT investments are subject to many of the risks associated with direct real estate ownership, including changes in economic conditions, credit risk, and interest rate fluctuations.
A REIT series’ tax status as a regulated investment company could be jeopardized if it holds real estate directly, as a result of defaults, or receives rental income from real estate holdings.
The Series may invest in derivatives, which may involve additional expenses and are subject to risk, including the risk that an underlying security or securities index moves in the opposite direction from what the portfolio manager anticipated. A derivatives transaction depends upon the counterparties’ ability to fulfill their contractual obligations.
Please read both the contract and underlying prospectus for specific details regarding the product’s risk profile.
*The aggregate contractual waiver period covering this report is from April 30, 2019 through April 30, 2020.
REIT Series-3
Delaware VIP® REIT Series
Performance summary (Unaudited) (continued)
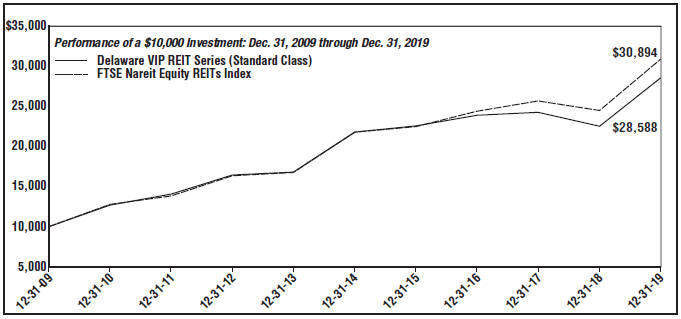
| | | | | | |
| For period beginning Dec. 31, 2009 through Dec. 31, 2019 | | Starting value | | Ending value |
-- FTSE Nareit Equity REITs Index | | $10,000 | | $30,894 |
-- Delaware VIP REIT Series (Standard Class) | | $10,000 | | $28,588 |
The chart shows a $10,000 investment in the Delaware VIP REIT Series Standard Class shares for the period from Dec. 31, 2009 through Dec. 31, 2019.
The chart also shows $10,000 invested in the FTSE Nareit Equity REITs Index for the period from Dec. 31, 2009 through Dec. 31, 2019. The FTSE Nareit Equity REITs Index measures the performance of all publicly traded equity real estate investment trusts (REITs) traded on US exchanges, excluding timber and infrastructure REITs.
Index performance returns do not reflect any management fees, transaction costs or expenses. Indices are unmanaged and one cannot invest directly in an index.
Performance of Service Class shares will vary due to different charges and expenses.
Past performance is not a guarantee of future results.
REIT Series-4
Delaware VIP® Trust — Delaware VIP REIT Series
Disclosure of Series expenses
For thesix-month period from July 1, 2019 to December 31, 2019 (Unaudited)
As a shareholder of the Series, you incur ongoing costs, which may include management fees; distribution and service(12b-1) fees; and other Series expenses. This example is intended to help you understand your ongoing costs (in dollars) of investing in the Series and to compare these costs with the ongoing costs of investing in other mutual funds.
The example is based on an investment of $1,000 invested at the beginning of the period and held for the entiresix-month period from July 1, 2019 to Dec. 31, 2019.
Actual expenses
The first section of the table shown, “Actual Series return,” provides information about actual account values and actual expenses. You may use the information in this section of the table, together with the amount you invested, to estimate the expenses that you paid over the period. Simply divide your account value by $1,000 (for example, an $8,600 account value divided by $1,000 = 8.6), then multiply the result by the number in the first section under the heading entitled “Expenses Paid During Period” to estimate the expenses you paid on your account during the period.
Hypothetical example for comparison purposes
The second section of the table shown, “Hypothetical 5% return,” provides information about hypothetical account values and hypothetical expenses based on the Series’ actual expense ratio and an assumed rate of return of 5% per year before expenses, which is not the Series’ actual return. The hypothetical account values and expenses may not be used to estimate the actual ending account balance or expenses you paid for the period. You may use this information to compare the ongoing costs of investing in the Series and other funds. To do so, compare this 5% hypothetical example with the 5% hypothetical examples that appear in the shareholder reports of other funds.
Please note that the expenses shown in the table are meant to highlight your ongoing costs only. As a shareholder of the Series, you do not incur any transaction costs, such as sales charges (loads), redemption fees or exchange fees, but shareholders of other funds may incur such costs. Also, the fees related to the variable annuity investment or the deferred sales charge that could apply have not been included. Therefore, the second section of the table is useful in comparing ongoing costs only, and will not help you determine the relative total costs of owning different funds. The Series’ expenses shown in the table reflect fee waivers in effect and assume reinvestment of all dividends and distributions.
Expense analysis of an investment of $1,000
| | | | | | | | | | | | |
| | | Beginning
Account
Value
7/1/19 | | | Ending
Account
Value
12/31/19 | | | Annualized
Expense
Ratio | | Expenses
Paid During
Period
7/1/19 to
12/31/19* |
Actual Series return† |
Standard Class | | $ | 1,000.00 | | | $ | 1,073.10 | | | 0.83% | | $4.34 |
Service Class | | | 1,000.00 | | | | 1,071.60 | | | 1.13% | | 5.90 |
Hypothetical 5% return(5% return before expenses) |
Standard Class | | $ | 1,000.00 | | | $ | 1,021.02 | | | 0.83% | | $4.23 |
Service Class | | | 1,000.00 | | | | 1,019.51 | | | 1.13% | | 5.75 |
*“Expenses Paid During Period” are equal to the Series’ annualized expense ratio, multiplied by the average account value over the period, multiplied by 184/365 (to reflect theone-half year period).
†Because actual returns reflect only the most recentsix-month period, the returns shown may differ significantly from fiscal year returns.
In addition to the Series’ expenses reflected above, the Series also indirectly bears its portion of the fees and expenses of the investment companies (Underlying Funds) in which it invests. The table above does not reflect the expenses of the Underlying Funds.
REIT Series-5
Delaware VIP® Trust — Delaware VIP REIT Series
Security type / sector allocation and top 10 equity holdings
As of December 31, 2019 (Unaudited)
Sector designations may be different than the sector designations presented in other Series materials. The sector designations may represent the investment manager’s internal sector classifications.
| | |
| Security type / sector | | Percentage of
net assets |
Common Stock | | 99.26% |
Healthcare | | 6.55% |
Information Technology | | 1.35% |
REIT Diversified | | 3.03% |
REIT Healthcare | | 8.44% |
REIT Hotel | | 5.19% |
REIT Industrial | | 12.01% |
REIT Information Technology | | 8.05% |
REIT Mall | | 3.77% |
REIT Manufactured Housing | | 4.95% |
REIT Mixed | | 1.66% |
REIT Multifamily | | 17.07% |
REIT Office | | 10.62% |
REIT Self-Storage | | 3.48% |
REIT Shopping Center | | 5.73% |
REIT Single Tenant | | 3.41% |
REIT Specialty | | 3.95% |
Short-Term Investments | | 0.34% |
Total Value of Securities | | 99.60% |
Receivables and Other Assets Net of Liabilities | | 0.40% |
Total Net Assets | | 100.00% |
Holdings are for informational purposes only and are subject to change at any time. They are not a recommendation to buy, sell, or hold any security.
| | |
| Top 10 equity holdings | | Percentage
of net assets |
Prologis | | 6.94% |
Brookdale Senior Living | | 6.55% |
Equinix | | 5.19% |
Welltower | | 4.07% |
Simon Property Group | | 3.77% |
Equity Residential | | 3.69% |
Sun Communities | | 3.47% |
UDR | | 3.34% |
STORE Capital | | 3.21% |
Camden Property Trust | | 3.17% |
REIT Series-6
Delaware VIP® Trust – Delaware VIP REIT Series
Schedule of investments
December 31, 2019
| | | | | | | | |
| | | Number of
shares | | | Value (US $) | |
Common Stock – 99.26% | | | | | | | | |
Healthcare – 6.55% | | | | | | | | |
Brookdale Senior Living † | | | 3,968,667 | | | $ | 28,852,209 | |
| | | | | | | | |
| | | | | | | 28,852,209 | |
| | | | | | | | |
Information Technology – 1.35% | | | | | |
InterXion Holding † | | | 70,941 | | | | 5,945,565 | |
| | | | | | | | |
| | | | | | | 5,945,565 | |
| | | | | | | | |
REIT Diversified – 3.03% | | | | | | | | |
Alpine Income Property Trust | | | 83,407 | | | | 1,587,235 | |
Cousins Properties | | | 156,870 | | | | 6,463,044 | |
Vornado Realty Trust | | | 79,861 | | | | 5,310,758 | |
| | | | | | | | |
| | | | | | | 13,361,037 | |
| | | | | | | | |
REIT Healthcare – 8.44% | | | | | | | | |
Healthcare Trust of America Class A | | | 235,698 | | | | 7,136,935 | |
Healthpeak Properties | | | 350,837 | | | | 12,093,351 | |
Welltower | | | 219,506 | | | | 17,951,201 | |
| | | | | | | | |
| | | | | | | 37,181,487 | |
| | | | | | | | |
REIT Hotel – 5.19% | | | | | | | | |
Host Hotels & Resorts | | | 475,846 | | | | 8,826,943 | |
Pebblebrook Hotel Trust | | | 64,786 | | | | 1,736,913 | |
RLJ Lodging Trust | | | 121,650 | | | | 2,155,638 | |
VICI Properties | | | 397,312 | | | | 10,151,322 | |
| | | | | | | | |
| | | | | | | 22,870,816 | |
| | | | | | | | |
REIT Industrial – 12.01% | | | | | | | | |
Americold Realty Trust | | | 173,612 | | | | 6,086,837 | |
Duke Realty | | | 89,878 | | | | 3,116,070 | |
Prologis | | | 342,899 | | | | 30,566,017 | |
Rexford Industrial Realty | | | 287,803 | | | | 13,143,963 | |
| | | | | | | | |
| | | | | | | 52,912,887 | |
| | | | | | | | |
REIT Information Technology – 8.05% | | | | | |
American Tower | | | 26,645 | | | | 6,123,554 | |
Equinix | | | 39,180 | | | | 22,869,366 | |
QTS Realty Trust Class A | | | 119,146 | | | | 6,466,053 | |
| | | | | | | | |
| | | | | | | 35,458,973 | |
| | | | | | | | |
REIT Mall – 3.77% | | | | | | | | |
Simon Property Group | | | 111,623 | | | | 16,627,362 | |
| | | | | | | | |
| | | | | | | 16,627,362 | |
| | | | | | | | |
REIT Manufactured Housing – 4.95% | | | | | |
Equity LifeStyle Properties | | | 92,787 | | | | 6,531,277 | |
Sun Communities | | | 101,790 | | | | 15,278,679 | |
| | | | | | | | |
| | | | | | | 21,809,956 | |
| | | | | | | | |
REIT Mixed – 1.66% | | | | | | | | |
Liberty Property Trust | | | 121,909 | | | | 7,320,635 | |
| | | | | | | | |
| | | | | | | 7,320,635 | |
| | | | | | | | |
REIT Multifamily – 17.07% | | | | | | | | |
Apartment Investment & Management | | | | | | | | |
Class A | | | 127,902 | | | | 6,606,138 | |
AvalonBay Communities | | | 58,056 | | | | 12,174,343 | |
Camden Property Trust | | | 131,770 | | | | 13,980,797 | |
Equity Residential | | | 200,917 | | | | 16,258,204 | |
Essex Property Trust | | | 38,266 | | | | 11,512,709 | |
| | | | | | | | |
| | | Number of
shares | | | Value
(US $) | |
Common Stock (continued) | | | | | |
REIT Multifamily (continued) | | | | | |
UDR | | | 315,174 | | | $ | 14,718,626 | |
| | | | | | | | |
| | | | | | | 75,250,817 | |
| | | | | | | | |
REIT Office – 10.62% | | | | | | | | |
Alexandria Real Estate Equities | | | 59,558 | | | | 9,623,380 | |
Boston Properties | | | 29,511 | | | | 4,068,386 | |
Hudson Pacific Properties | | | 265,063 | | | | 9,979,622 | |
Kilroy Realty | | | 164,605 | | | | 13,810,360 | |
Mack-Cali Realty | | | 178,184 | | | | 4,121,396 | |
VEREIT | | | 562,448 | | | | 5,197,020 | |
| | | | | | | | |
| | | | | | | 46,800,164 | |
| | | | | | | | |
REIT Self-Storage – 3.48% | | | | | |
CubeSmart | | | 194,601 | | | | 6,126,039 | |
Extra Space Storage | | | 74,385 | | | | 7,856,544 | |
Public Storage | | | 6,336 | | | | 1,349,315 | |
| | | | | | | | |
| | | | | | | 15,331,898 | |
| | | | | | | | |
REIT Shopping Center – 5.73% | | | | | |
Brixmor Property Group | | | 130,356 | | | | 2,816,993 | |
Kimco Realty | | | 400,441 | | | | 8,293,133 | |
Kite Realty Group Trust | | | 236,607 | | | | 4,620,935 | |
Regency Centers | | | 34,610 | | | | 2,183,545 | |
SITE Centers | | | 523,745 | | | | 7,342,905 | |
| | | | | | | | |
| | | | | | | 25,257,511 | |
| | | | | | | | |
REIT Single Tenant – 3.41% | | | | | | | | |
National Retail Properties | | | 16,693 | | | | 895,079 | |
STORE Capital | | | 380,095 | | | | 14,154,738 | |
| | | | | | | | |
| | | | | | | 15,049,817 | |
| | | | | | | | |
REIT Specialty – 3.95% | | | | | | | | |
EPR Properties | | | 56,734 | | | | 4,007,690 | |
Invitation Homes | | | 447,324 | | | | 13,406,300 | |
| | | | | | | | |
| | | | | | | 17,413,990 | |
| | | | | | | | |
Total Common Stock
(cost $408,965,730) | | | | | | | 437,445,124 | |
| | | | | | | | |
Short-Term Investments – 0.34% | | | | | |
Money Market Mutual Funds – 0.34% | | | | | |
BlackRock FedFund – Institutional Shares(seven-day effective yield 1.52%) | | | 297,063 | | | | 297,063 | |
Fidelity Investments Money Market Government Portfolio – Class I(seven-day effective yield 1.49%) | | | 297,061 | | | | 297,061 | |
GS Financial Square Government Fund – Institutional Shares(seven-day effective yield 1.51%) | | | 297,061 | | | | 297,061 | |
Morgan Stanley Government Portfolio – Institutional Share Class(seven-day effective yield 1.48%) | | | 297,061 | | | | 297,061 | |
REIT Series-7
Delaware VIP® REIT Series
Schedule of investments (continued)
| | | | | | | | |
| | | Number of
shares | | | Value
(US $) | |
Short-Term Investments (continued) | |
Money Market Mutual Funds (continued) | |
State Street Institutional US Government
Money Market Fund – Investor Class(seven-day effective yield 1.45%) | | | 297,061 | | | $ | 297,061 | |
| | | | | | | | |
Total Short-Term Investments
(cost $1,485,307) | | | | 1,485,307 | |
| | | | | | | | |
| | | | |
Total Value of Securities – 99.60%
(cost $410,451,037) | | $ | 438,930,431 | |
| | | | |
† Non-income producing security.
Summary of abbreviations:
GS – Goldman Sachs
REIT – Real Estate Investment Trust
See accompanying notes, which are an integral part of the financial statements.
REIT Series-8
| | |
Delaware VIP® Trust —Delaware VIP REIT Series
Statement of assets and liabilities | | December 31, 2019 |
| | | | |
Assets: | | | | |
Investments, at value1 | | $ | 438,930,431 | |
Cash | | | 857,602 | |
Dividends and interest receivable | | | 1,926,988 | |
Receivable for securities sold | | | 1,350,258 | |
Receivable for series shares sold | | | 17,562 | |
| | | | |
Total assets | | | 443,082,841 | |
| | | | |
Liabilities: | | | | |
Payable for securities purchased | | | 1,415,660 | |
Payable for series shares redeemed | | | 569,730 | |
Management fees payable to affiliates | | | 283,991 | |
Other accrued expenses | | | 67,181 | |
Distribution fees payable to affiliates | | | 51,352 | |
Trustees’ fees and expenses payable to affiliates | | | 4,456 | |
Dividend disbursing and transfer agent fees and expenses payable to affiliates | | | 2,776 | |
Accounting and administration expenses payable to affiliates | | | 1,568 | |
Legal fees payable to affiliates | | | 692 | |
Reports and statements to shareholders expenses payable to affiliates | | | 211 | |
| | | | |
Total liabilities | | | 2,397,617 | |
| | | | |
Total Net Assets | | $ | 440,685,224 | |
| | | | |
| |
Net Assets Consist of: | | | | |
Paid-in capital | | $ | 395,721,764 | |
Total distributable earnings (loss) | | | 44,963,460 | |
| | | | |
Total Net Assets | | $ | 440,685,224 | |
| | | | |
| |
Net Asset Value | | | | |
Standard Class: | | | | |
Net assets | | $ | 236,491,951 | |
Shares of beneficial interest outstanding, unlimited authorization, no par | | | 16,093,656 | |
Net asset value per share | | $ | 14.69 | |
| |
Service Class: | | | | |
Net assets | | $ | 204,193,273 | |
Shares of beneficial interest outstanding, unlimited authorization, no par | | | 13,928,229 | |
Net asset value per share | | $ | 14.66 | |
| | | | |
1Investments, at cost | | $ | 410,451,037 | |
See accompanying notes, which are an integral part of the financial statements.
REIT Series-9
Delaware VIP® Trust —
Delaware VIP REIT Series
Statement of operations
Year ended December 31, 2019
| | | | |
Investment Income: | | | | |
Dividends | | $ | 10,708,030 | |
Interest | | | 60,824 | |
| | | | |
| |
| | | 10,768,854 | |
| | | | |
| |
Expenses: | | | | |
Management fees | | | 3,192,391 | |
Distribution expenses — Service Class | | | 591,428 | |
Accounting and administration expenses | | | 113,228 | |
Reports and statements to shareholders expenses | | | 70,210 | |
Dividend disbursing and transfer agent fees and expenses | | | 35,597 | |
Audit and tax fees | | | 33,691 | |
Trustees’ fees and expenses | | | 25,047 | |
Legal fees | | | 22,493 | |
Custodian fees | | | 16,113 | |
Registration fees | | | 132 | |
Other | | | 12,183 | |
| | | | |
| |
| | | 4,112,513 | |
Less expenses paid indirectly | | | (719 | ) |
| | | | |
Total operating expenses | | | 4,111,794 | |
| | | | |
Net Investment Income | | | 6,657,060 | |
| | | | |
| |
Net Realized and Unrealized Gain: | | | | |
Net realized gain on investments | | | 44,240,422 | |
Net change in unrealized appreciation (depreciation) of investments | | | 46,211,888 | |
| | | | |
Net Realized and Unrealized Gain | | | 90,452,310 | |
| | | | |
| |
Net Increase in Net Assets Resulting from Operations | | $ | 97,109,370 | |
| | | | |
Delaware VIP Trust —
Delaware VIP REIT Series
Statements of changes in net assets
| | | | | | | | |
| | | Year ended | |
| | | 12/31/19 | | | 12/31/18 | |
Increase (Decrease) in Net Assets from Operations: | | | | | | | | |
Net investment income | | $ | 6,657,060 | | | $ | 8,715,660 | |
Net realized gain (loss) | | | 44,240,422 | | | | (19,278,522 | ) |
Net change in unrealized appreciation (depreciation) | | | 46,211,888 | | | | (19,518,669 | ) |
| | | | | | | | |
Net increase (decrease) in net assets resulting from operations | | | 97,109,370 | | | | (30,081,531 | ) |
| | | | | | | | |
| |
Dividends and Distributions to Shareholders from: | | | | | |
Distributable earnings: | | | | | | | | |
Standard Class | | | (4,838,436 | ) | | | (11,357,786 | ) |
Service Class | | | (3,675,428 | ) | | | (9,640,377 | ) |
| | | | | | | | |
| | | (8,513,864 | ) | | | (20,998,163 | ) |
| | | | | | | | |
| | |
Capital Share Transactions: | | | | | | | | |
Proceeds from shares sold: | | | | | | | | |
Standard Class | | | 9,282,515 | | | | 8,399,074 | |
Service Class | | | 9,638,712 | | | | 8,627,567 | |
Net asset value of shares issued upon reinvestment of dividends and distributions: | | | | | | | | |
Standard Class | | | 4,838,436 | | | | 11,357,786 | |
Service Class | | | 3,675,428 | | | | 9,640,377 | |
| | | | | | | | |
| | | 27,435,091 | | | | 38,024,804 | |
| | | | | | | | |
Cost of shares redeemed: | | | | | | | | |
Standard Class | | | (24,026,313 | ) | | | (29,374,577 | ) |
Service Class | | | (23,679,606 | ) | | | (32,733,061 | ) |
| | | | | | | | |
| | | (47,705,919 | ) | | | (62,107,638 | ) |
| | | | | | | | |
Decrease in net assets derived from capital share transactions | | | (20,270,828 | ) | | | (24,082,834 | ) |
| | | | | | | | |
Net Increase (decrease) in Net Assets | | | 68,324,678 | | | | (75,162,528 | ) |
| | |
Net Assets: | | | | | | | | |
Beginning of year | | | 372,360,546 | | | | 447,523,074 | |
| | | | | | | | |
End of year | | $ | 440,685,224 | | | $ | 372,360,546 | |
| | | | | | | | |
See accompanying notes, which are an integral part of the financial statements.
REIT Series-10
Delaware VIP® Trust — Delaware VIP REIT Series
Financial highlights
Selected data for each share of the Series outstanding throughout each period were as follows:
| | | | | | | | | | | | | | | | | | | | |
| | | Delaware VIP REIT Series Standard Class
Year ended | |
| | | 12/31/19 | | | 12/31/18 | | | 12/31/17 | | | 12/31/16 | | | 12/31/15 | |
Net asset value, beginning of period | | $ | 11.85 | | | $ | 13.49 | | | $ | 15.57 | | | $ | 15.89 | | | $ | 15.50 | |
| | | | | |
Income (loss) from investment operations: | | | | | | | | | | | | | | | | | | | | |
Net investment income1 | | | 0.24 | | | | 0.28 | | | | 0.27 | | | | 0.22 | | | | 0.21 | |
Net realized and unrealized gain (loss) | | | 2.90 | | | | (1.27 | ) | | | (0.03 | ) | | | 0.67 | | | | 0.37 | |
| | | | | | | | | | | | | | | | | | | | |
Total from investment operations | | | 3.14 | | | | (0.99 | ) | | | 0.24 | | | | 0.89 | | | | 0.58 | |
| | | | | | | | | | | | | | | | | | | | |
| | | | | |
Less dividends and distributions from: | | | | | | | | | | | | | | | | | | | | |
Net investment income | | | (0.30 | ) | | | (0.27 | ) | | | (0.24 | ) | | | (0.21 | ) | | | (0.19 | ) |
Net realized gain | | | — | | | | (0.38 | ) | | | (2.08 | ) | | | (1.00 | ) | | | — | |
| | | | | | | | | | | | | | | | | | | | |
Total dividends and distributions | | | (0.30 | ) | | | (0.65 | ) | | | (2.32 | ) | | | (1.21 | ) | | | (0.19 | ) |
| | | | | | | | | | | | | | | | | | | | |
| | | | | |
Net asset value, end of period | | $ | 14.69 | | | $ | 11.85 | | | $ | 13.49 | | | $ | 15.57 | | | $ | 15.89 | |
| | | | | | | | | | | | | | | | | | | | |
| | | | | |
Total return2 | | | 26.81% | | | | (7.22% | ) | | | 1.54% | | | | 5.87% | | | | 3.75% | |
| | | | | |
Ratios and supplemental data: | | | | | | | | | | | | | | | | | | | | |
Net assets, end of period (000 omitted) | | $ | 236,492 | | | $ | 198,904 | | | $ | 235,390 | | | $ | 251,083 | | | $ | 244,618 | |
Ratio of expenses to average net assets3 | | | 0.83% | | | | 0.83% | | | | 0.84% | | | | 0.83% | | | | 0.85% | |
Ratio of net investment income to average net assets | | | 1.70% | | | | 2.23% | | | | 1.94% | | | | 1.39% | | | | 1.32% | |
Portfolio turnover | | | 98% | | | | 111% | | | | 173% | | | | 130% | | | | 75% | |
| 1 | The average shares outstanding method has been applied for per share information. |
| 2 | Total return is based on the change in net asset value of a share during the period and assumes reinvestment of dividends and distributions at net asset value. Total return does not include fees, charges, or expenses imposed by the variable annuity and life insurance contracts for which Delaware VIP Trust serves as an underlying investment vehicle. |
| 3 | Expense ratios do not include expenses of the Underlying Funds in which the Series invests. |
See accompanying notes, which are an integral part of the financial statements.
REIT Series-11
Delaware VIP® REIT Series
Financial highlights (continued)
Selected data for each share of the Series outstanding throughout each period were as follows:
| | | | | | | | | | | | | | | | | | | | |
| |
| Delaware VIP REIT Series Service Class
Year ended |
|
| | | 12/31/19 | | | | 12/31/18 | | | | 12/31/17 | | | | 12/31/16 | | | | 12/31/15 | |
Net asset value, beginning of period | | $ | 11.82 | | | $ | 13.46 | | | $ | 15.54 | | | $ | 15.86 | | | $ | 15.47 | |
| | | | | |
Income (loss) from investment operations: | | | | | | | | | | | | | | | | | | | | |
Net investment income1 | | | 0.20 | | | | 0.24 | | | | 0.24 | | | | 0.18 | | | | 0.17 | |
Net realized and unrealized gain (loss) | | | 2.90 | | | | (1.27 | ) | | | (0.03 | ) | | | 0.67 | | | | 0.37 | |
| | | | | | | | | | | | | | | | | | | | |
Total from investment operations | | | 3.10 | | | | (1.03 | ) | | | 0.21 | | | | 0.85 | | | | 0.54 | |
| | | | | | | | | | | | | | | | | | | | |
| | | | | |
Less dividends and distributions from: | | | | | | | | | | | | | | | | | | | | |
Net investment income | | | (0.26 | ) | | | (0.23 | ) | | | (0.21 | ) | | | (0.17 | ) | | | (0.15 | ) |
Net realized gain | | | — | | | | (0.38 | ) | | | (2.08 | ) | | | (1.00 | ) | | | — | |
| | | | | | | | | | | | | | | | | | | | |
Total dividends and distributions | | | (0.26 | ) | | | (0.61 | ) | | | (2.29 | ) | | | (1.17 | ) | | | (0.15 | ) |
| | | | | | | | | | | | | | | | | | | | |
| | | | | |
Net asset value, end of period | | $ | 14.66 | | | $ | 11.82 | | | $ | 13.46 | | | $ | 15.54 | | | $ | 15.86 | |
| | | | | | | | | | | | | | | | | | | | |
| | | | | |
Total return2 | | | 26.50% | | | | (7.52% | )3 | | | 1.27% | 3 | | | 5.62% | 3 | | | 3.52% | 3 |
| | | | | |
Ratios and supplemental data: | | | | | | | | | | | | | | | | | | | | |
Net assets, end of period (000 omitted) | | $ | 204,193 | | | $ | 173,457 | | | $ | 212,133 | | | $ | 232,062 | | | $ | 238,103 | |
Ratio of expenses to average net assets4 | | | 1.13% | | | | 1.11% | | | | 1.09% | | | | 1.08% | | | | 1.10% | |
Ratio of expenses to average net assets prior to fees waived4 | | | 1.13% | | | | 1.13% | | | | 1.14% | | | | 1.13% | | | | 1.15% | |
Ratio of net investment income to average net assets | | | 1.40% | | | | 1.95% | | | | 1.69% | | | | 1.14% | | | | 1.07% | |
Ratio of net investment income to average net assets prior to fees waived | | | 1.40% | | | | 1.93% | | | | 1.64% | | | | 1.09% | | | | 1.02% | |
Portfolio turnover | | | 98% | | | | 111% | | | | 173% | | | | 130% | | | | 75% | |
| 1 | The average shares outstanding method has been applied for per share information. |
| 2 | Total return is based on the change in net asset value of a share during the period and assumes reinvestment of dividends and distributions at net asset value. Total return does not include fees, charges, or expenses imposed by the variable annuity and life insurance contracts for which Delaware VIP Trust serves as an underlying investment vehicle. |
| 3 | Total return during the period reflects a waiver by the manager and/or distributor. Performance would have been lower had the waiver not been in effect. |
| 4 | Expense ratios do not include expenses of the Underlying Funds in which the Series invests. |
See accompanying notes, which are an integral part of the financial statements.
REIT Series-12
Delaware VIP® Trust — Delaware VIP REIT Series
Notes to financial statements
December 31, 2019
Delaware VIP Trust (Trust) is organized as a Delaware statutory trust and offers 22 series, each of which is treated as a separate entity for certain matters under the Investment Company Act of 1940, as amended (1940 Act). These financial statements and the related notes pertain to Delaware VIP REIT Series (Series). The Trust is anopen-end investment company. The Series is considered diversified under the 1940 Act and offers Standard Class and Service Class shares. The Standard Class shares do not carry a distribution and service(12b-1) fee and the Service Class shares carry a12b-1 fee. The shares of the Series are sold only to separate accounts of life insurance companies.
1. Significant Accounting Policies
The Series follows accounting and reporting guidance under Financial Accounting Standards Board (FASB) Accounting Standards Codification Topic 946, Financial Services - Investment Companies. The following accounting policies are in accordance with US generally accepted accounting principles (US GAAP) and are consistently followed by the Series.
Security Valuation – Equity securities, except those traded on the Nasdaq Stock Market LLC (Nasdaq), are valued at the last quoted sales price as of the time of the regular close of the New York Stock Exchange on the valuation date. Equity securities traded on the Nasdaq are valued in accordance with the Nasdaq Official Closing Price, which may not be the last sales price. If, on a particular day, an equity security does not trade, the mean between the bid and ask prices will be used, which approximates fair value. US government and agency securities are valued at the mean between the bid and ask prices, which approximates fair value.Open-end investment companies are valued at their published net asset value (NAV). Investments in repurchase agreements are generally valued at par, which approximates fair value, each business day. Generally, other securities and assets for which market quotations are not readily available are valued at fair value as determined in good faith under the direction of the Trust’s Board of Trustees (Board). In determining whether market quotations are readily available or fair valuation will be used, various factors will be taken into consideration, such as market closures or suspension of trading in a security. Restricted securities are valued at fair value using methods approved by the Board.
Federal Income Taxes – No provision for federal income taxes has been made as the Series intends to continue to qualify for federal income tax purposes as a regulated investment company under Subchapter M of the Internal Revenue Code of 1986, as amended, and make the requisite distributions to shareholders. The Series evaluates tax positions taken or expected to be taken in the course of preparing the Series’ tax returns to determine whether the tax positions are“more-likely-than-not” of being sustained by the applicable tax authority. Tax positions not deemed to meet the“more-likely-than-not” threshold are recorded as a tax benefit or expense in the current year. Management has analyzed the Series’ tax positions taken or expected to be taken on the Series’ federal income tax returns through the year ended Dec. 31, 2019 and for all open tax years (years ended Dec. 31, 2016–Dec. 31, 2018), and has concluded that no provision for federal income tax is required in the Series’ financial statements. If applicable, the Series recognizes interest accrued on unrecognized tax benefits in interest expense and penalties in “Other expenses” on the “Statement of operations.” During the year ended Dec. 31, 2019, the Series did not incur any interest or tax penalties.
Class Accounting – Investment income, common expenses, and realized and unrealized gain (loss) on investments are allocated to the classes of the Series on the basis of daily net assets of each class. Distribution expenses relating to a specific class are charged directly to that class.
Repurchase Agreements – The Series may purchase certain US government securities subject to the counterparty’s agreement to repurchase them at an agreed upon date and price. The counterparty will be required on a daily basis to maintain the value of the collateral subject to the agreement at not less than the repurchase price (including accrued interest). The agreements are conditioned upon the collateral being deposited under the Federal Reserve book-entry system with the Series’ custodian or a third-partysub-custodian. In the event of default or bankruptcy by the other party to the agreement, retention of the collateral may be subject to legal proceedings. At Dec. 31, 2019 the Series held no investments in repurchase agreements.
Use of Estimates – The preparation of financial statements in conformity with US GAAP requires management to make estimates and assumptions that affect the fair value of investments, the reported amounts of assets and liabilities and disclosure of contingent assets and liabilities at the date of the financial statements, and the reported amounts of revenues and expenses during the reporting period. Actual results could differ from those estimates and the differences could be material.
Other – Expenses directly attributable to the Series are charged directly to the Series. Other expenses common to various funds within the Delaware Funds® by Macquarie (Delaware Funds) are generally allocated among such funds on the basis of average net assets. Management fees and certain other expenses are paid monthly. Security transactions are recorded on the date the securities are purchased or sold (trade date) for financial reporting purposes. Costs used in calculating realized gains and losses on the sale of investment securities are those of the specific securities sold. Dividend income is recorded on theex-dividend date and interest income is recorded on the accrual basis. Discounts and premiums on debt securities are accreted or amortized to interest income, respectively, over the lives of the respective securities using the effective interest method. Distributions received from investments in real estate investment trusts (REITs) are recorded as dividend income on theex-dividend date, subject to reclassification upon notice of the character of such distributions by the issuer, which are estimated. The Series declares and pays dividends from net investment income and distributions from net realized gain on investments, if any, following the close of the fiscal year. The Series may distribute more frequently, if necessary for tax purposes. Dividends and distributions, if any, are recorded on theex-dividend date.
REITSeries-13
Delaware VIP® REIT Series
Notes to financial statements (continued)
1. Significant Accounting Policies (continued)
The Series receives earnings credits from its custodian when positive cash balances are maintained, which may be used to offset custody fees. The expenses paid under this arrangement are included on the “Statement of operations” under “Custodian fees” with the corresponding expenses offset included under “Less expenses paid indirectly.” For the year ended Dec. 31, 2019, the Series earned $718 under this arrangement.
The Series receives earnings credits from its transfer agent when positive cash balances are maintained, which may be used to offset transfer agent fees. If the amount earned is greater than $1, the expenses paid under this arrangement are included on the “Statement of operations” under “Dividend disbursing and transfer agent fees and expenses” with the corresponding expenses offset included under “Less expenses paid indirectly.” For the year ended Dec. 31, 2019, the Series earned $1 under this arrangement.
2. Investment Management, Administration Agreements, and Other Transactions with Affiliates
In accordance with the terms of its investment management agreement, the Series pays Delaware Management Company (DMC), a series of Macquarie Investment Management Business Trust and the investment manager, an annual fee which is calculated daily and paid monthly at the rates of 0.75% on the first $500 million of average daily net assets of the Series, 0.70% on the next $500 million, 0.65% on the next $1.5 billion, and 0.60% on average daily net assets in excess of $2.5 billion.
DMC has contractually agreed to waive all or a portion of its investment advisory fees and/or pay/reimburse expenses (excluding any12b-1 fee, acquired fund fees and expenses, taxes, interest, short sale and dividend interest expenses, brokerage fees, certain insurance costs, and nonroutine expenses or costs, including, but not limited to, those relating to reorganizations, litigation, conducting shareholder meetings, and liquidations) in order to prevent annual series operating expenses from exceeding 0.83% of the Series’ average daily net assets from April 30, 2019 through Dec. 31, 2019.* The waiver and reimbursement are accrued daily and received monthly. This waiver and reimbursement may only be terminated by agreement of DMC and the Series.
Effective May 30, 2019, DMC may permit its affiliates, Macquarie Investment Management Global Limited (MIMGL) and Macquarie Funds Management Hong Kong Limited (together, the “AffiliatedSub-Advisors”), to execute Fund equity security trades on behalf of the Manager. The Manager may also seek quantitative support from MIMGL. Although the AffiliatedSub-Advisors serve assub-advisors, DMC has ultimate responsibility for all investment advisory services. For these services, DMC, not the Fund, may pay each AffiliatedSub-Advisor a portion of its investment management fee.
Delaware Investments Fund Services Company (DIFSC), an affiliate of DMC, provides fund accounting and financial administration oversight services to the Series. For these services, DIFSC’s fees are calculated daily and paid monthly based on the aggregate daily net assets of all funds within the Delaware Funds at the following annual rates: 0.00475% of the first $35 billion; 0.0040% of the next $10 billion; and 0.0025% of aggregate average daily net assets in excess of $45 billion (Total Fee). Each fund in the Delaware Funds pays a minimum of $4,000, which, in aggregate, is subtracted from the Total Fee. Each fund then pays its portion of the remainder of the Total Fee on a relative NAV basis. This amount is included on the “Statement of operations” under “Accounting and administration expenses.” For the year ended Dec. 31, 2019, the Series was charged $19,579 for these services.
DIFSC is also the transfer agent and dividend disbursing agent of the Series. For these services, DIFSC’s fees are calculated daily and paid monthly at the annual rate of 0.0075% of the Series’ average daily net assets. This amount is included on the “Statement of operations” under “Dividend disbursing and transfer agent fees and expenses.” For the year ended Dec. 31, 2019, the Series was charged $31,924 for these services. Pursuant to asub-transfer agency agreement between DIFSC and BNY Mellon Investment Servicing (US) Inc. (BNYMIS), BNYMIS provides certainsub-transfer agency services to the Series.Sub-transfer agency fees are paid by the Series and are also included on the “Statement of operations” under “Dividend disbursing and transfer agent fees and expenses.” The fees that are calculated daily and paid as invoices are received on a monthly or quarterly basis.
Pursuant to a distribution agreement and distribution plan, the Series pays Delaware Distributors, L.P. (DDLP), the distributor and an affiliate of DMC, an annual12b-1 fee of 0.30% of the average daily net assets of the Service Class shares. The fees are calculated daily and paid monthly. Standard Class shares do not pay12b-1 fees.
As provided in the investment management agreement, the Series bears a portion of the cost of certain resources shared with DMC, including the cost of internal personnel of DMC and/or its affiliates that provide legal, tax, and regulatory reporting services to the Series. For the year ended Dec. 31, 2019, the Series was charged $12,689 for internal legal, tax, and regulatory reporting services provided by DMC and/or its affiliates’ employees. This amount is included on the “Statement of operations” under “Legal fees.”
Trustees’ fees include expenses accrued by the Series for each Trustee’s retainer and meeting fees. Certain officers of DMC, DIFSC, and DDLP are officers and/or Trustees of the Trust. These officers and Trustees are paid no compensation by the Series.
REITSeries-14
Delaware VIP® REIT Series
Notes to financial statements (continued)
In addition to the management fees and other expenses of the Series, the Series indirectly bears the investment management fees and other expenses of the investment companies (Underlying Funds) in which it invests. The amount of these fees and expenses incurred indirectly by the Series will vary based upon the expense and fee levels of the Underlying Funds and the number of shares that are owned of the Underlying Funds at different times.
*The aggregate contractual waiver period covering this report is from April 30, 2019 through April 30, 2020.
3. Investments
For the year ended Dec. 31, 2019, the Series made purchases and sales of investment securities other than short-term investments as follows:
| | | | |
Purchases | | $ | 405,483,798 | |
Sales | | | 418,256,361 | |
The tax cost of investments includes adjustments to net unrealized appreciation (depreciation) which may not necessarily be final tax cost basis adjustments, but approximate the tax basis unrealized gains and losses that may be realized and distributed to shareholders. At Dec. 31, 2019, the cost and unrealized appreciation (depreciation) of investments for federal income tax purposes for the Series were as follows:
| | | | | | |
Cost of
Investments | | Aggregate
Unrealized
Appreciation
of Investments | | Aggregate
Unrealized
Depreciation
of Investments | | Net Unrealized
Appreciation
of Investments |
$421,201,054 | | $35,394,640 | | $(17,665,263) | | $17,729,377 |
US GAAP defines fair value as the price that the Series would receive to sell an asset or pay to transfer a liability in an orderly transaction between market participants at the measurement date under current market conditions. A three-level hierarchy for fair value measurements has been established based upon the transparency of inputs to the valuation of an asset or liability. Inputs may be observable or unobservable and refer broadly to the assumptions that market participants would use in pricing the asset or liability. Observable inputs reflect the assumptions market participants would use in pricing the asset or liability based on market data obtained from sources independent of the reporting entity. Unobservable inputs reflect the reporting entity’s own assumptions about the assumptions that market participants would use in pricing the asset or liability based on the best information available under the circumstances. The Series’ investment in its entirety is assigned a level based upon the observability of the inputs which are significant to the overall valuation. The three-level hierarchy of inputs is summarized below.
| | | | |
| Level 1 | | – | | Inputs are quoted prices in active markets for identical investments. (Examples: equity securities,open-end investment companies, futures contracts, and exchange-traded options contracts) |
| Level 2 | | – | | Other observable inputs, including, but not limited to: quoted prices for similar assets or liabilities in markets that are active, quoted prices for identical or similar assets or liabilities in markets that are not active, inputs other than quoted prices that are observable for the assets or liabilities (such as interest rates, yield curves, volatilities, prepayment speeds, loss severities, credit risks, and default rates) or other market-corroborated inputs. (Examples: debt securities, government securities, swap contracts, foreign currency exchange contracts, foreign securities utilizing international fair value pricing, broker-quoted securities, and fair valued securities) |
| Level 3 | | – | | Significant unobservable inputs, including the Series’ own assumptions used to determine the fair value of investments. (Examples: broker-quoted securities and fair valued securities) |
Level 3 investments are valued using significant unobservable inputs. The Series may also use an income-based valuation approach in which the anticipated future cash flows of the investment are discounted to calculate fair value. Discounts may also be applied due to the nature or duration of any restrictions on the disposition of the investments. Valuations may also be based upon current market prices of securities that are comparable in coupon, rating, maturity, and industry. The derived value of a Level 3 investment may not represent the value which is received upon disposition and this could impact the results of operations.
REITSeries-15
Delaware VIP® REIT Series
Notes to financial statements (continued)
3. Investments (continued)
The following table summarizes the valuation of the Series’ investments by fair value hierarchy levels as of Dec. 31, 2019:
| | | | |
Securities | | Level 1 | |
Assets: | | | | |
Common Stock | | $ | 437,445,124 | |
Short-Term Investments | | | 1,485,307 | |
| | | | |
Total Value of Securities | | $ | 438,930,431 | |
| | | | |
During the year ended Dec. 31, 2019, there were no transfers between Level 1 investments, Level 2 investments, or Level 3 investments that had a significant impact to the Series. The Series’ policy is to recognize transfers between levels based on fair value at the beginning of the reporting period.
A reconciliation of Level 3 investments is presented when the Series has a significant amount of Level 3 investments at the beginning, interim, or end of the year in relation to the Series’ net assets. During the year ended Dec. 31, 2019, there were no Level 3 investments.
4. Dividend and Distribution Information
Income and long-term capital gain distributions are determined in accordance with federal income tax regulations, which may differ from US GAAP. Additionally, distributions from net short-term gains on sales of investment securities are treated as ordinary income for federal income tax purposes. The tax character of dividends and distributions paid during the years ended Dec. 31, 2019 and 2018 was as follows:
| | | | | | | | |
| | | Year ended | |
| | | 12/31/19 | | | 12/31/18 | |
Ordinary income | | $ | 8,513,864 | | | $ | 13,466,384 | |
Long-term capital gains | | | — | | | | 7,531,779 | |
| | | | | | | | |
Total | | $ | 8,513,864 | | | $ | 20,998,163 | |
| | | | | | | | |
5. Components of Net Assets on a Tax Basis
As of Dec. 31, 2019, the components of net assets on a tax basis were as follows:
| | | | |
Shares of beneficial interest | | $ | 395,721,764 | |
Undistributed ordinary income | | | 6,952,439 | |
Undistributed long-term capital gains | | | 20,281,644 | |
Net unrealized appreciation on investments | | | 17,729,377 | |
| | | | |
Net assets | | $ | 440,685,224 | |
| | | | |
The differences between book basis and tax basis components of net assets are primarily attributable to tax deferral of losses on wash sales.
For federal income tax purposes, capital loss carryforwards may be carried forward and applied against future capital gains. $20,576,424 was utilized in 2019.
REITSeries-16
Delaware VIP® REIT Series
Notes to financial statements (continued)
6. Capital Shares
Transactions in capital shares were as follows:
| | | | | | | | |
| | | Year ended | |
| | | 12/31/19 | | | 12/31/18 | |
Shares sold: | | | | | | | | |
Standard Class | | | 669,647 | | | | 676,737 | |
Service Class | | | 682,206 | | | | 688,375 | |
Shares issued upon reinvestment of dividends and distributions: | | | | | | | | |
Standard Class | | | 373,624 | | | | 985,064 | |
Service Class | | | 283,817 | | | | 836,112 | |
| | | | | | | | |
| | | 2,009,294 | | | | 3,186,288 | |
| | | | | | | | |
Shares redeemed: | | | | | | | | |
Standard Class | | | (1,734,837 | ) | | | (2,325,829 | ) |
Service Class | | | (1,709,138 | ) | | | (2,614,717 | ) |
| | | | | | | | |
| | | (3,443,975 | ) | | | (4,940,546 | ) |
| | | | | | | | |
Net decrease | | | (1,434,681 | ) | | | (1,754,258 | ) |
| | | | | | | | |
7. Line of Credit
The Series, along with certain other funds in the Delaware Funds (Participants), was a participant in a $220,000,000 revolving line of credit intended to be used for temporary or emergency purposes as an additional source of liquidity to fund redemptions of investor shares. Under the agreement, the Participants were charged an annual commitment fee of 0.15%, which was allocated across the Participants based on a weighted average of the respective net assets of each Participant. The Participants were permitted to borrow up to a maximum ofone-third of their net assets under the agreement. Each Participant was individually, and not jointly, liable for its particular advances, if any, under the line of credit. The line of credit available under the agreement expired on Nov. 4, 2019.
On Nov. 4, 2019, the Participants entered into an amendment to the agreement for a $250,000,000 revolving line of credit. The revolving line of credit is to be used as described above and operates in substantially the same manner as the original agreement. The line of credit available under the agreement expires on Nov. 2, 2020.
The Series had no amounts outstanding as of Dec. 31, 2019, or at any time during the year then ended.
8. Securities Lending
The Series, along with other funds in the Delaware Funds, may lend its securities pursuant to a security lending agreement (Lending Agreement) with The Bank of New York Mellon (BNY Mellon). At the time a security is loaned, the borrower must post collateral equal to the required percentage of the market value of the loaned security, including any accrued interest. The required percentage is: (1) 102% with respect to US securities and foreign securities that are denominated and payable in US dollars; and (2) 105% with respect to foreign securities. With respect to each loan, if on any business day, the aggregate market value of securities collateral plus cash collateral held is less than the aggregate market value of the securities which are the subject of such loan, the borrower will be notified to provide additional collateral by the end of the following business day, which, together with the collateral already held, will be not less than the applicable initial collateral requirements for such security loan. If the aggregate market value of securities collateral and cash collateral held with respect to a security loan exceeds the applicable initial collateral requirement, upon the request of the borrower, BNY Mellon must return enough collateral to the borrower by the end of the following business day to reduce the value of the remaining collateral to the applicable initial collateral requirement for such security loan. As a result of the foregoing, the value of the collateral held with respect to a loaned security on any particular day may be more or less than the value of the security on loan. The collateral percentage with respect to the market value of the loaned security is determined by the security lending agent.
Cash collateral received by each series of the Trust is generally invested in a series of individual separate accounts, each corresponding to a series. The investment guidelines permit each separate account to hold certain securities that would be considered eligible securities for a money market fund. Cash collateral received is generally invested in government securities; certain obligations issued by government sponsored enterprises; repurchase agreements collateralized by US Treasury securities; obligations issued by the central government of any Organization for Economic Cooperation and Development (OECD) country or its agencies, instrumentalities, or establishments; obligations of supranational organizations; commercial paper, notes, bonds, and other
REITSeries-17
Delaware VIP® REIT Series
Notes to financial statements (continued)
8. Securities Lending (continued)
debt obligations; certificates of deposit, time deposits, and other bank obligations; and asset-backed securities. A series can also accept US government securities and letters of credit(non-cash collateral) in connection with securities loans.
In the event of default or bankruptcy by the lending agent, realization and/or retention of the collateral may be subject to legal proceedings. In the event the borrower fails to return loaned securities and the collateral received is insufficient to cover the value of the loaned securities and provided such collateral shortfall is not the result of investment losses, the lending agent has agreed to pay the amount of the shortfall to the Series or, at the discretion of the lending agent, replace the loaned securities. The Series continues to record dividends or interest, as applicable, on the securities loaned and is subject to changes in value of the securities loaned that may occur during the term of the loan. The Series has the right under the Lending Agreement to recover the securities from the borrower on demand. With respect to security loans collateralized bynon-cash collateral, the Series receives loan premiums paid by the borrower. With respect to security loans collateralized by cash collateral, the earnings from the collateral investments are shared among the Series, the security lending agent, and the borrower. The Series records security lending income net of allocations to the security lending agent and the borrower.
The Series may incur investment losses as a result of investing securities lending collateral. This could occur if an investment in the collateral investment account defaulted or became impaired. Under those circumstances, the value of the Series’ cash collateral account may be less than the amount the Series would be required to return to the borrowers of the securities and the Series would be required to make up for this shortfall.
During the year ended Dec. 31, 2019, the Series had no securities out on loan.
9. Credit and Market Risk
The Series concentrates its investments in the real estate industry and is subject to the risks associated with that industry. If the Series holds real estate directly or receives rental income directly from real estate holdings, its tax status as a regulated investment company may be jeopardized. The Series is also affected by interest rate changes, particularly if the REITs it holds use floating rate debt to finance their ongoing operations. Its investments may also tend to fluctuate more widely than that of a fund that invests in a broader range of industries.
The Series may invest up to 10% of its net assets in illiquid securities, which may include securities with contractual restrictions on resale, securities exempt from registration under Rule 144A, promulgated under Securities Act of 1933, as amended, and other securities which may not be readily marketable. The relative illiquidity of these securities may impair the Series from disposing of them in a timely manner and at a fair price when it is necessary or desirable to do so. While maintaining oversight, the Board has delegated to DMC, theday-to-day functions of determining whether individual securities are liquid for purposes of the Series’ limitation on investments in illiquid securities. Securities eligible for resale pursuant to Rule 144A, which are determined to be liquid, are not subject to the Series’ 10% limit on investments in illiquid securities. As of Dec. 31, 2019, there were no Rule 144A securities held by the Series.
10. Contractual Obligations
The Series enters into contracts in the normal course of business that contain a variety of indemnifications. The Series’ maximum exposure under these arrangements is unknown. However, the Series has not had prior claims or losses pursuant to these contracts. Management has reviewed the Series’ existing contracts and expects the risk of loss to be remote.
11. Recent Accounting Pronouncements
In August 2018, the FASB issued an Accounting Standards Update (ASU), ASU2018-13, which changes certain fair value measurement disclosure requirements. ASU2018-13, in addition to other modifications and additions, removes the requirement to disclose the amount and reasons for transfers between Level 1 and Level 2 of the fair value hierarchy, the policy for the timing of transfers between levels and the valuation process for Level 3 fair value measurements. ASU2018-13 is effective for fiscal years, and interim periods within those fiscal years, beginning after Dec. 15, 2019. At this time, management is evaluating the implications of these changes on the financial statements.
12. Subsequent Events
Management has determined that no material events or transactions occurred subsequent to Dec. 31, 2019, that would require recognition or disclosure in the Series’ financial statements.
REITSeries-18
Delaware VIP® Trust — Delaware VIP REIT Series
Report of independent registered public accounting firm
To the Board of Trustees of Delaware VIP® Trust and Shareholders of Delaware VIP REIT Series
Opinion on the Financial Statements
We have audited the accompanying statement of assets and liabilities, including the schedule of investments, of Delaware VIP REIT Series (one of the series constituting Delaware VIP® Trust, referred to hereafter as the “Series”) as of December 31, 2019, the related statement of operations for the year ended December 31, 2019, the statements of changes in net assets for each of the two years in the period ended December 31, 2019, including the related notes, and the financial highlights for each of the five years in the period ended December 31, 2019 (collectively referred to as the “financial statements”). In our opinion, the financial statements present fairly, in all material respects, the financial position of the Series as of December 31, 2019, the results of its operations for the year then ended, the changes in its net assets for each of the two years in the period ended December 31, 2019 and the financial highlights for each of the five years in the period ended December 31, 2019 in conformity with accounting principles generally accepted in the United States of America.
Basis for Opinion
These financial statements are the responsibility of the Series’ management. Our responsibility is to express an opinion on the Series’ financial statements based on our audits. We are a public accounting firm registered with the Public Company Accounting Oversight Board (United States) (PCAOB) and are required to be independent with respect to the Series in accordance with the U.S. federal securities laws and the applicable rules and regulations of the Securities and Exchange Commission and the PCAOB.
We conducted our audits of these financial statements in accordance with the standards of the PCAOB. Those standards require that we plan and perform the audit to obtain reasonable assurance about whether the financial statements are free of material misstatement, whether due to error or fraud.
Our audits included performing procedures to assess the risks of material misstatement of the financial statements, whether due to error or fraud, and performing procedures that respond to those risks. Such procedures included examining, on a test basis, evidence regarding the amounts and disclosures in the financial statements. Our audits also included evaluating the accounting principles used and significant estimates made by management, as well as evaluating the overall presentation of the financial statements. Our procedures included confirmation of securities owned as of December 31, 2019 by correspondence with the custodian, transfer agents and brokers; when replies were not received from brokers, we performed other auditing procedures. We believe that our audits provide a reasonable basis for our opinion.
/s/PricewaterhouseCoopers LLP
Philadelphia, Pennsylvania
February 21, 2020
We have served as the auditor of one or more investment companies in Delaware Funds® by Macquarie since 2010.
REITSeries-19
Delaware VIP® Trust — Delaware VIP REIT Series
Other Series information (Unaudited)
Board consideration of Investment Advisory andSub-Advisory Agreements for Delaware VIP REIT Series at a meeting held August21-22, 2019
At a meeting held on Aug.21-22, 2019 (the “Annual Meeting”), the Board of Trustees (the “Board”), including a majority of disinterested or independent Trustees, approved the renewal of the investment advisory andsub-advisory agreements for Delaware VIP REIT Series (the “Series”). In making its decision, the Board considered information furnished at regular quarterly Board meetings, including reports detailing Series performance, investment strategies, and expenses, as well as information prepared specifically in connection with the renewal of the investment advisory andsub-advisory contracts. Information furnished specifically in connection with the renewal of the Investment Management Agreement with Delaware Management Company (“DMC”), a series of Macquarie Investment Management Business Trust (“MIMBT”) and theSub-Advisory Agreements with Macquarie Funds Management Hong Kong Limited (“MFMHK”) and Macquarie Investment Management Global Limited (“MIMGL”), included materials provided by DMC and its affiliates (collectively, “Macquarie Investment Management”), MFMHK, and MIMGL, concerning, among other things, the nature, extent, and quality of services provided to the Series; the costs of such services to the Series; economies of scale; and the investment manager’s financial condition and profitability. In addition, in connection with the Annual Meeting, materials were provided to the Trustees in May 2019, including reports provided by Broadridge Financial Solutions (“Broadridge”). The Broadridge reports compared the Series’ investment performance and expenses with those of other comparable mutual funds. The Independent Trustees reviewed and discussed the Broadridge reports with independent legal counsel to the Independent Trustees. In addition to the information noted above, the Board also requested and received information regarding DMC’s policy with respect to advisory fee levels and its breakpoint philosophy; the structure of portfolio manager compensation; comparative client fee information; and any constraints or limitations on the availability of securities for certain investment styles, which had in the past year inhibited, or which were likely in the future to inhibit, the investment manager’s ability to invest fully in accordance with Series policies.
In considering information relating to the approval of the Series’ investment advisory andsub-advisory agreements, the Independent Trustees received assistance and advice from and met separately with independent legal counsel to the Independent Trustees and also received assistance and advice from an experienced and knowledgeable independent fund consultant, JDL Consultants, LLC (“JDL”). Although the Board gave attention to all information furnished, the following discussion identifies, under separate headings, the primary factors taken into account by the Board during its contract renewal considerations.
Nature, extent, and quality of services.The Board considered the services provided by DMC to the Series and its shareholders. In reviewing the nature, extent, and quality of services, the Board considered reports furnished to it throughout the year, which covered matters such as the relative performance of the Series; compliance of portfolio managers with the investment policies, strategies, and restrictions for the Series; compliance by DMC and Delaware Distributors, L.P. (together, “Management”) personnel with the Code of Ethics adopted throughout the Delaware Funds® by Macquarie (the “Delaware Funds”); and adherence to fair value pricing procedures as established by the Board. The Board was pleased with the current staffing of DMC and the emphasis placed on research in the investment process. The Board recognized DMC’s receipt of certain favorable industry distinctions during the past several years. The Board gave favorable consideration to DMC’s efforts to control expenses while maintaining service levels committed to Series matters. The Board was satisfied with the nature, extent, and quality of the overall services provided by DMC.
Nature, extent, and quality of services.The Board considered the services provided by MFMHK to the Series and its shareholders. In reviewing the nature, extent, and quality of services, the Board considered reports furnished to it throughout the year at regular Board Meetings covering matters such as relative performance of the Series; compliance of portfolio managers with the investment policies, strategies, and restrictions for the Series; the compliance of MFMHK personnel with its Code of Ethics; and adherence to fair value pricing procedures as established by the Board. The Board was pleased with the current staffing of MFMHK and the emphasis placed on research in the investment process. The Board was satisfied with the nature, extent, and quality of the overall services provided by MFMHK.
Nature, extent, and quality of services.The Board considered the services provided by MIMGL to the Series and its shareholders. In reviewing the nature, extent, and quality of services, the Board considered reports furnished to it throughout the year at regular Board Meetings covering matters such as relative performance of the Series; compliance of portfolio managers with the investment policies, strategies, and restrictions for the Series; the compliance of MIMGL personnel with its Code of Ethics; and adherence to fair value pricing procedures as established by the Board. The Board was pleased with the current staffing of MIMGL and the emphasis placed on research in the investment process. The Board was satisfied with the nature, extent, and quality of the overall services provided by MIMGL.
Investment performance.The Board placed significant emphasis on the investment performance of the Series in view of the importance of investment performance to shareholders. Although the Board considered performance reports and discussions with portfolio managers at Board meetings throughout the year, the Board gave particular weight to the Broadridge reports furnished for the Annual Meeting. The Broadridge reports prepared for the Series showed the investment performance of its Standard Class shares in comparison to a group of similar funds as selected by Broadridge (the “Performance Universe”). A fund with the best performance ranked first, and a fund with the poorest performance ranked last. The highest/best performing 25% of funds in the Performance Universe make up the first quartile; the next 25%, the second quartile; the next 25%, the third quartile; and the poorest/worst performing 25% of funds in the Performance Universe make up the fourth quartile. Comparative annualized performance for the Series was
REITSeries-20
Delaware VIP® Trust — Delaware VIP REIT Series
Other Series information (Unaudited)
Board consideration of Investment Advisory andSub-Advisory Agreements for Delaware VIP REIT Series at a meeting held August21-22, 2019 (continued)
shown for the past1-,3-,5-, and10-year periods, as applicable, ended Jan. 31, 2019. The Board’s objective is that the Series’ performance for the1-,3-, and5-year periods be at or above the median of its Performance Universe.
The Performance Universe for the Series consisted of the Series and all real estate funds underlying variable insurance products as selected by Broadridge. The Broadridge report comparison showed that the Series’ total return for the1-year period was in the third quartile of its Performance Universe. The report further showed that the Series’ total return for the3-,5-, and10-year periods was in the fourth quartile of its Performance Universe. The Board observed that the Series’ performance results were not in line with the Board’s objective. In evaluating the Series’ performance, the Board considered the performance attribution included in the meeting materials, as well as the numerous investment and performance reports delivered by Management personnel to the Board’s Investments Committee. The Board was satisfied that Management was taking action to improve Series performance and to meet the Board’s performance objective.
Comparative expenses.The Board considered expense data for the Delaware Funds. Management provided the Board with information on pricing levels and fee structures for the Series as of its most recently completed fiscal year. The Board also focused on the comparative analysis of effective management fees and total expense ratios of the Series versus effective management fees and expense ratios of a group of similar funds as selected by Broadridge (the “Expense Group”). In reviewing comparative costs, the Series’ contractual management fee and the actual management fee incurred by the Series were compared with the contractual management fees (assuming all funds in the Expense Group were similar in size to the Series) and actual management fees (as reported by each fund) within the Expense Group, taking into account any applicable breakpoints and fee waivers. The Series’ total expenses were also compared with those of its Expense Group. The Broadridge total expenses, for comparative consistency, were shown by Broadridge for Standard Class shares which do not charge12b-1 andnon-12b-1 service fees. The Board’s objective is for each Series’ total expense ratio to be competitive with those of the peer funds within its Expense Group.
The expense comparisons for the Series showed that the actual management fee was in the quartile with the second lowest expenses of its Expense Group and its total expenses were in the quartile with the second highest expenses of its Expense Group. The Series’ total expenses were not in line with the Board’s objective. In evaluating total expenses, the Board considered fee waivers in place through April 2020 and various initiatives implemented by Management, such as the negotiation of lower fees for fund accounting, fund accounting oversight and custody services, which had created an opportunity for a further reduction in expenses. The Board was satisfied with Management’s efforts to improve the Series’ total expense ratio and to bring it in line with the Board’s objective.
Management profitability.The Board considered the level of profits realized by DMC in connection with the operation of the Series. In this respect, the Board reviewed the Investment Management Profitability Analysis that addressed the overall profitability of DMC’s business in providing management and other services to each of the individual funds and the Delaware Funds as a whole. Specific attention was given to the methodology used by DMC in allocating costs for the purpose of determining profitability. Management stated that the level of profits of DMC, to a certain extent, reflects recent operational cost savings and efficiencies initiated by DMC. The Board considered DMC’s efforts to improve services provided to fund shareholders and to meet additional regulatory and compliance requirements resulting from recent industry-wide Securities and Exchange Commission initiatives. The Board also considered the extent to which DMC might derive ancillary benefits from fund operations, including the potential for procuring additional business as a result of the prestige and visibility associated with its role as service provider to the Delaware Funds and the benefits from allocation of fund brokerage to improve trading efficiencies. As part of its work, the Board also reviewed a report prepared by JDL regarding MIMBT profitability as compared to certain peer fund complexes and the Independent Trustees discussed with JDL personnel regarding DMC’s profitability in such context. The Board found that the management fees were reasonable in light of the services rendered and the profitability of DMC.
Economies of scale.The Trustees considered whether economies of scale are realized by DMC as the Series’ assets increase and the extent to which any economies of scale are reflected in the level of management fees charged. The Trustees reviewed the Series’ advisory fee pricing and structure approved by the Board and shareholders, which includes breakpoints, and which applies to most funds in the Delaware Funds complex. Breakpoints in the advisory fee occur when the advisory fee rate is reduced on assets in excess of specified levels. Breakpoints result in a lower advisory fee, than would otherwise be the case in the absence of breakpoints, when the asset levels specified in the breakpoints are exceeded. Although, as of March 31, 2019, the Series had not reached a size at which it could take advantage of any breakpoints in the applicable fee schedule, the Board recognized that the fee was structured so that, if the Series increases sufficiently in size, then economies of scale may be shared.
REITSeries-21
Delaware VIP® Trust — Delaware VIP REIT Series
Other Series information (Unaudited)
Tax Information
All disclosures are based on financial information available as of the date of this annual report and, accordingly are subject to change. For any and all items requiring reporting, it is the intention of the Series to report the maximum amount permitted under the Internal Revenue Code and the regulations thereunder.
For the year ended Dec. 31, 2019, the Series reports distributions paid during the year as follows:
|
(A) Ordinary Income Distributions (Tax Basis) |
100.00% |
(A) is based on a percentage of the Series’ total distributions.
REITSeries-22
Delaware Funds® by Macquarie
Board of trustees / directors and officers addendum
A mutual fund is governed by a Board of Trustees/Directors (“Trustees”), which has oversight responsibility for the management of a fund’s business affairs. Trustees establish procedures and oversee and review the performance of the investment manager, the distributor, and others who perform services for the fund. The independent fund trustees, in particular, are advocates for shareholder interests. Each trustee has served in that capacity since he or she was elected to or appointed to the Board of Trustees, and will continue to serve until his or her retirement or the election of a new trustee in his or her place. The following is a list of the Trustees and Officers with certain background and related information.
| | | | | | | | | | |
Name,
Address,
and Birth Date | | Position(s) Held with
Fund(s) | | Length of Time
Served | | Principal
Occupation(s)
During the Past Five Years | | Number of
Portfolios in Fund
Complex Overseen
by Trustee
or Officer | | Other
Directorships
Held by
Trustee
or Officer |
INTERESTED TRUSTEE |
Shawn K. Lytle1
2005 Market Street
Philadelphia, PA 19103 February 1970 | | President,
Chief Executive Officer,
and Trustee | | President and Chief Executive Officer since August 2015 Trustee since
September 2015 | | President — Macquarie Investment Management2(June 2015-Present) Regional Head of Americas — UBS Global Asset Management(April 2010-May 2015) | | 95 | | Trustee —
UBS Relationship Funds,
SMA Relationship Trust,
and UBS Funds
(May 2010–April 2015) |
| INDEPENDENT TRUSTEES |
Thomas L. Bennett
2005 Market Street
Philadelphia, PA 19103 October 1947 | | Chair and Trustee | | Trustee since
March 2005 Chair since March 2015 | | Private Investor
(March 2004–Present) | | 95 | | None |
Jerome D. Abernathy
2005 Market Street
Philadelphia, PA 19103 July 1959 | | Trustee | | Since
January 2019 | | Managing Member,
Stonebrook Capital
Management, LLC (financial technology: macro factors and databases) (January 1993–Present) | | 95 | | None |
Ann D. Borowiec
2005 Market Street
Philadelphia, PA 19103 November 1958 | | Trustee | | Since
March 2015 | | Chief Executive Officer, Private Wealth Management (2011–2013) and Market Manager, New Jersey Private Bank (2005–2011) — J.P. Morgan Chase & Co. | | 95 | | Director — Banco Santander International (October 2016–December
2019) Director — Santander Bank, N.A. (December 2016–December
2019) |
Joseph W. Chow
2005 Market Street
Philadelphia, PA 19103 January 1953 | | Trustee | | Since
January 2013 | | Private Investor
(April 2011–Present) | | 95 | | Director and Audit Committee
Member — Hercules
Technology Growth
Capital, Inc. (July 2004–July 2014) |
REIT Series-23
| | | | | | | | | | |
Name,
Address,
and Birth Date | | Position(s)
Held with
Fund(s) | | Length of Time
Served | | Principal
Occupation(s)
During the
Past Five Years | | Number of
Portfolios in Fund
Complex Overseen
by Trustee or Officer | | Other
Directorships
Held by
Trustee
or Officer |
John A. Fry 2005 Market Street
Philadelphia, PA 19103 May 1960 | | Trustee | | Since
January 2001 | | President — Drexel University (August 2010–Present) President — Franklin & Marshall College (July 2002–July 2010) | | 95 | | Director; Compensation Committee and Governance Committee Member — Community Health Systems (May 2004–Present) Director —
Drexel Morgan & Co. (2015–Present) Director and Audit Committee Member — vTv Therapeutics LLC
(2017–Present) Director and Audit Committee Member — FS Credit Real Estate Income Trust, Inc. (2018–Present)
Director — Federal Reserve Bank of Philadelphia (January 2020–Present) |
Lucinda S. Landreth 2005 Market Street Philadelphia, PA 19103 June 1947 | | Trustee | | Since March 2005 | | Private Investor (2004–Present) | | 95 | | None |
Frances A. Sevilla-Sacasa2005 Market Street Philadelphia, PA 19103 January 1956 | | Trustee | | Since September 2011 | | Private Investor(January 2017-Present) Chief Executive Officer — Banco Itaú International | | 95 | | Trust Manager and Audit Committee Chair — Camden Property Trust (August 2011–Present) |
| | | | | | (April 2012–December 2016) | | | | Director; Strategic Planning |
| | | | | | | | | | and Reserves Committee |
| | | | | | Executive Advisor to Dean (August 2011–March 2012) and Interim Dean (January 2011–July 2011) — University of Miami School of | | | | and Nominating and Governance Committee Member — Callon Petroleum Company (December 2019–Present) |
| | | | | | Business Administration | | | | Director; Audit Committee |
| | | | | | President —U.S. Trust, Bank of America Private Wealth Management (Private Banking) | | | | Member — Carrizo Oil & Gas,Inc. (March 2018–December 2019) |
| | | | | | | (July 2007–December 2008) | | | | |
Thomas K. Whitford 2005 Market Street Philadelphia, PA 19103 | | Trustee | | Since January 2013 | | Vice Chairman (2010–April 2013) — PNC Financial Services Group | | 95 | | Director — HSBC North America Holdings Inc.(December 2013-Present) |
March 1956 | | | | | | | | | | Director —
HSBC USA Inc. (July 2014-Present) |
| | | | | | | | | | Director — HSBC Bank USA, National Association (July 2014-March 2017) |
| | | | | | | | | | | Director — HSBC Finance Corporation(December 2013-April 2018) |
REIT Series-24
| | | | | | | | | | |
Name,
Address,
and Birth Date | | Position(s)
Held with
Fund(s) | | Length of Time
Served | | Principal
Occupation(s)
During the
Past Five Years | | Number of
Portfolios in Fund
Complex Overseen
by Trustee
or Officer | | Other
Directorships
Held by
Trustee
or Officer |
Christianna Wood 2005 Market Street
Philadelphia, PA 19103 | | Trustee | | Since
January 2019 | | Chief Executive Officer and President — Gore Creek Capital, Ltd. (August 2009–Present) | | 95 | | Director; Finance Committee and Audit Committee Member — H&R Block Corporation (July 2008–Present) |
| March 1956 | | | | | | | | | | Director; Chair of Investments Committee and Audit Committee Member — Grange Insurance
(2013–Present) |
| | | | | | | | | | Trustee; Chair of Nominating and Governance Committee and Audit Committee Member — The Merger Fund
(2013–Present), The Merger Fund
VL (2013–Present); WCM Alternatives: Event-Driven Fund
(2013–Present), and WCM Alternatives:
Credit Event Fund
(December 2017–Present) |
| | | | | | | | | | | Director; Chair of Governance Committee and Audit Committee Member — International Securities Exchange (2010–2016) |
Janet L. Yeomans
2005 Market Street
Philadelphia, PA 19103 July 1948 | | Trustee | | Since
April 1999 | | Vice President and Treasurer (January 2006–July 2012), Vice President — Mergers & Acquisitions (January 2003–January 2006), and Vice President and Treasurer (July 1995–January 2003) — 3M Company | | 95 | | Director; Personnel and Compensation Committee Chair; Member of Nominating, Investments, and Audit Committees for various periods throughout directorship — Okabena Company
(2009-2017) |
REIT Series-25
| | | | | | | | | | |
Name,
Address,
and Birth Date | | Position(s)
Held with
Fund(s) | | Length of Time
Served | | Principal
Occupation(s)
During the
Past Five Years | | Number of
Portfolios in Fund
Complex Overseen
by Trustee
or Officer | | Other
Directorships
Held by Trustee
or Officer |
| OFFICERS | | | | | | | | | | |
| | | | | |
David F. Connor
2005 Market Street
Philadelphia, PA 19103 December 1963 | | Senior
Vice President,
General Counsel,
and Secretary | | Senior Vice President, since May 2013;
General Counsel
since May 2015; Secretary since
October 2005 | | David F. Connor has served in
various capacities at different
times at Macquarie Investment Management. | | 95 | | None3 |
| | | | | |
Daniel V. Geatens
2005 Market Street
Philadelphia, PA 19103 October 1972 | | Vice President
and Treasurer | | Vice President
and Treasurer
since
October 2007 | | Daniel V. Geatens has served in various capacities at different
times at Macquarie Investment
Management. | | 95 | | None3 |
| | | | | |
Richard Salus
2005 Market Street
Philadelphia, PA 19103 October 1963 | | Senior Vice President
and Chief Financial
Officer | | Senior Vice President
and Chief Financial Officer since
November 2006 | | Richard Salus has served in
various capacities at different
times at Macquarie Investment Management. | | 95 | | None |
| 1 | Shawn K. Lytle is considered to be an “Interested Trustee” because he is an executive officer of the Fund’s(s’) investment advisor. |
| 2 | Macquarie Investment Management is the marketing name for Macquarie Management Holdings, Inc. and its subsidiaries, including the Fund’s(s’) investment advisor, principal underwriter, and its transfer agent. |
| 3 | David F. Connor and Daniel V. Geatens serve in similar capacities for the six portfolios of the Optimum Fund Trust, which have the same investment advisor, principal underwriter, and transfer agent as the registrant. Mr. Geatens also serves as the Chief Financial Officer of the Optimum Fund Trust and he is the Chief Financial Officer and Treasurer for Macquarie Global Infrastructure Total Return Fund Inc. |
The Statement of Additional Information for the Fund(s) includes additional information about the Trustees and Officers and is available, without charge, upon request by calling 800523-1918.
REITSeries-26
| | | | |
| | The Series files its complete schedule of portfolio holdings with the Securities and Exchange Commission (SEC) for the first and third quarters of each fiscal year on FormN-Q or FormN-PORT (available for filings after March 31, 2019). The Series’ FormsN-Q or FormsN-PORT, as well as a description of the policies and procedures that the Series uses to determine how to vote proxies (if any) relating to portfolio securities, are available without charge (i) upon request, by calling 800523-1918; and (ii) on the SEC’s website at sec.gov. In addition, a description of the policies and procedures that the Series uses to determine how to vote proxies (if any) relating to portfolio securities and the Schedule of Investments included in the Series’ most recent FormN-Q or FormN-PORT are available without charge on the Series’ website at delawarefunds.com/vip/literature. The Series’ FormsN-Q and FormsN-PORT may be reviewed and copied at the SEC’s Public Reference Room in Washington, D.C.; information on the operation of the Public Reference Room may be obtained by calling 800SEC-0330. Information (if any) regarding how the Series voted proxies relating to portfolio securities during the most recently disclosed12-month period ended June 30 is available without charge (i) through the Series’ website at delawarefunds.com/proxy; and (ii) on the SEC’s website at sec.gov. | | |
REITSeries-27
AR-VIPREIT 22467 (2/20) (1073909)

Delaware VIP® Trust
Delaware VIP Small Cap Value Series
December 31, 2019
|
Beginning on or about June 1, 2021, as permitted by regulations adopted by the Securities and Exchange Commission, paper copies of your Series’ shareholder reports will no longer be sent to you by mail, unless you specifically request them from the Series or from your financial intermediary, such as a broker/dealer, bank, or insurance company. Instead, you will be notified by mail each time a report is posted on the website and provided with a link to access the report. If you already elected to receive shareholder reports electronically, you will not be affected by this change and you do not need to take any action. You may elect to receive paper copies of all future shareholder reports free of charge. You can inform the Series that you wish to continue receiving paper copies of your shareholder reports by contacting us at 800523-1918. If you own these shares through a financial intermediary, you may contact your financial intermediary to elect to continue to receive paper copies of your shareholder reports. Your election to receive reports in paper will apply to all funds held with the Delaware Funds® by Macquarie or your financial intermediary. |
Table of contents
Other than Macquarie Bank Limited (MBL), none of the entities noted are authorized deposit-taking institutions for the purposes of the Banking Act 1959 (Commonwealth of Australia). The obligations of these entities do not represent deposits or other liabilities of MBL. MBL does not guarantee or otherwise provide assurance in respect of the obligations of these entities, unless noted otherwise. The Series is governed by US laws and regulations.
Unless otherwise noted, views expressed herein are current as of Dec. 31, 2019, and subject to change for events occurring after such date.
The Series is not FDIC insured and is not guaranteed. It is possible to lose the principal amount invested.
Advisory services provided by Delaware Management Company, a series of Macquarie Investment Management Business Trust (MIMBT), a US registered investment advisor.
The Series is distributed byDelaware Distributors, L.P.(DDLP), an affiliate of MIMBT and Macquarie Group Limited. Macquarie Investment Management (MIM) is the marketing name for certain companies comprising the asset management division of Macquarie Group Limited and its subsidiaries and affiliates worldwide.
This material may be used in conjunction with the offering of shares in Delaware VIP® Small Cap Value Series only if preceded or accompanied by the Series’ current prospectus or the summary prospectus.
© 2020 Macquarie Management Holdings, Inc.
All third-party marks cited are the property of their respective owners.
| | |
| Delaware VIP®Trust — Delaware VIP Small Cap Value Series |
| Portfolio management review | | January 7, 2020 (Unaudited) |
The investment objective of the Series is to seek capital appreciation.
For the fiscal year ended Dec. 31, 2019, Delaware VIP Small Cap Value Series (the “Series”) Standard Class shares appreciated 28.14% and Service Class shares gained 27.72%. Both figures reflect all dividends reinvested. The Series’ benchmark, the Russell 2000® Value Index, appreciated 22.39% for the same period.
Small-cap value stocks posted positive performance during the year ended Dec. 31, 2019. During the year, growth companies outperformed value companies across the US market cap spectrum. The performance disparity between value companies and growth companies was significant insmall-cap equities throughout the year as the Russell 2000 Value Index gained 22.39%, while the Russell 2000® Growth Index rose 28.48%.
Sector-level performance within the benchmark, the Russell 2000 Value Index, was strong during the year as each sector appreciated by more than 10% except for the energy sector which declined by more than 10%. The strongest-performing sectors of the benchmark were technology, transportation, and capital spending, each of which advanced more than 30% during the year. The business services, real estate investment trusts (REITs), basic industry, and financial services sectors in the benchmark outperformed the benchmark’s 22.39% return. During the year, the traditionally defensive healthcare, consumer staples, and utilities sectors lagged. Higher-quality companies within the benchmark, those companies with higher returns on equity (ROE) and lowerprice-to-earnings (P/E) ratios, outperformed their lower-quality counterparts during the year.
The gross domestic product (GDP) growth rate slowed but remained positive during the year. The unemployment rate remained at historically low levels with a December reading of 3.5%, while wage growth was positive. The Federal Reserve reduced the federal funds rate in the second half of the year to support economic growth. The Conference Board Consumer Confidence Index® (1985=100, SA) was at historically high levels over the summer, peaking in August, and then declining month over month to settle at 126.5 for December, which was well above long-term averages.
Source: Bloomberg.
Stock selection during the year was strong across sectors with only the basic industry sector detracting on a relative basis as the Series’ holdings in the sector lagged those in the benchmark. Stock selection and relative overweight allocations to the capital spending and technology sectors contributed to outperformance during the year. Additionally, stock selection in the consumer cyclical, consumer staples, and energy sectors contributed.
Teradyne Inc., a supplier of automation equipment for test and industrial applications, contributed to the Series’ performance. The company designs systems used to test semiconductors, wireless products, and electronic systems, in addition to producing collaborativeindustrial-use robots. Teradyne’s stock price rose throughout the year and experienced a significant price increase after the company reported fiscal second-quarter earnings in July. Teradyne’s largest business segment – Semiconductor Test – reported stronger-than-expected sales that quarter, driven by 5G infrastructure, networking, and memory test. We believe Teradyne is well positioned to continue benefiting from increasing demand for its products.
MasTec Inc., a specialty engineering and construction company operating in the oil and gas, telecommunications, and power generationend-markets, also contributed to performance. MasTec reported multiple quarters of strong revenue, earnings per share (EPS), and earnings before interest, taxes, depreciation, and amortization (EBITDA) growth. The company has a healthy backlog of projects across business segments and trades at what we view as an attractive valuation.
Meritage Homes Corp., one of the largest builders of single-family homes in the United States, contributed to the Series’ performance. During the fiscal year, shares of Meritage Homes outperformed as the company reported consistently strong earnings and revenue. Meritage Homes has delivered more homes than expected and announced year-over-year order growth. During the fiscal year, we trimmed the Series’ position in Meritage Homes and purchased shares of peer homebuilderKB Home.We were attracted to KB Home, which was trading at a discounted valuation, pays a dividend, and has a strong balance sheet. Both homebuilders have a unique focus on selling to entry-level and firstmove-up, home-buyer markets, which we believe has sustainable demand.
Shares ofBerry Global Group Inc., a manufacturer of plastic consumer packaging, engineered materials, and nonwoven specialty materials, detracted from performance for the year. Its shares declined following the release of disappointing fiscal third-quarter earnings. Revenue and free-cash flow for the third quarter were lower than estimated, but management reiterated that the company would meet its full-year free-cash flow guidance and expects free-cash flow to grow next year. We maintained the Series’ position in Berry Global Group as the company achieved its 2019 free-cash flow expectations and trades at a discounted valuation.
Shares of television broadcasting and magazine company,Meredith Corp., detracted from the Series’ relative performance during the year. Meredith closed its acquisition of Time Inc. in January 2018 and anticipated that significant cost synergies from the deal would likely be realized in its 2020 fiscal year. When Meredith reported fiscal third quarter 2018 results, it set a goal to generate $1 billion of EBITDA in fiscal 2020. More than a year later, however,
Small Cap Value Series-1
| | |
| Delaware VIP®Trust — Delaware VIP Small Cap Value Series |
| Portfolio management review (continued) | | January 7, 2020 (Unaudited) |
on its fiscal 2019, fourth-quarter earnings call, Meredith said that fiscal-2020-adjusted EBITDA-guidance was now expected to range from $640 million to $675 million, acknowledging that the company was not where it expected to be at this point in time. The deterioration of the company’s fundamentals changed our investment rationale and resulted in our exiting the position prior to the end of the year.
Whiting Petroleum Corp., an independent oil and gas exploration and production (E&P) company with primary operations in the Bakken and Niobrara basins, detracted from performance. The company reported weaker-than-expected second-quarter results that missed oil production and earnings expectations. The oil production miss was a result of infrastructure constraints that were more severe than anticipated. In our view, Whiting Petroleum’s weaker financial outlook should make its ability to meet its deleveraging goals less realistic, and it is likely to force the company to take financial action that isn’t consistent with our investment discipline and, we believe, would not be in the best interest of equity shareholders. We exited Whiting Petroleum prior to the end of the year as a result of what we viewed as negative changes in its financial position.
We believe the moderate-growth, low inflation, low interest rate environment that we have experienced for several years should continue to support equity prices. Several indicators suggest to us that value-oriented companies have the potential to perform strongly in the current market environment, and we have positioned the Series to potentially benefit from this. The Series ended the year overweight the capital spending, technology, and consumer staples sectors. The Series held small underweight allocations to the consumer cyclical, transportation, financial services, and basic industry sectors. The Series remained underweight the traditionally defensive sectors, including REITs, utilities, and healthcare.
Our team’s disciplined philosophy remains unchanged. We continue to focus onbottom-up stock selection and specifically on identifying companies that trade at what we view as attractive valuations, generate strong free-cash flow, and implement shareholder-friendly policies through share buybacks, dividend increases, and debt reduction. In that regard, we are encouraged by the number of companies that continue to meet these criteria.
We appreciate your confidence and look forward to serving your investment needs in the next fiscal year.
Unless otherwise noted, views expressed herein are current as of Dec. 31, 2019, and subject to change.
Small Cap Value Series-2
Delaware VIP® Trust — Delaware VIP Small Cap Value Series
Performance summary (Unaudited)
The performance quoted represents past performance and does not guarantee future results. Investment return and principal value of an investment will fluctuate so that shares, when redeemed, may be worth more or less than their original cost. Current performance may be lower or higher than the performance quoted.
Carefully consider the Series’ investment objectives, risk factors, charges, and expenses before investing. This and other information can be found in the Series’ prospectus and its summary prospectus, which may be obtained by visiting delawarefunds.com/vip/literature or calling 800523-1918. Investors should read the prospectus and the summary prospectus carefully before investing.
| | | | | | | | | | | | | | | | | | | | | | | | | |
| Delaware VIP Small Cap Value Series | | | | | | | | | | |
| Average annual total returns | | | | | | | | | | |
| For periods ended December 31, 2019 | | 1 year | | 3 year | | 5 year | | 10 year | | Lifetime |
Standard Class shares (commenced operations on Dec. 27, 1993) | | | | +28.14% | | | | | +6.14% | | | | | +8.06% | | | | | +11.96% | | | | | +10.60% | |
| | | | | | | | | | | | | | | | | | | | | | | | | |
Service Class shares (commenced operations on May 1, 2000) | | | | +27.72% | | | | | +5.84% | | | | | +7.77% | | | | | +11.67% | | | | | +10.41% | |
| | | | | | | | | | | | | | | | | | | | | | | | | |
Russell 2000 Value Index | | | | +22.39% | | | | | +4.77% | | | | | +6.99% | | | | | +10.56% | | | | | n/a | |
Returns reflect the reinvestment of all distributions. Please see page 4 for a description of the index.
As described in the Series’ most recent prospectus, the net expense ratio for Service Class shares of the Series was 1.07%, while total operating expenses for Standard Class and Service Class shares were 0.77% and 1.07%, respectively. The management fee for Standard Class and Service Class shares was 0.71%.
The Series pays Delaware Distributors, L.P. (DDLP), the distributor and an affiliate of DMC, an annual12b-1 fee of 0.30% of the average daily net assets of the Service Class shares.
Earnings from a variable annuity or variable life investment compoundtax-free until withdrawal, and as a result, no adjustments were made for income taxes.
Expense limitations were in effect for both classes during certain periods shown in the Series performance table above and in the Performance of a $10,000 Investment graph on the next page.
Performance data do not reflect insurance fees related to a variable annuity or variable life investment or the deferred sales charge that would apply to certain withdrawals of investments held for fewer than eight years. Performance shown here would have been reduced if such fees were included and the expense limitation removed. For more information about fees, consult your variable annuity or variable life prospectus.
Investments in variable products involve risk.
Investments in small and/ormedium-sized companies typically exhibit greater risk and higher volatility than larger, more established companies.
Narrowly focused investments may exhibit higher volatility than investments in multiple industry sectors.
REIT investments are subject to many of the risks associated with direct real estate ownership, including changes in economic conditions, credit risk, and interest rate fluctuations.
Please read both the contract and underlying prospectus for specific details regarding the product’s risk profile.
Small Cap Value Series-3
| | |
| Delaware VIP®Small Cap Value Series |
| Performance summary (Unaudited) (continued) | | |
| | | | |
For period beginning Dec. 31, 2009 through Dec. 31, 2019 | | Starting value | | Ending value |
–– Delaware VIP Small Cap Value Series (Standard Class) | | $10,000 | | $30,960 |
– –Russell 2000 Value Index | | $10,000 | | $27,299 |
The graph shows a $10,000 investment in the Delaware VIP Small Cap Value Series Standard Class shares for the period from Dec. 31, 2009 through Dec. 31, 2019.
The graph also shows $10,000 invested in the Russell 2000 Value Index for the period from Dec. 31, 2009 through Dec. 31, 2019. The Russell 2000 Value Index measures the performance of thesmall-cap value segment of the US equity universe. It includes those Russell 2000 companies with lowerprice-to-book ratios and lower forecasted growth values.
The Russell 2000 Growth Index, mentioned on page 1, measures the performance of thesmall-cap growth segment of the US equity universe. It includes those Russell 2000 companies with higherprice-to-book ratios and higher forecasted growth values.
The Conference Board Consumer Confidence Index, mentioned on page 1, is a barometer of the health of the US economy from the perspective of the consumer. The index is based on consumers’ perceptions of current business and employment conditions, as well as their expectations for six months hence regarding business conditions, employment, and income. The resulting relative value is then used as an “index value” and compared against each respective monthly value for 1985. In that year, the result of the index was arbitrarily set at 100, representing it as the index benchmark.
Frank Russell Company is the source and owner of the trademarks, service marks, and copyrights related to the Russell Indexes. Russell® is a trademark of Frank Russell Company.
Index performance returns do not reflect any management fees, transaction costs or expenses. Indices are unmanaged and one cannot invest directly in an index.
Performance of Service Class shares will vary due to different charges and expenses.
Past performance is not a guarantee of future results.
Small Cap Value Series-4
Delaware VIP® Trust — Delaware VIP Small Cap Value Series
Disclosure of Series expenses
For thesix-month period from July 1, 2019 to December 31, 2019 (Unaudited)
As a shareholder of the Series, you incur ongoing costs, which may include management fees; distribution and service(12b-1) fees; and other Series expenses. This example is intended to help you understand your ongoing costs (in dollars) of investing in the Series and to compare these costs with the ongoing costs of investing in other mutual funds.
The example is based on an investment of $1,000 invested at the beginning of the period and held for the entiresix-month period from July 1, 2019 to Dec. 31, 2019.
Actual expenses
The first section of the table shown, “Actual Series Return,” provides information about actual account values and actual expenses. You may use the information in this section of the table, together with the amount you invested, to estimate the expenses that you paid over the period. Simply divide your account value by $1,000 (for example, an $8,600 account value divided by $1,000 = 8.6), then multiply the result by the number in the first section under the heading entitled “Expenses Paid During Period” to estimate the expenses you paid on your account during the period.
Hypothetical example for comparison purposes
The second section of the table shown, “Hypothetical 5% Return,” provides information about hypothetical account values and hypothetical expenses based on the Series’ actual expense ratio and an assumed rate of return of 5% per year before expenses, which is not the Series’ actual return. The hypothetical account values and expenses may not be used to estimate the actual ending account balance or expenses you paid for the period. You may use this information to compare the ongoing costs of investing in the Series and other funds. To do so, compare the 5% hypothetical example with the 5% hypothetical examples that appear in the shareholder reports of other funds.
Please note that the expenses shown in the table are meant to highlight your ongoing costs only. As a shareholder of the Series, you do not incur any transaction costs, such as sales charges (loads), redemption fees or exchange fees, but shareholders of other funds may incur such costs. Also, the fees related to the variable annuity investment or the deferred sales charge that could apply have not been included. Therefore, the second section of the table is useful in comparing ongoing costs only, and will not help you determine the relative total costs of owning different funds. The Series’ expenses shown in the table assume reinvestment of all dividends and distributions.
Expense analysis of an investment of $1,000
| | | | | | | | | | | | | | |
| | | Beginning
Account
Value
7/1/19 | | | Ending
Account
Value
12/31/19 | | | Annualized
Expense
Ratio | | | Expenses
Paid During
Period
7/1/19 to
12/31/19* |
| | | | |
Actual Series return† | | | | | | | | | | | | | | |
Standard Class | | $ | 1,000.00 | | | $ | 1,093.00 | | | | 0.77% | | | $4.06 |
Service Class | | | 1,000.00 | | | | 1,091.20 | | | | 1.07% | | | 5.64 |
|
Hypothetical 5% return(5% return before expenses) |
Standard Class | | $ | 1,000.00 | | | $ | 1,021.32 | | | | 0.77% | | | $3.92 |
Service Class | | | 1,000.00 | | | | 1,019.81 | | | | 1.07% | | | 5.45 |
*“Expenses Paid During Period” are equal to the Series’ annualized expense ratio, multiplied by the average account value over the period, multiplied by 184/365 (to reflect theone-half year period).
| † | Because actual returns reflect only the most recentsix-month period, the returns shown may differ significantly from fiscal year returns. |
In addition to the Series’ expenses reflected above, the Series also indirectly bears its portion of the fees and expenses of the investment companies in which it invests (Underlying Funds), including business development corporations and exchange-traded funds. The table above does not reflect the expenses of the Underlying Funds.
Small Cap Value Series-5
Delaware VIP® Trust — Delaware VIP Small Cap Value Series
Security type / sector allocation and top 10 equity holdings
As of December 31, 2019 (Unaudited)
Sector designations may be different than the sector designations presented in other Series materials. The sector designations may represent the investment manager’s internal sector classifications.
| | | | | |
| | | Percentage of |
| Security type / sector | | net assets |
Common Stock² | | | | 97.04 | % |
Basic Industry | | | | 5.10 | % |
Business Services | | | | 0.93 | % |
Capital Spending | | | | 9.29 | % |
Consumer Cyclical | | | | 3.74 | % |
Consumer Services | | | | 8.79 | % |
Consumer Staples | | | | 3.51 | % |
Energy | | | | 5.46 | % |
Financial Services1 | | | | 28.74 | % |
Healthcare | | | | 2.41 | % |
Real Estate | | | | 8.87 | % |
Technology | | | | 12.65 | % |
Transportation | | | | 2.51 | % |
Utilities | | | | 5.04 | % |
Short-Term Investments | | | | 3.26 | % |
| |
Total Value of Securities | | | | 100.30 | % |
| |
Liabilities Net of Receivables and Other Assets | | | | (0.30 | %) |
| |
Total Net Assets | | | | 100.00 | % |
| ² | Narrow industries are utilized for compliance purposes for diversification whereas broad sectors are used for financial reporting. |
| 1 | To monitor compliance with the Series’ concentration guidelines as described in the Series’ prospectus and Statement of Additional Information, the Financial Services sector (as disclosed herein for financial reporting purposes) is subdivided into a variety of “industries” (in accordance with the requirements of the Investment Company Act of 1940, as amended). The Financial Services sector consisted of Banks, Diversified Financial Services, Insurance, and Investment companies. As of Dec. 31, 2019, such amounts, as percentage of total net assets, were 21.13%, 2.37%, 4.88%, and 0.37%, respectively. The percentage in any such single industry will comply with the Series’ concentration policy even if the percentages in the Financial Services sector for financial reporting purposes may exceed 25%. |
Holdings are for informational purposes only and are subject to change at any time. They are not a recommendation to buy, sell, or hold any security.
| | | | | |
| Top 10 equity holdings | | Percentage
of net assets |
MasTec | | | | 2.67 | % |
East West Bancorp | | | | 2.56 | % |
ITT | | | | 2.26 | % |
Hancock Whitney | | | | 1.96 | % |
Webster Financial | | | | 1.77 | % |
Teradyne | | | | 1.71 | % |
Stifel Financial | | | | 1.66 | % |
FNB | | | | 1.61 | % |
Outfront Media | | | | 1.47 | % |
Hanover Insurance Group | | | | 1.47 | % |
Small Cap Value Series-6
Delaware VIP® Trust — Delaware VIP Small Cap Value Series
Schedule of investments
December 31, 2019
| | | | | | | | |
| | | Number of | | | Value | |
| | | shares | | | (US $) | |
| |
Common Stock – 97.04%² | | | | | |
Basic Industry – 5.10% | | | | | |
Berry Global Group † | | | 382,500 | | | $ | 18,164,925 | |
Ferro † | | | 491,700 | | | | 7,291,911 | |
HB Fuller | | | 282,500 | | | | 14,568,525 | |
Louisiana-Pacific | | | 523,900 | | | | 15,544,113 | |
Olin | | | 665,900 | | | | 11,486,775 | |
| | | | | |
| | | | 67,056,249 | |
| | | | | |
Business Services – 0.93% | | | | | |
Deluxe | | | 123,400 | | | | 6,160,128 | |
WESCO International † | | | 101,900 | | | | 6,051,841 | |
| | | | | |
| | | | 12,211,969 | |
| | | | | |
Capital Spending – 9.29% | | | | | |
Altra Industrial Motion | | | 422,170 | | | | 15,286,776 | |
Atkore International Group † | | | 302,000 | | | | 12,218,920 | |
H&E Equipment Services | | | 326,500 | | | | 10,914,895 | |
ITT | | | 402,800 | | | | 29,770,948 | |
MasTec † | | | 548,046 | | | | 35,162,632 | |
Primoris Services | | | 398,500 | | | | 8,862,640 | |
Rexnord † | | | 303,400 | | | | 9,896,908 | |
| | | | | |
| | | | 122,113,719 | |
| | | | | |
Consumer Cyclical – 3.74% | | | | | |
Barnes Group | | | 213,300 | | | | 13,216,068 | |
KB Home | | | 312,500 | | | | 10,709,375 | |
Knoll | | | 397,793 | | | | 10,048,251 | |
Meritage Homes † | | | 181,600 | | | | 11,097,576 | |
Standard Motor Products | | | 76,101 | | | | 4,050,095 | |
| | | | | |
| | | | 49,121,365 | |
| | | | | |
Consumer Services – 8.79% | | | | | |
Asbury Automotive Group † | | | 87,900 | | | | 9,826,341 | |
Cable One | | | 8,500 | | | | 12,651,995 | |
Caleres | | | 312,000 | | | | 7,410,000 | |
Cheesecake Factory | | | 198,500 | | | | 7,713,710 | |
Choice Hotels International | | | 157,200 | | | | 16,259,196 | |
Cinemark Holdings | | | 304,213 | | | | 10,297,610 | |
Cracker Barrel Old Country Store | | | 56,500 | | | | 8,686,310 | |
Steven Madden | | | 201,850 | | | | 8,681,569 | |
Texas Roadhouse | | | 150,300 | | | | 8,464,896 | |
UniFirst | | | 77,700 | | | | 15,693,846 | |
Wolverine World Wide | | | 292,500 | | | | 9,868,950 | |
| | | | | |
| | | | 115,554,423 | |
| | | | | |
Consumer Staples – 3.51% | | | | | |
Core-Mark Holding | | | 214,269 | | | | 5,825,974 | |
J&J Snack Foods | | | 62,800 | | | | 11,572,156 | |
Performance Food Group † | | | 220,795 | | | | 11,366,526 | |
ScottsMiracle-Gro | | | 95,100 | | | | 10,097,718 | |
Spectrum Brands Holdings | | | 113,600 | | | | 7,303,344 | |
| | | | | |
| | | | 46,165,718 | |
| | | | | |
Energy – 5.46% | | | | | |
Callon Petroleum † | | | 1,294,500 | | | | 6,252,435 | |
Delek US Holdings | | | 346,400 | | | | 11,614,792 | |
Dril-Quip † | | | 145,700 | | | | 6,834,787 | |
Helix Energy Solutions Group † | | | 927,700 | | | | 8,933,751 | |
Oasis Petroleum † | | | 976,400 | | | | 3,183,064 | |
| | | | | | | | |
| | | Number of | | | Value | |
| | | shares | | | (US $) | |
| |
Common Stock²(continued) | | | | | |
Energy (continued) | | | | | |
Patterson-UTI Energy | | | 919,400 | | | $ | 9,653,700 | |
SM Energy | | | 661,100 | | | | 7,430,764 | |
Valaris | | | 491,918 | | | | 3,226,982 | |
WPX Energy † | | | 1,066,800 | | | | 14,657,832 | |
| | | | | |
| | | | 71,788,107 | |
| | | | | |
Financial Services – 28.74% | | | | | |
American Equity Investment Life Holding | | | 575,900 | | | | 17,236,687 | |
Bank of NT Butterfield & Son | | | 205,300 | | | | 7,600,206 | |
Community Bank System | | | 43,800 | | | | 3,107,172 | |
East West Bancorp | | | 690,636 | | | | 33,633,974 | |
First Financial Bancorp | | | 578,900 | | | | 14,727,216 | |
First Hawaiian | | | 446,600 | | | | 12,884,410 | |
First Interstate BancSystem Class A | | | 249,000 | | | | 10,438,080 | |
First Midwest Bancorp | | | 661,900 | | | | 15,263,414 | |
FNB | | | 1,668,400 | | | | 21,188,680 | |
Great Western Bancorp | | | 486,800 | | | | 16,911,432 | |
Hancock Whitney | | | 587,700 | | | | 25,788,276 | |
Hanover Insurance Group | | | 141,600 | | | | 19,352,472 | |
Kemper | | | 128,700 | | | | 9,974,250 | |
Legg Mason | | | 261,500 | | | | 9,390,465 | |
Main Street Capital (BDC) | | | 111,800 | | | | 4,819,698 | |
NBT Bancorp | | | 268,300 | | | | 10,882,248 | |
Prosperity Bancshares | | | 157,500 | | | | 11,322,675 | |
S&T Bancorp | | | 203,942 | | | | 8,216,823 | |
Selective Insurance Group | | | 269,290 | | | | 17,555,015 | |
Stifel Financial | | | 359,000 | | | | 21,773,350 | |
Umpqua Holdings | | | 1,027,000 | | | | 18,177,900 | |
Valley National Bancorp | | | 1,315,900 | | | | 15,067,055 | |
Webster Financial | | | 435,400 | | | | 23,232,944 | |
WesBanco | | | 273,300 | | | | 10,328,007 | |
Western Alliance Bancorp | | | 333,800 | | | | 19,026,600 | |
| | | | | |
| | | | 377,899,049 | |
| | | | | |
Healthcare – 2.41% | | | | | |
Avanos Medical † | | | 250,900 | | | | 8,455,330 | |
Catalent † | | | 169,500 | | | | 9,542,850 | |
Service Corp. International | | | 208,800 | | | | 9,611,064 | |
STERIS | | | 26,998 | | | | 4,115,035 | |
| | | | | |
| | | | 31,724,279 | |
| | | | | |
Real Estate – 8.87% | | | | | |
Brandywine Realty Trust | | | 981,833 | | | | 15,463,870 | |
Highwoods Properties | | | 286,200 | | | | 13,998,042 | |
Kite Realty Group Trust | | | 107,400 | | | | 2,097,522 | |
Lexington Realty Trust | | | 1,116,800 | | | | 11,860,416 | |
Life Storage | | | 115,600 | | | | 12,517,168 | |
Outfront Media | | | 721,700 | | | | 19,355,994 | |
RPT Realty | | | 628,700 | | | | 9,455,648 | |
Spirit Realty Capital | | | 269,500 | | | | 13,254,010 | |
Summit Hotel Properties | | | 725,600 | | | | 8,953,904 | |
Washington Real Estate Investment Trust | | | 330,300 | | | | 9,638,154 | |
| | | | | |
| | | | 116,594,728 | |
| | | | | |
Small Cap Value Series-7
Delaware VIP® Small Cap Value Series
Schedule of investments (continued)
| | | | | | | | |
| | | Number of | | | Value | |
| | | shares | | | (US $) | |
| |
Common Stock²(continued) | | | | | |
Technology – 12.65% | | | | | |
Cirrus Logic † | | | 159,900 | | | $ | 13,177,359 | |
Coherent † | | | 56,300 | | | | 9,365,505 | |
CommScope Holding † | | | 335,845 | | | | 4,765,640 | |
Flex † | | | 1,022,900 | | | | 12,908,998 | |
MaxLinear † | | | 257,900 | | | | 5,472,638 | |
NCR † | | | 399,399 | | | | 14,042,869 | |
NetScout Systems † | | | 283,463 | | | | 6,822,954 | |
ON Semiconductor † | | | 670,800 | | | | 16,354,104 | |
Tech Data † | | | 91,929 | | | | 13,201,004 | |
Teradyne | | | 329,900 | | | | 22,495,881 | |
Tower Semiconductor † | | | 509,100 | | | | 12,248,946 | |
TTM Technologies † | | | 728,012 | | | | 10,956,581 | |
Viavi Solutions † | | | 569,800 | | | | 8,547,000 | |
Vishay Intertechnology | | | 751,900 | | | | 16,007,951 | |
| | | | | | | | |
| | | | | | | 166,367,430 | |
| | | | | | | | |
Transportation – 2.51% | | | | | |
Kirby † | | | 77,100 | | | | 6,902,763 | |
Saia † | | | 89,850 | | | | 8,366,832 | |
SkyWest | | | 94,949 | | | | 6,136,554 | |
Werner Enterprises | | | 318,100 | | | | 11,575,659 | |
| | | | | | | | |
| | | | | | | 32,981,808 | |
| | | | | | | | |
| | | | | | | | |
| | | Number of | | | Value | |
| | | shares | | | (US $) | |
| |
Common Stock²(continued) | | | | | |
Utilities – 5.04% | | | | | |
ALLETE | | | 133,800 | | | $ | 10,860,546 | |
Black Hills | | | 220,600 | | | | 17,325,924 | |
El Paso Electric | | | 198,100 | | | | 13,449,009 | |
South Jersey Industries | | | 293,300 | | | | 9,673,034 | |
Southwest Gas Holdings | | | 197,100 | | | | 14,973,687 | |
| | | | | | | | |
| | | | | | | 66,282,200 | |
| | | | | | | | |
Total Common Stock
(cost $918,046,855) | | | | | | | 1,275,861,044 | |
| | | | | | | | |
| |
Short-Term Investments – 3.26% | | | | | |
Money Market Mutual Funds – 3.26% | | | | | |
BlackRock FedFund – Institutional Shares(seven-day effective yield 1.52%) | | | 8,566,126 | | | | 8,566,126 | |
Fidelity Investments Money Market Government Portfolio – Class I(seven-day effective yield 1.49%) | | | 8,566,125 | | | | 8,566,125 | |
GS Financial Square Government Fund – Institutional Shares(seven-day effective yield 1.51%) | | | 8,566,125 | | | | 8,566,125 | |
Morgan Stanley Government Portfolio – Institutional Share Class(seven-day effective yield 1.48%) | | | 8,566,126 | | | | 8,566,126 | |
State Street Institutional US Government Money Market Fund – Investor Class(seven-day effective yield 1.45%) | | | 8,566,126 | | | | 8,566,126 | |
| | | | | | | | |
Total Short-Term Investments
(cost $42,830,628) | | | | 42,830,628 | |
| | | | | | | | |
| | | | |
Total Value of Securities – 100.30%
(cost $960,877,483) | | $ | 1,318,691,672 | |
| | | | |
| ² | Narrow industries are utilized for compliance purposes for diversification whereas broad sectors are used for financial reporting. |
| † | Non-income producing security. |
Summary of abbreviations:
BDC – Business Development Corporation
GS – Goldman Sachs
See accompanying notes, which are an integral part of the financial statements.
Small Cap Value Series-8
| | | | |
Delaware VIP®Trust — Delaware VIP Small Cap Value Series | | | | |
Statement of assets and liabilities | | | December 31, 2019 | |
| | | | |
Assets: | | | | |
Investments, at value1 | | $ | 1,318,691,672 | |
Cash | | | 72,680 | |
Dividends and interest receivable | | | 1,578,065 | |
Receivable for securities sold | | | 684,275 | |
Receivable for series shares sold | | | 211,366 | |
| | | | |
Total assets | | | 1,321,238,058 | |
| | | | |
Liabilities: | | | | |
Payable for securities purchased | | | 4,288,058 | |
Payable for series shares redeemed | | | 1,072,722 | |
Investment management fees payable to affiliates | | | 778,354 | |
Distribution fees payable to affiliates | | | 220,544 | |
Other accrued expenses | | | 110,808 | |
Trustees’ fees and expenses payable to affiliates | | | 12,411 | |
Dividend disbursing and transfer agent fees and expenses payable to affiliates | | | 8,246 | |
Accounting and administration expenses payable to affiliates | | | 3,988 | |
Legal fees payable to affiliates | | | 1,977 | |
Reports and statements to shareholders expenses payable to affiliates | | | 630 | |
| | | | |
Total liabilities | | | 6,497,738 | |
| | | | |
Total Net Assets | | $ | 1,314,740,320 | |
| | | | |
| |
Net Assets Consist of: | | | | |
Paid-in capital | | $ | 880,501,459 | |
Total distributable earnings (loss) | | | 434,238,861 | |
| | | | |
Total Net Assets | | $ | 1,314,740,320 | |
| | | | |
| |
Net Asset Value: | | | | |
Standard Class: | | | | |
Net assets | | $ | 435,375,204 | |
Shares of beneficial interest outstanding, unlimited authorization, no par | | | 11,367,908 | |
Net asset value per share | | $ | 38.30 | |
| |
Service Class: | | | | |
Net assets | | $ | 879,365,116 | |
Shares of beneficial interest outstanding, unlimited authorization, no par | | | 23,102,990 | |
Net asset value per share | | $ | 38.06 | |
| |
1Investments, at cost | | $ | 960,877,483 | |
See accompanying notes, which are an integral part of the financial statements.
Small Cap Value Series-9
Delaware VIP® Trust —
Delaware VIP Small Cap Value Series Statement of operations
Year ended December 31, 2019
| | | | |
Investment Income: | | | | |
Dividends | | $ | 23,977,427 | |
Interest | | | 174,392 | |
| | | | |
| | | 24,151,819 | |
| | | | |
Expenses: | | | | |
Management fees | | | 8,628,801 | |
Distribution expenses – Service Class | | | 2,423,540 | |
Accounting and administration expenses | | | 248,809 | |
Reports and statements to shareholders expenses | | | 106,882 | |
Dividends disbursing and transfer agent fees and expenses | | | 101,235 | |
Trustees’ fees and expenses | | | 71,504 | |
Legal fees | | | 58,301 | |
Custodian fees | | | 37,234 | |
Audit and tax fees | | | 32,402 | |
Registration fees | | | 150 | |
Other | | | 33,542 | |
| | | | |
| | | 11,742,400 | |
Less expenses paid indirectly | | | (2,415 | ) |
| | | | |
Total operating expenses | | | 11,739,985 | |
| | | | |
Net Investment Income | | | 12,411,834 | |
| | | | |
| |
Net Realized and Unrealized Gain: | | | | |
Net realized gain on investments | | | 64,457,799 | |
Net change in unrealized appreciation (depreciation) of investments | | | 215,042,792 | |
| | | | |
Net Realized and Unrealized Gain | | | 279,500,591 | |
| | | | |
Net Increase in Net Assets Resulting from Operations | | $ | 291,912,425 | |
| | | | |
Delaware VIP Trust —
Delaware VIP Small Cap Value Series Statements of changes in net assets
| | | | | | | | |
| | | Year ended | |
| | | 12/31/19 | | | 12/31/18 | |
Increase (Decrease) in Net Assets from Operations: | | | | | | | | |
Net investment income | | $ | 12,411,834 | | | $ | 10,450,426 | |
Net realized gain | | | 64,457,799 | | | | 95,626,959 | |
Net change in unrealized appreciation (depreciation) | | | 215,042,792 | | | | (318,139,961 | ) |
| | | | | | | | |
Net increase (decrease) in net assets resulting from operations | | | 291,912,425 | | | | (212,062,576 | ) |
| | | | | | | | |
Dividends and Distributions to Shareholders from: | | | | | | | | |
Distributable earnings: | | | | | | | | |
Standard Class | | | (35,845,943 | ) | | | (33,424,300 | ) |
Service Class | | | (70,100,727 | ) | | | (64,378,292 | ) |
| | | | | | | | |
| | | (105,946,670 | ) | | | (97,802,592 | ) |
| | | | | | | | |
| | |
Capital Share Transactions: | | | | | | | | |
Proceeds from shares sold: | | | | | | | | |
Standard Class | | | 37,861,588 | | | | 48,204,956 | |
Service Class | | | 77,024,433 | | | | 79,818,470 | |
Net asset value of shares issued upon reinvestment of dividends and distributions: | | | | | | | | |
Standard Class | | | 35,845,943 | | | | 33,424,300 | |
Service Class | | | 70,100,726 | | | | 64,378,292 | |
| | | | | | | | |
| | | 220,832,690 | | | | 225,826,018 | |
| | | | | | | | |
Cost of shares redeemed: | | | | | | | | |
Standard Class | | | (57,886,800 | ) | | | (59,827,644 | ) |
Service Class | | | (92,313,646 | ) | | | (90,648,481 | ) |
| | | | | | | | |
| | | (150,200,446 | ) | | | (150,476,125 | ) |
| | | | | | | | |
Increase in net assets derived from capital share transactions | | | 70,632,244 | | | | 75,349,893 | |
| | | | | | | | |
Net Increase (Decrease) in Net Assets | | | 256,597,999 | | | | (234,515,275 | ) |
| | | | | | | | |
Net Assets: | | | | | | | | |
Beginning of year | | | 1,058,142,321 | | | | 1,292,657,596 | |
| | | | | | | | |
| | |
End of year | | $ | 1,314,740,320 | | | $ | 1,058,142,321 | |
| | | | | | | | |
See accompanying notes, which are an integral part of the financial statements.
Small Cap Value Series-10
Delaware VIP® Trust — Delaware VIP Small Cap Value Series
Financial highlights
Selected data for each share of the Series outstanding throughout each period were as follows:
| | | | | | | | | | | | | | | | | | | | | | | | | | | | | | | | | | | | | | | | | | | | | | | | | | | | | | | |
| | | Delaware VIP Small Cap Value Series Standard Class
Year ended |
| | | | | 12/31/19 | | | | 12/31/18 | | | | 12/31/17 | | | | 12/31/16 | | | | 12/31/15 | | |
| | | | | |
Net asset value, beginning of period | | | | | | | | $ | 32.76 | | | | | | | | | $ | 42.73 | | | | | | | | | $ | 39.84 | | | | | | | | | $ | 33.72 | | | | | | | | | $ | 40.23 | | | | | | |
| | | | | | | | | | | |
Income (loss) from investment operations: | | | | | | | | | | | | | | | | | | | | | | | | | | | | | | | | | | | | | | | | | | | | | | | | | | | | | | | |
Net investment income1 | | | | | | | | | 0.44 | | | | | | | | | | 0.41 | | | | | | | | | | 0.34 | | | | | | | | | | 0.36 | | | | | | | | | | 0.33 | | | | | | |
Net realized and unrealized gain (loss) | | | | | | | | | 8.48 | | | | | | | | | | (7.03 | ) | | | | | | | | | 4.30 | | | | | | | | | | 9.37 | | | | | | | | | | (2.43 | ) | | | | | |
| | | | | | | | | | | | | | | | | | | | | | | | | | | | | | | | | | | | | | | | | | | | | | | | | | | | | | | |
Total from investment operations | | | | | | | | | 8.92 | | | | | | | | | | (6.62 | ) | | | | | | | | | 4.64 | | | | | | | | | | 9.73 | | | | | | | | | | (2.10 | ) | | | | | |
| | | | | | | | | | | | | | | | | | | | | | | | | | | | | | | | | | | | | | | | | | | | | | | | | | | | | | | |
| | | | | | | | | | | |
Less dividends and distributions from: | | | | | | | | | | | | | | | | | | | | | | | | | | | | | | | | | | | | | | | | | | | | | | | | | | | | | | | |
Net investment income | | | | | | | | | (0.40 | ) | | | | | | | | | (0.35 | ) | | | | | | | | | (0.35 | ) | | | | | | | | | (0.35 | ) | | | | | | | | | (0.28 | ) | | | | | |
Net realized gain | | | | | | | | | (2.98 | ) | | | | | | | | | (3.00 | ) | | | | | | | | | (1.40 | ) | | | | | | | | | (3.26 | ) | | | | | | | | | (4.13 | ) | | | | | |
| | | | | | | | | | | | | | | | | | | | | | | | | | | | | | | | | | | | | | | | | | | | | | | | | | | | | | | |
Total dividends and distributions | | | | | | | | | (3.38 | ) | | | | | | | | | (3.35 | ) | | | | | | | | | (1.75 | ) | | | | | | | | | (3.61 | ) | | | | | | | | | (4.41 | ) | | | | | |
| | | | | | | | | | | | | | | | | | | | | | | | | | | | | | | | | | | | | | | | | | | | | | | | | | | | | | | |
| | | | | | | | | | | |
Net asset value, end of period | | | | | | | | $ | 38.30 | | | | | | | | | $ | 32.76 | | | | | | | | | $ | 42.73 | | | | | | | | | $ | 39.84 | | | | | | | | | $ | 33.72 | | | | | | |
| | | | | | | | | | | | | | | | | | | | | | | | | | | | | | | | | | | | | | | | | | | | | | | | | | | | | | | |
| | | | | | | | | | | |
Total return2 | | | | | | | | | 28.14% | | | | | | | | | | (16.72% | ) | | | | | | | | | 12.05% | | | | | | | | | | 31.41% | | | | | | | | | | (6.22% | ) | | | | | |
| | | | | | | | | | | |
Ratios and supplemental data: | | | | | | | | | | | | | | | | | | | | | | | | | | | | | | | | | | | | | | | | | | | | | | | | | | | | | | | |
Net assets, end of period (000 omitted) | | | | | | | | $ | 435,375 | | | | | | | | | $ | 357,318 | | | | | | | | | $ | 439,612 | | | | | | | | | $ | 429,275 | | | | | | | | | $ | 343,847 | | | | | | |
Ratio of expenses to average net assets3 | | | | | | | | | 0.77% | | | | | | | | | | 0.77% | | | | | | | | | | 0.78% | | | | | | | | | | 0.79% | | | | | | | | | | 0.80% | | | | | | |
Ratio of net investment income to average net assets | | | | | | | | | 1.22% | | | | | | | | | | 1.03% | | | | | | | | | | 0.85% | | | | | | | | | | 1.05% | | | | | | | | | | 0.90% | | | | | | |
Portfolio turnover | | | | | | | | | 17% | | | | | | | | | | 18% | | | | | | | | | | 14% | | | | | | | | | | 11% | | | | | | | | | | 18% | | | | | | |
| 1 | The average shares outstanding method has been applied for per share information. |
| 2 | Total return is based on the change in net asset value of a share during the period and assumes reinvestment of dividends and distributions at net asset value. Total return does not include fees, charges, or expenses imposed by the variable annuity and life insurance contracts for which Delaware VIP Trust serves as an underlying investment vehicle. |
| 3 | Expense ratios do not include expenses of the Underlying Funds in which the Series invests. |
See accompanying notes, which are an integral part of the financial statements.
Small Cap Value Series-11
Delaware VIP® Small Cap Value Series
Financial highlights (continued)
Selected data for each share of the Series outstanding throughout each period were as follows:
| | | | | | | | | | | | | | | | | | | | | | | | | | | | | | | | | | | | | | | | | | | | | | | | | | | | | | | |
| | | Delaware VIP Small Cap Value Series Service Class
Year ended |
| | | | | 12/31/19 | | | | 12/31/18 | | | | 12/31/17 | | | | 12/31/16 | | | | 12/31/15 | | |
| | | | | |
Net asset value, beginning of period | | | | | | | | $ | 32.58 | | | | | | | | | $ | 42.52 | | | | | | | | | $ | 39.67 | | | | | | | | | $ | 33.58 | | | | | | | | | $ | 40.08 | | | | | | |
| | | | | | | | | | | |
Income (loss) from investment operations: | | | | | | | | | | | | | | | | | | | | | | | | | | | | | | | | | | | | | | | | | | | | | | | | | | | | | | | |
Net investment income1 | | | | | | | | | 0.33 | | | | | | | | | | 0.29 | | | | | | | | | | 0.24 | | | | | | | | | | 0.27 | | | | | | | | | | 0.24 | | | | | | |
Net realized and unrealized gain (loss) | | | | | | | | | 8.42 | | | | | | | | | | (6.98 | ) | | | | | | | | | 4.27 | | | | | | | | | | 9.34 | | | | | | | | | | (2.43 | ) | | | | | |
| | | | | | | | | | | | | | | | | | | | | | | | | | | | | | | | | | | | | | | | | | | | | | | | | | | | | | | |
Total from investment operations | | | | | | | | | 8.75 | | | | | | | | | | (6.69 | ) | | | | | | | | | 4.51 | | | | | | | | | | 9.61 | | | | | | | | | | (2.19 | ) | | | | | |
| | | | | | | | | | | | | | | | | | | | | | | | | | | | | | | | | | | | | | | | | | | | | | | | | | | | | | | |
| | | | | | | | | | | |
Less dividends and distributions from: | | | | | | | | | | | | | | | | | | | | | | | | | | | | | | | | | | | | | | | | | | | | | | | | | | | | | | | |
Net investment income | | | | | | | | | (0.29 | ) | | | | | | | | | (0.25 | ) | | | | | | | | | (0.26 | ) | | | | | | | | | (0.26 | ) | | | | | | | | | (0.18 | ) | | | | | |
Net realized gain | | | | | | | | | (2.98 | ) | | | | | | | | | (3.00 | ) | | | | | | | | | (1.40 | ) | | | | | | | | | (3.26 | ) | | | | | | | | | (4.13 | ) | | | | | |
| | | | | | | | | | | | | | | | | | | | | | | | | | | | | | | | | | | | | | | | | | | | | | | | | | | | | | | |
Total dividends and distributions | | | | | | | | | (3.27 | ) | | | | | | | | | (3.25 | ) | | | | | | | | | (1.66 | ) | | | | | | | | | (3.52 | ) | | | | | | | | | (4.31 | ) | | | | | |
| | | | | | | | | | | | | | | | | | | | | | | | | | | | | | | | | | | | | | | | | | | | | | | | | | | | | | | |
| | | | | | | | | | | |
Net asset value, end of period | | | | | | | | $ | 38.06 | | | | | | | | | $ | 32.58 | | | | | | | | | $ | 42.52 | | | | | | | | | $ | 39.67 | | | | | | | | | $ | 33.58 | | | | | | |
| | | | | | | | | | | | | | | | | | | | | | | | | | | | | | | | | | | | | | | | | | | | | | | | | | | | | | | |
| | | | | | | | | | | |
Total return2 | | | | | | | | | 27.72% | | | | | | | | | | (16.95% | )3 | | | | | | | | | 11.76% | 3 | | | | | | | | | 31.09% | 3 | | | | | | | | | (6.46% | )3 | | | | | |
| | | | | | | | | | | |
Ratios and supplemental data: | | | | | | | | | | | | | | | | | | | | | | | | | | | | | | | | | | | | | | | | | | | | | | | | | | | | | | | |
Net assets, end of period (000 omitted) | | | | | | | | $ | 879,365 | | | | | | | | | $ | 700,824 | | | | | | | | | $ | 853,046 | | | | | | | �� | | $ | 794,681 | | | | | | | | | $ | 621,022 | | | | | | |
Ratio of expenses to average net assets4 | | | | | | | | | 1.07% | | | | | | | | | | 1.05% | | | | | | | | | | 1.03% | | | | | | | | | | 1.04% | | | | | | | | | | 1.05% | | | | | | |
Ratio of expenses to average net assets prior to fees waived4 | | | | | | | | | 1.07% | | | | | | | | | | 1.07% | | | | | | | | | | 1.08% | | | | | | | | | | 1.09% | | | | | | | | | | 1.10% | | | | | | |
Ratio of net investment income to average net assets | | | | | | | | | 0.92% | | | | | | | | | | 0.74% | | | | | | | | | | 0.60% | | | | | | | | | | 0.80% | | | | | | | | | | 0.65% | | | | | | |
Ratio of net investment income to average net assets prior to fees waived | | | | | | | | | 0.92% | | | | | | | | | | 0.72% | | | | | | | | | | 0.55% | | | | | | | | | | 0.75% | | | | | | | | | | 0.60% | | | | | | |
Portfolio turnover | | | | | | | | | 17% | | | | | | | | | | 18% | | | | | | | | | | 14% | | | | | | | | | | 11% | | | | | | | | | | 18% | | | | | | |
| 1 | The average shares outstanding method has been applied for per share information. |
| 2 | Total return is based on the change in net asset value of a share during the period and assumes reinvestment of dividends and distributions at net asset value. Total return does not include fees, charges, or expenses imposed by the variable annuity and life insurance contracts for which Delaware VIP Trust serves as an underlying investment vehicle. |
| 3 | Total return during the period reflects a waiver by the manager and/or distributor. Performance would have been lower had the waiver not been in effect. |
| 4 | Expense ratios do not include expenses of the Underlying Funds in which the Series invests. |
See accompanying notes, which are an integral part of the financial statements.
Small Cap Value Series-12
Delaware VIP® Trust — Delaware VIP Small Cap Value Series
Notes to financial statements
December 31, 2019
Delaware VIP Trust (Trust) is organized as a Delaware statutory trust and offers 22 series, each of which is treated as a separate entity for certain matters under the Investment Company Act of 1940, as amended (1940 Act). These financial statements and the related notes pertain to Delaware VIP Small Cap Value Series (Series). The Trust is anopen-end investment company. The Series is considered diversified under the 1940 Act and offers Standard Class and Service Class shares. The Standard Class shares do not carry a distribution and service(12b-1) fee and the Service Class shares carry a12b-1 fee. The shares of the Series are sold only to separate accounts of life insurance companies.
1. Significant Accounting Policies
The Fund follows accounting and reporting guidance under Financial Accounting Standards Board (FASB) Accounting Standards Codification Topic 946, Financial Services - Investment Companies. The following accounting policies are in accordance with US generally accepted accounting principles (US GAAP) and are consistently followed by the Series.
Security Valuation — Equity securities, except those traded on the Nasdaq Stock Market LLC (Nasdaq) are valued at the last quoted sales price as of the time of the regular close of the New York Stock Exchange on the valuation date. Equity securities traded on the Nasdaq are valued in accordance with the Nasdaq Official Closing Price, which may not be the last sales price. If, on a particular day, an equity security does not trade, the mean between the bid and ask prices will be used, which approximates fair value.Open-end investment companies are valued at their published net asset value (NAV). US government and agency securities are valued at the mean between the bid and ask prices, which approximates fair value. Investments in repurchase agreements are generally valued at par, which approximates fair value, each business day. Generally, other securities and assets for which market quotations are not readily available are valued at fair value as determined in good faith under the direction of the Trust’s Board of Trustees (Board). In determining whether market quotations are readily available or fair valuation will be used, various factors will be taken into consideration, such as market closures or suspension of trading in a security. Restricted securities are valued at fair value using methods approved by the Board.
Federal Income Taxes — No provision for federal income taxes has been made as the Series intends to continue to qualify for federal income tax purposes as a regulated investment company under Subchapter M of the Internal Revenue Code of 1986, as amended, and make the requisite distributions to shareholders. The Series evaluates tax positions taken or expected to be taken in the course of preparing the Series’ tax returns to determine whether the tax positions are“more-likely-than-not” of being sustained by the applicable tax authority. Tax positions not deemed to meet the“more-likely-than-not” threshold are recorded as a tax benefit or expense in the current year. Management has analyzed the Series’ tax positions taken or expected to be taken on the Series’ federal income tax returns through the year ended Dec. 31, 2019 and for all open tax years (years ended Dec. 31, 2016–Dec. 31, 2018), and has concluded that no provision for federal income tax is required in the Series’ financial statements. If applicable, the Series recognizes interest accrued on unrecognized tax benefits in interest expense and penalties in “Other expenses” on the “Statement of operations.” During the year ended Dec. 31, 2019, the Series did not incur any interest or tax penalties.
Class Accounting — Investment income, common expenses, and realized and unrealized gain (loss) on investments are allocated to the classes of the Series on the basis of daily net assets of each class. Distribution expenses relating to a specific class are charged directly to that class.
Underlying Funds — The Series may invest in other investment companies (Underlying Funds) to the extent permitted by the 1940 Act. The Underlying Funds in which the Series invests include business development corporations (BDC). The Series will indirectly bear the investment management fees and other expenses of the Underlying Funds.
Repurchase Agreements — The Series may purchase certain US government securities subject to the counterparty’s agreement to repurchase them at an agreed upon date and price. The counterparty will be required on a daily basis to maintain the value of the collateral subject to the agreement at not less than the repurchase price (including accrued interest). The agreements are conditioned upon the collateral being deposited under the Federal Reserve book-entry system with the Series’ custodian or a third-partysub-custodian. In the event of default or bankruptcy by the other party to the agreement, retention of the collateral may be subject to legal proceedings. At Dec. 31, 2019, the Fund held no investments in repurchase agreements.
Use of Estimates — The preparation of financial statements in conformity with US GAAP requires management to make estimates and assumptions that affect the fair value of investments, the reported amounts of assets and liabilities and disclosure of contingent assets and liabilities at the date of the financial statements, and the reported amounts of revenues and expenses during the reporting period. Actual results could differ from those estimates and the differences could be material.
Other — Expenses directly attributable to the Series are charged directly to the Series. Other expenses common to various funds within the Delaware Funds® by Macquarie (Delaware Funds) are generally allocated among such funds on the basis of average net assets. Management fees and certain other expenses are paid monthly. Security transactions are recorded on the date the securities are purchased or sold (trade date) for financial reporting purposes. Costs used in calculating realized gains and losses on the sale of investment securities are those of the specific securities sold. Dividend income is recorded on theex-dividend date and interest income is recorded on the accrual basis. Discounts and premiums on debt securities are accreted or amortized to interest income, respectively, over the lives of the respective securities using the effective interest method. Distributions received from investments in real estate investment trusts (REITs) are recorded as dividend income on theex-dividend date, subject to reclassification upon notice of
Small Cap Value Series-13
Delaware VIP® Small Cap Value Series
Notes to financial statements (continued)
1. Significant Accounting Policies (continued)
the character of such distributions by the issuer, which are estimated. The Series declares and pays dividends from net investment income and distributions from net realized gain on investments, if any, following the close of the fiscal year. The Series may distribute more frequently, if necessary for tax purposes. Dividends and distributions, if any, are recorded on theex-dividend date.
The Series receives earnings credits from its custodian when positive cash balances are maintained, which may be used to offset custody fees. The expenses paid under this arrangement are included on the “Statement of operations” under “Custodian fees” with the corresponding expenses offset included under “Less expenses paid indirectly.” For the year ended Dec. 31, 2019, the Series earned $2,410 under this arrangement.
The Series receives earnings credits from its transfer agent when positive cash balances are maintained, which may be used to offset transfer agent fees. If the amount earned is greater than $1, the expenses paid under this arrangement are included on the “Statement of operations” under “Dividend disbursing and transfer agent fees and expenses” with the corresponding expenses offset included under “Less expenses paid indirectly.” For the year ended Dec. 31, 2019, the Series earned $5 under this arrangement.
2. Investment Management, Administration Agreements, and Other Transactions with Affiliates
In accordance with the terms of its investment management agreement, the Series pays Delaware Management Company (DMC), a series of Macquarie Investments Management Business Trust and the investment manager, an annual fee which is calculated daily and paid monthly at the rates of 0.75% on the first $500 million of average daily net assets of the Series, 0.70% on the next $500 million, 0.65% on the next $1.5 billion, and 0.60% on average daily net assets in excess of $2.5 billion.
Effective May 30, 2019, DMC may permit its affiliates, Macquarie Investment Management Global Limited (MIMGL) and Macquarie Funds Management Hong Kong Limited (together, the “AffiliatedSub-Advisors”), to execute Fund equity security trades on behalf of the Manager. The Manager may also seek quantitative support from MIMGL. Although the AffiliatedSub-Advisors serve assub-advisors, DMC has ultimate responsibility for all investment advisory services. For these services, DMC, not the Fund, may pay each AffiliatedSub-Advisor a portion of its investment management fee.
Delaware Investments Fund Services Company (DIFSC), an affiliate of DMC, provides fund accounting and financial administration oversight services to the Series. For these services, DIFSC’s fees are calculated daily and paid monthly based on the aggregate daily net assets of all funds within the Delaware Funds at the following annual rates: 0.00475% of the first $35 billion; 0.0040% of the next $10 billion; and 0.0025% of aggregate average daily net assets in excess of $45 billion (Total Fee). Each fund in the Delaware funds pays a minimum of $4,000, which, in aggregate, is subtracted from the Total Fee. Each fund then pays its portion of the remainder of the Total Fee on a relative NAV basis. This amount is included on the “Statement of operations” under “Accounting and administration expenses.” For the year ended December 31, 2019, the Series was charged $48,359 for these services.
DIFSC is also the transfer agent and dividend disbursing agent of the Series. For these services, DIFSC’s fees were calculated daily and paid monthly at the annual rate of 0.0075% of the Series’ average daily net assets. This amount is included on the “Statement of operations” under “Dividend disbursing and transfer agent fees and expenses.” For the year ended Dec. 31, 2019, the Series was charged $90,909 for these services. Pursuant to asub-transfer agency agreement between DIFSC and BNY Mellon Investment Servicing (US) Inc. (BNYMIS), BNYMIS provides certainsub-transfer agency services to the Series.Sub-transfer agency fees are paid by the Series and are also included on the “Statement of operations” under “Dividend disbursing and transfer agent fees and expenses.” The fees that are calculated daily and paid as invoices are received on a monthly or quarterly basis.
Pursuant to a distribution agreement and distribution plan, the Series pays DDLP, the distributor and an affiliate of DMC, an annual12b-1 fee of 0.30% of the average daily net assets of the Service Class shares. The fees are calculated daily and paid monthly. Standard Class shares do not pay12b-1 fees.
As provided in the investment management agreement, the Series bears a portion of the cost of certain resources shared with DMC, including the cost of internal personnel of DMC and/or its affiliates that provide legal, tax, and regulatory reporting services to the Series. For the year ended Dec. 31, 2019, the Series was charged $33,451 for internal legal, tax, and regulatory reporting services provided by DMC and/or its affiliates’ employees. This amount is included on the “Statement of operations” under “Legal fees.”
Trustees’ fees include expenses accrued by the Series for each Trustee’s retainer and meeting fees. Certain officers of DMC, DIFSC, and DDLP are officers and/or Trustees of the Trust. These officers and Trustees are paid no compensation by the Series.
In addition to the management fees and other expenses of the Series, the Series indirectly bears the investment management fees and other expenses of the Underlying Funds. The amount of these fees and expenses incurred indirectly by the Series will vary based upon the expense and fee levels of the Underlying Funds and the number of shares that are owned of the Underlying Funds at different times.
Small Cap Value Series-14
Delaware VIP® Small Cap Value Series
Notes to financial statements (continued)
3. Investments
For the year ended Dec. 31, 2019, the Series made purchases and sales of investment securities other than short-term investments as follows:
| | | | |
Purchases | | $ | 202,494,487 | |
Sales | | | 231,572,051 | |
The tax cost of investments includes adjustments to net unrealized appreciation (depreciation) which may not necessarily be final tax cost basis adjustments, but approximate the tax basis unrealized gains and losses that may be realized and distributed to shareholders. At Dec. 31, 2019, the cost and unrealized appreciation (depreciation) of investments for federal income tax purposes for the Fund were as follows:
| | | | | | |
| | | Aggregate | | Aggregate | | |
| | | Unrealized | | Unrealized | | Net Unrealized |
| Cost of | | Appreciation | | Depreciation | | Appreciation |
| Investments | | of Investments | | of Investments | | of Investments |
| $961,225,359 | | $418,841,819 | | $(61,375,506) | | $357,466,313 |
US GAAP defines fair value as the price that the Series would receive to sell an asset or pay to transfer a liability in an orderly transaction between market participants at the measurement date under current market conditions. A three-level hierarchy for fair value measurements has been established based upon the transparency of inputs to the valuation of an asset or liability. Inputs may be observable or unobservable and refer broadly to the assumptions that market participants would use in pricing the asset or liability. Observable inputs reflect the assumptions market participants would use in pricing the asset or liability based on market data obtained from sources independent of the reporting entity. Unobservable inputs reflect the reporting entity’s own assumptions about the assumptions that market participants would use in pricing the asset or liability based on the best information available under the circumstances. The Series’ investment in its entirety is assigned a level based upon the observability of the inputs which are significant to the overall valuation. The three-level hierarchy of inputs is summarized below.
| | | | |
| Level 1 | | – | | Inputs are quoted prices in active markets for identical investments. (Examples: equity securities,open-end investment companies, futures contracts, and exchange-traded options contracts) |
| Level 2 | | – | | Other observable inputs, including, but not limited to: quoted prices for similar assets or liabilities in markets that are active, quoted prices for identical or similar assets or liabilities in markets that are not active, inputs other than quoted prices that are observable for the assets or liabilities (such as interest rates, yield curves, volatilities, prepayment speeds, loss severities, credit risks and default rates) or other market-corroborated inputs. (Examples: debt securities, government securities, swap contracts, foreign currency exchange contracts, foreign securities utilizing international fair value pricing, broker-quoted securities, and fair valued securities) |
| Level 3 | | – | | Significant unobservable inputs, including the Series’ own assumptions used to determine the fair value of investments. (Examples: broker-quoted securities and fair valued securities) |
Level 3 investments are valued using significant unobservable inputs. The Series may also use an income-based valuation approach in which the anticipated future cash flows of the investment are discounted to calculate fair value. Discounts may also be applied due to the nature or duration of any restrictions on the disposition of the investments. Valuations may also be based upon current market prices of securities that are comparable in coupon, rating, maturity, and industry. The derived value of a Level 3 investment may not represent the value which is received upon disposition and this could impact the results of operations.
The following table summarizes the valuation of the Series’ investments by fair value hierarchy levels as of Dec. 31, 2019:
| | | | |
| | | Level 1 | |
Securities | | | | |
Assets: | | | | |
Common Stock | | $ | 1,275,861,044 | |
Short-Term Investments | | | 42,830,628 | |
| | | | |
Total Value of Securities | | $ | 1,318,691,672 | |
| | | | |
During the year ended Dec. 31, 2019, there were no transfers between Level 1 investments, Level 2 investments, or Level 3 investments that had a significant impact to the Series. The Series’ policy is to recognize transfers between levels based on fair value at the beginning of the reporting period.
A reconciliation of Level 3 investments is presented when the Series has a significant amount of Level 3 investments at the beginning, interim, or end of the period in relation to the Series’ net assets. During the year ended Dec. 31, 2019, there were no Level 3 investments.
Small Cap Value Series-15
Delaware VIP® Small Cap Value Series
Notes to financial statements (continued)
4. Dividend and Distribution Information
Income and long-term capital gain distributions are determined in accordance with federal income tax regulations, which may differ from US GAAP. Additionally, distributions from net short-term gains on sales of investment securities are treated as ordinary income for federal income tax purposes. The tax character of dividends and distributions paid during the year ended Dec. 31, 2019 and 2018 was as follows:
| | | | | | | | |
| | | Year ended | |
| | | 12/31/19 | | | 12/31/18 | |
Ordinary income | | $ | 16,167,516 | | | $ | 9,763,552 | |
Long-term capital gains | | | 89,779,154 | | | | 88,039,040 | |
| | | | | | | | |
Total | | $ | 105,946,670 | | | $ | 97,802,592 | |
| | | | | | | | |
5. Components of Net Assets on a Tax Basis
As of Dec. 31, 2019, the components of net assets on a tax basis were as follows:
| | | | |
Shares of beneficial interest | | $ | 880,501,459 | |
Undistributed ordinary income | | | 12,389,647 | |
Undistributed long-term capital gains | | | 64,382,901 | |
Net unrealized appreciation on investments | | | 357,466,313 | |
| | | | |
Net assets | | $ | 1,314,740,320 | |
| | | | |
The differences between book basis and tax basis components of net assets are primarily attributable to tax deferral of losses on wash sales.
6. Capital Shares
Transactions in capital shares were as follows:
| | | | | | | | |
| | | Year ended | |
| | | 12/31/19 | | | 12/31/18 | |
Shares sold: | | | | | | | | |
Standard Class | | | 1,056,698 | | | | 1,231,914 | |
Service Class | | | 2,164,927 | | | | 2,036,658 | |
| | |
Shares issued upon reinvestment of dividends and distributions: | | | | | | | | |
Standard Class | | | 1,018,930 | | | | 859,679 | |
Service Class | | | 2,000,591 | | | | 1,661,804 | |
| | | | | | | | |
| | | 6,241,146 | | | | 5,790,055 | |
| | | | | | | | |
Shares redeemed: | | | | | | | | |
Standard Class | | | (1,613,952 | ) | | | (1,473,380 | ) |
Service Class | | | (2,575,610 | ) | | | (2,248,735 | ) |
| | | | | | | | |
| | | (4,189,562 | ) | | | (3,722,115 | ) |
| | | | | | | | |
Net increase | | | 2,051,584 | | | | 2,067,940 | |
| | | | | | | | |
7. Line of Credit
The Series, along with certain other funds in the Delaware Funds (Participants), was a participant in a $220,000,000 revolving line of credit to be used for temporary or emergency purposes as an additional source of liquidity to fund redemptions of investor shares. Under the agreement, the Participants were charged an annual commitment fee of 0.15%, which was allocated across the Participants based on a weighted average of the respective net assets of each Participant. The Participants were permitted to borrow up to a maximum ofone-third of their net assets under the agreement. Each Participant was individually, and not jointly, liable for its particular advances, if any, under the line of credit. The line of credit available under the agreement expired on Nov. 4, 2019.
On Nov. 4, 2019, the Participants entered into an amendment to the agreement for a $250,000,000 revolving line of credit. The revolving line of credit is to be used as described above and operates in substantially the same manner as the original agreement. The line of credit available under the agreement expires on Nov. 2, 2020.
Small Cap Value Series-16
Delaware VIP® Small Cap Value Series
Notes to financial statements (continued)
The Series had no amounts outstanding as of Dec. 31, 2019, or at any time during the year then ended.
8. Securities Lending
The Series, along with other funds in the Delaware Funds, may lend its securities pursuant to a security lending agreement (Lending Agreement) with The Bank of New York Mellon (BNY Mellon). At the time a security is loaned, the borrower must post collateral equal to the required percentage of the market value of the loaned security, including any accrued interest. The required percentage is: (1) 102% with respect to US securities and foreign securities that are denominated and payable in US dollars; and (2) 105% with respect to foreign securities. With respect to each loan, if on any business day, the aggregate market value of securities collateral plus cash collateral held is less than the aggregate market value of the securities which are the subject of such loan, the borrower will be notified to provide additional collateral by the end of the following business day which, together with the collateral already held, will be not less than the applicable initial collateral requirements for such security loan. If the aggregate market value of securities collateral and cash collateral held with respect to a security loan exceeds the applicable initial collateral requirement, upon the request of the borrower, BNY Mellon must return enough collateral to the borrower by the end of the following business day to reduce the value of the remaining collateral to the applicable initial collateral requirement for such security loan. As a result of the foregoing, the value of the collateral held with respect to a loaned security on any particular day may be more or less than the value of the security on loan. The collateral percentage with respect to the market value of the loaned security is determined by the security lending agent.
Cash collateral received by each series of the Trust is generally invested in a series of individual separate accounts, each corresponding to a series. The investment guidelines permit each separate account to hold certain securities that would be considered eligible securities for a money market fund. Cash collateral received is generally invested in government securities; certain obligations issued by government sponsored enterprises; repurchase agreements collateralized by US Treasury securities; obligations issued by the central government of any Organization for Economic Cooperation and Development (OECD) country or its agencies, instrumentalities, or establishments; obligations of supranational organizations; commercial paper, notes, bonds, and other debt obligations; certificates of deposit, time deposits, and other bank obligations; and asset-backed securities. A series can also accept US government securities and letters of credit(non-cash collateral) in connection with securities loans.
In the event of default or bankruptcy by the lending agent, realization and/or retention of the collateral may be subject to legal proceedings. In the event the borrower fails to return loaned securities and the collateral received is insufficient to cover the value of the loaned securities and provided such collateral shortfall is not the result of investment losses, the lending agent has agreed to pay the amount of the shortfall to the Series or, at the discretion of the lending agent, replace the loaned securities. The Series continues to record dividends or interest, as applicable, on the securities loaned and is subject to changes in value of the securities loaned that may occur during the term of the loan. The Series has the right under the Lending Agreement to recover the securities from the borrower on demand. With respect to security loans collateralized bynon-cash collateral, the Series receives loan premiums paid by the borrower. With respect to security loans collateralized by cash collateral, the earnings from the collateral investments are shared among the Series, the security lending agent, and the borrower. The Series records security lending income net of allocations to the security lending agent and the borrower.
The Series may incur investment losses as a result of investing securities lending collateral. This could occur if an investment in the collateral investment account defaulted or became impaired. Under those circumstances, the value of the Series’ cash collateral account may be less than the amount the Series would be required to return to the borrowers of the securities and the Series would be required to make up for this shortfall.
During the year ended Dec. 31, 2019, the Series had no securities out on loan.
9. Credit and Market Risk
The Series invests a significant portion of its assets in small companies and may be subject to certain risks associated with ownership of securities of such companies. Investments in small sized companies may be more volatile than investments in larger companies for a number of reasons, which include limited financial resources or a dependence on narrow product lines.
The Series invests in REITs and is subject to the risks associated with that industry. If the Series holds real estate directly or receives rental income directly from real estate holdings, its tax status as a regulated investment company may be jeopardized. There were no direct real estate holdings during the year ended Dec. 31, 2019. The Series’ REIT holdings are also affected by interest rate changes, particularly if the REITs it holds use floating rate debt to finance their ongoing operations.
The Series may invest up to 10% of its net assets in illiquid securities, which may include securities with contractual restrictions on resale, securities exempt from registration under Rule 144A, promulgated under the Securities Act of 1933, as amended, and other securities which may not be readily marketable. The relative illiquidity of these securities may impair the Series from disposing of them in a timely manner and at a fair price when it is necessary or desirable to do so. While maintaining oversight, the Board has delegated to DMC, theday-to-day functions of determining whether individual
Small Cap Value Series-17
Delaware VIP® Small Cap Value Series
Notes to financial statements (continued)
securities are liquid for purposes of the Series’ limitation on investments in illiquid securities. Securities eligible for resale pursuant to Rule 144A, which are determined to be liquid, are not subject to the Series’ 10% limit on investments in illiquid securities. As of Dec. 31, 2019, there were no Rule 144A securities held by the Series.
10. Contractual Obligations
The Series enters into contracts in the normal course of business that contain a variety of indemnifications. The Series’ maximum exposure under these arrangements is unknown. However, the Series has not had prior claims or losses pursuant to these contracts. Management has reviewed the Series’ existing contracts and expects the risk of loss to be remote.
11. Recent Accounting Pronouncements
In August 2018, the FASB issued an Accounting Standards Update (ASU), ASU2018-13, which changes certain fair value measurement disclosure requirements. ASU2018-13, in addition to other modifications and additions, removes the requirement to disclose the amount and reasons for transfers between Level 1 and Level 2 of the fair value hierarchy, the policy for the timing of transfers between levels and the valuation process for Level 3 fair value measurements. ASU2018-13 is effective for fiscal years, and interim periods within those fiscal years, beginning after Dec. 15, 2019. At this time, management is evaluating the implications of these changes on the financial statements.
12. Subsequent Events
Management has determined that no material events or transactions occurred subsequent to Dec. 31, 2019, that would require recognition or disclosure in the Series’ financial statements.
Small Cap Value Series-18
Delaware VIP® Trust — Delaware VIP Small Cap Value Series
Report of independent registered public accounting firm
To the Board of Trustees of Delaware VIP® Trust and Shareholders of Delaware VIP Small Cap Value Series
Opinion on the Financial Statements
We have audited the accompanying statement of assets and liabilities, including the schedule of investments, of Delaware VIP Small Cap Value Series (one of the series constituting Delaware VIP® Trust, referred to hereafter as the “Series”) as of December 31, 2019, the related statement of operations for the year ended December 31, 2019, the statements of changes in net assets for each of the two years in the period ended December 31, 2019, including the related notes, and the financial highlights for each of the five years in the period ended December 31, 2019 (collectively referred to as the “financial statements”). In our opinion, the financial statements present fairly, in all material respects, the financial position of the Series as of December 31, 2019, the results of its operations for the year then ended, the changes in its net assets for each of the two years in the period ended December 31, 2019 and the financial highlights for each of the five years in the period ended December 31, 2019 in conformity with accounting principles generally accepted in the United States of America.
Basis for Opinion
These financial statements are the responsibility of the Series’ management. Our responsibility is to express an opinion on the Series’ financial statements based on our audits. We are a public accounting firm registered with the Public Company Accounting Oversight Board (United States) (PCAOB) and are required to be independent with respect to the Series in accordance with the U.S. federal securities laws and the applicable rules and regulations of the Securities and Exchange Commission and the PCAOB.
We conducted our audits of these financial statements in accordance with the standards of the PCAOB. Those standards require that we plan and perform the audit to obtain reasonable assurance about whether the financial statements are free of material misstatement, whether due to error or fraud.
Our audits included performing procedures to assess the risks of material misstatement of the financial statements, whether due to error or fraud, and performing procedures that respond to those risks. Such procedures included examining, on a test basis, evidence regarding the amounts and disclosures in the financial statements. Our audits also included evaluating the accounting principles used and significant estimates made by management, as well as evaluating the overall presentation of the financial statements. Our procedures included confirmation of securities owned as of December 31, 2019 by correspondence with the custodian, transfer agents and brokers; when replies were not received from brokers, we performed other auditing procedures. We believe that our audits provide a reasonable basis for our opinion.
/s/PricewaterhouseCoopers LLP
Philadelphia, Pennsylvania
February 21, 2020
We have served as the auditor of one or more investment companies in Delaware Funds® by Macquarie since 2010.
Small Cap Value Series-19
Delaware VIP® Trust — Delaware VIP Small Cap Value Series
Other Series information (Unaudited)
Board consideration of Investment Advisory andSub-Advisory Agreements for Delaware VIP Small Cap Value Series at a meeting held August21-22, 2019
At a meeting held on Aug.21-22, 2019 (the “Annual Meeting”), the Board of Trustees (the “Board”), including a majority of disinterested or independent Trustees, approved the renewal of the investment advisory andsub-advisory agreements for Delaware VIP Small Cap Value Series (the “Series”). In making its decision, the Board considered information furnished at regular quarterly Board meetings, including reports detailing Series performance, investment strategies, and expenses, as well as information prepared specifically in connection with the renewal of the investment advisory andsub-advisory contracts. Information furnished specifically in connection with the renewal of the Investment Management Agreement with Delaware Management Company (“DMC”), a series of Macquarie Investment Management Business Trust (“MIMBT”) and theSub-Advisory Agreements with Macquarie Funds Management Hong Kong Limited (“MFMHK”) and Macquarie Investment Management Global Limited (“MIMGL”), included materials provided by DMC and its affiliates (collectively, “Macquarie Investment Management”), MFMHK, and MIMGL, concerning, among other things, the nature, extent, and quality of services provided to the Series; the costs of such services to the Series; economies of scale; and the investment manager’s financial condition and profitability. In addition, in connection with the Annual Meeting, materials were provided to the Trustees in May 2019, including reports provided by Broadridge Financial Solutions (“Broadridge”). The Broadridge reports compared the Series’ investment performance and expenses with those of other comparable mutual funds. The Independent Trustees reviewed and discussed the Broadridge reports with independent legal counsel to the Independent Trustees. In addition to the information noted above, the Board also requested and received information regarding DMC’s policy with respect to advisory fee levels and its breakpoint philosophy; the structure of portfolio manager compensation; comparative client fee information; and any constraints or limitations on the availability of securities for certain investment styles, which had in the past year inhibited, or which were likely in the future to inhibit, the investment manager’s ability to invest fully in accordance with Series policies.
In considering information relating to the approval of the Series’ investment advisory andsub-advisory agreements, the Independent Trustees received assistance and advice from and met separately with independent legal counsel to the Independent Trustees and also received assistance and advice from an experienced and knowledgeable independent fund consultant, JDL Consultants, LLC (“JDL”). Although the Board gave attention to all information furnished, the following discussion identifies, under separate headings, the primary factors taken into account by the Board during its contract renewal considerations.
Nature, extent, and quality of services.The Board considered the services provided by DMC to the Series and its shareholders. In reviewing the nature, extent, and quality of services, the Board considered reports furnished to it throughout the year, which covered matters such as the relative performance of the Series; compliance of portfolio managers with the investment policies, strategies, and restrictions for the Series; compliance by DMC and Delaware Distributors, L.P. (together, “Management”) personnel with the Code of Ethics adopted throughout the Delaware Funds® by Macquarie (the “Delaware Funds”); and adherence to fair value pricing procedures as established by the Board. The Board was pleased with the current staffing of DMC and the emphasis placed on research in the investment process. The Board recognized DMC’s receipt of certain favorable industry distinctions during the past several years. The Board gave favorable consideration to DMC’s efforts to control expenses while maintaining service levels committed to Series matters. The Board was satisfied with the nature, extent, and quality of the overall services provided by DMC.
Nature, extent, and quality of services.The Board considered the services provided by MFMHK to the Series and its shareholders. In reviewing the nature, extent, and quality of services, the Board considered reports furnished to it throughout the year at regular Board Meetings covering matters such as relative performance of the Series; compliance of portfolio managers with the investment policies, strategies, and restrictions for the Series; the compliance of MFMHK personnel with its Code of Ethics; and adherence to fair value pricing procedures as established by the Board. The Board was pleased with the current staffing of MFMHK and the emphasis placed on research in the investment process. The Board was satisfied with the nature, extent, and quality of the overall services provided by MFMHK.
Nature, extent, and quality of services.The Board considered the services provided by MIMGL to the Series and its shareholders. In reviewing the nature, extent, and quality of services, the Board considered reports furnished to it throughout the year at regular Board Meetings covering matters such as relative performance of the Series; compliance of portfolio managers with the investment policies, strategies, and restrictions for the Series; the compliance of MIMGL personnel with its Code of Ethics; and adherence to fair value pricing procedures as established by the Board. The Board was pleased with the current staffing of MIMGL and the emphasis placed on research in the investment process. The Board was satisfied with the nature, extent, and quality of the overall services provided by MIMGL.
Investment performance.The Board placed significant emphasis on the investment performance of the Series in view of the importance of investment performance to shareholders. Although the Board considered performance reports and discussions with portfolio managers at Board meetings throughout the year, the Board gave particular weight to the Broadridge reports furnished for the Annual Meeting. The Broadridge reports prepared for the Series showed the investment performance of its Standard Class shares in comparison to a group of similar funds as selected by Broadridge (the “Performance Universe”). A fund with the best performance ranked first, and a fund with the poorest performance ranked last. The highest/best performing 25% of funds in the Performance Universe make up the first quartile; the next 25%, the second quartile; the next 25%, the third quartile; and the poorest/worst
Small Cap Value Series-20
Delaware VIP® Trust — Delaware VIP Small Cap Value Series
Other Series information (Unaudited)
Board consideration of Investment Advisory andSub-Advisory Agreements for Delaware VIP Small Cap Value Series at a meeting held August21-22, 2019 (continued)
performing 25% of funds in the Performance Universe make up the fourth quartile. Comparative annualized performance for the Series was shown for the past1-,3-,5-, and10-year periods, as applicable, ended Jan. 31, 2019. The Board’s objective is that the Series’ performance for the1-,3-, and5-year periods be at or above the median of its Performance Universe.
Broadridge currently classifies the Series as asmall-cap core fund. However, Management believes that, because the Series utilizes a value investment philosophy and process, it would be more appropriate to include the Series in thesmall-cap value funds category. Accordingly, the Broadridge report prepared for the Series compares the Series’ performance to two separate Performance Universes – one, consisting of allsmall-cap core funds underlying variable insurance products, and the other, consisting of allsmall-cap value funds underlying variable insurance products. When compared to othersmall-cap core funds, the Broadridge report comparison showed that the Series’ total return for the1-year period was in the fourth quartile of its Performance Universe. The report further showed that the Series’ total return for the3- and10-year periods was in the second quartile of its Performance Universe and the Series’ total return for the5-year period was in the third quartile of its Performance Universe. When compared to othersmall-cap value funds, the Broadridge report comparison showed that the Series’ total return for the1-year period was in the fourth quartile of its Performance Universe and the Series’ total return for the3-,5-, and10-year periods was in the first quartile of its Performance Universe. The Board observed that the Series’ short-term performance was not in line with the Board’s objective. In evaluating the Series’ performance, the Board considered the Series’ intermediate- and long-term performance, which was strong. The Board also considered the numerous investment and performance reports delivered by Management personnel to the Board’s Investments Committee. The Board was satisfied that Management was taking action to improve Series performance and to meet the Board’s performance objective.
Comparative expenses.The Board considered expense data for the Delaware Funds. Management provided the Board with information on pricing levels and fee structures for the Series as of its most recently completed fiscal year. The Board also focused on the comparative analysis of effective management fees and total expense ratios of the Series versus effective management fees and expense ratios of a group of similar funds as selected by Broadridge (the “Expense Group”). In reviewing comparative costs, the Series’ contractual management fee and the actual management fee incurred by the Series were compared with the contractual management fees (assuming all funds in the Expense Group were similar in size to the Series) and actual management fees (as reported by each fund) within the Expense Group, taking into account any applicable breakpoints and fee waivers. The Series’ total expenses were also compared with those of its Expense Group. The Broadridge total expenses, for comparative consistency, were shown by Broadridge for Standard Class shares which do not charge12b-1 andnon-12b-1 service fees. The Board’s objective is for each Series’ total expense ratio to be competitive with those of the peer funds within its Expense Group.
When compared to othersmall-cap core funds, the expense comparisons for the Series showed that the actual management fee and total expenses were in the quartile with the lowest expenses of its Expense Group. When compared to othersmall-cap value funds, the expense comparisons for the Series showed that the actual management fee and total expenses were in the quartile with the second lowest expenses of its Expense Group. The Board was satisfied with the management fee and total expenses of the Series in comparison to those of its Expense Group.
Management profitability.The Board considered the level of profits realized by DMC in connection with the operation of the Series. In this respect, the Board reviewed the Investment Management Profitability Analysis that addressed the overall profitability of DMC’s business in providing management and other services to each of the individual funds and the Delaware Funds as a whole. Specific attention was given to the methodology used by DMC in allocating costs for the purpose of determining profitability. Management stated that the level of profits of DMC, to a certain extent, reflects recent operational cost savings and efficiencies initiated by DMC. The Board considered DMC’s efforts to improve services provided to fund shareholders and to meet additional regulatory and compliance requirements resulting from recent industry-wide Securities and Exchange Commission initiatives. The Board also considered the extent to which DMC might derive ancillary benefits from fund operations, including the potential for procuring additional business as a result of the prestige and visibility associated with its role as service provider to the Delaware Funds and the benefits from allocation of fund brokerage to improve trading efficiencies. As part of its work, the Board also reviewed a report prepared by JDL regarding MIMBT profitability as compared to certain peer fund complexes and the Independent Trustees discussed with JDL personnel regarding DMC’s profitability in such context. The Board found that the management fees were reasonable in light of the services rendered and the profitability of DMC.
Economies of scale.The Trustees considered whether economies of scale are realized by DMC as the Series’ assets increase and the extent to which any economies of scale are reflected in the level of management fees charged. The Trustees reviewed the Series’ advisory fee pricing and structure approved by the Board and shareholders, which includes breakpoints, and which applies to most funds in the Delaware Funds complex. Breakpoints in the advisory fee occur when the advisory fee rate is reduced on assets in excess of specified levels. Breakpoints result in a lower advisory fee, than would otherwise be the case in the absence of breakpoints, when the asset levels specified in the breakpoints are exceeded. The Board noted that, as of March 31, 2019, the Series’ assets exceeded the second breakpoint level. The Board believed that, given the extent to which economies of scale might be realized by DMC and its affiliates, the schedule of fees under the Investment Management Agreement provides a sharing of benefits with the Series and its shareholders.
Small Cap Value Series-21
Delaware VIP® Trust — Delaware VIP Small Cap Value Series
Other Series information (Unaudited)
Tax Information
All disclosures are based on financial information available as of the date of this annual report and, accordingly are subject to change. For any and all items requiring reporting, it is the intention of the Series to report the maximum amount permitted under the Internal Revenue Code and the regulations thereunder.
For the year ended Dec. 31, 2019, the Series reports distributions paid during the year as follows:
| | | | | | | | | | |
| | | (A)
Long-Term
Capital Gains
Distributions
(Tax Basis) | | (B)
Ordinary Income
Distributions
(Tax Basis) | | Total
Distributions
(Tax Basis) | | (C)
Qualified
Dividends1 | |
| | 84.74% | | 15.26% | | 100.00% | | | 100.00% | |
(A) and (B) are based on a percentage of the Series’ total distributions.
(C) is based on a percentage of the Series’ ordinary income distributions.
1Qualified dividends represent dividends which qualify for the corporate dividends received deduction.
Small Cap Value Series-22
Delaware Funds® by Macquarie
Board of trustees / directors and officers addendum
A mutual fund is governed by a Board of Trustees/Directors (“Trustees”), which has oversight responsibility for the management of a fund’s business affairs. Trustees establish procedures and oversee and review the performance of the investment manager, the distributor, and others who perform services for the fund. The independent fund trustees, in particular, are advocates for shareholder interests. Each trustee has served in that capacity since he or she was elected to or appointed to the Board of Trustees, and will continue to serve until his or her retirement or the election of a new trustee in his or her place. The following is a list of the Trustees and Officers with certain background and related information.
| | | | | | | | | | |
Name, Address, and Birth Date | | Position(s) Held with Fund(s) | | Length of Time Served | | Principal Occupation(s) During the Past Five Years | | Number of Portfolios in Fund Complex Overseen by Trustee or Officer | | Other Directorships Held by Trustee or Officer |
| INTERESTED TRUSTEE | | | | | | | | | | |
| | | | | |
Shawn K. Lytle1 2005 Market Street Philadelphia, PA 19103 February 1970 | | President, Chief Executive Officer, and Trustee | | President and Chief Executive Officer since August 2015 Trustee since September 2015 | | President — Macquarie Investment Management2 (June 2015-Present) Regional Head of Americas — UBS Global Asset Management (April 2010-May 2015) | | 95 | | Trustee — UBS Relationship Funds, SMA Relationship Trust, and UBS Funds (May 2010–April 2015) |
INDEPENDENT TRUSTEES | | | | | | | | | | |
Thomas L. Bennett 2005 Market Street Philadelphia, PA 19103 October 1947 | | Chair and Trustee | | Trustee since March 2005 Chair since March 2015 | | Private Investor (March 2004–Present) | | 95 | | None |
Jerome D. Abernathy 2005 Market Street Philadelphia, PA 19103 July 1959 | | Trustee | | Since January 2019 | | Managing Member, Stonebrook Capital Management, LLC (financial technology: macro factors and databases) (January 1993–Present) | | 95 | | None |
Ann D. Borowiec 2005 Market Street Philadelphia, PA 19103 November 1958 | | Trustee | | Since March 2015 | | Chief Executive Officer, Private Wealth Management (2011–2013) and Market Manager, New Jersey Private Bank (2005–2011) — J.P. Morgan Chase & Co. | | 95 | | Director — Banco Santander International (October 2016–December 2019) Director — Santander Bank, N.A. (December 2016–December 2019) |
Joseph W. Chow 2005 Market Street Philadelphia, PA 19103 January 1953 | | Trustee | | Since January 2013 | | Private Investor (April 2011–Present) | | 95 | | Director and Audit Committee Member — Hercules Technology Growth Capital, Inc. (July 2004–July 2014) |
Small Cap Value Series-23
| | | | | | | | | | |
Name, Address, and Birth Date | | Position(s) Held with Fund(s) | | Length of Time Served | | Principal Occupation(s) During the Past Five Years | | Number of Portfolios in Fund Complex Overseen by Trustee or Officer | | Other Directorships Held by Trustee or Officer |
John A. Fry 2005 Market Street Philadelphia, PA 19103 May 1960 | | Trustee | | Since January 2001 | | President — Drexel University (August 2010–Present) President — Franklin & Marshall College (July 2002–July 2010) | | 95 | | Director; Compensation Committee and Governance Committee Member — Community Health Systems (May 2004–Present) Director — Drexel Morgan & Co. (2015–Present) Director and Audit Committee Member — vTv Therapeutics LLC (2017–Present) Director and Audit Committee Member —FS Credit Real Estate Income Trust, Inc. (2018–Present) Director —Federal Reserve Bank of Philadelphia (January 2020–Present) |
Lucinda S. Landreth 2005 Market Street Philadelphia, PA 19103 June 1947 | | Trustee | | Since March 2005 | | Private Investor (2004–Present) | | 95 | | None |
Frances A. Sevilla-Sacasa 2005 Market Street Philadelphia, PA 19103 January 1956 | | Trustee | | Since September 2011 | | Private Investor (January 2017-Present) Chief Executive Officer — Banco Itaú International (April 2012–December 2016) Executive Advisor to Dean (August 2011–March 2012) and Interim Dean (January 2011–July 2011) — University of Miami School of Business Administration President — U.S. Trust, Bank of America Private Wealth Management (Private Banking) (July 2007–December 2008) | | 95 | | Trust Manager and Audit Committee Chair — Camden Property Trust (August 2011–Present) Director; Strategic Planning and Reserves Committee and Nominating and Governance Committee Member — Callon Petroleum Company (December 2019–Present) Director; Audit Committee Member — Carrizo Oil & Gas, Inc. (March 2018–December 2019) |
Thomas K. Whitford 2005 Market Street Philadelphia, PA 19103 March 1956 | | Trustee | | Since January 2013 | | Vice Chairman (2010–April 2013) — PNC Financial Services Group | | 95 | | Director — HSBC North America Holdings Inc. (December 2013-Present) Director — HSBC USA Inc. (July 2014-Present) Director — HSBC Bank USA, National Association (July 2014-March 2017) Director — HSBC Finance Corporation (December 2013-April 2018) |
Small Cap Value Series-24
| | | | | | | | | | |
Name, Address, and Birth Date | | Position(s) Held with Fund(s) | | Length of Time Served | | Principal Occupation(s) During the Past Five Years | | Number of Portfolios in Fund Complex Overseen by Trustee or Officer | | Other Directorships Held by Trustee or Officer |
Christianna Wood 2005 Market Street Philadelphia, PA 19103 March 1956 | | Trustee | | Since January 2019 | | Chief Executive Officer and President — Gore Creek Capital, Ltd. (August 2009–Present) | | 95 | | Director; Finance Committee and Audit Committee Member — H&R Block Corporation (July 2008–Present) Director; Chair of Investments Committee and Audit Committee Member — Grange Insurance (2013–Present) Trustee; Chair of Nominating and Governance Committee and Audit Committee Member — The Merger Fund (2013–Present), The Merger Fund VL (2013–Present); WCM Alternatives: Event-Driven Fund (2013–Present), and WCM Alternatives: Credit Event Fund (December 2017–Present) Director; Chair of Governance Committee and Audit Committee Member — International Securities Exchange (2010–2016) |
Janet L. Yeomans 2005 Market Street Philadelphia, PA 19103 July 1948 | | Trustee | | Since April 1999 | | Vice President and Treasurer (January 2006–July 2012), Vice President — Mergers & Acquisitions (January 2003–January 2006), and Vice President and Treasurer (July 1995–January 2003) — 3M Company | | 95 | | Director; Personnel and Compensation Committee Chair; Member of Nominating, Investments, and Audit Committees for various periods throughout directorship — Okabena Company (2009-2017) |
Small Cap Value Series-25
| | | | | | | | | | |
Name, Address, and Birth Date | | Position(s) Held with Fund(s) | | Length of Time Served | | Principal Occupation(s) During the Past Five Years | | Number of Portfolios in Fund Complex Overseen by Trustee or Officer | | Other Directorships Held by Trustee or Officer |
OFFICERS | | | | | | | | | | |
David F. Connor 2005 Market Street Philadelphia, PA 19103 December 1963 | | Senior Vice President, General Counsel, and Secretary | | Senior Vice President, since May 2013; General Counsel since May 2015; Secretary since October 2005 | | David F. Connor has served in various capacities at different times at Macquarie Investment Management. | | 95 | | None3 |
Daniel V. Geatens 2005 Market Street Philadelphia, PA 19103 October 1972 | | Vice President and Treasurer | | Vice President and Treasurer since October 2007 | | Daniel V. Geatens has served in various capacities at different times at Macquarie Investment Management. | | 95 | | None3 |
Richard Salus 2005 Market Street Philadelphia, PA 19103 October 1963 | | Senior Vice President and Chief Financial Officer | | Senior Vice President and Chief Financial Officer since November 2006 | | Richard Salus has served in various capacities at different times at Macquarie Investment Management. | | 95 | | None |
| 1 | Shawn K. Lytle is considered to be an “Interested Trustee” because he is an executive officer of the Fund’s(s’) investment advisor. |
| 2 | Macquarie Investment Management is the marketing name for Macquarie Management Holdings, Inc. and its subsidiaries, including the Fund’s(s’) investment advisor, principal underwriter, and its transfer agent. |
| 3 | David F. Connor and Daniel V. Geatens serve in similar capacities for the six portfolios of the Optimum Fund Trust, which have the same investment advisor, principal underwriter, and transfer agent as the registrant. Mr. Geatens also serves as the Chief Financial Officer of the Optimum Fund Trust and he is the Chief Financial Officer and Treasurer for Macquarie Global Infrastructure Total Return Fund Inc. |
The Statement of Additional Information for the Fund(s) includes additional information about the Trustees and Officers and is available, without charge, upon request by calling 800523-1918.
Small Cap Value Series-26
| | | | |
| | The Series files its complete schedule of portfolio holdings with the Securities and Exchange Commission (SEC) for the first and third quarters of each fiscal year on FormN-Q or FormN-PORT (available for filings after March 31, 2019). The Series’ FormsN-Q or FormsN-PORT, as well as a description of the policies and procedures that the Series uses to determine how to vote proxies (if any) relating to portfolio securities, are available without charge (i) upon request, by calling 800523-1918; and (ii) on the SEC’s website at sec.gov. In addition, a description of the policies and procedures that the Series uses to determine how to vote proxies (if any) relating to portfolio securities and the Schedule of Investments included in the Series’ most recent FormN-Q or FormN-PORT are available without charge on the Series’ website at delawarefunds.com/vip/literature. The Series’ FormsN-Q and FormsN-PORT may be reviewed and copied at the SEC’s Public Reference Room in Washington, D.C.; information on the operation of the Public Reference Room may be obtained by calling 800SEC-0330. Information (if any) regarding how the Series voted proxies relating to portfolio securities during the most recently disclosed12-month period ended June 30 is available without charge (i) through the Series’ website at delawarefunds.com/proxy; and (ii) on the SEC’s website at sec.gov. | | |
| | |
| AR-VIPSCV 22468 (2/20) (1073909) | | Small Cap Value Series-27 |
Delaware VIP® Trust
Delaware VIP U.S. Growth Series
December 31, 2019
|
Beginning on or about June 1, 2021, as permitted by regulations adopted by the Securities and Exchange Commission, paper copies of your Series’ shareholder reports will no longer be sent to you by mail, unless you specifically request them from the Series or from your financial intermediary, such as a broker/dealer, bank, or insurance company. Instead, you will be notified by mail each time a report is posted on the website and provided with a link to access the report. If you already elected to receive shareholder reports electronically, you will not be affected by this change and you do not need to take any action. You may elect to receive paper copies of all future shareholder reports free of charge. You can inform the Series that you wish to continue receiving paper copies of your shareholder reports by contacting us at 800523-1918. If you own these shares through a financial intermediary, you may contact your financial intermediary to elect to continue to receive paper copies of your shareholder reports. Your election to receive reports in paper will apply to all funds held with the Delaware Funds®by Macquarie or your financial intermediary. |
Table of contents
Other than Macquarie Bank Limited (MBL), none of the entities noted are authorized deposit-taking institutions for the purposes of the Banking Act 1959 (Commonwealth of Australia). The obligations of these entities do not represent deposits or other liabilities of MBL. MBL does not guarantee or otherwise provide assurance in respect of the obligations of these entities, unless noted otherwise. The Series is governed by US laws and regulations.
Unless otherwise noted, views expressed herein are current as of Dec. 31, 2019, and subject to change for events occurring after such date.
The Series is not FDIC insured and is not guaranteed. It is possible to lose the principal amount invested.
Advisory services provided by Delaware Management Company, a series of Macquarie Investment Management Business Trust (MIMBT), a US registered investment advisor.
The Series is distributed byDelaware Distributors, L.P.(DDLP), an affiliate of MIMBT and Macquarie Group Limited. Macquarie Investment Management (MIM) is the marketing name for certain companies comprising the asset management division of Macquarie Group Limited and its subsidiaries and affiliates worldwide.
This material may be used in conjunction with the offering of shares in Delaware VIP® U.S. Growth Series only if preceded or accompanied by the Series’ current prospectus or the summary prospectus.
© 2020 Macquarie Management Holdings, Inc.
All third-party marks cited are the property of their respective owners.
| | |
| Delaware VIP®Trust — Delaware VIP U.S. Growth Series |
| Portfolio management review | | January 7, 2020 (Unaudited) |
The investment objective of the Series is to seek long-term capital appreciation.
Jackson Square Partners, LLC (JSP), a US registered investment advisor, is thesub-advisor to Delaware VIP U.S. Growth Series (the “Series”). Assub-advisor, JSP is responsible forday-to-day management of the Series’ assets. Although JSP serves assub-advisor, the investment manager, Delaware Management Company (DMC), a series of Macquarie Investment Management Business Trust (MIMBT) has ultimate responsibility for all investment advisory services.
For the fiscal year ended Dec. 31, 2019, the Series’ Standard Class shares gained 27.25% and Service Class shares gained 26.88%. Both figures reflect all distributions reinvested. For the same period, the Series’ benchmark, the Russell 1000® Growth Index, gained 36.39%.
Equity markets generally made strong gains during the fiscal year. US markets rose 31.49%, as measured by the S&P 500® Index. International markets gained 22.01% (net) and emerging markets gained 18.42% (net), as measured by the MSCI EAFE (Europe, Australasia, Far East) Index and the MSCI Emerging Markets Index, respectively.
The fiscal year opened in January 2019 with equity markets bouncing back from December’s sudden downdraft that was precipitated in large part by a35-day federal shutdown, the longest in US history. Markets were buoyed when it seemed thatUS-China trade negotiations might forestall further tariff increases. Diplomacy between the nations broke down, however, and in May 2019, the United States increased the tax import rate from 10% to 25% on $200 billion worth of Chinese imports. China responded with its own tariff hikes. At the same time, positive economic events at home – including solid employment numbers, an increase in manufacturing, and the first hints of a dovish tilt from the Federal Reserve – gave a boost to investor sentiment.
In May 2019, the US economy started to slow. A combination of low inflation, weaker economic data, and continued trade concerns forged a path for the Fed to reduce interest rates in July for the first time in 11 years. The Fed cut rates again in September, and then once more in October.
Toward the end of the Series’ fiscal year, news that the US and China had hammered out Phase 1 of a trade agreement seemed to mollify US investors. Still, manufacturing gains tapered, consumer confidence declined marginally, and the pace of job growth began to slow. On the brighter side, corporate earnings per share (EPS) continued to grow and the S&P 500 Index posted positive gains.
Source: Bloomberg.
The Series’ strong relative performance in the industrials sector was unable to overcome weak relative performance in the communication services sector. On a stock-specific level, the following were the Series’ most significant detractors and contributors during the period.
TripAdvisor Inc., a travel website providing travel advice and planning features, detracted from the Series’ performance during the fiscal year. The company’s hotel segment has struggled against competitive headwinds, including increased challenges from Google’s search business. Although we believe TripAdvisor’s commitment to increased focus on its experiences and dining products is likely the right long-term strategic move, we decided to exit the Series’ position and deploy assets to what we view as more attractive opportunities.
Dollar Tree Inc., a chain of discount variety stores, also detracted from the Series’ performance during the12-month period. Despite posting attractive same-store sales for the third quarter of 2019, the company cut its full-year estimates due to higher expenses related to tariffs, freight, and a shift in product mix towards consumables. Despite this transitory expense pressure, we continue to believe the company represents an attractive business model in a retail segment largely insulated from Amazon. Furthermore, the Dollar Tree brand name represents a multi-decade, high-performing core franchise that is now combined with an underperforming Family Dollar asset that we believe could be optimized in the medium term.
Applied Materials Inc.– the global leader in providing equipment for advanced semiconductors and flat-panel displays – contributed to the Series’ performance during the fiscal year. The sector drifted higher on stronger foundry investment from Taiwan Semiconductor Manufacturing Co., signs of a bottom in the market for NAND flash memory (a type of nonvolatile storage technology that does not require power to retain data), and positive commentary from management on market-share gains in 2020. We believe Applied Materials is undervalued by the market and think it is attractively positioned in a consolidating sector with high barriers to entry.
Charter Communications Inc., a cable telecommunications company, also contributed to the Series’ performance. The company continues to report strong earnings driven by well-above consensus broadband-subscriber additions. Charter Communications generated margin expansion of earnings before interest, taxes, depreciation, and amortization (EBITDA), driven by the economically accretive mix shift towards broadband and declines in capital intensity. We believe these trends support our thesis and should continue to do so for the foreseeable future. The stock remains undervalued versus our intrinsic business value estimate even with strongyear-to-date stock performance. Overall, we like its cable business given the structurally high barriers to entry,
U.S. Growth Series.-1
| | |
| Delaware VIP®Trust — Delaware VIP U.S. Growth Series |
| Portfolio management review (continued) | | January 7, 2020 (Unaudited) |
limited competition in broadband, inherent long-term pricing power, and the benefits accrued from durable and inexorable secular trends underlying consumer high-speed data consumption.
The markets’ generally positive bias, albeit with periodic bouts of caution, enhances our desire as “intrinsic value” investors to be somewhat contrarian by leaning into lower-duration growth stocks and reallocating to newer ideas and holdings that we believe have more idiosyncratic fundamental drivers or trade at a bigger discount to intrinsic business value.
Regardless of the economic outcome, we remain consistent in our long-term investment philosophy: We want to own what we view as strong secular-growth companies with solid business models and competitive positions that we believe can grow market share and have the potential to deliver shareholder value in a variety of market environments.
| | |
| Unless otherwise noted, views expressed herein are current as of Dec. 31, 2019, and subject to change. |
U.S. Growth Series.-2
Delaware VIP® Trust — Delaware VIP U.S. Growth Series
Performance summary (Unaudited)
The performance quoted represents past performance and does not guarantee future results. Investment return and principal value of an investment will fluctuate so that shares, when redeemed, may be worth more or less than their original cost. Current performance may be lower or higher than the performance quoted.
Carefully consider the Series’ investment objectives, risk factors, charges, and expenses before investing. This and other information can be found in the Series’ prospectus and its summary prospectus, which may be obtained by visiting delawarefunds.com/vip/literature or calling 800523-1918. Investors should read the prospectus and the summary prospectus carefully before investing.
| | | | | | | | | | | | | | | | | | | | | | | | | |
| Delaware VIP U.S. Growth Series | | | | | | | | | | |
| Average annual total returns | | | | | | | | | | |
| For periods ended December 31, 2019 | | 1 year | | 3 year | | 5 year | | 10 year | | Lifetime |
Standard Class shares (commenced operations on Nov. 15, 1999) | | | | +27.25% | | | | | +16.55% | | | | | +9.61% | | | | | +13.11% | | | | | +4.82% | |
| | | | | | | | | | | | | | | | | | | | | | | | | |
Service Class shares (commenced operations on May 1, 2000) | | | | +26.88% | | | | | +16.27% | | | | | +9.31% | | | | | +12.82% | | | | | +4.22% | |
| | | | | | | | | | | | | | | | | | | | | | | | | |
Russell 1000 Growth Index | | | | +36.39% | | | | | +20.49% | | | | | +14.63% | | | | | +15.22% | | | | | n/a | |
Returns reflect the reinvestment of all distributions. Please see page 4 for a description of the index.
As described in the Series’ most recent prospectus, the net expense ratio for Service Class shares of the Series was 1.03%, while total operating expenses for Standard Class and Service Class shares were 0.73% and 1.03%, respectively. The management fee for Standard Class and Service Class shares was 0.65%.
The Series pays Delaware Distributors, L.P. (DDLP), the distributor and an affiliate of DMC, an annual12b-1 fee of 0.30% of the average daily net assets of the Service Class shares.
Earnings from a variable annuity or variable life investment compoundtax-free until withdrawal, and as a result, no adjustments were made for income taxes.
Expense limitations were in effect for both classes during certain periods shown in the Series performance table above and in the Performance of a $10,000 Investment graph on the next page.
Performance data do not reflect insurance fees related to a variable annuity or variable life investment or the deferred sales charge that would apply to certain withdrawals of investments held for fewer than eight years. Performance shown here would have been reduced if such fees were included and the expense limitation removed. For more information about fees, consult your variable annuity or variable life prospectus.
Investments in variable products involve risk.
Investments in small and/ormedium-sized companies typically exhibit greater risk and higher volatility than larger, more established companies.
Please read both the contract and underlying prospectus for specific details regarding the product’s risk profile.
U.S. Growth Series-3
Delaware VIP® U.S. Growth Series
Performance summary (Unaudited) (continued)
| | | | |
| For period beginning Dec. 31, 2009 through Dec. 31, 2019 | | Starting value | | Ending value |
-- Russell 1000 Growth Index | | $10,000 | | $41,233 |
– Delaware VIP U.S. Growth Series (Standard Class) | | $10,000 | | $34,269 |
The graph shows a $10,000 investment in the Delaware VIP U.S. Growth Series Standard Class shares for the period from Dec. 31, 2009 through Dec. 31, 2019.
The graph also shows $10,000 invested in the Russell 1000 Growth Index for the period from Dec. 31, 2009 through Dec. 31, 2019. The Russell 1000 Growth Index measures the performance of thelarge-cap growth segment of the US equity universe. It includes those Russell 1000 companies with higherprice-to-book ratios and higher forecasted growth values.
The S&P 500 Index, mentioned on page 1, measures the performance of 500 mostlylarge-cap stocks weighted by market value, and is often used to represent performance of the US stock market.
The MSCI EAFE (Europe, Australasia, Far East) Index, mentioned on page 1, represents large- andmid-cap stocks across 21 developed markets, excluding the United States and Canada. The index covers approximately 85% of the free float-adjusted market capitalization in each country. Index “net” return approximates the minimum possible dividend reinvestment, after deduction of withholding tax at the highest possible rate.
The MSCI Emerging Markets Index, mentioned on page 1, represents large- andmid-cap stocks across emerging market countries worldwide. The index covers approximately 85% of the free float-adjusted market capitalization in each country. Index “net” return approximates the minimum possible dividend reinvestment, after deduction of withholding tax at the highest possible rate.
Frank Russell Company is the source and owner of the trademarks, service marks, and copyrights related to the Russell Indexes. Russell® is a trademark of Frank Russell Company.
Index performance returns do not reflect any management fees, transaction costs or expenses. Indices are unmanaged and one cannot invest directly in an index.
Performance of Service Class shares will vary due to different charges and expenses.
Past performance is not a guarantee of future results.
U.S. Growth Series-4
Delaware VIP® Trust — Delaware VIP U.S. Growth Series
Disclosure of Series expenses
For thesix-month period from July 1, 2019 to December 31, 2019 (Unaudited)
As a shareholder of the Series, you incur ongoing costs, which may include management fees; distribution and service(12b-1) fees; and other Series expenses. This example is intended to help you understand your ongoing costs (in dollars) of investing in the Series and to compare these costs with the ongoing costs of investing in other mutual funds.
The example is based on an investment of $1,000 invested at the beginning of the period and held for the entiresix-month period from July 1, 2019 to Dec. 31, 2019.
Actual expenses
The first section of the table shown, “Actual Series Return,” provides information about actual account values and actual expenses. You may use the information in this section of the table, together with the amount you invested, to estimate the expenses that you paid over the period. Simply divide your account value by $1,000 (for example, an $8,600 account value divided by $1,000 = 8.6), then multiply the result by the number in the first section under the heading entitled “Expenses Paid During Period” to estimate the expenses you paid on your account during the period.
Hypothetical example for comparison purposes
The second section of the table shown, “Hypothetical 5% Return,” provides information about hypothetical account values and hypothetical expenses based on the Series’ actual expense ratio and an assumed rate of return of 5% per year before expenses, which is not the Series’ actual return. The hypothetical account values and expenses may not be used to estimate the actual ending account balance or expenses you paid for the period. You may use this information to compare the ongoing costs of investing in the Series and other funds. To do so, compare the 5% hypothetical example with the 5% hypothetical examples that appear in the shareholder reports of other funds.
Please note that the expenses shown in the table are meant to highlight your ongoing costs only. As a shareholder of the Series, you do not incur any transaction costs, such as sales charges (loads), redemption fees, or exchange fees, but shareholders of other funds may incur such costs. Also, the fees related to the variable annuity investment or the deferred sales charge that could apply have not been included. Therefore, the second section of the table is useful in comparing ongoing costs only, and will not help you determine the relative total costs of owning different funds. The Series’ expenses shown in the table assume reinvestment of all dividends and distributions.
Expense analysis of an investment of $1,000
| | | | | | | | | | | | | | | | |
| | | Beginning
Account
Value
7/1/19 | | | Ending
Account
Value
12/31/19 | | | Annualized
Expense
Ratio | | | Expenses
Paid During
Period
7/1/19 to
12/31/19* | | |
| | | | | |
Actual Series return† | | | | | | | | | | | | | | | | |
Standard Class | | | $1,000.00 | | | | $1,056.20 | | | | 0.72% | | | $3.73 | | |
Service Class | | | 1,000.00 | | | | 1,055.50 | | | | 1.02% | | | 5.28 | | |
| |
Hypothetical 5% return(5% return before expenses) | | |
Standard Class | | | $1,000.00 | | | | $1,021.58 | | | | 0.72% | | | $3.67 | | |
Service Class | | | 1,000.00 | | | | 1,020.06 | | | | 1.02% | | | 5.19 | | |
*“Expenses Paid During Period” are equal to the Series’ annualized expense ratio, multiplied by the average account value over the period, multiplied by 184/365 (to reflect theone-half year period).
†Because actual returns reflect only the most recent
six-month period, the returns shown may differ significantly
from fiscal year returns.
In addition to the Series’ expenses reflected above, the Series also indirectly bears its portion of the fees and expenses of the investment companies (Underlying Funds) in which it invests. The table above does not reflect the expenses of the Underlying Funds.
U.S. Growth Series-5
Delaware VIP® Trust — Delaware VIP U.S. Growth Series
Security type / sector allocation and top 10 equity holdings
As of December 31, 2019 (Unaudited)
Sector designations may be different than the sector designations presented in other Series materials. The sector designations may represent the investment manager’s internal sector classifications.
| | | | | |
| | | Percentage of |
| Security type / sector | | net assets |
Common Stock² | | | | 95.69 | % |
Communication Services | | | | 8.30 | % |
Consumer Discretionary | | | | 19.42 | % |
Consumer Staples | | | | 4.82 | % |
Financial Services | | | | 23.81 | % |
Healthcare | | | | 13.40 | % |
Materials | | | | 4.87 | % |
Technology | | | | 21.07 | % |
Short-Term Investments | | | | 4.39 | % |
| |
Total Value of Securities | | | | 100.08 | % |
| |
Liabilities Net of Receivables and Other Assets | | | | (0.08) | % |
| |
Total Net Assets | | | | 100.00 | % |
| ² | Narrow industries are utilized for compliance purposes for diversification whereas broad sectors are used for financial reporting. |
Holdings are for informational purposes only and are subject to change at any time. They are not a recommendation to buy, sell, or hold any security.
| | | | | |
| Top 10 equity holdings | | Percentage
of net assets |
Microsoft | | | | 10.68% | |
IQVIA Holdings | | | | 5.58% | |
Alphabet Class A & Class C | | | | 5.37% | |
Charter Communications Class A | | | | 4.91% | |
Ball | | | | 4.87% | |
Constellation Brands Class A | | | | 4.82% | |
UnitedHealth Group | | | | 4.48% | |
Hasbro | | | | 4.41% | |
Mastercard Class A | | | | 4.09% | |
Dollar Tree | | | | 3.92% | |
U.S. Growth Series-6
Delaware VIP® Trust — Delaware VIP U.S. Growth Series
Schedule of investments
December 31, 2019
| | | | | | | | |
| | | Number of | | | Value | |
| | | shares | | | (US $) | |
| |
Common Stock – 95.69%² | | | | | |
Communication
Services – 8.30% | | | | | | | | |
Alphabet Class A † | | | 14,499 | | | $ | 19,419,816 | |
Alphabet Class C † | | | 417 | | | | 557,537 | |
Netflix † | | | 33,756 | | | | 10,922,429 | |
| | | | | | | | |
| | | | | | | 30,899,782 | |
| | | | | | | | |
Consumer Discretionary – 19.42% | | | | | |
Charter Communications Class A † | | | 37,703 | | | | 18,288,971 | |
Dollar Tree † | | | 155,258 | | | | 14,602,015 | |
Domino’s Pizza | | | 41,442 | | | | 12,174,831 | |
Hasbro | | | 155,417 | | | | 16,413,589 | |
Take-Two Interactive Software † | | | 88,475 | | | | 10,831,994 | |
| | | | | | | | |
| | | | | | | 72,311,400 | |
| | | | | | | | |
Consumer Staples – 4.82% | | | | | |
Constellation Brands Class A | | | 94,552 | | | | 17,941,242 | |
| | | | | | | | |
| | | | | | | 17,941,242 | |
| | | | | | | | |
Financial Services – 23.81% | | | | | |
Charles Schwab | | | 295,950 | | | | 14,075,382 | |
CME Group | | | 52,778 | | | | 10,593,600 | |
Crown Castle International | | | 46,984 | | | | 6,678,776 | |
KKR & Co. Class A | | | 497,617 | | | | 14,515,488 | |
Mastercard Class A | | | 50,951 | | | | 15,213,459 | |
PayPal Holdings † | | | 124,928 | | | | 13,513,462 | |
Visa Class A | | | 74,782 | | | | 14,051,538 | |
| | | | | | | | |
| | | | | | | 88,641,705 | |
| | | | | | | | |
Healthcare – 13.40% | | | | | |
Illumina † | | | 37,489 | | | | 12,436,601 | |
IQVIA Holdings † | | | 134,445 | | | | 20,773,097 | |
UnitedHealth Group | | | 56,724 | | | | 16,675,721 | |
| | | | | | | | |
| | | | | | | 49,885,419 | |
| | | | | | | | |
Materials – 4.87% | | | | | |
Ball | | | 280,212 | | | | 18,121,310 | |
| | | | | | | | |
| | | | | | | 18,121,310 | |
| | | | | | | | |
| | | | | | | | |
| | | Number of | | | Value | |
| | | shares | | | (US $) | |
| |
Common Stock² (continued) | | | | | |
Technology – 21.07% | | | | | |
Applied Materials | | | 173,214 | | | $ | 10,572,982 | |
Arista Networks † | | | 37,507 | | | | 7,628,924 | |
Autodesk † | | | 67,290 | | | | 12,345,023 | |
Microsoft | | | 252,034 | | | | 39,745,762 | |
ServiceNow † | | | 28,958 | | | | 8,175,423 | |
| | | | | | | | |
| | | | | | | 78,468,114 | |
| | | | | | | | |
Total Common Stock
(cost $246,997,133) | | | | | | | 356,268,972 | |
| | | | | | | | |
| |
Short-Term Investments – 4.39% | | | | | |
Money Market Mutual Funds – 4.39% | | | | | |
BlackRock FedFund – Institutional Shares(seven-day effective yield 1.52%) | | | 3,270,806 | | | | 3,270,806 | |
Fidelity Investments Money Market Government Portfolio – Class I(seven-day effective yield 1.49%) | | | 3,270,806 | | | | 3,270,806 | |
GS Financial Square Government Fund – Institutional Shares(seven-day effective yield 1.51%) | | | 3,270,806 | | | | 3,270,806 | |
Morgan Stanley Government Portfolio – Institutional Share Class(seven-day effective yield 1.48%) | | | 3,270,806 | | | | 3,270,806 | |
State Street Institutional US Government Money Market Fund – Investor Class(seven-day effective yield 1.45%) | | | 3,270,806 | | | | 3,270,806 | |
| | | | | | | | |
Total Short-Term Investments
(cost $16,354,030) | | | | | | | 16,354,030 | |
| | | | | | | | |
| | | | |
Total Value of Securities – 100.08%
(cost $263,351,163) | | $ | 372,623,002 | |
| | | | |
| ² | Narrow industries are utilized for compliance purposes for diversification whereas broad sectors are used for financial reporting. |
† Non-income producing security.
GS – Goldman Sachs
See accompanying notes, which are an integral part of the financial statements.
U.S. Growth Series-7
| | | | |
| Delaware VIP®Trust — Delaware VIP U.S. Growth Series | | | | |
| Statement of assets and liabilities | | | December 31, 2019 | |
| | | | |
Assets: | | | | |
Investments, at value1 | | $ | 372,623,002 | |
Cash | | | 225 | |
Dividends and interest receivable | | | 139,654 | |
Foreign tax reclaims receivable | | | 37,096 | |
| | | | |
Total assets | | | 372,799,977 | |
| | | | |
Liabilities: | | | | |
Payable for series shares redeemed | | | 125,839 | |
Investment management fees payable to affiliates | | | 203,353 | |
Distribution fees payable to affiliates | | | 80,405 | |
Reports and statements to shareholders payable | | | 31,010 | |
Other accrued expenses | | | 23,769 | |
Custody fees payable | | | 6,387 | |
Trustees’ fees and expenses payable | | | 3,616 | |
Dividend disbursing and transfer agent fees and expenses payable to affiliates | | | 2,346 | |
Accounting and administration expenses payable to affiliates | | | 1,378 | |
Legal fees payable to affiliates | | | 570 | |
Reports and statements to shareholders expense payable to affiliates | | | 178 | |
| | | | |
Total liabilities | | | 478,851 | |
| | | | |
Total Net Assets | | $ | 372,321,126 | |
| | | | |
| |
Net Assets Consist of: | | | | |
Paid-in capital | | $ | 242,414,149 | |
Total distributable earnings (loss) | | | 129,906,977 | |
| | | | |
Total Net Assets | | $ | 372,321,126 | |
| | | | |
| |
Net Asset Value: | | | | |
Standard Class: | | | | |
Net assets | | $ | 53,321,869 | |
Shares of beneficial interest outstanding, unlimited authorization, no par | | | 5,253,292 | |
Net asset value per share | | $ | 10.15 | |
| |
Service Class: | | | | |
Net assets | | $ | 318,999,257 | |
Shares of beneficial interest outstanding, unlimited authorization, no par | | | 32,888,334 | |
Net asset value per share | | $ | 9.70 | |
| |
1Investments, at cost | | $ | 263,351,163 | |
See accompanying notes, which are an integral part of the financial statements.
U.S. Growth Series-8
Delaware VIP®Trust —
Delaware VIP U.S. Growth Series
Statement of operations
Year ended December 31, 2019
| | | | |
Investment Income: | | | | |
Dividends | | $ | 3,063,937 | |
Interest | | | 57,025 | |
| | | | |
| | | 3,120,962 | |
| | | | |
| |
Expenses: | | | | |
Management fees | | | 2,359,578 | |
Distribution expenses – Service Class | | | 935,049 | |
Accounting and administration expenses | | | 102,496 | |
Reports and statements to shareholders | | | 60,335 | |
Audit and tax fees | | | 32,304 | |
Dividend disbursing and transfer agent fees and expenses | | | 30,251 | |
Trustees’ fees and expenses | | | 21,474 | |
Legal fees | | | 18,735 | |
Custodian fees | | | 12,632 | |
Registration fees | | | 27 | |
Other | | | 10,733 | |
| | | | |
| | | 3,583,614 | |
Less expenses paid indirectly | | | (658 | ) |
| | | | |
Total operating expenses | | | 3,582,956 | |
| | | | |
Net Investment Loss | | | (461,994 | ) |
| | | | |
| |
Net Realized and Unrealized Gain: | | | | |
Net realized gain | | | 23,852,476 | |
Net change in unrealized appreciation (depreciation) of investments | | | 62,031,457 | |
| | | | |
Net Realized and Unrealized Gain | | | 85,883,933 | |
| | | | |
Net Increase in Net Assets Resulting from Operations | | $ | 85,421,939 | |
| | | | |
Delaware VIP Trust —
Delaware VIP U.S. Growth Series
Statements of changes in net assets
| | | | | | | | |
| | | Year ended | |
| | | 12/31/19 | | | 12/31/18 | |
Increase (Decrease) in Net Assets from Operations: | | | | | | | | |
Net investment loss | | $ | (461,994 | ) | | $ | (644,265 | ) |
Net realized gain | | | 23,852,476 | | | | 63,618,314 | |
Net change in unrealized appreciation (depreciation) | | | 62,031,457 | | | | (70,795,585 | ) |
| | | | | | | | |
Net increase (decrease) in net assets resulting from operations | | | 85,421,939 | | | | (7,821,536 | ) |
| | | | | | | | |
| | |
Dividends and Distributions to Shareholders from: | | | | | | | | |
Distributable earnings: | | | | | | | | |
Standard Class | | | (8,687,296 | ) | | | (6,179,560 | ) |
Service Class | | | (54,735,552 | ) | | | (42,785,737 | ) |
| | | | | | | | |
| | | (63,422,848 | ) | | | (48,965,297 | ) |
| | | | | | | | |
| | |
Capital Share Transactions: | | | | | | | | |
Proceeds from shares sold: | | | | | | | | |
Standard Class | | | 6,351,775 | | | | 4,179,512 | |
Service Class | | | 2,785,831 | | | | 5,753,887 | |
Net asset value of shares based upon reinvestment of dividends and distributions: | | | | | | | | |
Standard Class | | | 8,687,296 | | | | 6,179,560 | |
Service Class | | | 54,735,552 | | | | 42,785,737 | |
| | | | | | | | |
| | | 72,560,454 | | | | 58,898,696 | |
| | | | | | | | |
| | |
Cost of shares redeemed: | | | | | | | | |
Standard Class | | | (8,398,881 | ) | | | (6,532,749 | ) |
Service Class | | | (43,121,049 | ) | | | (49,881,786 | ) |
| | | | | | | | |
| | | (51,519,930 | ) | | | (56,414,535 | ) |
| | | | | | | | |
Increase in net assets derived from capital share transactions | | | 21,040,524 | | | | 2,484,161 | |
| | | | | | | | |
| | |
Net Increase (Decrease) in Net Assets | | | 43,039,615 | | | | (54,302,672 | ) |
| | |
Net Assets: | | | | | | | | |
Beginning of year | | | 329,281,511 | | | | 383,584,183 | |
| | | | | | | | |
End of year | | $ | 372,321,126 | | | $ | 329,281,511 | |
| | | | | | | | |
See accompanying notes, which are an integral part of the financial statements.
U.S. Growth Series-9
Delaware VIP® Trust — Delaware VIP U.S. Growth Series
Financial highlights
Selected data for each share of the Series outstanding throughout each period were as follows:
| | | | | | | | | | | | | | | | | | | | |
| | | Delaware VIP U.S. Growth Series Standard Class Year ended | |
| | | 12/31/19 | | | 12/31/18 | | | 12/31/17 | | | 12/31/16 | | | 12/31/15 | |
Net asset value, beginning of period | | $ | 9.57 | | | $ | 11.31 | | | $ | 8.91 | | | $ | 13.31 | | | $ | 13.75 | |
| | | | | |
Income (loss) from investment operations: | | | | | | | | | | | | | | | | | | | | |
Net investment income1 | | | 0.01 | | | | 0.01 | | | | 0.01 | | | | 0.02 | | | | 0.08 | |
Net realized and unrealized gain (loss) | | | 2.41 | | | | (0.27 | ) | | | 2.49 | | | | (0.75 | ) | | | 0.66 | |
| | | | | | | | | | | | | | | | | | | | |
Total from investment operations | | | 2.42 | | | | (0.26 | ) | | | 2.50 | | | | (0.73 | ) | | | 0.74 | |
| | | | | | | | | | | | | | | | | | | | |
| | | | | |
Less dividends and distributions from: | | | | | | | | | | | | | | | | | | | | |
Net investment income | | | — | | | | — | | | | — | | | | (0.08 | ) | | | (0.08 | ) |
Net realized gain | | | (1.84 | ) | | | (1.48 | ) | | | (0.10 | ) | | | (3.59 | ) | | | (1.10 | ) |
| | | | | | | | | | | | | | | | | | | | |
Total dividends and distributions | | | (1.84 | ) | | | (1.48 | ) | | | (0.10 | ) | | | (3.67 | ) | | | (1.18 | ) |
| | | | | | | | | | | | | | | | | | | | |
| | | | | |
Net asset value, end of period | | $ | 10.15 | | | $ | 9.57 | | | $ | 11.31 | | | $ | 8.91 | | | $ | 13.31 | |
| | | | | | | | | | | | | | | | | | | | |
| | | | | |
Total return2 | | | 27.25% | | | | (3.00% | ) | | | 28.28% | | | | (5.17% | ) | | | 5.39% | |
| | | | | |
Ratios and supplemental data: | | | | | | | | | | | | | | | | | | | | |
Net assets, end of period (000 omitted) | | $ | 53,322 | | | $ | 43,417 | | | $ | 46,908 | | | $ | 47,773 | | | $ | 50,055 | |
Ratio of expenses to average net assets3 | | | 0.73% | | | | 0.73% | | | | 0.74% | | | | 0.74% | | | | 0.75% | |
Ratio of net investment income to average net assets | | | 0.13% | | | | 0.08% | | | | 0.05% | | | | 0.22% | | | | 0.56% | |
Portfolio turnover | | | 33% | | | | 40% | | | | 25% | | | | 22% | | | | 39% | |
| 1 | The average shares outstanding method has been applied for per share information. |
| 2 | Total return is based on the change in net asset value of a share during the period and assumes reinvestment of dividends and distributions at net asset value. Total return does not include fees, charges, or expenses imposed by the variable annuity and life insurance contracts for which Delaware VIP Trust serves as an underlying investment vehicle. |
| 3 | Expense ratios do not include expenses of the Underlying Funds in which the Series invests. |
See accompanying notes, which are an integral part of the financial statements.
U.S. Growth Series-10
Delaware VIP® U.S. Growth Series
Financial highlights (continued)
Selected data for each share of the Series outstanding throughout each period were as follows:
| | | | | | | | | | | | | | | | | | | | |
| | | Delaware VIP U.S. Growth Series Service Class Year ended | |
| | | 12/31/19 | | | 12/31/18 | | | 12/31/17 | | | 12/31/16 | | | 12/31/15 | |
Net asset value, beginning of period | | $ | 9.24 | | | $ | 11.00 | | | $ | 8.68 | | | $ | 13.07 | | | $ | 13.53 | |
| | | | | |
Income (loss) from investment operations: | | | | | | | | | | | | | | | | | | | | |
Net investment income (loss)1 | | | (0.02 | ) | | | (0.02 | ) | | | (0.02 | ) | | | — | 2 | | | 0.04 | |
Net realized and unrealized gain (loss) | | | 2.32 | | | | (0.26 | ) | | | 2.44 | | | | (0.75 | ) | | | 0.65 | |
| | | | | | | | | | | | | | | | | | | | |
Total from investment operations | | | 2.30 | | | | (0.28 | ) | | | 2.42 | | | | (0.75 | ) | | | 0.69 | |
| | | | | | | | | | | | | | | | | | | | |
| | | | | |
Less dividends and distributions from: | | | | | | | | | | | | | | | | | | | | |
Net investment income | | | — | | | | — | | | | — | | | | (0.05 | ) | | | (0.05 | ) |
Net realized gain | | | (1.84 | ) | | | (1.48 | ) | | | (0.10 | ) | | | (3.59 | ) | | | (1.10 | ) |
| | | | | | | | | | | | | | | | | | | | |
Total dividends and distributions | | | (1.84 | ) | | | (1.48 | ) | | | (0.10 | ) | | | (3.64 | ) | | | (1.15 | ) |
| | | | | | | | | | | | | | | | | | | | |
| | | | | |
Net asset value, end of period | | $ | 9.70 | | | $ | 9.24 | | | $ | 11.00 | | | $ | 8.68 | | | $ | 13.07 | |
| | | | | | | | | | | | | | | | | | | | |
| | | | | |
Total return3 | | | 26.88% | | | | (3.29% | )4 | | | 28.10% | 4 | | | (5.50% | )4 | | | 5.08% | 4 |
| | | | | |
Ratios and supplemental data: | | | | | | | | | | | | | | | | | | | | |
Net assets, end of period (000 omitted) | | $ | 318,999 | | | $ | 285,865 | | | $ | 336,676 | | | $ | 316,194 | | | $ | 361,691 | |
Ratio of expenses to average net assets5 | | | 1.03% | | | | 1.01% | | | | 0.99% | | | | 0.99% | | | | 1.00% | |
Ratio of expenses to average net assets prior to fees waived and expenses paid indirectly5 | | | 1.03% | | | | 1.03% | | | | 1.04% | | | | 1.04% | | | | 1.05% | |
Ratio of net investment income (loss) to average net assets | | | (0.17% | ) | | | (0.20% | ) | | | (0.20% | ) | | | (0.03% | ) | | | 0.31% | |
Ratio of net investment income (loss) to average net assets prior to fees waived and expenses paid indirectly | | | (0.17% | ) | | | (0.22% | ) | | | (0.25% | ) | | | (0.08% | ) | | | 0.26% | |
Portfolio turnover | | | 33% | | | | 40% | | | | 25% | | | | 22% | | | | 39% | |
| 1 | The average shares outstanding method has been applied for per share information. |
| 2 | Amount is less than $0.005 per share. |
| 3 | Total return is based on the change in net asset value of a share during the period and assumes reinvestment of dividends and distributions at net asset value. Total return does not include fees, charges, or expenses imposed by the variable annuity and life insurance contracts for which Delaware VIP Trust serves as an underlying investment vehicle. |
| 4 | Total return during the period reflects a waiver by the manager and/or distributor. Performance would have been lower had the waiver not been in effect. |
| 5 | Expense ratios do not include expenses of the Underlying Funds in which the Series invests. |
See accompanying notes, which are an integral part of the financial statements.
U.S. Growth Series-11
Delaware VIP® Trust — Delaware VIP U.S. Growth Series
Notes to financial statements
December 31, 2019
Delaware VIP Trust (Trust) is organized as a Delaware statutory trust and offers 22 series, each of which is treated as a separate entity for certain matters under the Investment Company Act of 1940, as amended (1940 Act). These financial statements and the related notes pertain to Delaware VIP U.S. Growth Series (Series). The Trust is anopen-end investment company. The Series is considered diversified under the 1940 Act and offers Standard Class and Service Class shares. The Standard Class shares do not carry a distribution and service(12b-1) fee and the Service Class shares carry a12b-1 fee. The shares of the Series are sold only to separate accounts of life insurance companies.
1. Significant Accounting Policies
The Series follows accounting and reporting guidance under Financial Accounting Standards Board (FASB) Accounting Standards Codification Topic 946, Financial Services - Investment Companies. The following accounting policies are in accordance with US generally accepted accounting principles (US GAAP) and are consistently followed by the Series.
Security Valuation— Equity securities, except those traded on the Nasdaq Stock Market LLC (Nasdaq) are valued at the last quoted sales price as of the time of the regular close of the New York Stock Exchange on the valuation date. Equity securities traded on the Nasdaq are valued in accordance with the Nasdaq Official Closing Price, which may not be the last sales price. If, on a particular day, an equity security does not trade, the mean between the bid and ask prices will be used, which approximates fair value. US government and agency securities are valued at the mean between the bid and ask prices, which approximates fair value.Open-end investment companies are valued at their published net asset value (NAV). Investments in repurchase agreements are generally value at par, which approximates fair value, each business day. Generally, other securities and assets for which market quotations are not readily available are valued at fair value as determined in good faith under the direction of the Trust’s Board of Trustees (Board). In determining whether market quotations are readily available or fair valuation will be used, various factors will be taken into consideration, such as market closures or suspension of trading in a security. The Series may use fair value pricing more frequently for securities traded primarily innon-US markets because, among other things, most foreign markets close well before the Series values its securities, generally as of 4:00pm Eastern time. The earlier close of these foreign markets gives rise to the possibility that significant events, including broad market moves, government actions or pronouncements, aftermarket trading, or news events may have occurred in the interim. Whenever such a significant event occurs, the Series may value foreign securities using fair value prices based on third-party vendor modeling tools (international fair value pricing). Restricted securities are valued at fair value using methods approved by the Board.
Federal Income Taxes — No provision for federal income taxes has been made as the Series intends to continue to qualify for federal income tax purposes as a regulated investment company under Subchapter M of the Internal Revenue Code of 1986, as amended, and make the requisite distributions to shareholders. The Series evaluates tax positions taken or expected to be taken in the course of preparing the Series’ tax returns to determine whether the tax positions are“more-likely-than-not” of being sustained by the applicable tax authority. Tax positions not deemed to meet the“more-likely-than-not” threshold are recorded as a tax benefit or expense in the current year. Management has analyzed the Series’ tax positions taken or expected to be taken on the Series’ federal income tax returns through the year ended Dec. 31, 2019 and for all open tax years (years ended Dec. 31, 2016–Dec. 31, 2018), and has concluded that no provision for federal income tax is required in the Series’ financial statements. If applicable, the Series recognizes interest accrued on unrecognized tax benefits in interest expense and penalties in “Other expenses” on the “Statement of operations.” During the year ended Dec. 31, 2019, the Series did not incur any interest or tax penalties.
Class Accounting — Investment income, common expenses, and realized and unrealized gain (loss) on investments are allocated to the classes of the Series on the basis of daily net assets of each class. Distribution expenses relating to a specific class are charged directly to that class.
Repurchase Agreements — The Series may purchase certain US government securities subject to the counterparty’s agreement to repurchase them at an agreed upon date and price. The counterparty will be required on a daily basis to maintain the value of the collateral subject to the agreement at not less than the repurchase price (including accrued interest). The agreements are conditioned upon the collateral being deposited under the Federal Reserve book-entry system with the Series’ custodian or a third-partysub-custodian. In the event of default or bankruptcy by the other party to the agreement, retention of the collateral may be subject to legal proceedings. At Dec. 31, 2019, the Series had no open repurchase agreements.
Use of Estimates — The preparation of financial statements in conformity with US GAAP requires management to make estimates and assumptions that affect the fair value of investments, the reported amounts of assets and liabilities and disclosure of contingent assets and liabilities at the date of the financial statements, and the reported amounts of revenues and expenses during the reporting period. Actual results could differ from those estimates and the differences could be material.
Other— Expenses directly attributable to the Series are charged directly to the Series. Other expenses common to various funds within the Delaware Funds® by Macquarie (Delaware Funds) are generally allocated among such funds on the basis of average net assets. Management fees and certain other expenses are paid monthly. Security transactions are recorded on the date the securities are purchased or sold (trade date) for financial reporting purposes. Costs used in calculating realized gains and losses on the sale of investment securities are those of the specific securities sold. Dividend income is recorded on theex-dividend date and interest income is recorded on the accrual basis. Foreign dividends are also recorded on theex-dividend date or as soon after theex-dividend date that the Series is aware of such dividends, net of all tax withholdings, a portion of which may be
U.S. Growth Series-12
Delaware VIP® U.S. Growth Series
Notes to financial statements (continued)
reclaimable. Withholding taxes and reclaims on foreign dividends have been recorded in accordance with the Series’ understanding of the applicable country’s tax rules and rates. The Series declares and pays dividends from net investment income and distributions from net realized gain on investments, if any, following the close of the fiscal year. The Series may distribute more frequently, if necessary for tax purposes. Dividends and distributions, if any, are recorded on theex-dividend date.
The Series receives earnings credits from its custodian when positive cash balances are maintained, which may be used to offset custody fees. The expenses paid under this arrangement are included on the “Statement of operations” under “Custodian fees” with the corresponding expenses offset included under “Less expenses paid indirectly.” For the year ended Dec. 31, 2019, the Series earned $657 under this arrangement.
The Series receives earnings credits from its transfer agent when positive cash balances are maintained, which may be used to offset transfer agent fees. If the amount earned is greater than $1, the expenses paid under this arrangement are included on the “Statement of operations” under “Dividend disbursing and transfer agent fees and expenses” with the corresponding expenses offset included under “Less expenses paid indirectly.” For the year ended Dec. 31, 2019, the Series earned $1 under this agreement.
2. Investment Management, Administration Agreements, and Other Transactions with Affiliates
In accordance with the terms of its investment management agreement, the Series pays Delaware Management Company (DMC), a series of Macquarie Investment Management Business Trust and the investment manager, an annual fee which is calculated daily and paid monthly at the rates of 0.65% on the first $500 million of average daily net assets of the Series, 0.60% on the next $500 million, 0.55% on the next $1.5 billion, and 0.50% on average daily net assets in excess of $2.5 billion.
Jackson Square Partners, LLC (JSP), a related party of DMC, furnishes investmentsub-advisory services to the Series. For these services, DMC, not the Series, pays JSP fees based on the aggregate average daily net assets of the Series at the following annual rate: 0.39% of the first $500 million; 0.36% of the next $500 million; 0.33% of the next $1.5 billion; and 0.30% of aggregate average daily net assets in excess of $2.5 billion.
Delaware Investments Fund Services Company (DIFSC), an affiliate of DMC, provides fund accounting and financial administration oversight services to the Series. For these services, DIFSC’s fees were calculated daily and paid monthly based on the aggregate daily net assets of all funds within the Delaware Funds at the following annual rates: 0.00475% of the first $35 billion; 0.0040% of the next $10 billion; and 0.0025% of aggregate average daily net assets in excess of $45 billion (Total Fee). Each fund in the Delaware Funds pays a minimum of $4,000, which, in aggregate, is subtracted from the Total Fee. Each fund then pays its portion of the remainder of the Total Fee on a relative NAV basis. This amount is included on the “Statement of operations” under “Accounting and administration expenses.” For the year ended Dec. 31, 2019, the Series was charged $17,301 for these services.
DIFSC is also the transfer agent and dividend disbursing agent of the Series. For these services, DIFSC’s fees are calculated daily and paid monthly at the annual rate of 0.0075% of the Series average daily net assets. This amount is included on the “Statement of operations” under “Dividend disbursing and transfer agent fees and expenses.” For the year ended Dec. 31, 2019, the Series was charged $27,226 for these services. Pursuant to asub-transfer agency agreement between DIFSC and BNY Mellon Investment Servicing (US) Inc. (BNYMIS), BNYMIS provides certainsub-transfer agency services to the Series.Sub-transfer agency fees are paid by the Series and are also included on the “Statement of operations” under “Dividend disbursing and transfer agent fees and expenses.” The fees that are calculated daily and paid as invoices are received on a monthly or quarterly basis.
Pursuant to a distribution agreement and distribution plan, the Series pays Delaware Distributors, L.P. (DDLP), the distributor and an affiliate of DMC, an annual12b-1 fee of 0.30% of the average daily net assets of the Service Class shares. The fees are calculated daily and paid monthly. Standard Class shares do not pay12b-1 fees.
As provided in the investment management agreement, the Series bears a portion of the cost of certain resources shared with DMC, including the cost of internal personnel of DMC and/or its affiliates that provide legal, tax, and regulatory reporting services to the Series. For the year ended Dec. 31, 2019 the Series was charged $10,145 for internal legal, tax, and regulatory reporting services provided by DMC and/or its affiliates’ employees. This amount is included on the “Statement of operations” under “Legal fees.”
Trustees’ fees include expenses accrued by the Series for each Trustee’s retainer and meeting fees. Certain officers of DMC, DIFSC, and DDLP are officers and/or Trustees of the Trust. These officers and Trustees are paid no compensation by the Series.
In addition to the management fees and other expenses of the Series, the Series indirectly bears the investment management fees and other expenses of the investment companies (Underlying Funds) in which it invests. The amount of these fees and expenses incurred indirectly by the Series will vary based upon the expense and fee levels of the Underlying Funds and the number of shares that are owned of the Underlying Funds at different times.
U.S. Growth Series-13
Delaware VIP® U.S. Growth Series
Notes to financial statements (continued)
3. Investments
For the year ended Dec. 31, 2019, the Series made purchases and sales of investment securities other than short-term investments as follows:
| | | | |
Purchases | | $ | 120,110,841 | |
Sales | | | 168,526,204 | |
The tax cost of investments includes adjustments to net unrealized appreciation (depreciation) which may not necessarily be final tax cost basis adjustments, but approximate the tax basis unrealized gains and losses that may be realized and distributed to shareholders. At Dec. 31, 2019, the cost and unrealized appreciation (depreciation) of investments for federal income tax purposes for the Series were as follows:
| | | | | | |
| | | Aggregate
Unrealized | | Aggregate
Unrealized | | Net Unrealized |
| Cost of | | Appreciation | | Depreciation | | Appreciation |
| Investments | | of Investments | | of Investments | | of Investments |
| $263,436,514 | | $110,969,409 | | $(1,782,921) | | $109,186,488 |
US GAAP defines fair value as the price that the Series would receive to sell an asset or pay to transfer a liability in an orderly transaction between market participants at the measurement date under current market conditions. A three-level hierarchy for fair value measurements has been established based upon the transparency of inputs to the valuation of an asset or liability. Inputs may be observable or unobservable and refer broadly to the assumptions that market participants would use in pricing the asset or liability. Observable inputs reflect the assumptions market participants would use in pricing the asset or liability based on market data obtained from sources independent of the reporting entity. Unobservable inputs reflect the reporting entity’s own assumptions about the assumptions that market participants would use in pricing the asset or liability based on the best information available under the circumstances. The Series’ investment in its entirety is assigned a level based upon the observability of the inputs which are significant to the overall valuation. The three-level hierarchy of inputs is summarized below.
| | | | |
| Level 1 | | – | | Inputs are quoted prices in active markets for identical investments. (Examples: equity securities,open-end investment companies, futures contracts, and exchange-traded options contracts) |
| Level 2 | | – | | Other observable inputs, including, but not limited to: quoted prices for similar assets or liabilities in markets that are active, quoted prices for identical or similar assets or liabilities in markets that are not active, inputs other than quoted prices that are observable for the assets or liabilities (such as interest rates, yield curves, volatilities, prepayment speeds, loss severities, credit risks, and default rates) or other market-corroborated inputs. (Examples: debt securities, government securities, swap contracts, foreign currency exchange contracts, foreign securities utilizing international fair value pricing, broker-quoted securities, and fair valued securities) |
| Level 3 | | – | | Significant unobservable inputs, including the Series’ own assumptions used to determine the fair value of investment. (Examples: broker-quoted securities and fair valued securities) |
Level 3 investments are valued using significant unobservable inputs. The Series may also use an income-based valuation approach in which the anticipated future cash flows of the investment are discounted to calculate fair value. Discounts may also be applied due to the nature or duration of any restrictions on the disposition of the investments. Valuations may also be based upon current market prices of securities that are comparable in coupon, rating, maturity, and industry. The derived value of a Level 3 investment may not represent the value which is received upon disposition and this could impact the results of operations.
The following table summarizes the valuation of the Series’ investments by fair value hierarchy levels as of Dec. 31, 2019:
| | | | |
| Securities | | Level 1 | |
Assets: | | | | |
Common Stock | | $ | 356,268,972 | |
Short-Term Investments | | | 16,354,030 | |
| | | | |
Total Value of Securities | | $ | 372,623,002 | |
| | | | |
During the year ended Dec. 31, 2019, there were no transfers between Level 1 investments, Level 2 investments, or Level 3 investments that had a significant impact to the Series. The Series’ policy is to recognize transfers between levels based on fair value at the beginning of the reporting period.
A reconciliation of Level 3 investments is presented when the Series has a significant amount of Level 3 investments at the beginning, interim, or end of the year in relation to the Series’ net assets. During the year ended Dec. 31, 2019, there were no Level 3 investments.
U.S. Growth Series-14
Delaware VIP® U.S. Growth Series
Notes to financial statements (continued)
4. Dividend and Distribution Information
Income and long-term capital gain distributions are determined in accordance with federal income tax regulations, which may differ from US GAAP. Additionally, distributions from net gains on foreign currency transactions and net short-term gains on sales of investment securities are treated as ordinary income for federal income tax purposes. The tax character of dividends and distributions paid during the years ended Dec. 31, 2019 and 2018 was as follows:
| | | | | | | | |
| | | Year ended | |
| | | 12/31/19 | | | 12/31/18 | |
Ordinary income | | $ | 2,207,101 | | | $ | 2,738,625 | |
Long-term capital gain | | | 61,215,747 | | | | 46,226,672 | |
| | | | | | | | |
Total | | $ | 63,422,848 | | | $ | 48,965,297 | |
| | | | | | | | |
5. Components of Net Assets on a Tax Basis
As of Dec. 31, 2019, the components of net assets on a tax basis were as follows:
| | | | |
Shares of beneficial interest | | $ | 242,414,149 | |
Undistributed long-term capital gains | | | 20,720,489 | |
Unrealized appreciation on investments | | | 109,186,488 | |
| | | | |
Net assets | | $ | 372,321,126 | |
| | | | |
The differences between book basis and tax basis components of net assets are primarily attributable to tax deferral of losses on wash sales.
For financial reporting purposes, capital accounts are adjusted to reflect the tax character of permanent book/tax differences. Reclassifications are primarily due to net operating loss. Results of operations and net assets were not affected by these classifications. For the year ended Dec. 31, 2019, the Series recorded the following reclassifications:
| | | | | | | | |
Paid-in
Capital | | | Total Distributable Earnings (Loss) | | | |
| $ | (296,647 | ) | | $ | 296,647 | |
6. Capital Shares
Transactions in capital shares were as follows:
| | | | | | | | |
| | | Year ended | |
| | | 12/31/19 | | | 12/31/18 | |
Shares sold: | | | | | | | | |
Standard Class | | | 639,633 | | | | 382,239 | |
Service Class | | | 295,305 | | | | 595,706 | |
| | |
Shares issued upon reinvestment of dividends and distributions: | | | | | | | | |
Standard Class | | | 945,299 | | | | 609,424 | |
Service Class | | | 6,219,949 | | | | 4,361,441 | |
| | | | | | | | |
| | | 8,100,186 | | | | 5,948,810 | |
| | | | | | | | |
| | |
Shares redeemed: | | | | | | | | |
Standard Class | | | (868,468 | ) | | | (601,660 | ) |
Service Class | | | (4,564,819 | ) | | | (4,626,671 | ) |
| | | | | | | | |
| | | (5,433,287 | ) | | | (5,228,331 | ) |
| | | | | | | | |
Net increase | | | 2,666,899 | | | | 720,479 | |
| | | | | | | | |
7. Line of Credit
The Series, along with certain other funds in the Delaware Funds (Participants), was a participant in a $220,000,000 revolving line of credit intended to be used for temporary or emergency purposes as an additional source of liquidity to fund redemptions of investor shares. Under the agreement, the Participants were charged an annual commitment fee of 0.15%, which was allocated across the Participants based on a weighted average of the respective
U.S. Growth Series-15
Delaware VIP® U.S. Growth Series
Notes to financial statements (continued)
7. Line of Credit (continued)
net assets of each Participant. The Participants were permitted to borrow up to a maximum ofone-third of their net assets under the agreement. Each Participant was individually, and not jointly, liable for its particular advances, if any, under the line of credit. The line of credit available under the agreement expired on Nov. 4, 2019.
On Nov. 4, 2019, the Participants entered into an amendment to the agreement for a $250,000,000 revolving line of credit. The revolving line of credit is to be used as described above and operates in substantially the same manner as the original agreement. The line of credit available under the agreement expires on Nov. 2, 2020.
The Series had no amounts outstanding as of Dec. 31, 2019, or at any time during the year then ended.
8. Securities Lending
The Series, along with other funds in the Delaware Funds, may lend its securities pursuant to a security lending agreement (Lending Agreement) with The Bank of New York Mellon (BNY Mellon). At the time a security is loaned, the borrower must post collateral equal to the required percentage of the market value of the loaned security, including any accrued interest. The required percentage is: (1) 102% with respect to US securities and foreign securities that are denominated and payable in US dollars; and (2) 105% with respect to foreign securities. With respect to each loan, if on any business day, the aggregate market value of securities collateral plus cash collateral held is less than the aggregate market value of the securities which are the subject of such loan, the borrower will be notified to provide additional collateral by the end of the following business day, which, together with the collateral already held, will be not less than the applicable initial collateral requirements for such security loan. If the aggregate market value of securities collateral and cash collateral held with respect to a security loan exceeds the applicable initial collateral requirement, upon the request of the borrower, BNY Mellon must return enough collateral to the borrower by the end of the following business day to reduce the value of the remaining collateral to the applicable initial collateral requirement for such security loan. As a result of the foregoing, the value of the collateral held with respect to a loaned security on any particular day may be more or less than the value of the security on loan. The collateral percentage with respect to the market value of the loaned security is determined by the security lending agent.
Cash collateral received by each series of the Trust is generally invested in a series of individual separate accounts, each corresponding to a series. The investment guidelines permit each separate account to hold certain securities that would be considered eligible securities for a money market fund. Cash collateral received is generally invested in government securities; certain obligations issued by government sponsored enterprises; repurchase agreements collateralized by US Treasury securities; obligations issued by the central government of any Organization for Economic Cooperation and Development (OECD) country or its agencies, instrumentalities, or establishments; obligations of supranational organizations; commercial paper, notes, bonds, and other debt obligations; certificates of deposit, time deposits, and other bank obligations; and asset-backed securities. The Series can also accept US government securities and letters of credit(non-cash collateral) in connection with securities loans.
In the event of default or bankruptcy by the lending agent, realization and/or retention of the collateral may be subject to legal proceedings. In the event the borrower fails to return loaned securities and the collateral received is insufficient to cover the value of the loaned securities and provided such collateral shortfall is not the result of investment losses, the lending agent has agreed to pay the amount of the shortfall to the Series or, at the discretion of the lending agent, replace the loaned securities. The Series continues to record dividends or interest, as applicable, on the securities loaned and is subject to changes in value of the securities loaned that may occur during the term of the loan. The Series has the right under the Lending Agreement to recover the securities from the borrower on demand. With respect to security loans collateralized bynon-cash collateral, the Series receives loan premiums paid by the borrower. With respect to security loans collateralized by cash collateral, the earnings from the collateral investments are shared among the Series, the security lending agent, and the borrower. The Series records security lending income net of allocations to the security lending agent and the borrower.
The Series may incur investment losses as a result of investing securities lending collateral. This could occur if an investment in the collateral investment account defaulted or became impaired. Under those circumstances, the value of the Series’ cash collateral account may be less than the amount the Series would be required to return to the borrowers of the securities and the Series would be required to make up for this shortfall.
During the year ended Dec. 31, 2019, the Series had no securities out on loan.
9. Credit and Market Risk
The Series invests in growth stocks (such as those in the financial services sector), which reflect projections of future earnings and revenue. These prices may rise or fall dramatically depending on whether those projections are met. These companies’ stock prices may be more volatile, particularly over the short term.
The Series may invest up to 15% of its net assets in illiquid securities, which may include securities with contractual restrictions on resale, securities exempt from registration under Rule 144A, promulgated under the Securities Act of 1933, as amended, and other securities which may not be readily
U.S. Growth Series-16
Delaware VIP® U.S. Growth Series
Notes to financial statements (continued)
marketable. The relative illiquidity of these securities may impair the Series from disposing of them in a timely manner and at a fair price when it is necessary or desirable to do so. While maintaining oversight, the Board has delegated to DMC, theday-to-day functions of determining whether individual securities are liquid for purposes of the Series’ limitation on investments in illiquid securities. Securities eligible for resale pursuant to Rule 144A, which are determined to be liquid, are not subject to the Series’ 15% limit on investments in illiquid securities. As of Dec. 31, 2019, there were no Rule 144A securities held by the Series.
10. Contractual Obligations
The Series enters into contracts in the normal course of business that contain a variety of indemnifications. The Series’ maximum exposure under these arrangements is unknown. However, the Series has not had prior claims or losses pursuant to these contracts. Management has reviewed the Series’ existing contracts and expects the risk of loss to be remote.
11. Recent Accounting Pronouncements
In August 2018, the FASB issued an Accounting Standards Update (ASU), ASU2018-13, which changes certain fair value measurement disclosure requirements. The ASU2018-13, in addition to other modifications and additions, removes the requirement to disclose the amount and reasons for transfers between Level 1 and Level 2 of the fair value hierarchy, the policy for the timing of transfers between levels and the valuation process for Level 3 fair value measurements. The ASU2018-13 is effective for fiscal years, and interim periods within those fiscal years, beginning after Dec. 15, 2019. At this time, management is evaluating the implications of these changes on the financial statements.
12. Subsequent Events
Management has determined that no material events or transactions occurred subsequent to Dec. 31, 2019, that would require recognition or disclosure in the Series’ financial statements.
U.S. Growth Series-17
Delaware VIP® Trust — Delaware VIP U.S. Growth Series
Report of independent registered public accounting firm
To the Board of Trustees of Delaware VIP® Trust and Shareholders of Delaware VIP U.S. Growth Series
Opinion on the Financial Statements
We have audited the accompanying statement of assets and liabilities, including the schedule of investments, of Delaware VIP U.S. Growth Series (one of the series constituting Delaware VIP® Trust, referred to hereafter as the “Series”) as of December 31, 2019, the related statement of operations for the year ended December 31, 2019, the statements of changes in net assets for each of the two years in the period ended December 31, 2019, including the related notes, and the financial highlights for each of the five years in the period ended December 31, 2019 (collectively referred to as the “financial statements”). In our opinion, the financial statements present fairly, in all material respects, the financial position of the Series as of December 31, 2019, the results of its operations for the year then ended, the changes in its net assets for each of the two years in the period ended December 31, 2019 and the financial highlights for each of the five years in the period ended December 31, 2019 in conformity with accounting principles generally accepted in the United States of America.
Basis for Opinion
These financial statements are the responsibility of the Series’ management. Our responsibility is to express an opinion on the Series’ financial statements based on our audits. We are a public accounting firm registered with the Public Company Accounting Oversight Board (United States) (PCAOB) and are required to be independent with respect to the Series in accordance with the U.S. federal securities laws and the applicable rules and regulations of the Securities and Exchange Commission and the PCAOB.
We conducted our audits of these financial statements in accordance with the standards of the PCAOB. Those standards require that we plan and perform the audit to obtain reasonable assurance about whether the financial statements are free of material misstatement, whether due to error or fraud.
Our audits included performing procedures to assess the risks of material misstatement of the financial statements, whether due to error or fraud, and performing procedures that respond to those risks. Such procedures included examining, on a test basis, evidence regarding the amounts and disclosures in the financial statements. Our audits also included evaluating the accounting principles used and significant estimates made by management, as well as evaluating the overall presentation of the financial statements. Our procedures included confirmation of securities owned as of December 31, 2019 by correspondence with the custodian and transfer agents. We believe that our audits provide a reasonable basis for our opinion.
/s/PricewaterhouseCoopers LLP
Philadelphia, Pennsylvania
February 21, 2020
We have served as the auditor of one or more investment companies in Delaware Funds® by Macquarie since 2010.
U.S. Growth Series-18
Delaware VIP® Trust — Delaware U.S. Growth Series
Other Series information (Unaudited)
Board consideration of Investment Advisory andSub-Advisory Agreements for Delaware VIP U.S. Growth Series at a meeting held August21-22, 2019
At a meeting held on Aug.21-22, 2019 (the “Annual Meeting”), the Board of Trustees (the “Board”), including a majority of disinterested or independent Trustees, approved the renewal of the investment advisory andsub-advisory agreements for Delaware VIP U.S. Growth Series (the “Series”). In making its decision, the Board considered information furnished at regular quarterly Board meetings, including reports detailing Series performance, investment strategies and expenses, as well as information prepared specifically in connection with the renewal of the investment advisory andsub-advisory contracts. Information furnished specifically in connection with the renewal of the Investment Management Agreement with Delaware Management Company (“DMC”), a series of Macquarie Investment Management Business Trust (“MIMBT”) and theSub-Advisory Agreements with Jackson Square Partners (“JSP”), Macquarie Funds Management Hong Kong Limited (“MFMHK”) and Macquarie Investment Management Global Limited (“MIMGL”), included materials provided by DMC and its affiliates (collectively, “Macquarie Investment Management”), JSP, MFMHK, and MIMGL, concerning, among other things, the nature, extent, and quality of services provided to the Series; the costs of such services to the Series; economies of scale; and the investment manager’s financial condition and profitability. In addition, in connection with the Annual Meeting, materials were provided to the Trustees in May 2019, including reports provided by Broadridge Financial Solutions (“Broadridge”). The Broadridge reports compared the Series’ investment performance and expenses with those of other comparable mutual funds. The Independent Trustees reviewed and discussed the Broadridge reports with independent legal counsel to the Independent Trustees. In addition to the information noted above, the Board also requested and received information regarding DMC’s policy with respect to advisory fee levels and its breakpoint philosophy; the structure of portfolio manager compensation; comparative client fee information; and any constraints or limitations on the availability of securities for certain investment styles, which had in the past year inhibited, or which were likely in the future to inhibit, the investment manager’s ability to invest fully in accordance with Series policies.
In considering information relating to the approval of the Series’ investment advisory andsub-advisory agreements, the Independent Trustees received assistance and advice from and met separately with independent legal counsel to the Independent Trustees and also received assistance and advice from an experienced and knowledgeable independent fund consultant, JDL Consultants, LLC (“JDL”). Although the Board gave attention to all information furnished, the following discussion identifies, under separate headings, the primary factors taken into account by the Board during its contract renewal considerations.
Nature, extent, and quality of services.The Board considered the services provided by DMC to the Series and its shareholders. In reviewing the nature, extent, and quality of services, the Board considered reports furnished to it throughout the year, which covered matters such as the relative performance of the Series; compliance of portfolio managers with the investment policies, strategies, and restrictions for the Series; compliance by DMC and Delaware Distributors, L.P. (together, “Management”) personnel with the Code of Ethics adopted throughout the Delaware Funds® by Macquarie (the “Delaware Funds”); and adherence to fair value pricing procedures as established by the Board. The Board was pleased with the current staffing of DMC and the emphasis placed on research in the investment process. The Board recognized DMC’s receipt of certain favorable industry distinctions during the past several years. The Board gave favorable consideration to DMC’s efforts to control expenses while maintaining service levels committed to Series matters. The Board was satisfied with the nature, extent, and quality of the overall services provided by DMC.
Nature, extent, and quality of services.The Board considered the services provided by JSP to the Series and its shareholders. In reviewing the nature, extent, and quality of services, the Board considered reports furnished to it throughout the year at regular Board Meetings covering matters such as relative performance of the Series; compliance of portfolio managers with the investment policies, strategies, and restrictions for the Series; the compliance of JSP personnel with its Code of Ethics; and adherence to fair value pricing procedures as established by the Board. The Board was pleased with the current staffing of JSP and the emphasis placed on research in the investment process. The Board was satisfied with the nature, extent, and quality of the overall services provided by JSP.
Nature, extent, and quality of services.The Board considered the services provided by MFMHK to the Series and its shareholders. In reviewing the nature, extent, and quality of services, the Board considered reports furnished to it throughout the year at regular Board Meetings covering matters such as relative performance of the Series; compliance of portfolio managers with the investment policies, strategies, and restrictions for the Series; the compliance of MFMHK personnel with its Code of Ethics; and adherence to fair value pricing procedures as established by the Board. The Board was pleased with the current staffing of MFMHK and the emphasis placed on research in the investment process. The Board was satisfied with the nature, extent, and quality of the overall services provided by MFMHK.
Nature, extent, and quality of services.The Board considered the services provided by MIMGL to the Series and its shareholders. In reviewing the nature, extent, and quality of services, the Board considered reports furnished to it throughout the year at regular Board Meetings covering matters such as relative performance of the Series; compliance of portfolio managers with the investment policies, strategies, and restrictions for the Series; the compliance of MIMGL personnel with its Code of Ethics; and adherence to fair value pricing procedures as established by the Board. The Board was pleased with the current staffing of MIMGL and the emphasis placed on research in the investment process. The Board was satisfied with the nature, extent, and quality of the overall services provided by MIMGL.
U.S. Growth Series-19
Delaware VIP® Trust — Delaware U.S. Growth Series
Other Series information (Unaudited)
Board consideration of Investment Advisory andSub-Advisory Agreements for Delaware VIP U.S. Growth Series at a meeting held August21-22, 2019 (continued)
Investment performance.The Board placed significant emphasis on the investment performance of the Series in view of the importance of investment performance to shareholders. Although the Board considered performance reports and discussions with portfolio managers at Board meetings throughout the year, the Board gave particular weight to the Broadridge reports furnished for the Annual Meeting. The Broadridge reports prepared for the Series showed the investment performance of its Standard Class shares in comparison to a group of similar funds as selected by Broadridge (the “Performance Universe”). A fund with the best performance ranked first, and a fund with the poorest performance ranked last. The highest/best performing 25% of funds in the Performance Universe make up the first quartile; the next 25%, the second quartile; the next 25%, the third quartile; and the poorest/worst performing 25% of funds in the Performance Universe make up the fourth quartile. Comparative annualized performance for the Series was shown for the past1-,3-,5-, and10-year periods, as applicable, ended Jan. 31, 2019. The Board’s objective is that the Series’ performance for the1-,3-, and5-year periods be at or above the median of its Performance Universe.
The Performance Universe for the Series consisted of the Series and alllarge-cap growth funds underlying variable insurance products as selected by Broadridge. The Broadridge report comparison showed that the Series’ total return for the1-,3-, and5-year periods was in the fourth quartile of its Performance Universe. The report further showed that the Series’ total return for the10-year period was in the third quartile of its Performance Universe. The Board observed that the Series’ performance was not in line with the Board’s objective. In evaluating the Series’ performance, the Board considered the numerous investment and performance reports delivered by Management personnel to the Board’s Investments Committee. The Board was satisfied that Management was taking action to improve Series performance and to meet the Board’s performance objective.
Comparative expenses.The Board considered expense data for the Delaware Funds. Management provided the Board with information on pricing levels and fee structures for the Series as of its most recently completed fiscal year. The Board also focused on the comparative analysis of effective management fees and total expense ratios of the Series versus effective management fees and expense ratios of a group of similar funds as selected by Broadridge (the “Expense Group”). In reviewing comparative costs, the Series’ contractual management fee and the actual management fee incurred by the Series were compared with the contractual management fees (assuming all funds in the Expense Group were similar in size to the Series) and actual management fees (as reported by each fund) within the Expense Group, taking into account any applicable breakpoints and fee waivers. The Series’ total expenses were also compared with those of its Expense Group. The Broadridge total expenses, for comparative consistency, were shown by Broadridge for Standard Class shares which do not charge12b-1 andnon-12b-1 service fees. The Board’s objective is for each Series’ total expense ratio to be competitive with those of the peer funds within its Expense Group.
The expense comparisons for the Series showed that the actual management fee was in the quartile with the second lowest expenses of its Expense Group and its total expenses were in the quartile with the lowest expenses of its Expense Group. The Board was satisfied with the management fee and total expenses of the Series in comparison to those of its Expense Group.
Management profitability.The Board considered the level of profits realized by DMC in connection with the operation of the Series. In this respect, the Board reviewed the Investment Management Profitability Analysis that addressed the overall profitability of DMC’s business in providing management and other services to each of the individual funds and the Delaware Funds as a whole. Specific attention was given to the methodology used by DMC in allocating costs for the purpose of determining profitability. Management stated that the level of profits of DMC, to a certain extent, reflects recent operational cost savings and efficiencies initiated by DMC. The Board considered DMC’s efforts to improve services provided to fund shareholders and to meet additional regulatory and compliance requirements resulting from recent industry-wide Securities and Exchange Commission initiatives. The Board also considered the extent to which DMC might derive ancillary benefits from fund operations, including the potential for procuring additional business as a result of the prestige and visibility associated with its role as service provider to the Delaware Funds and the benefits from allocation of fund brokerage to improve trading efficiencies. As part of its work, the Board also reviewed a report prepared by JDL regarding MIMBT profitability as compared to certain peer fund complexes and the Independent Trustees discussed with JDL personnel regarding DMC’s profitability in such context. The Board found that the management fees were reasonable in light of the services rendered and the profitability of DMC.
Management profitability.Trustees were also given available information on profits being realized by JSP in relation to the services being provided to the Fund and in relation to JSP’s overall investment advisory business, but believed such information to be of limited relevance because thesub-advisory fees are paid by DMC out of its management fee, and changes in the level ofsub-advisory fees have no impact on Fund expenses. The Board was also provided information on potentialfall-out benefits derived or to be derived by JSP in connection with its relationship to the Fund, such as reputational enhancement, soft dollar arrangements, or commissions paid to affiliated broker/dealers, as applicable.
Economies of scale.The Trustees considered whether economies of scale are realized by DMC as the Series’ assets increase and the extent to which any economies of scale are reflected in the level of management fees charged. The Trustees reviewed the Series’ advisory fee pricing and structure approved by the Board and shareholders, which includes breakpoints, and which applies to most funds in the Delaware Funds complex. Breakpoints in the advisory
U.S. Growth Series-20
Delaware VIP® Trust — Delaware U.S. Growth Series
Other Series information (Unaudited)
Board consideration of Investment Advisory andSub-Advisory Agreements for Delaware VIP U.S. Growth Series at a meeting held August21-22, 2019 (continued)
fee occur when the advisory fee rate is reduced on assets in excess of specified levels. Breakpoints result in a lower advisory fee, than would otherwise be the case in the absence of breakpoints, when the asset levels specified in the breakpoints are exceeded. Although, as of March 31, 2019, the Series had not reached a size at which it could take advantage of any breakpoints in the applicable fee schedule, the Board recognized that the fee was structured so that, if the Series increases sufficiently in size, then economies of scale may be shared.
Tax Information
All disclosures are based on financial information available as of the date of this annual report and, accordingly are subject to change. For any and all items requiring reporting, it is the intention of the Series to report the maximum amount permitted under the Internal Revenue Code and the regulations thereunder.
For the year ended Dec. 31, 2019, the Series reports distributions paid during the year as follows:
| | | | | | |
(A)
Long-Term
Capital Gain
Distributions
(Tax Basis) | | (B)
Ordinary Income
Distributions
(Tax Basis) | | Total
Distributions
(Tax Basis) | | (C)
Qualifying
Dividends1
|
| 96.52% | | 3.48% | | 100.00% | | 100.00% |
(A) and (B) are based on a percentage of the Series’ total distributions.
(C) is based on a percentage of the Series’ ordinary income distributions.
1Qualifying dividends represent dividends which qualify for the corporate dividends received deduction.
U.S. Growth Series-21
Delaware Funds® by Macquarie
Board of trustees / directors and officers addendum
A mutual fund is governed by a Board of Trustees/Directors (“Trustees”), which has oversight responsibility for the management of a fund’s business affairs. Trustees establish procedures and oversee and review the performance of the investment manager, the distributor, and others who perform services for the fund. The independent fund trustees, in particular, are advocates for shareholder interests. Each trustee has served in that capacity since he or she was elected to or appointed to the Board of Trustees, and will continue to serve until his or her retirement or the election of a new trustee in his or her place. The following is a list of the Trustees and Officers with certain background and related information.
| | | | | | | | | | |
Name, Address, and Birth Date | | Position(s) Held with Fund(s) | | Length of Time
Served | | Principal
Occupation(s)
During the Past Five Years | | Number of Portfolios in Fund Complex Overseen
by Trustee or Officer | | Other
Directorships
Held by Trustee or Officer |
| INTERESTED TRUSTEE | | | | | | | | | | |
| | | | | |
Shawn K. Lytle1 2005 Market Street Philadelphia, PA 19103 February 1970 | | President, Chief Executive Officer, and Trustee | | President and Chief Executive Officer since August 2015 Trustee since September 2015 | | President — Macquarie Investment Management2(June 2015-Present) Regional Head of Americas — UBS Global Asset Management (April2010-May 2015) | | 95 | | Trustee — UBS Relationship Funds, SMA Relationship Trust, and UBS Funds (May 2010–April 2015) |
| INDEPENDENT TRUSTEES | | | | | | | | | | |
Thomas L. Bennett 2005 Market Street Philadelphia, PA 19103 October 1947 | | Chair and Trustee | | Trustee since March 2005 Chair since March 2015 | | Private Investor (March 2004–Present) | | 95 | | None |
Jerome D. Abernathy 2005 Market Street Philadelphia, PA 19103 July 1959 | | Trustee | | Since January 2019 | | Managing Member, Stonebrook Capital Management, LLC (financial technology: macro factors and databases) (January 1993–Present) | | 95 | | None |
Ann D. Borowiec 2005 Market Street Philadelphia, PA 19103 November 1958 | | Trustee | | Since March 2015 | | Chief Executive Officer, Private Wealth Management (2011–2013) and Market Manager, New Jersey Private Bank (2005–2011) — J.P. Morgan Chase & Co. | | 95 | | Director — Banco Santander International (October 2016–December 2019) Director — Santander Bank, N.A. (December 2016–December 2019) |
Joseph W. Chow 2005 Market Street Philadelphia, PA 19103 January 1953 | | Trustee | | Since January 2013 | | Private Investor (April 2011–Present) | | 95 | | Director and Audit Committee Member — Hercules Technology Growth Capital, Inc. (July 2004–July 2014) |
U.S. Growth Series-22
| | | | | | | | | | |
Name, Address, and Birth Date | | Position(s) Held with Fund(s) | | Length of Time
Served | | Principal
Occupation(s)
During the
Past Five Years | | Number of
Portfolios in Fund
Complex Overseen
by Trustee or Officer | | Other
Directorships
Held by Trustee or Officer |
John A. Fry 2005 Market Street Philadelphia, PA 19103 May 1960 | | Trustee | | Since January 2001 | | President — Drexel University (August 2010–Present) President — Franklin & Marshall College (July 2002–July 2010) | | 95 | | Director; Compensation Committee and Governance Committee Member — Community Health Systems (May 2004–Present) Director — Drexel Morgan & Co. (2015–Present) Director and Audit Committee Member — vTv Therapeutics LLC (2017–Present) Director and Audit Committee Member — FS Credit Real Estate Income Trust, Inc. (2018–Present) Director — Federal Reserve Bank of Philadelphia (January 2020–Present) |
Lucinda S. Landreth 2005 Market Street Philadelphia, PA 19103 June 1947 | | Trustee | | Since March 2005 | | Private Investor (2004–Present) | | 95 | | None |
Frances A. Sevilla-Sacasa 2005 Market Street Philadelphia, PA 19103 January 1956 | | Trustee | | Since September 2011 | | Private Investor(January 2017-Present) Chief Executive Officer — Banco Itaú International (April 2012–December 2016) Executive Advisor to Dean (August 2011–March 2012) and Interim Dean (January 2011–July 2011) — University of Miami School of Business Administration President — U.S. Trust, Bank of America Private Wealth Management (Private Banking) (July 2007–December 2008) | | 95 | | Trust Manager and Audit Committee Chair — Camden Property Trust (August 2011–Present) Director; Strategic Planning and Reserves Committee and Nominating and Governance Committee Member — Callon Petroleum Company (December 2019–Present) Director; Audit Committee Member — Carrizo Oil & Gas, Inc. (March 2018–December 2019) |
Thomas K. Whitford 2005 Market Street Philadelphia, PA 19103 March 1956 | | Trustee | | Since January 2013 | | Vice Chairman (2010–April 2013) — PNC Financial Services Group | | 95 | | Director — HSBC North America Holdings Inc. (December 2013-Present) Director — HSBC USA Inc. (July 2014-Present) Director — HSBC Bank USA, National Association (July 2014-March 2017) Director — HSBC Finance Corporation(December 2013-April 2018) |
U.S. Growth Series-23
| | | | | | | | | | |
Name, Address, and Birth Date | | Position(s) Held with Fund(s) | | Length of Time
Served | | Principal
Occupation(s)
During the Past Five Years | | Number of
Portfolios in Fund
Complex Overseen
by Trustee or Officer | | Other
Directorships
Held by Trustee or Officer |
Christianna Wood 2005 Market Street Philadelphia, PA 19103 March 1956 | | Trustee | | Since January 2019 | | Chief Executive Officer and President — Gore Creek Capital, Ltd. (August 2009–Present) | | 95 | | Director; Finance Committee and Audit Committee Member — H&R Block Corporation (July 2008–Present) Director; Chair of Investments Committee and Audit Committee Member — Grange Insurance (2013–Present) Trustee; Chair of Nominating and Governance Committee and Audit Committee Member — The Merger Fund (2013–Present), The Merger Fund VL (2013–Present); WCM Alternatives: Event-Driven Fund (2013–Present), and WCM Alternatives: Credit Event Fund (December 2017–Present) Director; Chair of Governance Committee and Audit Committee Member — International Securities Exchange (2010–2016) |
Janet L. Yeomans 2005 Market Street Philadelphia, PA 19103 July 1948 | | Trustee | | Since April 1999 | | Vice President and Treasurer (January 2006–July 2012), Vice President — Mergers & Acquisitions (January 2003–January 2006), and Vice President and Treasurer (July 1995–January 2003) — 3M Company | | 95 | | Director; Personnel and Compensation Committee Chair; Member of Nominating, Investments, and Audit Committees for various periods throughout directorship — Okabena Company (2009-2017) |
U.S. Growth Series-24
| | | | | | | | | | |
Name, Address, and Birth Date | | Position(s) Held with Fund(s) | | Length of Time
Served | | Principal
Occupation(s)
During the Past Five Years | | Number of
Portfolios in Fund
Complex Overseen
by Trustee
or Officer | | Other
Directorships
Held by Trustee
or Officer |
| OFFICERS | | | | | | | | | | |
| | | | | |
David F. Connor 2005 Market Street Philadelphia, PA 19103 December 1963 | | Senior Vice President, General Counsel, and Secretary | | Senior Vice President, since May 2013; General Counsel since May 2015; Secretary since October 2005 | | David F. Connor has served in various capacities at different times at Macquarie Investment Management. | | 95 | | None3 |
Daniel V. Geatens 2005 Market Street Philadelphia, PA 19103 October 1972 | | Vice President and Treasurer | | Vice President and Treasurer since October 2007 | | Daniel V. Geatens has served in various capacities at different times at Macquarie Investment Management. | | 95 | | None3 |
Richard Salus 2005 Market Street Philadelphia, PA 19103 October 1963 | | Senior Vice President and Chief Financial Officer | | Senior Vice President and Chief Financial Officer since November 2006 | | Richard Salus has served in various capacities at different times at Macquarie Investment Management. | | 95 | | None |
| 1 | Shawn K. Lytle is considered to be an “Interested Trustee” because he is an executive officer of the Fund’s(s’) investment advisor. |
| 2 | Macquarie Investment Management is the marketing name for Macquarie Management Holdings, Inc. and its subsidiaries, including the Fund’s(s’) investment advisor, principal underwriter, and its transfer agent. |
| 3 | David F. Connor and Daniel V. Geatens serve in similar capacities for the six portfolios of the Optimum Fund Trust, which have the same investment advisor, principal underwriter, and transfer agent as the registrant. Mr. Geatens also serves as the Chief Financial Officer of the Optimum Fund Trust and he is the Chief Financial Officer and Treasurer for Macquarie Global Infrastructure Total Return Fund Inc. |
The Statement of Additional Information for the Fund(s) includes additional information about the Trustees and Officers and is available, without charge, upon request by calling 800523-1918.
U.S. Growth Series-25
| | | | |
| | The Series files its complete schedule of portfolio holdings with the Securities and Exchange Commission (SEC) for the first and third quarters of each fiscal year on FormN-Q or FormN-PORT (available for filings after March 31, 2019). The Series’ FormsN-Q or FormsN-PORT, as well as a description of the policies and procedures that the Series uses to determine how to vote proxies (if any) relating to portfolio securities, are available without charge (i) upon request, by calling 800523-1918; and (ii) on the SEC’s website at sec.gov. In addition, a description of the policies and procedures that the Series uses to determine how to vote proxies (if any) relating to portfolio securities and the Schedule of Investments included in the Series’ most recent FormN-Q or FormN-PORT are available without charge on the Series’ website at delawarefunds.com/vip/literature. The Series’ FormsN-Q and FormsN-PORT may be reviewed and copied at the SEC’s Public Reference Room in Washington, D.C.; information on the operation of the Public Reference Room may be obtained by calling 800SEC-0330. Information (if any) regarding how the Series voted proxies relating to portfolio securities during the most recently disclosed12-month period ended June 30 is available without charge (i) through the Series’ website at delawarefunds.com/proxy; and (ii) on the SEC’s website at sec.gov. | | |
| | |
| AR-VIPUSG 22470 (2/20) (1073909) | | U.S. GrowthSeries-26 |
| | |
| | |
| |
 | |  |
| | |
| |
| | Annual report |
| | |
Delaware VIP® Trust
Delaware VIP Value Series
December 31, 2019
Beginning on or about June 1, 2021, as permitted by regulations adopted by the Securities and Exchange Commission, paper copies of your Series’ shareholder reports will no longer be sent to you by mail, unless you specifically request them from the Series or from your financial intermediary, such as a broker/dealer, bank, or insurance company. Instead, you will be notified by mail each time a report is posted on the website and provided with a link to access the report.
If you already elected to receive shareholder reports electronically, you will not be affected by this change and you do not need to take any action.
You may elect to receive paper copies of all future shareholder reports free of charge. You can inform the Series that you wish to continue receiving paper copies of your shareholder reports by contacting us at 800523-1918. If you own these shares through a financial intermediary, you may contact your financial intermediary to elect to continue to receive paper copies of your shareholder reports. Your election to receive reports in paper will apply to all funds held with the Delaware Funds® by Macquarie or your financial intermediary.
Table of contents
Other than Macquarie Bank Limited (MBL), none of the entities noted are authorized deposit-taking institutions for the purposes of the Banking Act 1959 (Commonwealth of Australia). The obligations of these entities do not represent deposits or other liabilities of MBL. MBL does not guarantee or otherwise provide assurance in respect of the obligations of these entities, unless noted otherwise. The Series is governed by US laws and regulations.
Unless otherwise noted, views expressed herein are current as of Dec. 31, 2019, and subject to change for events occurring after such date.
The Series is not FDIC insured and is not guaranteed. It is possible to lose the principal amount invested.
Advisory services provided by Delaware Management Company, a series of Macquarie Investment Management Business Trust (MIMBT), a US registered investment advisor.
The Series is distributed byDelaware Distributors, L.P.(DDLP), an affiliate of MIMBT and Macquarie Group Limited. Macquarie Investment Management (MIM) is the marketing name for certain companies comprising the asset management division of Macquarie Group Limited and its subsidiaries and affiliates worldwide.
This material may be used in conjunction with the offering of shares in Delaware VIP® Value Series only if preceded or accompanied by the Series’ current prospectus or the summary prospectus.
© 2020 Macquarie Management Holdings, Inc.
All third-party marks cited are the property of their respective owners.
| | |
| Delaware VIP® Trust — Delaware VIP Value Series | | |
| Portfolio management review | | January 7, 2020 (Unaudited) |
The investment objective of the Series is to seek long-term capital appreciation.
For the fiscal year ended Dec. 31, 2019, Delaware VIP Value Series (the “Series”) Standard Class shares gained 19.97% and Service Class shares were up 19.60%. Both figures reflect all dividends reinvested. The Series underperformed its benchmark, the Russell 1000® Value Index, which increased 26.54% for the same period.
Rebounding from the stock market correction that occurred in late 2018, the broad market S&P 500® Index posted a total return of 31.5% and achieved a newall-time high in December 2019. Notably, there was little earnings growth to support 2019’s hardy gains (aggregate earnings for the S&P 500 Index were lower in each of the first three quarters, year over year, and are expected to be down again in the fourth quarter). The Federal Open Market Committee (FOMC) reduced the federal funds rate by 0.25 percentage points on three separate occasions. You may recall that the FOMC raised rates in December 2018 before “pivoting” toward a more accommodative stance, which helped spark the 2019 stock market rally. Yields on US Treasury securities moved lower during the year as investors appeared to price in slower economic growth. The yield on the benchmark10-year note fell 0.76% to settle at 1.92%. The price of crude oil moved higher. West Texas Intermediate (WTI) crude, the domestic benchmark, was up 34% to $61.06 a barrel (source: FactSet Research Systems).
Investments in the energy sector caused the largest drags on the Series’ relative performance. Exploration and production (E&P) companyOccidental Petroleum Corp.was the largest detractor. The company’s shares sold off following its acquisition of Anadarko Petroleum Corp. as investors expressed frustration with how the deal came together, including the price paid and financing terms. We believe the deal has the potential to create an attractive long-term investment if Occidental follows through on its asset sales and deleveraging plan.
The Series’ holdings in the healthcare sector also detracted from relative returns. Pharmaceutical makerPfizer Inc.led the group lower after announcing that itsoff-patent drug business would be combined with drug maker Mylan N.V. to form a new company. The price of the combination was lower than expected and management provided conservative guidance for the remaining Pfizer business. Longer term, we think the transaction leaves Pfizer with a better growth profile.
Another significant detractor to the Series’ performance was diversified chemical manufacturerDuPont de Nemours Inc.Its shares were down in response to shareholder impatience with the pace of divestitures of certain businesses, challenges posed by the trade war, and investor concern about potential liability related to the chemical PFOA. We believe any PFOA liabilities will be manageable for DuPont and that the stock is attractively valued on asum-of-the-parts basis.
Investments in the industrials sector made the largest contributions to relative performance. Defense contractorRaytheon Co.was a noteworthy contributor. Raytheon agreed to a “merger of equals” with United Technologies Corp., which has the potential to create a larger, more diversified competitor in the aerospace and defense industry.
The Series’ holdings in the consumer staples sector also added significantly to relative returns. Global snack and beverage makerMondelez International Inc.was a strong contributor to the Series’ performance. Mondelez has executed well, generating solid organic sales growth.
Another notable contributor was communication services sector holdingAT&T Inc.Performance in its wireless business has improved and the integration of Time Warner appears to be on track. AT&T raised its full-year free cash flow guidance and has reduced its debt.
In January 2019, we added a target weight position inBroadcom Inc., a leading developer of semiconductors. At the time of purchase – following its acquisition of software company CA Technologies – we viewed Broadcom as having an attractive valuation and solid cash-flow characteristics. About half of Broadcom’s business is tied to the theme of increasing data usage. In August 2019, we exited the Series’ position in diagnostic testing providerQuest Diagnostics Inc., reducing our target weight in the healthcare sector to 21%. Shares of Quest Diagnostics had been a long-term holding in the Series. At the time of our sale, the shares traded near our price target, had strong performance year to date and, in our view, no longer offered an attractive risk-reward profile. In August 2019, we added a target-weight position inConagra Brands Inc., a leading food company with a broad array of well-known brands. We had become increasingly interested in adding exposure to the consumer staples sector, given the traditionally defensive behavior of consumer staples stocks, in general, and the emergence of attractive valuations in certain industries. Shares of Conagra experienced a steep decline soon after it acquired Pinnacle Foods Inc., which was facing challenges with several key brands. We saw these issues as fixable, however, and liked Conagra for its discounted valuation, improving balance-sheet fundamentals, and attractive dividend yield.
Value Series-1
| | |
| Delaware VIP®Trust — Delaware VIP Value Series | | |
| Portfolio management review (continued) | | January 7, 2020 (Unaudited) |
Expanding valuation multiples drove this year’s large market gains. The price-earnings ratio for the S&P 500 Index, based on next fiscal year’s earnings, rose to 20.0 from 15.7 in 2019. We think elevated valuation levels could lead to lower equity market returns in the coming years. Another concern is high indebtedness. High debt has the potential to crowd out future investment and curtail economic growth. Given our muted expectations for the economy and US stock market, we think a defensive tilt is appropriate for the Series. This means lower cyclicality, generally, and an emphasis on higher quality companies that have the potential to offer good long-term value. An exception with respect to lower cyclicality is our position in the energy sector, where we believe investors have been overly punitive and are mispricing the fundamentals of these holdings.
Unless otherwise noted, views expressed herein are current as of Dec. 31, 2019, and subject to change.
Value Series-2
Delaware VIP® Trust — Delaware VIP Value Series
Performance summary (Unaudited)
The performance quoted represents past performance and does not guarantee future results. Investment return and principal value of an investment will fluctuate so that shares, when redeemed, may be worth more or less than their original cost. Current performance may be lower or higher than the performance quoted.
Carefully consider the Series’ investment objectives, risk factors, charges, and expenses before investing. This and other information can be found in the Series’ prospectus and its summary prospectus, which may be obtained by visiting delawarefunds.com/vip/literature or calling 800523-1918. Investors should read the prospectus and the summary prospectus carefully before investing.
| | | | | | | | | | | | | | | | | | | | | | | | |
| Delaware VIP Value Series | | | | | | | | | | | | | | | | | | |
| Average annual total returns | | | | | | | | | | | | | | | | | | |
| For periods ended December 31, 2019 | | 1 year | | | 3 year | | | 5 year | | | 10 year | | | Lifetime | | | | |
Standard Class shares (commenced operations on July 28, 1988) | | | +19.97% | | | | +9.91% | | | | +8.68% | | | | +12.88% | | | | +9.09% | | | | | |
| | | | | | | | | | | | | | | | | | | | | | | | |
Service Class shares (commenced operations on May 1, 2000) | | | +19.60% | | | | +9.62% | | | | +8.39% | | | | +12.58% | | | | +7.77% | | | | | |
| | | | | | | | | | | | | | | | | | | | | | | | |
Russell 1000 Value Index | | | +26.54% | | | | +9.68% | | | | +8.29% | | | | +11.80% | | | | n/a | | | | | |
Returns reflect the reinvestment of all distributions. Please see page 4 for a description of the index.
As described in the Series’ most recent prospectus, the net expense ratio for Service Class shares of the Series was 0.99%, while total operating expenses for Standard Class and Service Class shares were 0.69% and 0.99%, respectively. The management fee for Standard Class and Service Class shares was 0.63%.
The Series pays Delaware Distributors, L.P. (DDLP), the distributor and an affiliate of DMC, an annual12b-1 fee of 0.30% of the average daily net assets of the Service Class shares.
Earnings from a variable annuity or variable life investment compoundtax-free until withdrawal, and as a result, no adjustments were made for income taxes.
Expense limitations were in effect for both classes during certain periods shown in the Series performance table above and in the Performance of a $10,000 Investment graph on the next page.
Performance data do not reflect insurance fees related to a variable annuity or variable life investment or the deferred sales charge that would apply to certain withdrawals of investments held for fewer than eight years. Performance shown here would have been reduced if such fees were included and the expense limitation removed. For more information about fees, consult your variable annuity or variable life prospectus.
Investments in variable products involve risk.
Please read both the contract and underlying prospectus for specific details regarding the product’s risk profile.
Value Series-3
Delaware VIP® Value Series
Performance summary (Unaudited) (continued)
| | | | |
| For period beginning Dec. 31, 2009 through Dec. 31, 2019 | | Starting value | | Ending value |
–– Delaware VIP Value Series (Standard Class) | | $10,000 | | $33,576 |
- - Russell 1000 Value Index | | $10,000 | | $30,505 |
The graph shows a $10,000 investment in the Delaware VIP Value Series Standard Class shares for the period from Dec. 31, 2009 through Dec. 31, 2019.
The graph also shows $10,000 invested in the Russell 1000 Value Index for the period from Dec. 31, 2009 through Dec. 31, 2019. The Russell 1000 Value Index measures the performance of thelarge-cap value segment of the US equity universe. It includes those Russell 1000 companies with lowerprice-to-book ratios and lower forecasted growth values.
The S&P 500 Index, mentioned on page 1, measures the performance of 500 mostlylarge-cap stocks weighted by market value, and is often used to represent performance of the US stock market.
Frank Russell Company is the source and owner of the trademarks, service marks, and copyrights related to the Russell Indexes. Russell® is a trademark of Frank Russell Company.
Index performance returns do not reflect any management fees, transaction costs or expenses. Indices are unmanaged and one cannot invest directly in an index.
Performance of Service Class shares will vary due to different charges and expenses.
Past performance is not a guarantee of future results.
Value Series-4
Delaware VIP® Trust — Delaware VIP Value Series
Disclosure of Series expenses
For thesix-month period from July 1, 2019 to December 31, 2019 (Unaudited)
As a shareholder of the Series, you incur ongoing costs, which may include management fees; distribution and service(12b-1) fees; and other Series expenses. This example is intended to help you understand your ongoing costs (in dollars) of investing in the Series and to compare these costs with the ongoing costs of investing in other mutual funds.
The example is based on an investment of $1,000 invested at the beginning of the period and held for the entiresix-month period from July 1, 2019 to Dec. 31, 2019.
Actual expenses
The first section of the table shown, “Actual Series return,” provides information about actual account values and actual expenses. You may use the information in this section of the table, together with the amount you invested, to estimate the expenses that you paid over the period. Simply divide your account value by $1,000 (for example, an $8,600 account value divided by $1,000 = 8.6), then multiply the result by the number in the first section under the heading entitled “Expenses Paid During Period” to estimate the expenses you paid on your account during the period.
Hypothetical example for comparison purposes
The second section of the table shown, “Hypothetical 5% return,” provides information about hypothetical account values and hypothetical expenses based on the Series’ actual expense ratio and an assumed rate of return of 5% per year before expenses, which is not the Series’ actual return. The hypothetical account values and expenses may not be used to estimate the actual ending account balance or expenses you paid for the period. You may use this information to compare the ongoing costs of investing in the Series and other funds. To do so, compare the 5% hypothetical example with the 5% hypothetical examples that appear in the shareholder reports of other funds.
Please note that the expenses shown in the table are meant to highlight your ongoing costs only. As a shareholder of the Series, you do not incur any transaction costs, such as sales charges (loads), redemption fees or exchange fees, but shareholders of other funds may incur such costs. Also, the fees related to the variable annuity investment or the deferred sales charge that could apply have not been included. Therefore, the second section of the table is useful in comparing ongoing costs only, and will not help you determine the relative total costs of owning different funds. The Series’ expenses shown in the table assume reinvestment of all dividends and distributions.
Expense analysis of an investment of $1,000
| | | | | | | | | | | | | | | | |
| | | Beginning
Account
Value 7/1/19 | | | Ending
Account
Value
12/31/19 | | | Annualized
Expense
Ratio | | | Expenses
Paid During
Period
7/1/19 to
12/31/19* | |
| | | | |
Actual Series return† | | | | | | | | | | | | | | | | |
Standard Class | | | $1,000.00 | | | | $1,081.00 | | | | 0.69% | | | | $3.62 | |
Service Class | | | 1,000.00 | | | | 1,079.20 | | | | 0.99% | | | | 5.19 | |
Hypothetical 5% return(5% return before expenses) | |
Standard Class | | | $1,000.00 | | | | $1,021.73 | | | | 0.69% | | | | $3.52 | |
Service Class | | | 1,000.00 | | | | 1,020.21 | | | | 0.99% | | | | 5.04 | |
*“Expenses Paid During Period” are equal to the Series’ annualized expense ratio, multiplied by the average account value over the period, multiplied by 184/365 (to reflect theone-half year period).
†Because actual returns reflect only the most recentsix-month period, the returns shown may differ significantly from fiscal year returns.
In addition to the Series’ expenses reflected above, the Series also indirectly bears its portion of the fees and expenses of the investment companies (Underlying Funds) in which it invests. The table above does not reflect the expenses of the Underlying Funds.
Value Series-5
Delaware VIP® Trust — Delaware VIP Value Series
Security type / sector allocation and top 10 equity holdings
As of December 31, 2019 (Unaudited)
Sector designations may be different than the sector designations presented in other Series materials. The sector designations may represent the investment manager’s internal sector classifications.
| | | | |
| Security type / sector | | Percentage of net assets |
| |
Common Stock | | | 99.08 | % |
Communication Services | | | 6.22 | % |
Consumer Discretionary | | | 5.89 | % |
Consumer Staples | | | 9.20 | % |
Energy | | | 10.92 | % |
Financials | | | 15.63 | % |
Healthcare | | | 21.41 | % |
Industrials | | | 9.15 | % |
Information Technology | | | 12.04 | % |
Materials | | | 2.49 | % |
Real Estate | | | 2.90 | % |
Utilities | | | 3.23 | % |
Short-Term Investments | | | 1.00 | % |
Total Value of Securities | | | 100.08 | % |
Liabilities Net of Receivables and Other Assets | | | (0.08 | %) |
Total Net Assets | | | 100.00 | % |
Holdings are for informational purposes only and are subject to change at any time. They are not a recommendation to buy, sell, or hold any security.
| | | | |
| Top 10 equity holdings | | Percentage
of net assets |
| |
Conagra Brands | | | 3.33 | % |
Cigna | | | 3.29 | % |
Marsh & McLennan | | | 3.29 | % |
Broadcom | | | 3.28 | % |
Allstate | | | 3.27 | % |
CVS Health | | | 3.27 | % |
Truist Financial | | | 3.27 | % |
Lowe’s | | | 3.25 | % |
Edison International | | | 3.23 | % |
Abbott Laboratories | | | 3.22 | % |
Value Series-6
Delaware VIP® Trust — Delaware VIP Value Series
Schedule of investments
December 31, 2019
| | | | | | | | |
| | | Number of
shares | | | Value (US $) | |
| |
Common Stock – 99.08% | | | | | |
Communication Services – 6.22% | |
AT&T | | | 682,224 | | | $ | 26,661,314 | |
Verizon Communications | | | 416,800 | | | | 25,591,520 | |
| | | | | | | | |
| | | | | | | 52,252,834 | |
| | | | | | | | |
Consumer Discretionary – 5.89% | |
Dollar Tree † | | | 235,400 | | | | 22,139,370 | |
Lowe’s | | | 228,200 | | | | 27,329,232 | |
| | | | | | | | |
| | | | | | | 49,468,602 | |
| | | | | | | | |
Consumer Staples – 9.20% | |
Archer-Daniels-Midland | | | 536,500 | | | | 24,866,775 | |
Conagra Brands | | | 816,904 | | | | 27,970,793 | |
Mondelez International Class A | | | 444,100 | | | | 24,461,028 | |
| | | | | | | | |
| | | | | | | 77,298,596 | |
| | | | | | | | |
Energy – 10.92% | |
ConocoPhillips | | | 410,000 | | | | 26,662,300 | |
Halliburton | | | 840,900 | | | | 20,576,823 | |
Marathon Oil | | | 1,812,857 | | | | 24,618,598 | |
Occidental Petroleum | | | 481,100 | | | | 19,826,131 | |
| | | | | | | | |
| | | | | | | 91,683,852 | |
| | | | | | | | |
Financials – 15.63% | |
Allstate | | | 244,500 | | | | 27,494,025 | |
American International Group | | | 481,500 | | | | 24,715,395 | |
Bank of New York Mellon | | | 476,400 | | | | 23,977,212 | |
Marsh & McLennan | | | 248,000 | | | | 27,629,680 | |
Truist Financial | | | 487,600 | | | | 27,461,632 | |
| | | | | | | | |
| | | | | | | 131,277,944 | |
| | | | | | | | |
Healthcare – 21.41% | |
Abbott Laboratories | | | 311,000 | | | | 27,013,460 | |
Cardinal Health | | | 465,500 | | | | 23,544,990 | |
Cigna | | | 135,151 | | | | 27,637,028 | |
CVS Health | | | 369,900 | | | | 27,479,871 | |
Johnson & Johnson | | | 168,200 | | | | 24,535,334 | |
Merck & Co. | | | 296,500 | | | | 26,966,675 | |
Pfizer | | | 577,541 | | | | 22,628,057 | |
| | | | | | | | |
| | | | | | | 179,805,415 | |
| | | | | | | | |
Industrials – 9.15% | |
Northrop Grumman | | | 71,200 | | | | 24,490,664 | |
Raytheon | | | 121,800 | | | | 26,764,332 | |
Waste Management | | | 224,400 | | | | 25,572,624 | |
| | | | | | | | |
| | | | | | | 76,827,620 | |
| | | | | | | | |
| | | | | | | | |
| | | Number
of shares | | | Value (US $) | |
|
Common Stock (continued) | |
Information Technology – 12.04% | | | | | |
Broadcom | | | 87,100 | | | $ | 27,525,342 | |
Cisco Systems | | | 472,800 | | | | 22,675,488 | |
Intel | | | 449,600 | | | | 26,908,560 | |
Oracle | | | 454,000 | | | | 24,052,920 | |
| | | | | | | | |
| | | | | | | 101,162,310 | |
| | | | | | | | |
Materials – 2.49% | | | | | |
DuPont de Nemours | | | 326,183 | | | | 20,940,948 | |
| | | | | | | | |
| | | | | | | 20,940,948 | |
| | | | | | | | |
Real Estate – 2.90% | | | | | |
Equity Residential | | | 300,900 | | | | 24,348,828 | |
| | | | | | | | |
| | | | | | | 24,348,828 | |
| | | | | | | | |
Utilities – 3.23% | | | | | |
Edison International | | | 359,500 | | | | 27,109,895 | |
| | | | | | | | |
| | | | | | | 27,109,895 | |
| | | | | | | | |
Total Common Stock
(cost $497,870,971) | | | | | | | 832,176,844 | |
| | | | | | | | |
Short-Term Investments – 1.00% | |
Money Market Mutual Funds – 1.00% | |
BlackRock FedFund – Institutional Shares(seven-day effective yield 1.52%) | | | 1,675,039 | | | | 1,675,039 | |
Fidelity Investments Money Market Government Portfolio – Class I(seven-day effective yield 1.49%) | | | 1,675,039 | | | | 1,675,039 | |
GS Financial Square Government Fund – Institutional Shares(seven-day effective yield 1.51%) | | | 1,675,039 | | | | 1,675,039 | |
Morgan Stanley Government Portfolio – Institutional Share Class(seven-day effective yield 1.48%) | | | 1,675,039 | | | | 1,675,039 | |
State Street Institutional US Government Money Market Fund – Investor Class(seven-day effective yield 1.45%) | | | 1,675,038 | | | | 1,675,038 | |
| | | | | | | | |
Total Short-Term Investments
(cost $8,375,194) | | | | | | | 8,375,194 | |
| | | | | | | | |
| | | | |
Total Value of Securities – 100.08%
(cost $506,246,165) | | $ | 840,552,038 | |
| | | | |
†Non-income producing security.
GS – Goldman Sachs
See accompanying notes, which are an integral part of the financial statements.
Value Series-7
| | |
Delaware VIP®Trust — Delaware VIP Value Series | | |
Statement of assets and liabilities | | December 31, 2019 |
| | | | |
Assets: | | | | |
Investments, at value1 | | $ | 840,552,038 | |
Dividends and interest receivable | | | 1,443,659 | |
Receivable for securities sold | | | 468,849 | |
Receivable for series shares sold | | | 1,312 | |
| �� | | | |
Total assets | | | 842,465,858 | |
| | | | |
Liabilities: | | | | |
Payable for series shares redeemed | | | 1,936,961 | |
Investment management fees payable | | | 443,840 | |
Distribution fees payable to affiliates | | | 100,292 | |
Other accrued expenses | | | 69,658 | |
Trustees’ fees and expenses payable to affiliates | | | 8,052 | |
Dividend disbursing and transfer agent fees and expenses payable to affiliates | | | 5,282 | |
Accounting and administration expenses payable to affiliates | | | 2,677 | |
Legal fees payable to affiliates | | | 1,271 | |
Reports and statements to shareholders expenses payable to affiliates | | | 403 | |
| | | | |
Total liabilities | | | 2,568,436 | |
| | | | |
Total Net Assets | | $ | 839,897,422 | |
| | | | |
| |
Net Assets Consist of: | | | | |
Paid-in capital | | $ | 459,946,462 | |
Total distributable earnings (loss) | | | 379,950,960 | |
| | | | |
Total Net Assets | | $ | 839,897,422 | |
| | | | |
| |
Net Asset Value: | | | | |
Standard Class: | | | | |
Net assets | | $ | 440,586,981 | |
Shares of beneficial interest outstanding, unlimited authorization, no par | | | 14,173,285 | |
Net asset value per share | | $ | 31.09 | |
| |
Service Class: | | | | |
Net assets | | $ | 399,310,441 | |
Shares of beneficial interest outstanding, unlimited authorization, no par | | | 12,901,946 | |
Net asset value per share | | $ | 30.95 | |
| |
| ________________ | | | | |
1Investments, at cost | | $ | 506,246,165 | |
See accompanying notes, which are an integral part of the financial statements.
Value Series-8
| | |
Delaware VIP® Trust — | | Delaware VIP Trust — |
Delaware VIP Value Series | | Delaware VIP Value Series |
Statement of operations | | Statements of changes in net assets |
| Year ended December 31, 2019 | | |
| | | | |
Investment Income: | | | | |
Dividends | | $ | 20,938,437 | |
Interest | | | 81,848 | |
| | | | |
| | | 21,020,285 | |
| | | | |
Expenses: | | | | |
Management fees | | | 5,089,268 | |
Distribution expenses-Service Class | | | 1,143,385 | |
Accounting and administration expenses | | | 179,004 | |
Dividend disbursing and transfer agent fees and expenses | | | 67,298 | |
Reports and statements to shareholders expenses | | | 58,997 | |
Trustees’ fees and expenses | | | 47,672 | |
Legal fees | | | 40,219 | |
Audit and tax fees | | | 32,277 | |
Custodian fees | | | 21,213 | |
Registration fees | | | 150 | |
Other | | | 22,580 | |
| | | | |
| | | 6,702,063 | |
Less expenses paid indirectly | | | (732 | ) |
| | | | |
Total operating expenses | | | 6,701,331 | |
| | | | |
Net Investment Income | | | 14,318,954 | |
| | | | |
Net Realized and Unrealized Gain: | | | | |
Net realized gain on investments | | | 35,858,393 | |
Net change in unrealized appreciation (depreciation) of investments | | | 93,121,390 | |
| | | | |
Net Realized and Unrealized Gain | | | 128,979,783 | |
| | | | |
Net Increase in Net Assets Resulting from Operations | | $ | 143,298,737 | |
| | | | |
| | | | | | | | |
| | | Year ended | |
| | | 12/31/19 | | | 12/31/18 | |
Increase (Decrease) in Net Assets from Operations: | | | | | | | | |
Net investment income | | $ | 14,318,954 | | | $ | 13,044,258 | |
Net realized gain | | | 35,858,393 | | | | 56,062,721 | |
Net change in unrealized appreciation (depreciation) | | | 93,121,390 | | | | (89,340,596 | ) |
| | | | | | | | |
Net increase (decrease) in net assets resulting from operations | | | 143,298,737 | | | | (20,233,617 | ) |
| | | | | | | | |
| | |
Dividends and Distributions to Shareholders from: | | | | | | | | |
Distributable earnings: | | | | | | | | |
Standard Class | | | (36,693,110 | ) | | | (33,362,526 | ) |
Service Class | | | (32,088,566 | ) | | | (27,989,816 | ) |
| | | | | | | | |
| | | (68,781,676 | ) | | | (61,352,342 | ) |
| | | | | | | | |
|
Capital Share Transactions: | |
Proceeds from shares sold: | | | | | | | | |
Standard Class | | | 21,217,326 | | | | 11,383,861 | |
Service Class | | | 20,861,629 | | | | 35,186,107 | |
Net asset value of shares issued upon reinvestment of dividends and distributions: | | | | | | | | |
Standard Class | | | 36,693,110 | | | | 33,362,526 | |
Service Class | | | 32,088,566 | | | | 27,989,816 | |
| | | | | | | | |
| | | 110,860,631 | | | | 107,922,310 | |
| | | | | | | | |
Cost of shares redeemed: | | | | | | | | |
Standard Class | | | (45,148,585 | ) | | | (45,227,144 | ) |
Service Class | | | (37,921,696 | ) | | | (47,969,409 | ) |
| | | | | | | | |
| | | (83,070,281 | ) | | | (93,196,553 | ) |
| | | | | | | | |
Increase in net assets derived from capital share transactions | | | 27,790,350 | | | | 14,725,757 | |
| | | | | | | | |
| | |
Net Increase (Decrease) in Net Assets | | | 102,307,411 | | | | (66,860,202 | ) |
| | |
Net Assets: | | | | | | | | |
Beginning of year | | | 737,590,011 | | | | 804,450,213 | |
| | | | | | | | |
End of year | | $ | 839,897,422 | | | $ | 737,590,011 | |
| | | | | | | | |
See accompanying notes, which are an integral part of the financial statements.
Value Series-9
Delaware VIP® Trust — Delaware VIP Value Series
Financial highlights
Selected data for each share of the Series outstanding throughout each period were as follows:
| | | | | | | | | | | | | | | | | | | | |
| | | Delaware VIP Value Series Standard Class | |
| | | Year ended | |
| | | 12/31/19 | | | 12/31/18 | | | 12/31/17 | | | 12/31/16 | | | 12/31/15 | |
Net asset value, beginning of period | | $ | 28.31 | | | $ | 31.57 | | | $ | 29.25 | | | $ | 28.64 | | | $ | 29.24 | |
| | | | | |
Income (loss) from investment operations: | | | | | | | | | | | | | | | | | | | | |
Net investment income1 | | | 0.57 | | | | 0.54 | | | | 0.48 | | | | 0.52 | | | | 0.55 | |
Net realized and unrealized gain (loss) | | | 4.87 | | | | (1.29 | ) | | | 3.38 | | | | 3.39 | | | | (0.65 | ) |
| | | | | | | | | | | | | | | | | | | | |
Total from investment operations | | | 5.44 | | | | (0.75 | ) | | | 3.86 | | | | 3.91 | | | | (0.10 | ) |
| | | | | | | | | | | | | | | | | | | | |
| | | | | |
Less dividends and distributions from: | | | | | | | | | | | | | | | | | | | | |
Net investment income | | | (0.54 | ) | | | (0.53 | ) | | | (0.51 | ) | | | (0.59 | ) | | | (0.50 | ) |
Net realized gain | | | (2.12 | ) | | | (1.98 | ) | | | (1.03 | ) | | | (2.71 | ) | | | — | |
| | | | | | | | | | | | | | | | | | | | |
Total dividends and distributions | | | (2.66 | ) | | | (2.51 | ) | | | (1.54 | ) | | | (3.30 | ) | | | (0.50 | ) |
| | | | | | | | | | | | | | | | | | | | |
| | | | | |
Net asset value, end of period | | $ | 31.09 | | | $ | 28.31 | | | $ | 31.57 | | | $ | 29.25 | | | $ | 28.64 | |
| | | | | | | | | | | | | | | | | | | | |
| | | | | |
Total return2 | | | 19.97% | | | | (2.73% | ) | | | 13.80% | | | | 14.65% | | | | (0.41% | ) |
| | | | | |
Ratios and supplemental data: | | | | | | | | | | | | | | | | | | | | |
Net assets, end of period (000 omitted) | | $ | 440,587 | | | $ | 388,644 | | | $ | 431,874 | | | $ | 439,265 | | | $ | 389,570 | |
Ratio of expenses to average net assets3 | | | 0.69% | | | | 0.69% | | | | 0.70% | | | | 0.70% | | | | 0.71% | |
Ratio of net investment income to average net assets | | | 1.92% | | | | 1.77% | | | | 1.64% | | | | 1.87% | | | | 1.88% | |
Portfolio turnover | | | 13% | | | | 13% | | | | 11% | | | | 17% | | | | 17% | |
| 1 | The average shares outstanding method has been applied for per share information. |
| 2 | Total return is based on the change in net asset value of a share during the period and assumes reinvestment of dividends and distributions at net asset value. Total return does not include fees, charges, or expenses imposed by the variable annuity and life insurance contracts for which Delaware VIP Trust serves as an underlying investment vehicle. |
| 3 | Expense ratios do not include expenses of the Underlying Funds in which the Series invests. |
See accompanying notes, which are an integral part of the financial statements.
Value Series-10
Delaware VIP® Value Series
Financial highlights (continued)
Selected data for each share of the Series outstanding throughout each period were as follows:
| | | | | | | | | | | | | | | | | | | | |
| | | Delaware VIP Value Series Service Class | |
| | | Year ended | |
| | | 12/31/19 | | | 12/31/18 | | | 12/31/17 | | | 12/31/16 | | | 12/31/15 | |
Net asset value, beginning of period | | $ | 28.20 | | | $ | 31.46 | | | $ | 29.15 | | | $ | 28.56 | | | $ | 29.16 | |
| | | | | |
Income (loss) from investment operations: | | | | | | | | | | | | | | | | | | | | |
Net investment income1 | | | 0.48 | | | | 0.45 | | | | 0.41 | | | | 0.45 | | | | 0.47 | |
Net realized and unrealized gain (loss) | | | 4.84 | | | | (1.28 | ) | | | 3.37 | | | | 3.37 | | | | (0.64 | ) |
| | | | | | | | | | | | | | | | | | | | |
Total from investment operations | | | 5.32 | | | | (0.83 | ) | | | 3.78 | | | | 3.82 | | | | (0.17 | ) |
| | | | | | | | | | | | | | | | | | | | |
| | | | | |
Less dividends and distributions from: | | | | | | | | | | | | | | | | | | | | |
Net investment income | | | (0.45 | ) | | | (0.45 | ) | | | (0.44 | ) | | | (0.52 | ) | | | (0.43 | ) |
Net realized gain | | | (2.12 | ) | | | (1.98 | ) | | | (1.03 | ) | | | (2.71 | ) | | | — | |
| | | | | | | | | | | | | | | | | | | | |
Total dividends and distributions | | | (2.57 | ) | | | (2.43 | ) | | | (1.47 | ) | | | (3.23 | ) | | | (0.43 | ) |
| | | | | | | | | | | | | | | | | | | | |
| | | | | |
Net asset value, end of period | | $ | 30.95 | | | $ | 28.20 | | | $ | 31.46 | | | $ | 29.15 | | | $ | 28.56 | |
| | | | | | | | | | | | | | | | | | | | |
| | | | | |
Total return2 | | | 19.60% | | | | (3.00% | )3 | | | 13.53% | 3 | | | 14.32% | 3 | | | (0.64% | )3 |
| | | | | |
Ratios and supplemental data: | | | | | | | | | | | | | | | | | | | | |
Net assets, end of period (000 omitted) | | $ | 399,310 | | | $ | 348,946 | | | $ | 372,576 | | | $ | 365,855 | | | $ | 304,570 | |
Ratio of expenses to average net assets4 | | | 0.99% | | | | 0.97% | | | | 0.95% | | | | 0.95% | | | | 0.96% | |
Ratio of expenses to average net assets prior to fees waived4 | | | 0.99% | | | | 0.99% | | | | 1.00% | | | | 1.00% | | | | 1.01% | |
Ratio of net investment income to average net assets | | | 1.62% | | | | 1.49% | | | | 1.39% | | | | 1.62% | | | | 1.63% | |
Ratio of net investment income to average net assets prior to fees waived | | | 1.62% | | | | 1.47% | | | | 1.34% | | | | 1.57% | | | | 1.58% | |
Portfolio turnover | | | 13% | | | | 13% | | | | 11% | | | | 17% | | | | 17% | |
| 1 | The average shares outstanding method has been applied for per share information. |
| 2 | Total return is based on the change in net asset value of a share during the period and assumes reinvestment of dividends and distributions at net asset value. Total return does not include fees, charges, or expenses imposed by the variable annuity and life insurance contracts for which Delaware VIP Trust serves as an underlying investment vehicle. |
| 3 | Total return during the period reflects a waiver by the manager and/or distributor. Performance would have been lower had the waiver not been in effect. |
| 4 | Expense ratios do not include expenses of the Underlying Funds in which the Series invests. |
See accompanying notes, which are an integral part of the financial statements.
Value Series-11
Delaware VIP® Trust — Delaware VIP Value Series
Notes to financial statements
December 31, 2019
Delaware VIP Trust (Trust) is organized as a Delaware statutory trust and offers 22 series, each of which is treated as a separate entity for certain matters under the Investment Company Act of 1940, as amended (1940 Act). These financial statements and the related notes pertain to Delaware VIP Value Series (Series). The Trust is anopen-end investment company. The Series is considered diversified under the 1940 Act and offers Standard Class and Service Class shares. The Standard Class shares do not carry a distribution and service(12b-1) fee and the Service Class shares carry a12b-1 fee. The shares of the Series are sold only to separate accounts of life insurance companies.
1. Significant Accounting Policies
The Series follows accounting and reporting guidance under Financial Accounting Standards Board (FASB) Accounting Standards Codification Topic 946, Financial Services - Investment Companies. The following accounting policies are in accordance with US generally accepted accounting principles (US GAAP) and are consistently followed by the Series.
Security Valuation — Equity securities, except those traded on the Nasdaq Stock Market LLC (Nasdaq), are valued at the last quoted sales price as of the time of the regular close of the New York Stock Exchange on the valuation date. Equity securities traded on the Nasdaq are valued in accordance with the Nasdaq Official Closing Price, which may not be the last sales price. If, on a particular day, an equity security does not trade, the mean between the bid and ask prices will be used, which approximates fair value. US government and agency securities are valued at the mean between the bid and ask prices, which approximates fair value.Open-end investment companies are valued at their published net asset value (NAV). Investments in repurchase agreements are generally valued at par, which approximates fair value, each business day. Generally, other securities and assets for which market quotations are not readily available are valued at fair value as determined in good faith under the direction of the Trust’s Board of Trustees (Board). In determining whether market quotations are readily available or fair valuation will be used, various factors will be taken into consideration, such as market closures or suspension of trading in a security. Restricted securities are valued at fair value using methods approved by the Board.
Federal Income Taxes — No provision for federal income taxes has been made as the Series intends to continue to qualify for federal income tax purposes as a regulated investment company under Subchapter M of the Internal Revenue Code of 1986, as amended, and make the requisite distributions to shareholders. The Series evaluates tax positions taken or expected to be taken in the course of preparing the Series’ tax returns to determine whether the tax positions are“more-likely-than-not” of being sustained by the applicable tax authority. Tax positions not deemed to meet the“more-likely-than-not” threshold are recorded as a tax benefit or expense in the current year. Management has analyzed the Series’ tax positions taken or expected to be taken on the Series’ federal income tax returns through the year ended Dec. 31, 2019, and for all open tax years (years ended Dec. 31, 2016–Dec. 31, 2018), and has concluded that no provision for federal income tax is required in the Series’ financial statements. If applicable, the Series recognizes interest accrued on unrecognized tax benefits in interest expense and penalties in “Other expenses” on the “Statement of operations.” During the year ended Dec. 31, 2019, the Series did not incur any interest or tax penalties.
Class Accounting — Investment income, common expenses, and realized and unrealized gain (loss) on investments are allocated to the various classes of the Series on the basis of daily net assets of each class. Distribution expenses relating to a specific class are charged directly to that class.
Repurchase Agreements — The Series may purchase certain US government securities subject to the counterparty’s agreement to repurchase them at an agreed upon date and price. The counterparty will be required on a daily basis to maintain the value of the collateral subject to the agreement at not less than the repurchase price (including accrued interest). The agreements are conditioned upon the collateral being deposited under the Federal Reserve book-entry system with the Series’ custodian or a third-partysub-custodian. In the event of default or bankruptcy by the other party to the agreement, retention of the collateral may be subject to legal proceedings. At Dec. 31, 2019, the Series had no open repurchase agreements.
Use of Estimates — The preparation of financial statements in conformity with US GAAP requires management to make estimates and assumptions that affect the fair value of investments, the reported amounts of assets and liabilities and disclosure of contingent assets and liabilities at the date of the financial statements, and the reported amounts of revenues and expenses during the reporting period. Actual results could differ from those estimates and the differences could be material.
Other — Expenses directly attributable to the Series are charged directly to the Series. Other expenses common to various funds within the Delaware Funds® by Macquarie (Delaware Funds) are generally allocated among such funds on the basis of average net assets. Management fees and certain other expenses are paid monthly. Security transactions are recorded on the date the securities are purchased or sold (trade date) for financial reporting purposes. Costs used in calculating realized gains and losses on the sale of investment securities are those of the specific securities sold. Dividend income is recorded on theex-dividend date and interest income is recorded on the accrual basis. Discounts and premiums on debt securities are accreted or amortized to interest income, respectively, over the lives of the respective securities using the effective interest method. The Series declares and pays distributions from net investment income and distributions from net realized gain on investments, if any, following the close of the fiscal year. The Series may distribute more frequently, if necessary for tax purposes. Dividends and distributions, if any, are recorded on theex-dividend date.
Value Series-12
Delaware VIP® Value Series
Notes to financial statements (continued)
The Series receives earnings credits from its custodian when positive cash balances are maintained, which may be used to offset custody fees. The expenses paid under this arrangement are included on the “Statement of operations” under “Custodian fees” with the corresponding expenses offset included under “Less expenses paid indirectly.” For the year ended Dec. 31, 2019, the Series earned $731 under this arrangement.
The Series receives earnings credits from its transfer agent when positive cash balances are maintained, which may be used to offset transfer agent fees. If the amount earned is greater than $1, the expenses paid under this arrangement are included on the “Statement of operations” under “Dividend disbursing and transfer agent fees and expenses” with the corresponding expenses offset included under “Less expenses paid indirectly.” For the year ended Dec. 31, 2019, the Series earned $1 under this arrangement.
2. Investment Management, Administration Agreements, and Other Transactions with Affiliates
In accordance with the terms of its investment management agreement, the Series pays Delaware Management Company (DMC), a series of Macquarie Investment Management Business Trust and the investment manager, an annual fee which is calculated daily and paid monthly at the rates of 0.65% on the first $500 million of average daily net assets of the Series, 0.60% on the next $500 million, 0.55% on the next $1.5 billion, and 0.50% on average daily net assets in excess of $2.5 billion.
Effective May 30, 2019, DMC may permit its affiliates, Macquarie Investment Management Global Limited (MIMGL) and Macquarie Funds Management Hong Kong Limited (together, the “AffiliatedSub-Advisors”), to execute Fund equity security trades on behalf of the Manager. The Manager may also seek quantitative support from MIMGL. Although the AffiliatedSub-Advisors serve assub-advisors, DMC has ultimate responsibility for all investment advisory services. For these services, DMC, not the Fund, may pay each AffiliatedSub-Advisor a portion of its investment management fee.
Delaware Investments Fund Services Company (DIFSC), an affiliate of DMC, provides fund accounting and financial administration oversight services to the Series. For these services, DIFSC’s fees are calculated daily and paid monthly based on the aggregate daily net assets of all funds within the Delaware Funds at the following annual rates: 0.00475% of the first $35 billion; 0.0040% of the next $10 billion; and 0.0025% of aggregate average daily net assets in excess of $45 billion (Total Fee). Each fund in the Delaware Funds pays a minimum of $4,000, which, in aggregate, is subtracted from the Total Fee. Each fund then pays its portion of the remainder of the Total Fee on a relative NAV basis. This amount is included on the “Statement of operations” under “Accounting and administration expenses.” For the year ended Dec. 31, 2019, the Series was charged $33,541 for these services.
DIFSC is also the transfer agent and dividend disbursing agent of the Series. For these services, DIFSC’s fees are calculated daily and paid monthly at the annual rate of 0.0075% of the Series’ average daily net assets. This amount is included on the “Statement of operations” under “Dividend disbursing and transfer agent fees and expenses.” For the year ended Dec. 31, 2019, the Series was charged $60,491 for these services. Pursuant to asub-transfer agency agreement between DIFSC and BNY Mellon Investment Servicing (US) Inc. (BNYMIS), BNYMIS provides certainsub-transfer agency services to the Series.Sub-transfer agency fees are paid by the Series and are also included on the “Statement of operations” under “Dividend disbursing and transfer agent fees and expenses.” The fees that are calculated daily and paid as invoices are received on a monthly or quarterly basis.
Pursuant to a distribution agreement and distribution plan, the Series pays Delaware Distributors, L.P. (DDLP), the distributor and an affiliate of DMC, an annual12b-1 fee of 0.30% of the average daily net assets of the Service Class shares. The fees are calculated daily and paid monthly. Standard Class shares do not12b-1 fees.
As provided in the investment management agreement, the Series bears a portion of the cost of certain resources shared with DMC, including the cost of internal personnel of DMC and/or its affiliates that provide legal, tax, and regulatory reporting services to the Series. For the year ended Dec. 31, 2019, the Series was charged $22,337 for internal legal, tax, and regulatory reporting services provided by DMC and/or its affiliates’ employees. This amount is included on the “Statement of operations” under “Legal fees.”
Trustees’ fees include expenses accrued by the Series for each Trustee’s retainer and meeting fees. Certain officers of DMC, DIFSC, and DDLP are officers and/or Trustees of the Trust. These officers and Trustees are paid no compensation by the Series.
In addition to the management fees and other expenses of the Series, the Series indirectly bears the investment management fees and other expenses of the investment companies (Underlying Funds) in which it invests. The amount of these fees and expenses incurred indirectly by the Series will vary based upon the expense and fee levels of the Underlying Funds and the number of shares that are owned of the Underlying Funds at different times.
Value Series-13
Delaware VIP® Value Series
Notes to financial statements (continued)
3. Investments
For the year ended Dec. 31, 2019, the Series made purchases and sales of investment securities other than short-term investments as follows:
| | | | |
Purchases | | $ | 104,625,973 | |
Sales | | | 109,703,416 | |
The tax cost of investments includes adjustments to net unrealized appreciation (depreciation) which may not necessarily be the final tax cost basis adjustments, but approximate the tax basis unrealized gains and losses that may be realized and distributed to shareholders. At Dec. 31, 2019, the cost and unrealized appreciation (depreciation) of investments for federal income tax purposes for the Series were as follows:
| | | | | | |
| | | Aggregate | | Aggregate | | |
| | | Unrealized | | Unrealized | | Net Unrealized |
| Cost of | | Appreciation | | Depreciation | | Appreciation |
Investments | | of Investments | | of Investments | | of Investments |
| $510,641,726 | | $354,283,001 | | $(24,372,689) | | $329,910,312 |
US GAAP defines fair value as the price that the Series would receive to sell an asset or pay to transfer a liability in an orderly transaction between market participants at the measurement date under current market conditions. A three-level hierarchy for fair value measurements has been established based upon the transparency of inputs to the valuation of an asset or liability. Inputs may be observable or unobservable and refer broadly to the assumptions that market participants would use in pricing the asset or liability. Observable inputs reflect the assumptions market participants would use in pricing the asset or liability based on market data obtained from sources independent of the reporting entity. Unobservable inputs reflect the reporting entity’s own assumptions about the assumptions that market participants would use in pricing the asset or liability based on the best information available under the circumstances. The Series’ investment in its entirety is assigned a level based upon the observability of the inputs which are significant to the overall valuation. The three-level hierarchy of inputs is summarized below.
| | | | |
| Level 1 | | – | | Inputs are quoted prices in active markets for identical investments. (Examples: equity securities,open-end investment companies, futures contracts, exchange-traded options contracts) |
| Level 2 | | – | | Other observable inputs, including, but not limited to: quoted prices for similar assets or liabilities in markets that are active, quoted prices for identical or similar assets or liabilities in markets that are not active, inputs other than quoted prices that are observable for the assets or liabilities (such as interest rates, yield curves, volatilities, prepayment speeds, loss severities, credit risks and default rates) or other market-corroborated inputs. (Examples: debt securities, government securities, swap contracts, foreign currency exchange contracts, foreign securities utilizing international fair value pricing, broker-quoted securities, fair valued securities) |
| Level 3 | | – | | Significant unobservable inputs including the Series’ own assumptions used to determine the fair value of investments. (Examples: broker-quoted securities, fair valued securities) |
Level 3 investments are valued using significant unobservable inputs. The Series may also use an income-based valuation approach in which the anticipated future cash flows of the investment are discounted to calculate fair value. Discounts may also be applied due to the nature or duration of any restrictions on the disposition of the investments. Valuations may also be based upon current market prices of securities that are comparable in coupon, rating, maturity, and industry. The derived value of a Level 3 investment may not represent the value which is received upon disposition and this could impact the results of operations.
The following table summarizes the valuation of the Series’ investments by fair value hierarchy levels as of Dec. 31, 2019:
| | | | |
| | | Level 1 | |
| Securities | | | |
Assets: | | | | |
Common Stock | | $ | 832,176,844 | |
Short-Term Investments | | | 8,375,194 | |
| | | | |
Total Value of Securities | | $ | 840,552,038 | |
| | | | |
During the year ended Dec. 31, 2019, there were no transfers between Level 1 investments, Level 2 investments, or Level 3 investments that had a significant impact to the Series. The Series’ policy is to recognize transfers between levels based on fair value at the beginning of the reporting period.
A reconciliation of Level 3 investments is presented when the Series has a significant amount of Level 3 investments at the beginning, interim, or end of the period in relation to the Series’ net assets. During the year ended Dec. 31, 2019, there were no Level 3 investments.
Value Series-14
Delaware VIP® Value Series
Notes to financial statements (continued)
4. Dividend and Distribution Information
Income and long-term capital gain distributions are determined in accordance with federal income tax regulations, which may differ from US GAAP. Additionally, distributions from net short-term gains on sales of investment securities are treated as ordinary income for federal income tax purposes. The tax character of dividends and distributions paid during the years ended Dec. 31, 2019 and 2018 was as follows:
| | | | | | | | |
| | | Year ended | |
| | | 12/31/19 | | | 12/31/18 | |
Ordinary income | | $ | 15,082,442 | | | $ | 16,351,471 | |
Long-term capital gain | | | 53,699,234 | | | | 45,000,871 | |
| | | | | | | | |
Total | | $ | 68,781,676 | | | $ | 61,352,342 | |
| | | | | | | | |
5. Components of Net Assets on a Tax Basis
As of Dec. 31, 2019, the components of net assets on a tax basis were as follows:
| | | | |
Shares of beneficial interest | | $ | 459,946,462 | |
Undistributed ordinary income | | | 17,709,872 | |
Undistributed long-term capital gains | | | 32,330,776 | |
Net unrealized appreciation on investments | | | 329,910,312 | |
| | | | |
Net assets | | $ | 839,897,422 | |
| | | | |
The differences between book basis and tax basis components of net assets are primarily attributable to tax deferral of losses on wash sales.
6. Capital Shares
Transactions in capital shares were as follows:
| | | | | | | | |
| | | Year ended | |
| | | 12/31/19 | | | 12/31/18 | |
Shares sold: | | | | | | | | |
Standard Class | | | 709,070 | | | | 384,160 | |
Service Class | | | 699,745 | | | | 1,154,221 | |
Shares issued upon reinvestment of dividends and distributions: | | | | | | | | |
Standard Class | | | 1,274,509 | | | | 1,124,453 | |
Service Class | | | 1,117,290 | | | | 944,964 | |
| | | | | | | | |
| | | 3,800,614 | | | | 3,607,798 | |
| | | | | | | | |
Shares redeemed: | | | | | | | | |
Standard Class | | | (1,536,732 | ) | | | (1,464,041 | ) |
Service Class | | | (1,287,594 | ) | | | (1,570,472 | ) |
| | | | | | | | |
| | | (2,824,326 | ) | | | (3,034,513 | ) |
| | | | | | | | |
Net increase | | | 976,288 | | | | 573,285 | |
| | | | | | | | |
7. Line of Credit
The Series, along with certain other funds in the Delaware Funds (Participants), was a participant in a $220,000,000 revolving line of credit intended to be used for temporary or emergency purposes as an additional source of liquidity to fund redemptions of investor shares. Under the agreement, the Participants were charged an annual commitment fee of 0.15%, which was allocated across the Participants based on a weighted average of the respective net assets of each Participant. The Participants were permitted to borrow up to a maximum ofone-third of their net assets under the agreement. Each Participant was individually, and not jointly, liable for its particular advances, if any, under the line of credit. The line of credit available under the agreement expired on Nov. 4, 2019.
On Nov. 4, 2019, the Participants entered into an amendment to the agreement for a $250,000,000 revolving line of credit. The revolving line of credit is to be used as described above and operates in substantially the same manner as the original agreement. The line of credit available under the agreement expires on Nov. 2, 2020.
The Series had no amounts outstanding as of Dec. 31, 2019, or at any time during the year then ended.
Value Series-15
Delaware VIP® Value Series
Notes to financial statements (continued)
8. Securities Lending
The Series, along with other funds in the Delaware Funds, may lend its securities pursuant to a security lending agreement (Lending Agreement) with The Bank of New York Mellon (BNY Mellon). At the time a security is loaned, the borrower must post collateral equal to the required percentage of the market value of the loaned security, including any accrued interest. The required percentage is: (1) 102% with respect to US securities and foreign securities that are denominated and payable in US dollars; and (2) 105% with respect to foreign securities. With respect to each loan, if on any business day the aggregate market value of securities collateral plus cash collateral held is less than the aggregate market value of the securities that are the subject of such loan, the borrower will be notified to provide additional collateral by the end of the following business day, which, together with the collateral already held, will be not less than the applicable initial collateral requirements for such security loan. If the aggregate market value of securities collateral and cash collateral held with respect to a security loan exceeds the applicable initial collateral requirement, upon the request of the borrower, BNY Mellon must return enough collateral to the borrower by the end of the following business day to reduce the value of the remaining collateral to the applicable initial collateral requirement for such security loan. As a result of the foregoing, the value of the collateral held with respect to a loaned security on any particular day may be more or less than the value of the security on loan. The collateral percentage with respect to the market value of the loaned security is determined by the security lending agent.
Cash collateral received by each series of the Trust is generally invested in a series of individual separate accounts, each corresponding to a series. The investment guidelines permit each separate account to hold certain securities that would be considered eligible securities for a money market fund. Cash collateral received is generally invested in government securities; certain obligations issued by government sponsored enterprises; repurchase agreements collateralized by US Treasury securities; obligations issued by the central government of any Organization for Economic Cooperation and Development (OECD) country or its agencies, instrumentalities, or establishments; obligations of supranational organizations; commercial paper, notes, bonds, and other debt obligations; certificates of deposit, time deposits, and other bank obligations; and asset-backed securities. The Series can also accept US government securities and letters of credit(non-cash collateral) in connection with securities loans.
In the event of default or bankruptcy by the lending agent, realization and/or retention of the collateral may be subject to legal proceedings. In the event the borrower fails to return loaned securities and the collateral received is insufficient to cover the value of the loaned securities and provided such collateral shortfall is not the result of investment losses, the lending agent has agreed to pay the amount of the shortfall to the Series or, at the discretion of the lending agent, replace the loaned securities. The Series continues to record dividends or interest, as applicable, on the securities loaned and is subject to changes in value of the securities loaned that may occur during the term of the loan. The Series has the right under the Lending Agreement to recover the securities from the borrower on demand. With respect to security loans collateralized bynon-cash collateral, the Series receives loan premiums paid by the borrower. With respect to security loans collateralized by cash collateral, the earnings from the collateral investments are shared among the Series, the security lending agent, and the borrower. The Series records security lending income net of allocations to the security lending agent and the borrower.
The Series may incur investment losses as a result of investing securities lending collateral. This could occur if an investment in the collateral investment account defaulted or became impaired. Under those circumstances, the value of a Series’ cash collateral account may be less than the amount the Series would be required to return to the borrowers of the securities and the Series would be required to make up for this shortfall.
During the year ended Dec. 31, 2019, the Series had no securities out on loan.
9. Credit and Market Risk
The Series may invest up to 10% of its net assets in illiquid securities, which may include securities with contractual restrictions on resale, securities exempt from registration under Rule 144A, promulgated under the Securities Act of 1933, as amended, and other securities which may not be readily marketable. The relative illiquidity of these securities may impair the Series from disposing of them in a timely manner and at a fair price when it is necessary or desirable to do so. While maintaining oversight, the Board has delegated to DMC, theday-to-day functions of determining whether individual securities are liquid for purposes of the Series’ limitation on investments in illiquid securities. Securities eligible for resale pursuant to Rule 144A, which are determined to be liquid, are not subject to the Series’ 10% limit on investments in illiquid securities. As of Dec. 31, 2019, there were no Rule 144A securities held by the Series.
10. Contractual Obligations
The Series enters into contracts in the normal course of business that contain a variety of indemnifications. The Series’ maximum exposure under these arrangements is unknown. However, the Series has not had prior claims or losses pursuant to these contracts. Management has reviewed the Series’ existing contracts and expects the risk of loss to be remote.
Value Series-16
Delaware VIP® Value Series
Notes to financial statements (continued)
11. Recent Accounting Pronouncements
In August 2018, the FASB issued an Accounting Standards Update (ASU), ASU2018-13, which changes certain fair value measurement disclosure requirements. ASU2018-13, in addition to other modifications and additions, removes the requirement to disclose the amount and reasons for transfers between Level 1 and Level 2 of the fair value hierarchy, the policy for the timing of transfers between levels and the valuation process for Level 3 fair value measurements. ASU2018-13 is effective for fiscal years, and interim periods within those fiscal years, beginning after Dec. 15, 2019. At this time, management is evaluating the implications of these changes on the financial statements.
12. Subsequent Events
Management has determined that no material events or transactions occurred subsequent to Dec. 31, 2019, that would require recognition or disclosure in the Series’ financial statements.
Value Series-17
Delaware VIP® Trust — Delaware VIP Value Series
Report of independent registered public accounting firm
To the Board of Trustees of Delaware VIP® Trust and Shareholders of Delaware VIP Value Series
Opinion on the Financial Statements
We have audited the accompanying statement of assets and liabilities, including the schedule of investments, of Delaware VIP Value Series (one of the series constituting Delaware VIP® Trust, referred to hereafter as the “Series”) as of December 31, 2019, the related statement of operations for the year ended December 31, 2019, the statements of changes in net assets for each of the two years in the period ended December 31, 2019, including the related notes, and the financial highlights for each of the five years in the period ended December 31, 2019 (collectively referred to as the “financial statements”). In our opinion, the financial statements present fairly, in all material respects, the financial position of the Series as of December 31, 2019, the results of its operations for the year then ended, the changes in its net assets for each of the two years in the period ended December 31, 2019 and the financial highlights for each of the five years in the period ended December 31, 2019 in conformity with accounting principles generally accepted in the United States of America.
Basis for Opinion
These financial statements are the responsibility of the Series’ management. Our responsibility is to express an opinion on the Series’ financial statements based on our audits. We are a public accounting firm registered with the Public Company Accounting Oversight Board (United States) (PCAOB) and are required to be independent with respect to the Series in accordance with the U.S. federal securities laws and the applicable rules and regulations of the Securities and Exchange Commission and the PCAOB.
We conducted our audits of these financial statements in accordance with the standards of the PCAOB. Those standards require that we plan and perform the audit to obtain reasonable assurance about whether the financial statements are free of material misstatement, whether due to error or fraud.
Our audits included performing procedures to assess the risks of material misstatement of the financial statements, whether due to error or fraud, and performing procedures that respond to those risks. Such procedures included examining, on a test basis, evidence regarding the amounts and disclosures in the financial statements. Our audits also included evaluating the accounting principles used and significant estimates made by management, as well as evaluating the overall presentation of the financial statements. Our procedures included confirmation of securities owned as of December 31, 2019 by correspondence with the custodian and transfer agents. We believe that our audits provide a reasonable basis for our opinion.
/s/PricewaterhouseCoopers LLP
Philadelphia, Pennsylvania
February 21, 2020
We have served as the auditor of one or more investment companies in Delaware Funds® by Macquarie since 2010.
Value Series-18
Delaware VIP® Trust — Delaware VIP Value Series
Other Series information (Unaudited)
Board consideration of Investment Advisory andSub-Advisory Agreements for Delaware VIP Value Series at a meeting held August21-22, 2019
At a meeting held on Aug.21-22, 2019 (the “Annual Meeting”), the Board of Trustees (the “Board”), including a majority of disinterested or independent Trustees, approved the renewal of the investment advisory andsub-advisory agreements for Delaware VIP Value Series (the “Series”). In making its decision, the Board considered information furnished at regular quarterly Board meetings, including reports detailing Series performance, investment strategies, and expenses, as well as information prepared specifically in connection with the renewal of the investment advisory andsub-advisory contracts. Information furnished specifically in connection with the renewal of the Investment Management. Agreement with Delaware Management Company (“DMC”), a series of Macquarie Investment Management Business Trust (“MIMBT”) and theSub-Advisory Agreements with Macquarie Funds Management Hong Kong Limited (“MFMHK”) and Macquarie Investment Management Global Limited (“MIMGL”), included materials provided by DMC and its affiliates (collectively, “Macquarie Investment Management”), MFMHK, and MIMGL, concerning, among other things, the nature, extent, and quality of services provided to the Series; the costs of such services to the Series; economies of scale; and the investment manager’s financial condition and profitability. In addition, in connection with the Annual Meeting, materials were provided to the Trustees in May 2019, including reports provided by Broadridge Financial Solutions (“Broadridge”). The Broadridge reports compared the Series’ investment performance and expenses with those of other comparable mutual funds. The Independent Trustees reviewed and discussed the Broadridge reports with independent legal counsel to the Independent Trustees. In addition to the information noted above, the Board also requested and received information regarding DMC’s policy with respect to advisory fee levels and its breakpoint philosophy; the structure of portfolio manager compensation; comparative client fee information; and any constraints or limitations on the availability of securities for certain investment styles, which had in the past year inhibited, or which were likely in the future to inhibit, the investment manager’s ability to invest fully in accordance with Series policies.
In considering information relating to the approval of the Series’ investment advisory andsub-advisory agreements, the Independent Trustees received assistance and advice from and met separately with independent legal counsel to the Independent Trustees and also received assistance and advice from an experienced and knowledgeable independent fund consultant, JDL Consultants, LLC (“JDL”). Although the Board gave attention to all information furnished, the following discussion identifies, under separate headings, the primary factors taken into account by the Board during its contract renewal considerations.
Nature, extent, and quality of services.The Board considered the services provided by DMC to the Series and its shareholders. In reviewing the nature, extent, and quality of services, the Board considered reports furnished to it throughout the year, which covered matters such as the relative performance of the Series; compliance of portfolio managers with the investment policies, strategies, and restrictions for the Series; compliance by DMC and Delaware Distributors, L.P. (together, “Management”) personnel with the Code of Ethics adopted throughout the Delaware Funds® by Macquarie (the “Delaware Funds”); and adherence to fair value pricing procedures as established by the Board. The Board was pleased with the current staffing of DMC and the emphasis placed on research in the investment process. The Board recognized DMC’s receipt of certain favorable industry distinctions during the past several years. The Board gave favorable consideration to DMC’s efforts to control expenses while maintaining service levels committed to Series matters. The Board was satisfied with the nature, extent, and quality of the overall services provided by DMC.
Nature, extent, and quality of services.The Board considered the services provided by MFMHK to the Series and its shareholders. In reviewing the nature, extent, and quality of services, the Board considered reports furnished to it throughout the year at regular Board Meetings covering matters such as relative performance of the Series; compliance of portfolio managers with the investment policies, strategies, and restrictions for the Series; the compliance of MFMHK personnel with its Code of Ethics; and adherence to fair value pricing procedures as established by the Board. The Board was pleased with the current staffing of MFMHK and the emphasis placed on research in the investment process. The Board was satisfied with the nature, extent, and quality of the overall services provided by MFMHK.
Nature, extent, and quality of services.The Board considered the services provided by MIMGL to the Series and its shareholders. In reviewing the nature, extent, and quality of services, the Board considered reports furnished to it throughout the year at regular Board Meetings covering matters such as relative performance of the Series; compliance of portfolio managers with the investment policies, strategies, and restrictions for the Series; the compliance of MIMGL personnel with its Code of Ethics; and adherence to fair value pricing procedures as established by the Board. The Board was pleased with the current staffing of MIMGL and the emphasis placed on research in the investment process. The Board was satisfied with the nature, extent, and quality of the overall services provided by MIMGL.
Investment performance.The Board placed significant emphasis on the investment performance of the Series in view of the importance of investment performance to shareholders. Although the Board considered performance reports and discussions with portfolio managers at Board meetings throughout the year, the Board gave particular weight to the Broadridge reports furnished for the Annual Meeting. The Broadridge reports prepared for the Series showed the investment performance of its Standard Class shares in comparison to a group of similar funds as selected by Broadridge (the “Performance Universe”). A fund with the best performance ranked first, and a fund with the poorest performance ranked last. The highest/best performing 25% of funds in the Performance Universe make up the first quartile; the next 25%, the second quartile; the next 25%, the third quartile; and the poorest/worst performing 25% of funds in the Performance Universe make up the fourth quartile. Comparative annualized performance for the Series was shown for the
Value Series-19
Delaware VIP® Trust — Delaware VIP Value Series
Other Series information (Unaudited)
Board consideration of Investment Advisory andSub-Advisory Agreements for Delaware VIP Value Series at a meeting held August21-22, 2019
past1-,3-,5-. and10-year periods, as applicable, ended Jan. 31, 2019. The Board’s objective is that the Series’ performance for the1-,3-, and5-year periods be at or above the median of its Performance Universe.
The Performance Universe for the Series consisted of the Series and alllarge-cap value funds underlying variable insurance products as selected by Broadridge. The Broadridge report comparison showed that the Series’ total return for the1-,5-, and10-year periods was in the first quartile of its Performance Universe. The report further showed that the Series’ total return for the3-year period was in the second quartile of its Performance Universe. The Board was satisfied with performance.
Comparative expenses.The Board considered expense data for the Delaware Funds. Management provided the Board with information on pricing levels and fee structures for the Series as of its most recently completed fiscal year. The Board also focused on the comparative analysis of effective management fees and total expense ratios of the Series versus effective management fees and expense ratios of a group of similar funds as selected by Broadridge (the “Expense Group”). In reviewing comparative costs, the Series’ contractual management fee and the actual management fee incurred by the Series were compared with the contractual management fees (assuming all funds in the Expense Group were similar in size to the Series) and actual management fees (as reported by each fund) within the Expense Group, taking into account any applicable breakpoints and fee waivers. The Series’ total expenses were also compared with those of its Expense Group. The Broadridge total expenses, for comparative consistency, were shown by Broadridge for Standard Class shares which do not charge12b-1 andnon-12b-1 service fees. The Board’s objective is for each Series’ total expense ratio to be competitive with those of the peer funds within its Expense Group.
The expense comparisons for the Series showed that the actual management fee was in the quartile with the lowest expenses of its Expense Group and its and total expenses were in the quartile with the second lowest expenses of its Expense Group. The Board was satisfied with the management fee and total expenses of the Series in comparison to those of its Expense Group.
Management profitability.The Board considered the level of profits realized by DMC in connection with the operation of the Series. In this respect, the Board reviewed the Investment Management Profitability Analysis that addressed the overall profitability of DMC’s business in providing management and other services to each of the individual funds and the Delaware Funds as a whole. Specific attention was given to the methodology used by DMC in allocating costs for the purpose of determining profitability. Management stated that the level of profits of DMC, to a certain extent, reflects recent operational cost savings and efficiencies initiated by DMC. The Board considered DMC’s efforts to improve services provided to fund shareholders and to meet additional regulatory and compliance requirements resulting from recent industry-wide Securities and Exchange Commission initiatives. The Board also considered the extent to which DMC might derive ancillary benefits from fund operations, including the potential for procuring additional business as a result of the prestige and visibility associated with its role as service provider to the Delaware Funds and the benefits from allocation of fund brokerage to improve trading efficiencies. As part of its work, the Board also reviewed a report prepared by JDL regarding MIMBT profitability as compared to certain peer fund complexes and the Independent Trustees discussed with JDL personnel regarding DMC’s profitability in such context. The Board found that the management fees were reasonable in light of the services rendered and the profitability of DMC.
Economies of scale.The Trustees considered whether economies of scale are realized by DMC as the Series’ assets increase and the extent to which any economies of scale are reflected in the level of management fees charged. The Trustees reviewed the Series’ advisory fee pricing and structure approved by the Board and shareholders, which includes breakpoints, and which applies to most funds in the Delaware Funds complex. Breakpoints in the advisory fee occur when the advisory fee rate is reduced on assets in excess of specified levels. Breakpoints result in a lower advisory fee, than would otherwise be the case in the absence of breakpoints, when the asset levels specified in the breakpoints are exceeded. The Board noted that, as of March 31, 2019, the Series’ assets exceeded the first breakpoint level. The Board believed that, given the extent to which economies of scale might be realized by DMC and its affiliates, the schedule of fees under the Investment Management Agreement provides a sharing of benefits with the Series and its shareholders.
Value Series-20
Delaware VIP® Trust — Delaware VIP Value Series
Other Series information (Unaudited)
Tax Information
All disclosures are based on financial information available as of the date of this annual report and, accordingly is subject to change. For any and all items requiring reporting, it is the intention of the Fund to report the maximum amount permitted under the Internal Revenue Code and the regulations thereunder.
For the year ended Dec. 31, 2019, the Series’ reports distributions paid during the year as follows:
| | | | | | |
| (A) | | | | | | |
| Long-Term | | (B) | | | | |
| Capital Gain | | Ordinary Income | | Total | | (C) |
| Distributions | | Distributions | | Distributions | | Qualifying |
(Tax Basis) | | (Tax Basis) | | (Tax Basis) | | Dividends1 |
| 78.07% | | 21.93% | | 100.00% | | 100.00% |
(A) and (B) are based on a percentage of the Series’ total distributions.
(C) is based on a percentage of the Series’ ordinary income distributions.
1Qualifying dividends represent dividends which qualify for the corporate dividends received deduction.
Value Series-21
Delaware Funds® by Macquarie
Board of trustees / directors and officers addendum
A mutual fund is governed by a Board of Trustees/Directors (“Trustees”), which has oversight responsibility for the management of a fund’s business affairs. Trustees establish procedures and oversee and review the performance of the investment manager, the distributor, and others who perform services for the fund. The independent fund trustees, in particular, are advocates for shareholder interests. Each trustee has served in that capacity since he or she was elected to or appointed to the Board of Trustees, and will continue to serve until his or her retirement or the election of a new trustee in his or her place. The following is a list of the Trustees and Officers with certain background and related information.
| | | | | | | | | | |
Name,
Address,
and Birth Date | | Position(s)
Held with
Fund(s) | | Length of Time
Served | | Principal
Occupation(s)
During the Past Five Years | | Number of
Portfolios in Fund
Complex Overseen
by Trustee
or Officer | | Other
Directorships
Held by
Trustee
or Officer |
INTERESTED TRUSTEE | | | | | | | | |
| | | | | |
Shawn K. Lytle1
2005 Market Street Philadelphia, PA 19103 February 1970 | | President,
Chief Executive Officer, and Trustee | | President and Chief Executive Officer since August 2015 Trustee since September 2015 | | President — Macquarie Investment Management2
(June 2015-Present) Regional Head of Americas — UBS Global Asset Management (April2010-May 2015) | | 95 | | Trustee — UBS Relationship Funds, SMA Relationship Trust, and UBS Funds
(May 2010–April 2015) |
INDEPENDENT TRUSTEES | | | | | | | | |
| | | | | |
Thomas L. Bennett
2005 Market Street Philadelphia, PA 19103 October 1947 | | Chair and Trustee | | Trustee since March 2005 Chair since March 2015 | | Private Investor
(March 2004–Present) | | 95 | | None |
Jerome D. Abernathy 2005 Market Street Philadelphia, PA 19103 July 1959 | | Trustee | | Since January 2019 | | Managing Member, Stonebrook Capital Management, LLC (financial technology: macro factors and databases)
(January 1993–Present) | | 95 | | None |
Ann D. Borowiec
2005 Market Street Philadelphia, PA 19103 November 1958 | | Trustee | | Since
March 2015 | | Chief Executive Officer, Private Wealth Management (2011–2013) and Market Manager, New Jersey Private Bank (2005–2011) — J.P. Morgan Chase & Co. | | 95 | | Director — Banco Santander International (October 2016–December 2019) Director — Santander Bank, N.A. (December 2016–December 2019) |
Joseph W. Chow
2005 Market Street Philadelphia, PA 19103 January 1953 | | Trustee | | Since January 2013 | | Private Investor (April 2011–Present) | | 95 | | Director and Audit Committee Member — Hercules Technology Growth Capital, Inc. (July 2004–July 2014) |
Value Series-22
| | | | | | | | | | |
Name,
Address,
and Birth Date | | Position(s)
Held with
Fund(s) | | Length of Time
Served | | Principal Occupation(s)
During the Past Five Years | | Number of
Portfolios in Fund
Complex Overseen
by Trustee
or Officer | | Other
Directorships
Held by
Trustee
or Officer |
John A. Fry 2005 Market Street Philadelphia, PA 19103 May 1960 | | Trustee | | Since January 2001 | | President — Drexel University
(August 2010–Present) President — Franklin & Marshall College
(July 2002–July 2010) | | 95 | | Director; Compensation Committee and Governance Committee Member — Community Health Systems (May 2004–Present) Director — Drexel Morgan & Co. (2015–Present) Director and Audit Committee Member —vTv Therapeutics LLC (2017–Present) Director and Audit Committee Member — FS Credit Real Estate Income Trust, Inc. (2018–Present) Director — Federal Reserve Bank of Philadelphia (January 2020–Present) |
Lucinda S. Landreth 2005 Market Street Philadelphia, PA 19103 June 1947 | | Trustee | | Since March 2005 | | Private Investor
(2004–Present) | | 95 | | None |
Frances A. Sevilla-Sacasa 2005 Market Street Philadelphia, PA 19103 January 1956 | | Trustee | | Since September 2011 | | Private Investor (January 2017-Present) Chief Executive Officer — Banco Itaú International (April 2012–December 2016) Executive Advisor to Dean (August 2011–March 2012) and Interim Dean (January 2011–July 2011) — University of Miami School of Business Administration President — U.S. Trust, Bank of America Private Wealth Management (Private Banking) (July 2007–December 2008) | | 95 | | Trust Manager and Audit Committee Chair — Camden Property Trust (August 2011–Present) Director; Strategic Planning and Reserves Committee and Nominating and Governance Committee Member — Callon Petroleum Company (December 2019–Present) Director; Audit Committee Member — Carrizo Oil & Gas, Inc. (March 2018–December 2019) |
Thomas K. Whitford 2005 Market Street Philadelphia, PA 19103 March 1956 | | Trustee | | Since January 2013 | | Vice Chairman (2010–April 2013) — PNC Financial Services Group | | 95 | | Director — HSBC North America Holdings Inc. (December 2013-Present) Director — HSBC USA Inc. (July 2014-Present) Director — HSBC Bank USA, National Association (July 2014-March 2017) Director — HSBC Finance Corporation (December 2013-April 2018) |
Value Series-23
| | | | | | | | | | |
Name,
Address,
and Birth Date | | Position(s)
Held with
Fund(s) | | Length of Time
Served | | Principal Occupation(s)
During the
Past Five Years | | Number of
Portfolios in Fund
Complex Overseen
by Trustee
or Officer | | Other
Directorships
Held by
Trustee
or Officer |
Christianna Wood 2005 Market Street Philadelphia, PA 19103 March 1956 | | Trustee | | Since January 2019 | | Chief Executive Officer and President — Gore Creek Capital, Ltd. (August 2009–Present) | | 95 | | Director; Finance Committee and Audit Committee Member — H&R Block Corporation (July 2008–Present) Director; Chair of Investments Committee and Audit Committee Member — Grange Insurance (2013–Present) Trustee; Chair of Nominating and Governance Committee and Audit Committee Member — The Merger Fund (2013–Present), The Merger Fund VL (2013–Present); WCM Alternatives: Event-Driven Fund (2013–Present), and WCM Alternatives: Credit Event Fund (December 2017–Present) Director; Chair of Governance Committee and Audit Committee Member — International Securities Exchange (2010–2016) |
Janet L. Yeomans 2005 Market Street Philadelphia, PA 19103 July 1948 | | Trustee | | Since April 1999 | | Vice President and Treasurer (January 2006–July 2012), Vice President — Mergers & Acquisitions (January 2003–January 2006), and Vice President and Treasurer (July 1995–January 2003) — 3M Company | | 95 | | Director; Personnel and Compensation Committee Chair; Member of Nominating, Investments, and Audit Committees for various periods throughout directorship — Okabena Company (2009-2017) |
Value Series-24
| | | | | | | | | | |
Name,
Address,
and Birth Date | | Position(s)
Held with
Fund(s) | | Length of Time
Served | | Principal
Occupation(s)
During the Past Five Years | | Number of
Portfolios in Fund
Complex Overseen
by Trustee
or Officer | | Other
Directorships
Held by
Trustee
or Officer |
OFFICERS | | | | | | | | |
| | | | | |
David F. Connor 2005 Market Street Philadelphia, PA 19103 December 1963 | | Senior Vice President, General Counsel, and Secretary | | Senior Vice President, since May 2013; General Counsel since May 2015; Secretary since October 2005 | | David F. Connor has served in various capacities at different times at Macquarie Investment Management. | | 95 | | None3 |
Daniel V. Geatens 2005 Market Street Philadelphia, PA 19103 October 1972 | | Vice President and Treasurer | | Vice President and Treasurer since October 2007 | | Daniel V. Geatens has served in various capacities at different times at Macquarie Investment Management. | | 95 | | None3 |
Richard Salus 2005 Market Street Philadelphia, PA 19103 October 1963 | | Senior Vice President and Chief Financial Officer | | Senior Vice President and Chief Financial Officer since November 2006 | | Richard Salus has served in various capacities at different times at Macquarie Investment Management. | | 95 | | None |
1 Shawn K. Lytle is considered to be an “Interested Trustee” because he is an executive officer of the Fund’s(s’) investment advisor.
2 Macquarie Investment Management is the marketing name for Macquarie Management Holdings, Inc. and its subsidiaries, including the Fund’s(s’) investment advisor, principal underwriter, and its transfer agent.
3 David F. Connor and Daniel V. Geatens serve in similar capacities for the six portfolios of the Optimum Fund Trust, which have the same investment advisor, principal underwriter, and transfer agent as the registrant. Mr. Geatens also serves as the Chief Financial Officer of the Optimum Fund Trust and he is the Chief Financial Officer and Treasurer for Macquarie Global Infrastructure Total Return Fund Inc.
The Statement of Additional Information for the Fund(s) includes additional information about the Trustees and Officers and is available, without charge, upon request by calling 800523-1918.
Value Series-25
| | | | |
| | The Series files its complete schedule of portfolio holdings with the Securities and Exchange Commission (SEC) for the first and third quarters of each fiscal year on FormN-Q or FormN-PORT (available for filings after March 31, 2019). The Series’ FormsN-Q or FormsN-PORT, as well as a description of the policies and procedures that the Series uses to determine how to vote proxies (if any) relating to portfolio securities, are available without charge (i) upon request, by calling 800523-1918; and (ii) on the SEC’s website at sec.gov. In addition, a description of the policies and procedures that the Series uses to determine how to vote proxies (if any) relating to portfolio securities and the Schedule of Investments included in the Series’ most recent FormN-Q or FormN-PORT are available without charge on the Series’ website at delawarefunds.com/vip/literature. The Series’ FormsN-Q and FormsN-PORT may be reviewed and copied at the SEC’s Public Reference Room in Washington, D.C.; information on the operation of the Public Reference Room may be obtained by calling 800SEC-0330. Information (if any) regarding how the Series voted proxies relating to portfolio securities during the most recently disclosed12-month period ended June 30 is available without charge (i) through the Series’ website at delawarefunds.com/proxy; and (ii) on the SEC’s website at sec.gov. | | |
| | |
AR-VIPV 22471 (2/20) (1073909) | | ValueSeries-26 |
Delaware VIP® Trust
Delaware VIP Covered Call Strategy Series
(formerly, First Investors Life Series Covered Call Strategy Fund)
December 31, 2019
|
Beginning on or about June 1, 2021, as permitted by regulations adopted by the Securities and Exchange Commission, paper copies of your Series’ shareholder reports will no longer be sent to you by mail, unless you specifically request them from the Series or from your financial intermediary, such as a broker/dealer, bank, or insurance company. Instead, you will be notified by mail each time a report is posted on the website and provided with a link to access the report. If you already elected to receive shareholder reports electronically, you will not be affected by this change and you do not need to take any action. You may elect to receive paper copies of all future shareholder reports free of charge. You can inform the Series that you wish to continue receiving paper copies of your shareholder reports by contacting us at 800523-1918. If you own these shares through a financial intermediary, you may contact your financial intermediary to elect to continue to receive paper copies of your shareholder reports. Your election to receive reports in paper will apply to all funds held with the Delaware Funds® by Macquarie or your financial intermediary. |
Table of contents
Other than Macquarie Bank Limited (MBL), none of the entities noted are authorized deposit-taking institutions for the purposes of the Banking Act 1959 (Commonwealth of Australia). The obligations of these entities do not represent deposits or other liabilities of MBL. MBL does not guarantee or otherwise provide assurance in respect of the obligations of these entities, unless noted otherwise. The Series is governed by US laws and regulations.
Unless otherwise noted, views expressed herein are current as of Dec. 31, 2019, and subject to change for events occurring after such date.
The Series is not FDIC insured and is not guaranteed. It is possible to lose the principal amount invested.
Advisory services provided by Delaware Management Company, a series of Macquarie Investment Management Business Trust (MIMBT), a US registered investment advisor.
The Series is distributed byDelaware Distributors, L.P.(DDLP), an affiliate of MIMBT and Macquarie Group Limited. Macquarie Investment Management (MIM) is the marketing name for certain companies comprising the asset management division of Macquarie Group Limited and its subsidiaries and affiliates worldwide.
This material may be used in conjunction with the offering of shares in Delaware VIP® Covered Call Strategy Series only if preceded or accompanied by the Series’ current prospectus or the summary prospectus.
© 2020 Macquarie Management Holdings, Inc.
All third-party marks cited are the property of their respective owners.
| | |
| Delaware VIP®Trust — Delaware VIP Covered Call Strategy Series |
| Portfolio management review | | January 7, 2020 (Unaudited) |
The investment objective of the Series is to seek long-term capital appreciation.
On April 6, 2019, Foresters Investment Management Company, Inc. (FIMCO), the investment adviser to the First Investors Funds, entered into an agreement with Macquarie Management Holdings, Inc. (MMHI), whereby MMHI, on behalf of its affiliate Delaware Management Company (DMC), a series of Macquarie Investment Management Business Trust (MIMBT), would acquire FIMCO’s asset management business (the “Transaction”). In connection with the Transaction, the Board of Trustees of the First Investors Trusts and the First Investors Fund shareholders approved, pursuant to an Agreement and Plan of Reorganization (the “Agreement”), the transfer of all assets and liabilities of each First Investors Fund to a corresponding, newly formed fund in the Delaware Funds® by Macquarie family of funds. The Transaction closed on Oct. 4, 2019.
Ziegler Capital Management, LLC (ZCM), a US registered investment advisor, is thesub-advisor to Delaware VIP Covered Call Strategy Series (“the Series”). Assub-advisor, ZCM is responsible forday-to-day management of the Series’ assets. Although ZCM serves assub-advisor, the investment manager, DMC, a series of MIMBT, has ultimate responsibility for all investment advisory services.
During the fiscal year ended Dec. 31, 2019, the Series’ Standard Class shares returned 21.37%. This figure reflects all dividends reinvested. The Series’ benchmark, the CBOE S&P 500® BuyWrite Index, gained 15.68% for the same period. Both the stocks and the options in the Series outperformed the benchmark during the year. Effective Oct. 4, 2019, the Series changed its primary index from the S&P 500® Index to the CBOE S&P 500 BuyWrite Index. The Series elected to use the new index because it more closely reflected the Series’ investment strategies.
In a reversal from 2018, nearly every major asset class, including bonds, produced strong returns during the fiscal year ended Dec. 31, 2019. The S&P 500 Index returned 31.5% during the period, the fourth-highest calendar year return of the past 30 years. The reflation in asset prices was driven, in large part, by the US Federal Reserve’s pivot to accommodative monetary policy. The Fed cut rates three times during 2019, the first cuts since December 2008, and is likely to remain on the sidelines in the coming quarters. While trade concerns waxed and waned throughout 2019, the year ended with a Phase 1 agreement with China that is likely to keep trade worries off the table at least until after the 2020 election.
In general, low inflation and low unemployment together provide many benefits to the economy, and investors have historically paid a premium to own stocks in such an environment. According to the third estimate released by the Bureau of Economic Analysis, US gross domestic product (GDP) growth for the third quarter of 2019 was 2.1%,in-line with the current cycle average. Consumers have benefited from rising wages and an unemployment rate of 3.5%, the lowest in more than 50 years, thereby supporting growth. Interest rates and inflation remained low, with the10-year Treasury yielding 1.92% at the end of the Series’ fiscal year.
Unlike the past five years, during which growth stocks significantly outperformed value stocks, we believe there has been no consistent winner in 2019. This change in the market has created an environment that we believe is more favorable to stock picking.
Source: Bloomberg.
Because of the heightened levels of implied volatility at the end of 2018, the Series began 2019 with the most favorable call options since inception of the Series. Due to the tailwind from these favorable call options, the Series returned 14.39% during the first half of 2019, outperforming the benchmark as both the stocks and the options in the Series outperformed. Over the course of the full year, the call options in the Series outperformed the call options in the benchmark. The Series’ call options outperformed for three main reasons: (1) the actively selected, single stock call options of the Series tend to provide higher call premiums than the passively selected options of the benchmark; (2) the Series’ call options were actively rolled higher in strike price as the market rallied throughout the year, allowing the Series more upside participation, compared to the benchmark’sat-the-money call options which can limit upside participation; and 3) the high implied volatility at the end of 2018 allowed us to“lock-in” high call premiums on longer term options, which gradually decayed during the first half of 2019. The benchmark does not have that opportunity because it is limited to short-term,1-month options.
Calendar year 2019 can be characterized as a stock-pickers market, which enabled the Series’ actively managed stock portfolio to outperform the benchmark during the year. In the Series’ stock portfolio, both sector allocation and stock selection were positive during the year. An underweight to the underperforming healthcare and energy sectors contributed to the Series’ performance. An overweight to the strong-performing technology sector also contributed, while an overweight in materials detracted from the Series’ performance. Stock selection in industrials and healthcare contributed to performance but detracted from Series returns in materials and technology.
The Series is invested in what we view as attractively valued stocks with strong fundamentals and a bias towardUS-based earnings. The stocks are undervalued relative to the S&P 500 Index, with a forward price-earnings (P/E) ratio of 16.2 for the stocks in the Series versus a forward P/E ratio of 18.3 for the S&P 500 Index. The Series is underweight the healthcare sector, given increasing calls for price regulation, especially for pharmaceuticals. The Series is also underweight communication services due to the increasing risk of government regulation, anti-trust concerns, and privacy concerns. The Series is
| | |
| Unless otherwise noted, views expressed herein are current as of Dec. 31, 2019, and subject to change. |
Covered Call Strategy Series-1
| | |
| Delaware VIP®Trust — Delaware VIP Covered Call Strategy Series |
| Portfolio management review (continued) | | January 7, 2020 (Unaudited) |
overweight defense stocks, as there continues to be government support for defense spending – not only in the United States, but also internationally. As market risks have begun to fade and global demand regains a more solid footing, we have added some economic sensitivity into the Series’ portfolio on the margin, particularly in the energy sector, which, we think, has become significantly undervalued relative to the market.
Although implied volatility has been below average for the overall market, we have maintained solid call premiums by actively selecting what we view as the most attractive call options for each stock in the Series. This process has resulted in a call option portfolio that ended the year with an average strike price 0.3% above existing stock prices and an average of 1.1 months until expiration. As we manage the active option writing strategy in the Series, we will continue to closely monitor implied volatility opportunities that have the potential to add further excess return versus the rules-based, index options of the CBOE S&P 500 BuyWrite Index. We continue to believe reasonably pricedlarge-cap stocks offer the strongest risk-reward potential going forward, especially when combined with call premiums that may help stabilize returns and provide downside protection.
| | |
| Unless otherwise noted, views expressed herein are current as of Dec. 31, 2019, and subject to change. |
Covered Call Strategy Series-2
Delaware VIP® Trust — Delaware VIP Covered Call Strategy Series
Performance summary (Unaudited)
The performance quoted represents past performance and does not guarantee future results. Investment return and principal value of an investment will fluctuate so that shares, when redeemed, may be worth more or less than their original cost. Current performance may be lower or higher than the performance quoted.
Carefully consider the Series’ investment objectives, risk factors, charges, and expenses before investing. This and other information can be found in the Series’ prospectus and its summary prospectus, which may be obtained by visiting delawarefunds.com/vip/literature or calling 800523-1918. Investors should read the prospectus and the summary prospectus carefully before investing.
| | | | | | | | | | | | | | | | | | | | | | | | |
| Delaware VIP Covered Call Strategy Series | | | | | | | | | | | | | | | | | | |
| Average annual total returns | | | | | | | | | | | | | | | | | | |
| For periods ended December 31, 2019 | | 1 year | | | 3 year | | | 5 year | | | 10 year | | | Lifetime | | | | |
Standard Class shares (commenced operations on May 2, 2016) | | | +21.37% | | | | +6.66% | | | | — | | | | — | | | | +6.91% | | | | | |
| | | | | | | | | | | | | | | | | | | | | | | | |
CBOE S&P 500 BuyWrite Index (current benchmark) | | | +15.68% | | | | +7.58% | | | | — | | | | — | | | | +8.24% | | | | | |
| | | | | | | | | | | | | | | | | | | | | | | | |
S&P 500 Index (former benchmark) | | | +31.49% | | | | +15.27% | | | | — | | | | — | | | | +15.30% | | | | | |
| | | | | | | | | | | | | | | | | | | | | | | | |
Returns reflect the reinvestment of all distributions. Please see page 4 for a description of the indices.
As described in the Series’ most recent prospectus, the net expense ratio for Standard Class shares of the Series was 0.90%, while total operating expenses for Standard Class shares were 1.12%. The management fee for Standard Class shares was 0.75%. DMC has contractually agreed to waive all or a portion of its investment advisory fees and/or pay/reimburse expenses (excluding any12b-1 fees, acquired fund fees and expenses, taxes, interest, short sale and dividend interest expenses, brokerage fees, certain insurance costs, and nonroutine expenses or costs, including, but not limited to, those relating to reorganizations, litigation, conducting shareholder meetings, and liquidations) in order to prevent annual series operating expenses from exceeding 0.90% of the Series’ average daily net assets from Oct. 4, 2019 through Dec. 31, 2019.* Please see the most recent prospectus and any applicable supplement(s) for additional information on these fee waivers and/or reimbursements. Please see the “Financial highlights” section in this report for the most recent expense ratios.
Earnings from a variable annuity or variable life investment compoundtax-free until withdrawal, and as a result, no adjustments were made for income taxes.
Expense limitations were in effect for Standard Class shares during certain periods shown in the Series performance table above and in the Performance of a $10,000 Investment graph on the next page.
Performance data do not reflect insurance fees related to a variable annuity or variable life investment or the deferred sales charge that would apply to certain withdrawals of investments held for fewer than eight years. Performance shown here would have been reduced if such fees were included and the expense limitation removed. For more information about fees, consult your variable annuity or variable life prospectus.
Investments in variable products involve risk.
Narrowly focused investments may exhibit higher volatility than investments in multiple industry sectors.
The Series may experience portfolio turnover in excess of 100%, which could result in higher transaction costs and tax liability.
Writing call options involves risks, such as potential losses if equity markets or an individual equity security do not move as expected and the potential for greater losses than if these techniques had not been used.
At times, the Series may not be able to identify attractive dividend-paying stocks. The income received by the Series will also fluctuate due to the amount of dividends that companies elect to pay, which could adversely affect the Series’ ability to pay dividends and its share price.
A covered call is a transaction in which the investor selling call options owns the equivalent amount of the underlying security. Call options are financial contracts that give the option buyer the right, but not the obligation, to buy a security at a specified price within a specific time period. The investor’s long position in the asset is the “cover” because it means the seller can deliver the shares if the buyer of the call option chooses to exercise.
By writing covered call options, the Series will give up the opportunity to benefit from potential increases in the value of a Series asset above the exercise price but will bear the risk of declines in the value of the asset. Writing call options may expose the Series to significant additional costs. Derivatives may be difficult to sell, unwind or value.
Covered Call Strategy Series-3
Delaware VIP® Covered Call Strategy Series
Performance summary (Unaudited) (continued)
Writing call options may significantly reduce or eliminate the amount of Series dividends that qualify to be taxed tonon-corporate shareholders at a lower rate. Covered calls also are subject to federal tax rules that may: (1) limit the allowance of certain losses or deductions by the Series (2) convert the Series’ long-term capital gains into higher taxed short-term capital gains or ordinary income; (3) convert the Series’ ordinary losses or deductions to capital losses, the deductibility of which is more limited; and/or (4) cause the Series to recognize income or gains without a corresponding receipt of cash.
An exchange-traded fund (ETF) is a security that represents all the stocks on a given exchange. ETF shares can be bought, sold, short-sold, traded on margin, and generally function as if they were stocks.
Liquidity risk is the possibility that investments cannot be readily sold within seven days at approximately the price at which a fund has valued them.
The Series may invest in derivatives, which may involve additional expenses and are subject to risk, including the risk that an underlying security or securities index moves in the opposite direction from what the portfolio manager anticipated. A derivatives transaction depends upon the counterparties’ ability to fulfill their contractual obligations. Please read both the contract and underlying prospectus for specific details regarding the product’s risk profile.
| *The | aggregate contractual waiver period covering this report is from Oct. 4, 2019 through Oct. 31, 2021. |
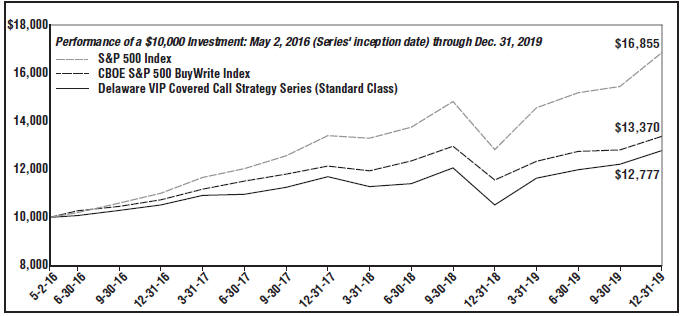
| | | | |
| For period beginning May 2, 2016 (Series’ inception date) through Dec. 31, 2019 | | Starting value | | Ending value |
– – S&P 500 Index | | $10,000 | | $16,855 |
– – CBOE S&P 500 BuyWrite Index | | $10,000 | | $13,370 |
— Delaware VIP Covered Call Strategy Series (Standard Class) | | $10,000 | | $12,777 |
The graph shows a $10,000 investment in the Delaware VIP Covered Call Strategy Series Standard Class shares for the period from May 2, 2016 through Dec. 31, 2019.
The graph also shows $10,000 invested in the CBOE S&P 500 BuyWrite Index and the S&P 500 Index for the period from May 2, 2016 through Dec. 31, 2019.
The CBOE S&P 500 BuyWrite Index is designed to show the hypothetical performance of a portfolio that engages in abuy-write strategy using S&P 500 Index call options.
The S&P 500 Index measures the performance of 500 mostlylarge-cap stocks weighted by market value, and is often used to represent performance of the US stock market.
Gross domestic product is a measure of all goods and services produced by a nation in a year.
Index performance returns do not reflect any management fees, transaction costs or expenses. Indices are unmanaged and one cannot invest directly in an index.
Past performance is not a guarantee of future results.
Covered Call Strategy Series-4
Delaware VIP® Trust — Delaware VIP Covered Call Strategy Series
Disclosure of Series expenses
For thesix-month period from July 1, 2019 to December 31, 2019 (Unaudited)
As a shareholder of the Series, you incur ongoing costs, which may include management fees; distribution and service(12b-1) fees; and other Series expenses. This example is intended to help you understand your ongoing costs (in dollars) of investing in the Series and to compare these costs with the ongoing costs of investing in other mutual funds.
The example is based on an investment of $1,000 invested at the beginning of the period and held for the entiresix-month period from July 1, 2019 to Dec. 31, 2019.
Actual expenses
The first section of the table shown, “Actual Series return,” provides information about actual account values and actual expenses. You may use the information in this section of the table, together with the amount you invested, to estimate the expenses that you paid over the period. Simply divide your account value by $1,000 (for example, an $8,600 account value divided by $1,000 = 8.6), then multiply the result by the number in the first section under the heading entitled “Expenses Paid During Period” to estimate the expenses you paid on your account during the period.
Hypothetical example for comparison purposes
The second section of the table shown, “Hypothetical 5% return,” provides information about hypothetical account values and hypothetical expenses based on the Series’ actual expense ratio and an assumed rate of return of 5% per year before expenses, which is not the Series’ actual return. The hypothetical account values and expenses may not be used to estimate the actual ending account balance or expenses you paid for the period. You may use this information to compare the ongoing costs of investing in the Series and other funds. To do so, compare this 5% hypothetical example with the 5% hypothetical examples that appear in the shareholder reports of other funds.
Please note that the expenses shown in the table are meant to highlight your ongoing costs only. As a shareholder of the Series, you do not incur any transaction costs, such as sales charges (loads), redemption fees or exchange fees, but shareholders of other funds may incur such costs. Also, the fees related to the variable annuity investment or the deferred sales charge that could apply have not been included. Therefore, the second section of the table is useful in comparing ongoing costs only, and will not help you determine the relative total costs of owning different funds. The Series’ expenses shown in the table reflect fee waivers in effect and assume reinvestment of all dividends and distributions.
Expense analysis of an investment of $1,000
| | | | | | | | | | | | | | | | |
| | | Beginning
Account
Value
7/1/19 | | | Ending
Account
Value
12/31/19 | | | Annualized
Expense
Ratio | | | Expenses Paid During
Period
7/1/19 to 12/31/19* | |
| | |
Actual Seriesreturn† | | | | | | | | | |
Standard Class | | | $1,000.00 | | | | $1,065.90 | | | | 0.91% | | | | $4.74 | |
|
Hypothetical 5% return(5% return before expenses) | |
Standard Class | | | $1,000.00 | | | | $1,020.62 | | | | 0.91% | | | | $4.63 | |
| * | “Expenses Paid During Period” are equal to the Series’ annualized expense ratio, multiplied by the average account value over the period, multiplied by 184/365 (to reflect theone-half year period). |
| † | Because actual returns reflect only the most recentsix-month period, the returns shown may differ significantly from fiscal year returns. |
In addition to the Series’ expenses reflected above, the Series also indirectly bears its portion of the fees and expenses of the investment companies (Underlying Funds) in which it invests. The table above does not reflect the expenses of the Underlying Funds.
Covered Call Strategy Series-5
Delaware VIP® Trust — Delaware VIP Covered Call Strategy Series
Security type / sector allocation and top 10 equity holdings
As of December 31, 2019 (Unaudited)
Sector designations may be different than the sector designations presented in other Series materials. The sector designations may represent the investment manager’s internal sector classifications
| | | | |
| | | Percentage | |
| Security type / sector | | of net assets | |
Common Stock | | | 101.56% | |
Communication Services | | | 3.05% | |
Consumer Discretionary | | | 8.64% | |
Consumer Staples | | | 11.04% | |
Energy | | | 6.14% | |
Financials | | | 13.48% | |
Healthcare | | | 11.56% | |
Industrials | | | 15.48% | |
Information Technology | | | 27.17% | |
Materials | | | 5.00% | |
Short-Term Investments | | | 0.89% | |
Total Value of Securities Before Options Written | | | 102.45% | |
Options Written | | | (2.91)% | |
Receivables and Other Assets Net of Liabilities | | | 0.46% | |
| |
Total Net Assets | | | 100.00% | |
Holdings are for informational purposes only and are subject to change at any time. They are not a recommendation to buy, sell, or hold any security
| | |
| Top 10 equity holdings | | Percentage
of net assets |
Apple | | 5.91% |
Microsoft | | 5.70% |
JPMorgan Chase & Co. | | 5.04% |
Medtronic | | 4.93% |
Mastercard Class A | | 4.51% |
Lockheed Martin | | 4.28% |
Chevron | | 3.97% |
Cisco Systems | | 3.82% |
Costco Wholesale | | 3.50% |
Broadcom | | 3.47% |
Covered Call Strategy Series-6
Delaware VIP® Trust — Delaware VIP Covered Call Strategy Series
Schedule of investments
December 31, 2019
| | | | | | | | |
| | | Number of | | | Value | |
| | | shares | | | (US $) | |
Common Stock – 101.56% | | | | | |
Communication Services – 3.05% | | | | | |
AT&T ~ | | | 10,500 | | | $ | 410,340 | |
ViacomCBS Class B ~ | | | 6,100 | | | | 256,017 | |
| | | | | | | | |
| | | | | | | 666,357 | |
| | | | | | | | |
Consumer Discretionary – 8.64% | | | | | |
Home Depot ~ | | | 3,400 | | | | 742,492 | |
Ross Stores ~ | | | 4,400 | | | | 512,248 | |
Whirlpool ~ | | | 4,300 | | | | 634,379 | |
| | | | | | | | |
| | | | | | | 1,889,119 | |
| | | | | | | | |
Consumer Staples – 11.04% | | | | | |
Constellation Brands Class A ~ | | | 1,700 | | | | 322,575 | |
Costco Wholesale ~ | | | 2,600 | | | | 764,192 | |
General Mills ~ | | | 6,700 | | | | 358,852 | |
Mondelez International Class A ~ | | | 10,000 | | | | 550,800 | |
Philip Morris International ~ | | | 4,900 | | | | 416,941 | |
| | | | | | | | |
| | | | | | | 2,413,360 | |
| | | | | | | | |
Energy – 6.14% | | | | | |
Chevron ~ | | | 7,200 | | | | 867,672 | |
ConocoPhillips ~ | | | 7,300 | | | | 474,719 | |
| | | | | | | | |
| | | | | | | 1,342,391 | |
| | | | | | | | |
Financials – 13.48% | | | | | |
Allstate ~ | | | 4,600 | | | | 517,270 | |
American Express ~ | | | 5,000 | | | | 622,450 | |
BlackRock ~ | | | 1,400 | | | | 703,780 | |
JPMorgan Chase & Co. ~ | | | 7,900 | | | | 1,101,260 | |
| | | | | | | | |
| | | | | | | 2,944,760 | |
| | | | | | | | |
Healthcare – 11.56% | | | | | |
Bristol-Myers Squibb ~ | | | 8,200 | | | | 526,358 | |
Medtronic ~ | | | 9,500 | | | | 1,077,775 | |
Merck & Co. ~ | | | 6,200 | | | | 563,890 | |
Thermo Fisher Scientific ~ | | | 1,100 | | | | 357,357 | |
| | | | | | | | |
| | | | | | | 2,525,380 | |
| | | | | | | | |
Industrials – 15.48% | | | | | |
Delta Air Lines ~ | | | 7,000 | | | | 409,360 | |
Honeywell International ~ | | | 3,900 | | | | 690,300 | |
Lockheed Martin ~ | | | 2,400 | | | | 934,512 | |
Raytheon ~ | | | 2,300 | | | | 505,402 | |
Union Pacific ~ | | | 2,100 | | | | 379,659 | |
United Technologies ~ | | | 3,100 | | | | 464,256 | |
| | | | | | | | |
| | | | | | | 3,383,489 | |
| | | | | | | | |
Information Technology – 27.17% | | | | | |
Apple ~ | | | 4,400 | | | | 1,292,060 | |
Broadcom ~ | | | 2,400 | | | | 758,448 | |
Cisco Systems ~ | | | 17,400 | | | | 834,504 | |
International Business Machines ~ | | | 3,200 | | | | 428,928 | |
Mastercard Class A ~ | | | 3,300 | | | | 985,347 | |
Microsoft ~ | | | 7,900 | | | | 1,245,830 | |
Oracle ~ | | | 7,400 | | | | 392,052 | |
| | | | | | | | |
| | | | | | | 5,937,169 | |
| | | | | | | | |
Materials – 5.00% | | | | | | | | |
Dow ~ | | | 4,000 | | | | 218,920 | |
| | | | | | | | |
| | | Number of | | | Value | |
| | | shares | | | (US $) | |
Common Stock (continued) | | | | | |
Materials (continued) | | | | | |
DuPont de Nemours ~ | | | 8,700 | | | $ | 558,540 | |
Nucor ~ | | | 5,600 | | | | 315,168 | |
| | | | | | | | |
| | | | | | | 1,092,628 | |
| | | | | | | | |
Total Common Stock
(cost $17,952,248) | | | | 22,194,653 | |
| | | | | | | | |
| |
Short-Term Investments – 0.89% | | | | | |
Money Market Mutual Funds – 0.89% | |
BlackRock FedFund – Institutional Shares(seven-day effective yield 1.52%) | | | 38,712 | | | | 38,712 | |
Fidelity Investments Money Market Government Portfolio – Class I(seven-day effective yield 1.49%) | | | 38,712 | | | | 38,712 | |
GS Financial Square Government Fund – Institutional Shares(seven-day effective yield 1.51%) | | | 38,712 | | | | 38,712 | |
Morgan Stanley Government Portfolio – Institutional Share Class(seven-day effective yield 1.48%) | | | 38,712 | | | | 38,712 | |
State Street Institutional US Government Money Market Fund – Investor Class(seven-day effective yield 1.45%) | | | 38,711 | | | | 38,711 | |
| | | | | | | | |
Total Short-Term Investments
(cost $193,559) | | | | 193,559 | |
| | | | | | | | |
Total Value of Securities Before
Options Written – 102.45%
(cost $18,145,807) | | | | 22,388,212 | |
| | | | | | | | |
| | | Number of | | | | |
| | | contracts | | | | |
Options Written – (2.91%) | | | | | |
Equity Call Options – (2.91%) | | | | | |
Allstate strike price $110, expiration date 1/17/20, notional amount ($253,000) | | | (23 | ) | | | (6,957 | ) |
Allstate strike price $115, expiration date 1/17/20, notional amount ($264,500) | | | (23 | ) | | | (770 | ) |
American Express strike price $125, expiration date 1/17/20, notional amount ($625,000) | | | (50 | ) | | | (5,850 | ) |
Apple strike price $240, expiration date 1/17/20, notional amount ($504,000) | | | (21 | ) | | | (113,872 | ) |
Apple strike price $255, expiration date 1/17/20, notional amount ($586,500) | | | (23 | ) | | | (89,872 | ) |
AT&T strike price $38, expiration date 1/17/20, notional amount ($399,000) | | | (105 | ) | | | (13,703 | ) |
BlackRock strike price $500, expiration date 1/17/20, notional amount ($700,000) | | | (14 | ) | | | (15,050 | ) |
Covered Call Strategy Series-7
Delaware VIP® Covered Call Strategy Series
Schedule of investments (continued)
| | | | | | | | |
| | | Number of | | | Value | |
| | | contracts | | | (US $) | |
Options Written (continued) | | | | | |
Equity Call Options (continued) | | | | | |
Bristol-Myers Squibb strike price $67.50, expiration date 2/21/20, notional amount ($553,500) | | | (82 | ) | | $ | (6,929) | |
Broadcom strike price $320, expiration date 2/21/20, notional amount ($768,000) | | | (24 | ) | | | (22,560 | ) |
Chevron strike price $120, expiration date 1/17/20, notional amount ($96,000) | | | (8 | ) | | | (1,676 | ) |
Chevron strike price $125, expiration date 1/17/20, notional amount ($800,000) | | | (64 | ) | | | (1,568 | ) |
Cisco Systems strike price $49, expiration date 1/31/20, notional amount ($852,600) | | | (174 | ) | | | (8,004 | ) |
ConocoPhillips strike price $65, expiration date 1/17/20, notional amount ($188,500) | | | (29 | ) | | | (4,176 | ) |
ConocoPhillips strike price $67.50, expiration date 2/21/20, notional amount ($297,000) | | | (44 | ) | | | (6,490 | ) |
Constellation Brands strike price $205, expiration date 1/17/20, notional amount ($348,500) | | | (17 | ) | | | (1,615 | ) |
Costco Wholesale strike price $305, expiration date 1/17/20, notional amount ($793,000) | | | (26 | ) | | | (1,586 | ) |
Delta Air Lines strike price $60, expiration date 3/20/20, notional amount ($420,000) | | | (70 | ) | | | (11,690 | ) |
Dow strike price $55, expiration date 1/17/20, notional amount ($220,000) | | | (40 | ) | | | (4,000 | ) |
DuPont de Nemours strike price $66, expiration date 1/31/20, notional amount ($574,200) | | | (87 | ) | | | (11,788 | ) |
General Mills strike price $55, expiration date 1/17/20, notional amount | | | | | | | | |
($368,500) | | | (67 | ) | | | (1,474 | ) |
Home Depot strike price $225, expiration date 1/17/20, notional amount ($765,000) | | | (34 | ) | | | (2,380 | ) |
Honeywell International strike price $175, expiration date 1/17/20, notional amount ($490,000) | | | (28 | ) | | | (10,220 | ) |
Honeywell International strike price $185, expiration date 1/17/20, notional amount ($203,500) | | | (11 | ) | | | (132 | ) |
| | | | | | | | |
| | | Number of | | | Value | |
| | | contracts | | | (US $) | |
Options Written (continued) | | | | | |
Equity Call Options (continued) | |
International Business Machines strike price $140, expiration date 1/17/20, notional amount ($448,000) | | | (32 | ) | | $ | (576) | |
JPMorgan Chase & Co. strike price $140, expiration date 3/20/20, notional amount ($1,106,000) | | | (79 | ) | | | (34,562 | ) |
Lockheed Martin strike price $410, expiration date 1/17/20, notional amount ($984,000) | | | (24 | ) | | | (300 | ) |
Mastercard strike price $280, expiration date 1/17/20, notional amount ($924,000) | | | (33 | ) | | | (63,278 | ) |
Medtronic strike price $114, expiration date 1/24/20, notional amount ($1,083,000) | | | (95 | ) | | | (14,488 | ) |
Merck & Co. strike price $87.50, expiration date 1/17/20, notional amount ($542,500) | | | (62 | ) | | | (23,405 | ) |
Microsoft strike price $160, expiration date 3/20/20, notional amount ($1,264,000) | | | (79 | ) | | | (36,538 | ) |
Mondelez International strike price $55, expiration date 2/21/20, notional amount ($550,000) | | | (100 | ) | | | (15,700 | ) |
Nucor strike price $60, expiration date 2/21/20, notional amount ($336,000) | | | (56 | ) | | | (3,304 | ) |
Oracle strike price $55, expiration date 2/21/20, notional amount ($407,000) | | | (74 | ) | | | (3,330 | ) |
Philip Morris International strike price $87.50, expiration date 3/20/20, notional amount ($428,750) | | | (49 | ) | | | (11,319 | ) |
Raytheon strike price $180, expiration date 1/17/20, notional amount ($54,000) | | | (3 | ) | | | (11,902 | ) |
Raytheon strike price $230, expiration date 2/21/20, notional amount ($460,000) | | | (20 | ) | | | (5,030 | ) |
Ross Stores strike price $115, expiration date 1/17/20, notional amount ($506,000) | | | (44 | ) | | | (11,990 | ) |
Thermo Fisher Scientific strike price $310, expiration date 1/17/20, notional amount ($341,000) | | | (11 | ) | | | (17,765 | ) |
Union Pacific strike price $180, expiration date 2/21/20, notional amount ($378,000) | | | (21 | ) | | | (14,700 | ) |
Covered Call Strategy Series-8
Delaware VIP® Covered Call Strategy Series
Schedule of investments (continued)
| | | | | | | | |
| | | Number of | | | Value | |
| | | contracts | | | (US $) | |
Options Written (continued) | | | | | |
Equity Call Options (continued) | | | | | |
United Technologies strike price $150, expiration date 1/17/20, notional amount ($465,000) | | | (31 | ) | | $ | (6,154) | |
ViacomCBS strike price $45, expiration date 1/17/20, notional amount ($274,500) | | | (61 | ) | | | (732 | ) |
| | | | | | | | |
| | | Number of | | | Value | |
| | | contracts | | | (US $) | |
Options Written (continued) | | | | | |
Equity Call Options (continued) | | | | | |
Whirlpool strike price $150, expiration date 1/31/20, notional amount ($645,000) | | | (43 | ) | | $ | (18,598) | |
| | | | | | | | |
Total Options Written
(premium received $619,777) | | | | (636,033 | ) |
| | | | | | | | |
| ~ | All or portion of the security has been pledged as collateral with outstanding options written. |
GS – Goldman Sachs
See accompanying notes, which are an integral part of the financial statements.
Covered Call Strategy Series-9
| | | | |
| Delaware VIP® Trust — Delaware VIP Covered Call Strategy Series | | | | |
| Statement of assets and liabilities | | | December 31, 2019 | |
| | | | |
Assets: | | | | |
Investments, at value1 | | $ | 22,388,212 | |
Receivable for securities sold | | | 130,456 | |
Dividends and interest receivable | | | 23,106 | |
Receivable due from advisor | | | 8,829 | |
Receivable for series shares sold | | | 1,933 | |
Foreign tax reclaims receivable | | | 1,026 | |
Other assets | | | 327 | |
| | | | |
Total assets | | | 22,553,889 | |
| | | | |
Liabilities: | | | | |
Options written, at value2 | | | 636,033 | |
Audit and tax fees payable | | | 40,233 | |
Payable for series shares redeemed | | | 10,876 | |
Accounting and Administration expenses payable tonon-affiliates | | | 6,290 | |
Reports and statements to shareholders expenses payable tonon-affiliates | | | 3,108 | |
Other accrued expenses | | | 2,486 | |
Accounting and administration expenses payable to affiliates | | | 401 | |
Pricing fees payable | | | 250 | |
Trustees’ fees and expenses payable | | | 214 | |
Dividend disbursing and transfer agent fees and expenses payable to affiliates | | | 138 | |
Legal fees payable to affiliates | | | 34 | |
Reports and statements to shareholders expenses payable to affiliates | | | 34 | |
| | | | |
Total liabilities | | | 700,097 | |
| | | | |
Total Net Assets | | $ | 21,853,792 | |
| | | | |
| |
Net Assets Consist of: | | | | |
Paid-in capital | | $ | 18,724,132 | |
Total distributable earnings (loss) | | | 3,129,660 | |
| | | | |
Total Net Assets | | $ | 21,853,792 | |
| | | | |
| |
Net Asset Value: | | | | |
Standard Class: | | | | |
Net assets | | $ | 21,853,792 | |
Shares of beneficial interest outstanding, unlimited authorization, no par | | | 1,755,357 | |
Net asset value per share | | $ | 12.45 | |
| |
1Investments, at cost | | $ | 18,145,807 | |
2Premium received | | | (619,777 | ) |
See accompanying notes, which are an integral part of the financial statements.
Covered Call StrategySeries-10
Delaware VIP® Trust —
Delaware VIP Covered Call Strategy Series
Statement of operations
Year ended December 31, 2019
| | | | |
Investment Income: | | | | |
Dividends | | $ | 488,798 | |
| | | | |
Expenses: | | | | |
Management fees | | | 156,943 | |
Audit and tax fees | | | 40,275 | |
Accounting and administration expenses | | | 9,797 | |
Reports and statements to shareholders | | | 9,261 | |
Custodian fees | | | 4,605 | |
Trustees’ fees and expenses | | | 1,889 | |
Legal fees | | | 470 | |
Dividend disbursing and transfer agent fees and expenses | | | 422 | |
Other | | | 4,281 | |
| | | | |
| | | 227,943 | |
Less expenses waived | | | (35,169 | ) |
Less expenses paid indirectly | | | (550 | ) |
| | | | |
Total operating expenses | | | 192,224 | |
| | | | |
Net Investment Income | | | 296,574 | |
| | | | |
|
Net Realized and Unrealized Gain (Loss): | |
Net realized loss on: | | | | |
Investments | | | 190,376 | |
Options written | | | (1,434,631 | ) |
| | | | |
Net realized loss | | | (1,244,255 | ) |
| | | | |
Net change in unrealized appreciation (depreciation) of: | | | | |
Investments | | | 4,937,887 | |
Options written | | | (107,146 | ) |
| | | | |
Net change in unrealized appreciation (depreciation) | | | 4,830,741 | |
| | | | |
Net Realized and Unrealized Gain | | | 3,586,486 | |
| | | | |
Net Increase in Net Assets Resulting from Operations | | $ | 3,883,060 | |
| | | | |
Delaware VIP Trust —
Delaware VIP Covered Call Strategy Series
Statements of changes in net assets
| | | | | | | | |
| | | Year ended | |
| | | 12/31/19 | | | 12/31/18 | |
Increase (Decrease) in Net Assets from Operations: | | | | | | | | |
Net investment income | | $ | 296,574 | | | $ | 214,738 | |
Net realized gain (loss) | | | (1,244,255 | ) | | | 79,161 | |
Net change in unrealized appreciation (depreciation) | | | 4,830,741 | | | | (2,140,100 | ) |
| | | | | | | | |
Net increase (decrease) in net assets resulting from operations | | | 3,883,060 | | | | (1,846,201 | ) |
| | | | | | | | |
| | |
Dividends and Distributions to Shareholders from: | | | | | | | | |
Distributable earnings: | | | | | | | | |
Standard Class | | | (214,737 | ) | | | (132,946 | ) |
| | | | | | | | |
| | |
Capital Share Transactions: | | | | | | | | |
Proceeds from shares sold: | | | | | | | | |
Standard Class | | | 2,910,716 | | | | 8,617,171 | |
Net asset value of shares issued upon reinvestment of dividends and distributions: | | | | | | | | |
Standard Class | | | 214,737 | | | | 132,946 | |
| | | | | | | | |
| | | 3,125,453 | | | | 8,750,117 | |
| | | | | | | | |
Cost of shares redeemed: | | | | | | | | |
Standard Class | | | (2,299,235 | ) | | | (795,938 | ) |
| | | | | | | | |
Increase in net assets derived from capital share transactions | | | 826,218 | | | | 7,954,179 | |
| | | | | | | | |
Net Increase in Net Assets | | | 4,494,541 | | | | 5,975,032 | |
| | |
Net Assets: | | | | | | | | |
Beginning of year | | | 17,359,251 | | | | 11,384,219 | |
| | | | | | | | |
End of year | | $ | 21,853,792 | | | $ | 17,359,251 | |
| | | | | | | | |
See accompanying notes, which are an integral part of the financial statements.
Covered Call Strategy Series-11
Delaware VIP® Trust — Delaware VIP Covered Call Strategy Series
Financial highlights
Selected data for each share of the Series outstanding throughout each period were as follows:
| | | | | | | | | | | | | | | | | | | | |
| | | Delaware VIP Covered Call Strategy Series Standard Class |
| | | Year ended | | 5/2/162 to |
| | | 12/31/191 | | 12/31/18 | | 12/31/17 | | 12/31/16 |
Net asset value, beginning of period | | | $ | 10.37 | | | | $ | 11.65 | | | | $ | 10.53 | | | | $ | 10.00 | |
| | | | |
Income (loss) from investment operations: | | | | | | | | | | | | | | | | | | | | |
Net investment income3 | | | | 0.17 | | | | | 0.16 | | | | | 0.14 | | | | | 0.07 | |
Net realized and unrealized gain (loss) | | | | 2.03 | | | | | (1.31 | ) | | | | 1.02 | | | | | 0.46 | |
| | | | | | | | | | | �� | | | | | | | | | |
Total from investment operations | | | | 2.20 | | | | | (1.15 | ) | | | | 1.16 | | | | | 0.53 | |
| | | | | | | | | | | | | | | | | | | | |
| | | | |
Less dividends and distributions from: | | | | | | | | | | | | | | | | | | | | |
Net investment income | | | | (0.12 | ) | | | | (0.13 | ) | | | | (0.04 | ) | | | | — | |
| | | | | | | | | | | | | | | | | | | | |
Total dividends and distributions | | | | (0.12 | ) | | | | (0.13 | ) | | | | (0.04 | ) | | | | — | |
| | | | | | | | | | | | | | | | | | | | |
| | | | |
Net asset value, end of period | | | $ | 12.45 | | | | $ | 10.37 | | | | $ | 11.65 | | | | $ | 10.53 | |
| | | | | | | | | | | | | | | | | | | | |
| | | | |
Total return4 | | | | 21.37%5 | | | | | (9.99% | ) | | | | 11.07% | | | | | 5.30% | |
| | | | |
Ratios and supplemental data: | | | | | | | | | | | | | | | | | | | | |
Net assets, end of period (000 omitted) | | | $ | 21,854 | | | | $ | 17,359 | | | | $ | 11,384 | | | | $ | 10,208 | |
Ratio of expenses to average net assets6 | | | | 0.92% | | | | | 0.98% | | | | | 1.06% | | | | | 1.73% | |
Ratio of expenses to average net assets prior to fees waived6 | | | | 1.09% | | | | | 0.98% | | | | | 1.06% | | | | | 1.73% | |
Ratio of net investment income to average net assets | | | | 1.42% | | | | | 1.44% | | | | | 1.26% | | | | | 0.97% | |
Ratio of net investment income to average net assets prior to fees waived | | | | 1.25% | | | | | 1.44% | | | | | 1.26% | | | | | 0.97% | |
Portfolio turnover | | | | 56% | | | | | 87% | | | | | 143% | | | | | 96%7 | |
| 1 | On Oct. 4, 2019, the First Investors Life Series Covered Call Strategy Fund shares were reorganized into Standard Class shares of the Series. See “Notes to financial statements.” The Standard Class shares financial highlights for the period prior to Oct. 4, 2019, reflect the performance of the First Investors Life Series Covered Call Strategy Fund shares. |
| 2 | Date of commencement of operations; ratios have been annualized and total return has not been annualized. |
| 3 | The average shares outstanding method has been applied for per share information. |
| 4 | Total return is based on the change in net asset value of a share during the period and assumes reinvestment of dividends and distributions at net asset value. Total return does not include fees, charges, or expenses imposed by the variable annuity and life insurance contracts for which Delaware VIP Trust serves as an underlying investment vehicle. |
| 5 | Total return during the period reflects a waiver by the manager. Performance would have been lower had the waiver not been in effect. |
| 6 | Expense ratios do not include expenses of the Underlying Funds in which the Series invests. |
| 7 | Portfolio turnover is representative of the Series for the entire year. |
See accompanying notes, which are an integral part of the financial statements.
Covered Call StrategySeries-12
Delaware VIP® Trust — Delaware VIP Covered Call Strategy Series
Notes to financial statements
December 31, 2019
Delaware VIP Trust (Trust) is organized as a Delaware statutory trust. The Trust consists of 22 series, each of which is treated as a separate entity for certain matters under the Investment Company Act of 1940, as amended (1940 Act). These financial statements and the related notes pertain to Delaware VIP Covered Call Strategy Series (Series). The Trust is anopen-end investment company. The Series is considered diversified under the 1940 Act and offers Standard Class shares. The Standard Class shares do not carry a distribution and service(12b-1) fee. The shares of the Series are sold only to separate accounts of life insurance companies.
Before the Series commenced operations, on Oct. 4, 2019, all of the assets and liabilities of the First Investors Life Series Covered Call Strategy Fund, its respective Predecessor Series (Predecessor Series) were transferred to the Series in atax-free reorganization as set forth in an agreement and plan of reorganization (each a Foresters Reorganization) between the Trust, on behalf of the Series, and Foresters Investment Management Company, Inc. (FIMCO), on behalf of the Predecessor Series. As a result of the Foresters Reorganization, the Series assumed the performance and accounting history of its Predecessor Series. Financial information included for the dates prior to the Foresters Reorganization is that of the Predecessor Series.
1. Significant Accounting Policies
The Series follows accounting and reporting guidance under Financial Accounting Standards Board (FASB) Accounting Standards Codification Topic 946, Financial Services – Investment Companies. The following accounting policies are in accordance with US generally accepted accounting principles (US GAAP) and are consistently followed by the Series.
Security Valuation — Equity securities, except those traded on the Nasdaq Stock Market LLC (Nasdaq), are valued at the last quoted sales price as of the time of the regular close of the New York Stock Exchange on the valuation date. Equity securities traded on the Nasdaq are valued in accordance with the Nasdaq Official Closing Price, which may not be the last sales price. If, on a particular day, an equity security does not trade, the mean between the bid and ask prices will be used, which approximates fair value. Equity securities listed on a foreign exchange are normally valued at the last quoted sales price on the valuation date. Exchange-traded options are valued at the last reported sale price or, if no sales are reported, at the mean between the last reported bid and ask prices, which approximates fair value.Open-end investment companies are valued at their published net asset value (NAV). Generally, other securities and assets for which market quotations are not readily available are valued at fair value as determined in good faith under the direction of the Trust’s Board of Trustees (Board). In determining whether market quotations are readily available or fair valuation will be used, various factors will be taken into consideration, such as market closures or suspension of trading in a security. Restricted securities are valued at fair value using methods approved by the Board.
Federal Income Taxes — No provision for federal income taxes has been made as the Series intends to continue to qualify for federal income tax purposes as a regulated investment company under Subchapter M of the Internal Revenue Code of 1986, as amended, and make the requisite distributions to shareholders. The Series evaluates tax positions taken or expected to be taken in the course of preparing the Series’ tax returns to determine whether the tax positions are“more-likely-than-not” of being sustained by the applicable tax authority. Tax positions not deemed to meet the“more-likely-than-not” threshold are recorded as a tax benefit or expense in the current year. Management has analyzed the Series’ tax positions taken or expected to be taken on the Series’ federal income tax returns through the year ended Dec. 31, 2019 and for all open tax years (years ended Dec. 31, 2016–Dec. 31, 2018), and has concluded that no provision for federal income tax is required in the Series’ financial statements. If applicable, the Series recognizes interest accrued on unrecognized tax benefits in interest expense and penalties in “Other” on the “Statement of operations.” During the year ended Dec. 31, 2019, the Series did not incur any interest or tax penalties.
Use of Estimates — The preparation of financial statements in conformity with US GAAP requires management to make estimates and assumptions that affect the fair value of investments, the reported amounts of assets and liabilities and disclosure of contingent assets and liabilities at the date of the financial statements, and the reported amounts of revenues and expenses during the reporting period. Actual results could differ from those estimates and the differences could be material.
Other — Expenses directly attributable to the Series are charged directly to the Series. Other expenses common to various funds within the Delaware Funds® by Macquarie (Delaware Funds) are generally allocated among such funds on the basis of average net assets. Management fees and certain other expenses are paid monthly. Security transactions are recorded on the date the securities are purchased or sold (trade date) for financial reporting purposes. Costs used in calculating realized gains and losses on the sale of investment securities are those of the specific securities sold. Dividend income is recorded on theex-dividend date and interest income is recorded on the accrual basis. Withholding taxes and reclaims on foreign dividends have been recorded in accordance with the Series’ understanding of the applicable country’s tax rules and rates. The Series declares and pays dividends from net investment income and distributions from net realized gain on investments, if any, following the close of the fiscal year. The Series may distribute more frequently, if necessary for tax purposes. Dividends and distributions, if any, are recorded on theex-dividend date.
The Series receives earnings credits from its custodian when positive cash balances are maintained, which may be used to offset custody fees. The expenses paid under this arrangement are included on the “Statement of operations” under “Custodian fees” with the corresponding expenses offset included under “Less expenses paid indirectly.” For the year ended Dec. 31, 2019, the Series earned $550 under this arrangement.
Covered Call Strategy Series-13
Delaware VIP® Covered Call Strategy Series
Notes to financial statements (continued)
1. Significant Accounting Policies (continued)
The Series receives earnings credits from its transfer agent when positive cash balances are maintained, which may be used to offset transfer agent fees. If the amount earned is greater than $1, the expenses paid under this arrangement are included on the “Statement of operations” under “Dividend disbursing and transfer agent fees and expenses” with the corresponding expenses offset included under “Less expenses paid indirectly.” There were no such earnings credits for the year ended Dec. 31, 2019.
2. Investment Management, Administration Agreements, and Other Transactions with Affiliates
In accordance with the terms of its investment management agreement, effective Oct. 4, 2019, the Series pays Delaware Management Company (DMC), a series of Macquarie Investment Management Business Trust and the investment manager, an annual fee which is calculated daily and paid monthly at the rates of 0.75% on the first $250 million of average daily net assets of the Series, 0.72% on the next $250 million, 0.69% on the next $250 million, 0.66% on the next $500 million, 0.64% on the next $500 million, 0.62% on the next $500 million, and 0.60% on average daily net assets in excess of $2.25 billion. Prior to Oct. 4, 2019, the Series paid FIMCO, an annual fee which was calculated daily and paid monthly at the rates of 0.75% on the first $250 million of average daily net assets of the Series, 0.72% on the next $250 million, 0.69% on the next $250 million, 0.66% on the next $500 million, 0.64% on the next $500 million, 0.62% on the next $500 million, and 0.60% on average daily net assets in excess of $2.25 billion.
DMC has contractually agreed to waive all or a portion of its investment advisory fees and/or pay/reimburse expenses (excluding any acquired fund fees and expenses, taxes, interest, short sale dividend and interest expenses, brokerage fees, certain insurance costs, and nonroutine expenses or costs, including, but not limited to, those relating to reorganizations, litigation, conducting shareholder meetings, and liquidations), do not exceed 0.90% of the Series’ average daily net assets from Oct. 4, 2019 through Dec. 31, 2019.* These waivers and reimbursements may only be terminated by agreement of DMC and the Series. The waivers and reimbursements are accrued daily and received monthly.
Effective Oct. 4, 2019, Ziegler Capital Management, LLC (ZCM) furnishes investmentsub-advisory services to the Series. For these services, DMC, not the Series, pays ZCM a fee, which is based on the aggregate average daily net assets at the rates of 0.27% on the first $500 million, 0.25% on the next $500 million, and 0.20% on average daily net assets in excess of $1 billion of the Series, Delaware Covered Call Strategy Fund, and Delaware Premium Income Fund.
Effective Oct. 4, 2019, Delaware Investments Fund Services Company (DIFSC), an affiliate of DMC, provides fund accounting and financial administration oversight services to the Series. For these services, DIFSC’s fees are calculated daily and paid monthly based on the aggregate daily net assets of all funds within the Delaware Funds at the following annual rates: 0.00475% of the first $35 billion; 0.0040% of the next $10 billion; and 0.0025% of aggregate average daily net assets in excess of $45 billion (Total Fee). Each fund in the Delaware Funds pays a minimum of $4,000, which, in aggregate, is subtracted from the Total Fee. Each fund then pays its portion of the remainder of the Total Fee on a relative NAV basis. This amount is included on the “Statement of operations” under “Accounting and administration expenses.” For the period Oct. 4, 2019 through year ended Dec. 31, 2019, the Series was charged $1,182 for these services. Prior to Oct. 4, 2019, there were no fund accounting and financial administration oversight services for the Series.
Effective Oct. 4, 2019, DIFSC is also the transfer agent and dividend disbursing agent of the Series. For these services, DIFSC’s fees are calculated daily and paid monthly at the annual rate of 0.0075% of the Series’ average daily net assets. This amount is included on the “Statement of operations” under “Dividend disbursing and transfer agent fees and expenses.” For the period Oct. 4, 2019 through year ended Dec. 31, 2019, the Series was charged $392 for these services. Pursuant to asub-transfer agency agreement between DIFSC and BNY Mellon Investment Servicing (US) Inc. (BNYMIS), BNYMIS provides certainsub-transfer agency services to the Series.Sub-transfer agency fees are paid directly by the Series and are also included on the “Statement of operations” under “Dividend disbursing and transfer agent fees and expenses.” The fees that are calculated daily and paid as invoices are received on a monthly or quarterly basis. Prior to Oct. 4, 2019, Foresters Investor Services, Inc. was the transfer agent of the Series.
As provided in the investment management agreement, the Series bears a portion of the cost of certain resources shared with DMC, including the cost of internal personnel of DMC and/or its affiliates that provide legal, tax, and regulatory reporting services to the Series. For the period Oct. 4, 2019 through year ended Dec. 31, 2019, the Series was charged $106 for internal legal, tax, and regulatory reporting services provided by DMC and/or its affiliates’ employees. These amounts are included on the “Statement of operations” under “Legal fees.”
Trustees’ fees include expenses accrued by the Series for each Trustee’s retainer and meeting fees. Certain officers of DMC, DIFSC, and DDLP are officers and/or Trustees of the Trust. These officers and Trustees are paid no compensation by the Series.
In addition to the management fees and other expenses of the Series, the Series indirectly bears the investment management fees and other expenses of the investment companies (Underlying Funds) in which it invests. The amount of these fees and expenses incurred indirectly by the Series will vary based
Covered Call StrategySeries-14
Delaware VIP® Covered Call Strategy Series
Notes to financial statements (continued)
2. Investment Management, Administration Agreements, and Other Transactions with Affiliates (continued)
upon the expense and fee levels of the Underlying Funds and the number of shares that are owned of the Underlying Funds at different times.
*The aggregate contractual waiver period covering this report is from Oct. 4, 2019 through Oct. 31, 2021.
3. Investments
For the year ended Dec. 31, 2019, the Series made purchases and sales of investment securities other than short-term investments as follows:
| | | | |
Purchases | | $ | 11,672,971 | |
Sales | | | 12,106,011 | |
The tax cost of investments and derivatives includes adjustments to net unrealized appreciation (depreciation) which may not necessarily be the final tax cost basis adjustments, but approximate the tax basis unrealized gains and losses that may be realized and distributed to shareholders. At Dec. 31, 2019, the cost and unrealized appreciation (depreciation) of investments and derivatives for federal income tax purposes for the Series were as follows:
| | | | | | |
Cost of
Investments
and Derivatives | | Aggregate
Unrealized
Appreciation of Investments
and Derivatives | | Aggregate Unrealized
Depreciation of Investments
and Derivatives | | Net Unrealized
Appreciation of Investments
and Derivatives |
| $17,551,785 | | $4,426,272 | | $(225,878) | | $4,200,394 |
US GAAP defines fair value as the price that the Series would receive to sell an asset or pay to transfer a liability in an orderly transaction between market participants at the measurement date under current market conditions. A three-level hierarchy for fair value measurements has been established based upon the transparency of inputs to the valuation of an asset or liability. Inputs may be observable or unobservable and refer broadly to the assumptions that market participants would use in pricing the asset or liability. Observable inputs reflect the assumptions that market participants would use in pricing the asset or liability based on market data obtained from sources independent of the reporting entity. Unobservable inputs reflect the reporting entity’s own assumptions about the assumptions that market participants would use in pricing the asset or liability based on the best information available under the circumstances. The Series’ investment in its entirety is assigned a level based upon the observability of the inputs which are significant to the overall valuation. The three-level hierarchy of inputs is summarized below.
| | | | |
| Level 1 | | – | | Inputs are quoted prices in active markets for identical investments. (Examples: equity securities,open-end investment companies, futures contracts, and exchange-traded options contracts) |
| Level 2 | | – | | Other observable inputs, including, but not limited to: quoted prices for similar assets or liabilities in markets that are active, quoted prices for identical or similar assets or liabilities in markets that are not active, inputs other than quoted prices that are observable for the assets or liabilities (such as interest rates, yield curves, volatilities, prepayment speeds, loss severities, credit risks, and default rates) or other market-corroborated inputs. (Examples: debt securities, government securities, swap contracts, foreign currency exchange contracts, foreign securities utilizing international fair value pricing, broker-quoted securities, and fair valued securities) |
| Level 3 | | – | | Significant unobservable inputs, including the Series’ own assumptions used to determine the fair value of investments. (Examples: broker-quoted securities and fair valued securities) |
Level 3 investments are valued using significant unobservable inputs. The Series may also use an income-based valuation approach in which the anticipated future cash flows of the investment are discounted to calculate fair value. Discounts may also be applied due to the nature or duration of any restrictions on the disposition of the investments. Valuations may also be based upon current market prices of securities that are comparable in coupon, rating, maturity, and industry. The derived value of a Level 3 investment may not represent the value which is received upon disposition and this could impact the results of operations.
Covered Call Strategy Series-15
Delaware VIP® Covered Call Strategy Series
Notes to financial statements (continued)
3. Investments (continued)
The following table summarizes the valuation of the Series’ investments by fair value hierarchy levels as of Dec. 31, 2019:
| | | | |
Securities | | Level 1 | |
Assets: | | | | |
Common Stock | | $ | 22,194,653 | |
Short-Term Investments | | | 193,559 | |
| | | | |
Total Value of Securities | | $ | 22,388,212 | |
| | | | |
Liabilities: | | | | |
Options Written | | $ | (636,033 | ) |
| | | | |
During the year ended Dec. 31, 2019, there were no transfers between Level 1 investments, Level 2 investments, or Level 3 investments that had a significant impact to the Series. The Series’ policy is to recognize transfers between levels based on fair value at the beginning of the reporting period.
A reconciliation of Level 3 investments is presented when the Series has a significant amount of Level 3 investments at the beginning, interim, or end of the period in relation to net assets. During the year ended Dec. 31, 2019, there were no Level 3 investments.
4. Dividend and Distribution Information
Income and long-term capital gain distributions are determined in accordance with federal income tax regulations, which may differ from US GAAP. Additionally, distributions from net short-term gains on sales of investment securities are treated as ordinary income for federal income tax purposes. The tax character of dividends and distributions paid during the years ended Dec. 31, 2019 and 2018 was as follows:
| | | | | | | | |
| | | Year ended | |
| | | 12/31/19 | | | 12/31/18 | |
Ordinary income | | $ | 214,737 | | | $ | 132,946 | |
5. Components of Net Assets on a Tax Basis
As of Dec. 31, 2019, the components of net assets on a tax basis were as follows:
| | | | |
Shares of beneficial interest | | $ | 18,724,132 | |
Undistributed ordinary income | | | 296,574 | |
Capital loss carryforwards | | | (1,367,308 | ) |
Net unrealized appreciation on investments and derivatives | | | 4,200,394 | |
| | | | |
Net assets | | $ | 21,853,792 | |
| | | | |
The differences between the book basis and tax basis components of net assets are primarily attributable to tax deferral of losses on wash sales and tax deferral of losses on straddles.
For federal income tax purposes, capital loss carryforwards may be carried forward and applied against future capital gains.
At Dec. 31, 2019, capital loss carryforwards available to offset future realized gains were as follows:
| | | | | | |
| Loss carryforward character | |
Short-term | | Long-term | | Total | |
$1,367,308 | | $— | | $ | 1,367,308 | |
Covered Call Strategy Series-16
Delaware VIP® Covered Call Strategy Series
Notes to financial statements (continued)
6. Capital Shares
Transactions in capital shares were as follows:
| | | | | | | | |
| | | Year ended | |
| | | 12/31/19 | | | 12/31/18 | |
Shares sold: | | | | | | | | |
Standard Class | | | 256,899 | | | | 753,965 | |
Shares issued upon reinvestment of dividends and distributions: | | | | | | | | |
Standard Class | | | 19,139 | | | | 11,796 | |
| | | | | | | | |
| | | 276,038 | | | | 765,761 | |
| | | | | | | | |
Shares redeemed: | | | | | | | | |
Standard Class | | | (194,764 | ) | | | (68,955 | ) |
| | | | | | | | |
Net increase | | | 81,274 | | | | 696,806 | |
| | | | | | | | |
7. Line of Credit
On Nov. 4, 2019, the Series, along with certain other funds in the Delaware Funds (Participants), is a participant in a $250,000,000 revolving line of credit intended to be used for temporary or emergency purposes as an additional source of liquidity to fund redemptions of investor shares. Under the agreement, the Participants are charged an annual commitment fee of 0.15%, which is allocated across the Participants based on a weighted average of the respective net assets of each Participant. The Participants are permitted to borrow up to a maximum ofone-third of their net assets under the agreement. Each Participant is individually, and not jointly, liable for its particular advances, if any, under the line of credit. The line of credit available under the agreement expires on Nov. 2, 2020.
The Series had no amounts outstanding as of Dec. 31, 2019, or at any time during the period then ended.
8. Derivatives
US GAAP requires disclosures that enable investors to understand: (1) how and why an entity uses derivatives; (2) how they are accounted for; and (3) how they affect an entity’s results of operations and financial position.
Options Contracts— The Series may enter into options contracts in the normal course of pursuing its investment objective. The Series may buy or write options contracts for any number of reasons, including without limitation: to manage the Series’ exposure to changes in securities prices caused by interest rates or market conditions and foreign currencies; as an efficient means of adjusting the Series’ overall exposure to certain markets; to protect the value of portfolio securities; and as a cash management tool. The Series may buy or write call or put options on securities, futures, swaps, swaptions, financial indices, and foreign currencies. When the Series buys an option, a premium is paid and an asset is recorded and adjusted on a daily basis to reflect the current market value of the option purchased. When the Series writes an option, a premium is received and a liability is recorded and adjusted on a daily basis to reflect the current market value of the option written. Premiums received from writing options that expire unexercised are treated by the Series on the expiration date as realized gains. The difference between the premium received and the amount paid on effecting a closing purchase transaction, including brokerage commissions, is treated as realized gain or loss. If a call option is exercised, the premium is added to the proceeds from the sale of the underlying security in determining whether the Series has a realized gain or loss. If a put option is exercised, the premium reduces the cost basis of the securities purchased by the Series. The Series, as writer of an option, bears the market risk of an unfavorable change in the price of the security underlying the written option. When writing options, the Series is subject to minimal counterparty risk because the counterparty is only obligated to pay premiums and does not bear the market risk of an unfavorable market change.
During the year ended Dec. 31, 2019, the Series used options contracts to manage the Series’ exposure to changes in securities prices caused by interest rates or market conditions, to protect the value of portfolio securities, and to receive premiums for writing options.
Fair values of derivative instruments as of Dec. 31, 2019 were as follows:
| | |
| | | Liability Derivatives Fair Value |
| | | Equity |
Statement of Assets and Liabilities Location | | Contracts |
Options written, at value | | $(636,033) |
Covered Call Strategy Series-17
Delaware VIP® Covered Call Strategy Series
Notes to financial statements (continued)
8. Derivatives (continued)
The effect of derivative instruments on the “Statement of operations” for the year ended Dec. 31, 2019 was as follows:
| | |
| | | Net Realized Gain (Loss) on: |
| | | Options |
| | | Written |
Equity contracts | | $(1,434,631) |
| |
| | | Net Change in Unrealized |
| | | Appreciation (Depreciation) of: |
| | | Options |
| | | Written |
Equity contracts | | $(107,146) |
The table below summarizes the average balance of derivative holdings by the Series during the year ended Dec. 31, 2019.
| | | | |
| | | Long | | Short |
| | | Derivatives | | Derivatives |
| | | Volume | | Volume |
Options contracts (average notional value) | | $— | | $661,540 |
9. Securities Lending
Effective Oct. 4, 2019, the Series, along with other funds in the Delaware Funds, may lend its securities pursuant to a security lending agreement (Lending Agreement) with The Bank of New York Mellon (BNY Mellon). At the time a security is loaned, the borrower must post collateral equal to the required percentage of the market value of the loaned security, including any accrued interest. The required percentage is: (1) 102% with respect to US securities and foreign securities that are denominated and payable in US dollars; and (2) 105% with respect to foreign securities. With respect to each loan, if on any business day, the aggregate market value of securities collateral plus cash collateral held is less than the aggregate market value of the securities which are the subject of such loan, the borrower will be notified to provide additional collateral by the end of the following business day, which, together with the collateral already held, will be not less than the applicable initial collateral requirements for such security loan. If the aggregate market value of securities collateral and cash collateral held with respect to a security loan exceeds the applicable initial collateral requirement, upon the request of the borrower, BNY Mellon must return enough collateral to the borrower by the end of the following business day to reduce the value of the remaining collateral to the applicable initial collateral requirement for such security loan. As a result of the foregoing, the value of the collateral held with respect to a loaned security on any particular day, may be more or less than the value of the security on loan. The collateral percentage with respect to the market value of the loaned security is determined by the security lending agent.
Cash collateral received by each series of the Trust is generally invested in a series of individual separate accounts, each corresponding to a series. The investment guidelines permit each separate account to hold certain securities that would be considered eligible securities for a money market fund. Cash collateral received is generally invested in government securities; certain obligations issued by government sponsored enterprises; repurchase agreements collateralized by US Treasury securities; obligations issued by the central government of any Organization for Economic Cooperation and Development (OECD) country or its agencies, instrumentalities, or establishments; obligations of supranational organizations; commercial paper, notes, bonds, and other debt obligations; certificates of deposit, time deposits, and other bank obligations; and asset-backed securities. The Series can also accept US government securities and letters of credit(non-cash collateral) in connection with securities loans.
In the event of default or bankruptcy by the lending agent, realization and/or retention of the collateral may be subject to legal proceedings. In the event the borrower fails to return loaned securities and the collateral received is insufficient to cover the value of the loaned securities and provided such collateral shortfall is not the result of investment losses, the lending agent has agreed to pay the amount of the shortfall to the Series or, at the discretion of the lending agent, replace the loaned securities. The Series continues to record dividends or interest, as applicable, on the securities loaned and is subject to changes in value of the securities loaned that may occur during the term of the loan. The Series has the right under the Lending Agreement to recover the securities from the borrower on demand. With respect to security loans collateralized bynon-cash collateral, the Series receives loan premiums paid by the borrower. With respect to security loans collateralized by cash collateral, the earnings from the collateral investments are shared among the Series, the security lending agent, and the borrower. The Series records security lending income net of allocations to the security lending agent and the borrower.
The Series may incur investment losses as a result of investing securities lending collateral. This could occur if an investment in the collateral investment account defaulted or became impaired. Under those circumstances, the value of the Series’ cash collateral account may be less than the amount the Series would be required to return to the borrowers of the securities and the Series would be required to make up for this shortfall.
During the year ended Dec. 31, 2019, the Series had no securities out on loan.
Covered Call Strategy Series-18
Delaware VIP® Covered Call Strategy Series
Notes to financial statements (continued)
10. Credit and Market Risk
The Series may invest up to 10% of its net assets in illiquid securities, which may include securities with contractual restrictions on resale, securities exempt from registration under Rule 144A, promulgated under the Securities Act of 1933, as amended, and other securities which may not be readily marketable. The relative illiquidity of these securities may impair the Series from disposing of them in a timely manner and at a fair price when it is necessary or desirable to do so. While maintaining oversight, the Board has delegated to DMC theday-to-day functions of determining whether individual securities are liquid for purposes of the Series’ limitation on investments in illiquid securities. Securities eligible for resale pursuant to Rule 144A, which are determined to be liquid, are not subject to the Series’ 10% limit on investments in illiquid securities. As of Dec. 31, 2019, there were no Rule 144A securities held by the Series.
11. Contractual Obligations
The Series enters into contracts in the normal course of business that contain a variety of indemnifications. The Series’ maximum exposure under these arrangements is unknown. However, the Series has not had prior claims or losses pursuant to these contracts. Management has reviewed the Series’ existing contracts and expects the risk of loss to be remote.
12. Recent Accounting Pronouncements
In August 2018, the FASB issued an Accounting Standard Update (ASU), ASU2018-13, which changes certain fair value measurement disclosure requirements. The ASU2018-13, in addition to other modifications and additions, removes the requirement to disclose the amount and reasons for transfers between Level 1 and Level 2 of the fair value hierarchy, the policy for the timing of transfers between levels and the valuation process for Level 3 fair value measurements. TheASU 2018-13 is effective for fiscal years, and interim periods within those fiscal years, beginning after Dec. 15, 2019. At this time, management is evaluating the implications of these changes on the financial statements.
13. Subsequent Events
Management has determined that no material events or transactions occurred subsequent to Dec. 31, 2019, that would require recognition or disclosure in the Series’ financial statements.
Covered Call Strategy Series-19
Delaware VIP® Trust — Delaware VIP Covered Call Strategy Series
Report of independent registered public accounting firm
To the Board of Trustees of Delaware VIP® Trust and Shareholders of Delaware VIP Covered Call Strategy Series
Opinion on the Financial Statements
We have audited the accompanying statement of assets and liabilities, including the schedule of investments, of Delaware VIP Covered Call Strategy Series (one of the series constituting Delaware VIP® Trust, referred to hereafter as the “Series”) as of December 31, 2019, the related statements of operations and changes in net assets, including the related notes, and the financial highlights for the year then ended (collectively referred to as the “financial statements”). In our opinion, the financial statements present fairly, in all material respects, the financial position of the Series as of December 31, 2019, the results of its operations, changes in its net assets, and the financial highlights for the year then ended in conformity with accounting principles generally accepted in the United States of America.
The financial statements of First Investors Life Series Covered Call Strategy Fund (subsequent to reorganization, known as Delaware VIP Covered Call Strategy Series) as of and for the year ended December 31, 2018 and the financial highlights for each of the periods ended on or prior to December 31, 2018 (not presented herein, other than the statement of changes in net assets and the financial highlights) were audited by other auditors whose report dated February 26, 2019 expressed an unqualified opinion on those financial statements and financial highlights.
Basis for Opinion
These financial statements are the responsibility of the Series’ management. Our responsibility is to express an opinion on the Series’ financial statements based on our audit. We are a public accounting firm registered with the Public Company Accounting Oversight Board (United States) (PCAOB) and are required to be independent with respect to the Series in accordance with the U.S. federal securities laws and the applicable rules and regulations of the Securities and Exchange Commission and the PCAOB.
We conducted our audit of these financial statements in accordance with the standards of the PCAOB. Those standards require that we plan and perform the audit to obtain reasonable assurance about whether the financial statements are free of material misstatement, whether due to error or fraud.
Our audit included performing procedures to assess the risks of material misstatement of the financial statements, whether due to error or fraud, and performing procedures that respond to those risks. Such procedures included examining, on a test basis, evidence regarding the amounts and disclosures in the financial statements. Our audit also included evaluating the accounting principles used and significant estimates made by management, as well as evaluating the overall presentation of the financial statements. Our procedures included confirmation of securities owned as of December 31, 2019 by correspondence with the custodian, transfer agents and brokers. We believe that our audit provides a reasonable basis for our opinion.
/s/PricewaterhouseCoopers LLP
Philadelphia, Pennsylvania
February 28, 2020
We have served as the auditor of one or more investment companies in Delaware Funds® by Macquarie since 2010.
Covered Call Strategy Series-20
Delaware VIP® Trust — Delaware VIP Covered Call Strategy Series
Other Series information (Unaudited)
Tax Information
All disclosures are based on financial information available as of the date of this annual report and, accordingly are subject to change. For any and all items requiring reporting, it is the intention of the Series to report the maximum amount permitted under the Internal Revenue Code and the regulations thereunder.
For the year ended Dec. 31, 2019, the Series reports distributions paid during the year as follows:
|
| (A) |
| Ordinary Income |
| Distributions |
| (Tax Basis) |
100.00% |
(A) is based on a percentage of the Series’ total distributions.
Covered Call StrategySeries-21
DelawareFunds® by Macquarie
Board of trustees / directors and officers addendum
A mutual fund is governed by a Board of Trustees/Directors (“Trustees”), which has oversight responsibility for the management of a fund’s business affairs. Trustees establish procedures and oversee and review the performance of the investment manager, the distributor, and others who perform services for the fund. The independent fund trustees, in particular, are advocates for shareholder interests. Each trustee has served in that capacity since he or she was elected to or appointed to the Board of Trustees, and will continue to serve until his or her retirement or the election of a new trustee in his or her place. The following is a list of the Trustees and Officers with certain background and related information.
| | | | | | | | | | |
Name, Address, and Birth Date | | Position(s) Held with Fund(s) | | Length of Time
Served | | Principal Occupation(s)
During the Past Five Years | | Number of Portfolios in Fund Complex Overseen by Trustee or Officer | | Other
Directorships
Held by Trustee or Officer |
INTERESTED TRUSTEE Shawn K. Lytle1 2005 Market Street Philadelphia, PA 19103 | | President, Chief Executive Officer, and Trustee | | President and Chief Executive Officer since August 2015 | | President — Macquarie Investment Management2(June 2015-Present) | | 95 | | Trustee — UBS Relationship Funds, SMA Relationship Trust, and UBS Funds (May 2010–April 2015) |
| | | | | |
| February 1970 | | | | Trustee since September 2015 | | Regional Head of Americas — UBS Global Asset Management(April 2010-May 2015) | | | | |
| INDEPENDENT TRUSTEES | | | | | | | | | | |
Thomas L. Bennett | | Chair and Trustee | | Trustee since | | Private Investor | | 95 | | None |
| 2005 Market Street | | | | March 2005 | | (March 2004–Present) | | | | |
| Philadelphia, PA 19103 | | | | | | | | | | |
| | | | | |
| October 1947 | | | | Chair since March 2015 | | | | | | |
| | | | | |
| Jerome D. Abernathy | | Trustee | | Since | | Managing Member, | | 95 | | None |
| 2005 Market Street | | | | January 2019 | | Stonebrook Capital | | | | |
| Philadelphia, PA 19103 | | | | | | Management, LLC | | | | |
| | | | | | (financial technology: macro | | | | |
| July 1959 | | | | | | factors and databases) | | | | |
| | | | | | (January 1993–Present) | | | | |
| | | | | |
| Ann D. Borowiec | | Trustee | | Since | | Chief Executive Officer, | | 95 | | Director — |
| 2005 Market Street | | | | March 2015 | | Private Wealth Management | | | | Banco Santander International |
| Philadelphia, PA 19103 | | | | | | (2011 – 2013) and Market Manager, | | | | (October 2016–December |
| | | | | | New Jersey Private Bank | | | | 2019) |
| November 1958 | | | | | | (2005–2011) — | | | | |
| | | | | | J.P. Morgan Chase & Co. | | | | Director — |
| | | | | | | | | | Santander Bank, N.A. |
| | | | | | | | | | (December 2016–December |
| | | | | | | | | | 2019) |
| | | | | |
| Joseph W. Chow | | Trustee | | Since | | Private Investor | | 95 | | Director and Audit |
| 2005 Market Street | | | | January 2013 | | (April 2011–Present) | | | | Committee |
| Philadelphia, PA 19103 | | | | | | | | | | Member — Hercules |
| | | | | | | | | | Technology Growth |
| January 1953 | | | | | | | | | | Capital, Inc. |
| | | | | | | | | | (July 2004–July 2014) |
Covered Call Strategy Series-22
| | | | | | | | | | |
Name, Address, and Birth Date | | Position(s) Held with Fund(s) | | Length of Time
Served | | Principal Occupation(s)
During the Past Five Years | | Number of Portfolios in Fund Complex Overseen by Trustee or Officer | | Other
Directorships
Held by Trustee or Officer |
John A. Fry 2005 Market Street Philadelphia, PA 19103 May 1960 | | Trustee | | Since January 2001 | | President — Drexel University (August 2010–Present) President — Franklin & Marshall College (July 2002–July 2010) | | 95 | | Director; Compensation Committee and Governance Committee Member — Community Health Systems (May 2004–Present) Director — Drexel Morgan & Co. (2015–Present) Director and Audit Committee Member — vTv Therapeutics LLC (2017–Present) Director and Audit Committee Member — FS Credit Real Estate Income Trust, Inc. (2018–Present) Director — Federal Reserve Bank of Philadelphia (January 2020–Present) |
| | | | | |
Lucinda S. Landreth 2005 Market Street Philadelphia, PA 19103 June 1947 | | Trustee | | Since March 2005 | | Private Investor (2004–Present) | | 95 | | None |
| | | | | |
Frances A. Sevilla-Sacasa 2005 Market Street Philadelphia, PA 19103 January 1956 | | Trustee | | Since September 2011 | | Private Investor(January 2017-Present) Chief Executive Officer — Banco Itaú International (April 2012–December 2016) Executive Advisor to Dean (August 2011–March 2012) and Interim Dean (January 2011–July 2011) — University of Miami School of Business Administration President — U.S. Trust, Bank of America Private Wealth Management (Private Banking) (July 2007–December 2008) | | 95 | | Trust Manager and Audit Committee Chair — Camden Property Trust (August 2011–Present) Director; Strategic Planning and Reserves Committee and Nominating and Governance Committee Member — Callon Petroleum Company (December 2019–Present) Director; Audit Committee Member — Carrizo Oil & Gas, Inc. (March 2018–December 2019) |
| | | | | |
Thomas K. Whitford 2005 Market Street Philadelphia, PA 19103 March 1956 | | Trustee | | Since January 2013 | | Vice Chairman (2010–April 2013) — PNC Financial Services Group | | 95 | | Director — HSBC North America Holdings Inc. (December 2013-Present) Director — HSBC USA Inc. (July 2014-Present) Director — HSBC Bank USA, National Association (July 2014-March 2017) Director — HSBC Finance Corporation (December 2013-April 2018) |
Covered Call Strategy Series-23
| | | | | | | | | | |
Name, Address, and Birth Date | | Position(s) Held with Fund(s) | | Length of Time
Served | | Principal Occupation(s)
During the Past Five Years | | Number of Portfolios in Fund Complex Overseen by Trustee or Officer | | Other
Directorships
Held by Trustee or Officer |
Christianna Wood 2005 Market Street Philadelphia, PA 19103 March 1956 | | Trustee | | Since January 2019 | | Chief Executive Officer and President — Gore Creek Capital, Ltd. (August 2009–Present) | | 95 | | Director; Finance Committee and Audit Committee Member — H&R Block Corporation (July 2008–Present) Director; Chair of Investments Committee and Audit Committee Member — Grange Insurance (2013–Present) Trustee; Chair of Nominating and Governance Committee and Audit Committee Member — The Merger Fund (2013–Present), The Merger Fund VL (2013–Present); WCM Alternatives: Event-Driven Fund (2013–Present), and WCM Alternatives: Credit Event Fund (December 2017–Present) Director; Chair of Governance Committee and Audit Committee Member — International Securities Exchange (2010–2016) |
| | | | | |
Janet L. Yeomans 2005 Market Street Philadelphia, PA 19103 July 1948 | | Trustee | | Since April 1999 | | Vice President and Treasurer (January 2006–July 2012), Vice President — Mergers & Acquisitions (January 2003–January 2006), and Vice President and Treasurer (July 1995–January 2003) — 3M Company | | 95 | | Director; Personnel and Compensation Committee Chair; Member of Nominating, Investments, and Audit Committees for various periods throughout directorship — Okabena Company (2009-2017) |
Covered Call StrategySeries-24
| | | | | | | | | | |
Name, Address, and Birth Date | | Position(s) Held with Fund(s) | | Length of Time
Served | | Principal Occupation(s)
During the Past Five Years | | Number of Portfolios in Fund Complex Overseen by Trustee or Officer | | Other
Directorships
Held by Trustee or Officer |
OFFICERS | | | | | | | | | | |
David F. Connor 2005 Market Street Philadelphia, PA 19103 December 1963 | | Senior Vice President, General Counsel, and Secretary | | Senior Vice President, since May 2013; General Counsel since May 2015; Secretary since October 2005 | | David F. Connor has served in various capacities at different times at Macquarie Investment Management. | | 95 | | None3 |
| | | | | |
Daniel V. Geatens 2005 Market Street Philadelphia, PA 19103 October 1972 | | Vice President and Treasurer | | Vice President and Treasurer since October 2007 | | Daniel V. Geatens has served in various capacities at different times at Macquarie Investment Management. | | 95 | | None3 |
| | | | | |
Richard Salus 2005 Market Street Philadelphia, PA 19103 October 1963 | | Senior Vice President and Chief Financial Officer | | Senior Vice President and Chief Financial Officer since November 2006 | | Richard Salus has served in various capacities at different times at Macquarie Investment Management. | | 95 | | None |
| 1 | Shawn K. Lytle is considered to be an “Interested Trustee” because he is an executive officer of the Fund’s(s’) investment advisor. |
| 2 | Macquarie Investment Management is the marketing name for Macquarie Management Holdings, Inc. and its subsidiaries, including the Fund’s(s’) investment advisor, principal underwriter, and its transfer agent. |
| 3 | David F. Connor and Daniel V. Geatens serve in similar capacities for the six portfolios of the Optimum Fund Trust, which have the same investment advisor, principal underwriter, and transfer agent as the registrant. Mr. Geatens also serves as the Chief Financial Officer of the Optimum Fund Trust and he is the Chief Financial Officer and Treasurer for Macquarie Global Infrastructure Total Return Fund Inc. |
The Statement of Additional Information for the Fund(s) includes additional information about the Trustees and Officers and is available, without charge, upon request by calling 800523-1918.
Covered Call StrategySeries-25
| | | | |
| | The Series files its complete schedule of portfolio holdings with the Securities and Exchange Commission (SEC) for the first and third quarters of each fiscal year on FormN-Q or FormN-PORT (available for filings after March 31, 2019). The Series’ FormsN-Q or FormsN-PORT, as well as a description of the policies and procedures that the Series uses to determine how to vote proxies (if any) relating to portfolio securities, are available without charge (i) upon request, by calling 800523-1918; and (ii) on the SEC’s website at sec.gov. In addition, a description of the policies and procedures that the Series uses to determine how to vote proxies (if any) relating to portfolio securities and the Schedule of Investments included in the Series’ most recent FormN-Q or FormN-PORT are available without charge on the Series’ website at delawarefunds.com/vip/literature. The Series’ FormsN-Q and FormsN-PORT may be reviewed and copied at the SEC’s Public Reference Room in Washington, D.C.; information on the operation of the Public Reference Room may be obtained by calling 800SEC-0330. Information (if any) regarding how the Series voted proxies relating to portfolio securities during the most recently disclosed12-month period ended June 30 is available without charge (i) through the Series’ website at delawarefunds.com/proxy; and (ii) on the SEC’s website at sec.gov. | | |
| | |
| AR-VIPCCS 22490 (2/20) (1076649) | | Covered Call Strategy Series-26 |

Delaware VIP® Trust
Delaware VIP Equity Income Series
(formerly, First Investors Life Series Equity Income Fund)
December 31, 2019
Beginning on or about June 1, 2021, as permitted by regulations adopted by the Securities and Exchange Commission, paper copies of your Series’ shareholder reports will no longer be sent to you by mail, unless you specifically request them from the Series or from your financial intermediary, such as a broker/dealer, bank, or insurance company. Instead, you will be notified by mail each time a report is posted on the website and provided with a link to access the report.
If you already elected to receive shareholder reports electronically, you will not be affected by this change and you do not need to take any action.
You may elect to receive paper copies of all future shareholder reports free of charge. You can inform the Series that you wish to continue receiving paper copies of your shareholder reports by contacting us at 800523-1918. If you own these shares through a financial intermediary, you may contact your financial intermediary to elect to continue to receive paper copies of your shareholder reports. Your election to receive reports in paper will apply to all funds held with the Delaware Funds® by Macquarie or your financial intermediary.

Table of contents
Other than Macquarie Bank Limited (MBL), none of the entities noted are authorized deposit-taking institutions for the purposes of the Banking Act 1959 (Commonwealth of Australia). The obligations of these entities do not represent deposits or other liabilities of MBL. MBL does not guarantee or otherwise provide assurance in respect of the obligations of these entities, unless noted otherwise. The Series is governed by US laws and regulations.
Unless otherwise noted, views expressed herein are current as of Dec. 31, 2019, and subject to change for events occurring after such date.
The Series is not FDIC insured and is not guaranteed. It is possible to lose the principal amount invested.
Advisory services provided by Delaware Management Company, a series of Macquarie Investment Management Business Trust (MIMBT), a US registered investment advisor.
The Series is distributed byDelaware Distributors, L.P.(DDLP), an affiliate of MIMBT and Macquarie Group Limited. Macquarie Investment Management (MIM) is the marketing name for certain companies comprising the asset management division of Macquarie Group Limited and its subsidiaries and affiliates worldwide.
This material may be used in conjunction with the offering of shares in Delaware VIP® Equity Income Series only if preceded or accompanied by the Series’ current prospectus or the summary prospectus.
© 2020 Macquarie Management Holdings, Inc.
All third-party marks cited are the property of their respective owners.
| | |
| Delaware VIP®Trust — Delaware VIP Equity Income Series | | |
| Portfolio management review | | January 7, 2020 (Unaudited) |
The investment objective of the Series is to seek total return.
Effective after the close of business on Oct. 4, 2019, Delaware Management Company (DMC or Manager), a series of Macquarie Investment Management Business Trust (MIMBT), serves as the investment manager for the Series.* During the period after the close of business on Oct. 4, 2019 to Dec. 31, 2019, the Manager repositioned the portfolio in accordance with the Series’ investment objective and principal investment strategies, as described in the prospectus. The investment objective is the same and its principal investment strategies are the same or similar to those of the corresponding Life Series Fund.
For the fiscal year ended Dec. 31, 2019, Delaware VIP Equity Income Series (the “Series”) Standard Class shares gained 22.71%, reflecting all dividends reinvested. The Series’ benchmark, the Russell 1000® Value Index, advanced 26.54% for the same period. The Series changed its broad-based securities index to the Russell 1000 Value Index as of Oct. 4, 2019. The Series had previously changed its broad-based securities index to the MSCI USA Value Index as of Jan. 31, 2019. In each case the Series elected to use the new index because it more closely reflects the Series’ investment strategies. From Jan. 1, 2019 to Jan. 30, 2019, the Series’ benchmark was the Russell 1000 Value Index.
Rebounding from the stock market correction that occurred in late 2018, the broad market S&P 500® Index posted a total return of 31.5% and achieved a newall-time high in December 2019. Notably, there was little earnings growth to support 2019’s hardy gains (aggregate earnings for the S&P 500 Index were lower in each of the first three quarters, year over year, and are expected to be down again in the fourth quarter). The Federal Open Market Committee (FOMC) reduced the federal funds rate by 0.25 percentage points on three separate occasions. The FOMC raised rates in December 2018 before “pivoting” toward a more accommodative stance, which we believe helped spark the 2019 stock market rally. Yields on US Treasury securities moved lower during the year as investors appeared to price in slower economic growth. The yield on the benchmark10-year note fell 0.76% to settle at 1.92%. The price of crude oil moved higher. West Texas Intermediate (WTI) crude, the domestic benchmark, was up 34% to $61.06 a barrel (source: FactSet Research Systems).
Foresters Investment Management Company, Inc. (FIMCO) managed the Series from Jan. 1, 2019 to Oct. 4, 2019, when the management of the Series transitioned to DMC. The following is a discussion about Series performance during that period ended Oct. 4, 2019:
Through the first nine months of 2019, the Series underperformed its benchmark, primarily due to the Series’ underweight in the consumer discretionary sector and poor stock selection.Designer Brands Inc.was down significantly off its highs after the company completed an acquisition that was not well received by investors.Tractor Supply Co.underperformed after China curtailed its agriculture purchases. Additionally, flooding in themid-west put tremendous pressure on customers’ purchasing power. Trade tariffs had a negative effect onTapestry Inc., the parent company of Coach and Kate Spade. Higher tariffs on goods made in China have had a negative effect on margins, while sales have been slow to take off despite new product launches. The Series’ underperformance in healthcare was due to poor stock selection and an underweight in medical technology. The Series’ mandate is to invest in stocks that pay a dividend to add yield to portfolio returns. Because most of the medical technology stocks either have little or no dividend, the team cannot invest in them. The Series’ position inPhibro Animal Health Corp., which provides vaccines and medicines for herd animals, was hurt when an outbreak of African swine fever reduced demand for farm animals in China. With smaller herds, Phibro’s volumes have gone down and earnings were reset lower. Although the utilities sector performed quite well, the Series’ underweighting in the sector hurt relative performance.
Stock selection was robust within the industrial sector during the reporting period. The Series’ two defense companies,Lockheed Martin Corp.andNorthrop Grumman Corp., were up significantly during the reporting period as defense budgets were expanded and both companies picked up sizeable new contracts.Ingersoll-Rand PLCrose significantly because of high demand in its core air conditioning market and the planned divestiture of its lower-margin industrial business. The Series’ performance in the consumer staples sector was also strong. BothThe Coca-Cola Co.andPepsiCo Inc.had a strong year. The Series’ positions inStaples Inc.andWalmart Inc.also performed well, benefiting from improvement in online retail sales.
*On April 6, 2019, FIMCO, the investment adviser to the First Investors Funds, entered into an agreement with Macquarie Management Holdings, Inc. (MMHI), whereby MMHI, on behalf of its affiliate DMC, would acquire FIMCO’s asset management business (the “Transaction”). In connection with the Transaction, the Board of Trustees of the First Investors Trusts and the First Investors Fund shareholders approved, pursuant to an Agreement and Plan of Reorganization (the “Agreement”), the transfer of all assets and liabilities of each First Investors Fund to a corresponding, newly formed fund in the Delaware Funds® by Macquarie family of funds. The Transaction closed on Oct. 4, 2019.
| | |
| Unless otherwise noted, views expressed herein are current as of Dec. 31, 2019, and subject to change. | | |
| | Equity Income Series-1 |
Delaware VIP® Trust — Delaware VIP Equity Income Series
Performance summary (Unaudited)
The performance quoted represents past performance and does not guarantee future results. Investment return and principal value of an investment will fluctuate so that shares, when redeemed, may be worth more or less than their original cost. Current performance may be lower or higher than the performance quoted.
Carefully consider the Series’ investment objectives, risk factors, charges, and expenses before investing. This and other information can be found in the Series’ prospectus and its summary prospectus, which may be obtained by visiting delawarefunds.com/vip/literature or calling 800523-1918. Investors should read the prospectus and the summary prospectus carefully before investing.
| | | | | | | | | | | | | | | | | | |
Delaware VIP Equity Income Series Average annual total returns For periods ended December 31, 2019 | | 1 year | | | 3 year | | | 5 year | | | 10 year | | | Lifetime |
Standard Class shares (commenced operations on Nov. 15, 1993) | | | +22.71% | | | | +9.09% | | | | +7.79% | | | | +10.25% | | | — |
| | | | | | | | | | | | | | | | | | |
Russell 1000 Value Index (current benchmark) | | | +26.54% | | | | +9.68% | | | | +8.29% | | | | +11.80% | | | — |
| | | | | | | | | | | | | | | | | | |
MSCI USA Value Index (former benchmark) | | | +25.73% | | | | +10.42% | | | | +9.06% | | | | +11.83% | | | — |
| | | | | | | | | | | | | | | | | | |
Returns reflect the reinvestment of all distributions. Please see page 3 for a description of the indices.
As described in the Series’ most recent prospectus, the net expense ratio for Standard Class shares of the Series was 0.75%, while total operating expenses for Standard Class shares were 0.75%. The management fee for Standard Class shares was 0.65%.The Series’ investment manager, Delaware Management Company (Manager), has contractually agreed to waive all or a portion of its investment advisory fees and/or pay/reimburse expenses (excluding any12b-1 fees, acquired fund fees and expenses, taxes, interest, short sale and dividend interest expenses, brokerage fees, certain insurance costs, and nonroutine expenses or costs, including, but not limited to, those relating to reorganizations, litigation, conducting shareholder meetings, and liquidations) in order to prevent annual series operating expenses from exceeding 0.80% of the Series’ average daily net assets from Oct. 4, 2019 through Dec. 31, 2019.* Please see the most recent prospectus and any applicable supplement(s) for additional information on these fee waivers and/or reimbursements. Please see the “Financial highlights” section in this report for the most recent expense ratios.
Earnings from a variable annuity or variable life investment compoundtax-free until withdrawal, and as a result, no adjustments were made for income taxes.
Expense limitations were in effect for Standard Class shares during certain periods shown in the Series performance table above and in the Performance of a $10,000 Investment graph on the next page.
Performance data do not reflect insurance fees related to a variable annuity or variable life investment or the deferred sales charge that would apply to certain withdrawals of investments held for fewer than eight years. Performance shown here would have been reduced if such fees were included and the expense limitation removed. For more information about fees, consult your variable annuity or variable life prospectus.
Investments in variable products involve risk.
Please read both the contract and underlying prospectus for specific details regarding the product’s risk profile.
*The aggregate contractual waiver period covering this report is from Oct. 4, 2019 through Oct. 31, 2021.
Equity Income Series-2
Delaware VIP® Equity Income Series
Performance summary (Unaudited) (continued)
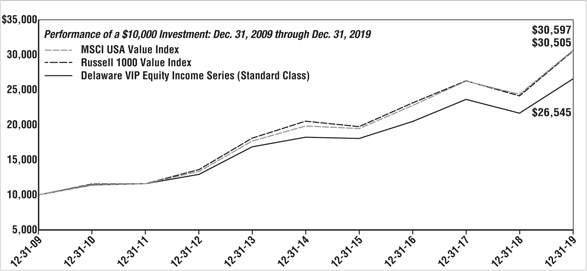
| | | | |
| For period beginning Dec. 31, 2009 through Dec. 31, 2019 | | Starting value | | Ending value |
– – MSCI USA Value Index | | $10,000 | | $30,597 |
– – Russell 1000 Value Index | | $10,000 | | $30,505 |
— Delaware VIP Equity Income Series (Standard Class) | | $10,000 | | $26,545 |
The graph shows a $10,000 investment in the Delaware VIP Equity Income Series Standard Class shares for the period from Dec. 31, 2009 through Dec. 31, 2019.
The graph also shows $10,000 invested in the Russell 1000 Value Index and the MSCI USA Value Index for the period from Dec. 31, 2009 through Dec. 31, 2019.
The Russell 1000 Value Index measures the performance of thelarge-cap value segment of the US equity universe. It includes those Russell 1000 companies with lowerprice-to-book ratios and lower forecasted growth values.
The MSCI USA Value Index captures large- andmid-cap US stocks exhibiting overall value style characteristics. The value investment style characteristics for index construction are defined using three variables: book value to price,12-month forward earnings to price, and dividend yield.
The S&P 500 Index, mentioned on page 1, measures the performance of 500 mostlylarge-cap stocks weighted by market value, and is often used to represent performance of the US stock market.
Frank Russell Company is the source and owner of the trademarks, service marks, and copyrights related to the Russell Indexes. Russell® is a trademark of Frank Russell Company.
Index performance returns do not reflect any management fees, transaction costs or expenses. Indices are unmanaged and one cannot invest directly in an index.
Past performance is not a guarantee of future results.
Equity Income Series-3
Delaware VIP® Trust — Delaware VIP Equity Income Series
Disclosure of Series expenses
For thesix-month period from July 1, 2019 to December 31, 2019 (Unaudited)
As a shareholder of the Series, you incur ongoing costs, which may include management fees; distribution and service(12b-1) fees; and other Series expenses. This example is intended to help you understand your ongoing costs (in dollars) of investing in the Series and to compare these costs with the ongoing costs of investing in other mutual funds.
The example is based on an investment of $1,000 invested at the beginning of the period and held for the entiresix-month period from July 1, 2019 to Dec. 31, 2019.
Actual expenses
The first section of the table shown, “Actual Series return,” provides information about actual account values and actual expenses. You may use the information in this section of the table, together with the amount you invested, to estimate the expenses that you paid over the period. Simply divide your account value by $1,000 (for example, an $8,600 account value divided by $1,000 = 8.6), then multiply the result by the number in the first section under the heading entitled “Expenses Paid During Period” to estimate the expenses you paid on your account during the period.
Hypothetical example for comparison purposes
The second section of the table shown, “Hypothetical 5% return,” provides information about hypothetical account values and hypothetical expenses based on the Series’ actual expense ratio and an assumed rate of return of 5% per year before expenses, which is not the Series’ actual return. The hypothetical account values and expenses may not be used to estimate the actual ending account balance or expenses you paid for the period. You may use this information to compare the ongoing costs of investing in the Series and other funds. To do so, compare this 5% hypothetical example with the 5% hypothetical examples that appear in the shareholder reports of other funds.
Please note that the expenses shown in the table are meant to highlight your ongoing costs only. As a shareholder of the Series, you do not incur any transaction costs, such as sales charges (loads), redemption fees or exchange fees, but shareholders of other funds may incur such costs. Also, the fees related to the variable annuity investment or the deferred sales charge that could apply have not been included. Therefore, the second section of the table is useful in comparing ongoing costs only, and will not help you determine the relative total costs of owning different funds. The Series’ expenses shown in the table reflect fee waivers in effect and assume reinvestment of all dividends and distributions.
Expense analysis of an investment of $1,000
| | | | | | | | | | | | | | | | |
| | | Beginning
Account
Value
7/1/19 | | | Ending
Account
Value
12/31/19 | | | Annualized
Expense
Ratio | | | Expenses
Paid During
Period
7/1/19 to
12/31/19* | |
Actual Series return† | |
Standard Class | | $ | 1,000.00 | | | $ | 1,083.80 | | | | 0.83 | % | | | $4.36 | |
Hypothetical 5% return(5% return before expenses) | |
Standard Class | | $ | 1,000.00 | | | $ | 1,021.02 | | | | 0.83 | % | | | $4.23 | |
| * | “Expenses Paid During Period” are equal to the Series’ annualized expense ratio, multiplied by the average account value over the period, multiplied by 184/365 (to reflect theone-half year period). |
| † | Because actual returns reflect only the most recentsix-month period, the returns shown may differ significantly from fiscal year returns. |
In addition to the Series’ expenses reflected above, the Series also indirectly bears its portion of the fees and expenses of the investment companies (Underlying Funds) in which it invests. The table above does not reflect the expenses of the Underlying Funds.
Equity Income Series-4
Delaware VIP® Trust — Delaware VIP Equity Income Series
Security type / sector allocation and top 10 equity holdings
As of December 31, 2019 (Unaudited)
Sector designations may be different than the sector designations presented in other Series materials. The sector designations may represent the investment manager’s internal sector classifications.
| | | | |
| Security type / sector | | Percentage of
net assets |
| |
Common Stock | | | 98.61% | |
Communication Services | | | 5.74% | |
Consumer Discretionary | | | 5.43% | |
Consumer Staples | | | 9.31% | |
Energy | | | 12.36% | |
Financials | | | 15.03% | |
Healthcare | | | 21.67% | |
Industrials | | | 8.77% | |
Information Technology | | | 11.82% | |
Materials | | | 2.84% | |
Real Estate | | | 2.57% | |
Utilities | | | 3.07% | |
Short-Term Investments | | | 0.84% | |
Total Value of Securities | | | 99.45% | |
Receivables and Other Assets Net of Liabilities | | | 0.55% | |
Total Net Assets | | | 100.00% | |
Holdings are for informational purposes only and are subject to change at any time. They are not a recommendation to buy, sell, or hold any security.
| | | | |
| Top 10 equity holdings | | Percentage
of net assets |
| |
Johnson & Johnson | | | 3.29% | |
Halliburton | | | 3.28% | |
Archer-Daniels-Midland | | | 3.26% | |
Cigna | | | 3.24% | |
Marathon Oil | | | 3.20% | |
Merck & Co. | | | 3.19% | |
Marsh & McLennan | | | 3.19% | |
Intel | | | 3.19% | |
Raytheon | | | 3.17% | |
ConocoPhillips | | | 3.15% | |
Equity Income Series-5
Delaware VIP® Trust — Delaware VIP Equity Income Series
Schedule of investments
December 31, 2019
| | | | | | | | |
| | | Number of
shares | | | Value (US $) | |
Common Stock – 98.61% | | | | | | | | |
Communication Services – 5.74% | | | | | |
AT&T | | | 95,100 | | | $ | 3,716,508 | |
Verizon Communications | | | 59,500 | | | | 3,653,300 | |
| | | | | | | | |
| | | | | | | 7,369,808 | |
| | | | | | | | |
Consumer Discretionary – 5.43% | | | | | |
Dollar Tree † | | | 31,900 | | | | 3,000,195 | |
Lowe’s | | | 33,100 | | | | 3,964,056 | |
| | | | | | | | |
| | | | | | | 6,964,251 | |
| | | | | | | | |
Consumer Staples – 9.31% | | | | | |
Archer-Daniels-Midland | | | 90,100 | | | | 4,176,135 | |
Conagra Brands | | | 112,700 | | | | 3,858,848 | |
Mondelez International Class A | | | 70,900 | | | | 3,905,172 | |
| | | | | | | | |
| | | | | | | 11,940,155 | |
| | | | | | | | |
Energy – 12.36% | | | | | | | | |
ConocoPhillips | | | 62,200 | | | | 4,044,866 | |
Halliburton | | | 171,900 | | | | 4,206,393 | |
Marathon Oil | | | 301,800 | | | | 4,098,444 | |
Occidental Petroleum | | | 84,900 | | | | 3,498,729 | |
| | | | | | | | |
| | | | | | | 15,848,432 | |
| | | | | | | | |
Financials – 15.03% | | | | | | | | |
Allstate | | | 33,300 | | | | 3,744,585 | |
American International Group | | | 70,200 | | | | 3,603,366 | |
Bank of New York Mellon | | | 78,100 | | | | 3,930,773 | |
Marsh & McLennan | | | 36,700 | | | | 4,088,747 | |
Truist Financial | | | 69,400 | | | | 3,908,608 | |
| | | | | | | | |
| | | | | | | 19,276,079 | |
| | | | | | | | |
Healthcare – 21.67% | | | | | | | | |
Abbott Laboratories | | | 46,400 | | | | 4,030,304 | |
Cardinal Health | | | 67,600 | | | | 3,419,208 | |
Cigna | | | 20,300 | | | | 4,151,147 | |
CVS Health | | | 53,400 | | | | 3,967,086 | |
Johnson & Johnson | | | 28,900 | | | | 4,215,643 | |
Merck & Co. | | | 45,000 | | | | 4,092,750 | |
Pfizer | | | 100,000 | | | | 3,918,000 | |
| | | | | | | | |
| | | | | | | 27,794,138 | |
| | | | | | | | |
Industrials – 8.77% | | | | | | | | |
Northrop Grumman | | | 10,600 | | | | 3,646,082 | |
Raytheon | | | 18,500 | | | | 4,065,190 | |
Waste Management | | | 31,000 | | | | 3,532,760 | |
| | | | | | | | |
| | | | | | | 11,244,032 | |
| | | | | | | | |
| | | | | | | | |
| | | Number of
shares | | | Value (US $) | |
Common Stock (continued) | | | | | |
Information Technology – 11.82% | |
Broadcom | | | 12,100 | | | $ | 3,823,842 | |
Cisco Systems | | | 75,000 | | | | 3,597,000 | |
Intel | | | 68,300 | | | | 4,087,755 | |
Oracle | | | 69,000 | | | | 3,655,620 | |
| | | | | | | | |
| | | | | | | 15,164,217 | |
| | | | | | | | |
Materials – 2.84% | | | | | | | | |
DuPont de Nemours | | | 56,700 | | | | 3,640,140 | |
| | | | | | | | |
| | | | | | | 3,640,140 | |
| | | | | | | | |
Real Estate – 2.57% | | | | | | | | |
Equity Residential | | | 40,800 | | | | 3,301,536 | |
| | | | | | | | |
| | | | | | | 3,301,536 | |
| | | | | | | | |
Utilities – 3.07% | | | | | | | | |
Edison International | | | 52,200 | | | | 3,936,402 | |
| | | | | | | | |
| | | | | | | 3,936,402 | |
| | | | | | | | |
Total Common Stock (cost $109,462,139) | | | | | | | 126,479,190 | |
| | | | | | | | |
Short-Term Investments – 0.84% | | | | | |
Money Market Mutual Funds – 0.84% | | | | | |
BlackRock FedFund – Institutional Shares(seven-day effective yield 1.52%) | | | 214,246 | | | | 214,246 | |
Fidelity Investments Money Market Government Portfolio – Class I(seven-day effective yield 1.49%) | | | 214,246 | | | | 214,247 | |
GS Financial Square Government Fund – Institutional Shares(seven-day effective yield 1.51%) | | | 214,246 | | | | 214,246 | |
Morgan Stanley Government Portfolio – Institutional Share Class(seven-day effective yield 1.48%) | | | 214,246 | | | | 214,246 | |
State Street Institutional US Government Money Market Fund – Investor Class(seven-day effective yield 1.45%) | | | 214,246 | | | | 214,246 | |
| | | | | | | | |
Total Short-Term Investments
(cost $1,071,231) | | | | 1,071,231 | |
| | | | | | | | |
| | | | |
Total Value of Securities – 99.45%
(cost $110,533,370) | | $ | 127,550,421 | |
| | | | |
†Non-income producing security.
GS – Goldman Sachs
See accompanying notes, which are an integral part of the financial statements.
Equity Income Series-6
| | |
Delaware VIP® Trust — Delaware VIP Equity Income Series Statement of assets and liabilities | | December 31, 2019 |
| | |
| | | | |
Assets: | | | | |
Investments, at value1 | | $ | 127,550,421 | |
Receivable for securities sold | | | 623,891 | |
Dividends and interest receivable | | | 221,607 | |
Receivable for series shares sold | | | 3,467 | |
Other assets | | | 4,022 | |
| | | | |
Total assets | | | 128,403,408 | |
| | | | |
Liabilities: | | | | |
Investment management fees payable | | | 62,328 | |
Audit and tax fees payable | | | 38,166 | |
Payable for series shares redeemed | | | 13,888 | |
Reports and statements to shareholders payable tonon-affiliates | | | 13,106 | |
Accounting and administration expenses payable tonon-affiliates | | | 8,447 | |
Other accrued expenses | | | 3,679 | |
Trustees’ fees and expenses payable | | | 1,242 | |
Dividend disbursing and transfer agent fees and expenses payable to affiliates | | | 808 | |
Pricing fees payable | | | 750 | |
Accounting and administration expenses payable to affiliates | | | 697 | |
Reports and statements to shareholders payable to affiliates | | | 200 | |
Legal fees payable to affiliates | | | 195 | |
| | | | |
Total liabilities | | | 143,506 | |
| | | | |
Total Net Assets | | $ | 128,259,902 | |
| | | | |
| |
Net Assets Consist of: | | | | |
Paid-in capital | | $ | 84,236,626 | |
Total distributable earnings (loss) | | | 44,023,276 | |
| | | | |
Total Net Assets | | $ | 128,259,902 | |
| | | | |
| |
Net Asset Value: | | | | |
Standard Class: | | | | |
Net assets | | $ | 128,259,902 | |
Shares of beneficial interest outstanding, unlimited authorization, no par | | | 5,734,034 | |
Net asset value per share | | $ | 22.37 | |
| | | | |
| 1Investments, at cost | | $ | 110,533,370 | |
See accompanying notes, which are an integral part of the financial statements.
Equity Income Series-7
Delaware VIP® Trust —
Delaware VIP Equity Income Series
Statement of operations
Year ended December 31, 2019
| | | | |
Investment Income: | | | | |
Dividends | | $ | 3,341,574 | |
Interest | | | 110,268 | |
| | | | |
| | | 3,451,842 | |
| | | | |
| |
Expenses: | | | | |
Management fees | | | 900,571 | |
Audit and tax fees | | | 36,988 | |
Reports and statements to shareholders | | | 32,463 | |
Accounting and administration expenses | | | 13,745 | |
Legal fees | | | 12,606 | |
Trustees’ fees and expenses | | | 11,032 | |
Custodian fees | | | 4,851 | |
Dividend disbursing and transfer agent fees and expenses | | | 2,388 | |
Other | | | 11,666 | |
| | | | |
| | | 1,026,310 | |
Less expenses waived | | | (7,728 | ) |
Less expenses paid indirectly | | | (3,115 | ) |
| | | | |
Total operating expenses | | | 1,015,467 | |
| | | | |
Net Investment Income | | | 2,436,375 | |
| | | | |
| |
Net Realized and Unrealized Gain (Loss): | | | | |
Net realized gain on investments | | | 24,884,776 | |
Net change in unrealized appreciation (depreciation) of investments | | | (2,271,056 | ) |
| | | | |
Net Realized and Unrealized Gain | | | 22,613,720 | |
| | | | |
Net Increase in Net Assets Resulting from Operations | | $ | 25,050,095 | |
| | | | |
Delaware VIP Trust —
Delaware VIP Equity Income Series
Statements of changes in net assets
| | | | | | | | |
| | | Year ended | |
| | | 12/31/19 | | | 12/31/18 | |
Increase (Decrease) in Net Assets from Operations: | | | | | | | | |
Net investment income | | $ | 2,436,375 | | | $ | 3,708,762 | |
Net realized gain | | | 24,884,776 | | | | 10,345,512 | |
Net change in unrealized appreciation (depreciation) | | | (2,271,056 | ) | | | (24,510,582 | ) |
| | | | | | | | |
Net increase (decrease) in net assets resulting from operations | | | 25,050,095 | | | | (10,456,308 | ) |
| | | | | | | | |
| | |
Dividends and Distributions to Shareholders from: | | | | | | | | |
Distributable earnings:
Standard Class | | | (14,210,932 | ) | | | (6,132,576 | ) |
| | | | | | | | |
| | |
Capital Share Transactions: | | | | | | | | |
Proceeds from shares sold:
| | | | | | | | |
Standard Class | | | 1,919,221 | | | | 3,601,599 | |
| | |
Net asset value of shares issued upon reinvestment of dividends and distributions:
| | | | | | | | |
Standard Class | | | 14,210,932 | | | | 6,132,576 | |
| | | | | | | | |
| | | 16,130,153 | | | | 9,734,175 | |
| | | | | | | | |
Cost of shares redeemed:
Standard Class | | | (12,594,141 | ) | | | (9,254,741 | ) |
| | | | | | | | |
Increase in net assets derived from capital share transactions | | | 3,536,012 | | | | 479,434 | |
| | | | | | | | |
Net Increase (Decrease) in Net Assets | | | 14,375,175 | | | | (16,109,450 | ) |
| | |
Net Assets: | | | | | | | | |
Beginning of year | | | 113,884,727 | | | | 129,994,177 | |
| | | | | | | | |
End of year | | $ | 128,259,902 | | | $ | 113,884,727 | |
| | | | | | | | |
See accompanying notes, which are an integral part of the financial statements.
Equity Income Series-8
Delaware VIP® Trust — Delaware VIP Equity Income Series
Financial highlights
Selected data for each share of the Series outstanding throughout each period were as follows:
| | | | | | | | | | | | | | | | | | | | | | | | | | | | | | | | | | | | | | |
| | | Delaware VIP Equity Income Series Standard Class Year ended | | | |
| | | |
| | | 12/31/191 | | | | | | 12/31/18 | | | | | | 12/31/17 | | | | | | 12/31/16 | | | | | | 12/31/15 | | | |
| | | |
Net asset value, beginning of period | | $ | 20.61 | | | | | | | $ | 23.64 | | | | | | | $ | 21.36 | | | | | | | $ | 20.01 | | | | | | | $ | 21.29 | | | |
| | | | | | | | | | |
Income (loss) from investment operations: | | | | | | | | | | | | | | | | | | | | | | | | | | | | | | | | | | | | | | |
Net investment income2 | | | 0.41 | | | | | | | | 0.66 | | | | | | | | 0.40 | | | | | | | | 0.42 | | | | | | | | 0.40 | | | |
Net realized and unrealized gain (loss) | | | 3.94 | | | | | | | | (2.57 | ) | | | | | | | 2.81 | | | | | | | | 2.03 | | | | | | | | (0.58 | ) | | |
| | | | | | | | | | | | | | | | | | | | | | | | | | | | | | | | | | | | | | |
Total from investment operations | | | 4.35 | | | | | | | | (1.91 | ) | | | | | | | 3.21 | | | | | | | | 2.45 | | | | | | | | (0.18 | ) | | |
| | | | | | | | | | | | | | | | | | | | | | | | | | | | | | | | | | | | | | |
| | | | | | | | | | |
Less dividends and distributions from: | | | | | | | | | | | | | | | | | | | | | | | | | | | | | | | | | | | | | | |
Net investment income | | | (0.68 | ) | | | | | | | (0.43 | ) | | | | | | | (0.42 | ) | | | | | | | (0.40 | ) | | | | | | | (0.35 | ) | | |
Net realized gain | | | (1.91 | ) | | | | | | | (0.69 | ) | | | | | | | (0.51 | ) | | | | | | | (0.70 | ) | | | | | | | (0.75 | ) | | |
| | | | | | | | | | | | | | | | | | | | | | | | | | | | | | | | | | | | | | |
Total dividends and distributions | | | (2.59 | ) | | | | | | | (1.12 | ) | | | | | | | (0.93 | ) | | | | | | | (1.10 | ) | | | | | | | (1.10 | ) | | |
| | | | | | | | | | | | | | | | | | | | | | | | | | | | | | | | | | | | | | |
| | | | | | | | | | |
Net asset value, end of period | | $ | 22.37 | | | | | | | $ | 20.61 | | | | | | | $ | 23.64 | | | | | | | $ | 21.36 | | | | | | | $ | 20.01 | | | |
| | | | | | | | | | | | | | | | | | | | | | | | | | | | | | | | | | | | | | |
| | | | | | | | | | |
Total return3 | | | 22.71%4 | | | | | | | | (8.42%) | | | | | | | | 15.52% | | | | | | | | 13.28% | | | | | | | | (1.03%) | | | |
| | | | | | | | | | |
Ratios and supplemental data: | | | | | | | | | | | | | | | | | | | | | | | | | | | | | | | | | | | | | | |
Net assets, end of period (000 omitted) | | $ | 128,260 | | | | | | | $ | 113,885 | | | | | | | $ | 129,994 | | | | | | | $ | 116,685 | | | | | | | $ | 107,016 | | | |
Ratio of expenses to average net assets5 | | | 0.82% | | | | | | | | 0.81% | | | | | | | | 0.80% | | | | | | | | 0.81% | | | | | | | | 0.81% | | | |
Ratio of expenses to average net assets prior to fees waived5 | | | 0.82% | | | | | | | | 0.81% | | | | | | | | 0.80% | | | | | | | | 0.81% | | | | | | | | 0.81% | | | |
Ratio of net investment income to average net assets | | | 1.96% | | | | | | | | 2.92% | | | | | | | | 1.81% | | | | | | | | 2.09% | | | | | | | | 1.97% | | | |
Ratio of net investment income to average net assets prior to fees waived | | | 1.96% | | | | | | | | 2.92% | | | | | | | | 1.81% | | | | | | | | 2.09% | | | | | | | | 1.97% | | | |
Portfolio turnover | | | 118%6 | | | | | | | | 50% | | | | | | | | 18% | | | | | | | | 20% | | | | | | | | 24% | | | |
| 1 | On Oct. 4, 2019, the First Investors Life Series Equity Income Fund shares were reorganized into Standard Class shares of the Series. See “Notes to financial statements.” The Standard Class shares financial highlights for the period prior to Oct. 4, 2019, reflect the performance of the First Investors Life Series Equity Income Fund shares. |
| 2 | The average shares outstanding method has been applied for per share information. |
| 3 | Total return is based on the change in net asset value of a share during the period and assumes reinvestment of dividends and distributions at net asset value. Total return does not include fees, charges, or expenses imposed by the variable annuity and life insurance contracts for which Delaware VIP Trust serves as an underlying investment vehicle. |
| 4 | Total return during the period reflects a waiver by the manager. Performance would have been lower had the waiver not been in effect. |
| 5 | Expense ratios do not include expenses of the Underlying Funds in which the Series invests. |
| 6 | The Series’ portfolio turnover rate increased substantially during the year ended Dec. 31, 2019 due to a change in the Series’ portfolio managers and associated repositioning. |
See accompanying notes, which are an integral part of the financial statements.
Equity Income Series-9
Delaware VIP® Trust – Delaware VIP Equity Income Series
Notes to financial statements
December 31, 2019
Delaware VIP Trust (Trust) is organized as a Delaware statutory trust. The Trust consists of 22 series, each of which is treated as a separate entity for certain matters under the Investment Company Act of 1940, as amended (1940 Act). These financial statements and the related notes pertain to Delaware VIP Equity Income Series (Series). The Trust is anopen-end investment company. The Series is considered diversified under the 1940 Act and offers Standard Class shares. The Standard Class shares do not carry a distribution and service(12b-1) fee. The shares of the Series are sold only to separate accounts of life insurance companies.
Before the Series commenced operations, on Oct. 4, 2019, all of the assets and liabilities of the First Investors Life Series Equity Income Fund, its respective Predecessor Series (Predecessor Series) were transferred to the Series in atax-free reorganization as set forth in an agreement and plan of reorganization (each a Foresters Reorganization) between the Trust, on behalf of the Series, and Foresters Investment Management Company, Inc. (FIMCO), on behalf of the Predecessor Series. As a result of the Foresters Reorganization, the Series assumed the performance and accounting history of its Predecessor Series. Financial information included for the dates prior to the Foresters Reorganization is that of the Predecessor Series.
1. Significant Accounting Policies
The Series follows accounting and reporting guidance under Financial Accounting Standards Board (FASB) Accounting Standards Codification Topic 946, Financial Services – Investment Companies. The following accounting policies are in accordance with US generally accepted accounting principles (US GAAP) and are consistently followed by the Series.
Security Valuation – Equity securities, except those traded on the Nasdaq Stock Market LLC (Nasdaq), are valued at the last quoted sales price as of the time of the regular close of the New York Stock Exchange on the valuation date. Equity securities traded on the Nasdaq are valued in accordance with the Nasdaq Official Closing Price, which may not be the last sales price. If, on a particular day, an equity security does not trade, the mean between the bid and ask prices will be used, which approximates fair value. Equity securities listed on a foreign exchange are normally valued at the last quoted sales price on the valuation date.Open-end investment companies are valued at their published net asset value (NAV). Generally, other securities and assets for which market quotations are not readily available are valued at fair value as determined in good faith under the direction of the Trust’s Board of Trustees (Board). In determining whether market quotations are readily available or fair valuation will be used, various factors will be taken into consideration, such as market closures or suspension of trading in a security. Restricted securities are valued at fair value using methods approved by the Board.
Federal Income Taxes – No provision for federal income taxes has been made as the Series intends to continue to qualify for federal income tax purposes as a regulated investment company under Subchapter M of the Internal Revenue Code of 1986, as amended, and make the requisite distributions to shareholders. The Series evaluates tax positions taken or expected to be taken in the course of preparing the Series’ tax returns to determine whether the tax positions are“more-likely-than-not” of being sustained by the applicable tax authority. Tax positions not deemed to meet the“more-likely-than-not” threshold are recorded as a tax benefit or expense in the current year. Management has analyzed the Series’ tax positions taken or expected to be taken on the Series’ federal income tax returns through the year ended Dec. 31, 2019 and for all open tax years (years ended Dec. 31, 2016–Dec. 31, 2018), and has concluded that no provision for federal income tax is required in the Series’ financial statements. If applicable, the Series recognizes interest accrued on unrecognized tax benefits in interest expense and penalties in “Other” on the “Statement of operations.” During the year ended Dec. 31, 2019, the Series did not incur any interest or tax penalties.
Use of Estimates – The preparation of financial statements in conformity with US GAAP requires management to make estimates and assumptions that affect the fair value of investments, the reported amounts of assets and liabilities and disclosure of contingent assets and liabilities at the date of the financial statements, and the reported amounts of revenues and expenses during the reporting period. Actual results could differ from those estimates and the differences could be material.
Other – Expenses directly attributable to the Series are charged directly to the Series. Other expenses common to various funds within the Delaware Funds® by Macquarie (Delaware Funds) are generally allocated among such funds on the basis of average net assets. Management fees and certain other expenses are paid monthly. Security transactions are recorded on the date the securities are purchased or sold (trade date) for financial reporting purposes. Costs used in calculating realized gains and losses on the sale of investment securities are those of the specific securities sold. Dividend income is recorded on theex-dividend date and interest income is recorded on the accrual basis. Discounts and premiums on debt securities are accreted or amortized to interest income, respectively, over the lives of the respective securities using the effective interest method. The Series declares and pays dividends from net investment income and distributions from net realized gain on investments, if any, following the close of the fiscal year. The Series may distribute more frequently, if necessary for tax purposes. Dividends and distributions, if any, are recorded on theex-dividend date.
The Series receives earnings credits from its custodian when positive cash balances are maintained, which may be used to offset custody fees. The expenses paid under this arrangement are included on the “Statement of operations” under “Custodian fees” with the corresponding expenses offset included under “Less expenses paid indirectly.” For the year ended Dec. 31, 2019, the Series earned $3,115 under this arrangement.
The Series receives earnings credits from its transfer agent when positive cash balances are maintained, which may be used to offset transfer agent fees. If the amount earned is greater than $1, the expenses paid under this arrangement are included on the “Statement of operations” under “Dividend disbursing
Equity Income Series-10
Delaware VIP® Equity Income Series
Notes to financial statements (continued)
1. Significant Accounting Policies (continued)
and transfer agent fees and expenses” with the corresponding expenses offset included under “Less expenses paid indirectly.” There were no such earnings credits for the year ended Dec. 31, 2019.
2. Investment Management, Administration Agreements, and Other Transactions with Affiliates
In accordance with the terms of its investment management agreement, effective Oct. 4, 2019, the Series pays Delaware Management Company (DMC), a series of Macquarie Investment Management Business Trust and the investment manager, an annual fee which is calculated daily and paid monthly at the rates of 0.65% on the first $500 million of average daily net assets of the Series, 0.60% on the next $500 million, 0.55% on the next $1.5 billion, and 0.50% on average daily net assets in excess of $2.5 billion. Prior to Oct. 4, 2019, the Series paid FIMCO, an annual fee which was calculated daily and paid monthly at the rates of 0.75% on the first $250 million of average daily net assets of the Series, 0.72% on the next $250 million, 0.69% on the next $250 million, 0.66% on the next $500 million, 0.64% on the next $500 million, 0.62% on the next $500 million, and 0.60% on average daily net assets in excess of $2.25 billion.
DMC has contractually agreed to waive all or a portion of its investment advisory fees and/or pay/reimburse expenses (excluding any acquired fund fees and expenses, taxes, interest, short sale dividend and interest expenses, brokerage fees, certain insurance costs, and nonroutine expenses or costs, including, but not limited to, those relating to reorganizations, litigation, conducting shareholder meetings, and liquidations), do not exceed 0.80% of the Series’ average daily net assets from Oct. 4, 2019 through Dec. 31, 2019.* These waivers and reimbursements may only be terminated by agreement of DMC and the Series. The waivers and reimbursements are accrued daily and received monthly.
Effective Oct. 4, 2019, DMC may permit its affiliates, Macquarie Investment Management Global Limited (MIMGL) and Macquarie Funds Management Hong Kong Limited (together, the “AffiliatedSub-Advisors”), to execute Series equity security trades on behalf of the Manager. The Manager may also seek quantitative support from MIMGL. Although the AffiliatedSub-Advisors serve assub-advisors, DMC has ultimate responsibility for all investment advisory services. For these services, DMC, not the Series, may pay each AffiliatedSub-Advisor a portion of its investment management fee.
Effective Oct. 4, 2019, Delaware Investments Fund Services Company (DIFSC), an affiliate of DMC, provides fund accounting and financial administration oversight services to the Series. For these services, DIFSC’s fees are calculated daily and paid monthly based on the aggregate daily net assets of all funds within the Delaware Funds at the following annual rates: 0.00475% of the first $35 billion; 0.0040% of the next $10 billion; and 0.0025% of aggregate average daily net assets in excess of $45 billion (Total Fee). Each fund in the Delaware Funds pays a minimum of $4,000, which, in aggregate, is subtracted from the Total Fee. Each fund then pays its portion of the remainder of the Total Fee on a relative NAV basis. This amount is included on the “Statement of operations” under “Accounting and administration expenses.” For the period Oct. 4, 2019 through year ended Dec. 31, 2019, the Series was charged $2,019 for these services. Prior to Oct. 4, 2019, there were no fund accounting and financial administration oversight services for the Series.
Effective Oct. 4, 2019, DIFSC is also the transfer agent and dividend disbursing agent of the Series. For these services, DIFSC’s fees are calculated daily and paid monthly at the annual rate of 0.0075% of the Series’ average daily net assets. This amount is included on the “Statement of operations” under “Dividend disbursing and transfer agent fees and expenses.” For the period Oct. 4, 2019 through year ended Dec. 31, 2019, the Series was charged $2,275 for these services. Pursuant to asub-transfer agency agreement between DIFSC and BNY Mellon Investment Servicing (US) Inc. (BNYMIS), BNYMIS provides certainsub-transfer agency services to the Series.Sub-transfer agency fees are paid directly by the Series and are also included on the “Statement of operations” under “Dividend disbursing and transfer agent fees and expenses.” The fees that are calculated daily and paid as invoices are received on a monthly or quarterly basis. Prior to Oct. 4, 2019, Foresters Investor Services, Inc. was the transfer agent of the Series.
As provided in the investment management agreement, the Series bears a portion of the cost of certain resources shared with DMC, including the cost of internal personnel of DMC and/or its affiliates that provide legal, tax, and regulatory reporting services to the Series. For the year ended Dec. 31, 2019, the Series was charged $617 for internal legal, tax, and regulatory reporting services provided by DMC and/or its affiliates’ employees. These amounts are included on the “Statement of operations” under “Legal fees.”
Trustees’ fees include expenses accrued by the Series for each Trustee’s retainer and meeting fees. Certain officers of DMC, DIFSC, and DDLP are officers and/or Trustees of the Trust. These officers and Trustees are paid no compensation by the Series.
In addition to the management fees and other expenses of the Series, the Series indirectly bears the investment management fees and other expenses of the investment companies (Underlying Funds) in which it invests. The amount of these fees and expenses incurred indirectly by the Series will vary based upon the expense and fee levels of the Underlying Funds and the number of shares that are owned of the Underlying Funds at different times.
*The aggregate contractual waiver period covering this report is from Oct. 4, 2019 through Oct. 31, 2021.
Equity Income Series-11
Delaware VIP® Equity Income Series
Notes to financial statements (continued)
3. Investments
For the year ended Dec. 31, 2019, the Series made purchases and sales of investment securities other than short-term investments as follows:
| | | | |
Purchases | | $ | 137,042,618 | |
Sales | | | 144,129,699 | |
The tax cost of investments includes adjustments to net unrealized appreciation (depreciation) which may not necessarily be the final tax cost basis adjustments, but approximate the tax basis unrealized gains and losses that may be realized and distributed to shareholders. At Dec. 31, 2019, the cost and unrealized appreciation (depreciation) of investments for federal income tax purposes for the Series were as follows:
| | | | | | | | | | |
| | Cost of
Investments | | Aggregate
Unrealized
Appreciation of Investments | | Aggregate
Unrealized
Depreciation of Investments | | Net Unrealized
Appreciation of Investments | | |
| | $110,591,412 | | $18,298,140 | | $(1,339,131) | | $16,959,009 |
US GAAP defines fair value as the price that the Series would receive to sell an asset or pay to transfer a liability in an orderly transaction between market participants at the measurement date under current market conditions. A three-level hierarchy for fair value measurements has been established based upon the transparency of inputs to the valuation of an asset or liability. Inputs may be observable or unobservable and refer broadly to the assumptions that market participants would use in pricing the asset or liability. Observable inputs reflect the assumptions that market participants would use in pricing the asset or liability based on market data obtained from sources independent of the reporting entity. Unobservable inputs reflect the reporting entity’s own assumptions about the assumptions that market participants would use in pricing the asset or liability based on the best information available under the circumstances. The Series’ investment in its entirety is assigned a level based upon the observability of the inputs which are significant to the overall valuation. The three-level hierarchy of inputs is summarized below.
| Level 1 – | Inputs are quoted prices in active markets for identical investments. (Examples: equity securities,open-end investment companies, futures contracts, and exchange-traded options contracts) |
| Level 2 – | Other observable inputs, including, but not limited to: quoted prices for similar assets or liabilities in markets that are active, quoted prices for identical or similar assets or liabilities in markets that are not active, inputs other than quoted prices that are observable for the assets or liabilities (such as interest rates, yield curves, volatilities, prepayment speeds, loss severities, credit risks, and default rates) or other market-corroborated inputs. (Examples: debt securities, government securities, swap contracts, foreign currency exchange contracts, foreign securities utilizing international fair value pricing, broker-quoted securities, and fair valued securities) |
| Level 3 – | Significant unobservable inputs, including the Series’ own assumptions used to determine the fair value of investments. (Examples: broker-quoted securities and fair valued securities) |
Level 3 investments are valued using significant unobservable inputs. The Series may also use an income-based valuation approach in which the anticipated future cash flows of the investment are discounted to calculate fair value. Discounts may also be applied due to the nature or duration of any restrictions on the disposition of the investments. Valuations may also be based upon current market prices of securities that are comparable in coupon, rating, maturity, and industry. The derived value of a Level 3 investment may not represent the value which is received upon disposition and this could impact the results of operations.
The following table summarizes the valuation of the Series’ investments by fair value hierarchy levels as of Dec. 31, 2019:
| | | | |
Securities | | Level 1 | |
Assets: | | | | |
Common Stock | | $ | 126,479,190 | |
Short-Term Investments | | | 1,071,231 | |
| | | | |
Total Value of Securities | | $ | 127,550,421 | |
| | | | |
During the year ended Dec. 31, 2019, there were no transfers between Level 1 investments, Level 2 investments, or Level 3 investments that had a significant impact to the Series. The Series’ policy is to recognize transfers between levels based on fair value at the beginning of the reporting period.
A reconciliation of Level 3 investments is presented when the Series has a significant amount of Level 3 investments at the beginning, interim, or end of the period in relation to the Series’ net assets. During the year ended Dec. 31, 2019, there were no Level 3 investments.
Equity Income Series-12
Delaware VIP® Equity Income Series
Notes to financial statements (continued)
4. Dividend and Distribution Information
Income and long-term capital gain distributions are determined in accordance with federal income tax regulations, which may differ from US GAAP. Additionally, distributions from net short-term gains on sales of investment securities are treated as ordinary income for federal income tax purposes. The tax character of dividends and distributions paid during the years ended Dec. 31, 2019 and 2018 was as follows:
| | | | | | | | |
| | | Year ended | |
| | | 12/31/19 | | | 12/31/18 | |
Ordinary income | | | $ 3,708,762 | | | | $3,060,488 | |
Long-term capital gains | | | 10,502,170 | | | | 3,072,088 | |
| | | | | | | | |
| | | $14,210,932 | | | | $6,132,576 | |
| | | | | | | | |
5. Components of Net Assets on a Tax Basis
As of Dec. 31, 2019, the components of net assets on a tax basis were as follows:
| | | | |
Shares of beneficial interest | | | $ 84,236,626 | |
Undistributed ordinary income | | | 2,593,388 | |
Undistributed long-term capital gains | | | 24,470,879 | |
Net unrealized appreciation on investments | | | 16,959,009 | |
| | | | |
Net assets | | | $128,259,902 | |
| | | | |
The differences between the book basis and tax basis components of net assets are primarily attributable to tax deferral of losses on wash sales and partnership income.
For financial reporting purposes, capital accounts are adjusted to reflect the tax character of permanent book/tax differences. Reclassifications are primarily due to tax treatment of partnership income. Results of operations and net assets were not affected by these classification. For the year ended Dec. 31, 2019, the Series recorded the following reclassifications:
| | | | | | |
| | | Paid-in Capital | | | | Distributable Earnings |
| | $(46,643) | | | | $46,643 |
6. Capital Shares
Transactions in capital shares were as follows:
| | | | | | | | |
| | | Year ended | |
| | | 12/31/19 | | | 12/31/18 | |
Shares sold: | | | | | | | | |
Standard Class | | | 92,878 | | | | 159,530 | |
Shares issued upon reinvestment of dividends and distributions: | | | | | | | | |
Standard Class | | | 716,277 | | | | 276,242 | |
| | | | | | | | |
| | | 809,155 | | | | 435,772 | |
| | | | | | | | |
Shares redeemed: | | | | | | | | |
Standard Class | | | (599,970 | ) | | | (410,580 | ) |
| | | | | | | | |
Net increase | | | 209,185 | | | | 25,192 | |
| | | | | | | | |
7. Line of Credit
On Nov. 4, 2019, the Series, along with certain other funds in the Delaware Funds (Participants), is a participant in a $250,000,000 revolving line of credit intended to be used for temporary or emergency purposes as an additional source of liquidity to fund redemptions of investor shares. Under the agreement, the Participants are charged an annual commitment fee of 0.15%, which is allocated across the Participants based on a weighted average of the respective net assets of each Participant. The Participants are permitted to borrow up to a maximum ofone-third of their net assets under the agreement. Each Participant is individually, and not jointly, liable for its particular advances, if any, under the line of credit. The line of credit available under the agreement expires on Nov. 2, 2020.
The Series had no amounts outstanding as of Dec. 31, 2019, or at any time during the period then ended.
Equity Income Series-13
Delaware VIP® Equity Income Series
Notes to financial statements (continued)
8. Securities Lending
Effective Oct. 4, 2019, the Series, along with other funds in the Delaware Funds, may lend its securities pursuant to a security lending agreement (Lending Agreement) with The Bank of New York Mellon (BNY Mellon). At the time a security is loaned, the borrower must post collateral equal to the required percentage of the market value of the loaned security, including any accrued interest. The required percentage is: (1) 102% with respect to US securities and foreign securities that are denominated and payable in US dollars; and (2) 105% with respect to foreign securities. With respect to each loan, if on any business day, the aggregate market value of securities collateral plus cash collateral held is less than the aggregate market value of the securities which are the subject of such loan, the borrower will be notified to provide additional collateral by the end of the following business day, which, together with the collateral already held, will be not less than the applicable initial collateral requirements for such security loan. If the aggregate market value of securities collateral and cash collateral held with respect to a security loan exceeds the applicable initial collateral requirement, upon the request of the borrower, BNY Mellon must return enough collateral to the borrower by the end of the following business day to reduce the value of the remaining collateral to the applicable initial collateral requirement for such security loan. As a result of the foregoing, the value of the collateral held with respect to a loaned security on any particular day, may be more or less than the value of the security on loan. The collateral percentage with respect to the market value of the loaned security is determined by the security lending agent.
Cash collateral received by each series of the Trust is generally invested in a series of individual separate accounts, each corresponding to a series. The investment guidelines permit each separate account to hold certain securities that would be considered eligible securities for a money market fund. Cash collateral received is generally invested in government securities; certain obligations issued by government sponsored enterprises; repurchase agreements collateralized by US Treasury securities; obligations issued by the central government of any Organization for Economic Cooperation and Development (OECD) country or its agencies, instrumentalities, or establishments; obligations of supranational organizations; commercial paper, notes, bonds, and other debt obligations; certificates of deposit, time deposits, and other bank obligations; and asset-backed securities. The Series can also accept US government securities and letters of credit(non-cash collateral) in connection with securities loans.
In the event of default or bankruptcy by the lending agent, realization and/or retention of the collateral may be subject to legal proceedings. In the event the borrower fails to return loaned securities and the collateral received is insufficient to cover the value of the loaned securities and provided such collateral shortfall is not the result of investment losses, the lending agent has agreed to pay the amount of the shortfall to the Series or, at the discretion of the lending agent, replace the loaned securities. The Series continues to record dividends or interest, as applicable, on the securities loaned and is subject to changes in value of the securities loaned that may occur during the term of the loan. The Series has the right under the Lending Agreement to recover the securities from the borrower on demand. With respect to security loans collateralized bynon-cash collateral, the Series receives loan premiums paid by the borrower. With respect to security loans collateralized by cash collateral, the earnings from the collateral investments are shared among the Series, the security lending agent, and the borrower. The Series records security lending income net of allocations to the security lending agent and the borrower.
The Series may incur investment losses as a result of investing securities lending collateral. This could occur if an investment in the collateral investment account defaulted or became impaired. Under those circumstances, the value of the Series’ cash collateral account may be less than the amount the Series would be required to return to the borrowers of the securities and the Series would be required to make up for this shortfall.
During the year ended Dec. 31, 2019, the Series had no securities out on loan.
9. Credit and Market Risk
The Series may invest up to 10% of its net assets in illiquid securities, which may include securities with contractual restrictions on resale, securities exempt from registration under Rule 144A, promulgated under the Securities Act of 1933, as amended, and other securities which may not be readily marketable. The relative illiquidity of these securities may impair the Series from disposing of them in a timely manner and at a fair price when it is necessary or desirable to do so. While maintaining oversight, the Board has delegated to DMC theday-to-day functions of determining whether individual securities are liquid for purposes of the Series’ limitation on investments in illiquid securities. Securities eligible for resale pursuant to Rule 144A, which are determined to be liquid, are not subject to the Series’ 10% limit on investments in illiquid securities. As of Dec. 31, 2019, there were no Rule 144A securities held by the Series.
10. Contractual Obligations
The Series enters into contracts in the normal course of business that contain a variety of indemnifications. The Series’ maximum exposure under these arrangements is unknown. However, the Series has not had prior claims or losses pursuant to these contracts. Management has reviewed the Series’ existing contracts and expects the risk of loss to be remote.
Equity Income Series-14
Delaware VIP® Equity Income Series
Notes to financial statements (continued)
11. Recent Accounting Pronouncements
In August 2018, the FASB issued an Accounting Standard Update (ASU), ASU2018-13, which changes certain fair value measurement disclosure requirements. The ASU2018-13, in addition to other modifications and additions, removes the requirement to disclose the amount and reasons for transfers between Level 1 and Level 2 of the fair value hierarchy, the policy for the timing of transfers between levels and the valuation process for Level 3 fair value measurements. The ASU2018-13 is effective for fiscal years, and interim periods within those fiscal years, beginning after Dec. 15, 2019. At this time, management is evaluating the implications of these changes on the financial statements.
12. Subsequent Events
Management has determined that no material events or transactions occurred subsequent to Dec. 31, 2019, that would require recognition or disclosure in the Series’ financial statements.
Equity Income Series-15
Delaware VIP® Trust — Delaware VIP Equity Income Series
Report of independent registered public accounting firm
To the Board of Trustees of Delaware VIP® Trust and Shareholders of Delaware VIP Equity Income Series
Opinion on the Financial Statements
We have audited the accompanying statement of assets and liabilities, including the schedule of investments, of Delaware VIP Equity Income Series (one of the series constituting Delaware VIP® Trust, referred to hereafter as the “Series”) as of December 31, 2019, the related statements of operations and changes in net assets, including the related notes, and the financial highlights for the year then ended (collectively referred to as the “financial statements”). In our opinion, the financial statements present fairly, in all material respects, the financial position of the Series as of December 31, 2019, the results of its operations, changes in its net assets, and the financial highlights for the year then ended in conformity with accounting principles generally accepted in the United States of America.
The financial statements of First Investors Life Series Equity Income Fund (subsequent to reorganization, known as Delaware VIP Equity Income Series) as of and for the year ended December 31, 2018 and the financial highlights for each of the periods ended on or prior to December 31, 2018 (not presented herein, other than the statement of changes in net assets and the financial highlights) were audited by other auditors whose report dated February 26, 2019 expressed an unqualified opinion on those financial statements and financial highlights.
Basis for Opinion
These financial statements are the responsibility of the Series’ management. Our responsibility is to express an opinion on the Series’ financial statements based on our audit. We are a public accounting firm registered with the Public Company Accounting Oversight Board (United States) (PCAOB) and are required to be independent with respect to the Series in accordance with the U.S. federal securities laws and the applicable rules and regulations of the Securities and Exchange Commission and the PCAOB.
We conducted our audit of these financial statements in accordance with the standards of the PCAOB. Those standards require that we plan and perform the audit to obtain reasonable assurance about whether the financial statements are free of material misstatement, whether due to error or fraud.
Our audit included performing procedures to assess the risks of material misstatement of the financial statements, whether due to error or fraud, and performing procedures that respond to those risks. Such procedures included examining, on a test basis, evidence regarding the amounts and disclosures in the financial statements. Our audit also included evaluating the accounting principles used and significant estimates made by management, as well as evaluating the overall presentation of the financial statements. Our procedures included confirmation of securities owned as of December 31, 2019 by correspondence with the custodian and transfer agents. We believe that our audit provides a reasonable basis for our opinion.
/s/PricewaterhouseCoopers LLP
Philadelphia, Pennsylvania
February 28, 2020
We have served as the auditor of one or more investment companies in Delaware Funds® by Macquarie since 2010.
Equity Income Series-16
Delaware VIP® Trust — Delaware VIP Equity Income Series
Other Series information (Unaudited)
Tax Information
All disclosures are based on financial information available as of the date of this annual report and, accordingly are subject to change. For any and all items requiring reporting, it is the intention of the Series to report the maximum amount permitted under the Internal Revenue Code and the regulations thereunder.
For the year ended Dec. 31, 2019, the Series reports distributions paid during the year as follows:
| | | | |
(A) Long-Term Capital Gain Distributions (Tax Basis) | | (B)
Ordinary Income
Distributions
(Tax Basis) | | Total
Distributions
(Tax Basis) |
| 73.90% | | 26.10% | | 100.00% |
(A) and (B) are based on a percentage of the Series’ total distributions.
Equity Income Series-17
Delaware Funds® by Macquarie
Board of trustees / directors and officers addendum
A mutual fund is governed by a Board of Trustees/Directors (“Trustees”), which has oversight responsibility for the management of a fund’s business affairs. Trustees establish procedures and oversee and review the performance of the investment manager, the distributor, and others who perform services for the fund. The independent fund trustees, in particular, are advocates for shareholder interests. Each trustee has served in that capacity since he or she was elected to or appointed to the Board of Trustees, and will continue to serve until his or her retirement or the election of a new trustee in his or her place. The following is a list of the Trustees and Officers with certain background and related information.
| | | | | | | | | | |
Name, Address, and Birth Date | | Position(s) Held with Fund(s) | | Length of Time
Served | | Principal
Occupation(s)
During the Past Five Years | | Number of
Portfolios in Fund
Complex Overseen
by Trustee or Officer | | Other
Directorships
Held by Trustee or Officer |
| INTERESTED TRUSTEE | | | | | | | | | | |
| | | | | |
Shawn K. Lytle1
2005 Market Street Philadelphia, PA 19103 February 1970 | | President,
Chief Executive Officer, and Trustee | | President and Chief Executive Officer since August 2015 Trustee since September 2015 | | President — Macquarie Investment Management2(June 2015-Present) Regional Head of Americas — UBS Global Asset Management(April 2010-May 2015) | | 95 | | Trustee — UBS Relationship Funds, SMA Relationship Trust, and UBS Funds (May 2010–April 2015) |
INDEPENDENT TRUSTEES | | | | | | |
| | | | | |
Thomas L. Bennett
2005 Market Street Philadelphia, PA 19103 October 1947 | | Chair and Trustee | | Trustee since March 2005 Chair since March 2015 | | Private Investor (March 2004–Present) | | 95 | | None |
Jerome D. Abernathy
2005 Market Street Philadelphia, PA 19103 July 1959 | | Trustee | | Since January 2019 | | Managing Member, Stonebrook Capital Management, LLC (financial technology: macro factors and databases) (January 1993–Present) | | 95 | | None |
Ann D. Borowiec
2005 Market Street Philadelphia, PA 19103 November 1958 | | Trustee | | Since March 2015 | | Chief Executive Officer, Private Wealth Management (2011–2013) and Market Manager, New Jersey Private Bank (2005–2011) — J.P. Morgan Chase & Co. | | 95 | | Director —
Banco Santander International (October 2016–December
2019) Director —
Santander Bank, N.A. (December 2016–December 2019) |
Joseph W. Chow
2005 Market Street Philadelphia, PA 19103 January 1953 | | Trustee | | Since January 2013 | | Private Investor (April 2011–Present) | | 95 | | Director and Audit
Committee
Member — Hercules Technology Growth Capital, Inc. (July 2004–July 2014) |
Equity Income Series-18
| | | | | | | | | | |
Name,
Address,
and Birth Date | | Position(s)
Held with
Fund(s) | | Length of Time
Served | | Principal
Occupation(s)
During the
Past Five Years | | Number of
Portfolios in Fund
Complex Overseen
by Trustee
or Officer | | Other
Directorships
Held by
Trustee
or Officer |
| | | | | |
John A. Fry
2005 Market Street Philadelphia, PA 19103 May 1960 | | Trustee | | Since
January 2001 | | President — Drexel University (August 2010–Present) President — Franklin & Marshall College (July 2002–July 2010) | | 95 | | Director; Compensation Committee and Governance Committee Member — Community Health Systems (May 2004–Present) Director — Drexel Morgan & Co. (2015–Present) Director and Audit Committee Member — vTv Therapeutics LLC (2017–Present) Director and Audit Committee Member — FS Credit Real Estate Income Trust, Inc. (2018–Present) Director — Federal Reserve Bank of Philadelphia (January 2020–Present) |
| | | | | |
Lucinda S. Landreth
2005 Market Street Philadelphia, PA 19103 June 1947 | | Trustee | | Since
March 2005 | | Private Investor
(2004–Present) | | 95 | | None |
| | | | | |
Frances A. Sevilla-Sacasa
2005 Market Street Philadelphia, PA 19103 January 1956 | | Trustee | | Since
September 2011 | | Private Investor(January 2017-Present) Chief Executive Officer — Banco Itaú International (April 2012–December 2016) Executive Advisor to Dean (August 2011–March 2012) and Interim Dean (January 2011–July 2011) — University of Miami School of Business Administration President — U.S. Trust, Bank of America Private Wealth Management (Private Banking) (July 2007–December 2008) | | 95 | | Trust Manager and Audit Committee Chair — Camden Property Trust (August 2011–Present) Director; Strategic Planning and Reserves Committee and Nominating and Governance Committee Member — Callon Petroleum Company (December 2019–Present) Director; Audit Committee Member — Carrizo Oil & Gas, Inc. (March 2018–December 2019) |
| | | | | |
Thomas K. Whitford
2005 Market Street Philadelphia, PA 19103 March 1956 | | Trustee | | Since
January 2013 | | Vice Chairman (2010–April 2013) —
PNC Financial Services Group | | 95 | | Director — HSBC North America Holdings Inc. (December 2013-Present) Director — HSBC USA Inc. (July 2014-Present) Director — HSBC Bank USA, National Association(July 2014-March 2017) Director — HSBC Finance Corporation(December 2013- April 2018) |
Equity Income Series-19
| | | | | | | | | | |
Name,
Address,
and Birth Date | | Position(s)
Held with
Fund(s) | | Length of Time
Served | | Principal
Occupation(s)
During the
Past Five Years | | Number of
Portfolios in Fund
Complex Overseen
by Trustee
or Officer | | Other
Directorships
Held by
Trustee
or Officer |
| | | | | |
Christianna Wood
2005 Market Street
Philadelphia, PA 19103 March 1956 | | Trustee | | Since
January 2019 | | Chief Executive Officer and President — Gore Creek Capital, Ltd. (August 2009–Present) | | 95 | | Director; Finance Committee and Audit Committee Member — H&R Block Corporation (July 2008–Present) Director; Chair of Investments Committee and Audit Committee Member — Grange Insurance (2013–Present) Trustee; Chair of Nominating and Governance Committee and Audit Committee Member — The Merger Fund (2013–Present), The Merger Fund VL (2013–Present); WCM Alternatives: Event-Driven Fund (2013–Present), and WCM Alternatives: Credit Event Fund (December 2017–Present) Director; Chair of Governance Committee and Audit Committee Member — International Securities Exchange (2010–2016) |
| | | | | |
Janet L. Yeomans
2005 Market Street Philadelphia, PA 19103 July 1948 | | Trustee | | Since
April 1999 | | Vice President and Treasurer (January 2006–July 2012), Vice President — Mergers & Acquisitions (January 2003–January 2006), and Vice President and Treasurer (July 1995–January 2003) — 3M Company | | 95 | | Director; Personnel and Compensation Committee Chair; Member of Nominating, Investments, and Audit Committees for various periods throughout directorship — Okabena Company (2009-2017) |
Equity Income Series-20
| | | | | | | | | | |
Name,
Address,
and Birth Date | | Position(s)
Held with
Fund(s) | | Length of Time
Served | | Principal
Occupation(s)
During the
Past Five Years | | Number of
Portfolios in Fund
Complex Overseen
by Trustee
or Officer | | Other
Directorships
Held by
Trustee
or Officer |
| OFFICERS | | | | | | | | | | |
| | | | | |
David F. Connor
2005 Market Street Philadelphia, PA 19103 December 1963 | | Senior
Vice President, General Counsel, and Secretary | | Senior Vice President, since May 2013; General Counsel since May 2015; Secretary since October 2005 | | David F. Connor has served in various capacities at different times at Macquarie Investment Management. | | 95 | | None3 |
| | | | | |
Daniel V. Geatens
2005 Market Street Philadelphia, PA 19103 October 1972 | | Vice President and Treasurer | | Vice President and Treasurer since October 2007 | | Daniel V. Geatens has served in various capacities at different times at Macquarie Investment Management. | | 95 | | None3 |
| | | | | |
Richard Salus
2005 Market Street Philadelphia, PA 19103 October 1963 | | Senior
Vice President
and
Chief Financial
Officer | | Senior Vice President and Chief Financial Officer since November 2006 | | Richard Salus has served in various capacities at different times at Macquarie Investment Management. | | 95 | | None |
| 1 | Shawn K. Lytle is considered to be an “Interested Trustee” because he is an executive officer of the Fund’s(s’) investment advisor. |
| 2 | Macquarie Investment Management is the marketing name for Macquarie Management Holdings, Inc. and its subsidiaries, including the Fund’s(s’) investment advisor, principal underwriter, and its transfer agent. |
| 3 | David F. Connor and Daniel V. Geatens serve in similar capacities for the six portfolios of the Optimum Fund Trust, which have the same investment advisor, principal underwriter, and transfer agent as the registrant. Mr. Geatens also serves as the Chief Financial Officer of the Optimum Fund Trust and he is the Chief Financial Officer and Treasurer for Macquarie Global Infrastructure Total Return Fund Inc. |
The Statement of Additional Information for the Fund(s) includes additional information about the Trustees and Officers and is available, without charge, upon request by calling 800523-1918.
Equity Income Series-21
| | | | |
| | |
| | The Series files its complete schedule of portfolio holdings with the Securities and Exchange Commission (SEC) for the first and third quarters of each fiscal year on FormN-Q or FormN-PORT (available for filings after March 31, 2019). The Series’ FormsN-Q or FormsN-PORT, as well as a description of the policies and procedures that the Series uses to determine how to vote proxies (if any) relating to portfolio securities, are available without charge (i) upon request, by calling 800523-1918; and (ii) on the SEC’s website at sec.gov. In addition, a description of the policies and procedures that the Series uses to determine how to vote proxies (if any) relating to portfolio securities and the Schedule of Investments included in the Series’ most recent FormN-Q or FormN-PORT are available without charge on the Series’ website at delawarefunds.com/vip/literature. The Series’ FormsN-Q and FormsN-PORT may be reviewed and copied at the SEC’s Public Reference Room in Washington, D.C.; information on the operation of the Public Reference Room may be obtained by calling 800SEC-0330. Information (if any) regarding how the Series voted proxies relating to portfolio securities during the most recently disclosed12-month period ended June 30 is available without charge (i) through the Series’ website at delawarefunds.com/proxy; and (ii) on the SEC’s website at sec.gov. | | |
| | |
| AR-VIPEI 22491 (2/20) (1076649) | | Equity IncomeSeries-22 |
Delaware VIP® Trust
Delaware VIP Fund for Income Series
(formerly, First Investors Life Series Fund for Income)
December 31, 2019
Beginning on or about June 1, 2021, as permitted by regulations adopted by the Securities and Exchange Commission, paper copies of your Series’ shareholder reports will no longer be sent to you by mail, unless you specifically request them from the Series or from your financial intermediary, such as a broker/dealer, bank, or insurance company. Instead, you will be notified by mail each time a report is posted on the website and provided with a link to access the report.
If you already elected to receive shareholder reports electronically, you will not be affected by this change and you do not need to take any action.
You may elect to receive paper copies of all future shareholder reports free of charge. You can inform the Series that you wish to continue receiving paper copies of your shareholder reports by contacting us at 800523-1918. If you own these shares through a financial intermediary, you may contact your financial intermediary to elect to continue to receive paper copies of your shareholder reports. Your election to receive reports in paper will apply to all funds held with the Delaware Funds® by Macquarie or your financial intermediary.

Table of contents
Other than Macquarie Bank Limited (MBL), none of the entities noted are authorized deposit-taking institutions for the purposes of the Banking Act 1959 (Commonwealth of Australia). The obligations of these entities do not represent deposits or other liabilities of MBL. MBL does not guarantee or otherwise provide assurance in respect of the obligations of these entities, unless noted otherwise. The Series is governed by US laws and regulations.
Unless otherwise noted, views expressed herein are current as of Dec. 31, 2019, and subject to change for events occurring after such date.
The Series is not FDIC insured and is not guaranteed. It is possible to lose the principal amount invested.
Advisory services provided by Delaware Management Company, a series of Macquarie Investment Management Business Trust (MIMBT), a US registered investment advisor.
The Series is distributed byDelaware Distributors, L.P.(DDLP), an affiliate of MIMBT and Macquarie Group Limited. Macquarie Investment Management (MIM) is the marketing name for certain companies comprising the asset management division of Macquarie Group Limited and its subsidiaries and affiliates worldwide.
This material may be used in conjunction with the offering of shares in Delaware VIP® Fund for Income Series only if preceded or accompanied by the Series’ current prospectus or the summary prospectus.
© 2020 Macquarie Management Holdings, Inc.
All third-party marks cited are the property of their respective owners.
| | |
Delaware VIP® Trust — Delaware VIP Fund for Income Series |
Portfolio management review | | January 7, 2020 (Unaudited) |
The investment objective of the Series is to seek high current income.
Effective after the close of business on Oct. 4, 2019, Delaware Management Company (DMC or Manager), a series of Macquarie Investment Management Business Trust (MIMBT), serves as the investment manager for the Series.* During the period after the close of business on Oct. 4, 2019 to Dec. 31, 2019, the Manager repositioned the portfolio in accordance with Series’ investment objective and principal investment strategies, as described in the prospectus. The investment objective is the same and its principal investment strategies are the same or similar to those of the corresponding Life Series Fund.
For the fiscal year ended Dec. 31, 2019, Delaware VIP Fund for Income Series (the “Series”) Standard Class shares gained 12.78%. This figure reflects all dividends reinvested. The Series’ benchmark, the ICE BofA US High Yield Constrained Index, advanced 14.41% for the same period. The Series changed its broad-based securities index from the ICE BofABB-B US Cash Pay High Yield Constrained Index to the ICE BofA US High Yield Constrained Index as of Oct. 4, 2019. The Series elected to use the new index because it more closely reflected the Series’ investment strategies.
The major theme of the Series’ fiscal year was the great monetary policy pivot. The period began with the US Treasury yield above 3% and the US Federal Reserve contemplating four additional rate hikes heading into 2019. While the Fed had raised rates at the end of the prior fiscal period, by early 2019 it was apparent that further hikes were untenable. The US economy, though among the strongest globally, was no longer able to sustain a10-year interest rate above 3% or a federal funds rate in themid-2% range.
As 2019 began, economic indicators in the US began to flash yellow while global financial conditions were flashing red. The liquidity-induced risk-assets selloff at the end of 2018 reflected what we believe to be the ongoing unhealthy dependence of asset prices on monetary policy. Bymid-2019, there were other signs of an impending global slowdown as well, including corporate earnings’ deceleration, declining global manufacturing activity, the continuingUS-China trade dispute, and the ongoing Brexit drama. Many investors saw the yield-curve inversion and the August peak of $17 trillion worldwide in negative-yielding debt as signals of a potential recession.
This prompted the Fed and central banks in Australia, Europe, and the United Kingdom to shift to a more accommodative monetary policy. In the US, the Fed first signaled a hold on further rate hikes and then terminated quantitative tightening (QT) and balance-sheet reductions. Three interest rate cuts of 0.25 percentage points each followed in July, September, and October.
The massive liquidity infusion, coupled with the December announcement of a Phase 1 trade agreement with China, sent both interest rates and risk premiums significantly lower. Fixed income delivered its strongest total return since 2002, finishing the year with investors in a frenzied search for yield. We believe the fiscal year was a good example of the potential benefit of owning bonds as part of a diversified investment portfolio. During the period, bonds provided a stabilizing benefit and a return competitive with that of equities.
Entering fiscal year 2019, we assessed that long-standing secular factors would continue to drive asset markets and global economic growth and inflation. These included aging demographics, rising debt, and increased digitization, which have for decades held down growth and inflation. In recent years, two additional themes have emerged: increased dependency of asset prices on monetary policy, and deglobalization, seen in the form of rising populism. With that as a backdrop, we resisted reacting to short-term headlines, such as Brexit, the US trade war with China, or pockets of global unrest. Instead, we focused on the underlying issues.
Source: Bloomberg.
Foresters Investment Management Company, Inc. (FIMCO) managed the Series from Jan. 1, 2019 to Oct. 4, 2019, when the management of the Series transitioned to DMC. The following is a discussion about Series performance during that period ended Oct. 4, 2019:
Despite continued uncertainty for global growth outlooks, we believe an accommodative Fed and solid US economic data provide a supportive backdrop for high yield valuations. We believe the fundamental backdrop also remains supportive, but the market’s appetite for risk assets will be governed by the outlook for global growth,US-China trade relations, and sentiment around the 2020 elections.
We believe the current credit cycle will likely continue throughout 2020. An accommodative Fed, solid economic data, continued progress inUS-China trade relations and low default rates provide a positive backdrop for high yield markets. In addition, the technical backdrop in high yield remains supportive, in our view, as refinancing constitutes the lion’s share ofnew-issue proceeds, and leveraged buyout (LBO) activity remains modest. As such, we believe the outlook for high yield returns in 2020 is positive.
Unless otherwise noted, views expressed herein are current as of Dec. 31, 2019, and subject to change.
Fund for Income Series-1
| | |
Delaware VIP® Trust — Delaware VIP Fund for Income Series |
Portfolio management review (continued) | | January 7, 2020 (Unaudited) |
As we navigate the late stage of the credit cycle and global growth uncertainty persists, it is our belief that operational execution at the issuer level will become paramount and proper credit selection will be critical in maximizing returns. We believe ourbottom-up (bond by bond) approach to constructing portfolios is well suited for this environment.
*On April 6, 2019, FIMCO, the investment adviser to the First Investors Funds, entered into an agreement with Macquarie Management Holdings, Inc. (MMHI), whereby MMHI, on behalf of its affiliate DMC, would acquire FIMCO’s asset management business (the “Transaction”). In connection with the Transaction, the Board of Trustees of the First Investors Trusts and the First Investors Fund shareholders approved, pursuant to an Agreement and Plan of Reorganization (the “Agreement”), the transfer of all assets and liabilities of each First Investors Fund to a corresponding, newly formed fund in the Delaware Funds® by Macquarie family of funds. The Transaction closed on Oct. 4, 2019.
|
| Unless otherwise noted, views expressed herein are current as of Dec. 31, 2019, and subject to change. |
Fund for Income Series-2
Delaware VIP® Trust — Delaware VIP Fund for Income Series
Performance summary (Unaudited)
The performance quoted represents past performance and does not guarantee future results. Investment return and principal value of an investment will fluctuate so that shares, when redeemed, may be worth more or less than their original cost. Current performance may be lower or higher than the performance quoted.
Carefully consider the Series’ investment objectives, risk factors, charges, and expenses before investing. This and other information can be found in the Series’ prospectus and its summary prospectus, which may be obtained by visiting delawarefunds.com/vip/literature or calling 800523-1918. Investors should read the prospectus and the summary prospectus carefully before investing.
| | | | | | | | | | | | | | | | | | | | |
Delaware VIP Fund for Income Series | | | | | | | | | | | | | | | | | |
Average annual total returns | | | | | | | | | | | | | | | | | | | | |
| For periods ended December 31, 2019 | | 1 year | | | 3 year | | | 5 year | | | 10 year | | | Lifetime | |
Standard Class shares (commenced operations on Nov. 9, 1987) | | | +12.78% | | | | +5.48% | | | | +5.06% | | | | +6.52% | | | | — | |
| | | | | | | | | | | | | | | | | | | | |
ICE BofA US High Yield Constrained Index (current benchmark) | | | +14.41% | | | | +6.32% | | | | +6.14% | | | | +7.48% | | | | — | |
| | | | | | | | | | | | | | | | | | | | |
ICE BofABB-B US Cash Pay High Yield Constrained Index (former benchmark) | | | +15.08% | | | | +6.45% | | | | +6.10% | | | | +7.43% | | | | — | |
Returns reflect the reinvestment of all distributions. Please see page 4 for a description of the indices.
As described in the Series’ most recent prospectus, the net expense ratio for Standard Class shares of the Series was 0.83%, while total operating expenses for Standard Class shares were 0.85%. The management fee for Standard Class shares was 0.65%. The Series’ investment manager, Delaware Management Company (Manager), has contractually agreed to waive all or a portion of its investment advisory fees and/or pay/reimburse expenses (excluding any12b-1 fees, acquired fund fees and expenses, taxes, interest, short sale and dividend interest expenses, brokerage fees, certain insurance costs, and nonroutine expenses or costs, including, but not limited to, those relating to reorganizations, litigation, conducting shareholder meetings, and liquidations) in order to prevent annual series operating expenses from exceeding 0.83% of the Series’ average daily net assets from Oct. 4, 2019 through Dec. 31, 2019.* Please see the most recent prospectus and any applicable supplement(s) for additional information on these fee waivers and/or reimbursements. Please see the “Financial highlights” section in this report for the most recent expense ratios.
Earnings from a variable annuity or variable life investment compoundtax-free until withdrawal, and as a result, no adjustments were made for income taxes.
Expense limitations were in effect for Standard Class shares during certain periods shown in the Series performance table above and in the Performance of a $10,000 Investment graph on the next page.
Performance data do not reflect insurance fees related to a variable annuity or variable life investment or the deferred sales charge that would apply to certain withdrawals of investments held for fewer than eight years. Performance shown here would have been reduced if such fees were included and the expense limitation removed. For more information about fees, consult your variable annuity or variable life prospectus.
Investments in variable products involve risk.
Fixed income securities and bond funds can lose value, and investors can lose principal, as interest rates rise. They also may be affected by economic conditions that hinder an issuer’s ability to make interest and principal payments on its debt.
The Series may also be subject to prepayment risk, the risk that the principal of a fixed income security that is held by the Series may be prepaid prior to maturity, potentially forcing the Series to reinvest that money at a lower interest rate.
High yielding,non-investment-grade bonds (junk bonds) involve higher risk than investment grade bonds.
The high yield secondary market is particularly susceptible to liquidity problems when institutional investors, such as mutual funds and certain other financial institutions, temporarily stop buying bonds for regulatory, financial, or other reasons. In addition, a less liquid secondary market makes it more difficult for the Series to obtain precise valuations of the high yield securities in its portfolio.
The Series may invest in derivatives, which may involve additional expenses and are subject to risk, including the risk that an underlying security or securities index moves in the opposite direction from what the portfolio manager anticipated. A derivatives transaction depends upon the counterparties’ ability to fulfill their contractual obligations.
Liquidity risk is the possibility that investments cannot be readily sold within seven days at approximately the price at which a fund has valued them.
Fund for Income Series-3
Delaware VIP® Fund for Income Series
Performance summary (Unaudited) (continued)
LIBOR risk is the risk that potential changes related to the use of the London interbank offered rate (LIBOR) could have adverse impacts on financial instruments which reference LIBOR. The potential abandonment of LIBOR could affect the value and liquidity of instruments which reference LIBOR.
Please read both the contract and underlying prospectus for specific details regarding the product’s risk profile.
*The aggregate contractual waiver period covering this report is from Oct. 4, 2019 through Oct. 31, 2021.

| | | | | | |
For period beginning Dec. 31, 2009 through Dec. 31, 2019 | | Starting value | | Ending value |
-- | | ICE BofA US High Yield Constrained Index | | $10,000 | | $20,579 |
-- | | ICE BofABB-B US Cash Pay High Yield Constrained Index | | $10,000 | | $20,482 |
— | | Delaware VIP Fund for Income Series (Standard Class) | | $10,000 | | $18,805 |
The graph shows a $10,000 investment in the Delaware VIP Fund for Income Series Standard Class shares for the period from Dec. 31, 2009 through Dec. 31, 2019.
The graph also shows $10,000 invested in the ICE BofA US High Yield Constrained Index and the ICE BofABB-B US Cash Pay High Yield Constrained Index for the period from Dec. 31, 2009 through Dec. 31, 2019.
The ICE BofA US High Yield Constrained Index tracks the performance of US dollar–denominated below high yield corporate debt publicly issued in the US domestic market, but caps individual issuer exposure at 2% of the benchmark. Qualifying securities must have, among other things, a below-investment-grade rating (based on an average of Moody’s, Standard & Poor’s, and Fitch), an investment grade issuing country (based on an average of Moody’s, Standard & Poor’s, and Fitch foreign currency long-term sovereign debt ratings), and maturities of one year or more.
The ICE BofABB-B US Cash Pay High Yield Constrained Index tracks the performance of US dollar-denominated corporate debt rated BB1 through B3, based on an average of Moody’s, S&P and Fitch, currently in a coupon paying period, that is publicly issued in the US domestic market. Qualifying securities must have at least 18 months to final maturity at the time of issuance, at least one year remaining term to final maturity as of the rebalancing date, a fixed coupon schedule and a minimum amount outstanding of $250 million. The index caps issuer exposure at 2%.
Index performance returns do not reflect any management fees, transaction costs or expenses. Indices are unmanaged and one cannot invest directly in an index.
Past performance is not a guarantee of future results.
Fund for Income Series-4
Delaware VIP® Trust — Delaware VIP Fund for Income Series
Disclosure of Series expenses
For thesix-month period from July 1, 2019 to December 31, 2019 (Unaudited)
As a shareholder of the Series, you incur ongoing costs, which may include management fees; distribution and service(12b-1) fees; and other Series expenses. This example is intended to help you understand your ongoing costs (in dollars) of investing in the Series and to compare these costs with the ongoing costs of investing in other mutual funds.
The example is based on an investment of $1,000 invested at the beginning of the period and held for the entiresix-month period from July 1, 2019 to Dec. 31, 2019.
Actual expenses
The first section of the table shown, “Actual Series return,” provides information about actual account values and actual expenses. You may use the information in this section of the table, together with the amount you invested, to estimate the expenses that you paid over the period. Simply divide your account value by $1,000 (for example, an $8,600 account value divided by $1,000 = 8.6), then multiply the result by the number in the first section under the heading entitled “Expenses Paid During Period” to estimate the expenses you paid on your account during the period.
Hypothetical example for comparison purposes
The second section of the table shown, “Hypothetical 5% return,” provides information about hypothetical account values and hypothetical expenses based on the Series’ actual expense ratio and an assumed rate of return of 5% per year before expenses, which is not the Series’ actual return. The hypothetical account values and expenses may not be used to estimate the actual ending account balance or expenses you paid for the period. You may use this information to compare the ongoing costs of investing in the Series and other funds. To do so, compare this 5% hypothetical example with the 5% hypothetical examples that appear in the shareholder reports of other funds.
Please note that the expenses shown in the table are meant to highlight your ongoing costs only. As a shareholder of the Series, you do not incur any transaction costs, such as sales charges (loads), redemption fees or exchange fees, but shareholders of other funds may incur such costs. Also, the fees related to the variable annuity investment or the deferred sales charge that could apply have not been included. Therefore, the second section of the table is useful in comparing ongoing costs only, and will not help you determine the relative total costs of owning different funds. The Series’ expenses shown in the table reflect fee waivers in effect and assume reinvestment of all dividends and distributions.
Expense analysis of an investment of $1,000
| | | | | | | | | | |
| | | | |
| | | | | | | | | Expenses | |
| | | Beginning | | Ending | | | | Paid During | |
| | | Account | | Account | | Annualized | | Period | |
| | | Value | | Value | | Expense | | 7/1/19 to | |
| | | 7/1/19 | | 12/31/19 | | Ratio | | 12/31/19* | |
Actual Series return† | | | | |
Standard Class | | $1,000.00 | | $1,034.20 | | 0.88% | | | $4.51 | |
Hypothetical 5% return(5% return before expenses) | |
Standard Class | | $1,000.00 | | $1,020.77 | | 0.88% | | | $4.48 | |
*“Expenses Paid During Period” are equal to the Series’ annualized expense ratio, multiplied by the average account value over the period, multiplied by 184/365 (to reflect theone-half year period).
†Because actual returns reflect only the most recentsix-month period, the returns shown may differ significantly from fiscal year returns.
In addition to the Series’ expenses reflected above, the Series also indirectly bears its portion of the fees and expenses of the investment companies (Underlying Funds) in which it invests. The table above does not reflect the expenses of the Underlying Funds.
Fund for Income Series-5
Delaware VIP® Trust — Delaware VIP Fund for Income Series
Security type / country and sector allocations
As of December 31, 2019 (Unaudited)
Sector designations may be different than the sector designations presented in other Series materials. The sector designations may represent the investment manager’s internal sector classifications.
| | | | |
| | | Percentage |
| Security type / country | | of net assets |
Corporate Bonds | | | 87.65% | |
Banking | | | 3.33% | |
Basic Industry | | | 8.66% | |
Capital Goods | | | 7.44% | |
Communications | | | 6.79% | |
Consumer Cyclical | | | 8.39% | |
ConsumerNon-Cyclical | | | 4.14% | |
Energy | | | 11.15% | |
Financial Services | | | 1.27% | |
Healthcare | | | 7.68% | |
Insurance | | | 3.73% | |
Media | | | 12.43% | |
Real Estate Investment Trusts | | | 1.04% | |
Services | | | 2.51% | |
Technology | | | 5.86% | |
Transportation | | | 0.27% | |
Utilities | | | 2.96% | |
Loan Agreements | | | 6.15% | |
Short-Term Investments | | | 6.37% | |
Total Value of Securities | | | 100.17% | |
Liabilities Net of Receivables and Other Assets | | | (0.17% | ) |
Total Net Assets | | | 100.00% | |
Fund for Income Series-6
Delaware VIP® Trust — Delaware VIP Fund for Income Series
Schedule of investments
December 31, 2019
| | | | | | | | |
| | | Principal | | | Value | |
| | | amount° | | | (US $) | |
Corporate Bonds - 87.65% | | | | | |
Banking - 3.33% | | | | | | | | |
Ally Financial 8.00% 11/1/31 | | | 630,000 | | | $ | 875,669 | |
Credit Suisse Group 144A 7.50%#µy | | | 225,000 | | | | 253,535 | |
Popular 6.125% 9/14/23 | | | 975,000 | | | | 1,052,186 | |
Royal Bank of Scotland Group 8.625%µy | | | 980,000 | | | | 1,061,414 | |
Synovus Financial 5.90% 2/7/29 µ | | | 245,000 | | | | 260,319 | |
| | | | | | | | |
| | | | | | | 3,503,123 | |
| | | | | | | | |
| |
Basic Industry - 8.66% | | | | | |
Allegheny Technologies | | | | | | | | |
5.875% 12/1/27 | | | 180,000 | | | | 189,090 | |
7.875% 8/15/23 | | | 475,000 | | | | 533,385 | |
Chemours | | | | | | | | |
5.375% 5/15/27 | | | 275,000 | | | | 244,069 | |
7.00% 5/15/25 | | | 275,000 | | | | 277,636 | |
First Quantum Minerals | | | | | | | | |
144A 7.25% 5/15/22 # | | | 310,000 | | | | 312,009 | |
144A 7.50% 4/1/25 # | | | 320,000 | | | | 327,867 | |
Freeport-McMoRan 5.45% 3/15/43 | | | 575,000 | | | | 596,620 | |
Hudbay Minerals | | | | | | | | |
144A 7.25% 1/15/23 # | | | 175,000 | | | | 181,963 | |
144A 7.625% 1/15/25 # | | | 125,000 | | | | 132,198 | |
IAMGOLD 144A 7.00% 4/15/25 # | | | 255,000 | | | | 266,418 | |
Joseph T Ryerson & Son 144A | | | | | | | | |
11.00% 5/15/22 # | | | 450,000 | | | | 475,872 | |
Kraton Polymers 144A 7.00% 4/15/25 # | | | 530,000 | | | | 547,389 | |
Lennar 5.00% 6/15/27 | | | 280,000 | | | | 304,597 | |
Mattamy Group 144A 5.25% 12/15/27 # | | | 540,000 | | | | 562,950 | |
New Enterprise Stone & Lime 144A 6.25% 3/15/26 # | | | 350,000 | | | | 367,622 | |
Novelis | | | | | | | | |
144A 5.875% 9/30/26 # | | | 225,000 | | | | 239,946 | |
144A 6.25% 8/15/24 # | | | 275,000 | | | | 289,091 | |
Olin | | | | | | | | |
5.00% 2/1/30 | | | 555,000 | | | | 564,352 | |
5.625% 8/1/29 | | | 525,000 | | | | 555,476 | |
Schweitzer-Mauduit International 144A | | | | | | | | |
6.875% 10/1/26 # | | | 250,000 | | | | 270,087 | |
Standard Industries | | | | | | | | |
144A 5.00% 2/15/27 # | | | 250,000 | | | | 261,206 | |
144A 5.375% 11/15/24 # | | | 400,000 | | | | 411,996 | |
144A 6.00% 10/15/25 # | | | 350,000 | | | | 368,809 | |
Tms International Holding 144A 7.25% 8/15/25 # | | | 310,000 | | | | 281,196 | |
TPC Group 144A 10.50% 8/1/24 # | | | 525,000 | | | | 530,032 | |
| | | | | | | | |
| | | | | | | 9,091,876 | |
| | | | | | | | |
| | |
Capital Goods - 7.44% | | | | | | | | |
ARD Finance 144A PIK 6.50% 6/30/27 #T | | | 425,000 | | | | 440,215 | |
Ashtead Capital 144A 4.25% 11/1/29 # | | | 400,000 | | | | 409,500 | |
Berry Global 144A 4.875% 7/15/26 # | | | 250,000 | | | | 264,143 | |
| | | | | | | | |
| | | Principal | | | Value | |
| | | amount° | | | (US $) | |
Corporate Bonds (continued) | | | | | |
Capital Goods (continued) | | | | | |
Berry Global | | | | | | | | |
5.50% 5/15/22 | | | 250,000 | | | $ | 253,436 | |
144A 5.625% 7/15/27 # | | | 300,000 | | | | 322,507 | |
Bombardier | | | | | | | | |
144A 6.00% 10/15/22 # | | | 425,000 | | | | 425,935 | |
144A 7.50% 12/1/24 # | | | 275,000 | | | | 289,497 | |
144A 7.875% 4/15/27 # | | | 265,000 | | | | 273,288 | |
Cloud Crane 144A 10.125% 8/1/24 # | | | 125,000 | | | | 131,511 | |
Gates Global 144A 6.25% 1/15/26 # | | | 495,000 | | | | 504,427 | |
Granite Holdings US Acquisition 144A 11.00% 10/1/27 # | | | 280,000 | | | | 284,297 | |
Greif 144A 6.50% 3/1/27 # | | | 200,000 | | | | 216,370 | |
Mauser Packaging Solutions Holding 144A 7.25% 4/15/25 # | | | 540,000 | | | | 534,595 | |
Owens-Brockway Glass Container 144A 5.875% 8/15/23 # | | | 75,000 | | | | 80,219 | |
Reynolds Group Issuer 5.75% 10/15/20 | | | 508,782 | | | | 510,054 | |
TransDigm | | | | | | | | |
144A 5.50% 11/15/27 # | | | 270,000 | | | | 273,532 | |
144A 6.25% 3/15/26 # | | | 250,000 | | | | 271,121 | |
Trivium Packaging Finance | | | | | | | | |
144A 5.50% 8/15/26 # | | | 300,000 | | | | 316,687 | |
144A 8.50% 8/15/27 # | | | 390,000 | | | | 434,597 | |
United Rentals North America | | | | | | | | |
4.625% 10/15/25 | | | 150,000 | | | | 154,528 | |
5.25% 1/15/30 | | | 1,000,000 | | | | 1,078,150 | |
5.50% 5/15/27 | | | 325,000 | | | | 348,983 | |
| | | | | | | | |
| | | | | | | 7,817,592 | |
| | | | | | | | |
| |
Communications - 6.79% | | | | | |
Altice France | | | | | | | | |
144A 7.375% 5/1/26 # | | | 525,000 | | | | 564,632 | |
144A 8.125% 2/1/27 # | | | 200,000 | | | | 225,620 | |
C&W Senior Financing 144A 6.875% 9/15/27 # | | | 408,000 | | | | 437,234 | |
CenturyLink 144A 5.125% 12/15/26 # | | | 460,000 | | | | 469,260 | |
Cincinnati Bell 144A 7.00% 7/15/24 # | | | 300,000 | | | | 315,372 | |
Frontier Communications 144A 8.00% 4/1/27 # | | | 525,000 | | | | 549,596 | |
Level 3 Financing | | | | | | | | |
144A 3.875% 11/15/29 # | | | 550,000 | | | | 555,143 | |
5.375% 8/15/22 | | | 63,000 | | | | 63,249 | |
Qwest 7.25% 9/15/25 | | | 225,000 | | | | 258,809 | |
Sprint | | | | | | | | |
7.125% 6/15/24 | | | 125,000 | | | | 135,104 | |
7.625% 2/15/25 | | | 150,000 | | | | 164,978 | |
7.625% 3/1/26 | | | 450,000 | | | | 497,093 | |
7.875% 9/15/23 | | | 1,150,000 | | | | 1,271,227 | |
Sprint Capital 8.75% 3/15/32 | | | 175,000 | | | | 212,730 | |
T-Mobile USA | | | | | | | | |
5.125% 4/15/25 | | | 200,000 | | | | 207,392 | |
6.50% 1/15/24 | | | 50,000 | | | | 51,563 | |
Fund for Income Series-7
Delaware VIP® Fund for Income Series
Schedule of investments (continued)
| | | | | | | | |
| | | Principal | | | Value | |
| | | amount° | | | (US $) | |
Corporate Bonds (continued) | | | | | |
Communications (continued) | | | | | |
T-Mobile USA Escrow=† | | | 500,000 | | | $ | 0 | |
Zayo Group | | | | | | | | |
144A 5.75% 1/15/27 # | | | 525,000 | | | | 535,026 | |
6.00% 4/1/23 | | | 350,000 | | | | 358,605 | |
6.375% 5/15/25 | | | 250,000 | | | | 258,229 | |
| | | | | | | | |
| | | | | | | 7,130,862 | |
| | | | | | | | |
Consumer Cyclical – 8.39% | | | | | |
1011778 BC | | | | | | | | |
144A 3.875% 1/15/28 # | | | 275,000 | | | | 276,196 | |
144A 5.00% 10/15/25 # | | | 250,000 | | | | 258,646 | |
Allison Transmission 144A 5.875% 6/1/29 # | | | 500,000 | | | | 548,661 | |
AMC Entertainment Holdings | | | | | | | | |
5.75% 6/15/25 | | | 200,000 | | | | 185,417 | |
6.125% 5/15/27 | | | 840,000 | | | | 768,621 | |
Boyd Gaming | | | | | | | | |
144A 4.75% 12/1/27 # | | | 620,000 | | | | 645,172 | |
6.00% 8/15/26 | | | 395,000 | | | | 425,256 | |
Caesars Resort Collection 144A 5.25% 10/15/25 # | | | 586,000 | | | | 607,243 | |
Cedar Fair 5.375% 6/1/24 | | | 200,000 | | | | 206,083 | |
Golden Nugget 144A 8.75% 10/1/25 # | | | 225,000 | | | | 241,170 | |
IRB Holding 144A 6.75% 2/15/26 # | | | 775,000 | | | | 814,019 | |
KFC Holding 144A 5.00% 6/1/24 # | | | 150,000 | | | | 155,750 | |
Marriott Ownership Resorts 144A 4.75% 1/15/28 # | | | 100,000 | | | | 102,660 | |
MGM Resorts International 6.00% 3/15/23 | | | 200,000 | | | | 219,917 | |
Murphy Oil USA 4.75% 9/15/29 | | | 1,013,000 | | | | 1,071,673 | |
Scientific Games International | | | | | | | | |
144A 7.00% 5/15/28 # | | | 130,000 | | | | 139,341 | |
144A 7.25% 11/15/29 # | | | 180,000 | | | | 196,083 | |
144A 8.25% 3/15/26 # | | | 881,000 | | | | 972,953 | |
Stars Group Holdings 144A 7.00% 7/15/26 # | | | 150,000 | | | | 162,840 | |
Viking Cruises | | | | | | | | |
144A 5.875% 9/15/27 # | | | 175,000 | | | | 187,355 | |
144A 6.25% 5/15/25 # | | | 600,000 | | | | 626,499 | |
| | | | | | | | |
| | | | | | | 8,811,555 | |
| | | | | | | | |
Consumer Non-Cyclical – 4.14% | | | | | |
Albertsons | | | | | | | | |
5.75% 3/15/25 | | | 200,000 | | | | 207,583 | |
144A 5.875% 2/15/28 # | | | 100,000 | | | | 106,435 | |
144A 7.50% 3/15/26 # | | | 100,000 | | | | 112,437 | |
B&G Foods 5.25% 9/15/27 | | | 125,000 | | | | 126,406 | |
Energizer Holdings | | | | | | | | |
144A 5.50% 6/15/25 # | | | 250,000 | | | | 259,896 | |
144A 6.375% 7/15/26 # | | | 125,000 | | | | 133,356 | |
HLF Financing 144A 7.25% 8/15/26 # | | | 250,000 | | | | 265,313 | |
JBS USA | | | | | | | | |
144A 5.50% 1/15/30 # | | | 625,000 | | | | 672,469 | |
| | | | | | | | |
| | | Principal | | | Value | |
| | | amount° | | | (US $) | |
Corporate Bonds (continued) | | | | | |
Consumer Non-Cyclical (continued) | | | | | |
JBS USA | | | | | | | | |
144A 5.875% 7/15/24 # | | | 100,000 | | | $ | 103,025 | |
144A 6.75% 2/15/28 # | | | 300,000 | | | | 332,058 | |
Pilgrim’s Pride 144A 5.875% 9/30/27 # | | | 495,000 | | | | 536,135 | |
Post Holdings | | | | | | | | |
144A 5.50% 3/1/25 # | | | 250,000 | | | | 262,396 | |
144A 5.50% 12/15/29 # | | | 250,000 | | | | 267,037 | |
144A 5.75% 3/1/27 # | | | 400,000 | | | | 429,929 | |
Spectrum Brands 144A | | | | | | | | |
5.00% 10/1/29 # | | | 520,000 | | | | 538,381 | |
| | | | | | | | |
| | | | | | | 4,352,856 | |
| | | | | | | | |
Energy – 11.15% | | | | | | | | |
AmeriGas Partners | | | | | | | | |
5.50% 5/20/25 | | | 225,000 | | | | 243,560 | |
5.625% 5/20/24 | | | 50,000 | | | | 54,125 | |
5.75% 5/20/27 | | | 330,000 | | | | 362,941 | |
Cheniere Corpus Christi Holdings 7.00% 6/30/24 | | | 915,000 | | | | 1,056,345 | |
Cheniere Energy Partners 144A 4.50% 10/1/29 # | | | 815,000 | | | | 839,002 | |
Crestwood Midstream Partners | | | | | | | | |
5.75% 4/1/25 | | | 450,000 | | | | 461,245 | |
6.25% 4/1/23 | | | 250,000 | | | | 255,521 | |
DCP Midstream Operating | | | | | | | | |
3.875% 3/15/23 | | | 250,000 | | | | 256,247 | |
5.125% 5/15/29 | | | 175,000 | | | | 181,886 | |
Genesis Energy | | | | | | | | |
5.625% 6/15/24 | | | 100,000 | | | | 96,791 | |
6.50% 10/1/25 | | | 250,000 | | | | 242,497 | |
Gulfport Energy 6.375% 1/15/26 | | | 300,000 | | | | 186,854 | |
Hess Midstream Operations 144A 5.125% 6/15/28 # | | | 315,000 | | | | 319,331 | |
Murphy Oil | | | | | | | | |
5.875% 12/1/27 | | | 795,000 | | | | 835,744 | |
5.875% 12/1/42 | | | 250,000 | | | | 230,859 | |
NuStar Logistics | | | | | | | | |
5.625% 4/28/27 | | | 350,000 | | | | 360,273 | |
6.00% 6/1/26 | | | 350,000 | | | | 370,781 | |
Oasis Petroleum | | | | | | | | |
144A 6.25% 5/1/26 # | | | 285,000 | | | | 237,270 | |
6.875% 1/15/23 | | | 250,000 | | | | 245,000 | |
Parkland Fuel | | | | | | | | |
144A 5.875% 7/15/27 # | | | 225,000 | | | | 241,166 | |
144A 6.00% 4/1/26 # | | | 250,000 | | | | 264,537 | |
PDC Energy 6.125% 9/15/24 | | | 87,000 | | | | 88,341 | |
Precision Drilling | | | | | | | | |
6.50% 12/15/21 | | | 71,773 | | | | 71,802 | |
144A 7.125% 1/15/26 # | | | 150,000 | | | | 142,927 | |
Southwestern Energy 6.20% 1/23/25 | | | 300,000 | | | | 275,907 | |
Fund for Income Series-8
Delaware VIP® Fund for Income Series
Schedule of investments (continued)
| | | | | | | | |
| | | Principal | | | Value | |
| | | amount° | | | (US $) | |
Corporate Bonds (continued) | | | | | |
Energy (continued) | | | | | |
Southwestern Energy | | | | | | | | |
7.50% 4/1/26 | | | 100,000 | | | $ | 92,753 | |
7.75% 10/1/27 | | | 595,000 | | | | 552,591 | |
Sunoco 4.875% 1/15/23 | | | 300,000 | | | | 307,631 | |
Targa Resources Partners | | | | | | | | |
4.25% 11/15/23 | | | 850,000 | | | | 860,272 | |
144A 6.50% 7/15/27 # | | | 535,000 | | | | 586,815 | |
Transocean 144A 9.00% 7/15/23 # | | | 780,000 | | | | 825,501 | |
WPX Energy 5.25% 10/15/27 | | | 535,000 | | | | 565,415 | |
| | | | | | | | |
| | | | | | | 11,711,930 | |
| | | | | | | | |
Financial Services – 1.27% | | | | | |
DAE Funding | | | | | | | | |
144A 5.00% 8/1/24 # | | | 425,000 | | | | 447,283 | |
144A 5.75% 11/15/23 # | | | 175,000 | | | | 184,041 | |
NFP 144A 8.00% 7/15/25 # | | | 275,000 | | | | 281,302 | |
Springleaf Finance 5.375% 11/15/29 | | | 405,000 | | | | 423,488 | |
| | | | | | | | |
| | | | | | | 1,336,114 | |
| | | | | | | | |
Healthcare – 7.68% | | | | | |
AMN Healthcare 144A 5.125% 10/1/24 # | | | 125,000 | | | | 129,739 | |
Bausch Health 144A 5.50% 11/1/25 # | | | 1,000,000 | | | | 1,047,085 | |
Charles River Laboratories International 144A 4.25% 5/1/28 # | | | 785,000 | | | | 801,171 | |
DaVita 5.125% 7/15/24 | | | 925,000 | | | | 950,054 | |
Encompass Health | | | | | | | | |
4.75% 2/1/30 | | | 505,000 | | | | 524,872 | |
5.75% 11/1/24 | | | 118,000 | | | | 119,574 | |
Hadrian Merger 144A 8.50% 5/1/26 # | | | 625,000 | | | | 641,623 | |
HCA | | | | | | | | |
5.375% 2/1/25 | | | 325,000 | | | | 360,072 | |
5.875% 2/15/26 | | | 125,000 | | | | 142,373 | |
5.875% 2/1/29 | | | 470,000 | | | | 544,025 | |
Hill-Rom Holdings 144A 4.375% 9/15/27 # | | | 520,000 | | | | 536,431 | |
MEDNAX 144A 6.25% 1/15/27 # | | | 200,000 | | | | 205,505 | |
Select Medical 144A 6.25% 8/15/26 # | | | 440,000 | | | | 477,116 | |
Tenet Healthcare | | | | | | | | |
6.875% 11/15/31 | | | 220,000 | | | | 225,026 | |
8.125% 4/1/22 | | | 1,225,000 | | | | 1,357,337 | |
| | | | | | | | |
| | | | | | | 8,062,003 | |
| | | | | | | | |
Insurance – 3.73% | | | | | |
Centene | | | | | | | | |
144A 4.625% 12/15/29 # | | | 560,000 | | | | 591,192 | |
6.125% 2/15/24 | | | 300,000 | | | | 311,625 | |
GTCR AP Finance 144A 8.00% 5/15/27 # | | | 325,000 | | | | 338,925 | |
HUB International 144A 7.00% 5/1/26 # | | | 656,000 | | | | 695,376 | |
Molina Healthcare | | | | | | | | |
144A 4.875% 6/15/25 # | | | 250,000 | | | | 257,604 | |
5.375% 11/15/22 | | | 400,000 | | | | 425,904 | |
SBL Holdings 144A 5.125% 11/13/26 # | | | 450,000 | | | | 452,715 | |
| | | | | | | | |
| | | Principal | | | Value | |
| | | amount° | | | (US $) | |
Corporate Bonds (continued) | | | | | |
Insurance (continued) | | | | | |
USI 144A 6.875% 5/1/25 # | | | 821,000 | | | $ | 841,270 | |
| | | | | | | | |
| | | | | | | 3,914,611 | |
| | | | | | | | |
Media – 12.43% | | | | | |
Altice Luxembourg | | | | | | | | |
144A 7.625% 2/15/25 # | | | 505,000 | | | | 526,463 | |
144A 10.50% 5/15/27 # | | | 500,000 | | | | 570,950 | |
CCO Holdings | | | | | | | | |
144A 4.75% 3/1/30 # | | | 225,000 | | | | 229,923 | |
144A 5.00% 2/1/28 # | | | 150,000 | | | | 157,675 | |
5.125% 2/15/23 | | | 275,000 | | | | 278,435 | |
5.25% 9/30/22 | | | 200,000 | | | | 202,606 | |
144A 5.375% 6/1/29 # | | | 125,000 | | | | 133,669 | |
5.75% 9/1/23 | | | 150,000 | | | | 153,250 | |
144A 5.875% 4/1/24 # | | | 500,000 | | | | 517,917 | |
144A 5.875% 5/1/27 # | | | 275,000 | | | | 291,451 | |
Clear Channel Worldwide Holdings | | | | | | | | |
144A 5.125% 8/15/27 # | | | 650,000 | | | | 678,048 | |
144A 9.25% 2/15/24 # | | | 256,000 | | | | 284,054 | |
Connect Finco 144A 6.75% 10/1/26 # | | | 775,000 | | | | 826,344 | |
CSC Holdings | | | | | | | | |
144A 5.375% 7/15/23 # | | | 750,000 | | | | 770,314 | |
144A 5.75% 1/15/30 # | | | 450,000 | | | | 480,937 | |
144A 6.625% 10/15/25 # | | | 200,000 | | | | 212,748 | |
144A 7.50% 4/1/28 # | | | 225,000 | | | | 254,773 | |
Cumulus Media New Holdings 144A 6.75% 7/1/26 # | | | 535,000 | | | | 574,121 | |
Diamond Sports Group | | | | | | | | |
144A 5.375% 8/15/26 # | | | 275,000 | | | | 278,692 | |
144A 6.625% 8/15/27 # | | | 475,000 | | | | 462,816 | |
Gray Television | | | | | | | | |
144A 5.125% 10/15/24 # | | | 50,000 | | | | 51,979 | |
144A 5.875% 7/15/26 # | | | 275,000 | | | | 293,040 | |
144A 7.00% 5/15/27 # | | | 210,000 | | | | 233,751 | |
iHeartCommunications 8.375% 5/1/27 | | | 425,000 | | | | 470,411 | |
Inmarsat Finance 144A 4.875% 5/15/22 # | | | 150,000 | | | | 152,156 | |
LCPR Senior Secured Financing 144A 6.75% 10/15/27 # | | | 275,000 | | | | 292,009 | |
Netflix | | | | | | | | |
4.375% 11/15/26 | | | 100,000 | | | | 102,685 | |
4.875% 4/15/28 | | | 300,000 | | | | 312,367 | |
144A 4.875% 6/15/30 # | | | 60,000 | | | | 61,049 | |
Nexstar Broadcasting | | | | | | | | |
144A 5.625% 8/1/24 # | | | 200,000 | | | | 208,917 | |
144A 5.625% 7/15/27 # | | | 705,000 | | | | 744,233 | |
Radiate Holdco 144A 6.625% 2/15/25 # | | | 780,000 | | | | 790,074 | |
Sirius XM Radio 144A 4.625% 7/15/24 # | | | 450,000 | | | | 473,438 | |
Terrier Media Buyer 144A 8.875% 12/15/27 # | | | 440,000 | | | | 466,400 | |
VTR Finance 144A 6.875% 1/15/24 # | | | 505,000 | | | | 517,415 | |
| | | | | | | | |
| | | | | | | 13,055,110 | |
| | | | | | | | |
Fund for Income Series-9
Delaware VIP® Fund for Income Series
Schedule of investments (continued)
| | | | | | | | |
| | | Principal | | | Value | |
| | | amount° | | | (US $) | |
Corporate Bonds (continued) | | | | | |
Real Estate Investment Trusts – 1.04% | | | | | |
HAT Holdings I 144A 5.25% 7/15/24 # | | | 200,000 | | | $ | 210,667 | |
MGM Growth Properties Operating Partnership 144A 5.75% 2/1/27 # | | | 785,000 | | | | 878,219 | |
| | | | | | | | |
| | | | | | | 1,088,886 | |
| | | | | | | | |
Services – 2.51% | | | | | | | | |
Anixter 6.00% 12/1/25 | | | 275,000 | | | | 286,802 | |
Brand Industrial Services 144A 8.50% 7/15/25 # | | | 725,000 | | | | 744,930 | |
Clean Harbors 144A 5.125% 7/15/29 # | | | 295,000 | | | | 317,257 | |
KAR Auction Services 144A 5.125% 6/1/25 # | | | 50,000 | | | | 52,104 | |
Mobile Mini 5.875% 7/1/24 | | | 125,000 | | | | 130,313 | |
Prime Security Services Borrower 144A 5.75% 4/15/26 # | | | 540,000 | | | | 587,927 | |
Staples 144A 10.75% 4/15/27 # | | | 505,000 | | | | 513,509 | |
| | | | | | | | |
| | | | | | | 2,632,842 | |
| | | | | | | | |
Technology – 5.86% | | | | | | | | |
Banff Merger Sub 144A 9.75% 9/1/26 # | | | 545,000 | | | | 553,189 | |
Camelot Finance 144A 4.50% 11/1/26 # | | | 445,000 | | | | 458,071 | |
CDK Global 144A 5.25% 5/15/29 # | | | 755,000 | | | | 810,681 | |
CDW 5.00% 9/1/25 | | | 250,000 | | | | 261,771 | |
CommScope 144A 6.00% 3/1/26 # | | | 125,000 | | | | 133,203 | |
CommScope Technologies 144A 6.00% 6/15/25 # | | | 465,000 | | | | 466,688 | |
Iron Mountain | | | | | | | | |
144A 5.25% 3/15/28 # | | | 925,000 | | | | 963,711 | |
5.75% 8/15/24 | | | 225,000 | | | | 228,091 | |
NCR 144A 6.125% 9/1/29 # | | | 550,000 | | | | 597,834 | |
Solera 144A 10.50% 3/1/24 # | | | 400,000 | | | | 425,258 | |
SS&C Technologies 144A 5.50% 9/30/27 # | | | 665,000 | | | | 711,134 | |
Verscend Escrow 144A 9.75% 8/15/26 # | | | 495,000 | | | | 542,656 | |
| | | | | | | | |
| | | | | | | 6,152,287 | |
| | | | | | | | |
Transportation – 0.27% | | | | | |
VistaJet Malta Finance 144A 10.50% 6/1/24 # | | | 300,000 | | | | 285,626 | |
| | | | | | | | |
| | | | | | | 285,626 | |
| | | | | | | | |
Utilities – 2.96% | | | | | | | | |
AES 6.00% 5/15/26 | | | 150,000 | | | | 160,027 | |
Calpine 144A 5.25% 6/1/26 # | | | 505,000 | | | | 527,004 | |
Drax Finco 144A 6.625% 11/1/25 # | | | 300,000 | | | | 319,375 | |
TerraForm Power Operating | | | | | | | | |
144A 4.75% 1/15/30 # | | | 525,000 | | | | 535,159 | |
144A 5.00% 1/31/28 # | | | 250,000 | | | | 264,790 | |
Vistra Operations | | | | | | | | |
144A 5.00% 7/31/27 # | | | 255,000 | | | | 266,942 | |
144A 5.625% 2/15/27 # | | | 985,000 | | | | 1,039,766 | |
| | | | | | | | |
| | | | | | | 3,113,063 | |
| | | | | | | | |
Total Corporate Bonds
(cost $89,303,096) | | | | 92,060,336 | |
| | | | | | | | |
| | | | | | | | |
| | | Principal | | | Value | |
| | | amount° | | | (US $) | |
Loan Agreements – 6.15% | | | | | |
Air Medical Group Holdings Tranche B 1st Lien 5.035% (LIBOR01M + 3.25%) 4/28/22 • | | | 266,542 | | | $ | 261,461 | |
Applied Systems 2nd Lien 0.00% 9/19/25 X | | | 686,000 | | | | 704,007 | |
Apro Tranche B 1st Lien 5.842% (LIBOR03M + 4.00%) 10/28/26 • | | | 291,667 | | | | 294,219 | |
BW Gas & Convenience Holdings Tranche B 8.00% (LIBOR03M + 6.25%) 11/18/24 • | | | 275,000 | | | | 274,313 | |
Chesapeake Energy 9.928% (LIBOR03M + 8.00%) 6/24/24 • | | | 470,000 | | | | 485,275 | |
Dorna Sports Tranche B2 4.921% (LIBOR06M + 3.00%) 4/12/24 • | | | 400,000 | | | | 394,875 | |
Frontier Communications TrancheB-1 1st Lien 5.55% (LIBOR01M + 3.75%) 6/17/24 • | | | 525,652 | | | | 529,529 | |
Granite Generation Tranche B 1st Lien 5.57% (LIBOR03M + 3.75%) 11/9/26 • | | | 428,000 | | | | 424,790 | |
Howden Tranche B 7.211% (LIBOR03M + 5.25%) 9/30/26 • | | | 264,338 | | | | 265,659 | |
iHeartCommunications 1st Lien 5.691% (LIBOR01M + 4.00%) 5/1/26 • | | | 355,013 | | | | 358,880 | |
Kronos 2nd Lien 0.00% 11/1/24 X | | | 216,000 | | | | 221,940 | |
LCPR Loan Financing Tranche B 1st Lien 6.74% (LIBOR01M + 5.00%) 10/15/26 • | | | 207,000 | | | | 210,105 | |
Merrill Communications Tranche B 1st Lien 0.00% 10/5/26 X | | | 355,000 | | | | 357,662 | |
Nexstar Broadcasting TrancheB-4 4.452% (LIBOR03M + 2.75%) 9/18/26 • | | | 375 | | | | 378 | |
Panther BF Aggregator 2 Tranche B 1st Lien 5.305% (LIBOR01M + 3.50%) 4/30/26 • | | | 309,225 | | | | 311,091 | |
Stars Group Holdings Tranche B 0.00% 7/10/25 X | | | 265,000 | | | | 267,670 | |
Terrier Media Buyer Tranche B 0.00% 12/17/26 X | | | 224,000 | | | | 226,520 | |
Verscend Holding Tranche B 6.299% (LIBOR01M + 4.50%) 8/27/25 • | | | 372,058 | | | | 375,081 | |
Zekelman Industries 4.035% (LIBOR01M + 2.25%) 6/14/21 • | | | 496,539 | | | | 497,904 | |
| | | | | | | | |
Total Loan Agreements
(cost $6,405,990) | | | | 6,461,359 | |
| | | | | | | | |
Fund for Income Series-10
Delaware VIP® Fund for Income Series
Schedule of investments (continued)
| | | | | | | | |
| | | Number of | | | Value | |
| | | shares | | | (US $) | |
Short-Term Investments – 6.37% | | | | | |
Money Market Mutual Funds – 6.37% | | | | | |
BlackRock FedFund – Institutional Shares(seven-day effective yield 1.52%) | | | 1,338,627 | | | $ | 1,338,627 | |
Fidelity Investments Money Market Government Portfolio – Class I(seven-day effective yield 1.49%) | | | 1,338,627 | | | | 1,338,627 | |
GS Financial Square Government Fund – Institutional Shares(seven-day effective yield 1.51%) | | | 1,338,627 | | | | 1,338,627 | |
| | | | | | | | |
| | | Number of | | | Value | |
| | | shares | | | (US $) | |
Short-Term Investments (continued) | | | | | |
Money Market Mutual Funds (continued) | | | | | |
Morgan Stanley Government Portfolio – Institutional Share Class(seven-day effective yield 1.48%) | | | 1,338,627 | | | $ | 1,338,627 | |
State Street Institutional US Government Money Market Fund – Investor Class(seven-day effective yield 1.45%) | | | 1,338,627 | | | | 1,338,627 | |
| | | | | | | | |
Total Short-Term Investments
(cost $6,693,135) | | | | 6,693,135 | |
| | | | | | | | |
| | | | |
Total Value of Securities – 100.17%
(cost $102,402,221) | | $ | 105,214,830 | |
| | | | |
| # | Security exempt from registration under Rule 144A of the Securities Act of 1933, as amended. At Dec. 31, 2019, the aggregate value of Rule 144A securities was $60,283,948, which represents 57.39% of the Series’ net assets. See Note 9 in “Notes to financial statements.” |
| T | PIK. The first payment of cash and/or principal will be made after June 30, 2020. |
| = | The value of this security was determined using significant unobservable inputs and is reported as a Level 3 security in the disclosure table located in Note 3 in “Notes to financial statements.” |
| ° | Principal amount shown is stated in USD unless noted that the security is denominated in another currency. |
| µ | Fixed to variable rate investment. The rate shown reflects the fixed rate in effect at Dec. 31, 2019. Rate will reset at a future date. |
| y | No contractual maturity date. |
| † | Non-income producing security. |
| • | Variable rate investment. Rates reset periodically. Rate shown reflects the rate in effect at Dec. 31, 2019. For securities based on a published reference rate and spread, the reference rate and spread are indicated in their description above. The reference rate descriptions (i.e. LIBOR03M, LIBOR06M, etc.) used in this report are identical for different securities, but the underlying reference rates may differ due to the timing of the reset period. Certain variable rate securities are not based on a published reference rate and spread but are determined by the issuer or agent and are based on current market conditions, or for mortgage-backed securities, are impacted by the individual mortgages which are paying off over time. These securities do not indicate a reference rate and spread in their description above. |
| X | This loan will settle after Dec. 31, 2019, at which time the interest rate, based on the LIBOR and the agreed upon spread on trade date, will be reflected. |
Unfunded Loan Commitments
The Series may invest in floating rate loans. In connection with these investments, the Series may also enter into unfunded corporate loan commitments (commitments). Commitments may obligate the Series to furnish temporary financing to a borrower until permanent financing can be arranged. In connection with these commitments, the Series earns a commitment fee, typically set as a percentage of the commitment amount. The following unfunded loan commitment was outstanding at Dec. 31, 2019:
| | | | | | |
Borrower | | Principal Amount | | Value | | Unrealized Appreciation |
Apro Tranche B 1st Lien 2.00% (LIBOR03M + 2.00%) 10/28/26 | | $83,333 | | $84,063 | | $730 |
Summary of abbreviations:
GS – Goldman Sachs
ICE – Intercontinental Exchange
LIBOR – London interbank offered rate
LIBOR01M – ICE LIBOR USD 1 Month
LIBOR03M – ICE LIBOR USD 3 Month
LIBOR06M – ICE LIBOR USD 6 Month
PIK –Payment-in-kind
USD – US Dollar
See accompanying notes, which are an integral part of the financial statements.
Fund for Income Series-11
| | |
Delaware VIP®Trust — Delaware VIP Fund for Income Series | | |
Statement of assets and liabilities | | December 31, 2019 |
| | | | |
Assets: | | | | |
Investments, at value1 | | $ | 105,214,830 | |
Dividends and interest receivable | | | 1,520,483 | |
Receivable for securities sold | | | 900,850 | |
Receivable for series shares sold | | | 5,182 | |
Other assets | | | 4,286 | |
| | | | |
Total assets | | | 107,645,631 | |
| | | | |
Liabilities: | | | | |
Cash due to custodian | | | 77,775 | |
Payable for securities purchased | | | 2,378,652 | |
Audit and tax fees payable | | | 51,403 | |
Other accrued expenses | | | 37,882 | |
Investment management fees payable | | | 31,563 | |
Payable for series shares redeemed | | | 30,926 | |
Trustees’ fees and expenses payable | | | 1,051 | |
Dividend disbursing and transfer agent fees and expenses payable to affiliates | | | 669 | |
Accounting and administration expenses payable to affiliates | | | 636 | |
Reports and statements to shareholders expenses payable to affiliates | | | 167 | |
Legal fees payable to affiliates | | | 163 | |
| | | | |
Total liabilities | | | 2,610,887 | |
| | | | |
Total Net Assets | | $ | 105,034,744 | |
| | | | |
| |
Net Assets Consist of: | | | | |
Paid-in capital | | $ | 103,884,261 | |
Total distributable earnings (loss) | | | 1,150,483 | |
| | | | |
Total Net Assets | | $ | 105,034,744 | |
| | | | |
| |
Net Asset Value: | | | | |
Standard Class: | | | | |
Net assets | | $ | 105,034,744 | |
Shares of beneficial interest outstanding, unlimited authorization, no par | | | 16,502,064 | |
Net asset value per share | | $ | 6.36 | |
| |
| | | | |
1Investments, at cost | | $ | 102,402,221 | |
See accompanying notes, which are an integral part of the financial statements.
Fund for Income Series-12
Delaware VIP®Trust —
Delaware VIP Fund for Income Series
Statement of operations
Year ended December 31, 2019
| | | | |
Investment Income: | | | | |
Interest | | $ | 6,102,068 | |
Dividends | | | 28,570 | |
| | | | |
| | | 6,130,638 | |
| | | | |
Expenses: | | | | |
Management fees | | | 769,442 | |
Audit and tax fees | | | 50,252 | |
Reports and statements to shareholders | | | 37,155 | |
Accounting and administration expenses | | | 12,979 | |
Legal fees | | | 11,782 | |
Trustees’ fees and expenses | | | 9,429 | |
Custodian fees | | | 3,058 | |
Dividend disbursing and transfer agent fees and expenses | | | 2,010 | |
Other | | | 37,226 | |
| | | | |
| | | 933,333 | |
Less expenses waived | | | (31,884 | ) |
Less expenses paid indirectly | | | (2,491 | ) |
| | | | |
Total operating expenses | | | 898,958 | |
| | | | |
Net Investment Income | | | 5,231,680 | |
| | | | |
| |
Net Realized and Unrealized Gain (Loss): | | | | |
Net realized loss on investments | | | (628,839 | ) |
Net change in unrealized appreciation (depreciation) of investments | | | 7,972,064 | |
| | | | |
Net Realized and Unrealized Gain | | | 7,343,225 | |
| | | | |
Net Increase in Net Assets Resulting from Operations | | $ | 12,574,905 | |
| | | | |
Delaware VIP Trust —
Delaware VIP Fund for Income Series
Statements of changes in net assets
| | | | | | | | |
| | | Year ended | |
| | | 12/31/19 | | | 12/31/18 | |
Increase (Decrease) in Net Assets from Operations: | | | | | | | | |
Net investment income | | $ | 5,231,680 | | | $ | 5,136,389 | |
Net realized loss | | | (628,839 | ) | | | (135,135 | ) |
Net change in unrealized appreciation (depreciation) | | | 7,972,064 | | | | (7,547,381 | ) |
| | | | | | | | |
Net increase (decrease) in net assets resulting from operations | | | 12,574,905 | | | | (2,546,127 | ) |
| | | | | | | | |
| | |
Dividends and Distributions to Shareholders from: | | | | | | | | |
Distributable earnings: | | | | | | | | |
Standard Class | | | (5,659,504 | ) | | | (5,406,594 | ) |
| | | | | | | | |
| | |
Capital Share Transactions: | | | | | | | | |
Proceeds from shares sold: | | | | | | | | |
Standard Class | | | 3,411,348 | | | | 4,700,129 | |
| | |
Net asset value of shares issued upon reinvestment of dividends and distributions: | | | | | | | | |
Standard Class | | | 5,659,504 | | | | 5,406,594 | |
| | | | | | | | |
| | | 9,070,852 | | | | 10,106,723 | |
| | | | | | | | |
Cost of shares redeemed: | | | | | | | | |
Standard Class | | | (11,149,960 | ) | | | (7,966,143 | ) |
| | | | | | | | |
Increase (Decrease) in net assets derived from capital share transactions | | | (2,079,108 | ) | | | 2,140,580 | |
| | | | | | | | |
Net Increase (Decrease) in Net Assets | | | 4,836,293 | | | | (5,812,141 | ) |
| | |
Net Assets: | | | | | | | | |
Beginning of year | | | 100,198,451 | | | | 106,010,592 | |
| | | | | | | | |
End of year | | $ | 105,034,744 | | | $ | 100,198,451 | |
| | | | | | | | |
See accompanying notes, which are an integral part of the financial statements.
Fund for Income Series-13
Delaware VIP® Trust — Delaware VIP Fund for Income Series
Financial highlights
Selected data for each share of the Series outstanding throughout each period were as follows:
| | | | | | | | | | | | | | | | | | | | | | | | | |
| | | Delaware VIP Fund for Income Series Standard Class Year ended |
| | | 12/31/191 | | 12/31/18 | | 12/31/17 | | 12/31/16 | | 12/31/15 |
Net asset value, beginning of period | | | $ | 5.96 | | | | $ | 6.45 | | | | $ | 6.36 | | | | $ | 6.07 | | | | $ | 6.53 | |
| | | | | |
Income (loss) from investment operations: | | | | | | | | | | | | | | | | | | | | | | | | | |
Net investment income2 | | | | 0.30 | | | | | 0.30 | | | | | 0.30 | | | | | 0.30 | | | | | 0.30 | |
Net realized and unrealized gain (loss) | | | | 0.44 | | | | | (0.46 | ) | | | | 0.12 | | | | | 0.34 | | | | | (0.40 | ) |
| | | | | | | | | | | | | | | | | | | | | | | | | |
Total from investment operations | | | | 0.74 | | | | | (0.16 | ) | | | | 0.42 | | | | | 0.64 | | | | | (0.10 | ) |
| | | | | | | | | | | | | | | | | | | | | | | | | |
| | | | | |
Less dividends and distributions from: | | | | | | | | | | | | | | | | | | | | | | | | | |
Net investment income | | | | (0.34 | ) | | | | (0.33 | ) | | | | (0.33 | ) | | | | (0.35 | ) | | | | (0.36 | ) |
| | | | | | | | | | | | | | | | | | | | | | | | | |
Total dividends and distributions | | | | (0.34 | ) | | | | (0.33 | ) | | | | (0.33 | ) | | | | (0.35 | ) | | | | (0.36 | ) |
| | | | | | | | | | | | | | | | | | | | | | | | | |
| | | | | |
Net asset value, end of period | | | $ | 6.36 | | | | $ | 5.96 | | | | $ | 6.45 | | | | $ | 6.36 | | | | $ | 6.07 | |
| | | | | | | | | | | | | | | | | | | | | | | | | |
| | | | | |
Total return3 | | | | 12.78% | | | | | (2.58% | ) | | | | 6.82% | | | | | 11.12% | | | | | (1.85% | ) |
| | | | | |
Ratios and supplemental data: | | | | | | | | | | | | | | | | | | | | | | | | | |
Net assets, end of period (000 omitted) | | | $ | 105,035 | | | | $ | 100,198 | | | | $ | 106,011 | | | | $ | 101,427 | | | | $ | 95,033 | |
Ratio of expenses to average net assets4 | | | | 0.85% | | | | | 0.91% | | | | | 0.89% | | | | | 0.89% | | | | | 0.86% | |
Ratio of expenses to average net assets prior to fees waived4 | | | | 0.88% | | | | | 0.91% | | | | | 0.89% | | | | | 0.89% | | | | | 0.86% | |
Ratio of net investment income to average net assets | | | | 4.94% | | | | | 4.93% | | | | | 4.70% | | | | | 4.85% | | | | | 4.86% | |
Ratio of net investment income to average net assets prior to fees waived | | | | 4.91% | | | | | 4.93% | | | | | 4.70% | | | | | 4.85% | | | | | 4.86% | |
Portfolio turnover | | | | 115% | | | | | 73% | | | | | 66% | | | | | 56% | | | | | 45% | |
| 1 | On Oct. 4, 2019, the First Investors Life Series Fund for Income shares were reorganized into Standard Class shares of the Series. See “Notes to financial statements.” The Standard Class shares financial highlights for the period prior to Oct. 4, 2019, reflect the performance of the First Investors Life Series Fund for Income shares. |
| 2 | The average shares outstanding method has been applied for per share information. |
| 3 | Total return is based on the change in net asset value of a share during the period and assumes reinvestment of dividends and distributions at net asset value. Total return does not include fees, charges, or expenses imposed by the variable annuity and life insurance contracts for which Delaware VIP Trust serves as an underlying investment vehicle. |
| 4 | Expense ratios do not include expenses of the Underlying Funds in which the Series invests. |
See accompanying notes, which are an integral part of the financial statements.
Fund for Income Series-14
Delaware VIP® Trust — Delaware VIP Fund for Income Series
Notes to financial statements
December 31, 2019
Delaware VIP Trust (Trust) is organized as a Delaware statutory trust. The Trust consists of 22 series, each of which is treated as a separate entity for certain matters under the Investment Company Act of 1940, as amended (1940 Act). These financial statements and the related notes pertain to Delaware VIP Fund for Income Series (Series). The Trust is anopen-end investment company. The Series is considered diversified under the 1940 Act and offers Standard Class shares. The Standard Class shares do not carry a distribution and service(12b-1) fee. The shares of the Series are sold only to separate accounts of life insurance companies.
Before the Series commenced operations, on Oct. 4, 2019, all of the assets and liabilities of the First Investors Life Series Fund for Income, its respective Predecessor Series (Predecessor Series) were transferred to the Series in atax-free reorganization as set forth in an agreement and plan of reorganization (each a Foresters Reorganization) between the Trust, on behalf of the Series, and Foresters Investment Management Company, Inc. (FIMCO), on behalf of the Predecessor Series. As a result of the Foresters Reorganization, the Series assumed the performance and accounting history of its Predecessor Series. Financial information included for the dates prior to the Foresters Reorganization is that of the Predecessor Series.
1. Significant Accounting Policies
The Series follows accounting and reporting guidance under Financial Accounting Standards Board (FASB) Accounting Standards Codification Topic 946, Financial Services – Investment Companies. The following accounting policies are in accordance with US generally accepted accounting principles (US GAAP) and are consistently followed by the Series.
Security Valuation — Debt securities are valued based upon valuations provided by an independent pricing service or broker and reviewed by management. To the extent current market prices are not available, the pricing service may take into account developments related to the specific security, as well as transactions in comparable securities. US government and agency securities are valued at the mean between the bid and ask prices, which approximates fair value. Valuations for fixed income securities utilize matrix systems, which reflect such factors as security prices, yields, maturities, and ratings, and are supplemented by dealer and exchange quotations.Open-end investment companies are valued at their published net asset value (NAV). Generally, other securities and assets for which market quotations are not readily available are valued at fair value as determined in good faith under the direction of the Trust’s Board of Trustees (Board). In determining whether market quotations are readily available or fair valuation will be used, various factors will be taken into consideration, such as market closures or suspension of trading in a security. Restricted securities are valued at fair value using methods approved by the Board.
Federal Income Taxes — No provision for federal income taxes has been made as the Series intends to continue to qualify for federal income tax purposes as a regulated investment company under Subchapter M of the Internal Revenue Code of 1986, as amended, and make the requisite distributions to shareholders. The Series evaluates tax positions taken or expected to be taken in the course of preparing the Series’ tax returns to determine whether the tax positions are“more-likely-than-not” of being sustained by the applicable tax authority. Tax positions not deemed to meet the“more-likely-than-not” threshold are recorded as a tax benefit or expense in the current year. Management has analyzed the Series’ tax positions taken or expected to be taken on the Series’ federal income tax returns through the year ended Dec. 31, 2019 and for all open tax years (years ended Dec. 31, 2016–Dec. 31, 2018), and has concluded that no provision for federal income tax is required in the Series’ financial statements. If applicable, the Series recognizes interest accrued on unrecognized tax benefits in interest expense and penalties in “Other” on the “Statement of operations.” During the year ended Dec. 31, 2019, the Series did not incur any interest or tax penalties.
Use of Estimates — The preparation of financial statements in conformity with US GAAP requires management to make estimates and assumptions that affect the fair value of investments, the reported amounts of assets and liabilities and disclosure of contingent assets and liabilities at the date of the financial statements, and the reported amounts of revenues and expenses during the reporting period. Actual results could differ from those estimates and the differences could be material.
Other — Expenses directly attributable to the Series are charged directly to the Series. Other expenses common to various funds within the Delaware Funds® by Macquarie (Delaware Funds) are generally allocated among such funds on the basis of average net assets. Management fees and certain other expenses are paid monthly. Security transactions are recorded on the date the securities are purchased or sold (trade date) for financial reporting purposes. Costs used in calculating realized gains and losses on the sale of investment securities are those of the specific securities sold. Interest income is recorded on the accrual basis. Discounts and premiums on debt securities are accreted or amortized to interest income, respectively, over the lives of the respective securities using the effective interest method. Realized gains (losses) on paydowns of asset- and mortgage backed securities are classified as interest income. The Series declares and pays dividends from net investment income and distributions from net realized gain on investments, if any, following the close of the fiscal year. The Series may distribute more frequently, if necessary for tax purposes. Dividends and distributions, if any, are recorded on theex-dividend date.
The Series receives earnings credits from its custodian when positive cash balances are maintained, which may be used to offset custody fees. The expenses paid under this arrangement are included on the “Statement of operations” under “Custodian fees” with the corresponding expenses offset included under “Less expenses paid indirectly.” For the year ended Dec. 31, 2019, the Series earned $2,491 under this arrangement.
Fund for Income Series-15
Delaware VIP® Fund for Income Series
Notes to financial statements (continued)
1. Significant Accounting Policies (continued)
The Series receives earnings credits from its transfer agent when positive cash balances are maintained, which may be used to offset transfer agent fees. If the amount earned is greater than $1, the expenses paid under this arrangement are included on the “Statement of operations” under “Dividend disbursing and transfer agent fees and expenses” with the corresponding expenses offset included under “Less expenses paid indirectly.” There were no such earnings credits for the year ended Dec. 31, 2019.
2. Investment Management, Administration Agreements, and Other Transactions with Affiliates
In accordance with the terms of its investment management agreement, effective Oct. 4, 2019, the Series pays Delaware Management Company (DMC), a series of Macquarie Investment Management Business Trust and the investment manager, an annual fee which is calculated daily and paid monthly at the rates of 0.65% on the first $500 million of average daily net assets of the Series, 0.60% on the next $500 million, 0.55% on the next $1.5 billion, and 0.50% on average daily net assets in excess of $2.5 billion. Prior to Oct. 4, 2019, the Series paid FIMCO, an annual fee which was calculated daily and paid monthly at the rates of 0.75% on the first $250 million of average daily net assets of the Series, 0.72% on the next $250 million, 0.69% on the next $250 million, 0.66% on the next $500 million, 0.64% on the next $500 million, 0.62% on the next $500 million, and 0.60% on average daily net assets in excess of $2.25 billion.
DMC has contractually agreed to waive all or a portion of its investment advisory fees and/or pay/reimburse expenses (excluding any acquired fund fees and expenses, taxes, interest, short sale dividend and interest expenses, brokerage fees, certain insurance costs, and nonroutine expenses or costs, including, but not limited to, those relating to reorganizations, litigation, conducting shareholder meetings, and liquidations), do not exceed 0.83% of the Series’ average daily net assets from Oct. 4, 2019 through Dec. 31, 2019.* Prior to Oct. 4, 2019, FIMCO had waived to limit the advisory fee to 0.60% of the Series’ average daily net assets. These waivers and reimbursements may only be terminated by agreement of DMC and the Series. The waivers and reimbursements are accrued daily and received monthly.
Effective Oct. 4, 2019, DMC may seek investment advice and recommendations from its affiliates: Macquarie Investment Management Europe Limited, Macquarie Investment Management Austria Kapitalanlage AG, and Macquarie Investment Management Global Limited (together, the “AffiliatedSub-Advisors”). The Manager may also permit these AffiliatedSub-Advisors to execute Series security trades on behalf of the Manager and exercise investment discretion for securities in certain markets where DMC believes it will be beneficial to utilize an AffiliatedSub-Advisor’s specialized market knowledge. Although the AffiliatedSub-Advisors serve assub-advisors, DMC has ultimate responsibility for all investment advisory services. For these services, DMC, not the Series, pays each AffiliatedSub-Advisor a portion of its investment management fee.
Effective Oct. 4, 2019, Delaware Investments Fund Services Company (DIFSC), an affiliate of DMC, provides fund accounting and financial administration oversight services to the Series. For these services, DIFSC’s fees are calculated daily and paid monthly based on the aggregate daily net assets of all funds within the Delaware Funds at the following annual rates: 0.00475% of the first $35 billion; 0.0040% of the next $10 billion; and 0.0025% of aggregate average daily net assets in excess of $45 billion (Total Fee). Each fund in the Delaware Funds pays a minimum of $4,000, which, in aggregate, is subtracted from the Total Fee. Each fund then pays its portion of the remainder of the Total Fee on a relative NAV basis. This amount is included on the “Statement of operations” under “Accounting and administration expenses.” For the period Oct. 4, 2019 through year ended Dec. 31, 2019, the Series was charged $1,856 for these services. Prior to Oct. 4, 2019, there were no fund accounting and financial administration oversight services for the Series.
Effective Oct. 4, 2019, DIFSC is also the transfer agent and dividend disbursing agent of the Series. For these services, DIFSC’s fees are calculated daily and paid monthly at the annual rate of 0.0075% of the Series’ average daily net assets. This amount is included on the “Statement of operations” under “Dividend disbursing and transfer agent fees and expenses.” For the period Oct. 4, 2019 through year ended Dec. 31, 2019, the Series was charged $1,909 for these services. Pursuant to asub-transfer agency agreement between DIFSC and BNY Mellon Investment Servicing (US) Inc. (BNYMIS), BNYMIS provides certainsub-transfer agency services to the Series.Sub-transfer agency fees are paid directly by the Series and are also included on the “Statement of operations” under “Dividend disbursing and transfer agent fees and expenses.” The fees that are calculated daily and paid as invoices are received on a monthly or quarterly basis. Prior to Oct. 4, 2019, Foresters Investor Services, Inc. was the transfer agent of the Series.
As provided in the investment management agreement, the Series bears a portion of the cost of certain resources shared with DMC, including the cost of internal personnel of DMC and/or its affiliates that provide legal, tax, and regulatory reporting services to the Series. For the year ended Dec. 31, 2019, the Series was charged $519 for internal legal, tax, and regulatory reporting services provided by DMC and/or its affiliates’ employees. These amounts are included on the “Statement of operations” under “Legal fees.”
Trustees’ fees include expenses accrued by the Series for each Trustee’s retainer and meeting fees. Certain officers of DMC, DIFSC, and DDLP are officers and/or Trustees of the Trust. These officers and Trustees are paid no compensation by the Series.
In addition to the management fees and other expenses of the Series, the Series indirectly bears the investment management fees and other expenses of the investment companies (Underlying Funds) in which it invests. The amount of these fees and expenses incurred indirectly by the Series will vary based upon the expense and fee levels of the Underlying Funds and the number of shares that are owned of the Underlying Funds at different times.
Fund for Income Series-16
Delaware VIP® Fund for Income Series
Notes to financial statements (continued)
2. Investment Management, Administration Agreements, and Other Transactions with Affiliates (continued)
Cross trades for the year ended Dec. 31, 2019 were executed by the Series pursuant to procedures adopted by the Board designed to ensure compliance with Rule17a-7 under the 1940 Act. Cross trading is the buying or selling of portfolio securities between funds of investment companies, or between a fund of an investment company and another entity, that are or could be considered affiliates by virtue of having a common investment advisor (or affiliated investment advisors), common directors/trustees and or common officers. At its regularly scheduled meetings, the Board reviews such transactions for compliance with the procedures adopted by the Board. Pursuant to these procedures, for the year ended Dec. 31, 2019, the Series engaged in securities purchases of $158,851. The Series did not engage in Rule17a-7 securities sales for the year ended Dec. 31, 2019.
*The aggregate contractual waiver period covering this report is from Oct. 4, 2019 through Oct. 31, 2021.
3. Investments
For the year ended Dec. 31, 2019, the Series made purchases and sales of investment securities other than short-term investments as follows:
| | | | |
Purchases | | $ | 117,235,177 | |
Sales | | | 119,624,959 | |
The tax cost of investments includes adjustments to net unrealized appreciation (depreciation) which may not necessarily be the final tax cost basis adjustments, but approximate the tax basis unrealized gains and losses that may be realized and distributed to shareholders. At Dec. 31, 2019, the cost and unrealized appreciation (depreciation) of investments for federal income tax purposes for the Series were as follows:
| | | | | | |
| | | Aggregate | | Aggregate | | |
| | | Unrealized | | Unrealized | | Net Unrealized |
| Cost of | | Appreciation | | Depreciation | | Appreciation |
| Investments | | of Investments | | of Investments | | of Investments |
| $102,667,106 | | $2,887,226 | | $(339,502) | | $2,547,724 |
US GAAP defines fair value as the price that the Series would receive to sell an asset or pay to transfer a liability in an orderly transaction between market participants at the measurement date under current market conditions. A three-level hierarchy for fair value measurements has been established based upon the transparency of inputs to the valuation of an asset or liability. Inputs may be observable or unobservable and refer broadly to the assumptions that market participants would use in pricing the asset or liability. Observable inputs reflect the assumptions that market participants would use in pricing the asset or liability based on market data obtained from sources independent of the reporting entity. Unobservable inputs reflect the reporting entity’s own assumptions about the assumptions that market participants would use in pricing the asset or liability based on the best information available under the circumstances. The Series’ investment in its entirety is assigned a level based upon the observability of the inputs which are significant to the overall valuation. The three-level hierarchy of inputs is summarized below.
| | | | |
| Level 1 | | – | | Inputs are quoted prices in active markets for identical investments. (Examples: equity securities,open-end investment companies, futures contracts, and exchange-traded options contracts) |
| Level 2 | | – | | Other observable inputs, including, but not limited to: quoted prices for similar assets or liabilities in markets that are active, quoted prices for identical or similar assets or liabilities in markets that are not active, inputs other than quoted prices that are observable for the assets or liabilities (such as interest rates, yield curves, volatilities, prepayment speeds, loss severities, credit risks, and default rates) or other market-corroborated inputs. (Examples: debt securities, government securities, swap contracts, foreign currency exchange contracts, foreign securities utilizing international fair value pricing, broker-quoted securities, and fair valued securities) |
| Level 3 | | – | | Significant unobservable inputs, including the Series’ own assumptions used to determine the fair value of investments. (Examples: broker-quoted securities and fair valued securities) |
Level 3 investments are valued using significant unobservable inputs. The Series may also use an income-based valuation approach in which the anticipated future cash flows of the investment are discounted to calculate fair value. Discounts may also be applied due to the nature or duration of any restrictions on the disposition of the investments. Valuations may also be based upon current market prices of securities that are comparable in coupon, rating, maturity, and industry. The derived value of a Level 3 investment may not represent the value which is received upon disposition and this could impact the results of operations.
Fund for Income Series-17
Delaware VIP® Fund for Income Series
Notes to financial statements (continued)
3. Investments (continued)
The following table summarizes the valuation of the Series’ investments by fair value hierarchy levels as of Dec. 31, 2019:
| | | | | | | | | | | | | | | | | | | | |
Securities | | Level 1 | | Level 2 | | Level 3 | | Total |
Assets: | | | | | | | | | | | | | | | | | | | | |
Corporate Debt | | | $ | — | | | | $ | 92,060,336 | | | | $ | — | | | | $ | 92,060,336 | |
Loan Agreements | | | | — | | | | | 6,461,359 | | | | | — | | | | | 6,461,359 | |
Short-Term Investments | | | | 6,693,135 | | | | | — | | | | | — | | | | | 6,693,135 | |
| | | | | | | | | | | | | | | | | | | | |
Total Value of Securities | | | $ | 6,693,135 | | | | $ | 98,521,695 | | | | $ | — | | | | $ | 105,214,830 | |
| | | | | | | | | | | | | | | | | | | | |
The securities that have been valued at zero on the “Schedule of investments” are considered to be Level 3 investments in this table.
During the year ended Dec. 31, 2019, there were no transfers between Level 1 investments, Level 2 investments, or Level 3 investments that had a significant impact to the Series. The Series’ policy is to recognize transfers between levels based on fair value at the beginning of the reporting period.
A reconciliation of Level 3 investments is presented when the Series has a significant amount of Level 3 investments at the beginning, interim, or end of the year in relation to net assets.
4. Dividend and Distribution Information
Income and long-term capital gain distributions are determined in accordance with federal income tax regulations, which may differ from US GAAP. Additionally, distributions from net short-term gains on sales of investment securities are treated as ordinary income for federal income tax purposes. The tax character of dividends and distributions paid during the years ended Dec. 31, 2019 and 2018 was as follows:
| | | | | | | | |
| | | Year ended | |
| | | 12/31/19 | | | 12/31/18 | |
Ordinary income | | $ | 5,659,504 | | | $ | 5,406,594 | |
5. Components of Net Assets on a Tax Basis
As of Dec. 31, 2019, the components of net assets on a tax basis were as follows:
| | | | |
Shares of beneficial interest | | $ | 103,884,261 | |
Undistributed ordinary income | | | 5,669,127 | |
Capital loss carryforwards | | | (7,066,368 | ) |
Net unrealized appreciation on investments | | | 2,547,724 | |
| | | | |
Net assets | | $ | 105,034,744 | |
| | | | |
The differences between the book basis and tax basis components of net assets are primarily attributable to market premium on debt instruments.
For federal income tax purposes, capital loss carryforwards may be carried forward and applied against future capital gains.
At Dec. 31, 2019, capital loss carryforwards available to offset future realized gains were as follows:
| | | | | | | | | | |
| Loss carryforward character | |
Short-term | | | Long-term | | | Total | |
| $ | 1,091,891 | | | $ | 5,974,477 | | | $ | 7,066,368 | |
Fund for Income Series-18
Delaware VIP® Fund for Income Series
Notes to financial statements (continued)
6. Capital Shares
Transactions in capital shares were as follows:
| | | | | | | | |
| | | Year ended | |
| | | 12/31/19 | | | 12/31/18 | |
Shares sold: | | | | | | | | |
Standard Class | | | 555,571 | | | | 760,276 | |
Shares issued upon reinvestment of dividends and distributions: | | | | | | | | |
Standard Class | | | 947,991 | | | | 887,782 | |
| | | | | | | | |
| | | 1,503,562 | | | | 1,648,058 | |
| | | | | | | | |
Shares redeemed: | | | | | | | | |
Standard Class | | | (1,801,135 | ) | | | (1,294,191 | ) |
| | | | | | | | |
Net increase (decrease) | | | (297,573 | ) | | | 353,867 | |
| | | | | | | | |
7. Line of Credit
On Nov. 4, 2019, the Series, along with certain other funds in the Delaware Funds (Participants), is a participant in a $250,000,000 revolving line of credit intended to be used for temporary or emergency purposes as an additional source of liquidity to fund redemptions of investor shares. Under the agreement, the Participants are charged an annual commitment fee of 0.15%, which is allocated across the Participants based on a weighted average of the respective net assets of each Participant. The Participants are permitted to borrow up to a maximum ofone-third of their net assets under the agreement. Each Participant is individually, and not jointly, liable for its particular advances, if any, under the line of credit. The line of credit available under the agreement expires on Nov. 2, 2020.
The Series had no amounts outstanding as of Dec. 31, 2019, or at any time during the period then ended.
8. Securities Lending
Effective Oct. 4, 2019, the Series, along with other funds in the Delaware Funds, may lend its securities pursuant to a security lending agreement (Lending Agreement) with The Bank of New York Mellon (BNY Mellon). At the time a security is loaned, the borrower must post collateral equal to the required percentage of the market value of the loaned security, including any accrued interest. The required percentage is: (1) 102% with respect to US securities and foreign securities that are denominated and payable in US dollars; and (2) 105% with respect to foreign securities. With respect to each loan, if on any business day, the aggregate market value of securities collateral plus cash collateral held is less than the aggregate market value of the securities which are the subject of such loan, the borrower will be notified to provide additional collateral by the end of the following business day, which, together with the collateral already held, will be not less than the applicable initial collateral requirements for such security loan. If the aggregate market value of securities collateral and cash collateral held with respect to a security loan exceeds the applicable initial collateral requirement, upon the request of the borrower, BNY Mellon must return enough collateral to the borrower by the end of the following business day to reduce the value of the remaining collateral to the applicable initial collateral requirement for such security loan. As a result of the foregoing, the value of the collateral held with respect to a loaned security on any particular day, may be more or less than the value of the security on loan. The collateral percentage with respect to the market value of the loaned security is determined by the security lending agent.
Cash collateral received by each series of the Trust is generally invested in a series of individual separate accounts, each corresponding to a series. The investment guidelines permit each separate account to hold certain securities that would be considered eligible securities for a money market fund. Cash collateral received is generally invested in government securities; certain obligations issued by government sponsored enterprises; repurchase agreements collateralized by US Treasury securities; obligations issued by the central government of any Organization for Economic Cooperation and Development (OECD) country or its agencies, instrumentalities, or establishments; obligations of supranational organizations; commercial paper, notes, bonds, and other debt obligations; certificates of deposit, time deposits, and other bank obligations; and asset-backed securities. The Series can also accept US government securities and letters of credit(non-cash collateral) in connection with securities loans.
In the event of default or bankruptcy by the lending agent, realization and/or retention of the collateral may be subject to legal proceedings. In the event the borrower fails to return loaned securities and the collateral received is insufficient to cover the value of the loaned securities and provided such collateral shortfall is not the result of investment losses, the lending agent has agreed to pay the amount of the shortfall to the Series or, at the discretion of the lending agent, replace the loaned securities. The Series continues to record dividends or interest, as applicable, on the securities loaned and is subject to changes in value of the securities loaned that may occur during the term of the loan. The Series has the right under the Lending Agreement to recover the securities from the borrower on demand. With respect to security loans collateralized bynon-cash collateral, the Series receives loan premiums paid by the
Fund for Income Series-19
Delaware VIP® Fund for Income Series
Notes to financial statements (continued)
8. Securities Lending (continued)
borrower. With respect to security loans collateralized by cash collateral, the earnings from the collateral investments are shared among the Series, the security lending agent, and the borrower. The Series records security lending income net of allocations to the security lending agent and the borrower.
The Series may incur investment losses as a result of investing securities lending collateral. This could occur if an investment in the collateral investment account defaulted or became impaired. Under those circumstances, the value of the Series’ cash collateral account may be less than the amount the Series would be required to return to the borrowers of the securities and the Series would be required to make up for this shortfall.
During the year ended Dec. 31, 2019, the Series had no securities out on loan.
9. Credit and Market Risk
When interest rates rise, fixed income securities (i.e. debt obligations) generally will decline in value. These declines in value are greater for fixed income securities with longer maturities or durations.
The risk that potential changes related to the use of the London Interbank Offered Rate (LIBOR) could have adverse impacts on financial instruments which reference LIBOR. The potential abandonment of LIBOR could affect the value and liquidity of instruments which reference LIBOR.
The Series invests in bank loans and other securities that may subject it to direct indebtedness risk, the risk that the Series will not receive payment of principal, interest, and other amounts due in connection with these investments and will depend primarily on the financial condition of the borrower. Loans that are fully secured offer the Series more protection than unsecured loans in the event of nonpayment of scheduled interest or principal, although there is no assurance that the liquidation of collateral from a secured loan would satisfy the corporate borrower’s obligation, or that the collateral can be liquidated.
Some loans or claims may be in default at the time of purchase. Certain of the loans and the other direct indebtedness acquired by the Series may involve revolving credit facilities or other standby financing commitments that obligate the Series to pay additional cash on a certain date or on demand. These commitments may require the Series to increase its investment in a company at a time when the Series might not otherwise decide to do so (including at a time when the company’s financial condition makes it unlikely that such amounts will be repaid). To the extent that the Series is committed to advance additional funds, it will at all times hold and maintain cash or other high grade debt obligations in an amount sufficient to meet such commitments. When a loan agreement is purchased, the Series may pay an assignment fee. On an ongoing basis, the Series may receive a commitment fee based on the undrawn portion of the underlying line of credit portion of a loan agreement. Prepayment penalty fees are received upon the prepayment of a loan agreement by a borrower. Prepayment penalty, facility, commitment, consent, and amendment fees are recorded to income as earned or paid.
As the Series may be required to rely upon another lending institution to collect and pass on to the Series amounts payable with respect to the loan and to enforce the Series’ rights under the loan and other direct indebtedness, an insolvency, bankruptcy, or reorganization of the lending institution may delay or prevent the Series from receiving such amounts. The highly leveraged nature of many loans may make them especially vulnerable to adverse changes in economic or market conditions. Investments in such loans and other direct indebtedness may involve additional risk to the Series.
The Series invests a portion of its assets in high yield fixed income securities, which are securities rated lower thanBBB- by S&P and lower than Baa3 by Moody’s, or similarly rated by another nationally recognized statistical rating organization. Investments in these higher yielding securities are generally accompanied by a greater degree of credit risk than higher rated securities. Additionally, lower rated securities may be more susceptible to adverse economic and competitive industry conditions than investment grade securities.
The Series may invest up to 10% of its net assets in illiquid securities, which may include securities with contractual restrictions on resale, securities exempt from registration under Rule 144A, promulgated under the Securities Act of 1933, as amended, and other securities which may not be readily marketable. The relative illiquidity of these securities may impair the Series from disposing of them in a timely manner and at a fair price when it is necessary or desirable to do so. While maintaining oversight, the Board has delegated to DMC theday-to-day functions of determining whether individual securities are liquid for purposes of the Series’ limitation on investments in illiquid securities. Securities eligible for resale pursuant to Rule 144A, which are determined to be liquid, are not subject to the Series’ 10% limit on investments in illiquid securities. Rule 144A securities have been identified on the “Schedule of investments.”
10. Contractual Obligations
The Series enters into contracts in the normal course of business that contain a variety of indemnifications. The Series’ maximum exposure under these arrangements is unknown. However, the Series has not had prior claims or losses pursuant to these contracts. Management has reviewed the Series’ existing contracts and expects the risk of loss to be remote.
Fund for Income Series-20
Delaware VIP® Fund for Income Series
Notes to financial statements (continued)
11. Recent Accounting Pronouncements
In March 2017, the FASB issued an Accounting Standards Update (ASU), ASU2017-08, Receivables — Nonrefundable Fees and Other Costs (Subtopic310-20), Premium Amortization on Purchased Callable Debt Securities which amends the amortization period for certain callable debt securities purchased at a premium, shortening such period to the earliest call date. The ASU2017-08 does not require any accounting change for debt securities held at a discount; the discount continues to be amortized to maturity. The ASU2017-08 is effective for fiscal years, and interim periods within those fiscal years, beginning after Dec. 15, 2018. Management has implemented the ASU2017-08 and determined that the impact if this guidance to the Series’ net assets at the end of the year is not material.
In August 2018, the FASB issued an Accounting Standard Update, ASU2018-13, which changes certain fair value measurement disclosure requirements. The ASU2018-13, in addition to other modifications and additions, removes the requirement to disclose the amount and reasons for transfers between Level 1 and Level 2 of the fair value hierarchy, the policy for the timing of transfers between levels and the valuation process for Level 3 fair value measurements. The ASU2018-13 is effective for fiscal years, and interim periods within those fiscal years, beginning after Dec. 15, 2019. At this time, management is evaluating the implications of these changes on the financial statements.
12. Subsequent Events
Management has determined that no material events or transactions occurred subsequent to Dec. 31, 2019, that would require recognition or disclosure in the Series’ financial statements.
Fund for Income Series-21
Delaware VIP® Trust — Delaware VIP Fund for Income Series
Report of independent registered public accounting firm
To the Board of Trustees of Delaware VIP® Trust and Shareholders of Delaware VIP Fund for Income Series
Opinion on the Financial Statements
We have audited the accompanying statement of assets and liabilities, including the schedule of investments, of Delaware VIP Fund for Income Series (one of the series constituting Delaware VIP® Trust, referred to hereafter as the “Series”) as of December 31, 2019, the related statements of operations and changes in net assets, including the related notes, and the financial highlights for the year then ended (collectively referred to as the “financial statements”). In our opinion, the financial statements present fairly, in all material respects, the financial position of the Series as of December 31, 2019, the results of its operations, changes in its net assets, and the financial highlights for the year then ended in conformity with accounting principles generally accepted in the United States of America.
The financial statements of First Investors Life Series Fund for Income (subsequent to reorganization, known as Delaware VIP Fund for Income Series) as of and for the year ended December 31, 2018 and the financial highlights for each of the periods ended on or prior to December 31, 2018 (not presented herein, other than the statement of changes in net assets and the financial highlights) were audited by other auditors whose report dated February 26, 2019 expressed an unqualified opinion on those financial statements and financial highlights.
Basis for Opinion
These financial statements are the responsibility of the Series’ management. Our responsibility is to express an opinion on the Series’ financial statements based on our audit. We are a public accounting firm registered with the Public Company Accounting Oversight Board (United States) (PCAOB) and are required to be independent with respect to the Series in accordance with the U.S. federal securities laws and the applicable rules and regulations of the Securities and Exchange Commission and the PCAOB.
We conducted our audit of these financial statements in accordance with the standards of the PCAOB. Those standards require that we plan and perform the audit to obtain reasonable assurance about whether the financial statements are free of material misstatement, whether due to error or fraud.
Our audit included performing procedures to assess the risks of material misstatement of the financial statements, whether due to error or fraud, and performing procedures that respond to those risks. Such procedures included examining, on a test basis, evidence regarding the amounts and disclosures in the financial statements. Our audit also included evaluating the accounting principles used and significant estimates made by management, as well as evaluating the overall presentation of the financial statements. Our procedures included confirmation of securities owned as of December 31, 2019 by correspondence with the custodian, transfer agents and brokers. We believe that our audit provides a reasonable basis for our opinion.
/s/PricewaterhouseCoopers LLP
Philadelphia, Pennsylvania
February 28, 2020
We have served as the auditor of one or more investment companies in Delaware Funds® by Macquarie since 2010.
Fund for Income Series-22
Delaware VIP® Trust — Delaware VIP Fund for Income Series
Other Series information (Unaudited)
Tax Information
All disclosures are based on financial information available as of the date of this annual report and, accordingly are subject to change. For any and all items requiring reporting, it is the intention of the Series to report the maximum amount permitted under the Internal Revenue Code and the regulations thereunder.
For the year ended Dec. 31, 2019, the Series reports distributions paid during the year as follows:
|
| (A) |
| Ordinary Income |
| Distributions |
(Tax Basis) |
| 100.00% |
(A) is based on a percentage of the Series’ total distributions.
Fund for Income Series-23
Delaware Funds® by Macquarie
Board of trustees / directors and officers addendum
A mutual fund is governed by a Board of Trustees/Directors (“Trustees”), which has oversight responsibility for the management of a fund’s business affairs. Trustees establish procedures and oversee and review the performance of the investment manager, the distributor, and others who perform services for the fund. The independent fund trustees, in particular, are advocates for shareholder interests. Each trustee has served in that capacity since he or she was elected to or appointed to the Board of Trustees, and will continue to serve until his or her retirement or the election of a new trustee in his or her place. The following is a list of the Trustees and Officers with certain background and related information.
| | | | | | | | | | |
Name, Address, and Birth Date | | Position(s) Held with Fund(s) | | Length of Time
Served | | Principal Occupation(s) During the Past Five Years | | Number of
Portfolios in Fund
Complex Overseen
by Trustee or Officer | | Other
Directorships
Held by Trustee or Officer |
| INTERESTED TRUSTEE | | | | | | | | | | |
| | | | | |
Shawn K. Lytle1 2005 Market Street Philadelphia, PA 19103 February 1970 | | President, Chief Executive Officer, and Trustee | | President and Chief Executive Officer since August 2015 Trustee since September 2015 | | President — Macquarie Investment Management2 (June 2015-Present) Regional Head of Americas — UBS Global Asset Management (April2010-May 2015) | | 95 | | Trustee — UBS Relationship Funds, SMA Relationship Trust, and UBS Funds (May 2010–April 2015) |
| INDEPENDENT TRUSTEES | | | | | | | | | | |
| | | | | |
Thomas L. Bennett 2005 Market Street Philadelphia, PA 19103 October 1947 | | Chair and Trustee | | Trustee since March 2005 Chair since March 2015 | | Private Investor (March 2004–Present) | | 95 | | None |
| | | | | |
Jerome D. Abernathy 2005 Market Street Philadelphia, PA 19103 July 1959 | | Trustee | | Since January 2019 | | Managing Member, Stonebrook Capital Management, LLC (financial technology: macro factors and databases) (January 1993–Present) | | 95 | | None |
| | | | | |
Ann D. Borowiec 2005 Market Street Philadelphia, PA 19103 November 1958 | | Trustee | | Since March 2015 | | Chief Executive Officer, Private Wealth Management (2011–2013) and Market Manager, New Jersey Private Bank (2005–2011) — J.P. Morgan Chase & Co. | | 95 | | Director — Banco Santander International (October 2016–December 2019) Director — Santander Bank, N.A. (December 2016–December 2019) |
| | | | | |
Joseph W. Chow 2005 Market Street Philadelphia, PA 19103 January 1953 | | Trustee | | Since January 2013 | | Private Investor (April 2011–Present) | | 95 | | Director and Audit Committee Member — Hercules Technology Growth Capital, Inc. (July 2004–July 2014) |
Fund for Income Series-24
| | | | | | | | | | |
Name, Address, and Birth Date | | Position(s) Held with Fund(s) | | Length of Time
Served | | Principal Occupation(s) During the Past Five Years | | Number of
Portfolios in Fund
Complex Overseen
by Trustee
or Officer | | Other
Directorships
Held by Trustee or Officer |
John A. Fry 2005 Market Street Philadelphia, PA 19103 May 1960 | | Trustee | | Since January 2001 | | President — Drexel University (August 2010–Present) President — Franklin & Marshall College (July 2002–July 2010) | | 95 | | Director; Compensation Committee and Governance Committee Member — Community Health Systems (May 2004–Present) Director — Drexel Morgan & Co. (2015–Present) Director and Audit Committee Member — vTv Therapeutics LLC (2017–Present) Director and Audit Committee Member — FS Credit Real Estate Income Trust, Inc. (2018–Present) Director — Federal Reserve Bank of Philadelphia (January 2020–Present) |
| | | | | |
Lucinda S. Landreth 2005 Market Street Philadelphia, PA 19103 June 1947 | | Trustee | | Since March 2005 | | Private Investor (2004–Present) | | 95 | | None |
| | | | | |
Frances A. Sevilla-Sacasa 2005 Market Street Philadelphia, PA 19103 January 1956 | | Trustee | | Since September 2011 | | Private Investor (January 2017-Present) Chief Executive Officer — Banco Itaú International (April 2012–December 2016) Executive Advisor to Dean (August 2011–March 2012) and Interim Dean (January 2011–July 2011) — University of Miami School of Business Administration President — U.S. Trust, Bank of America Private Wealth Management (Private Banking) (July 2007–December 2008) | | 95 | | Trust Manager and Audit Committee Chair — Camden Property Trust (August 2011–Present) Director; Strategic Planning and Reserves Committee and Nominating and Governance Committee Member — Callon Petroleum Company (December 2019–Present) Director; Audit Committee Member — Carrizo Oil & Gas, Inc. (March 2018–December 2019) |
| | | | | |
Thomas K. Whitford 2005 Market Street Philadelphia, PA 19103 March 1956 | | Trustee | | Since January 2013 | | Vice Chairman (2010–April 2013) — PNC Financial Services Group | | 95 | | Director — HSBC North America Holdings Inc. (December 2013-Present) Director — HSBC USA Inc. (July 2014-Present) Director — HSBC Bank USA, National Association (July 2014-March 2017) Director — HSBC Finance Corporation (December 2013-April 2018) |
Fund for Income Series-25
| | | | | | | | | | |
Name, Address, and Birth Date | | Position(s) Held with Fund(s) | | Length of Time
Served | | Principal Occupation(s) During the Past Five Years | | Number of
Portfolios in Fund
Complex Overseen
by Trustee
or Officer | | Other
Directorships
Held by Trustee or Officer |
Christianna Wood 2005 Market Street Philadelphia, PA 19103 March 1956 | | Trustee | | Since January 2019 | | Chief Executive Officer and President — Gore Creek Capital, Ltd. (August 2009–Present) | | 95 | | Director; Finance Committee and Audit Committee Member — H&R Block Corporation (July 2008–Present) Director; Chair of Investments Committee and Audit Committee Member — Grange Insurance (2013–Present) Trustee; Chair of Nominating and Governance Committee and Audit Committee Member — The Merger Fund (2013–Present), The Merger Fund VL (2013–Present); WCM Alternatives: Event-Driven Fund (2013–Present), and WCM Alternatives: Credit Event Fund (December 2017–Present) Director; Chair of Governance Committee and Audit Committee Member — International Securities Exchange (2010–2016) |
| | | | | |
Janet L. Yeomans 2005 Market Street Philadelphia, PA 19103 July 1948 | | Trustee | | Since April 1999 | | Vice President and Treasurer (January 2006–July 2012), Vice President — Mergers & Acquisitions (January 2003–January 2006), and Vice President and Treasurer (July 1995–January 2003) — 3M Company | | 95 | | Director; Personnel and Compensation Committee Chair; Member of Nominating, Investments, and Audit Committees for various periods throughout directorship — Okabena Company (2009-2017) |
Fund for Income Series-26
| | | | | | | | | | |
Name, Address, and Birth Date | | Position(s) Held with Fund(s) | | Length of Time
Served | | Principal Occupation(s) During the Past Five Years | | Number of
Portfolios in Fund
Complex Overseen
by Trustee
or Officer | | Other
Directorships
Held by Trustee or Officer |
| OFFICERS | | | | | | | | | | |
| | | | | |
David F. Connor 2005 Market Street Philadelphia, PA 19103 December 1963 | | Senior Vice President, General Counsel, and Secretary | | Senior Vice President, since May 2013; General Counsel since May 2015; Secretary since October 2005 | | David F. Connor has served in various capacities at different times at Macquarie Investment Management. | | 95 | | None3 |
| | | | | |
Daniel V. Geatens 2005 Market Street Philadelphia, PA 19103 October 1972 | | Vice President and Treasurer | | Vice President and Treasurer since October 2007 | | Daniel V. Geatens has served in various capacities at different times at Macquarie Investment Management. | | 95 | | None3 |
| | | | | |
Richard Salus 2005 Market Street Philadelphia, PA 19103 October 1963 | | Senior Vice President and Chief Financial Officer | | Senior Vice President and Chief Financial Officer since November 2006 | | Richard Salus has served in various capacities at different times at Macquarie Investment Management. | | 95 | | None |
| 1 | Shawn K. Lytle is considered to be an “Interested Trustee” because he is an executive officer of the Fund’s(s’) investment advisor. |
| 2 | Macquarie Investment Management is the marketing name for Macquarie Management Holdings, Inc. and its subsidiaries, including the Fund’s(s’) investment advisor, principal underwriter, and its transfer agent. |
| 3 | David F. Connor and Daniel V. Geatens serve in similar capacities for the six portfolios of the Optimum Fund Trust, which have the same investment advisor, principal underwriter, and transfer agent as the registrant. Mr. Geatens also serves as the Chief Financial Officer of the Optimum Fund Trust and he is the Chief Financial Officer and Treasurer for Macquarie Global Infrastructure Total Return Fund Inc. |
The Statement of Additional Information for the Fund(s) includes additional information about the Trustees and Officers and is available, without charge, upon request by calling 800523-1918.
Fund for Income Series-27
The Series files its complete schedule of portfolio holdings with the Securities and Exchange Commission (SEC) for the first and third quarters of each fiscal year on FormN-Q or FormN-PORT (available for filings after March 31, 2019). The Series’ FormsN-Q or FormsN-PORT, as well as a description of the policies and procedures that the Series uses to determine how to vote proxies (if any) relating to portfolio securities, are available without charge (i) upon request, by calling 800523-1918; and (ii) on the SEC’s website at sec.gov. In addition, a description of the policies and procedures that the Series uses to determine how to vote proxies (if any) relating to portfolio securities and the Schedule of Investments included in the Series’ most recent FormN-Q or FormN-PORT are available without charge on the Series’ website at delawarefunds.com/vip/literature. The Series’ FormsN-Q and FormsN-PORT may be reviewed and copied at the SEC’s Public Reference Room in Washington, D.C.; information on the operation of the Public Reference Room may be obtained by calling 800SEC-0330.
Information (if any) regarding how the Series voted proxies relating to portfolio securities during the most recently disclosed12-month period ended June 30 is available without charge (i) through the Series’ website at delawarefunds.com/proxy; and (ii) on the SEC’s website at sec.gov.
| | |
| AR-VIPFFI 22492 (2/20) (1076649) | | Fund for IncomeSeries-28 |
Delaware VIP® Trust
Delaware VIP Government Cash Management Series
(formerly, First Investors Life Series Government Cash Management Fund)
December 31, 2019
Beginning on or about June 1, 2021, as permitted by regulations adopted by the Securities and Exchange Commission, paper copies of your Series’ shareholder reports will no longer be sent to you by mail, unless you specifically request them from the Series or from your financial intermediary, such as a broker/dealer, bank, or insurance company. Instead, you will be notified by mail each time a report is posted on the website and provided with a link to access the report.
If you already elected to receive shareholder reports electronically, you will not be affected by this change and you do not need to take any action.
You may elect to receive paper copies of all future shareholder reports free of charge. You can inform the Series that you wish to continue receiving paper copies of your shareholder reports by contacting us at 800523-1918. If you own these shares through a financial intermediary, you may contact your financial intermediary to elect to continue to receive paper copies of your shareholder reports. Your election to receive reports in paper will apply to all funds held with the Delaware Funds® by Macquarie or your financial intermediary.
Table of contents
Other than Macquarie Bank Limited (MBL), none of the entities noted are authorized deposit-taking institutions for the purposes of the Banking Act 1959 (Commonwealth of Australia). The obligations of these entities do not represent deposits or other liabilities of MBL. MBL does not guarantee or otherwise provide assurance in respect of the obligations of these entities, unless noted otherwise. The Series is governed by US laws and regulations.
Unless otherwise noted, views expressed herein are current as of Dec. 31, 2019, and subject to change for events occurring after such date.
The Series is not FDIC insured and is not guaranteed. It is possible to lose the principal amount invested.
Advisory services provided by Delaware Management Company, a series of Macquarie Investment Management Business Trust (MIMBT), a US registered investment advisor.
The Series is distributed byDelaware Distributors, L.P.(DDLP), an affiliate of MIMBT and Macquarie Group Limited. Macquarie Investment Management (MIM) is the marketing name for certain companies comprising the asset management division of Macquarie Group Limited and its subsidiaries and affiliates worldwide.
This material may be used in conjunction with the offering of shares in Delaware VIP® Government Cash Management Series only if preceded or accompanied by the Series’ current prospectus or the summary prospectus.
© 2020 Macquarie Management Holdings, Inc.
All third-party marks cited are the property of their respective owners.
| | |
Delaware VIP®Trust — Delaware VIP Government Cash Management Series |
Portfolio management review | | January 7, 2020 (Unaudited) |
The investment objective of the Series is to earn current income consistent with the preservation of capital and maintenance of liquidity.
Effective after the close of business on Oct. 4, 2019, Delaware Management Company (DMC or Manager), a series of Macquarie Investment Management Business Trust (MIMBT), serves as the investment manager for the Series.* During the period after the close of business on Oct. 4, 2019 to Dec. 31, 2019, the Manager repositioned the portfolio in accordance with the Series’ investment objective and principal investment strategies, as described in the prospectus. The investment objective is substantially the same and its principal investment strategies are the same or similar to those of the corresponding Life Series Fund. Delaware VIP Government Cash Management Series seeks to earn current income consistent with the preservation of capital and maintenance of liquidity.
For the fiscal year ended Dec. 31, 2019, Delaware VIP Government Cash Management Series (the “Series”) Standard Class shares gained 1.35%, reflecting all dividends reinvested. The Series’ benchmark, the ICE BofA US3-Month Treasury Bill Index, advanced 2.28% for the same period. Effective Oct. 4, 2019, the Series added the ICE BofA US3-Month Treasury Bill Index as its benchmark. The Series elected to use the new index because it more closely reflected the Series’ investment strategies.
The major theme of the Series’ fiscal year was the great monetary policy pivot. The period began with the US Treasury yield above 3% and the US Federal Reserve contemplating four additional rate hikes heading into 2019. While the Fed had raised rates at the end of the prior fiscal period, by early 2019 it was apparent that further hikes were untenable. The US economy, though among the strongest globally, was no longer able to sustain a10-year interest rate above 3% or a federal funds rate in themid-2% range.
As 2019 began, economic indicators in the US began to flash yellow while global financial conditions were flashing red. The liquidity-induced risk-assets selloff at the end of 2018 reflected what we believe to be the ongoing unhealthy dependence of asset prices on monetary policy. Bymid-2019, there were other signs of an impending global slowdown as well, including corporate earnings’ deceleration, declining global manufacturing activity, the continuingUS-China trade dispute, and the ongoing Brexit drama. Many investors saw the yield-curve inversion and the August peak of $17 trillion worldwide in negative-yielding debt as signals of a potential recession.
This prompted the Fed and central banks in Australia, Europe, and the United Kingdom to shift to a more accommodative monetary policy. In the US, the Fed first signaled a hold on further rate hikes and then terminated quantitative tightening (QT) and balance-sheet reductions. Three interest rate cuts of 0.25 percentage points each followed in July, September, and October.
The massive liquidity infusion, coupled with the December announcement of a Phase 1 trade agreement between the US and China, sent both interest rates and risk premiums significantly lower. Fixed income delivered its strongest total return since 2002, finishing the year with investors in a frenzied search for yield. We believe the fiscal year was a good example of the potential benefit of owning bonds as part of a diversified investment portfolio.
Source: Bloomberg.
Foresters Investment Management Company, Inc. (FIMCO) managed the Series from Jan. 1, 2019 to Oct. 4, 2019, when the management of the Series transitioned to DMC. The following is a discussion about Series performance during that period ended Oct. 4, 2019:
Many money market funds, including Delaware VIP Government Cash Management Series, chose to convert to government money market funds, which invest nearly all of their assets in securities that are issued by the US government or its agencies or instrumentalities, the lowest-risk investments available. The Series maintained a longer-than-average weighted average maturity during most of the period Jan. 1, 2019 to Oct. 4, 2019, as the direction of interest rates was not clear but biased toward lower. That said, during this period, the Series maintained a weighted average maturity of fewer than 60 days to comply with current Securities and Exchange Commission (SEC) rules designed to limit interest rate risk. We employed floating-rate securities in the Series’ portfolio during this period for incremental yield.
A note about money market funds: Regulatory reforms that became effective in 2016 caused structural changes that continue to affect the money market and money market investments. Though these enacted reform-driven changes have likely suppressed returns for those who operate in theselow-risk products, these reforms have also reduced certain types of risks to the investor.
*On April 6, 2019, FIMCO, the investment adviser to the First Investors Funds, entered into an agreement with Macquarie Management Holdings, Inc. (MMHI), whereby MMHI, on behalf of its affiliate DMC, would acquire FIMCO’s asset management business (the “Transaction”). In connection with the Transaction, the Board of Trustees of the First Investors Trusts and the First Investors Fund shareholders approved, pursuant to an Agreement and Plan of Reorganization (the “Agreement”), the transfer of all assets and liabilities of each First Investors Fund to a corresponding, newly formed fund in the Delaware Funds® by Macquarie family of funds. The Transaction closed on Oct. 4, 2019.
Unless otherwise noted, views expressed herein are current as of Dec. 31, 2019, and subject to change.
Government Cash Management Series-1
Delaware VIP® Trust — Delaware VIP Government Cash Management Series
Performance summary (Unaudited)
The performance quoted represents past performance and does not guarantee future results. Investment return and principal value of an investment will fluctuate so that shares, when redeemed, may be worth more or less than their original cost. Current performance may be lower or higher than the performance quoted.
Carefully consider the Series’ investment objectives, risk factors, charges, and expenses before investing. This and other information can be found in the Series’ prospectus and its summary prospectus, which may be obtained by visiting delawarefunds.com/vip/literature or calling 800523-1918. Investors should read the prospectus and the summary prospectus carefully before investing.
| | | | | | | | | | | | | | | | | | | | |
Delaware VIP Government Cash Management Series | | | | | | | | | | | | | | | | | |
Average annual total returns | | | | | | | | | | | | | | | | | | | | |
| For periods ended December 31, 2019 | | 1 year | | | 3 year | | | 5 year | | | 10 year | | | Lifetime | |
Standard Class shares (commenced operations on Nov. 9, 1987) | | | +1.35% | | | | +0.95% | | | | +0.57% | | | | +0.28% | | | | — | |
| | | | | | | | | | | | | | | | | | | | |
ICE BofA US3-Month Treasury Bill Index | | | +2.28% | | | | +1.67% | | | | +1.07% | | | | +0.58% | | | | — | |
Returns reflect the reinvestment of all distributions. Please see page 3 for a description of the index.
As described in the Series’ most recent prospectus, the net expense ratio for Standard Class shares of the Series was 0.83%, while total operating expenses for Standard Class shares were 1.01%. The management fee for Standard Class shares was 0.45%. The Series’ investment manager, Delaware Management Company (Manager), has contractually agreed to waive all or a portion of its investment advisory fees and/or pay/reimburse expenses (excluding any12b-1 fees, acquired fund fees and expenses, taxes, interest, short sale and dividend interest expenses, brokerage fees, certain insurance costs, and nonroutine expenses or costs, including, but not limited to, those relating to reorganizations, litigation, conducting shareholder meetings, and liquidations) in order to prevent annual series operating expenses from exceeding 0.83% of the Series’ average daily net assets from Oct. 4, 2019 through Dec. 31, 2019.* Please see the most recent prospectus and any applicable supplement(s) for additional information on these fee waivers and/or reimbursements. Please see the “Financial highlights” section in this report for the most recent expense ratios.
Earnings from a variable annuity or variable life investment compoundtax-free until withdrawal, and as a result, no adjustments were made for income taxes.
Expense limitations were in effect for Standard Class shares during certain periods shown in the Series performance table above and in the Performance of a $10,000 Investment graph on the next page.
Performance data do not reflect insurance fees related to a variable annuity or variable life investment or the deferred sales charge that would apply to certain withdrawals of investments held for fewer than eight years. Performance shown here would have been reduced if such fees were included and the expense limitation removed. For more information about fees, consult your variable annuity or variable life prospectus.
Investments in variable products involve risk.
Fixed income securities and bond funds can lose value, and investors can lose principal, as interest rates rise. They also may be affected by economic conditions that hinder an issuer’s ability to make interest and principal payments on its debt.
The Series may also be subject to prepayment risk, the risk that the principal of a fixed income security that is held by the Series may be prepaid prior to maturity, potentially forcing the Series to reinvest that money at a lower interest rate.
Liquidity risk is the possibility that investments cannot be readily sold within seven days at approximately the price at which a fund has valued them.
The risk that all or a majority of the securities in a certain market – like the stock market or bond market – will decline in value because of factors such as adverse political or economic conditions, future expectations, investor confidence, or heavy institutional selling.
The yields received by the Series on its investments will generally decline as interest rates decline.
Like the values of other debt instruments, the market values of US Government securities are affected by changes in interest rates. When interest rates rise, the market values of US Government securities generally decline. This could cause the Series’ NAV to decline below $1.00 per share.
The US Government securities the Series invests in may or may not be backed by the full faith and credit of the US Government. Securities issued by US Government sponsored enterprises are supported only by the credit of the issuing entity. The value of an investment will decline if there is a default by or a deterioration in the credit quality of the issuer or a provider of a credit enhancement or demand feature. This could cause the Series NAV to decline below $1.00 per share.
Government Cash Management Series-2
Delaware VIP® Government Cash Management Series
Performance summary (Unaudited) (continued)
LIBOR risk is the risk that potential changes related to the use of the London interbank offered rate (LIBOR) could have adverse impacts on financial instruments which reference LIBOR. The potential abandonment of LIBOR could affect the value and liquidity of instruments which reference LIBOR.
Please read both the contract and underlying prospectus for specific details regarding the product’s risk profile.
*The aggregate contractual waiver period covering this report is from Oct. 4, 2019 through Oct. 31, 2021.
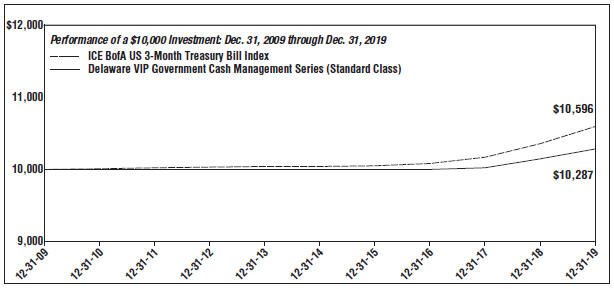
| | | | | | |
For period beginning Dec. 31, 2009 through Dec. 31, 2019 | | Starting value | | Ending value |

| �� | ICE BofA US3-Month Treasury Bill Index | | $10,000 | | $10,596 |

| | Delaware VIP Government Cash Management Series (Standard Class) | | $10,000 | | $10,287 |
The graph shows a $10,000 investment in the Delaware VIP Government Cash Management Series Standard Class shares for the period from Dec. 31, 2009 through Dec. 31, 2019.
The graph also shows $10,000 invested in the ICE BofA US3-Month Treasury Bill Index for the period from Dec. 31, 2009 through Dec. 31, 2019. The ICE BofA US3-Month Treasury Bill Index tracks the performance of US Treasury bills with a maturity of three months. The index comprises a single Treasury issue purchased at the beginning of the month, which is then sold at the end of the month and rolled into a newly selected issue that matures closest to, but not beyond, three months from the transaction date (known as the rebalancing date).
Index performance returns do not reflect any management fees, transaction costs or expenses. Indices are unmanaged and one cannot invest directly in an index.
Past performance is not a guarantee of future results.
Government Cash Management Series-3
Delaware VIP® Trust — Delaware VIP Government Cash Management Series
Disclosure of Series expenses
For thesix-month period from July 1, 2019 to December 31, 2019 (Unaudited)
As a shareholder of the Series, you incur ongoing costs, which may include management fees; distribution and service(12b-1) fees; and other Series expenses. This example is intended to help you understand your ongoing costs (in dollars) of investing in the Series and to compare these costs with the ongoing costs of investing in other mutual funds.
The example is based on an investment of $1,000 invested at the beginning of the period and held for the entiresix-month period from July 1, 2019 to Dec. 31, 2019.
Actual expenses
The first section of the table shown, “Actual Series return,” provides information about actual account values and actual expenses. You may use the information in this section of the table, together with the amount you invested, to estimate the expenses that you paid over the period. Simply divide your account value by $1,000 (for example, an $8,600 account value divided by $1,000 = 8.6), then multiply the result by the number in the first section under the heading entitled “Expenses Paid During Period” to estimate the expenses you paid on your account during the period.
Hypothetical example for comparison purposes
The second section of the table shown, “Hypothetical 5% return,” provides information about hypothetical account values and hypothetical expenses based on the Series’ actual expense ratio and an assumed rate of return of 5% per year before expenses, which is not the Series’ actual return. The hypothetical account values and expenses may not be used to estimate the actual ending account balance or expenses you paid for the period. You may use this information to compare the ongoing costs of investing in the Series and other funds. To do so, compare this 5% hypothetical example with the 5% hypothetical examples that appear in the shareholder reports of other funds.
Please note that the expenses shown in the table are meant to highlight your ongoing costs only. As a shareholder of the Series, you do not incur any transaction costs, such as sales charges (loads), redemption fees or exchange fees, but shareholders of other funds may incur such costs. Also, the fees related to the variable annuity investment or the deferred sales charge that could apply have not been included. Therefore, the second section of the table is useful in comparing ongoing costs only, and will not help you determine the relative total costs of owning different funds. The Series’ expenses shown in the table reflect fee waivers in effect and assume reinvestment of all dividends and distributions.
Expense analysis of an investment of $1,000
| | | | | | | | | | |
| | | | | | | | | Expenses | |
| | | Beginning | | Ending | | | | Paid During | |
| | | Account | | Account | | Annualized | | Period | |
| | | Value | | Value | | Expense | | 7/1/19 to | |
| | | 7/1/19 | | 12/31/19 | | Ratio | | 12/31/19* | |
Actual Series return† | | | | |
Standard Class | | $1,000.00 | | $1,005.20 | | 0.91% | | | $4.60 | |
Hypothetical 5% return(5% return before expenses) | |
Standard Class | | $1,000.00 | | $1,020.62 | | 0.91% | | | $4.63 | |
*“Expenses Paid During Period” are equal to the Series’ annualized expense ratio, multiplied by the average account value over the period, multiplied by 184/365 (to reflect theone-half year period).
†Because actual returns reflect only the most recentsix-month period, the returns shown may differ significantly from fiscal year returns.
Government Cash Management Series-4
Delaware VIP® Trust — Delaware VIP Government Cash Management Series
Security type / sector allocation
As of December 31, 2019 (Unaudited)
| | | | |
| | | Percentage | |
| Security type / Sector | | of net assets | |
Agency Obligation | | | 4.45% | |
Short-Term Investments | | | 93.92% | |
Total Value of Securities | | | 98.37% | |
Receivables and Other Assets Net of Liabilities | | | 1.63% | |
Total Net Assets | | | 100.00% | |
Government Cash Management Series-5
Delaware VIP® Trust — Delaware VIP Government Cash Management Series
Schedule of investments
December 31, 2019
| | | | | | | | |
| | | Principal | | | Value | |
| | | amount° | | | (US $) | |
Agency Obligation – 4.45% | | | | | | | | |
Federal Farm Credit Bank | | | | | | | | |
1.792% (LIBOR01M + 0.00%) 6/25/20 • | | | 400,000 | | | $ | 399,989 | |
| | | | | | | | |
Total Agency Obligation
(cost $399,989) | | | | | | | 399,989 | |
| | | | | | | | |
| |
Short-Term Investments – 93.92% | | | | | |
Discount Notes – 93.92%≠ | | | | | | | | |
Federal Home Loan Bank | | | | | | | | |
1.521% 1/15/20 | | | 900,000 | | | | 899,468 | |
1.537% 1/6/20 | | | 930,000 | | | | 929,802 | |
1.542% 1/10/20 | | | 900,000 | | | | 899,653 | |
| | | | | | | | |
| | | Principal | | | Value | |
| | | amount° | | | (US $) | |
Short-Term Investments (continued) | | | | | |
Discount Notes≠ (continued) | | | | | | | | |
1.543% 1/3/20 | | | 900,000 | | | $ | 899,923 | |
1.551% 1/13/20 | | | 900,000 | | | | 899,535 | |
1.553% 1/2/20 | | | 900,000 | | | | 899,961 | |
1.561% 1/17/20 | | | 700,000 | | | | 699,515 | |
1.572% 1/30/20 | | | 550,000 | | | | 549,304 | |
Federal National Mortgage Association | | | | | | | | |
1.05% 1/2/20 | | | 1,763,000 | | | | 1,762,949 | |
| | | | | | | | |
Total Short-Term Investments
(cost $8,440,110) | | | | | | | 8,440,110 | |
| | | | | | | | |
| | | | |
Total Value of Securities – 98.37%
(cost $8,840,099) | | | $8,840,099 | |
| | | | |
| ≠ | The rate shown is the effective yield at the time of purchase. |
| ° | Principal amount shown is stated in USD unless noted that the security is denominated in another currency. |
| • | Variable rate investment. Rates reset periodically. Rate shown reflects the rate in effect at Dec. 31, 2019. For securities based on a published reference rate and spread, the reference rate and spread are indicated in their description above. The reference rate descriptions (i.e. LIBOR03M, LIBOR06M, etc.) used in this report are identical for different securities, but the underlying reference rates may differ due to the timing of the reset period. Certain variable rate securities are not based on a published reference rate and spread but are determined by the issuer or agent and are based on current market conditions, or for mortgage-backed securities, are impacted by the individual mortgages which are paying off over time. These securities do not indicate a reference rate and spread in their description above. |
Summary of abbreviations:
ICE – Intercontinental Exchange
LIBOR – London interbank offered rate
LIBOR01M – ICE LIBOR USD 1 Month
LIBOR03M – ICE LIBOR USD 3 Month
LIBOR06M – ICE LIBOR USD 6 Month
USD – US Dollar
See accompanying notes, which are an integral part of the financial statements.
Government Cash Management Series-6
| | |
Delaware VIP®Trust — Delaware VIP Government Cash Management Series | | |
Statement of assets and liabilities | | December 31, 2019 |
| | | | |
Assets: | | | | |
Investments, at value1 | | $ | 8,840,099 | |
Cash | | | 177,058 | |
Receivable for series shares sold | | | 554 | |
Dividends and interest receivable | | | 139 | |
Receivable due from advisor | | | 19,770 | |
Other assets | | | 327 | |
| | | | |
Total assets | | | 9,037,947 | |
| | | | |
Liabilities: | | | | |
Audit and tax fees payable | | | 40,837 | |
Accounting and administration fees payable tonon-affiliates | | | 4,366 | |
Other accrued expenses | | | 1,929 | |
Reports and statements to shareholders expenses payable tonon-affiliates | | | 1,886 | |
Income distributions payable | | | 1,602 | |
Pricing fees payable | | | 500 | |
Accounting and administration expenses payable to affiliates | | | 365 | |
Trustees’ fees and expenses payable | | | 91 | |
Dividend disbursing and transfer agent fees and expenses payable to affiliates | | | 58 | |
Reports and statements to shareholders expenses payable to affiliates | | | 15 | |
Legal fees payable to affiliates | | | 14 | |
| | | | |
Total liabilities | | | 51,663 | |
| | | | |
Total Net Assets | | $ | 8,986,284 | |
| | | | |
| |
Net Assets Consist of: | | | | |
Paid-in capital | | $ | 8,986,284 | |
| | | | |
Total Net Assets | | $ | 8,986,284 | |
| | | | |
| |
Net Asset Value: | | | | |
Standard Class: | | | | |
Net assets | | $ | 8,986,284 | |
Shares of beneficial interest outstanding, unlimited authorization, no par | | | 8,986,284 | |
Net asset value per share | | $ | 1.00 | |
| |
| | | | |
1Investments, at cost | | $ | 8,840,099 | |
See accompanying notes, which are an integral part of the financial statements.
Government Cash Management Series-7
Delaware VIP® Trust —
Delaware VIP Government Cash Management Series
Statement of operations
Year ended December 31, 2019
| | | | |
Investment Income: | | | | |
Interest | | $ | 217,606 | |
| | | | |
Expenses: | | | | |
Management fees | | | 67,448 | |
Audit and tax fees | | | 28,698 | |
Reports and statements to shareholders | | | 8,208 | |
Accounting and administration expenses | | | 7,648 | |
Custodian fees | | | 3,599 | |
Legal fees | | | 2,647 | |
Trustees’ fees and expenses | | | 900 | |
Dividend disbursing and transfer agent fees and expenses | | | 179 | |
Other | | | 3,912 | |
| | | | |
| | | 123,239 | |
Less expenses waived | | | (40,089 | ) |
Less expenses paid indirectly | | | (250 | ) |
| | | | |
Total operating expenses | | | 82,900 | |
| | | | |
Net Investment Income | | | 134,706 | |
| | | | |
Net Increase in Net Assets Resulting from Operations | | $ | 134,706 | |
| | | | |
Delaware VIP Trust —
Delaware VIP Government Cash Management Series
Statements of changes in net assets
| | | | | | | | |
| | | Year ended | |
| | | 12/31/19 | | | 12/31/18 | |
Increase in Net Assets from Operations: | | | | | | | | |
Net investment income | | $ | 134,706 | | | $ | 123,522 | |
| | | | | | | | |
Net increase in net assets resulting from operations | | | 134,706 | | | | 123,522 | |
| | | | | | | | |
| | |
Dividends and Distributions to Shareholders from: | | | | | | | | |
Distributable earnings: | | | | | | | | |
Standard Class | | | (134,706 | ) | | | (123,522 | ) |
| | | | | | | | |
| | |
Capital Share Transactions: | | | | | | | | |
Proceeds from shares sold: | | | | | | | | |
Standard Class | | | 12,666,759 | | | | 34,404,223 | |
| | |
Net asset value of shares issued upon reinvestment of dividends and distributions: | | | | | | | | |
Standard Class | | | 133,104 | | | | 123,522 | |
| | | | | | | | |
| | | 12,799,863 | | | | 34,527,745 | |
| | | | | | | | |
Cost of shares redeemed: | | | | | | | | |
Standard Class | | | (15,467,714 | ) | | | (31,536,951 | ) |
| | | | | | | | |
Increase (Decrease) in net assets derived from capital share transactions | | | (2,667,851 | ) | | | 2,990,794 | |
| | | | | | | | |
Net Increase (Decrease) in Net Assets | | | (2,667,851 | ) | | | 2,990,794 | |
Net Assets: | | | | | | | | |
Beginning of year | | | 11,654,135 | | | | 8,663,341 | |
| | | | | | | | |
End of year | | $ | 8,986,284 | | | $ | 11,654,135 | |
| | | | | | | | |
See accompanying notes, which are an integral part of the financial statements.
Government Cash Management Series-8
Delaware VIP® Trust — Delaware VIP Government Cash Management Series
Financial highlights
Selected data for each share of the Series outstanding throughout each period were as follows:
| | | | | | | | | | | | | | | | | | | | | | | | | |
| | | Delaware VIP Government Cash Management Series Standard Class Year ended |
| | | 12/31/191 | | 12/31/18 | | 12/31/17 | | 12/31/16 | | 12/31/15 |
Net asset value, beginning of period | | | $ | 1.00 | | | | $ | 1.00 | | | | $ | 1.00 | | | | $ | 1.00 | | | | $ | 1.00 | |
| | | | | |
Income from investment operations: | | | | | | | | | | | | | | | | | | | | | | | | | |
Net investment income2 | | | | 0.01 | | | | | 0.01 | | | | | — | | | | | — | | | | | — | |
| | | | | | | | | | | | | | | | | | | | | | | | | |
Total from investment operations | | | | 0.01 | | | | | 0.01 | | | | | — | | | | | — | | | | | — | |
| | | | | | | | | | | | | | | | | | | | | | | | | |
| | | | | |
Less dividends and distributions from: | | | | | | | | | | | | | | | | | | | | | | | | | |
Net investment income (loss) | | | | (0.01 | ) | | | | (0.01 | ) | | | | — | 3 | | | | — | | | | | — | |
| | | | | | | | | | | | | | | | | | | | | | | | | |
Total dividends and distributions | | | | (0.01 | ) | | | | (0.01 | ) | | | | — | | | | | — | | | | | — | |
| | | | | | | | | | | | | | | | | | | | | | | | | |
| | | | | |
Net asset value, end of period | | | $ | 1.00 | | | | $ | 1.00 | | | | $ | 1.00 | | | | $ | 1.00 | | | | $ | 1.00 | |
| | | | | | | | | | | | | | | | | | | | | | | | | |
| | | | | |
Total return4 | | | | 1.35% | | | | | 1.24% | | | | | 0.26% | | | | | 0.00% | | | | | 0.00% | |
| | | | | |
Ratios and supplemental data: | | | | | | | | | | | | | | | | | | | | | | | | | |
Net assets, end of period (000 omitted) | | | $ | 8,986 | | | | $ | 11,654 | | | | $ | 8,663 | | | | $ | 9,916 | | | | $ | 14,000 | |
Ratio of expenses to average net assets | | | | 0.84% | | | | | 0.60% | | | | | 0.60% | | | | | 0.38% | | | | | 0.13% | |
Ratio of expenses to average net assets prior to fees waived | | | | 1.25% | | | | | 1.06% | | | | | 1.19% | | | | | 1.15% | | | | | 1.09% | |
Ratio of net investment income to average net assets | | | | 1.37% | | | | | 1.26% | | | | | 0.25% | | | | | 0.00% | | | | | 0.00% | |
Ratio of net investment income (loss) to average net assets prior to fees waived | | | | 0.96% | | | | | 0.80% | | | | | (0.34% | ) | | | | (0.78% | ) | | | | (0.96% | ) |
| 1 | On Oct. 4, 2019, the First Investors Life Series Government Cash Management Fund shares were reorganized into Standard Class shares of the Series. See “Notes to financial statements.” The Standard Class shares financial highlights for the period prior to Oct. 4, 2019, reflect the performance of the First Investors Life Series Government Cash Management Fund shares. |
| 2 | The average shares outstanding method has been applied for per share information. |
| 3 | Amount is less than $0.005 per share. |
| 4 | Total return is based on the change in net asset value of a share during the period and assumes reinvestment of dividends and distributions at net asset value. Total return during all of the periods shown reflects a waiver by the manager. Performance would have been lower had the waiver not been in effect. Total return does not include fees, charges, or expenses imposed by the variable annuity and life insurance contracts for which Delaware VIP Trust serves as an underlying investment vehicle. |
See accompanying notes, which are an integral part of the financial statements.
Government Cash Management Series-9
Delaware VIP® Trust — Delaware VIP Government Cash Management Series
Notes to financial statements
December 31, 2019
Delaware VIP Trust (Trust) is organized as a Delaware statutory trust. The Trust consists of 22 series, each of which is treated as a separate entity for certain matters under the Investment Company Act of 1940, as amended (1940 Act). These financial statements and the related notes pertain to Delaware VIP Government Cash Management Series (Series). The Trust is anopen-end investment company. The Series is considered diversified under the 1940 Act and offers Standard Class shares. The Standard Class shares do not carry a distribution and service(12b-1) fee. The shares of the Series are sold only to separate accounts of life insurance companies.
Before the Series commenced operations, on Oct. 4, 2019, all of the assets and liabilities of the First Investors Life Series Government Cash Management Fund, its respective Predecessor Series (Predecessor Series) were transferred to the Series in atax-free reorganization as set forth in an agreement and plan of reorganization (each a Foresters Reorganization) between the Trust, on behalf of the Series, and Foresters Investment Management Company, Inc. (FIMCO), on behalf of the Predecessor Series. As a result of the Foresters Reorganization, the Series assumed the performance and accounting history of its Predecessor Series. Financial information included for the dates prior to the Foresters Reorganization is that of the Predecessor Series.
1. Significant Accounting Policies
The Series follows accounting and reporting guidance under Financial Accounting Standards Board (FASB) Accounting Standards Codification Topic 946, Financial Services – Investment Companies. The following accounting policies are in accordance with US generally accepted accounting principles (US GAAP) and are consistently followed by the Series.
Security Valuation — Securities are valued at amortized cost, which approximates market value.
Federal Income Taxes — No provision for federal income taxes has been made as the Series intends to continue to qualify for federal income tax purposes as a regulated investment company under Subchapter M of the Internal Revenue Code of 1986, as amended, and make the requisite distributions to shareholders. The Series evaluates tax positions taken or expected to be taken in the course of preparing the Series’ tax returns to determine whether the tax positions are“more-likely-than-not” of being sustained by the applicable tax authority. Tax positions not deemed to meet the“more-likely-than-not” threshold are recorded as a tax benefit or expense in the current year. Management has analyzed the Series’ tax positions taken or expected to be taken on the Series’ federal income tax returns through the year ended Dec. 31, 2019 and for all open tax years (years ended Dec. 31, 2016–Dec. 31, 2018), and has concluded that no provision for federal income tax is required in the Series’ financial statements. If applicable, the Series recognizes interest accrued on unrecognized tax benefits in interest expense and penalties in “Other” on the “Statement of operations.” During the year ended Dec. 31, 2019, the Series did not incur any interest or tax penalties.
Use of Estimates — The preparation of financial statements in conformity with US GAAP requires management to make estimates and assumptions that affect the fair value of investments, the reported amounts of assets and liabilities and disclosure of contingent assets and liabilities at the date of the financial statements, and the reported amounts of revenues and expenses during the reporting period. Actual results could differ from those estimates and the differences could be material.
Other — Expenses directly attributable to the Series are charged directly to the Series. Other expenses common to various funds within the Delaware Funds® by Macquarie (Delaware Funds) are generally allocated among such funds on the basis of average net assets. Management fees and certain other expenses are paid monthly. Security transactions are recorded on the date the securities are purchased or sold (trade date) for financial reporting purposes. Costs used in calculating realized gains and losses on the sale of investment securities are those of the specific securities sold. Interest income is recorded on the accrual basis. Discounts and premiums on debt securities are accreted or amortized to interest income, respectively, over the lives of the respective securities using the effective interest method. The Series declares and pays dividends daily from net investment income and pays the dividend monthly and declares and pays distributions from net realized gain on investments, if any, annually. The Series may distribute more frequently, if necessary for tax purposes. Dividends and distributions, if any, are recorded on theex-dividend date.
The Series receives earnings credits from its custodian when positive cash balances are maintained, which may be used to offset custody fees. The expenses paid under this arrangement are included on the “Statement of operations” under “Custodian fees” with the corresponding expenses offset included under “Less expenses paid indirectly.” For the year ended Dec. 31, 2019, the Series under this arrangement earned $250 under this arrangement.
The Series receives earnings credits from its transfer agent when positive cash balances are maintained, which may be used to offset transfer agent fees. If the amount earned is greater than $1, the expenses paid under this arrangement are included on the “Statement of operations” under “Dividend disbursing and transfer agent fees and expenses” with the corresponding expenses offset included under “Less expenses paid indirectly.” There were no such earnings credits for the year ended Dec. 31, 2019.
2. Investment Management, Administration Agreements, and Other Transactions with Affiliates
In accordance with the terms of its investment management agreement, effective Oct. 4, 2019, the Series pays Delaware Management Company (DMC), a series of Macquarie Investment Management Business Trust and the investment manager, an annual fee which is calculated daily and paid monthly at the rate of 0.45% of average daily net assets of the Series. Prior to Oct. 4, 2019, the Series paid FIMCO, an annual fee which was calculated daily and paid
Government Cash Management Series-10
Delaware VIP® Government Cash Management Series
Notes to financial statements (continued)
2. Investment Management, Administration Agreements, and Other Transactions with Affiliates (continued)
monthly at the rates of 0.75% on the first $250 million of average daily net assets of the Series, 0.72% on the next $250 million, 0.69% on the next $250 million, 0.66% on the next $500 million, 0.64% on the next $500 million, 0.62% on the next $500 million, and 0.60% on average daily net assets in excess of $2.25 billion.
DMC has contractually agreed to waive all or a portion of its investment advisory fees and/or pay/reimburse expenses (excluding any acquired fund fees and expenses, taxes, interest, short sale dividend and interest expenses, brokerage fees, certain insurance costs, and nonroutine expenses or costs, including, but not limited to, those relating to reorganizations, litigation, conducting shareholder meetings, and liquidations), do not exceed 0.83% of the Series’ average daily net assets from Oct. 4, 2019 through Dec. 31, 2019.* From Jan. 1, 2019 through May 1, 2019, FIMCO, had waived to limit the advisory fee to 0.60% of the Series’ average daily net assets. There were no waiver from May 2, 2019 through Oct. 4, 2019. These waivers and reimbursements may only be terminated by agreement of DMC and the Series. The waivers and reimbursements are accrued daily and received monthly.
Effective Oct. 4, 2019, Delaware Investments Fund Services Company (DIFSC), an affiliate of DMC, provides fund accounting and financial administration oversight services to the Series. For these services, DIFSC’s fees are calculated daily and paid monthly based on the aggregate daily net assets of all funds within the Delaware Funds at the following annual rates: 0.00475% of the first $35 billion; 0.0040% of the next $10 billion; and 0.0025% of aggregate average daily net assets in excess of $45 billion (Total Fee). Each fund in the Delaware Funds pays a minimum of $4,000, which, in aggregate, is subtracted from the Total Fee. Each fund then pays its portion of the remainder of the Total Fee on a relative NAV basis. This amount is included on the “Statement of operations” under “Accounting and administration expenses.” For the period Oct. 4, 2019 through year ended Dec. 31, 2019, the Series was charged $1,080 for these services. Prior to Oct. 4, 2019, there were no fund accounting and financial administration oversight services for the Series.
Effective Oct. 4, 2019, DIFSC is also the transfer agent and dividend disbursing agent of the Series. For these services, DIFSC’s fees are calculated daily and paid monthly at the annual rate of 0.0075% of the Series’ average daily net assets. This amount is included on the “Statement of operations” under “Dividend disbursing and transfer agent fees and expenses.” For the period Oct. 4, 2019 through year ended Dec. 31, 2019, the Series was charged $162 for these services. Pursuant to asub-transfer agency agreement between DIFSC and BNY Mellon Investment Servicing (US) Inc. (BNYMIS), BNYMIS provides certainsub-transfer agency services to the Series.Sub-transfer agency fees are paid directly by the Series and are also included on the “Statement of operations” under “Dividend disbursing and transfer agent fees and expenses.” The fees that are calculated daily and paid as invoices are received on a monthly or quarterly basis. Prior to Oct. 4, 2019, Foresters Investor Services, Inc. was the transfer agent of the Series.
As provided in the investment management agreement, the Series bears a portion of the cost of certain resources shared with DMC, including the cost of internal personnel of DMC and/or its affiliates that provide legal, tax, and regulatory reporting services to the Series. For the period Oct. 4, 2019 through year ended Dec. 31, 2019, the Series was charged $45 for internal legal, tax, and regulatory reporting services provided by DMC and/or its affiliates’ employees. These amounts are included on the “Statement of operations” under “Legal fees.”
Trustees’ fees include expenses accrued by the Series for each Trustee’s retainer and meeting fees. Certain officers of DMC, DIFSC, and DDLP are officers and/or Trustees of the Trust. These officers and Trustees are paid no compensation by the Series.
*The aggregate contractual waiver period covering this report is from Oct. 4, 2019 through Oct. 31, 2021.
3. Investments
US GAAP defines fair value as the price that the Series would receive to sell an asset or pay to transfer a liability in an orderly transaction between market participants at the measurement date under current market conditions. A three-level hierarchy for fair value measurements has been established based upon the transparency of inputs to the valuation of an asset or liability. Inputs may be observable or unobservable and refer broadly to the assumptions that market participants would use in pricing the asset or liability. Observable inputs reflect the assumptions that market participants would use in pricing the asset or liability based on market data obtained from sources independent of the reporting entity. Unobservable inputs reflect the reporting entity’s own assumptions about the assumptions that market participants would use in pricing the asset or liability based on the best information available under the circumstances. The Series’ investment in its entirety is assigned a level based upon the observability of the inputs which are significant to the overall valuation. The three-level hierarchy of inputs is summarized below and on the next page.
| | | | |
| Level 1 | | – | | Inputs are quoted prices in active markets for identical investments. (Examples: equity securities,open-end investment companies, futures contracts, and exchange-traded options contracts) |
Government Cash Management Series-11
Delaware VIP® Government Cash Management Series
Notes to financial statements (continued)
3. Investments (continued)
| | | | |
| Level 2 | | – | | Other observable inputs, including, but not limited to: quoted prices for similar assets or liabilities in markets that are active, quoted prices for identical or similar assets or liabilities in markets that are not active, inputs other than quoted prices that are observable for the assets or liabilities (such as interest rates, yield curves, volatilities, prepayment speeds, loss severities, credit risks, and default rates) or other market-corroborated inputs. (Examples: debt securities, government securities, swap contracts, foreign currency exchange contracts, foreign securities utilizing international fair value pricing, broker-quoted securities, and fair valued securities) |
| Level 3 | | – | | Significant unobservable inputs, including the Series’ own assumptions used to determine the fair value of investments. (Examples: broker-quoted securities and fair valued securities) |
Level 3 investments are valued using significant unobservable inputs. The Series may also use an income-based valuation approach in which the anticipated future cash flows of the investment are discounted to calculate fair value. Discounts may also be applied due to the nature or duration of any restrictions on the disposition of the investments. Valuations may also be based upon current market prices of securities that are comparable in coupon, rating, maturity, and industry. The derived value of a Level 3 investment may not represent the value which is received upon disposition and this could impact the results of operations.
The following table summarizes the valuation of the Series’ investments by fair value hierarchy levels as of Dec. 31, 2019:
| | | | |
Securities | | Level 2 | |
| | | | |
Assets: | | | | |
Agency Obligation | | $ | 399,989 | |
Short-Term Investments | | | 8,440,110 | |
| | | | |
Total Value of Securities | | $ | 8,840,099 | |
| | | | |
During the year ended Dec. 31, 2019, there were no transfers between Level 1 investments, Level 2 investments, or Level 3 investments that had a significant impact to the Series. The Series’ policy is to recognize transfers between levels based on fair value at the beginning of the reporting period.
A reconciliation of Level 3 investments is presented when the Series has a significant amount of Level 3 investments at the beginning, interim, or end of the period in relation to the Series’ net assets. During the year ended Dec. 31, 2019, there were no Level 3 investments.
4. Dividend and Distribution Information
Income and long-term capital gain distributions are determined in accordance with federal income tax regulations, which may differ from US GAAP. Additionally, distributions from net short-term gains on sales of investment securities are treated as ordinary income for federal income tax purposes. The tax character of dividends and distributions paid during the years ended Dec. 31, 2019 and 2018 was as follows:
| | | | | | | | |
| | | Year ended | |
| | | 12/31/19 | | | 12/31/18 | |
Ordinary income | | $ | 134,706 | | | $ | 123,522 | |
5. Components of Net Assets on a Tax Basis
As of Dec. 31, 2019, the components of net assets on a tax basis were as follows:
| | | | |
Shares of beneficial interest | | $ | 8,986,284 | |
Undistributed ordinary income | | | 1,602 | |
Distributions payable | | | (1,602 | ) |
| | | | |
Net assets | | $ | 8,986,284 | |
| | | | |
Government Cash Management Series-12
Delaware VIP® Government Cash Management Series
Notes to financial statements (continued)
6. Capital Shares
Transactions in capital shares were as follows:
| | | | | | | | |
| | | Year ended | |
| | | 12/31/19 | | | 12/31/18 | |
Shares sold: | | | | | | | | |
Standard Class | | | 12,666,759 | | | | 34,404,223 | |
Shares issued upon reinvestment of dividends and distributions: | | | | | | | | |
Standard Class | | | 133,104 | | | | 123,522 | |
| | | | | | | | |
| | | 12,799,863 | | | | 34,527,745 | |
| | | | | | | | |
Shares redeemed: | | | | | | | | |
Standard Class | | | (15,467,714 | ) | | | (31,536,951 | ) |
| | | | | | | | |
Net increase (decrease) | | | (2,667,851 | ) | | | 2,990,794 | |
| | | | | | | | |
7. Line of Credit
On Nov. 4, 2019, the Series, along with certain other funds in the Delaware Funds (Participants), is a participant in a $250,000,000 revolving line of credit intended to be used for temporary or emergency purposes as an additional source of liquidity to fund redemptions of investor shares. Under the agreement, the Participants are charged an annual commitment fee of 0.15%, which is allocated across the Participants based on a weighted average of the respective net assets of each Participant. The Participants are permitted to borrow up to a maximum ofone-third of their net assets under the agreement. Each Participant is individually, and not jointly, liable for its particular advances, if any, under the line of credit. The line of credit available under the agreement expires on Nov. 2, 2020.
The Series had no amounts outstanding as of Dec. 31, 2019, or at any time during the period then ended.
8. Securities Lending
Effective Oct. 4, 2019, the Series, along with other funds in the Delaware Funds, may lend its securities pursuant to a security lending agreement (Lending Agreement) with The Bank of New York Mellon (BNY Mellon). At the time a security is loaned, the borrower must post collateral equal to the required percentage of the market value of the loaned security, including any accrued interest. The required percentage is: (1) 102% with respect to US securities and foreign securities that are denominated and payable in US dollars; and (2) 105% with respect to foreign securities. With respect to each loan, if on any business day, the aggregate market value of securities collateral plus cash collateral held is less than the aggregate market value of the securities which are the subject of such loan, the borrower will be notified to provide additional collateral by the end of the following business day, which, together with the collateral already held, will be not less than the applicable initial collateral requirements for such security loan. If the aggregate market value of securities collateral and cash collateral held with respect to a security loan exceeds the applicable initial collateral requirement, upon the request of the borrower, BNY Mellon must return enough collateral to the borrower by the end of the following business day to reduce the value of the remaining collateral to the applicable initial collateral requirement for such security loan. As a result of the foregoing, the value of the collateral held with respect to a loaned security on any particular day, may be more or less than the value of the security on loan. The collateral percentage with respect to the market value of the loaned security is determined by the security lending agent.
Cash collateral received by each series of the Trust is generally invested in a series of individual separate accounts, each corresponding to a series. The investment guidelines permit each separate account to hold certain securities that would be considered eligible securities for a money market fund. Cash collateral received is generally invested in government securities; certain obligations issued by government sponsored enterprises; repurchase agreements collateralized by US Treasury securities; obligations issued by the central government of any Organization for Economic Cooperation and Development (OECD) country or its agencies, instrumentalities, or establishments; obligations of supranational organizations; commercial paper, notes, bonds, and other debt obligations; certificates of deposit, time deposits, and other bank obligations; and asset-backed securities. The Series can also accept US government securities and letters of credit(non-cash collateral) in connection with securities loans.
In the event of default or bankruptcy by the lending agent, realization and/or retention of the collateral may be subject to legal proceedings. In the event the borrower fails to return loaned securities and the collateral received is insufficient to cover the value of the loaned securities and provided such collateral shortfall is not the result of investment losses, the lending agent has agreed to pay the amount of the shortfall to the Series or, at the discretion of the lending agent, replace the loaned securities. The Series continues to record dividends or interest, as applicable, on the securities loaned and is subject to changes in value of the securities loaned that may occur during the term of the loan. The Series has the right under the Lending Agreement to recover the securities from the borrower on demand. With respect to security loans collateralized bynon-cash collateral, the Series receives loan premiums paid by the
Government Cash Management Series-13
Delaware VIP® Government Cash Management Series
Notes to financial statements (continued)
8. Securities Lending (continued)
borrower. With respect to security loans collateralized by cash collateral, the earnings from the collateral investments are shared among the Series, the security lending agent, and the borrower. The Series records security lending income net of allocations to the security lending agent and the borrower.
The Series may incur investment losses as a result of investing securities lending collateral. This could occur if an investment in the collateral investment account defaulted or became impaired. Under those circumstances, the value of the Series’ cash collateral account may be less than the amount the Series would be required to return to the borrowers of the securities and the Series would be required to make up for this shortfall.
During the year ended Dec. 31, 2019, the Series had no securities out on loan.
9. Credit and Market Risk
An investment in the Series is not insured or guaranteed by the Federal Deposit Insurance Corporation or any other government agency. Although the Series seeks to preserve the value of your investment at $1.00 per share, it is possible to lose money by investing in the Series.
The Series invests in certain obligations that may have liquidity protection designed to ensure that the receipt of payments due on the underlying security is timely. Such protection may be provided through guarantees, insurance policies, or letters of credit obtained by the issuer or sponsor through third parties, through various means of structuring the transaction, or through a combination of such approaches. The Series will not pay any additional fees for such credit support, although the existence of credit support may increase the price of the security.
The Series may invest up to 5% of its net assets in illiquid securities, which may include securities with contractual restrictions on resale, securities exempt from registration under Rule 144A, promulgated under the Securities Act of 1933, as amended, and other securities which may not be readily marketable. The relative illiquidity of these securities may impair the Series from disposing of them in a timely manner and at a fair price when it is necessary or desirable to do so. While maintaining oversight, the Board has delegated to DMC theday-to-day functions of determining whether individual securities are liquid for purposes of the Series’ limitation on investments in illiquid securities. Securities eligible for resale pursuant to Rule 144A, which are determined to be liquid, are not subject to the Series’ 5% limit on investments in illiquid securities. As of Dec. 31, 2019, there were no Rule 144A securities held by the Series.
10. Contractual Obligations
The Series enters into contracts in the normal course of business that contain a variety of indemnifications. The Series’ maximum exposure under these arrangements is unknown. However, the Series has not had prior claims or losses pursuant to these contracts. Management has reviewed the Series’ existing contracts and expects the risk of loss to be remote.
11. Recent Accounting Pronouncements
In March 2017, the FASB issued an Accounting Standards Update (ASU), ASU2017-08, Receivables — Nonrefundable Fees and Other Costs (Subtopic310-20), Premium Amortization on Purchased Callable Debt Securities which amends the amortization period for certain callable debt securities purchased at a premium, shortening such period to the earliest call date. The ASU2017-08 does not require any accounting change for debt securities held at a discount; the discount continues to be amortized to maturity. The ASU2017-08 is effective for fiscal years, and interim periods within those fiscal years, beginning after Dec. 15, 2018. Management has implemented the ASU2017-08 and determined that the impact of this guidance to the Series’ net assets at the end of the year is not material.
In August 2018, the FASB issued an Accounting Standard Update, ASU2018-13, which changes certain fair value measurement disclosure requirements. The ASU2018-13, in addition to other modifications and additions, removes the requirement to disclose the amount and reasons for transfers between Level 1 and Level 2 of the fair value hierarchy, the policy for the timing of transfers between levels and the valuation process for Level 3 fair value measurements. The ASU2018-13 is effective for fiscal years, and interim periods within those fiscal years, beginning after Dec. 15, 2019. At this time, management is evaluating the implications of these changes on the financial statements.
12. Subsequent Events
Management has determined that no material events or transactions occurred subsequent to Dec. 31, 2019, that would require recognition or disclosure in the Series’ financial statements.
Government Cash Management Series-14
Delaware VIP® Trust — Delaware VIP Government Cash Management Series
Report of independent registered public accounting firm
To the Board of Trustees of Delaware VIP® Trust and Shareholders of Delaware VIP Government Cash Management Series
Opinion on the Financial Statements
We have audited the accompanying statement of assets and liabilities, including the schedule of investments, of Delaware VIP Government Cash Management Series (one of the series constituting Delaware VIP® Trust, referred to hereafter as the “Series”) as of December 31, 2019, the related statements of operations and changes in net assets, including the related notes, and the financial highlights for the year then ended (collectively referred to as the “financial statements”). In our opinion, the financial statements present fairly, in all material respects, the financial position of the Series as of December 31, 2019, the results of its operations, changes in its net assets, and the financial highlights for the year then ended in conformity with accounting principles generally accepted in the United States of America.
The financial statements of First Investors Life Series Government Cash Management Fund (subsequent to reorganization, known as Delaware VIP Government Cash Management Series) as of and for the year ended December 31, 2018 and the financial highlights for each of the periods ended on or prior to December 31, 2018 (not presented herein, other than the statement of changes in net assets and the financial highlights) were audited by other auditors whose report dated February 26, 2019 expressed an unqualified opinion on those financial statements and financial highlights.
Basis for Opinion
These financial statements are the responsibility of the Series’ management. Our responsibility is to express an opinion on the Series’ financial statements based on our audit. We are a public accounting firm registered with the Public Company Accounting Oversight Board (United States) (PCAOB) and are required to be independent with respect to the Series in accordance with the U.S. federal securities laws and the applicable rules and regulations of the Securities and Exchange Commission and the PCAOB.
We conducted our audit of these financial statements in accordance with the standards of the PCAOB. Those standards require that we plan and perform the audit to obtain reasonable assurance about whether the financial statements are free of material misstatement, whether due to error or fraud.
Our audit included performing procedures to assess the risks of material misstatement of the financial statements, whether due to error or fraud, and performing procedures that respond to those risks. Such procedures included examining, on a test basis, evidence regarding the amounts and disclosures in the financial statements. Our audit also included evaluating the accounting principles used and significant estimates made by management, as well as evaluating the overall presentation of the financial statements. Our procedures included confirmation of securities owned as of December 31, 2019 by correspondence with the custodian. We believe that our audit provides a reasonable basis for our opinion.
/s/PricewaterhouseCoopers LLP
Philadelphia, Pennsylvania
February 28, 2020
We have served as the auditor of one or more investment companies in Delaware Funds® by Macquarie since 2010.
Government Cash Management Series-15
Delaware VIP® Trust — Delaware VIP Government Cash Management Series
Other Series information (Unaudited)
Tax Information
All disclosures are based on financial information available as of the date of this annual report and, accordingly are subject to change. For any and all items requiring reporting, it is the intention of the Series to report the maximum amount permitted under the Internal Revenue Code and the regulations thereunder.
For the year ended Dec. 31, 2019, the Series reports distributions paid during the year as follows:
|
| (A) |
| Ordinary Income |
| Distributions |
(Tax Basis) |
100.00% |
(A) is based on a percentage of the Series’ total distributions.
Government Cash Management Series-16
Delaware Funds® by Macquarie
Board of trustees / directors and officers addendum
A mutual fund is governed by a Board of Trustees/Directors (“Trustees”), which has oversight responsibility for the management of a fund’s business affairs. Trustees establish procedures and oversee and review the performance of the investment manager, the distributor, and others who perform services for the fund. The independent fund trustees, in particular, are advocates for shareholder interests. Each trustee has served in that capacity since he or she was elected to or appointed to the Board of Trustees, and will continue to serve until his or her retirement or the election of a new trustee in his or her place. The following is a list of the Trustees and Officers with certain background and related information.
| | | | | | | | | | |
Name, Address, and Birth Date | | Position(s) Held with Fund(s) | | Length of Time
Served | | Principal Occupation(s) During the Past Five Years | | Number of
Portfolios in Fund
Complex Overseen
by Trustee
or Officer | | Other Directorships Held by Trustee or Officer |
| INTERESTED TRUSTEE | | | | | | | | | | |
| | | | | |
Shawn K. Lytle1 2005 Market Street Philadelphia, PA 19103 February 1970 | | President, Chief Executive Officer, and Trustee | | President and Chief Executive Officer since August 2015 Trustee since September 2015 | | President — Macquarie Investment Management2 (June 2015-Present) Regional Head of Americas — UBS Global Asset Management(April 2010-May 2015) | | 95 | | Trustee — UBS Relationship Funds, SMA Relationship Trust, and UBS Funds (May 2010–April 2015) |
| INDEPENDENT TRUSTEES | | | | | | | | | | |
| | | | | |
Thomas L. Bennett 2005 Market Street Philadelphia, PA 19103 October 1947 | | Chair and Trustee | | Trustee since March 2005 Chair since March 2015 | | Private Investor (March 2004–Present) | | 95 | | None |
Jerome D. Abernathy 2005 Market Street Philadelphia, PA 19103 July 1959 | | Trustee | | Since January 2019 | | Managing Member, Stonebrook Capital Management, LLC (financial technology: macro factors and databases) (January 1993–Present) | | 95 | | None |
Ann D. Borowiec 2005 Market Street Philadelphia, PA 19103 November 1958 | | Trustee | | Since March 2015 | | Chief Executive Officer, Private Wealth Management (2011–2013) and Market Manager, New Jersey Private Bank (2005–2011) — J.P. Morgan Chase & Co. | | 95 | | Director — Banco Santander International (October 2016–December 2019) Director — Santander Bank, N.A. (December 2016–December 2019) |
Joseph W. Chow 2005 Market Street Philadelphia, PA 19103 January 1953 | | Trustee | | Since January 2013 | | Private Investor (April 2011–Present) | | 95 | | Director and Audit Committee Member — Hercules Technology Growth Capital, Inc. (July 2004–July 2014) |
Government Cash Management Series-17
| | | | | | | | | | |
Name, Address, and Birth Date | | Position(s) Held with Fund(s) | | Length of Time
Served | | Principal Occupation(s) During the Past Five Years | | Number of
Portfolios in Fund
Complex Overseen
by Trustee
or Officer | | Other Directorships Held by Trustee or Officer |
John A. Fry 2005 Market Street Philadelphia, PA 19103 May 1960 | | Trustee | | Since January 2001 | | President — Drexel University (August 2010–Present) President — Franklin & Marshall College (July 2002–July 2010) | | 95 | | Director; Compensation Committee and Governance Committee Member — Community Health Systems (May 2004–Present) Director — Drexel Morgan & Co. (2015–Present) Director and Audit Committee Member — vTv Therapeutics LLC (2017–Present) Director and Audit Committee Member — FS Credit Real Estate Income Trust, Inc. (2018–Present) Director — Federal Reserve Bank of Philadelphia (January 2020–Present) |
| | | | | | | | | | |
Lucinda S. Landreth 2005 Market Street Philadelphia, PA 19103 June 1947 | | Trustee | | Since March 2005 | | Private Investor (2004–Present) | | 95 | | None |
| | | | | |
Frances A. Sevilla-Sacasa 2005 Market Street Philadelphia, PA 19103 January 1956 | | Trustee | | Since September 2011 | | Private Investor (January 2017-Present) Chief Executive Officer — Banco Itaú International (April 2012–December 2016) Executive Advisor to Dean (August 2011–March 2012) and Interim Dean (January 2011–July 2011) — University of Miami School of Business Administration President — U.S. Trust, Bank of America Private Wealth Management (Private Banking) (July 2007–December 2008) | | 95 | | Trust Manager and Audit Committee Chair — Camden Property Trust (August 2011–Present) Director; Strategic Planning and Reserves Committee and Nominating and Governance Committee Member — Callon Petroleum Company (December 2019–Present) Director; Audit Committee Member — Carrizo Oil & Gas, Inc. (March 2018–December 2019) |
| | | | | |
Thomas K. Whitford 2005 Market Street Philadelphia, PA 19103 March 1956 | | Trustee | | Since January 2013 | | Vice Chairman (2010–April 2013) — PNC Financial Services Group | | 95 | | Director — HSBC North America Holdings Inc. (December 2013-Present) Director — HSBC USA Inc. (July 2014-Present) Director — HSBC Bank USA, National Association (July 2014-March 2017) Director — HSBC Finance Corporation (December 2013-April 2018) |
Government Cash Management Series-18
| | | | | | | | | | |
Name, Address, and Birth Date | | Position(s) Held with Fund(s) | | Length of Time
Served | | Principal Occupation(s) During the Past Five Years | | Number of
Portfolios in Fund
Complex Overseen
by Trustee
or Officer | | Other Directorships Held by Trustee or Officer |
Christianna Wood 2005 Market Street Philadelphia, PA 19103 March 1956 | | Trustee | | Since January 2019 | | Chief Executive Officer and President — Gore Creek Capital, Ltd. (August 2009–Present) | | 95 | | Director; Finance Committee and Audit Committee Member — H&R Block Corporation (July 2008–Present) Director; Chair of Investments Committee and Audit Committee Member — Grange Insurance (2013–Present) Trustee; Chair of Nominating and Governance Committee and Audit Committee Member — The Merger Fund (2013–Present), The Merger Fund VL (2013–Present); WCM Alternatives: Event-Driven Fund (2013–Present), and WCM Alternatives: Credit Event Fund (December 2017–Present) Director; Chair of Governance Committee and Audit Committee Member — International Securities Exchange (2010–2016) |
Janet L. Yeomans 2005 Market Street Philadelphia, PA 19103 July 1948 | | Trustee | | Since April 1999 | | Vice President and Treasurer (January 2006–July 2012), Vice President — Mergers & Acquisitions (January 2003–January 2006), and Vice President and Treasurer (July 1995–January 2003) — 3M Company | | 95 | | Director; Personnel and Compensation Committee Chair; Member of Nominating, Investments, and Audit Committees for various periods throughout directorship — Okabena Company (2009-2017) |
Government Cash Management Series-19
| | | | | | | | | | |
Name, Address, and Birth Date | | Position(s) Held with Fund(s) | | Length of Time
Served | | Principal Occupation(s) During the Past Five Years | | Number of
Portfolios in Fund
Complex Overseen
by Trustee
or Officer | | Other Directorships Held by Trustee or Officer |
| OFFICERS | | | | | | | | | | |
| | | | | |
David F. Connor 2005 Market Street Philadelphia, PA 19103 December 1963 | | Senior Vice President, General Counsel, and Secretary | | Senior Vice President, since May 2013; General Counsel since May 2015; Secretary since October 2005 | | David F. Connor has served in various capacities at different times at Macquarie Investment Management. | | 95 | | None3 |
| | | | | |
Daniel V. Geatens 2005 Market Street Philadelphia, PA 19103 October 1972 | | Vice President and Treasurer | | Vice President and Treasurer since October 2007 | | Daniel V. Geatens has served in various capacities at different times at Macquarie Investment Management. | | 95 | | None3 |
| | | | | |
Richard Salus 2005 Market Street Philadelphia, PA 19103 October 1963 | | Senior Vice President and Chief Financial Officer | | Senior Vice President and Chief Financial Officer since November 2006 | | Richard Salus has served in various capacities at different times at Macquarie Investment Management. | | 95 | | None |
| 1 | Shawn K. Lytle is considered to be an “Interested Trustee” because he is an executive officer of the Fund’s(s’) investment advisor. |
| 2 | Macquarie Investment Management is the marketing name for Macquarie Management Holdings, Inc. and its subsidiaries, including the Fund’s(s’) investment advisor, principal underwriter, and its transfer agent. |
| 3 | David F. Connor and Daniel V. Geatens serve in similar capacities for the six portfolios of the Optimum Fund Trust, which have the same investment advisor, principal underwriter, and transfer agent as the registrant. Mr. Geatens also serves as the Chief Financial Officer of the Optimum Fund Trust and he is the Chief Financial Officer and Treasurer for Macquarie Global Infrastructure Total Return Fund Inc. |
The Statement of Additional Information for the Fund(s) includes additional information about the Trustees and Officers and is available, without charge, upon request by calling 800523-1918.
Government Cash Management Series-20
The Series files its complete schedule of portfolio holdings with the Securities and Exchange Commission (SEC) for the first and third quarters of each fiscal year on FormN-Q or FormN-PORT (available for filings after March 31, 2019). The Series’ FormsN-Q or FormsN-PORT, as well as a description of the policies and procedures that the Series uses to determine how to vote proxies (if any) relating to portfolio securities, are available without charge (i) upon request, by calling 800523-1918; and (ii) on the SEC’s website at sec.gov. In addition, a description of the policies and procedures that the Series uses to determine how to vote proxies (if any) relating to portfolio securities and the Schedule of Investments included in the Series’ most recent FormN-Q or FormN-PORT are available without charge on the Series’ website at delawarefunds.com/vip/literature. The Series’ FormsN-Q and FormsN-PORT may be reviewed and copied at the SEC’s Public Reference Room in Washington, D.C.; information on the operation of the Public Reference Room may be obtained by calling 800SEC-0330.
Information (if any) regarding how the Series voted proxies relating to portfolio securities during the most recently disclosed12-month period ended June 30 is available without charge (i) through the Series’ website at delawarefunds.com/proxy; and (ii) on the SEC’s website at sec.gov.
| | |
| AR-VIPGCM 22493 (2/20) (1076649) | | Government Cash ManagementSeries-21 |
Delaware VIP® Trust
Delaware VIP Growth and Income Series
(formerly, First Investors Life Series Growth & Income Fund)
December 31, 2019
Beginning on or about June 1, 2021, as permitted by regulations adopted by the Securities and Exchange Commission, paper copies of your Series’ shareholder reports will no longer be sent to you by mail, unless you specifically request them from the Series or from your financial intermediary, such as a broker/dealer, bank, or insurance company. Instead, you will be notified by mail each time a report is posted on the website and provided with a link to access the report.
If you already elected to receive shareholder reports electronically, you will not be affected by this change and you do not need to take any action.
You may elect to receive paper copies of all future shareholder reports free of charge. You can inform the Series that you wish to continue receiving paper copies of your shareholder reports by contacting us at 800523-1918. If you own these shares through a financial intermediary, you may contact your financial intermediary to elect to continue to receive paper copies of your shareholder reports. Your election to receive reports in paper will apply to all funds held with the Delaware Funds® by Macquarie or your financial intermediary.

Table of contents
Other than Macquarie Bank Limited (MBL), none of the entities noted are authorized deposit-taking institutions for the purposes of the Banking Act 1959 (Commonwealth of Australia). The obligations of these entities do not represent deposits or other liabilities of MBL. MBL does not guarantee or otherwise provide assurance in respect of the obligations of these entities, unless noted otherwise. The Series is governed by US laws and regulations.
Unless otherwise noted, views expressed herein are current as of Dec. 31, 2019, and subject to change for events occurring after such date.
The Series is not FDIC insured and is not guaranteed. It is possible to lose the principal amount invested.
Advisory services provided by Delaware Management Company, a series of Macquarie Investment Management Business Trust (MIMBT), a US registered investment advisor.
The Series is distributed byDelaware Distributors, L.P.(DDLP), an affiliate of MIMBT and Macquarie Group Limited. Macquarie Investment Management (MIM) is the marketing name for certain companies comprising the asset management division of Macquarie Group Limited and its subsidiaries and affiliates worldwide.
This material may be used in conjunction with the offering of shares in Delaware VIP® Growth and Income Series only if preceded or accompanied by the Series’ current prospectus or the summary prospectus.
© 2020 Macquarie Management Holdings, Inc.
All third-party marks cited are the property of their respective owners.
| | |
| Delaware VIP®Trust — Delaware VIP Growth and Income Series | | |
| Portfolio management review | | January 7, 2020 (Unaudited) |
The investment objective of the Series is to seek long-term growth of capital and current income.
Effective after the close of business on Oct. 4, 2019, Delaware Management Company (DMC or Manager), a series of Macquarie Investment Management Business Trust (MIMBT), serves as the investment manager for the Series.* During the period after the close of business on Oct. 4, 2019 to Dec. 31, 2019, the Manager repositioned the portfolio in accordance with the Series’ investment objective and principal investment strategies, as described in the prospectus. The investment objective is the same and its principal investment strategies are the same or similar to those of the corresponding Life Series Fund.
For the fiscal year ended Dec. 31, 2019, Delaware VIP Growth and Income Series (the “Series”) Standard Class shares gained 25.60%, reflecting all dividends reinvested. The Series’ benchmark, the Russell 1000® Value Index, advanced 26.54% for the same period. The Series changed its broad-based securities index to the Russell 1000 Value Index as of Oct. 4, 2019. The Series had previously changed its broad-based securities index to the MSCI USA Value Index as of Jan. 31, 2019. In each case the Series elected to use the new index because it more closely reflects the Series’ investment strategies.
Rebounding from the stock market correction that occurred in late 2018, the broad market S&P 500® Index posted a total return of 31.5% and achieved a newall-time high in December 2019. Notably, there was little earnings growth to support 2019’s hardy gains (aggregate earnings for the S&P 500 Index were lower in each of the first three quarters, year over year, and are expected to be down again in the fourth quarter). The Federal Open Market Committee (FOMC) reduced the federal funds rate by 0.25 percentage points on three separate occasions. The FOMC raised rates in December 2018 before “pivoting” toward a more accommodative stance, which helped spark the 2019 stock market rally. Yields on US Treasury securities moved lower during the year as investors appeared to price in slower economic growth. The yield on the benchmark10-year note fell 0.76% to settle at 1.92%. The price of crude oil moved higher. West Texas Intermediate (WTI) crude, the domestic benchmark, was up 34% to $61.06 a barrel (source: FactSet Research Systems).
Foresters Investment Management Company, Inc. (FIMCO) managed the Series from Jan. 1, 2019 to Oct. 4, 2019, when the management of the Series transitioned to DMC. The following is a discussion about Series performance during that period ended Oct. 4, 2019:
The Series outperformed both the Russell 1000 Value Index and the MSCI USA Value Index during the first nine months of the fiscal period. The Series benefited from strong stock selection overall during the period, most notably within the industrials sector. Two of the Series’ defense holdings,Lockheed Martin Corp.andNorthrop Grumman Corp., benefited as defense budgets were expanded and both companies picked up sizeable new contracts.Ingersoll-Rand PLCprofited from high demand in its core air conditioning market and the planned divestiture of its lower-margin industrial businesses. Both specialty chemicals providerCelanese Corp.and agricultural chemical providerFMC Corp.gained from strong global demand for their products which, in FMC’s case, more than offset flood-related challenges to its North American business.
The Series also enjoyed sound stock selection in the information technology sector. Improving investor optimism about key semiconductor trends buoyed Series holdings such asSynopsys Inc.,ASML Holding NV,Texas Instruments Inc.,NXP Semiconductors NV, andQualcomm Inc., bolstered by a patent settlement with Apple. Business payment providerFleetCor Technologies Inc.also saw strong performance in its core products combined with encouraging customer adoption of the company’s new offerings.
Partially offsetting the above, the Series experienced pockets of negative stock selection, notably in the healthcare and communication services sectors. Managed-care providerCentene Corp.succumbed to increased investor concern over the fate of the Affordable Care Act (as a result of the late 2018 ruling of a federal judge in Texas) and the loss of a Medicaid contract in Louisiana. The Series’ media investments declined as investors worried about advertising trends and changing consumer viewing habits.CBS Corp.also announced a poorly received recombination with Viacom, whereasFox Corp.unveiled disappointing spending guidance. Additionally, the Series’ underweighting of stocks in the real estate sector served as a headwind to relative performance, as that sector was the benchmark’s single-strongest-performing sector during the reporting period.
*On April 6, 2019, FIMCO, the investment adviser to the First Investors Funds, entered into an agreement with Macquarie Management Holdings, Inc. (MMHI), whereby MMHI, on behalf of its affiliate DMC, would acquire FIMCO’s asset management business (the “Transaction”). In connection with the Transaction, the Board of Trustees of the First Investors Trusts and the First Investors Fund shareholders approved, pursuant to an Agreement and Plan of Reorganization (the “Agreement”), the transfer of all assets and liabilities of each First Investors Fund to a corresponding, newly formed fund in the Delaware Funds® by Macquarie family of funds. The Transaction closed on Oct. 4, 2019.
Unless otherwise noted, views expressed herein are current as of Dec. 31, 2019, and subject to change.
Growth and Income Series-1
Delaware VIP® Trust — Delaware VIP Growth and Income Series
Performance summary (Unaudited)
The performance quoted represents past performance and does not guarantee future results. Investment return and principal value of an investment will fluctuate so that shares, when redeemed, may be worth more or less than their original cost. Current performance may be lower or higher than the performance quoted.
Carefully consider the Series’ investment objectives, risk factors, charges, and expenses before investing. This and other information can be found in the Series’ prospectus and its summary prospectus, which may be obtained by visiting delawarefunds.com/vip/literature or calling 800523-1918. Investors should read the prospectus and the summary prospectus carefully before investing.
| | | | | | | | | | | | | | | | | | |
| Delaware VIP Growth and Income Series | | | | | | | | | | | | | | |
| Average annual total returns | | | | | | | | | | | | | | |
| For periods ended December 31, 2019 | | 1 year | | | 3 year | | | 5 year | | | 10 year | | | Lifetime |
Standard Class shares (commenced operations on Nov. 9, 1987) | | | +25.60% | | | | +10.10% | | | | +7.27% | | | | +11.42% | | | — |
| | | | | | | | | | | | | | | | | | |
Russell 1000 Value Index (current benchmark) | | | +26.54% | | | | +9.68% | | | | +8.29% | | �� | | +11.80% | | | — |
| | | | | | | | | | | | | | | | | | |
MSCI USA Value Index (former benchmark) | | | +25.73% | | | | +10.42% | | | | +9.06% | | | | +11.83% | | | — |
Returns reflect the reinvestment of all distributions. Please see page 3 for a description of the indices.
As described in the Series’ most recent prospectus, the net expense ratio for Standard Class shares of the Series was 0.72%, while total operating expenses for Standard Class shares were 0.72%. The management fee for Standard Class shares was 0.65%.The Series’ investment manager, Delaware Management Company (Manager), has contractually agreed to waive all or a portion of its investment advisory fees and/or pay/reimburse expenses (excluding any12b-1 fees, acquired fund fees and expenses, taxes, interest, short sale and dividend interest expenses, brokerage fees, certain insurance costs, and nonroutine expenses or costs, including, but not limited to, those relating to reorganizations, litigation, conducting shareholder meetings, and liquidations) in order to prevent annual series operating expenses from exceeding 0.77% of the Series’ average daily net assets from Oct. 4, 2019 through Dec. 31, 2019.* Please see the most recent prospectus and any applicable supplement(s) for additional information on these fee waivers and/or reimbursements. Please see the “Financial highlights” section in this report for the most recent expense ratios.
Earnings from a variable annuity or variable life investment compoundtax-free until withdrawal, and as a result, no adjustments were made for income taxes.
Expense limitations were in effect for Standard Class shares during certain periods shown in the Series performance table above and in the Performance of a $10,000 Investment graph on the next page.
Performance data do not reflect insurance fees related to a variable annuity or variable life investment or the deferred sales charge that would apply to certain withdrawals of investments held for fewer than eight years. Performance shown here would have been reduced if such fees were included and the expense limitation removed. For more information about fees, consult your variable annuity or variable life prospectus.
Investments in variable products involve risk.
Stock prices may decline over short or even extended periods due to general economic and market conditions, adverse political or regulatory developments or interest rate fluctuations. While dividend-paying stocks are generally considered less volatile than other stocks, there can be no guarantee that an investment therein will be less volatile than the general stock market. The Series’ investments in potential growth opportunities may increase the potential volatility of its share price. Adverse market events may lead in increased redemptions, which could cause the Series to experience a loss or difficulty in selling securities to meet redemptions.
The Series seeks to invest in securities that are undervalued and that will rise in value due to anticipated events or changes in investor perceptions. If these developments do not occur, the market price of these securities may not rise as expected or may fall.
At times, the Series may not be able to identify attractive dividend-paying stocks. The income received by the Series will also fluctuate due to the amount of dividends that companies elect to pay, which could adversely affect the Series’ ability to pay dividends and its share price.
The risk that the securities selected by a series’ management will underperform the markets, the relevant indices, or the securities selected by other funds with similar investment objectives and investment strategies. The securities and sectors selected may vary from the securities and sectors included in the relevant index.
In addition to the risks associated with the real estate industry, which include declines in the real estate market, decreases in property revenues and increases in property taxes and operating expenses, REITs are subject to additional risks, including those related to adverse governmental actions, declines
Growth and Income Series-2
Delaware VIP® Growth and Income Series
Performance summary (Unaudited) (continued)
in property value, and the potential failure to qualify for federaltax-free “pass-though” of distributed net income and net realized gains and exemption from registration as an investment company. REITs are dependent upon specialized management skills and may invest in relatively few properties, a small geographic area or a small number of property types. As a result, investments in REITs may be volatile. REITs are pooled investment vehicles with their own fees and expenses, and the Series will indirectly bear a proportionate share of those fees and expenses.
Please read both the contract and underlying prospectus for specific details regarding the product’s risk profile.
*The aggregate contractual waiver period covering this report is from Oct. 4, 2019 through Oct. 31, 2021.
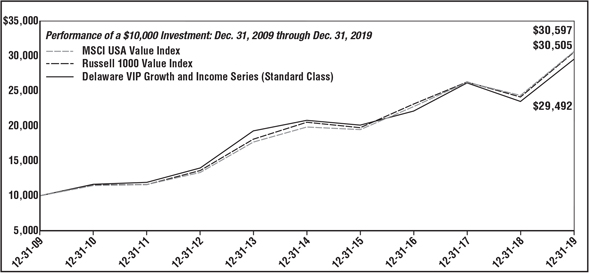
| | | | | | | | | | |
For period beginning Dec. 31, 2009 through Dec. 31, 2019 | | | Starting value | | | | Ending value | |
| -- | | MSCI USA Value Index | | | $10,000 | | | | $30,597 | |
| -- | | Russell 1000 Value Index | | | $10,000 | | | | $30,505 | |
| — | | Delaware VIP Growth and Income Series (Standard Class) | | | $10,000 | | | | $29,492 | |
The graph shows a $10,000 investment in the Delaware VIP Growth and Income Series Standard Class shares for the period from Dec. 31, 2009 through Dec. 31, 2019.
The graph also shows $10,000 invested in the Russell 1000 Value Index and the MSCI USA Value Index for the period from Dec. 31, 2009 through Dec. 31, 2019.
The Russell 1000 Value Index measures the performance of thelarge-cap value segment of the US equity universe. It includes those Russell 1000 companies with lowerprice-to-book ratios and lower forecasted growth values.
The MSCI USA Value Index captures large- andmid-cap US stocks exhibiting overall value style characteristics. The value investment style characteristics for index construction are defined using three variables: book value to price,12-month forward earnings to price, and dividend yield.
The S&P 500 Index, mentioned on page 1, measures the performance of 500 mostlylarge-cap stocks weighted by market value, and is often used to represent performance of the US stock market.
Frank Russell Company is the source and owner of the trademarks, service marks, and copyrights related to the Russell Indexes. Russell® is a trademark of Frank Russell Company.
Index performance returns do not reflect any management fees, transaction costs or expenses. Indices are unmanaged and one cannot invest directly in an index.
Past performance is not a guarantee of future results.
Growth and Income Series-3
Delaware VIP® Trust — Delaware VIP Growth and Income Series
Disclosure of Series expenses
For thesix-month period from July 1, 2019 to December 31, 2019 (Unaudited)
As a shareholder of the Series, you incur ongoing costs, which may include management fees; distribution and service(12b-1) fees; and other Series expenses. This example is intended to help you understand your ongoing costs (in dollars) of investing in the Series and to compare these costs with the ongoing costs of investing in other mutual funds.
The example is based on an investment of $1,000 invested at the beginning of the period and held for the entiresix-month period from July 1, 2019 to Dec. 31, 2019.
Actual expenses
The first section of the table shown, “Actual Series return,” provides information about actual account values and actual expenses. You may use the information in this section of the table, together with the amount you invested, to estimate the expenses that you paid over the period. Simply divide your account value by $1,000 (for example, an $8,600 account value divided by $1,000 = 8.6), then multiply the result by the number in the first section under the heading entitled “Expenses Paid During Period” to estimate the expenses you paid on your account during the period.
Hypothetical example for comparison purposes
The second section of the table shown, “Hypothetical 5% return,” provides information about hypothetical account values and hypothetical expenses based on the Series’ actual expense ratio and an assumed rate of return of 5% per year before expenses, which is not the Series’ actual return. The hypothetical account values and expenses may not be used to estimate the actual ending account balance or expenses you paid for the period. You may use this information to compare the ongoing costs of investing in the Series and other funds. To do so, compare this 5% hypothetical example with the 5% hypothetical examples that appear in the shareholder reports of other funds.
Please note that the expenses shown in the table are meant to highlight your ongoing costs only. As a shareholder of the Series, you do not incur any transaction costs, such as sales charges (loads), redemption fees or exchange fees, but shareholders of other funds may incur such costs. Also, the fees related to the variable annuity investment or the deferred sales charge that could apply have not been included. Therefore, the second section of the table is useful in comparing ongoing costs only, and will not help you determine the relative total costs of owning different funds. The Series’ expenses shown in the table reflect fee waivers in effect and assume reinvestment of all dividends and distributions.
Expense analysis of an investment of $1,000
| | | | | | | | | | | | | | | | |
| | | Beginning
Account
Value
7/1/19 | | | Ending
Account
Value
12/31/19 | | | Annualized
Expense
Ratio | | | Expenses
Paid During
Period
7/1/19 to
12/31/19* | |
Actual Series return† | | | | | |
Standard Class | | | $1,000.00 | | | $ | 1,088.70 | | | | 0.74 | % | | | $3.90 | |
Hypothetical 5% return(5% return before expenses) | |
Standard Class | | | $1,000.00 | | | $ | 1,021.48 | | | | 0.74 | % | | | $3.77 | |
*“Expenses Paid During Period” are equal to the Series’ annualized expense ratio, multiplied by the average account value over the period, multiplied by 184/365 (to reflect theone-half year period).
†Because actual returns reflect only the most recentsix-month period, the returns shown may differ significantly from fiscal year returns.
In addition to the Series’ expenses reflected above, the Series also indirectly bears its portion of the fees and expenses of the investment companies (Underlying Funds) in which it invests. The table above does not reflect the expenses of the Underlying Funds.
Growth and Income Series-4
Delaware VIP® Trust — Delaware VIP Growth and Income Series
Security type / country and sector allocations
As of December 31, 2019 (Unaudited)
Sector designations may be different than the sector designations presented in other Series materials. The sector designations may represent the investment manager’s internal sector classifications.
| | | | |
| Security type / sector | | Percentage of
net assets | |
Common Stock | | | 98.56% | |
Communication Services | | | 5.75% | |
Consumer Discretionary | | | 5.44% | |
Consumer Staples | | | 9.29% | |
Energy | | | 12.55% | |
Financials | | | 15.01% | |
Healthcare | | | 21.67% | |
Industrials | | | 8.74% | |
Information Technology | | | 11.79% | |
Materials | | | 2.69% | |
Real Estate | | | 2.58% | |
Utilities | | | 3.05% | |
Short-Term Investments | | | 0.90% | |
Total Value of Securities | | | 99.46% | |
Receivables and Other Assets Net of Liabilities | | | 0.54% | |
Total Net Assets | | | 100.00% | |
Holdings are for informational purposes only and are subject to change at any time. They are not a recommendation to buy, sell, or hold any security.
| | |
| Top 10 equity holdings | | Percentage
of net assets |
Marathon Oil | | 3.33% |
Halliburton | | 3.27% |
Johnson & Johnson | | 3.27% |
Archer-Daniels-Midland | | 3.26% |
Merck & Co. | | 3.24% |
ConocoPhillips | | 3.22% |
Cigna | | 3.22% |
Marsh & McLennan | | 3.19% |
Intel | | 3.18% |
Raytheon | | 3.17% |
Growth and Income Series-5
Delaware VIP® Trust — Delaware VIP Growth and Income Series
Schedule of investments
December 31, 2019
| | | | | | | | |
| | | Number of
shares | | | Value (US $) | |
Common Stock – 98.56% | | | | | |
Communication Services – 5.75% | | | | | |
AT&T | | | 384,500 | | | $ | 15,026,260 | |
Verizon Communications | | | 240,400 | | | | 14,760,560 | |
| | | | | | | | |
| | | | | | | 29,786,820 | |
| | | | | | | | |
Consumer Discretionary – 5.44% | | | | | |
Dollar Tree † | | | 129,100 | | | | 12,141,855 | |
Lowe’s | | | 133,800 | | | | 16,023,888 | |
| | | | | | | | |
| | | | | | | 28,165,743 | |
| | | | | | | | |
Consumer Staples – 9.29% | | | | | |
Archer-Daniels-Midland | | | 364,000 | | | | 16,871,400 | |
Conagra Brands | | | 455,000 | | | | 15,579,200 | |
Mondelez International Class A | | | 284,300 | | | | 15,659,244 | |
| | | | | | | | |
| | | | | | | 48,109,844 | |
| | | | | | | | |
Energy – 12.55% | | | | | |
ConocoPhillips | | | 256,800 | | | | 16,699,704 | |
Halliburton | | | 692,000 | | | | 16,933,240 | |
Marathon Oil | | | 1,269,200 | | | | 17,235,736 | |
Occidental Petroleum | | | 343,300 | | | | 14,147,393 | |
| | | | | | | | |
| | | | | | | 65,016,073 | |
| | | | | | | | |
Financials – 15.01% | | | | | |
Allstate | | | 134,800 | | | | 15,158,260 | |
American International Group | | | 270,000 | | | | 13,859,100 | |
Bank of New York Mellon | | | 325,800 | | | | 16,397,514 | |
Marsh & McLennan | | | 148,300 | | | | 16,522,103 | |
Truist Financial | | | 280,700 | | | | 15,809,024 | |
| | | | | | | | |
| | | | | | | 77,746,001 | |
| | | | | | | | |
Healthcare – 21.67% | | | | | |
Abbott Laboratories | | | 178,700 | | | | 15,521,882 | |
Cardinal Health | | | 285,500 | | | | 14,440,590 | |
Cigna | | | 81,500 | | | | 16,665,935 | |
CVS Health | | | 217,000 | | | | 16,120,930 | |
Johnson & Johnson | | | 116,000 | | | | 16,920,920 | |
Merck & Co. | | | 184,300 | | | | 16,762,085 | |
Pfizer | | | 404,200 | | | | 15,836,556 | |
| | | | | | | | |
| | | | | | | 112,268,898 | |
| | | | | | | | |
Industrials – 8.74% | | | | | |
Northrop Grumman | | | 42,500 | | | | 14,618,725 | |
Raytheon | | | 74,700 | | | | 16,414,578 | |
Waste Management | | | 125,200 | | | | 14,267,792 | |
| | | | | | | | |
| | | | | | | 45,301,095 | |
| | | | | | | | |
| | | | | | | | |
| | | Number of
shares | | | Value (US $) | |
Common Stock (continued) | |
Information Technology – 11.79% | | | | | |
Broadcom | | | 50,800 | | | $ | 16,053,816 | |
Cisco Systems | | | 303,200 | | | | 14,541,472 | |
Intel | | | 275,500 | | | | 16,488,675 | |
Oracle | | | 264,300 | | | | 14,002,614 | |
| | | | | | | | |
| | | | | | | 61,086,577 | |
| | | | | | | | |
Materials – 2.69% | | | | | |
DuPont de Nemours | | | 217,100 | | | | 13,937,820 | |
| | | | | | | | |
| | | | | | | 13,937,820 | |
| | | | | | | | |
Real Estate – 2.58% | | | | | |
Equity Residential | | | 165,000 | | | | 13,351,800 | |
| | | | | | | | |
| | | | | | | 13,351,800 | |
| | | | | | | | |
Utilities – 3.05% | | | | | |
Edison International | | | 209,500 | | | | 15,798,395 | |
| | | | | | | | |
| | | | | | | 15,798,395 | |
| | | | | | | | |
Total Common Stock (cost $441,196,139) | | | | | | | 510,569,066 | |
| | | | | | | | |
Short-Term Investments – 0.90% | |
Money Market Mutual Funds – 0.90% | |
BlackRock FedFund – Institutional Shares(seven-day effective yield 1.52%) | | | 938,275 | | | | 938,275 | |
Fidelity Investments Money Market Government Portfolio – Class I(seven-day effective yield 1.49%) | | | 938,275 | | | | 938,275 | |
GS Financial Square Government Fund – Institutional Shares(seven-day effective yield 1.51%) | | | 938,275 | | | | 938,275 | |
Morgan Stanley Government Portfolio – Institutional Share Class(seven-day effective yield 1.48%) | | | 938,275 | | | | 938,275 | |
State Street Institutional US Government Money Market Fund – Investor Class(seven-day effective yield 1.45%) | | | 938,275 | | | | 938,275 | |
| | | | | | | | |
Total Short-Term Investments
(cost $4,691,375) | | | | | | | 4,691,375 | |
| | | | | | | | |
| | | | | | |
Total Value of Securities – 99.46%
(cost $445,887,514) | | | | $ | 515,260,441 | |
| | | | | | |
†Non-income producing security.
GS – Goldman Sachs
See accompanying notes, which are an integral part of the financial statements.
Growth and Income Series-6
| | |
Delaware VIP®Trust — Delaware VIP Growth and Income Series | | |
Statement of assets and liabilities | | December 31, 2019 |
| | | | |
Assets: | | | | |
Investments, at value1 | | $ | 515,260,441 | |
Receivable for securities sold | | | 2,327,318 | |
Dividends and interest receivable | | | 901,863 | |
Other assets | | | 16,185 | |
| | | | |
Total assets | | | 518,505,807 | |
| | | | |
Liabilities: | | | | |
Investment management fees payable | | | 281,843 | |
Payable for series shares redeemed | | | 65,142 | |
Reports and statements to shareholders payable tonon-affiliates | | | 41,807 | |
Audit and tax fees payable | | | 38,124 | |
Accounting and administration expenses payable tonon-affiliates | | | 16,319 | |
Other accrued expenses | | | 7,982 | |
Trustees’ fees and expenses payable | | | 4,982 | |
Dividend disbursing and transfer agent fees and expenses payable to affiliates | | | 3,258 | |
Accounting and administration expenses payable to affiliates | | | 1,781 | |
Reports and statements to shareholders expenses payable to affiliates | | | 805 | |
Legal fees payable to affiliates | | | 786 | |
Pricing fees payable | | | 501 | |
| | | | |
Total liabilities | | | 463,330 | |
| | | | |
Total Net Assets | | $ | 518,042,477 | |
| | | | |
| |
Net Assets Consist of: | | | | |
Paid-in capital | | $ | 313,098,933 | |
Total distributable earnings (loss) | | | 204,943,544 | |
| | | | |
Total Net Assets | | $ | 518,042,477 | |
| | | | |
| |
Net Asset Value: | | | | |
Standard Class: | | | | |
Net assets | | $ | 518,042,477 | |
Shares of beneficial interest outstanding, unlimited authorization, no par | | | 12,019,789 | |
Net asset value per share | | $ | 43.10 | |
| | | | |
1Investments, at cost | | $ | 445,887,514 | |
See accompanying notes, which are an integral part of the financial statements.
Growth and Income Series-7
Delaware VIP® Trust —
Delaware VIP Growth and Income Series Statement of operations
Year ended December 31, 2019
| | | | |
Investment Income: | | | | |
Dividends | | $ | 11,979,590 | |
Interest | | | 477,370 | |
| | | | |
| | | 12,456,960 | |
| | | | |
Expenses: | | | | |
Management fees | | | 3,541,217 | |
Reports and statements to shareholders | | | 89,487 | |
Trustees’ fees and expenses | | | 44,032 | |
Audit and tax fees | | | 36,946 | |
Accounting and administration expenses | | | 28,150 | |
Custodian fees | | | 15,508 | |
Dividend disbursing and transfer agent fees and expenses | | | 9,569 | |
Legal fees | | | 6,009 | |
Other | | | 24,589 | |
| | | | |
| | | 3,795,507 | |
Less expenses paid indirectly | | | (12,516 | ) |
| | | | |
Total operating expenses | | | 3,782,991 | |
| | | | |
Net Investment Income | | | 8,673,969 | |
| | | | |
| |
Net Realized and Unrealized Gain (Loss): | | | | |
Net realized gain on investments | | | 129,014,509 | |
Net change in unrealized appreciation (depreciation) of investments | | | (26,372,461 | ) |
| | | | |
Net Realized and Unrealized Gain | | | 102,642,048 | |
| | | | |
Net Increase in Net Assets Resulting from Operations | | $ | 111,316,017 | |
| | | | |
Delaware VIP Trust —
Delaware VIP Growth and Income Series
Statements of changes in net assets
| | | | | | | | |
| | | Year ended | |
| | | 12/31/19 | | | 12/31/18 | |
Increase (Decrease) in Net Assets from Operations: | | | | | |
Net investment income | | $ | 8,673,969 | | | $ | 7,887,300 | |
Net realized gain | | | 129,014,509 | | | | 79,189,083 | |
Net change in unrealized appreciation (depreciation) | | | (26,372,461 | ) | | | (137,968,673 | ) |
| | | | | | | | |
Net increase (decrease) in net assets resulting from operations | | | 111,316,017 | | | | (50,892,290 | ) |
| | | | | | | | |
Dividends and Distributions to Shareholders from: | | | | | | | | |
Distributable earnings: | | | | | | | | |
Standard Class | | | (88,019,342 | ) | | | (30,287,733 | ) |
| | | | | | | | |
Capital Share Transactions: | | | | | | | | |
Proceeds from shares sold: | | | | | | | | |
Standard Class | | | 3,098,537 | | | | 4,272,429 | |
| | | | | | | | |
Net asset value of shares issued upon reinvestment of dividends and distributions: | | | | | | | | |
Standard Class | | | 88,019,342 | | | | 30,287,733 | |
| | | | | | | | |
| | | 91,117,879 | | | | 34,560,162 | |
| | | | | | | | |
Cost of shares redeemed: | | | | | | | | |
Standard Class | | | (45,347,319 | ) | | | (36,099,781 | ) |
| | | | | | | | |
Increase (Decrease) in net assets derived from capital share transactions | | | 45,770,560 | | | | (1,539,619 | ) |
| | | | | | | | |
Net Increase (Decrease) in Net Assets | | | 69,067,235 | | | | (82,719,642 | ) |
| | |
Net Assets: | | | | | | | | |
Beginning of year | | | 448,975,242 | | | | 531,694,884 | |
| | | | | | | | |
End of year | | $ | 518,042,477 | | | $ | 448,975,242 | |
| | | | | | | | |
See accompanying notes, which are an integral part of the financial statements.
Growth and IncomeSeries-8
Delaware VIP® Trust — Delaware VIP Growth and Income Series
Financial highlights
Selected data for each share of the Series outstanding throughout each period were as follows:
| | | | | | | | | | | | | | | | | | | | |
| | | Delaware VIP Growth and Income Series Standard Class | |
| | | Year ended | |
| | | 12/31/191 | | | 12/31/18 | | | 12/31/17 | | | 12/31/16 | | | 12/31/15 | |
Net asset value, beginning of period | | $ | 41.84 | | | $ | 49.45 | | | $ | 44.18 | | | $ | 43.11 | | | $ | 47.43 | |
| | | | | |
Income (loss) from investment operations: | | | | | | | | | | | | | | | | | | | | |
Net investment income2 | | | 0.71 | | | | 0.72 | | | �� | 0.66 | | | | 0.69 | | | | 0.60 | |
Net realized and unrealized gain (loss) | | | 8.82 | | | | (5.48 | ) | | | 7.09 | | | | 3.08 | | | | (1.87 | ) |
| | | | | | | | | | | | | | | | | | | | |
Total from investment operations | | | 9.53 | | | | (4.76 | ) | | | 7.75 | | | | 3.77 | | | | (1.27 | ) |
| | | | | | | | | | | | | | | | | | | | |
| | | | | |
Less dividends and distributions from: | | | | | | | | | | | | | | | | | | | | |
Net investment income | | | (0.74 | ) | | | (0.68 | ) | | | (0.71 | ) | | | (0.61 | ) | | | (0.55 | ) |
Net realized gain | | | (7.53 | ) | | | (2.17 | ) | | | (1.77 | ) | | | (2.09 | ) | | | (2.50 | ) |
| | | | | | | | | | | | | | | | | | | | |
Total dividends and distributions | | | (8.27 | ) | | | (2.85 | ) | | | (2.48 | ) | | | (2.70 | ) | | | (3.05 | ) |
| | | | | | | | | | | | | | | | | | | | |
| | | | | |
Net asset value, end of period | | $ | 43.10 | | | $ | 41.84 | | | $ | 49.45 | | | $ | 44.18 | | | $ | 43.11 | |
| | | | | | | | | | | | | | | | | | | | |
| | | | | |
Total return3 | | | 25.60% | | | | (10.17% | ) | | | 18.28% | | | | 9.88% | | | | (3.12% | ) |
| | | | | |
Ratios and supplemental data: | | | | | | | | | | | | | | | | | | | | |
Net assets, end of period (000 omitted) | | $ | 518,042 | | | $ | 448,975 | | | $ | 531,695 | | | $ | 475,019 | | | $ | 457,087 | |
Ratio of expenses to average net assets4 | | | 0.76% | | | | 0.77% | | | | 0.78% | | | | 0.79% | | | | 0.78% | |
Ratio of net investment income to average net assets | | | 1.75% | | | | 1.54% | | | | 1.45% | | | | 1.67% | | | | 1.33% | |
Portfolio turnover | | | 122%5 | | | | 58% | | | | 17% | | | | 21% | | | | 23% | |
| 1 | On Oct. 4, 2019, the First Investors Life Series Growth & Income Fund shares were reorganized into Standard Class shares of the Series. See “Notes to financial statements.” The Standard Class shares financial highlights for the period prior to Oct. 4, 2019, reflect the performance of the First Investors Life Series Growth & Income Fund shares. |
| 2 | The average shares outstanding method has been applied for per share information. |
| 3 | Total return is based on the change in net asset value of a share during the period and assumes reinvestment of dividends and distributions at net asset value. Total return does not include fees, charges, or expenses imposed by the variable annuity and life insurance contracts for which Delaware VIP Trust serves as an underlying investment vehicle. |
| 4 | Expense ratios do not include expenses of the Underlying Funds in which the Series invests. |
| 5 | The Series’ portfolio turnover rate increased substantially during the year ended Dec. 31, 2019 due to a change in the Series’ portfolio managers and associated repositioning. |
See accompanying notes, which are an integral part of the financial statements.
Growth and IncomeSeries-9
Delaware VIP® Trust — Delaware VIP Growth and Income Series
Notes to financial statements
December 31, 2019
Delaware VIP Trust (Trust) is organized as a Delaware statutory trust. The Trust consists of 22 series, each of which is treated as a separate entity for certain matters under the Investment Company Act of 1940, as amended (1940 Act). These financial statements and the related notes pertain to Delaware VIP Growth and Income Series (Series). The Trust is anopen-end investment company. The Series is considered diversified under the 1940 Act and offers Standard Class shares. The Standard Class shares do not carry a distribution and service(12b-1) fee. The shares of the Series are sold only to separate accounts of life insurance companies.
Before the Series commenced operations, on Oct. 4, 2019, all of the assets and liabilities of the First Investors Life Series Growth & Income Fund, its respective Predecessor Series (Predecessor Series) were transferred to the Series in atax-free reorganization as set forth in an agreement and plan of reorganization (each a Foresters Reorganization) between the Trust, on behalf of the Series, and Foresters Investment Management Company, Inc. (FIMCO), on behalf of the Predecessor Series. As a result of the Foresters Reorganization, the Series assumed the performance and accounting history of its Predecessor Series. Financial information included for the dates prior to the Foresters Reorganization is that of the Predecessor Series.
1. Significant Accounting Policies
The Series follows accounting and reporting guidance under Financial Accounting Standards Board (FASB) Accounting Standards Codification Topic 946, Financial Services – Investment Companies. The following accounting policies are in accordance with US generally accepted accounting principles (US GAAP) and are consistently followed by the Series.
Security Valuation – Equity securities, except those traded on the Nasdaq Stock Market LLC (Nasdaq), are valued at the last quoted sales price as of the time of the regular close of the New York Stock Exchange on the valuation date. Equity securities traded on the Nasdaq are valued in accordance with the Nasdaq Official Closing Price, which may not be the last sales price. If, on a particular day, an equity security does not trade, the mean between the bid and ask prices will be used, which approximates fair value. Equity securities listed on a foreign exchange are normally valued at the last quoted sales price on the valuation date.Open-end investment companies are valued at their published net asset value (NAV). Generally, other securities and assets for which market quotations are not readily available are valued at fair value as determined in good faith under the direction of the Trust’s Board of Trustees (Board). In determining whether market quotations are readily available or fair valuation will be used, various factors will be taken into consideration, such as market closures or suspension of trading in a security. Restricted securities are valued at fair value using methods approved by the Board.
Federal Income Taxes – No provision for federal income taxes has been made as the Series intends to continue to qualify for federal income tax purposes as a regulated investment company under Subchapter M of the Internal Revenue Code of 1986, as amended, and make the requisite distributions to shareholders. The Series evaluates tax positions taken or expected to be taken in the course of preparing the Series’ tax returns to determine whether the tax positions are“more-likely-than-not” of being sustained by the applicable tax authority. Tax positions not deemed to meet the“more-likely-than-not” threshold are recorded as a tax benefit or expense in the current year. Management has analyzed the Series’ tax positions taken or expected to be taken on the Series’ federal income tax returns through the year ended Dec. 31, 2019 and for all open tax years (years ended Dec. 31, 2016–Dec. 31, 2018), and has concluded that no provision for federal income tax is required in the Series’ financial statements. If applicable, the Series recognizes interest accrued on unrecognized tax benefits in interest expense and penalties in “Other” on the “Statement of operations.” During the year ended Dec. 31, 2019, the Series did not incur any interest or tax penalties.
Use of Estimates – The preparation of financial statements in conformity with US GAAP requires management to make estimates and assumptions that affect the fair value of investments, the reported amounts of assets and liabilities and disclosure of contingent assets and liabilities at the date of the financial statements, and the reported amounts of revenues and expenses during the reporting period. Actual results could differ from those estimates and the differences could be material.
Other – Expenses directly attributable to the Series are charged directly to the Series. Other expenses common to various funds within the Delaware Funds® by Macquarie (Delaware Funds) are generally allocated among such funds on the basis of average net assets. Management fees and certain other expenses are paid monthly. Security transactions are recorded on the date the securities are purchased or sold (trade date) for financial reporting purposes. Costs used in calculating realized gains and losses on the sale of investment securities are those of the specific securities sold. Dividend income is recorded on theex-dividend date and interest income is recorded on the accrual basis. Discounts and premiums on debt securities are accreted or amortized to interest income, respectively, over the lives of the respective securities using the effective interest method. Distributions received from investments in real estate investment trusts (REITs) are recorded as dividend income on theex-dividend date, subject to reclassification upon notice of the character of such distribution by the issuer. The Series declares and pays dividends from net investment income and distributions from net realized gain on investments, if any, following the close of the fiscal year. The Series may distribute more frequently, if necessary for tax purposes. Dividends and distributions, if any, are recorded on theex-dividend date.
The Series receives earnings credits from its custodian when positive cash balances are maintained, which may be used to offset custody fees. The expenses paid under this arrangement are included on the “Statement of operations” under “Custodian fees” with the corresponding expenses offset included under “Less expenses paid indirectly.” For the year ended Dec. 31, 2019, the Series earned $12,516 under this arrangement.
Growth and Income Series-10
Delaware VIP® Growth and Income Series
Notes to financial statements (continued)
1. Significant Accounting Policies (continued)
The Series receives earnings credits from its transfer agent when positive cash balances are maintained, which may be used to offset transfer agent fees. If the amount earned is greater than $1, the expenses paid under this arrangement are included on the “Statement of operations” under “Dividend disbursing and transfer agent fees and expenses” with the corresponding expenses offset included under “Less expenses paid indirectly.” There were no such earnings credits for the year ended Dec. 31, 2019.
2. Investment Management, Administration Agreements, and Other Transactions with Affiliates
In accordance with the terms of its investment management agreement, effective Oct. 4, 2019, the Series pays Delaware Management Company (DMC), a series of Macquarie Investment Management Business Trust and the investment manager, an annual fee which is calculated daily and paid monthly at the rates of 0.65% on the first $500 million of average daily net assets of the Series, 0.60% on the next $500 million, 0.55% on the next $1.5 billion, and 0.50% on average daily net assets in excess of $2.5 billion. Prior to Oct. 4, 2019, the Series paid FIMCO, an annual fee which was calculated daily and paid monthly at the rates of 0.75% on the first $250 million of average daily net assets of the Series, 0.72% on the next $250 million, 0.69% on the next $250 million, 0.66% on the next $500 million, 0.64% on the next $500 million, 0.62% on the next $500 million, and 0.60% on average daily net assets in excess of $2.25 billion.
DMC has contractually agreed to waive all or a portion of its investment advisory fees and/or pay/reimburse expenses (excluding any acquired fund fees and expenses, taxes, interest, short sale dividend and interest expenses, brokerage fees, certain insurance costs, and nonroutine expenses or costs, including, but not limited to, those relating to reorganizations, litigation, conducting shareholder meetings, and liquidations), do not exceed 0.77% of the Series’ average daily net assets from Oct. 4, 2019 through Dec. 31, 2019.* These expense waivers and reimbursements may only be terminated by agreement of DMC and the Series. The waivers and reimbursements are accrued daily and received monthly.
Effective Oct. 4, 2019, DMC may permit its affiliates, Macquarie Investment Management Global Limited (MIMGL) and Macquarie Funds Management Hong Kong Limited (together, the “AffiliatedSub-Advisors”), to execute Series equity security trades on behalf of the Manager. The Manager may also seek quantitative support from MIMGL. Although the AffiliatedSub-Advisors serve assub-advisors, DMC has ultimate responsibility for all investment advisory services. For these services, DMC, not the Series, may pay each AffiliatedSub-Advisor a portion of its investment management fee.
Effective Oct. 4, 2019, Delaware Investments Fund Services Company (DIFSC), an affiliate of DMC, provides fund accounting and financial administration oversight services to the Series. For these services, DIFSC’s fees are calculated daily and paid monthly based on the aggregate daily net assets of all funds within the Delaware Funds at the following annual rates: 0.00475% of the first $35 billion; 0.0040% of the next $10 billion; and 0.0025% of aggregate average daily net assets in excess of $45 billion (Total Fee). Each fund in the Delaware Funds pays a minimum of $4,000, which, in aggregate, is subtracted from the Total Fee. Each fund then pays its portion of the remainder of the Total Fee on a relative NAV basis. This amount is included on the “Statement of operations” under “Accounting and administration expenses.” For the period Oct. 4, 2019 through year ended Dec. 31, 2019, the Series was charged $5,072 for these services. Prior to Oct. 4, 2019, there were no fund accounting and financial administration oversight services for the Series.
Effective Oct. 4, 2019, DIFSC is also the transfer agent and dividend disbursing agent of the Series. For these services, DIFSC’s fees are calculated daily and paid monthly at the annual rate of 0.0075% of the Series’ average daily net assets. This amount is included on the “Statement of operations” under “Dividend disbursing and transfer agent fees and expenses.” For the period Oct. 4, 2019 through year ended Dec. 31, 2019, the Series was charged $9,146 for these services. Pursuant to asub-transfer agency agreement between DIFSC and BNY Mellon Investment Servicing (US) Inc. (BNYMIS), BNYMIS provides certainsub-transfer agency services to the Series.Sub-transfer agency fees are paid directly by the Series and are also included on the “Statement of operations” under “Dividend disbursing and transfer agent fees and expenses.” The fees that are calculated daily and paid as invoices are received on a monthly or quarterly basis. Prior to Oct. 4, 2019, Foresters Investor Services, Inc. was the transfer agent of the Series.
As provided in the investment management agreement, the Series bears a portion of the cost of certain resources shared with DMC, including the cost of internal personnel of DMC and/or its affiliates that provide legal, tax, and regulatory reporting services to the Series. For the period Oct. 4, 2019 through year ended Dec. 31, 2019, the Series was charged $2,481 for internal legal, tax, and regulatory reporting services provided by DMC and/or its affiliates’ employees. These amounts are included on the “Statement of operations” under “Legal fees.”
Trustees’ fees include expenses accrued by the Series for each Trustee’s retainer and meeting fees. Certain officers of DMC, DIFSC, and DDLP are officers and/or Trustees of the Trust. These officers and Trustees are paid no compensation by the Series.
In addition to the management fees and other expenses of the Series, the Series indirectly bears the investment management fees and other expenses of the investment companies (Underlying Funds) in which it invests. The amount of these fees and expenses incurred indirectly by the Series will vary based upon the expense and fee levels of the Underlying Funds and the number of shares that are owned of the Underlying Funds at different times.
*The aggregate contractual waiver period covering this report is from Oct. 4, 2019 through Oct. 31, 2021.
Growth and Income Series-11
Delaware VIP® Growth and Income Series
Notes to financial statements (continued)
3. Investments
For the year ended Dec. 31, 2019, the Series made purchases and sales of investment securities other than short-term investments as follows:
| | | | |
Purchases | | $ | 565,712,829 | |
Sales | | | 585,478,757 | |
The tax cost of investments includes adjustments to net unrealized appreciation (depreciation) which may not necessarily be the final tax cost basis adjustments, but approximate the tax basis unrealized gains and losses that may be realized and distributed to shareholders. At Dec. 31, 2019, the cost and unrealized appreciation (depreciation) of investments for federal income tax purposes for the Series were as follows:
| | | | | | | | | | | | | | |
Cost of
Investments | | | | | Aggregate
Unrealized
Appreciation of Investments | | | | Aggregate
Unrealized
Depreciation of Investments | | | | Net Unrealized
Appreciation of Investments |
| $ | 446,482,655 | | | | | $75,250,323 | | | | $(6,472,537) | | | | $68,777,786 |
US GAAP defines fair value as the price that the Series would receive to sell an asset or pay to transfer a liability in an orderly transaction between market participants at the measurement date under current market conditions. A three-level hierarchy for fair value measurements has been established based upon the transparency of inputs to the valuation of an asset or liability. Inputs may be observable or unobservable and refer broadly to the assumptions that market participants would use in pricing the asset or liability. Observable inputs reflect the assumptions that market participants would use in pricing the asset or liability based on market data obtained from sources independent of the reporting entity. Unobservable inputs reflect the reporting entity’s own assumptions about the assumptions that market participants would use in pricing the asset or liability based on the best information available under the circumstances. The Series’ investment in its entirety is assigned a level based upon the observability of the inputs which are significant to the overall valuation. The three-level hierarchy of inputs is summarized below.
| Level 1 – | Inputs are quoted prices in active markets for identical investments. (Examples: equity securities,open-end investment companies, futures contracts, and exchange-traded options contracts) |
| Level 2 – | Other observable inputs, including, but not limited to: quoted prices for similar assets or liabilities in markets that are active, quoted prices for identical or similar assets or liabilities in markets that are not active, inputs other than quoted prices that are observable for the assets or liabilities (such as interest rates, yield curves, volatilities, prepayment speeds, loss severities, credit risks, and default rates) or other market-corroborated inputs. (Examples: debt securities, government securities, swap contracts, foreign currency exchange contracts, foreign securities utilizing international fair value pricing, broker-quoted securities, and fair valued securities) |
| Level 3 – | Significant unobservable inputs, including the Series’ own assumptions used to determine the fair value of investments. (Examples: broker-quoted securities and fair valued securities) |
Level 3 investments are valued using significant unobservable inputs. The Series may also use an income-based valuation approach in which the anticipated future cash flows of the investment are discounted to calculate fair value. Discounts may also be applied due to the nature or duration of any restrictions on the disposition of the investments. Valuations may also be based upon current market prices of securities that are comparable in coupon, rating, maturity, and industry. The derived value of a Level 3 investment may not represent the value which is received upon disposition and this could impact the results of operations.
The following table summarizes the valuation of the Series’ investments by fair value hierarchy levels as of Dec. 31, 2019:
| | | | |
Securities | | Level 1 | |
Assets: | | | | |
Common Stock | | $ | 510,569,066 | |
Short-Term Investments | | | 4,691,375 | |
| | | | |
Total Value of Securities | | $ | 515,260,441 | |
| | | | |
During the year ended Dec. 31, 2019, there were no transfers between Level 1 investments, Level 2 investments, or Level 3 investments that had a significant impact to the Series. The Series’ policy is to recognize transfers between levels based on fair value at the beginning of the reporting period.
A reconciliation of Level 3 investments is presented when the Series has a significant amount of Level 3 investments at the beginning, interim, or end of the period in relation to the Series’ net assets. During the year ended Dec. 31, 2019, there were no Level 3 investments.
Growth and Income Series-12
Delaware VIP® Growth and Income Series
Notes to financial statements (continued)
4. Dividend and Distribution Information
Income and long-term capital gain distributions are determined in accordance with federal income tax regulations, which may differ from US GAAP. Additionally, distributions from net short-term gains on sales of investment securities are treated as ordinary income for federal income tax purposes. The tax character of dividends and distributions paid during the years ended Dec. 31, 2019 and 2018 was as follows:
| | | | | | | | |
| | | Year ended | |
| | | 12/31/19 | | | 12/31/18 | |
Ordinary income | | $ | 7,887,300 | | | $ | 10,798,413 | |
Long-term capital gains | | | 80,132,042 | | | | 19,489,320 | |
| | | | | | | | |
| | | $88,019,342 | | | $30,287,733 | |
| | | | | | | | |
5. Components of Net Assets on a Tax Basis
As of Dec. 31, 2019, the components of net assets on a tax basis were as follows:
| | | | |
Shares of beneficial interest | | $ | 313,098,933 | |
Undistributed ordinary income | | | 19,618,060 | |
Undistributed long-term capital gains | | | 116,547,698 | |
Net unrealized appreciation on investments | | | 68,777,786 | |
| | | | |
Net assets | | $ | 518,042,477 | |
| | | | |
The differences between the book basis and tax basis components of net assets are primarily attributable to tax deferral of losses on wash sales.
6. Capital Shares
Transactions in capital shares were as follows:
| | | | | | | | |
| | | Year ended | |
| | | 12/31/19 | | | 12/31/18 | |
Shares sold: | | | | | | | | |
Standard Class | | | 75,731 | | | | 91,611 | |
Shares issued upon reinvestment of dividends and distributions: | | | | | | | | |
Standard Class | | | 2,334,731 | | | | 656,716 | |
| | | | | | | | |
| | | 2,410,462 | | | 748,327 | |
| | | | | | | | |
Shares redeemed: | | | | | | | | |
Standard Class | | | (1,120,847 | ) | | | (769,522 | ) |
| | | | | | | | |
Net increase (decrease) | | | 1,289,615 | | | | (21,195 | ) |
| | | | | | | | |
7. Line of Credit
On Nov. 4, 2019, the Series, along with certain other funds in the Delaware Funds (Participants), is a participant in a $250,000,000 revolving line of credit intended to be used for temporary or emergency purposes as an additional source of liquidity to fund redemptions of investor shares. Under the agreement, the Participants are charged an annual commitment fee of 0.15%, which is allocated across the Participants based on a weighted average of the respective net assets of each Participant. The Participants are permitted to borrow up to a maximum ofone-third of their net assets under the agreement. Each Participant is individually, and not jointly, liable for its particular advances, if any, under the line of credit. The line of credit available under the agreement expires on Nov. 2, 2020.
The Series had no amounts outstanding as of Dec. 31, 2019, or at any time during the period then ended.
Growth and Income Series-13
Delaware VIP® Growth and Income Series
Notes to financial statements (continued)
8. Securities Lending
Effective Oct. 4, 2019, the Series, along with other funds in the Delaware Funds, may lend its securities pursuant to a security lending agreement (Lending Agreement) with The Bank of New York Mellon (BNY Mellon). At the time a security is loaned, the borrower must post collateral equal to the required percentage of the market value of the loaned security, including any accrued interest. The required percentage is: (1) 102% with respect to US securities and foreign securities that are denominated and payable in US dollars; and (2) 105% with respect to foreign securities. With respect to each loan, if on any business day, the aggregate market value of securities collateral plus cash collateral held is less than the aggregate market value of the securities which are the subject of such loan, the borrower will be notified to provide additional collateral by the end of the following business day, which, together with the collateral already held, will be not less than the applicable initial collateral requirements for such security loan. If the aggregate market value of securities collateral and cash collateral held with respect to a security loan exceeds the applicable initial collateral requirement, upon the request of the borrower, BNY Mellon must return enough collateral to the borrower by the end of the following business day to reduce the value of the remaining collateral to the applicable initial collateral requirement for such security loan. As a result of the foregoing, the value of the collateral held with respect to a loaned security on any particular day, may be more or less than the value of the security on loan. The collateral percentage with respect to the market value of the loaned security is determined by the security lending agent.
Cash collateral received by each series of the Trust is generally invested in a series of individual separate accounts, each corresponding to a series. The investment guidelines permit each separate account to hold certain securities that would be considered eligible securities for a money market fund. Cash collateral received is generally invested in government securities; certain obligations issued by government sponsored enterprises; repurchase agreements collateralized by US Treasury securities; obligations issued by the central government of any Organization for Economic Cooperation and Development (OECD) country or its agencies, instrumentalities, or establishments; obligations of supranational organizations; commercial paper, notes, bonds, and other debt obligations; certificates of deposit, time deposits, and other bank obligations; and asset-backed securities. The Series can also accept US government securities and letters of credit(non-cash collateral) in connection with securities loans.
In the event of default or bankruptcy by the lending agent, realization and/or retention of the collateral may be subject to legal proceedings. In the event the borrower fails to return loaned securities and the collateral received is insufficient to cover the value of the loaned securities and provided such collateral shortfall is not the result of investment losses, the lending agent has agreed to pay the amount of the shortfall to the Series or, at the discretion of the lending agent, replace the loaned securities. The Series continues to record dividends or interest, as applicable, on the securities loaned and is subject to changes in value of the securities loaned that may occur during the term of the loan. The Series has the right under the Lending Agreement to recover the securities from the borrower on demand. With respect to security loans collateralized bynon-cash collateral, the Series receives loan premiums paid by the borrower. With respect to security loans collateralized by cash collateral, the earnings from the collateral investments are shared among the Series, the security lending agent, and the borrower. The Series records security lending income net of allocations to the security lending agent and the borrower.
The Series may incur investment losses as a result of investing securities lending collateral. This could occur if an investment in the collateral investment account defaulted or became impaired. Under those circumstances, the value of the Series’ cash collateral account may be less than the amount the Series would be required to return to the borrowers of the securities and the Series would be required to make up for this shortfall.
During the year ended Dec. 31, 2019, the Series had no securities out on loan.
9. Credit and Market Risk
The Series invests in growth stocks, which reflect projections of future earnings and revenue. These prices may rise or fall dramatically depending on whether those projections are met. These companies’ stock prices may be more volatile, particularly over the short term.
The Series invests in REITs and is subject to the risks associated with that industry. If the Series holds real estate directly or receives rental income directly from real estate holdings, its tax status as a regulated investment company may be jeopardized. There were no direct real estate holdings during the year ended Dec. 31, 2019. The Series’ REIT holdings are also affected by interest rate changes, particularly if the REITs it holds use floating rate debt to finance their ongoing operations.
The Series may invest up to 10% of its net assets in illiquid securities, which may include securities with contractual restrictions on resale, securities exempt from registration under Rule 144A, promulgated under the Securities Act of 1933, as amended, and other securities which may not be readily marketable. The relative illiquidity of these securities may impair the Series from disposing of them in a timely manner and at a fair price when it is necessary or desirable to do so. While maintaining oversight, the Board has delegated to DMC theday-to-day functions of determining whether individual securities are liquid for purposes of the Series’ limitation on investments in illiquid securities. Securities eligible for resale pursuant to Rule 144A, which are determined to be liquid, are not subject to the Series’ 10% limit on investments in illiquid securities. As of Dec. 31, 2019, there were no Rule 144A securities held by the Series.
Growth and Income Series-14
Delaware VIP® Growth and Income Series
Notes to financial statements (continued)
10. Contractual Obligations
The Series enters into contracts in the normal course of business that contain a variety of indemnifications. The Series’ maximum exposure under these arrangements is unknown. However, the Series has not had prior claims or losses pursuant to these contracts. Management has reviewed the Series’ existing contracts and expects the risk of loss to be remote.
11. Recent Accounting Pronouncements
In August 2018, the FASB issued an Accounting Standard Update (ASU), ASU2018-13, which changes certain fair value measurement disclosure requirements. The ASU2018-13, in addition to other modifications and additions, removes the requirement to disclose the amount and reasons for transfers between Level 1 and Level 2 of the fair value hierarchy, the policy for the timing of transfers between levels and the valuation process for Level 3 fair value measurements. The ASU2018-13 is effective for fiscal years, and interim periods within those fiscal years, beginning after Dec. 15, 2019. At this time, management is evaluating the implications of these changes on the financial statements.
12. Subsequent Events
Management has determined that no material events or transactions occurred subsequent to Dec. 31, 2019, that would require recognition or disclosure in the Series’ financial statements.
Growth and Income Series-15
Delaware VIP® Trust — Delaware VIP Growth and Income Series
Report of independent registered public accounting firm
To the Board of Trustees of Delaware VIP® Trust and Shareholders of Delaware VIP Growth and Income Series
Opinion on the Financial Statements
We have audited the accompanying statement of assets and liabilities, including the schedule of investments, of Delaware VIP Growth and Income Series (one of the series constituting Delaware VIP® Trust, referred to hereafter as the “Series”) as of December 31, 2019, the related statements of operations and changes in net assets, including the related notes, and the financial highlights for the year then ended (collectively referred to as the “financial statements”). In our opinion, the financial statements present fairly, in all material respects, the financial position of the Series as of December 31, 2019, the results of its operations, changes in its net assets, and the financial highlights for the year then ended in conformity with accounting principles generally accepted in the United States of America.
The financial statements of First Investors Life Series Growth & Income Fund (subsequent to reorganization, known as Delaware VIP Growth and Income Series) as of and for the year ended December 31, 2018 and the financial highlights for each of the periods ended on or prior to December 31, 2018 (not presented herein, other than the statement of changes in net assets and the financial highlights) were audited by other auditors whose report dated February 26, 2019 expressed an unqualified opinion on those financial statements and financial highlights.
Basis for Opinion
These financial statements are the responsibility of the Series’ management. Our responsibility is to express an opinion on the Series’ financial statements based on our audit. We are a public accounting firm registered with the Public Company Accounting Oversight Board (United States) (PCAOB) and are required to be independent with respect to the Series in accordance with the U.S. federal securities laws and the applicable rules and regulations of the Securities and Exchange Commission and the PCAOB.
We conducted our audit of these financial statements in accordance with the standards of the PCAOB. Those standards require that we plan and perform the audit to obtain reasonable assurance about whether the financial statements are free of material misstatement, whether due to error or fraud.
Our audit included performing procedures to assess the risks of material misstatement of the financial statements, whether due to error or fraud, and performing procedures that respond to those risks. Such procedures included examining, on a test basis, evidence regarding the amounts and disclosures in the financial statements. Our audit also included evaluating the accounting principles used and significant estimates made by management, as well as evaluating the overall presentation of the financial statements. Our procedures included confirmation of securities owned as of December 31, 2019 by correspondence with the custodian and transfer agents. We believe that our audit provides a reasonable basis for our opinion.
/s/PricewaterhouseCoopers LLP
Philadelphia, Pennsylvania
February 28, 2020
We have served as the auditor of one or more investment companies in Delaware Funds® by Macquarie since 2010.
Growth and Income Series-16
Delaware VIP® Trust — Delaware VIP Growth and Income Series
Other Series information (Unaudited)
Tax Information
All disclosures are based on financial information available as of the date of this annual report and, accordingly are subject to change. For any and all items requiring reporting, it is the intention of the Series to report the maximum amount permitted under the Internal Revenue Code and the regulations thereunder.
For the year ended Dec. 31, 2019, the Series reports distributions paid during the year as follows:
| | | | | | | | |
| | | (A)
Long-Term
Capital Gain
Distributions
(Tax Basis) | | (B)
Ordinary Income
Distributions
(Tax Basis) | | Total
Distributions
(Tax Basis) | | |
| | 91.04% | | 8.96% | | 100.00% | | |
(A) and (B) are based on a percentage of the Series’ total distributions.
Growth and Income Series-17
Delaware Funds® by Macquarie
Board of trustees / directors and officers addendum
A mutual fund is governed by a Board of Trustees/Directors (“Trustees”), which has oversight responsibility for the management of a fund’s business affairs. Trustees establish procedures and oversee and review the performance of the investment manager, the distributor, and others who perform services for the fund. The independent fund trustees, in particular, are advocates for shareholder interests. Each trustee has served in that capacity since he or she was elected to or appointed to the Board of Trustees, and will continue to serve until his or her retirement or the election of a new trustee in his or her place. The following is a list of the Trustees and Officers with certain background and related information.
| | | | | | | | | | |
Name,
Address,
and Birth Date | | Position(s)
Held with
Fund(s) | | Length of Time
Served | | Principal
Occupation(s)
During the
Past Five Years | | Number of
Portfolios in Fund
Complex Overseen
by Trustee
or Officer | | Other
Directorships
Held by
Trustee
or Officer |
INTERESTED TRUSTEE | | | | | | | | |
| | | | | |
Shawn K. Lytle1
2005 Market Street Philadelphia, PA 19103 February 1970 | | President,
Chief Executive Officer, and Trustee | | President and Chief Executive Officer since August 2015 Trustee since
September 2015 | | President — Macquarie Investment Management2
(June 2015-Present) Regional Head of Americas — UBS Global
Asset Management
(April 2010-May 2015) | | 95 | | Trustee —
UBS Relationship Funds,
SMA Relationship Trust,
and UBS Funds
(May 2010–April 2015) |
INDEPENDENT TRUSTEES | | | | | | | | |
| | | | | |
Thomas L. Bennett
2005 Market Street Philadelphia, PA 19103 October 1947 | | Chair and Trustee | | Trustee since
March 2005 Chair since March 2015 | | Private Investor (March 2004–Present) | | 95 | | None |
Jerome D. Abernathy 2005 Market Street Philadelphia, PA 19103 July 1959 | | Trustee | | Since
January 2019 | | Managing Member, Stonebrook Capital Management, LLC
(financial technology: macro factors and databases)
(January 1993–Present) | | 95 | | None |
Ann D. Borowiec 2005 Market Street Philadelphia, PA 19103 November 1958 | | Trustee | | Since
March 2015 | | Chief Executive Officer, Private Wealth Management (2011–2013) and Market Manager,
New Jersey Private Bank (2005–2011) —
J.P. Morgan Chase & Co. | | 95 | | Director —
Banco Santander International (October 2016–December 2019) Director — Santander Bank, N.A. (December 2016–December 2019) |
Joseph W. Chow 2005 Market Street Philadelphia, PA 19103 January 1953 | | Trustee | | Since
January 2013 | | Private Investor (April 2011–Present) | | 95 | | Director and Audit Committee Member — Hercules Technology Growth Capital, Inc. (July 2004–July 2014) |
Growth and Income Series-18
| | | | | | | | | | |
Name,
Address,
and Birth Date | | Position(s)
Held with
Fund(s) | | Length of Time
Served | | Principal
Occupation(s)
During the
Past Five Years | | Number of
Portfolios in Fund
Complex Overseen
by Trustee
or Officer | | Other
Directorships
Held by
Trustee
or Officer |
John A. Fry 2005 Market Street Philadelphia, PA 19103 May 1960 | | Trustee | | Since
January 2001 | | President — Drexel University (August 2010–Present) President — Franklin & Marshall College (July 2002–July 2010) | | 95 | | Director; Compensation Committee and Governance Committee Member — Community Health Systems (May 2004–Present) Director — Drexel Morgan & Co. (2015–Present) Director and Audit Committee Member — vTv Therapeutics LLC (2017–Present) Director and Audit Committee Member — FS Credit Real Estate Income Trust, Inc. (2018–Present) Director — Federal Reserve Bank of Philadelphia (January 2020–Present) |
Lucinda S. Landreth 2005 Market Street Philadelphia, PA 19103 June 1947 | | Trustee | | Since
March 2005 | | Private Investor (2004–Present) | | 95 | | None |
Frances A. Sevilla-Sacasa
2005 Market Street Philadelphia, PA 19103 January 1956 | | Trustee | | Since
September 2011 | | Private Investor (January 2017-Present) Chief Executive Officer — Banco Itaú International (April 2012–December 2016) Executive Advisor to Dean (August 2011–March 2012) and Interim Dean (January 2011–July 2011) — University of Miami School of Business Administration President — U.S. Trust, Bank of America Private Wealth Management (Private Banking) (July 2007–December 2008) | | 95 | | Trust Manager and Audit Committee Chair — Camden Property Trust (August 2011–Present) Director; Strategic Planning and Reserves Committee and Nominating and Governance Committee Member — Callon Petroleum Company (December 2019–Present) Director; Audit Committee Member — Carrizo Oil & Gas, Inc. (March 2018–December 2019) |
Thomas K. Whitford 2005 Market Street Philadelphia, PA 19103 March 1956 | | Trustee | | Since
January 2013 | | Vice Chairman (2010–April 2013) — PNC Financial Services Group | | 95 | | Director — HSBC North America Holdings Inc. (December 2013-Present) Director — HSBC USA Inc. (July 2014-Present) Director — HSBC Bank USA, National Association (July 2014-March 2017) Director — HSBC Finance Corporation (December 2013-April 2018) |
Growth and Income Series-19
| | | | | | | | | | |
Name,
Address,
and Birth Date | | Position(s)
Held with
Fund(s) | | Length of Time
Served | | Principal
Occupation(s)
During the
Past Five Years | | Number of
Portfolios in Fund
Complex Overseen
by Trustee
or Officer | | Other
Directorships
Held by
Trustee
or Officer |
Christianna Wood 2005 Market Street Philadelphia, PA 19103 March 1956 | | Trustee | | Since
January 2019 | | Chief Executive Officer and President — Gore Creek Capital, Ltd. (August 2009–Present) | | 95 | | Director; Finance Committee and Audit Committee Member — H&R Block Corporation (July 2008–Present) Director; Chair of Investments Committee and Audit Committee Member — Grange Insurance (2013–Present) Trustee; Chair of Nominating and Governance Committee and Audit Committee Member — The Merger Fund (2013–Present), The Merger Fund VL (2013–Present); WCM Alternatives: Event-Driven Fund (2013–Present), and WCM Alternatives: Credit Event Fund (December 2017–Present) Director; Chair of Governance Committee and Audit Committee Member — International Securities Exchange (2010–2016) |
Janet L. Yeomans 2005 Market Street Philadelphia, PA 19103 July 1948 | | Trustee | | Since
April 1999 | | Vice President and Treasurer (January 2006–July 2012), Vice President — Mergers & Acquisitions (January 2003–January 2006), and Vice President and Treasurer (July 1995–January 2003) — 3M Company | | 95 | | Director; Personnel and Compensation Committee Chair; Member of Nominating, Investments, and Audit Committees for various periods throughout directorship — Okabena Company (2009-2017) |
Growth and Income Series-20
| | | | | | | | | | |
Name,
Address,
and Birth Date | | Position(s)
Held with
Fund(s) | | Length of Time
Served | | Principal
Occupation(s)
During the
Past Five Years | | Number of
Portfolios in Fund
Complex Overseen
by Trustee
or Officer | | Other
Directorships
Held by
Trustee
or Officer |
OFFICERS | | | | | | | | | | |
David F. Connor
2005 Market Street
Philadelphia, PA 19103 December 1963 | | Senior Vice President, General Counsel, and Secretary | | Senior Vice President, since May 2013; General Counsel since May 2015; Secretary since October 2005 | | David F. Connor has served in various capacities at different times at Macquarie Investment Management. | | 95 | | None3 |
Daniel V. Geatens
2005 Market Street
Philadelphia, PA 19103 October 1972 | | Vice President and Treasurer | | Vice President and Treasurer since October 2007 | | Daniel V. Geatens has served in various capacities at different times at Macquarie Investment Management. | | 95 | | None3 |
Richard Salus
2005 Market Street
Philadelphia, PA 19103 October 1963 | | Senior Vice President and Chief Financial Officer | | Senior Vice President and Chief Financial Officer since November 2006 | | Richard Salus has served in various capacities at different times at Macquarie Investment Management. | | 95 | | None |
| 1 | Shawn K. Lytle is considered to be an “Interested Trustee” because he is an executive officer of the Fund’s(s’) investment advisor. |
| 2 | Macquarie Investment Management is the marketing name for Macquarie Management Holdings, Inc. and its subsidiaries, including the Fund’s(s’) investment advisor, principal underwriter, and its transfer agent. |
| 3 | David F. Connor and Daniel V. Geatens serve in similar capacities for the six portfolios of the Optimum Fund Trust, which have the same investment advisor, principal underwriter, and transfer agent as the registrant. Mr. Geatens also serves as the Chief Financial Officer of the Optimum Fund Trust and he is the Chief Financial Officer and Treasurer for Macquarie Global Infrastructure Total Return Fund Inc. |
The Statement of Additional Information for the Fund(s) includes additional information about the Trustees and Officers and is available, without charge, upon request by calling 800523-1918.
Growth and Income Series-21
| | | | |
| | |
| | | | |
| | The Series files its complete schedule of portfolio holdings with the Securities and Exchange Commission (SEC) for the first and third quarters of each fiscal year on FormN-Q or FormN-PORT (available for filings after March 31, 2019). The Series’ FormsN-Q or FormsN-PORT, as well as a description of the policies and procedures that the Series uses to determine how to vote proxies (if any) relating to portfolio securities, are available without charge (i) upon request, by calling 800523-1918; and (ii) on the SEC’s website at sec.gov. In addition, a description of the policies and procedures that the Series uses to determine how to vote proxies (if any) relating to portfolio securities and the Schedule of Investments included in the Series’ most recent FormN-Q or FormN-PORT are available without charge on the Series’ website at delawarefunds.com/vip/literature. The Series’ FormsN-Q and FormsN-PORT may be reviewed and copied at the SEC’s Public Reference Room in Washington, D.C.; information on the operation of the Public Reference Room may be obtained by calling 800SEC-0330. Information (if any) regarding how the Series voted proxies relating to portfolio securities during the most recently disclosed12-month period ended June 30 is available without charge (i) through the Series’ website at delawarefunds.com/proxy; and (ii) on the SEC’s website at sec.gov. | | |
| | |
| AR-VIPGI 22494 (2/20) (1076649) | | Growth and IncomeSeries-22 |
Delaware VIP® Trust
Delaware VIP Growth Equity Series
(formerly, First Investors Life Series Select Growth Fund)
December 31, 2019
|
Beginning on or about June 1, 2021, as permitted by regulations adopted by the Securities and Exchange Commission, paper copies of your Series’ shareholder reports will no longer be sent to you by mail, unless you specifically request them from the Series or from your financial intermediary, such as a broker/dealer, bank, or insurance company. Instead, you will be notified by mail each time a report is posted on the website and provided with a link to access the report. If you already elected to receive shareholder reports electronically, you will not be affected by this change and you do not need to take any action. You may elect to receive paper copies of all future shareholder reports free of charge. You can inform the Series that you wish to continue receiving paper copies of your shareholder reports by contacting us at 800523-1918. If you own these shares through a financial intermediary, you may contact your financial intermediary to elect to continue to receive paper copies of your shareholder reports. Your election to receive reports in paper will apply to all funds held with the Delaware Funds® by Macquarie or your financial intermediary. |

Table of contents
Other than Macquarie Bank Limited (MBL), none of the entities noted are authorized deposit-taking institutions for the purposes of the Banking Act 1959 (Commonwealth of Australia). The obligations of these entities do not represent deposits or other liabilities of MBL. MBL does not guarantee or otherwise provide assurance in respect of the obligations of these entities, unless noted otherwise. The Series is governed by US laws and regulations.
Unless otherwise noted, views expressed herein are current as of Dec. 31, 2019, and subject to change for events occurring after such date.
The Series is not FDIC insured and is not guaranteed. It is possible to lose the principal amount invested.
Advisory services provided by Delaware Management Company, a series of Macquarie Investment Management Business Trust (MIMBT), a US registered investment advisor.
The Series is distributed byDelaware Distributors, L.P.(DDLP), an affiliate of MIMBT and Macquarie Group Limited. Macquarie Investment Management (MIM) is the marketing name for certain companies comprising the asset management division of Macquarie Group Limited and its subsidiaries and affiliates worldwide.
This material may be used in conjunction with the offering of shares in Delaware VIP® Growth Equity Series only if preceded or accompanied by the Series’ current prospectus or the summary prospectus.
© 2020 Macquarie Management Holdings, Inc.
All third-party marks cited are the property of their respective owners.
| | |
Delaware VIP®Trust — Delaware VIP Growth Equity Series |
Portfolio management review | | January 7, 2020 (Unaudited) |
The investment objective of the Series is to seek long-term growth of capital.
On April 6, 2019, Foresters Investment Management Company, Inc. (FIMCO), the investment adviser to the First Investors Funds, entered into an agreement with Macquarie Management Holdings, Inc. (MMHI), whereby MMHI, on behalf of its affiliate Delaware Management Company (DMC), a series of Macquarie Investment Management Business Trust (MIMBT), would acquire FIMCO’s asset management business (the “Transaction”). In connection with the Transaction, the Board of Trustees of the First Investors Trusts and the First Investors Fund shareholders approved, pursuant to an Agreement and Plan of Reorganization (the “Agreement”), the transfer of all assets and liabilities of each First Investors Fund to a corresponding, newly formed fund in the Delaware Funds® by Macquarie family of funds. The Transaction closed on Oct. 4, 2019.
Smith Asset Management Group, L.P. (Smith), a US registered investment advisor, is thesub-advisor to Delaware VIP Growth Equity Series (“the Series”). Assub-advisor, Smith is responsible forday-to-day management of the Series’ assets. Although Smith serves assub-advisor, the investment manager, DMC, a series of MIMBT, has ultimate responsibility for all investment advisory services.
For the fiscal year ended Dec. 31, 2019, the Series’ Standard Class shares gained 24.35%. This figure reflects all dividends reinvested. For the same period, the Series’ benchmark, the Russell 1000® Growth Index, gained 36.39%. The Series changed its broad-based index from the Russell 3000® Growth Index to the Russell 1000 Growth Index as of Jan. 31, 2019. The Series elected to use the new index because it more closely reflects the Series’ investment strategy.
The fiscal year ended Dec. 31, 2019 finished with a strong final quarter that capped off an annual return for US large cap stocks that ranks in the top 5% historically. Investors’ mood at the end of the12-month period was 180 degrees from the pessimism that prevailed at the end of 2018. With little earnings growth during 2019, the surge in market performance was almost wholly due to an increase in valuations. The composition of market returns deviated from recent years in that the advance was more broad-based, companies with foreign earnings made a comeback, and investors seemed to pay attention to valuations toward the end of the year.
The US economy in 2019 was surprisingly resilient considering the multitude of headwinds. Trade tensions and a global slowdown hurt business confidence, which in turn slowed capital spending. The labor market was surprisingly robust given the aging expansion, with wages steadily climbing. This combination helped consumers stay optimistic, making them the primary support for a tepid economic result. (Source: Bloomberg.)
Within the Series, financials was the strongest-performing sector on an absolute basis. The information technology sector was the largest detractor, at the sector level, from Series’ performance for the fiscal year due to adverse stock selection, while communication services was the weakest-performing sector on an absolute basis.
The Series’ strongest-performing holding for the year was general merchandise retailerTarget Corp.Target reported 19%year-on-year earnings growth during 2019; it had projected just 6% at the beginning of the year. Healthy store traffic and growth in digital-channel sales drove results.
The leading performers in the information technology sector wereCadence Design Systems Inc.andFortinet Inc.Electronic product-design solutions provider Cadence Design Systems has been a long-time performer, and it did not disappoint this year. Security software provider Fortinet has been a frontrunner in the small- andmedium-size markets with its unified threat management system that packages multiple security solutions into a single affordable offering. We believe the company is well positioned to capitalize on the ever-increasing complexity of cyber threats.
Among underperformers in the information technology sector, enterprise data storage systems supplierNetApp Inc.pre-announced results early in the second quarter, sending shares sharply lower as investors were caught off guard by a dramatic reduction in its fiscal year 2020 revenue outlook. NetApp cited a significant global slowdown in technology hardware spending due to trade and economic uncertainty.
However, the largest detractor from the Series’ performance was its underweight position in leading performer and large benchmark weightApple Inc.For the year, Apple averaged a 7% weight in the benchmark, well above the max position weight the Series will hold in any security due to risk-control guidelines. Consequently, Apple detracted meaningfully from Series performance despite being a strong absolute performer.
Communication services sector holdingTripAdvisor Inc.was the weakest individual performer. TripAdvisor is the largest source of user-generated travel reviews for hotels, restaurants, and attractions. However, the company has had difficulty transforming this volume of page visits into consistent profits. Overall, it appears unlikely to us that the company can exceed expectations, and we exited the Series’ position.
The Series’ overweight in the healthcare sector proved a significant headwind as the sector struggled with regulatory and fiscal-policy concerns.
Headlines tend to be sensational, in our view, but the US economy appears likely to muddle through 2020 at a tepid pace without tipping over into recession. Consumers are liquid and their debt-service is manageable. Homebuilding is on the rise due to low mortgage rates. Less trade uncertainty may
|
| Unless otherwise noted, views expressed herein are current as of Dec. 31, 2019, and subject to change. |
Growth Equity Series-1
| | |
Delaware VIP®Trust — Delaware VIP Growth Equity Series |
Portfolio management review (continued) | | January 7, 2020 (Unaudited) |
give businesses more confidence to invest. The US Federal Reserve looks to be on hold for the near term, and central banks around the world have been providing access to liquidity. More business investment is needed for the US economy to meet the Trump administration’s growth targets.
We maintain our belief that equities have the potential to generate healthy returns going forward as economic growth and supportive monetary policy provide a solid foundation for continued earnings growth by the companies the Series holds. Likewise, we continue to believe that our focus on high-quality companies with the potential to grow earnings beyond market expectations is the key to generating excess returns over the long term.
|
| Unless otherwise noted, views expressed herein are current as of Dec. 31, 2019, and subject to change. |
Growth Equity Series-2
Delaware VIP® Trust — Delaware VIP Growth Equity Series
Performance summary (Unaudited)
The performance quoted represents past performance and does not guarantee future results. Investment return and principal value of an investment will fluctuate so that shares, when redeemed, may be worth more or less than their original cost. Current performance may be lower or higher than the performance quoted.
Carefully consider the Series’ investment objectives, risk factors, charges, and expenses before investing. This and other information can be found in the Series’ prospectus and its summary prospectus, which may be obtained by visiting delawarefunds.com/vip/literature or calling 800523-1918. Investors should read the prospectus and the summary prospectus carefully before investing.
| | | | | | | | | | | | | | | | | | | | |
Delaware VIP Growth Equity Series | | | | | | | | | | | | | | | | | | | | |
Average annual total returns | | | | | | | | | | | | | | | | | | | | |
| For periods ended December 31, 2019 | | 1 year | | | 3 year | | | 5 year | | | 10 year | | | Lifetime | |
Standard Class shares (commenced operations on Nov. 8, 1999) | | | +24.35% | | | | +16.69% | | | | +11.27% | | | | +14.05% | | | | — | |
| | | | | | | | | | | | | | | | | | | | |
Russell 1000 Growth Index (current benchmark) | | | +36.39% | | | | +20.49% | | | | +14.63% | | | | +15.22% | | | | — | |
| | | | | | | | | | | | | | | | | | | | |
Russell 3000 Growth Index (former benchmark) | | | +35.85% | | | | +19.89% | | | | +14.23% | | | | +15.05% | | | | — | |
Returns reflect the reinvestment of all distributions. Please see page 4 for a description of the indices.
As described in the Series’ most recent prospectus, the net expense ratio for Standard Class shares of the Series was 0.76%, while total operating expenses for Standard Class shares were 0.76%. The management fee for Standard Class shares was 0.65%. The Series’ investment manager, Delaware Management Company (Manager), has contractually agreed to waive all or a portion of its investment advisory fees and/or pay/reimburse expenses (excluding any12b-1 fees, acquired fund fees and expenses, taxes, interest, short sale and dividend interest expenses, brokerage fees, certain insurance costs, and nonroutine expenses or costs, including, but not limited to, those relating to reorganizations, litigation, conducting shareholder meetings, and liquidations) in order to prevent annual series operating expenses from exceeding 0.80% of the Series’ average daily net assets from Oct. 4, 2019 through Dec. 31, 2019.* Please see the most recent prospectus and any applicable supplement(s) for additional information on these fee waivers and/or reimbursements. Please see the “Financial highlights” section in this report for the most recent expense ratios.
Earnings from a variable annuity or variable life investment compoundtax-free until withdrawal, and as a result, no adjustments were made for income taxes.
Expense limitations were in effect for Standard Class shares during certain periods shown in the Series performance table above and in the Performance of a $10,000 Investment graph on the next page.
Performance data do not reflect insurance fees related to a variable annuity or variable life investment or the deferred sales charge that would apply to certain withdrawals of investments held for fewer than eight years. Performance shown here would have been reduced if such fees were included and the expense limitation removed. For more information about fees, consult your variable annuity or variable life prospectus.
Investments in variable products involve risk.
Investments in small and/ormedium-sized companies typically exhibit greater risk and higher volatility than larger, more established companies.
Narrowly focused investments may exhibit higher volatility than investments in multiple industry sectors.
Please read both the contract and underlying prospectus for specific details regarding the product’s risk profile.
*The aggregate contractual waiver period covering this report is from Oct. 4, 2019 through Oct. 31, 2021.
Growth Equity Series-3
Delaware VIP® Growth Equity Series
Performance summary (Unaudited) (continued)
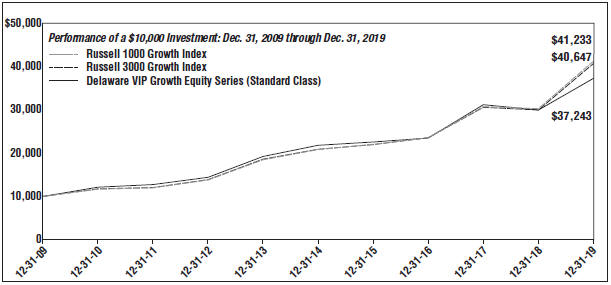
| | | | | | |
| For period beginning Dec. 31, 2009 through Dec. 31, 2019 | | Starting value | | Ending value |
-- Russell 1000 Growth Index | | $10,000 | | $41,233 |
-- Russell 3000 Growth Index | | $10,000 | | $40,647 |
–– Delaware VIP Growth Equity Series (Standard Class) | | $10,000 | | $37,243 |
The graph shows a $10,000 investment in the Delaware VIP Growth Equity Series Standard Class shares for the period from Dec. 31, 2009 through Dec. 31, 2019.
The graph also shows $10,000 invested in the Russell 1000 Growth Index and the Russell 3000 Growth Index for the period from Dec. 31, 2009 through Dec. 31, 2019.
The Russell 1000 Growth Index measures the performance of thelarge-cap growth segment of the US equity universe. It includes those Russell 1000 companies with higherprice-to-book ratios and higher forecasted growth values.
The Russell 3000 Growth Index measures the performance of the broad growth segment of the US equity universe. It includes those Russell 3000 companies with higherprice-to-book ratios and higher forecasted growth values.
Frank Russell Company is the source and owner of the trademarks, service marks and copyrights related to the Russell Indexes. Russell® is a trademark of Frank Russell Company.
Index performance returns do not reflect any management fees, transaction costs or expenses. Indices are unmanaged and one cannot invest directly in an index.
Past performance is not a guarantee of future results.
Growth Equity Series-4
Delaware VIP® Trust — Delaware VIP Growth Equity Series
Disclosure of Series expenses
For thesix-month period from July 1, 2019 to December 31, 2019 (Unaudited)
As a shareholder of the Series, you incur ongoing costs, which may include management fees; distribution and service(12b-1) fees; and other Series expenses. This example is intended to help you understand your ongoing costs (in dollars) of investing in the Series and to compare these costs with the ongoing costs of investing in other mutual funds.
The example is based on an investment of $1,000 invested at the beginning of the period and held for the entiresix-month period from July 1, 2019 to Dec. 31, 2019.
Actual expenses
The first section of the table shown, “Actual Series return,” provides information about actual account values and actual expenses. You may use the information in this section of the table, together with the amount you invested, to estimate the expenses that you paid over the period. Simply divide your account value by $1,000 (for example, an $8,600 account value divided by $1,000 = 8.6), then multiply the result by the number in the first section under the heading entitled “Expenses Paid During Period” to estimate the expenses you paid on your account during the period.
Hypothetical example for comparison purposes
The second section of the table shown, “Hypothetical 5% return,” provides information about hypothetical account values and hypothetical expenses based on the Series’ actual expense ratio and an assumed rate of return of 5% per year before expenses, which is not the Series’ actual return. The hypothetical account values and expenses may not be used to estimate the actual ending account balance or expenses you paid for the period. You may use this information to compare the ongoing costs of investing in the Series and other funds. To do so, compare this 5% hypothetical example with the 5% hypothetical examples that appear in the shareholder reports of other funds.
Please note that the expenses shown in the table are meant to highlight your ongoing costs only. As a shareholder of the Series, you do not incur any transaction costs, such as sales charges (loads), redemption fees or exchange fees, but shareholders of other funds may incur such costs. Also, the fees related to the variable annuity investment or the deferred sales charge that could apply have not been included. Therefore, the second section of the table is useful in comparing ongoing costs only, and will not help you determine the relative total costs of owning different funds. The Series’ expenses shown in the table reflect fee waivers in effect and assume reinvestment of all dividends and distributions.
Expense analysis of an investment of $1,000
| | | | | | | | | | |
| | | Beginning
Account
Value
7/1/19 | | Ending
Account
Value
12/31/19 | | Annualized
Expense
Ratio | | Expenses
Paid During
Period
7/1/19 to
12/31/19* | |
| |
Actual Series return† | | | | |
Standard Class | | $1,000.00 | | $1,091.80 | | 0.83% | | | $4.38 | |
|
Hypothetical 5% return(5% return before expenses) | |
Standard Class | | $1,000.00 | | $1,021.02 | | 0.83% | | | $4.23 | |
*“Expenses Paid During Period” are equal to the Series’ annualized expense ratio, multiplied by the average account value over the period, multiplied by 184/365 (to reflect theone-half year period).
| † | Because actual returns reflect only the most recentsix-month period, the returns shown may differ significantly from fiscal year returns. |
In addition to the Series’ expenses reflected above, the Series also indirectly bears its portion of the fees and expenses of the investment companies (Underlying Funds) in which it invests. The table above does not reflect the expenses of the Underlying Funds.
Growth Equity Series-5
Delaware VIP® Trust — Delaware VIP Growth Equity Series
Security type / sector allocation and top 10 equity holdings
As of December 31, 2019 (Unaudited)
Sector designations may be different than the sector designations presented in other Series materials. The sector designations may represent the investment manager’s internal sector classifications.
| | | | |
| Security type / sector | | Percentage of net assets |
Common Stock² | | | 99.53 | % |
Communication Services | | | 9.11 | % |
Consumer Discretionary | | | 11.97 | % |
Consumer Staples | | | 4.20 | % |
Energy | | | 0.70 | % |
Financials | | | 5.53 | % |
Healthcare | | | 18.89 | % |
Industrials | | | 12.05 | % |
Information Technology1 | | | 37.08 | % |
Short-Term Investments | | | 0.55 | % |
Total Value of Securities | | | 100.08 | % |
Liabilities Net of Receivables and Other Assets | | | (0.08 | %) |
Total Net Assets | | | 100.00 | % |
| ² | Narrow industries are utilized for compliance purposes for diversification whereas broad sectors are used for financial reporting. |
| 1 | To monitor compliance with the Series’ concentration guidelines as described in the Series’ Prospectus and Statement of Additional Information, the Information Technology sector (as disclosed herein for financial reporting purposes) is subdivided into a variety of “industries” (in accordance with the requirements of the Investment Company Act of 1940, as amended). The Information Technology sector consisted of Commercial Services, Computers, Office/Business Equipments, Software, and Telecommunications. As of Dec. 31, 2019, such amounts, as a percentage of total net assets, were 6.29%, 9.56%, 3.28%, 15.71%, and 2.24%, respectively. The percentage in any such single industry will comply with the Series’ concentration policy even if the percentages in the Information Technology sector for financial reporting purposes may exceed 25%. |
Holdings are for informational purposes only and are subject to change at any time. They are not a recommendation to buy, sell, or hold any security.
| | | | |
| Top 10 equity holdings | | Percentage of net assets |
Adobe | | | 4.23 | % |
Microsoft | | | 4.06 | % |
Fortinet | | | 4.00 | % |
Alphabet Class A | | | 3.79 | % |
Cadence Design Systems | | | 3.74 | % |
Zebra Technologies Class A | | | 3.28 | % |
Automatic Data Processing | | | 3.26 | % |
Facebook Class A | | | 3.15 | % |
PayPal Holdings | | | 3.03 | % |
Apple | | | 3.00 | % |
Growth Equity Series-6
Delaware VIP® Trust — Delaware VIP Growth Equity Series
Schedule of investments
December 31, 2019
| | | | | | | | |
| | | Number of
shares | | | Value (US $) | |
Common Stock – 99.53%² | | | | | |
Communication Services – 9.11% | | | | | |
Alphabet Class A † | | | 2,600 | | | $ | 3,482,414 | |
Comcast Class A | | | 44,500 | | | | 2,001,165 | |
Facebook Class A † | | | 14,100 | | | | 2,894,025 | |
| | | | | | | | |
| | | | | | | 8,377,604 | |
| | | | | | | | |
Consumer Discretionary – 11.97% | | | | | |
AutoZone † | | | 1,900 | | | | 2,263,489 | |
Burlington Stores † | | | 9,800 | | | | 2,234,694 | |
Deckers Outdoor † | | | 14,600 | | | | 2,465,356 | |
Dunkin’ Brands Group | | | 23,500 | | | | 1,775,190 | |
Target | | | 17,671 | | | | 2,265,599 | |
| | | | | | | | |
| | | | | | | 11,004,328 | |
| | | | | | | | |
Consumer Staples – 4.20% | | | | | |
Procter & Gamble | | | 15,526 | | | | 1,939,197 | |
Walmart | | | 16,228 | | | | 1,928,536 | |
| | | | | | | | |
| | | | | | | 3,867,733 | |
| | | | | | | | |
Energy – 0.70% | | | | | |
Chevron | | | 5,360 | | | | 645,934 | |
| | | | | | | | |
| | | | | | | 645,934 | |
| | | | | | | | |
Financials – 5.53% | | | | | |
Bank of America | | | 58,100 | | | | 2,046,282 | |
Discover Financial Services | | | 16,390 | | | | 1,390,200 | |
US Bancorp | | | 27,800 | | | | 1,648,262 | |
| | | | | | | | |
| | | | | | | 5,084,744 | |
| | | | | | | | |
Healthcare – 18.89% | | | | | |
Baxter International | | | 26,500 | | | | 2,215,930 | |
Biogen † | | | 5,500 | | | | 1,632,015 | |
Bristol-Myers Squibb | | | 34,900 | | | | 2,240,231 | |
Centene † | | | 42,900 | | | | 2,697,123 | |
Edwards Lifesciences † | | | 9,300 | | | | 2,169,597 | |
Eli Lilly & Co. | | | 19,986 | | | | 2,626,760 | |
Merck & Co. | | | 18,700 | | | | 1,700,765 | |
Varian Medical Systems † | | | 14,700 | | | | 2,087,547 | |
| | | | | | | | |
| | | | | | | 17,369,968 | |
| | | | | | | | |
Industrials – 12.05% | | | | | |
Alaska Air Group | | | 29,500 | | | | 1,998,625 | |
Dover | | | 22,500 | | | | 2,593,350 | |
EMCOR Group | | | 22,200 | | | | 1,915,860 | |
Huntington Ingalls Industries | | | 9,736 | | | | 2,442,568 | |
| | | | | | | | |
| | | Number of
shares | | | Value (US $) | |
Common Stock²(continued) | |
Industrials (continued) | | | | | | | | |
Rockwell Automation | | | 10,500 | | | $ | 2,128,035 | |
| | | | | | | | |
| | | | | | | 11,078,438 | |
| | | | | | | | |
Information Technology – 37.08% | | | | | |
Adobe † | | | 11,800 | | | | 3,891,757 | |
Akamai Technologies † | | | 21,600 | | | | 1,865,808 | |
Apple | | | 9,400 | | | | 2,760,310 | |
Automatic Data Processing | | | 17,581 | | | | 2,997,561 | |
Cadence Design Systems † | | | 49,600 | | | | 3,440,256 | |
Ciena† | | | 48,300 | | | | 2,061,927 | |
EPAM Systems † | | | 11,100 | | | | 2,354,976 | |
Fortinet † | | | 34,457 | | | | 3,678,629 | |
Microsoft | | | 23,700 | | | | 3,737,490 | |
Oracle | | | 28,500 | | | | 1,509,930 | |
PayPal Holdings † | | | 25,800 | | | | 2,790,786 | |
Zebra Technologies Class A † | | | 11,800 | | | | 3,014,192 | |
| | | | | | | | |
| | | | | | | 34,103,622 | |
| | | | | | | | |
Total Common Stock
(cost $69,507,273) | | | | | | | 91,532,371 | |
| | | | | | | | |
| |
Short-Term Investments – 0.55% | | | | | |
Money Market Mutual Funds – 0.55% | | | | | |
BlackRock FedFund – Institutional Shares(seven-day effective yield 1.52%) | | | 101,491 | | | | 101,491 | |
Fidelity Investments Money Market Government Portfolio – Class I(seven-day effective yield 1.49%) | | | 101,492 | | | | 101,492 | |
GS Financial Square Government Fund – Institutional Shares(seven-day effective yield 1.51%) | | | 101,491 | | | | 101,491 | |
Morgan Stanley Government Portfolio – Institutional Share Class(seven-day effective yield 1.48%) | | | 101,491 | | | | 101,491 | |
State Street Institutional US Government Money Market Fund – Investor Class(seven-day effective yield 1.45%) | | | 101,491 | | | | 101,491 | |
| | | | | | | | |
Total Short-Term Investments
(cost $507,456) | | |
| 507,456
|
|
| | | | | | | | |
| | | | |
Total Value of Securities – 100.08%
(cost $70,014,729) | | $ | 92,039,827 | |
| | | | |
| ² | Narrow industries are utilized for compliance purposes for diversification whereas broad sectors are used for financial reporting. |
| † | Non-income producing security. |
GS – Goldman Sachs
See accompanying notes, which are an integral part of the financial statements.
Growth Equity Series-7
| | | | |
| Delaware VIP®Trust — Delaware VIP Growth Equity Series | |
| Statement of assets and liabilities | | | December 31, 2019 | |
| | | | |
Assets: | | | | |
Investments, at value1 | | $ | 92,039,827 | |
Dividends and interest receivable | | | 54,765 | |
Receivable for series shares sold | | | 4,458 | |
Other assets | | | 2,044 | |
| | | | |
Total assets | | | 92,101,094 | |
| | | | |
Liabilities: | | | | |
Investment management fees payable | | | 41,649 | |
Payable for series shares redeemed | | | 39,869 | |
Audit and tax fees payable | | | 38,047 | |
Accounting and administration expenses payable tonon-affiliates | | | 7,702 | |
Reports and statements to shareholders expenses payable tonon-affiliates | | | 6,138 | |
Other accrued expenses | | | 2,703 | |
Trustees’ fees and expenses payable | | | 873 | |
Accounting and administration expenses payable to affiliates | | | 597 | |
Dividend disbursing and transfer agent fees and expenses payable to affiliates | | | 582 | |
Pricing fees payable | | | 275 | |
Reports and statements to shareholders payable to affiliates | | | 143 | |
Legal fees payable to affiliates | | | 141 | |
| | | | |
Total liabilities | | | 138,719 | |
| | | | |
Total Net Assets | | $ | 91,962,375 | |
| | | | |
| |
Net Assets Consist of: | | | | |
Paid-in capital | | $ | 63,879,404 | |
Total distributable earnings (loss) | | | 28,082,971 | |
| | | | |
Total Net Assets | | $ | 91,962,375 | |
| | | | |
| |
Net Asset Value: | | | | |
Standard Class: | | | | |
Net assets | | $ | 91,962,375 | |
Shares of beneficial interest outstanding, unlimited authorization, no par | | | 5,563,633 | |
Net asset value per share | | $ | 16.53 | |
1Investments, at cost | | $ | 70,014,729 | |
See accompanying notes, which are an integral part of the financial statements.
Growth Equity Series-8
Delaware VIP® Trust —
Delaware VIP Growth Equity Series
Statement of operations
Year ended December 31, 2019
| | | | |
Investment Income: | | | | |
Dividends | | $ | 1,060,574 | |
Interest | | | 9,764 | |
| | | | |
| | | 1,070,338 | |
| | | | |
Expenses: | | | | |
Management fees | | | 619,321 | |
Audit and tax fees | | | 36,870 | |
Reports and statements to shareholders | | | 21,846 | |
Accounting and administration expenses | | | 12,341 | |
Legal fees | | | 8,714 | |
Trustees’ fees and expenses | | | 7,546 | |
Custodian fees | | | 5,720 | |
Dividend disbursing and transfer agent fees and expenses | | | 1,686 | |
Other | | | 5,467 | |
| | | | |
| | | 719,511 | |
Less expenses waived | | | (17,094 | ) |
Less expenses paid indirectly | | | (2,115 | ) |
| | | | |
Total operating expenses | | | 700,302 | |
| | | | |
Net Investment Income | | | 370,036 | |
| | | | |
| |
Net Realized and Unrealized Gain: | | | | |
Net realized gain on investments | | | 5,687,837 | |
Net change in unrealized appreciation (depreciation) of investments | | | 12,086,317 | |
| | | | |
Net Realized and Unrealized Gain | | | 17,774,154 | |
| | | | |
Net Increase in Net Assets Resulting from Operations | | $ | 18,144,190 | |
| | | | |
Delaware VIP Trust—
Delaware VIP Growth Equity Series
Statements of changes in net assets
| | | | | | | | |
| | | Year ended | |
| | | 12/31/19 | | | 12/31/18 | |
Increase (Decrease) in Net
Assets from Operations: | |
Net investment income | | $ | 370,036 | | | $ | 260,357 | |
Net realized gain | | | 5,687,837 | | | | 4,817,300 | |
Net change in unrealized appreciation (depreciation) | | | 12,086,317 | | | | (8,481,984 | ) |
| | | | | | | | |
Net increase (decrease) in net assets resulting from operations | | | 18,144,190 | | | | (3,404,327 | ) |
| | | | | | | | |
| | |
Dividends and Distributions to Shareholders from: | | | | | | | | |
Distributable earnings: | | | | | | | | |
Standard Class | | | (5,077,656 | ) | | | (5,263,578 | ) |
| | | | | | | | |
| |
Capital Share Transactions: | | | | | |
Proceeds from shares sold: | | | | | | | | |
Standard Class | | | 7,067,713 | | | | 11,136,982 | |
| | |
Net asset value of shares issued upon reinvestment of dividends and distributions: | | | | | | | | |
Standard Class | | | 5,077,656 | | | | 5,263,578 | |
| | | | | | | | |
| | | 12,145,369 | | | | 16,400,560 | |
| | | | | | | | |
Cost of shares redeemed: | | | | | | | | |
Standard Class | | | (6,878,222 | ) | | | (3,933,445 | ) |
| | | | | | | | |
Increase in net assets derived from capital share transactions | | | 5,267,147 | | | | 12,467,115 | |
| | | | | | | | |
Net Increase in Net Assets | | | 18,333,681 | | | | 3,799,210 | |
| | |
Net Assets: | | | | | | | | |
Beginning of year | | | 73,628,694 | | | | 69,829,484 | |
| | | | | | | | |
End of year | | $ | 91,962,375 | | | $ | 73,628,694 | |
| | | | | | | | |
See accompanying notes, which are an integral part of the financial statements.
Growth Equity Series-9
Delaware VIP® Trust — Delaware VIP Growth Equity Series
Financial highlights
Selected data for each share of the Series outstanding throughout each period were as follows:
| | | | | | | | | | | | | | | | | | | | |
| | | Delaware VIP Growth Equity Series Standard Class Year ended | |
| | | 12/31/191 | | | 12/31/18 | | | 12/31/17 | | | 12/31/16 | | | 12/31/15 | |
Net asset value, beginning of period | | $ | 14.14 | | | $ | 15.87 | | | $ | 13.37 | | | $ | 13.98 | | | $ | 14.34 | |
| | | | | |
Income (loss) from investment operations: | | | | | | | | | | | | | | | | | | | | |
Net investment income2 | | | 0.07 | | | | 0.05 | | | | 0.06 | | | | 0.08 | | | | 0.09 | |
Net realized and unrealized gain (loss) | | | 3.28 | | | | (0.57 | ) | | | 3.97 | | | | 0.36 | | | | 0.38 | |
| | | | | | | | | | | | | | | | | | | | |
Total from investment operations | | | 3.35 | | | | (0.52 | ) | | | 4.03 | | | | 0.44 | | | | 0.47 | |
| | | | | | | | | | | | | | | | | | | | |
| | | | | |
Less dividends and distributions from: | | | | | | | | | | | | | | | | | | | | |
Net investment income | | | (0.05 | ) | | | (0.06 | ) | | | (0.08 | ) | | | (0.09 | ) | | | (0.05 | ) |
Net realized gain | | | (0.91 | ) | | | (1.15 | ) | | | (1.45 | ) | | | (0.96 | ) | | | (0.78 | ) |
| | | | | | | | | | | | | | | | | | | | |
Total dividends and distributions | | | (0.96 | ) | | | (1.21 | ) | | | (1.53 | ) | | | (1.05 | ) | | | (0.83 | ) |
| | | | | | | | | | | | | | | | | | | | |
| | | | | |
Net asset value, end of period | | $ | 16.53 | | | $ | 14.14 | | | $ | 15.87 | | | $ | 13.37 | | | $ | 13.98 | |
| | | | | | | | | | | | | | | | | | | | |
| | | | | |
Total return3 | | | 24.35%4 | | | | (3.79% | ) | | | 32.80% | | | | 4.04% | | | | 3.21% | |
| | | | | |
Ratios and supplemental data: | | | | | | | | | | | | | | | | | | | | |
Net assets, end of period (000 omitted) | | | $91,962 | | | | $73,629 | | | | $69,829 | | | | $52,433 | | | | $47,997 | |
Ratio of expenses to average net assets5 | | | 0.82% | | | | 0.81% | | | | 0.81% | | | | 0.83% | | | | 0.83% | |
Ratio of expenses to average net assets prior to fees waived5 | | | 0.84% | | | | 0.81% | | | | 0.81% | | | | 0.83% | | | | 0.83% | |
Ratio of net investment income to average net assets | | | 0.43% | | | | 0.34% | | | | 0.40% | | | | 0.61% | | | | 0.65% | |
Ratio of net investment income to average net assets prior to fees waived | | | 0.41% | | | | 0.34% | | | | 0.40% | | | | 0.61% | | | | 0.65% | |
Portfolio turnover | | | 45% | | | | 31% | | | | 52% | | | | 64% | | | | 43% | |
| 1 | On Oct. 4, 2019, the First Investors Life Series Select Growth Fund shares were reorganized into Standard Class shares of the Series. See “Notes to financial statements.” The Standard Class shares financial highlights for the period prior to Oct. 4, 2019, reflect the performance of the First Investors Life Series Select Growth Fund shares. |
| 2 | The average shares outstanding method has been applied for per share information. |
| 3 | Total return is based on the change in net asset value of a share during the period and assumes reinvestment of dividends and distributions at net asset value. Total return does not include fees, charges, or expenses imposed by the variable annuity and life insurance contracts for which Delaware VIP Trust serves as an underlying investment vehicle. |
| 4 | Total return during the period reflects a waiver by the manager. Performance would have been lower had the waiver not been in effect. |
| 5 | Expense ratios do not include expenses of the Underlying Funds in which the Series invests. |
See accompanying notes, which are an integral part of the financial statements.
Growth Equity Series-10
Delaware VIP® Trust — Delaware VIP Growth Equity Series
Notes to financial statements
December 31, 2019
Delaware VIP Trust (Trust) is organized as a Delaware statutory trust. The Trust consists of 22 series, each of which is treated as a separate entity for certain matters under the Investment Company Act of 1940, as amended (1940 Act). These financial statements and the related notes pertain to Delaware VIP Growth Equity Series (Series). The Trust is anopen-end investment company. The Series is considered diversified under the 1940 Act and offers Standard Class shares. The Standard Class shares do not carry a distribution and service(12b-1) fee. The shares of the Series are sold only to separate accounts of life insurance companies.
Before the Series commenced operations, on Oct. 4, 2019, all of the assets and liabilities of the First Investors Life Series Select Growth Fund, its respective Predecessor Series (Predecessor Series) were transferred to the Series in atax-free reorganization as set forth in an agreement and plan of reorganization (each a Foresters Reorganization) between the Trust, on behalf of the Series, and Foresters Investment Management Company, Inc. (FIMCO), on behalf of the Predecessor Series. As a result of the Foresters Reorganization, the Series assumed the performance and accounting history of its Predecessor Series. Financial information included for the dates prior to the Foresters Reorganization is that of the Predecessor Series.
1. Significant Accounting Policies
The Series follows accounting and reporting guidance under Financial Accounting Standards Board (FASB) Accounting Standards Codification Topic 946, Financial Services – Investment Companies. The following accounting policies are in accordance with US generally accepted accounting principles (US GAAP) and are consistently followed by the Series.
Security Valuation — Equity securities, except those traded on the Nasdaq Stock Market LLC (Nasdaq), are valued at the last quoted sales price as of the time of the regular close of the New York Stock Exchange on the valuation date. Equity securities traded on the Nasdaq are valued in accordance with the Nasdaq Official Closing Price, which may not be the last sales price. If, on a particular day, an equity security does not trade, the mean between the bid and ask prices will be used, which approximates fair value.Open-end investment companies are valued at their published net asset value (NAV). Generally, other securities and assets for which market quotations are not readily available are valued at fair value as determined in good faith under the direction of the Trust’s Board of Trustees (Board). In determining whether market quotations are readily available or fair valuation will be used, various factors will be taken into consideration, such as market closures or suspension of trading in a security. Restricted securities are valued at fair value using methods approved by the Board.
Federal Income Taxes — No provision for federal income taxes has been made as the Series intends to continue to qualify for federal income tax purposes as a regulated investment company under Subchapter M of the Internal Revenue Code of 1986, as amended, and make the requisite distributions to shareholders. The Series evaluates tax positions taken or expected to be taken in the course of preparing the Series’ tax returns to determine whether the tax positions are“more-likely-than-not” of being sustained by the applicable tax authority. Tax positions not deemed to meet the“more-likely-than-not” threshold are recorded as a tax benefit or expense in the current year. Management has analyzed the Series’ tax positions taken or expected to be taken on the Series’ federal income tax returns through the year ended Dec. 31, 2019 and for all open tax years (years ended Dec. 31, 2016–Dec. 31, 2018), and has concluded that no provision for federal income tax is required in the Series’ financial statements. If applicable, the Series recognizes interest accrued on unrecognized tax benefits in interest expense and penalties in “Other” on the “Statement of operations.” During the year ended Dec. 31, 2019, the Series did not incur any interest or tax penalties.
Use of Estimates — The preparation of financial statements in conformity with US GAAP requires management to make estimates and assumptions that affect the fair value of investments, the reported amounts of assets and liabilities and disclosure of contingent assets and liabilities at the date of the financial statements, and the reported amounts of revenues and expenses during the reporting period. Actual results could differ from those estimates and the differences could be material.
Other — Expenses directly attributable to the Series are charged directly to the Series. Other expenses common to various funds within the Delaware Funds® by Macquarie (Delaware Funds) are generally allocated among such funds on the basis of average net assets. Management fees and certain other expenses are paid monthly. Security transactions are recorded on the date the securities are purchased or sold (trade date) for financial reporting purposes. Costs used in calculating realized gains and losses on the sale of investment securities are those of the specific securities sold. Dividend income is recorded on theex-dividend date and interest income is recorded on the accrual basis. Discounts and premiums on debt securities are accreted or amortized to interest income, respectively, over the lives of the respective securities using the effective interest method. The Series declares and pays distributions from net investment income and net realized gain on investments, if any, following the close of the fiscal year. The Series may distribute more frequently, if necessary for tax purposes. Dividends and distributions, if any, are recorded on theex-dividend date.
The Series receives earnings credits from its custodian when positive cash balances are maintained, which may be used to offset custody fees. The expenses paid under this arrangement are included on the “Statement of operations” under “Custodian fees” with the corresponding expenses offset included under “Less expenses paid indirectly.” For the year ended Dec. 31, 2019, the Series earned $2,115 under this arrangement.
The Series receives earnings credits from its transfer agent when positive cash balances are maintained, which may be used to offset transfer agent fees. If the amount earned is greater than $1, the expenses paid under this arrangement are included on the “Statement of operations” under “Dividend disbursing
Growth Equity Series-11
Delaware VIP® Growth Equity Series
Notes to financial statements (continued)
1. Significant Accounting Policies (continued)
and transfer agent fees and expenses” with the corresponding expenses offset included under “Less expenses paid indirectly.” There were no such earnings credits for the year ended Dec. 31, 2019.
2. Investment Management, Administration Agreements, and Other Transactions with Affiliates
In accordance with the terms of its investment management agreement, effective Oct. 4, 2019, the Series pays Delaware Management Company (DMC), a series of Macquarie Investment Management Business Trust and the investment manager, an annual fee which is calculated daily and paid monthly at the rates of 0.65% on the first $500 million of average daily net assets of the Series, 0.60% on the next $500 million, 0.55% on the next $1.5 billion, and 0.50% on average daily net assets in excess of $2.5 billion. Prior to Oct. 4, 2019, the Series paid FIMCO, an annual fee which was calculated daily and paid monthly at the rates of 0.75% on the first $250 million of average daily net assets of the Series, 0.72% on the next $250 million, 0.69% on the next $250 million, 0.66% on the next $500 million, 0.64% on the next $500 million, 0.62% on the next $500 million, and 0.60% on average daily net assets in excess of $2.25 billion.
DMC has contractually agreed to waive all or a portion of its investment advisory fees and/or pay/reimburse expenses (excluding any acquired fund fees and expenses, taxes, interest, short sale dividend and interest expenses, brokerage fees, certain insurance costs, and nonroutine expenses or costs, including, but not limited to, those relating to reorganizations, litigation, conducting shareholder meetings, and liquidations), do not exceed 0.80% of the Series’ average daily net assets from Oct. 4, 2019 through Dec. 31, 2019.* These waivers and reimbursements may only be terminated by agreement of DMC and the Series. The waivers and reimbursements are accrued daily and received monthly.
Effective Oct. 4, 2019, Smith Asset Management Group, L.P. (Smith) furnishes investmentsub-advisory services to the Series. For these services, DMC, not the Series, pays Smith a fee, which is based on 0.20% of the aggregate average daily net assets of the Series and Delaware Growth Equity Fund.
Effective Oct. 4, 2019, Delaware Investments Fund Services Company (DIFSC), an affiliate of DMC, provides fund accounting and financial administration oversight services to the Series. For these services, DIFSC’s fees are calculated daily and paid monthly based on the aggregate daily net assets of all funds within the Delaware Funds at the following annual rates: 0.00475% of the first $35 billion; 0.0040% of the next $10 billion; and 0.0025% of aggregate average daily net assets in excess of $45 billion (Total Fee). Each fund in the Delaware Funds pays a minimum of $4,000, which, in aggregate, is subtracted from the Total Fee. Each fund then pays its portion of the remainder of the Total Fee on a relative NAV basis. This amount is included on the “Statement of operations” under “Accounting and administration expenses.” For the period Oct. 4, 2019 through year ended Dec. 31, 2019, the Series was charged $1,721 for these services. Prior to Oct. 4, 2019, there were no fund accounting and financial administration oversight services for the Series.
Effective Oct. 4, 2019, DIFSC is also the transfer agent and dividend disbursing agent of the Series. For these services, DIFSC’s fees are calculated daily and paid monthly at the annual rate of 0.0075% of the Series’ average daily net assets. This amount is included on the “Statement of operations” under “Dividend disbursing and transfer agent fees and expenses.” For the period Oct. 4, 2019 through year ended Dec. 31, 2019, the Series was charged $1,605 for these services. Pursuant to asub-transfer agency agreement between DIFSC and BNY Mellon Investment Servicing (US) Inc. (BNYMIS), BNYMIS provides certainsub-transfer agency services to the Series.Sub-transfer agency fees are paid directly by the Series and are also included on the “Statement of operations” under “Dividend disbursing and transfer agent fees and expenses.” The fees that are calculated daily and paid as invoices are received on a monthly or quarterly basis. Prior to Oct. 4, 2019, Foresters Investor Services, Inc. was the transfer agent of the Series.
As provided in the investment management agreement, the Series bears a portion of the cost of resources shared with DMC, including the cost of internal personnel of DMC and/or its affiliates that provide legal, tax, and regulatory reporting services to the Series. For the period Oct. 4, 2019 through year ended Dec. 31, 2019, the Series was charged $438 for internal legal, tax, and regulatory reporting services provided by DMC and/or its affiliates’ employees. These amounts are included on the “Statement of operations” under “Legal fees.”
Trustees’ fees include expenses accrued by the Series for each Trustee’s retainer and meeting fees. Certain officers of DMC, DIFSC, and DDLP are officers and/or Trustees of the Trust. These officers and Trustees are paid no compensation by the Series.
In addition to the management fees and other expenses of the Series, the Series indirectly bears the investment management fees and other expenses of the investment companies (Underlying Funds) in which it invests. The amount of these fees and expenses incurred indirectly by the Series will vary based upon the expense and fee levels of the Underlying Funds and the number of shares that are owned of the Underlying Funds at different times.
*The aggregate contractual waiver period covering this report is from Oct. 4, 2019 through Oct. 31, 2021.
Growth Equity Series-12
Delaware VIP® Growth Equity Series
Notes to financial statements (continued)
3. Investments
For the year ended Dec. 31, 2019, the Series made purchases and sales of investment securities other than short-term investments as follows:
| | | | |
Purchases | | $ | 47,784,686 | |
Sales | | | 45,891,983 | |
The tax cost of investments includes adjustments to net unrealized appreciation (depreciation) which may not necessarily be final tax cost basis adjustments, but approximate the tax basis unrealized gains and losses that may be realized and distributed to shareholders. At Dec. 31, 2019, the cost and unrealized appreciation (depreciation) of investments for federal income tax purposes for the Series were as follows:
| | | | | | | | |
Cost of Investments | | Aggregate
Unrealized
Appreciation of Investments | | Aggregate
Unrealized
Depreciation of Investments | | Net Unrealized
Appreciation of Investments | | |
$70,014,729 | | $22,335,050 | | $(309,952) | | $22,025,098 |
US GAAP defines fair value as the price that the Series would receive to sell an asset or pay to transfer a liability in an orderly transaction between market participants at the measurement date under current market conditions. A three-level hierarchy for fair value measurements has been established based upon the transparency of inputs to the valuation of an asset or liability. Inputs may be observable or unobservable and refer broadly to the assumptions that market participants would use in pricing the asset or liability. Observable inputs reflect the assumptions that market participants would use in pricing the asset or liability based on market data obtained from sources independent of the reporting entity. Unobservable inputs reflect the reporting entity’s own assumptions about the assumptions that market participants would use in pricing the asset or liability based on the best information available under the circumstances. The Series’ investment in its entirety is assigned a level based upon the observability of the inputs which are significant to the overall valuation. The three-level hierarchy of inputs is summarized below.
| | | | |
| Level 1 | | – | | Inputs are quoted prices in active markets for identical investments. (Examples: equity securities,open-end investment companies, futures contracts, and exchange-traded options contracts) |
| | |
| Level 2 | | – | | Other observable inputs, including, but not limited to: quoted prices for similar assets or liabilities in markets that are active, quoted prices for identical or similar assets or liabilities in markets that are not active, inputs other than quoted prices that are observable for the assets or liabilities (such as interest rates, yield curves, volatilities, prepayment speeds, loss severities, credit risks, and default rates) or other market-corroborated inputs. (Examples: debt securities, government securities, swap contracts, foreign currency exchange contracts, foreign securities utilizing international fair value pricing, broker-quoted securities, and fair valued securities) |
| | |
| Level 3 | | – | | Significant unobservable inputs, including the Series’ own assumptions used to determine the fair value of investments. (Examples: broker-quoted securities and fair valued securities) |
Level 3 investments are valued using significant unobservable inputs. The Series may also use an income-based valuation approach in which the anticipated future cash flows of the investment are discounted to calculate fair value. Discounts may also be applied due to the nature or duration of any restrictions on the disposition of the investments. Valuations may also be based upon current market prices of securities that are comparable in coupon, rating, maturity, and industry. The derived value of a Level 3 investment may not represent the value which is received upon disposition and this could impact the results of operations.
The following table summarizes the valuation of the Series’ investments by fair value hierarchy levels as of Dec. 31, 2019:
| | | | |
| Securities | | Level 1 | |
Assets: | | | | |
Common Stock | | $ | 91,532,371 | |
Short-Term Investments | | | 507,456 | |
| | | | |
Total Value of Securities | | $ | 92,039,827 | |
| | | | |
During the year ended Dec. 31, 2019, there were no transfers between Level 1 investments, Level 2 investments, or Level 3 investments that had a significant impact to the Series. The Series’ policy is to recognize transfers between levels based on fair value at the beginning of the reporting period.
A reconciliation of Level 3 investments is presented when the Series has a significant amount of Level 3 investments at the beginning, interim, or end of the year in relation to the Series’ net assets. During the year ended Dec. 31, 2019, there were no Level 3 investments.
Growth Equity Series-13
Delaware VIP® Growth Equity Series
Notes to financial statements (continued)
4. Dividend and Distribution Information
Income and long-term capital gain distributions are determined in accordance with federal income tax regulations, which may differ from US GAAP. Additionally, distributions from net short-term gains on sales of investment securities are treated as ordinary income for federal income tax purposes. The tax character of dividends and distributions paid during the years ended Dec. 31, 2019 and 2018 was as follows:
| | | | | | | | |
| | | Year ended | |
| | | 12/31/19 | | | 12/31/18 | |
Ordinary income | | $ | 275,771 | | | $ | 243,760 | |
Long-term capital gain | | | 4,801,885 | | | | 5,019,818 | |
| | | | | | | | |
Total | | $ | 5,077,656 | | | $ | 5,263,578 | |
| | | | | | | | |
5. Components of Net Assets on a Tax Basis
As of Dec. 31, 2019, the components of net assets on a tax basis were as follows:
| | | | |
Shares of beneficial interest | | $ | 63,879,404 | |
Undistributed ordinary income | | | 370,036 | |
Undistributed long-term capital gains | | | 5,687,837 | |
Net unrealized appreciation on investments | | | 22,025,098 | |
| | | | |
Net assets | | $ | 91,962,375 | |
| | | | |
The differences between book basis and tax basis components of net assets are primarily attributable to tax deferral of losses on wash sales.
6. Capital Shares
Transactions in capital shares were as follows:
| | | | | | | | |
| | | Year ended | |
| | | 12/31/19 | | | 12/31/18 | |
Shares sold: | | | | | | | | |
Standard Class | | | 467,704 | | | | 707,116 | |
Shares issued upon reinvestment of dividends and distributions: | | | | | | | | |
Standard Class | | | 336,714 | | | | 347,890 | |
| | | | | | | | |
| | | 804,418 | | | | 1,055,006 | |
| | | | | | | | |
Shares redeemed: | | | | | | | | |
Standard Class | | | (447,536 | ) | | | (247,891 | ) |
| | | | | | | | |
Net increase | | | 356,882 | | | | 807,115 | |
| | | | | | | | |
7. Line of Credit
On Nov. 4, 2019, the Series, along with certain other funds in the Delaware Funds (Participants), is a participant in a $250,000,000 revolving line of credit intended to be used for temporary or emergency purposes as an additional source of liquidity to fund redemptions of investor shares. Under the agreement, the Participants are charged an annual commitment fee of 0.15%, which is allocated across the Participants based on a weighted average of the respective net assets of each Participant. The Participants are permitted to borrow up to a maximum ofone-third of their net assets under the agreement. Each Participant is individually, and not jointly, liable for its particular advances, if any, under the line of credit. The line of credit available under the agreement expires on Nov. 2, 2020.
The Series had no amounts outstanding as of Dec. 31, 2019, or at any time during the period then ended.
8. Securities Lending
Effective Oct. 4, 2019, the Series, along with other funds in the Delaware Funds, may lend its securities pursuant to a security lending agreement (Lending Agreement) with The Bank of New York Mellon (BNY Mellon). At the time a security is loaned, the borrower must post collateral equal to the required percentage of the market value of the loaned security, including any accrued interest. The required percentage is: (1) 102% with respect to US securities and foreign securities that are denominated and payable in US dollars; and (2) 105% with respect to foreign securities. With respect to each loan, if on any business day, the aggregate market value of securities collateral plus cash collateral held is less than the aggregate market value of the securities which are
Growth Equity Series-14
Delaware VIP® Growth Equity Series
Notes to financial statements (continued)
8. Securities Lending (continued)
the subject of such loan, the borrower will be notified to provide additional collateral by the end of the following business day, which, together with the collateral already held, will be not less than the applicable initial collateral requirements for such security loan. If the aggregate market value of securities collateral and cash collateral held with respect to a security loan exceeds the applicable initial collateral requirement, upon the request of the borrower, BNY Mellon must return enough collateral to the borrower by the end of the following business day to reduce the value of the remaining collateral to the applicable initial collateral requirement for such security loan. As a result of the foregoing, the value of the collateral held with respect to a loaned security on any particular day, may be more or less than the value of the security on loan. The collateral percentage with respect to the market value of the loaned security is determined by the security lending agent.
Cash collateral received by each series of the Trust is generally invested in a series of individual separate accounts, each corresponding to a series. The investment guidelines permit each separate account to hold certain securities that would be considered eligible securities for a money market fund. Cash collateral received is generally invested in government securities; certain obligations issued by government sponsored enterprises; repurchase agreements collateralized by US Treasury securities; obligations issued by the central government of any Organization for Economic Cooperation and Development (OECD) country or its agencies, instrumentalities, or establishments; obligations of supranational organizations; commercial paper, notes, bonds, and other debt obligations; certificates of deposit, time deposits, and other bank obligations; and asset-backed securities. The Series can also accept US government securities and letters of credit(non-cash collateral) in connection with securities loans.
In the event of default or bankruptcy by the lending agent, realization and/or retention of the collateral may be subject to legal proceedings. In the event the borrower fails to return loaned securities and the collateral received is insufficient to cover the value of the loaned securities and provided such collateral shortfall is not the result of investment losses, the lending agent has agreed to pay the amount of the shortfall to the Series or, at the discretion of the lending agent, replace the loaned securities. The Series continues to record dividends or interest, as applicable, on the securities loaned and is subject to changes in value of the securities loaned that may occur during the term of the loan. The Series has the right under the Lending Agreement to recover the securities from the borrower on demand. With respect to security loans collateralized bynon-cash collateral, the Series receives loan premiums paid by the borrower. With respect to security loans collateralized by cash collateral, the earnings from the collateral investments are shared among the Series, the security lending agent, and the borrower. The Series records security lending income net of allocations to the security lending agent and the borrower.
The Series may incur investment losses as a result of investing securities lending collateral. This could occur if an investment in the collateral investment account defaulted or became impaired. Under those circumstances, the value of the Series’ cash collateral account may be less than the amount the Series would be required to return to the borrowers of the securities and the Series would be required to make up for this shortfall.
During the year ended Dec. 31, 2019, the Series had no securities out on loan.
9. Credit and Market Risk
The Series invests in growth stocks, which reflect projections of future earnings and revenue. These prices may rise or fall dramatically depending on whether those projections are met. These companies’ stock prices may be more volatile, particularly over the short term.
The Series may invest up to 10% of its net assets in illiquid securities, which may include securities with contractual restrictions on resale, securities exempt from registration under Rule 144A, promulgated under the Securities Act of 1933, as amended, and other securities which may not be readily marketable. The relative illiquidity of these securities may impair the Series from disposing of them in a timely manner and at a fair price when it is necessary or desirable to do so. While maintaining oversight, the Board has delegated to DMC theday-to-day functions of determining whether individual securities are liquid for purposes of the Series’ limitation on investments in illiquid securities. Securities eligible for resale pursuant to Rule 144A, which are determined to be liquid, are not subject to the Series’ 10% limit on investments in illiquid securities. As of Dec. 31, 2019, there were no Rule 144A securities held by the Series.
10. Contractual Obligations
The Series enters into contracts in the normal course of business that contain a variety of indemnifications. The Series’ maximum exposure under these arrangements is unknown. However, the Series has not had prior claims or losses pursuant to these contracts. Management has reviewed the Series’ existing contracts and expects the risk of loss to be remote.
11. Recent Accounting Pronouncements
In August 2018, the FASB issued an Accounting Standards Update (ASU), ASU2018-13, which changes certain fair value measurement disclosure requirements. The ASU2018-13, in addition to other modifications and additions, removes the requirement to disclose the amount and reasons for transfers between Level 1 and Level 2 of the fair value hierarchy, the policy for the timing of transfers between levels and the valuation process for Level 3
Growth Equity Series-15
Delaware VIP® Growth Equity Series
Notes to financial statements (continued)
11. Recent Accounting Pronouncements (continued)
fair value measurements. The ASU2018-13 is effective for fiscal years, and interim periods within those fiscal years, beginning after Dec. 15, 2019. At this time, management is evaluating the implications of these changes on the financial statements.
12. Subsequent Events
Management has determined that no material events or transactions occurred subsequent to Dec. 31, 2019, that would require recognition or disclosure in the Series’ financial statements.
Growth Equity Series-16
Delaware VIP® Trust—Delaware VIP Growth Equity Series
Report of independent registered public accounting firm
To the Board of Trustees of Delaware VIP® Trust and Shareholders of Delaware VIP Growth Equity Series
Opinion on the Financial Statements
We have audited the accompanying statement of assets and liabilities, including the schedule of investments, of Delaware VIP Growth Equity Series (one of the series constituting Delaware VIP® Trust, referred to hereafter as the “Series”) as of December 31, 2019, the related statements of operations and changes in net assets, including the related notes, and the financial highlights for the year then ended (collectively referred to as the “financial statements”). In our opinion, the financial statements present fairly, in all material respects, the financial position of the Series as of December 31, 2019, the results of its operations, changes in its net assets, and the financial highlights for the year then ended in conformity with accounting principles generally accepted in the United States of America.
The financial statements of First Investors Life Series Select Growth Fund (subsequent to reorganization, known as Delaware VIP Growth Equity Series) as of and for the year ended December 31, 2018 and the financial highlights for each of the periods ended on or prior to December 31, 2018 (not presented herein, other than the statement of changes in net assets and the financial highlights) were audited by other auditors whose report dated February 26, 2019 expressed an unqualified opinion on those financial statements and financial highlights.
Basis for Opinion
These financial statements are the responsibility of the Series’ management. Our responsibility is to express an opinion on the Series’ financial statements based on our audit. We are a public accounting firm registered with the Public Company Accounting Oversight Board (United States) (PCAOB) and are required to be independent with respect to the Series in accordance with the U.S. federal securities laws and the applicable rules and regulations of the Securities and Exchange Commission and the PCAOB.
We conducted our audit of these financial statements in accordance with the standards of the PCAOB. Those standards require that we plan and perform the audit to obtain reasonable assurance about whether the financial statements are free of material misstatement, whether due to error or fraud.
Our audit included performing procedures to assess the risks of material misstatement of the financial statements, whether due to error or fraud, and performing procedures that respond to those risks. Such procedures included examining, on a test basis, evidence regarding the amounts and disclosures in the financial statements. Our audit also included evaluating the accounting principles used and significant estimates made by management, as well as evaluating the overall presentation of the financial statements. Our procedures included confirmation of securities owned as of December 31, 2019 by correspondence with the custodian and transfer agents. We believe that our audit provides a reasonable basis for our opinion.
/s/PricewaterhouseCoopers LLP
Philadelphia, Pennsylvania
February 28, 2020
We have served as the auditor of one or more investment companies in Delaware Funds® by Macquarie since 2010.
Growth Equity Series-17
Delaware VIP® Trust — Delaware VIP Growth Equity Series
Other Series information (Unaudited)
Tax Information
All disclosures are based on financial information available as of the date of this annual report and, accordingly are subject to change. For any and all items requiring reporting, it is the intention of the Series to report the maximum amount permitted under the Internal Revenue Code and the regulations thereunder.
For the year ended Dec. 31, 2019, the Series reports distributions paid during the year as follows:
| | | | | | |
| | | (A)
Long-Term
Capital Gain
Distributions
Tax Basis | | (B)
Ordinary Income
Distributions
(Tax Basis) | | Total
Distributions
(Tax Basis) |
| | 94.57% | | 5.43% | | 100.00% |
(A) and (B) are based on a percentage of the Series’ total distributions.
Growth Equity Series-18
Delaware Funds® by Macquarie
Board of trustees / directors and officers addendum
A mutual fund is governed by a Board of Trustees/Directors (“Trustees”), which has oversight responsibility for the management of a fund’s business affairs. Trustees establish procedures and oversee and review the performance of the investment manager, the distributor, and others who perform services for the fund. The independent fund trustees, in particular, are advocates for shareholder interests. Each trustee has served in that capacity since he or she was elected to or appointed to the Board of Trustees, and will continue to serve until his or her retirement or the election of a new trustee in his or her place. The following is a list of the Trustees and Officers with certain background and related information.
| | | | | | | | | | |
Name, Address, and Birth Date | | Position(s) Held with Fund(s) | | Length of Time Served | | Principal Occupation(s) During the Past Five Years | | Number of Portfolios in Fund Complex Overseen by Trustee or Officer | | Other Directorships Held by Trustee or Officer |
| INTERESTED TRUSTEE | | | | | | | | | | |
| | | | | |
Shawn K. Lytle1 2005 Market Street Philadelphia, PA 19103 February 1970 | | President, Chief Executive Officer, and Trustee | | President and Chief Executive Officer since August 2015 Trustee since September 2015 | | President — Macquarie Investment Management2 (June 2015-Present) Regional Head of Americas — UBS Global Asset Management (April 2010-May 2015) | | 95 | | Trustee — UBS Relationship Funds, SMA Relationship Trust, and UBS Funds (May 2010–April 2015) |
| INDEPENDENT TRUSTEES | | | | | | | | | | |
| | | | | |
Thomas L. Bennett 2005 Market Street Philadelphia, PA 19103 October 1947 | | Chair and Trustee | | Trustee since March 2005 Chair since March 2015 | | Private Investor (March 2004–Present) | | 95 | | None |
Jerome D. Abernathy 2005 Market Street Philadelphia, PA 19103 July 1959 | | Trustee | | Since January 2019 | | Managing Member, Stonebrook Capital Management, LLC (financial technology: macro factors and databases) (January 1993–Present) | | 95 | | None |
Ann D. Borowiec 2005 Market Street Philadelphia, PA 19103 November 1958 | | Trustee | | Since March 2015 | | Chief Executive Officer, Private Wealth Management (2011–2013) and Market Manager, New Jersey Private Bank (2005–2011) — J.P. Morgan Chase & Co. | | 95 | | Director — Banco Santander International (October 2016–December 2019) Director — Santander Bank, N.A. (December 2016–December 2019) |
Joseph W. Chow 2005 Market Street Philadelphia, PA 19103 January 1953 | | Trustee | | Since January 2013 | | Private Investor (April 2011–Present) | | 95 | | Director and Audit Committee Member — Hercules Technology Growth Capital, Inc. (July 2004–July 2014) |
Growth Equity Series-19
| | | | | | | | | | |
Name, Address, and Birth Date | | Position(s) Held with Fund(s) | | Length of Time Served | | Principal Occupation(s) During the Past Five Years | | Number of Portfolios in Fund Complex Overseen by Trustee or Officer | | Other Directorships Held by Trustee or Officer |
John A. Fry 2005 Market Street Philadelphia, PA 19103 May 1960 | | Trustee | | Since January 2001 | | President — Drexel University (August 2010–Present) President — Franklin & Marshall College (July 2002–July 2010) | | 95 | | Director; Compensation Committee and Governance Committee Member — Community Health Systems (May 2004–Present) Director — Drexel Morgan & Co. (2015–Present) Director and Audit Committee Member — vTv Therapeutics LLC (2017–Present) Director and Audit Committee Member — FS Credit Real Estate Income Trust, Inc. (2018–Present) Director — Federal Reserve Bank of Philadelphia (January 2020–Present) |
Lucinda S. Landreth 2005 Market Street Philadelphia, PA 19103 June 1947 | | Trustee | | Since March 2005 | | Private Investor (2004–Present) | | 95 | | None |
Frances A. Sevilla-Sacasa 2005 Market Street Philadelphia, PA 19103 January 1956 | | Trustee | | Since September 2011 | | Private Investor (January 2017-Present) Chief Executive Officer — Banco Itaú International (April 2012–December 2016) Executive Advisor to Dean (August 2011–March 2012) and Interim Dean (January 2011–July 2011) — University of Miami School of Business Administration President — U.S. Trust, Bank of America Private Wealth Management (Private Banking) (July 2007–December 2008) | | 95 | | Trust Manager and Audit Committee Chair — Camden Property Trust (August 2011–Present) Director; Strategic Planning and Reserves Committee and Nominating and Governance Committee Member — Callon Petroleum Company (December 2019–Present) Director; Audit Committee Member — Carrizo Oil & Gas, Inc. (March 2018–December 2019) |
Thomas K. Whitford 2005 Market Street Philadelphia, PA 19103 March 1956 | | Trustee | | Since January 2013 | | Vice Chairman (2010–April 2013) — PNC Financial Services Group | | 95 | | Director — HSBC North America Holdings Inc. (December 2013-Present) Director — HSBC USA Inc. (July 2014-Present) Director — HSBC Bank USA, National Association (July 2014-March 2017) Director — HSBC Finance Corporation (December 2013-April 2018) |
Growth Equity Series-20
| | | | | | | | | | |
Name, Address, and Birth Date | | Position(s) Held with Fund(s) | | Length of Time Served | | Principal Occupation(s) During the Past Five Years | | Number of Portfolios in Fund Complex Overseen by Trustee or Officer | | Other Directorships Held by Trustee or Officer |
Christianna Wood 2005 Market Street Philadelphia, PA 19103 March 1956 | | Trustee | | Since January 2019 | | Chief Executive Officer and President — Gore Creek Capital, Ltd. (August 2009–Present) | | 95 | | Director; Finance Committee and Audit Committee Member — H&R Block Corporation (July 2008–Present) Director; Chair of Investments Committee and Audit Committee Member — Grange Insurance (2013–Present) Trustee; Chair of Nominating and Governance Committee and Audit Committee Member — The Merger Fund (2013–Present), The Merger Fund VL (2013–Present); WCM Alternatives: Event-Driven Fund (2013–Present), and WCM Alternatives: Credit Event Fund (December 2017–Present) Director; Chair of Governance Committee and Audit Committee Member — International Securities Exchange (2010–2016) |
Janet L. Yeomans 2005 Market Street Philadelphia, PA 19103 July 1948 | | Trustee | | Since April 1999 | | Vice President and Treasurer (January 2006–July 2012), Vice President — Mergers & Acquisitions (January 2003–January 2006), and Vice President and Treasurer (July 1995–January 2003) — 3M Company | | 95 | | Director; Personnel and Compensation Committee Chair; Member of Nominating, Investments, and Audit Committees for various periods throughout directorship — Okabena Company (2009-2017) |
Growth Equity Series-21
| | | | | | | | | | |
Name, Address, and Birth Date | | Position(s) Held with Fund(s) | | Length of Time Served | | Principal Occupation(s) During the Past Five Years | | Number of Portfolios in Fund Complex Overseen by Trustee or Officer | | Other Directorships Held by Trustee or Officer |
| OFFICERS | | | | | | | | | | |
| | | | | |
David F. Connor 2005 Market Street Philadelphia, PA 19103 December 1963 | | Senior Vice President, General Counsel, and Secretary | | Senior Vice President, since May 2013; General Counsel since May 2015; Secretary since October 2005 | | David F. Connor has served in various capacities at different times at Macquarie Investment Management. | | 95 | | None3 |
Daniel V. Geatens 2005 Market Street Philadelphia, PA 19103 October 1972 | | Vice President and Treasurer | | Vice President and Treasurer since October 2007 | | Daniel V. Geatens has served in various capacities at different times at Macquarie Investment Management. | | 95 | | None3 |
Richard Salus 2005 Market Street Philadelphia, PA 19103 October 1963 | | Senior Vice President and Chief Financial Officer | | Senior Vice President and Chief Financial Officer since November 2006 | | Richard Salus has served in various capacities at different times at Macquarie Investment Management. | | 95 | | None |
| 1 | Shawn K. Lytle is considered to be an “Interested Trustee” because he is an executive officer of the Fund’s(s’) investment advisor. |
| 2 | Macquarie Investment Management is the marketing name for Macquarie Management Holdings, Inc. and its subsidiaries, including the Fund’s(s’) investment advisor, principal underwriter, and its transfer agent. |
| 3 | David F. Connor and Daniel V. Geatens serve in similar capacities for the six portfolios of the Optimum Fund Trust, which have the same investment advisor, principal underwriter, and transfer agent as the registrant. Mr. Geatens also serves as the Chief Financial Officer of the Optimum Fund Trust and he is the Chief Financial Officer and Treasurer for Macquarie Global Infrastructure Total Return Fund Inc. |
The Statement of Additional Information for the Fund(s) includes additional information about the Trustees and Officers and is available, without charge, upon request by calling 800523-1918.
Growth Equity Series-22
| | | | |
| | |
| | The Series files its complete schedule of portfolio holdings with the Securities and Exchange Commission (SEC) for the first and third quarters of each fiscal year on FormN-Q or FormN-PORT (available for filings after March 31, 2019). The Series’ FormsN-Q or FormsN-PORT, as well as a description of the policies and procedures that the Series uses to determine how to vote proxies (if any) relating to portfolio securities, are available without charge (i) upon request, by calling 800523-1918; and (ii) on the SEC’s website at sec.gov. In addition, a description of the policies and procedures that the Series uses to determine how to vote proxies (if any) relating to portfolio securities and the Schedule of Investments included in the Series’ most recent FormN-Q or FormN-PORT are available without charge on the Series’ website at delawarefunds.com/vip/literature. The Series’ FormsN-Q and FormsN-PORT may be reviewed and copied at the SEC’s Public Reference Room in Washington, D.C.; information on the operation of the Public Reference Room may be obtained by calling 800SEC-0330. Information (if any) regarding how the Series voted proxies relating to portfolio securities during the most recently disclosed12-month period ended June 30 is available without charge (i) through the Series’ website at delawarefunds.com/proxy; and (ii) on the SEC’s website at sec.gov. | | |
| | |
| AR-VIPGE 22495 (2/20) (1076649) | | Growth Equity Series-23 |

Delaware VIP® Trust
Delaware VIP International Series
(formerly, First Investors Life Series International Fund)
December 31, 2019
Beginning on or about June 1, 2021, as permitted by regulations adopted by the Securities and Exchange Commission, paper copies of your Series’ shareholder reports will no longer be sent to you by mail, unless you specifically request them from the Series or from your financial intermediary, such as a broker/dealer, bank, or insurance company. Instead, you will be notified by mail each time a report is posted on the website and provided with a link to access the report.
If you already elected to receive shareholder reports electronically, you will not be affected by this change and you do not need to take any action.
You may elect to receive paper copies of all future shareholder reports free of charge. You can inform the Series that you wish to continue receiving paper copies of your shareholder reports by contacting us at 800523-1918. If you own these shares through a financial intermediary, you may contact your financial intermediary to elect to continue to receive paper copies of your shareholder reports. Your election to receive reports in paper will apply to all funds held with the Delaware Funds® by Macquarie or your financial intermediary.

Table of contents
Other than Macquarie Bank Limited (MBL), none of the entities noted are authorized deposit-taking institutions for the purposes of the Banking Act 1959 (Commonwealth of Australia). The obligations of these entities do not represent deposits or other liabilities of MBL. MBL does not guarantee or otherwise provide assurance in respect of the obligations of these entities, unless noted otherwise. The Series is governed by US laws and regulations.
Unless otherwise noted, views expressed herein are current as of Dec. 31, 2019, and subject to change for events occurring after such date.
The Series is not FDIC insured and is not guaranteed. It is possible to lose the principal amount invested.
Advisory services provided by Delaware Management Company, a series of Macquarie Investment Management Business Trust (MIMBT), a US registered investment advisor.
The Series is distributed byDelaware Distributors, L.P.(DDLP), an affiliate of MIMBT and Macquarie Group Limited. Macquarie Investment Management (MIM) is the marketing name for certain companies comprising the asset management division of Macquarie Group Limited and its subsidiaries and affiliates worldwide.
This material may be used in conjunction with the offering of shares in Delaware VIP® International Series only if preceded or accompanied by the Series’ current prospectus or the summary prospectus.
© 2020 Macquarie Management Holdings, Inc.
All third-party marks cited are the property of their respective owners.
Delaware VIP®Trust — Delaware VIP International Series
| | |
| Portfolio management review | | January 7, 2020 (Unaudited) |
The investment objective of the Series is to seek long-term capital growth.
Effective after the close of business on Oct. 4, 2019, Delaware Management Company (DMC or Manager), a series of Macquarie Investment Management Business Trust (MIMBT), serves as the investment manager for the Series.* During the period after the close of business on Oct. 4, 2019 to Dec. 31, 2019, the Manager repositioned the portfolio in accordance with Series’ investment objective and principal investment strategies, as described in the prospectus. The investment objective is the same and its principal investment strategies are the same or similar to those of the corresponding Life Series Fund. Delaware VIP International Series transitioned from a diversified fund to anon-diversified fund during this period.
For the fiscal year ended Dec. 31, 2019, Delaware VIP International Series (the “Series”) Standard Class shares gained 24.91%. This figure reflects all dividends reinvested. The Series’ benchmark, the MSCI EAFE (Europe, Australasia, Far East) Index, advanced 22.01% (net) and 22.66% (gross) for the same period.
During the fourth quarter of 2018, prior to the fiscal year, there was a sharp decline in the valuation of risky assets. But early in 2019, equity prices began to recover. Admittedly, there were plenty of reasons for equity investors to be concerned, notably the continuing disputes between the United States and several of its most important trading partners. The looming prospect of Brexit continued to create doubt about the United Kingdom’s economic and political outlook. Despite these uncertainties, equities generally performed well over the 12 months ended Dec. 31, 2019.
During the fiscal year, the spot price of West Texas Intermediate (WTI) oil rose by nearly 35%, while the spot price of gold climbed about 18%. Broader-based commodity indices also showed fairly strong performance. The total return of the energy-intensive S&P GSCI as about 18% for the year, while the broad-based Thomson Reuters/CoreCommodity CRB Index rose almost 12% over the12-month period.
Risk-free interest rates continued to decline over the course of the fiscal year. The yield on US10-year Treasurys was 2.7% at the end of December 2018 but fell to roughly 1.8% by the end of December 2019. In Japan, the yield on10-year government bonds was roughly zero at the end of December 2018, dipped into negative territorymid-year, and then returned to near zero by the end of the year. In Germany,10-year government bonds offered barely positive yields at the end of December 2018, dropping to negative levels at the end of December 2019.
These declines in interest rates led to unusually high total returns for fixed income investors during the12-month period, but it seems unlikely, in our view, that risk-free interest rates around the world can continue to decline significantly from current levels. The limited scope for further declines in interest rates may cause equities to look relatively more appealing to asset owners with longer investment horizons. Although some market observers believe that falling interest rates and weak commodity returns indicate an economic slowdown, equity investors appeared to shrug off these warning signals.
Source: Bloomberg.
Foresters Investment Management Company, Inc. (FIMCO) managed the Series from Jan. 1, 2019 to Oct. 4, 2019, when the management of the Series transitioned to DMC. The following is a discussion about Series performance during that period ended Oct. 4, 2019:
Constellation Software Inc., a Canadian-listed conglomerate of mission-critical niche software businesses in the private and public sectors, was a leading contributor during the fiscal period. Constellation Software benefited from vibrant acquisition opportunities and stable organic growth. The company also announced a special dividend for investors early in 2019. Constellation Software grows throughbolt-on acquisitions and the industry is still quite fragmented. We believe the business is predictable because customers usually do not switch to a competitor’s product and they pay annual maintenance fees.
Nestlé SAalso contributed to the Series’ performance during the reporting period. Nestlé’s organic growth exceeded expectations early in the period with particularly strong growth from its Petcare and Nutrition & Health Science units. We continue to believe Nestlé is well positioned with strong brands and meaningful exposure to faster growing emerging markets. During the second quarter of 2019, Nestlé continued its steady progress following good first-quarter results, an informative investor conference, and progress on the$10-billion sale of its skin health business. Nestlé deliverslow- tomid-single-digit, constant currency, organic sales growth consistently, driven by its focus on health and wellness, its diversified geographic exposure, and its wide product range. Under its new CEO, Nestlé is also more concentrated on margin improvement and focused on its faster-growing categories while disposing of those that grow slower.
Reckitt Benckiser Groupunderperformed during the reporting period, as Indivior PLC, a pharmaceutical company that Reckitt Benckiser spun off five years ago, was indicted on charges by the US Department of Justice concerning the sale of an opioid treatment beginning in 2010. The market worried over the amount of risk this might entail for Reckitt. We sold Reckitt and reallocated capital to what we viewed as better opportunities.
Unless otherwise noted, views expressed herein are current as of Dec. 31, 2019, and subject to change.
International Series-1
Delaware VIP®Trust — Delaware VIP International Series
| | |
| Portfolio management review (continued) | | January 7, 2020 (Unaudited) |
British American Tobacco PLCalso detracted from the Series’ performance following Phillip Morris International Inc.’s announcement that uptake in Japan of its leadingHeat-Not-Burn product was weaker than expected. The announcement highlighted to investors the current uncertainty in the nicotine delivery space. We sold British American Tobacco and reallocated capital to improved prospects, in our view.
*On April 6, 2019, FIMCO, the investment adviser to the First Investors Funds, entered into an agreement with Macquarie Management Holdings, Inc. (MMHI), whereby MMHI, on behalf of its affiliate DMC, would acquire FIMCO’s asset management business (the “Transaction”). In connection with the Transaction, the Board of Trustees of the First Investors Trusts and the First Investors Fund shareholders approved, pursuant to an Agreement and Plan of Reorganization (the “Agreement”), the transfer of all assets and liabilities of each First Investors Fund to a corresponding, newly formed fund in the Delaware Funds® by Macquarie family of funds. The Transaction closed on Oct. 4, 2019.
Unless otherwise noted, views expressed herein are current as of Dec. 31, 2019, and subject to change.
International Series-2
Delaware VIP® Trust — Delaware VIP International Series
Performance summary (Unaudited)
The performance quoted represents past performance and does not guarantee future results. Investment return and principal value of an investment will fluctuate so that shares, when redeemed, may be worth more or less than their original cost. Current performance may be lower or higher than the performance quoted.
Carefully consider the Series’ investment objectives, risk factors, charges, and expenses before investing. This and other information can be found in the Series’ prospectus and its summary prospectus, which may be obtained by visiting delawarefunds.com/vip/literature or calling 800523-1918. Investors should read the prospectus and the summary prospectus carefully before investing.
| | | | | | | | | | | | | | | | | | |
| Delaware VIP International Series | | | | | | | | | |
| Average annual total returns | | | | | | | | | |
| For periods ended December 31, 2019 | | 1 year | | | 3 year | | | 5 year | | | 10 year | | | Lifetime |
Standard Class shares (commenced operations on April 16, 1990) | | | +24.91% | | | | +13.42% | | | | +7.66% | | | | +8.11% | | | — |
| | | | | | | | | | | | | | | | | | |
MSCI EAFE Index (net) | | | +22.01% | | | | +9.56% | | | | +5.67% | | | | +5.50% | | | — |
| | | | | | | | | | | | | | | | | | |
MSCI EAFE Index (gross) | | | +22.66% | | | | +10.11% | | | | +6.18% | | | | +5.99% | | | — |
Returns reflect the reinvestment of all distributions. Please see page 4 for a description of the index.
As described in the Series’ most recent prospectus, the net expense ratio for Standard Class shares of the Series was 0.86%, while total operating expenses for Standard Class shares were 0.99%. The management fee for Standard Class shares was 0.85%.The Series’ investment manager, Delaware Management Company (Manager), has contractually agreed to waive all or a portion of its investment advisory fees and/or pay/reimburse expenses (excluding any12b-1 fees, acquired fund fees and expenses, taxes, interest, short sale and dividend interest expenses, brokerage fees, certain insurance costs, and nonroutine expenses or costs, including, but not limited to, those relating to reorganizations, litigation, conducting shareholder meetings, and liquidations) in order to prevent annual series operating expenses from exceeding 0.86% of the Series’ average daily net assets from Oct. 4, 2019 through Dec. 31, 2019.* Please see the most recent prospectus and any applicable supplement(s) for additional information on these fee waivers and/or reimbursements. Please see the “Financial highlights” section in this report for the most recent expense ratios.
Earnings from a variable annuity or variable life investment compoundtax-free until withdrawal, and as a result, no adjustments were made for income taxes.
Expense limitations were in effect for Standard Class shares during certain periods shown in the Series performance table above and in the Performance of a $10,000 Investment graph on the next page.
Performance data do not reflect insurance fees related to a variable annuity or variable life investment or the deferred sales charge that would apply to certain withdrawals of investments held for fewer than eight years. Performance shown here would have been reduced if such fees were included and the expense limitation removed. For more information about fees, consult your variable annuity or variable life prospectus.
Investments in variable products involve risk.
International investments entail risks not ordinarily associated with US investments including fluctuation in currency values, differences in accounting principles, or economic or political instability in other nations. Investing in emerging markets can be riskier than investing in established foreign markets due to increased volatility and lower trading volume.
Narrowly focused investments may exhibit higher volatility than investments in multiple industry sectors.
“Non-diversified” funds may allocate more of their net assets to investments in single securities than “diversified” funds. Resulting adverse effects may subject these funds to greater risks and volatility.
Liquidity risk is the possibility that investments cannot be readily sold within seven days at approximately the price at which a fund has valued them.
Please read both the contract and underlying prospectus for specific details regarding the product’s risk profile.
*The aggregate contractual waiver period covering this report is from Oct. 4, 2019 through Oct. 31, 2021.
InternationalSeries-3
Delaware VIP® International Series
Performance summary (Unaudited) (continued)
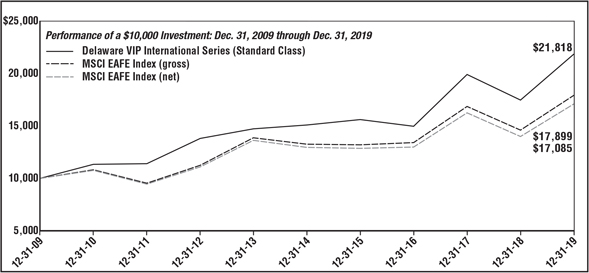
| | | | | | | | | | |
For period beginning Dec. 31, 2009 through Dec. 31, 2019 | | | Starting value | | | | Ending value | |
| — | | Delaware VIP International Series (Standard Class) | | | $10,000 | | | | $21,818 | |
| --- | | MSCI EAFE Index (gross) | | | $10,000 | | | | $17,899 | |
| --- | | MSCI EAFE Index (net) | | | $10,000 | | | | $17,085 | |
The graph shows a $10,000 investment in the Delaware VIP International Series Standard Class shares for the period from Dec. 31, 2009 through Dec. 31, 2019.
The graph also shows $10,000 invested in the MSCI EAFE Index for the period from Dec. 31, 2009 through Dec. 31, 2019. The MSCI EAFE (Europe, Australasia, Far East) Index represents large- andmid-cap stocks across 21 developed markets, excluding the United States and Canada. The index covers approximately 85% of the free float-adjusted market capitalization in each country. Index “net” return approximates the minimum possible dividend reinvestment, after deduction of withholding tax at the highest possible rate. Index “gross” return approximates the maximum possible dividend reinvestment.
The S&P GSCI (formerly Goldman Sachs Commodity Index), mentioned on page 1, is a world production-weighted index composed of the principal physical commodities that are the subject of active, liquid futures markets.
The Thomson Reuters/CoreCommodity CRB Index, mentioned on page 1, is a widely recognized measure of global commodities markets. It is made up of 19 components considered to be significant commodities, including silver, sugar, wheat, aluminum, and soy beans.
Index performance returns do not reflect any management fees, transaction costs or expenses. Indices are unmanaged and one cannot invest directly in an index.
Past performance is not a guarantee of future results.
International Series-4
Delaware VIP® Trust — Delaware VIP International Series
Disclosure of Series expenses
For thesix-month period from July 1, 2019 to December 31, 2019 (Unaudited)
As a shareholder of the Series, you incur ongoing costs, which may include management fees; distribution and service(12b-1) fees; and other Series expenses. This example is intended to help you understand your ongoing costs (in dollars) of investing in the Series and to compare these costs with the ongoing costs of investing in other mutual funds.
The example is based on an investment of $1,000 invested at the beginning of the period and held for the entiresix-month period from July 1, 2019 to Dec. 31, 2019.
Actual expenses
The first section of the table shown, “Actual Series return,” provides information about actual account values and actual expenses. You may use the information in this section of the table, together with the amount you invested, to estimate the expenses that you paid over the period. Simply divide your account value by $1,000 (for example, an $8,600 account value divided by $1,000 = 8.6), then multiply the result by the number in the first section under the heading entitled “Expenses Paid During Period” to estimate the expenses you paid on your account during the period.
Hypothetical example for comparison purposes
The second section of the table shown, “Hypothetical 5% return,” provides information about hypothetical account values and hypothetical expenses based on the Series’ actual expense ratio and an assumed rate of return of 5% per year before expenses, which is not the Series’ actual return. The hypothetical account values and expenses may not be used to estimate the actual ending account balance or expenses you paid for the period. You may use this information to compare the ongoing costs of investing in the Series and other funds. To do so, compare this 5% hypothetical example with the 5% hypothetical examples that appear in the shareholder reports of other funds.
Please note that the expenses shown in the table are meant to highlight your ongoing costs only. As a shareholder of the Series, you do not incur any transaction costs, such as sales charges (loads), redemption fees or exchange fees, but shareholders of other funds may incur such costs. Also, the fees related to the variable annuity investment or the deferred sales charge that could apply have not been included. Therefore, the second section of the table is useful in comparing ongoing costs only, and will not help you determine the relative total costs of owning different funds. The Series’ expenses shown in the table reflect fee waivers in effect and assume reinvestment of all dividends and distributions.
Expense analysis of an investment of $1,000
| | | | | | | | | | | | | | |
| | | Beginning
Account
Value
7/1/19 | | | Ending
Account
Value
12/31/19 | | | Annualized
Expense
Ratio | | Expenses
Paid During
Period
7/1/19 to
12/31/19* | |
Actual Series return† | | | | |
Standard Class | | | $1,000.00 | | | | $1,050.40 | | | 0.80% | | | $4.13 | |
Hypothetical 5% return(5% return before expenses) | |
Standard Class | | | $1,000.00 | | | | $1,021.17 | | | 0.80% | | | $4.08 | |
| * | “Expenses Paid During Period” are equal to the Series’ annualized expense ratio, multiplied by the average account value over the period, multiplied by 184/365 (to reflect theone-half year period). |
| † | Because actual returns reflect only the most recentsix-month period, the returns shown may differ significantly from fiscal year returns. |
In addition to the Series’ expenses reflected above, the Series also indirectly bears its portion of the fees and expenses of the investment companies (Underlying Funds) in which it invests. The table above does not reflect the expenses of the Underlying Funds.
InternationalSeries-5
Delaware VIP® Trust — Delaware VIP International Series
Security type / country and sector allocations
As of December 31, 2019 (Unaudited)
Sector designations may be different than the sector designations presented in other Series materials. The sector designations may represent the investment manager’s internal sector classifications.
| | |
| Security type / country | | Percentage
of net assets |
Common Stock by Country | | 97.86% |
Denmark | | 6.71% |
France | | 25.27% |
Germany | | 6.61% |
Ireland | | 1.43% |
Japan | | 21.50% |
Netherlands | | 7.11% |
Sweden | | 3.95% |
Switzerland | | 15.31% |
United Kingdom | | 9.97% |
Exchange-Traded Funds | | 1.97% |
Total Value of Securities | | 99.83% |
Receivables and Other Assets Net of Liabilities | | 0.17% |
Total Net Assets | | 100.00% |
| | |
| Common stock by sector | | Percentage
of net assets |
Communication Services | | 13.16% |
Consumer Discretionary | | 10.73% |
Consumer Staples1 | | 38.04% |
Healthcare | | 18.30% |
Industrials | | 12.04% |
Materials | | 5.59% |
Total | | 97.86% |
| 1 | To monitor compliance with the Series’ concentration guidelines as described in the Series’ Prospectus and Statement of Additional Information, the Consumer Staples sector (as disclosed herein for financial reporting purposes) is subdivided into a variety of “industries” (in accordance with the requirements of the Investment Company Act of 1940, as amended). The Consumer Staples sector consisted of Beverages, Cosmetics/Personal Care, Dairy Products, Miscellaneous/Diversified, and Retail. As of Dec. 31, 2019, such amounts, as a percentage of total net assets, were 8.37%, 1.78%, 6.55%, 7.14%, and 14.20%, respectively. The percentage in any such single industry will comply with the Series’ concentration policy even if the percentages in the Consumer Staples sector for financial reporting purposes may exceed 25%. |
InternationalSeries-6
Delaware VIP® Trust — Delaware VIP International Series
Schedule of investments
December 31, 2019
| | | | | | | | |
| | | Number of | | | Value | |
| | | shares | | | (US $) | |
Common Stock – 97.86%D | |
Denmark – 6.71% | | | | | | | | |
Novo Nordisk Class B | | | 192,580 | | | $ | 11,159,786 | |
| | | | | | | | |
| | | | | | | 11,159,786 | |
| | | | | | | | |
France – 25.27% | | | | | |
Air Liquide | | | 65,680 | | | | 9,297,565 | |
Danone | | | 131,340 | | | | 10,887,249 | |
Orange † | | | 426,730 | | | | 6,280,059 | |
Publicis Groupe | | | 178,550 | | | | 8,083,282 | |
Sodexo | | | 62,880 | | | | 7,451,758 | |
| | | | | | | | |
| | | | | | | 41,999,913 | |
| | | | | | | | |
Germany – 6.61% | | | | | | | | |
adidas AG | | | 8,400 | | | | 2,730,577 | |
Fresenius Medical Care AG & Co. | | | 112,170 | | | | 8,258,834 | |
| | | | | | | | |
| | | | | | | 10,989,411 | |
| | | | | | | | |
Ireland – 1.43% | | | | | |
Kerry Group Class A | | | 19,050 | | | | 2,374,028 | |
| | | | | | | | |
| | | | | | | 2,374,028 | |
| | | | | | | | |
Japan – 21.50% | | | | | |
Asahi Group Holdings | | | 102,200 | | | | 4,662,417 | |
Kao | | | 35,800 | | | | 2,952,609 | |
KDDI | | | 251,800 | | | | 7,512,799 | |
Kirin Holdings | | | 96,100 | | | | 2,097,535 | |
Lawson | | | 65,600 | | | | 3,723,629 | |
Makita | | | 126,100 | | | | 4,354,848 | |
Secom | | | 26,600 | | | | 2,373,857 | |
Seven & i Holdings | | | 219,800 | | | | 8,056,865 | |
| | | | | | | | |
| | | | | | | 35,734,559 | |
| | | | | | | | |
| | | | | | | | |
| | | Number of | | | Value | |
| | | shares | | | (US $) | |
Common StockD(continued) | |
Netherlands – 7.11% | | | | | |
Koninklijke Ahold Delhaize | | | 472,740 | | | $ | 11,822,424 | |
| | | | | | | | |
| | | | | | | 11,822,424 | |
| | | | | | | | |
Sweden – 3.95% | | | | | |
Securitas Class B | | | 380,890 | | | | 6,562,438 | |
| | | | | | | | |
| | | | | | | 6,562,438 | |
| | | | | | | | |
Switzerland – 15.31% | | | | | |
Nestle | | | 87,630 | | | | 9,487,286 | |
Roche Holding | | | 33,840 | | | | 10,998,095 | |
Swatch Group | | | 17,740 | | | | 4,953,104 | |
| | | | | | | | |
| | | | | | | 25,438,485 | |
| | | | | | | | |
United Kingdom – 9.97% | | | | | |
Diageo | | | 168,760 | | | | 7,154,381 | |
G4S | | | 2,325,700 | | | | 6,715,756 | |
Next | | | 29,070 | | | | 2,702,360 | |
| | | | | | | | |
| | | | | | | 16,572,497 | |
| | | | | | | | |
Total Common Stock
(cost $150,916,431) | | | | 162,653,541 | |
| | | | | | | | |
Exchange-Traded Funds – 1.97% | | | | | |
iShares MSCI EAFE ETF | | | 715 | | | | 49,650 | |
Vanguard FTSE Developed Markets ETF | | | 73,240 | | | | 3,226,954 | |
| | | | | | | | |
Total Exchange-Traded Funds
(cost $3,020,580) | | | | 3,276,604 | |
| | | | | | | | |
| | | | |
Total Value of Securities – 99.83%
(cost $153,937,011) | | $ | 165,930,145 | |
| | | | |
| D | Securities have been classified by country of origin. Aggregate classification by business sector has been presented on page 6 in “Security type / country and sector allocations.” |
| † | Non-income producing security. |
The following foreign currency exchange contracts were outstanding at Dec. 31, 2019:1
Foreign Currency Exchange Contracts
| | | | | | | | | | | | | | | | | | | | | | | | | | |
Counterparty | | Currency to
Receive (Deliver) | | | In Exchange For | | | Settlement
Date | | | Unrealized
Appreciation | | | Unrealized
Depreciation | |
BNYM | | EUR | | | (82,234) | | | | USD | | | | 92,027 | | | | 1/2/20 | | | | $— | | | | $(227) | |
BNYM | | GBP | | | (16,910) | | | | USD | | | | 22,413 | | | | 1/3/20 | | | | 11 | | | | — | |
BNYM | | SEK | | | 243,769 | | | | USD | | | | (26,030) | | | | 1/2/20 | | | | — | | | | (1) | |
BNYM | | SEK | | | (316,845) | | | | USD | | | | 33,833 | | | | 1/2/20 | | | | 2 | | | | — | |
Total Foreign Currency Exchange Contracts | | | | | | | | $ 13 | | | | $(228) | |
The use of foreign currency exchange contracts involves elements of market risk and risks in excess of the amounts disclosed in the financial statements. The foreign currency exchange contracts presented above represent the Series’ total exposure in such contracts, whereas only the net unrealized appreciation (depreciation) is reflected in the Series’ net assets.
1See Note 8 in “Notes to financial statements.”
InternationalSeries-7
Delaware VIP® International Series
Schedule of investments (continued)
Summary of abbreviations:
BNYM – The Bank of New York Mellon
EAFE – Europe, Australasia, and the Far East
ETF – Exchange-Traded Fund
EUR – Euro
FTSE – Financial Times Stock Exchange 100 Index
GBP – British Pound Sterling
MSCI – Morgan Stanley Capital International
SEK – Swedish Krona
USD – US Dollar
See accompanying notes, which are an integral part of the financial statements.
InternationalSeries-8
| | |
| Delaware VIP®Trust — Delaware VIP International Series |
| Statement of assets and liabilities | | December 31, 2019 |
| | | | |
Assets: | | | | |
Investments, at value1 | | $ | 165,930,145 | |
Foreign currencies, at value2 | | | 160,364 | |
Foreign tax reclaims receivable | | | 213,320 | |
Receivable for securities sold | | | 126,071 | |
Dividends and interest receivable | | | 103,552 | |
Receivable for series shares sold | | | 4,562 | �� |
Unrealized appreciation on foreign currency exchange contracts | | | 13 | |
Other assets | | | 4,904 | |
| | | | |
| |
Total assets | | | 166,542,931 | |
| | | | |
Liabilities: | | | | |
Cash due to custodian | | | 115,519 | |
Investment management fees payable | | | 89,391 | |
Audit and tax fees payable | | | 40,097 | |
Payable for securities purchased | | | 26,026 | |
Payable for series shares redeemed | | | 18,960 | |
Other accrued expenses | | | 17,393 | |
Reports and statements to shareholders expenses payable tonon-affiliates | | | 9,985 | |
Accounting and administration fees payable tonon-affiliates | | | 9,250 | |
Pricing fees payable | | | 2,500 | |
Trustees’ fees and expenses payable | | | 1,643 | |
Dividend disbursing and transfer agent fees and expenses payable to affiliates | | | 1,054 | |
Accounting and administration expenses payable to affiliates | | | 806 | |
Reports and statements to shareholders expenses payable to affiliates | | | 263 | |
Legal fees payable to affiliates | | | 257 | |
Unrealized depreciation on foreign currency exchange contracts | | | 228 | |
| | | | |
| |
Total liabilities | | | 333,372 | |
| | | | |
| |
Total Net Assets | | $ | 166,209,559 | |
| | | | |
| |
Net Assets Consist of: | | | | |
Paid-in capital | | $ | 114,902,412 | |
Total distributable earnings (loss) | | | 51,307,147 | |
| | | | |
| |
Total Net Assets | | $ | 166,209,559 | |
| | | | |
| |
Net Asset Value: | | | | |
Standard Class: | | | | |
Net assets | | $ | 166,209,559 | |
Shares of beneficial interest outstanding, unlimited authorization, no par | | | 6,648,854 | |
Net asset value per share | | $ | 25.00 | |
| | | | |
1Investments, at cost | | $ | 153,937,011 | |
2Foreign currencies, at cost | | | 158,833 | |
See accompanying notes, which are an integral part of the financial statements.
InternationalSeries-9
Delaware VIP® Trust —
Delaware VIP International Series
Statement of operations
Year ended December 31, 2019
| | | | |
Investment Income: | | | | |
Dividends | | $ | 2,526,679 | |
Interest | | | 55,173 | |
Foreign tax withheld | | | (34,418 | ) |
| | | | |
| | | 2,547,434 | |
| | | | |
| |
Expenses: | | | | |
Management fees | | | 1,245,176 | |
Audit and tax fees | | | 38,919 | |
Custodian fees | | | 37,379 | |
Reports and statements to shareholders | | | 30,158 | |
Accounting and administration expenses | | | 15,238 | |
Trustees’ fees and expenses | | | 14,256 | |
Legal fees | | | 3,673 | |
Dividend disbursing and transfer agent fees and expenses | | | 3,135 | |
Other | | | 12,491 | |
| | | | |
| | | 1,400,425 | |
Less expenses waived | | | (59,983 | ) |
Less expenses paid indirectly | | | (779 | ) |
| | | | |
Total operating expenses | | | 1,339,663 | |
| | | | |
Net Investment Income | | | 1,207,771 | |
| | | | |
| |
Net Realized and Unrealized Gain (Loss): | | | | |
Net realized gain (loss) on: | | | | |
Investments1 | | | 40,852,757 | |
Foreign currencies | | | (2,404,958 | ) |
Foreign currency exchange contracts | | | (101,031 | ) |
| | | | |
Net realized gain | | | 38,346,768 | |
| | | | |
Net change in unrealized appreciation (depreciation) of: | | | | |
Investments | | | (4,744,929 | ) |
Foreign currencies | | | 2,238 | |
Foreign currency exchange contracts | | | (215 | ) |
| | | | |
Net change in unrealized appreciation (depreciation) | | | (4,742,906 | ) |
| | | | |
Net Realized and Unrealized Gain | | | 33,603,862 | |
| | | | |
Net Increase in Net Assets Resulting from Operations | | $ | 34,811,633 | |
| | | | |
Delaware VIP Trust —
Delaware VIP International Series
Statements of changes in net assets
| | | | | | | | |
| | | Year ended | |
| | | 12/31/19 | | | 12/31/18 | |
Increase (Decrease) in Net Assets from Operations: | | | | | |
Net investment income | | $ | 1,207,771 | | | $ | 1,315,927 | |
Net realized gain | | | 38,346,768 | | | | 13,130,271 | |
Net change in unrealized appreciation (depreciation) | | | (4,742,906 | ) | | | (34,079,938 | ) |
| | | | | | | | |
Net increase (decrease) in net assets resulting from operations | | | 34,811,633 | | | | (19,633,740 | ) |
| | | | | | | | |
| | |
Dividends and Distributions to Shareholders from: | | | | | | | | |
Distributable earnings: | | | | | | | | |
Standard Class | | | (14,342,500 | ) | | | (8,452,691 | ) |
| | | | | | | | |
| |
Capital Share Transactions: | | | | | |
Proceeds from shares sold: | | | | | |
Standard Class | | | 3,072,061 | | | | 8,719,408 | |
Net asset value of shares based upon reinvestment of dividends and distributions: | | | | | | | | |
Standard Class | | | 14,342,500 | | | | 8,452,691 | |
| | | | | | | | |
| | | 17,414,561 | | | | 17,172,099 | |
| | | | | | | | |
| | |
Cost of shares redeemed: | | | | | | | | |
Standard Class | | | (13,922,284 | ) | | | (6,965,544 | ) |
| | | | | | | | |
Increase in net assets derived from capital share transactions | | | 3,492,277 | | | | 10,206,555 | |
| | | | | | | | |
Net Increase (Decrease) in Net Assets | | | 23,961,410 | | | | (17,879,876 | ) |
| | |
Net Assets: | | | | | | | | |
Beginning of year | | | 142,248,149 | | | | 160,128,025 | |
| | | | | | | | |
End of year | | $ | 166,209,559 | | | $ | 142,248,149 | |
| | | | | | | | |
1Includes $115,119 capital gains taxes paid.
See accompanying notes, which are an integral part of the financial statements.
InternationalSeries-10
Delaware VIP® Trust — Delaware VIP International Series
Financial highlights
Selected data for each share of the Series outstanding throughout each period were as follows:
| | | | | | | | | | | | | | | | | | | | | | | | | | | | | | | | | | | | | | |
| | | Delaware VIP International Series Standard Class
Year ended | | | |
| | | |
| | | 12/31/191 | | | | | | 12/31/18 | | | | | | 12/31/17 | | | | | | 12/31/16 | | | | | | 12/31/15 | | | |
| | | |
Net asset value, beginning of period | | $ | 22.08 | | | | | | | $ | 26.57 | | | | | | | $ | 20.22 | | | | | | | $ | 21.38 | | | | | | | $ | 20.88 | | | |
| | | | | | | | | | |
Income (loss) from investment operations: | | | | | | | | | | | | | | | | | | | | | | | | | | | | | | | | | | | | | | |
Net investment income2 | | | 0.18 | | | | | | | | 0.21 | | | | | | | | 0.22 | | | | | | | | 0.27 | | | | | | | | 0.26 | | | |
Net realized and unrealized gain (loss) | | | 4.97 | | | | | | | | (3.29 | ) | | | | | | | 6.38 | | | | | | | | (1.17 | ) | | | | | | | 0.47 | | | |
| | | | | | | | | | | | | | | | | | | | | | | | | | | | | | | | | | | | | | |
Total from investment operations | | | 5.15 | | | | | | | | (3.08 | ) | | | | | | | 6.60 | | | | | | | | (0.90 | ) | | | | | | | 0.73 | | | |
| | | | | | | | | | | | | | | | | | | | | | | | | | | | | | | | | | | | | | |
| | | | | | | | | | |
Less dividends and distributions from: | | | | | | | | | | | | | | | | | | | | | | | | | | | | | | | | | | | | | | |
Net investment income | | | (0.19 | ) | | | | | | | (0.21 | ) | | | | | | | (0.25 | ) | | | | | | | (0.26 | ) | | | | | | | (0.23 | ) | | |
Net realized gain | | | (2.04 | ) | | | | | | | (1.20 | ) | | | | | | | — | | | | | | | | — | | | | | | | | — | | | |
| | | | | | | | | | | | | | | | | | | | | | | | | | | | | | | | | | | | | | |
Total dividends and distributions | | | (2.23 | ) | | | | | | | (1.41 | ) | | | | | | | (0.25 | ) | | | | | | | (0.26 | ) | | | | | | | (0.23 | ) | | |
| | | | | | | | | | | | | | | | | | | | | | | | | | | | | | | | | | | | | | |
| | | | | | | | | | |
Net asset value, end of period | | $ | 25.00 | | | | | | | $ | 22.08 | | | | | | | $ | 26.57 | | | | | | | $ | 20.22 | | | | | | | $ | 21.38 | | | |
| | | | | | | | | | | | | | | | | | | | | | | | | | | | | | | | | | | | | | |
| | | | | | | | | | |
Total return3 | | | 24.91%4 | | | | | | | | (12.16%) | | | | | | | | 32.96% | | | | | | | | (4.20%) | | | | | | | | 3.49% | | | |
| | | | | | | | | | |
Ratios and supplemental data: | | | | | | | | | | | | | | | | | | | | | | | | | | | | | | | | | | | | | | |
Net assets, end of period (000 omitted) | | $ | 166,210 | | | | | | | $ | 142,248 | | | | | | | $ | 160,128 | | | | | | | $ | 124,439 | | | | | | | $ | 133,691 | | | |
Ratio of expenses to average net assets5 | | | 0.83% | | | | | | | | 0.86% | | | | | | | | 0.84% | | | | | | | | 0.87% | | | | | | | | 0.87% | | | |
Ratio of expenses to average net assets prior to fees waived5 | | | 0.87% | | | | | | | | 0.86% | | | | | | | | 0.84% | | | | | | | | 0.87% | | | | | | | | 0.87% | | | |
Ratio of net investment income to average net assets | | | 0.75% | | | | | | | | 0.84% | | | | | | | | 0.90% | | | | | | | | 1.28% | | | | | | | | 1.22% | | | |
Ratio of net investment income to average net assets prior to fees waived | | | 0.71% | | | | | | | | 0.84% | | | | | | | | 0.90% | | | | | | | | 1.28% | | | | | | | | 1.22% | | | |
Portfolio turnover | | | 144%6 | | | | | | | | 50% | | | | | | | | 29% | | | | | | | | 37% | | | | | | | | 27% | | | |
| 1 | On Oct. 4, 2019, the First Investors Life Series International Fund shares were reorganized into Standard Class shares of the Series. See “Notes to financial statements.” The Standard Class shares financial highlights for the period prior to Oct. 4, 2019, reflect the performance of the First Investors Life Series International Fund shares. |
| 2 | The average shares outstanding method has been applied for per share information. |
| 3 | Total return is based on the change in net asset value of a share during the period and assumes reinvestment of dividends and distributions at net asset value. Total return does not include fees, charges, or expenses imposed by the variable annuity and life insurance contracts for which Delaware VIP Trust serves as an underlying investment vehicle. |
| 4 | Total return during the period reflects a waiver by the manager. Performance would have been lower had the waiver not been in effect. |
| 5 | Expense ratios do not include expenses of the Underlying Funds in which the Series invests. |
| 6 | The Series’ portfolio turnover rate increased substantially during the year ended Dec. 31, 2019 due to a change in the Series’ portfolio managers and associated repositioning. |
See accompanying notes, which are an integral part of the financial statements.
InternationalSeries-11
Delaware VIP® Trust — Delaware VIP International Series
Notes to financial statements
December 31, 2019
Delaware VIP Trust (Trust) is organized as a Delaware statutory trust. The Trust consists of 22 series, each of which is treated as a separate entity for certain matters under the Investment Company Act of 1940, as amended (1940 Act). These financial statements and the related notes pertain to Delaware VIP International Series (Series). The Trust is anopen-end investment company. The Series is considerednon-diversified under the 1940 Act and offers Standard Class shares. The Standard Class shares do not carry a distribution and service(12b-1) fee. The shares of the Series are sold only to separate accounts of life insurance companies.
Before the Series commenced operations, on Oct. 4, 2019, all of the assets and liabilities of the First Investors Life Series International Fund, its respective Predecessor Series (Predecessor Series) were transferred to the Series in atax-free reorganization as set forth in an agreement and plan of reorganization (each a Foresters Reorganization) between the Trust, on behalf of the Series, and Foresters Investment Management Company, Inc. (FIMCO), on behalf of the Predecessor Series. As a result of the Foresters Reorganization, the Series assumed the performance and accounting history of its Predecessor Series. Financial information included for the dates prior to the Foresters Reorganization is that of the Predecessor Series.
1. Significant Accounting Policies
The Series follows accounting and reporting guidance under Financial Accounting Standards Board (FASB) Accounting Standards Codification Topic 946, Financial Services – Investment Companies. The following accounting policies are in accordance with US generally accepted accounting principles (US GAAP) and are consistently followed by the Series.
Security Valuation – Equity securities and exchange-traded funds (ETFs), except those traded on the Nasdaq Stock Market LLC (Nasdaq), are valued at the last quoted sales price as of the time of the regular close of the New York Stock Exchange on the valuation date. Equity securities and ETFs traded on the Nasdaq are valued in accordance with the Nasdaq Official Closing Price, which may not be the last sales price. If, on a particular day, an equity security or ETF does not trade, the mean between the bid and ask prices will be used, which approximates fair value. Equity securities listed on a foreign exchange are normally valued at the last quoted sales price on the valuation date. US government and agency securities are valued at the mean between the bid and ask prices, which approximates fair value.Open-end investment companies are valued at their published net asset value (NAV) per share, as reported by the underlying investment company. Foreign currency exchange contracts and foreign cross currency exchange contracts are valued at the mean between the bid and ask prices, which approximates fair value. Interpolated values are derived when the settlement date of the contract is an interim date for which quotations are not available. Generally, other securities and assets for which market quotations are not readily available are valued at fair value as determined in good faith under the direction of the Trust’s Board of Trustees (Board). In determining whether market quotations are readily available or fair valuation will be used, various factors will be taken into consideration, such as market closures or suspension of trading in a security. The Series may use fair value pricing more frequently for securities traded primarily innon-US markets because, among other things, most foreign markets close well before the Series values its securities, generally as of 4:00pm Eastern time. The earlier close of these foreign markets gives rise to the possibility that significant events, including broad market moves, government actions or pronouncements, aftermarket trading, or news events may have occurred in the interim. Whenever such a significant event occurs, the Series may value foreign securities using fair value prices based on third-party vendor modeling tools (international fair value pricing). Restricted securities are valued at fair value using methods approved by the Board.
Federal and Foreign Income Taxes – No provision for federal income taxes has been made as the Series intends to continue to qualify for federal income tax purposes as a regulated investment company under Subchapter M of the Internal Revenue Code of 1986, as amended, and make the requisite distributions to shareholders. The Series evaluates tax positions taken or expected to be taken in the course of preparing the Series’ tax returns to determine whether the tax positions are“more-likely-than-not” of being sustained by the applicable tax authority. Tax positions not deemed to meet the“more-likely-than-not” threshold are recorded as a tax benefit or expense in the current year. Management has analyzed the Series’ tax positions taken or expected to be taken on the Series’ federal income tax returns through the year ended Dec. 31, 2019 and for all open tax years (years ended Dec. 31, 2016–Dec. 31, 2018), and has concluded that no provision for federal income tax is required in the Series’ financial statements. If applicable, the Series recognizes interest accrued on unrecognized tax benefits in interest expense and penalties in “Other” on the “Statement of operations.” In regard to foreign taxes only, the Series has open tax years in certain foreign countries in which it invests that may date back to the inception of the Series. During the year ended Dec. 31, 2019, the Series did not incur any interest or tax penalties.
Underlying Funds – The Series may invest in other investment companies (Underlying Funds) to the extent permitted by the 1940 Act. The Underlying Funds in which the Series may invest include ETFs. A Series will indirectly bear the investment management fees and other expenses of the Underlying Funds.
Foreign Currency Transactions – Transactions denominated in foreign currencies are recorded at the prevailing exchange rates on the valuation date in accordance with the Series’ prospectus. The value of all assets and liabilities denominated in foreign currencies is translated daily into US dollars at the exchange rate of such currencies against the US dollar. Transaction gains or losses resulting from changes in exchange rates during the reporting period or upon settlement of the foreign currency transaction are reported in operations for the current period. The Series generally does not bifurcate that portion of realized gains and losses on investments attributable to changes in foreign exchange rates from that which is due to changes in market prices. These gains and losses are included on the “Statement of operations” under “Net realized gain (loss) on investments.” The Series reports certain foreign currency
InternationalSeries-12
Delaware VIP® International Series
Notes to financial statements (continued)
1. Significant Accounting Policies (continued)
related transactions as components of realized gains (losses) for financial reporting purposes, whereas such components are treated as ordinary income (loss) for federal income tax purposes.
Use of Estimates – The preparation of financial statements in conformity with US GAAP requires management to make estimates and assumptions that affect the fair value of investments, the reported amounts of assets and liabilities and disclosure of contingent assets and liabilities at the date of the financial statements, and the reported amounts of revenues and expenses during the reporting period. Actual results could differ from those estimates and the differences could be material.
Other – Expenses directly attributable to the Series are charged directly to the Series. Other expenses common to various funds within the Delaware Funds® by Macquarie (Delaware Funds) are generally allocated among such funds on the basis of average net assets. Management fees and certain other expenses are paid monthly. Security transactions are recorded on the date the securities are purchased or sold (trade date) for financial reporting purposes. Costs used in calculating realized gains and losses on the sale of investment securities are those of the specific securities sold. Dividend income is recorded on theex-dividend date and interest income is recorded on the accrual basis. Discounts and premiums on debt securities are accreted or amortized to interest income, respectively, over the lives of the respective securities using the effective interest method. Taxablenon-cash dividends are recorded as dividend income. Foreign dividends are also recorded on theex-dividend date or as soon after theex-dividend date that the Series is aware of such dividends, net of all tax withholdings, a portion of which may be reclaimable. Withholding taxes and reclaims on foreign dividends have been recorded in accordance with the Series’ understanding of the applicable country’s tax rules and rates. The Series may pay foreign capital gains taxes on certain foreign securities held, which are reported as components of realized losses for financial reporting purposes, whereas such components are treated as ordinary loss for federal income tax purposes. The Series declares and pays dividends from net investment income and distributions from net realized gain on investments, if any, following the close of the fiscal year. The Series may distribute more frequently, if necessary for tax purposes. Dividends and distributions, if any, are recorded on theex-dividend date.
The Series receives earnings credits from its custodian when positive cash balances are maintained, which may be used to offset custody fees. The expenses paid under this arrangement are included on the “Statement of operations” under “Custodian fees” with the corresponding expenses offset included under “Less expenses paid indirectly.” For the year ended Dec. 31, 2019, the Series earned $779 under this arrangement.
The Series receives earnings credits from its transfer agent when positive cash balances are maintained, which may be used to offset transfer agent fees. If the amount earned is greater than $1, the expenses paid under this arrangement are included on the “Statement of operations” under “Dividend disbursing and transfer agent fees and expenses” with the corresponding expenses offset included under “Less expenses paid indirectly.” For the year ended Dec. 31, 2019, the Series received no earnings credit under this arrangement.
2. Investment Management, Administration Agreements, and Other Transactions with Affiliates
In accordance with the terms of its investment management agreement, effective Oct. 4, 2019, the Series pays Delaware Management Company (DMC), a series of Macquarie Investment Management Business Trust and the investment manager, an annual fee which is calculated daily and paid monthly at the rates of 0.85% on the first $500 million of average daily net assets of the Series, 0.80% on the next $500 million, 0.75% on the next $1.5 billion, and 0.70% on average daily net assets in excess of $2.5 billion. Prior to Oct. 4, 2019, the Series paid FIMCO, an annual fee which was calculated daily and paid monthly at the rates of 0.75% on the first $250 million of average daily net assets of the Series, 0.72% on the next $250 million, 0.69% on the next $250 million, 0.66% on the next $500 million, 0.64% on the next $500 million, 0.62% on the next $500 million, and 0.60% on average daily net assets in excess of $2.25 billion.
DMC has contractually agreed to waive all or a portion of its investment advisory fees and/or pay/reimburse expenses (excluding any acquired fund fees and expenses, taxes, interest, short sale dividend and interest expenses, brokerage fees, certain insurance costs, and nonroutine expenses or costs, including, but not limited to, those relating to reorganizations, litigation, conducting shareholder meetings, and liquidations), do not exceed 0.86% of the Series’ average daily net assets from Oct. 4, 2019 through Dec. 31, 2019.* These waivers and reimbursements may only be terminated by agreement of DMC and the Series. The waivers and reimbursements are accrued daily and received monthly.
Effective Oct. 4, 2019, DMC may permit its affiliates, Macquarie Investment Management Global Limited (MIMGL) and Macquarie Funds Management Hong Kong Limited (together, the “AffiliatedSub-Advisors”), to execute Series equity security trades on behalf of the Manager. The Manager may also seek quantitative support from MIMGL. Although the AffiliatedSub-Advisors serve assub-advisors, DMC has ultimate responsibility for all investment advisory services. For these services, DMC, not the Series, may pay each AffiliatedSub-Advisor a portion of its investment management fee.
Effective Oct. 4, 2019, Delaware Investments Fund Services Company (DIFSC), an affiliate of DMC, provides fund accounting and financial administration oversight services to the Series. For these services, DIFSC’s fees are calculated daily and paid monthly based on the aggregate daily net assets of all funds within the Delaware Funds at the following annual rates: 0.00475% of the first $35 billion; 0.0040% of the next $10 billion; and 0.0025% of aggregate average daily net assets in excess of $45 billion (Total Fee). Each fund in the Delaware Funds pays a minimum of $4,000, which, in aggregate, is subtracted
InternationalSeries-13
Delaware VIP® International Series
Notes to financial statements (continued)
2. Investment Management, Administration Agreements, and Other Transactions with Affiliates (continued)
from the Total Fee. Each fund then pays its portion of the remainder of the Total Fee on a relative NAV basis. This amount is included on the “Statement of operations” under “Accounting and administration expenses.” For the period Oct. 4, 2019 through year ended Dec. 31, 2019, the Series was charged $2,335 for these services. Prior to Oct. 4, 2019, there were no fund accounting and financial administration oversight services for the Series.
Effective Oct. 4, 2019, DIFSC is also the transfer agent and dividend disbursing agent of the Series. For these services, DIFSC’s fees are calculated daily and paid monthly at the annual rate of 0.0075% of the Series’ average daily net assets. This amount is included on the “Statement of operations” under “Dividend disbursing and transfer agent fees and expenses.” For the period Oct. 4, 2019 through year ended Dec. 31, 2019, the Series was charged $2,986 for these services. Pursuant to asub-transfer agency agreement between DIFSC and BNY Mellon Investment Servicing (US) Inc. (BNYMIS), BNYMIS provides certainsub-transfer agency services to the Series.Sub-transfer agency fees are paid directly by the Series and are also included on the “Statement of operations” under “Dividend disbursing and transfer agent fees and expenses.” The fees that are calculated daily and paid as invoices are received on a monthly or quarterly basis. Prior to Oct. 4, 2019, Foresters Investor Services, Inc. was the transfer agent of the Series.
As provided in the investment management agreement, the Series bears a portion of the cost of certain resources shared with DMC, including the cost of internal personnel of DMC and/or its affiliates that provide legal, tax, and regulatory reporting services to the Series. For the period Oct. 4, 2019 through year ended Dec. 31, 2019, the Series was charged $814 for internal legal, tax, and regulatory reporting services provided by DMC and/or its affiliates’ employees. These amounts are included on the “Statement of operations” under “Legal fees.”
Trustees’ fees include expenses accrued by the Series for each Trustee’s retainer and meeting fees. Certain officers of DMC, DIFSC, and DDLP are officers and/or Trustees of the Trust. These officers and Trustees are paid no compensation by the Series.
In addition to the management fees and other expenses of the Series, the Series indirectly bears the investment management fees and other expenses of the investment companies (Underlying Funds) in which it invests. The amount of these fees and expenses incurred indirectly by the Series will vary based upon the expense and fee levels of the Underlying Funds and the number of shares that are owned of the Underlying Funds at different times.
*The aggregate contractual waiver period covering this report is from Oct. 4, 2019 through Oct. 31, 2021.
3. Investments
For the year ended Dec. 31, 2019, the Series made purchases and sales of investment securities other than short-term investments as follows:
| | | | |
Purchases | | $ | 221,544,640 | |
Sales | | | 224,218,196 | |
The tax cost of investments includes adjustments to net unrealized appreciation (depreciation) which may not necessarily be final tax cost basis adjustments, but approximate the tax basis unrealized gains and losses that may be realized and distributed to shareholders. At Dec. 31, 2019, the cost and unrealized appreciation (depreciation) of investments and derivatives for federal income tax purposes for the Series were as follows:
| | | | | | |
Cost of
Investments
and Derivatives | | Aggregate
Unrealized
Appreciation of Investments
and Derivatives | | Aggregate
Unrealized
Depreciation of Investments
and Derivatives | | Net Unrealized
Appreciation of Investments
and Derivatives |
| $153,950,104 | | $15,334,402 | | $(3,354,576) | | $11,979,826 |
US GAAP defines fair value as the price that the Series would receive to sell an asset or pay to transfer a liability in an orderly transaction between market participants at the measurement date under current market conditions. A three-level hierarchy for fair value measurements has been established based upon the transparency of inputs to the valuation of an asset or liability. Inputs may be observable or unobservable and refer broadly to the assumptions that market participants would use in pricing the asset or liability. Observable inputs reflect the assumptions that market participants would use in pricing the asset or liability based on market data obtained from sources independent of the reporting entity. Unobservable inputs reflect the reporting entity’s own assumptions about the assumptions that market participants would use in pricing the asset or liability based on the best information available under the circumstances. The Series’ investment in its entirety is assigned a level based upon the observability of the inputs which are significant to the overall valuation. The three-level hierarchy of inputs is summarized below and on the next page.
| | | | |
| Level 1 | | – | | Inputs are quoted prices in active markets for identical investments. (Examples: equity securities,open-end investment companies, futures contracts, and exchange-traded options contracts) |
InternationalSeries-14
Delaware VIP® International Series
Notes to financial statements (continued)
3. Investments (continued)
| | | | |
| Level 2 | | – | | Other observable inputs, including, but not limited to: quoted prices for similar assets or liabilities in markets that are active, quoted prices for identical or similar assets or liabilities in markets that are not active, inputs other than quoted prices that are observable for the assets or liabilities (such as interest rates, yield curves, volatilities, prepayment speeds, loss severities, credit risks, and default rates) or other market-corroborated inputs. (Examples: debt securities, government securities, swap contracts, foreign currency exchange contracts, foreign securities utilizing international fair value pricing, broker-quoted securities, and fair valued securities) |
| Level 3 | | – | | Significant unobservable inputs, including the Series’ own assumptions used to determine the fair value of investments. (Examples: broker-quoted securities and fair valued securities) |
Level 3 investments are valued using significant unobservable inputs. The Series may also use an income-based valuation approach in which the anticipated future cash flows of the investment are discounted to calculate fair value. Discounts may also be applied due to the nature or duration of any restrictions on the disposition of the investments. Valuations may also be based upon current market prices of securities that are comparable in coupon, rating, maturity, and industry. The derived value of a Level 3 investment may not represent the value which is received upon disposition and this could impact the results of operations.
The following table summarizes the valuation of the Series’ investments by fair value hierarchy levels as of Dec. 31, 2019:
| | | | | | | | | | | | |
Securities | | Level 1 | | | Level 2 | | | Total | |
Assets: | | | | | | | | | | | | |
Common Stock | | | | | | | | | | | | |
Denmark | | $ | — | | | $ | 11,159,786 | | | $ | 11,159,786 | |
France | | | 41,999,913 | | | | — | | | | 41,999,913 | |
Germany | | | 2,730,577 | | | | 8,258,834 | | | | 10,989,411 | |
Ireland | | | 2,374,028 | | | | — | | | | 2,374,028 | |
Japan | | | — | | | | 35,734,559 | | | | 35,734,559 | |
Netherlands | | | 11,822,424 | | | | — | | | | 11,822,424 | |
Sweden | | | — | | | | 6,562,438 | | | | 6,562,438 | |
Switzerland | | | — | | | | 25,438,485 | | | | 25,438,485 | |
United Kingdom | | | 16,572,497 | | | | — | | | | 16,572,497 | |
Exchange-Traded Funds | | | 3,276,604 | | | | — | | | | 3,276,604 | |
| | | | | | | | | | | | |
Total Value of Securities | | $ | 78,776,043 | | | $ | 87,154,102 | | | $ | 165,930,145 | |
| | | | | | | | | | | | |
| | | |
Derivatives1 | | | | | | | | | | | | |
Assets: | | | | | | | | | | | | |
Foreign Currency Exchange Contract | | $ | — | | | $ | 13 | | | $ | 13 | |
| | | | | | | | | | | | |
| | | |
Liabilities: | | | | | | | | | | | | |
Foreign Currency Exchange Contracts | | $ | — | | | $ | (228 | ) | | $ | (228 | ) |
| | | | | | | | | | | | |
1Foreign currency exchange contracts are valued at the unrealized appreciation (depreciation) on the instrument at the period end.
As a result of utilizing international fair value pricing at Dec. 31, 2019, a portion of the common stock in the portfolio was categorized as Level 2.
During the year ended Dec. 31, 2019, there were no transfers between Level 1 investments, Level 2 investments, or Level 3 investments that had a significant impact to the Series. This does not include transfers between Level 1 investments and Level 2 investments due to the Series utilizing international fair value pricing during the period. In accordance with the fair valuation procedures described in Note 1, international fair value pricing of securities occurs when market volatility exceeds an established rolling threshold. If the threshold is exceeded on a given date, then prices of international securities (those that traded on exchanges that close at a different time than the time that the Series’ NAV is determined) are established using a separate pricing feed from a third-party vendor designed to establish a price for each such security as of the time that the Series’ NAV is determined. Further, international fair value pricing uses other observable market-based inputs in place of the closing exchange price due to the events occurring after the close of the exchange or market on which the investment is principally traded, causing a change in classification between levels. The Series’ policy is to recognize transfers between levels based on fair value at the beginning of the reporting period.
A reconciliation of Level 3 investments is presented when the Series has a significant amount of Level 3 investments at the beginning, interim, or end of the period in relation to net assets. During the year ended Dec. 31, 2019, there were no Level 3 investments.
InternationalSeries-15
Delaware VIP® International Series
Notes to financial statements (continued)
4. Dividend and Distribution Information
Income and long-term capital gain distributions are determined in accordance with federal income tax regulations, which may differ from US GAAP. Additionally, distributions from net gains on foreign currency transactions and net short-term gains on sales of investment securities are treated as ordinary income for federal income tax purposes. The tax character of dividends and distributions paid during the years ended Dec. 31, 2019 and 2018 was as follows:
| | | | | | | | |
| | | Year ended | |
| | | 12/31/19 | | | 12/31/18 | |
Ordinary income | | | $ 1,247,879 | | | | $1,252,901 | |
Long-term capital gains | | | 13,094,621 | | | | 7,199,790 | |
| | | | | | | | |
| | | $14,342,500 | | | | $8,452,691 | |
| | | | | | | | |
5. Components of Net Assets on a Tax Basis
As of Dec. 31, 2019, the components of net assets on a tax basis were as follows:
| | | | |
Shares of beneficial interest | | | $114,902,412 | |
Undistributed ordinary income | | | 10,292,688 | |
Undistributed long-term capital gains | | | 29,034,633 | |
Net unrealized appreciation on investments and derivatives | | | 11,979,826 | |
| | | | |
Net assets | | | $166,209,559 | |
| | | | |
The differences between the book basis and tax basis components of net assets are primarily attributable to tax deferral of losses on wash sales andmark-to-market of forward currency contracts.
6. Capital Shares
Transactions in capital shares were as follows:
| | | | | | | | |
| | | Year ended | |
| | | 12/31/19 | | | 12/31/18 | |
Shares sold: | | | | | | | | |
Standard Class | | | 132,352 | | | | 355,497 | |
Shares issued upon reinvestment of dividends and distributions: | | | | | | | | |
Standard Class | | | 662,471 | | | | 342,492 | |
| | | | | | | | |
| | | 794,823 | | | | 697,989 | |
| | | | | | | | |
Shares redeemed: | | | | | | | | |
Standard Class | | | (587,301 | ) | | | (282,708 | ) |
| | | | | | | | |
Net increase | | | 207,522 | | | | 415,281 | |
| | | | | | | | |
7. Line of Credit
On Nov. 4, 2019, the Series, along with certain other funds in the Delaware Funds (Participants), is a participant in a $250,000,000 revolving line of credit intended to be used for temporary or emergency purposes as an additional source of liquidity to fund redemptions of investor shares. Under the agreement, the Participants are charged an annual commitment fee of 0.15%, which is allocated across the Participants based on a weighted average of the respective net assets of each Participant. The Participants are permitted to borrow up to a maximum ofone-third of their net assets under the agreement. Each Participant is individually, and not jointly, liable for its particular advances, if any, under the line of credit. The line of credit available under the agreement expires on Nov. 2, 2020.
The Series had no amounts outstanding as of Dec. 31, 2019, or at any time during the period then ended.
8. Derivatives
US GAAP requires disclosures that enable investors to understand: (1) how and why an entity uses derivatives; (2) how they are accounted for; and (3) how they affect an entity’s results of operations and financial position.
InternationalSeries-16
Delaware VIP® International Series
Notes to financial statements (continued)
8. Derivatives (continued)
Foreign Currency Exchange Contracts
The Series may enter into foreign currency exchange contracts and foreign cross currency exchange contracts as a way of managing foreign exchange rate risk. The Series may enter into these contracts to fix the US dollar value of a security that it has agreed to buy or sell for the period between the date the trade was entered into and the date the security is delivered and paid for. The Series may also use these contracts to hedge the US dollar value of securities it already owns that are denominated in foreign currencies. In addition, the Series may enter into these contracts to facilitate or expedite the settlement of portfolio transactions. The change in value is recorded as an unrealized gain or loss. When the contract is closed, a realized gain or loss is recorded equal to the difference between the value of the contract at the time it was opened and the value at the time it was closed.
The use of foreign currency exchange contracts and foreign cross currency exchange contracts does not eliminate fluctuations in the underlying prices of the securities, but does establish a rate of exchange that can be achieved in the future. Although foreign currency exchange contracts and foreign cross currency exchange contracts limit the risk of loss due to an unfavorable change in the value of the hedged currency, they also limit any potential gain that might result should the value of the currency change favorably. In addition, the Series could be exposed to risks if the counterparties to the contracts are unable to meet the terms of their contracts. The Series’ maximum risk of loss from counterparty credit risk is the value of its currency exchanged with the counterparty. The risk is generally mitigated by having a netting arrangement between the Series and the counterparty and by the posting of collateral by the counterparty to the Series to cover the Series’ exposure to the counterparty.
During the year ended Dec. 31, 2019, the Series entered into foreign currency exchange contracts and foreign cross currency exchange contracts to fix the US dollar value of a security between trade date and settlement date, to hedge the value of securities it already owns which are denominated in foreign currencies, and to facilitate or expedite the settlement of portfolio transactions.
At Dec. 31, 2019, the Series experienced net realized and unrealized gains or losses attributable to foreign currency holdings, which are disclosed on the “Statement of assets and liabilities” and “Statement of operations.”
The table below summarizes the quarterly average balance of derivative holdings by the Series during the year ended Dec. 31, 2019.
| | | | |
| | | Long | | Short |
| | | Derivatives | | Derivatives |
| | | Volume | | Volume |
Foreign currency exchange contracts (average notional value) | | $24,449 | | $ – |
9. Offsetting
The Series entered into an International Swaps and Derivatives Association, Inc. Master Agreement (ISDA Master Agreement) or a similar agreement with certain of their derivative contract counterparties in order to better define its contractual rights and to secure rights that will help the Series mitigate its counterparty risk. An ISDA Master Agreement is a bilateral agreement between the Series and a counterparty that governsover-the-counter (OTC) derivatives and foreign exchange contracts and typically contains, among other things, collateral posting items and netting provisions in the event of a default and/or termination event. Under an ISDA Master Agreement, the Series may, under certain circumstances, offset with the counterparty certain derivative financial instrument’s payables and/or receivables with collateral held and/or posted and create one single net payment. The provisions of the ISDA Master Agreement typically permit a single net payment in the event of default(close-out), including the bankruptcy or insolvency of the counterparty. However, bankruptcy or insolvency laws of a particular jurisdiction may impose restrictions on or prohibitions against the right of offset in bankruptcy, insolvency, or other events.
For financial reporting purposes, the Series does not offset derivative assets and derivative liabilities that are subject to netting arrangements on the “Statement of assets and liabilities.”
At Dec. 31, 2019, the Series had the following assets and liabilities subject to offsetting provisions:
Offsetting of Financial Assets and Liabilities and Derivative Assets and Liabilities
| | | | | | |
| | | Gross Value of | | Gross Value of | | |
Counterparty | | Derivative Asset | | Derivative Liability | | Net Position |
The Bank of New York Mellon | | $13 | | $(228) | | $(215) |
InternationalSeries-17
Delaware VIP® International Series
Notes to financial statements (continued)
9. Offsetting (continued)
Offsetting of Financial Assets and Liabilities and Derivative Assets and Liabilities (continued)
| | | | | | | | | | | | |
Counterparty | | Net Position | | Fair Value of
Non-Cash
Collateral Received | | Cash Collateral
Received | | Fair Value of
Non-Cash
Collateral Pledged | | Cash Collateral
Pledged | | Net Exposure(a) |
The Bank of New York Mellon | | $(215) | | $— | | $— | | $— | | $— | | $(215) |
(a)Net exposure represents the receivable (payable) that would be due from (to) the counterparty in the event of default.
10. Securities Lending
Effective Oct. 4, 2019, the Series, along with other funds in the Delaware Funds, may lend its securities pursuant to a security lending agreement (Lending Agreement) with The Bank of New York Mellon (BNY Mellon). At the time a security is loaned, the borrower must post collateral equal to the required percentage of the market value of the loaned security, including any accrued interest. The required percentage is: (1) 102% with respect to US securities and foreign securities that are denominated and payable in US dollars; and (2) 105% with respect to foreign securities. With respect to each loan, if on any business day, the aggregate market value of securities collateral plus cash collateral held is less than the aggregate market value of the securities which are the subject of such loan, the borrower will be notified to provide additional collateral by the end of the following business day, which, together with the collateral already held, will be not less than the applicable initial collateral requirements for such security loan. If the aggregate market value of securities collateral and cash collateral held with respect to a security loan exceeds the applicable initial collateral requirement, upon the request of the borrower, BNY Mellon must return enough collateral to the borrower by the end of the following business day to reduce the value of the remaining collateral to the applicable initial collateral requirement for such security loan. As a result of the foregoing, the value of the collateral held with respect to a loaned security on any particular day, may be more or less than the value of the security on loan. The collateral percentage with respect to the market value of the loaned security is determined by the security lending agent.
Cash collateral received by each series of the Trust is generally invested in a series of individual separate accounts, each corresponding to a series. The investment guidelines permit each separate account to hold certain securities that would be considered eligible securities for a money market fund. Cash collateral received is generally invested in government securities; certain obligations issued by government sponsored enterprises; repurchase agreements collateralized by US Treasury securities; obligations issued by the central government of any Organization for Economic Cooperation and Development (OECD) country or its agencies, instrumentalities, or establishments; obligations of supranational organizations; commercial paper, notes, bonds, and other debt obligations; certificates of deposit, time deposits, and other bank obligations; and asset-backed securities. The Series can also accept US government securities and letters of credit(non-cash collateral) in connection with securities loans.
In the event of default or bankruptcy by the lending agent, realization and/or retention of the collateral may be subject to legal proceedings. In the event the borrower fails to return loaned securities and the collateral received is insufficient to cover the value of the loaned securities and provided such collateral shortfall is not the result of investment losses, the lending agent has agreed to pay the amount of the shortfall to the Series or, at the discretion of the lending agent, replace the loaned securities. The Series continues to record dividends or interest, as applicable, on the securities loaned and is subject to changes in value of the securities loaned that may occur during the term of the loan. The Series has the right under the Lending Agreement to recover the securities from the borrower on demand. With respect to security loans collateralized bynon-cash collateral, the Series receives loan premiums paid by the borrower. With respect to security loans collateralized by cash collateral, the earnings from the collateral investments are shared among the Series, the security lending agent, and the borrower. The Series records security lending income net of allocations to the security lending agent and the borrower.
The Series may incur investment losses as a result of investing securities lending collateral. This could occur if an investment in the collateral investment account defaulted or became impaired. Under those circumstances, the value of the Series’ cash collateral account may be less than the amount the Series would be required to return to the borrowers of the securities and the Series would be required to make up for this shortfall.
During the year ended Dec. 31, 2019, the Series had no securities out on loan.
11. Credit and Market Risk
Some countries in which the Series may invest require governmental approval for the repatriation of investment income, capital, or the proceeds of sales of securities by foreign investors. In addition, if there is deterioration in a country’s balance of payments or for other reasons, a country may impose temporary restrictions on foreign capital remittances abroad.
The securities exchanges of certain foreign markets are substantially smaller, less liquid, and more volatile than the major securities markets in the United States. Consequently, acquisition and disposition of securities by the Series may be inhibited. In addition, a significant portion of the aggregate market value of equity securities listed on the major securities exchanges in emerging markets is held by a smaller number of investors. This may limit the number of shares available for acquisition or disposition by the Series.
InternationalSeries-18
Delaware VIP® International Series
Notes to financial statements (continued)
11. Credit and Market Risk (continued)
The Series may invest up to 10% of its net assets in illiquid securities, which may include securities with contractual restrictions on resale, securities exempt from registration under Rule 144A, promulgated under the Securities Act of 1933, as amended, and other securities which may not be readily marketable. The relative illiquidity of these securities may impair the Series from disposing of them in a timely manner and at a fair price when it is necessary or desirable to do so. While maintaining oversight, the Board has delegated to DMC theday-to-day functions of determining whether individual securities are liquid for purposes of the Series’ limitation on investments in illiquid securities. Securities eligible for resale pursuant to Rule 144A, which are determined to be liquid, are not subject to the Series’ 10% limit on investments in illiquid securities. As of Dec. 31, 2019, there were no Rule 144A securities held by the Series.
12. Contractual Obligations
The Series enters into contracts in the normal course of business that contain a variety of indemnifications. The Series’ maximum exposure under these arrangements is unknown. However, the Series has not had prior claims or losses pursuant to these contracts. Management has reviewed the Series’ existing contracts and expects the risk of loss to be remote.
13. Recent Accounting Pronouncements
In August 2018, the FASB issued an Accounting Standards Update (ASU), ASU2018-13, which changes certain fair value measurement disclosure requirements. The ASU2018-13, in addition to other modifications and additions, removes the requirement to disclose the amount and reasons for transfers between Level 1 and Level 2 of the fair value hierarchy, the policy for the timing of transfers between levels and the valuation process for Level 3 fair value measurements. The ASU2018-13 is effective for fiscal years, and interim periods within those fiscal years, beginning after Dec. 15, 2019. At this time, management is evaluating the implications of these changes on the financial statements.
14. Subsequent Events
Management has determined that no material events or transactions occurred subsequent to Dec. 31, 2019, that would require recognition or disclosure in the Series’ financial statements.
InternationalSeries-19
Delaware VIP® Trust — Delaware VIP International Series
Report of independent registered public accounting firm
To the Board of Trustees of Delaware VIP® Trust and Shareholders of Delaware VIP International Series
Opinion on the Financial Statements
We have audited the accompanying statement of assets and liabilities, including the schedule of investments, of Delaware VIP International Series (one of the series constituting Delaware VIP® Trust, referred to hereafter as the “Series”) as of December 31, 2019, the related statements of operations and changes in net assets, including the related notes, and the financial highlights for the year then ended (collectively referred to as the “financial statements”). In our opinion, the financial statements present fairly, in all material respects, the financial position of the Series as of December 31, 2019, the results of its operations, changes in its net assets, and the financial highlights for the year then ended in conformity with accounting principles generally accepted in the United States of America.
The financial statements of First Investors Life Series International Fund (subsequent to reorganization, known as Delaware VIP International Series) as of and for the year ended December 31, 2018 and the financial highlights for each of the periods ended on or prior to December 31, 2018 (not presented herein, other than the statement of changes in net assets and the financial highlights) were audited by other auditors whose report dated February 26, 2019 expressed an unqualified opinion on those financial statements and financial highlights.
Basis for Opinion
These financial statements are the responsibility of the Series’ management. Our responsibility is to express an opinion on the Series’ financial statements based on our audit. We are a public accounting firm registered with the Public Company Accounting Oversight Board (United States) (PCAOB) and are required to be independent with respect to the Series in accordance with the U.S. federal securities laws and the applicable rules and regulations of the Securities and Exchange Commission and the PCAOB.
We conducted our audit of these financial statements in accordance with the standards of the PCAOB. Those standards require that we plan and perform the audit to obtain reasonable assurance about whether the financial statements are free of material misstatement, whether due to error or fraud.
Our audit included performing procedures to assess the risks of material misstatement of the financial statements, whether due to error or fraud, and performing procedures that respond to those risks. Such procedures included examining, on a test basis, evidence regarding the amounts and disclosures in the financial statements. Our audit also included evaluating the accounting principles used and significant estimates made by management, as well as evaluating the overall presentation of the financial statements. Our procedures included confirmation of securities owned as of December 31, 2019 by correspondence with the custodian and brokers. We believe that our audit provides a reasonable basis for our opinion.
/s/PricewaterhouseCoopers LLP
Philadelphia, Pennsylvania
February 28, 2020
We have served as the auditor of one or more investment companies in Delaware Funds® by Macquarie since 2010.
InternationalSeries-20
Delaware VIP® Trust — Delaware VIP International Series
Other Series information (Unaudited)
Tax Information
All disclosures are based on financial information available as of the date of this annual report and, accordingly are subject to change. For any and all items requiring reporting, it is the intention of the Series to report the maximum amount permitted under the Internal Revenue Code and the regulations thereunder.
For the year ended Dec. 31, 2019, the Series reports distributions paid during the year as follows:
| | | | |
(A) Long-
Term Capital
Gain
Distributions
(Tax Basis) | | (B)
Ordinary Income
Distributions
(Tax Basis) | | Total
Distributions
(Tax Basis) |
| 91.30% | | 8.70% | | 100.00% |
(A) and (B) are based on a percentage of the Series’ total distributions.
InternationalSeries-21
Delaware Funds® by Macquarie
Board of trustees / directors and officers addendum
A mutual fund is governed by a Board of Trustees/Directors (“Trustees”), which has oversight responsibility for the management of a fund’s business affairs. Trustees establish procedures and oversee and review the performance of the investment manager, the distributor, and others who perform services for the fund. The independent fund trustees, in particular, are advocates for shareholder interests. Each trustee has served in that capacity since he or she was elected to or appointed to the Board of Trustees, and will continue to serve until his or her retirement or the election of a new trustee in his or her place. The following is a list of the Trustees and Officers with certain background and related information.
| | | | | | | | | | |
Name, Address, and Birth Date | | Position(s) Held with Fund(s) | | Length of Time Served | | Principal Occupation(s) During the
Past Five Years | | Number of
Portfolios in Fund
Complex Overseen
by Trustee
or Officer | | Other
Directorships
Held by Trustee
or Officer |
| INTERESTED TRUSTEE | | | | | | | | | | |
| | | | | |
Shawn K. Lytle1
2005 Market Street Philadelphia, PA 19103 February 1970 | | President, Chief Executive Officer, and Trustee | | President and Chief Executive Officer since August 2015 Trustee since September 2015 | | President — Macquarie Investment Management2(June 2015-Present) Regional Head of Americas — UBS Global Asset Management
(April 2010-May 2015) | | 95 | | Trustee — UBS Relationship Funds, SMA Relationship Trust, and UBS Funds (May 2010–April 2015) |
INDEPENDENT TRUSTEES | | | | | | |
| | | | | |
| Thomas L. Bennett | | Chair and Trustee | | Trustee since | | Private Investor | | 95 | | None |
| 2005 Market Street | | | | March 2005 | | (March 2004–Present) | | | | |
| Philadelphia, PA 19103 | | | | | | | | | | |
| | | | | |
| October 1947 | | | | Chair since March 2015 | | | | | | |
| Jerome D. Abernathy | | Trustee | | Since | | Managing Member, | | 95 | | None |
| 2005 Market Street | | | | January 2019 | | Stonebrook Capital | | | | |
| Philadelphia, PA 19103 | | | | | | Management, LLC | | | | |
| | | | | | (financial technology: macro | | | | |
| July 1959 | | | | | | factors and databases) | | | | |
| | | | | | | (January 1993–Present) | | | | |
| Ann D. Borowiec | | Trustee | | Since | | Chief Executive Officer, | | 95 | | Director — |
| 2005 Market Street | | | | March 2015 | | Private Wealth Management | | | | Banco Santander International |
| Philadelphia, PA 19103 | | | | | | (2011–2013) and Market Manager, | | | | (October 2016–December |
| | | | | | New Jersey Private Bank | | | | 2019) |
| November 1958 | | | | | | (2005–2011) — | | | | |
| | | | | | J.P. Morgan Chase & Co. | | | | Director — |
| | | | | | | | | | Santander Bank, N.A. |
| | | | | | | | | | (December 2016–December |
| | | | | | | | | | | 2019) |
| Joseph W. Chow | | Trustee | | Since | | Private Investor | | 95 | | Director and Audit |
| 2005 Market Street | | | | January 2013 | | (April 2011–Present) | | | | Committee |
| Philadelphia, PA 19103 | | | | | | | | | | Member — Hercules |
| | | | | | | | | | Technology Growth |
| January 1953 | | | | | | | | | | Capital, Inc. |
| | | | | | | | | | | (July 2004–July 2014) |
InternationalSeries-22
| | | | | | | | | | |
Name, Address, and Birth Date | | Position(s) Held with Fund(s) | | Length of Time Served | | Principal Occupation(s) During the
Past Five Years | | Number of
Portfolios in Fund
Complex Overseen
by Trustee
or Officer | | Other
Directorships
Held by Trustee
or Officer |
John A. Fry
2005 Market Street Philadelphia, PA 19103 May 1960 | | Trustee | | Since January 2001 | | President — Drexel University (August 2010–Present) President — Franklin & Marshall College (July 2002–July 2010) | | 95 | | Director; Compensation Committee and Governance Committee Member — Community Health Systems (May 2004–Present) Director — Drexel Morgan & Co.
(2015–Present) Director and Audit Committee Member — vTv Therapeutics LLC (2017–Present) Director and Audit Committee Member — FS Credit Real Estate Income Trust, Inc. (2018–Present) Director — Federal Reserve Bank of Philadelphia
(January 2020–Present) |
| Lucinda S. Landreth | | Trustee | | Since | | Private Investor | | 95 | | None |
| 2005 Market Street | | | | March 2005 | | (2004–Present) | | | | |
| Philadelphia, PA 19103 | | | | | | | | | | |
| | | | | |
| June 1947 | | | | | | | | | | |
| | | | | |
Frances A. Sevilla-Sacasa 2005 Market Street Philadelphia, PA 19103 January 1956 | | Trustee | | Since
September 2011 | | Private Investor(January 2017-Present) Chief Executive Officer — Banco Itaú International (April 2012–December 2016) Executive Advisor to Dean (August 2011–March 2012) and Interim Dean
(January 2011–July 2011) — University of Miami School of Business Administration President — U.S. Trust, Bank of America Private Wealth Management (Private Banking)
(July 2007–December 2008) | | 95 | | Trust Manager and Audit Committee Chair — Camden Property Trust (August 2011–Present) Director; Strategic Planning and Reserves Committee and Nominating and Governance Committee Member — Callon Petroleum Company (December 2019–Present) Director; Audit Committee Member — Carrizo Oil & Gas, Inc. (March 2018–December 2019) |
| | | | | |
Thomas K. Whitford 2005 Market Street Philadelphia, PA 19103 March 1956 | | Trustee | | Since
January 2013 | | Vice Chairman
(2010–April 2013) —
PNC Financial Services Group | | 95 | | Director — HSBC North America Holdings Inc. (December 2013-Present) Director — HSBC USA Inc. (July 2014-Present) Director — HSBC Bank USA, National Association (July 2014-March 2017) Director — HSBC Finance Corporation (December 2013-April 2018) |
InternationalSeries-23
| | | | | | | | | | |
Name, Address, and Birth Date | | Position(s) Held with Fund(s) | | Length of Time Served | | Principal Occupation(s) During the
Past Five Years | | Number of
Portfolios in Fund
Complex Overseen
by Trustee
or Officer | | Other
Directorships
Held by Trustee
or Officer |
Christianna Wood
2005 Market Street
Philadelphia, PA 19103 March 1956 | | Trustee | | Since
January 2019 | | Chief Executive Officer and President — Gore Creek Capital, Ltd. (August 2009–Present) | | 95 | | Director; Finance Committee and Audit Committee Member — H&R Block Corporation (July 2008–Present) |
| | | | | |
| | | | | | | | | | Director; Chair of Investments Committee and Audit Committee Member — Grange Insurance (2013–Present) |
| | | | | |
| | | | | | | | | | Trustee; Chair of Nominating and Governance Committee and Audit Committee Member — The Merger Fund (2013–Present), The Merger Fund VL (2013–Present); WCM Alternatives: Event-Driven Fund (2013–Present), and WCM Alternatives: Credit Event Fund (December 2017–Present) |
| | | | | |
| | | | | | | | | | Director; Chair of Governance Committee and Audit Committee Member — International Securities Exchange (2010–2016) |
| | | | | | |
Janet L. Yeomans 2005 Market Street Philadelphia, PA 19103 July 1948 | | Trustee | | Since
April 1999 | | Vice President and Treasurer (January 2006–July 2012), Vice President — Mergers & Acquisitions (January 2003–January 2006), and Vice President and Treasurer (July 1995–January 2003) — 3M Company | | 95 | | Director; Personnel and Compensation Committee Chair; Member of Nominating, Investments, and Audit Committees for various periods throughout directorship — Okabena Company (2009-2017) |
InternationalSeries-24
| | | | | | | | | | |
Name, Address, and Birth Date | | Position(s) Held with Fund(s) | | Length of Time Served | | Principal Occupation(s) During the
Past Five Years | | Number of
Portfolios in Fund
Complex Overseen
by Trustee
or Officer | | Other
Directorships
Held by Trustee
or Officer |
| OFFICERS | | | | | | | | | | |
| | | | | |
David F. Connor 2005 Market Street Philadelphia, PA 19103 December 1963 | | Senior
Vice President, General Counsel, and Secretary | | Senior Vice President, since May 2013; General Counsel since May 2015; Secretary since October 2005 | | David F. Connor has served in various capacities at different times at Macquarie Investment Management. | | 95 | | None3 |
| | | | | |
Daniel V. Geatens 2005 Market Street Philadelphia, PA 19103 October 1972 | | Vice President
and Treasurer | | Vice President and Treasurer
since October 2007 | | Daniel V. Geatens has served in various capacities at different times at Macquarie Investment Management. | | 95 | | None3 |
| | | | | |
Richard Salus 2005 Market Street Philadelphia, PA 19103 October 1963 | | Senior
Vice President
and
Chief Financial
Officer | | Senior Vice President
and Chief Financial Officer since November 2006 | | Richard Salus has served in various capacities at different times at Macquarie Investment Management. | | 95 | | None |
| 1 | Shawn K. Lytle is considered to be an “Interested Trustee” because he is an executive officer of the Fund’s(s’) investment advisor. |
| 2 | Macquarie Investment Management is the marketing name for Macquarie Management Holdings, Inc. and its subsidiaries, including the Fund’s(s’) investment advisor, principal underwriter, and its transfer agent. |
| 3 | David F. Connor and Daniel V. Geatens serve in similar capacities for the six portfolios of the Optimum Fund Trust, which have the same investment advisor, principal underwriter, and transfer agent as the registrant. Mr. Geatens also serves as the Chief Financial Officer of the Optimum Fund Trust and he is the Chief Financial Officer and Treasurer for Macquarie Global Infrastructure Total Return Fund Inc. |
The Statement of Additional Information for the Fund(s) includes additional information about the Trustees and Officers and is available, without charge, upon request by calling 800523-1918.
InternationalSeries-25
| | | | |
| | The Series files its complete schedule of portfolio holdings with the Securities and Exchange Commission (SEC) for the first and third quarters of each fiscal year on FormN-Q or FormN-PORT (available for filings after March 31, 2019). The Series’ FormsN-Q or FormsN-PORT, as well as a description of the policies and procedures that the Series uses to determine how to vote proxies (if any) relating to portfolio securities, are available without charge (i) upon request, by calling 800523-1918; and (ii) on the SEC’s website at sec.gov. In addition, a description of the policies and procedures that the Series uses to determine how to vote proxies (if any) relating to portfolio securities and the Schedule of Investments included in the Series’ most recent FormN-Q or FormN-PORT are available without charge on the Series’ website at delawarefunds.com/vip/literature. The Series’ FormsN-Q and FormsN-PORT may be reviewed and copied at the SEC’s Public Reference Room in Washington, D.C.; information on the operation of the Public Reference Room may be obtained by calling 800SEC-0330. Information (if any) regarding how the Series voted proxies relating to portfolio securities during the most recently disclosed12-month period ended June 30 is available without charge (i) through the Series’ website at delawarefunds.com/proxy; and (ii) on the SEC’s website at sec.gov. | | |
| | |
| AR-VIPINT 22496 (2/20) (1076649) | | InternationalSeries-26 |
Delaware VIP® Trust
Delaware VIP Investment Grade Series
(formerly, First Investors Life Series Investment Grade Fund)
December 31, 2019
|
Beginning on or about June 1, 2021, as permitted by regulations adopted by the Securities and Exchange Commission, paper copies of your Series’ shareholder reports will no longer be sent to you by mail, unless you specifically request them from the Series or from your financial intermediary, such as a broker/dealer, bank, or insurance company. Instead, you will be notified by mail each time a report is posted on the website and provided with a link to access the report. If you already elected to receive shareholder reports electronically, you will not be affected by this change and you do not need to take any action. You may elect to receive paper copies of all future shareholder reports free of charge. You can inform the Series that you wish to continue receiving paper copies of your shareholder reports by contacting us at 800523-1918. If you own these shares through a financial intermediary, you may contact your financial intermediary to elect to continue to receive paper copies of your shareholder reports. Your election to receive reports in paper will apply to all funds held with the Delaware Funds® by Macquarie or your financial intermediary. |
Table of contents
Other than Macquarie Bank Limited (MBL), none of the entities noted are authorized deposit-taking institutions for the purposes of the Banking Act 1959 (Commonwealth of Australia). The obligations of these entities do not represent deposits or other liabilities of MBL. MBL does not guarantee or otherwise provide assurance in respect of the obligations of these entities, unless noted otherwise. The Series is governed by US laws and regulations.
Unless otherwise noted, views expressed herein are current as of Dec. 31, 2019, and subject to change for events occurring after such date.
The Series is not FDIC insured and is not guaranteed. It is possible to lose the principal amount invested.
Advisory services provided by Delaware Management Company, a series of Macquarie Investment Management Business Trust (MIMBT), a US registered investment advisor.
The Series is distributed byDelaware Distributors, L.P.(DDLP), an affiliate of MIMBT and Macquarie Group Limited. Macquarie Investment Management (MIM) is the marketing name for certain companies comprising the asset management division of Macquarie Group Limited and its subsidiaries and affiliates worldwide.
This material may be used in conjunction with the offering of shares in Delaware VIP® Investment Grade Series only if preceded or accompanied by the Series’ current prospectus or the summary prospectus.
© 2020 Macquarie Management Holdings, Inc.
All third-party marks cited are the property of their respective owners.
| | |
Delaware VIP®Trust — Delaware VIP Investment Grade Series |
Portfolio management review | | January 7, 2020 (Unaudited) |
The investment objective of the Series is to seek generate a maximum level of income consistent with investment primarily in investment grade debt securities.
Effective after the close of business on Oct. 4, 2019, Delaware Management Company (DMC or Manager), a series of Macquarie Investment Management Business Trust (MIMBT), serves as the investment manager for the Series.* During the period after the close of business on Oct. 4, 2019 to Dec. 31, 2019, the Manager repositioned the portfolio in accordance with Series’ investment objective and principal investment strategies, as described in the prospectus. The investment objective is the same and its principal investment strategies are the same or similar to those of the corresponding Life Series Fund.
For the fiscal year ended Dec. 31, 2019, Delaware VIP Investment Grade Series (the “Series”) Standard Class shares gained 12.62%. The Series’ Service Class shares gained 0.37% since its inception date (Oct. 31, 2019). Both figures reflect all dividends reinvested. The Series’ benchmark, the Bloomberg Barclays US Corporate Investment Grade Index, advanced 14.54% for the1-year period. The Series changed its broad-based securities index from the ICE BofA US Corporate Index to the Bloomberg Barclays US Corporate Investment Grade Index as of Oct. 4, 2019. The Series elected to use the new index because it more closely reflected the Series’ investment strategies.
The major theme of the Series’ fiscal year was the great monetary policy pivot. The period began with the US Treasury yield above 3% and the US Federal Reserve contemplating four additional rate hikes heading into 2019. While the Fed had raised rates at the end of the prior fiscal period, by early 2019 it was apparent that further hikes were untenable. The US economy, though among the strongest globally, was no longer able to sustain a10-year interest rate above 3% or a federal funds rate in themid-2% range.
As 2019 began, economic indicators in the US began to flash yellow while global financial conditions were flashing red. The liquidity-induced risk-assets selloff at the end of 2018 reflected what we believe to be the ongoing unhealthy dependence of asset prices on monetary policy. Bymid-2019, there were other signs of an impending global slowdown as well, including corporate earnings’ deceleration, declining global manufacturing activity, the continuingUS-China trade war, and the ongoing Brexit drama. Many investors saw the yield-curve inversion and the August peak of $17 trillion worldwide in negative-yielding debt as signals of a potential recession.
This prompted the Fed and central banks in Australia, Europe, and the United Kingdom to shift to a more accommodative monetary policy. In the US, the Fed first signaled a hold on further rate hikes and then terminated quantitative tightening (QT) and balance-sheet reductions. Three interest rate cuts of 0.25 percentage points each followed in July, September, and October.
The massive liquidity infusion, coupled with the December announcement of a Phase 1 trade agreement with China, sent both interest rates and risk premiums significantly lower. Fixed income delivered its strongest total return since 2002, finishing the year with investors in a frenzied search for yield. We believe the fiscal year was a good example of the potential benefit of owning bonds as part of a diversified investment portfolio. During the period, bonds provided a stabilizing benefit and a return competitive with that of equities.
Entering fiscal year 2019, we assessed that long-standing secular factors would continue to drive asset markets and global economic growth and inflation. These included aging demographics, rising debt, and increased digitization, which have for decades held down growth and inflation. In recent years, two additional themes have emerged: increased dependency of asset prices on monetary policy, and deglobalization, seen in the form of rising populism. With that as a backdrop, we resisted reacting to short-term headlines, such as Brexit, theUS-China trade dispute, or pockets of global unrest. Instead, we focused on the underlying issues.
Source: Bloomberg.
Foresters Investment Management Company, Inc. (FIMCO) managed the Series from Jan. 1, 2019 to Oct. 4, 2019, when the management of the Series transitioned to DMC. The following is a discussion about Series performance during that period ended Oct. 4, 2019:
The Series invests in investment grade fixed income securities and, as such, most of its assets were invested in investment grade corporate bonds. During the reporting period, the Series also had as much as 8.5% of its assets invested in high yield securities and 3.0% invested in US Treasurys.
The Series underperformed the ICE BofA US Corporate Index during the reporting period. The relative underperformance was predominantly a function of the Series’ underweight in corporate bonds with maturities greater than 10 years, which had the largest returns during the period. The Series benefited from its overweight in theBBB-rated bonds, which had the highest returns among different rating categories. The Series’ exposure to high yield detracted from performance as high yield underperformed investment grade corporate bonds during the reporting period.
| | |
| Unless otherwise noted, views expressed herein are current as of Dec. 31, 2019, and subject to change. | | |
| | Investment Grade Series-1 |
| | |
| Delaware VIP®Trust — Delaware VIP Investment Grade Series |
| Portfolio management review (continued) | | January 7, 2020 (Unaudited) |
*On April 6, 2019, FIMCO, the investment adviser to the First Investors Funds, entered into an agreement with Macquarie Management Holdings, Inc. (MMHI), whereby MMHI, on behalf of its affiliate DMC, would acquire FIMCO’s asset management business (the “Transaction”). In connection with the Transaction, the Board of Trustees of the First Investors Trusts and the First Investors Fund shareholders approved, pursuant to an Agreement and Plan of Reorganization (the “Agreement”), the transfer of all assets and liabilities of each First Investors Fund to a corresponding, newly formed fund in the Delaware Funds® by Macquarie family of funds. The Transaction closed on Oct. 4, 2019.
| | |
| Unless otherwise noted, views expressed herein are current as of Dec. 31, 2019, and subject to change. | | |
| | Investment Grade Series-2 |
| | |
| Delaware VIP® Trust — Delaware VIP Investment Grade Series |
| Performance summary (Unaudited) | | |
The performance quoted represents past performance and does not guarantee future results. Investment return and principal value of an investment will fluctuate so that shares, when redeemed, may be worth more or less than their original cost. Current performance may be lower or higher than the performance quoted.
Carefully consider the Series’ investment objectives, risk factors, charges, and expenses before investing. This and other information can be found in the Series’ prospectus and its summary prospectus, which may be obtained by visiting delawarefunds.com/vip/literature or calling 800523-1918. Investors should read the prospectus and the summary prospectus carefully before investing.
| | | | | | | | | | | | | | | | | | | | |
Delaware VIP Investment Grade Series | | | | | | | | | | | | | | | | | | | | |
Average annual total returns | | | | | | | | | | | | | | | | | | | | |
| For periods ended December 31, 2019 | | 1 year | | | 3 year | | | 5 year | | | 10 year | | | Lifetime | |
Standard Class shares (commenced operations on Jan. 7, 1992) | | | +12.62% | | | | +4.94% | | | | +3.80% | | | | +5.03% | | | | — | |
| | | | | | | | | | | | | | | | | | | | |
Service Class shares (commenced operations on Oct. 31, 2019) | | | — | | | | — | | | | — | | | | — | | | | +0.37% | |
| | | | | | | | | | | | | | | | | | | | |
Bloomberg Barclays US Corporate Investment Grade Index (current benchmark) | | | +14.54% | | | | +5.92% | | | | +4.60% | | | | +5.54% | | | | — | |
| | | | | | | | | | | | | | | | | | | | |
ICE BofA US Corporate Index (former benchmark) | | | +14.23% | | | | +5.94% | | | | +4.60% | | | | +5.60% | | | | — | |
Returns reflect the reinvestment of all distributions. Please see page 3 for a description of the indices.
As described in the Series’ most recent prospectus, the net expense ratio for Standard Class shares and Service Class shares of the Series were 0.66% and 0.96%, respectively, while total operating expenses for Standard Class and Service Class shares were 0.66% and 0.96%, respectively. The management fee for Standard Class and Service Class shares was 0.50%. The Series’ investment manager, Delaware Management Company (Manager), has contractually agreed to waive all or a portion of its investment advisory fees and/or pay/reimburse expenses (excluding any12b-1 fees, acquired fund fees and expenses, taxes, interest, short sale and dividend interest expenses, brokerage fees, certain insurance costs, and nonroutine expenses or costs, including, but not limited to, those relating to reorganizations, litigation, conducting shareholder meetings, and liquidations) in order to prevent annual series operating expenses from exceeding 0.69% of the Series’ average daily net assets for the Standard Class and 0.99% for the Service Class from Oct. 4, 2019 through Dec. 31, 2019.* Please see the most recent prospectus and any applicable supplement(s) for additional information on these fee waivers and/or reimbursements. Please see the “Financial highlights” section in this report for the most recent expense ratios.
The Series pays Delaware Distributors, L.P. (DDLP), the distributor and an affiliate of DMC, an annual12b-1 fee of 0.30% of the average daily net assets of the Service Class shares.
Earnings from a variable annuity or variable life investment compoundtax-free until withdrawal, and as a result, no adjustments were made for income taxes.
Expense limitations were in effect for both classes during certain periods shown in the Series performance table above and in the Performance of a $10,000 Investment graph on the next page.
Performance data do not reflect insurance fees related to a variable annuity or variable life investment or the deferred sales charge that would apply to certain withdrawals of investments held for fewer than eight years. Performance shown here would have been reduced if such fees were included and the expense limitation removed. For more information about fees, consult your variable annuity or variable life prospectus.
Investments in variable products involve risk.
Fixed income securities and bond funds can lose value, and investors can lose principal, as interest rates rise. They also may be affected by economic conditions that hinder an issuer’s ability to make interest and principal payments on its debt.
The Series may also be subject to prepayment risk, the risk that the principal of a fixed income security that is held by the Series may be prepaid prior to maturity, potentially forcing the Series to reinvest that money at a lower interest rate.
The Series may invest in derivatives, which may involve additional expenses and are subject to risk, including the risk that an underlying security or securities index moves in the opposite direction from what the portfolio manager anticipated. A derivatives transaction depends upon the counterparties’ ability to fulfill their contractual obligations.
Narrowly focused investments may exhibit higher volatility than investments in multiple industry sectors.
Investment Grade Series-3
Delaware VIP® Investment Grade Series
Performance summary (Unaudited) (continued)
LIBOR risk is the risk that potential changes related to the use of the London interbank offered rate (LIBOR) could have adverse impacts on financial instruments which reference LIBOR. The potential abandonment of LIBOR could affect the value and liquidity of instruments which reference LIBOR.
Please read both the contract and underlying prospectus for specific details regarding the product’s risk profile.
*The aggregate contractual waiver period covering this report is from Oct. 4, 2019 through Oct. 31, 2021.
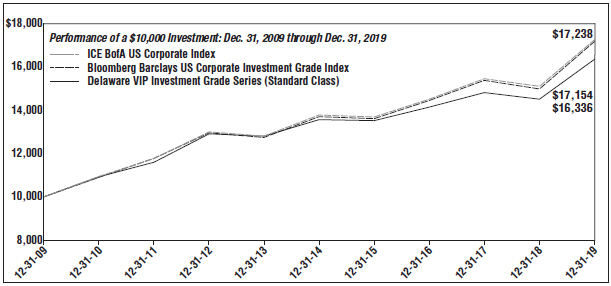
| | | | | | |
| For period beginning Dec. 31, 2009 through Dec. 31, 2019 | | Starting value | | Ending value |
| – – | | ICE BofA US Corporate Index | | $10,000 | | $17,238 |
| – – | | Bloomberg Barclays US Corporate Investment Grade Index | | $10,000 | | $17,154 |
| –– | | Delaware VIP Investment Grade Series (Standard Class) | | $10,000 | | $16,336 |
The graph shows a $10,000 investment in the Delaware VIP Investment Grade Series Standard Class shares for the period from Dec. 31, 2009 through Dec. 31, 2019.
The graph also shows $10,000 invested in the Bloomberg Barclays US Corporate Investment Grade Index and the ICE BofA US Corporate Index for the period from Dec. 31, 2009 through Dec. 31, 2019.
The Bloomberg Barclays US Corporate Investment Grade Index is composed of US dollar-denominated, investment grade,SEC-registered corporate bonds issued by industrial, utility, and financial companies. All bonds have at least one year to maturity.
The ICE BofA US Corporate Index tracks the performance of US dollar-denominated investment grade corporate debt publicly issued in the US domestic market. Qualifying securities must have an investment grade rating (based on an average of Moody’s, S&P and Fitch), at least 18 months to final maturity at the time of issuance, at least one year remaining term to final maturity as of the rebalancing date, a fixed coupon schedule, and a minimum amount outstanding of $250 million.
Index performance returns do not reflect any management fees, transaction costs or expenses. Indices are unmanaged and one cannot invest directly in an index.
Performance of Service Class shares will vary due to different charges and expenses.
Past performance is not a guarantee of future results.
Investment Grade Series-4
Delaware VIP® Trust — Delaware VIP Investment Grade Series
Disclosure of Series expenses
For thesix-month period from July 1, 2019 to December 31, 2019 (Unaudited)
As a shareholder of the Series, you incur ongoing costs, which may include management fees; distribution and service(12b-1) fees; and other Series expenses. This example is intended to help you understand your ongoing costs (in dollars) of investing in the Series and to compare these costs with the ongoing costs of investing in other mutual funds.
The example is based on an investment of $1,000 invested at the beginning of the period and held for the entiresix-month period from July 1, 2019 to Dec. 31, 2019.
Actual expenses
The first section of the table shown, “Actual Series return,” provides information about actual account values and actual expenses. You may use the information in this section of the table, together with the amount you invested, to estimate the expenses that you paid over the period. Simply divide your account value by $1,000 (for example, an $8,600 account value divided by $1,000 = 8.6), then multiply the result by the number in the first section under the heading entitled “Expenses Paid During Period” to estimate the expenses you paid on your account during the period.
Hypothetical example for comparison purposes
The second section of the table shown, “Hypothetical 5% return,” provides information about hypothetical account values and hypothetical expenses based on the Series’ actual expense ratio and an assumed rate of return of 5% per year before expenses, which is not the Series’ actual return. The hypothetical account values and expenses may not be used to estimate the actual ending account balance or expenses you paid for the period. You may use this information to compare the ongoing costs of investing in the Series and other funds. To do so, compare this 5% hypothetical example with the 5% hypothetical examples that appear in the shareholder reports of other funds.
Please note that the expenses shown in the table are meant to highlight your ongoing costs only. As a shareholder of the Series, you do not incur any transaction costs, such as sales charges (loads), redemption fees or exchange fees, but shareholders of other funds may incur such costs. Also, the fees related to the variable annuity investment or the deferred sales charge that could apply have not been included. Therefore, the second section of the table is useful in comparing ongoing costs only, and will not help you determine the relative total costs of owning different funds. The Series’ expenses shown in the table reflect fee waivers in effect and assume reinvestment of all dividends and distributions.
Expense analysis of an investment of $1,000
| | | | | | | | | | | | | | | | | | | | |
| | | Beginning Account Value 7/1/19 | | Ending Account Value 12/31/19 | | Annualized Expense Ratio | | Expenses Paid During Period 7/1/19 to 12/31/19* |
| | |
Actual Series return† | | | | | | | | | | | |
Standard Class | | | $ | 1,000.00 | | | | $ | 1,031.80 | | | | | 0.76 | % | | | | $3.89 | |
Service Class** | | | | 1,000.00 | | | | | 1,003.70 | | | | | 0.99 | % | | | | 1.66 | |
|
Hypothetical 5% return(5% return before expenses) | |
Standard Class | | | $ | 1,000.00 | | | | $ | 1,021.37 | | | | | 0.76 | % | | | | $3.87 | |
Service Class** | | | | 1,000.00 | | | | | 1,020.21 | | | | | 0.99 | % | | | | 5.04 | |
*“Expenses Paid During Period” are equal to the Series’ annualized expense ratio, multiplied by the average account value over the period, multiplied by 184/365 (to reflect theone-half year period).
**The Service Class shares commenced operations on Oct. 31, 2019. The ending account value for “Actual” uses the performance since inception and is not annualized and the expenses paid during the period for “Actual ”are equal to the Service Class annualized expense ratio, multiplied by 61/365 (to reflect the actual days since inception).
| † | Because actual returns reflect only the most recentsix-month period, the returns shown may differ significantly from fiscal year returns. |
In addition to the Series’ expenses reflected above, the Series also indirectly bears its portion of the fees and expenses of the investment companies (Underlying Funds) in which it invests. The table above does not reflect the expenses of the Underlying Funds.
Investment Grade Series-5
Delaware VIP® Trust — Delaware VIP Investment Grade Series
Security type / sector allocation
As of December 31, 2019 (Unaudited)
Sector designations may be different than the sector designations presented in other Series materials. The sector designations may represent the investment manager’s internal sector classifications.
| | | | | |
| Security type / sector | | Percentage of
net assets |
| |
Corporate Bonds | | | | 95.59 | % |
Banking | | | | 18.09 | % |
Basic Industry | | | | 5.28 | % |
Brokerage | | | | 0.35 | % |
Capital Goods | | | | 3.98 | % |
Communications | | | | 12.82 | % |
Consumer Cyclical | | | | 4.21 | % |
ConsumerNon-Cyclical | | | | 10.28 | % |
Electric | | | | 11.14 | % |
Energy | | | | 11.00 | % |
Finance Companies | | | | 2.60 | % |
Insurance | | | | 2.39 | % |
Natural Gas | | | | 1.31 | % |
Real Estate Investment Trusts | | | | 1.87 | % |
Technology | | | | 7.94 | % |
Transportation | | | | 1.23 | % |
Utilities | | | | 1.10 | % |
US Treasury Obligations | | | | 2.74 | % |
Preferred Stock | | | | 0.72 | % |
Short-Term Investments | | | | 0.09 | % |
Total Value of Securities | | | | 99.14 | % |
Receivables and Other Assets Net of Liabilities | | | | 0.86 | % |
Total Net Assets | | | | 100.00 | % |
Investment Grade Series-6
Delaware VIP® Trust — Delaware VIP Investment Grade Series
Schedule of investments
December 31, 2019
| | | | | | | | |
| | | Principal amount° | | | Value (US $) | |
| |
Corporate Bonds – 95.59% | | | | | |
Banking – 18.09% | | | | | |
Banco Bilbao Vizcaya Argentaria 6.50%µy | | | 200,000 | | | $ | 212,000 | |
Bank of America | | | | | | | | |
2.456% 10/22/25 µ | | | 285,000 | | | | 286,832 | |
3.458% 3/15/25 µ | | | 425,000 | | | | 443,884 | |
5.125%µy | | | 280,000 | | | | 296,534 | |
Bank of New York Mellon 3.25% 9/11/24 | | | 610,000 | | | | 640,911 | |
BBVA USA | | | | | | | | |
2.875% 6/29/22 | | | 250,000 | | | | 253,533 | |
3.875% 4/10/25 | | | 250,000 | | | | 262,555 | |
Citibank | | | | | | | | |
2.844% 5/20/22 µ | | | 250,000 | | | | 253,057 | |
3.165% 2/19/22 µ | | | 390,000 | | | | 395,077 | |
Citigroup 4.044%
6/1/24 µ | | | 155,000 | | | | 163,968 | |
Citizens Financial Group 2.85% 7/27/26 | | | 380,000 | | | | 387,059 | |
Credit Suisse Group | | | | | | | | |
144A 2.593%
9/11/25 #µ | | | 505,000 | | | | 506,748 | |
144A 6.375%#µy | | | 210,000 | | | | 226,905 | |
Fifth Third Bancorp 2.375% 1/28/25 | | | 145,000 | | | | 145,197 | |
Fifth Third Bank 3.85% 3/15/26 | | | 410,000 | | | | 436,712 | |
Goldman Sachs Group 4.95%µy | | | 350,000 | | | | 363,256 | |
JPMorgan Chase & Co. | | | | | | | | |
4.023% 12/5/24 µ | | | 295,000 | | | | 314,574 | |
5.00%µy | | | 325,000 | | | | 338,406 | |
KeyBank 3.40% 5/20/26 | | | 605,000 | | | | 630,021 | |
Morgan Stanley | | | | | | | | |
3.124% (LIBOR03M + 1.22%) 5/8/24 • | | | 200,000 | | | | 203,673 | |
5.00% 11/24/25 | | | 450,000 | | | | 506,847 | |
PNC Bank 4.05% 7/26/28 | | | 250,000 | | | | 274,350 | |
PNC Financial Services Group 2.60% 7/23/26 | | | 530,000 | | | | 537,093 | |
Regions Financial 3.80% 8/14/23 | | | 195,000 | | | | 206,420 | |
Royal Bank of Scotland Group | | | | | | | | |
3.754% 11/1/29 µ | | | 200,000 | | | | 204,213 | |
8.625%µy | | | 205,000 | | | | 222,030 | |
Santander UK 144A 5.00% 11/7/23 # | | | 200,000 | | | | 215,364 | |
Truist Bank 2.636% 9/17/29 µ | | | 695,000 | | | | 694,726 | |
UBS 7.625% 8/17/22 | | | 250,000 | | | | 281,926 | |
UBS Group | | | | | | | | |
144A 3.126% 8/13/30 #µ | | | 200,000 | | | | 203,708 | |
6.875%µy | | | 200,000 | | | | 208,550 | |
US Bancorp 3.00% 7/30/29 | | | 865,000 | | | | 893,888 | |
| | | | | | | | |
| | | | | | | 11,210,017 | |
| | | | | | | | |
Basic Industry – 5.28% | | | | | | | | |
BHP Billiton Finance USA 144A 6.25% 10/19/75 #µ | | | 545,000 | | | | 562,723 | |
Methanex 5.25% 12/15/29 | | | 315,000 | | | | 325,690 | |
Newmont Goldcorp 2.80% 10/1/29 | | | 550,000 | | | | 545,251 | |
| | | | | | | | |
| | | Principal amount° | | | Value (US $) | |
| |
Corporate Bonds (continued) | | | | | |
Basic Industry (continued) | | | | | |
Packaging Corp. of America 3.00% 12/15/29 | | | 470,000 | | | $ | 472,695 | |
RPM International 4.55% 3/1/29 | | | 170,000 | | | | 184,136 | |
Sherwin-Williams 2.95% 8/15/29 | | | 495,000 | | | | 501,738 | |
Steel Dynamics | | | | | | | | |
2.80% 12/15/24 | | | 105,000 | | | | 105,693 | |
3.45% 4/15/30 | | | 205,000 | | | | 207,561 | |
Teck Resources 6.25% 7/15/41 | | | 320,000 | | | | 366,668 | |
| | | | | | | | |
| | | | | | | 3,272,155 | |
| | | | | | | | |
Brokerage – 0.35% | | | | | | | | |
Jefferies Group | | | | | | | | |
4.15% 1/23/30 | | | 100,000 | | | | 105,993 | |
6.50% 1/20/43 | | | 90,000 | | | | 107,201 | |
| | | | | | | | |
| | | | | | | 213,194 | |
| | | | | | | | |
Capital Goods – 3.98% | | | | | | | | |
Ingersoll-Rand Luxembourg Finance 3.80% 3/21/29 | | | 240,000 | | | | 257,616 | |
Johnson Controls International 5.00% 3/30/20 | | | 500,000 | | | | 503,242 | |
L3Harris Technologies | | | | | | | | |
2.90% 12/15/29 | | | 130,000 | | | | 132,143 | |
144A 3.85% 6/15/23 # | | | 95,000 | | | | 100,083 | |
144A 4.40% 6/15/28 # | | | 470,000 | | | | 523,777 | |
Roper Technologies 2.35% 9/15/24 | | | 480,000 | | | | 482,842 | |
United Technologies 3.65% 8/16/23 | | | 440,000 | | | | 463,787 | |
| | | | | | | | |
| | | | | | | 2,463,490 | |
| | | | | | | | |
Communications – 12.82% | | | | | | | | |
AMC Networks 4.75% 8/1/25 | | | 156,000 | | | | 156,910 | |
American Tower 3.375% 5/15/24 | | | 325,000 | | | | 337,474 | |
AT&T | | | | | | | | |
4.35% 3/1/29 | | | 295,000 | | | | 328,024 | |
4.50% 3/9/48 | | | 340,000 | | | | 375,732 | |
Charter Communications Operating | | | | | | | | |
4.80% 3/1/50 | | | 230,000 | | | | 242,101 | |
4.908% 7/23/25 | | | 225,000 | | | | 247,851 | |
5.125% 7/1/49 | | | 25,000 | | | | 27,173 | |
Comcast | | | | | | | | |
2.65% 2/1/30 | | | 275,000 | | | | 276,111 | |
3.45% 2/1/50 | | | 50,000 | | | | 51,223 | |
4.40% 8/15/35 | | | 390,000 | | | | 457,018 | |
Crown Castle International 5.25% 1/15/23 | | | 290,000 | | | | 315,066 | |
Diamond Sports Group 144A 5.375% 8/15/26 # | | | 155,000 | | | | 157,081 | |
Discovery Communications | | | | | | | | |
4.125% 5/15/29 | | | 405,000 | | | | 437,513 | |
5.20% 9/20/47 | | | 10,000 | | | | 11,642 | |
Fox | | | | | | | | |
144A 4.03% 1/25/24 # | | | 400,000 | | | | 426,434 | |
144A 4.709% 1/25/29 # | | | 500,000 | | | | 569,886 | |
Investment Grade Series-7
Delaware VIP® Investment Grade Series
Schedule of investments (continued)
| | | | | | | | |
| | | Principal amount° | | | Value (US $) | |
| |
Corporate Bonds (continued) | | | | | |
Communications (continued) | | | | | |
Level 3 Financing 144A 3.875% 11/15/29 # | | | 360,000 | | | $ | 363,366 | |
Time Warner Cable 7.30% 7/1/38 | | | 320,000 | | | | 417,158 | |
Time Warner Entertainment 8.375% 3/15/23 | | | 290,000 | | | | 342,323 | |
Verizon Communications 4.50% 8/10/33 | | | 755,000 | | | | 881,708 | |
ViacomCBS 4.375% 3/15/43 | | | 495,000 | | | | 524,615 | |
Virgin Media Secured Finance 144A 5.50% 5/15/29 # | | | 200,000 | | | | 212,120 | |
Vodafone Group | | | | | | | | |
4.25% 9/17/50 | | | 200,000 | | | | 208,985 | |
4.875% 6/19/49 | | | 495,000 | | | | 574,640 | |
| | | | | | | | |
| | | | | | | 7,942,154 | |
| | | | | | | | |
Consumer Cyclical – 4.21% | | | | | |
Dollar Tree 4.00% 5/15/25 | | | 265,000 | | | | 283,456 | |
Ford Motor Credit 8.125% 1/15/20 | | | 600,000 | | | | 601,127 | |
General Motors Financial | | | | | | | | |
4.35% 4/9/25 | | | 430,000 | | | | 460,780 | |
5.25% 3/1/26 | | | 125,000 | | | | 138,820 | |
GLP Capital | | | | | | | | |
3.35% 9/1/24 | | | 245,000 | | | | 250,788 | |
4.00% 1/15/30 | | | 270,000 | | | | 276,216 | |
Lowe’s | | | | | | | | |
4.05% 5/3/47 | | | 115,000 | | | | 124,056 | |
4.55% 4/5/49 | | | 400,000 | | | | 471,523 | |
| | | | | | | | |
| | | | | | | 2,606,766 | |
| | | | | | | | |
ConsumerNon-Cyclical – 10.28% | | | | | |
AbbVie | | | | | | | | |
144A 2.60% 11/21/24 # | | | 170,000 | | | | 171,165 | |
144A 2.95% 11/21/26 # | | | 485,000 | | | | 493,000 | |
144A 4.05% 11/21/39 # | | | 215,000 | | | | 227,985 | |
Alcon Finance 144A 2.75% 9/23/26 # | | | 365,000 | | | | 371,906 | |
Amgen 4.663% 6/15/51 | | | 260,000 | | | | 305,815 | |
Anheuser-Busch InBev Worldwide | | | | | | | | |
3.65% 2/1/26 | | | 330,000 | | | | 351,798 | |
4.15% 1/23/25 | | | 460,000 | | | | 500,758 | |
Bristol-Myers Squibb 144A 2.90% 7/26/24 # | | | 710,000 | | | | 732,986 | |
Cigna | | | | | | | | |
4.125% 11/15/25 | | | 230,000 | | | | 249,660 | |
144A 4.75% 11/15/21 # | | | 450,000 | | | | 471,801 | |
Constellation Brands 3.15% 8/1/29 | | | 535,000 | | | | 541,452 | |
CVS Health | | | | | | | | |
3.25% 8/15/29 | | | 130,000 | | | | 132,201 | |
4.78% 3/25/38 | | | 335,000 | | | | 380,316 | |
DH Europe Finance II | | | | | | | | |
2.60% 11/15/29 | | | 330,000 | | | | 329,007 | |
3.25% 11/15/39 | | | 177,000 | | | | 178,563 | |
3.40% 11/15/49 | | | 8,000 | | | | 8,160 | |
Gilead Sciences 4.15% 3/1/47 | | | 375,000 | | | | 417,123 | |
| | | | | | | | |
| | | Principal amount° | | | Value (US $) | |
| |
Corporate Bonds (continued) | | | | | |
ConsumerNon-Cyclical (continued) | | | | | |
Mars 144A 3.20% 4/1/30 # | | | 480,000 | | | $ | 508,087 | |
| | | | | | | | |
| | | | | | | 6,371,783 | |
| | | | | | | | |
Electric – 11.14% | | | | | | | | |
AEP Texas 3.45% 1/15/50 | | | 120,000 | | | | 120,254 | |
AES 4.50% 3/15/23 | | | 120,000 | | | | 123,250 | |
CenterPoint Energy 2.95% 3/1/30 | | | 620,000 | | | | 611,689 | |
Dominion Energy 4.65%µy | | | 215,000 | | | | 219,605 | |
Duke Energy 4.875%µy | | | 265,000 | | | | 278,296 | |
Duke Energy Indiana 3.25% 10/1/49 | | | 135,000 | | | | 134,917 | |
Edison International 3.125% 11/15/22 | | | 180,000 | | | | 182,848 | |
Emera 6.75% 6/15/76 µ | | | 245,000 | | | | 277,222 | |
Entergy Arkansas 4.20% 4/1/49 | | | 340,000 | | | | 396,974 | |
Entergy Mississippi 3.85% 6/1/49 | | | 50,000 | | | | 54,573 | |
Entergy Texas 3.55% 9/30/49 | | | 115,000 | | | | 117,319 | |
Evergy 2.90% 9/15/29 | | | 480,000 | | | | 478,033 | |
FirstEnergy Transmission 144A 4.55% 4/1/49 # | | | 255,000 | | | | 291,857 | |
Interstate Power & Light 4.10% 9/26/28 | | | 205,000 | | | | 224,792 | |
Louisville Gas & Electric 4.25% 4/1/49 | | | 350,000 | | | | 403,204 | |
National Rural Utilities Cooperative Finance 5.25% 4/20/46 µ | | | 105,000 | | | | 113,825 | |
NRG Energy | | | | | | | | |
144A 3.75% 6/15/24 # | | | 115,000 | | | | 118,912 | |
144A 4.45% 6/15/29 # | | | 185,000 | | | | 193,837 | |
Southern California Edison | | | | | | | | |
4.00% 4/1/47 | | | 135,000 | | | | 141,927 | |
4.20% 3/1/29 | | | 215,000 | | | | 238,057 | |
4.875% 3/1/49 | | | 285,000 | | | | 337,568 | |
Southwestern Electric Power 4.10% 9/15/28 | | | 605,000 | | | | 661,767 | |
Union Electric 3.25% 10/1/49 | | | 320,000 | | | | 317,590 | |
Vistra Operations | | | | | | | | |
144A 3.55% 7/15/24 # | | | 305,000 | | | | 309,024 | |
144A 3.70% 1/30/27 # | | | 125,000 | | | | 124,187 | |
144A 4.30% 7/15/29 # | | | 55,000 | | | | 56,098 | |
Xcel Energy | | | | | | | | |
2.60% 12/1/29 | | | 260,000 | | | | 257,523 | |
3.50% 12/1/49 | | | 115,000 | | | | 117,054 | |
| | | | | | | | |
| | | | | | | 6,902,202 | |
| | | | | | | | |
Energy – 11.00% | | | | | |
Cheniere Corpus Christi Holdings 7.00% 6/30/24 | | | 410,000 | | | | 473,335 | |
Continental Resources 5.00% 9/15/22 | | | 274,000 | | | | 275,999 | |
Energy Transfer Operating | | | | | | | | |
5.25% 4/15/29 | | | 20,000 | | | | 22,463 | |
6.25% 4/15/49 | | | 275,000 | | | | 331,422 | |
6.625%µy | | | 295,000 | | | | 279,223 | |
Eni 144A 4.25% 5/9/29 # | | | 320,000 | | | | 351,236 | |
Husky Energy 4.40% 4/15/29 | | | 295,000 | | | | 317,560 | |
Magellan Midstream Partners 5.00% 3/1/26 | | | 500,000 | | | | 564,479 | |
Investment Grade Series-8
Delaware VIP® Investment Grade Series
Schedule of investments (continued)
| | | | | | | | |
| | | Principal amount° | | | Value (US $) | |
| |
Corporate Bonds (continued) | | | | | |
Energy (continued) | | | | | |
Marathon Oil 4.40% 7/15/27 | | | 555,000 | | | $ | 603,422 | |
MPLX | | | | | | | | |
4.125% 3/1/27 | | | 585,000 | | | | 614,347 | |
5.50% 2/15/49 | | | 135,000 | | | | 153,154 | |
Noble Energy | | | | | | | | |
3.25% 10/15/29 | | | 160,000 | | | | 161,468 | |
3.90% 11/15/24 | | | 135,000 | | | | 142,676 | |
4.20% 10/15/49 | | | 275,000 | | | | 276,727 | |
NuStar Logistics 5.625% 4/28/27 | | | 153,000 | | | | 157,491 | |
Occidental Petroleum | | | | | | | | |
2.90% 8/15/24 | | | 305,000 | | | | 310,039 | |
3.50% 8/15/29 | | | 250,000 | | | | 255,059 | |
ONEOK 7.50% 9/1/23 | | | 290,000 | | | | 338,486 | |
Sabine Pass Liquefaction 5.75% 5/15/24 | | | 345,000 | | | | 384,833 | |
Schlumberger Holdings 144A 4.30% 5/1/29 # | | | 315,000 | | | | 345,702 | |
Targa Resources Partners 5.875% 4/15/26 | | | 152,000 | | | | 161,785 | |
Transcanada Trust 5.50% 9/15/79 µ | | | 280,000 | | | | 294,560 | |
| | | | | | | | |
| | | | | | | 6,815,466 | |
| | | | | | | | |
Finance Companies – 2.60% | | | | | |
AerCap Ireland Capital 3.65% 7/21/27 | | | 150,000 | | | | 154,525 | |
Aviation Capital Group 144A 3.50% 11/1/27 # | | | 300,000 | | | | 301,935 | |
Avolon Holdings Funding | | | | | | | | |
144A 3.95% 7/1/24 # | | | 190,000 | | | | 198,237 | |
144A 4.375% 5/1/26 # | | | 120,000 | | | | 126,906 | |
144A 5.25% 5/15/24 # | | | 275,000 | | | | 300,986 | |
International Lease Finance 8.25% 12/15/20 | | | 500,000 | | | | 528,674 | |
| | | | | | | | |
| | | | | | | 1,611,263 | |
| | | | | | | | |
Insurance – 2.39% | | | | | |
Brighthouse Financial 4.70% 6/22/47 | | | 495,000 | | | | 458,893 | |
Centene 144A 4.625% 12/15/29 # | | | 115,000 | | | | 121,406 | |
Prudential Financial | | | | | | | | |
3.70% 3/13/51 | | | 180,000 | | | | 189,354 | |
4.35% 2/25/50 | | | 60,000 | | | | 69,051 | |
Reinsurance Group of America 3.90% 5/15/29 | | | 470,000 | | | | 501,241 | |
SBL Holdings 144A 5.125% 11/13/26 # | | | 140,000 | | | | 140,844 | |
| | | | | | | | |
| | | | | | | 1,480,789 | |
| | | | | | | | |
Natural Gas – 1.31% | | | | | |
Atmos Energy 3.375% 9/15/49 | | | 295,000 | | | | 299,369 | |
NiSource 2.95% 9/1/29 | | | 515,000 | | | | 513,593 | |
| | | | | | | | |
| | | | | | | 812,962 | |
| | | | | | | | |
Real Estate Investment Trusts – 1.87% | | | | | |
Alexandria Real Estate Equities 2.75% 12/15/29 | | | 175,000 | | | | 172,866 | |
CubeSmart 3.00% 2/15/30 | | | 490,000 | | | | 484,411 | |
| | | | | | | | |
| | | Principal amount° | | | Value (US $) | |
| |
Corporate Bonds (continued) | | | | | |
Real Estate Investment Trusts (continued) | | | | | |
Simon Property Group 2.45% 9/13/29 | | | 200,000 | | | $ | 196,839 | |
UDR 3.00% 8/15/31 | | | 305,000 | | | | 305,518 | |
| | | | | | | | |
| | | | | | | 1,159,634 | |
| | | | | | | | |
Technology – 7.94% | | | | | |
Amphenol 2.80% 2/15/30 | | | 375,000 | | | | 371,735 | |
Apple | | | | | | | | |
2.05% 9/11/26 | | | 295,000 | | | | 292,845 | |
2.95% 9/11/49 | | | 185,000 | | | | 179,678 | |
Equinix 3.20% 11/18/29 | | | 310,000 | | | | 311,727 | |
Global Payments 2.65% 2/15/25 | | | 640,000 | | | | 643,040 | |
Intel | | | | | | | | |
2.45% 11/15/29 | | | 325,000 | | | | 324,034 | |
3.25% 11/15/49 | | | 250,000 | | | | 251,848 | |
International Business Machines 3.00% 5/15/24 | | | 510,000 | | | | 528,437 | |
Microchip Technology | | | | | | | | |
3.922% 6/1/21 | | | 75,000 | | | | 76,710 | |
4.333% 6/1/23 | | | 550,000 | | | | 581,123 | |
Micron Technology | | | | | | | | |
4.663% 2/15/30 | | | 280,000 | | | | 308,433 | |
4.975% 2/6/26 | | | 180,000 | | | | 199,821 | |
NXP | | | | | | | | |
144A 4.125% 6/1/21 # | | | 200,000 | | | | 205,082 | |
144A 4.875% 3/1/24 # | | | 445,000 | | | | 485,425 | |
SS&C Technologies 144A 5.50% 9/30/27 # | | | 149,000 | | | | 159,337 | |
| | | | | | | | |
| | | | | | | 4,919,275 | |
| | | | | | | | |
Transportation – 1.23% | | | | | |
FedEx 4.05% 2/15/48 | | | 475,000 | | | | 458,329 | |
Norfolk Southern 4.15% 2/28/48 | | | 270,000 | | | | 304,746 | |
| | | | | | | | |
| | | | | | | 763,075 | |
| | | | | | | | |
Utilities – 1.10% | | | | | |
American Water Capital 3.45% 6/1/29 | | | 445,000 | | | | 470,483 | |
Aqua America 4.276% 5/1/49 | | | 190,000 | | | | 212,966 | |
| | | | | | | | |
| | | | | | | 683,449 | |
| | | | | | | | |
Total Corporate Bonds
(cost $58,778,465) | | | | 59,227,674 | |
| | | | | | | | |
US Treasury Obligations – 2.74% | | | | | |
US Treasury Bonds | | | | | | | | |
2.25% 8/15/49 | | | 5,000 | | | | 4,846 | |
2.375% 11/15/49 | | | 380,000 | | | | 378,396 | |
3.00% 2/15/49 | | | 945,000 | | | | 1,065,174 | |
US Treasury Note 1.625% 8/15/29 | | | 255,000 | | | | 248,272 | |
| | | | | | | | |
Total US Treasury Obligations
(cost $1,715,060) | | | | 1,696,688 | |
| | | | | | | | |
Investment Grade Series-9
Delaware VIP® Investment Grade Series
Schedule of investments (continued)
| | | | | | | | |
| | | Number of shares | | | Value (US $) | |
Preferred Stock – 0.72% | | | | | | | | |
Morgan Stanley 5.55%µ | | | 440,000 | | | $ | 448,831 | |
| | | | | | | | |
Total Preferred Stock (cost $447,137) | | | | | | | 448,831 | |
| | | | | | | | |
| |
Short-Term Investments – 0.09% | | | | | |
Money Market Mutual Funds – 0.09% | |
BlackRock FedFund – Institutional Shares(seven-day effective yield 1.52%) | | | 10,970 | | | | 10,970 | |
Fidelity Investments Money Market Government Portfolio – Class I(seven-day effective yield 1.49%) | | | 10,970 | | | | 10,970 | |
GS Financial Square Government Fund – Institutional Shares(seven-day effective yield 1.51%) | | | 10,970 | | | | 10,970 | |
| | | | | | | | |
| | | Number of shares | | | Value (US $) | |
Short-Term Investments (continued) | | | | | |
Money Market Mutual Funds (continued) | |
Morgan Stanley Government Portfolio – Institutional Share Class(seven-day effective yield 1.48%) | | | 10,969 | | | $ | 10,969 | |
State Street Institutional US Government Money Market Fund - Investor Class(seven-day effective yield 1.45%) | | | 10,969 | | | | 10,969 | |
| | | | | | | | |
Total Short-Term Investments
(cost $54,848) | | | | 54,848 | |
| | | | | | | | |
| | | | |
Total Value of Securities – 99.14%
(cost $60,995,510) | | $ | 61,428,041 | |
| | | | |
| # | Security exempt from registration under Rule 144A of the Securities Act of 1933, as amended. At Dec. 31, 2019, the aggregate value of Rule 144A securities was $10,876,136, which represents 17.55% of the Series’ net assets. See Note 9 in “Notes to financial statements.” |
| ° | Principal amount shown is stated in USD unless noted that the security is denominated in another currency. |
| µ | Fixed to variable rate investment. The rate shown reflects the fixed rate in effect at Dec. 31, 2019. Rate will reset at a future date. |
| y | No contractual maturity date. |
| • | Variable rate investment. Rates reset periodically. Rate shown reflects the rate in effect at Dec. 31, 2019. For securities based on a published reference rate and spread, the reference rate and spread are indicated in their description above. The reference rate descriptions (i.e. LIBOR03M, LIBOR06M, etc.) used in this report are identical for different securities, but the underlying reference rates may differ due to the timing of the reset period. Certain variable rate securities are not based on a published reference rate and spread but are determined by the issuer or agent and are based on current market conditions, or for mortgage-backed securities, are impacted by the individual mortgages which are paying off over time. These securities do not indicate a reference rate and spread in their description above. |
Summary of abbreviations:
GS - Goldman Sachs
ICE - Intercontinental Exchange
LIBOR - London interbank offered rate
LIBOR03M - ICE LIBOR USD 3 Month
LIBOR06M - ICE LIBOR USD 6 Month
USD - US Dollar
See accompanying notes, which are an integral part of the financial statements.
Investment Grade Series-10
| | |
| Delaware VIP®Trust — Delaware VIP Investment Grade Series |
| Statement of assets and liabilities | | December 31, 2019 |
| | | | |
Assets: | | | | |
Investments, at value1 | | $ | 61,428,041 | |
Dividends and interest receivable | | | 637,765 | |
Receivable for series shares sold | | | 6,256 | |
Receivable due from advisor | | | 4,320 | |
Other assets | | | 2,125 | |
| | | | |
Total assets | | | 62,078,507 | |
| | | | |
Liabilities: | | | | |
Audit and tax fees payable | | | 51,389 | |
Payable for series shares redeemed | | | 42,636 | |
Accounting and administration expenses payable tonon-affiliates | | | 7,129 | |
Reports and statements to shareholders expenses payable tonon-affiliates | | | 6,979 | |
Pricing fees payable | | | 3,750 | |
Other accrued expenses | | | 2,458 | |
Trustees’ fees and expenses payable | | | 630 | |
Accounting and administration expenses payable to affiliates | | | 515 | |
Dividend disbursing and transfer agent fees and expenses payable to affiliates | | | 397 | |
Reports and statements to shareholders expenses payable to affiliates | | | 100 | |
Legal fees payable to affiliates | | | 97 | |
Distribution fees payable | | | 2 | |
| | | | |
Total liabilities | | | 116,082 | |
| | | | |
Total Net Assets | | $ | 61,962,425 | |
| | | | |
| |
Net Assets Consist of: | | | | |
Paid-in capital | | $ | 58,467,516 | |
Total distributable earnings (loss) | | | 3,494,909 | |
| | | | |
Total Net Assets | | $ | 61,962,425 | |
| | | | |
| |
Net Asset Value: | | | | |
Standard Class: | | | | |
Net assets | | $ | 61,952,388 | |
Shares of beneficial interest outstanding, unlimited authorization, no par | | | 5,622,588 | |
Net asset value per share | | $ | 11.02 | |
| |
Service Class: | | | | |
Net assets | | $ | 10,037 | |
Shares of beneficial interest outstanding, unlimited authorization, no par | | | 912 | |
Net asset value per share | | $ | 11.01 | |
| |
1Investments, at cost | | $ | 60,995,510 | |
See accompanying notes, which are an integral part of the financial statements.
Investment Grade Series-11
| | |
Delaware VIP®Trust — | | Delaware VIP Trust — |
Delaware VIP Investment Grade Series | | Delaware VIP Investment Grade Series |
Statement of operations | | Statements of changes in net assets |
Year ended December 31, 2019 | | |
| | | | |
Investment Income: | | | | |
Interest | | $ | 2,228,140 | |
Dividends | | | 3,813 | |
| | | | |
| | | 2,231,953 | |
| | | | |
Expenses: | | | | |
Management fees | | | 440,268 | |
Distribution expenses - Service Class | | | 5 | |
Audit and tax fees | | | 50,211 | |
Reports and statements to shareholders | | | 20,323 | |
Accounting and administration expenses | | | 11,365 | |
Trustees’ fees and expenses | | | 5,704 | |
Legal fees | | | 4,686 | |
Custodian fees | | | 2,483 | |
Dividend disbursing and transfer agent fees and expenses | | | 1,205 | |
Other | | | 41,764 | |
| | | | |
| | | 578,014 | |
Less expenses waived | | | (107,705 | ) |
Less expenses paid indirectly | | | (1,592 | ) |
| | | | |
Total operating expenses | | | 468,717 | |
| | | | |
Net Investment Income | | | 1,763,236 | |
| | | | |
| |
Net Realized and Unrealized Gain: | | | | |
Net realized gain on investments | | | 3,986,891 | |
Net change in unrealized appreciation (depreciation) of investments | | | 1,811,517 | |
| | | | |
Net Realized and Unrealized Gain | | | 5,798,408 | |
| | | | |
Net Increase in Net Assets Resulting from Operations | | $ | 7,561,644 | |
| | | | |
| | | | | | | | |
| | | Year ended | |
| | | 12/31/19 | | | 12/31/18 | |
Increase (Decrease) in Net Assets from Operations: | | | | | | | | |
Net investment income | | $ | 1,763,236 | | | $ | 1,947,725 | |
Net realized gain (loss) | | | 3,986,891 | | | | (192,933 | ) |
Net change in unrealized appreciation (depreciation) | | | 1,811,517 | | | | (3,142,639 | ) |
| | | | | | | | |
Net increase (decrease) in net assets resulting from operations | | | 7,561,644 | | | | (1,387,847 | ) |
| | | | | | | | |
Dividends and Distributions to Shareholders from: | | | | | | | | |
Distributable earnings: | | | | | | | | |
Standard Class | | | (2,419,791 | ) | | | (2,464,911 | ) |
| | | | | | | | |
Capital Share Transactions: | | | | | |
Proceeds from shares sold: | | | | | | | | |
Standard Class | | | 2,077,498 | | | | 3,265,357 | |
Service Class | | | 10,000 | | | | — | |
Net asset value of shares issued upon reinvestment of dividends and distributions: | | | | | | | | |
Standard Class | | | 2,419,791 | | | | 2,464,911 | |
| | | | | | | | |
| | | 4,507,289 | | | | 5,730,268 | |
| | | | | | | | |
Cost of shares redeemed: | | | | | | | | |
Standard Class | | | (9,316,846 | ) | | | (6,410,479 | ) |
| | | | | | | | |
Decrease in net assets derived from capital share transactions | | | (4,809,557 | ) | | | (680,211 | ) |
| | | | | | | | |
Net Increase (Decrease) in Net Assets | | | 332,296 | | | | (4,532,969 | ) |
| | |
Net Assets: | | | | | | | | |
Beginning of year | | | 61,630,129 | | | | 66,163,098 | |
| | | | | | | | |
End of year | | $ | 61,962,425 | | | $ | 61,630,129 | |
| | | | | | | | |
See accompanying notes, which are an integral part of the financial statements.
Investment Grade Series-12
Delaware VIP® Trust — Delaware VIP Investment Grade Series
Financial highlights
Selected data for each share of the Series outstanding throughout each period were as follows:
| | | | | | | | | | | | | | | | | | | | | | | | | |
| | | Delaware VIP Investment Grade Series Standard Class
Year ended |
| | | 12/31/191 | | 12/31/18 | | 12/31/17 | | 12/31/16 | | 12/31/15 |
| | | |
Net asset value, beginning of period | | | $ | 10.18 | | | | $ | 10.80 | | | | $ | 10.73 | | | | $ | 10.70 | | | | $ | 11.20 | |
| | | | | |
Income (loss) from investment operations: | | | | | | | | | | | | | | | | | | | | | | | | | |
Net investment income2 | | | | 0.29 | | | | | 0.31 | | | | | 0.31 | | | | | 0.33 | | | | | 0.34 | |
Net realized and unrealized gain (loss) | | | | 0.95 | | | | | (0.53 | ) | | | | 0.18 | | | | | 0.15 | | | | | (0.37 | ) |
| | | | | | | | | | | | | | | | | | | | | | | | | |
Total from investment operations | | | | 1.24 | | | | | (0.22 | ) | | | | 0.49 | | | | | 0.48 | | | | | (0.03 | ) |
| | | | | | | | | | | | | | | | | | | | | | | | | |
| | | | | |
Less dividends and distributions from: | | | | | | | | | | | | | | | | | | | | | | | | | |
Net investment income | | | | (0.40 | ) | | | | (0.40 | ) | | | | (0.42 | ) | | | | (0.45 | ) | | | | (0.47 | ) |
| | | | | | | | | | | | | | | | | | | | | | | | | |
Total dividends and distributions | | | | (0.40 | ) | | | | (0.40 | ) | | | | (0.42 | ) | | | | (0.45 | ) | | | | (0.47 | ) |
| | | | | | | | | | | | | | | | | | | | | | | | | |
| | | | | |
Net asset value, end of period | | | $ | 11.02 | | | | $ | 10.18 | | | | $ | 10.80 | | | | $ | 10.73 | | | | $ | 10.70 | |
| | | | | | | | | | | | | | | | | | | | | | | | | |
| | | | | |
Total return3 | | | | 12.62% | | | | | (2.03% | ) | | | | 4.72% | | | | | 4.65% | | | | | (0.35% | ) |
| | | | | |
Ratios and supplemental data: | | | | | | | | | | | | | | | | | | | | | | | | | |
Net assets, end of period (000 omitted) | | | $ | 61,952 | | | | $ | 61,630 | | | | $ | 66,163 | | | | $ | 64,095 | | | | $ | 62,020 | |
Ratio of expenses to average net assets4 | | | | 0.73% | | | | | 0.70% | | | | | 0.68% | | | | | 0.68% | | | | | 0.68% | |
Ratio of expenses to average net assets prior to fees waived4 | | | | 0.90% | | | | | 0.85% | | | | | 0.83% | | | | | 0.83% | | | | | 0.83% | |
Ratio of net investment income to average net assets | | | | 2.76% | | | | | 3.05% | | | | | 2.93% | | | | | 3.02% | | | | | 3.12% | |
Ratio of net investment income to average net assets prior to fees waived | | | | 2.59% | | | | | 2.90% | | | | | 2.78% | | | | | 2.87% | | | | | 2.97% | |
Portfolio turnover | | | | 157% | 5 | | | | 53% | | | | | 60% | | | | | 40% | | | | | 37% | |
| 1 | On Oct. 4, 2019, the First Investors Life Series Investment Grade Fund shares were reorganized into Standard Class shares of the Series. See “Notes to financial statements.” The Standard Class shares financial highlights for the period prior to Oct. 4, 2019, reflect the performance of the First Investors Life Series Investment Grade Fund shares. |
| 2 | The average shares outstanding method has been applied for per share information. |
| 3 | Total return is based on the change in net asset value of a share during the period and assumes reinvestment of dividends and distributions at net asset value. Total return during all of the periods shown reflects a waiver by the manager. Performance would have been lower had the waiver not been in effect. Total return does not include fees, charges, or expenses imposed by the variable annuity and life insurance contracts for which Delaware VIP Trust serves as an underlying investment vehicle. |
| 4 | Expense ratios do not include expenses of the Underlying Funds in which the Series invests. |
| 5 | The Series’ portfolio turnover rate increased substantially during the year ended Dec. 31, 2019 due to a change in the Series’ portfolio managers and associated repositioning. |
See accompanying notes, which are an integral part of the financial statements.
Investment Grade Series-13
Delaware VIP® Trust — Delaware VIP Investment Grade Series
Financial highlights (continued)
Selected data for each share of the Series outstanding throughout each period were as follows:
| | | | | |
| | | Delaware VIP Investment Grade Series Service Class
10/31/191
to
12/31/19 |
Net asset value, beginning of period | | | $ | 10.97 | |
| |
Income (loss) from investment operations: | | | | | |
Net investment income2 | | | | 0.03 | |
Net realized and unrealized gain | | | | 0.01 | |
| | | | | |
Total from investment operations | | | | 0.04 | |
| | | | | |
| |
Net asset value, end of period | | | $ | 11.01 | |
| | | | | |
| |
Total return3 | | | | 0.37 | % |
| |
Ratios and supplemental data: | | | | | |
Net assets, end of period (000 omitted) | | | $ | 10 | |
Ratio of expenses to average net assets4 | | | | 0.99 | % |
Ratio of expenses to average net assets prior to fees waived4 | | | | 1.31 | % |
Ratio of net investment income to average net assets | | | | 1.50 | % |
Ratio of net investment income to average net assets prior to fees waived | | | | 1.18 | % |
Portfolio turnover | | | | 157 | %5,6 |
| 1 | Date of commencement of operations; ratios have been annualized and total return has not been annualized. |
| 2 | The average shares outstanding method has been applied for per share information. |
| 3 | Total return is based on the change in net asset value of a share during the period and assumes reinvestment of dividends and distributions at net asset value. Total return during the period shown reflects waivers by the manager and/or distributor. Performance would have been lower had the waivers not been in effect. Total return does not include fees, charges, or expenses imposed by the variable annuity and life insurance contracts for which Delaware VIP Trust serves as an underlying investment vehicle. |
| 4 | Expense ratios do not include expenses of the Underlying Funds in which the Series invests. |
| 5 | The Series’ portfolio turnover rate increased substantially during the year ended Dec. 31, 2019 due to a change in the Series’ portfolio managers and associated repositioning. |
| 6 | Portfolio turnover is representative of the Series for the entire year. |
See accompanying notes, which are an integral part of the financial statements.
Investment Grade Series-14
Delaware VIP® Trust — Delaware VIP Investment Grade Series
Notes to financial statements
December 31, 2019
Delaware VIP Trust (Trust) is organized as a Delaware statutory trust. The Trust consists of 22 series, each of which is treated as a separate entity for certain matters under the Investment Company Act of 1940, as amended (1940 Act). These financial statements and the related notes pertain to Delaware VIP Investment Grade Series (Series). The Trust is anopen-end investment company. The Series is considered diversified under the 1940 Act and offers Standard Class and Service Class shares. The Standard Class shares do not carry a distribution and service(12b-1) fee and the Service Class shares carry a12b-1 fee. The shares of the Series are sold only to separate accounts of life insurance companies.
Before the Series commenced operations, on Oct. 4, 2019, all of the assets and liabilities of the First Investors Life Series Investment Grade Fund, its respective Predecessor Series (Predecessor Series) were transferred to the Series in atax-free reorganization as set forth in an agreement and plan of reorganization (each a Foresters Reorganization) between the Trust, on behalf of the Series, and Foresters Investment Management Company, Inc. (FIMCO), on behalf of the Predecessor Series. As a result of the Foresters Reorganization, the Series assumed the performance and accounting history of its Predecessor Series. Financial information included for the dates prior to the Foresters Reorganization is that of the Predecessor Series.
1. Significant Accounting Policies
The Series follows accounting and reporting guidance under Financial Accounting Standards Board (FASB) Accounting Standards Codification Topic 946, Financial Services – Investment Companies. The following accounting policies are in accordance with US generally accepted accounting principles (US GAAP) and are consistently followed by the Series.
Security Valuation — Equity securities, except those traded on the Nasdaq Stock Market LLC (Nasdaq), are valued at the last quoted sales price as of the time of the regular close of the New York Stock Exchange on the valuation date. Equity securities traded on the Nasdaq are valued in accordance with the Nasdaq Official Closing Price, which may not be the last sales price. If, on a particular day, an equity security does not trade, the mean between the bid and ask prices will be used, which approximates fair value. Other debt securities are valued based upon valuations provided by an independent pricing service or broker and reviewed by management. To the extent current market prices are not available, the pricing service may take into account developments related to the specific security, as well as transactions in comparable securities. US government and agency securities are valued at the mean between the bid and ask prices, which approximates fair value. Valuations for fixed income securities utilize matrix systems, which reflect such factors as security prices, yields, maturities, and ratings, and are supplemented by dealer and exchange quotations. For asset-backed securities, collateralized mortgage obligations, commercial mortgage securities, and US government agency mortgage securities, pricing vendors utilize matrix pricing which considers prepayment speed; attributes of the collateral; yield or price of bonds of comparable quality, coupon, maturity, and type as well as broker/dealer-supplied prices.Open-end investment companies are valued at their published net asset value (NAV). Generally, other securities and assets for which market quotations are not readily available are valued at fair value as determined in good faith under the direction of the Trust’s Board of Trustees (Board). In determining whether market quotations are readily available or fair valuation will be used, various factors will be taken into consideration, such as market closures or suspension of trading in a security. Restricted securities are valued at fair value using methods approved by the Board.
Federal Income Taxes — No provision for federal income taxes has been made as the Series intends to continue to qualify for federal income tax purposes as a regulated investment company under Subchapter M of the Internal Revenue Code of 1986, as amended, and make the requisite distributions to shareholders. The Series evaluates tax positions taken or expected to be taken in the course of preparing the Series’ tax returns to determine whether the tax positions are“more-likely-than-not” of being sustained by the applicable tax authority. Tax positions not deemed to meet the“more-likely-than-not” threshold are recorded as a tax benefit or expense in the current year. Management has analyzed the Series’ tax positions taken or expected to be taken on the Series’ federal income tax returns through the year ended Dec. 31, 2019 and for all open tax years (years ended Dec. 31, 2016–Dec. 31, 2018), and has concluded that no provision for federal income tax is required in the Series’ financial statements. If applicable, the Series recognizes interest accrued on unrecognized tax benefits in interest expense and penalties in “Other” on the “Statement of operations.” During the year ended Dec. 31, 2019, the Series did not incur any interest or tax penalties.
Class Accounting — Investment income, common expenses, and realized and unrealized gain (loss) on investments are allocated to the classes of the Series on the basis of daily net assets of each class. Distribution expenses relating to a specific class are charged directly to that class.
Use of Estimates — The preparation of financial statements in conformity with US GAAP requires management to make estimates and assumptions that affect the fair value of investments, the reported amounts of assets and liabilities and disclosure of contingent assets and liabilities at the date of the financial statements, and the reported amounts of revenues and expenses during the reporting period. Actual results could differ from those estimates and the differences could be material.
Other — Expenses directly attributable to the Series are charged directly to the Series. Other expenses common to various funds within the Delaware Funds® by Macquarie (Delaware Funds) are generally allocated among such funds on the basis of average net assets. Management fees and certain other expenses are paid monthly. Security transactions are recorded on the date the securities are purchased or sold (trade date) for financial reporting purposes. Costs used in calculating realized gains and losses on the sale of investment securities are those of the specific securities sold. Dividend income is recorded on theex-dividend date and interest income is recorded on the accrual basis. Discounts and premiums on debt securities are accreted or
Investment Grade Series-15
Delaware VIP® Investment Grade Series
Notes to financial statements (continued)
1. Significant Accounting Policies (continued)
amortized to interest income, respectively, over the lives of the respective securities using the effective interest method. Realized gains (losses) on paydowns of asset- and mortgage backed securities are classified as interest income. The Series declares and pays dividends from net investment income and distributions from net realized gain on investments, if any, following the close of the fiscal year. The Series may distribute more frequently, if necessary for tax purposes. Dividends and distributions, if any, are recorded on theex-dividend date.
The Series receives earnings credits from its custodian when positive cash balances are maintained, which may be used to offset custody fees. The expenses paid under this arrangement are included on the “Statement of operations” under “Custodian fees” with the corresponding expenses offset included under “Less expenses paid indirectly.” For the year ended Dec. 31, 2019, the Series earned $1,592 under this arrangement.
The Series receives earnings credits from its transfer agent when positive cash balances are maintained, which may be used to offset transfer agent fees. If the amount earned is greater than $1, the expenses paid under this arrangement are included on the “Statement of operations” under “Dividend disbursing and transfer agent fees and expenses” with the corresponding expenses offset included under “Less expenses paid indirectly.” There were no such earnings credits for the year ended Dec. 31, 2019.
2. Investment Management, Administration Agreements, and Other Transactions with Affiliates
In accordance with the terms of its investment management agreement, effective Oct. 4, 2019, the Series pays Delaware Management Company (DMC), a series of Macquarie Investment Management Business Trust and the investment manager, an annual fee which is calculated daily and paid monthly at the rates of 0.50% on the first $500 million of average daily net assets of the Series, 0.475% on the next $500 million, 0.45% on the next $1.5 billion, and 0.425% on average daily net assets in excess of $2.5 billion. Prior to Oct. 4, 2019, the Series paid FIMCO, an annual fee which was calculated daily and paid monthly at the rates of 0.75% on the first $250 million of average daily net assets of the Series, 0.72% on the next $250 million, 0.69% on the next $250 million, 0.66% on the next $500 million, 0.64% on the next $500 million, 0.62% on the next $500 million, and 0.60% on average daily net assets in excess of $2.25 billion.
DMC has contractually agreed to waive all or a portion of its investment advisory fees and/or pay/reimburse expenses (excluding any acquired fund fees and expenses, taxes, interest, short sale dividend and interest expenses, brokerage fees, certain insurance costs, and nonroutine expenses or costs, including, but not limited to, those relating to reorganizations, litigation, conducting shareholder meetings, and liquidations), do not exceed 0.69% of the Series’ average daily net assets for the Standard Class and 0.99% for the Service Class from Oct. 4, 2019 through Dec. 31, 2019.* From Jan. 1, 2019 through May 1, 2019, FIMCO, had waived to limit the advisory fee to 0.60% of the Series’ average daily net assets. There were no waiver from May 2, 2019 through Oct. 4, 2019. These waivers and reimbursements may only be terminated by agreement of DMC and the Series. The waivers and reimbursements are accrued daily and received monthly.
Effective Oct. 4, 2019, DMC may seek investment advice and recommendations from its affiliates: Macquarie Investment Management Europe Limited, Macquarie Investment Management Austria Kapitalanlage AG, and Macquarie Investment Management Global Limited (together, the “AffiliatedSub-Advisors”). The Manager may also permit these AffiliatedSub-Advisors to execute Series security trades on behalf of the Manager and exercise investment discretion for securities in certain markets where DMC believes it will be beneficial to utilize an AffiliatedSub-Advisor’s specialized market knowledge. Although the AffiliatedSub-Advisors serve assub-advisors, DMC has ultimate responsibility for all investment advisory services. For these services, DMC, not the Series, pays each AffiliatedSub-Advisor a portion of its investment management fee.
Effective Oct. 4, 2019, Delaware Investments Fund Services Company (DIFSC), an affiliate of DMC, provides fund accounting and financial administration oversight services to the Series. For these services, DIFSC’s fees are calculated daily and paid monthly based on the aggregate daily net assets of all funds within the Delaware Funds at the following annual rates: 0.00475% of the first $35 billion; 0.0040% of the next $10 billion; and 0.0025% of aggregate average daily net assets in excess of $45 billion (Total Fee). Each fund in the Delaware Funds pays a minimum of $4,000, which, in aggregate, is subtracted from the Total Fee. Each fund then pays its portion of the remainder of the Total Fee on a relative NAV basis. This amount is included on the “Statement of operations” under “Accounting and administration expenses.” For the period Oct. 4, 2019 through year ended Dec. 31, 2019, the Series was charged $1,514 for these services. Prior to Oct. 4, 2019, there were no fund accounting and financial administration oversight services for the Series.
Effective Oct. 4, 2019, DIFSC is also the transfer agent and dividend disbursing agent of the Series. For these services, DIFSC’s fees are calculated daily and paid monthly at the annual rate of 0.0075% of the Series’ average daily net assets. This amount is included on the “Statement of operations” under “Dividend disbursing and transfer agent fees and expenses.” For the period Oct. 4, 2019 through year ended Dec. 31, 2019, the Series was charged $1,139 for these services. Pursuant to asub-transfer agency agreement between DIFSC and BNY Mellon Investment Servicing (US) Inc. (BNYMIS), BNYMIS provides certainsub-transfer agency services to the Series.Sub-transfer agency fees are paid directly by the Series and are also included on the “Statement of operations” under “Dividend disbursing and transfer agent fees and expenses.” The fees that are calculated daily and paid as invoices are received on a monthly or quarterly basis. Prior to Oct. 4, 2019, Foresters Investor Services, Inc. was the transfer agent of the Series.
Investment Grade Series-16
Delaware VIP® Investment Grade Series
Notes to financial statements (continued)
2. Investment Management, Administration Agreements, and Other Transactions with Affiliates (continued)
Effective Oct. 4, 2019, pursuant to a distribution agreement and distribution plan, the Series pays Delaware Distributors, L.P. (DDLP), the distributor and an affiliate of DMC, an annual12b-1 fee of 0.30% of the average daily net assets of the Service Class shares. The fees are calculated daily and paid monthly. Standard Class shares do not pay12b-1 fees.
As provided in the investment management agreement, the Series bears a portion of the cost of certain resources shared with DMC, including the cost of internal personnel of DMC and/or its affiliates that provide legal, tax, and regulatory reporting services to the Series. For the period Oct. 4, 2019 through year ended Dec. 31, 2019, the Series was charged $310 for internal legal, tax, and regulatory reporting services provided by DMC and/or its affiliates’ employees. These amounts are included on the “Statement of operations” under “Legal fees.”
Trustees’ fees include expenses accrued by the Series for each Trustee’s retainer and meeting fees. Certain officers of DMC, DIFSC, and DDLP are officers and/or Trustees of the Trust. These officers and Trustees are paid no compensation by the Series.
In addition to the management fees and other expenses of the Series, the Series indirectly bears the investment management fees and other expenses of the investment companies (Underlying Funds) in which it invests. The amount of these fees and expenses incurred indirectly by the Series will vary based upon the expense and fee levels of the Underlying Funds and the number of shares that are owned of the Underlying Funds at different times.
*The aggregate contractual waiver period covering this report is from Oct. 4, 2019 through Oct. 31, 2021.
3. Investments
For the year ended Dec. 31, 2019, the Series made purchases and sales of investment securities other than short-term investments as follows:
| | | | |
Purchases other than US government securities | | $ | 84,702,251 | |
Purchases of US government securities | | | 12,721,553 | |
Sales other than US government securities | | | 88,270,442 | |
Sales of US government securities | | | 13,795,021 | |
The tax cost of investments includes adjustments to net unrealized appreciation (depreciation) which may not necessarily be final tax cost basis adjustments, but approximate the tax basis unrealized gains and losses that may be realized and distributed to shareholders. At Dec. 31, 2019, the cost and unrealized appreciation (depreciation) of investments for federal income tax purposes for the Series were as follows:
| | | | | | | | | | |
| | | Cost of
Investments | | Aggregate Unrealized
Appreciation of Investments | | Aggregate
Unrealized
Depreciation of Investments | | Net Unrealized
Appreciation of Investments | | |
| | $61,361,508 | | $540,003 | | $(473,470) | | $66,533 |
US GAAP defines fair value as the price that the Series would receive to sell an asset or pay to transfer a liability in an orderly transaction between market participants at the measurement date under current market conditions. A three-level hierarchy for fair value measurements has been established based upon the transparency of inputs to the valuation of an asset or liability. Inputs may be observable or unobservable and refer broadly to the assumptions that market participants would use in pricing the asset or liability. Observable inputs reflect the assumptions that market participants would use in pricing the asset or liability based on market data obtained from sources independent of the reporting entity. Unobservable inputs reflect the reporting entity’s own assumptions about the assumptions that market participants would use in pricing the asset or liability based on the best information available under the circumstances. The Series’ investment in its entirety is assigned a level based upon the observability of the inputs which are significant to the overall valuation. The three-level hierarchy of inputs is summarized below and on the next page.
| | | | |
| Level 1 | | – | | Inputs are quoted prices in active markets for identical investments. (Examples: equity securities,open-end investment companies, futures contracts, and exchange-traded options contracts) |
| | |
| Level 2 | | – | | Other observable inputs, including, but not limited to: quoted prices for similar assets or liabilities in markets that are active, quoted prices for identical or similar assets or liabilities in markets that are not active, inputs other than quoted prices that are observable for the assets or liabilities (such as interest rates, yield curves, volatilities, prepayment speeds, loss severities, credit risks, and default rates) or other market-corroborated inputs. (Examples: debt securities, government securities, swap contracts, foreign currency exchange contracts, foreign securities utilizing international fair value pricing, broker-quoted securities, and fair valued securities) |
| | |
| Level 3 | | – | | Significant unobservable inputs, including the Series’ own assumptions used to determine the fair value of investments. (Examples: broker-quoted securities and fair valued securities) |
Investment Grade Series-17
Delaware VIP® Investment Grade Series
Notes to financial statements (continued)
3. Investments (continued)
Level 3 investments are valued using significant unobservable inputs. The Series may also use an income-based valuation approach in which the anticipated future cash flows of the investment are discounted to calculate fair value. Discounts may also be applied due to the nature or duration of any restrictions on the disposition of the investments. Valuations may also be based upon current market prices of securities that are comparable in coupon, rating, maturity, and industry. The derived value of a Level 3 investment may not represent the value which is received upon disposition and this could impact the results of operations.
The following table summarizes the valuation of the Series’ investments by fair value hierarchy levels as of Dec. 31, 2019:
| | | | | | | | | | | | |
Securities | | Level 1 | | | Level 2 | | | Total | |
Assets: | | | | | | | | | | | | |
Corporate Debt | | $ | — | | | $ | 59,227,674 | | | $ | 59,227,674 | |
Preferred Stock | | | — | | | | 448,831 | | | | 448,831 | |
US Treasury Obligation | | | — | | | | 1,696,688 | | | | 1,696,688 | |
Short-Term Investments | | | 54,848 | | | | — | | | | 54,848 | |
| | | | | | | | | | | | |
Total Value of Securities | | $ | 54,848 | | | $ | 61,373,193 | | | $ | 61,428,041 | |
| | | | | | | | | | | | |
During the year ended Dec. 31, 2019, there were no transfers between Level 1 investments, Level 2 investments, or Level 3 investments that had a significant impact to the Series. The Series’ policy is to recognize transfers between levels based on fair value at the beginning of the reporting period.
A reconciliation of Level 3 investments is presented when the Series has a significant amount of Level 3 investments at the beginning, interim, or end of the year in relation to the Series’ net assets. During the year ended Dec. 31, 2019, there were no Level 3 investments.
4. Dividend and Distribution Information
Income and long-term capital gain distributions are determined in accordance with federal income tax regulations, which may differ from US GAAP. Additionally, distributions from net short-term gains on sales of investment securities are treated as ordinary income for federal income tax purposes. The tax character of dividends and distributions paid during the years ended Dec. 31, 2019 and 2018 was as follows:
| | | | | | | | |
| | | Year ended | |
| | | 12/31/19 | | | 12/31/18 | |
Ordinary income | | $ | 2,419,791 | | | $ | 2,464,911 | |
5. Components of Net Assets on a Tax Basis
As of Dec. 31, 2019, the components of net assets on a tax basis were as follows:
| | | | |
Shares of beneficial interest | | $ | 58,467,516 | |
Undistributed ordinary income | | | 3,428,376 | |
Net unrealized appreciation on investments | | | 66,533 | |
| | | | |
Net assets | | $ | 61,962,425 | |
| | | | |
The differences between the book basis and tax basis components of net assets are primarily attributable to tax deferral of losses on wash sales and market premium on debt instruments.
For federal income tax purposes, capital loss carryforwards may be carried forward and applied against future capital gains. $1,526,641 was utilized in 2019.
Investment Grade Series-18
Delaware VIP® Investment Grade Series
Notes to financial statements (continued)
6. Capital Shares
Transactions in capital shares were as follows:
| | | | | | | | |
| | | Year ended | |
| | | 12/31/19 | | | 12/31/18 | |
Shares sold: | | | | | | | | |
Standard Class | | | 196,853 | | | | 318,410 | |
Service Class | | | 912 | | | | — | |
Shares issued upon reinvestment of dividends and distributions: | | | | | | | | |
Standard Class | | | 241,255 | | | | 242,371 | |
| | | | | | | | |
| | | 439,020 | | | | 560,781 | |
| | | | | | | | |
| | |
Shares redeemed: | | | | | | | | |
Standard Class | | | (869,334 | ) | | | (630,374 | ) |
| | | | | | | | |
Net decrease | | | (430,314 | ) | | | (69,593 | ) |
| | | | | | | | |
7. Line of Credit
On Nov. 4, 2019, the Series, along with certain other funds in the Delaware Funds (Participants), is a participant in a $250,000,000 revolving line of credit intended to be used for temporary or emergency purposes as an additional source of liquidity to fund redemptions of investor shares. Under the agreement, the Participants are charged an annual commitment fee of 0.15%, which is allocated across the Participants based on a weighted average of the respective net assets of each Participant. The Participants are permitted to borrow up to a maximum ofone-third of their net assets under the agreement. Each Participant is individually, and not jointly, liable for its particular advances, if any, under the line of credit. The line of credit available under the agreement expires on Nov. 2, 2020.
The Series had no amounts outstanding as of Dec. 31, 2019, or at any time during the period then ended.
8. Securities Lending
Effective Oct. 4, 2019, the Series, along with other funds in the Delaware Funds, may lend its securities pursuant to a security lending agreement (Lending Agreement) with The Bank of New York Mellon (BNY Mellon). At the time a security is loaned, the borrower must post collateral equal to the required percentage of the market value of the loaned security, including any accrued interest. The required percentage is: (1) 102% with respect to US securities and foreign securities that are denominated and payable in US dollars; and (2) 105% with respect to foreign securities. With respect to each loan, if on any business day, the aggregate market value of securities collateral plus cash collateral held is less than the aggregate market value of the securities which are the subject of such loan, the borrower will be notified to provide additional collateral by the end of the following business day, which, together with the collateral already held, will be not less than the applicable initial collateral requirements for such security loan. If the aggregate market value of securities collateral and cash collateral held with respect to a security loan exceeds the applicable initial collateral requirement, upon the request of the borrower, BNY Mellon must return enough collateral to the borrower by the end of the following business day to reduce the value of the remaining collateral to the applicable initial collateral requirement for such security loan. As a result of the foregoing, the value of the collateral held with respect to a loaned security on any particular day, may be more or less than the value of the security on loan. The collateral percentage with respect to the market value of the loaned security is determined by the security lending agent.
Cash collateral received by each series of the Trust is generally invested in a series of individual separate accounts, each corresponding to a series. The investment guidelines permit each separate account to hold certain securities that would be considered eligible securities for a money market fund. Cash collateral received is generally invested in government securities; certain obligations issued by government sponsored enterprises; repurchase agreements collateralized by US Treasury securities; obligations issued by the central government of any Organization for Economic Cooperation and Development (OECD) country or its agencies, instrumentalities, or establishments; obligations of supranational organizations; commercial paper, notes, bonds, and other debt obligations; certificates of deposit, time deposits, and other bank obligations; and asset-backed securities. The Series can also accept US government securities and letters of credit(non-cash collateral) in connection with securities loans.
In the event of default or bankruptcy by the lending agent, realization and/or retention of the collateral may be subject to legal proceedings. In the event the borrower fails to return loaned securities and the collateral received is insufficient to cover the value of the loaned securities and provided such collateral shortfall is not the result of investment losses, the lending agent has agreed to pay the amount of the shortfall to the Series or, at the discretion of the lending agent, replace the loaned securities. The Series continues to record dividends or interest, as applicable, on the securities loaned and is subject to changes in value of the securities loaned that may occur during the term of the loan. The Series has the right under the Lending Agreement to recover the securities from the borrower on demand. With respect to security loans collateralized bynon-cash collateral, the Series receives loan premiums paid by the
Investment Grade Series-19
Delaware VIP® Investment Grade Series
Notes to financial statements (continued)
8. Securities Lending (continued)
borrower. With respect to security loans collateralized by cash collateral, the earnings from the collateral investments are shared among the Series, the security lending agent, and the borrower. The Series records security lending income net of allocations to the security lending agent and the borrower.
The Series may incur investment losses as a result of investing securities lending collateral. This could occur if an investment in the collateral investment account defaulted or became impaired. Under those circumstances, the value of the Series’ cash collateral account may be less than the amount the Series would be required to return to the borrowers of the securities and the Series would be required to make up for this shortfall.
During the year ended Dec. 31, 2019, the Series had no securities out on loan.
9. Credit and Market Risk
When interest rates rise, fixed income securities (i.e. debt obligations) generally will decline in value. These declines in value are greater for fixed income securities with longer maturities or durations.
The risk that potential changes related to the use of the London Interbank Offered Rate (LIBOR) could have adverse impacts on financial instruments which reference LIBOR. The potential abandonment of LIBOR could affect the value and liquidity of instruments which reference LIBOR.
The Series invests in high yield fixed income securities, which are securities rated lower thanBBB- by Standard & Poor’s Financial Services LLC and lower than Baa3 by Moody’s Investors Service, Inc. or similarly rated by another nationally recognized statistical rating organization. Investments in these higher yielding securities are generally accompanied by a greater degree of credit risk than higher-rated securities. Additionally, lower-rated securities may be more susceptible to adverse economic and competitive industry conditions than investment grade securities.
The Series may invest up to 10% of its net assets in illiquid securities, which may include securities with contractual restrictions on resale, securities exempt from registration under Rule 144A, promulgated under the Securities Act of 1933, as amended, and other securities which may not be readily marketable. The relative illiquidity of these securities may impair the Series from disposing of them in a timely manner and at a fair price when it is necessary or desirable to do so. While maintaining oversight, the Board has delegated to DMC theday-to-day functions of determining whether individual securities are liquid for purposes of the Series’ limitation on investments in illiquid securities. Securities eligible for resale pursuant to Rule 144A, which are determined to be liquid, are not subject to the Series’ 10% limit on investments in illiquid securities. Rule 144A securities have been identified on the “Schedule of investments.”
10. Contractual Obligations
The Series enters into contracts in the normal course of business that contain a variety of indemnifications. The Series’ maximum exposure under these arrangements is unknown. However, the Series has not had prior claims or losses pursuant to these contracts. Management has reviewed the Series’ existing contracts and expects the risk of loss to be remote.
11. Recent Accounting Pronouncements
In March 2017, the FASB issued an Accounting Standards Update (ASU), ASU2017-08, Receivables — Nonrefundable Fees and Other Costs (Subtopic310-20), Premium Amortization on Purchased Callable Debt Securities which amends the amortization period for certain callable debt securities purchased at a premium, shortening such period to the earliest call date. The ASU2017-08 does not require any accounting change for debt securities held at a discount; the discount continues to be amortized to maturity. The ASU2017-08 is effective for fiscal years, and interim periods within those fiscal years, beginning after Dec. 15, 2018. Management has implemented the ASU2017-08 and determined that the impact of this guidance to the Series’ net assets at the end of the year is not material.
In August 2018, the FASB issued an Accounting Standards Update, ASU2018-13, which changes certain fair value measurement disclosure requirements. The ASU2018-13, in addition to other modifications and additions, removes the requirement to disclose the amount and reasons for transfers between Level 1 and Level 2 of the fair value hierarchy, the policy for the timing of transfers between levels and the valuation process for Level 3 fair value measurements. The ASU2018-13 is effective for fiscal years, and interim periods within those fiscal years, beginning after Dec. 15, 2019. At this time, management is evaluating the implications of these changes on the financial statements.
12. Subsequent Events
Management has determined that no material events or transactions occurred subsequent to Dec. 31, 2019, that would require recognition or disclosure in the Series’ financial statements.
Investment Grade Series-20
Delaware VIP® Trust — Delaware VIP Investment Grade Series
Report of independent registered public accounting firm
To the Board of Trustees of Delaware VIP® Trust and Shareholders of Delaware VIP Investment Grade Series
Opinion on the Financial Statements
We have audited the accompanying statement of assets and liabilities, including the schedule of investments, of Delaware VIP Investment Grade Series (one of the series constituting Delaware VIP® Trust, referred to hereafter as the “Series”) as of December 31, 2019, the related statements of operations and changes in net assets for the year then ended, including the related notes, and the financial highlights for each of the periods indicated therein (collectively referred to as the “financial statements”). In our opinion, the financial statements present fairly, in all material respects, the financial position of the Series as of December 31, 2019, the results of its operations and changes in its net assets for the year then ended, and the financial highlights for each of the periods indicated therein in conformity with accounting principles generally accepted in the United States of America.
The financial statements of First Investors Life Series Investment Grade Fund (subsequent to reorganization, known as Delaware VIP Investment Grade Series ) as of and for the year ended December 31, 2018 and the financial highlights for each of the periods ended on or prior to December 31, 2018 (not presented herein, other than the statement of changes in net assets and the financial highlights) were audited by other auditors whose report dated February 26, 2019 expressed an unqualified opinion on those financial statements and financial highlights.
Basis for Opinion
These financial statements are the responsibility of the Series’ management. Our responsibility is to express an opinion on the Series’ financial statements based on our audit. We are a public accounting firm registered with the Public Company Accounting Oversight Board (United States) (PCAOB) and are required to be independent with respect to the Series in accordance with the U.S. federal securities laws and the applicable rules and regulations of the Securities and Exchange Commission and the PCAOB.
We conducted our audit of these financial statements in accordance with the standards of the PCAOB. Those standards require that we plan and perform the audit to obtain reasonable assurance about whether the financial statements are free of material misstatement, whether due to error or fraud.
Our audit included performing procedures to assess the risks of material misstatement of the financial statements, whether due to error or fraud, and performing procedures that respond to those risks. Such procedures included examining, on a test basis, evidence regarding the amounts and disclosures in the financial statements. Our audit also included evaluating the accounting principles used and significant estimates made by management, as well as evaluating the overall presentation of the financial statements. Our procedures included confirmation of securities owned as of December 31, 2019 by correspondence with the custodian and transfer agents. We believe that our audit provides a reasonable basis for our opinion.
/s/PricewaterhouseCoopers LLP
Philadelphia, Pennsylvania
February 28, 2020
We have served as the auditor of one or more investment companies in Delaware Funds® by Macquarie since 2010.
Investment Grade Series-21
Delaware VIP® Trust — Delaware VIP Investment Grade Series
Other Series information (Unaudited)
Tax Information
All disclosures are based on financial information available as of the date of this annual report and, accordingly are subject to change. For any and all items requiring reporting, it is the intention of the Series to report the maximum amount permitted under the Internal Revenue Code and the regulations thereunder.
For the year ended Dec. 31, 2019, the Series reports distributions paid during the year as follows:
|
| (A) |
| Ordinary Income |
| Distributions |
| (Tax Basis) |
100.00% |
(A) is based on a percentage of the Series’ total distributions.
Investment Grade Series-22
Delaware Funds® by Macquarie
Board of trustees / directors and officers addendum
A mutual fund is governed by a Board of Trustees/Directors (“Trustees”), which has oversight responsibility for the management of a fund’s business affairs. Trustees establish procedures and oversee and review the performance of the investment manager, the distributor, and others who perform services for the fund. The independent fund trustees, in particular, are advocates for shareholder interests. Each trustee has served in that capacity since he or she was elected to or appointed to the Board of Trustees, and will continue to serve until his or her retirement or the election of a new trustee in his or her place. The following is a list of the Trustees and Officers with certain background and related information.
| | | | | | | | | | |
Name, Address, and Birth Date | | Position(s) Held with Fund(s) | | Length of Time Served | | Principal
Occupation(s)
During the Past Five Years | | Number of
Portfolios in Fund Complex Overseen by Trustee or Officer | | Other
Directorships Held by Trustee or Officer |
| INTERESTED TRUSTEE | | | | | | | | | | |
| | | | | |
Shawn K. Lytle1 2005 Market Street Philadelphia, PA 19103 February 1970 | | President, Chief Executive Officer, and Trustee | | President and Chief Executive Officer since August 2015 Trustee since September 2015 | | President — Macquarie Investment Management2 (June 2015-Present) Regional Head of Americas — UBS Global Asset Management (April 2010-May 2015) | | 95 | | Trustee — UBS Relationship Funds, SMA Relationship Trust, and UBS Funds (May 2010–April 2015) |
| INDEPENDENT TRUSTEES | | | | | | | | | | |
| | | | | |
Thomas L. Bennett 2005 Market Street Philadelphia, PA 19103 | | Chair and Trustee | | Trustee since March 2005 | | Private Investor (March 2004–Present) | | 95 | | None |
| | | | | |
| October 1947 | | | | Chair since March 2015 | | | | | | |
Jerome D. Abernathy
2005 Market Street Philadelphia, PA 19103 July 1959 | | Trustee | | Since January 2019 | | Managing Member, Stonebrook Capital Management, LLC (financial technology: macro factors and databases) (January 1993–Present) | | 95 | | None |
Ann D. Borowiec 2005 Market Street Philadelphia, PA 19103 November 1958 | | Trustee | | Since March 2015 | | Chief Executive Officer, Private Wealth Management (2011–2013) and Market Manager, New Jersey Private Bank (2005–2011) — J.P. Morgan Chase & Co. | | 95 | | Director — Banco Santander International (October 2016–December 2019) Director — Santander Bank, N.A. (December 2016–December 2019) |
Joseph W. Chow 2005 Market Street Philadelphia, PA 19103 | | Trustee | | Since January 2013 | | Private Investor (April 2011–Present) | | 95 | | Director and Audit Committee Member — Hercules Technology Growth Capital, Inc. |
| January 1953 | | | | | | | | | | (July 2004–July 2014) |
Investment Grade Series-23
| | | | | | | | | | |
Name, Address, and Birth Date | | Position(s) Held with Fund(s) | | Length of Time Served | | Principal
Occupation(s)
During the Past Five Years | | Number of
Portfolios in Fund Complex Overseen by Trustee or Officer | | Other
Directorships Held by Trustee or Officer |
John A. Fry 2005 Market Street Philadelphia, PA 19103 May 1960 | | Trustee | | Since January 2001 | | President — Drexel University (August 2010–Present) President — Franklin & Marshall College (July 2002–July 2010) | | 95 | | Director; Compensation Committee and Governance Committee Member — Community Health Systems (May 2004–Present) Director — Drexel Morgan & Co. (2015–Present) Director and Audit Committee Member — vTv Therapeutics LLC (2017–Present) Director and Audit Committee Member — FS Credit Real Estate Income Trust, Inc. (2018–Present) Director — Federal Reserve Bank of Philadelphia (January 2020–Present) |
Lucinda S. Landreth 2005 Market Street Philadelphia, PA 19103 June 1947 | | Trustee | | Since March 2005 | | Private Investor (2004–Present) | | 95 | | None |
Frances A. Sevilla-Sacasa 2005 Market Street Philadelphia, PA 19103 January 1956 | | Trustee | | Since September 2011 | | Private Investor (January 2017-Present) Chief Executive Officer — Banco Itaú International (April 2012–December 2016) Executive Advisor to Dean (August 2011–March 2012) and Interim Dean (January 2011–July 2011) — University of Miami School of Business Administration President — U.S. Trust, Bank of America Private Wealth Management (Private Banking) (July 2007–December 2008) | | 95 | | Trust Manager and Audit Committee Chair — Camden Property Trust (August 2011–Present) Director; Strategic Planning and Reserves Committee and Nominating and Governance Committee Member — Callon Petroleum Company (December 2019–Present) Director; Audit Committee Member — Carrizo Oil & Gas, Inc. (March 2018–December 2019) |
Thomas K. Whitford 2005 Market Street Philadelphia, PA 19103 March 1956 | | Trustee | | Since January 2013 | | Vice Chairman (2010–April 2013) — PNC Financial Services Group | | 95 | | Director — HSBC North America Holdings Inc. (December 2013-Present) Director — HSBC USA Inc. (July 2014-Present) Director — HSBC Bank USA, National Association (July2014-March 2017) Director — HSBC Finance Corporation (December 2013-April 2018) |
Investment Grade Series-24
| | | | | | | | | | |
Name, Address, and Birth Date | | Position(s) Held with Fund(s) | | Length of Time Served | | Principal
Occupation(s)
During the Past Five Years | | Number of
Portfolios in Fund Complex Overseen by Trustee or Officer | | Other
Directorships Held by Trustee or Officer |
Christianna Wood 2005 Market Street Philadelphia, PA 19103 March 1956 | | Trustee | | Since January 2019 | | Chief Executive Officer and President — Gore Creek Capital, Ltd. (August 2009–Present) | | 95 | | Director; Finance Committee and Audit Committee Member — H&R Block Corporation (July 2008–Present) Director; Chair of Investments Committee and Audit Committee Member — Grange Insurance (2013–Present) Trustee; Chair of Nominating and Governance Committee and Audit Committee Member — The Merger Fund (2013–Present), The Merger Fund VL (2013–Present); WCM Alternatives: Event-Driven Fund (2013–Present), and WCM Alternatives: Credit Event Fund (December 2017–Present) Director; Chair of Governance Committee and Audit Committee Member — International Securities Exchange (2010–2016) |
Janet L. Yeomans 2005 Market Street Philadelphia, PA 19103 July 1948 | | Trustee | | Since April 1999 | | Vice President and Treasurer (January 2006–July 2012), Vice President — Mergers & Acquisitions (January 2003–January 2006), and Vice President and Treasurer (July 1995–January 2003) — 3M Company | | 95 | | Director; Personnel and Compensation Committee Chair; Member of Nominating, Investments, and Audit Committees for various periods throughout directorship — Okabena Company (2009-2017) |
Investment Grade Series-25
| | | | | | | | | | |
Name, Address, and Birth Date | | Position(s) Held with Fund(s) | | Length of Time Served | | Principal
Occupation(s)
During the Past Five Years | | Number of
Portfolios in Fund Complex Overseen by Trustee or Officer | | Other
Directorships Held by Trustee or Officer |
| OFFICERS | | | | | | | | | | |
| | | | | |
David F. Connor 2005 Market Street Philadelphia, PA 19103 December 1963 | | Senior Vice President, General Counsel, and Secretary | | Senior Vice President, since May 2013; General Counsel since May 2015; Secretary since October 2005 | | David F. Connor has served in various capacities at different times at Macquarie Investment Management. | | 95 | | None3 |
Daniel V. Geatens 2005 Market Street Philadelphia, PA 19103 October 1972 | | Vice President and Treasurer | | Vice President and Treasurer since October 2007 | | Daniel V. Geatens has served in various capacities at different times at Macquarie Investment Management. | | 95 | | None3 |
Richard Salus 2005 Market Street Philadelphia, PA 19103 October 1963 | | Senior Vice President and Chief Financial Officer | | Senior Vice President and Chief Financial Officer since November 2006 | | Richard Salus has served in various capacities at different times at Macquarie Investment Management. | | 95 | | None |
| 1 | Shawn K. Lytle is considered to be an “Interested Trustee” because he is an executive officer of the Fund’s(s’) investment advisor. |
| 2 | Macquarie Investment Management is the marketing name for Macquarie Management Holdings, Inc. and its subsidiaries, including the Fund’s(s’) investment advisor, principal underwriter, and its transfer agent. |
| 3 | David F. Connor and Daniel V. Geatens serve in similar capacities for the six portfolios of the Optimum Fund Trust, which have the same investment advisor, principal underwriter, and transfer agent as the registrant. Mr. Geatens also serves as the Chief Financial Officer of the Optimum Fund Trust and he is the Chief Financial Officer and Treasurer for Macquarie Global Infrastructure Total Return Fund Inc. |
The Statement of Additional Information for the Fund(s) includes additional information about the Trustees and Officers and is available, without charge, upon request by calling 800523-1918.
Investment Grade Series-26
| | | | |
| | The Series files its complete schedule of portfolio holdings with the Securities and Exchange Commission (SEC) for the first and third quarters of each fiscal year on FormN-Q or FormN-PORT (available for filings after March 31, 2019). The Series’ FormsN-Q or FormsN-PORT, as well as a description of the policies and procedures that the Series uses to determine how to vote proxies (if any) relating to portfolio securities, are available without charge (i) upon request, by calling 800523-1918; and (ii) on the SEC’s website at sec.gov. In addition, a description of the policies and procedures that the Series uses to determine how to vote proxies (if any) relating to portfolio securities and the Schedule of Investments included in the Series’ most recent FormN-Q or FormN-PORT are available without charge on the Series’ website at delawarefunds.com/vip/literature. The Series’ FormsN-Q and FormsN-PORT may be reviewed and copied at the SEC’s Public Reference Room in Washington, D.C.; information on the operation of the Public Reference Room may be obtained by calling 800SEC-0330. Information (if any) regarding how the Series voted proxies relating to portfolio securities during the most recently disclosed12-month period ended June 30 is available without charge (i) through the Series’ website at delawarefunds.com/proxy; and (ii) on the SEC’s website at sec.gov. | | |
| | |
| AR-VIPIG 22497 (2/20) (1076649) | | Investment Grade Series-27 |

Delaware VIP® Trust
Delaware VIP Limited Duration Bond Series
(formerly, First Investors Life Series Limited Duration Bond Fund)
December 31, 2019
Beginning on or about June 1, 2021, as permitted by regulations adopted by the Securities and Exchange Commission, paper copies of your Series’ shareholder reports will no longer be sent to you by mail, unless you specifically request them from the Series or from your financial intermediary, such as a broker/dealer, bank, or insurance company. Instead, you will be notified by mail each time a report is posted on the website and provided with a link to access the report.
If you already elected to receive shareholder reports electronically, you will not be affected by this change and you do not need to take any action.
You may elect to receive paper copies of all future shareholder reports free of charge. You can inform the Series that you wish to continue receiving paper copies of your shareholder reports by contacting us at 800523-1918. If you own these shares through a financial intermediary, you may contact your financial intermediary to elect to continue to receive paper copies of your shareholder reports. Your election to receive reports in paper will apply to all funds held with the Delaware Funds® by Macquarie or your financial intermediary.

Table of contents
Other than Macquarie Bank Limited (MBL), none of the entities noted are authorized deposit-taking institutions for the purposes of the Banking Act 1959 (Commonwealth of Australia). The obligations of these entities do not represent deposits or other liabilities of MBL. MBL does not guarantee or otherwise provide assurance in respect of the obligations of these entities, unless noted otherwise. The Series is governed by US laws and regulations.
Unless otherwise noted, views expressed herein are current as of Dec. 31, 2019, and subject to change for events occurring after such date.
The Series is not FDIC insured and is not guaranteed. It is possible to lose the principal amount invested.
Advisory services provided by Delaware Management Company, a series of Macquarie Investment Management Business Trust (MIMBT), a US registered investment advisor.
The Series is distributed byDelaware Distributors, L.P.(DDLP), an affiliate of MIMBT and Macquarie Group Limited. Macquarie Investment Management (MIM) is the marketing name for certain companies comprising the asset management division of Macquarie Group Limited and its subsidiaries and affiliates worldwide.
This material may be used in conjunction with the offering of shares in Delaware VIP® Limited Duration Bond Series only if preceded or accompanied by the Series’ current prospectus or the summary prospectus.
© 2020 Macquarie Management Holdings, Inc.
All third-party marks cited are the property of their respective owners.
| | |
| Delaware VIP®Trust — Delaware VIP Limited Duration Bond Series |
| Portfolio management review | | January 7, 2020 (Unaudited) |
The investment objective of the Series is to seek current income consistent with low volatility of principal.
Effective after the close of business on Oct. 4, 2019, Delaware Management Company (DMC or Manager), a series of Macquarie Investment Management Business Trust (MIMBT), serves as the investment manager for the Series.* During the period after the close of business on Oct. 4, 2019 to Dec. 31, 2019, the Manager repositioned the portfolio in accordance with the Series’ investment objective and principal investment strategies, as described in the prospectus. The investment objective is the same and its principal investment strategies are the same or similar to those of the corresponding Life Series Fund.
For the fiscal year ended Dec. 31, 2019, Delaware VIP Limited Duration Bond Series (the “Series”) Standard Class shares gained 4.09%, reflecting all dividends reinvested. The Series’ benchmark, the Bloomberg Barclays1-3 Year US Government/Credit Index, advanced 4.03% for the same period. The Series changed its broad-based securities index from the ICE BofA1-5 Year US Broad Market Index to the Bloomberg Barclays1-3 Year US Government/Credit Index as of Jan. 31, 2019. The Series elected to use the new index because it more closely reflects the Series’ investment strategies.
The major theme of the Series’ fiscal year was the great monetary policy pivot. The period began with the US Treasury yield above 3% and the US Federal Reserve contemplating four additional rate hikes heading into 2019. While the Fed had raised rates at the end of the prior fiscal period, by early 2019 it was apparent that further hikes were untenable. The US economy, though among the strongest globally, was no longer able to sustain a10-year interest rate above 3% or a federal funds rate in themid-2% range.
As 2019 began, economic indicators in the US began to flash yellow while global financial conditions were flashing red. The liquidity-induced risk-assets selloff at the end of 2018 reflected what we believe to be the ongoing unhealthy dependence of asset prices on monetary policy. Bymid-2019, there were other signs of an impending global slowdown as well, including corporate earnings’ deceleration, declining global manufacturing activity, the continuingUS-China trade dispute, and the ongoing Brexit drama. Many investors saw the yield-curve inversion and the August peak of $17 trillion worldwide in negative-yielding debt as signals of a potential recession.
This prompted the Fed and central banks in Australia, Europe, and the United Kingdom to shift to a more accommodative monetary policy. In the US, the Fed first signaled a hold on further rate hikes and then terminated quantitative tightening (QT) and balance-sheet reductions. Three interest rate cuts, of 0.25 percentage points each, followed in July, September, and October.
The massive liquidity infusion coupled with the December announcement of aphase-one trade agreement with China, sent both interest rates and risk premiums significantly lower. Fixed income delivered its best total return since 2002, finishing the year with investors in a frenzied search for yield. We believe the fiscal year was a good example of the potential benefit of owning bonds as part of a diversified investment portfolio. During the period, bonds provided a stabilizing benefit and a return competitive with that of equities.
Entering fiscal year 2019, we assessed that long-standing secular factors would continue to drive asset markets and global economic growth and inflation. These included aging demographics, rising debt, and increased digitization, which have for decades held down growth and inflation. In recent years, two additional themes have emerged: increased dependency of asset prices on monetary policy, and deglobalization, seen in the form of rising populism. With that as a backdrop, we resisted reacting to short-term headlines, such as Brexit, theUS-China trade dispute, or pockets of global unrest. Instead, we focused on the underlying issues.
Source: Bloomberg.
Foresters Investment Management Company, Inc. (FIMCO) managed the Series from Jan. 1, 2019 to Oct. 4, 2019, when the management of the Series transitioned to DMC. The following is a discussion about Series performance during that period ended Oct. 4, 2019:
The Series outperformed the Bloomberg Barclays1-3 Year US Government/Credit Index during the reporting period. Several factors drove the Series’ outperformance. First, it was overweight investment grade corporate bonds. Second, the Series was overweight asset-backed securities (ABS) relative to the benchmark. Third, the Series had exposure to covered-bond securities which added to its relative outperformance. Fourth, exposure to agency commercial mortgage-backed securities (CMBS) as well as agency CMOs maturing between two and three years helped the Series’ performance. Lastly, the Series’ average duration was longer than its benchmark during the reporting period. This contributed to the Series’ outperformance as yields compressed during this period.
*On April 6, 2019, FIMCO, the investment adviser to the First Investors Funds, entered into an agreement with Macquarie Management Holdings, Inc. (MMHI), whereby MMHI, on behalf of its affiliate DMC, would acquire FIMCO’s asset management business (the “Transaction”). In connection with the Transaction, the Board of Trustees of the First Investors Trusts and the First Investors Fund shareholders approved, pursuant to an Agreement and Plan of
Unless otherwise noted, views expressed herein are current as of Dec. 31, 2019, and subject to change.
Limited Duration Bond Series-1
Delaware VIP®Trust — Delaware VIP Limited Duration Bond Series
| | |
| Portfolio management review (continued) | | January 7, 2020 (Unaudited) |
Reorganization (the “Agreement”), the transfer of all assets and liabilities of each First Investors Fund to a corresponding, newly formed fund in the Delaware Funds® by Macquarie family of funds. The Transaction closed on Oct. 4, 2019.
Unless otherwise noted, views expressed herein are current as of Dec. 31, 2019, and subject to change.
Limited Duration Bond Series-2
Delaware VIP® Trust — Delaware VIP Limited Duration Bond Series
Performance summary (Unaudited)
The performance quoted represents past performance and does not guarantee future results. Investment return and principal value of an investment will fluctuate so that shares, when redeemed, may be worth more or less than their original cost. Current performance may be lower or higher than the performance quoted.
Carefully consider the Series’ investment objectives, risk factors, charges, and expenses before investing. This and other information can be found in the Series’ prospectus and its summary prospectus, which may be obtained by visiting delawarefunds.com/vip/literature or calling 800523-1918. Investors should read the prospectus and the summary prospectus carefully before investing.
| | | | | | | | |
| Delaware VIP Limited Duration Bond Series | | | | |
| Average annual total returns | | | | | | | | |
| For periods ended Dec. 31, 2019 | | 1 year | | 3 year | | 5 year | | Lifetime |
Standard Class shares (commenced operations on July 1, 2014) | | +4.09% | | +1.69% | | +1.04% | | +0.46% |
| | | | | | | | | |
Bloomberg Barclays1-3 Year US Government/Credit Index (current benchmark) | | +4.03% | | +2.15% | | +1.67% | | — |
| | | | | | | | | |
ICE BofA1-5 Year US Broad Market Index (former benchmark) | | +5.19% | | +2.62% | | +2.10% | | — |
Returns reflect the reinvestment of all distributions. Please see page 5 for a description of the indices.
As described in the Series’ most recent prospectus, the net expense ratio for Standard Class shares of the Series was 0.75%, while total operating expenses for Standard Class shares were 1.14%. The management fee for Standard Class shares was 0.50%. The Series’ investment manager, Delaware Management Company (Manager), has contractually agreed to waive all or a portion of its investment advisory fees and/or pay/reimburse expenses (excluding any12b-1 fees, acquired fund fees and expenses, taxes, interest, short sale and dividend interest expenses, brokerage fees, certain insurance costs, and nonroutine expenses or costs, including, but not limited to, those relating to reorganizations, litigation, conducting shareholder meetings, and liquidations) in order to prevent annual series operating expenses from exceeding 0.75% of the Series’ average daily net assets from Oct. 4, 2019 through Dec. 31, 2019.* Please see the most recent prospectus and any applicable supplement(s) for additional information on these fee waivers and/or reimbursements. Please see the “Financial highlights” section in this report for the most recent expense ratios.
Earnings from a variable annuity or variable life investment compoundtax-free until withdrawal, and as a result, no adjustments were made for income taxes.
Expense limitations were in effect for Standard Class shares during certain periods shown in the Series performance table above and in the Performance of a $10,000 Investment graph on the next page.
Performance data do not reflect insurance fees related to a variable annuity or variable life investment or the deferred sales charge that would apply to certain withdrawals of investments held for fewer than eight years. Performance shown here would have been reduced if such fees were included and the expense limitation removed. For more information about fees, consult your variable annuity or variable life prospectus.
Investments in variable products involve risk.
Fixed income securities and bond funds can lose value, and investors can lose principal, as interest rates rise. They also may be affected by economic conditions that hinder an issuer’s ability to make interest and principal payments on its debt.
The Series may also be subject to prepayment risk, the risk that the principal of a fixed income security that is held by the Series may be prepaid prior to maturity, potentially forcing the Series to reinvest that money at a lower interest rate.
The Series may invest in derivatives, which may involve additional expenses and are subject to risk, including the risk that an underlying security or securities index moves in the opposite direction from what the portfolio manager anticipated. A derivatives transaction depends upon the counterparties’ ability to fulfill their contractual obligations.
International investments entail risks not ordinarily associated with US investments including fluctuation in currency values, differences in accounting principles, or economic or political instability in other nations. Investing in emerging markets can be riskier than investing in established foreign markets due to increased volatility and lower trading volume.
If and when the Series invests in forward foreign currency contracts or use other investments to hedge against currency risks, the Series will be subject to special risks, including counterparty risk.
Narrowly focused investments may exhibit higher volatility than investments in multiple industry sectors.
Limited Duration Bond Series-3
Delaware VIP® Limited Duration Bond Series
Performance summary (Unaudited) (continued)
During periods of falling interest rates, an issuer of a callable bond held by the Series may “call” or repay the security before its stated maturity. The Series would then lose any price appreciation above the bond’s call price and the Series may have to reinvest the proceeds at lower interest rates, resulting in a decline in the Series’ income.
The market values of bonds and other debt securities are affected by changes in interest rates. In general, when interest rates rise, the market value of a debt security declines, and when interest rates decline, the market value of a debt security increases. Generally, the longer the maturity and duration of a debt security, the greater its sensitivity to interest rates. The yields received by the Series on its investments will generally decline as interest rates decline.
Writing call options involves risks, such as potential losses if equity markets or an individual equity security do not move as expected and the potential for greater losses than if these techniques had not been used.
The Series may hold a significant amount of investments in similar businesses, which could be affected by the same economic or market conditions. To the extent the Series invests significantly in the financials sector, the value of the Series’ shares may be particularly vulnerable to factors affecting that sector, such as the availability and cost of capital, changes in interest rates, the rate of corporate and consumer debt defaults, credit ratings and quality, market liquidity, extensive government regulation and price competition.
An exchange-traded fund (ETF) is a security that represents all the stocks on a given exchange. ETF shares can be bought, sold, short-sold, traded on margin, and generally function as if they were stocks.
LIBOR risk is the risk that potential changes related to the use of the London interbank offered rate (LIBOR) could have adverse impacts on financial instruments which reference LIBOR. The potential abandonment of LIBOR could affect the value and liquidity of instruments which reference LIBOR.
Please read both the contract and underlying prospectus for specific details regarding the product’s risk profile.
*The aggregate contractual waiver period covering this report is from Oct. 4, 2019 through Oct. 31, 2021.
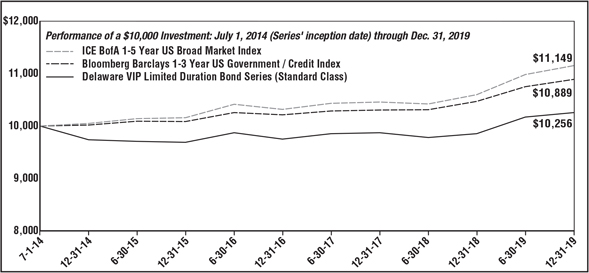
| | | | | | | | | | |
For period beginning July 1, 2014 (Series’ inception date) through Dec.
31, 2019 | | Starting value | | | Ending value | |
-- | | ICE BofA1-5 Year US Broad Market Index | | | $10,000 | | | | $11,149 | |
-- | | Bloomberg Barclays1-3 Year US Government / Credit Index | | | $10,000 | | | | $10,889 | |
– | | Delaware VIP Limited Duration Bond Series (Standard Class) | | | $10,000 | | | | $10,256 | |
The graph shows a $10,000 investment in the Delaware VIP Limited Duration Bond Series Standard Class shares for the period from July 1, 2014 through Dec. 31, 2019.
The graph also shows $10,000 invested in the Bloomberg Barclays1-3 Year US Government/Credit Index and the ICE BofA1-5 Year US Broad Market Index for the period from July 1, 2014 through Dec. 31, 2019.
Limited Duration Bond Series-4
Delaware VIP® Limited Duration Bond Series
Performance summary (Unaudited) (continued)
The Bloomberg Barclays1-3 Year US Government/Credit Index is a market value-weighted index of government fixed-rate debt securities and investment grade US and foreign fixed-rate debt securities with average maturities of one to three years.
The ICE BofA1-5 Year US Broad Market Index tracks the performance of US dollar-denominated investment grade debt publicly issued in the US domestic market, including US Treasury, quasi-government, corporate, securitized, and collateralized securities, with a remaining term to final maturity or an average life of less than five years. With the exception of local currency sovereign debt, qualifying securities must have an investment grade rating (based on an average of Moody’s, S&P, and Fitch).
Index performance returns do not reflect any management fees, transaction costs or expenses. Indices are unmanaged and one cannot invest directly in an index.
Past performance is not a guarantee of future results.
Limited Duration Bond Series-5
Delaware VIP® Trust — Delaware VIP Limited Duration Bond Series
Disclosure of Series expenses
For thesix-month period from July 1, 2019 to December 31, 2019 (Unaudited)
As a shareholder of the Series, you incur ongoing costs, which may include management fees; distribution and service(12b-1) fees; and other Series expenses. This example is intended to help you understand your ongoing costs (in dollars) of investing in the Series and to compare these costs with the ongoing costs of investing in other mutual funds.
The example is based on an investment of $1,000 invested at the beginning of the period and held for the entiresix-month period from July 1, 2019 to Dec. 31, 2019.
Actual expenses
The first section of the table shown, “Actual Series return,” provides information about actual account values and actual expenses. You may use the information in this section of the table, together with the amount you invested, to estimate the expenses that you paid over the period. Simply divide your account value by $1,000 (for example, an $8,600 account value divided by $1,000 = 8.6), then multiply the result by the number in the first section under the heading entitled “Expenses Paid During Period” to estimate the expenses you paid on your account during the period.
Hypothetical example for comparison purposes
The second section of the table shown, “Hypothetical 5% return,” provides information about hypothetical account values and hypothetical expenses based on the Series’ actual expense ratio and an assumed rate of return of 5% per year before expenses, which is not the Series’ actual return. The hypothetical account values and expenses may not be used to estimate the actual ending account balance or expenses you paid for the period. You may use this information to compare the ongoing costs of investing in the Series and other funds. To do so, compare this 5% hypothetical example with the 5% hypothetical examples that appear in the shareholder reports of other funds.
Please note that the expenses shown in the table are meant to highlight your ongoing costs only. As a shareholder of the Series, you do not incur any transaction costs, such as sales charges (loads), redemption fees or exchange fees, but shareholders of other funds may incur such costs. Also, the fees related to the variable annuity investment or the deferred sales charge that could apply have not been included. Therefore, the second section of the table is useful in comparing ongoing costs only, and will not help you determine the relative total costs of owning different funds. The Series’ expenses shown in the table reflect fee waivers in effect and assume reinvestment of all dividends and distributions.
Expense analysis of an investment of $1,000
| | | | | | | | | | | | | | |
| | | Beginning
Account
Value
7/1/19 | | | Ending
Account
Value
12/31/19 | | | Annualized
Expense
Ratio | | Expenses
Paid During
Period
7/1/19 to
12/31/19* | |
Actual Series return† | | | | |
Standard Class | | | $1,000.00 | | | | $1,008.40 | | | 0.97% | | | $4.91 | |
Hypothetical 5% return(5% return before expenses) | | | | |
Standard Class | | | $1,000.00 | | | | $1,020.32 | | | 0.97% | | | $4.94 | |
*“Expenses Paid During Period” are equal to the Series’ annualized expense ratio, multiplied by the average account value over the period, multiplied by 184/365 (to reflect theone-half year period).
†Because actual returns reflect only the most recentsix-month period, the returns shown may differ significantly from fiscal year returns.
In addition to the Series’ expenses reflected above, the Series also indirectly bears its portion of the fees and expenses of the investment companies (Underlying Funds) in which it invests. The table above does not reflect the expenses of the Underlying Funds.
Limited Duration Bond Series-6
Delaware VIP® Trust — Delaware VIP Limited Duration Bond Series
Security type / country and sector allocations
As of December 31, 2019 (Unaudited)
Sector designations may be different than the sector designations presented in other Series materials. The sector designations may represent the investment manager’s internal sector classifications.
| | |
| Security type / country | | Percentage
of net assets |
Agency Mortgage-Backed Securities | | 16.51% |
Agency Obligation | | 0.95% |
Corporate Bonds | | 35.15% |
Banking | | 11.02% |
Basic Industry | | 0.19% |
Capital Goods | | 1.44% |
Communications | | 2.12% |
Consumer Cyclical | | 0.48% |
ConsumerNon-Cyclical | | 6.49% |
Electric | | 3.64% |
Energy | | 2.48% |
Finance Companies | | 2.99% |
Insurance | | 0.31% |
Technology | | 1.72% |
Transportation | | 2.27% |
Non-Agency Asset-Backed Securities | | 19.12% |
US Treasury Obligations | | 15.82% |
Short-Term Investments | | 12.05% |
Total Value of Securities | | 99.60% |
Receivables and Other Assets Net of Liabilities | | 0.40% |
Total Net Assets | | 100.00% |
Limited Duration Bond Series-7
Delaware VIP® Trust — Delaware VIP Limited Duration Bond Series
Schedule of investments
December 31, 2019
| | | | | | | | |
| | | Principal | | | Value | |
| | | amount° | | | (US $) | |
| |
Agency Mortgage-Backed | | | | | |
Securities – 16.51% | | | | | | | | |
Fannie Mae S.F. 30 yr | | | | | | | | |
4.50% 1/1/43 | | | 286,649 | | | $ | 310,922 | |
4.50% 2/1/44 | | | 178,445 | | | | 197,788 | |
4.50% 4/1/44 | | | 209,274 | | | | 231,985 | |
4.50% 11/1/44 | | | 276,207 | | | | 304,445 | |
4.50% 10/1/45 | | | 635,869 | | | | 692,420 | |
4.50% 5/1/48 | | | 644,846 | | | | 681,204 | |
5.00% 5/1/48 | | | 462,370 | | | | 495,129 | |
5.50% 5/1/44 | | | 237,566 | | | | 266,784 | |
Freddie Mac S.F. 30 yr 4.00% 9/1/49 | | | 428,957 | | | | 458,796 | |
4.50% 7/1/45 | | | 54,100 | | | | 58,775 | |
4.50% 4/1/49 | | | 370,360 | | | | 390,715 | |
5.00% 7/1/45 | | | 666,411 | | | | 734,314 | |
5.00% 8/1/48 | | | 385,010 | | | | 411,977 | |
| | | | | | | | |
Total Agency Mortgage-Backed Securities
(cost $5,243,175) | | | | | | | 5,235,254 | |
| | | | | | | | |
| | |
Agency Obligation – 0.95% | | | | | | | | |
Federal National Mortgage Association 1.50% 11/30/20 | | | 300,000 | | | | 299,923 | |
| | | | | | | | |
Total Agency Obligation
(cost $299,681) | | | | | | | 299,923 | |
| | | | | | | | |
Corporate Bonds – 35.15% | | | | | | | | |
Banking – 11.02% | | | | | | | | |
Bank of America | | | | | | | | |
2.456% 10/22/25 µ | | | 30,000 | | | | 30,193 | |
3.458% 3/15/25 µ | | | 50,000 | | | | 52,222 | |
5.625% 7/1/20 | | | 180,000 | | | | 183,318 | |
Bank of Montreal 3.10% 4/13/21 | | | 75,000 | | | | 76,228 | |
Citizens Bank 2.629% (LIBOR03M + 0.72%) 2/14/22 • | | | 250,000 | | | | 251,477 | |
Citizens Financial Group 2.85% 7/27/26 | | | 110,000 | | | | 112,043 | |
DNB Boligkreditt 144A 2.50% 3/28/22 # | | | 500,000 | | | | 506,802 | |
Fifth Third Bancorp | | | | | | | | |
2.375% 1/28/25 | | | 35,000 | | | | 35,047 | |
3.65% 1/25/24 | | | 35,000 | | | | 36,902 | |
Huntington Bancshares 2.30% 1/14/22 | | | 65,000 | | | | 65,351 | |
JPMorgan Chase & Co. 4.023% 12/5/24 µ | | | 330,000 | | | | 351,896 | |
5.00% µy | | | 60,000 | | | | 62,475 | |
Morgan Stanley | | | | | | | | |
2.75% 5/19/22 | | | 5,000 | | | | 5,092 | |
3.124% (LIBOR03M + 1.22%) 5/8/24 • | | | 145,000 | | | | 147,663 | |
3.737% 4/24/24 µ | | | 25,000 | | | | 26,128 | |
5.00% 11/24/25 | | | 15,000 | | | | 16,895 | |
5.50% 1/26/20 | | | 110,000 | | | | 110,235 | |
| | | | | | | | |
| | | Principal | | | Value | |
| | | amount° | | | (US $) | |
Corporate Bonds (continued) | | | | | | | | |
Banking (continued) | | | | | | | | |
PNC Bank | | | | | | | | |
2.201% (LIBOR03M + 0.31%) 6/10/21 • | | | 250,000 | | | $ | 250,120 | |
2.70% 11/1/22 | | | 10,000 | | | | 10,191 | |
Regions Financial 2.75% 8/14/22 | | | 25,000 | | | | 25,448 | |
3.80% 8/14/23 | | | 50,000 | | | | 52,928 | |
Truist Bank | | | | | | | | |
2.15% 12/6/24 | | | 250,000 | | | | 249,538 | |
2.636% 9/17/29 µ | | | 105,000 | | | | 104,959 | |
Truist Financial 3.75% 12/6/23 | | | 110,000 | | | | 116,615 | |
UBS Group 144A 3.00% 4/15/21 # | | | 200,000 | | | | 202,675 | |
US Bancorp 3.375% 2/5/24 | | | 55,000 | | | | 57,736 | |
US Bank 2.05% 10/23/20 | | | 355,000 | | | | 355,483 | |
| | | | | | | | |
| | | | | | | 3,495,660 | |
| | | | | | | | |
Basic Industry – 0.19% | | | | | | | | |
Georgia-Pacific 144A 5.40% 11/1/20 # | | | 60,000 | | | | 61,670 | |
| | | | | | | | |
| | | | | | | 61,670 | |
| | | | | | | | |
Capital Goods – 1.44% | | | | | | | | |
General Electric | | | | | | | | |
2.271% (LIBOR03M + 0.38%) 5/5/26 • | | | 5,000 | | | | 4,752 | |
2.70% 10/9/22 | | | 35,000 | | | | 35,477 | |
Roper Technologies 2.35% 9/15/24 | | | 145,000 | | | | 145,858 | |
United Technologies 2.30% 5/4/22 | | | 160,000 | | | | 161,253 | |
Waste Management 2.95% 6/15/24 | | | 105,000 | | | | 108,489 | |
| | | | | | | | |
| | | | | | | 455,829 | |
| | | | | | | | |
Communications – 2.12% | | | | | | | | |
AT&T | | | | | | | | |
3.067% (LIBOR03M + 1.18%) 6/12/24 • | | | 125,000 | | | | 127,251 | |
4.35% 3/1/29 | | | 10,000 | | | | 11,119 | |
4.50% 3/9/48 | | | 25,000 | | | | 27,627 | |
Comcast 2.631% (LIBOR03M + 0.63%) 4/15/24 • | | | 160,000 | | | | 161,708 | |
Crown Castle International 5.25% 1/15/23 | | | 50,000 | | | | 54,322 | |
Fox | | | | | | | | |
144A 3.666% 1/25/22 # | | | 160,000 | | | | 165,221 | |
144A 4.03% 1/25/24 # | | | 100,000 | | | | 106,608 | |
Vodafone Group 4.875% 6/19/49 | | | 15,000 | | | | 17,413 | |
| | | | | | | | |
| | | | | | | 671,269 | |
| | | | | | | | |
Consumer Cyclical – 0.48% | | | | | | | | |
General Motors Financial | | | | | | | | |
3.45% 4/10/22 | | | 50,000 | | | | 51,139 | |
4.15% 6/19/23 | | | 30,000 | | | | 31,568 | |
5.10% 1/17/24 | | | 65,000 | | | | 70,572 | |
| | | | | | | | |
| | | | | | | 153,279 | |
| | | | | | | | |
Limited Duration Bond Series-8
Delaware VIP® Limited Duration Bond Series
Schedule of investments (continued)
| | | | | | | | |
| | | Principal | | | Value | |
| | | amount° | | | (US $) | |
| |
Corporate Bonds (continued) | | | | | |
ConsumerNon-Cyclical – 6.49% | | | | | |
AbbVie | | | | | | | | |
144A 2.60% 11/21/24 # | | | 40,000 | | | $ | 40,274 | |
144A 2.95% 11/21/26 # | | | 50,000 | | | | 50,825 | |
Alcon Finance 144A 2.75% 9/23/26 # | | | 490,000 | | | | 499,272 | |
Anheuser-Busch InBev Worldwide 4.15% 1/23/25 | | | 525,000 | | | | 571,517 | |
Bristol-Myers Squibb 144A 2.90% 7/26/24 # | | | 130,000 | | | | 134,209 | |
Cigna 3.20% 9/17/20 | | | 490,000 | | | | 493,888 | |
CVS Health 3.35% 3/9/21 | | | 110,000 | | | | 111,829 | |
Keurig Dr Pepper 3.551% 5/25/21 | | | 60,000 | | | | 61,289 | |
Molson Coors Beverage 2.10% 7/15/21 | | | 95,000 | | | | 95,084 | |
| | | | | | | | |
| | | | | | | 2,058,187 | |
| | | | | | | | |
Electric – 3.64% | | | | | |
AEP Texas 2.40% 10/1/22 | | | 140,000 | | | | 141,279 | |
CenterPoint Energy 3.85% 2/1/24 | | | 70,000 | | | | 73,835 | |
Cleveland Electric Illuminating 5.50% 8/15/24 | | | 115,000 | | | | 131,457 | |
Duke Energy | | | | | | | | |
1.80% 9/1/21 | | | 75,000 | | | | 74,932 | |
4.875% µy | | | 65,000 | | | | 68,261 | |
Entergy 4.00% 7/15/22 | | | 90,000 | | | | 93,937 | |
Entergy Louisiana 4.05% 9/1/23 | | | 10,000 | | | | 10,632 | |
Exelon 2.85% 6/15/20 | | | 85,000 | | | | 85,195 | |
IPALCO Enterprises 3.45% 7/15/20 | | | 115,000 | | | | 115,521 | |
Nevada Power 2.75% 4/15/20 | | | 50,000 | | | | 50,114 | |
NextEra Energy Capital Holdings 3.15% 4/1/24 | | | 100,000 | | | | 103,689 | |
NRG Energy 144A 3.75% 6/15/24 # | | | 95,000 | | | | 98,232 | |
Vistra Operations 144A 3.55% 7/15/24 # | | | 105,000 | | | | 106,385 | |
| | | | | | | | |
| | | | | | | 1,153,469 | |
| | | | | | | | |
Energy – 2.48% | | | | | |
Continental Resources 3.80% 6/1/24 | | | 70,000 | | | | 72,412 | |
Exxon Mobil 2.019% 8/16/24 | | | 130,000 | | | | 130,410 | |
Marathon Oil 2.80% 11/1/22 | | | 55,000 | | | | 55,915 | |
Occidental Petroleum | | | | | | | | |
2.90% 8/15/24 | | | 85,000 | | | | 86,404 | |
3.50% 8/15/29 | | | 30,000 | | | | 30,607 | |
ONEOK 7.50% 9/1/23 | | | 115,000 | | | | 134,227 | |
Sabine Pass Liquefaction 5.75% 5/15/24 | | | 110,000 | | | | 122,701 | |
Schlumberger Holdings 144A 3.75% 5/1/24 # | | | 145,000 | | | | 152,782 | |
| | | | | | | | |
| | | | | | | 785,458 | |
| | | | | | | | |
Finance Companies – 2.99% | | | | | |
AerCap Ireland Capital 3.65% 7/21/27 | | | 480,000 | | | | 494,479 | |
Aviation Capital Group 144A 2.875% 1/20/22 # | | | 130,000 | | | | 130,925 | |
| | | | | | | | |
| | | Principal | | | Value | |
| | | amount° | | | (US $) | |
| |
Corporate Bonds (continued) | | | | | |
Finance Companies (continued) | | | | | |
Aviation Capital Group 144A 4.375% 1/30/24 # | | | 10,000 | | | $ | 10,537 | |
144A 7.125% 10/15/20 # | | | 200,000 | | | | 207,567 | |
Avolon Holdings Funding 144A 3.95% 7/1/24 # | | | 85,000 | | | | 88,685 | |
144A 4.375% 5/1/26 # | | | 15,000 | | | | 15,863 | |
| | | | | | | | |
| | | | | | | 948,056 | |
| | | | | | | | |
Insurance – 0.31% | | | | | |
AXA Equitable Holdings 3.90% 4/20/23 | | | 95,000 | | | | 99,553 | |
| | | | | | | | |
| | | | | | | 99,553 | |
| | | | | | | | |
Technology – 1.72% | | | | | |
Global Payments | | | | | | | | |
2.65% 2/15/25 | | | 50,000 | | | | 50,238 | |
3.20% 8/15/29 | | | 35,000 | | | | 35,768 | |
Intel 3.25% 11/15/49 | | | 25,000 | | | | 25,185 | |
International Business Machines 3.00% 5/15/24 | | | 100,000 | | | | 103,615 | |
Microchip Technology | | | | | | | | |
3.922% 6/1/21 | | | 30,000 | | | | 30,684 | |
4.333% 6/1/23 | | | 55,000 | | | | 58,112 | |
Micron Technology 4.975% 2/6/26 | | | 55,000 | | | | 61,056 | |
NXP 144A 4.875% 3/1/24 # | | | 165,000 | | | | 179,989 | |
| | | | | | | | |
| | | | | | | 544,647 | |
| | | | | | | | |
Transportation – 2.27% | | | | | |
Heathrow Funding 144A 4.875% 7/15/21 # | | | 691,000 | | | | 719,776 | |
| | | | | | | | |
| | | | | | | 719,776 | |
| | | | | | | | |
Total Corporate Bonds
(cost $11,089,556) | | | | 11,146,853 | |
| | | | | | | | |
| |
Non-Agency Asset-Backed Securities – 19.12% | | | | | |
Americredit Automobile Receivables Trust | | | | | | | | |
Series2019-1 B 3.13% 2/18/25 | | | 300,000 | | | | 305,316 | |
ARI Fleet Lease Trust | | | | | | | | |
Series2019-A A2B 144A 2.22% (LIBOR01M + 0.48%) 11/15/27 #• | | | 150,000 | | | | 150,148 | |
BMW Vehicle Lease Trust | | | | | | | | |
Series2018-1 A3 3.26% 7/20/21 | | | 100,000 | | | | 100,907 | |
CarMax Auto Owner Trust | | | | | | | | |
Series2018-2 B 3.37% 10/16/23 | | | 150,000 | | | | 153,618 | |
Chase Issuance Trust | | | | | | | | |
Series2016-A3 A3 2.29% (LIBOR01M + 0.55%) 6/15/23 • | | | 300,000 | | | | 301,857 | |
Citibank Credit Card Issuance Trust | | | | | | | | |
Series2018-A1 A1 2.49% 1/20/23 | | | 300,000 | | | | 302,044 | |
Discover Card Execution Note Trust | | | | | | | | |
Series2015-A4 A4 2.19% 4/17/23 | | | 700,000 | | | | 701,927 | |
Limited Duration Bond Series-9
Delaware VIP® Limited Duration Bond Series
Schedule of investments (continued)
| | | | | | | | |
| | | Principal | | | Value | |
| | | amount° | | | (US $) | |
| |
Non-Agency Asset-Backed Securities (continued) | | | | | |
Discover Card Execution Note Trust | | | | | | | | |
Series2018-A3 A3 1.97% (LIBOR01M + 0.23%, Floor 0.23%) 12/15/23 • | | | 150,000 | | | $ | 150,133 | |
Ford Credit Auto Lease Trust | | | | | | | | |
Series2019-B A2A 2.28% 2/15/22 | | | 300,000 | | | | 300,915 | |
Ford Credit Auto Owner Trust | | | | | | | | |
Series2017-A A3 1.67% 6/15/21 | | | 188,128 | | | | 188,003 | |
Series2017-C A3 2.01% 3/15/22 | | | 234,350 | | | | 234,459 | |
GM Financial Automobile Leasing Trust | | | | | | | | |
Series2018-2 B 3.31% 4/20/22 | | | 100,000 | | | | 100,765 | |
Hertz Vehicle Financing II | | | | | | | | |
Series2017-1A A 144A 2.96% 10/25/21 # | | | 300,000 | | | | 301,525 | |
Hyundai Auto Lease Securitization Trust | | | | | | | | |
Series2018-A A3 144A 2.81% 4/15/21 # | | | 252,549 | | | | 253,215 | |
Hyundai Auto Receivables Trust | | | | | | | | |
Series2019-B A2 1.93% 7/15/22 | | | 550,000 | | | | 549,998 | |
John Deere Owner Trust | | | | | | | | |
Series2019-A A3 2.91% 7/17/23 | | | 200,000 | | | | 202,841 | |
Kubota Credit Owner Trust | | | | | | | | |
Series2018-1A A3 144A 3.10% 8/15/22 # | | | 210,000 | | | | 212,433 | |
Mercedes-Benz Auto Lease Trust | | | | | | | | |
Series2019-B A2 2.01% 12/15/21 | | | 300,000 | | | | 300,183 | |
Santander Drive Auto Receivables Trust | | | | | | | | |
Series2018-2 B 3.03% 9/15/22 | | | 256,982 | | | | 257,437 | |
Tesla Auto Lease Trust | | | | | | | | |
Series2018-B A 144A 3.71% 8/20/21 # | | | 469,002 | | | | 475,082 | |
Verizon Owner Trust | | | | | | | | |
Series2017-2A A 144A 1.92% 12/20/21 # | | | 286,504 | | | | 286,473 | |
Series2018-A A1A 3.23% 4/20/23 | | | 230,000 | | | | 233,866 | |
| | | | | | | | |
TotalNon-Agency Asset-Backed | | | | | | | | |
Securities (cost $6,021,945) | | | | | | | 6,063,145 | |
| | | | | | | | |
US Treasury Obligations – 15.82% | | | | | |
US Treasury Bond
2.375% 11/15/49 | | | 5,000 | | | | 4,979 | |
US Treasury Floating Rate Notes
1.826% (USBMMY3M + 0.30%) 10/31/21 • | | | 715,000 | | | | 716,332 | |
| | | | | | | | |
| | | Principal | | | Value | |
| | | amount° | | | (US $) | |
| |
US Treasury Obligations (continued) | | | | | |
US Treasury Notes | | | | | | | | |
1.50% 10/31/21 | | | 2,310,000 | | | $ | 2,306,570 | |
1.50% 9/30/24 | | | 915,000 | | | | 906,673 | |
1.50% 11/30/24 | | | 400,000 | | | | 396,436 | |
1.625% 8/15/29 | | | 5,000 | | | | 4,868 | |
1.75% 7/31/24 | | | 680,000 | | | | 681,664 | |
| | | | | | | | |
Total US Treasury Obligations
(cost $5,020,859) | | | | | | | 5,017,522 | |
| | | | | | | | |
| | | Number of
shares | | | | |
Short-Term Investments – 12.05% | | | | | |
Money Market Mutual Funds – 1.00% | | | | | |
BlackRock FedFund – Institutional | | | | | | | | |
Shares(seven-day effective yield 1.52%) | | | 63,652 | | | | 63,652 | |
Fidelity Investments Money Market | | | | | | | | |
Government Portfolio – Class I(seven-day effective yield 1.49%) | | | 63,652 | | | | 63,652 | |
GS Financial Square Government | | | | | | | | |
Fund – Institutional Shares(seven-day effective yield 1.51%) | | | 63,652 | | | | 63,652 | |
Morgan Stanley Government | | | | | | | | |
Portfolio – Institutional Share Class(seven-day effective yield 1.48%) | | | 63,652 | | | | 63,652 | |
State Street Institutional US Government | | | | | | | | |
Money Market Fund – Investor Class(seven-day effective yield 1.45%) | | | 63,652 | | | | 63,652 | |
| | | | | | | | |
| | | | | | | 318,260 | |
| | | | | | | | |
| | | Principal
amount° | | | | |
US Treasury Obligations – 11.05%≠ | | | | | |
US Treasury Bills | | | | | | | | |
1.25% 1/31/20 | | | 495,000 | | | | 494,844 | |
2.75% 11/30/20 | | | 2,980,000 | | | | 3,009,518 | |
| | | | | | | | |
| | | | | | | 3,504,362 | |
| | | | | | | | |
Total Short-Term Investments
(cost $3,792,358) | | | | 3,822,622 | |
| | | | | | | | |
| | | | |
Total Value of Securities – 99.60%
(cost $31,467,574) | | $ | 31,585,319 | |
| | | | |
| # | Security exempt from registration under Rule 144A of the Securities Act of 1933, as amended. At Dec. 31, 2019, the aggregate value of Rule 144A securities was $5,157,173, which represents 16.26% of the Series’ net assets. See Note 9 in “Notes to financial statements.” |
| ≠ | The rate shown is the effective yield at the time of purchase. |
Limited Duration Bond Series-10
Delaware VIP® Limited Duration Bond Series
Schedule of investments (continued)
| ° | Principal amount shown is stated in USD unless noted that the security is denominated in another currency. |
| µ | Fixed to variable rate investment. The rate shown reflects the fixed rate in effect at Dec. 31, 2019. Rate will reset at a future date. |
| y | No contractual maturity date. |
| • | Variable rate investment. Rates reset periodically. Rate shown reflects the rate in effect at Dec. 31, 2019. For securities based on a published reference rate and spread, the reference rate and spread are indicated in their description above. The reference rate descriptions (i.e. LIBOR03M, LIBOR06M, etc.) used in this report are identical for different securities, but the underlying reference rates may differ due to the timing of the reset period. Certain variable rate securities are not based on a published reference rate and spread but are determined by the issuer or agent and are based on current market conditions, or for mortgage-backed securities, are impacted by the individual mortgages which are paying off over time. These securities do not indicate a reference rate and spread in their description above. |
Summary of abbreviations:
|
GS – Goldman Sachs |
ICE – Intercontinental Exchange |
LIBOR – London interbank offered rate |
LIBOR1M – ICE LIBOR USD 1 Month |
LIBOR3M – ICE LIBOR USD 3 Month |
LIBOR6M – ICE LIBOR USD 6 Month |
S.F. – Single Family |
USBMMY3M – US Treasury 3 Month Bill Money Market Yield |
USD – US Dollar |
yr – Year |
See accompanying notes, which are an integral part of the financial statements.
Limited Duration Bond Series-11
| | |
Delaware VIP®Trust — Delaware VIP Limited Duration Bond Series Statement of assets and liabilities | | December 31, 2019 |
| | | | |
Assets: | | | | |
Investments, at value1 | | $ | 31,585,319 | |
Cash | | | 7,936 | |
Dividends and interest receivable | | | 172,942 | |
Receivable for series shares sold | | | 4,475 | |
Receivable due from advisor | | | 21,482 | |
Other assets | | | 1,435 | |
| | | | |
Total assets | | | 31,793,589 | |
| | | | |
Liabilities: | | | | |
Audit and tax fees payable | | | 51,313 | |
Payable for series shares redeemed | | | 6,939 | |
Pricing fees payable | | | 6,875 | |
Accounting and administration expenses payable tonon-affiliates | | | 6,500 | |
Reports and statements to shareholders expenses payable tonon-affiliates | | | 5,348 | |
Other accrued expenses | | | 3,346 | |
Accounting and administration expenses payable to affiliates | | | 429 | |
Trustees’ fees and expenses payable | | | 321 | |
Dividend disbursing and transfer agent fees and expenses payable to affiliates | | | 202 | |
Reports and statements to shareholders expenses payable to affiliates | | | 51 | |
Legal fees payable to affiliates | | | 49 | |
| | | | |
Total liabilities | | | 81,373 | |
| | | | |
Total Net Assets | | $ | 31,712,216 | |
| | | | |
| |
Net Assets Consist of: | | | | |
Paid-in capital | | $ | 33,019,318 | |
Total distributable earnings (loss) | | | (1,307,102 | ) |
| | | | |
Total Net Assets | | $ | 31,712,216 | |
| | | | |
| |
Net Asset Value: | | | | |
Standard Class: | | | | |
Net assets | | $ | 31,712,216 | |
Shares of beneficial interest outstanding, unlimited authorization, no par | | | 3,283,713 | |
Net asset value per share | | $ | 9.66 | |
| |
1Investments, at cost | | $ | 31,467,574 | |
See accompanying notes, which are an integral part of the financial statements.
Limited Duration Bond Series-12
Delaware VIP®Trust —
Delaware VIP Limited Duration
Bond Series
Statement of operations
Year ended December 31, 2019
| | | | |
Investment Income: | | | | |
Interest | | $ | 998,054 | |
Dividends | | | 2,952 | |
| | | | |
| | | 1,001,006 | |
| | | | |
Expenses: | | | | |
Management fees | | | 230,316 | |
Audit and tax fees | | | 49,135 | |
Reports and statements to shareholders | | | 16,326 | |
Accounting and administration expenses | | | 10,196 | |
Legal fees | | | 8,585 | |
Trustees’ fees and expenses | | | 3,059 | |
Custodian fees | | | 860 | |
Dividend disbursing and transfer agent fees and expenses | | | 619 | |
Other | | | 48,803 | |
| | | | |
| | | 367,899 | |
Less expenses waived | | | (80,787 | ) |
Less expenses paid indirectly | | | (842 | ) |
| | | | |
Total operating expenses | | | 286,270 | |
| | | | |
Net Investment Income | | | 714,736 | |
| | | | |
| |
Net Realized and Unrealized Gain: | | | | |
Net realized gain on investments | | | 455,374 | |
Net change in unrealized appreciation (depreciation) of investments | | | 181,974 | |
| | | | |
Net Realized and Unrealized Gain | | | 637,348 | |
| | | | |
Net Increase in Net Assets Resulting from Operations | | $ | 1,352,084 | |
| | | | |
Delaware VIP Trust —
Delaware VIP Limited Duration
Bond Series
Statements of changes in net assets
| | | | | | | | |
| | | Year ended | |
| | | 12/31/19 | | | 12/31/18 | |
Increase (Decrease) in Net Assets from Operations: | | | | | | | | |
Net investment income | | $ | 714,736 | | | $ | 41,887 | |
Net realized gain (loss) | | | 455,374 | | | | (114,370 | ) |
Net change in unrealized appreciation (depreciation) | | | 181,974 | | | | 139,774 | |
| | | | | | | | |
Net increase in net assets resulting from operations | | | 1,352,084 | | | | 67,291 | |
| | | | | | | | |
| |
Dividends and Distributions to Shareholders from: | | | | | |
Distributable earnings: | | | | | | | | |
Standard Class | | | (212,829 | ) | | | (181,149 | ) |
| | | | | | | | |
| |
Capital Share Transactions: | | | | | |
Proceeds from shares sold: | | | | | | | | |
Standard Class | | | 1,672,149 | | | | 2,471,009 | |
| | |
Shares issued from merger: | | | | | | | | |
Standard Class | | | — | | | | 25,246,765 | |
| | |
Net asset value of shares based upon reinvestment of dividends and distributions: | | | | | | | | |
Standard Class | | | 212,829 | | | | 181,149 | |
| | | | | | | | |
| | | 1,884,978 | | | | 27,898,923 | |
| | | | | | | | |
| | |
Cost of shares redeemed: | | | | | | | | |
Standard Class | | | (4,833,772 | ) | | | (1,483,283 | ) |
| | | | | | | | |
| | |
Increase (Decrease) in net assets derived from capital share transactions | | | (2,948,794 | ) | | | 26,415,640 | |
| | | | | | | | |
Net Increase (Decrease) in Net Assets | | | (1,809,539 | ) | | | 26,301,782 | |
| |
Net Assets: | | | | | |
Beginning of year | | | 33,521,755 | | | | 7,219,973 | |
| | | | | | | | |
End of year | | $ | 31,712,216 | | | $ | 33,521,755 | |
| | | | | | | | |
See accompanying notes, which are an integral part of the financial statements.
Limited Duration Bond Series-13
Delaware VIP® Trust — Delaware VIP Limited Duration Bond Series
Financial highlights
Selected data for each share of the Series outstanding throughout each period were as follows:
| | | | | | | | | | | | | | | | | | | | | | | | | |
| | | Delaware VIP Limited Duration Bond Series Standard Class Year ended |
| | | 12/31/191 | | 12/31/18 | | 12/31/17 | | 12/31/16 | | 12/31/15 |
Net asset value, beginning of period | | | | $ 9.34 | | | | | $ 9.61 | | | | | $ 9.66 | | | | | $ 9.69 | | | | | $ 9.74 | |
| | | | | |
Income (loss) from investment operations: | | | | | | | | | | | | | | | | | | | | | | | | | |
Net investment income (loss)2 | | | | 0.21 | | | | | 0.05 | | | | | 0.10 | | | | | (0.03 | ) | | | | 0.01 | |
Net realized and unrealized gain (loss) | | | | 0.17 | | | | | (0.07 | ) | | | | 0.02 | | | | | 0.09 | | | | | (0.06 | ) |
| | | | | | | | | | | | | | | | | | | | | | | | | |
Total from investment operations | | | | 0.38 | | | | | (0.02 | ) | | | | 0.12 | | | | | 0.06 | | | | | (0.05 | ) |
| | | | | | | | | | | | | | | | | | | | | | | | | |
| | | | | |
Less dividends and distributions from: | | | | | | | | | | | | | | | | | | | | | | | | | |
Net investment income | | | | (0.06 | ) | | | | (0.25 | ) | | | | (0.17 | ) | | | | (0.09 | ) | | | | — | |
| | | | | | | | | | | | | | | | | | | | | | | | | |
Total dividends and distributions | | | | (0.06 | ) | | | | (0.25 | ) | | | | (0.17 | ) | | | | (0.09 | ) | | | | — | |
| | | | | | | | | | | | | | | | | | | | | | | | | |
| | | | | |
Net asset value, end of period | | | | $ 9.66 | | | | | $ 9.34 | | | | | $ 9.61 | | | | | $ 9.66 | | | | | $ 9.69 | |
| | | | | | | | | | | | | | | | | | | | | | | | | |
| | | | | |
Total return3 | | | | 4.09% | | | | | (0.22% | ) | | | | 1.26% | | | | | 0.64% | | | | | (0.51% | ) |
| | | | | |
Ratios and supplemental data: | | | | | | | | | | | | | | | | | | | | | | | | | |
Net assets, end of period (000 omitted) | | | | $ 31,712 | | | | | $ 33,522 | | | | | $ 7,220 | | | | | $ 7,837 | | | | | $ 5,836 | |
Ratio of expenses to average net assets4 | | | | 0.86% | | | | | 1.15% | | | | | 1.01% | | | | | 1.06% | | | | | 1.44% | |
Ratio of expenses to average net assets prior to fees waived4 | | | | 1.10% | | | | | 1.30% | | | | | 1.16% | | | | | 1.21% | | | | | 1.59% | |
Ratio of net investment income (loss) to average net assets | | | | 2.15% | | | | | 0.49% | | | | | 1.09% | | | | | (0.34% | ) | | | | 0.11% | |
Ratio of net investment income (loss) to average net assets prior to fees waived | | | | 1.91% | | | | | 0.34% | | | | | 0.94% | | | | | (0.49% | ) | | | | (0.04% | ) |
Portfolio turnover | | | | 108% | 5 | | | | 268% | | | | | 82% | | | | | 78% | | | | | 94% | |
| 1 | On Oct. 4, 2019, the First Investors Life Series Limited Duration Bond Fund shares were reorganized into Standard Class shares of the Series. See “Notes to financial statements.” The Standard Class shares financial highlights for the period prior to Oct. 4, 2019, reflect the performance of the First Investors Life Series Limited Duration Bond Fund shares. |
| 2 | The average shares outstanding method has been applied for per share information. |
| 3 | Total return is based on the change in net asset value of a share during the period and assumes reinvestment of dividends and distributions at net asset value. Total return during all of the periods shown reflects a waiver by the manager. Performance would have been lower had the waiver not been in effect. Total return does not include fees, charges, or expenses imposed by the variable annuity and life insurance contracts for which Delaware VIP Trust serves as an underlying investment vehicle. |
| 4 | Expense ratios do not include expenses of the Underlying Funds in which the Series invests. |
| 5 | The Series’ portfolio turnover rate increased substantially during the year ended Dec. 31, 2019 due to a change in the Series’ portfolio managers and associated repositioning. |
See accompanying notes, which are an integral part of the financial statements.
Limited Duration Bond Series-14
Delaware VIP® Trust — Delaware VIP Limited Duration Bond Series
Notes to financial statements
December 31, 2019
Delaware VIP Trust (Trust) is organized as a Delaware statutory trust. The Trust consists of 22 series, each of which is treated as a separate entity for certain matters under the Investment Company Act of 1940, as amended (1940 Act). These financial statements and the related notes pertain to Delaware VIP Total Return Series (Series). The Trust is anopen-end investment company. The Series is considered diversified under the 1940 Act and offers Standard Class shares. The Standard Class shares do not carry a distribution and service(12b-1) fee. The shares of the Series are sold only to separate accounts of life insurance companies.
Before the Series commenced operations, on Oct. 4, 2019, all of the assets and liabilities of the First Investors Life Series Limited Duration Bond Fund, its respective Predecessor Series (Predecessor Series) were transferred to the Series in atax-free reorganization as set forth in an agreement and plan of reorganization (each a Foresters Reorganization) between the Trust, on behalf of the Series, and Foresters Investment Management Company, Inc. (FIMCO), on behalf of the Predecessor Series. As a result of the Foresters Reorganization, the Series assumed the performance and accounting history of its Predecessor Series. Financial information included for the dates prior to the Foresters Reorganization is that of the Predecessor Series.
1. Significant Accounting Policies
The Series follows accounting and reporting guidance under Financial Accounting Standards Board (FASB) Accounting Standards Codification Topic 946, Financial Services – Investment Companies. The following accounting policies are in accordance with US generally accepted accounting principles (US GAAP) and are consistently followed by the Series.
Security Valuation — Debt securities are valued based upon valuations provided by an independent pricing service or broker and reviewed by management. To the extent current market prices are not available, the pricing service may take into account developments related to the specific security, as well as transactions in comparable securities. Valuations for fixed income securities utilize matrix systems, which reflect such factors as security prices, yields, maturities, and ratings, and are supplemented by dealer and exchange quotations. For asset-backed securities, collateralized mortgage obligations, commercial mortgage securities, and US government agency mortgage securities, pricing vendors utilize matrix pricing which considers prepayment speed; attributes of the collateral; yield or price of bonds of comparable quality, coupon, maturity, and type as well as broker/dealer-supplied prices. US government and agency securities are valued at the mean between the bid and ask prices, which approximates fair value.Open-end investment companies are valued at their published net asset value (NAV). Generally, other securities and assets for which market quotations are not readily available are valued at fair value as determined in good faith under the direction of the Trust’s Board of Trustees (Board). In determining whether market quotations are readily available or fair valuation will be used, various factors will be taken into consideration, such as market closures or suspension of trading in a security. Restricted securities are valued at fair value using methods approved by the Board.
Federal and Foreign Income Taxes — No provision for federal income taxes has been made as the Series intends to continue to qualify for federal income tax purposes as a regulated investment company under Subchapter M of the Internal Revenue Code of 1986, as amended, and make the requisite distributions to shareholders. The Series evaluates tax positions taken or expected to be taken in the course of preparing the Series’ tax returns to determine whether the tax positions are“more-likely-than-not” of being sustained by the applicable tax authority. Tax positions not deemed to meet the“more-likely-than-not” threshold are recorded as a tax benefit or expense in the current year. Management has analyzed the Series’ tax positions taken or expected to be taken on the Series’ federal income tax returns through the year ended Dec. 31, 2019 and for all open tax years (years ended Dec. 31, 2016–Dec. 31, 2018), and has concluded that no provision for federal income tax is required in the Series’ financial statements. In regard to foreign taxes only, the Series has open tax years in certain foreign countries in which it invests that may date back to the inception of the Series. If applicable, the Series recognizes interest accrued on unrecognized tax benefits in interest expense and penalties in “Other” on the “Statement of operations.” During the year ended Dec. 31, 2019, the Series did not incur any interest or tax penalties.
Use of Estimates — The preparation of financial statements in conformity with US GAAP requires management to make estimates and assumptions that affect the fair value of investments, the reported amounts of assets and liabilities and disclosure of contingent assets and liabilities at the date of the financial statements, and the reported amounts of revenues and expenses during the reporting period. Actual results could differ from those estimates and the differences could be material.
Other — Expenses directly attributable to the Series are charged directly to the Series. Other expenses common to various funds within the Delaware Funds® by Macquarie (Delaware Funds) are generally allocated among such funds on the basis of average net assets. Management fees and certain other expenses are paid monthly. Security transactions are recorded on the date the securities are purchased or sold (trade date) for financial reporting purposes. Costs used in calculating realized gains and losses on the sale of investment securities are those of the specific securities sold. Interest income is recorded on the accrual basis. Discounts and premiums on debt securities are accreted or amortized to interest income, respectively, over the lives of the respective securities using the effective interest method. Realized gains (losses) on paydowns of asset- and mortgage backed securities are classified as interest income. The Series declares and pays dividends from net investment income and distributions from net realized gain on investments, if any, following the close of the fiscal year. The Series may distribute more frequently, if necessary for tax purposes. Dividends and distributions, if any, are recorded on theex-dividend date.
Limited Duration Bond Series-15
Delaware VIP® Limited Duration Bond Series
Notes to financial statements (continued)
1. Significant Accounting Policies (continued)
The Series receives earnings credits from its custodian when positive cash balances are maintained, which may be used to offset custody fees. The expenses paid under this arrangement are included on the “Statement of operations” under “Custodian fees” with the corresponding expenses offset included under “Less expenses paid indirectly.” For the year ended Dec. 31, 2019, the Series earned $842 under this arrangement.
The Series receives earnings credits from its transfer agent when positive cash balances are maintained, which may be used to offset transfer agent fees. If the amount earned is greater than $1, the expenses paid under this arrangement are included on the “Statement of operations” under “Dividend disbursing and transfer agent fees and expenses” with the corresponding expenses offset included under “Less expenses paid indirectly.” There were no such earnings credits for the year ended Dec. 31, 2019.
2. Investment Management, Administration Agreements, and Other Transactions with Affiliates
In accordance with the terms of its investment management agreement, effective Oct. 4, 2019, the Series pays Delaware Management Company (DMC), a series of Macquarie Investment Management Business Trust and the investment manager, an annual fee which is calculated daily and paid monthly at the rates of 0.50% on the first $500 million of average daily net assets of the Series, 0.475% on the next $500 million, 0.45% on the next $1.5 billion, and 0.425% on average daily net assets in excess of $2.5 billion. Prior to Oct. 4, 2019, the Series paid FIMCO, an annual fee which was calculated daily and paid monthly at the rates of 0.75% on the first $250 million of average daily net assets of the Series, 0.72% on the next $250 million, 0.69% on the next $250 million, 0.66% on the next $500 million, 0.64% on the next $500 million, 0.62% on the next $500 million, and 0.60% on average daily net assets in excess of $2.25 billion.
DMC has contractually agreed to waive all or a portion of its investment advisory fees and/or pay/reimburse expenses (excluding any acquired fund fees and expenses, taxes, interest, short sale dividend and interest expenses, brokerage fees, certain insurance costs, and nonroutine expenses or costs, including, but not limited to, those relating to reorganizations, litigation, conducting shareholder meetings, and liquidations), do not exceed 0.75% of the Series’ average daily net assets from Oct. 4, 2019 through Dec. 31, 2019.* From Jan. 1, 2019 through May 1, 2019, FIMCO, had waived to limit the advisory fee to 0.60% of the Series’ average daily net assets. There were no waiver from May 2, 2019 through Oct. 4, 2019. These waivers and reimbursements may only be terminated by agreement of DMC and the Series. The waivers and reimbursements are accrued daily and received monthly.
Effective Oct. 4, 2019, DMC may seek investment advice and recommendations from its affiliates: Macquarie Investment Management Europe Limited, Macquarie Investment Management Austria Kapitalanlage AG, and Macquarie Investment Management Global Limited (together, the “AffiliatedSub-Advisors”). The Manager may also permit these AffiliatedSub-Advisors to execute Series security trades on behalf of the Manager and exercise investment discretion for securities in certain markets where DMC believes it will be beneficial to utilize an AffiliatedSub-Advisor’s specialized market knowledge. Although the AffiliatedSub-Advisors serve assub-advisors, DMC has ultimate responsibility for all investment advisory services. For these services, DMC, not the Series, pays each AffiliatedSub-Advisor a portion of its investment management fee.
Effective Oct. 4, 2019, Delaware Investments Fund Services Company (DIFSC), an affiliate of DMC, provides fund accounting and financial administration oversight services to the Series. For these services, DIFSC’s fees are calculated daily and paid monthly based on the aggregate daily net assets of all funds within the Delaware Funds at the following annual rates: 0.00475% of the first $35 billion; 0.0040% of the next $10 billion; and 0.0025% of aggregate average daily net assets in excess of $45 billion (Total Fee). Each fund in the Delaware Funds pays a minimum of $4,000, which, in aggregate, is subtracted from the Total Fee. Each fund then pays its portion of the remainder of the Total Fee on a relative NAV basis. This amount is included on the “Statement of operations” under “Accounting and administration expenses.” For the period Oct. 4, 2019 through year ended Dec. 31, 2019, the Series was charged $1,267 for these services. Prior to Oct. 4, 2019, there were no fund accounting and financial administration oversight services for the Series.
Effective Oct. 4, 2019, DIFSC is also the transfer agent and dividend disbursing agent of the Series. For these services, DIFSC’s fees are calculated daily and paid monthly at the annual rate of 0.0075% of the Series’ average daily net assets. This amount is included on the “Statement of operations” under “Dividend disbursing and transfer agent fees and expenses.” For the period Oct. 4, 2019 through year ended Dec. 31, 2019, the Series was charged $582 for these services. Pursuant to asub-transfer agency agreement between DIFSC and BNY Mellon Investment Servicing (US) Inc. (BNYMIS), BNYMIS provides certainsub-transfer agency services to the Series.Sub-transfer agency fees are paid directly by the Series and are also included on the “Statement of operations” under “Dividend disbursing and transfer agent fees and expenses.” The fees that are calculated daily and paid as invoices are received on a monthly or quarterly basis. Prior to Oct. 4, 2019, Foresters Investor Services, Inc. was the transfer agent of the Series.
As provided in the investment management agreement, the Series bears a portion of the cost of certain resources shared with DMC, including the cost of internal personnel of DMC and/or its affiliates that provide legal, tax, and regulatory reporting services to the Series. For the period Oct. 4, 2019 through year ended Dec. 31, 2019, the Series was charged $158 for internal legal, tax, and regulatory reporting services provided by DMC and/or its affiliates’ employees. These amounts are included on the “Statement of operations” under “Legal fees.”
Trustees’ fees include expenses accrued by the Series for each Trustee’s retainer and meeting fees. Certain officers of DMC, DIFSC, and DDLP are officers and/or Trustees of the Trust. These officers and Trustees are paid no compensation by the Series.
Limited Duration Bond Series-16
Delaware VIP® Limited Duration Bond Series
Notes to financial statements (continued)
2. Investment Management, Administration Agreements, and Other Transactions with Affiliates (continued)
In addition to the management fees and other expenses of the Series, the Series indirectly bears the investment management fees and other expenses of the investment companies (Underlying Funds) in which it invests. The amount of these fees and expenses incurred indirectly by the Series will vary based upon the expense and fee levels of the Underlying Funds and the number of shares that are owned of the Underlying Funds at different times.
*The aggregate contractual waiver period covering this report is from Oct. 4, 2019 through Oct. 31, 2021.
3. Investments
For the year ended Dec. 31, 2019, the Series made purchases and sales of investment securities other than short-term investments as follows:
| | | | |
Purchases | | $ | 34,882,845 | |
Sales | | | 38,541,036 | |
The tax cost of investments includes adjustments to net unrealized appreciation (depreciation), which may not necessarily be the final tax cost basis adjustments, but approximate the tax basis unrealized gains and losses that may be realized and distributed to shareholders. At Dec. 31, 2019, the cost and unrealized appreciation (depreciation) of investments for federal income tax purposes for the Fund were as follows:
| | | | | | |
Cost of Investments | | Aggregate
Unrealized
Appreciation of Investments | | Aggregate Unrealized
Depreciation of Investments | | Net Unrealized
Appreciation of Investments |
| $31,522,520 | | $123,774 | | $(60,975) | | $62,799 |
US GAAP defines fair value as the price that the Series would receive to sell an asset or pay to transfer a liability in an orderly transaction between market participants at the measurement date under current market conditions. A three-level hierarchy for fair value measurements has been established based upon the transparency of inputs to the valuation of an asset or liability. Inputs may be observable or unobservable and refer broadly to the assumptions that market participants would use in pricing the asset or liability. Observable inputs reflect the assumptions that market participants would use in pricing the asset or liability based on market data obtained from sources independent of the reporting entity. Unobservable inputs reflect the reporting entity’s own assumptions about the assumptions that market participants would use in pricing the asset or liability based on the best information available under the circumstances. The Series’ investment in its entirety is assigned a level based upon the observability of the inputs which are significant to the overall valuation. The three-level hierarchy of inputs is summarized below.
| | | | |
| Level 1 | | – | | Inputs are quoted prices in active markets for identical investments. (Examples: equity securities,open-end investment companies, futures contracts, and exchange-traded options contracts) |
| Level 2 | | – | | Other observable inputs, including, but not limited to: quoted prices for similar assets or liabilities in markets that are active, quoted prices for identical or similar assets or liabilities in markets that are not active, inputs other than quoted prices that are observable for the assets or liabilities (such as interest rates, yield curves, volatilities, prepayment speeds, loss severities, credit risks, and default rates) or other market-corroborated inputs. (Examples: debt securities, government securities, swap contracts, foreign currency exchange contracts, foreign securities utilizing international fair value pricing, broker-quoted securities, and fair valued securities) |
| Level 3 | | – | | Significant unobservable inputs, including the Series’ own assumptions used to determine the fair value of investments. (Examples: broker-quoted securities and fair valued securities) |
Level 3 investments are valued using significant unobservable inputs. The Series may also use an income-based valuation approach in which the anticipated future cash flows of the investment are discounted to calculate fair value. Discounts may also be applied due to the nature or duration of any restrictions on the disposition of the investments. Valuations may also be based upon current market prices of securities that are comparable in coupon, rating, maturity, and industry. The derived value of a Level 3 investment may not represent the value which is received upon disposition and this could impact the results of operations.
Limited Duration Bond Series-17
Delaware VIP® Limited Duration Bond Series
Notes to financial statements (continued)
3. Investments (continued)
The following table summarizes the valuation of the Series’ investments by fair value hierarchy levels as of Dec. 31, 2019:
| | | | | | | | | | | | |
Securities | | Level 1 | | | Level 2 | | | Total | |
| | | |
Assets: | | | | | | | | | | | | |
Agency, Asset Backed & Mortgage Backed Securities | | $ | — | | | $ | 11,598,322 | | | $ | 11,598,322 | |
Corporate Debt | | | — | | | | 11,146,853 | | | | 11,146,853 | |
US Treasury Obligation | | | — | | | | 5,017,522 | | | | 5,017,522 | |
Short-Term Investments1 | | | 318,260 | | | | 3,504,362 | | | | 3,822,622 | |
| | | | | | | | | | | | |
Total Value of Securities | | $ | 318,260 | | | $ | 31,267,059 | | | $ | 31,585,319 | |
| | | | | | | | | | | | |
1Security type is valued across multiple levels. The amounts attributed to Level 1 investments and Level 2 investments represent 8.33% and 91.67%, respectively, of the total market value of this security type. Level 1 investments represent exchange traded investments and Level 2 investments represent investments with observable inputs.
During the year ended Dec. 31, 2019, there were no transfers between Level 1 investments, Level 2 investments, or Level 3 investments that had a significant impact to the Series. The Series’ policy is to recognize transfers between levels based on fair value at the beginning of the reporting period.
A reconciliation of Level 3 investments is presented when the Series has a significant amount of Level 3 investments at the beginning, interim, or end of the period in relation to net assets. During the year ended Dec. 31, 2019, there were no Level 3 investments.
4. Dividend and Distribution Information
Income and long-term capital gain distributions are determined in accordance with federal income tax regulations, which may differ from US GAAP. Additionally, distributions from net short-term gains on sales of investment securities are treated as ordinary income for federal income tax purposes. The tax character of dividends and distributions paid during the years ended Dec. 31, 2019 and 2018 was as follows:
| | | | | | | | |
| | | Year ended | |
| | | 12/31/19 | | | 12/31/18 | |
Ordinary income | | | $212,829 | | | | $181,149 | |
5. Components of Net Assets on a Tax Basis
As of Dec. 31, 2019, the components of net assets on a tax basis were as follows:
| | | | |
Shares of beneficial interest | | | $33,019,318 | |
Undistributed ordinary income | | | 839,932 | |
Capital loss carryforwards | | | (2,209,833 | ) |
Net unrealized appreciation on investments | | | 62,799 | |
| | | | |
Net assets | | | $31,712,216 | |
| | | | |
The differences between the book basis and tax basis components of net assets are primarily attributable to tax deferral of losses on wash sales and market premium on debt instruments.
For federal income tax purposes, capital loss carryforwards may be carried forward and applied against future capital gains. $274,320 was utilized in 2019.
At Dec. 31, 2019, capital loss carryforwards available to offset future realized gains were as follows:
| | | | | | | | |
| Loss carryforward character | |
| Short-term | | Long-term | | | Total | |
| $1,154,354 | | $ | 1,055,479 | | | $ | 2,209,833 | |
Limited Duration Bond Series-18
Delaware VIP® Limited Duration Bond Series
Notes to financial statements (continued)
6. Capital Shares
Transactions in capital shares were as follows:
| | | | | | | | |
| | | Year ended | |
| | | 12/31/19 | | | 12/31/18 | |
Shares sold: | | | | | | | | |
Standard Class | | | 175,965 | | | | 265,394 | |
Shares from merger: | | | | | | | | |
Standard Class | | | — | | | | 2,713,185 | |
Shares issued upon reinvestment of dividends and distributions: | | | | | | | | |
Standard Class | | | 22,690 | | | | 19,541 | |
| | | | | | | | |
| | | 198,655 | | | | 2,998,120 | |
| | | | | | | | |
Shares redeemed: | | | | | | | | |
Standard Class | | | (505,917 | ) | | | (158,651 | ) |
| | | | | | | | |
Net increase (decrease) | | | (307,262 | ) | | | 2,839,469 | |
| | | | | | | | |
7. Reorganization of Government Fund into Limited Duration Bond Fund
On Dec. 14, 2018, the First Investors Life Series Limited Duration Bond Fund acquired all of the net assets of the First Investors Life Series Government Fund in connection with atax-free reorganization that was approved by the Foresters Board of Trustees. The Limited Duration Bond Fund issued 2,713,185 shares to the Government Fund in connection with the reorganization. In return, it received net assets of $25,246,765 from the Government Fund (which included $163,690 of unrealized depreciation and $2,168,077 of accumulated net realized losses). The Limited Duration Bond Fund’s shares were issued at their current net asset values as of the date of the reorganization. The aggregate net assets of the Limited Duration Bond Fund and Government Fund immediately before the acquisition were $33,754,482 consisting of, with respect to Limited Duration Bond Fund, $8,507,717 and, with respect to Government Fund, $25,246,765.
8. Line of Credit
On Nov. 4, 2019, the Series, along with certain other funds in the Delaware Funds (Participants), is a participant in a $250,000,000 revolving line of credit intended to be used for temporary or emergency purposes as an additional source of liquidity to fund redemptions of investor shares. Under the agreement, the Participants are charged an annual commitment fee of 0.15%, which is allocated across the Participants based on a weighted average of the respective net assets of each Participant. The Participants are permitted to borrow up to a maximum ofone-third of their net assets under the agreement. Each Participant is individually, and not jointly, liable for its particular advances, if any, under the line of credit. The line of credit available under the agreement expires on Nov. 2, 2020.
The Series had no amounts outstanding as of Dec. 31, 2019, or at any time during the period then ended.
9. Securities Lending
Effective Oct. 4, 2019, the Series, along with other funds in the Delaware Funds, may lend its securities pursuant to a security lending agreement (Lending Agreement) with The Bank of New York Mellon (BNY Mellon). At the time a security is loaned, the borrower must post collateral equal to the required percentage of the market value of the loaned security, including any accrued interest. The required percentage is: (1) 102% with respect to US securities and foreign securities that are denominated and payable in US dollars; and (2) 105% with respect to foreign securities. With respect to each loan, if on any business day, the aggregate market value of securities collateral plus cash collateral held is less than the aggregate market value of the securities which are the subject of such loan, the borrower will be notified to provide additional collateral by the end of the following business day, which, together with the collateral already held, will be not less than the applicable initial collateral requirements for such security loan. If the aggregate market value of securities collateral and cash collateral held with respect to a security loan exceeds the applicable initial collateral requirement, upon the request of the borrower, BNY Mellon must return enough collateral to the borrower by the end of the following business day to reduce the value of the remaining collateral to the applicable initial collateral requirement for such security loan. As a result of the foregoing, the value of the collateral held with respect to a loaned security on any particular day, may be more or less than the value of the security on loan. The collateral percentage with respect to the market value of the loaned security is determined by the security lending agent.
Cash collateral received by each series of the Trust is generally invested in a series of individual separate accounts, each corresponding to a series. The investment guidelines permit each separate account to hold certain securities that would be considered eligible securities for a money market fund. Cash collateral received is generally invested in government securities; certain obligations issued by government sponsored enterprises; repurchase agreements
Limited Duration Bond Series-19
Delaware VIP® Limited Duration Bond Series
Notes to financial statements (continued)
9. Securities Lending (continued)
collateralized by US Treasury securities; obligations issued by the central government of any Organization for Economic Cooperation and Development (OECD) country or its agencies, instrumentalities, or establishments; obligations of supranational organizations; commercial paper, notes, bonds, and other debt obligations; certificates of deposit, time deposits, and other bank obligations; and asset-backed securities. The Series can also accept US government securities and letters of credit(non-cash collateral) in connection with securities loans.
In the event of default or bankruptcy by the lending agent, realization and/or retention of the collateral may be subject to legal proceedings. In the event the borrower fails to return loaned securities and the collateral received is insufficient to cover the value of the loaned securities and provided such collateral shortfall is not the result of investment losses, the lending agent has agreed to pay the amount of the shortfall to the Series or, at the discretion of the lending agent, replace the loaned securities. The Series continues to record dividends or interest, as applicable, on the securities loaned and is subject to changes in value of the securities loaned that may occur during the term of the loan. The Series has the right under the Lending Agreement to recover the securities from the borrower on demand. With respect to security loans collateralized bynon-cash collateral, the Series receives loan premiums paid by the borrower. With respect to security loans collateralized by cash collateral, the earnings from the collateral investments are shared among the Series, the security lending agent, and the borrower. The Series records security lending income net of allocations to the security lending agent and the borrower.
The Series may incur investment losses as a result of investing securities lending collateral. This could occur if an investment in the collateral investment account defaulted or became impaired. Under those circumstances, the value of the Series’ cash collateral account may be less than the amount the Series would be required to return to the borrowers of the securities and the Series would be required to make up for this shortfall.
During the year ended Dec. 31, 2019, the Series had no securities out on loan.
10. Credit and Market Risk
When interest rates rise, fixed income securities (i.e. debt obligations) generally will decline in value. These declines in value are greater for fixed income securities with longer maturities or durations.
The risk that potential changes related to the use of the London Interbank Offered Rate (LIBOR) could have adverse impacts on financial instruments which reference LIBOR. The potential abandonment of LIBOR could affect the value and liquidity of instruments which reference LIBOR.
Some countries in which the Series may invest require governmental approval for the repatriation of investment income, capital, or the proceeds of sales of securities by foreign investors. In addition, if there is deterioration in a country’s balance of payments or for other reasons, a country may impose temporary restrictions on foreign capital remittances abroad.
The securities exchanges of certain foreign markets are substantially smaller, less liquid, and more volatile than the major securities markets in the United States. Consequently, acquisition and disposition of securities by the Series may be inhibited. In addition, a significant portion of the aggregate market value of equity securities listed on the major securities exchanges in emerging markets is held by a smaller number of investors. This may limit the number of shares available for acquisition or disposition by the Series.
The Series invests in fixed income securities whose value is derived from an underlying pool of mortgages or consumer loans. The value of these securities is sensitive to changes in economic conditions, including delinquencies and/or defaults, and may be adversely affected by shifts in the market’s perception of the issuers and changes in interest rates. Investors receive principal and interest payments as the underlying mortgages and consumer loans are paid back. Some of these securities are collateralized mortgage obligations (CMOs). CMOs are debt securities issued by US government agencies or by financial institutions and other mortgage lenders, which are collateralized by a pool of mortgages held under an indenture. Prepayment of mortgages may shorten the stated maturity of the obligations and can result in a loss of premium, if any has been paid. Certain of these securities may be stripped (securities which provide only the principal or interest feature of the underlying security). The yield to maturity on an interest-only CMO is extremely sensitive not only to changes in prevailing interest rates, but also to the rate of principal payments (including prepayments) on the related underlying mortgage assets. A rapid rate of principal payments may have a material adverse effect on the Series’ yield to maturity. If the underlying mortgage assets experience greater than anticipated prepayments of principal, the Series may fail to fully recoup its initial investment in these securities even if the securities are rated in the highest rating categories.
The Series invests in high yield fixed income securities, which are securities rated lower thanBBB- by Standard & Poor’s Financial Services LLC and lower than Baa3 by Moody’s Investors Service, Inc. or similarly rated by another nationally recognized statistical rating organization. Investments in these higher yielding securities are generally accompanied by a greater degree of credit risk than higher-rated securities. Additionally, lower-rated securities may be more susceptible to adverse economic and competitive industry conditions than investment grade securities.
The Series may invest up to 10% of its net assets in illiquid securities, which may include securities with contractual restrictions on resale, securities exempt from registration under Rule 144A, promulgated under the Securities Act of 1933, as amended, and other securities which may not be readily marketable. The relative illiquidity of these securities may impair the Series from disposing of them in a timely manner and at a fair price when it is
Limited Duration Bond Series-20
Delaware VIP® Limited Duration Bond Series
Notes to financial statements (continued)
10. Credit and Market Risk (continued)
necessary or desirable to do so. While maintaining oversight, the Board has delegated to DMC theday-to-day functions of determining whether individual securities are liquid for purposes of the Series’ limitation on investments in illiquid securities. Securities eligible for resale pursuant to Rule 144A, which are determined to be liquid, are not subject to the Series’ 10% limit on investments in illiquid securities. Rule 144A securities have been identified on the “Schedule of investments.”
11. Contractual Obligations
The Series enters into contracts in the normal course of business that contain a variety of indemnifications. The Series’ maximum exposure under these arrangements is unknown. However, the Series has not had prior claims or losses pursuant to these contracts. Management has reviewed the Series’ existing contracts and expects the risk of loss to be remote.
12. Recent Accounting Pronouncements
In March 2017, the FASB issued an Accounting Standards Update (ASU), ASU2017-08, Receivables – Nonrefundable Fees and Other Costs (Subtopic310-20), Premium Amortization on Purchased Callable Debt Securities which amends the amortization period for certain callable debt securities purchased at a premium, shortening such period to the earliest call date. The ASU2017-08 does not require any accounting change for debt securities held at a discount; the discount continues to be amortized to maturity. The ASU2017-08 is effective for fiscal years, and interim periods within those fiscal years, beginning after Dec. 15, 2018. Management has implemented the ASU2017-08 and determined that the impact of this guidance to the Series’ net assets at the end of the year is not material.
In August 2018, the FASB issued an ASU2018-13, which changes certain fair value measurement disclosure requirements. The ASU2018-13, in addition to other modifications and additions, removes the requirement to disclose the amount and reasons for transfers between Level 1 and Level 2 of the fair value hierarchy, the policy for the timing of transfers between levels and the valuation process for Level 3 fair value measurements. The ASU2018-13 is effective for fiscal years, and interim periods within those fiscal years, beginning after Dec. 15, 2019. At this time, management is evaluating the implications of these changes on the financial statements.
13. Subsequent Events
Management has determined that no material events or transactions occurred subsequent to Dec. 31, 2019, that would require recognition or disclosure in the Series’ financial statements.
Limited Duration Bond Series-21
Delaware VIP® Trust — Delaware VIP Limited Duration Bond Series
Report of independent registered public accounting firm
To the Board of Trustees of Delaware VIP® Trust and Shareholders of Delaware VIP Limited Duration Bond Series
Opinion on the Financial Statements
We have audited the accompanying statement of assets and liabilities, including the schedule of investments, of Delaware VIP Limited Duration Bond Series (one of the series constituting Delaware VIP® Trust, referred to hereafter as the “Series”) as of December 31, 2019, the related statements of operations and changes in net assets, including the related notes, and the financial highlights for the year then ended (collectively referred to as the “financial statements”). In our opinion, the financial statements present fairly, in all material respects, the financial position of the Series as of December 31, 2019, the results of its operations, changes in its net assets, and the financial highlights for the year then ended in conformity with accounting principles generally accepted in the United States of America.
The financial statements of First Investors Life Series Limited Duration Bond Fund (subsequent to reorganization, known as Delaware VIP Limited Duration Bond Series) as of and for the year ended December 31, 2018 and the financial highlights for each of the periods ended on or prior to December 31, 2018 (not presented herein, other than the statement of changes in net assets and the financial highlights) were audited by other auditors whose report dated February 26, 2019 expressed an unqualified opinion on those financial statements and financial highlights.
Basis for Opinion
These financial statements are the responsibility of the Series’ management. Our responsibility is to express an opinion on the Series’ financial statements based on our audit. We are a public accounting firm registered with the Public Company Accounting Oversight Board (United States) (PCAOB) and are required to be independent with respect to the Series in accordance with the U.S. federal securities laws and the applicable rules and regulations of the Securities and Exchange Commission and the PCAOB.
We conducted our audit of these financial statements in accordance with the standards of the PCAOB. Those standards require that we plan and perform the audit to obtain reasonable assurance about whether the financial statements are free of material misstatement, whether due to error or fraud.
Our audit included performing procedures to assess the risks of material misstatement of the financial statements, whether due to error or fraud, and performing procedures that respond to those risks. Such procedures included examining, on a test basis, evidence regarding the amounts and disclosures in the financial statements. Our audit also included evaluating the accounting principles used and significant estimates made by management, as well as evaluating the overall presentation of the financial statements. Our procedures included confirmation of securities owned as of December 31, 2019 by correspondence with the custodian and transfer agents. We believe that our audit provides a reasonable basis for our opinion.
/s/PricewaterhouseCoopers LLP
Philadelphia, Pennsylvania
February 28, 2020
We have served as the auditor of one or more investment companies in Delaware Funds® by Macquarie since 2010.
Limited Duration Bond Series-22
Delaware VIP® Trust — Delaware VIP Limited Duration Bond Series
Other Series information (Unaudited)
Tax Information
All disclosures are based on financial information available as of the date of this annual report and, accordingly are subject to change. For any and all items requiring reporting, it is the intention of the Series to report the maximum amount permitted under the Internal Revenue Code and the regulations thereunder.
For the year ended Dec. 31, 2019, the Series reports distributions paid during the year as follows:
|
(A)
Ordinary Income
Distributions
(Tax Basis) |
100.00% |
(A) is based on a percentage of the Series’ total distributions.
Limited Duration Bond Series-23
Delaware Funds® by Macquarie
Board of trustees / directors and officers addendum
A mutual fund is governed by a Board of Trustees/Directors (“Trustees”), which has oversight responsibility for the management of a fund’s business affairs. Trustees establish procedures and oversee and review the performance of the investment manager, the distributor, and others who perform services for the fund. The independent fund trustees, in particular, are advocates for shareholder interests. Each trustee has served in that capacity since he or she was elected to or appointed to the Board of Trustees, and will continue to serve until his or her retirement or the election of a new trustee in his or her place. The following is a list of the Trustees and Officers with certain background and related information.
| | | | | | | | | | |
Name, Address, and Birth Date | | Position(s) Held with Fund(s) | | Length of Time
Served | | Principal
Occupation(s)
During the Past Five Years | | Number of
Portfolios in Fund
Complex Overseen
by Trustee or Officer | | Other
Directorships
Held by Trustee or Officer |
| INTERESTED TRUSTEE | | | | | | | | | | |
| | | | | |
Shawn K. Lytle1
2005 Market Street Philadelphia, PA 19103 February 1970 | | President, Chief Executive Officer, and Trustee | | President and Chief Executive Officer since August 2015 Trustee since September 2015 | | President — Macquarie Investment Management2(June 2015-Present) Regional Head of Americas —UBS Global Asset Management (April 2010-May 2015) | | 95 | | Trustee — UBS Relationship Funds, SMA Relationship Trust, and UBS Funds (May 2010–April 2015) |
INDEPENDENT TRUSTEES | | | | | | |
| | | | | |
Thomas L. Bennett
2005 Market Street Philadelphia, PA 19103 October 1947 | | Chair and Trustee | | Trustee since March 2005 Chair since March 2015 | | Private Investor (March 2004–Present) | | 95 | | None |
Jerome D. Abernathy
2005 Market Street Philadelphia, PA 19103 July 1959 | | Trustee | | Since January 2019 | | Managing Member, Stonebrook Capital Management, LLC (financial technology: macro factors and databases) (January 1993–Present) | | 95 | | None |
Ann D. Borowiec
2005 Market Street Philadelphia, PA 19103 November 1958 | | Trustee | | Since March 2015 | | Chief Executive Officer, Private Wealth Management (2011–2013) and Market Manager, New Jersey Private Bank (2005–2011) — J.P. Morgan Chase & Co. | | 95 | | Director —
Banco Santander International (October 2016–December 2019) Director — Santander Bank, N.A. (December 2016–December 2019) |
Joseph W. Chow
2005 Market Street Philadelphia, PA 19103 January 1953 | | Trustee | | Since January 2013 | | Private Investor (April 2011–Present) | | 95 | | Director and Audit Committee Member — Hercules Technology Growth Capital, Inc. (July 2004–July 2014) |
Limited Duration BondSeries-24
| | | | | | | | | | |
Name, Address, and Birth Date | | Position(s) Held with Fund(s) | | Length of Time
Served | | Principal
Occupation(s)
During the Past Five Years | | Number of
Portfolios in Fund
Complex Overseen
by Trustee
or Officer | | Other
Directorships
Held by
Trustee
or Officer |
| | | | | |
John A. Fry
2005 Market Street Philadelphia, PA 19103 May 1960 | | Trustee | | Since January 2001 | | President — Drexel University (August 2010–Present) President — Franklin & Marshall College (July 2002–July 2010) | | 95 | | Director; Compensation Committee and Governance Committee Member — Community Health Systems (May 2004–Present) Director — Drexel Morgan & Co. (2015–Present) Director and Audit Committee Member — vTv Therapeutics LLC (2017–Present) Director and Audit Committee Member — FS Credit Real Estate Income Trust, Inc. (2018–Present) Director — Federal Reserve Bank of Philadelphia (January 2020–Present) |
| | | | | |
Lucinda S. Landreth
2005 Market Street Philadelphia, PA 19103 June 1947 | | Trustee | | Since March 2005 | | Private Investor (2004–Present) | | 95 | | None |
| | | | | |
Frances A. Sevilla-Sacasa2005 Market Street Philadelphia, PA 19103 January 1956 | | Trustee | | Since September 2011 | | Private Investor (January 2017-Present) Chief Executive Officer — Banco Itaú International (April 2012–December 2016) Executive Advisor to Dean (August 2011–March 2012) and Interim Dean (January 2011–July 2011) — University of Miami School of Business Administration President — U.S. Trust, Bank of America Private Wealth Management (Private Banking) (July 2007–December 2008) | | 95 | | Trust Manager and Audit Committee Chair — Camden Property Trust (August 2011–Present) Director; Strategic Planning and Reserves Committee and Nominating and Governance Committee Member — Callon Petroleum Company (December 2019–Present) Director; Audit Committee Member — Carrizo Oil&Gas, Inc. (March 2018–December 2019) |
| | | | | |
Thomas K. Whitford
2005 Market Street Philadelphia, PA 19103 March 1956 | | Trustee | | Since January 2013 | | Vice Chairman (2010–April 2013) — PNC Financial Services Group | | 95 | | Director — HSBC North America Holdings Inc. (December 2013-Present) Director — HSBC USA Inc. (July 2014-Present) Director — HSBC Bank USA, National Association (July 2014-March 2017) Director — HSBC Finance Corporation (December 2013-April 2018) |
Limited Duration BondSeries-25
| | | | | | | | | | |
Name, Address, and Birth Date | | Position(s) Held with Fund(s) | | Length of Time
Served | | Principal
Occupation(s)
During the Past Five Years | | Number of
Portfolios in Fund
Complex Overseen
by Trustee
or Officer | | Other
Directorships
Held by
Trustee
or Officer |
| | | | | |
Christianna Wood
2005 Market Street Philadelphia, PA 19103 March 1956 | | Trustee | | Since January 2019 | | Chief Executive Officer and President — Gore Creek Capital, Ltd. (August 2009–Present) | | 95 | | Director; Finance Committee and Audit Committee Member — H&R Block Corporation (July 2008–Present) Director; Chair of Investments Committee and Audit Committee Member — Grange Insurance (2013–Present) Trustee; Chair of Nominating and Governance Committee and Audit Committee Member — The Merger Fund (2013–Present), The Merger Fund VL (2013–Present); WCM Alternatives: Event-Driven Fund (2013–Present), and WCM Alternatives: Credit Event Fund (December 2017–Present) Director; Chair of Governance Committee and Audit Committee Member — International Securities Exchange (2010–2016) |
| | | | | |
Janet L. Yeomans
2005 Market Street Philadelphia, PA 19103 July 1948 | | Trustee | | Since April 1999 | | Vice President and Treasurer (January 2006–July 2012), Vice President — Mergers & Acquisitions (January 2003–January 2006), and Vice President and Treasurer (July 1995–January 2003) — 3M Company | | 95 | | Director; Personnel and Compensation Committee Chair; Member of Nominating, Investments, and Audit Committees for various periods throughout directorship — Okabena Company (2009-2017) |
Limited Duration BondSeries-26
| | | | | | | | | | |
Name, Address, and Birth Date | | Position(s) Held with Fund(s) | | Length of Time
Served | | Principal
Occupation(s)
During the Past Five Years | | Number of
Portfolios in Fund
Complex Overseen
by Trustee
or Officer | | Other
Directorships
Held by
Trustee
or Officer |
| OFFICERS | | | | | | | | | | |
| | | | | |
David F. Connor
2005 Market Street Philadelphia, PA 19103 December 1963 | | Senior
Vice President, General Counsel, and Secretary | | Senior Vice President, since May 2013; General Counsel since May 2015; Secretary since October 2005 | | David F. Connor has served in various capacities at different times at Macquarie Investment Management. | | 95 | | None3 |
| | | | | |
Daniel V. Geatens
2005 Market Street Philadelphia, PA 19103 October 1972 | | Vice President and Treasurer | | Vice President and Treasurer since October 2007 | | Daniel V. Geatens has served in various capacities at different times at Macquarie Investment Management. | | 95 | | None3 |
| | | | | |
Richard Salus
2005 Market Street Philadelphia, PA 19103 October 1963 | | Senior
Vice President and Chief Financial
Officer | | Senior Vice President and Chief Financial Officer since November 2006 | | Richard Salus has served in various capacities at different times at Macquarie Investment Management. | | 95 | | None |
| 1 | Shawn K. Lytle is considered to be an “Interested Trustee” because he is an executive officer of the Fund’s(s’) investment advisor. |
| 2 | Macquarie Investment Management is the marketing name for Macquarie Management Holdings, Inc. and its subsidiaries, including the Fund’s(s’) investment advisor, principal underwriter, and its transfer agent. |
| 3 | David F. Connor and Daniel V. Geatens serve in similar capacities for the six portfolios of the Optimum Fund Trust, which have the same investment advisor, principal underwriter, and transfer agent as the registrant. Mr. Geatens also serves as the Chief Financial Officer of the Optimum Fund Trust and he is the Chief Financial Officer and Treasurer for Macquarie Global Infrastructure Total Return Fund Inc. |
The Statement of Additional Information for the Fund(s) includes additional information about the Trustees and Officers and is available, without charge, upon request by calling 800523-1918.
Limited Duration BondSeries-27
| | | | |
| | |
| | The Series files its complete schedule of portfolio holdings with the Securities and Exchange Commission (SEC) for the first and third quarters of each fiscal year on FormN-Q or FormN-PORT (available for filings after March 31, 2019). The Series’ FormsN-Q or FormsN-PORT, as well as a description of the policies and procedures that the Series uses to determine how to vote proxies (if any) relating to portfolio securities, are available without charge (i) upon request, by calling 800523-1918; and (ii) on the SEC’s website at sec.gov. In addition, a description of the policies and procedures that the Series uses to determine how to vote proxies (if any) relating to portfolio securities and the Schedule of Investments included in the Series’ most recent FormN-Q or FormN-PORT are available without charge on the Series’ website at delawarefunds.com/vip/literature. The Series’ FormsN-Q and FormsN-PORT may be reviewed and copied at the SEC’s Public Reference Room in Washington, D.C.; information on the operation of the Public Reference Room may be obtained by calling 800SEC-0330. Information (if any) regarding how the Series voted proxies relating to portfolio securities during the most recently disclosed12-month period ended June 30 is available without charge (i) through the Series’ website at delawarefunds.com/proxy; and (ii) on the SEC’s website at sec.gov. | | |
| | |
| AR-VIPLDB 22498 (2/20) (1076649) | | Limited Duration BondSeries-28 |

Delaware VIP® Trust
Delaware VIP Opportunity Series
(formerly, First Investors Life Series Opportunity Fund)
December 31, 2019
|
Beginning on or about June 1, 2021, as permitted by regulations adopted by the Securities and Exchange Commission, paper copies of your Series’ shareholder reports will no longer be sent to you by mail, unless you specifically request them from the Series or from your financial intermediary, such as a broker/dealer, bank, or insurance company. Instead, you will be notified by mail each time a report is posted on the website and provided with a link to access the report. If you already elected to receive shareholder reports electronically, you will not be affected by this change and you do not need to take any action. You may elect to receive paper copies of all future shareholder reports free of charge. You can inform the Series that you wish to continue receiving paper copies of your shareholder reports by contacting us at 800523-1918. If you own these shares through a financial intermediary, you may contact your financial intermediary to elect to continue to receive paper copies of your shareholder reports. Your election to receive reports in paper will apply to all funds held with the Delaware Funds® by Macquarie or your financial intermediary. |
Table of contents
Other than Macquarie Bank Limited (MBL), none of the entities noted are authorized deposit-taking institutions for the purposes of the Banking Act 1959 (Commonwealth of Australia). The obligations of these entities do not represent deposits or other liabilities of MBL. MBL does not guarantee or otherwise provide assurance in respect of the obligations of these entities, unless noted otherwise. The Series is governed by US laws and regulations.
Unless otherwise noted, views expressed herein are current as of Dec. 31, 2019, and subject to change for events occurring after such date.
The Series is not FDIC insured and is not guaranteed. It is possible to lose the principal amount invested.
Advisory services provided by Delaware Management Company, a series of Macquarie Investment Management Business Trust (MIMBT), a US registered investment advisor.
The Series is distributed byDelaware Distributors, L.P.(DDLP), an affiliate of MIMBT and Macquarie Group Limited. Macquarie Investment Management (MIM) is the marketing name for certain companies comprising the asset management division of Macquarie Group Limited and its subsidiaries and affiliates worldwide.
This material may be used in conjunction with the offering of shares in Delaware VIP® Opportunity Series only if preceded or accompanied by the Series’ current prospectus or the summary prospectus.
© 2020 Macquarie Management Holdings, Inc.
All third-party marks cited are the property of their respective owners.
| | |
Delaware VIP®Trust — Delaware VIP Opportunity Series |
Portfolio management review | | January 7, 2020 (Unaudited) |
The investment objective of the Series is to seek long-term capital growth.
Effective after the close of business on Oct. 4, 2019, Delaware Management Company (DMC or Manager), a series of Macquarie Investment Management Business Trust (MIMBT), serves as the investment manager for the Series.* During the period after the close of business on Oct. 4, 2019 to Dec. 31, 2019, the Manager repositioned the portfolio in accordance with Series’ investment objective and principal investment strategies, as described in the prospectus. The investment objective is the same and its principal investment strategies are the same or similar to those of the corresponding Life Series Fund.
For the fiscal year ended Dec. 31, 2019, Delaware VIP Opportunity Series (the “Series”) Standard Class shares gained 30.11%. This figure reflects all dividends reinvested. The Series’ benchmark, the Russell 2500™ Index, gained 27.77% for the same period. The Series changed its broad-based securities index from the S&P MidCap 400 Index to the Russell 2500 Index as of Oct. 4, 2019. The Series elected to use the new index because it more closely reflected the Series’ investment strategies.
Over the year, small- andmid-cap stocks underperformedlarge-cap stocks. Thesmaller-cap Russell 2000® Index gained 25.52% for the year while the Russell Midcap® Index gained 30.54%, and thelarge-cap Russell 1000® Index advanced 31.43%. Growth companies outperformed value companies during the year as Russell 2500™ Growth Index appreciated 32.65% versus the 23.56% gain for the Russell 2500™ Value Index.
In the Russell 2500 Index, high-beta (more volatile) companies outperformed lower-beta stocks, and companies without earnings – as well as those with higherprice-to-earnings (P/E) ratios – returned more on average than companies with lower P/E ratios. Sector-level performance within the Russell 2000 Index was mostly positive with 15 of 16 sectors advancing, and only the energy sector declining. The technology, credit cyclicals, capital goods, healthcare, and transportation sectors were the strongest-performing sectors in the benchmark, each advancing more than 30% during the year. The consumer discretionary, utilities, consumer staples, and media sectors in the benchmark were relative laggards during the year, each advancing more than 10% but returning less than the benchmark on average.
On the economic front, the gross domestic product (GDP) growth rate slowed in the third quarter, measuring 2.1%. At 3.5% in December, the unemployment rate remained at historically low levels. While the Conference Board Consumer Confidence Index® (1985=100, SA) trended lower over the year, a December survey of 126.5 continued to indicate confidence. In the manufacturing sector, the Purchasing Managers’ Index (PMI) has remained below 50 five months in a row; the December report was 47.2%. The National Federation of Independent Business (NFIB) Small Business Optimism Index ended the year with a relatively strong reading of 102.7 in December as small business owners understand that they are in a supportive environment.
Source: Bloomberg.
Foresters Investment Management Company, Inc. (FIMCO) managed the Series from Jan. 1, 2019 to Oct. 4, 2019, when the management of the Series transitioned to DMC. The following is a discussion about Series performance during that period ended Oct. 4, 2019:
During the reporting period, the Series’ absolute performance was mainly attributable to investments in information technology, industrials, and financial stocks. Information technology positions inSynopsys Inc., FleetCor Technologies Inc., andFiserv Inc., drove solid performance. In industrials,Jacobs Engineering Group Inc.benefited from strong earnings guidance and a successful acquisition. Finally, in financials,Fidelity National Financial Inc., helped by housing market strength, andAmeriprise Financial Inc., helped by lowering cost expectations, drove strong performance.
On a relative basis, the Series outperformed the S&P MidCap 400® Index primarily due to stock selection in the industrials, financials, and consumer staples sectors. The factors discussed earlier drove performance in industrials and financials. In consumer staples, a rotation to higher-quality names and continued growth in comparable sales helpedPerformance Food Group Co.andUS Foods Holding Corp.during the reporting period.
*On April 6, 2019, FIMCO, the investment adviser to the First Investors Funds, entered into an agreement with Macquarie Management Holdings, Inc. (MMHI), whereby MMHI, on behalf of its affiliate DMC, would acquire FIMCO’s asset management business (the “Transaction”). In connection with the Transaction, the Board of Trustees of the First Investors Trusts and the First Investors Fund shareholders approved, pursuant to an Agreement and Plan of Reorganization (the “Agreement”), the transfer of all assets and liabilities of each First Investors Fund to a corresponding, newly formed fund in the Delaware Funds® by Macquarie family of funds. The Transaction closed on Oct. 4, 2019.
|
| Unless otherwise noted, views expressed herein are current as of Dec. 31, 2019, and subject to change. |
Opportunity Series-1
| | |
| Delaware VIP® Trust — Delaware VIP Opportunity Series |
| Performance summary (Unaudited) | | |
The performance quoted represents past performance and does not guarantee future results. Investment return and principal value of an investment will fluctuate so that shares, when redeemed, may be worth more or less than their original cost. Current performance may be lower or higher than the performance quoted.
Carefully consider the Series’ investment objectives, risk factors, charges, and expenses before investing. This and other information can be found in the Series’ prospectus and its summary prospectus, which may be obtained by visiting delawarefunds.com/vip/literature or calling 800523-1918. Investors should read the prospectus and the summary prospectus carefully before investing.
| | | | | | | | | | | | | | | | |
Delaware VIP Opportunity Series | | | | | | | | | | | | | | | | |
Average annual total returns | | | | | | | | | | | | | | | | |
| For periods ended December 31, 2019 | | 1 year | | | 3 year | | | 5 year | | | Lifetime | |
Standard Class shares (commenced operations on Dec. 17, 2012) | | | +30.11% | | | | +9.42% | | | | +7.06% | | | | +11.08% | |
| | | | | | | | | | | | | | | | |
Russell 2500 Index (current benchmark) | | | +27.77% | | | | +10.33% | | | | +8.93% | | | | — | |
| | | | | | | | | | | | | | | | |
S&P MidCap 400 Index (former benchmark) | | | +26.20% | | | | +9.26% | | | | +9.03% | | | | — | |
Returns reflect the reinvestment of all distributions. Please see page 3 for a description of the indices.
As described in the Series’ most recent prospectus, the net expense ratio for Standard Class shares of the Series was 0.83%, while total operating expenses for Standard Class shares were 0.89%. The management fee for Standard Class shares was 0.75%. The Series’ investment manager, Delaware Management Company (Manager), has contractually agreed to waive all or a portion of its investment advisory fees and/or pay/reimburse expenses (excluding any12b-1 fees, acquired fund fees and expenses, taxes, interest, short sale and dividend interest expenses, brokerage fees, certain insurance costs, and nonroutine expenses or costs, including, but not limited to, those relating to reorganizations, litigation, conducting shareholder meetings, and liquidations) in order to prevent annual series operating expenses from exceeding 0.83% of the Series’ average daily net assets from Oct. 4, 2019 through Dec. 31, 2019.* Please see the most recent prospectus and any applicable supplement(s) for additional information on these fee waivers and/or reimbursements. Please see the “Financial highlights” section in this report for the most recent expense ratios.
Earnings from a variable annuity or variable life investment compoundtax-free until withdrawal, and as a result, no adjustments were made for income taxes.
Expense limitations were in effect for Standard Class shares during certain periods shown in the Series performance table above and in the Performance of a $10,000 Investment graph on the next page.
Performance data do not reflect insurance fees related to a variable annuity or variable life investment or the deferred sales charge that would apply to certain withdrawals of investments held for fewer than eight years. Performance shown here would have been reduced if such fees were included and the expense limitation removed. For more information about fees, consult your variable annuity or variable life prospectus.
Investments in variable products involve risk.
Investments in small and/ormedium-sized companies typically exhibit greater risk and higher volatility than larger, more established companies.
REIT investments are subject to many of the risks associated with direct real estate ownership, including changes in economic conditions, credit risk, and interest rate fluctuations.
An exchange-traded fund (ETF) is a security that represents all the stocks on a given exchange. ETF shares can be bought, sold, short-sold, traded on margin, and generally function as if they were stocks.
Please read both the contract and underlying prospectus for specific details regarding the product’s risk profile.
*The aggregate contractual waiver period covering this report is from Oct. 4, 2019 through Oct. 31, 2021.
Opportunity Series-2
Delaware VIP® Opportunity Series
Performance summary (Unaudited) (continued)
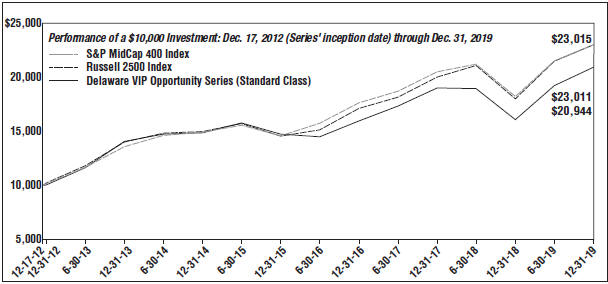
| | | | | | |
| For period beginning Dec. 17, 2012 (Series’ inception date) through Dec. 31, 2019 | | Starting value | | Ending value |
– – S&P MidCap 400 Index | | $10,000 | | $23,015 |
– – Russell 2500 Index | | $10,000 | | $23,011 |
–– Delaware VIP Opportunity Series (Standard Class) | | $10,000 | | $20,944 |
The graph shows a $10,000 investment in the Delaware VIP Opportunity Series Standard Class shares for the period from Dec. 17, 2012 through Dec. 31, 2019.
The graph also shows $10,000 invested in the Russell 2500 Index and the S&P MidCap 400 Index for the period from Dec. 17, 2012 through Dec. 31, 2019.
The Russell 2500 Index measures the performance of the small- tomid-cap segment of the US equity universe. The Russell 2500 Index is a subset of the Russell 3000® Index, representing approximately 2,500 of the smallest securities based on a combination of their market cap and current index membership.
The S&P MidCap 400 Index measures the performance of 400mid-sized US company stocks.
The Russell 1000 Index, mentioned on page 1, measures the performance of thelarge-cap segment of the US equity universe.
The Russell 2000 Index, mentioned on page 1, measures the performance of thesmall-cap segment of the US equity universe.
The Russell Midcap Index, mentioned on page 1, measures the performance of themid-cap segment of the US equity universe. The Russell Midcap Index is a subset of the Russell 1000 Index.
The Russell 2500 Growth Index, mentioned on page 1, measures the performance of the small- tomid-cap growth segment of the US equity universe. It includes those Russell 2500 companies with higherprice-to-book ratios and higher forecasted growth values.
The Russell 2500 Value Index, mentioned on page 1, measures the performance of the small- tomid-cap value segment of the US equity universe. It includes those Russell 2500 companies with lowerprice-to-book ratios and lower forecasted growth values.
The Conference Board Consumer Confidence Index, mentioned on page 1, is a barometer of the health of the US economy from the perspective of the consumer. The index is based on consumers’ perceptions of current business and employment conditions, as well as their expectations for six months hence regarding business conditions, employment, and income. The resulting relative value is then used as an “index value” and compared against each respective monthly value for 1985. In that year, the result of the index was arbitrarily set at 100, representing it as the index benchmark.
The Purchasing Managers’ Index (PMI), mentioned on page 1, is an indicator of the economic health of the manufacturing sector. A PMI reading above 50% indicates that the manufacturing economy is generally expanding; below 50% indicates that it is generally contracting.
Opportunity Series-3
Delaware VIP® Opportunity Series
Performance summary (Unaudited) (continued)
The NFIB Small Business Optimism Index, mentioned on page 1, is a survey asking small business owners a battery of questions related to their expectations for the future and their plans to hire, build inventory, borrow, and expand.
Gross domestic product is a measure of all goods and services produced by a nation in a year.
Theprice-to-earnings ratio (P/E ratio) is a valuation ratio of a company’s current share price compared to its earnings per share. Generally, a high P/E ratio means that investors are anticipating higher growth in the future.
Frank Russell Company is the source and owner of the trademarks, service marks, and copyrights related to the Russell Indexes. Russell® is a trademark of Frank Russell Company.
Index performance returns do not reflect any management fees, transaction costs or expenses. Indices are unmanaged and one cannot invest directly in an index.
Past performance is not a guarantee of future results.
Opportunity Series-4
Delaware VIP® Trust — Delaware VIP Opportunity Series
Disclosure of Series expenses
For thesix-month period from July 1, 2019 to December 31, 2019 (Unaudited)
As a shareholder of the Series, you incur ongoing costs, which may include management fees; distribution and service(12b-1) fees; and other Series expenses. This example is intended to help you understand your ongoing costs (in dollars) of investing in the Series and to compare these costs with the ongoing costs of investing in other mutual funds.
The example is based on an investment of $1,000 invested at the beginning of the period and held for the entiresix-month period from July 1, 2019 to Dec. 31, 2019.
Actual expenses
The first section of the table shown, “Actual Series return,” provides information about actual account values and actual expenses. You may use the information in this section of the table, together with the amount you invested, to estimate the expenses that you paid over the period. Simply divide your account value by $1,000 (for example, an $8,600 account value divided by $1,000 = 8.6), then multiply the result by the number in the first section under the heading entitled “Expenses Paid During Period” to estimate the expenses you paid on your account during the period.
Hypothetical example for comparison purposes
The second section of the table shown, “Hypothetical 5% return,” provides information about hypothetical account values and hypothetical expenses based on the Series’ actual expense ratio and an assumed rate of return of 5% per year before expenses, which is not the Series’ actual return. The hypothetical account values and expenses may not be used to estimate the actual ending account balance or expenses you paid for the period. You may use this information to compare the ongoing costs of investing in the Series and other funds. To do so, compare this 5% hypothetical example with the 5% hypothetical examples that appear in the shareholder reports of other funds.
Please note that the expenses shown in the table are meant to highlight your ongoing costs only. As a shareholder of the Series, you do not incur any transaction costs, such as sales charges (loads), redemption fees or exchange fees, but shareholders of other funds may incur such costs. Also, the fees related to the variable annuity investment or the deferred sales charge that could apply have not been included. Therefore, the second section of the table is useful in comparing ongoing costs only, and will not help you determine the relative total costs of owning different funds. The Series’ expenses shown in the table reflect fee waivers in effect and assume reinvestment of all dividends and distributions.
Expense analysis of an investment of $1,000
| | | | | | | | | | |
| | | Beginning
Account
Value
7/1/19 | | Ending
Account
Value
12/31/19 | | Annualized
Expense
Ratio | | Expenses
Paid During
Period
7/1/19 to
12/31/19* | |
| |
Actual Series return† | | | | |
Standard Class | | $1,000.00 | | $1,089.40 | | 0.85% | | | $4.48 | |
|
Hypothetical 5% return(5% return before expenses) | |
Standard Class | | $1,000.00 | | $1,020.92 | | 0.85% | | | $4.33 | |
*“Expenses Paid During Period” are equal to the Series’ annualized expense ratio, multiplied by the average account value over the period, multiplied by 184/365 (to reflect theone-half year period).
| † | Because actual returns reflect only the most recentsix-month period, the returns shown may differ significantly from fiscal year returns. |
In addition to the Series’ expenses reflected above, the Series also indirectly bears its portion of the fees and expenses of the investment companies (Underlying Funds) in which it invests. The table above does not reflect the expenses of the Underlying Funds.
Opportunity Series-5
Delaware VIP® Trust — Delaware VIP Opportunity Series
Security type / sector allocation and top 10 equity holdings
As of December 31, 2019 (Unaudited)
Sector designations may be different than the sector designations presented in other Series materials. The sector designations may represent the investment manager’s internal sector classifications.
| | | | | |
| Security type / sector | | Percentage of net assets |
Common Stock | | | | 98.05 | % |
Basic Materials | | | | 9.38 | % |
Business Services | | | | 3.60 | % |
Capital Goods | | | | 12.88 | % |
Communications Services | | | | 0.82 | % |
Consumer Discretionary | | | | 3.44 | % |
Consumer Services | | | | 1.97 | % |
Consumer Staples | | | | 1.81 | % |
Credit Cyclicals | | | | 1.66 | % |
Energy | | | | 1.27 | % |
Financial Services | | | | 14.39 | % |
Healthcare | | | | 14.19 | % |
Media | | | | 1.10 | % |
Real Estate Investment Trusts | | | | 9.46 | % |
Technology | | | | 16.47 | % |
Transportation | | | | 1.26 | % |
Utilities | | | | 4.35 | % |
Short-Term Investments | | | | 2.24 | % |
Total Value of Securities | | | | 100.29 | % |
Liabilities Net of Receivables and Other Assets | | | | (0.29 | %) |
Total Net Assets | | | | 100.00 | % |
Holdings are for informational purposes only and are subject to change at any time. They are not a recommendation to buy, sell, or hold any security.
| | | | | |
| Top 10 equity holdings | | Percentage of net assets |
Spire | | | | 1.62 | % |
Tyler Technologies | | | | 1.57 | % |
Paycom Software | | | | 1.55 | % |
NorthWestern | | | | 1.54 | % |
Reliance Steel & Aluminum | | | | 1.49 | % |
Reinsurance Group of America | | | | 1.32 | % |
SS&C Technologies Holdings | | | | 1.30 | % |
DexCom | | | | 1.22 | % |
Proofpoint | | | | 1.20 | % |
South Jersey Industries | | | | 1.19 | % |
Opportunity Series-6
Delaware VIP® Trust — Delaware VIP Opportunity Series
Schedule of investments
December 31, 2019
| | | | | | | | |
| | | Number of
shares | | | Value (US $) | |
Common Stock – 98.05% | | | | | |
Basic Materials – 9.38% | | | | | |
Balchem | | | 6,155 | | | $ | 625,533 | |
Continental Building Products † | | | 25,057 | | | | 912,826 | |
Eastman Chemical | | | 8,924 | | | | 707,316 | |
Huntsman | | | 39,902 | | | | 964,032 | |
Kaiser Aluminum | | | 8,616 | | | | 955,428 | |
Minerals Technologies | | | 12,925 | | | | 744,868 | |
Neenah | | | 12,719 | | | | 895,799 | |
Reliance Steel & Aluminum | | | 10,274 | | | | 1,230,414 | |
Worthington Industries | | | 16,378 | | | | 690,824 | |
| | | | | | | | |
| | | | | | | 7,727,040 | |
| | | | | | | | |
Business Services – 3.60% | | | | | |
ABM Industries | | | 15,489 | | | | 584,090 | |
Aramark | | | 17,061 | | | | 740,447 | |
ASGN † | | | 9,847 | | | | 698,842 | |
Mobile Mini | | | 9,637 | | | | 365,339 | |
US Ecology | | | 9,950 | | | | 576,205 | |
| | | | | | | | |
| | | | | | | 2,964,923 | |
| | | | | | | | |
Capital Goods – 12.88% | | | | | |
Barnes Group | | | 7,243 | | | | 448,776 | |
Belden | | | 8,924 | | | | 490,820 | |
BWX Technologies | | | 8,924 | | | | 554,002 | |
Columbus McKinnon | | | 4,821 | | | | 192,985 | |
ESCO Technologies | | | 6,667 | | | | 616,697 | |
Federal Signal | | | 9,027 | | | | 291,121 | |
Gates Industrial † | | | 19,387 | | | | 266,765 | |
Graco | | | 10,360 | | | | 538,720 | |
Granite Construction | | | 18,181 | | | | 503,068 | |
Jacobs Engineering Group | | | 6,770 | | | | 608,149 | |
Kadant | | | 7,898 | | | | 831,975 | |
Lincoln Electric Holdings | | | 9,129 | | | | 883,048 | |
MasTec † | | | 6,975 | | | | 447,516 | |
Oshkosh | | | 8,616 | | | | 815,504 | |
Quanta Services | | | 12,412 | | | | 505,293 | |
Rexnord † | | | 15,489 | | | | 505,251 | |
Spirit AeroSystems Holdings Class A | | | 5,847 | | | | 426,129 | |
Tetra Tech | | | 3,077 | | | | 265,114 | |
United Rentals † | | | 4,700 | | | | 783,819 | |
Woodward | | | 5,334 | | | | 631,759 | |
| | | | | | | | |
| | | | | | | 10,606,511 | |
| | | | | | | | |
Communications Services – 0.82% | | | | | |
InterXion Holding † | | | 8,065 | | | | 675,928 | |
| | | | | | | | |
| | | | | | | 675,928 | |
| | | | | | | | |
Consumer Discretionary – 3.44% | | | | | |
American Eagle Outfitters | | | 35,594 | | | | 523,232 | |
Five Below † | | | 5,744 | | | | 734,428 | |
Malibu Boats Class A † | | | 15,489 | | | | 634,275 | |
Steven Madden | | | 21,831 | | | | 938,951 | |
| | | | | | | | |
| | | | | | | 2,830,886 | |
| | | | | | | | |
Consumer Services – 1.97% | | | | | |
Cheesecake Factory | | | 10,052 | | | | 390,621 | |
| | | | | | | | |
| | | Number of
shares | | | Value (US $) | |
Common Stock (continued) | | | | | |
Consumer Services (continued) | | | | | |
Chuy’s Holdings † | | | 8,822 | | | $ | 228,666 | |
Jack in the Box | | | 5,847 | | | | 456,241 | |
Wendy’s | | | 24,786 | | | | 550,497 | |
| | | | | | | | |
| | | | | | | 1,626,025 | |
| | | | | | | | |
Consumer Staples – 1.81% | | | | | |
Casey’s General Stores | | | 5,334 | | | | 848,053 | |
J&J Snack Foods | | | 3,488 | | | | 642,734 | |
| | | | | | | | |
| | | | | | | 1,490,787 | |
| | | | | | | | |
Credit Cyclicals – 1.66% | | | | | |
BorgWarner | | | 15,694 | | | | 680,806 | |
Tenneco Class A | | | 17,541 | | | | 229,787 | |
Toll Brothers | | | 11,591 | | | | 457,960 | |
| | | | | | | | |
| | | | | | | 1,368,553 | |
| | | | | | | | |
Energy – 1.27% | | | | | |
Callon Petroleum † | | | 35,936 | | | | 173,572 | |
Diamondback Energy | | | 3,077 | | | | 285,730 | |
Parsley Energy Class A | | | 12,958 | | | | 245,036 | |
Patterson-UTI Energy | | | 25,131 | | | | 263,876 | |
SRC Energy † | | | 18,400 | | | | 75,808 | |
| | | | | | | | |
| | | | | | | 1,044,022 | |
| | | | | | | | |
Financial Services – 14.39% | | | | | |
Axis Capital Holdings | | | 8,656 | | | | 514,513 | |
CenterState Bank | | | 22,259 | | | | 556,030 | |
East West Bancorp | | | 14,053 | | | | 684,381 | |
Essent Group | | | 14,976 | | | | 778,602 | |
First Financial Bancorp | | | 15,135 | | | | 385,034 | |
Great Western Bancorp | | | 18,053 | | | | 627,161 | |
Independent Bank Group | | | 10,565 | | | | 585,724 | |
Kemper | | | 4,308 | | | | 333,870 | |
MGIC Investment | | | 53,032 | | | | 751,463 | |
Primerica | | | 6,155 | | | | 803,597 | |
Reinsurance Group of America | | | 6,667 | | | | 1,087,121 | |
Selective Insurance Group | | | 8,680 | | | | 565,849 | |
Sterling Bancorp | | | 27,285 | | | | 575,168 | |
Stifel Financial | | | 13,430 | | | | 814,530 | |
Umpqua Holdings | | | 40,312 | | | | 713,522 | |
Valley National Bancorp | | | 46,672 | | | | 534,394 | |
Webster Financial | | | 9,025 | | | | 481,574 | |
Western Alliance Bancorp | | | 10,565 | | | | 602,205 | |
WSFS Financial | | | 10,258 | | | | 451,249 | |
| | | | | | | | |
| | | | | | | 11,845,987 | |
| | | | | | | | |
Healthcare – 14.19% | | | | | |
Agios Pharmaceuticals † | | | 12,372 | | | | 590,763 | |
Alkermes † | | | 13,950 | | | | 284,580 | |
Bio-Techne | | | 4,043 | | | | 887,479 | |
Catalent † | | | 12,719 | | | | 716,080 | |
DexCom † | | | 4,597 | | | | 1,005,548 | |
Encompass Health | | | 10,052 | | | | 696,302 | |
Exact Sciences † | | | 9,228 | | | | 853,405 | |
ICON (Ireland) † | | | 5,129 | | | | 883,368 | |
Opportunity Series-7
Delaware VIP® Opportunity Series
Schedule of investments (continued)
| | | | | | | | |
| | | Number of
shares | | | Value (US $) | |
Common Stock (continued) | | | | | |
Healthcare (continued) | | | | | |
Ligand Pharmaceuticals † | | | 5,334 | | | $ | 556,283 | |
Medicines † | | | 10,429 | | | | 885,839 | |
Neurocrine Biosciences † | | | 9,010 | | | | 968,485 | |
Repligen † | | | 4,821 | | | | 445,943 | |
Supernus Pharmaceuticals † | | | 12,719 | | | | 301,695 | |
Ultragenyx Pharmaceutical † | | | 12,040 | | | | 514,228 | |
WellCare Health Plans † | | | 2,052 | | | | 677,591 | |
West Pharmaceutical Services | | | 6,462 | | | | 971,432 | |
Wright Medical Group † | | | 14,639 | | | | 446,197 | |
| | | | | | | | |
| | | | | | | 11,685,218 | |
| | | | | | | | |
Media – 1.10% | | | | | | | | |
Cinemark Holdings | | | 11,489 | | | | 388,903 | |
Interpublic Group of Companies | | | 22,362 | | | | 516,562 | |
| | | | | | | | |
| | | | | | | 905,465 | |
| | | | | | | | |
Real Estate Investment Trusts – 9.46% | | | | | |
American Assets Trust | | | 4,308 | | | | 197,737 | |
Apartment Investment & Management Class A | | | 14,668 | | | | 757,602 | |
Brixmor Property Group | | | 30,055 | | | | 649,489 | |
Camden Property Trust | | | 6,257 | | | | 663,868 | |
Cousins Properties | | | 19,592 | | | | 807,190 | |
EastGroup Properties | | | 5,231 | | | | 693,997 | |
EPR Properties | | | 8,514 | | | | 601,429 | |
Equity Commonwealth | | | 9,950 | | | | 326,659 | |
First Industrial Realty Trust | | | 18,977 | | | | 787,735 | |
Kite Realty Group Trust | | | 31,286 | | | | 611,016 | |
Mack-Cali Realty | | | 19,695 | | | | 455,545 | |
Pebblebrook Hotel Trust | | | 19,797 | | | | 530,758 | |
Physicians Realty Trust | | | 11,489 | | | | 217,602 | |
RPT Realty | | | 32,619 | | | | 490,590 | |
| | | | | | | | |
| | | | | | | 7,791,217 | |
| | | | | | | | |
Technology – 16.47% | | | | | | | | |
Blackbaud | | | 4,000 | | | | 318,400 | |
Brooks Automation | | | 15,200 | | | | 637,792 | |
Chegg † | | | 6,565 | | | | 248,879 | |
ExlService Holdings † | | | 10,258 | | | | 712,521 | |
Guidewire Software † | | | 8,616 | | | | 945,778 | |
II-VI † | | | 13,848 | | | | 466,262 | |
j2 Global | | | 8,001 | | | | 749,774 | |
LendingTree † | | | 2,359 | | | | 715,815 | |
MACOM Technology Solutions Holdings † | | | 9,642 | | | | 256,477 | |
MaxLinear † | | | 25,654 | | | | 544,378 | |
| | | | | | | | |
| | | Number of
shares | | | Value (US $) | |
Common Stock (continued) | | | | | |
Technology (continued) | | | | | |
NETGEAR † | | | 8,822 | | | $ | 216,227 | |
Paycom Software † | | | 4,821 | | | | 1,276,408 | |
Proofpoint † | | | 8,616 | | | | 988,944 | |
PTC † | | | 9,027 | | | | 676,032 | |
Semtech † | | | 13,335 | | | | 705,422 | |
SS&C Technologies Holdings | | | 17,438 | | | | 1,070,693 | |
SYNNEX | | | 3,488 | | | | 449,254 | |
Tyler Technologies † | | | 4,308 | | | | 1,292,486 | |
WNS Holdings ADR † | | | 13,335 | | | | 882,110 | |
Yelp † | | | 11,591 | | | | 403,715 | |
| | | | | | | | |
| | | | | | | 13,557,367 | |
| | | | | | | | |
Transportation – 1.26% | | | | | |
Knight-Swift Transportation Holdings | | | 21,951 | | | | 786,724 | |
Werner Enterprises | | | 6,824 | | | | 248,325 | |
| | | | | | | | |
| | | | | | | 1,035,049 | |
| | | | | | | | |
Utilities – 4.35% | | | | | | | | |
NorthWestern | | | 17,746 | | | | 1,271,856 | |
South Jersey Industries | | | 29,644 | | | | 977,659 | |
Spire | | | 16,002 | | | | 1,333,127 | |
| | | | | | | | |
| | | | | | | 3,582,642 | |
| | | | | | | | |
Total Common Stock
(cost $72,847,675) | | | | 80,737,620 | |
| | | | | | | | |
Short-Term Investments – 2.24% | | | | | |
Money Market Mutual Funds – 2.24% | | | | | |
BlackRock FedFund – Institutional Shares(seven-day effective yield 1.52%) | | | 367,995 | | | | 367,995 | |
Fidelity Investments Money Market Government Portfolio – Class I(seven-day effective yield 1.49%) | | | 367,995 | | | | 367,995 | |
GS Financial Square Government Fund – Institutional Shares(seven-day effective yield 1.51%) | | | 367,995 | | | | 367,995 | |
Morgan Stanley Government Portfolio – Institutional Share Class(seven-day effective yield 1.48%) | | | 367,995 | | | | 367,995 | |
State Street Institutional US Government Money Market Fund - Investor Class(seven-day effective yield 1.45%) | | | 367,995 | | | | 367,995 | |
| | | | | | | | |
Total Short-Term Investments
(cost $1,839,975) | | | | 1,839,975 | |
| | | | | | | | |
| | | | |
Total Value of Securities – 100.29%
(cost $74,687,650) | | $ | 82,577,595 | |
| | | | |
†Non-income producing security.
Opportunity Series-8
Delaware VIP® Opportunity Series
Schedule of investments (continued)
Summary of abbreviations:
ADR – American Depositary Receipt
GS – Goldman Sachs
See accompanying notes, which are an integral part of the financial statements.
Opportunity Series-9
| | | | |
| Delaware VIP®Trust — Delaware VIP Opportunity Series | |
| Statement of assets and liabilities | | | December 31, 2019 | |
| | | | |
Assets: | | | | |
Investments, at value1 | | $ | 82,577,595 | |
Dividends and interest receivable | | | 86,631 | |
Receivable for series shares sold | | | 34,972 | |
Other assets | | | 2115 | |
| | | | |
Total assets | | | 82,701,313 | |
| | | | |
Liabilities: | | | | |
Cash due to custodian | | | 2,024 | |
Payable for securities purchased | | | 248,285 | |
Audit and tax fees payable | | | 38,083 | |
Investment management fees payable | | | 28,224 | |
Payable for series shares redeemed | | | 22,592 | |
Accounting and administration expenses payable tonon-affiliates | | | 7,524 | |
Reports and statements to shareholders payable tonon-affiliates | | | 6,772 | |
Other accrued expenses | | | 3,487 | |
Trustees’ fees and expenses payable | | | 795 | |
Pricing fees payable | | | 750 | |
Accounting and administration expenses payable to affiliates | | | 571 | |
Dividend disbursing and transfer agent fees and expenses payable to affiliates | | | 522 | |
Reports and statements to shareholders payable to affiliates | | | 129 | |
Legal fees payable to affiliates | | | 128 | |
| | | | |
Total liabilities | | | 359,886 | |
| | | | |
Total Net Assets | | $ | 82,341,427 | |
| | | | |
| |
Net Assets Consist of: | | | | |
Paid-in capital | | $ | 61,907,656 | |
Total distributable earnings (loss) | | | 20,433,771 | |
| | | | |
Total Net Assets | | $ | 82,341,427 | |
| | | | |
| |
Net Asset Value: | | | | |
Standard Class: | | | | |
Net assets | | $ | 82,341,427 | |
Shares of beneficial interest outstanding, unlimited authorization, no par | | | 4,222,888 | |
Net asset value per share | | $ | 19.50 | |
1Investments, at cost | | $ | 74,687,650 | |
See accompanying notes, which are an integral part of the financial statements.
Opportunity Series-10
Delaware VIP®Trust —
Delaware VIP Opportunity Series
Statement of operations
Year ended December 31, 2019
| | | | |
Investment Income: | | | | |
Dividends | | $ | 1,132,451 | |
Interest | | | 8,941 | |
Foreign tax withheld | | | (2,811 | ) |
| | | | |
| | | 1,138,581 | |
| | | | |
Expenses: | | | | |
Management fees | | | 574,487 | |
Audit and tax fees | | | 36,905 | |
Reports and statements to shareholders | | | 22,339 | |
Accounting and administration expenses | | | 12,035 | |
Custodian fees | | | 10,201 | |
Legal fees | | | 7,754 | |
Trustees’ fees and expenses | | | 7,626 | |
Dividend disbursing and transfer agent fees and expenses | | | 1,537 | |
Other | | | 10,560 | |
| | | | |
| | | 683,444 | |
Less expenses waived | | | (35,031 | ) |
Less expenses paid indirectly | | | (1,932 | ) |
| | | | |
Total operating expenses | | | 646,481 | |
| | | | |
Net Investment Income | | | 492,100 | |
| | | | |
| |
Net Realized and Unrealized Gain: | | | | |
Net realized gain | | | 12,145,268 | |
Net change in unrealized appreciation (depreciation) of investments | | | 6,796,778 | |
| | | | |
Net Realized and Unrealized Gain | | | 18,942,046 | |
| | | | |
Net Increase in Net Assets Resulting from Operations | | $ | 19,434,146 | |
| | | | |
Delaware VIP Trust —
Delaware VIP Opportunity Series
Statements of changes in net assets
| | | | | | | | |
| | | Year ended | |
| | | 12/31/2019 | | | 12/31/2018 | |
Increase (Decrease) in Net Assets from Operations: | |
Net investment income | | $ | 492,100 | | | $ | 941,034 | |
Net realized gain | | | 12,145,268 | | | | 1,873,756 | |
Net change in unrealized appreciation (depreciation) | | | 6,796,778 | | | | (14,258,572 | ) |
| | | | | | | | |
Net increase (decrease) in net assets resulting from operations | | | 19,434,146 | | | | (11,443,782 | ) |
| | | | | | | | |
| | |
Dividends and Distributions to Shareholders from: | | | | | | | | |
Distributable earnings: | | | | | | | | |
Standard Class | | | (2,832,760 | ) | | | (1,264,074 | ) |
| | | | | | | | |
| |
Capital Share Transactions: | | | | | |
Proceeds from shares sold: | | | | | | | | |
Standard Class | | | 5,636,422 | | | | 10,438,149 | |
Net asset value of shares issued upon reinvestment of dividends and distributions: | | | | | | | | |
Standard Class | | | 2,832,760 | | | | 1,264,074 | |
| | | | | | | | |
| | | 8,469,182 | | | | 11,702,223 | |
| | | | | | | | |
Cost of shares redeemed: | | | | | | | | |
Standard Class | | | (6,924,307 | ) | | | (4,776,699 | ) |
| | | | | | | | |
Increase in net assets derived from capital share transactions | | | 1,544,875 | | | | 6,925,524 | |
| | | | | | | | |
Net Increase (Decrease) in Net Assets | | | 18,146,261 | | | | (5,782,332 | ) |
| | |
Net Assets: | | | | | | | | |
Beginning of year | | | 64,195,166 | | | | 69,977,498 | |
| | | | | | | | |
End of year | | $ | 82,341,427 | | | $ | 64,195,166 | |
| | | | | | | | |
See accompanying notes, which are an integral part of the financial statements.
Opportunity Series-11
Delaware VIP® Trust — Delaware VIP Opportunity Series
Financial highlights
Selected data for each share of the Series outstanding throughout each period were as follows:
| | | | | | | | | | | | | | | | | | | | | | | | |
| | | Delaware VIP Opportunity Series Standard Class Year ended | |
| | | 12/31/191 | | | 12/31/18 | | | 12/31/17 | | | | | | 12/31/16 | | | 12/31/15 | |
Net asset value, beginning of period | | $ | 15.58 | | | $ | 18.76 | | | $ | 15.87 | | | $ | | | | | 14.73 | | | $ | 14.88 | |
| | | | | | |
Income (loss) from investment operations: | | | | | | | | | | | | | | | | | | | | | | | | |
Net investment income2 | | | 0.11 | | | | 0.24 | | | | 0.10 | | | | | | | | 0.12 | | | | 0.08 | |
Net realized and unrealized gain (loss) | | | 4.49 | | | | (3.08 | ) | | | 2.90 | | | | | | | | 1.09 | | | | (0.20 | ) |
| | | | | | | | | | | | | | | | | | | | |
Total from investment operations | | | 4.60 | | | | (2.84 | ) | | | 3.00 | | | | | | | | 1.21 | | | | (0.12 | ) |
| | | | | | | | | | | | | | | | | | | | |
| | | | | | |
Less dividends and distributions from: | | | | | | | | | | | | | | | | | | | | | | | | |
Net investment income | | | (0.23 | ) | | | (0.10 | ) | | | (0.11 | ) | | | | | | | (0.07 | ) | | | (0.03 | ) |
Net realized gain | | | (0.45 | ) | | | (0.24 | ) | | | — | | | | | | | | — | | | | — | |
| | | | | | | | | | | | | | | | | | | | |
Total dividends and distributions | | | (0.68 | ) | | | (0.34 | ) | | | (0.11 | ) | | | | | | | (0.07 | ) | | | (0.03 | ) |
| | | | | | | | | | | | | | | | | | | | |
| | | | | | |
Net asset value, end of period | | $ | 19.50 | | | $ | 15.58 | | | $ | 18.76 | | | $ | | | | | 15.87 | | | $ | 14.73 | |
| | | | | | | | | | | | | | | | | | | | |
| | | | | | |
Total return3 | | | 30.11%4 | | | | (15.38% | ) | | | 19.00% | | | | | | | | 8.26% | | | | (0.81% | ) |
| | | | | | |
Ratios and supplemental data: | | | | | | | | | | | | | | | | | | | | | | | | |
Net assets, end of period (000 omitted) | | $ | 82,342 | | | $ | 64,195 | | | $ | 69,977 | | | $ | | | | | 52,737 | | | $ | 40,114 | |
Ratio of expenses to average net assets5 | | | 0.84% | | | | 0.83% | | | | 0.84% | | | | | | | | 0.87% | | | | 0.89% | |
Ratio of expenses to average net assets prior to fees waived5 | | | 0.89% | | | | 0.83% | | | | 0.84% | | | | | | | | 0.87% | | | | 0.89% | |
Ratio of net investment income to average net assets | | | 0.65% | | | | 1.34% | | | | 0.59% | | | | | | | | 0.83% | | | | 0.53% | |
Ratio of net investment income to average net assets prior to fees waived | | | 0.60% | | | | 1.34% | | | | 0.59% | | | | | | | | 0.83% | | | | 0.53% | |
Portfolio turnover | | | 125% | 6 | | | 59% | | | | 30% | | | | | | | | 31% | | | | 45% | |
| 1 | On Oct. 4, 2019, the First Investors Life Series Opportunity Fund shares were reorganized into Standard Class shares of the Series. See “Notes to financial statements.” The Standard Class shares financial highlights for the period prior to Oct. 4, 2019, reflect the performance of the First Investors Life Series Opportunity Fund shares. |
| 2 | The average shares outstanding method has been applied for per share information. |
| 3 | Total return is based on the change in net asset value of a share during the period and assumes reinvestment of dividends and distributions at net asset value. Total return does not include fees, charges, or expenses imposed by the variable annuity and life insurance contracts for which Delaware VIP Trust serves as an underlying investment vehicle. |
| 4 | Total return during the period reflects a waiver by the manager. Performance would have been lower had the waiver not been in effect. |
| 5 | Expense ratios do not include expenses of the Underlying Funds in which the Series invests. |
| 6 | The Series’ portfolio turnover rate increased substantially during the year ended Dec. 31, 2019 due to a change in the Series’ portfolio managers and associated repositioning. |
See accompanying notes, which are an integral part of the financial statements.
Opportunity Series-12
Delaware VIP® Trust — Delaware VIP Opportunity Series
Notes to financial statements
December 31, 2019
Delaware VIP Trust (Trust) is organized as a Delaware statutory trust. The Trust consists of 22 series, each of which is treated as a separate entity for certain matters under the Investment Company Act of 1940, as amended (1940 Act). These financial statements and the related notes pertain to Delaware VIP Total Return Series (Series). The Trust is anopen-end investment company. The Series is considered diversified under the 1940 Act and offers Standard Class shares. The Standard Class shares do not carry a distribution and service(12b-1) fee. The shares of the Series are sold only to separate accounts of life insurance companies.
Before the Series commenced operations, on Oct. 4, 2019, all of the assets and liabilities of the First Investors Life Series Opportunity Fund, its respective Predecessor Series (Predecessor Series) were transferred to the Series in atax-free reorganization as set forth in an agreement and plan of reorganization (each a Foresters Reorganization) between the Trust, on behalf of the Series, and Foresters Investment Management Company, Inc. (FIMCO), on behalf of the Predecessor Series. As a result of the Foresters Reorganization, the Series assumed the performance and accounting history of its Predecessor Series. Financial information included for the dates prior to the Foresters Reorganization is that of the Predecessor Series.
1. Significant Accounting Policies
The Series follows accounting and reporting guidance under Financial Accounting Standards Board (FASB) Accounting Standards Codification Topic 946, Financial Services – Investment Companies. The following accounting policies are in accordance with US generally accepted accounting principles (US GAAP) and are consistently followed by the Series.
Security Valuation — Equity securities, except those traded on the Nasdaq Stock Market LLC (Nasdaq), are valued at the last quoted sales price as of the time of the regular close of the New York Stock Exchange on the valuation date. Equity securities traded on the Nasdaq are valued in accordance with the Nasdaq Official Closing Price, which may not be the last sales price. If, on a particular day, an equity security does not trade, the mean between the bid and ask prices will be used, which approximates fair value. Equity securities listed on a foreign exchange are normally valued at the last quoted sales price on the valuation date. US government and agency securities are valued at the mean between the bid and ask prices, which approximates fair value.Open-end investment companies are valued at their published net asset value (NAV). Generally, other securities and assets for which market quotations are not readily available are valued at fair value as determined in good faith under the direction of the Trust’s Board of Trustees (Board). In determining whether market quotations are readily available or fair valuation will be used, various factors will be taken into consideration, such as market closures or suspension of trading in a security. Restricted securities are valued at fair value using methods approved by the Board.
Federal Income Taxes — No provision for federal income taxes has been made as the Series intends to continue to qualify for federal income tax purposes as a regulated investment company under Subchapter M of the Internal Revenue Code of 1986, as amended, and make the requisite distributions to shareholders. The Series evaluates tax positions taken or expected to be taken in the course of preparing the Series’ tax returns to determine whether the tax positions are“more-likely-than-not” of being sustained by the applicable tax authority. Tax positions not deemed to meet the“more-likely-than-not” threshold are recorded as a tax benefit or expense in the current year. Management has analyzed the Series’ tax positions taken or expected to be taken on the Series’ federal income tax returns through the year ended Dec. 31, 2019 and for all open tax years (years ended Dec. 31, 2016–Dec. 31, 2018), and has concluded that no provision for federal income tax is required in the Series’ financial statements. If applicable, the Series recognizes interest accrued on unrecognized tax benefits in interest expense and penalties in “Other” on the “Statement of operations.” During the year ended Dec. 31, 2019, the Series did not incur any interest or tax penalties.
Use of Estimates — The preparation of financial statements in conformity with US GAAP requires management to make estimates and assumptions that affect the fair value of investments, the reported amounts of assets and liabilities and disclosure of contingent assets and liabilities at the date of the financial statements, and the reported amounts of revenues and expenses during the reporting period. Actual results could differ from those estimates and the differences could be material.
Other — Expenses directly attributable to the Series are charged directly to the Series. Other expenses common to various funds within the Delaware Funds® by Macquarie (Delaware Funds) are generally allocated among such funds on the basis of average net assets. Management fees and certain other expenses are paid monthly. Security transactions are recorded on the date the securities are purchased or sold (trade date) for financial reporting purposes. Costs used in calculating realized gains and losses on the sale of investment securities are those of the specific securities sold. Dividend income is recorded on theex-dividend date and interest income is recorded on the accrual basis. Discounts and premiums on debt securities are accreted or amortized to interest income, respectively, over the lives of the respective securities using the effective interest method. Distributions received from investments in real estate investment trusts (REITs) are recorded as dividend income on theex-dividend date, subject to reclassification upon notice of the character of such distributions by the issuer. The Series may pay foreign capital gains taxes on certain foreign securities held, which are reported as components of realized losses for financial reporting purposes, whereas such components are treated as ordinary loss for federal income tax purposes. The Series declares and pays dividends from net investment income and distributions from net realized gain on investments, if any, following the close of the fiscal year. The Series may distribute more frequently, if necessary for tax purposes. Dividends and distributions, if any, are recorded on theex-dividend date.
Opportunity Series-13
Delaware VIP® Opportunity Series
Notes to financial statements (continued)
1. Significant Accounting Policies (continued)
The Series receives earnings credits from its custodian when positive cash balances are maintained, which may be used to offset custody fees. The expenses paid under this arrangement are included on the “Statement of operations” under “Custodian fees” with the corresponding expenses offset included under “Less expenses paid indirectly.” For the year ended Dec. 31, 2019, the Series earned $1,932 under this arrangement.
The Series receives earnings credits from its transfer agent when positive cash balances are maintained, which may be used to offset transfer agent fees. If the amount earned is greater than $1, the expenses paid under this arrangement are included on the “Statement of operations��� under “Dividend disbursing and transfer agent fees and expenses” with the corresponding expenses offset included under “Less expenses paid indirectly.” There were no such earnings credits for the year ended Dec. 31, 2019.
2. Investment Management, Administration Agreements, and Other Transactions with Affiliates
In accordance with the terms of its investment management agreement, effective Oct. 4, 2019, the Series pays Delaware Management Company (DMC), a series of Macquarie Investment Management Business Trust and the investment manager, an annual fee which is calculated daily and paid monthly at the rates of 0.75% on the first $500 million of average daily net assets of the Series, 0.70% on the next $500 million, 0.65% on the next $1.5 billion, and 0.60% on average daily net assets in excess of $2.5 billion. Prior to Oct. 4, 2019, the Series paid FIMCO, an annual fee which was calculated daily and paid monthly at the rates of 0.75% on the first $250 million of average daily net assets of the Series, 0.72% on the next $250 million, 0.69% on the next $250 million, 0.66% on the next $500 million, 0.64% on the next $500 million, 0.62% on the next $500 million, and 0.60% on average daily net assets in excess of $2.25 billion.
DMC has contractually agreed to waive all or a portion of its investment advisory fees and/or pay/reimburse expenses (excluding any acquired fund fees and expenses, taxes, interest, short sale dividend and interest expenses, brokerage fees, certain insurance costs, and nonroutine expenses or costs, including, but not limited to, those relating to reorganizations, litigation, conducting shareholder meetings, and liquidations), do not exceed 0.83% of the Series’ average daily net assets from Oct. 4, 2019 through Dec. 31, 2019.* These waivers and reimbursements may only be terminated by agreement of DMC and the Series. The waivers and reimbursements are accrued daily and received monthly.
Effective Oct. 4, 2019, DMC may permit its affiliates, Macquarie Investment Management Global Limited (MIMGL) and Macquarie Funds Management Hong Kong Limited (together, the “AffiliatedSub-Advisors”), to execute Series equity security trades on behalf of the Manager. The Manager may also seek quantitative support from MIMGL. Although the AffiliatedSub-Advisors serve assub-advisors, DMC has ultimate responsibility for all investment advisory services. For these services, DMC, not the Series, may pay each AffiliatedSub-Advisor a portion of its investment management fee.
Effective Oct. 4, 2019, Delaware Investments Fund Services Company (DIFSC), an affiliate of DMC, provides fund accounting and financial administration oversight services to the Series. For these services, DIFSC’s fees are calculated daily and paid monthly based on the aggregate daily net assets of all funds within the Delaware Funds at the following annual rates: 0.00475% of the first $35 billion; 0.0040% of the next $10 billion; and 0.0025% of aggregate average daily net assets in excess of $45 billion (Total Fee). Each fund in the Delaware Funds pays a minimum of $4,000, which, in aggregate, is subtracted from the Total Fee. Each fund then pays its portion of the remainder of the Total Fee on a relative NAV basis. This amount is included on the “Statement of operations” under “Accounting and administration expenses.” For the period Oct. 4, 2019 through year ended Dec. 31, 2019, the Series was charged $1,656 for these services. Prior to Oct. 4, 2019, there were no fund accounting and financial administration oversight services for the Series.
Effective Oct. 4, 2019, DIFSC is also the transfer agent and dividend disbursing agent of the Series. For these services, DIFSC’s fees are calculated daily and paid monthly at the annual rate of 0.0075% of the Series’ average daily net assets. This amount is included on the “Statement of operations” under “Dividend disbursing and transfer agent fees and expenses.” For the period Oct. 4, 2019 through year ended Dec. 31, 2019, the Series was charged $1,459 for these services. Pursuant to asub-transfer agency agreement between DIFSC and BNY Mellon Investment Servicing (US) Inc. (BNYMIS), BNYMIS provides certainsub-transfer agency services to the Series.Sub-transfer agency fees are paid directly by the Series and are also included on the “Statement of operations” under “Dividend disbursing and transfer agent fees and expenses.” The fees that are calculated daily and paid as invoices are received on a monthly or quarterly basis. Prior to Oct. 4, 2019, Foresters Investor Services, Inc. was the transfer agent of the Series.
As provided in the investment management agreement, the Series bears a portion of the cost of resources shared with DMC, including the cost of internal personnel of DMC and/or its affiliates that provide legal, tax, and regulatory reporting services to the Series. For the period Oct. 4, 2019 through year ended Dec. 31, 2019, the Series was charged $398 for internal legal, tax, and regulatory reporting services provided by DMC and/or its affiliates’ employees. These amounts are included on the “Statement of operations” under “Legal fees.”
Trustees’ fees include expenses accrued by the Series for each Trustee’s retainer and meeting fees. Certain officers of DMC, DIFSC, and DDLP are officers and/or Trustees of the Trust. These officers and Trustees are paid no compensation by the Series.
Opportunity Series-14
Delaware VIP® Opportunity Series
Notes to financial statements (continued)
2. Investment Management, Administration Agreements, and Other Transactions with Affiliates (continued)
In addition to the management fees and other expenses of the Series, the Series indirectly bears the investment management fees and other expenses of the investment companies (Underlying Funds) in which it invests. The amount of these fees and expenses incurred indirectly by the Series will vary based upon the expense and fee levels of the Underlying Funds and the number of shares that are owned of the Underlying Funds at different times.
Cross trades for the year ended Dec. 31, 2019 were executed by the Series pursuant to procedures adopted by the Board designed to ensure compliance with Rule17a-7 under the 1940 Act. Cross trading is the buying or selling of portfolio securities between funds of investment companies, or between a fund of an investment company and another entity, that are or could be considered affiliates by virtue of having a common investment advisor (or affiliated investment advisors), common directors/ trustees and/or common officers. At its regularly scheduled meetings, the Board reviews such transactions for compliance with the procedures adopted by the Board. Pursuant to these procedures, for the year ended Dec. 31, 2019, the Series engaged in Rule17a-7 securities purchases of $2,994,856 and securities sales of $2,500,859, which resulted in net realized gains of $324,118.
*The aggregate contractual waiver period covering this report is from Oct. 4, 2019 through Oct. 31, 2021.
3. Investments
For the year ended Dec. 31, 2019, the Series made purchases and sales of investment securities other than short-term investments as follows:
| | | | |
Purchases | | $ | 92,609,735 | |
Sales | | | 92,415,957 | |
The tax cost of investments includes adjustments to net unrealized appreciation (depreciation) which may not necessarily be the final tax cost basis adjustments, but approximate the tax basis unrealized gains and losses that may be realized and distributed to shareholders. At Dec. 31, 2019, the cost and unrealized appreciation (depreciation) of investments for federal income tax purposes for the Series were as follows:
| | | | | | |
| | | Aggregate | | Aggregate | | |
| Cost of | | Unrealized | | Unrealized | | Net Unrealized |
Investments | | Appreciation of Investments | | Depreciation of Investments | | Appreciation of Investments |
$74,718,878 | | $8,681,019 | | $(822,302) | | $7,858,717 |
US GAAP defines fair value as the price that the Series would receive to sell an asset or pay to transfer a liability in an orderly transaction between market participants at the measurement date under current market conditions. A three-level hierarchy for fair value measurements has been established based upon the transparency of inputs to the valuation of an asset or liability. Inputs may be observable or unobservable and refer broadly to the assumptions that market participants would use in pricing the asset or liability. Observable inputs reflect the assumptions that market participants would use in pricing the asset or liability based on market data obtained from sources independent of the reporting entity. Unobservable inputs reflect the reporting entity’s own assumptions about the assumptions that market participants would use in pricing the asset or liability based on the best information available under the circumstances. The Series’ investment in its entirety is assigned a level based upon the observability of the inputs which are significant to the overall valuation. The three-level hierarchy of inputs is summarized below.
| | | | |
| Level 1 | | – | | Inputs are quoted prices in active markets for identical investments. (Examples: equity securities,open-end investment companies, futures contracts, and exchange-traded options contracts) |
| Level 2 | | – | | Other observable inputs, including, but not limited to: quoted prices for similar assets or liabilities in markets that are active, quoted prices for identical or similar assets or liabilities in markets that are not active, inputs other than quoted prices that are observable for the assets or liabilities (such as interest rates, yield curves, volatilities, prepayment speeds, loss severities, credit risks, and default rates) or other market-corroborated inputs. (Examples: debt securities, government securities, swap contracts, foreign currency exchange contracts, foreign securities utilizing international fair value pricing, broker-quoted securities, and fair valued securities) |
| Level 3 | | – | | Significant unobservable inputs, including the Series’ own assumptions used to determine the fair value of investments. (Examples: broker-quoted securities and fair valued securities) |
Level 3 investments are valued using significant unobservable inputs. The Series may also use an income-based valuation approach in which the anticipated future cash flows of the investment are discounted to calculate fair value. Discounts may also be applied due to the nature or duration of any restrictions on the disposition of the investments. Valuations may also be based upon current market prices of securities that are comparable in coupon, rating, maturity, and industry. The derived value of a Level 3 investment may not represent the value which is received upon disposition and this could impact the results of operations.
Opportunity Series-15
Delaware VIP® Opportunity Series
Notes to financial statements (continued)
3. Investments (continued)
The following table summarizes the valuation of the Series’ investments by fair value hierarchy levels as of Dec. 31, 2019:
| | | | |
| Securities | | Level 1 | |
Assets: | | | | |
Common Stock | | $ | 80,737,620 | |
Short-Term Investments | | | 1,839,975 | |
| | | | |
Total Value of Securities | | $ | 82,577,595 | |
| | | | |
During the year ended Dec. 31, 2019, there were no transfers between Level 1 investments, Level 2 investments, or Level 3 investments that had a significant impact to the Series. The Series’ policy is to recognize transfers between levels based on fair value at the beginning of the reporting period.
A reconciliation of Level 3 investments is presented when the Series has a significant amount of Level 3 investments at the beginning, interim, or end of the period in relation to net assets. During the year ended Dec. 31, 2019, there were no transfers Level 3 investments.
4. Dividend and Distribution Information
Income and long-term capital gain distributions are determined in accordance with federal income tax regulations, which may differ from US GAAP. Additionally, distributions from net short-term gains on sales of investment securities are treated as ordinary income for federal income tax purposes. The tax character of dividends and distributions paid during the years ended Dec. 31, 2019 and 2018 was as follows:
| | | | | | | | |
| | | Year ended | |
| | | 12/31/19 | | | 12/31/18 | |
Ordinary income | | $ | 941,032 | | | $ | 360,672 | |
Long-term capital gain | | | 1,891,728 | | | | 903,402 | |
| | | | | | | | |
Total | | $ | 2,832,760 | | | $ | 1,264,074 | |
| | | | | | | | |
5. Components of Net Assets on a Tax Basis
As of Dec. 31, 2019, the components of net assets on a tax basis were as follows:
| | | | |
Shares of beneficial interest | | $ | 61,907,656 | |
Undistributed ordinary income | | | 3,172,725 | |
Undistributed long-term capital gains | | | 9,402,329 | |
Net unrealized appreciation on investments | | | 7,858,717 | |
| | | | |
Net assets | | $ | 82,341,427 | |
| | | | |
The differences between the book basis and tax basis components of net assets are primarily attributable to tax deferral of losses on wash sales.
6. Capital Shares
Transactions in capital shares were as follows:
| | | | | | | | |
| | | Year ended | |
| | | 12/31/19 | | | 12/31/18 | |
Shares sold: | | | | | | | | |
Standard Class | | | 319,545 | | | | 580,446 | |
Shares issued upon reinvestment of dividends and distributions: | | | | | | | | |
Standard Class | | | 164,986 | | | | 70,383 | |
| | | | | | | | |
| | | 484,531 | | | | 650,829 | |
| | | | | | | | |
Shares redeemed: | | | | | | | | |
Standard Class | | | (382,909 | ) | | | (260,692 | ) |
| | | | | | | | |
Net increase | | | 101,622 | | | | 390,137 | |
| | | | | | | | |
7. Line of Credit
On Nov. 4, 2019, the Series, along with certain other funds in the Delaware Funds (Participants), is a participant in a $250,000,000 revolving line of credit intended to be used for temporary or emergency purposes as an additional source of liquidity to fund redemptions of investor shares. Under the agreement,
Opportunity Series-16
Delaware VIP® Opportunity Series
Notes to financial statements (continued)
7. Line of Credit (continued)
the Participants are charged an annual commitment fee of 0.15%, which is allocated across the Participants based on a weighted average of the respective net assets of each Participant. The Participants are permitted to borrow up to a maximum ofone-third of their net assets under the agreement. Each Participant is individually, and not jointly, liable for its particular advances, if any, under the line of credit. The line of credit available under the agreement expires on Nov. 2, 2020.
The Series had no amounts outstanding as of Dec. 31, 2019, or at any time during the period then ended.
8. Securities Lending
Effective Oct. 4, 2019, the Series, along with other funds in the Delaware Funds, may lend its securities pursuant to a security lending agreement (Lending Agreement) with The Bank of New York Mellon (BNY Mellon). At the time a security is loaned, the borrower must post collateral equal to the required percentage of the market value of the loaned security, including any accrued interest. The required percentage is: (1) 102% with respect to US securities and foreign securities that are denominated and payable in US dollars; and (2) 105% with respect to foreign securities. With respect to each loan, if on any business day, the aggregate market value of securities collateral plus cash collateral held is less than the aggregate market value of the securities which are the subject of such loan, the borrower will be notified to provide additional collateral by the end of the following business day, which, together with the collateral already held, will be not less than the applicable initial collateral requirements for such security loan. If the aggregate market value of securities collateral and cash collateral held with respect to a security loan exceeds the applicable initial collateral requirement, upon the request of the borrower, BNY Mellon must return enough collateral to the borrower by the end of the following business day to reduce the value of the remaining collateral to the applicable initial collateral requirement for such security loan. As a result of the foregoing, the value of the collateral held with respect to a loaned security on any particular day, may be more or less than the value of the security on loan. The collateral percentage with respect to the market value of the loaned security is determined by the security lending agent.
Cash collateral received by each series of the Trust is generally invested in a series of individual separate accounts, each corresponding to a series. The investment guidelines permit each separate account to hold certain securities that would be considered eligible securities for a money market fund. Cash collateral received is generally invested in government securities; certain obligations issued by government sponsored enterprises; repurchase agreements collateralized by US Treasury securities; obligations issued by the central government of any Organization for Economic Cooperation and Development (OECD) country or its agencies, instrumentalities, or establishments; obligations of supranational organizations; commercial paper, notes, bonds, and other debt obligations; certificates of deposit, time deposits, and other bank obligations; and asset-backed securities. The Series can also accept US government securities and letters of credit(non-cash collateral) in connection with securities loans.
In the event of default or bankruptcy by the lending agent, realization and/or retention of the collateral may be subject to legal proceedings. In the event the borrower fails to return loaned securities and the collateral received is insufficient to cover the value of the loaned securities and provided such collateral shortfall is not the result of investment losses, the lending agent has agreed to pay the amount of the shortfall to the Series or, at the discretion of the lending agent, replace the loaned securities. The Series continues to record dividends or interest, as applicable, on the securities loaned and is subject to changes in value of the securities loaned that may occur during the term of the loan. The Series has the right under the Lending Agreement to recover the securities from the borrower on demand. With respect to security loans collateralized bynon-cash collateral, the Series receives loan premiums paid by the borrower. With respect to security loans collateralized by cash collateral, the earnings from the collateral investments are shared among the Series, the security lending agent, and the borrower. The Series records security lending income net of allocations to the security lending agent and the borrower.
The Series may incur investment losses as a result of investing securities lending collateral. This could occur if an investment in the collateral investment account defaulted or became impaired. Under those circumstances, the value of the Series’ cash collateral account may be less than the amount the Series would be required to return to the borrowers of the securities and the Series would be required to make up for this shortfall.
During the year ended Dec. 31, 2019, the Series had no securities out on loan.
9. Credit and Market Risk
The Series invests a significant portion of its assets in small- andmid-sized companies and may be subject to certain risks associated with ownership of securities of such companies. Investments in small- ormid-sized companies may be more volatile than investments in larger companies for a number of reasons, which include more limited financial resources or a dependence on narrow product lines.
The Series invests in REITs and is subject to the risks associated with that industry. If the Series holds real estate directly or receives rental income directly from real estate holdings, its tax status as a regulated investment company may be jeopardized. There were no direct real estate holdings during the year ended Dec. 31, 2019. The Series’ REIT holdings are also affected by interest rate changes, particularly if the REITs it holds use floating rate debt to finance their ongoing operations.
Opportunity Series-17
Delaware VIP® Opportunity Series
Notes to financial statements (continued)
9. Credit and Market Risk (continued)
The Series may invest up to 10% of its net assets in illiquid securities, which may include securities with contractual restrictions on resale, securities exempt from registration under Rule 144A, promulgated under the Securities Act of 1933, as amended, and other securities which may not be readily marketable. The relative illiquidity of these securities may impair the Series from disposing of them in a timely manner and at a fair price when it is necessary or desirable to do so. While maintaining oversight, the Board has delegated to DMC theday-to-day functions of determining whether individual securities are liquid for purposes of the Series’ limitation on investments in illiquid securities. Securities eligible for resale pursuant to Rule 144A, which are determined to be liquid, are not subject to the Series’ 10% limit on investments in illiquid securities. As of Dec. 31, 2019, there were no Rule 144A securities held by the Fund.
10. Contractual Obligations
The Series enters into contracts in the normal course of business that contain a variety of indemnifications. The Series’ maximum exposure under these arrangements is unknown. However, the Series has not had prior claims or losses pursuant to these contracts. Management has reviewed the Series’ existing contracts and expects the risk of loss to be remote.
11. Recent Accounting Pronouncements
In August 2018, the FASB issued an Accounting Standard Update (ASU), ASU2018-13, which changes certain fair value measurement disclosure requirements. The ASU2018-13, in addition to other modifications and additions, removes the requirement to disclose the amount and reasons for transfers between Level 1 and Level 2 of the fair value hierarchy, the policy for the timing of transfers between levels and the valuation process for Level 3 fair value measurements. The ASU2018-13 is effective for fiscal years, and interim periods within those fiscal years, beginning after Dec. 15, 2019. At this time, management is evaluating the implications of these changes on the financial statements.
12. Subsequent Events
Management has determined that no material events or transactions occurred subsequent to Dec. 31, 2019, that would require recognition or disclosure in the Series’ financial statements.
Opportunity Series-18
Delaware VIP® Trust — Delaware VIP Opportunity Series
Report of independent registered public accounting firm
To the Board of Trustees of Delaware VIP® Trust and Shareholders of Delaware VIP Opportunity Series
Opinion on the Financial Statements
We have audited the accompanying statement of assets and liabilities, including the schedule of investments, of Delaware VIP Opportunity Series (one of the series constituting Delaware VIP® Trust, referred to hereafter as the “Series”) as of December 31, 2019, the related statements of operations and changes in net assets, including the related notes, and the financial highlights for the year then ended (collectively referred to as the “financial statements”). In our opinion, the financial statements present fairly, in all material respects, the financial position of the Series as of December 31, 2019, the results of its operations, changes in its net assets, and the financial highlights for the year then ended in conformity with accounting principles generally accepted in the United States of America.
The financial statements of First Investors Life Series Opportunity Fund (subsequent to reorganization, known as Delaware VIP Opportunity Series) as of and for the year ended December 31, 2018 and the financial highlights for each of the periods ended on or prior to December 31, 2018 (not presented herein, other than the statement of changes in net assets and the financial highlights) were audited by other auditors whose report dated February 26, 2019 expressed an unqualified opinion on those financial statements and financial highlights.
Basis for Opinion
These financial statements are the responsibility of the Series’ management. Our responsibility is to express an opinion on the Series’ financial statements based on our audit. We are a public accounting firm registered with the Public Company Accounting Oversight Board (United States) (PCAOB) and are required to be independent with respect to the Series in accordance with the U.S. federal securities laws and the applicable rules and regulations of the Securities and Exchange Commission and the PCAOB.
We conducted our audit of these financial statements in accordance with the standards of the PCAOB. Those standards require that we plan and perform the audit to obtain reasonable assurance about whether the financial statements are free of material misstatement, whether due to error or fraud.
Our audit included performing procedures to assess the risks of material misstatement of the financial statements, whether due to error or fraud, and performing procedures that respond to those risks. Such procedures included examining, on a test basis, evidence regarding the amounts and disclosures in the financial statements. Our audit also included evaluating the accounting principles used and significant estimates made by management, as well as evaluating the overall presentation of the financial statements. Our procedures included confirmation of securities owned as of December 31, 2019 by correspondence with the custodian, transfer agents and brokers; when replies were not received from brokers, we performed other auditing procedures. We believe that our audit provides a reasonable basis for our opinion.
/s/PricewaterhouseCoopers LLP
Philadelphia, Pennsylvania
February 28, 2020
We have served as the auditor of one or more investment companies in Delaware Funds® by Macquarie since 2010.
Opportunity Series-19
Delaware VIP® Trust — Delaware VIP Opportunity Series
Other Series information (Unaudited)
Tax Information
All disclosures are based on financial information available as of the date of this annual report and, accordingly are subject to change. For any and all items requiring reporting, it is the intention of the Series to report the maximum amount permitted under the Internal Revenue Code and the regulations thereunder.
For the year ended Dec. 31, 2019, the Series reports distributions paid during the year as follows:
| | | | | | |
| | | (A)
Long-Term
Capital Gain
Distributions
Tax Basis | | (B)
Ordinary Income
Distributions
(Tax Basis) | | Total
Distributions
(Tax Basis) |
| | 66.78% | | 33.22% | | 100.00% |
(A) and (B) are based on a percentage of the Series’ total distributions.
Opportunity Series-20
Delaware Funds® by Macquarie
Board of trustees / directors and officers addendum
A mutual fund is governed by a Board of Trustees/Directors (“Trustees”), which has oversight responsibility for the management of a fund’s business affairs. Trustees establish procedures and oversee and review the performance of the investment manager, the distributor, and others who perform services for the fund. The independent fund trustees, in particular, are advocates for shareholder interests. Each trustee has served in that capacity since he or she was elected to or appointed to the Board of Trustees, and will continue to serve until his or her retirement or the election of a new trustee in his or her place. The following is a list of the Trustees and Officers with certain background and related information.
| | | | | | | | | | |
Name, Address, and Birth Date | | Position(s) Held with Fund(s) | | Length of Time Served | | Principal Occupation(s) During the Past Five Years | | Number of Portfolios in Fund Complex Overseen by Trustee or Officer | | Other Directorships Held by Trustee or Officer |
| INTERESTED TRUSTEE | | | | | | | | | | |
| | | | | |
Shawn K. Lytle1 2005 Market Street Philadelphia, PA 19103 February 1970 | | President, Chief Executive Officer, and Trustee | | President and Chief Executive Officer since August 2015 Trustee since September 2015 | | President — Macquarie Investment Management2 (June 2015-Present) Regional Head of Americas — UBS Global Asset Management (April 2010-May 2015) | | 95 | | Trustee — UBS Relationship Funds, SMA Relationship Trust, and UBS Funds (May 2010–April 2015) |
| INDEPENDENT TRUSTEES | | | | | | | | | | |
| | | | | |
Thomas L. Bennett 2005 Market Street Philadelphia, PA 19103 October 1947 | | Chair and Trustee | | Trustee since March 2005 Chair since March 2015 | | Private Investor (March 2004–Present) | | 95 | | None |
Jerome D. Abernathy 2005 Market Street Philadelphia, PA 19103 July 1959 | | Trustee | | Since January 2019 | | Managing Member, Stonebrook Capital Management, LLC (financial technology: macro factors and databases) (January 1993–Present) | | 95 | | None |
Ann D. Borowiec 2005 Market Street Philadelphia, PA 19103 November 1958 | | Trustee | | Since March 2015 | | Chief Executive Officer, Private Wealth Management (2011–2013) and Market Manager, New Jersey Private Bank (2005–2011) — J.P. Morgan Chase & Co. | | 95 | | Director — Banco Santander International (October 2016–December 2019) Director — Santander Bank, N.A. (December 2016–December 2019) |
Joseph W. Chow 2005 Market Street Philadelphia, PA 19103 January 1953 | | Trustee | | Since January 2013 | | Private Investor (April 2011–Present) | | 95 | | Director and Audit Committee Member — Hercules Technology Growth Capital, Inc. (July 2004–July 2014) |
Opportunity Series-21
| | | | | | | | | | |
Name, Address, and Birth Date | | Position(s) Held with Fund(s) | | Length of Time Served | | Principal Occupation(s) During the Past Five Years | | Number of Portfolios in Fund Complex Overseen by Trustee or Officer | | Other Directorships Held by Trustee or Officer |
John A. Fry 2005 Market Street Philadelphia, PA 19103 May 1960 | | Trustee | | Since January 2001 | | President — Drexel University (August 2010–Present) President — Franklin & Marshall College (July 2002–July 2010) | | 95 | | Director; Compensation Committee and Governance Committee Member — Community Health Systems (May 2004–Present) Director — Drexel Morgan & Co. (2015–Present) Director and Audit Committee Member — vTv Therapeutics LLC (2017–Present) Director and Audit Committee Member — FS Credit Real Estate Income Trust, Inc. (2018–Present) Director — Federal Reserve Bank of Philadelphia (January 2020–Present) |
Lucinda S. Landreth 2005 Market Street Philadelphia, PA 19103 June 1947 | | Trustee | | Since March 2005 | | Private Investor (2004–Present) | | 95 | | None |
Frances A. Sevilla-Sacasa 2005 Market Street Philadelphia, PA 19103 January 1956 | | Trustee | | Since September 2011 | | Private Investor (January 2017-Present) Chief Executive Officer — Banco Itaú International (April 2012–December 2016) Executive Advisor to Dean (August 2011–March 2012) and Interim Dean (January 2011–July 2011) — University of Miami School of Business Administration President — U.S. Trust, Bank of America Private Wealth Management (Private Banking) (July 2007–December 2008) | | 95 | | Trust Manager and Audit Committee Chair — Camden Property Trust (August 2011–Present) Director; Strategic Planning and Reserves Committee and Nominating and Governance Committee Member — Callon Petroleum Company (December 2019–Present) Director; Audit Committee Member — Carrizo Oil & Gas, Inc. (March 2018–December 2019) |
Thomas K. Whitford 2005 Market Street Philadelphia, PA 19103 March 1956 | | Trustee | | Since January 2013 | | Vice Chairman (2010–April 2013) — PNC Financial Services Group | | 95 | | Director — HSBC North America Holdings Inc. (December 2013-Present) Director — HSBC USA Inc. (July 2014-Present) Director — HSBC Bank USA, National Association (July 2014-March 2017) Director — HSBC Finance Corporation (December 2013-April 2018) |
Opportunity Series-22
| | | | | | | | | | |
Name, Address, and Birth Date | | Position(s) Held with Fund(s) | | Length of Time Served | | Principal Occupation(s) During the Past Five Years | | Number of Portfolios in Fund Complex Overseen by Trustee or Officer | | Other Directorships Held by Trustee or Officer |
Christianna Wood 2005 Market Street Philadelphia, PA 19103 March 1956 | | Trustee | | Since January 2019 | | Chief Executive Officer and President — Gore Creek Capital, Ltd. (August 2009–Present) | | 95 | | Director; Finance Committee and Audit Committee Member — H&R Block Corporation (July 2008–Present) Director; Chair of Investments Committee and Audit Committee Member — Grange Insurance (2013–Present) Trustee; Chair of Nominating and Governance Committee and Audit Committee Member — The Merger Fund (2013–Present), The Merger Fund VL (2013–Present); WCM Alternatives: Event-Driven Fund (2013–Present), and WCM Alternatives: Credit Event Fund (December 2017–Present) Director; Chair of Governance Committee and Audit Committee Member — International Securities Exchange (2010–2016) |
Janet L. Yeomans 2005 Market Street Philadelphia, PA 19103 July 1948 | | Trustee | | Since April 1999 | | Vice President and Treasurer (January 2006–July 2012), Vice President — Mergers & Acquisitions (January 2003–January 2006), and Vice President and Treasurer (July 1995–January 2003) — 3M Company | | 95 | | Director; Personnel and Compensation Committee Chair; Member of Nominating, Investments, and Audit Committees for various periods throughout directorship — Okabena Company (2009-2017) |
Opportunity Series-23
| | | | | | | | | | |
Name, Address, and Birth Date | | Position(s) Held with Fund(s) | | Length of Time Served | | Principal Occupation(s) During the Past Five Years | | Number of Portfolios in Fund Complex Overseen by Trustee or Officer | | Other Directorships Held by Trustee or Officer |
| OFFICERS | | | | | | | | | | |
| | | | | |
David F. Connor 2005 Market Street Philadelphia, PA 19103 December 1963 | | Senior Vice President, General Counsel, and Secretary | | Senior Vice President, since May 2013; General Counsel since May 2015; Secretary since October 2005 | | David F. Connor has served in various capacities at different times at Macquarie Investment Management. | | 95 | | None3 |
Daniel V. Geatens 2005 Market Street Philadelphia, PA 19103 October 1972 | | Vice President and Treasurer | | Vice President and Treasurer since October 2007 | | Daniel V. Geatens has served in various capacities at different times at Macquarie Investment Management. | | 95 | | None3 |
Richard Salus 2005 Market Street Philadelphia, PA 19103 October 1963 | | Senior Vice President and Chief Financial Officer | | Senior Vice President and Chief Financial Officer since November 2006 | | Richard Salus has served in various capacities at different times at Macquarie Investment Management. | | 95 | | None |
| 1 | Shawn K. Lytle is considered to be an “Interested Trustee” because he is an executive officer of the Fund’s(s’) investment advisor. |
| 2 | Macquarie Investment Management is the marketing name for Macquarie Management Holdings, Inc. and its subsidiaries, including the Fund’s(s’) investment advisor, principal underwriter, and its transfer agent. |
| 3 | David F. Connor and Daniel V. Geatens serve in similar capacities for the six portfolios of the Optimum Fund Trust, which have the same investment advisor, principal underwriter, and transfer agent as the registrant. Mr. Geatens also serves as the Chief Financial Officer of the Optimum Fund Trust and he is the Chief Financial Officer and Treasurer for Macquarie Global Infrastructure Total Return Fund Inc. |
The Statement of Additional Information for the Fund(s) includes additional information about the Trustees and Officers and is available, without charge, upon request by calling 800523-1918.
Opportunity Series-24
| | | | |
| | The Series files its complete schedule of portfolio holdings with the Securities and Exchange Commission (SEC) for the first and third quarters of each fiscal year on FormN-Q or FormN-PORT (available for filings after March 31, 2019). The Series’ FormsN-Q or FormsN-PORT, as well as a description of the policies and procedures that the Series uses to determine how to vote proxies (if any) relating to portfolio securities, are available without charge (i) upon request, by calling 800523-1918; and (ii) on the SEC’s website at sec.gov. In addition, a description of the policies and procedures that the Series uses to determine how to vote proxies (if any) relating to portfolio securities and the Schedule of Investments included in the Series’ most recent FormN-Q or FormN-PORT are available without charge on the Series’ website at delawarefunds.com/vip/literature. The Series’ FormsN-Q and FormsN-PORT may be reviewed and copied at the SEC’s Public Reference Room in Washington, D.C.; information on the operation of the Public Reference Room may be obtained by calling 800SEC-0330. Information (if any) regarding how the Series voted proxies relating to portfolio securities during the most recently disclosed12-month period ended June 30 is available without charge (i) through the Series’ website at delawarefunds.com/proxy; and (ii) on the SEC’s website at sec.gov. | | |
| | |
| AR-VIPOP 22499 (2/20) (1076649) | | Opportunity Series-25 |

Delaware VIP® Trust
Delaware VIP Special Situations Series
(formerly, First Investors Life Series Special Situations Fund)
December 31, 2019
Beginning on or about June 1, 2021, as permitted by regulations adopted by the Securities and Exchange Commission, paper copies of your Series’ shareholder reports will no longer be sent to you by mail, unless you specifically request them from the Series or from your financial intermediary, such as a broker/dealer, bank, or insurance company. Instead, you will be notified by mail each time a report is posted on the website and provided with a link to access the report.
If you already elected to receive shareholder reports electronically, you will not be affected by this change and you do not need to take any action.
You may elect to receive paper copies of all future shareholder reports free of charge. You can inform the Series that you wish to continue receiving paper copies of your shareholder reports by contacting us at 800523-1918. If you own these shares through a financial intermediary, you may contact your financial intermediary to elect to continue to receive paper copies of your shareholder reports. Your election to receive reports in paper will apply to all funds held with the Delaware Funds® by Macquarie or your financial intermediary.

Table of contents
Other than Macquarie Bank Limited (MBL), none of the entities noted are authorized deposit-taking institutions for the purposes of the Banking Act 1959 (Commonwealth of Australia). The obligations of these entities do not represent deposits or other liabilities of MBL. MBL does not guarantee or otherwise provide assurance in respect of the obligations of these entities, unless noted otherwise. The Series is governed by US laws and regulations.
Unless otherwise noted, views expressed herein are current as of Dec. 31, 2019, and subject to change for events occurring after such date.
The Series is not FDIC insured and is not guaranteed. It is possible to lose the principal amount invested.
Advisory services provided by Delaware Management Company, a series of Macquarie Investment Management Business Trust (MIMBT), a US registered investment advisor.
The Series is distributed byDelaware Distributors, L.P.(DDLP), an affiliate of MIMBT and Macquarie Group Limited. Macquarie Investment Management (MIM) is the marketing name for certain companies comprising the asset management division of Macquarie Group Limited and its subsidiaries and affiliates worldwide.
This material may be used in conjunction with the offering of shares in Delaware VIP® Special Situations Series only if preceded or accompanied by the Series’ current prospectus or the summary prospectus.
© 2020 Macquarie Management Holdings, Inc.
All third-party marks cited are the property of their respective owners.
| | |
| Delaware VIP® Trust — Delaware VIP Special Situations Series | | |
| Portfolio management review | | January 7, 2020 (Unaudited) |
The investment objective of the Series is to seek long-term growth of capital.
Effective after the close of business on Oct. 4, 2019, Delaware Management Company (DMC or Manager), a series of Macquarie Investment Management Business Trust (MIMBT), serves as the investment manager for the Series.* During the period after the close of business on Oct. 4, 2019 to Dec. 31, 2019, the Manager repositioned the portfolio in accordance with Series’ investment objective and principal investment strategies, as described in the prospectus. The investment objective is the same and its principal investment strategies are the same or similar to those of the corresponding Life Series.
For the fiscal year ended Dec. 31, 2019, Delaware VIP Special Situations Series (the “Series”) Standard Class shares gained 20.36%. This figure reflects all dividends reinvested. The Series’ benchmark, the Russell 2000® Value Index, gained 22.39% for the same period. The Series changed its broad-based securities index to the Russell 2000 Value Index as of Oct. 4, 2019. The Series had previously changed its broad-based securities index to the MSCI USA Small Cap Value Index as of Jan. 31, 2019. In each case the Series elected to use the new index because it more closely reflects the Series’ investment strategies.
Small-cap value stocks posted positive performance during the year ended Dec. 31, 2019. During the year, growth companies outperformed value companies across the US market cap spectrum. The performance disparity between value companies and growth companies was significant insmall-cap equities throughout the year as the Russell 2000 Value Index gained 22.39% while the Russell 2000® Growth Index rose 28.48%.
Sector-level performance within the Series’ benchmark was strong during the year as each sector appreciated by more than 10% except for the energy sector, which declined by more than 10%. The strongest-performing sectors of the benchmark were technology, transportation, and capital spending, each of which advanced more than 30% during the year. The business services, real estate investment trusts (REITs), basic industry, and financial services sectors in the benchmark outperformed the benchmark’s 22.39% return. During the year, the traditionally defensive healthcare, consumer staples, and utilities sectors lagged. Higher-quality companies within the benchmark, those companies with higher returns on equity (ROE) and lowerprice-to-earnings (P/E) ratios, outperformed their lower-quality counterparts during the year.
The gross domestic product (GDP) growth rate slowed but remained positive during the year. The unemployment rate remained at historically low levels with a December reading of 3.5%, while wage growth was positive. The Federal Reserve reduced the federal funds rate in the second half of the year to support economic growth. The Conference Board Consumer Confidence Index® (1985=100, SA) was at historically high levels over the summer, peaking in August, and then declining month over month to settle at 126.5 for December, which was well above long-term averages. (Source: Bloomberg.)
Foresters Investment Management Company, Inc. (FIMCO) managed the Series from Jan. 1, 2019 to Oct. 4, 2019, when the management of the Series transitioned to DMC. The following is a discussion about Series performance during that period ended Oct. 4, 2019:
During the reporting period, the Series’ absolute performance was mainly attributable to investments in financials, information technology and industrials. In financials, the Series’ investments inSterling Bancorp, which executed on balance sheet restructuring, andAmerican Financial Group Inc., which continued its steady performance and capital returns, combined to drive performance. In information technology,Perficient Inc., helped by solid organic growth and stronger margins, andPDF Solutions Inc., helped by new product launches, were the main drivers of performance. Finally, in industrials,SPX Corp.benefited from solid growth in its less cyclical lines of business.
During the reporting period, the Series underperformed the benchmark primarily due to underweights in the real estate and financial sectors. In the latter, the Series’ underweight to thrift institutions hurt relative performance, as lower interest rates aided the industry. In the real estate sector, an underweight to healthcare REITs was the largest source of relative underperformance.
*On April 6, 2019, FIMCO, the investment adviser to the First Investors Funds, entered into an agreement with Macquarie Management Holdings, Inc. (MMHI), whereby MMHI, on behalf of its affiliate DMC, would acquire FIMCO’s asset management business (the “Transaction”). In connection with the Transaction, the Board of Trustees of the First Investors Trusts and the First Investors Fund shareholders approved, pursuant to an Agreement and Plan of Reorganization (the “Agreement”), the transfer of all assets and liabilities of each First Investors Fund to a corresponding, newly formed fund in the Delaware Funds® by Macquarie family of funds. The Transaction closed on Oct. 4, 2019.
Unless otherwise noted, views expressed herein are current as of Dec. 31, 2019, and subject to change.
Special Situations Series-1
Delaware VIP® Trust — Delaware VIP Special Situations Series
Performance summary (Unaudited)
The performance quoted represents past performance and does not guarantee future results. Investment return and principal value of an investment will fluctuate so that shares, when redeemed, may be worth more or less than their original cost. Current performance may be lower or higher than the performance quoted.
Carefully consider the Series’ investment objectives, risk factors, charges, and expenses before investing. This and other information can be found in the Series’ prospectus and its summary prospectus, which may be obtained by visiting delawarefunds.com/vip/literature or calling 800523-1918. Investors should read the prospectus and the summary prospectus carefully before investing.
| | | | | | | | | | | | | | | | | | |
| Delaware VIP Special Situations Series | | | | | | | | | |
| Average annual total returns | | | | | | | | | |
| For periods ended December 31, 2019 | | 1 year | | | 3 year | | | 5 year | | | 10 year | | | Lifetime |
Standard Class shares (commenced operations on Nov. 9, 1987) | | | +20.36% | | | | +5.89% | | | | +6.52% | | | | +10.51% | | | – |
| | | | | | | | | | | | | | | | | | |
Russell 2000 Value Index (current benchmark) | | | +22.39% | | | | +4.77% | | | | +6.99% | | | | +10.56% | | | – |
| | | | | | | | | | | | | | | | | | |
MSCI USA Small Cap Value Index (former benchmark) | | | +22.92% | | | | +5.90% | | | | +7.23% | | | | +11.67% | | | – |
| | | | | | | | | | | | | | | | | | |
Returns reflect the reinvestment of all distributions. Please see page 3 for a description of the indices.
As described in the Series’ most recent prospectus, the net expense ratio for Standard Class shares of the Series was 0.80%, while total operating expenses for Standard Class shares were 0.83%. The management fee for Standard Class shares was 0.75%.The Series’ investment manager, Delaware Management Company (Manager), has contractually agreed to waive all or a portion of its investment advisory fees and/or pay/reimburse expenses (excluding any12b-1 fees, acquired fund fees and expenses, taxes, interest, short sale and dividend interest expenses, brokerage fees, certain insurance costs, and nonroutine expenses or costs, including, but not limited to, those relating to reorganizations, litigation, conducting shareholder meetings, and liquidations) in order to prevent annual series operating expenses from exceeding 0.80% of the Series’ average daily net assets from Oct. 4, 2019 through Dec. 31, 2019.* Please see the most recent prospectus and any applicable supplement(s) for additional information on these fee waivers and/or reimbursements. Please see the “Financial highlights” section in this report for the most recent expense ratios.
Earnings from a variable annuity or variable life investment compoundtax-free until withdrawal, and as a result, no adjustments were made for income taxes.
Expense limitations were in effect for Standard Class shares during certain periods shown in the Series performance table above and in the Performance of a $10,000 Investment graph on the next page.
Performance data do not reflect insurance fees related to a variable annuity or variable life investment or the deferred sales charge that would apply to certain withdrawals of investments held for fewer than eight years. Performance shown here would have been reduced if such fees were included and the expense limitation removed. For more information about fees, consult your variable annuity or variable life prospectus.
Investments in variable products involve risk.
Investments in small and/ormedium-sized companies typically exhibit greater risk and higher volatility than larger, more established companies.
REIT investments are subject to many of the risks associated with direct real estate ownership, including changes in economic conditions, credit risk, and interest rate fluctuations.
An exchange-traded fund (ETF) is a security that represents all the stocks on a given exchange. ETF shares can be bought, sold, short-sold, traded on margin, and generally function as if they were stocks.
Please read both the contract and underlying prospectus for specific details regarding the product’s risk profile.
*The aggregate contractual waiver period covering this report is from Oct. 4, 2019 through Oct. 31, 2021.
Special SituationsSeries-2
Delaware VIP® Special Situations Series
Performance summary (Unaudited) (continued)
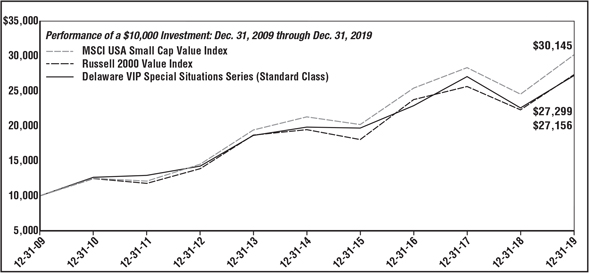
| | | | | | | | | | |
For period beginning Dec. 31, 2009 through Dec. 31, 2019 | | | Starting value | | | | Ending value | |
| -- | | MSCI USA Small Cap Value Index | | | $10,000 | | | | $30,145 | |
| -- | | Russell 2000 Value Index | | | $10,000 | | | | $27,299 | |
| – | | Delaware VIP Special Situations Series (Standard Class) | | | $10,000 | | | | $27,156 | |
The graph shows a $10,000 investment in the Delaware VIP Special Situations Series Standard Class shares for the period from Dec. 31, 2009 through Dec. 31, 2019.
The graph also shows $10,000 invested in the Russell 2000 Value Index and the MSCI USA Small Cap Value Index for the period from Dec. 31, 2009 through Dec. 31, 2019.
The Russell 2000 Value Index measures the performance of thesmall-cap value segment of the US equity universe. It includes those Russell 2000 companies with lowerprice-to-book ratios and lower forecasted growth values.
The MSCI USA Small Cap Value Index capturessmall-cap US stocks exhibiting overall value style characteristics. The value investment style characteristics for index construction are defined using three variables: book value to price,12-month forward earnings to price, and dividend yield.
The Russell 2000 Growth Index, mentioned on page 1, measures the performance of thesmall-cap growth segment of the US equity universe. It includes those Russell 2000 companies with higherprice-to-book ratios and higher forecasted growth values.
The Conference Board Consumer Confidence Index, mentioned on page 1, is a barometer of the health of the US economy from the perspective of the consumer. The index is based on consumers’ perceptions of current business and employment conditions, as well as their expectations for six months hence regarding business conditions, employment, and income. The resulting relative value is then used as an “index value” and compared against each respective monthly value for 1985. In that year, the result of the index was arbitrarily set at 100, representing it as the index benchmark.
Gross domestic product is a measure of all goods and services produced by a nation in a year.
Theprice-to-earnings ratio (P/E ratio) is a valuation ratio of a company’s current share price compared to its earnings per share. Generally, a high P/E ratio means that investors are anticipating higher growth in the future.
Frank Russell Company is the source and owner of the trademarks, service marks, and copyrights related to the Russell Indexes. Russell® is a trademark of Frank Russell Company.
Index performance returns do not reflect any management fees, transaction costs or expenses. Indices are unmanaged and one cannot invest directly in an index.
Past performance is not a guarantee of future results.
Special SituationsSeries-3
Delaware VIP® Trust — Delaware VIP Special Situations Series
Disclosure of Series expenses
For thesix-month period from July 1, 2019 to December 31, 2019 (Unaudited)
As a shareholder of the Series, you incur ongoing costs, which may include management fees; distribution and service(12b-1) fees; and other Series expenses. This example is intended to help you understand your ongoing costs (in dollars) of investing in the Series and to compare these costs with the ongoing costs of investing in other mutual funds.
The example is based on an investment of $1,000 invested at the beginning of the period and held for the entiresix-month period from July 1, 2019 to Dec. 31, 2019.
Actual expenses
The first section of the table shown, “Actual Series return,” provides information about actual account values and actual expenses. You may use the information in this section of the table, together with the amount you invested, to estimate the expenses that you paid over the period. Simply divide your account value by $1,000 (for example, an $8,600 account value divided by $1,000 = 8.6), then multiply the result by the number in the first section under the heading entitled “Expenses Paid During Period” to estimate the expenses you paid on your account during the period.
Hypothetical example for comparison purposes
The second section of the table shown, “Hypothetical 5% return,” provides information about hypothetical account values and hypothetical expenses based on the Series’ actual expense ratio and an assumed rate of return of 5% per year before expenses, which is not the Series’ actual return. The hypothetical account values and expenses may not be used to estimate the actual ending account balance or expenses you paid for the period. You may use this information to compare the ongoing costs of investing in the Series and other funds. To do so, compare this 5% hypothetical example with the 5% hypothetical examples that appear in the shareholder reports of other funds.
Please note that the expenses shown in the table are meant to highlight your ongoing costs only. As a shareholder of the Series, you do not incur any transaction costs, such as sales charges (loads), redemption fees or exchange fees, but shareholders of other funds may incur such costs. Also, the fees related to the variable annuity investment or the deferred sales charge that could apply have not been included. Therefore, the second section of the table is useful in comparing ongoing costs only, and will not help you determine the relative total costs of owning different funds. The Series’ expenses shown in the table reflect fee waivers in effect and assume reinvestment of all dividends and distributions.
Expense analysis of an investment of $1,000
| | | | | | | | | | | | | | |
| | | Beginning
Account
Value
7/1/19 | | | Ending
Account
Value
12/31/19 | | | Annualized
Expense
Ratio | | Expenses
Paid During
Period
7/1/19 to
12/31/19* | |
Actual Series return† | | | | |
Standard Class | | | $1,000.00 | | | | $1,072.20 | | | 0.79% | | | $4.13 | |
Hypothetical 5% return(5% return before expenses) | |
Standard Class | | | $1,000.00 | | | | $1,021.22 | | | 0.79% | | | $4.02 | |
| * | “Expenses Paid During Period” are equal to the Series’ annualized expense ratio, multiplied by the average account value over the period, multiplied by 184/365 (to reflect theone-half year period). |
| † | Because actual returns reflect only the most recentsix-month period, the returns shown may differ significantly from fiscal year returns. |
In addition to the Series’ expenses reflected above, the Series also indirectly bears its portion of the fees and expenses of the investment companies (Underlying Funds) in which it invests. The table above does not reflect the expenses of the Underlying Funds.
Special SituationsSeries-4
Delaware VIP® Trust — Delaware VIP Special Situations Series
Security type / sector allocation and top 10 equity holdings
As of December 31, 2019 (Unaudited)
Sector designations may be different than the sector designations presented in other Series materials. The sector designations may represent the investment manager’s internal sector classifications.
| | | | |
| Security type / sector | | Percentage of
net assets |
| |
Common Stock◇ | | | 97.83% | |
Basic Industry | | | 5.17% | |
Business Services | | | 1.02% | |
Capital Spending | | | 9.61% | |
Consumer Cyclical | | | 3.84% | |
Consumer Services | | | 8.97% | |
Consumer Staples | | | 3.58% | |
Energy | | | 5.62% | |
Financial Services1 | | | 28.77% | |
Healthcare | | | 2.48% | |
Real Estate Investment Trusts | | | 8.48% | |
Technology | | | 12.74% | |
Transportation | | | 2.54% | |
Utilities | | | 5.01% | |
Short-Term Investments | | | 2.06% | |
Total Value of Securities | | | 99.89% | |
Receivables and Other Assets Net of Liabilities | | | 0.11% | |
Total Net Assets | | | 100.00% | |
| ◇ | Narrow industries are utilized for compliance purposes for diversification where as broad sectors are used for financial reporting. |
| 1 | To monitor compliance with the Series’ concentration guidelines as described in the Series’ Prospectus and Statement of Additional Information, the Financial Services sector (as disclosed herein for financial reporting purposes) is subdivided into a variety of “industries” (in accordance with the requirements of the Investment Company Act of 1940, as amended). The Financial Services sector consisted of Banks, Diversified Financial Services and Insurance. As of Dec. 31, 2019, such amounts, as percentage of total net assets, were 21.72%, 2.24%, and 4.81%, respectively. The percentage in any such single industry will comply with the Series’ concentration policy even if the percentages in the Financial Services sector for financial reporting purposes may exceed 25%. |
Holdings are for informational purposes only and are subject to change at any time. They are not a recommendation to buy, sell, or hold any security.
| | |
| Top 10 equity holdings | | Percentage
of net assets |
| |
East West Bancorp | | 2.72% |
MasTec | | 2.69% |
ITT | | 2.40% |
Hancock Whitney | | 2.06% |
Webster Financial | | 1.89% |
Stifel Financial | | 1.69% |
Teradyne | | 1.69% |
FNB | | 1.62% |
Western Alliance Bancorp | | 1.52% |
Hanover Insurance Group | | 1.48% |
Special SituationsSeries-5
Delaware VIP® Trust — Delaware VIP Special Situations Series
Schedule of investments
December 31, 2019
| | | | | | | | |
| | | Number of
shares | | | Value
(US $) | |
| |
Common Stock – 97.83%◇ | | | | | |
Basic Industry – 5.17% | | | | | |
Berry Global Group † | | | 70,400 | | | $ | 3,343,296 | |
Ferro † | | | 94,600 | | | | 1,402,918 | |
HB Fuller | | | 50,900 | | | | 2,624,913 | |
Louisiana-Pacific | | | 97,100 | | | | 2,880,957 | |
Olin | | | 123,700 | | | | 2,133,825 | |
| | | | | | | | |
| | | | | | | 12,385,909 | |
| | | | | | | | |
Business Services – 1.02% | | | | | |
Deluxe | | | 24,700 | | | | 1,233,024 | |
WESCO International † | | | 20,400 | | | | 1,211,556 | |
| | | | | | | | |
| | | | | | | 2,444,580 | |
| | | | | | | | |
Capital Spending – 9.61% | | | | | |
Altra Industrial Motion | | | 82,600 | | | | 2,990,946 | |
Atkore International Group † | | | 55,600 | | | | 2,249,576 | |
H&E Equipment Services | | | 61,600 | | | | 2,059,288 | |
ITT | | | 77,600 | | | | 5,735,416 | |
MasTec † | | | 100,300 | | | | 6,435,248 | |
Primoris Services | | | 74,100 | | | | 1,647,984 | |
Rexnord † | | | 57,400 | | | | 1,872,388 | |
| | | | | | | | |
| | | | | | | 22,990,846 | |
| | | | | | | | |
Consumer Cyclical – 3.84% | | | | | |
Barnes Group | | | 40,300 | | | | 2,496,988 | |
KB Home | | | 57,100 | | | | 1,956,817 | |
Knoll | | | 76,900 | | | | 1,942,494 | |
Meritage Homes † | | | 32,200 | | | | 1,967,742 | |
Standard Motor Products | | | 15,500 | | | | 824,910 | |
| | | | | | | | |
| | | | | | | 9,188,951 | |
| | | | | | | | |
Consumer Services – 8.97% | | | | | |
Asbury Automotive
Group † | | | 17,100 | | | | 1,911,609 | |
Cable One | | | 1,600 | | | | 2,381,552 | |
Caleres | | | 56,900 | | | | 1,351,375 | |
Cheesecake Factory | | | 36,700 | | | | 1,426,162 | |
Choice Hotels International | | | 28,800 | | | | 2,978,784 | |
Cinemark Holdings | | | 56,600 | | | | 1,915,910 | |
Cracker Barrel Old Country Store | | | 10,300 | | | | 1,583,522 | |
Steven Madden | | | 38,400 | | | | 1,651,584 | |
Texas Roadhouse | | | 27,700 | | | | 1,560,064 | |
UniFirst | | | 14,100 | | | | 2,847,918 | |
Wolverine World Wide | | | 54,800 | | | | 1,848,952 | |
| | | | | | | | |
| | | | | | | 21,457,432 | |
| | | | | | | | |
Consumer Staples – 3.58% | | | | | |
Core-Mark Holding | | | 39,000 | | | | 1,060,410 | |
J&J Snack Foods | | | 11,600 | | | | 2,137,532 | |
Performance Food
Group † | | | 41,400 | | | | 2,131,272 | |
Scotts Miracle-Gro | | | 17,300 | | | | 1,836,914 | |
Spectrum Brands Holdings | | | 21,800 | | | | 1,401,522 | |
| | | | | | | | |
| | | | | | | 8,567,650 | |
| | | | | | | | |
Energy – 5.62% | | | | | |
Callon Petroleum † | | | 237,600 | | | | 1,147,608 | |
Delek US Holdings | | | 63,600 | | | | 2,132,508 | |
| | | | | | | | |
| | | Number of
shares | | | Value
(US $) | |
| |
Common Stock◇ (continued) | | | | | |
Energy (continued) | | | | | |
Dril-Quip † | | | 27,400 | | | $ | 1,285,334 | |
Helix Energy Solutions Group † | | | 180,700 | | | | 1,740,141 | |
Oasis Petroleum † | | | 179,200 | | | | 584,192 | |
Patterson-UTI Energy | | | 175,300 | | | | 1,840,650 | |
SM Energy | | | 121,400 | | | | 1,364,536 | |
Valaris | | | 102,100 | | | | 669,776 | |
WPX Energy † | | | 195,800 | | | | 2,690,292 | |
| | | | | | | | |
| | | | | | | 13,455,037 | |
| | | | | | | | |
Financial Services – 28.77% | | | | | |
American Equity Investment Life Holding | | | 110,900 | | | | 3,319,237 | |
Bank of NT Butterfield & Son | | | 37,600 | | | | 1,391,952 | |
Community Bank System | | | 9,700 | | | | 688,118 | |
East West Bancorp | | | 133,800 | | | | 6,516,060 | |
First Financial Bancorp | | | 107,600 | | | | 2,737,344 | |
First Hawaiian | | | 81,800 | | | | 2,359,930 | |
First Interstate BancSystem Class A | | | 45,600 | | | | 1,911,552 | |
First Midwest Bancorp | | | 121,200 | | | | 2,794,872 | |
FNB | | | 305,600 | | | | 3,881,120 | |
Great Western Bancorp | | | 88,700 | | | | 3,081,438 | |
Hancock Whitney | | | 112,300 | | | | 4,927,724 | |
Hanover Insurance Group | | | 25,900 | | | | 3,539,753 | |
Kemper | | | 23,500 | | | | 1,821,250 | |
Legg Mason | | | 36,500 | | | | 1,310,715 | |
NBT Bancorp | | | 49,100 | | | | 1,991,496 | |
Prosperity Bancshares | | | 29,300 | | | | 2,106,377 | |
S&T Bancorp | | | 36,800 | | | | 1,482,672 | |
Selective Insurance Group | | | 43,400 | | | | 2,829,246 | |
Stifel Financial | | | 66,800 | | | | 4,051,420 | |
Umpqua Holdings | | | 188,100 | | | | 3,329,370 | |
Valley National Bancorp | | | 241,800 | | | | 2,768,610 | |
Webster Financial | | | 85,000 | | | | 4,535,600 | |
WesBanco | | | 48,700 | | | | 1,840,373 | |
Western Alliance Bancorp | | | 63,900 | | | | 3,642,300 | |
| | | | | | | | |
| | | | | | | 68,858,529 | |
| | | | | | | | |
Healthcare – 2.48% | | | | | |
Avanos Medical † | | | 46,700 | | | | 1,573,790 | |
Catalent † | | | 31,800 | | | | 1,790,340 | |
Service Corp. International | | | 39,300 | | | | 1,808,979 | |
STERIS | | | 5,000 | | | | 762,100 | |
| | | | | | | | |
| | | | | | | 5,935,209 | |
| | | | | | | | |
Real Estate Investment Trusts – 8.48% | |
Brandywine Realty Trust | | | 181,000 | | | | 2,850,750 | |
Highwoods Properties | | | 54,500 | | | | 2,665,595 | |
Lexington Realty Trust | | | 196,000 | | | | 2,081,520 | |
Life Storage | | | 20,700 | | | | 2,241,396 | |
Outfront Media | | | 110,700 | | | | 2,968,974 | |
RPT Realty | | | 113,800 | | | | 1,711,552 | |
Spirit Realty Capital | | | 48,500 | | | | 2,385,230 | |
Summit Hotel Properties | | | 132,400 | | | | 1,633,816 | |
Special SituationsSeries-6
Delaware VIP® Special Situations Series
Schedule of investments (continued)
| | | | | | | | |
| | | Number of
shares | | | Value
(US $) | |
| |
Common Stock◇ (continued) | | | | | |
Real Estate Investment Trusts (continued) | | | | | |
Washington Real Estate Investment Trust | | | 60,400 | | | $ | 1,762,472 | |
| | | | | | | | |
| | | | | | | 20,301,305 | |
| | | | | | | | |
Technology – 12.74% | | | | | |
Cirrus Logic † | | | 27,800 | | | | 2,290,998 | |
Coherent † | | | 10,300 | | | | 1,713,405 | |
CommScope Holding † | | | 62,800 | | | | 891,132 | |
Flex † | | | 186,400 | | | | 2,352,368 | |
MaxLinear † | | | 46,300 | | | | 982,486 | |
NCR † | | | 72,800 | | | | 2,559,648 | |
NetScout Systems † | | | 53,500 | | | | 1,287,745 | |
ON Semiconductor † | | | 129,000 | | | | 3,145,020 | |
Tech Data † | | | 16,800 | | | | 2,412,480 | |
Teradyne | | | 59,400 | | | | 4,050,486 | |
Tower Semiconductor † | | | 95,400 | | | | 2,295,324 | |
TTM Technologies † | | | 133,100 | | | | 2,003,155 | |
Viavi Solutions † | | | 108,300 | | | | 1,624,500 | |
Vishay Intertechnology | | | 136,000 | | | | 2,895,440 | |
| | | | | | | | |
| | | | | | | 30,504,187 | |
| | | | | | | | |
Transportation – 2.54% | | | | | |
Kirby † | | | 14,500 | | | | 1,298,185 | |
Saia † | | | 16,500 | | | | 1,536,480 | |
SkyWest | | | 17,392 | | | | 1,124,045 | |
Werner Enterprises | | | 58,200 | | | | 2,117,898 | |
| | | | | | | | |
| | | | | | | 6,076,608 | |
| | | | | | | | |
Utilities – 5.01% | | | | | |
ALLETE | | | 24,600 | | | | 1,996,782 | |
Black Hills | | | 40,100 | | | | 3,149,454 | |
| | | | | | | | |
| | | Number of
shares | | | Value
(US $) | |
| |
Common Stock◇ (continued) | | | | | |
Utilities (continued) | | | | | |
El Paso Electric | | | 35,200 | | | $ | 2,389,728 | |
South Jersey Industries | | | 53,700 | | | | 1,771,026 | |
Southwest Gas Holdings | | | 35,200 | | | | 2,674,144 | |
| | | | | | | | |
| | | | | | | 11,981,134 | |
| | | | | | | | |
Total Common Stock
(cost $210,831,047) | | | | | | | 234,147,377 | |
| | | | | | | | |
| |
Short-Term Investments – 2.06% | | | | | |
Money Market Mutual Funds – 2.06% | | | | | |
BlackRock FedFund – Institutional Shares(seven-day effective yield 1.52%) | | | 987,481 | | | | 987,481 | |
Fidelity Investments Money Market Government Portfolio – Class I(seven-day effective yield 1.49%) | | | 987,480 | | | | 987,480 | |
GS Financial Square Government Fund – Institutional Shares(seven-day effective yield 1.51%) | | | 987,480 | | | | 987,480 | |
Morgan Stanley Government Portfolio – Institutional Share Class(seven-day effective yield 1.48%) | | | 987,481 | | | | 987,481 | |
State Street Institutional US Government Money Market Fund – Investor Class(seven-day effective yield 1.45%) | | | 987,481 | | | | 987,481 | |
| | | | | | | | |
Total Short-Term Investments
(cost $4,937,403) | | | | 4,937,403 | |
| | | | | | | | |
| | | | |
Total Value of Securities – 99.89%
(cost $215,768,450) | | $ | 239,084,780 | |
| | | | |
◇ Narrow industries are utilized for compliance purposes for diversification whereas broad sectors are used for financial reporting.
†Non-income producing security.
GS – Goldman Sachs
See accompanying notes, which are an integral part of the financial statements.
Special SituationsSeries-7
| | |
Delaware VIP®Trust — Delaware VIP Special Situations Series Statement of assets and liabilities | | December 31, 2019 |
| | |
| | | | |
Assets: | | | | |
Investments, at value1 | | $ | 239,084,780 | |
Receivable for securities sold | | | 628,054 | |
Dividends and interest receivable | | | 277,582 | |
Receivable for series shares sold | | | 4,579 | |
Other assets | | | 7,880 | |
| | | | |
Total assets | | | 240,002,875 | |
| | | | |
Liabilities: | | | | |
Payable for securities purchased | | | 421,390 | |
Investment management fees payable | | | 127,986 | |
Audit and tax fees payable | | | 38,050 | |
Payable for series shares redeemed | | | 28,222 | |
Reports and statements to shareholders payable tonon-affiliates | | | 14,444 | |
Accounting and Administration expenses payable tonon-affiliates | | | 10,684 | |
Other accrued expenses | | | 5,365 | |
Trustees’ fees and expenses payable | | | 2,289 | |
Dividend disbursing and transfer agent fees and expenses payable to affiliates | | | 1,507 | |
Pricing fees payable | | | 1,250 | |
Accounting and administration expenses payable to affiliates | | | 1,006 | |
Reports and statements to shareholders payable to affiliates | | | 371 | |
Legal fees payable to affiliates | | | 363 | |
| | | | |
Total liabilities | | | 652,927 | |
| | | | |
Total Net Assets | | $ | 239,349,948 | |
| | | | |
| |
Net Assets Consist of: | | | | |
Paid-in capital | | $ | 196,366,856 | |
Total distributable earnings (loss) | | | 42,983,092 | |
| | | | |
Total Net Assets | | $ | 239,349,948 | |
| | | | |
| |
Net Asset Value: | | | | |
Standard Class: | | | | |
Net assets | | $ | 239,349,948 | |
Shares of beneficial interest outstanding, unlimited authorization, no par | | | 7,431,676 | |
Net asset value per share | | $ | 32.21 | |
| | | | |
| 1Investments, at cost | | $ | 215,768,450 | |
See accompanying notes, which are an integral part of the financial statements.
Special SituationsSeries-8
Delaware VIP® Trust —
Delaware VIP Special Situations Series
Statement of operations
Year ended December 31, 2019
| | | | |
Investment Income: | | | | |
Dividends | | $ | 4,256,586 | |
Interest | | | 77,939 | |
| | | | |
| | | 4,334,525 | |
| | | | |
| |
Expenses: | | | | |
Management fees | | | 1,731,325 | |
Reports and statements to shareholders | | | 40,958 | |
Audit and tax fees | | | 36,872 | |
Trustees’ fees and expenses | | | 20,575 | |
Accounting and administration expenses | | | 17,799 | |
Custodian fees | | | 14,583 | |
Legal fees | | | 4,822 | |
Dividend disbursing and transfer agent fees and expenses | | | 4,407 | |
Other | | | 17,939 | |
| | | | |
| | | 1,889,280 | |
Less expenses waived | | | (39,991 | ) |
Less expenses paid indirectly | | | (5,576 | ) |
| | | | |
Total operating expenses | | | 1,843,713 | |
| | | | |
Net Investment Income | | | 2,490,812 | |
| | | | |
| |
Net Realized and Unrealized Gain: | | | | |
Net realized gain | | | 17,409,630 | |
Net change in unrealized appreciation (depreciation) of investments | | | 22,063,593 | |
| | | | |
Net Realized and Unrealized Gain | | | 39,473,223 | |
| | | | |
Net Increase in Net Assets Resulting from Operations | | $ | 41,964,035 | |
| | | | |
Delaware VIP Trust —
Delaware VIP Special Situations Series
Statements of changes in net assets
| | | | | | | | |
| | | Year ended | |
| | | 12/31/19 | | | 12/31/18 | |
Increase (Decrease) in Net Assets from Operations: | | | | | | | | |
Net investment income | | $ | 2,490,812 | | | $ | 1,626,398 | |
Net realized gain | | | 17,409,630 | | | | 15,731,287 | |
Net change in unrealized appreciation (depreciation) | | | 22,063,593 | | | | (59,007,907 | ) |
| | | | | | | | |
Net increase (decrease) in net assets resulting from operations | | | 41,964,035 | | | | (41,650,222 | ) |
| | | | | | | | |
| | |
Dividends and Distributions to Shareholders from: | | | | | | | | |
Distributable earnings:
Standard Class | | | (17,270,300 | ) | | | (33,554,496 | ) |
| | | | | | | | |
| | |
Capital Share Transactions: | | | | | | | | |
Proceeds from shares sold:
Standard Class | | | 4,903,509 | | | | 8,412,913 | |
| | |
Net asset value of shares issued upon reinvestment of dividends and distributions:
Standard Class | | | 17,270,300 | | | | 33,554,496 | |
| | | | | | | | |
| | | 22,173,809 | | | | 41,967,409 | |
| | | | | | | | |
Cost of shares redeemed:
Standard Class | | | (17,343,572 | ) | | | (12,935,929 | ) |
| | | | | | | | |
Increase in net assets derived from capital share transactions | | | 4,830,237 | | | | 29,031,480 | |
| | | | | | | | |
Net Increase (Decrease) in Net Assets | | | 29,523,972 | | | | (46,173,238 | ) |
| | |
Net Assets: | | | | | | | | |
Beginning of year | | | 209,825,976 | | | | 255,999,214 | |
| | | | | | | | |
End of year | | $ | 239,349,948 | | | $ | 209,825,976 | |
| | | | | | | | |
See accompanying notes, which are an integral part of the financial statements.
Special SituationsSeries-9
Delaware VIP® Trust — Delaware VIP Special Situations Series
Financial highlights
Selected data for each share of the Series outstanding throughout each period were as follows:
| | | | | | | | | | | | | | | | | | | | | | | | | | | | | | | | | | | | | | |
| | | Delaware VIP Special Situations Series Standard Class Year ended | | | |
| | | |
| | | 12/31/191 | | | | | | 12/31/18 | | | | | | 12/31/17 | | | | | | 12/31/16 | | | | | | 12/31/15 | | | |
| | | |
Net asset value, beginning of period | | $ | 28.86 | | | | | | | $ | 40.08 | | | | | | | $ | 34.64 | | | | | | | $ | 32.40 | | | | | | | $ | 34.22 | | | |
| | | | | | | | | | |
Income (loss) from investment operations: | | | | | | | | | | | | | | | | | | | | | | | | | | | | | | | | | | | | | | |
Net investment income2 | | | 0.33 | | | | | | | | 0.23 | | | | | | | | 0.15 | | | | | | | | 0.33 | | | | | | | | 0.18 | | | |
Net realized and unrealized gain (loss) | | | 5.39 | | | | | | | | (6.17 | ) | | | | | | | 6.06 | | | | | | | | 4.28 | | | | | | | | (0.27 | ) | | |
| | | | | | | | | | | | | | | | | | | | | | | | | | | | | | | | | | | | | | |
Total from investment operations | | | 5.72 | | | | | | | | (5.94 | ) | | | | | | | 6.21 | | | | | | | | 4.61 | | | | | | | | (0.09 | ) | | |
| | | | | | | | | | | | | | | | | | | | | | | | | | | | | | | | | | | | | | |
| | | | | | | | | | |
Less dividends and distributions from: | | | | | | | | | | | | | | | | | | | | | | | | | | | | | | | | | | | | | | |
Net investment income | | | (0.22 | ) | | | | | | | (0.18 | ) | | | | | | | (0.33 | ) | | | | | | | (0.18 | ) | | | | | | | (0.22 | ) | | |
Net realized gain | | | (2.15 | ) | | | | | | | (5.10 | ) | | | | | | | (0.44 | ) | | | | | | | (2.19 | ) | | | | | | | (1.51 | ) | | |
| | | | | | | | | | | | | | | | | | | | | | | | | | | | | | | | | | | | | | |
Total dividends and distributions | | | (2.37 | ) | | | | | | | (5.28 | ) | | | | | | | (0.77 | ) | | | | | | | (2.37 | ) | | | | | | | (1.73 | ) | | |
| | | | | | | | | | | | | | | | | | | | | | | | | | | | | | | | | | | | | | |
| | | | | | | | | | |
Net asset value, end of period | | $ | 32.21 | | | | | | | $ | 28.86 | | | | | | | $ | 40.08 | | | | | | | $ | 34.64 | | | | | | | $ | 32.40 | | | |
| | | | | | | | | | | | | | | | | | | | | | | | | | | | | | | | | | | | | | |
| | | | | | | | | | |
Total return3 | | | 20.36%4 | | | | | | | | (16.60%) | | | | | | | | 18.26% | | | | | | | | 16.10% | | | | | | | | (0.52%) | | | |
| | | | | | | | | | |
Ratios and supplemental data: | | | | | | | | | | | | | | | | | | | | | | | | | | | | | | | | | | | | | | |
Net assets, end of period (000 omitted) | | $ | 239,350 | | | | | | | $ | 209,826 | | | | | | | $ | 255,999 | | | | | | | $ | 224,220 | | | | | | | $ | 202,121 | | | |
Ratio of expenses to average net assets5 | | | 0.80% | | | | | | | | 0.80% | | | | | | | | 0.80% | | | | | | | | 0.81% | | | | | | | | 0.80% | | | |
Ratio of expenses to average net assets prior to fees waived5 | | | 0.82% | | | | | | | | 0.80% | | | | | | | | 0.80% | | | | | | | | 0.81% | | | | | | | | 0.80% | | | |
Ratio of net investment income to average net assets | | | 1.08% | | | | | | | | 0.65% | | | | | | | | 0.40% | | | | | | | | 1.06% | | | | | | | | 0.52% | | | |
Ratio of net investment income to average net assets prior to fees waived | | | 1.06% | | | | | | | | 0.65% | | | | | | | | 0.40% | | | | | | | | 1.06% | | | | | | | | 0.52% | | | |
Portfolio turnover | | | 128%6 | | | | | | | | 54% | | | | | | | | 38% | | | | | | | | 31% | | | | | | | | 46% | | | |
| 1 | On Oct. 4, 2019, the First Investors Life Series Special Situations Fund shares were reorganized into Standard Class shares of the Series. See “Notes to financial statements.” The Standard Class shares financial highlights for the period prior to Oct. 4, 2019, reflect the performance of the First Investors Life Series Special Situations Fund shares. |
| 2 | The average shares outstanding method has been applied for per share information. |
| 3 | Total return is based on the change in net asset value of a share during the period and assumes reinvestment of dividends and distributions at net asset value. Total return does not include fees, charges, or expenses imposed by the variable annuity and life insurance contracts for which Delaware VIP Trust serves as an underlying investment vehicle. |
| 4 | Total return during the period reflects a waiver by the manager. Performance would have been lower had the waiver not been in effect. |
| 5 | Expense ratios do not include expenses of the Underlying Funds in which the Series invests. |
| 6 | The Series’ portfolio turnover rate increased substantially during the year ended Dec. 31, 2019 due to a change in the Series’ portfolio managers and associated repositioning. |
See accompanying notes, which are an integral part of the financial statements.
Special SituationsSeries-10
Delaware VIP® Trust — Delaware VIP Special Situations Series
Notes to financial statements
December 31, 2019
Delaware VIP Trust (Trust) is organized as a Delaware statutory trust. The Trust consists of 22 series, each of which is treated as a separate entity for certain matters under the Investment Company Act of 1940, as amended (1940 Act). These financial statements and the related notes pertain to Delaware VIP Special Situations Series (Series). The Trust is anopen-end investment company. The Series is considered diversified under the 1940 Act and offers Standard Class shares. The Standard Class shares do not carry a distribution and service(12b-1) fee. The shares of the Series are sold only to separate accounts of life insurance companies.
Before the Series commenced operations, on Oct. 4, 2019, all of the assets and liabilities of the First Investors Life Series Special Situations Fund, its respective Predecessor Series (Predecessor Series) were transferred to the Series in atax-free reorganization as set forth in an agreement and plan of reorganization (each a Foresters Reorganization) between the Trust, on behalf of the Series, and Foresters Investment Management Company, Inc. (FIMCO), on behalf of the Predecessor Series. As a result of the Foresters Reorganization, the Series assumed the performance and accounting history of its Predecessor Series. Financial information included for the dates prior to the Foresters Reorganization is that of the Predecessor Series.
1. Significant Accounting Policies
The Series follows accounting and reporting guidance under Financial Accounting Standards Board (FASB) Accounting Standards Codification Topic 946, Financial Services – Investment Companies. The following accounting policies are in accordance with US generally accepted accounting principles (US GAAP) and are consistently followed by the Series.
Security Valuation — Equity securities, except those traded on the Nasdaq Stock Market LLC (Nasdaq), are valued at the last quoted sales price as of the time of the regular close of the New York Stock Exchange on the valuation date. Equity securities traded on the Nasdaq are valued in accordance with the Nasdaq Official Closing Price, which may not be the last sales price. If, on a particular day, an equity security does not trade, the mean between the bid and ask prices will be used, which approximates fair value. Equity securities listed on a foreign exchange are normally valued at the last quoted sales price on the valuation date.Open-end investment companies are valued at their published net asset value (NAV). Generally, other securities and assets for which market quotations are not readily available are valued at fair value as determined in good faith under the direction of the Trust’s Board of Trustees (Board). In determining whether market quotations are readily available or fair valuation will be used, various factors will be taken into consideration, such as market closures or suspension of trading in a security. Restricted securities are valued at fair value using methods approved by the Board.
Federal Income Taxes — No provision for federal income taxes has been made as the Series intends to continue to qualify for federal income tax purposes as a regulated investment company under Subchapter M of the Internal Revenue Code of 1986, as amended, and make the requisite distributions to shareholders. The Series evaluates tax positions taken or expected to be taken in the course of preparing the Series’ tax returns to determine whether the tax positions are“more-likely-than-not” of being sustained by the applicable tax authority. Tax positions not deemed to meet the“more-likely-than-not” threshold are recorded as a tax benefit or expense in the current year. Management has analyzed the Series’ tax positions taken or expected to be taken on the Series’ federal income tax returns through the year ended Dec. 31, 2019 and for all open tax years (years ended Dec. 31, 2016–Dec. 31, 2018), and has concluded that no provision for federal income tax is required in the Series’ financial statements. If applicable, the Series recognizes interest accrued on unrecognized tax benefits in interest expense and penalties in “Other” on the “Statement of operations.” During the year ended Dec. 31, 2019, the Series did not incur any interest or tax penalties.
Use of Estimates — The preparation of financial statements in conformity with US GAAP requires management to make estimates and assumptions that affect the fair value of investments, the reported amounts of assets and liabilities and disclosure of contingent assets and liabilities at the date of the financial statements, and the reported amounts of revenues and expenses during the reporting period. Actual results could differ from those estimates and the differences could be material.
Other — Expenses directly attributable to the Series are charged directly to the Series. Other expenses common to various funds within the Delaware Funds® by Macquarie (Delaware Funds) are generally allocated among such funds on the basis of average net assets. Management fees and certain other expenses are paid monthly. Security transactions are recorded on the date the securities are purchased or sold (trade date) for financial reporting purposes. Costs used in calculating realized gains and losses on the sale of investment securities are those of the specific securities sold. Dividend income is recorded on theex-dividend date and interest income is recorded on the accrual basis. Discounts and premiums on debt securities are accreted or amortized to interest income, respectively, over the lives of the respective securities using the effective interest method. Distributions received from investments in real estate investment trusts (REITs) are recorded as dividend income on theex-dividend date, subject to reclassification upon notice of the character of such distributions by the issuer. The financial statements reflect an estimate of the reclassification of the distribution character. The Series declares and pays dividends from net investment income and distributions from net realized gain on investments, if any, following the close of the fiscal year. The Series may distribute more frequently, if necessary for tax purposes. Dividends and distributions, if any, are recorded on theex-dividend date.
The Series receives earnings credits from its custodian when positive cash balances are maintained, which may be used to offset custody fees. The expenses paid under this arrangement are included on the “Statement of operations” under “Custodian fees” with the corresponding expenses offset included under “Less expenses paid indirectly.” For the year ended Dec. 31, 2019, the Series earned $5,576 under this arrangement.
Special SituationsSeries-11
Delaware VIP® Special Situations Series
Notes to financial statements (continued)
1. Significant Accounting Policies (continued)
The Series receives earnings credits from its transfer agent when positive cash balances are maintained, which may be used to offset transfer agent fees. If the amount earned is greater than $1, the expenses paid under this arrangement are included on the “Statement of operations” under “Dividend disbursing and transfer agent fees and expenses” with the corresponding expenses offset included under “Less expenses paid indirectly.” There were no such earnings credits for the year ended Dec. 31, 2019.
2. Investment Management, Administration Agreements, and Other Transactions with Affiliates
In accordance with the terms of its investment management agreement, effective Oct. 4, 2019, the Series pays Delaware Management Company (DMC), a series of Macquarie Investment Management Business Trust and the investment manager, an annual fee which is calculated daily and paid monthly at the rates of 0.75% on the first $500 million of average daily net assets of the Series, 0.70% on the next $500 million, 0.65% on the next $1.5 billion, and 0.60% on average daily net assets in excess of $2.5 billion. Prior to Oct. 4, 2019, the Series paid FIMCO, an annual fee which was calculated daily and paid monthly at the rates of 0.75% on the first $250 million of average daily net assets of the Series, 0.72% on the next $250 million, 0.69% on the next $250 million, 0.66% on the next $500 million, 0.64% on the next $500 million, 0.62% on the next $500 million, and 0.60% on average daily net assets in excess of $2.25 billion.
DMC has contractually agreed to waive all or a portion of its investment advisory fees and/or pay/reimburse expenses (excluding any acquired fund fees and expenses, taxes, interest, short sale dividend and interest expenses, brokerage fees, certain insurance costs, and nonroutine expenses or costs, including, but not limited to, those relating to reorganizations, litigation, conducting shareholder meetings, and liquidations), do not exceed 0.80% of the Series’ average daily net assets from Oct. 4, 2019 through Dec. 31, 2019.* These waivers and reimbursements may only be terminated by agreement of DMC and the Series. The waivers and reimbursements are accrued daily and received monthly.
Effective Oct. 4, 2019, DMC may permit its affiliates, Macquarie Investment Management Global Limited (MIMGL) and Macquarie Funds Management Hong Kong Limited (together, the “AffiliatedSub-Advisors”), to execute Series equity security trades on behalf of the Manager. The Manager may also seek quantitative support from MIMGL. Although the AffiliatedSub-Advisors serve assub-advisors, DMC has ultimate responsibility for all investment advisory services. For these services, DMC, not the Series, may pay each AffiliatedSub-Advisor a portion of its investment management fee.
Effective Oct. 4, 2019, Delaware Investments Fund Services Company (DIFSC), an affiliate of DMC, provides fund accounting and financial administration oversight services to the Series. For these services, DIFSC’s fees are calculated daily and paid monthly based on the aggregate daily net assets of all funds within the Delaware Funds at the following annual rates: 0.00475% of the first $35 billion; 0.0040% of the next $10 billion; and 0.0025% of aggregate average daily net assets in excess of $45 billion (Total Fee). Each fund in the Delaware Funds pays a minimum of $4,000, which, in aggregate, is subtracted from the Total Fee. Each fund then pays its portion of the remainder of the Total Fee on a relative NAV basis. This amount is included on the “Statement of operations” under “Accounting and administration expenses.” For the period Oct. 4, 2019 through year ended Dec. 31, 2019, the Series was charged $2,878 for these services. Prior to Oct. 4, 2019, there were no fund accounting and financial administration oversight services for the Series.
Effective Oct. 4, 2019, DIFSC is also the transfer agent and dividend disbursing agent of the Series. For these services, DIFSC’s fees are calculated daily and paid monthly at the annual rate of 0.0075% of the Series’ average daily net assets. This amount is included on the “Statement of operations” under “Dividend disbursing and transfer agent fees and expenses.” For the period Oct. 4, 2019 through year ended Dec. 31, 2019, the Series was charged $4,209 for these services. Pursuant to asub-transfer agency agreement between DIFSC and BNY Mellon Investment Servicing (US) Inc. (BNYMIS), BNYMIS provides certainsub-transfer agency services to the Series.Sub-transfer agency fees are paid directly by the Series and are also included on the “Statement of operations” under “Dividend disbursing and transfer agent fees and expenses.” The fees that are calculated daily and paid as invoices are received on a monthly or quarterly basis. Prior to Oct. 4, 2019, Foresters Investor Services, Inc. was the transfer agent of the Series.
As provided in the investment management agreement, the Series bears a portion of the cost of resources shared with DMC, including the cost of certain internal personnel of DMC and/or its affiliates that provide legal, tax, and regulatory reporting services to the Series. For the period Oct. 4, 2019 through year ended Dec. 31, 2019, the Series was charged $1,142 for internal legal, tax, and regulatory reporting services provided by DMC and/or its affiliates’ employees. These amounts are included on the “Statement of operations” under “Legal fees.”
Trustees’ fees include expenses accrued by the Series for each Trustee’s retainer and meeting fees. Certain officers of DMC, DIFSC, and DDLP are officers and/or Trustees of the Trust. These officers and Trustees are paid no compensation by the Series.
In addition to the management fees and other expenses of the Series, the Series indirectly bears the investment management fees and other expenses of the investment companies (Underlying Funds) in which it invests. The amount of these fees and expenses incurred indirectly by the Series will vary based upon the expense and fee levels of the Underlying Funds and the number of shares that are owned of the Underlying Funds at different times.
Cross trades for the year ended Dec. 31, 2019 were executed by the Series pursuant to procedures adopted by the Board designed to ensure compliance with Rule17a-7 under the 1940 Act. Cross trading is the buying or selling of portfolio securities between funds of investment companies, or between a fund
Special Situations Series-12
Delaware VIP® Special Situations Series
Notes to financial statements (continued)
2. Investment Management, Administration Agreements, and Other Transactions with Affiliates (continued)
of an investment company and another entity, that are or could be considered affiliates by virtue of having a common investment advisor (or affiliated investment advisors), common directors/ trustees and/or common officers. At its regularly scheduled meetings, the Board reviews such transactions for compliance with the procedures adopted by the Board. Pursuant to these procedures, for the year ended Dec. 31, 2019, the Series engaged in Rule17a-7 securities purchases of $10,407,443 and securities sales of $18,808,788, which resulted in net realized gains of $6,156,872.
*The aggregate contractual waiver period covering this report is from Oct. 4, 2019 through Oct. 31, 2021.
3. Investments
For the year ended Dec. 31, 2019, the Series made purchases and sales of investment securities other than short-term investments as follows:
| | | | |
Purchases | | $ | 286,391,631 | |
Sales | | | 292,657,396 | |
The tax cost of investments includes adjustments to net unrealized appreciation (depreciation) which may not necessarily be the final tax cost basis adjustments, but approximate the tax basis unrealized gains and losses that may be realized and distributed to shareholders. At Dec. 31, 2019, the cost and unrealized appreciation (depreciation) of investments for federal income tax purposes for the Series were as follows:
| | | | | | |
Cost of
Investments | | Aggregate
Unrealized
Appreciation
of Investments | | Aggregate
Unrealized
Depreciation
of Investments | | Net Unrealized
Appreciation
of Investments |
| $215,945,293 | | $26,431,587 | | $(3,292,100) | | $23,139,487 |
US GAAP defines fair value as the price that the Series would receive to sell an asset or pay to transfer a liability in an orderly transaction between market participants at the measurement date under current market conditions. A three-level hierarchy for fair value measurements has been established based upon the transparency of inputs to the valuation of an asset or liability. Inputs may be observable or unobservable and refer broadly to the assumptions that market participants would use in pricing the asset or liability. Observable inputs reflect the assumptions that market participants would use in pricing the asset or liability based on market data obtained from sources independent of the reporting entity. Unobservable inputs reflect the reporting entity’s own assumptions about the assumptions that market participants would use in pricing the asset or liability based on the best information available under the circumstances. The Series’ investment in its entirety is assigned a level based upon the observability of the inputs which are significant to the overall valuation. The three-level hierarchy of inputs is summarized below.
| | |
| Level 1 – | | Inputs are quoted prices in active markets for identical investments. (Examples: equity securities,open-end investment companies, futures contracts, and exchange-traded options contracts) |
| Level 2 – | | Other observable inputs, including, but not limited to: quoted prices for similar assets or liabilities in markets that are active, quoted prices for identical or similar assets or liabilities in markets that are not active, inputs other than quoted prices that are observable for the assets or liabilities (such as interest rates, yield curves, volatilities, prepayment speeds, loss severities, credit risks, and default rates) or other market-corroborated inputs. (Examples: debt securities, government securities, swap contracts, foreign currency exchange contracts, foreign securities utilizing international fair value pricing, broker-quoted securities, and fair valued securities) |
| Level 3 – | | Significant unobservable inputs, including the Series’ own assumptions used to determine the fair value of investments. (Examples: broker-quoted securities and fair valued securities) |
Level 3 investments are valued using significant unobservable inputs. The Series may also use an income-based valuation approach in which the anticipated future cash flows of the investment are discounted to calculate fair value. Discounts may also be applied due to the nature or duration of any restrictions on the disposition of the investments. Valuations may also be based upon current market prices of securities that are comparable in coupon, rating, maturity, and industry. The derived value of a Level 3 investment may not represent the value which is received upon disposition and this could impact the results of operations.
Special Situations Series-13
Delaware VIP® Special Situations Series
Notes to financial statements (continued)
3. Investments (continued)
The following table summarizes the valuation of the Series’ investments by fair value hierarchy levels as of Dec. 31, 2019:
| | | | |
Securities | | Level 1 | |
Assets: | | | | |
Common Stock | | $ | 234,147,377 | |
Short-Term Investments | | | 4,937,403 | |
| | | | |
Total Value of Securities | | $ | 239,084,780 | |
| | | | |
During the year ended Dec. 31, 2019, there were no transfers between Level 1 investments, Level 2 investments, or Level 3 investments that had a significant impact to the Series. The Series’ policy is to recognize transfers between levels based on fair value at the beginning of the reporting period.
A reconciliation of Level 3 investments is presented when the Series has a significant amount of Level 3 investments at the beginning, interim, or end of the period in relation to net assets. During the year ended Dec. 31, 2019, there were no Level 3 investments.
4. Dividend and Distribution Information
Income and long-term capital gain distributions are determined in accordance with federal income tax regulations, which may differ from US GAAP. Additionally, distributions from net short-term gains on sales of investment securities are treated as ordinary income for federal income tax purposes. The tax character of dividends and distributions paid during the years ended Dec. 31, 2019 and 2018 was as follows:
| | | | | | | | |
| | | Year ended | |
| | | 12/31/19 | | | 12/31/18 | |
Ordinary income | | | $ 1,634,303 | | | | $ 3,788,061 | |
Long-term capital gains | | | 15,635,997 | | | | 29,766,435 | |
| | | $17,270,300 | | | | $33,554,496 | |
5. Components of Net Assets on a Tax Basis
As of Dec. 31, 2019, the components of net assets on a tax basis were as follows:
| | | | |
Shares of beneficial interest | | | $196,366,856 | |
Undistributed ordinary income | | | 2,670,722 | |
Undistributed long-term capital gains | | | 17,172,883 | |
Net unrealized appreciation on investments | | | 23,139,487 | |
Net assets | | | $239,349,948 | |
The differences between the book basis and tax basis components of net assets are primarily attributable to tax deferral of losses on wash sales and partnership income.
For financial reporting purposes, capital accounts are adjusted to reflect the tax character of permanent book/tax differences. Reclassifications are primarily due to tax treatment of partnership income. Results of operations and net assets were not affected by these reclassifications. For the year ended Dec. 31, 2019, the Fund recorded the following reclassifications:
| | | | | | |
| | | Paid-in Capital | | | | Distributable Earnings |
| | $(78,650) | | | | $78,650 |
Special Situations Series-14
Delaware VIP® Special Situations Series
Notes to financial statements (continued)
6. Capital Shares
Transactions in capital shares were as follows:
| | | | | | | | |
| | | Year ended | |
| | | 12/31/19 | | | 12/31/18 | |
Shares sold: | | | | | | | | |
Standard Class | | | 162,943 | | | | 244,269 | |
Shares issued upon reinvestment of dividends and distributions: | | | | | | | | |
Standard Class | | | 569,038 | | | | 1,006,132 | |
| | | 731,981 | | | | 1,250,401 | |
Shares redeemed: | | | | | | | | |
Standard Class | | | (571,361 | ) | | | (366,438 | ) |
Net increase | | | 160,620 | | | | 883,963 | |
7. Line of Credit
On Nov. 4, 2019, the Series, along with certain other funds in the Delaware Funds (Participants), is a participant in a $250,000,000 revolving line of credit intended to be used for temporary or emergency purposes as an additional source of liquidity to fund redemptions of investor shares. Under the agreement, the Participants are charged an annual commitment fee of 0.15%, which is allocated across the Participants based on a weighted average of the respective net assets of each Participant. The Participants are permitted to borrow up to a maximum ofone-third of their net assets under the agreement. Each Participant is individually, and not jointly, liable for its particular advances, if any, under the line of credit. The line of credit available under the agreement expires on Nov. 2, 2020.
The Series had no amounts outstanding as of Dec. 31, 2019, or at any time during the period then ended.
8. Securities Lending
Effective Oct. 4, 2019, the Series, along with other funds in the Delaware Funds, may lend its securities pursuant to a security lending agreement (Lending Agreement) with The Bank of New York Mellon (BNY Mellon). At the time a security is loaned, the borrower must post collateral equal to the required percentage of the market value of the loaned security, including any accrued interest. The required percentage is: (1) 102% with respect to US securities and foreign securities that are denominated and payable in US dollars; and (2) 105% with respect to foreign securities. With respect to each loan, if on any business day, the aggregate market value of securities collateral plus cash collateral held is less than the aggregate market value of the securities which are the subject of such loan, the borrower will be notified to provide additional collateral by the end of the following business day, which, together with the collateral already held, will be not less than the applicable initial collateral requirements for such security loan. If the aggregate market value of securities collateral and cash collateral held with respect to a security loan exceeds the applicable initial collateral requirement, upon the request of the borrower, BNY Mellon must return enough collateral to the borrower by the end of the following business day to reduce the value of the remaining collateral to the applicable initial collateral requirement for such security loan. As a result of the foregoing, the value of the collateral held with respect to a loaned security on any particular day, may be more or less than the value of the security on loan. The collateral percentage with respect to the market value of the loaned security is determined by the security lending agent.
Cash collateral received by each series of the Trust is generally invested in a series of individual separate accounts, each corresponding to a series. The investment guidelines permit each separate account to hold certain securities that would be considered eligible securities for a money market fund. Cash collateral received is generally invested in government securities; certain obligations issued by government sponsored enterprises; repurchase agreements collateralized by US Treasury securities; obligations issued by the central government of any Organization for Economic Cooperation and Development (OECD) country or its agencies, instrumentalities, or establishments; obligations of supranational organizations; commercial paper, notes, bonds, and other debt obligations; certificates of deposit, time deposits, and other bank obligations; and asset-backed securities. The Series can also accept US government securities and letters of credit(non-cash collateral) in connection with securities loans.
In the event of default or bankruptcy by the lending agent, realization and/or retention of the collateral may be subject to legal proceedings. In the event the borrower fails to return loaned securities and the collateral received is insufficient to cover the value of the loaned securities and provided such collateral shortfall is not the result of investment losses, the lending agent has agreed to pay the amount of the shortfall to the Series or, at the discretion of the lending agent, replace the loaned securities. The Series continues to record dividends or interest, as applicable, on the securities loaned and is subject to changes in value of the securities loaned that may occur during the term of the loan. The Series has the right under the Lending Agreement to recover the securities from the borrower on demand. With respect to security loans collateralized bynon-cash collateral, the Series receives loan premiums paid by the
Special Situations Series-15
Delaware VIP® Special Situations Series
Notes to financial statements (continued)
8. Securities Lending (continued)
borrower. With respect to security loans collateralized by cash collateral, the earnings from the collateral investments are shared among the Series, the security lending agent, and the borrower. The Series records security lending income net of allocations to the security lending agent and the borrower.
The Series may incur investment losses as a result of investing securities lending collateral. This could occur if an investment in the collateral investment account defaulted or became impaired. Under those circumstances, the value of the Series’ cash collateral account may be less than the amount the Series would be required to return to the borrowers of the securities and the Series would be required to make up for this shortfall.
During the year ended Dec. 31, 2019, the Series had no securities out on loan.
9. Credit and Market Risk
The Series invests a significant portion of its assets in small- andmid-sized companies and may be subject to certain risks associated with ownership of securities of such companies. Investments in small- ormid-sized companies may be more volatile than investments in larger companies for a number of reasons, which include more limited financial resources or a dependence on narrow product lines.
The Series invests in REITs and is subject to the risks associated with that industry. If the Series holds real estate directly or receives rental income directly from real estate holdings, its tax status as a regulated investment company may be jeopardized. There were no direct real estate holdings during the year ended Dec. 31, 2019. The Series’ REIT holdings are also affected by interest rate changes, particularly if the REITs it holds use floating rate debt to finance their ongoing operations.
The Series may invest up to 10% of its net assets in illiquid securities, which may include securities with contractual restrictions on resale, securities exempt from registration under Rule 144A, promulgated under the Securities Act of 1933, as amended, and other securities which may not be readily marketable. The relative illiquidity of these securities may impair the Series from disposing of them in a timely manner and at a fair price when it is necessary or desirable to do so. While maintaining oversight, the Board has delegated to DMC theday-to-day functions of determining whether individual securities are liquid for purposes of the Series’ limitation on investments in illiquid securities. Securities eligible for resale pursuant to Rule 144A, which are determined to be liquid, are not subject to the Series’ 10% limit on investments in illiquid securities. As of Dec. 31, 2019, there were no Rule 144A securities held by the Series.
10. Contractual Obligations
The Series enters into contracts in the normal course of business that contain a variety of indemnifications. The Series’ maximum exposure under these arrangements is unknown. However, the Series has not had prior claims or losses pursuant to these contracts. Management has reviewed the Series’ existing contracts and expects the risk of loss to be remote.
11. Recent Accounting Pronouncements
In August 2018, the FASB issued an Accounting Standard Update (ASU), ASU2018-13, which changes certain fair value measurement disclosure requirements. The ASU2018-13, in addition to other modifications and additions, removes the requirement to disclose the amount and reasons for transfers between Level 1 and Level 2 of the fair value hierarchy, the policy for the timing of transfers between levels and the valuation process for Level 3 fair value measurements. The ASU2018-13 is effective for fiscal years, and interim periods within those fiscal years, beginning after Dec. 15, 2019. At this time, management is evaluating the implications of these changes on the financial statements.
12. Subsequent Events
Management has determined that no material events or transactions occurred subsequent to Dec. 31, 2019, that would require recognition or disclosure in the Series’ financial statements.
Special Situations Series-16
Delaware VIP® Trust — Delaware VIP Special Situations Series
Report of independent registered public accounting firm
To the Board of Trustees of Delaware VIP® Trust and Shareholders of Delaware VIP Special Situations Series
Opinion on the Financial Statements
We have audited the accompanying statement of assets and liabilities, including the schedule of investments, of Delaware VIP Special Situations Series (one of the series constituting Delaware VIP® Trust, referred to hereafter as the “Series”) as of December 31, 2019, the related statements of operations and changes in net assets, including the related notes, and the financial highlights for the year then ended (collectively referred to as the “financial statements”). In our opinion, the financial statements present fairly, in all material respects, the financial position of the Series as of December 31, 2019, the results of its operations, changes in its net assets, and the financial highlights for the year then ended in conformity with accounting principles generally accepted in the United States of America.
The financial statements of First Investors Life Series Special Situations Fund (subsequent to reorganization, known as Delaware VIP Special Situations Series) as of and for the year ended December 31, 2018 and the financial highlights for each of the periods ended on or prior to December 31, 2018 (not presented herein, other than the statement of changes in net assets and the financial highlights) were audited by other auditors whose report dated February 26, 2019 expressed an unqualified opinion on those financial statements and financial highlights.
Basis for Opinion
These financial statements are the responsibility of the Series’ management. Our responsibility is to express an opinion on the Series’ financial statements based on our audit. We are a public accounting firm registered with the Public Company Accounting Oversight Board (United States) (PCAOB) and are required to be independent with respect to the Series in accordance with the U.S. federal securities laws and the applicable rules and regulations of the Securities and Exchange Commission and the PCAOB.
We conducted our audit of these financial statements in accordance with the standards of the PCAOB. Those standards require that we plan and perform the audit to obtain reasonable assurance about whether the financial statements are free of material misstatement, whether due to error or fraud.
Our audit included performing procedures to assess the risks of material misstatement of the financial statements, whether due to error or fraud, and performing procedures that respond to those risks. Such procedures included examining, on a test basis, evidence regarding the amounts and disclosures in the financial statements. Our audit also included evaluating the accounting principles used and significant estimates made by management, as well as evaluating the overall presentation of the financial statements. Our procedures included confirmation of securities owned as of December 31, 2019 by correspondence with the custodian, transfer agents and brokers; when replies were not received from brokers, we performed other auditing procedures. We believe that our audit provides a reasonable basis for our opinion.
/s/PricewaterhouseCoopers LLP
Philadelphia, Pennsylvania
February 28, 2020
We have served as the auditor of one or more investment companies in Delaware Funds® by Macquarie since 2010.
Special Situations Series-17
Delaware VIP® Trust — Delaware VIP Special Situations Series
Other Series information (Unaudited)
Tax Information
All disclosures are based on financial information available as of the date of this annual report and, accordingly are subject to change. For any and all items requiring reporting, it is the intention of the Series to report the maximum amount permitted under the Internal Revenue Code and the regulations thereunder.
For the year ended Dec. 31, 2019, the Series reports distributions paid during the year as follows:
| | | | |
(A)
Long-Term
Capital Gain
Distributions
Tax Basis | | (B)
Ordinary Income
Distributions
(Tax Basis) | | Total
Distributions
(Tax Basis) |
| 90.54% | | 9.46% | | 100.00% |
(A) and (B) are based on a percentage of the Series’ total distributions.
Special SituationsSeries-18
Delaware Funds® by Macquarie
Board of trustees / directors and officers addendum
A mutual fund is governed by a Board of Trustees/Directors (“Trustees”), which has oversight responsibility for the management of a fund’s business affairs. Trustees establish procedures and oversee and review the performance of the investment manager, the distributor, and others who perform services for the fund. The independent fund trustees, in particular, are advocates for shareholder interests. Each trustee has served in that capacity since he or she was elected to or appointed to the Board of Trustees, and will continue to serve until his or her retirement or the election of a new trustee in his or her place. The following is a list of the Trustees and Officers with certain background and related information.
| | | | | | | | | | |
Name, Address, and Birth Date | | Position(s) Held with Fund(s) | | Length of Time
Served | | Principal
Occupation(s)
During the Past Five Years | | Number of
Portfolios in Fund
Complex Overseen
by Trustee or Officer | | Other
Directorships
Held by Trustee or Officer |
| INTERESTED TRUSTEE | | | | | | | | | | |
| | | | | |
Shawn K. Lytle1
2005 Market Street Philadelphia, PA 19103 February 1970 | | President, Chief Executive Officer, and Trustee | | President and Chief Executive Officer since August 2015 Trustee since September 2015 | | President — Macquarie Investment Management2
(June 2015-Present) Regional Head of Americas — UBS Global Asset Management(April 2010-May 2015) | | 95 | | Trustee — UBS Relationship Funds, SMA Relationship Trust, and UBS Funds
(May 2010–April 2015) |
INDEPENDENT TRUSTEES | | | | | | |
| | | | | |
Thomas L. Bennett
2005 Market Street Philadelphia, PA 19103 October 1947 | | Chair and Trustee | | Trustee since March 2005 Chair since March 2015 | | Private Investor (March 2004–Present) | | 95 | | None |
| | | | | |
Jerome D. Abernathy
2005 Market Street Philadelphia, PA 19103 July 1959 | | Trustee | | Since January 2019 | | Managing Member, Stonebrook Capital Management, LLC (financial technology: macro factors and databases) (January 1993–Present) | | 95 | | None |
| | | | | |
Ann D. Borowiec
2005 Market Street Philadelphia, PA 19103 November 1958 | | Trustee | | Since March 2015 | | Chief Executive Officer, Private Wealth Management (2011–2013) and Market Manager, New Jersey Private Bank (2005–2011) — J.P. Morgan Chase & Co. | | 95 | | Director —
Banco Santander International (October 2016–December 2019) Director — Santander Bank, N.A. (December 2016–December 2019) |
| | | | | |
Joseph W. Chow
2005 Market Street Philadelphia, PA 19103 January 1953 | | Trustee | | Since January 2013 | | Private Investor (April 2011–Present) | | 95 | | Director and Audit Committee Member — Hercules Technology Growth Capital, Inc. (July 2004–July 2014) |
Special SituationsSeries-19
| | | | | | | | | | |
Name, Address, and Birth Date | | Position(s) Held with Fund(s) | | Length of Time
Served | | Principal
Occupation(s)
During the Past Five Years | | Number of
Portfolios in Fund
Complex Overseen
by Trustee or Officer | | Other
Directorships
Held by Trustee or Officer |
| | | | | |
John A. Fry
2005 Market Street Philadelphia, PA 19103 May 1960 | | Trustee | | Since January 2001 | | President — Drexel University (August 2010–Present) President — Franklin & Marshall College (July 2002–July 2010) | | 95 | | Director; Compensation Committee and Governance Committee Member — Community Health Systems (May 2004–Present) Director — Drexel Morgan & Co. (2015–Present) Director and Audit Committee Member — vTv Therapeutics LLC (2017–Present) Director and Audit Committee Member — FS Credit Real Estate Income Trust, Inc. (2018–Present) Director — Federal Reserve Bank of Philadelphia (January 2020–Present) |
| | | | | |
Lucinda S. Landreth
2005 Market Street Philadelphia, PA 19103 June 1947 | | Trustee | | Since March 2005 | | Private Investor (2004–Present) | | 95 | | None |
| | | | | |
Frances A. Sevilla-Sacasa2005 Market Street Philadelphia, PA 19103 January 1956 | | Trustee | | Since September 2011 | | Private Investor (January 2017-Present) Chief Executive Officer — Banco Itaú International (April 2012–December 2016) Executive Advisor to Dean (August 2011–March 2012) and Interim Dean (January 2011–July 2011) — University of Miami School of Business Administration President — U.S. Trust, Bank of America Private Wealth Management (Private Banking) (July 2007–December 2008) | | 95 | | Trust Manager and Audit Committee Chair — Camden Property Trust (August 2011–Present) Director; Strategic Planning and Reserves Committee and Nominating and Governance Committee Member — Callon Petroleum Company (December 2019–Present) Director; Audit Committee Member — Carrizo Oil & Gas, Inc. (March 2018–December 2019) |
| | | | | |
Thomas K. Whitford
2005 Market Street Philadelphia, PA 19103 March 1956 | | Trustee | | Since January 2013 | | Vice Chairman (2010–April 2013) — PNC Financial Services Group | | 95 | | Director — HSBC North America Holdings Inc. (December 2013-Present) Director — HSBC USA Inc. (July 2014-Present) Director — HSBC Bank USA, National Association (July 2014-March 2017) Director — HSBC Finance Corporation (December 2013-April 2018) |
Special SituationsSeries-20
| | | | | | | | | | |
Name, Address, and Birth Date | | Position(s) Held with Fund(s) | | Length of Time
Served | | Principal
Occupation(s)
During the Past Five Years | | Number of
Portfolios in Fund
Complex Overseen
by Trustee or Officer | | Other
Directorships
Held by Trustee or Officer |
Christianna Wood
2005 Market Street Philadelphia, PA 19103 March 1956 | | Trustee | | Since January 2019 | | Chief Executive Officer and President — Gore Creek Capital, Ltd. (August 2009–Present) | | 95 | | Director; Finance Committee and Audit Committee Member — H&R Block Corporation (July 2008–Present) Director; Chair of Investments Committee and Audit Committee Member — Grange Insurance (2013–Present) Trustee; Chair of Nominating and Governance Committee and Audit Committee Member — The Merger Fund (2013–Present), The Merger Fund VL (2013–Present); WCM Alternatives: Event-Driven Fund (2013–Present), and WCM Alternatives: Credit Event Fund (December 2017–Present) Director; Chair of Governance Committee and Audit Committee Member — International Securities Exchange (2010–2016) |
| | | | | |
Janet L. Yeomans
2005 Market Street Philadelphia, PA 19103 July 1948 | | Trustee | | Since April 1999 | | Vice President and Treasurer (January 2006–July 2012), Vice President — Mergers & Acquisitions (January 2003–January 2006), and Vice President and Treasurer (July 1995–January 2003) — 3M Company | | 95 | | Director; Personnel and Compensation Committee Chair; Member of Nominating, Investments, and Audit Committees for various periods throughout directorship — Okabena Company (2009-2017) |
Special SituationsSeries-21
| | | | | | | | | | |
Name, Address, and Birth Date | | Position(s) Held with Fund(s) | | Length of Time
Served | | Principal
Occupation(s)
During the Past Five Years | | Number of
Portfolios in Fund
Complex Overseen
by Trustee or Officer | | Other
Directorships
Held by Trustee or Officer |
| OFFICERS | | | | | | | | | | |
| | | | | |
David F. Connor
2005 Market Street Philadelphia, PA 19103 December 1963 | | Senior Vice President,
General Counsel,
and Secretary | | Senior Vice President, since May 2013; General Counsel since May 2015; Secretary since October 2005 | | David F. Connor has served in various capacities at different times at Macquarie Investment Management. | | 95 | | None3 |
| | | | | |
Daniel V. Geatens
2005 Market Street Philadelphia, PA 19103 October 1972 | | Vice President and Treasurer | | Vice President and Treasurer since October 2007 | | Daniel V. Geatens has served in various capacities at different times at Macquarie Investment Management. | | 95 | | None3 |
| | | | | |
Richard Salus
2005 Market Street Philadelphia, PA 19103 October 1963 | | Senior Vice President and Chief Financial Officer | | Senior Vice President and Chief Financial Officer since November 2006 | | Richard Salus has served in various capacities at different times at Macquarie Investment Management. | | 95 | | None |
| 1 | Shawn K. Lytle is considered to be an “Interested Trustee” because he is an executive officer of the Fund’s(s’) investment advisor. |
| 2 | Macquarie Investment Management is the marketing name for Macquarie Management Holdings, Inc. and its subsidiaries, including the Fund’s(s’) investment advisor, principal underwriter, and its transfer agent. |
| 3 | David F. Connor and Daniel V. Geatens serve in similar capacities for the six portfolios of the Optimum Fund Trust, which have the same investment advisor, principal underwriter, and transfer agent as the registrant. Mr. Geatens also serves as the Chief Financial Officer of the Optimum Fund Trust and he is the Chief Financial Officer and Treasurer for Macquarie Global Infrastructure Total Return Fund Inc. |
The Statement of Additional Information for the Fund(s) includes additional information about the Trustees and Officers and is available, without charge, upon request by calling 800523-1918.
Special SituationsSeries-22
| | | | |
| | |
| | The Series files its complete schedule of portfolio holdings with the Securities and Exchange Commission (SEC) for the first and third quarters of each fiscal year on FormN-Q or FormN-PORT (available for filings after March 31, 2019). The Series’ FormsN-Q or FormsN-PORT, as well as a description of the policies and procedures that the Series uses to determine how to vote proxies (if any) relating to portfolio securities, are available without charge (i) upon request, by calling 800523-1918; and (ii) on the SEC’s website at sec.gov. In addition, a description of the policies and procedures that the Series uses to determine how to vote proxies (if any) relating to portfolio securities and the Schedule of Investments included in the Series’ most recent FormN-Q or FormN-PORT are available without charge on the Series’ website at delawarefunds.com/vip/literature. The Series’ FormsN-Q and FormsN-PORT may be reviewed and copied at the SEC’s Public Reference Room in Washington, D.C.; information on the operation of the Public Reference Room may be obtained by calling 800SEC-0330. Information (if any) regarding how the Series voted proxies relating to portfolio securities during the most recently disclosed12-month period ended June 30 is available without charge (i) through the Series’ website at delawarefunds.com/proxy; and (ii) on the SEC’s website at sec.gov. | | |
| | |
| AR-VIPSS 22500 (2/20) (1076649) | | Special SituationsSeries-23 |

Delaware VIP® Trust
Delaware VIP Total Return Series
(formerly, First Investors Life Series Total Return Fund)
December 31, 2019
Beginning on or about June 1, 2021, as permitted by regulations adopted by the Securities and Exchange Commission, paper copies of your Series’ shareholder reports will no longer be sent to you by mail, unless you specifically request them from the Series or from your financial intermediary, such as a broker/dealer, bank, or insurance company. Instead, you will be notified by mail each time a report is posted on the website and provided with a link to access the report.
If you already elected to receive shareholder reports electronically, you will not be affected by this change and you do not need to take any action.
You may elect to receive paper copies of all future shareholder reports free of charge. You can inform the Series that you wish to continue receiving paper copies of your shareholder reports by contacting us at 800523-1918. If you own these shares through a financial intermediary, you may contact your financial intermediary to elect to continue to receive paper copies of your shareholder reports. Your election to receive reports in paper will apply to all funds held with the Delaware Funds® by Macquarie or your financial intermediary.

Table of contents
Other than Macquarie Bank Limited (MBL), none of the entities noted are authorized deposit-taking institutions for the purposes of the Banking Act 1959 (Commonwealth of Australia). The obligations of these entities do not represent deposits or other liabilities of MBL. MBL does not guarantee or otherwise provide assurance in respect of the obligations of these entities, unless noted otherwise. The Series is governed by US laws and regulations.
Unless otherwise noted, views expressed herein are current as of Dec. 31, 2019, and subject to change for events occurring after such date.
The Series is not FDIC insured and is not guaranteed. It is possible to lose the principal amount invested.
Advisory services provided by Delaware Management Company, a series of Macquarie Investment Management Business Trust (MIMBT), a US registered investment advisor.
The Series is distributed byDelaware Distributors, L.P.(DDLP), an affiliate of MIMBT and Macquarie Group Limited. Macquarie Investment Management (MIM) is the marketing name for certain companies comprising the asset management division of Macquarie Group Limited and its subsidiaries and affiliates worldwide.
This material may be used in conjunction with the offering of shares in Delaware VIP® Total Return Series only if preceded or accompanied by the Series’ current prospectus or the summary prospectus.
© 2020 Macquarie Management Holdings, Inc.
All third-party marks cited are the property of their respective owners.
| | |
Delaware VIP®Trust — Delaware VIP Total Return Series |
Portfolio management review | | January 7, 2020 (Unaudited) |
The investment objective of the Series is to seek to provide sustainable current income with potential for capital appreciation with moderate investment risk.
Effective after the close of business on Oct. 4, 2019, Delaware Management Company (DMC or Manager), a series of Macquarie Investment Management Business Trust (MIMBT), serves as the investment manager for the Series.* During the period after the close of business on Oct. 4, 2019 to Dec. 31, 2019, the Manager repositioned the portfolio in accordance with the Series’ investment objective and principal investment strategies, as described in the prospectus. The investment objective is the same and its principal investment strategies are the same or similar to those of the corresponding Life Series Fund.
For the fiscal year ended Dec. 31, 2019, Delaware VIP Total Return Series (the “Series”) Standard Class shares gained 18.88%. The Series’ Service Class shares gained 3.63% since its inception date (Oct. 31, 2019). Both figures reflect all dividends reinvested. The Series’ primary benchmark, the S&P 500® Index, advanced 31.49% for the1-year period. Its new secondary benchmarks, the Bloomberg Barclays US Aggregate Index and a blend of 60% S&P 500 Index / 40% Bloomberg Barclays US Aggregate Index, gained 8.72% and 22.18%, respectively, for the same period. The Series’ previous secondary benchmark, the ICE BofA US Corporate, Government & Mortgage Index, advanced 8.96% for the12-month period.
The Series’ fiscal year ended Dec. 31, 2019 began with a meaningful reversal in the equity and bond markets following the sharp selloff in December 2018. Conditions for most asset classes had turned significantly positive and generally remained that way throughout 2019. Global financial markets marched ahead, as central banks globally signaled their intent to provide monetary support for their respective economies.
These central banks included the US Federal Reserve, which gradually shifted from a policy of raising interest rates to one of cutting them. The shift took place against a backdrop of consistent US economic growth with few signs of inflation. In December 2018, prior to the Series’ reporting period, the Fed raised its benchmark short-term interest rate by 0.25 percentage points – it was the central bank’s seventh such rate increase in the previous two years. The Fed then kept the federal funds rate steady until late July 2019, when it initiated its first of three successive0.25-percentage-point rate cuts. By fiscal year end, the federal funds rate was within a range of 1.50% to 1.75% – where it had been inmid-2018.
The Fed’s monetary policy shift came amid the US economy’s weakest quarterly performance of the fiscal year. US gross domestic product (GDP), a measure of national economic output, grew by an annualized rate of just 1.1% in the final three months of 2018, but by the first quarter of 2019, US annual GDP growth accelerated to 3.1%. The national economy subsequently expanded by 2.0% and 2.1% in the year’s second and third quarters, respectively. Meanwhile, the US unemployment rate declined further, reaching 3.5% in November 2019 – the lowest since 1969. (Sources: US Bureau of Economic Analysis and US Bureau of Labor Statistics.)
The shift in Fed interest rate policy was the main driver behind the favorable results seen across all the Series’ asset classes, as financial markets benefited strongly from the increase in global liquidity.
For the fiscal year ended Dec. 31, 2019, USlarge-cap value stocks, as measured by the Russell 1000® Value Index, gained 26.54%, as the equity market recovered from a December 2018 market correction to produce steady gains throughout the rest of the12-month period. In comparison, international developed market stocks, as measured by the MSCI EAFE (Europe, Australasia, Far East) Index (net), gained 22.01% over the same time frame. US stocks tended to outperform their international counterparts, reflecting better growth fundamentals in the United States.
High yield corporate bonds gained 14.32%, as reflected in the performance of the Bloomberg Barclays US Corporate High-Yield Index. During the fiscal year, high yield bonds benefited from narrowing credit spreads, indicating that investors were willing to accept gradually less income in exchange for taking on credit risk. Investment grade debt rose 8.72%, as measured by the Bloomberg Barclays US Aggregate Index. The Bloomberg Barclays Municipal Bond Index, a proxy for the municipal bond market, gained 7.54%.
Source: Bloomberg.
The Series may invest in derivatives, which may involve additional expenses and are subject to risk, including the risk that an underlying security or securities index moves in the opposite direction from what the portfolio manager anticipated. A derivatives transaction depends upon the counterparties’ ability to fulfill their contractual obligations.
Unless otherwise noted, views expressed herein are current as of Dec. 31, 2019, and subject to change.
Total Return Series-1
| | |
Delaware VIP®Trust — Delaware VIP Total Return Series |
Portfolio management review (continued) | | January 7, 2020 (Unaudited) |
Foresters Investment Management Company, Inc. (FIMCO) managed the Series from Jan. 1, 2019 to Oct. 4, 2019, when the management of the Series transitioned to DMC. The following is a discussion about Series performance during that period ended Oct. 4, 2019:
Equities
During the Jan. 1, 2019 to Oct. 4, 2019 period, the Series’ equity portion returns were driven by itslarge-cap core positions. In the industrials sector, the Series’ defense stocks led performance. Severallarge-cap holdings in the healthcare sector also contributed to performance. In financials, the Series’ investment in asmall-cap investment management firm focused on private equity and private credit funds contributed to performance. The Series’ investment insmall-cap banks also generated a positive return for the period despite the flattening of the yield curve.
The Series underperformed in both the real estate and utilities sectors, as the equity portion of the Series did not invest in high yielding stocks, including REITs and utilities, during this period.
Fixed income
During the Jan. 1, 2019 to Oct. 4, 2019 period, the Series’ fixed income portion returns were predominantly a function of its overweight to corporate bonds, the strongest-performing asset class during this period. The Series’ overweight to30-year US Treasurys relative to the benchmark also contributed to performance.
*On April 6, 2019, FIMCO, the investment adviser to the First Investors Funds, entered into an agreement with Macquarie Management Holdings, Inc. (MMHI), whereby MMHI, on behalf of its affiliate DMC, would acquire FIMCO’s asset management business (the “Transaction”). In connection with the Transaction, the Board of Trustees of the First Investors Trusts and the First Investors Fund shareholders approved, pursuant to an Agreement and Plan of Reorganization (the “Agreement”), the transfer of all assets and liabilities of each First Investors Fund to a corresponding, newly formed fund in the Delaware Funds® by Macquarie family of funds. The Transaction closed on Oct. 4, 2019.
Unless otherwise noted, views expressed herein are current as of Dec. 31, 2019, and subject to change.
Total Return Series-2
Delaware VIP® Trust — Delaware VIP Total Return Series
Performance summary (Unaudited)
The performance quoted represents past performance and does not guarantee future results. Investment return and principal value of an investment will fluctuate so that shares, when redeemed, may be worth more or less than their original cost. Current performance may be lower or higher than the performance quoted.
Carefully consider the Series’ investment objectives, risk factors, charges, and expenses before investing. This and other information can be found in the Series’ prospectus and its summary prospectus, which may be obtained by visiting delawarefunds.com/vip/literature or calling 800523-1918. Investors should read the prospectus and the summary prospectus carefully before investing.
| | | | | | | | | | | | | | | | |
Delaware VIP Total Return Series | | | | | | | | | | | | | | | | |
Average annual total returns | | | | | | | | | | | | | | | | |
| For periods ended Dec. 31, 2019 | | 1 year | | | 3 year | | | 5 year | | | Lifetime | |
Standard Class shares (commenced operations on Dec. 17, 2012) | | | +18.88 | % | | | +7.05 | % | | | +5.17 | % | | | +6.76 | % |
| | | | | | | | | | | | | | | | |
Service Class shares (commenced operations on Oct. 31, 2019) | | | – | | | | – | | | | – | | | | +3.63 | % |
| | | | | | | | | | | | | | | | |
S&P 500 Index | | | +31.49 | % | | | +15.27 | % | | | +11.70 | % | | | – | |
| | | | | | | | | | | | | | | | |
60% S&P 500 Index/40% Bloomberg Barclays US Aggregate Index | | | +22.18 | % | | | +10.87 | % | | | +8.37 | % | | | – | |
| | | | | | | | | | | | | | | | |
Bloomberg Barclays US Aggregate Index | | | +8.72 | % | | | +4.03 | % | | | +3.05 | % | | | – | |
| | | | | | | | | | | | | | | | |
ICE BofA US Corporate, Government & Mortgage Index | | | +8.96 | % | | | +4.14 | % | | | +3.11 | % | | | – | |
Returns reflect the reinvestment of all distributions. Please see page 5 for a description of the indices.
As described in the Series’ most recent prospectus, the net expense ratio for Standard Class shares and Service Class shares of the Series were 0.86% and 1.16%, respectively, while total operating expenses for Standard Class and Service Class shares were 0.87% and 1.17%, respectively. The management fee for Standard Class and Service Class shares was 0.65%. The Series’ investment manager, Delaware Management Company (Manager), has contractually agreed to waive all or a portion of its investment advisory fees and/or pay/reimburse expenses (excluding any12b-1 fees, acquired fund fees and expenses, taxes, interest, short sale and dividend interest expenses, brokerage fees, certain insurance costs, and nonroutine expenses or costs, including, but not limited to, those relating to reorganizations, litigation, conducting shareholder meetings, and liquidations) in order to prevent annual series operating expenses from exceeding 0.86% of the Series’ average daily net assets for the Standard Class and 1.16% for the Service Class from Oct. 4, 2019 through Dec. 31, 2019.* Please see the most recent prospectus and any applicable supplement(s) for additional information on these fee waivers and/or reimbursements. Please see the “Financial highlights” section in this report for the most recent expense ratios.
The Series pays Delaware Distributors, L.P. (DDLP), the distributor and an affiliate of DMC, an annual12b-1 fee of 0.30% of the average daily net assets of the Service Class shares.
Earnings from a variable annuity or variable life investment compoundtax-free until withdrawal, and as a result, no adjustments were made for income taxes.
Expense limitations were in effect for both classes during certain periods shown in the Series performance table above and in the Performance of a $10,000 Investment graph on the next page.
Performance data do not reflect insurance fees related to a variable annuity or variable life investment or the deferred sales charge that would apply to certain withdrawals of investments held for fewer than eight years. Performance shown here would have been reduced if such fees were included and the expense limitation removed. For more information about fees, consult your variable annuity or variable life prospectus.
Investments in variable products involve risk.
Fixed income securities and bond funds can lose value, and investors can lose principal, as interest rates rise. They also may be affected by economic conditions that hinder an issuer’s ability to make interest and principal payments on its debt.
The Series may also be subject to prepayment risk, the risk that the principal of a fixed income security that is held by the Series may be prepaid prior to maturity, potentially forcing the Series to reinvest that money at a lower interest rate.
High yielding,non-investment-grade bonds (junk bonds) involve higher risk than investment grade bonds.
Total Return Series-3
Delaware VIP® Total Return Series
Performance summary (Unaudited) (continued)
International investments entail risks not ordinarily associated with US investments including fluctuation in currency values, differences in accounting principles, or economic or political instability in other nations. Investing in emerging markets can be riskier than investing in established foreign markets due to increased volatility and lower trading volume.
Investments in small and/ormedium-sized companies typically exhibit greater risk and higher volatility than larger, more established companies.
REIT investments are subject to many of the risks associated with direct real estate ownership, including changes in economic conditions, credit risk, and interest rate fluctuations.
Risk controls and asset allocation models do not promise any level of performance or guarantee against loss of principal.
An exchange-traded fund (ETF) is a security that represents all the stocks on a given exchange. ETF shares can be bought, sold, short-sold, traded on margin, and generally function as if they were stocks.
Liquidity risk is the possibility that investments cannot be readily sold within seven days at approximately the price at which a fund has valued them.
The Series may invest in derivatives, which may involve additional expenses and are subject to risk, including the risk that an underlying security or securities index moves in the opposite direction from what the portfolio manager anticipated. A derivatives transaction depends upon the counterparties’ ability to fulfill their contractual obligations.
LIBOR risk is the risk that potential changes related to the use of the London interbank offered rate (LIBOR) could have adverse impacts on financial instruments which reference LIBOR. The potential abandonment of LIBOR could affect the value and liquidity of instruments which reference LIBOR.
Please read both the contract and underlying prospectus for specific details regarding the product’s risk profile.
*The aggregate contractual waiver period covering this report is from Oct. 4, 2019 through Oct. 31, 2021.
| | | | | | |
For period beginning Dec. 17, 2012 (Series’ inception date) through Dec. 31, 2019 | | Starting value | | Ending value |
— | | S&P 500 Index | | $10,000 | | $26,422 |
--- | | 60% S&P 500 Index / 40% Bloomberg Barclays US Aggregate Index | | $10,000 | | $19,554 |
— | | Delaware VIP Total Return Series (Standard Class) | | $10,000 | | $15,846 |
— | | ICE BofA US Corporate, Government & Mortgage Index | | $10,000 | | $12,111 |
--- | | Bloomberg Barclays US Aggregate Index | | $10,000 | | $12,066 |
The graph shows a $10,000 investment in the Delaware VIP Total Return Series Standard Class shares for the period from Dec. 17, 2012 through Dec. 31, 2019.
Total Return Series-4
Delaware VIP® Total Return Series
Performance summary (Unaudited) (continued)
The graph also shows $10,000 invested in the S&P 500 Index, 60% S&P 500 Index / 40% Bloomberg Barclays US Aggregate Index, the Bloomberg Barclays US Aggregate Index, and the ICE BofA US Corporate, Government & Mortgage Index for the period from Dec. 17, 2012 through Dec. 31, 2019.
The S&P 500 Index measures the performance of 500 mostlylarge-cap stocks weighted by market value, and is often used to represent performance of the US stock market.
The Bloomberg Barclays US Aggregate Index measures the performance of publicly issued investment grade(Baa3/BBB- or better) corporate, US government, mortgage- and asset-backed securities with at least one year to maturity and at least $300 million par amount outstanding.
The ICE BofA US Corporate, Government & Mortgage Index tracks the performance of US dollar denominated investment grade debt publicly issued in the US domestic market, including US Treasurys, quasi-governments, corporates, covered bonds and residential mortgage pass-throughs.Non-residential mortgage collateralized debt such as commercial mortgage-backed securities (CMBS) and asset-backed securities (ABS) are excluded from the index, as are all collateralized mortgage obligations (CMOs). With the exception of local currency sovereign debt, qualifying securities must have an investment grade rating (based on an average of Moody’s, S&P, and Fitch). In addition, qualifying securities must have at least one year remaining term to final maturity, at least 18 months to final maturity at point of issuance, and a fixed coupon schedule.
The Russell 1000 Value Index, mentioned on page 1, measures the performance of thelarge-cap value segment of the US equity universe. It includes those Russell 1000 companies with lowerprice-to-book ratios and lower forecasted growth values.
The MSCI EAFE (Europe, Australasia, Far East) Index, mentioned on page 1, represents large- andmid-cap stocks across 21 developed markets, excluding the United States and Canada. The index covers approximately 85% of the free float-adjusted market capitalization in each country. Index “net” return approximates the minimum possible dividend reinvestment, after deduction of withholding tax at the highest possible rate.
The Bloomberg Barclays US Corporate High-Yield Index, mentioned on page 1, is composed of US dollar-denominated, noninvestment-grade corporate bonds for which the middle rating among Moody’s Investors Service, Inc., Fitch, Inc., and Standard & Poor’s is Ba1/BB+/BB+ or below.
The Bloomberg Barclays Municipal Bond Index, mentioned on page 1, measures the total return performance of the long-term, investment gradetax-exempt bond market.
Gross domestic product is a measure of all goods and services produced by a nation in a year.
Frank Russell Company is the source and owner of the trademarks, service marks and copyrights related to the Russell Indexes. Russell® is a trademark of Frank Russell Company.
Index performance returns do not reflect any management fees, transaction costs or expenses. Indices are unmanaged and one cannot invest directly in an index.
Performance of Service Class shares will vary due to different charges and expenses.
Past performance is not a guarantee of future results.
Total Return Series-5
Delaware VIP® Trust — Delaware VIP Total Return Series
Disclosure of Series expenses
For thesix-month period from July 1, 2019 to December 31, 2019(Unaudited)
As a shareholder of the Series, you incur ongoing costs, which may include management fees; distribution and service(12b-1) fees; and other Series expenses. This example is intended to help you understand your ongoing costs (in dollars) of investing in the Series and to compare these costs with the ongoing costs of investing in other mutual funds.
The example is based on an investment of $1,000 invested at the beginning of the period and held for the entiresix-month period from July 1, 2019 to Dec. 31, 2019.
Actual expenses
The first section of the table shown, “Actual Series return,” provides information about actual account values and actual expenses. You may use the information in this section of the table, together with the amount you invested, to estimate the expenses that you paid over the period. Simply divide your account value by $1,000 (for example, an $8,600 account value divided by $1,000 = 8.6), then multiply the result by the number in the first section under the heading entitled “Expenses Paid During Period” to estimate the expenses you paid on your account during the period.
Hypothetical example for comparison purposes
The second section of the table shown, “Hypothetical 5% return,” provides information about hypothetical account values and hypothetical expenses based on the Series’ actual expense ratio and an assumed rate of return of 5% per year before expenses, which is not the Series’ actual return. The hypothetical account values and expenses may not be used to estimate the actual ending account balance or expenses you paid for the period. You may use this information to compare the ongoing costs of investing in the Series and other funds. To do so, compare this 5% hypothetical example with the 5% hypothetical examples that appear in the shareholder reports of other funds.
Please note that the expenses shown in the table are meant to highlight your ongoing costs only. As a shareholder of the Series, you do not incur any transaction costs, such as sales charges (loads), redemption fees or exchange fees, but shareholders of other funds may incur such costs. Also, the fees related to the variable annuity investment or the deferred sales charge that could apply have not been included. Therefore, the second section of the table is useful in comparing ongoing costs only, and will not help you determine the relative total costs of owning different funds. The Series’ expenses shown in the table reflect fee waiver in effect and assume reinvestment of all dividends and distributions.
Expense analysis of an investment of $1,000
| | | | | | | | |
| | | Beginning
Account
Value
7/1/19 | | Ending
Account
Value
12/31/19 | | Annualized
Expense
Ratio | | Expenses
Paid During
Period
7/1/19 to
12/31/19* |
|
Actual Series return† |
Standard Class | | $1,000.00 | | $1,053.10 | | 0.99% | | $5.12 |
Service Class** | | 1,000.00 | | 1,036.30 | | 1.16% | | 1.97 |
| |
Hypothetical 5% return(5% return before expenses) |
Standard Class | | $1,000.00 | | $1,020.21 | | 0.99% | | $5.04 |
Service Class** | | 1,000.00 | | 1,019.36 | | 1.16% | | 5.90 |
| *“ | Expenses Paid During Period” are equal to the Series’ annualized expense ratio, multiplied by the average account value over the period, multiplied by 184/365 (to reflect theone-half year period). |
| ** | The Service Class shares commenced operations on Oct. 31, 2019. The ending account value for “Actual” uses the performance since inception and is not annualized and the expenses paid during the period for “Actual ”are equal to the Service Class annualized expense ratio, multiplied by 61/365 (to reflect the actual days since inception). |
| † | Because actual returns reflect only the most recentsix-month period, the returns shown may differ significantly from fiscal year returns. |
In addition to the Series’ expenses reflected above, the Series also indirectly bears its portion of the fees and expenses of the investment companies (Underlying Funds) in which it invests. The table above does not reflect the expenses of the Underlying Fund.
Total Return Series-6
Delaware VIP® Trust — Delaware VIP Total Return Series
Security type / sector allocation
As of December 31, 2019 (Unaudited)
Sector designations may be different than the sector designations presented in other Series materials. The sector designations may represent the investment manager’s internal sector classifications.
| | |
| Security type / sector | | Percentage of
net assets |
Agency Mortgage-Backed Securities | | 1.02% |
Convertible Bonds | | 8.74% |
Capital Goods | | 0.38% |
Communications | | 1.39% |
Consumer Cyclical | | 0.47% |
ConsumerNon-Cyclical | | 1.26% |
Electric | | 0.29% |
Energy | | 1.18% |
Financials | | 0.65% |
Real Estate Investment Trusts | | 0.33% |
Technology | | 2.79% |
Corporate Bonds | | 13.36% |
Banking | | 1.27% |
Basic Industry | | 1.49% |
Brokerage | | 0.03% |
Capital Goods | | 0.56% |
Communications | | 1.31% |
Consumer Cyclical | | 1.16% |
ConsumerNon-Cyclical | | 0.70% |
Electric | | 0.29% |
Energy | | 1.70% |
Finance Companies | | 0.06% |
Financials | | 0.63% |
Healthcare | | 0.90% |
Insurance | | 0.29% |
| | |
| Security type / sector | | Percentage of
net assets |
Media | | 1.39% |
Real Estate Investment Trusts | | 0.23% |
Services | | 0.19% |
Technology | | 0.08% |
Technology & Electronics | | 0.39% |
Transportation | | 0.02% |
Utilities | | 0.67% |
Municipal Bonds | | 2.16% |
Non-Agency Asset-Backed Security | | 0.17% |
Non-Agency Commercial Mortgage-Backed Securities | | 0.44% |
Sovereign Bonds | | 0.39% |
US Treasury Obligations | | 0.76% |
Common Stock | | 66.04% |
Closed-End Funds | | 0.29% |
Convertible Preferred Stock | | 2.21% |
Preferred Stock | | 0.11% |
Exchange-Traded Funds | | 0.99% |
Short-Term Investments | | 2.98% |
Total Value of Securities | | 99.66% |
Receivables and Other Assets Net of Liabilities | | 0.34% |
Total Net Assets | | 100.00% |
Total Return Series-7
Delaware VIP® Trust — Delaware VIP Total Return Series
Schedule of investments
December 31, 2019
| | | | | | | | |
| | | Principal
amount° | | | Value
(US $) | |
Agency Mortgage-Backed
Securities – 1.02% | | | | | | | | |
Fannie Mae S.F. 30 yr | | | | | | | | |
3.00% 12/1/46 | | | 76,712 | | | $ | 78,519 | |
3.00% 11/1/48 | | | 103,404 | | | | 105,336 | |
3.50% 12/1/49 | | | 68,893 | | | | 72,179 | |
4.00% 3/1/47 | | | 69,789 | | | | 73,497 | |
4.50% 8/1/41 | | | 63,011 | | | | 68,575 | |
5.00% 3/1/42 | | | 56,225 | | | | 61,872 | |
Freddie Mac S.F. 30 yr | | | | | | | | |
3.50% 7/1/44 | | | 46,898 | | | | 49,616 | |
4.50% 12/1/43 | | | 81,821 | | | | 88,606 | |
| | | | | | | | |
Total Agency Mortgage-Backed
Securities (cost $599,112) | | | | 598,200 | |
| | | | | | | | |
| | |
Convertible Bonds – 8.74% | | | | | | | | |
Capital Goods – 0.38% | | | | | | | | |
Chart Industries 144A 1.00% exercise price $58.73, maturity date 11/15/24 # | | | 102,000 | | | | 134,548 | |
Dycom Industries 0.75% exercise price $96.89, maturity date 9/15/21 | | | 88,000 | | | | 85,727 | |
| | | | | | | | |
| | | | | | | 220,275 | |
| | | | | | | | |
Communications – 1.39% | | | | | | | | |
DISH Network 2.375% exercise price $82.22, maturity date 3/15/24 | | | 242,000 | | | | 221,878 | |
GCI Liberty 144A 1.75% exercise price $370.52, maturity date 9/30/46 # | | | 184,000 | | | | 254,196 | |
InterDigital 144A 2.00% exercise price $81.29, maturity date 6/1/24 # | | | 156,000 | | | | 155,899 | |
Liberty Media 2.25% exercise price $34.07, maturity date 9/30/46 | | | 315,000 | | | | 182,855 | |
| | | | | | | | |
| | | | | | | 814,828 | |
| | | | | | | | |
Consumer Cyclical – 0.47% | | | | | |
Meritor 3.25% exercise price $39.92, maturity date 10/15/37 | | | 91,000 | | | | 99,235 | |
Team 5.00% exercise price $21.70, maturity date 8/1/23 | | | 171,000 | | | | 179,452 | |
| | | | | | | | |
| | | | | | | 278,687 | |
| | | | | | | | |
ConsumerNon-Cyclical – 1.26% | | | | | |
BioMarin Pharmaceutical 0.599% exercise price $124.67, maturity date 8/1/24 | | | 129,000 | | | | 136,611 | |
Chefs’ Warehouse 144A 1.875% exercise price $44.20, maturity
date 12/1/24 # | | | 76,000 | | | | 84,003 | |
FTI Consulting 2.00% exercise price $101.38, maturity date 8/15/23 | | | 172,000 | | | | 216,050 | |
Paratek Pharmaceuticals 4.75% exercise price $15.90, maturity date 5/1/24 | | | 169,000 | | | | 122,103 | |
Vector Group 1.75% exercise price $20.27, maturity date 4/15/20 • | | | 171,000 | | | | 178,374 | |
| | | | | | | | |
| | | | | | | 737,141 | |
| | | | | | | | |
| | | | | | | | |
| | | Principal
amount° | | | Value (US $) | |
Convertible Bonds (continued) | |
Electric – 0.29% | | | | | | | | |
NRG Energy 2.75% exercise price $47.74, maturity date 6/1/48 | | | 148,000 | | | $ | 168,165 | |
| | | | | | | | |
| | | | | | | 168,165 | |
| | | | | | | | |
Energy – 1.18% | | | | | | | | |
Cheniere Energy 4.25% exercise price $138.38, maturity date 3/15/45 | | | 328,000 | | | | 259,957 | |
Helix Energy Solutions Group 4.25% exercise price $13.89, maturity date 5/1/22 | | | 155,000 | | | | 166,051 | |
PDC Energy 1.125% exercise price $85.39, maturity date 9/15/21 | | | 282,000 | | | | 266,191 | |
| | | | | | | | |
| | | | | | | 692,199 | |
| | | | | | | | |
Financials – 0.65% | | | | | | | | |
GAIN Capital Holdings 5.00% exercise price $8.20, maturity date 8/15/22 | | | 200,000 | | | | 175,319 | |
Jazz Investments I 1.875% exercise price $199.77, maturity date 8/15/21 | | | 200,000 | | | | 206,425 | |
| | | | | | | | |
| | | | | | | 381,744 | |
| | | | | | | | |
Real Estate Investment Trusts – 0.33% | | | | | |
Blackstone Mortgage Trust 4.75% exercise price $36.23, maturity date 3/15/23 | | | 181,000 | | | | 194,490 | |
| | | | | | | | |
| | | | | | | 194,490 | |
| | | | | | | | |
Technology – 2.79% | | | | | | | | |
Boingo Wireless 1.00% exercise price $42.32, maturity date 10/1/23 | | | 305,000 | | | | 270,983 | |
CSG Systems International 4.25% exercise price $56.87, maturity date 3/15/36 | | | 162,000 | | | | 185,692 | |
Knowles 3.25% exercise price $18.43, maturity date 11/1/21 | | | 68,000 | | | | 88,545 | |
Ligand Pharmaceuticals 0.75% exercise price $248.48, maturity date 5/15/23 | | | 98,000 | | | | 84,823 | |
Pluralsight 144A 0.375% exercise price $38.76, maturity date 3/1/24 # | | | 201,000 | | | | 174,955 | |
Quotient Technology 1.75% exercise price $17.36, maturity date 12/1/22 | | | 177,000 | | | | 174,859 | |
Retrophin 2.50% exercise price $38.80, maturity date 9/15/25 | | | 158,000 | | | | 122,877 | |
Synaptics 0.50% exercise price $73.02, maturity date 6/15/22 | | | 190,000 | | | | 211,144 | |
Verint Systems 1.50% exercise price $64.46, maturity date 6/1/21 | | | 170,000 | | | | 183,776 | |
Vishay Intertechnology 2.25% exercise price $31.44, maturity date 6/15/25 | | | 139,000 | | | | 139,597 | |
| | | | | | | | |
| | | | | | | 1,637,251 | |
| | | | | | | | |
Total Convertible Bonds
(cost $4,960,665) | | | | 5,124,780 | |
| | | | | | | | |
Total Return Series-8
Delaware VIP® Total Return Series
Schedule of investments (continued)
| | | | | | | | |
| | | Principal
amount° | | | Value
(US $) | |
Corporate Bonds – 13.36% | | | | | | | | |
Banking – 1.27% | | | | | | | | |
Ally Financial 5.75% 11/20/25 | | | 100,000 | | | $ | 112,125 | |
Bank of America 3.458% 3/15/25 µ | | | 20,000 | | | | 20,889 | |
Credit Suisse Group 144A 6.25% #µy | | | 200,000 | | | | 218,161 | |
JPMorgan Chase & Co. | | | | | | | | |
4.023% 12/5/24 µ | | | 10,000 | | | | 10,664 | |
5.00% µy | | | 10,000 | | | | 10,413 | |
Morgan Stanley | | | | | | | | |
3.124% (LIBOR03M + 1.22%) 5/8/24 • | | | 5,000 | | | | 5,092 | |
5.00% 11/24/25 | | | 10,000 | | | | 11,263 | |
PNC Financial Services Group 2.60% 7/23/26 | | | 20,000 | | | | 20,268 | |
Popular 6.125% 9/14/23 | | | 60,000 | | | | 64,750 | |
Royal Bank of Scotland Group 8.625% µy | | | 200,000 | | | | 216,615 | |
State Street 3.30% 12/16/24 | | | 20,000 | | | | 21,093 | |
Truist Bank 2.636% 9/17/29 µ | | | 15,000 | | | | 14,994 | |
US Bancorp 3.375% 2/5/24 | | | 10,000 | | | | 10,497 | |
USB Capital IX 3.50% (LIBOR03M + 1.02%)y• | | | 10,000 | | | | 8,765 | |
| | | | | | | | |
| | | | | | | 745,589 | |
| | | | | | | | |
Basic Industry – 1.49% | | | | | | | | |
Builders FirstSource 144A 5.625% 9/1/24 # | | | 15,000 | | | | 15,631 | |
Chemours | | | | | | | | |
5.375% 5/15/27 | | | 50,000 | | | | 44,376 | |
7.00% 5/15/25 | | | 15,000 | | | | 15,144 | |
FMG Resources August 2006 144A 5.125% 5/15/24 # | | | 30,000 | | | | 31,938 | |
Freeport-McMoRan | | | | | | | | |
4.55% 11/14/24 | | | 25,000 | | | | 26,479 | |
5.45% 3/15/43 | | | 42,000 | | | | 43,579 | |
HD Supply 144A
5.375% 10/15/26 # | | | 40,000 | | | | 42,493 | |
Lennar 5.00% 6/15/27 | | | 15,000 | | | | 16,318 | |
Methanex 5.25% 12/15/29 | | | 20,000 | | | | 20,679 | |
Newmont Goldcorp 2.80% 10/1/29 | | | 20,000 | | | | 19,827 | |
Novelis 144A 6.25% 8/15/24 # | | | 25,000 | | | | 26,281 | |
Olin | | | | | | | | |
5.00% 2/1/30 | | | 20,000 | | | | 20,337 | |
5.125% 9/15/27 | | | 60,000 | | | | 62,689 | |
Orbia Advance 144A 5.50% 1/15/48 # | | | 264,000 | | | | 270,519 | |
PulteGroup 5.00% 1/15/27 | | | 15,000 | | | | 16,370 | |
RPM International 4.55% 3/1/29 | | | 20,000 | | | | 21,663 | |
Standard Industries 144A 4.75% 1/15/28 # | | | 80,000 | | | | 82,186 | |
Steel Dynamics 5.00% 12/15/26 | | | 65,000 | | | | 69,139 | |
Univar Solutions USA 144A 5.125% 12/1/27 # | | | 25,000 | | | | 26,141 | |
| | | | | | | | |
| | | | | | | 871,789 | |
| | | | | | | | |
| | | | | | | | |
| | | Principal
amount° | | | Value
(US $) | |
Corporate Bonds (continued) | | | | | | | | |
Brokerage – 0.03% | | | | | | | | |
Jefferies Group 4.15% 1/23/30 | | | 15,000 | | | $ | 15,899 | |
| | | | | | | | |
| | | | | | | 15,899 | |
| | | | | | | | |
Capital Goods – 0.56% | | | | | | | | |
Bombardier 144A 6.00% 10/15/22 # | | | 30,000 | | | | 30,066 | |
Crown Americas 4.25% 9/30/26 | | | 55,000 | | | | 57,838 | |
L3Harris Technologies 2.90% 12/15/29 | | | 5,000 | | | | 5,082 | |
Mauser Packaging Solutions Holding 144A 5.50% 4/15/24 # | | | 70,000 | | | | 72,281 | |
Roper Technologies 2.35% 9/15/24 | | | 20,000 | | | | 20,118 | |
TransDigm 144A
6.25% 3/15/26 # | | | 30,000 | | | | 32,535 | |
United Rentals North America 5.25% 1/15/30 | | | 85,000 | | | | 91,643 | |
Waste Management | | | | | | | | |
3.45% 6/15/29 | | | 10,000 | | | | 10,703 | |
4.15% 7/15/49 | | | 5,000 | | | | 5,712 | |
| | | | | | | | |
| | | | | | | 325,978 | |
| | | | | | | | |
Communications – 1.31% | | | | | | | | |
Altice France 144A 7.375% 5/1/26 # | | | 200,000 | | | | 215,098 | |
AT&T 4.35% 3/1/29 | | | 15,000 | | | | 16,679 | |
Charter Communications Operating | | | | | | | | |
4.80% 3/1/50 | | | 5,000 | | | | 5,263 | |
5.05% 3/30/29 | | | 10,000 | | | | 11,341 | |
Crown Castle International 5.25% 1/15/23 | | | 15,000 | | | | 16,296 | |
Level 3 Financing 144A 3.875% 11/15/29 # | | | 50,000 | | | | 50,467 | |
Ooredoo International Finance 144A 5.00% 10/19/25 # | | | 200,000 | | | | 223,541 | |
Sprint 7.125% 6/15/24 | | | 80,000 | | | | 86,467 | |
Time Warner Cable 7.30% 7/1/38 | | | 5,000 | | | | 6,518 | |
Time Warner Entertainment 8.375% 3/15/23 | | | 5,000 | | | | 5,902 | |
Verizon Communications | | | | | | | | |
4.50% 8/10/33 | | | 15,000 | | | | 17,517 | |
4.522% 9/15/48 | | | 5,000 | | | | 5,990 | |
ViacomCBS 4.375% 3/15/43 | | | 20,000 | | | | 21,197 | |
Vodafone Group | | | | | | | | |
4.25% 9/17/50 | | | 10,000 | | | | 10,449 | |
4.875% 6/19/49 | | | 10,000 | | | | 11,609 | |
Zayo Group 6.375% 5/15/25 | | | 60,000 | | | | 61,975 | |
| | | | | | | | |
| | | | | | | 766,309 | |
| | | | | | | | |
Consumer Cyclical – 1.16% | | | | | | | | |
Allison Transmission 144A 5.875% 6/1/29 # | | | 75,000 | | | | 82,299 | |
AMC Entertainment Holdings 6.125% 5/15/27 | | | 70,000 | | | | 64,052 | |
Boyd Gaming 6.00% 8/15/26 | | | 60,000 | | | | 64,596 | |
General Motors Financial 5.25% 3/1/26 | | | 20,000 | | | | 22,211 | |
Hilton Worldwide Finance 4.875% 4/1/27 | | | 70,000 | | | | 74,505 | |
Total Return Series-9
Delaware VIP® Total Return Series
Schedule of investments (continued)
| | | | | | | | |
| | | Principal
amount° | | | Value
(US $) | |
Corporate Bonds (continued) | | | | | |
Consumer Cyclical (continued) | | | | | |
Lowe’s 4.55% 4/5/49 | | | 15,000 | | | $ | 17,682 | |
MGM Resorts International 5.75% 6/15/25 | | | 37,000 | | | | 41,532 | |
Murphy Oil USA 4.75% 9/15/29 | | | 83,000 | | | | 87,807 | |
Penn National Gaming 144A 5.625% 1/15/27 # | | | 45,000 | | | | 47,684 | |
Scientific Games International 144A 8.25% 3/15/26 # | | | 99,000 | | | | 109,333 | |
Yum! Brands 144A 4.75% 1/15/30 # | | | 65,000 | | | | 68,208 | |
| | | | | | | | |
| | | | | | | 679,909 | |
| | | | | | | | |
ConsumerNon-Cyclical – 0.70% | | | | | |
AbbVie 144A
2.95% 11/21/26 # | | | 5,000 | | | | 5,082 | |
Anheuser-Busch InBev Worldwide | | | | | | | | |
3.65% 2/1/26 | | | 15,000 | | | | 15,991 | |
4.75% 1/23/29 | | | 5,000 | | | | 5,793 | |
Cott Holdings 144A 5.50% 4/1/25 # | | | 34,000 | | | | 35,601 | |
CVS Health 3.25% 8/15/29 | | | 20,000 | | | | 20,339 | |
DH Europe Finance II 3.25% 11/15/39 | | | 50,000 | | | | 50,441 | |
Gilead Sciences 4.15% 3/1/47 | | | 15,000 | | | | 16,685 | |
JBS USA 144A
6.50% 4/15/29 # | | | 78,000 | | | | 86,824 | |
Pilgrim’s Pride 144A 5.875% 9/30/27 # | | | 65,000 | | | | 70,401 | |
Post Holdings 144A 5.50% 12/15/29 # | | | 98,000 | | | | 104,679 | |
| | | | | | | | |
| | | | | | | 411,836 | |
| | | | | | | | |
Electric – 0.29% | | | | | | | | |
CenterPoint Energy | | | | | | | | |
3.85% 2/1/24 | | | 10,000 | | | | 10,548 | |
4.25% 11/1/28 | | | 10,000 | | | | 10,854 | |
Duke Energy 4.875% µy | | | 10,000 | | | | 10,502 | |
Duke Energy Indiana 3.25% 10/1/49 | | | 10,000 | | | | 9,994 | |
Entergy Mississippi 2.85% 6/1/28 | | | 5,000 | | | | 5,113 | |
Entergy Texas 3.55% 9/30/49 | | | 15,000 | | | | 15,302 | |
Evergy 2.90% 9/15/29 | | | 15,000 | | | | 14,939 | |
MidAmerican Energy 3.15% 4/15/50 | | | 10,000 | | | | 9,871 | |
National Rural Utilities Cooperative Finance | | | | | | | | |
2.85% 1/27/25 | | | 15,000 | | | | 15,438 | |
5.25% 4/20/46 µ | | | 5,000 | | | | 5,420 | |
NextEra Energy Capital Holdings | | | | | | | | |
2.90% 4/1/22 | | | 5,000 | | | | 5,102 | |
3.15% 4/1/24 | | | 5,000 | | | | 5,184 | |
PacifiCorp 3.50% 6/15/29 | | | 10,000 | | | | 10,789 | |
Southern California Edison | | | | | | | | |
4.00% 4/1/47 | | | 5,000 | | | | 5,257 | |
4.20% 3/1/29 | | | 10,000 | | | | 11,072 | |
4.875% 3/1/49 | | | 5,000 | | | | 5,922 | |
Southwestern Electric Power 4.10% 9/15/28 | | | 15,000 | | | | 16,407 | |
Xcel Energy 3.50% 12/1/49 | | | 5,000 | | | | 5,089 | |
| | | | | | | | |
| | | | | | | 172,803 | |
| | | | | | | | |
Energy – 1.70% | | | | | | | | |
AmeriGas Partners 5.75% 5/20/27 | | | 30,000 | | | | 32,995 | |
| | | | | | | | |
| | | Principal
amount° | | | Value
(US $) | |
Corporate Bonds (continued) | | | | | |
Energy (continued) | | | | | |
Cheniere Corpus Christi Holdings 5.875% 3/31/25 | | | 20,000 | | | $ | 22,531 | |
Cheniere Energy Partners 144A 4.50% 10/1/29 # | | | 40,000 | | | | 41,178 | |
Crestwood Midstream Partners | | | | | | | | |
144A 5.625% 5/1/27 # | | | 30,000 | | | | 30,488 | |
6.25% 4/1/23 | | | 5,000 | | | | 5,110 | |
Energy Transfer Operating | | | | | | | | |
5.25% 4/15/29 | | | 10,000 | | | | 11,231 | |
6.25% 4/15/49 | | | 5,000 | | | | 6,026 | |
Genesis Energy 6.75% 8/1/22 | | | 30,000 | | | | 30,353 | |
Hilcorp Energy I 144A 5.00% 12/1/24 # | | | 35,000 | | | | 33,946 | |
KazMunayGas National 144A 5.375% 4/24/30 # | | | 264,000 | | | | 306,729 | |
Marathon Oil 4.40% 7/15/27 | | | 20,000 | | | | 21,745 | |
MPLX | | | | | | | | |
4.00% 3/15/28 | | | 5,000 | | | | 5,177 | |
4.80% 2/15/29 | | | 10,000 | | | | 10,971 | |
5.50% 2/15/49 | | | 5,000 | | | | 5,672 | |
Murphy Oil 5.875% 12/1/27 | | | 41,000 | | | | 43,101 | |
Noble Energy | | | | | | | | |
3.25% 10/15/29 | | | 15,000 | | | | 15,138 | |
4.95% 8/15/47 | | | 5,000 | | | | 5,535 | |
NuStar Logistics 5.625% 4/28/27 | | | 30,000 | | | | 30,881 | |
Sabine Pass Liquefaction 5.625% 3/1/25 | | | 5,000 | | | | 5,630 | |
Sinopec Group Overseas Development 2018 144A 2.50% 8/8/24 # | | | 200,000 | | | | 200,898 | |
Southwestern Energy 7.75% 10/1/27 | | | 38,000 | | | | 35,292 | |
Targa Resources Partners 5.375% 2/1/27 | | | 30,000 | | | | 31,181 | |
Transocean 144A
9.00% 7/15/23 # | | | 60,000 | | | | 63,500 | |
| | | | | | | | |
| | | | | | | 995,308 | |
| | | | | | | | |
Finance Companies – 0.06% | | | | | | | | |
Avolon Holdings Funding | | | | | | | | |
144A 3.95% 7/1/24 # | | | 5,000 | | | | 5,217 | |
144A 4.375% 5/1/26 # | | | 15,000 | | | | 15,863 | |
International Lease Finance 8.625% 1/15/22 | | | 15,000 | | | | 16,877 | |
| | | | | | | | |
| | | | | | | 37,957 | |
| | | | | | | | |
Financials – 0.63% | | | | | | | | |
AerCap Global Aviation Trust 144A 6.50% 6/15/45 #µ | | | 200,000 | | | | 221,020 | |
DAE Funding 144A 5.75% 11/15/23 # | | | 70,000 | | | | 73,617 | |
E*TRADE Financial 5.875% µy | | | 70,000 | | | | 74,615 | |
| | | | | | | | |
| | | | | | | 369,252 | |
| | | | | | | | |
Healthcare – 0.90% | | | | | | | | |
Bausch Health 144A 5.50% 11/1/25 # | | | 80,000 | | | | 83,767 | |
Charles River Laboratories International 144A 4.25% 5/1/28 # | | | 85,000 | | | | 86,751 | |
Total Return Series-10
Delaware VIP® Total Return Series
Schedule of investments (continued)
| | | | | | | | |
| | | Principal
amount° | | | Value
(US $) | |
Corporate Bonds (continued) | | | | | | | | |
Healthcare (continued) | | | | | | | | |
Encompass Health 4.75% 2/1/30 | | | 80,000 | | | $ | 83,148 | |
HCA | | | | | | | | |
5.375% 2/1/25 | | | 70,000 | | | | 77,554 | |
5.875% 2/15/26 | | | 40,000 | | | | 45,559 | |
Hill-Rom Holdings 144A 4.375% 9/15/27 # | | | 30,000 | | | | 30,948 | |
Hologic 144A
4.625% 2/1/28 # | | | 40,000 | | | | 42,514 | |
Tenet Healthcare 8.125% 4/1/22 | | | 70,000 | | | | 77,562 | |
| | | | | | | | |
| | | | | | | 527,803 | |
| | | | | | | | |
Insurance – 0.29% | | | | | |
HUB International 144A 7.00% 5/1/26 # | | | 45,000 | | | | 47,701 | |
USI 144A 6.875% 5/1/25 # | | | 60,000 | | | | 61,481 | |
WellCare Health Plans 144A 5.375% 8/15/26 # | | | 60,000 | | | | 64,011 | |
| | | | | | | | |
| | | | | | | 173,193 | |
| | | | | | | | |
Media – 1.39% | | | | | |
AMC Networks 4.75% 8/1/25 | | | 65,000 | | | | 65,379 | |
CCO Holdings | | | | | | | | |
144A 5.375% 6/1/29 # | | | 40,000 | | | | 42,774 | |
144A 5.875% 5/1/27 # | | | 65,000 | | | | 68,888 | |
CSC Holdings
6.75% 11/15/21 | | | 50,000 | | | | 53,925 | |
144A 7.75% 7/15/25 # | | | 200,000 | | | | 213,740 | |
Gray Television 144A 7.00% 5/15/27 # | | | 55,000 | | | | 61,221 | |
Lamar Media 5.75% 2/1/26 | | | 60,000 | | | | 63,705 | |
Netflix 5.875% 11/15/28 | | | 80,000 | | | | 88,833 | |
Sinclair Television Group 144A 5.125% 2/15/27 # | | | 45,000 | | | | 46,366 | |
Sirius XM Radio | | | | | | | | |
144A 5.00% 8/1/27 # | | | 25,000 | | | | 26,421 | |
144A 5.50% 7/1/29 # | | | 75,000 | | | | 81,232 | |
| | | | | | | | |
| | | | | | | 812,484 | |
| | | | | | | | |
Real Estate Investment Trusts – 0.23% | | | | | |
ESH Hospitality | | | | | | | | |
144A 4.625% 10/1/27 # | | | 65,000 | | | | 65,933 | |
144A 5.25% 5/1/25 # | | | 65,000 | | | | 67,329 | |
| | | | | | | | |
| | | | | | | 133,262 | |
| | | | | | | | |
Services – 0.19% | | | | | |
Prime Security Services Borrower 144A 5.75% 4/15/26 # | | | 70,000 | | | | 76,213 | |
Service Corp. International 4.625% 12/15/27 | | | 36,000 | | | | 37,614 | |
| | | | | | | | |
| | | | | | | 113,827 | |
| | | | | | | | |
Technology – 0.08% | | | | | |
Global Payments | | | | | | | | |
2.65% 2/15/25 | | | 15,000 | | | | 15,071 | |
3.20% 8/15/29 | | | 5,000 | | | | 5,110 | |
Intel 2.45% 11/15/29 | | | 5,000 | | | | 4,985 | |
NXP 144A 4.875% 3/1/24 # | | | 20,000 | | | | 21,817 | |
| | | | | | | | |
| | | | | | | 46,983 | |
| | | | | | | | |
| | | | | | | | |
| | | Principal
amount° | | | Value
(US $) | |
Corporate Bonds (continued) | | | | | |
Technology & Electronics – 0.39% | | | | | |
CDK Global 144A
5.25% 5/15/29 # | | | 70,000 | | | $ | 75,162 | |
Iron Mountain 144A 5.25% 3/15/28 # | | | 60,000 | | | | 62,511 | |
SS&C Technologies 144A 5.50% 9/30/27 # | | | 85,000 | | | | 90,897 | |
| | | | | | | | |
| | | | | | | 228,570 | |
| | | | | | | | |
Transportation – 0.02% | | | | | |
FedEx 4.05% 2/15/48 | | | 15,000 | | | | 14,474 | |
| | | | | | | | |
| | | | | | | 14,474 | |
| | | | | | | | |
Utilities – 0.67% | | | | | |
Calpine 144A
5.25% 6/1/26 # | | | 55,000 | | | | 57,396 | |
Empresas Publicas de Medellin 144A 4.25% 7/18/29 # | | | 264,000 | | | | 275,102 | |
Vistra Operations 144A 5.00% 7/31/27 # | | | 60,000 | | | | 62,810 | |
| | | | | | | | |
| | | | | | | 395,308 | |
| | | | | | | | |
Total Corporate Bonds
(cost $7,751,104) | | | | | | | 7,838,533 | |
| | | | | | | | |
| |
Municipal Bonds – 2.16% | | | | | |
Allegheny County Industrial Development Authority Revenue | | | | | | | | |
(United States Steel Corporation Project) 4.875% 11/1/24 | | | 100,000 | | | | 104,471 | |
Colorado Health Facilities Authority Revenue | | | | | | | | |
(Cappella of Grand Junction Project) 144A 5.00% 12/1/54 # | | | 250,000 | | | | 258,683 | |
National Finance Authority Revenue | | | | | | | | |
(The Vista Project) Series A 144A 5.25% 7/1/39 # | | | 250,000 | | | | 272,090 | |
New Jersey Tobacco Settlement Financing Corporation | | | | | | | | |
Series B 5.00% 6/1/46 | | | 250,000 | | | | 278,652 | |
Puerto Rico Sales Tax Financing Revenue | | | | | | | | |
(Restructured) SeriesA-1 4.75% 7/1/53 | | | 335,000 | | | | 350,584 | |
| | | | | | | | |
Total Municipal Bonds
(cost $1,248,592) | | | | 1,264,480 | |
| | | | | | | | |
| |
Non-Agency Asset-Backed
Security – 0.17% | | | | | |
Citibank Credit Card Issuance Trust Series2018-A1 A1 2.49% 1/20/23 | | | 100,000 | | | | 100,681 | |
| | | | | | | | |
TotalNon-Agency Asset-Backed
Security (cost $100,848) | | | | 100,681 | |
| | | | | | | | |
Total Return Series-11
Delaware VIP® Total Return Series
Schedule of investments (continued)
| | | | | | | | |
| | | Principal
amount° | | | Value
(US $) | |
Non-Agency Commercial Mortgage-Backed | | | | | | | | |
Securities – 0.44% | | | | | | | | |
BANK | | | | | | | | |
Series 2019-BN21 A5
2.851% 10/17/52 | | | 50,000 | | | $ | 50,759 | |
GS Mortgage Securities Trust | | | | | | | | |
Series2017-GS5 A4 3.674% 3/10/50 | | | 50,000 | | | | 53,488 | |
JPM-BB Commercial Mortgage Securities Trust | | | | | | | | |
Series2015-C31 A3 3.801% 8/15/48 | | | 50,000 | | | | 53,476 | |
Morgan Stanley Bank of America Merrill Lynch Trust | | | | | | | | |
Series2016-C29 A4 3.325% 5/15/49 | | | 50,000 | | | | 52,230 | |
Wells Fargo Commercial Mortgage Trust | | | | | | | | |
Series 2016-BNK1 A3 2.652% 8/15/49 | | | 50,000 | | | | 50,353 | |
| | | | | | | | |
TotalNon-Agency Commercial Mortgage-Backed Securities
(cost $264,633) | | | | | | | 260,306 | |
| | | | | | | | |
Sovereign Bonds – 0.39%D | | | | | |
Dominican Republic – 0.37% | | | | | |
Dominican Republic International Bond
144A 6.00% 7/19/28 # | | | 198,000 | | | | 220,593 | |
| | | | | | | | |
| | | | | | | 220,593 | |
| | | | | | | | |
Mexico – 0.02% | | | | | | | | |
Mexican Bonos 6.50% 6/9/22 | | MXN | 204,400 | | | | 10,758 | |
| | | | | | | | |
| | | | | | | 10,758 | |
| | | | | | | | |
Total Sovereign Bonds
(cost $228,646) | | | | | | | 231,351 | |
| | | | | | | | |
| |
US Treasury Obligations – 0.76% | | | | | |
US Treasury Bonds
2.375% 11/15/49 | | | 5,000 | | | | 4,979 | |
4.50% 2/15/36 | | | 65,000 | | | | 86,128 | |
US Treasury Floating Rate Note
1.746% (USBMMY3M + 0.22%) 7/31/21 | | | 85,000 | | | | 85,050 | |
US Treasury Notes
1.50% 9/30/24 | | | 10,000 | | | | 9,909 | |
1.50% 11/30/24 | | | 220,000 | | | | 218,040 | |
1.625% 8/15/29 | | | 15,000 | | | | 14,604 | |
US Treasury Strip Principal
2.26% 5/15/44 | | | 45,000 | | | | 24,909 | |
| | | | | | | | |
Total US Treasury Obligations
(cost $446,235) | | | | | | | 443,619 | |
| | | | | | | | |
| | | | | | | | |
| | | Number of
shares | | | Value
(US $) | |
Common Stock – 66.04% | | | | | | | | |
Communication Services – 3.62% | | | | | |
AT&T | | | 22,900 | | | $ | 894,932 | |
CenturyLink | | | 4,847 | | | | 64,029 | |
KDDI | | | 3,300 | | | | 98,460 | |
Orange † | | | 5,610 | | | | 82,561 | |
Publicis Groupe | | | 2,360 | | | | 106,842 | |
Verizon Communications | | | 14,300 | | | | 878,020 | |
| | | | | | | | |
| | | | | | | 2,124,844 | |
| | | | | | | | |
Consumer Discretionary – 3.43% | | | | | |
adidas AG | | | 110 | | | | 35,758 | |
Dollar Tree † | | | 9,500 | | | | 893,475 | |
Lowe’s | | | 7,400 | | | | 886,224 | |
Next | | | 380 | | | | 35,325 | |
Sodexo | | | 825 | | | | 97,769 | |
Swatch Group | | | 235 | | | | 65,613 | |
| | | | | | | | |
| | | | | | | 2,014,164 | |
| | | | | | | | |
Consumer Staples – 6.17% | | | | | | | | |
Archer-Daniels-Midland | | | 19,600 | | | | 908,460 | |
Asahi Group Holdings | | | 1,300 | | | | 59,307 | |
Conagra Brands | | | 28,900 | | | | 989,536 | |
Danone | | | 1,720 | | | | 142,577 | |
Diageo | | | 2,230 | | | | 94,538 | |
Kao | | | 400 | | | | 32,990 | |
Kerry Group Class A | | | 250 | | | | 31,155 | |
Kirin Holdings | | | 1,300 | | | | 28,375 | |
Koninklijke Ahold Delhaize | | | 6,230 | | | | 155,802 | |
Lawson | | | 900 | | | | 51,086 | |
Mondelez International Class A | | | 16,200 | | | | 892,296 | |
Nestle | | | 1,145 | | | | 123,964 | |
Seven & i Holdings | | | 2,900 | | | | 106,301 | |
| | | | | | | | |
| | | | | | | 3,616,387 | |
| | | | | | | | |
Energy – 6.39% | | | | | | | | |
ConocoPhillips | | | 14,200 | | | | 923,426 | |
Halliburton | | | 38,000 | | | | 929,860 | |
Marathon Oil | | | 68,600 | | | | 931,588 | |
Occidental Petroleum | | | 23,300 | | | | 960,193 | |
| | | | | | | | |
| | | | | | | 3,745,067 | |
| | | | | | | | |
Financials – 9.55% | | | | | | | | |
Allstate | | | 8,000 | | | | 899,600 | |
American International Group | | | 17,400 | | | | 893,142 | |
Bank of America | | | 11,403 | | | | 401,614 | |
Bank of New York Mellon | | | 17,500 | | | | 880,775 | |
Hercules Capital | | | 15,471 | | | | 216,903 | |
JPMorgan Chase & Co. | | | 3,600 | | | | 501,840 | |
Marsh & McLennan | | | 8,000 | | | | 891,280 | |
Truist Financial | | | 16,300 | | | | 918,016 | |
| | | | | | | | |
| | | | | | | 5,603,170 | |
| | | | | | | | |
Healthcare – 12.09% | | | | | | | | |
Abbott Laboratories | | | 10,300 | | | | 894,658 | |
Brookdale Senior Living † | | | 64,040 | | | | 465,571 | |
Cardinal Health | | | 16,100 | | | | 814,338 | |
Total Return Series-12
Delaware VIP® Total Return Series
Schedule of investments (continued)
| | | | | | | | |
| | | Number of
shares | | | Value (US $) | |
Common Stock (continued) | | | | | |
Healthcare (continued) | | | | | |
Cigna | | | 4,600 | | | $ | 940,654 | |
CVS Health | | | 11,900 | | | | 884,051 | |
Fresenius Medical Care AG & Co. | | | 1,480 | | | | 108,969 | |
Johnson & Johnson | | | 6,200 | | | | 904,394 | |
Merck & Co. | | | 9,800 | | | | 891,310 | |
Novo Nordisk Class B | | | 2,540 | | | | 147,190 | |
Pfizer | | | 22,900 | | | | 897,222 | |
Roche Holding | | | 445 | | | | 144,626 | |
| | | | | | | | |
| | | | | | | 7,092,983 | |
| | | | | | | | |
Industrials – 5.44% | | | | | |
G4S | | | 30,700 | | | | 88,650 | |
Honeywell International | | | 1,641 | | | | 290,457 | |
Makita | | | 1,700 | | | | 58,709 | |
Northrop Grumman | | | 2,500 | | | | 859,925 | |
Raytheon | | | 4,000 | | | | 878,960 | |
Secom | | | 300 | | | | 26,773 | |
Securitas Class B | | | 5,000 | | | | 86,146 | |
Waste Management | | | 7,900 | | | | 900,284 | |
| | | | | | | | |
| | | | | | | 3,189,904 | |
| | | | | | | | |
Information Technology – 7.80% | | | | | |
Broadcom | | | 2,700 | | | | 853,254 | |
Cisco Systems | | | 19,800 | | | | 949,608 | |
Intel | | | 15,300 | | | | 915,705 | |
Microsoft | | | 3,454 | | | | 544,696 | |
Oracle | | | 15,400 | | | | 815,892 | |
Sabre | | | 3,205 | | | | 71,920 | |
Texas Instruments | | | 3,307 | | | | 424,255 | |
| | | | | | | | |
| | | | | | | 4,575,330 | |
| | | | | | | | |
Materials – 1.69% | | | | | |
Air Liquide | | | 860 | | | | 121,740 | |
DuPont de Nemours | | | 13,500 | | | | 866,700 | |
| | | | | | | | |
| | | | | | | 988,440 | |
| | | | | | | | |
REIT Hotel – 0.43% | | | | | |
MGM Growth Properties Class A | | | 1,800 | | | | 55,746 | |
VICI Properties | | | 7,700 | | | | 196,735 | |
| | | | | | | | |
| | | | | | | 252,481 | |
| | | | | | | | |
REIT Information Technology – 0.12% | | | | | |
American Tower | | | 300 | | | | 68,946 | |
| | | | | | | | |
| | | | | | | 68,946 | |
| | | | | | | | |
REIT Mall – 0.10% | | | | | |
Simon Property Group | | | 400 | | | | 59,584 | |
| | | | | | | | |
| | | | | | | 59,584 | |
| | | | | | | | |
REIT Mortgage – 0.15% | | | | | |
Annaly Capital Management | | | 9,000 | | | | 84,780 | |
| | | | | | | | |
| | | | | | | 84,780 | |
| | | | | | | | |
REIT Office – 0.04% | | | | | |
Postal Realty Trust Class A | | | 1,441 | | | | 24,425 | |
| | | | | | | | |
| | | | | | | 24,425 | |
| | | | | | | | |
| | | | | | | | |
| | | Number of
shares | | | Value (US $) | |
Common Stock (continued) | | | | | |
REIT Self-Storage – 0.16% | | | | | |
Extra Space Storage | | | 900 | | | $ | 95,058 | |
| | | | | | | | |
| | | | | | | 95,058 | |
| | | | | | | | |
REITs Diversified – 0.75% | | | | | |
Alpine Income Property Trust | | | 8,000 | | | | 152,240 | |
Cousins Properties | | | 3,400 | | | | 140,080 | |
Lexington Realty Trust | | | 14,100 | | | | 149,742 | |
| | | | | | | | |
| | | | | | | 442,062 | |
| | | | | | | | |
REITs Healthcare – 0.98% | | | | | |
Assura | | | 172,491 | | | | 177,759 | |
Healthpeak Properties | | | 4,686 | | | | 161,526 | |
Sabra Health Care REIT | | | 3,600 | | | | 76,824 | |
Welltower | | | 1,916 | | | | 156,690 | |
| | | | | | | | |
| | | | | | | 572,799 | |
| | | | | | | | |
REITs Industrial – 0.46% | | | | | |
Americold Realty Trust | | | 3,700 | | | | 129,722 | |
Prologis | | | 1,600 | | | | 142,624 | |
| | | | | | | | |
| | | | | | | 272,346 | |
| | | | | | | | |
REITs Manufactured Housing – 0.50% | | | | | |
Equity LifeStyle Properties | | | 1,800 | | | | 126,702 | |
Sun Communities | | | 1,100 | | | | 165,110 | |
| | | | | | | | |
| | | | | | | 291,812 | |
| | | | | | | | |
REITs Multifamily – 3.12% | | | | | |
Apartment Investment & Management Class A | | | 2,500 | | | | 129,125 | |
Bluerock Residential Growth REIT | | | 7,543 | | | | 90,893 | |
Camden Property Trust | | | 1,438 | | | | 152,572 | |
Equity Residential | | | 10,600 | | | | 857,752 | |
Grainger | | | 22,257 | | | | 92,336 | |
Killam Apartment Real Estate Investment Trust | | | 3,554 | | | | 51,837 | |
NexPoint Residential Trust | | | 5,800 | | | | 261,000 | |
UDR | | | 4,200 | | | | 196,140 | |
| | | | | | | | |
| | | | | | | 1,831,655 | |
| | | | | | | | |
REITs Shopping Center – 0.07% | | | | | |
Brixmor Property Group | | | 100 | | | | 2,161 | |
Retail Properties of America Class A | | | 2,700 | | | | 36,180 | |
| | | | | | | | |
| | | | | | | 38,341 | |
| | | | | | | | |
REITs Single Tenant – 0.53% | | | | | |
National Retail Properties | | | 1,200 | | | | 64,344 | |
Spirit Realty Capital | | | 2,100 | | | | 103,278 | |
STORE Capital | | | 3,800 | | | | 141,512 | |
| | | | | | | | |
| | | | | | | 309,134 | |
| | | | | | | | |
REITs Specialty – 0.54% | | | | | |
Front Yard Residential | | | 11,400 | | | | 140,676 | |
Invitation Homes | | | 4,400 | | | | 131,868 | |
Safehold | | | 1,100 | | | | 44,330 | |
| | | | | | | | |
| | | | | | | 316,874 | |
| | | | | | | | |
Utilities – 1.91% | | | | | |
Edison International | | | 12,200 | | | | 920,002 | |
Total Return Series-13
Delaware VIP® Total Return Series
Schedule of investments (continued)
| | | | | | | | |
| | | Number of
shares | | | Value (US $) | |
Common Stock (continued) | | | | | |
Utilities (continued) | | | | | | | | |
TerraForm Power Class A | | | 12,890 | | | $ | 198,377 | |
| | | | | | | | |
| | | | | | | 1,118,379 | |
| | | | | | | | |
Total Common Stock
(cost $34,834,682) | | | | | | | 38,728,965 | |
| | | | | | | | |
| | |
Closed-End Funds – 0.29% | | | | | | | | |
Aberdeen Total Dynamic Dividend Fund | | | 12,200 | | | | 109,190 | |
Western Asset Emerging Markets Debt Fund | | | 4,251 | | | | 60,662 | |
| | | | | | | | |
TotalClosed-End Funds
(cost $160,455) | | | | | | | 169,852 | |
| | | | | | | | |
| | |
Convertible Preferred Stock – 2.21% | | | | | | | | |
A Schulman 6.00% exercise price $52.33y | | | 243 | | | | 253,799 | |
AMG Capital Trust II 5.15% exercise
price $195.47, maturity date 10/15/37 | | | 3,271 | | | | 158,644 | |
Bank of America 7.25% exercise price $50.00y | | | 136 | | | | 197,064 | |
El Paso Energy Capital Trust I 4.75%
exercise price $34.49, maturity date
3/31/28 | | | 4,518 | | | | 232,496 | |
QTS Realty Trust 6.50% exercise price $46.99y | | | 2,300 | | | | 297,091 | |
Wells Fargo & Co. 7.50% exercise price $156.71y | | | 107 | | | | 155,150 | |
| | | | | | | | |
| | |
Total Convertible Preferred Stock
(cost $1,285,629) | | | | | | | 1,294,244 | |
| | | | | | | | |
| | | | | | | | |
| | | Number of
shares | | | Value (US $) | |
Preferred Stock – 0.11% | | | | | | | | |
Bank of America 6.50% µ | | | 55,000 | | | $ | 62,464 | |
| | | | | | | | |
Total Preferred Stock
(cost $62,154) | | | | | | | 62,464 | |
| | | | | | | | |
| |
Exchange-Traded Funds – 0.99% | | | | | |
iShares Preferred & Income Securities | | | | | | | | |
ETF | | | 2,828 | | | | 106,304 | |
SPDR Gold Shares† | | | 1,671 | | | | 238,786 | |
VanEck Vectors High-Yield Municipal | | | | | | | | |
Index ETF | | | 3,032 | | | | 194,200 | |
Vanguard FTSE Developed Markets ETF | | | 910 | | | | 40,095 | |
| | | | | | | | |
Total Exchange-Traded Funds (cost $575,947) | | | | | | | 579,385 | |
| | | | | | | | |
| |
Short-Term Investments – 2.98% | | | | | |
Money Market Mutual Funds – 2.98% | | | | | |
BlackRock FedFund – Institutional Shares(seven-day effective yield 1.52%) | | | 349,904 | | | | 349,904 | |
Fidelity Investments Money Market Government Portfolio – Class I(seven-day effective yield 1.49%) | | | 349,904 | | | | 349,904 | |
GS Financial Square Government Fund – Institutional Shares (seven-day effective yield 1.51%) | | | 349,904 | | | | 349,904 | |
Morgan Stanley Government Portfolio – Institutional Share Class(seven-day effective yield 1.48%) | | | 349,904 | | | | 349,904 | |
State Street Institutional US Government Money Market Fund – Investor Class(seven-day effective yield 1.45%) | | | 349,904 | | | | 349,904 | |
| | | | | | | | |
Total Short-Term Investments
(cost $1,749,520) | | | | | | | 1,749,520 | |
| | | | | | | | |
| | | | |
Total Value of Securities – 99.66%
(cost $54,268,222) | | $ | 58,446,380 | |
| | | | |
| # | Security exempt from registration under Rule 144A of the Securities Act of 1933, as amended. At Dec. 31, 2019, the aggregate value of Rule 144A securities was $6,307,857, which represents 10.76% of the Series’ net assets. See Note 11 in “Notes to financial statements.” |
| ° | Principal amount shown is stated in USD unless noted that the security is denominated in another currency. |
| D | Securities have been classified by country of origin. |
| µ | Fixed to variable rate investment. The rate shown reflects the fixed rate in effect at Dec. 31, 2019. Rate will reset at a future date. |
| y | No contractual maturity date. |
| † | Non-income producing security. |
| • | Variable rate investment. Rates reset periodically. Rate shown reflects the rate in effect at Dec. 31, 2019. For securities based on a published reference rate and spread, the reference rate and spread are indicated in their description above. The reference rate descriptions (i.e. LIBOR03M, LIBOR06M, etc.) used in this report are identical for different securities, but the underlying reference rates may differ due to the timing of the reset period. Certain variable rate securities are not based on a published reference rate and spread but are determined by the issuer or agent and are based on current market conditions, or for mortgage-backed securities, are impacted by the individual mortgages which are paying off over time. These securities do not indicate a reference rate and spread in their description above. |
Total Return Series-14
Delaware VIP® Total Return Series
Schedule of investments (continued)
The following foreign currency exchange contracts and futures contracts were outstanding at Dec. 31, 2019:1
Foreign Currency Exchange Contracts
| | | | | | | | | | | | | | | | | | | | | | | | | | | | | | |
Counterparty | | | | Currency to Receive (Deliver) | | In Exchange For | | Settlement
Date | | | | Unrealized
Appreciation | | | | Unrealized
Depreciation | |
BNYM | | | | CHF | | | (1,046 | ) | | | | USD | | | 1,078 | | | | | 1/3/20 | | | | $— | | | | | $ (3) | |
BNYM | | | | EUR | | | (1,995 | ) | | | | USD | | | 2,233 | | | | | 1/2/20 | | | | — | | | | | (5) | |
BNYM | | | | GBP | | | (224 | ) | | | | USD | | | 297 | | | | | 1/3/20 | | | | — | | | | | — | |
JPMCB | | | | BRL | | | 86,581 | | | | | USD | | | (20,570 | ) | | | | 1/10/20 | | | | 945 | | | | | — | |
JPMCB | | | | ZAR | | | (303,864 | ) | | | | USD | | | 20,422 | | | | | 1/10/20 | | | | — | | | | | (1,279) | |
Total Foreign Currency Exchange Contracts | | | | | | | | | $945 | | | | | $(1,287) | |
Futures Contracts
| | | | | | | | | | | | | | | | | | | | | | | | | | | | | | |
Contracts to Buy (Sell) | | | | Notional
Amount | | | | | Notional
Cost (Proceeds) | | | | | Expiration
Date | | | | | Value/
Unrealized
Depreciation | | | | | Variation Margin
Due from
(Due to) Brokers | |
US Treasury 10 yr | | | | | | | | | | | | | | | | | | | | | | | | | | | | | | |
1 Notes | | | | $ | 128,422 | | | | | $ | 128,888 | | | | | | 3/20/20 | | | | | $ | (466 | ) | | | | $ | (109 | ) |
The use of foreign currency exchange contracts and futures contracts involves elements of market risk and risks in excess of the amounts disclosed in the financial statements. The foreign currency exchange contracts and notional amount presented above represent the Series’ total exposure in such contracts, whereas only the net unrealized appreciation (depreciation) and variation margin are reflected in the Series’ net assets.
1See Note 8 in “Notes to financial statements.”
|
Summary of abbreviations: |
BB – Barclays Bank |
BNYM – Bank of New York Mellon |
BRL – Brazilian Real |
CHF – Swiss Franc |
ETF – Exchange-Traded Fund |
EUR – European Monetary Unit |
FTSE – Financial times Stock Exchange 100 Index |
GBP – Great Britain Pound |
GS – Goldman Sachs |
ICE – Intercontinental Exchange |
JPM – JPMorgan |
JPMCB – JPMorgan Chase Bank, National Association |
LIBOR – London interbank offered rate |
LIBOR3M – ICE LIBOR USD 3 Month |
LIBOR6M – ICE LIBOR USD 6 Month |
MXN – Mexican Peso |
REIT – Real Estate Investment Trust |
S.F. – Single Family |
SPDR – S&P Depositary Receipts |
USBMMY3M – US Treasury 3 Month Bill Money |
USD – US Dollar |
yr – Year |
ZAR – South African Rand |
See accompanying notes, which are an integral part of the financial statements.
Total Return Series-15
| | |
| Delaware VIP® Trust — Delaware VIP Total Return Series | | |
| Statement of assets and liabilities | | December 31, 2019 |
| | | | |
Assets: | | | | |
Investments, at value1 | | $ | 58,446,380 | |
Cash | | | 97,427 | |
Cash collateral due from brokers | | | 1,265 | |
Foreign currencies, at value2 | | | 15 | |
Dividends and interest receivable | | | 246,397 | |
Receivable for securities sold | | | 14,163 | |
Receivable for series shares sold | | | 2,190 | |
Unrealized appreciation on foreign currency exchange contracts | | | 945 | |
Foreign tax reclaims receivable | | | 440 | |
Other assets | | | 1,746 | |
| | | | |
Total assets | | | 58,810,968 | |
| | | | |
Liabilities: | | | | |
Audit and tax fees payable | | | 52,397 | |
Payable for securities purchased | | | 52,375 | |
Payable for series shares redeemed | | | 27,375 | |
Reports and statements to shareholders expenses payable tonon-affiliates | | | 10,268 | |
Accounting and administration fees payable tonon-affiliates | | | 7,037 | |
Other accrued expenses | | | 4,643 | |
Pricing fees payable | | | 4,000 | |
Investment management fees payable | | | 2,635 | |
Unrealized depreciation on foreign currency exchange contracts | | | 1,287 | |
Trustees’ fees and expenses payable | | | 573 | |
Accounting and administration expenses payable to affiliates | | | 504 | |
Dividend disbursing and transfer agent fees and expenses payable to affiliates | | | 370 | |
Variation margin payable on futures contracts | | | 109 | |
Reports and statements to shareholders expenses payable to affiliates | | | 92 | |
Legal fees payable to affiliates | | | 90 | |
Distribution fees payable | | | 3 | |
| | | | |
Total liabilities | | | 163,758 | |
| | | | |
Total Net Assets | | $ | 58,647,210 | |
| | | | |
| |
Net Assets Consist of: | | | | |
Paid-in capital | | $ | 48,461,599 | |
Total distributable earnings (loss) | | | 10,185,611 | |
| | | | |
Total Net Assets | | $ | 58,647,210 | |
| | | | |
| |
Net Asset Value: | | | | |
Standard Class: | | | | |
Net assets | | $ | 58,636,850 | |
Shares of beneficial interest outstanding, unlimited authorization, no par | | | 4,102,225 | |
Net asset value per share | | $ | 14.29 | |
| |
Service Class: | | | | |
Net assets | | $ | 10,360 | |
Shares of beneficial interest outstanding, unlimited authorization, no par | | | 725 | |
Net asset value per share | | $ | 14.29 | |
| | | | |
1Investments, at cost | | $ | 54,268,222 | |
2Foreign currencies, at cost | | | 15 | |
See accompanying notes, which are an integral part of the financial statements.
Total Return Series-16
| | |
Delaware VIP®Trust — | | Delaware VIP Trust— |
Delaware VIP Total Return Series | | Delaware VIP Total Return Series |
Statement of operations | | Statements of changes in net assets |
Year ended December 31, 2019 | | |
| | | | |
Investment Income: | | | | |
Dividends | | $ | 759,372 | |
Interest | | | 701,918 | |
Foreign tax withheld | | | (557 | ) |
| | | | |
| | | 1,460,733 | |
| | | | |
Expenses: | | | | |
Management fees | | | 413,421 | |
Distribution expenses – Service Class | | | 5 | |
Audit and tax fees | | | 52,719 | |
Reports and statements to shareholders | | | 33,599 | |
Accounting and administration expenses | | | 11,169 | |
Legal fees | | | 9,526 | |
Trustees’ fees and expenses | | | 5,059 | |
Custodian fees | | | 2,505 | |
Dividend disbursing and transfer agent fees and expenses | | | 1,109 | |
Other | | | 39,491 | |
| | | | |
| | | 568,603 | |
Less expenses waived | | | (35,848 | ) |
Less expenses paid indirectly | | | (1,761 | ) |
| | | | |
Total operating expenses | | | 530,994 | |
| | | | |
Net Investment Income | | | 929,739 | |
| | | | |
| |
Net Realized and Unrealized Gain (Loss): | | | | |
Net realized gain (loss) on: | | | | |
Investments | | | 5,507,506 | |
Foreign currencies | | | (2,027 | ) |
Foreign currency exchange contracts | | | 1,234 | |
| | | | |
Net realized gain | | | 5,506,713 | |
| | | | |
Net change in unrealized appreciation (depreciation) of: | | | | |
Investments | | | 3,254,906 | |
Foreign currencies | | | 54 | |
Foreign currency exchange contracts | | | (342 | ) |
Futures contracts | | | (466 | ) |
| | | | |
Net change in unrealized appreciation (depreciation) | | | 3,254,152 | |
| | | | |
Net Realized and Unrealized Gain | | | 8,760,865 | |
| | | | |
Net Increase in Net Assets Resulting from Operations | | $ | 9,690,604 | |
| | | | |
| | | | | | | | |
| | | Year ended | |
| | | 12/31/19 | | | 12/31/18 | |
Increase (Decrease) in Net Assets from | | | | | | | | |
Operations: | | | | | | | | |
Net investment income | | $ | 929,739 | | | $ | 871,169 | |
Net realized gain | | | 5,506,713 | | | | 1,088,676 | |
Net change in unrealized appreciation (depreciation) | | | 3,254,152 | | | | (5,855,570 | ) |
| | | | | | | | |
Net increase (decrease) in net assets
resulting from operations | | | 9,690,604 | | | | (3,895,725 | ) |
| | | | | | | | |
| | |
Dividends and Distributions to
Shareholders from: | | | | | | | | |
Distributable earnings: | | | | | | | | |
Standard Class | | | (2,116,836 | ) | | | (1,009,297 | ) |
| | | | | | | | |
| | |
Capital Share Transactions: | | | | | | | | |
Proceeds from shares sold: | | | | | | | | |
Standard Class | | | 3,207,400 | | | | 5,027,378 | |
Service Class | | | 10,000 | | | | — | |
Net assets from merger: | | | | | | | | |
Shares issued from merger | | | — | | | | 5,946,557 | |
Net asset value of shares issued upon
reinvestment of dividends and
distributions: | | | | | | | | |
Standard Class | | | 2,116,836 | | | | 1,009,297 | |
| | | | | | | | |
| | | 5,334,236 | | | | 11,983,232 | |
| | | | | | | | |
Cost of shares redeemed: | | | | | | | | |
Standard Class | | | (5,890,384 | ) | | | (3,358,122 | ) |
| | | | | | | | |
Increase (Decrease) in net assets derived
from capital share transactions | | | (556,148 | ) | | | 8,625,110 | |
| | | | | | | | |
Net Increase in Net Assets | | | 7,017,620 | | | | 3,720,088 | |
| | |
Net Assets: | | | | | | | | |
Beginning of year | | | 51,629,590 | | | | 47,909,502 | |
| | | | | | | | |
End of year | | $ | 58,647,210 | | | $ | 51,629,590 | |
| | | | | | | | |
See accompanying notes, which are an integral part of the financial statements.
Total Return Series-17
Delaware VIP® Trust — Delaware VIP Total Return Series
Financial highlights
Selected data for each share of the Series outstanding throughout each period were as follows:
| | | | | | | | | | | | | | | | | | | | |
| | | | | | Delaware VIP Total Return Series Standard Class
Year ended | | | | |
| | | | |
| | | 12/31/19 | 1 | | | 12/31/18 | | | | 12/31/17 | | | | 12/31/16 | | | | 12/31/15 | |
| | | | |
Net asset value, beginning of period | | | $ 12.50 | | | | $ 13.83 | | | | $ 12.58 | | | | $ 11.98 | | | | $ 12.30 | |
| | | | | |
Income (loss) from investment operations: | | | | | | | | | | | | | | | | | | | | |
Net investment income2 | | | 0.22 | | | | 0.24 | | | | 0.18 | | | | 0.18 | | | | 0.15 | |
Net realized and unrealized gain (loss) | | | 2.08 | | | | (1.28 | ) | | | 1.28 | | | | 0.59 | | | | (0.34 | ) |
Total from investment operations | | | 2.30 | | | | (1.04 | ) | | | 1.46 | | | | 0.77 | | | | (0.19 | ) |
| | | | | |
Less dividends and distributions from: | | | | | | | | | | | | | | | | | | | | |
Net investment income1 | | | (0.26 | ) | | | (0.22 | ) | | | (0.21 | ) | | | (0.17 | ) | | | (0.13 | ) |
Net realized gain | | | (0.25 | ) | | | (0.07 | ) | | | — | | | | — | | | | — | |
Total dividends and distributions | | | (0.51 | ) | | | (0.29 | ) | | | (0.21 | ) | | | (0.17 | ) | | | (0.13 | ) |
| | | | | |
Net asset value, end of period | | | $ 14.29 | | | | $ 12.50 | | | | $ 13.83 | | | | $ 12.58 | | | | $ 11.98 | |
| | | | | |
Total return3 | | | 18.88% | | | | (7.65% | ) | | | 11.75% | | | | 6.62% | | | | (1.61% | ) |
| | | | | |
Ratios and supplemental data: | | | | | | | | | | | | | | | | | | | | |
Net assets, end of period (000 omitted) | | | $ 58,637 | | | | $51,630 | | | | $47,910 | | | | $40,400 | | | | $ 36,509 | |
Ratio of expenses to average net assets4 | | | 0.93% | | | | 0.90% | | | | 0.86% | | | | 0.89% | | | | 0.89% | |
Ratio of expenses to average net assets prior to fees waived4 | | | 0.99% | | | | 0.90% | | | | 0.86% | | | | 0.89% | | | | 0.89% | |
Ratio of net investment income to average net assets | | | 1.63% | | | | 1.80% | | | | 1.39% | | | | 1.45% | | | | 1.20% | |
Ratio of net investment income to average net assets prior to fees waived | | | 1.57% | | | | 1.80% | | | | 1.39% | | | | 1.45% | | | | 1.20% | |
Portfolio turnover | | | 150%5 | | | | 68% | | | | 48% | | | | 67% | | | | 39% | |
| 1 | On Oct. 4, 2019, the First Investors Life Series Total Return Fund shares were reorganized into Standard Class shares of the Series. See “Notes to financial statements.” The Standard Class shares financial highlights for the period prior to Oct. 4, 2019, reflect the performance of the First Investors Life Series Total Return Fund shares. |
2 The average shares outstanding method has been applied for per share information.
| 3 | Total return is based on the change in net asset value of a share during the period and assumes reinvestment of dividends and distributions at net asset value. Total return does not include fees, charges, or expenses imposed by the variable annuity and life insurance contracts for which Delaware VIP Trust serves as an underlying investment vehicle. |
4 Expense ratios do not include expenses of the Underlying Funds in which the Series invests.
| 5 | The Series’ portfolio turnover rate increased substantially during the year ended Dec. 31, 2019 due to a change in the Series’ portfolio managers and associated repositioning. |
See accompanying notes, which are an integral part of the financial statements.
Total Return Series-18
Delaware VIP® Trust — Delaware VIP Total Return Series
Financial highlights (continued)
Selected data for each share of the Series outstanding throughout each period were as follows:
| | |
| | | Delaware VIP Total Return Series Service Class
10/31/20191
to
12/31/19 |
Net asset value, beginning of period | | $13.79 |
| |
Income from investment operations: | | |
Net investment income2 | | 0.04 |
Net realized and unrealized gain | | 0.46 |
| |
Total from investment operations | | 0.50 |
| |
Net asset value, end of period | | $14.29 |
| |
Total return3 | | 3.63% |
| |
Ratios and supplemental data: | | |
Net assets, end of period (000 omitted) | | $ 10 |
Ratio of expenses to average net assets4 | | 1.16% |
Ratio of expenses to average net assets prior to fees waived4 | | 1.50% |
Ratio of net investment income to average net assets | | 1.79% |
Ratio of net investment income to average net assets prior to fees waived | | 1.45% |
Portfolio turnover | | 150%5,6 |
| 1 | Date of commencement of operations; ratios have been annualized and total return has not been annualized. |
| 2 | The average shares outstanding method has been applied for per share information. |
| 3 | Total return is based on the change in net asset value of a share during the period and assumes reinvestment of dividends and distributions at net asset value. Total return during the period shown reflects waivers by the manager and/or distributor. Performance would have been lower had the waivers not been in effect. Total return does not include fees, charges, or expenses imposed by the variable annuity and life insurance contracts for which Delaware VIP Trust serves as an underlying investment vehicle. |
| 4 | Expense ratios do not include expenses of the Underlying Funds in which the Series invests. |
| 5 | The Series’ portfolio turnover rate increased substantially during the year ended Dec. 31, 2019 due to a change in the Series’ portfolio managers and associated repositioning. |
| 6 | Portfolio turnover is representative of the Series for the entire year. |
See accompanying notes, which are an integral part of the financial statements.
Total Return Series-19
Delaware VIP® Trust — Delaware VIP Total Return Series
Notes to financial statements
December 31, 2019
Delaware VIP Trust (Trust) is organized as a Delaware statutory trust. The Trust consists of 22 series, each of which is treated as a separate entity for certain matters under the Investment Company Act of 1940, as amended (1940 Act). These financial statements and the related notes pertain to Delaware VIP Total Return Series (Series). The Trust is anopen-end investment company. The Series is considered diversified under the 1940 Act and offers Standard Class and Service Class shares. The Standard Class shares do not carry a distribution and service(12b-1) fee and the Service Class shares carry a12b-1 fee. The shares of the Series are sold only to separate accounts of life insurance companies.
Before the Series commenced operations, on Oct. 4, 2019, all of the assets and liabilities of the First Investors Life Series Total Return Fund, its respective Predecessor Series (Predecessor Series) were transferred to the Series in atax-free reorganization as set forth in an agreement and plan of reorganization (each a Foresters Reorganization) between the Trust, on behalf of the Series, and Foresters Investment Management Company, Inc. (FIMCO), on behalf of the Predecessor Series. As a result of the Foresters Reorganization, the Series assumed the performance and accounting history of its Predecessor Series. Financial information included for the dates prior to the Foresters Reorganization is that of the Predecessor Series.
1. Significant Accounting Policies
The Series follows accounting and reporting guidance under Financial Accounting Standards Board (FASB) Accounting Standards Codification Topic 946, Financial Services – Investment Companies. The following accounting policies are in accordance with US generally accepted accounting principles (US GAAP) and are consistently followed by the Series.
Security Valuation — Equity securities and exchange-traded funds (ETFs), except those traded on the Nasdaq Stock Market LLC (Nasdaq), are valued at the last quoted sales price as of the time of the regular close of the New York Stock Exchange on the valuation date. Equity securities and ETFs traded on the Nasdaq are valued in accordance with the Nasdaq Official Closing Price, which may not be the last sales price. If, on a particular day, an equity security or ETF does not trade, the mean between the bid and ask prices will be used, which approximates fair value. Equity securities listed on a foreign exchange are normally valued at the last quoted sales price on the valuation date. Other debt securities are valued based upon valuations provided by an independent pricing service or broker and reviewed by management. To the extent current market prices are not available, the pricing service may take into account developments related to the specific security, as well as transactions in comparable securities. US government and agency securities are valued at the mean between the bid and ask prices, which approximates fair value. Valuations for fixed income securities utilize matrix systems, which reflect such factors as security prices, yields, maturities, and ratings, and are supplemented by dealer and exchange quotations. For asset-backed securities, collateralized mortgage obligations, commercial mortgage securities, and US government agency mortgage securities, pricing vendors utilize matrix pricing which considers prepayment speed; attributes of the collateral; yield or price of bonds of comparable quality, coupon, maturity, and type as well as broker/dealer-supplied prices. Futures contracts are valued at the daily quoted settlement prices. Foreign currency exchange contracts and foreign cross currency exchange contracts are valued at the mean between the bid and ask prices, which approximates fair value. Interpolated values are derived when the settlement date of the contract is an interim date for which quotations are not available.Open-end investment companies are valued at their published net asset value (NAV) per share, as reported by the underlying investment company. Generally, other securities and assets for which market quotations are not readily available are valued at fair value as determined in good faith under the direction of the Trust’s Board of Trustees (Board). In determining whether market quotations are readily available or fair valuation will be used, various factors will be taken into consideration, such as market closures or suspension of trading in a security. Restricted securities are valued at fair value using methods approved by the Board.
Federal and Foreign Income Taxes — No provision for federal income taxes has been made as the Series intends to continue to qualify for federal income tax purposes as a regulated investment company under Subchapter M of the Internal Revenue Code of 1986, as amended, and make the requisite distributions to shareholders. The Series evaluates tax positions taken or expected to be taken in the course of preparing the Series’ tax returns to determine whether the tax positions are“more-likely-than-not” of being sustained by the applicable tax authority. Tax positions not deemed to meet the“more-likely-than-not” threshold are recorded as a tax benefit or expense in the current year. Management has analyzed the Series’ tax positions taken or expected to be taken on the Series’ federal income tax returns through the year ended Dec. 31, 2019 and for all open tax years (years ended Dec. 31, 2016–Dec. 31, 2018), and has concluded that no provision for federal income tax is required in the Series’ financial statements. If applicable, the Series recognizes interest accrued on unrecognized tax benefits in interest expense and penalties in “Other” on the “Statement of operations.” During the year ended Dec. 31, 2019, the Series did not incur any interest or tax penalties. In regard to foreign taxes only, the Series has open tax years in certain foreign countries in which it invests that may date back to the inception of the Series.
Class Accounting — Investment income, common expenses, and realized and unrealized gain (loss) on investments are allocated to the classes of the Series on the basis of daily net assets of each class. Distribution expenses relating to a specific class are charged directly to that class.
Underlying Funds — The Series may invest in other investment companies (Underlying Funds) to the extent permitted by the 1940 Act. The Underlying Funds in which the Series may invest include ETFs. A Series will indirectly bear the investment management fees and other expenses of the Underlying Funds.
Total ReturnSeries-20
Delaware VIP® Total Return Series
Notes to financial statements (continued)
1. Significant Accounting Policies (continued)
Foreign Currency Transactions — Transactions denominated in foreign currencies are recorded at the prevailing exchange rates on the valuation date in accordance with the Series’ prospectus. The value of all assets and liabilities denominated in foreign currencies is translated daily into US dollars at the exchange rate of such currencies against the US dollar. Transaction gains or losses resulting from changes in exchange rates during the reporting period or upon settlement of the foreign currency transaction are reported in operations for the current period. The Series generally does not bifurcate that portion of realized gains and losses on investments attributable to changes in foreign exchange rates from that which is due to changes in market prices. These realized gains and losses are included on the “Statement of operations” under “Net realized gain (loss) on investments.” The Series reports certain foreign currency related transactions as components of realized gains (losses) for financial reporting purposes, whereas such components are treated as ordinary income (loss) for federal income tax purposes.
Use of Estimates — The preparation of financial statements in conformity with US GAAP requires management to make estimates and assumptions that affect the fair value of investments, the reported amounts of assets and liabilities and disclosure of contingent assets and liabilities at the date of the financial statements, and the reported amounts of revenues and expenses during the reporting period. Actual results could differ from those estimates and the differences could be material.
Other — Expenses directly attributable to the Series are charged directly to the Series. Other expenses common to various funds within the Delaware Funds® by Macquarie (Delaware Funds) are generally allocated among such funds on the basis of average net assets. Management fees and certain other expenses are paid monthly. Security transactions are recorded on the date the securities are purchased or sold (trade date) for financial reporting purposes. Costs used in calculating realized gains and losses on the sale of investment securities are those of the specific securities sold. Dividend income is recorded on theex-dividend date and interest income is recorded on the accrual basis. Taxablenon-cash dividends are recorded as dividend income. Foreign dividends are also recorded on theex-dividend date or as soon after theex-dividend date that the Series is aware of such dividends, net of all tax withholdings, a portion of which may be reclaimable. Withholding taxes and reclaims on foreign dividends have been recorded in accordance with the Series’ understanding of the applicable country’s tax rules and rates. Discounts and premiums on debt securities are accreted or amortized to interest income, respectively, over the lives of the respective securities using the effective interest method. Realized gains (losses) on paydowns ofasset-and mortgage backed securities are classified as interest income. Distributions received from investments in real estate investment trusts (REITs) are recorded as dividend income on theex-dividend date, subject to reclassification upon notice of the character of such distributions by the issuer. The Series declares and pays dividends from net investment income and distributions from net realized gain on investments, if any, following the close of the fiscal year. The Series may distribute more frequently, if necessary for tax purposes. Dividends and distributions, if any, are recorded on theex-dividend date.
The Series receives earnings credits from its custodian when positive cash balances are maintained, which may be used to offset custody fees. The expenses paid under this arrangement are included on the “Statement of operations” under “Custodian fees” with the corresponding expenses offset included under “Less expenses paid indirectly.” For the year ended Dec. 31, 2019, the Series earned $1,761 under this arrangement.
The Series receives earnings credits from its transfer agent when positive cash balances are maintained, which may be used to offset transfer agent fees. If the amount earned is greater than $1, the expenses paid under this arrangement are included on the “Statement of operations” under “Dividend disbursing and transfer agent fees and expenses” with the corresponding expenses offset included under “Less expenses paid indirectly.” There were no such earnings credits for the year ended Dec. 31, 2019.
2. Investment Management, Administration Agreements, and Other Transactions with Affiliates
In accordance with the terms of its investment management agreement, effective Oct. 4, 2019, the Series pays Delaware Management Company (DMC), a series of Macquarie Investment Management Business Trust and the investment manager, an annual fee which is calculated daily and paid monthly at the rates of 0.65% on the first $500 million of average daily net assets of the Series, 0.60% on the next $500 million, 0.55% on the next $1.5 billion, and 0.50% on average daily net assets in excess of $2.5 billion. Prior to Oct. 4, 2019, the Series paid FIMCO, an annual fee which was calculated daily and paid monthly at the rates of 0.75% on the first $250 million of average daily net assets of the Series, 0.72% on the next $250 million, 0.69% on the next $250 million, 0.66% on the next $500 million, 0.64% on the next $500 million, 0.62% on the next $500 million, and 0.60% on average daily net assets in excess of $2.25 billion.
DMC has contractually agreed to waive all or a portion of its investment advisory fees and/or pay/reimburse expenses (excluding any acquired fund fees and expenses, taxes, interest, short sale dividend and interest expenses, brokerage fees, certain insurance costs, and nonroutine expenses or costs, including, but not limited to, those relating to reorganizations, litigation, conducting shareholder meetings, and liquidations), do not exceed 0.86% of the Series’ average daily net assets for the Standard Class and 1.16% for the Service Class from Oct. 4, 2019 through Dec. 31, 2019.* These waivers and reimbursements may only be terminated by agreement of DMC and the Series. The waivers and reimbursements are accrued daily and received monthly.
Effective Oct. 4, 2019, DMC may seek investment advice and recommendations from its affiliates: Macquarie Investment Management Europe Limited, Macquarie Funds Management Hong Kong Limited, Macquarie Investment Management Austria Kapitalanlage AG, and Macquarie Investment Management
Total ReturnSeries-21
Delaware VIP® Total Return Series
Notes to financial statements (continued)
2. Investment Management, Administration Agreements, and Other Transactions with Affiliates (continued)
Global Limited (together, the “AffiliatedSub-Advisors”). The Manager may also permit these AffiliatedSub-Advisors to execute Series security trades on behalf of the Manager and exercise investment discretion for securities in certain markets where DMC believes it will be beneficial to utilize an AffiliatedSub-Advisor’s specialized market knowledge. Although the AffiliatedSub-Advisors serve assub-advisors, DMC has ultimate responsibility for all investment advisory services. For these services, DMC, not the Series, pays each AffiliatedSub-Advisor a portion of its investment management fee.
Effective Oct. 4, 2019, Delaware Investments Fund Services Company (DIFSC), an affiliate of DMC, provides fund accounting and financial administration oversight services to the Series. For these services, DIFSC’s fees are calculated daily and paid monthly based on the aggregate daily net assets of all funds within the Delaware Funds at the following annual rates: 0.00475% of the first $35 billion; 0.0040% of the next $10 billion; and 0.0025% of aggregate average daily net assets in excess of $45 billion (Total Fee). Each fund in the Delaware Funds pays a minimum of $4,000, which, in aggregate, is subtracted from the Total Fee. Each fund then pays its portion of the remainder of the Total Fee on a relative NAV basis. This amount is included on the “Statement of operations” under “Accounting and administration expenses.” For the period Oct. 4, 2019 through year ended Dec. 31, 2019, the Series was charged $1,473 for these services. Prior to Oct. 4, 2019, there were no fund accounting and financial administration oversight services for the Series.
Effective Oct. 4, 2019, DIFSC is also the transfer agent and dividend disbursing agent of the Series. For these services, DIFSC’s fees are calculated daily and paid monthly at the annual rate of 0.0075% of the Series’ average daily net assets. This amount is included on the “Statement of operations” under “Dividend disbursing and transfer agent fees and expenses.” For the period Oct. 4, 2019 through year ended Dec. 31, 2019, the Series was charged $1,046 for these services. Pursuant to asub-transfer agency agreement between DIFSC and BNY Mellon Investment Servicing (US) Inc. (BNYMIS), BNYMIS provides certainsub-transfer agency services to the Series.Sub-transfer agency fees are paid directly by the Series and are also included on the “Statement of operations” under “Dividend disbursing and transfer agent fees and expenses.” The fees that are calculated daily and paid as invoices are received on a monthly or quarterly basis. Prior to Oct. 4, 2019, Foresters Investor Services, Inc. was the transfer agent of the Series.
Effective Oct. 4, 2019, pursuant to a distribution agreement and distribution plan, the Series pays Delaware Distributors, L.P. (DDLP), the distributor and an affiliate of DMC, an annual12b-1 fee of 0.30% of the average daily net assets of the Service Class shares. The fees are calculated daily and paid monthly. Standard Class shares do not pay12b-1 fees.
As provided in the investment management agreement, the Series bears a portion of the cost of resources shared with DMC, including the cost of internal personnel of DMC and/or its affiliates that provide legal, tax, and regulatory reporting services to the Series. For the period Oct. 4, 2019 through year ended Dec. 31, 2019, the Series was charged $285 for internal legal, tax, and regulatory reporting services provided by DMC and/or its affiliates’ employees. These amounts are included on the “Statement of operations” under “Legal fees.”
Trustees’ fees include expenses accrued by the Series for each Trustee’s retainer and meeting fees. Certain officers of DMC, DIFSC, and DDLP are officers and/or Trustees of the Trust. These officers and Trustees are paid no compensation by the Series.
In addition to the management fees and other expenses of the Series, the Series indirectly bears the investment management fees and other expenses of the investment companies (Underlying Funds) in which it invests. The amount of these fees and expenses incurred indirectly by the Series will vary based upon the expense and fee levels of the Underlying Funds and the number of shares that are owned of the Underlying Funds at different times.
Cross trades for the year ended Dec. 31, 2019 were executed by the Series pursuant to procedures adopted by the Board designed to ensure compliance with Rule17a-7 under the 1940 Act. Cross trading is the buying or selling of portfolio securities between funds of investment companies, or between a fund of an investment company and another entity, that are or could be considered affiliates by virtue of having a common investment advisor (or affiliated investment advisors), common directors/ trustees and/or common officers. At its regularly scheduled meetings, the Board reviews such transactions for compliance with the procedures adopted by the Board. Pursuant to these procedures, for the year ended Dec. 31, 2019, the Series engaged in Rule17a-7 securities purchases of $830,078. The Series did not engage in Rule17a-7 securities sales for the year ended Dec. 31, 2019.
*The aggregate contractual waiver period covering this report is from Oct. 4, 2019 through Oct. 31, 2021.
3. Investments
For the year ended Dec. 31, 2019, the Series made purchases and sales of investment securities other than short-term investments as follows:
| | | | |
Purchases other than US government securities | | $ | 69,200,460 | |
Purchases of US government securities | | | 10,535,683 | |
Sales other than US government securities | | | 67,404,643 | |
Sales of US government securities | | | 15,168,492 | |
The tax cost of investments includes adjustments to net unrealized appreciation (depreciation) which may not necessarily be final tax cost basis adjustments, but approximate the tax basis unrealized gains and losses that may be realized and distributed to shareholders. At Dec. 31, 2019, the cost
Total ReturnSeries-22
Delaware VIP® Total Return Series
Notes to financial statements (continued)
3. Investments (continued)
and unrealized appreciation (depreciation) of investments and derivatives for federal income tax purposes has been estimated since final tax characteristics cannot be determined until fiscal year end. At Dec. 31, 2019, the cost and unrealized appreciation (depreciation) of investments and derivatives for the Series were as follows:
| | | | | | | | | | |
| | Cost of
Investments
and Derivatives | | Aggregate
Unrealized
Appreciation of Investments
and Derivatives | | Aggregate
Unrealized
Depreciation of Investments
and Derivatives | | Net Unrealized
Appreciation of Investments
and Derivatives | | |
| | $54,326,027 | | $4,743,370 | | $(623,825) | | $4,119,545 |
US GAAP defines fair value as the price that the Series would receive to sell an asset or pay to transfer a liability in an orderly transaction between market participants at the measurement date under current market conditions. A three-level hierarchy for fair value measurements has been established based upon the transparency of inputs to the valuation of an asset or liability. Inputs may be observable or unobservable and refer broadly to the assumptions that market participants would use in pricing the asset or liability. Observable inputs reflect the assumptions that market participants would use in pricing the asset or liability based on market data obtained from sources independent of the reporting entity. Unobservable inputs reflect the reporting entity’s own assumptions about the assumptions that market participants would use in pricing the asset or liability based on the best information available under the circumstances. The Series’ investment in its entirety is assigned a level based upon the observability of the inputs which are significant to the overall valuation. The three-level hierarchy of inputs is summarized below.
| Level 1 – | Inputs are quoted prices in active markets for identical investments. (Examples: equity securities,open-end investment companies, futures contracts, and exchange-traded options contracts) |
| Level 2 – | Other observable inputs, including, but not limited to: quoted prices for similar assets or liabilities in markets that are active, quoted prices for identical or similar assets or liabilities in markets that are not active, inputs other than quoted prices that are observable for the assets or liabilities (such as interest rates, yield curves, volatilities, prepayment speeds, loss severities, credit risks, and default rates) or other market-corroborated inputs. (Examples: debt securities, government securities, swap contracts, foreign currency exchange contracts, foreign securities utilizing international fair value pricing, broker-quoted securities, and fair valued securities) |
| Level 3 – | Significant unobservable inputs, including the Series’ own assumptions used to determine the fair value of investments. (Examples: broker-quoted securities and fair valued securities) |
Level 3 investments are valued using significant unobservable inputs. The Series may also use an income-based valuation approach in which the anticipated future cash flows of the investment are discounted to calculate fair value. Discounts may also be applied due to the nature or duration of any restrictions on the disposition of the investments. Valuations may also be based upon current market prices of securities that are comparable in coupon, rating, maturity, and industry. The derived value of a Level 3 investment may not represent the value which is received upon disposition and this could impact the results of operations.
The following table summarizes the valuation of the Series’ investments by fair value hierarchy levels as of Dec. 31, 2019:
| | | | | | | | | | | | |
| | | Level 1 | | | Level 2 | | | Total | |
Securities | | | | | | | | | | | | |
Assets: | | | | | | | | | | | | |
Agency, Asset- & Mortgage-Backed Securities | | $ | — | | | $ | 959,187 | | | $ | 959,187 | |
Corporate Debt | | | — | | | | 12,963,313 | | | | 12,963,313 | |
Foreign Debt | | | — | | | | 231,351 | | | | 231,351 | |
Municipal Bonds | | | — | | | | 1,264,480 | | | | 1,264,480 | |
US Treasury Obligations | | | — | | | | 443,619 | | | | 443,619 | |
Convertible Preferred Stock1 | | | 881,801 | | | | 412,443 | | | | 1,294,244 | |
Common Stock | | | | | | | | | | | | |
Communication Services | | | 2,026,384 | | | | 98,460 | | | | 2,124,844 | |
Consumer Discretionary | | | 1,948,551 | | | | 65,613 | | | | 2,014,164 | |
Consumer Staples | | | 3,214,364 | | | | 402,023 | | | | 3,616,387 | |
Energy | | | 3,745,067 | | | | — | | | | 3,745,067 | |
Financials | | | 5,603,170 | | | | — | | | | 5,603,170 | |
Healthcare | | | 6,692,198 | | | | 400,785 | | | | 7,092,983 | |
Industrials | | | 3,018,276 | | | | 171,628 | | | | 3,189,904 | |
Information Technology | | | 4,575,330 | | | | — | | | | 4,575,330 | |
Materials | | | 988,440 | | | | — | | | | 988,440 | |
Total Return Series-23
Delaware VIP® Total Return Series
Notes to financial statements (continued)
3. Investments (continued)
| | | | | | | | | | | | |
| | | Level 1 | | | Level 2 | | | Total | |
Securities | | | | | | | | | | | | |
Assets: | | | | | | | | | | | | |
REIT Hotel | | | $ 252,481 | | | | $ — | | | | $ 252,481 | |
REIT Information Technology | | | 68,946 | | | | — | | | | 68,946 | |
REIT Mall | | | 59,584 | | | | — | | | | 59,584 | |
REIT Mortgage | | | 84,780 | | | | — | | | | 84,780 | |
REIT Office | | | 24,425 | | | | — | | | | 24,425 | |
REIT Self-Storage | | | 95,058 | | | | — | | | | 95,058 | |
REITs Diversified | | | 442,062 | | | | — | | | | 442,062 | |
REITs Healthcare | | | 572,799 | | | | — | | | | 572,799 | |
REITs Industrial | | | 272,346 | | | | — | | | | 272,346 | |
REITs Manufactured Housing | | | 291,812 | | | | — | | | | 291,812 | |
REITs Multifamily | | | 1,831,655 | | | | — | | | | 1,831,655 | |
REITs Shopping Center | | | 38,341 | | | | — | | | | 38,341 | |
REITs Single Tenant | | | 309,134 | | | | — | | | | 309,134 | |
REITs Specialty | | | 316,874 | | | | — | | | | 316,874 | |
Utilities | | | 1,118,379 | | | | — | | | | 1,118,379 | |
Preferred Stock | | | — | | | | 62,464 | | | | 62,464 | |
Exchange-Traded Funds | | | 579,385 | | | | — | | | | 579,385 | |
Closed End Funds | | | 169,852 | | | | — | | | | 169,852 | |
Short-Term Investments | | | 1,749,520 | | | | — | | | | 1,749,520 | |
Total Value of Securities | | | $40,971,014 | | | | $17,475,366 | | | | $58,446,380 | |
| | | |
Derivatives2 | | | | | | | | | | | | |
Assets: | | | | | | | | | | | | |
Foreign Currency Exchange Contracts | | | $ — | | | | $ 945 | | | | $ 945 | |
| | | |
Liabilities: | | | | | | | | | | | | |
Foreign Currency Exchange Contracts | | | $ — | | | | $ (1,287 | ) | | | $ (1,287 | ) |
| | | |
Futures Contracts | | | $ (466 | ) | | | $ — | | | | $ (466 | ) |
1Security type is valued across multiple levels. The amounts attributed to Level 1 investments and Level 2 investments represent 68.13% and 31.87%, respectively, of the total market value of this security type. Level 1 investments represent exchange traded investments and Level 2 investments represent investments with observable inputs.
2Foreign currency exchange contracts and futures contracts are valued at the unrealized appreciation (depreciation) on the instrument at the period end.
As a result of utilizing international fair value pricing at Dec. 31, 2019, a portion of the common stock in the portfolio was categorized as Level 2.
During the year ended Dec. 31, 2019, there were no transfers between Level 1 investments, Level 2 investments, or Level 3 investments that had a significant impact to the Series. The Series’ policy is to recognize transfers between levels based on fair value at the beginning of the reporting period.
A reconciliation of Level 3 investments is presented when the Series has a significant amount of Level 3 investments at the beginning, interim, or end of the period in relation to net assets. During the year ended Dec. 31, 2019, there were no Level 3 investments.
Total Return Series-24
Delaware VIP® Total Return Series
Notes to financial statements (continued)
4. Dividend and Distribution Information
Income and long-term capital gain distributions are determined in accordance with federal income tax regulations, which may differ from US GAAP. Additionally, distributions from net gains on foreign currency transactions and net short-term gains on sales of investment securities are treated as ordinary income for federal income tax purposes. The tax character of dividends and distributions paid during the years ended Dec. 31, 2019 and 2018 was as follows:
| | | | | | | | |
| | | Year ended | |
| | | 12/31/19 | | | 12/31/18 | |
Ordinary income | | | $1,085,004 | | | | $ 776,309 | |
Long-term capital gains | | | 1,031,832 | | | | 232,988 | |
| | | | | | | | |
| | | $2,116,836 | | | | $1,009,297 | |
| | | | | | | | |
5. Components of Net Assets on a Tax Basis
As of Dec. 31, 2019, the components of net assets on a tax basis were as follows:
| | | | |
Shares of beneficial interest | | | $48,461,599 | |
Undistributed ordinary income | | | 2,607,461 | |
Undistributed long-term capital gains | | | 3,458,605 | |
Net unrealized appreciation on investments and derivatives | | | 4,119,545 | |
| | | | |
Net assets | | | $58,647,210 | |
| | | | |
The differences between the book basis and tax basis components of net assets are primarily attributable to tax deferral of losses on wash sales, market premium on debt instruments, trust preferred securities,mark-to-market on foreign currency exchange contracts andmark-to-market on futures contracts.
For federal income tax purposes, capital loss carryforwards may be carried forward and applied against future capital gains. $21,724 was utilized in 2019.
6. Capital Shares
Transactions in capital shares were as follows:
| | | | | | | | |
| | | Year ended | |
| | | 12/31/19 | | | 12/31/18 | |
Shares sold: | | | | | | | | |
Standard Class | | | 240,492 | | | | 376,074 | |
Service Class | | | 725 | | | | — | |
Shares from merger: | | | | | | | | |
Standard Class | | | — | | | | 469,477 | |
Shares issued upon reinvestment of dividends and distributions: | | | | | | | | |
Standard Class | | | 165,120 | | | | 75,659 | |
| | | | | | | | |
| | | 406,337 | | | | 921,210 | |
| | | | | | | | |
Shares redeemed: | | | | | | | | |
Standard Class | | | (434,147 | ) | | | (253,482 | ) |
| | | | | | | | |
Net increase (decrease) | | | (27,810 | ) | | | 667,728 | |
| | | | | | | | |
7. Reorganization of Balanced Income Fund into Total Return Fund
On Dec. 14, 2018, the First Investors Life Series Total Return Fund acquired all of the net assets of the First Investors Life Series Balanced Income Fund in connection with atax-free reorganization that was approved by the Foresters Board of Trustees. The Total Return Fund issued 469,477 shares to the Balanced Income Fund in connection with the reorganization. In return, it received net assets of $5,946,557 from the Balanced Income Fund (which included $134,488 of unrealized appreciation and $23,828 of accumulated net realized losses). The Total Return Fund’s shares were issued at their current net asset values as of the date of the reorganization. The aggregate net assets of the Total Return Fund and Balanced Income Fund immediately before the acquisition were $52,445,432 consisting of, with respect to Total Return Fund, $46,498,875 and, with respect to Balanced Income Fund, $5,946,557.
Total Return Series-25
Delaware VIP® Total Return Series
Notes to financial statements (continued)
8. Line of Credit
On Nov. 4, 2019, the Series, along with certain other funds in the Delaware Funds (Participants), is a participant in a $250,000,000 revolving line of credit intended to be used for temporary or emergency purposes as an additional source of liquidity to fund redemptions of investor shares. Under the agreement, the Participants are charged an annual commitment fee of 0.15%, which is allocated across the Participants based on a weighted average of the respective net assets of each Participant. The Participants are permitted to borrow up to a maximum ofone-third of their net assets under the agreement. Each Participant is individually, and not jointly, liable for its particular advances, if any, under the line of credit. The line of credit available under the agreement expires on Nov. 2, 2020.
The Series had no amounts outstanding as of Dec. 31, 2019, or at any time during the period then ended.
9. Derivatives
US GAAP requires disclosures that enable investors to understand: (1) how and why an entity uses derivatives; (2) how they are accounted for; and (3) how they affect an entity’s results of operations and financial position.
Foreign Currency Exchange Contracts
The Series may enter into foreign currency exchange contracts and foreign cross currency exchange contracts as a way of managing foreign exchange rate risk. The Series may enter into these contracts to fix the US dollar value of a security that it has agreed to buy or sell for the period between the date the trade was entered into and the date the security is delivered and paid for. The Series may also use these contracts to hedge the US dollar value of securities it already owns that are denominated in foreign currencies. In addition, the Series may enter into these contracts to facilitate or expedite the settlement of portfolio transactions. The change in value is recorded as an unrealized gain or loss. When the contract is closed, a realized gain or loss is recorded equal to the difference between the value of the contract at the time it was opened and the value at the time it was closed.
The use of foreign currency exchange contracts and foreign cross currency exchange contracts does not eliminate fluctuations in the underlying prices of the securities, but does establish a rate of exchange that can be achieved in the future. Although foreign currency exchange contracts and foreign cross currency exchange contracts limit the risk of loss due to an unfavorable change in the value of the hedged currency, they also limit any potential gain that might result should the value of the currency change favorably. In addition, the Series could be exposed to risks if the counterparties to the contracts are unable to meet the terms of their contracts. The Series’ maximum risk of loss from counterparty credit risk is the value of its currency exchanged with the counterparty. The risk is generally mitigated by having a netting arrangement between the Series and the counterparty and by the posting of collateral by the counterparty to the Series to cover the Series’ exposure to the counterparty.
During the year ended Dec. 31, 2019, the Series entered into foreign currency exchange contracts and foreign cross currency exchange contracts to hedge the US dollar value of securities it already owns that are denominated in foreign currencies.
At Dec. 31, 2019, the Series experienced net realized and unrealized gains or losses attributable to foreign currency holdings, which are disclosed on the “Statement of assets and liabilities” and “Statement of operations.”
Futures Contracts
A futures contract is an agreement in which the writer (or seller) of the contract agrees to deliver to the buyer an amount of cash or securities equal to a specific dollar amount times the difference between the value of a specific security or index at the close of the last trading day of the contract and the price at which the agreement is made. The Series may use futures contracts in the normal course of pursuing its investment objective. The Series may invest in futures contracts to hedge its existing portfolio securities against fluctuations in value caused by changes in interest rates or market conditions. Upon entering into a futures contract, the Series deposits cash or pledges US government securities to a broker, equal to the minimum “initial margin” requirements of the exchange on which the contract is traded. Subsequent payments are received from the broker or paid to the broker each day, based on the daily fluctuation in the market value of the contract. These receipts or payments are known as “variation margin” and are recorded daily by the Series as unrealized gains or losses until the contracts are closed. When the contracts are closed, the Series records a realized gain or loss equal to the difference between the value of the contract at the time it was opened and the value at the time it was closed. Risks of entering into futures contracts include potential imperfect correlation between the futures contracts and the underlying securities and the possibility of an illiquid secondary market for these instruments. When investing in futures, there is reduced counterparty credit risk to the Series because futures are exchange-traded and the exchange’s clearinghouse, as counterparty to all exchange-traded futures, guarantees against default. At Dec. 31, 2019, the Series posted $1,265 in cash as collateral for open futures contracts, which is included in “Cash collateral due from brokers” on the “Statement of assets and liabilities”.
During the year ended Dec. 31, 2019, the Series entered into futures contracts to hedge the Series’ existing portfolio securities against fluctuations in value caused by changes in interest rates or market conditions.
Total Return Series-26
Delaware VIP® Total Return Series
Notes to financial statements (continued)
9. Derivatives (continued)
Fair values of derivative instruments as of Dec. 31, 2019 were as follows:
| | |
| | | Asset Derivatives Fair Value |
| |
| Statement of Assets and Liabilities Location | | Currency Contracts |
Unrealized appreciation of foreign currency exchange contracts | | $945 |
| | | | | | | | | | | | |
| | | Liability Derivatives Fair Value | |
| | | |
| Statement of Assets and Liabilities Location | | Currency
Contracts | | | Interest
Rate
Contracts | | | Total | |
Unrealized depreciation of foreign currency exchange contracts | | | $(1,287) | | | | $— | | | | $(1,287) | |
Variation margin due to broker on futures contracts* | | | — | | | | (466) | | | | (466) | |
Total | | | $(1,287) | | | | $(466) | | | | $(1,753) | |
*Includes cumulative appreciation (depreciation) of futures contracts from the date the contracts were opened through Dec. 31, 2019. Only current day variation margin is reported on the “Statement of assets and liabilities.”
The effect of derivative instruments on the “Statement of operations” for the year ended Dec. 31, 2019 was as follows:
| | |
| | | Net Realized Gain (Loss) on: |
| |
| | | Foreign Currency Exchange Contracts |
Currency contracts | | $1,234 |
| | | | | | |
| | | Net Change in Unrealized Appreciation (Depreciation) of: |
| | | |
| | | Foreign Currency
Exchange Contracts | | Futures
Contracts | | Total |
Currency contracts | | $(342) | | $ — | | $(342) |
Interest rate contracts | | — | | (466) | | (466) |
Total | | $(342) | | $(466) | | $(808) |
The table below summarizes the quarterly average balance of derivative holdings by the Series during the year ended Dec. 31, 2019.
| | | | |
| | | Long
Derivatives
Volume | | Short
Derivatives
Volume |
Foreign currency exchange contracts (average notional value) | | $ 692 | | $ — |
Futures contracts (average notional value) | | 25,684 | | — |
10. Offsetting
The Series entered into an International Swaps and Derivatives Association, Inc. Master Agreement (ISDA Master Agreement) or a similar agreement with certain of their derivative contract counterparties in order to better define its contractual rights and to secure rights that will help the Series mitigate its counterparty risk. An ISDA Master Agreement is a bilateral agreement between the Series and a counterparty that governsover-the-counter (OTC) derivatives and foreign exchange contracts and typically contains, among other things, collateral posting items and netting provisions in the event of a default and/or termination event. Under an ISDA Master Agreement, the Series may, under certain circumstances, offset with the counterparty certain derivative financial instrument’s payables and/or receivables with collateral held and/or posted and create one single net payment. The provisions of the ISDA Master Agreement typically permit a single net payment in the event of default(close-out), including the bankruptcy or insolvency of the counterparty. However, bankruptcy or insolvency laws of a particular jurisdiction may impose restrictions on or prohibitions against the right of offset in bankruptcy, insolvency, or other events.
Total Return Series-27
Delaware VIP® Total Return Series
Notes to financial statements (continued)
10. Offsetting (continued)
For financial reporting purposes, the Series does not offset derivative assets and derivative liabilities that are subject to netting arrangements on the “Statement of assets and liabilities.”
At Dec. 31, 2019, the Series had the following assets and liabilities subject to offsetting provisions:
Offsetting of Financial Assets and Liabilities and Derivative Assets and Liabilities
| | | | | | |
Counterparty | | Gross Value of
Derivative Asset | | Gross Value of
Derivative Liability | | Net Position |
The Bank of New York Mellon | | $— | | $(8) | | $(8) |
JPMorgan Chase Bank, National | | 945 | | (1,279) | | (334) |
Total | | $945 | | $(1,287) | | $(342) |
| | | | | | | | | | | | |
Counterparty | | Net Position | | Fair Value of
Non-Cash
Collateral Received | | Cash Collateral
Received | | Fair Value of
Non-Cash
Collateral Pledged | | Cash
Collateral
Pledged | | Net Exposure(a) |
The Bank of New York Mellon | | $(8) | | $— | | $— | | $— | | $— | | $(8) |
JPMorgan Chase Bank, National | | (334) | | — | | — | | — | | — | | (334) |
| | | | | | |
Total | | $(342) | | $— | | $— | | $— | | $— | | $(342) |
(a)Net exposure represents the receivable (payable) that would be due from (to) the counterparty in the event of default.
11. Securities Lending
Effective Oct. 4, 2019, the Series, along with other funds in the Delaware Funds, may lend its securities pursuant to a security lending agreement (Lending Agreement) with The Bank of New York Mellon (BNY Mellon). At the time a security is loaned, the borrower must post collateral equal to the required percentage of the market value of the loaned security, including any accrued interest. The required percentage is: (1) 102% with respect to US securities and foreign securities that are denominated and payable in US dollars; and (2) 105% with respect to foreign securities. With respect to each loan, if on any business day, the aggregate market value of securities collateral plus cash collateral held is less than the aggregate market value of the securities which are the subject of such loan, the borrower will be notified to provide additional collateral by the end of the following business day, which, together with the collateral already held, will be not less than the applicable initial collateral requirements for such security loan. If the aggregate market value of securities collateral and cash collateral held with respect to a security loan exceeds the applicable initial collateral requirement, upon the request of the borrower, BNY Mellon must return enough collateral to the borrower by the end of the following business day to reduce the value of the remaining collateral to the applicable initial collateral requirement for such security loan. As a result of the foregoing, the value of the collateral held with respect to a loaned security on any particular day, may be more or less than the value of the security on loan. The collateral percentage with respect to the market value of the loaned security is determined by the security lending agent.
Cash collateral received by each series of the Trust is generally invested in a series of individual separate accounts, each corresponding to a series. The investment guidelines permit each separate account to hold certain securities that would be considered eligible securities for a money market fund. Cash collateral received is generally invested in government securities; certain obligations issued by government sponsored enterprises; repurchase agreements collateralized by US Treasury securities; obligations issued by the central government of any Organization for Economic Cooperation and Development (OECD) country or its agencies, instrumentalities, or establishments; obligations of supranational organizations; commercial paper, notes, bonds, and other debt obligations; certificates of deposit, time deposits, and other bank obligations; and asset-backed securities. The Series can also accept US government securities and letters of credit(non-cash collateral) in connection with securities loans.
In the event of default or bankruptcy by the lending agent, realization and/or retention of the collateral may be subject to legal proceedings. In the event the borrower fails to return loaned securities and the collateral received is insufficient to cover the value of the loaned securities and provided such collateral shortfall is not the result of investment losses, the lending agent has agreed to pay the amount of the shortfall to the Series or, at the discretion of the lending agent, replace the loaned securities. The Series continues to record dividends or interest, as applicable, on the securities loaned and is subject to changes in value of the securities loaned that may occur during the term of the loan. The Series has the right under the Lending Agreement to recover the securities from the borrower on demand. With respect to security loans collateralized bynon-cash collateral, the Series receives loan premiums paid by the borrower. With respect to security loans collateralized by cash collateral, the earnings from the collateral investments are shared among the Series, the security lending agent, and the borrower. The Series records security lending income net of allocations to the security lending agent and the borrower.
Total Return Series-28
Delaware VIP® Total Return Series
Notes to financial statements (continued)
11. Securities Lending (continued)
The Series may incur investment losses as a result of investing securities lending collateral. This could occur if an investment in the collateral investment account defaulted or became impaired. Under those circumstances, the value of the Series’ cash collateral account may be less than the amount the Series would be required to return to the borrowers of the securities and the Series would be required to make up for this shortfall.
During the year ended Dec. 31, 2019, the Series had no securities out on loan.
12. Credit and Market Risk
When interest rates rise, fixed income securities (i.e. debt obligations) generally will decline in value. These declines in value are greater for fixed income securities with longer maturities or durations.
The risk that potential changes related to the use of the London Interbank Offered Rate (LIBOR) could have adverse impacts on financial instruments which reference LIBOR. The potential abandonment of LIBOR could affect the value and liquidity of instruments which reference LIBOR.
Some countries in which the Series may invest require governmental approval for the repatriation of investment income, capital, or the proceeds of sales of securities by foreign investors. In addition, if there is deterioration in a country’s balance of payments or for other reasons, a country may impose temporary restrictions on foreign capital remittances abroad.
The securities exchanges of certain foreign markets are substantially smaller, less liquid, and more volatile than the major securities markets in the United States. Consequently, acquisition and disposition of securities by the Series may be inhibited. In addition, a significant portion of the aggregate market value of equity securities listed on the major securities exchanges in emerging markets is held by a smaller number of investors. This may limit the number of shares available for acquisition or disposition by the Series.
The Series invests in REITs and is subject to the risks associated with that industry. If the Series holds real estate directly or receives rental income directly from real estate holdings, its tax status as a regulated investment company may be jeopardized. There were no direct real estate holdings during the year ended Dec. 31, 2019. The Series’ REIT holdings are also affected by interest rate changes, particularly if the REITs it holds use floating rate debt to finance their ongoing operations.
The Series invests in high yield fixed income securities, which are securities rated lower thanBBB- by Standard & Poor’s Financial Services LLC and lower than Baa3 by Moody’s Investors Service, Inc., or similarly rated by another nationally recognized statistical rating organization. Investments in these higher yielding securities are generally accompanied by a greater degree of credit risk than higher rated securities. Additionally, lower rated securities may be more susceptible to adverse economic and competitive industry conditions than investment grade securities.
The Series invests in fixed income securities whose value is derived from an underlying pool of mortgages or consumer loans. The value of these securities is sensitive to changes in economic conditions, including delinquencies and/or defaults, and may be adversely affected by shifts in the market’s perception of the issuers and changes in interest rates. Investors receive principal and interest payments as the underlying mortgages and consumer loans are paid back. Some of these securities are collateralized mortgage obligations (CMOs). CMOs are debt securities issued by US government agencies or by financial institutions and other mortgage lenders, which are collateralized by a pool of mortgages held under an indenture. Prepayment of mortgages may shorten the stated maturity of the obligations and can result in a loss of premium, if any has been paid. Certain of these securities may be stripped (securities which provide only the principal or interest feature of the underlying security). The yield to maturity on an interest-only CMO is extremely sensitive not only to changes in prevailing interest rates, but also to the rate of principal payments (including prepayments) on the related underlying mortgage assets. A rapid rate of principal payments may have a material adverse effect on the Series’ yield to maturity. If the underlying mortgage assets experience greater than anticipated prepayments of principal, the Series may fail to fully recoup its initial investment in these securities even if the securities are rated in the highest rating categories.
The Series invests in certain obligations that may have liquidity protection designed to ensure that the receipt of payments due on the underlying security is timely. Such protection may be provided through guarantees, insurance policies, or letters of credit obtained by the issuer or sponsor through third parties, through various means of structuring the transaction, or through a combination of such approaches. The Series will not pay any additional fees for such credit support, although the existence of credit support may increase the price of the security.
The Series may invest up to 10% of its net assets in illiquid securities, which may include securities with contractual restrictions on resale, securities exempt from registration under Rule 144A, promulgated under the Securities Act of 1933, as amended, and other securities which may not be readily marketable. The relative illiquidity of these securities may impair the Series from disposing of them in a timely manner and at a fair price when it is necessary or desirable to do so. While maintaining oversight, the Board has delegated to DMC theday-to-day functions of determining whether individual securities are liquid for purposes of the Series’ limitation on investments in illiquid securities. Securities eligible for resale pursuant to Rule 144A, which are determined to be liquid, are not subject to the Series’ 10% limit on investments in illiquid securities. Rule 144A securities have been identified on the “Schedule of investments.”
Total Return Series-29
Delaware VIP® Total Return Series
Notes to financial statements (continued)
13. Contractual Obligations
The Series enters into contracts in the normal course of business that contain a variety of indemnifications. The Series’ maximum exposure under these arrangements is unknown. However, the Series has not had prior claims or losses pursuant to these contracts. Management has reviewed the Series’ existing contracts and expects the risk of loss to be remote.
14. Recent Accounting Pronouncements
In March 2017, the FASB issued an Accounting Standards Update (ASU), ASU2017-08, Receivables — Nonrefundable Fees and Other Costs (Subtopic310-20), Premium Amortization on Purchased Callable Debt Securities which amends the amortization period for certain callable debt securities purchased at a premium, shortening such period to the earliest call date. The ASU2017-08 does not require any accounting change for debt securities held at a discount; the discount continues to be amortized to maturity. The ASU2017-08 is effective for fiscal years, and interim periods within those fiscal years, beginning after Dec. 15, 2018. Management has implemented the ASU2017-08 and determined that the impact of this guidance to the Series’ net assets at the end of the year is not material.
In August 2018, the FASB issued an ASU2018-13, which changes certain fair value measurement disclosure requirements. ASU2018-13, in addition to other modifications and additions, removes the requirement to disclose the amount and reasons for transfers between Level 1 and Level 2 of the fair value hierarchy, the policy for the timing of transfers between levels and the valuation process for Level 3 fair value measurements. ASU2018-13 is effective for fiscal years, and interim periods within those fiscal years, beginning after Dec. 15, 2019. At this time, management is evaluating the implications of these changes on the financial statements.
15. Subsequent Events
Management has determined that no material events or transactions occurred subsequent to Dec. 31, 2019, that would require recognition or disclosure in the Series’ financial statements.
Total Return Series-30
Delaware VIP® Trust — Delaware VIP Total Return Series
Report of independent registered public accounting firm
To the Board of Trustees of Delaware VIP® Trust and Shareholders of Delaware VIP Total Return Series
Opinion on the Financial Statements
We have audited the accompanying statement of assets and liabilities, including the schedule of investments, of Delaware VIP Total Return Series (one of the series constituting Delaware VIP® Trust, referred to hereafter as the “Series”) as of December 31, 2019, the related statements of operations and changes in net assets for the year then ended, including the related notes, and the financial highlights for each of the periods indicated therein (collectively referred to as the “financial statements”). In our opinion, the financial statements present fairly, in all material respects, the financial position of the Series as of December 31, 2019, the results of its operations and changes in its net assets for the year then ended, and the financial highlights for each of the periods indicated therein in conformity with accounting principles generally accepted in the United States of America.
The financial statements of First Investors Life Series Total Return Fund (subsequent to reorganization, known as Delaware VIP Total Return Series) as of and for the year ended December 31, 2018 and the financial highlights for each of the periods ended on or prior to December 31, 2018 (not presented herein, other than the statement of changes in net assets and the financial highlights) were audited by other auditors whose report dated February 26, 2019 expressed an unqualified opinion on those financial statements and financial highlights.
Basis for Opinion
These financial statements are the responsibility of the Series’ management. Our responsibility is to express an opinion on the Series’ financial statements based on our audit. We are a public accounting firm registered with the Public Company Accounting Oversight Board (United States) (PCAOB) and are required to be independent with respect to the Series in accordance with the U.S. federal securities laws and the applicable rules and regulations of the Securities and Exchange Commission and the PCAOB.
We conducted our audit of these financial statements in accordance with the standards of the PCAOB. Those standards require that we plan and perform the audit to obtain reasonable assurance about whether the financial statements are free of material misstatement, whether due to error or fraud.
Our audit included performing procedures to assess the risks of material misstatement of the financial statements, whether due to error or fraud, and performing procedures that respond to those risks. Such procedures included examining, on a test basis, evidence regarding the amounts and disclosures in the financial statements. Our audit also included evaluating the accounting principles used and significant estimates made by management, as well as evaluating the overall presentation of the financial statements. Our procedures included confirmation of securities owned as of December 31, 2019 by correspondence with the custodian, transfer agents and brokers. We believe that our audit provides a reasonable basis for our opinion.
/s/PricewaterhouseCoopers LLP
Philadelphia, Pennsylvania
February 28, 2020
We have served as the auditor of one or more investment companies in Delaware Funds® by Macquarie since 2010.
Total Return Series-31
Delaware VIP® Trust — Delaware VIP Total Return Series
Other Series information(Unaudited)
Tax Information
All disclosures are based on financial information available as of the date of this annual report and, accordingly are subject to change. For any and all items requiring reporting, it is the intention of the Series to report the maximum amount permitted under the Internal Revenue Code and the regulations thereunder.
For the year ended Dec. 31, 2019, the Series reports distributions paid during the year as follows:
| | | | |
(A)
Long-Term
Capital Gain
Distributions
(Tax Basis) | | (B)
Ordinary Income
Distributions
(Tax Basis) | | Total
Distributions
(Tax Basis) |
| 48.74% | | 51.26% | | 100.00% |
(A) and (B) are based on a percentage of the Series’ total distributions.
Total Return Series-32
Delaware Funds® by Macquarie
Board of trustees / directors and officers addendum
A mutual fund is governed by a Board of Trustees/Directors (“Trustees”), which has oversight responsibility for the management of a fund’s business affairs. Trustees establish procedures and oversee and review the performance of the investment manager, the distributor, and others who perform services for the fund. The independent fund trustees, in particular, are advocates for shareholder interests. Each trustee has served in that capacity since he or she was elected to or appointed to the Board of Trustees, and will continue to serve until his or her retirement or the election of a new trustee in his or her place. The following is a list of the Trustees and Officers with certain background and related information.
| | | | | | | | | | |
Name,
Address,
and Birth Date | | Position(s) Held with Fund(s) | | Length of Time
Served | | Principal
Occupation(s)
During the
Past Five Years | | Number of
Portfolios in Fund
Complex Overseen
by Trustee
or Officer | | Other
Directorships
Held by
Trustee
or Officer |
| INTERESTED TRUSTEE | | | | | | | | | | |
| | | | | |
Shawn K. Lytle1
2005 Market Street Philadelphia, PA 19103 February 1970 | | President,
Chief Executive Officer, and Trustee | | President and Chief Executive Officer since August 2015 Trustee since September 2015 | | President — Macquarie Investment Management2(June 2015-Present) Regional Head of Americas — UBS Global Asset Management(April 2010-May 2015) | | 95 | | Trustee — UBS Relationship Funds, SMA Relationship Trust, and UBS Funds
(May 2010–April 2015) |
INDEPENDENT TRUSTEES | | | | | | |
| | | | | |
Thomas L. Bennett
2005 Market Street Philadelphia, PA 19103 October 1947 | | Chair and Trustee | | Trustee since March 2005 Chair since March 2015 | | Private Investor (March 2004–Present) | | 95 | | None |
Jerome D. Abernathy
2005 Market Street Philadelphia, PA 19103 July 1959 | | Trustee | | Since January 2019 | | Managing Member, Stonebrook Capital Management, LLC (financial technology: macro factors and databases) (January 1993–Present) | | 95 | | None |
Ann D. Borowiec
2005 Market Street Philadelphia, PA 19103 November 1958 | | Trustee | | Since March 2015 | | Chief Executive Officer, Private Wealth Management (2011–2013) and Market Manager, New Jersey Private Bank (2005–2011) — J.P. Morgan Chase & Co. | | 95 | | Director — Banco Santander International (October 2016–December 2019) Director — Santander Bank, N.A. (December 2016–December 2019) |
Joseph W. Chow
2005 Market Street Philadelphia, PA 19103 January 1953 | | Trustee | | Since January 2013 | | Private Investor (April 2011–Present) | | 95 | | Director and Audit Committee Member — Hercules Technology Growth Capital, Inc. (July 2004–July 2014) |
Total Return Series-33
| | | | | | | | | | |
Name,
Address,
and Birth Date | | Position(s)
Held with
Fund(s) | | Length of Time
Served | | Principal
Occupation(s)
During the
Past Five Years | | Number of
Portfolios in Fund
Complex Overseen
by Trustee
or Officer | | Other
Directorships
Held by
Trustee
or Officer |
John A. Fry
2005 Market Street Philadelphia, PA 19103 May 1960 | | Trustee | | Since January 2001 | | President — Drexel University (August 2010–Present) President — Franklin & Marshall College (July 2002–July 2010) | | 95 | | Director; Compensation Committee and Governance Committee Member — Community Health Systems (May 2004–Present) Director — Drexel Morgan & Co. (2015–Present) Director and Audit Committee Member — vTv Therapeutics LLC (2017–Present) Director and Audit Committee Member — FS Credit Real Estate Income Trust, Inc.
(2018–Present) Director — Federal Reserve Bank of Philadelphia (January 2020–Present) |
Lucinda S. Landreth
2005 Market Street Philadelphia, PA 19103 June 1947 | | Trustee | | Since March 2005 | | Private Investor (2004–Present) | | 95 | | None |
| | | | | |
Frances A. Sevilla-Sacasa
2005 Market Street Philadelphia, PA 19103 January 1956 | | Trustee | | Since September 2011 | | Private Investor (January 2017-Present) Chief Executive Officer — Banco Itaú International (April 2012–December 2016) Executive Advisor to Dean (August 2011–March 2012) and Interim Dean (January 2011–July 2011) — University of Miami School of Business Administration President — U.S. Trust, Bank of America Private Wealth Management (Private Banking) (July 2007–December 2008) | | 95 | | Trust Manager and Audit Committee Chair — Camden Property Trust (August 2011–Present) Director; Strategic Planning and Reserves Committee and Nominating and Governance Committee Member — Callon Petroleum Company (December 2019–Present) Director; Audit Committee Member — Carrizo Oil & Gas, Inc. (March 2018–December 2019) |
Thomas K. Whitford
2005 Market Street Philadelphia, PA 19103 March 1956 | | Trustee | | Since January 2013 | | Vice Chairman (2010–April 2013) — PNC Financial Services Group | | 95 | | Director — HSBC North America Holdings Inc. (December 2013-Present) Director — HSBC USA Inc. (July 2014-Present) Director — HSBC Bank USA, National Association (July 2014-March 2017) Director — HSBC Finance Corporation (December 2013-April 2018) |
Total Return Series-34
| | | | | | | | | | |
Name, Address, and Birth Date | | Position(s) Held with Fund(s) | | Length of Time
Served | | Principal
Occupation(s)
During the Past Five Years | | Number of
Portfolios in Fund
Complex Overseen
by Trustee or Officer | | Other
Directorships
Held by Trustee
or Officer |
Christianna Wood
2005 Market Street Philadelphia, PA 19103 March 1956 | | Trustee | | Since January 2019 | | Chief Executive Officer and President — Gore Creek Capital, Ltd. (August 2009–Present) | | 95 | | Director; Finance Committee and Audit Committee Member — H&R Block Corporation (July 2008–Present) Director; Chair of Investments Committee and Audit Committee Member — Grange Insurance (2013–Present) Trustee; Chair of Nominating and Governance Committee and Audit Committee Member — The Merger Fund (2013–Present), The Merger Fund VL (2013–Present); WCM Alternatives: Event-Driven Fund (2013–Present), and WCM Alternatives: Credit Event Fund (December 2017–Present) Director; Chair of Governance Committee and Audit Committee Member — International Securities Exchange (2010–2016) |
Janet L. Yeomans
2005 Market Street Philadelphia, PA 19103 July 1948 | | Trustee | | Since April 1999 | | Vice President and Treasurer (January 2006–July 2012), Vice President — Mergers & Acquisitions (January 2003–January 2006), and Vice President and Treasurer (July 1995–January 2003) — 3M Company | | 95 | | Director; Personnel and Compensation Committee Chair; Member of Nominating, Investments, and Audit Committees for various periods throughout directorship — Okabena Company (2009-2017) |
Total Return Series-35
| | | | | | | | | | |
Name, Address, and Birth Date | | Position(s) Held with Fund(s) | | Length of Time
Served | | Principal
Occupation(s)
During the Past Five Years | | Number of
Portfolios in Fund
Complex Overseen
by Trustee or Officer | | Other
Directorships
Held by Trustee
or Officer |
| OFFICERS | | | | | | | | | | |
| | | | | |
David F. Connor
2005 Market Street Philadelphia, PA 19103 December 1963 | | Senior Vice President, General Counsel, and Secretary | | Senior Vice President, since May 2013; General Counsel since May 2015; Secretary since October 2005 | | David F. Connor has served in various capacities at different times at Macquarie Investment Management. | | 95 | | None3 |
| | | | | |
Daniel V. Geatens
2005 Market Street Philadelphia, PA 19103 October 1972 | | Vice President and Treasurer | | Vice President and Treasurer since October 2007 | | Daniel V. Geatens has served in various capacities at different times at Macquarie Investment Management. | | 95 | | None3 |
| | | | | |
Richard Salus
2005 Market Street Philadelphia, PA 19103 October 1963 | | Senior Vice President and Chief Financial Officer | | Senior Vice President and Chief Financial Officer since November 2006 | | Richard Salus has served in various capacities at different times at Macquarie Investment Management. | | 95 | | None |
| 1 | Shawn K. Lytle is considered to be an “Interested Trustee” because he is an executive officer of the Fund’s(s’) investment advisor. |
| 2 | Macquarie Investment Management is the marketing name for Macquarie Management Holdings, Inc. and its subsidiaries, including the Fund’s(s’) investment advisor, principal underwriter, and its transfer agent. |
| 3 | David F. Connor and Daniel V. Geatens serve in similar capacities for the six portfolios of the Optimum Fund Trust, which have the same investment advisor, principal underwriter, and transfer agent as the registrant. Mr. Geatens also serves as the Chief Financial Officer of the Optimum Fund Trust and he is the Chief Financial Officer and Treasurer for Macquarie Global Infrastructure Total Return Fund Inc. |
The Statement of Additional Information for the Fund(s) includes additional information about the Trustees and Officers and is available, without charge, upon request by calling 800523-1918.
Total Return Series-36
| | | | |
| | |
| | The Series files its complete schedule of portfolio holdings with the Securities and Exchange Commission (SEC) for the first and third quarters of each fiscal year on FormN-Q or FormN-PORT (available for filings after March 31, 2019). The Series’ FormsN-Q or FormsN-PORT, as well as a description of the policies and procedures that the Series uses to determine how to vote proxies (if any) relating to portfolio securities, are available without charge (i) upon request, by calling 800523-1918; and (ii) on the SEC’s website at sec.gov. In addition, a description of the policies and procedures that the Series uses to determine how to vote proxies (if any) relating to portfolio securities and the Schedule of Investments included in the Series’ most recent FormN-Q or FormN-PORT are available without charge on the Series’ website at delawarefunds.com/vip/literature. The Series’ FormsN-Q and FormsN-PORT may be reviewed and copied at the SEC’s Public Reference Room in Washington, D.C.; information on the operation of the Public Reference Room may be obtained by calling 800SEC-0330. Information (if any) regarding how the Series voted proxies relating to portfolio securities during the most recently disclosed12-month period ended June 30 is available without charge (i) through the Series’ website at delawarefunds.com/proxy; and (ii) on the SEC’s website at sec.gov. | | |
| | |
| AR-VIPTR 22501 (2/20) (1076649) | | Total ReturnSeries-37 |
Item 2. Code of Ethics
Item 3. Audit Committee Financial Expert
The registrant’s Board of Trustees has determined that certain members of the registrant’s Audit Committee are audit committee financial experts, as defined below. For purposes of this item, an “audit committee financial expert” is a person who has the following attributes:
a. An understanding of generally accepted accounting principles and financial statements;
b. The ability to assess the general application of such principles in connection with the accounting for estimates, accruals, and reserves;
c. Experience preparing, auditing, analyzing, or evaluating financial statements that present a breadth and level of complexity of accounting issues that are generally comparable to the breadth and complexity of issues that can reasonably be expected to be raised by the registrant’s financial statements, or experience actively supervising one or more persons engaged in such activities;
d. An understanding of internal controls and procedures for financial reporting; and
e. An understanding of audit committee functions.
An “audit committee financial expert” shall have acquired such attributes through:
a. Education and experience as a principal financial officer, principal accounting officer, controller, public accountant, or auditor or experience in one or more positions that involve the performance of similar functions;
b. Experience actively supervising a principal financial officer, principal accounting officer, controller, public accountant, auditor, or person performing similar functions;
c. Experience overseeing or assessing the performance of companies or public accountants with respect to the preparation, auditing, or evaluation of financial statements; or
d. Other relevant experience.
The registrant’s Board of Trustees has also determined that each member of the registrant’s Audit Committee is independent. In order to be “independent” for purposes of this item, the Audit Committee member may not: (i) other than in his or her capacity as a member of the Board of Trustees or any committee thereof, accept directly or indirectly any consulting, advisory or other compensatory fee from the issuer; or (ii) be an “interested person” of the registrant as defined in Section 2(a)(19) of the Investment Company Act of 1940.
The names of the audit committee financial experts on the registrant’s Audit Committee are set forth below:
Jerome D. Abernathy
John A. Fry
Thomas K. Whitford, Chair
Christianna Wood
Item 4. Principal Accountant Fees and Services
The aggregate fees billed for services provided to the registrant by its independent auditors for the audit of the registrant’s annual financial statements and for services normally provided by the independent auditors in connection with statutory and regulatory filings or engagements were $921,410 for the fiscal year ended December 31, 2019.
The aggregate fees billed for services provided to the registrant by its independent auditors for the audit of the registrant’s annual financial statements and for services normally provided by the independent auditors in connection with statutory and regulatory filings or engagements were $337,050 for the fiscal year ended December 31, 2018.
The aggregate fees billed by the registrant’s independent auditors for services relating to the performance of the audit of the registrant’s financial statements and not reported under paragraph (a) of this Item were $0 for the fiscal year ended December 31, 2019.
The aggregate fees billed by the registrant’s independent auditors for services relating to the performance of the audit of the registrant’s financial statements and not reported under paragraph (a) of this Item were $0 for the fiscal year ended December 31, 2018.
The aggregate fees billed by the registrant’s independent auditors for tax-related services provided to the registrant’s investment adviser and other service providers under common control with the adviser and that relate directly to the operations or financial reporting of the registrant were $0 for the registrant’s fiscal year ended December 31, 2019. The percentage of these fees relating to services approved by the registrant’s Audit Committee pursuant to the de minimis exception from the pre-approval requirement in Rule 2-01(c)(7)(i)(C) of Regulation S-X was 0%.
The aggregate fees billed by the registrant’s independent auditors for tax-related services provided to the registrant’s investment adviser and other service providers under common control with the adviser and that relate directly to the operations or financial reporting of the registrant were $0 for the registrant’s fiscal year ended December 31, 2018. The percentage of these fees relating to services approved by the registrant’s Audit Committee pursuant to the de minimis exception from the pre-approval requirement in Rule 2-01(c)(7)(i)(C) of Regulation S-X was 0%.
The aggregate fees billed for all services provided by the independent auditors to the registrant other than those set forth in paragraphs (a), (b) and (c) of this Item were $0 for the fiscal year ended December 31, 2019.
The aggregate fees billed for all services provided by the independent auditors to the registrant other than those set forth in paragraphs (a), (b) and (c) of this Item were $0 for the fiscal year ended December 31, 2018.
Under the Pre-Approval Policy, the Audit Committee has also pre-approved the services set forth in the table below with respect to the registrant’s investment adviser and other entities controlling, controlled by or under common control with the investment adviser that provide ongoing services to the registrant (the “Control Affiliates”) up to the specified fee limit. This fee limit is based on aggregate fees to the investment adviser and its Control Affiliates.
The Pre-Approval Policy requires the registrant’s independent auditors to report to the Audit Committee at each of its regular meetings regarding all services initiated since the last such report was rendered, including those services authorized by the Pre-Approval Policy.
(f) Not applicable.
(g) The aggregate non-audit fees billed by the registrant’s independent auditors for services rendered to the registrant and to its investment adviser and other service providers under common control with the adviser were $4,687,000 and $11,748,000 for the registrant’s fiscal years ended December 31, 2019 and December 31, 2018, respectively.
(h) In connection with its selection of the independent auditors, the registrant’s Audit Committee has considered the independent auditors’ provision of non-audit services to the registrant’s investment adviser and other service providers under common control with the adviser that were not required to be pre-approved pursuant to Rule 2-01(c)(7)(ii) of Regulation S-X. The Audit Committee has determined that the independent auditors’ provision of these services is compatible with maintaining the auditors’ independence.
Item 5. Audit Committee of Listed Registrants
Not applicable.
Item 6. Investments
(a) Included as part of report to shareholders filed under Item 1 of this Form N-CSR.
(b) Divestment of securities in accordance with Section 13(c) of the Investment Company Act of 1940.
Not applicable.
Item 7. Disclosure of Proxy Voting Policies and Procedures for Closed-End Management Investment Companies
Not applicable.
Item 8. Portfolio Managers of Closed-End Management Investment Companies
Not applicable.
Item 9. Purchases of Equity Securities by Closed-End Management Investment Companies and Affiliated Purchasers
Not applicable.
Item 10. Submission of Matters to a Vote of Security Holders
Not applicable.
Item 11. Controls and Procedures
The registrant’s principal executive officer and principal financial officer have evaluated the registrant’s disclosure controls and procedures within 90 days of the filing of this report and have concluded that they are effective in providing reasonable assurance that the information required to be disclosed by the registrant in its reports or statements filed under the Securities Exchange Act of 1934 is recorded, processed, summarized and reported within the time periods specified in the rules and forms of the Securities and Exchange Commission.
There were no significant changes in the registrant’s internal control over financial reporting that occurred during the period covered by the report to stockholders included herein that have materially affected, or are reasonably likely to materially affect, the registrant’s internal control over financial reporting.
Item 12. Disclosure of Securities Lending Activities for Closed-End Management Investment Companies
Not applicable.
Item 13. Exhibits
Not applicable.
(2) Certifications of Principal Executive Officer and Principal Financial Officer pursuant to Rule 30a-2 under the Investment Company Act of 1940 are attached hereto as Exhibit 99.CERT.
(3) Written solicitations to purchase securities pursuant to Rule 23c-1 under the Securities Exchange Act of 1934.
Not applicable.
(b) Certifications pursuant to Section 906 of the Sarbanes-Oxley Act of 2002 are furnished herewith as Exhibit 99.906CERT.
Pursuant to the requirements of the Securities Exchange Act of 1934 and the Investment Company Act of 1940, the registrant has duly caused this report to be signed on its behalf, by the undersigned, thereunto duly authorized.
Pursuant to the requirements of the Securities Exchange Act of 1934 and the Investment Company Act of 1940, this report has been signed below by the following persons on behalf of the registrant and in the capacities and on the dates indicated.


 Portfolio management review


 Portfolio management review


