UNITED STATES
SECURITIES AND EXCHANGE COMMISSION
Washington, D.C. 20549
FORM N-CSR
Certified Shareholder Report of
Registered Management Investment Companies
Investment Company Act File Number: 811-05888
SMALLCAP World Fund, Inc.
(Exact Name of Registrant as Specified in Charter)
6455 Irvine Center Drive
Irvine, California 92618
(Address of Principal Executive Offices)
Registrant's telephone number, including area code: (213) 486-9200
Date of fiscal year end: September 30
Date of reporting period: September 30, 2017
Michael W. Stockton
SMALLCAP World Fund, Inc.
333 South Hope Street
Los Angeles, California 90071
(Name and Address of Agent for Service)
ITEM 1 – Reports to Stockholders
 | SMALLCAP World Fund® Annual report
for the year ended
September 30, 2017 |

We believe high-
conviction investing
and diverse
perspectives lead
to better results.
SMALLCAP World Fund seeks to provide you with long-term growth of capital.
This fund is one of more than 40 offered by one of the nation’s largest mutual fund families, American Funds, from Capital Group. For more than 85 years, Capital has invested with a long-term focus based on thorough research and attention to risk.
Fund results shown in this report, unless otherwise indicated, are for Class A shares at net asset value. If a sales charge (maximum 5.75%) had been deducted, the results would have been lower. Results are for past periods and are not predictive of results for future periods. Current and future results may be lower or higher than those shown. Share prices and returns will vary, so investors may lose money. Investing for short periods makes losses more likely. For current information and month-end results, visit americanfunds.com.
See page 5 for Class A share results with relevant sales charges deducted. For other share class results, visit americanfunds.com and americanfundsretirement.com.
Investment results assume all distributions are reinvested and reflect applicable fees and expenses. When applicable, investment results reflect fee waivers, without which results would have been lower. Visit americanfunds.com for more information.
Investing outside the United States may be subject to risks, such as currency fluctuations and political instability. These risks may be heightened in connection with investments in developing countries. Investing in small-capitalization stocks can involve greater risk than is customarily associated with investing in stocks of larger, more established companies. Refer to the fund prospectus and the Risk Factors section of this report for more information on these and other risks associated with investing in the fund.
Investments are not FDIC-insured, nor are they deposits of or guaranteed by a bank or any other entity, so they may lose value.
Contents
| 1 | Letter to investors |
| | |
| 5 | The value of a long-term perspective |
| | |
| 6 | Summary investment portfolio |
| | |
| 15 | Financial statements |
| | |
| 42 | Board of directors and other officers |
Fellow investors:
Global small-capitalization stocks underwent intense volatility during SMALLCAP World Fund’s most recent fiscal year, but the fund nonetheless posted a total return of 18.11% for the 12 months ended September 30, 2017.
By way of comparison the MSCI All Country World Small Cap Index, an unmanaged index of global small-cap equities that does not include fees or expenses, returned 19.23% over the same period, while the Lipper Global Small-/ Mid-Cap Funds Average, a measure of the fund’s peer group, gained 20.27%.
The fund’s returns included a dividend payment of 15.89 cents per share, paid out on December 21, 2016.
The fund’s managers sought to keep volatility in check during the period. Over a number of longer periods, the fund’s returns continue to surpass the indexes, as seen in the chart below.
The year in review
While global equity markets generally surged during the 12-month period, this was primarily led by large-cap indexes, consisting of highly established, global companies. Small-cap indexes around the world, however, saw more volatility. This was fueled largely by big swings in currency exchange rates as well as commodity prices, particularly energy.
Results at a glance
For periods ended September 30, 2017, with all distributions reinvested
| | | Cumulative
total returns | | Average annual
total returns |
| | | 1 year | | 5 years | | 10 years | | Lifetime
(since 4/30/90) |
SMALLCAP World Fund
(Class A shares) | | | 18.11 | % | | | 12.21 | % | | | 5.38 | % | | | 9.80 | % |
MSCI All Country World
Small Cap Index* | | | 19.23 | | | | 11.94 | | | | 6.16 | | | | n/a | |
Lipper Global Small-/Mid-Cap
Funds Average† | | | 20.27 | | | | 11.79 | | | | 4.75 | | | | 9.38 | |
| * | Source: MSCI. The market index is unmanaged and, therefore, has no expenses. Investors cannot invest directly in an index. The market index is a free float-adjusted market capitalization weighted index that is designed to measure equity market results of smaller capitalization companies in both developed and emerging markets. Results reflect dividends net of withholding taxes. This index was not in existence when the fund’s Class A shares were first sold; therefore, lifetime results are not available. |
| † | Source: Thomson Reuters Lipper. Lipper averages reflect the current composition of all eligible mutual funds (all share classes) within a given category. Lipper categories are dynamic and averages may have few funds, especially over longer periods. To see the number of funds included in the Lipper category for each fund’s lifetime, please see the Quarterly Statistical Update available on our website. |
“The primary driver of investment decisions remains our intensive, bottom-up research into individual companies.”
Likewise, most global markets weathered a number of geopolitical issues, such as political gridlock in the United States, issues around Brexit in Europe, and continued unrest in the Middle East and the Korean Peninsula. Small-cap companies, however, can be more susceptible to such changes, and these issues had a larger effect on the fund’s investment universe than the broader market.
That said, economic growth in the United States remained strong, with second-quarter gross domestic product in the United States rising 3.1%, and GDP in the euro zone rising 2.3% on an annualized basis. Emerging markets such as China saw renewed economic expansion as well.
How the fund responded
The economic and market environment remains an important consideration for the fund’s managers, but the primary driver of investment decisions remains our intensive, bottom-up research into individual companies, which has been a hallmark of the fund’s success for more than a quarter-century. The fund’s managers do not allocate based on industry or geography, but instead invest in individual companies with the potential to grow over time.
For the fund’s most recent fiscal year, holdings in consumer discretionary, health care and financials provided some of the greatest returns for the fund, surpassing the returns of the MSCI index in each instance. Two of the fund’s top health care holdings, Kite Pharma (up 221.9%) and Bluebird Bio (up 102.6%), strongly aided returns. That said, GW Pharmaceuticals (down 23.5%) and China Biologic Products Holdings Inc. (down 25.9%) had a negative impact.
The fund’s holdings in energy stocks detracted from the fund’s return, due in part to the aforementioned volatility among commodity prices. U.S. Silica fell 33.3% for the year, as an example.
Roughly 44% of the fund’s portfolio was held in U.S. equities, which were largely beneficial to the fund’s relative return. Emerging markets shares made up 19% of the portfolio’s equity position, which aided returns, as did companies domiciled
Where the fund’s assets are invested (by country of domicile)
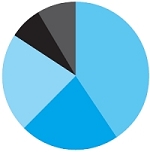
| As of September 30, 2017 | Percent of net assets |
| n United States | 40.6% |
| n Asia & Pacific Basin | 21.9 |
| n Europe | 21.9 |
| n Other (including Canada & Latin America) | 7.1 |
| n Short-term securities & other assets less liabilities | 8.5 |
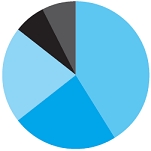
| As of September 30, 2016 | Percent of net assets |
| n United States | 41.2% |
| n Asia & Pacific Basin | 23.4 |
| n Europe | 21.0 |
| n Other (including Canada & Latin America) | 6.9 |
| n Short-term securities & other assets less liabilities | 7.5 |
Largest equity holdings
| | Percent of net assets |
| AAC Technologies Holdings | .8% |
| Bluebird Bio | .8 |
| Kotak Mahindra Bank | .8 |
| Molina Healthcare | .8 |
| Qorvo | .7 |
| Lions Gate Entertainment | .7 |
| Domino’s Pizza | .7 |
| Seria | .7 |
| YOOX Net-A-Porter | .7 |
| Essent Group | .6 |
in Canada, the Pacific Rim (aside from Japan) and a number of European shares.
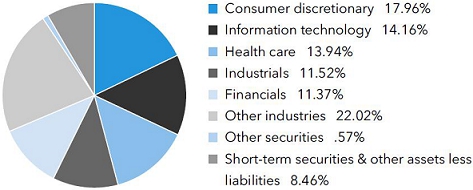
The largest detractor to the fund’s relative return was its cash position, at 8.46% of the portfolio. The fund’s managers maintain a small portion of the portfolio in cash to help hedge against volatility and to take advantage of potential investment opportunities as they arise.
The road ahead
Volatility is likely to continue among small-cap stocks, but the overall economic environment remains positive. That said, double-digit returns such as these are unusual, and we do not invest with the expectation that such returns are sustainable over the long term.
The biotechnology industry could see gains over the coming year. A number of the fund’s biotech holdings are approaching important milestones in clinical trials and approvals in the next 12 months, which may help the fund. Consumers around the world remain resilient, and we continue to study spending patterns closely to stay ahead of any developing trends.
The New Geography of Investing®
Where a company does business can be more important than where it’s located. Here’s a look at SMALLCAP World Fund’s portfolio in terms of where its equity holdings earn their revenue. The charts below show the countries and regions in which the fund’s equity investments are located, and where the revenue comes from.
Equity portion breakdown by domicile (%)
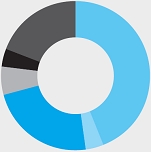
| Region | Fund | | Index | |
| n United States | 44 | % | 49 | % |
| n Canada | 4 | | 3 | |
| n Europe | 23 | | 22 | |
| n Japan | 6 | | 11 | |
| n Asia-Pacific ex. Japan | 4 | | 4 | |
| n Emerging markets | 19 | | 11 | |
| Total | 100 | % | 100 | % |
Equity portion breakdown by revenue (%)
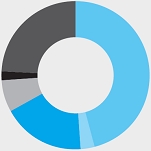
| Region | Fund | | Index | |
| n United States | 46 | % | 43 | % |
| n Canada | 3 | | 3 | |
| n Europe | 18 | | 19 | |
| n Japan | 7 | | 10 | |
| n Asia-Pacific ex. Japan | 2 | | 4 | |
| n Emerging markets | 24 | | 21 | |
| Total | 100 | % | 100 | % |
| | | | | |
Compared with the MSCI ACWI Small Cap Index as a percent of net assets. Source: MSCI.
All figures include convertible securities.
SMALLCAP World Fund source: Capital Group (as of September 30, 2017).
“The fund has never had as many resources available to our investment professionals as we do today.”
Geopolitical issues are likely to remain a concern over the next year, though it remains to be seen how much overall impact they’ll have. Domestically, Washington remains gridlocked; while this may prevent major initiatives from being passed, this can also keep government from having negative impacts as well.
We wish to note that the fund’s guidelines for market capitalization will expand. Currently, the fund can invest in companies with overall values of up to $4 billion. This will increase to $6 billion as of December 1. The fund has not changed its focus on investing in equities in the lowest quintile of market capitalization. The simple fact of the matter is that the value of this lowest quintile has risen since the fund last revisited its guidelines in 2010.
Finally, we remain committed to continually strengthening our investment process on behalf of our shareholders. We continue to add resources to our research efforts around the globe and, as of this writing, the fund has never had as many resources available to our investment professionals as we do today. We thank you for your continued faith in our efforts, and look forward to reporting to you again in six months.
Cordially,

Jonathan Knowles
Vice Chairman of the Board

Gregory W. Wendt
President
November 10, 2017
For current information about the fund, visit americanfunds.com.
Why your annual report has a different look
You have probably noticed that this annual report doesn’t look like the glossier reports of the past. After surveying a large, representative sample of our investors, we have decided to make a few key changes to these documents and have adjusted the look and feel of our reports (e.g., paper stock and design standards) to reflect the prevailing industry norm. These changes will reduce costs and the amount of paper we consume.
You also told us that we should be considering ways to deliver the valuable perspective of our investment professionals to you digitally. We are in the process of building our digital investor education content on our website, which will provide a platform for investment professionals to communicate with investors using the channels that you access more often.
If you have not already done so, you can elect to receive your annual reports electronically. Once you do, you will receive an email notification as soon as the documents are available. To learn more, visit americanfunds.com/gopaperless.n
The value of a long-term perspective
This chart shows how a $10,000 investment in SMALLCAP World Fund’s Class A shares grew from April 30, 1990 — the fund’s inception — through September 30, 2017, the end of the fund’s latest fiscal year. As you can see, the $10,000 would have grown to $122,279 even after deducting the maximum 5.75% sales charge.
Fund results shown are for Class A shares and reflect deduction of the maximum sales charge of 5.75% on the $10,000 investment.1 Thus, the net amount invested was $9,425. Results are for past periods and are not predictive of results for future periods. Current and future results may be lower or higher than those shown. Share prices and returns will vary, so investors may lose money. For current information and month-end results, visit americanfunds.com.
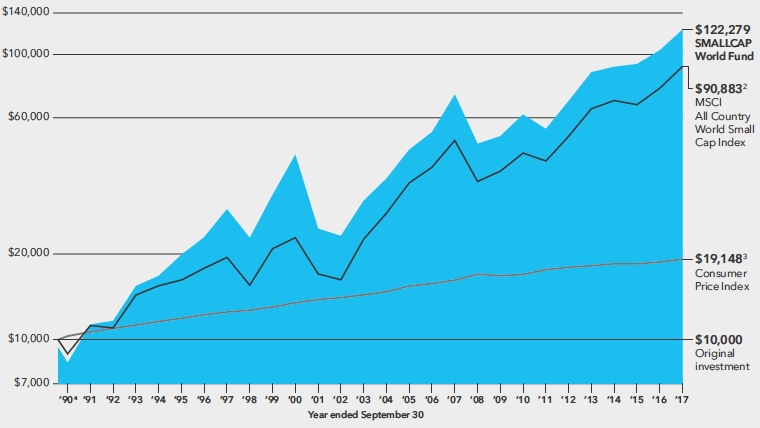
| 1 | As outlined in the prospectus, the sales charge is reduced for accounts (and aggregated investments) of $25,000 or more and is eliminated for purchases of $1 million or more. There is no sales charge on dividends or capital gain distributions that are reinvested in additional shares. |
| 2 | The MSCI All Country World Small Cap Index is unmanaged and, therefore, has no expenses. Investors cannot invest directly in an index. Results reflect dividends net of withholding taxes. Because the index was not in existence when the fund’s Class A shares were first sold, cumulative returns through May 31, 1994, reflect the returns of the S&P Developed <$1.2 Billion Index. MSCI source: MSCI. S&P source: S&P Dow Jones Indices LLC. |
| 3 | Computed from data supplied by the U.S. Department of Labor, Bureau of Labor Statistics. |
| 4 | For the period April 30, 1990, commencement of operations, through September 30, 1990. |
The results shown are before taxes on fund distributions and sale of fund shares.
Average annual total returns based on a $1,000 investment (for periods ended September 30, 2017)*
| | | 1 year | | 5 years | | 10 years |
| | | | | | | |
| Class A shares | | | 11.32 | % | | | 10.89 | % | | | 4.76 | % |
* Assumes reinvestment of all distributions and payment of the maximum 5.75% sales charge.
The total annual fund operating expense ratio is 1.07% for Class A shares as of the prospectus dated December 1, 2017 (unaudited). The expense ratio is restated to reflect current fees.
Investment results assume all distributions are reinvested and reflect applicable fees and expenses. When applicable, investment results reflect fee waivers, without which results would have been lower. Visit americanfunds.com for more information.
Summary investment portfolio September 30, 2017
| Industry sector diversification | Percent of net assets |
| Country diversification by domicile | | Percent of
net assets |
| United States | | | 40.53 | % |
| Euro zone* | | | 8.13 | |
| United Kingdom | | | 7.87 | |
| Japan | | | 5.67 | |
| India | | | 5.12 | |
| Canada | | | 3.16 | |
| Sweden | | | 2.70 | |
| China | | | 2.24 | |
| Taiwan | | | 2.09 | |
| Other countries | | | 14.03 | |
| Short-term securities & other assets less liabilities | | | 8.46 | |
| * | Countries using the euro as a common currency; those represented in the fund’s portfolio are Austria, Belgium, Finland, France, Germany, Greece, Ireland, Italy, the Netherlands, Portugal, Slovenia and Spain. |
| Common stocks 90.97% | | Shares | | | Value
(000) | |
| Consumer discretionary 17.96% | | | | | | | | |
| Lions Gate Entertainment Corp., Class A1,2 | | | 4,243,393 | | | $ | 141,942 | |
| Lions Gate Entertainment Corp., Class B1,2 | | | 3,878,393 | | | | 123,294 | |
| Domino’s Pizza, Inc. | | | 1,255,061 | | | | 249,192 | |
| Seria Co., Ltd.1,3 | | | 4,334,948 | | | | 241,284 | |
| YOOX Net-A-Porter Group SPA1,2,3 | | | 6,093,000 | | | | 239,133 | |
| Dollarama Inc. | | | 2,005,000 | | | | 219,389 | |
| GVC Holdings PLC1,3 | | | 19,240,894 | | | | 211,689 | |
| Hilton Grand Vacations Inc.2 | | | 3,563,300 | | | | 137,650 | |
| Melco International Development Ltd.3 | | | 43,527,000 | | | | 125,896 | |
| Evolution Gaming Group AB1,3 | | | 1,943,200 | | | | 124,065 | |
| Ted Baker PLC1,3 | | | 3,446,897 | | | | 122,407 | |
| ASOS PLC2,3 | | | 1,491,741 | | | | 119,064 | |
| TopBuild Corp.2 | | | 1,745,000 | | | | 113,722 | |
| Other securities | | | | | | | 4,455,096 | |
| | | | | | | | 6,623,823 | |
| | | | | | | | | |
| Information technology 14.16% | | | | | | | | |
| AAC Technologies Holdings Inc.3 | | | 17,190,500 | | | | 290,360 | |
| Qorvo, Inc.2 | | | 3,884,370 | | | | 274,547 | |
| Paycom Software, Inc.1,2 | | | 3,126,716 | | | | 234,379 | |
| RingCentral, Inc., Class A2 | | | 4,979,000 | | | | 207,873 | |
| Vanguard International Semiconductor Corp.1,3 | | | 83,546,386 | | | | 144,219 | |
| WIN Semiconductors Corp.1,3 | | | 20,743,009 | | | | 133,421 | |
| ZPG PLC1,3 | | | 26,498,395 | | | | 128,440 | |
| Square, Inc., Class A2 | | | 4,212,830 | | | | 121,372 | |
| Inphi Corp.1,2 | | | 2,970,199 | | | | 117,887 | |
| VTech Holdings Ltd.3 | | | 7,858,500 | | | | 114,763 | |
| Versum Materials, Inc. | | | 2,950,690 | | | | 114,546 | |
| Other securities | | | | | | | 3,342,983 | |
| | | | | | | | 5,224,790 | |
| | | | | | | | | |
| Health care 13.94% | | | | | | | | |
| Bluebird Bio, Inc.2 | | | 2,106,520 | | | | 289,331 | |
| Molina Healthcare, Inc.1,2 | | | 4,069,005 | | | | 279,785 | |
| Insulet Corp.1,2 | | | 3,734,000 | | | | 205,669 | |
| GW Pharmaceuticals PLC (ADR)1,2 | | | 1,891,400 | | | | 191,958 | |
| Centene Corp.2 | | | 1,459,439 | | | | 141,230 | |
| Intuitive Surgical, Inc.2 | | | 135,000 | | | | 141,194 | |
| WuXi Biologics (Cayman) Inc.2,3 | | | 26,901,000 | | | | 136,137 | |
| | | Shares | | | Value
(000) | |
| Incyte Corp.2 | | | 1,088,122 | | | $ | 127,027 | |
| Fleury SA, ordinary nominative | | | 12,515,000 | | | | 116,451 | |
| Other securities | | | | | | | 3,513,103 | |
| | | | | | | | 5,141,885 | |
| | | | | | | | | |
| Industrials 11.52% | | | | | | | | |
| Loomis AB, Class B3 | | | 3,698,042 | | | | 146,981 | |
| Kirby Corp.2 | | | 2,145,000 | | | | 141,463 | |
| NIBE Industrier AB, Class B3 | | | 13,234,285 | | | | 133,445 | |
| MonotaRO Co., Ltd.3 | | | 4,374,300 | | | | 117,381 | |
| Bravida Holding AB1,3 | | | 15,730,395 | | | | 115,259 | |
| Other securities | | | | | | | 3,594,754 | |
| | | | | | | | 4,249,283 | |
| | | | | | | | | |
| Financials 11.37% | | | | | | | | |
| Kotak Mahindra Bank Ltd.3 | | | 18,292,040 | | | | 281,043 | |
| Essent Group Ltd.1,2 | | | 5,825,535 | | | | 235,934 | |
| Bajaj Finance Ltd.3 | | | 6,087,160 | | | | 171,881 | |
| Validus Holdings, Ltd. | | | 3,228,000 | | | | 158,850 | |
| Radian Group Inc. | | | 7,194,161 | | | | 134,459 | |
| VZ Holding AG3 | | | 390,411 | | | | 124,575 | |
| SVB Financial Group2 | | | 652,500 | | | | 122,076 | |
| MarketAxess Holdings Inc. | | | 660,000 | | | | 121,777 | |
| Texas Capital Bancshares, Inc.2 | | | 1,414,817 | | | | 121,391 | |
| Grupo Supervielle SA, Class B (ADR) | | | 4,912,000 | | | | 121,277 | |
| First Republic Bank | | | 1,141,825 | | | | 119,275 | |
| Webster Financial Corp. | | | 2,156,900 | | | | 113,345 | |
| Other securities | | | | | | | 2,368,202 | |
| | | | | | | | 4,194,085 | |
| | | | | | | | | |
| Consumer staples 5.81% | | | | | | | | |
| Emmi AG1,3 | | | 289,300 | | | | 189,576 | |
| Raia Drogasil SA, ordinary nominative | | | 7,527,574 | | | | 178,257 | |
| Lion Corp.3 | | | 7,637,000 | | | | 139,930 | |
| Pinnacle Foods Inc. | | | 2,389,050 | | | | 136,582 | |
| Morinaga & Co., Ltd.3 | | | 2,390,600 | | | | 132,934 | |
| Ariake Japan Co., Ltd.3 | | | 1,607,000 | | | | 115,642 | |
| COSMOS Pharmaceutical Corp.3 | | | 502,700 | | | | 112,144 | |
| Other securities | | | | | | | 1,136,645 | |
| | | | | | | | 2,141,710 | |
| | | | | | | | | |
| Materials 4.53% | | | | | | | | |
| Other securities | | | | | | | 1,671,977 | |
| | | | | | | | | |
| Energy 3.74% | | | | | | | | |
| Centennial Resource Development, Inc., Class A2,4 | | | 6,795,088 | | | | 122,108 | |
| Centennial Resource Development, Inc., Class A2,3,4 | | | 550,000 | | | | 9,389 | |
| Centennial Resource Development, Inc., Class A2 | | | 262,782 | | | | 4,722 | |
| Other securities | | | | | | | 1,243,483 | |
| | | | | | | | 1,379,702 | |
| | | | | | | | | |
| Real estate 1.47% | | | | | | | | |
| MGM Growth Properties LLC REIT, Class A1 | | | 4,148,087 | | | | 125,314 | |
| WHA Corp. PCL1,3 | | | 1,145,170,900 | | | | 122,347 | |
| Other securities | | | | | | | 292,679 | |
| | | | | | | | 540,340 | |
| | | | | | | | | |
| Other 1.59% | | | | | | | | |
| Other securities | | | | | | | 587,567 | |
| | | | | | | | | |
| Miscellaneous 4.88% | | | | | | | | |
| Other common stocks in initial period of acquisition | | | | | | | 1,801,798 | |
| | | | | | | | | |
| Total common stocks (cost: $22,482,258,000) | | | | | | | 33,556,960 | |
| Preferred securities 0.00% | | Shares | | | Value
(000) | |
| Consumer staples 0.00% | | | | | | | | |
| Other securities | | | | | | $ | 135 | |
| | | | | | | | | |
| Total preferred securities (cost: $185,000) | | | | | | | 135 | |
| | | | | | | | | |
| Rights & warrants 0.01% | | | | | | | | |
| Other 0.01% | | | | | | | | |
| Other securities | | | | | | | 5,222 | |
| | | | | | | | | |
| Total rights & warrants (cost: $927,000) | | | | | | | 5,222 | |
| | | | | | | | | |
| Convertible stocks 0.31% | | | | | | | | |
| Other 0.31% | | | | | | | | |
| Other securities | | | | | | | 115,157 | |
| | | | | | | | | |
| Total convertible stocks (cost: $108,475,000) | | | | | | | 115,157 | |
| Bonds, notes & other debt instruments 0.25% | | Principal amount
(000) | | | | |
| Other 0.25% | | | | | | | | |
| Other securities | | | | | | | 91,268 | |
| | | | | | | | | |
| Total bonds, notes & other debt instruments (cost: $79,464,000) | | | | | | | 91,268 | |
| | | | | | | | | |
| Short-term securities 8.39% | | | | | | | | |
| Bank of Nova Scotia 1.32% due 12/5/20174 | | $ | 75,000 | | | | 74,826 | |
| Bank of Tokyo-Mitsubishi UFJ, Ltd. 1.40% due 10/31/2017 | | | 42,800 | | | | 42,807 | |
| Caisse d’Amortissement de la Dette Sociale 1.27%–1.28% due 10/2/2017–10/25/20174 | | | 132,800 | | | | 132,721 | |
| CPPIB Capital Inc. 1.16%–1.31% due 10/20/2017–1/2/20184 | | | 128,000 | | | | 127,712 | |
| Federal Home Loan Bank 1.03%–1.09% due 10/6/2017–2/2/2018 | | | 362,400 | | | | 361,839 | |
| Kells Funding, LLC 1.29%–1.30% due 10/16/2017–10/23/20174 | | | 148,500 | | | | 148,392 | |
| KfW 1.23% due 10/12/20174 | | | 114,500 | | | | 114,452 | |
| Liberty Street Funding Corp. 1.25%–1.30% due 11/28/2017–12/7/20174 | | | 65,000 | | | | 64,843 | |
| Mitsubishi UFJ Trust and Banking Corp. 1.36% due 1/5/20184 | | | 50,000 | | | | 49,819 | |
| Mizuho Bank, Ltd. 1.27%–1.37% due 10/20/2017–2/16/20184 | | | 252,100 | | | | 251,517 | |
| Nordea Bank AB 1.25%–1.41% due 10/27/2017–4/9/20184 | | | 194,800 | | | | 194,198 | |
| Sumitomo Mitsui Banking Corp. 1.24%–1.30% due 11/9/2017–11/13/20174 | | | 183,200 | | | | 182,931 | |
| Victory Receivables Corp. 1.32%–1.34% due 12/8/2017–12/26/20174 | | | 135,000 | | | | 134,625 | |
| Other securities | | | | | | | 1,214,746 | |
| | | | | | | | | |
| Total short-term securities (cost: $3,095,433,000) | | | | | | | 3,095,428 | |
| Total investment securities 99.93% (cost: $25,766,742,000) | | | | | | | 36,864,170 | |
| Other assets less liabilities 0.07% | | | | | | | 25,022 | |
| | | | | | | | | |
| Net assets 100.00% | | | | | | $ | 36,889,192 | |
This summary investment portfolio is designed to streamline the report and help investors better focus on the fund’s principal holdings. See the inside back cover for details on how to obtain a complete schedule of portfolio holdings.
As permitted by U.S. Securities and Exchange Commission regulations, “Miscellaneous” securities include holdings in their first year of acquisition that have not previously been publicly disclosed.
“Other securities” includes all issues that are not disclosed separately in the summary investment portfolio. “Other securities” also includes securities which were pledged as collateral. The total value of pledged collateral was $4,832,000, which represented .01% of the net assets of the fund.
Forward currency contracts
| Contract amount | | | | | | Unrealized
(depreciation)
appreciation | |
Purchases
(000) | | Sales
(000) | | Counterparty | | Settlement
date | | at 9/30/2017
(000) | |
| USD14,676 | | GBP11,375 | | Bank of America, N.A. | | 10/5/2017 | | | $(569 | ) |
| USD26,214 | | CAD34,000 | | UBS AG | | 10/6/2017 | | | (1,037 | ) |
| USD26,133 | | ZAR345,000 | | Barclays Bank PLC | | 10/18/2017 | | | 731 | |
| USD25,994 | | GBP19,380 | | Goldman Sachs | | 10/18/2017 | | | 9 | |
| USD48,904 | | JPY5,303,225 | | JPMorgan Chase | | 10/19/2017 | | | 1,727 | |
| USD6,011 | | JPY669,165 | | UBS AG | | 10/23/2017 | | | 56 | |
| USD98,771 | | GBP76,514 | | Citibank | | 10/23/2017 | | | (3,840 | ) |
| USD13,671 | | GBP10,590 | | Barclays Bank PLC | | 10/24/2017 | | | (532 | ) |
| USD33,179 | | GBP24,400 | | Bank of America, N.A. | | 11/3/2017 | | | 446 | |
| USD47,107 | | INR3,049,338 | | Citibank | | 11/24/2017 | | | 738 | |
| | | | | | | | | | $(2,271 | ) |
Investments in affiliates
A company is an affiliate of the fund under the Investment Company Act of 1940 if the fund’s holdings in that company represent 5% or more of the outstanding voting shares. The value of the fund’s affiliated-company holdings is either shown in the summary investment portfolio or included in the value of “Other securities” under the respective industry sectors. Further details on such holdings and related transactions during the year ended September 30, 2017, appear below.
| | | Beginning
shares | | Additions | | Reductions | | Ending
shares | | Net realized
(loss) gain
(000) | | | Net unrealized
appreciation
(depreciation)
(000) | | | Dividend
income
(000) | | | Value of
affiliates at
9/30/2017
(000) | |
| Common stocks 20.96% | | | | | | | | | | | | | | | | | | | | | | | | |
| Consumer discretionary 5.77% | | | | | | | | | | | | | | | | | | | | | | | | |
| Lions Gate Entertainment Corp., Class A2 | | — | | 4,528,393 | | 285,000 | | 4,243,393 | | $ | (502 | ) | | $ | 26,097 | | | $ | — | | | $ | 141,942 | |
| Lions Gate Entertainment Corp., Class B2 | | — | | 4,528,393 | | 650,000 | | 3,878,393 | | | (991 | ) | | | 21,021 | | | | — | | | | 123,294 | |
| Lions Gate Entertainment Corp.2 | | 7,751,786 | | 1,305,000 | | 9,056,786 | | — | | | — | | | | (105,982 | ) | | | — | | | | — | |
| Seria Co., Ltd.3 | | 1,425,324 | | 2,909,624 | | — | | 4,334,948 | | | — | | | | 62,507 | | | | 584 | | | | 241,284 | |
| YOOX Net-A-Porter Group SPA2,3 | | 3,627,000 | | 2,466,000 | | — | | 6,093,000 | | | — | | | | 60,323 | | | | — | | | | 239,133 | |
| GVC Holdings PLC3 | | 19,280,894 | | 2,560,000 | | 2,600,000 | | 19,240,894 | | | 7,375 | | | | 26,445 | | | | 10,677 | | | | 211,689 | |
| Evolution Gaming Group AB3 | | 1,943,200 | | — | | — | | 1,943,200 | | | — | | | | 60,817 | | | | 936 | | | | 124,065 | |
| Ted Baker PLC3 | | 3,340,342 | | 106,555 | | — | | 3,446,897 | | | — | | | | 12,411 | | | | 2,287 | | | | 122,407 | |
| Beauty Community PCL3 | | 217,500,000 | | 34,500,000 | | 43,500,000 | | 208,500,000 | | | 8,385 | | | | 33,899 | | | | 1,772 | | | | 100,029 | |
| Taiwan Paiho Ltd.3 | | 22,578,000 | | — | | 967,000 | | 21,611,000 | | | 1,175 | | | | 21,499 | | | | 2,234 | | | | 99,596 | |
| Entertainment One Ltd.3 | | 25,150,631 | | 2,500,000 | | — | | 27,650,631 | | | — | | | | 14,888 | | | | 465 | | | | 95,593 | |
| Sleep Country Canada Holdings Inc. | | 3,011,253 | | — | | — | | 3,011,253 | | | — | | | | 15,599 | | | | 1,437 | | | | 87,073 | |
| JINS Inc.3 | | 1,608,000 | | — | | 227,000 | | 1,381,000 | | | 2,937 | | | | 20,390 | | | | 455 | | | | 86,505 | |
| MakeMyTrip Ltd., non-registered shares2 | | 735,000 | | 2,142,300 | | — | | 2,877,300 | | | — | | | | (398 | ) | | | — | | | | 82,722 | |
| MakeMyTrip Ltd., non-registered shares2,5 | | — | | 92,000 | | — | | 92,000 | | | — | | | | (667 | ) | | | — | | | | 2,645 | |
| zooplus AG, non-registered shares2,3 | | 558,778 | | 1,356 | | 59,500 | | 500,634 | | | 4,132 | | | | 10,324 | | | | — | | | | 84,317 | |
| POYA International Co., Ltd.3 | | 6,735,908 | | 67,359 | | — | | 6,803,267 | | | — | | | | (18,922 | ) | | | 2,377 | | | | 81,391 | |
| Strayer Education, Inc. | | — | | 845,750 | | — | | 845,750 | | | — | | | | 7,436 | | | | 558 | | | | 73,809 | |
| Tailored Brands, Inc. | | — | | 3,741,000 | | — | | 3,741,000 | | | — | | | | (17,443 | ) | | | 1,917 | | | | 54,020 | |
| Hostelworld Group PLC3 | | — | | 7,645,662 | | — | | 7,645,662 | | | — | | | | 16,314 | | | | 2,207 | | | | 36,808 | |
| Lands’ End, Inc.2 | | 1,504,000 | | 150,000 | | — | | 1,654,000 | | | — | | | | (2,375 | ) | | | — | | | | 21,833 | |
Investments in affiliates (continued)
| | | Beginning
shares | | Additions | | Reductions | | Ending
shares | | Net realized
(loss) gain
(000) | | | Net unrealized
appreciation
(depreciation)
(000) | | | Dividend
income
(000) | | | Value of
affiliates at
9/30/2017
(000) | |
| Talwalkars Better Value Fitness Ltd.3 | | 2,389,000 | | — | | — | | 2,389,000 | | $ | — | | | $ | (42 | ) | | $ | 56 | | | $ | 9,906 | |
| BNN Technology PLC2,3,6 | | 8,457,000 | | 10,550,000 | | — | | 19,007,000 | | | — | | | | (17,868 | ) | | | — | | | | 8,558 | |
| Domino’s Pizza, Inc.7 | | 2,828,769 | | — | | 1,573,708 | | 1,255,061 | | | 199,826 | | | | (94,870 | ) | | | 3,448 | | | | — | |
| SeaWorld Entertainment, Inc.7 | | 2,803,625 | | 3,618,032 | | 4,772,331 | | 1,649,326 | | | (14,895 | ) | | | 1,028 | | | | — | | | | — | |
| TravelCenters of America LLC2,7 | | 2,023,750 | | — | | 2,023,750 | | — | | | (12,027 | ) | | | 4,556 | | | | — | | | | — | |
| Installed Building Products, Inc.2,7 | | 1,704,039 | | — | | 465,539 | | 1,238,500 | | | 14,516 | | | | 24,958 | | | | — | | | | — | |
| Century Communities, Inc.2,7 | | 1,576,000 | | — | | 665,000 | | 911,000 | | | 2,109 | | | | 500 | | | | — | | | | — | |
| Tele Columbus AG2,3,7 | | 6,696,000 | | — | | 2,267,000 | | 4,429,000 | | | 4,863 | | | | 8,395 | | | | — | | | | — | |
| BCA Marketplace PLC3,7 | | 42,870,000 | | — | | 27,077,000 | | 15,793,000 | | | 6,418 | | | | 6,526 | | | | 2,133 | | | | — | |
| Blue Nile, Inc.2,7 | | 753,000 | | 174,000 | | 927,000 | | — | | | 5,128 | | | | 292 | | | | — | | | | — | |
| Ladbrokes Coral Group PLC3,7,8 | | 55,522,600 | | — | | 26,000,000 | | 29,522,600 | | | (11,678 | ) | | | (1,576 | ) | | | 1,533 | | | | — | |
| | | | | | | | | | | | | | | | | | | | | | | | 2,128,619 | |
| | | | | | | | | | | | | | | | | | | | | | | | | |
| Information technology 4.13% | | | | | | | | | | | | | | | | | | | | | | | | |
| Paycom Software, Inc.2 | | 1,199,028 | | 1,927,688 | | — | | 3,126,716 | | | — | | | | 78,757 | | | | — | | | | 234,379 | |
| Vanguard International Semiconductor Corp.3 | | 83,546,386 | | — | | — | | 83,546,386 | | | — | | | | (13,114 | ) | | | 8,222 | | | | 144,219 | |
| WIN Semiconductors Corp.3 | | — | | 20,743,009 | | — | | 20,743,009 | | | — | | | | 49,329 | | | | 2,761 | | | | 133,421 | |
| ZPG PLC3,8 | | 23,652,006 | | 2,846,389 | | — | | 26,498,395 | | | — | | | | 15,534 | | | | 1,748 | | | | 128,440 | |
| Inphi Corp.2 | | 2,459,199 | | 1,349,000 | | 838,000 | | 2,970,199 | | | 3,495 | | | | (8,374 | ) | | | — | | | | 117,887 | |
| Quotient Technology Inc.2 | | 6,711,613 | | — | | — | | 6,711,613 | | | — | | | | 15,705 | | | | — | | | | 105,037 | |
| Acacia Communications, Inc.2 | | — | | 2,179,910 | | — | | 2,179,910 | | | — | | | | 2,191 | | | | — | | | | 102,674 | |
| Talend SA (ADR)2 | | 787,500 | | 1,376,555 | | — | | 2,164,055 | | | — | | | | 30,968 | | | | — | | | | 88,596 | |
| Callidus Software Inc. (USA)2 | | — | | 3,420,000 | | — | | 3,420,000 | | | — | | | | 14,528 | | | | — | | | | 84,303 | |
| Globant SA2 | | 2,717,510 | | 34,000 | | 782,000 | | 1,969,510 | | | 2,198 | | | | (12,971 | ) | | | — | | | | 78,918 | |
| eMemory Technology Inc.3 | | 6,146,000 | | — | | — | | 6,146,000 | | | — | | | | 13,050 | | | | 1,313 | | | | 78,878 | |
| RIB Software SE3 | | 2,904,993 | | 217,733 | | 142,553 | | 2,980,173 | | | (520 | ) | | | 25,918 | | | | 495 | | | | 63,225 | |
| Mitel Networks Corp.2 | | — | | 5,934,900 | | — | | 5,934,900 | | | — | | | | 350 | | | | — | | | | 49,794 | |
| Douzone Bizon Co., Ltd.3 | | — | | 1,755,000 | | — | | 1,755,000 | | | — | | | | (2,534 | ) | | | — | | | | 47,845 | |
| Datalex PLC3 | | — | | 6,106,000 | | — | | 6,106,000 | | | — | | | | (863 | ) | | | 4 | | | | 26,926 | |
| MagnaChip Semiconductor Corp.2 | | 2,355,000 | | — | | — | | 2,355,000 | | | — | | | | 7,089 | | | | — | | | | 26,729 | |
| GoldMoney Inc.2 | | 3,531,100 | | — | | — | | 3,531,100 | | | — | | | | 1,329 | | | | — | | | | 13,414 | |
| DeNA Co., Ltd.3,7 | | 8,201,010 | | 890,000 | | 5,638,000 | | 3,453,010 | | | 2,587 | | | | (117,686 | ) | | | 1,912 | | | | — | |
| Finisar Corp.2,7 | | 5,729,000 | | 21,000 | | 3,672,000 | | 2,078,000 | | | 13,387 | | | | (43,999 | ) | | | — | | | | — | |
| NCC Group PLC7 | | 14,386,000 | | 1,598,000 | | 15,984,000 | | — | | | (28,442 | ) | | | (15,919 | ) | | | 303 | | | | — | |
| Actua Corp2,7 | | 2,602,000 | | — | | 2,602,000 | | — | | | 3,474 | | | | (1,152 | ) | | | — | | | | — | |
| Sonus Networks, Inc.2,7 | | 2,875,200 | | — | | 1,890,244 | | 984,956 | | | (3,166 | ) | | | 66 | | | | — | | | | — | |
| Exa Corp.2,7 | | — | | 894,100 | | 894,100 | | — | | | 8,663 | | | | — | | | | — | | | | — | |
| istyle Inc.3,7 | | 3,832,900 | | 308,600 | | 895,100 | | 3,246,400 | | | 1,099 | | | | (5,524 | ) | | | 14 | | | | — | |
| ShoreTel, Inc.2,7 | | — | | 5,402,000 | | 5,402,000 | | — | | | 2,970 | | | | — | | | | — | | | | — | |
| CardConnect Corp.2,7 | | — | | 1,485,800 | | 1,485,800 | | — | | | 3,715 | | | | — | | | | — | | | | — | |
| | | | | | | | | | | | | | | | | | | | | | | | 1,524,685 | |
| | | | | | | | | | | | | | | | | | | | | | | | | |
| Health care 4.37% | | | | | | | | | | | | | | | | | | | | | | | | |
| Molina Healthcare, Inc.2 | | 4,526,000 | | 622,005 | | 1,079,000 | | 4,069,005 | | | 6,855 | | | | 42,417 | | | | — | | | | 279,785 | |
| Insulet Corp.2 | | 3,921,000 | | 383,000 | | 570,000 | | 3,734,000 | | | 3,550 | | | | 49,119 | | | | — | | | | 205,669 | |
| GW Pharmaceuticals PLC (ADR)2 | | 1,976,400 | | 40,000 | | 125,000 | | 1,891,400 | | | 1,356 | | | | (61,127 | ) | | | — | | | | 191,958 | |
| Vitrolife AB3 | | 1,387,559 | | — | | 23,980 | | 1,363,579 | | | 882 | | | | 24,077 | | | | 408 | | | | 110,898 | |
| CONMED Corp. | | 2,141,654 | | — | | 318,654 | | 1,823,000 | | | (2,790 | ) | | | 27,801 | | | | 1,606 | | | | 95,653 | |
| Glaukos Corp.2 | | 1,706,070 | | 1,033,930 | | — | | 2,740,000 | | | — | | | | (14,858 | ) | | | — | | | | 90,420 | |
| | | Beginning
shares | | Additions | | Reductions | | Ending
shares | | Net realized
(loss) gain
(000) | | | Net unrealized
appreciation
(depreciation)
(000) | | | Dividend
income
(000) | | | Value of
affiliates at
9/30/2017
(000) | |
| Genomma Lab Internacional, SAB de CV, Series B2 | | 67,483,000 | | — | | — | | 67,483,000 | | $ | — | | | $ | 16,061 | | | $ | — | | | $ | 86,642 | |
| iRhythm Technologies, Inc.2 | | — | | 1,591,200 | | — | | 1,591,200 | | | — | | | | 36,756 | | | | — | | | | 82,551 | |
| Osstem Implant Co., Ltd.2,3 | | — | | 1,078,621 | | — | | 1,078,621 | | | — | | | | 4,891 | | | | — | | | | 65,913 | |
| Flexion Therapeutics, Inc.2 | | 1,723,051 | | 814,949 | | — | | 2,538,000 | | | — | | | | 12,295 | | | | — | | | | 61,369 | |
| Adaptimmune Therapeutics PLC (ADR)2 | | 4,601,000 | | 2,927,000 | | 735,300 | | 6,792,700 | | | (9,602 | ) | | | 23,560 | | | | — | | | | 55,632 | |
| Natera, Inc.2 | | 4,099,803 | | 122,806 | | — | | 4,222,609 | | | — | | | | 7,539 | | | | — | | | | 54,429 | |
| CryoLife, Inc.2 | | 1,093,598 | | 899,551 | | — | | 1,993,149 | | | — | | | | 10,863 | | | | — | | | | 45,244 | |
| Pacific Biosciences of California, Inc.2 | | 1,240,000 | | 6,888,077 | | — | | 8,128,077 | | | — | | | | 10,126 | | | | — | | | | 42,672 | |
| CellaVision AB, non-registered shares3 | | — | | 1,908,123 | | — | | 1,908,123 | | | — | | | | 9,609 | | | | 209 | | | | 40,707 | |
| NuCana PLC (ADR)2 | | — | | 1,932,728 | | — | | 1,932,728 | | | — | | | | 6,419 | | | | — | | | | 35,504 | |
| Virtus Health Ltd.3 | | 4,603,000 | | 620,000 | | — | | 5,223,000 | | | — | | | | (7,096 | ) | | | 959 | | | | 22,875 | |
| Monash IVF Group Ltd.3 | | 18,520,000 | | 300,000 | | — | | 18,820,000 | | | — | | | | (15,049 | ) | | | 1,298 | | | | 20,445 | |
| Neovasc Inc.2 | | 3,474,667 | | 2,820,000 | | — | | 6,294,667 | | | — | | | | 4,941 | | | | — | | | | 10,645 | |
| Viralytics Ltd.2,3 | | — | | 14,000,000 | | — | | 14,000,000 | | | — | | | | (2,240 | ) | | | — | | | | 8,875 | |
| Xenon Pharmaceuticals Inc.2 | | 1,030,000 | | 399,000 | | — | | 1,429,000 | | | — | | | | (7,109 | ) | | | — | | | | 4,216 | |
| Zeltiq Aesthetics, Inc.2,7 | | 3,122,044 | | 75,956 | | 3,198,000 | | — | | | 119,609 | | | | (66,600 | ) | | | — | | | | — | |
| Bluebird Bio, Inc.2,7 | | 1,619,352 | | 614,168 | | 127,000 | | 2,106,520 | | | 334 | | | | 134,438 | | | | — | | | | — | |
| Myriad Genetics, Inc.2,7 | | 3,712,256 | | — | | 3,712,256 | | — | | | (27,864 | ) | | | 13,900 | | | | — | | | | — | |
| China Biologic Products Holdings, Inc.2,7 | | 1,682,523 | | 13,400 | | 610,423 | | 1,085,500 | | | (13,332 | ) | | | (36,024 | ) | | | — | | | | — | |
| Teladoc, Inc.2,7 | | 3,295,269 | | 954,012 | | 3,424,281 | | 825,000 | | | 65,297 | | | | 2,938 | | | | — | | | | — | |
| | | | | | | | | | | | | | | | | | | | | | | | 1,612,102 | |
| | | | | | | | | | | | | | | | | | | | | | | | | |
| Industrials 1.90% | | | | | | | | | | | | | | | | | | | | | | | | |
| Bravida Holding AB3 | | 11,545,792 | | 11,629,603 | | 7,445,000 | | 15,730,395 | | | — | | | | 10,303 | | | | 2,071 | | | | 115,259 | |
| Kratos Defense & Security Solutions, Inc.2 | | — | | 8,087,000 | | — | | 8,087,000 | | | — | | | | 25,660 | | | | — | | | | 105,778 | |
| King Slide Works Co., Ltd.3 | | 7,623,000 | | 765 | | — | �� | 7,623,765 | | | — | | | | 5,133 | | | | 2,085 | | | | 103,930 | |
| TechnoPro Holdings, Inc.3 | | 2,125,000 | | 244,000 | | 400,000 | | 1,969,000 | | | 2,071 | | | | 15,613 | | | | 1,777 | | | | 93,290 | |
| Continental Building Products, Inc.2 | | 3,330,700 | | — | | — | | 3,330,700 | | | — | | | | 16,687 | | | | — | | | | 86,598 | |
| XP Power Ltd.3 | | 1,140,000 | | 97,207 | | — | | 1,237,207 | | | — | | | | 18,256 | | | | 1,081 | | | | 46,028 | |
| Tsubaki Nakashima Co., Ltd.3 | | — | | 2,118,800 | | — | | 2,118,800 | | | — | | | | 3,329 | | | | 269 | | | | 44,644 | |
| R.R. Donnelley & Sons Co. | | — | | 3,890,358 | | — | | 3,890,358 | | | — | | | | (7,533 | ) | | | 905 | | | | 40,071 | |
| Barrett Business Services, Inc. | | — | | 580,000 | | — | | 580,000 | | | — | | | | 474 | | | | 187 | | | | 32,787 | |
| KEYW Holding Corp.2 | | 2,836,400 | | — | | 300,000 | | 2,536,400 | | | (703 | ) | | | (8,308 | ) | | | — | | | | 19,302 | |
| J. Kumar Infraprojects Ltd.3 | | 4,092,000 | | 358,500 | | — | | 4,450,500 | | | — | | | | 1,562 | | | | 137 | | | | 13,953 | |
| Takeuchi Mfg. Co., Ltd.3,7 | | 802,100 | | 1,826,858 | | 2,114,264 | | 514,694 | | | 2,745 | | | | 1,482 | | | | 234 | | | | — | |
| | | | | | | | | | | | | | | | | | | | | | | | 701,640 | |
| | | | | | | | | | | | | | | | | | | | | | | | | |
| Financials 1.27% | | | | | | | | | | | | | | | | | | | | | | | | |
| Essent Group Ltd.2 | | 4,177,925 | | 1,897,610 | | 250,000 | | 5,825,535 | | | (221 | ) | | | 63,411 | | | | — | | | | 235,934 | |
| CenterState Bank Corp. | | 2,758,399 | | 990,000 | | — | | 3,748,399 | | | — | | | | 26,962 | | | | 746 | | | | 100,457 | |
| Trupanion, Inc.2 | | 2,290,500 | | 90,300 | | — | | 2,380,800 | | | — | | | | 22,524 | | | | — | | | | 62,877 | |
| M&A Capital Partners Co., Ltd.2,3 | | — | | 937,100 | | — | | 937,100 | | | — | | | | 1,982 | | | | — | | | | 46,735 | |
| Numis Corp. PLC3 | | 5,663,282 | | — | | — | | 5,663,282 | | | — | | | | 5,217 | | | | 866 | | | | 21,307 | |
| Financial Engines, Inc.7 | | 3,137,000 | | — | | — | | 3,137,000 | | | — | | | | 15,810 | | | | 878 | | | | — | |
Investments in affiliates (continued)
| | | Beginning
shares | | Additions | | Reductions | | Ending
shares | | Net realized
(loss) gain
(000) | | | Net unrealized
appreciation
(depreciation)
(000) | | | Dividend
income
(000) | | | Value of
affiliates at
9/30/2017
(000) | |
| Acasta Enterprises Inc., Class B2,7 | | — | | 2,400,000 | | 2,400,000 | | — | | $ | (7,369 | ) | | $ | — | | | $ | — | | | $ | — | |
| Conyers Park Acquisition Corp., Class A2,7 | | — | | 3,000,000 | | 3,000,000 | | — | | | — | | | | — | | | | — | | | | — | |
| | | | | | | | | | | | | | | | | | | | | | | | 467,310 | |
| | | | | | | | | | | | | | | | | | | | | | | | | |
| Consumer staples 1.21% | | | | | | | | | | | | | | | | | | | | | | | | |
| Emmi AG3 | | 270,100 | | 19,200 | | — | | 289,300 | | | — | | | | (8,462 | ) | | | 1,598 | | | | 189,576 | |
| Milbon Co., Ltd.3 | | 535,000 | | 789,300 | | — | | 1,324,300 | | | — | | | | 18,271 | | | | 769 | | | | 80,418 | |
| CCL Products (India) Ltd.3 | | 9,479,102 | | 1,163,071 | | — | | 10,642,173 | | | — | | | | 8,454 | | | | 411 | | | | 50,208 | |
| Simply Good Foods Co., Class A2 | | — | | 4,017,095 | | — | | 4,017,095 | | | — | | | | 4,909 | | | | — | | | | 47,040 | |
| BWX Ltd.3 | | — | | 7,708,000 | | — | | 7,708,000 | | | — | | | | 5,305 | | | | 246 | | | | 35,453 | |
| CLIO Cosmetics Co., Ltd.3 | | — | | 1,166,900 | | — | | 1,166,900 | | | — | | | | (6,681 | ) | | | — | | | | 33,487 | |
| R.E.A. Holdings PLC2,3 | | 800,000 | | 1,362,000 | | — | | 2,162,000 | | | — | | | | 1,550 | | | | — | | | | 9,198 | |
| Stock Spirits Group PLC3,7 | | 14,404,674 | | — | | 8,000,000 | | 6,404,674 | | | (13,307 | ) | | | 22,707 | | | | 702 | | | | — | |
| | | | | | | | | | | | | | | | | | | | | | | | 445,380 | |
| | | | | | | | | | | | | | | | | | | | | | | | | |
| Materials 0.74% | | | | | | | | | | | | | | | | | | | | | | | | |
| Sirius Minerals PLC2,3 | | 179,676,660 | | 67,690,900 | | — | | 247,367,560 | | | — | | | | (7,908 | ) | | | — | | | | 84,460 | |
| Scapa Group PLC3 | | 4,000,000 | | 8,183,326 | | — | | 12,183,326 | | | — | | | | 21,297 | | | | 317 | | | | 72,168 | |
| Clearwater Paper Corp.2 | | — | | 990,000 | | — | | 990,000 | | | — | | | | 2,747 | | | | — | | | | 48,757 | |
| Kenmare Resources PLC2,3 | | 5,424,863 | | 1,700,000 | | — | | 7,124,863 | | | — | | | | 3,230 | | | | — | | | | 31,244 | |
| Hummingbird Resources PLC2,3 | | 18,920,000 | | 8,539,300 | | — | | 27,459,300 | | | — | | | | 4,323 | | | | — | | | | 13,109 | |
| Danakali Ltd.2,3 | | — | | 16,700,000 | | — | | 16,700,000 | | | — | | | | 1,373 | | | | — | | | | 9,067 | |
| Bacanora Minerals Ltd.2,3 | | — | | 8,573,925 | | — | | 8,573,925 | | | — | | | | (638 | ) | | | — | | | | 8,904 | |
| Kennady Diamonds Inc.2 | | 2,557,952 | | — | | — | | 2,557,952 | | | — | | | | (1,771 | ) | | | — | | | | 6,048 | |
| | | | | | | | | | | | | | | | | | | | | | | | 273,757 | |
| | | | | | | | | | | | | | | | | | | | | | | | | |
| Energy 0.26% | | | | | | | | | | | | | | | | | | | | | | | | |
| Tidewater Midstream and Infrastructure Ltd. | | 16,934,000 | | 11,890,000 | | 4,490,000 | | 24,334,000 | | | — | | | | (406 | ) | | | 686 | | | | 27,693 | |
| Source Energy Services Ltd.2 | | — | | 3,438,235 | | — | | 3,438,235 | | | — | | | | (486 | ) | | | — | | | | 25,213 | |
| Independence Contract Drilling, Inc.2 | | 3,010,000 | | 98,277 | | 152,632 | | 2,955,645 | | | 68 | | | | (4,313 | ) | | | — | | | | 11,232 | |
| Lekoil Ltd. (CDI)2,3 | | 25,208,400 | | 23,713,991 | | 6,000,000 | | 42,922,391 | | | — | | | | (1,811 | ) | | | — | | | | 9,919 | |
| San Leon Energy PLC2,3 | | 25,803,000 | | 28,345,000 | | 21,800,000 | | 32,348,000 | | | — | | | | (11,089 | ) | | | — | | | | 8,940 | |
| Savannah Petroleum PLC2,3,6 | | 17,844,000 | | — | | — | | 17,844,000 | | | — | | | | 1,231 | | | | — | | | | 8,279 | |
| BNK Petroleum Inc.2 | | 12,804,914 | | — | | — | | 12,804,914 | | | — | | | | 1,032 | | | | — | | | | 3,130 | |
| Providence Resources PLC2,3 | | 35,235,000 | | — | | — | | 35,235,000 | | | — | | | | (1,682 | ) | | | — | | | | 2,655 | |
| Gulf Keystone Petroleum Ltd.2,3,4,7 | | 57,715,000 | | 932,000,000 | | 984,687,850 | | 5,027,150 | | | — | | | | 43 | | | | — | | | | — | |
| Transocean Partners LLC7 | | 2,470,063 | | — | | 2,470,063 | | — | | | 4,493 | | | | (4,950 | ) | | | — | | | | — | |
| Hurricane Energy PLC2,7 | | — | | 68,881,650 | | 68,881,650 | | — | | | — | | | | — | | | | — | | | | — | |
| | | | | | | | | | | | | | | | | | | | | | | | 97,061 | |
| | | | | | | | | | | | | | | | | | | | | | | | | |
| Real estate 1.02% | | | | | | | | | | | | | | | | | | | | | | | | |
| MGM Growth Properties LLC REIT, Class A | | 3,311,387 | | 836,700 | | — | | 4,148,087 | | | — | | | | 15,950 | | | | 5,899 | | | | 125,314 | |
| WHA Corp. PCL3 | | 1,081,018,900 | | 64,152,000 | | — | | 1,145,170,900 | | | — | | | | 18,725 | | | | 5,083 | | | | 122,347 | |
| Purplebricks Group PLC2,3 | | 4,295,000 | | 16,856,800 | | — | | 21,151,800 | | | — | | | | 35,887 | | | | — | | | | 109,842 | |
| Mahindra Lifespace Developers Ltd.3 | | 2,157,380 | | 539,345 | | — | | 2,696,725 | | | — | | | | 2,669 | | | | 251 | | | | 19,140 | |
| | | | | | | | | | | | | | | | | | | | | | | | 376,643 | |
| | | Beginning
shares | | Additions | | Reductions | | Ending
shares | | Net realized
(loss) gain
(000) | | | Net unrealized
appreciation
(depreciation)
(000) | | | Dividend
income
(000) | | | Value of
affiliates at
9/30/2017
(000) | |
| Telecommunication services 0.28% | | | | | | | | | | | | | | | | | | | | | | | | |
| Iridium Communications Inc.2 | | 6,008,616 | | 1,197,472 | | — | | 7,206,088 | | $ | — | | | $ | 15,010 | | | $ | — | | | $ | 74,223 | |
| Zegona Communications PLC3 | | 12,305,654 | | — | | — | | 12,305,654 | | | — | | | | 10,041 | | | | 345 | | | | 27,715 | |
| | | | | | | | | | | | | | | | | | | | | | | | 101,938 | |
| | | | | | | | | | | | | | | | | | | | | | | | | |
| Utilities 0.01% | | | | | | | | | | | | | | | | | | | | | | | | |
| Mytrah Energy Ltd.2,3 | | 10,418,000 | | — | | — | | 10,418,000 | | | — | | | | (2,832 | ) | | | — | | | | 4,156 | |
| Greenko Group PLC3,7 | | 9,748,155 | | — | | 9,748,155 | | — | | | (24,209 | ) | | | 24,081 | | | | 289 | | | | — | |
| | | | | | | | | | | | | | | | | | | | | | | | 4,156 | |
| Total common stocks | | | | | | | | | | | | | | | | | | | | | | | 7,733,291 | |
| | | | | | | | | | | | | | | | | | | | | | | | | |
| Convertible stocks 0.02% | | | | | | | | | | | | | | | | | | | | | | | | |
| Telecommunication services 0.02% | | | | | | | | | | | | | | | | | | | | | | | | |
| Iridium Communications Inc., Series A, convertible preferred4 | | 60,000 | | — | | — | | 60,000 | | | — | | | | 699 | | | | 291 | | | | 6,874 | |
| | | | | | | | | | | | | | | | | | | | | | | | | |
| Rights & warrants 0.01% | | | | | | | | | | | | | | | | | | | | | | | | |
| Information technology 0.00% | | | | | | | | | | | | | | | | | | | | | | | | |
| CardConnect Corp., warrants, expire 20212,7 | | — | | 415,000 | | 415,000 | | — | | | 91 | | | | — | | | | — | | | | — | |
| | | | | | | | | | | | | | | | | | | | | | | | | |
| Real estate 0.01% | | | | | | | | | | | | | | | | | | | | | | | | |
| WHA Corp. PCL, warrants, expire 20202 | | 6,909,830 | | — | | — | | 6,909,830 | | | — | | | | 243 | | | | — | | | | 1,958 | |
| Mahindra & Mahindra Ltd., rights, expire 20172,3 | | — | | 539,345 | | 539,345 | | — | | | — | | | | — | | | | — | | | | — | |
| | | | | | | | | | | | | | | | | | | | | | | | 1,958 | |
| | | | | | | | | | | | | | | | | | | | | | | | | |
| Total rights & warrants | | | | | | | | | | | | | | | | | | | | | | | 1,958 | |
| | | | | | | | | | | | | | | | | | | | | | | | | |
| Preferred securities 0.00% | | | | | | | | | | | | | | | | | | | | | | | | |
| Consumer staples 0.00% | | | | | | | | | | | | | | | | | | | | | | | | |
| R.E.A. Holdings PLC 9.00% | | 96,000 | | — | | — | | 96,000 | | | — | | | | 19 | | | | 11 | | | | 135 | |
| Total 20.99% | | | | | | | | | | $ | 334,185 | | | $ | 841,738 | | | $ | 84,462 | | | $ | 7,742,258 | |
The following footnotes apply to either the individual securities noted or one or more of the securities aggregated and listed as a single line item.
| 1 | Represents an affiliated company as defined under the Investment Company Act of 1940. |
| 2 | Security did not produce income during the last 12 months. |
| 3 | Valued under fair value procedures adopted by authority of the board of directors. The total value of all such securities, including those in “Miscellaneous” and “Other securities,” was $15,648,143,000, which represented 42.42% of the net assets of the fund. This amount includes $15,420,102,000 related to certain securities trading outside the U.S. whose values were adjusted as a result of significant market movements following the close of local trading. |
| 4 | Acquired in a transaction exempt from registration under Rule 144A or Section 4(2) of the Securities Act of 1933. May be resold in the U.S. in transactions exempt from registration, normally to qualified institutional buyers. The total value of all such securities, including those in “Other securities,” was $2,385,817,000, which represented 6.47% of the net assets of the fund. |
| 5 | Acquired through a private placement transaction exempt from registration under the Securities Act of 1933. May be subject to legal or contractual restrictions on resale. Further details on these holdings appear below. |
| 6 | Value determined using significant unobservable inputs. |
| 7 | Unaffiliated issuer at 9/30/2017. |
| 8 | This security changed its name during the reporting period. |
| Private placement securities | | Acquisition
date(s) | | Cost
(000) | | | Value
(000) | | | Percent
of net
assets | |
| MakeMyTrip Ltd., non-registered shares | | 5/2/2017 | | $ | 3,312 | | | $ | 2,645 | | | | .01 | % |
| Other private placement securities | | 12/3/2013-9/28/2017 | | | 187,373 | | | | 203,541 | | | | .54 | |
| Total private placement securities | | | | $ | 190,685 | | | $ | 206,186 | | | | .55 | % |
Key to abbreviations and symbol
ADR = American Depositary Receipts
CAD = Canadian dollars
CDI = CREST Depository Interest
GBP = British pounds
INR = Indian rupees
JPY = Japanese yen
USD/$ = U.S. dollars
ZAR = South African rand
See Notes to Financial Statements
Financial statements
Statement of assets and liabilities
at September 30, 2017
(dollars in thousands)
| Assets: | | | | | | | | |
| Investment securities, at value: | | | | | | | | |
| Unaffiliated issuers (cost: $20,097,917) | | $ | 29,121,912 | | | | | |
| Affiliated issuers (cost: $5,668,825) | | | 7,742,258 | | | $ | 36,864,170 | |
| Cash | | | | | | | 4,734 | |
| Cash denominated in currencies other than U.S. dollars (cost: $29,953) | | | | | | | 29,939 | |
| Unrealized appreciation on open forward currency contracts | | | | | | | 3,707 | |
| Receivables for: | | | | | | | | |
| Sales of investments | | | 108,965 | | | | | |
| Sales of fund’s shares | | | 37,988 | | | | | |
| Dividends and interest | | | 34,653 | | | | | |
| Other | | | 956 | | | | 182,562 | |
| | | | | | | | 37,085,112 | |
| Liabilities: | | | | | | | | |
| Unrealized depreciation on open forward currency contracts | | | | | | | 5,978 | |
| Payables for: | | | | | | | | |
| Purchases of investments | | | 107,312 | | | | | |
| Repurchases of fund’s shares | | | 28,676 | | | | | |
| Investment advisory services | | | 18,478 | | | | | |
| Services provided by related parties | | | 9,232 | | | | | |
| Directors’ deferred compensation | | | 4,176 | | | | | |
| Non-U.S. taxes | | | 21,435 | | | | | |
| Other | | | 633 | | | | 189,942 | |
| Net assets at September 30, 2017 | | | | | | $ | 36,889,192 | |
| |
| Net assets consist of: | | | | | | | | |
| Capital paid in on shares of capital stock | | | | | | $ | 24,069,219 | |
| Distributions in excess of net investment income | | | | | | | (159,333 | ) |
| Undistributed net realized gain | | | | | | | 1,903,291 | |
| Net unrealized appreciation | | | | | | | 11,076,015 | |
| Net assets at September 30, 2017 | | | | | | $ | 36,889,192 | |
See Notes to Financial Statements
(dollars and shares in thousands, except per-share amounts)
Total authorized capital stock — 1,000,000 shares,
$.01 par value (666,037 total shares outstanding)
| | | | | | Shares | | | Net asset value | |
| | | Net assets | | | outstanding | | | per share | |
| Class A | | $ | 21,383,321 | | | | 384,599 | | | $ | 55.60 | |
| Class C | | | 809,973 | | | | 16,431 | | | | 49.30 | |
| Class T | | | 11 | | | | — | * | | | 55.64 | |
| Class F-1 | | | 792,076 | | | | 14,403 | | | | 55.00 | |
| Class F-2 | | | 2,894,263 | | | | 51,464 | | | | 56.24 | |
| Class F-3 | | | 1,220,990 | | | | 21,907 | | | | 55.74 | |
| Class 529-A | | | 1,195,440 | | | | 21,732 | | | | 55.01 | |
| Class 529-C | | | 313,834 | | | | 6,254 | | | | 50.18 | |
| Class 529-E | | | 59,103 | | | | 1,103 | | | | 53.57 | |
| Class 529-T | | | 11 | | | | — | * | | | 55.63 | |
| Class 529-F-1 | | | 112,530 | | | | 2,025 | | | | 55.58 | |
| Class R-1 | | | 29,975 | | | | 590 | | | | 50.79 | |
| Class R-2 | | | 627,743 | | | | 12,353 | | | | 50.82 | |
| Class R-2E | | | 15,701 | | | | 284 | | | | 55.26 | |
| Class R-3 | | | 843,649 | | | | 15,777 | | | | 53.47 | |
| Class R-4 | | | 865,430 | | | | 15,684 | | | | 55.18 | |
| Class R-5E | | | 11,655 | | | | 210 | | | | 55.55 | |
| Class R-5 | | | 424,529 | | | | 7,449 | | | | 56.99 | |
| Class R-6 | | | 5,288,958 | | | | 93,772 | | | | 56.40 | |
*Amount less than one thousand.
See Notes to Financial Statements
Statement of operations
for the year ended September 30, 2017
(dollars in thousands)
| Investment income: | | | | | | | | |
| Income: | | | | | | | | |
| Dividends (net of non-U.S. taxes of $21,595; also includes $84,462 from affiliates) | | $ | 364,462 | | | | | |
| Interest (net of non-U.S. taxes of $14) | | | 27,694 | | | $ | 392,156 | |
| Fees and expenses*: | | | | | | | | |
| Investment advisory services | | | 201,295 | | | | | |
| Distribution services | | | 72,716 | | | | | |
| Transfer agent services | | | 43,867 | | | | | |
| Administrative services | | | 8,364 | | | | | |
| Reports to shareholders | | | 1,739 | | | | | |
| Registration statement and prospectus | | | 1,764 | | | | | |
| Directors’ compensation | | | 1,085 | | | | | |
| Auditing and legal | | | 343 | | | | | |
| Custodian | | | 4,340 | | | | | |
| State and local taxes | | | 1 | | | | | |
| Other | | | 1,675 | | | | | |
| Total fees and expenses before waiver | | | 337,189 | | | | | |
| Less investment advisory services waiver | | | 13 | | | | | |
| Total fees and expenses after waiver | | | | | | | 337,176 | |
| Net investment income | | | | | | | 54,980 | |
| | | | | | | | | |
| Net realized gain and unrealized appreciation: | | | | | | | | |
| Net realized gain (loss) on: | | | | | | | | |
| Investments (net of non-U.S. taxes of $2,621): | | | | | | | | |
| Unaffiliated issuers | | | 1,585,375 | | | | | |
| Affiliated issuers | | | 334,185 | | | | | |
| Forward currency contracts | | | 4,533 | | | | | |
| Currency transactions | | | (2,527 | ) | | | 1,921,566 | |
| Net unrealized appreciation (depreciation) on: | | | | | | | | |
| Investments (net of non-U.S. taxes of $20,060): | | | | | | | | |
| Unaffiliated issuers | | | 2,738,938 | | | | | |
| Affiliated issuers | | | 841,738 | | | | | |
| Forward currency contracts | | | (5,178 | ) | | | | |
| Currency translations | | | (451 | ) | | | 3,575,047 | |
| Net realized gain and unrealized appreciation | | | | | | | 5,496,613 | |
| | | | | | | | | |
| Net increase in net assets resulting from operations | | | | | | $ | 5,551,593 | |
*Additional information related to class-specific fees and expenses is included in the Notes to Financial Statements.
See Notes to Financial Statements
Statements of changes in net assets
(dollars in thousands)
| | | Year ended September 30 | |
| | | 2017 | | | 2016 | |
| Operations: | | | | | | | | |
| Net investment income | | $ | 54,980 | | | $ | 21,862 | |
| Net realized gain (loss) | | | 1,921,566 | | | | (92,510 | ) |
| Net unrealized appreciation | | | 3,575,047 | | | | 3,229,098 | |
| Net increase in net assets resulting from operations | | | 5,551,593 | | | | 3,158,450 | |
| | | | | | | | | |
| Dividends and distributions paid to shareholders: | | | | | | | | |
| Dividends from net investment income | | | (113,141 | ) | | | — | |
| Distributions from net realized gain on investments | | | — | | | | (1,672,921 | ) |
| Total dividends and distributions paid to shareholders | | | (113,141 | ) | | | (1,672,921 | ) |
| | | | | | | | | |
| Net capital share transactions | | | 1,584,900 | | | | 2,176,139 | |
| | | | | | | | | |
| Total increase in net assets | | | 7,023,352 | | | | 3,661,668 | |
| | | | | | | | | |
| Net assets: | | | | | | | | |
| Beginning of year | | | 29,865,840 | | | | 26,204,172 | |
| End of year (including distributions in excess of net investment income and accumulated net investment loss: $(159,333) and $(145,843), respectively) | | $ | 36,889,192 | | | $ | 29,865,840 | |
See Notes to Financial Statements
Notes to financial statements
1. Organization
SMALLCAP World Fund, Inc. (the “fund”) is registered under the Investment Company Act of 1940 as an open-end, diversified management investment company. The fund seeks to provide long-term growth of capital. Shareholders approved a proposal to reorganize the fund from a Maryland corporation to a Delaware statutory trust. The reorganization may be completed in the next year; however, the fund reserves the right to delay the implementation.
The fund has 19 share classes consisting of six retail share classes (Classes A, C, T, F-1, F-2 and F-3), five 529 college savings plan share classes (Classes 529-A, 529-C, 529-E, 529-T and 529-F-1) and eight retirement plan share classes (Classes R-1, R-2, R-2E, R-3, R-4, R-5E, R-5 and R-6). The 529 college savings plan share classes can be used to save for college education. The retirement plan share classes are generally offered only through eligible employer-sponsored retirement plans. The fund’s share classes are described further in the following table:
| Share class | | Initial sales charge | | Contingent deferred sales charge upon
redemption | | Conversion feature | |
| Classes A and 529-A | | Up to 5.75% | | None (except 1% for certain redemptions within one year of purchase without an initial sales charge*) | | None | |
| Class C | | None | | 1% for redemptions within one year of purchase | | Class C converts to Class F-1 after 10 years | |
| Class 529-C | | None | | 1% for redemptions within one year of purchase | | None | |
| Class 529-E | | None | | None | | None | |
| Classes T and 529-T† | | Up to 2.50% | | None | | None | |
| Classes F-1, F-2, F-3 and 529-F-1 | | None | | None | | None | |
| Classes R-1, R-2, R-2E, R-3, R-4, R-5E, R-5 and R-6 | | None | | None | | None | |
| * | 18 months for shares purchased on or after August 14, 2017. |
| † | Class T and 529-T shares are not available for purchase. |
Holders of all share classes have equal pro rata rights to the assets, dividends and liquidation proceeds of the fund. Each share class has identical voting rights, except for the exclusive right to vote on matters affecting only its class. Share classes have different fees and expenses (“class-specific fees and expenses”), primarily due to different arrangements for distribution, transfer agent and administrative services. Differences in class-specific fees and expenses will result in differences in net investment income and, therefore, the payment of different per-share dividends by each share class.
2. Significant accounting policies
The fund is an investment company that applies the accounting and reporting guidance issued in Topic 946 by the U.S. Financial Accounting Standards Board. The fund’s financial statements have been prepared to comply with U.S. generally accepted accounting principles (“U.S. GAAP”). These principles require the fund’s investment adviser to make estimates and assumptions that affect reported amounts and disclosures. Actual results could differ from those estimates. Subsequent events, if any, have been evaluated through the date of issuance in the preparation of the financial statements. The fund follows the significant accounting policies described in this section, as well as the valuation policies described in the next section on valuation.
Security transactions and related investment income — Security transactions are recorded by the fund as of the date the trades are executed with brokers. Realized gains and losses from security transactions are determined based on the specific identified cost of the securities. In the event a security is purchased with a delayed payment date, the fund will segregate liquid assets sufficient to meet its payment obligations. Dividend income is recognized on the ex-dividend date and interest income is recognized on an accrual basis. Market discounts, premiums and original issue discounts on fixed-income securities are amortized daily over the expected life of the security.
Class allocations — Income, fees and expenses (other than class-specific fees and expenses) and realized and unrealized gains and losses are allocated daily among the various share classes based on their relative net assets. Class-specific fees and expenses, such as distribution, transfer agent and administrative services, are charged directly to the respective share class.
Dividends and distributions to shareholders — Dividends and distributions to shareholders are recorded on the ex-dividend date.
Currency translation — Assets and liabilities, including investment securities, denominated in currencies other than U.S. dollars are translated into U.S. dollars at the exchange rates supplied by one or more pricing vendors on the valuation date. Purchases and sales of investment securities and income and expenses are translated into U.S. dollars at the exchange rates on the dates of such transactions. The effects of changes in exchange rates on investment securities are included with the net realized gain or loss and net unrealized appreciation or depreciation on investments in the fund’s statement of operations. The realized gain or loss and unrealized appreciation or depreciation resulting from all other transactions denominated in currencies other than U.S. dollars are disclosed separately.
3. Valuation
Capital Research and Management Company (“CRMC”), the fund’s investment adviser, values the fund’s investments at fair value as defined by U.S. GAAP. The net asset value of each share class of the fund is generally determined as of approximately 4:00 p.m. New York time each day the New York Stock Exchange is open.
Methods and inputs — The fund’s investment adviser uses the following methods and inputs to establish the fair value of the fund’s assets and liabilities. Use of particular methods and inputs may vary over time based on availability and relevance as market and economic conditions evolve.
Equity securities are generally valued at the official closing price of, or the last reported sale price on, the exchange or market on which such securities are traded, as of the close of business on the day the securities are being valued or, lacking any sales, at the last available bid price. Prices for each security are taken from the principal exchange or market on which the security trades.
Fixed-income securities, including short-term securities, are generally valued at prices obtained from one or more pricing vendors. Vendors value such securities based on one or more of the inputs described in the following table. The table provides examples of inputs that are commonly relevant for valuing particular classes of fixed-income securities in which the fund is authorized to invest. However, these classifications are not exclusive, and any of the inputs may be used to value any other class of fixed-income security.
| Fixed-income class | Examples of standard inputs |
| All | Benchmark yields, transactions, bids, offers, quotations from dealers and trading systems, new issues, spreads and other relationships observed in the markets among comparable securities; and proprietary pricing models such as yield measures calculated using factors such as cash flows, financial or collateral performance and other reference data (collectively referred to as “standard inputs”) |
| Corporate bonds & notes; convertible securities | Standard inputs and underlying equity of the issuer |
| Bonds & notes of governments & government agencies | Standard inputs and interest rate volatilities |
When the fund’s investment adviser deems it appropriate to do so (such as when vendor prices are unavailable or deemed to be not representative), fixed-income securities will be valued in good faith at the mean quoted bid and ask prices that are reasonably and timely available (or bid prices, if ask prices are not available) or at prices for securities of comparable maturity, quality and type.
Securities with both fixed-income and equity characteristics, or equity securities traded principally among fixed-income dealers, are generally valued in the manner described for either equity or fixed-income securities, depending on which method is deemed most appropriate by the fund’s investment adviser. Forward currency contracts are valued at the mean of representative quoted bid and ask prices, generally based on prices supplied by one or more pricing vendors.
Securities and other assets for which representative market quotations are not readily available or are considered unreliable by the fund’s investment adviser are fair valued as determined in good faith under fair valuation guidelines adopted by authority of the fund’s board of directors as further described. The investment adviser follows fair valuation guidelines, consistent with U.S. Securities and Exchange Commission rules and guidance, to consider relevant principles and factors when making fair value determinations. The investment adviser considers relevant indications of value that are reasonably and timely available to it in determining the fair value to be assigned to a particular security, such as the type and cost of the security; contractual or legal restrictions on resale of the security; relevant financial or business developments of the issuer; actively traded similar or related securities; conversion or exchange rights on the security; related corporate actions; significant events occurring after the close of trading in the security; and changes in overall market conditions. In addition, the closing prices of equity securities that trade in markets outside U.S. time zones may be adjusted to reflect significant events that occur after the close of local trading but before the net asset value of each share class of the fund is determined. Fair valuations and
valuations of investments that are not actively trading involve judgment and may differ materially from valuations that would have been used had greater market activity occurred.
Processes and structure — The fund’s board of directors has delegated authority to the fund’s investment adviser to make fair value determinations, subject to board oversight. The investment adviser has established a Joint Fair Valuation Committee (the “Fair Valuation Committee”) to administer, implement and oversee the fair valuation process, and to make fair value decisions. The Fair Valuation Committee regularly reviews its own fair value decisions, as well as decisions made under its standing instructions to the investment adviser’s valuation teams. The Fair Valuation Committee reviews changes in fair value measurements from period to period and may, as deemed appropriate, update the fair valuation guidelines to better reflect the results of back testing and address new or evolving issues. The Fair Valuation Committee reports any changes to the fair valuation guidelines to the board of directors with supplemental information to support the changes. The fund’s board and audit committee also regularly review reports that describe fair value determinations and methods.
The fund’s investment adviser has also established a Fixed-Income Pricing Review Group to administer and oversee the fixed-income valuation process, including the use of fixed-income pricing vendors. This group regularly reviews pricing vendor information and market data. Pricing decisions, processes and controls over security valuation are also subject to additional internal reviews, including an annual control self-evaluation program facilitated by the investment adviser’s compliance group.
Classifications — The fund’s investment adviser classifies the fund’s assets and liabilities into three levels based on the inputs used to value the assets or liabilities. Level 1 values are based on quoted prices in active markets for identical securities. Level 2 values are based on significant observable market inputs, such as quoted prices for similar securities and quoted prices in inactive markets. Certain securities trading outside the U.S. may transfer between Level 1 and Level 2 due to valuation adjustments resulting from significant market movements following the close of local trading. Level 3 values are based on significant unobservable inputs that reflect the investment adviser’s determination of assumptions that market participants might reasonably use in valuing the securities. The valuation levels are not necessarily an indication of the risk or liquidity associated with the underlying investment. For example, U.S. government securities are reflected as Level 2 because the inputs used to determine fair value may not always be quoted prices in an active market. The following tables present the fund’s valuation levels as of September 30, 2017 (dollars in thousands):
| | | Investment securities | |
| | | Level 1 | | | Level 2* | | | Level 3 | | | Total | |
| Assets: | | | | | | | | | | | | | | | | |
| Common stocks: | | | | | | | | | | | | | | | | |
| Consumer discretionary | | $ | 2,828,307 | | | $ | 3,786,958 | | | $ | 8,558 | | | $ | 6,623,823 | |
| Information technology | | | 3,284,300 | | | | 1,940,490 | | | | — | | | | 5,224,790 | |
| Health care | | | 3,739,979 | | | | 1,382,155 | | | | 19,751 | | | | 5,141,885 | |
| Industrials | | | 1,870,364 | | | | 2,378,919 | | | | — | | | | 4,249,283 | |
| Financials | | | 2,722,924 | | | | 1,471,161 | | | | — | | | | 4,194,085 | |
| Consumer staples | | | 407,127 | | | | 1,734,583 | | | | — | | | | 2,141,710 | |
| Materials | | | 572,330 | | | | 1,099,647 | | | | — | | | | 1,671,977 | |
| Energy | | | 1,020,193 | | | | 336,102 | | | | 23,407 | | | | 1,379,702 | |
| Real estate | | | 233,502 | | | | 306,838 | | | | — | | | | 540,340 | |
| Other | | | 178,411 | | | | 409,156 | | | | — | | | | 587,567 | |
| Miscellaneous | | | 1,162,926 | | | | 638,872 | | | | — | | | | 1,801,798 | |
| Preferred securities | | | 135 | | | | — | | | | — | | | | 135 | |
| Rights & warrants | | | 1,958 | | | | 2,300 | | | | 964 | | | | 5,222 | |
| Convertible stocks | | | — | | | | 6,874 | | | | 108,283 | | | | 115,157 | |
| Bonds, notes & other debt instruments | | | — | | | | 91,268 | | | | — | | | | 91,268 | |
| Short-term securities | | | — | | | | 3,095,428 | | | | — | | | | 3,095,428 | |
| Total | | $ | 18,022,456 | | | $ | 18,680,751 | | | $ | 160,963 | | | $ | 36,864,170 | |
See next page for footnote.
| | | Other investments† | |
| | | Level 1 | | | Level 2 | | | Level 3 | | | Total | |
| Assets: | | | | | | | | | | | | | | | | |
| Unrealized appreciation on open forward currency contracts | | $ | — | | | $ | 3,707 | | | $ | — | | | $ | 3,707 | |
| Liabilities: | | | | | | | | | | | | | | | | |
| Unrealized depreciation on open forward currency contracts | | | — | | | | (5,978 | ) | | | — | | | | (5,978 | ) |
| Total | | $ | — | | | $ | (2,271 | ) | | $ | — | | | $ | (2,271 | ) |
| | |
| * | Securities with a value of $15,420,102,000, which represented 41.80% of the net assets of the fund, were classified as Level 2 due to significant market movements following the close of local trading. |
| † | Forward currency contracts are not included in the investment portfolio. |
4. Risk factors
Investing in the fund may involve certain risks including, but not limited to, those described below.
Market conditions — The prices of, and the income generated by, the securities held by the fund may decline – sometimes rapidly or unpredictably – due to various factors, including events or conditions affecting the general economy or particular industries; overall market changes; local, regional or global political, social or economic instability; governmental or governmental agency responses to economic conditions; and currency exchange rate, interest rate and commodity price fluctuations.
Issuer risks — The prices of, and the income generated by, securities held by the fund may decline in response to various factors directly related to the issuers of such securities, including reduced demand for an issuer’s goods or services, poor management performance and strategic initiatives such as mergers, acquisitions or dispositions and the market response to any such initiatives.
Investing in growth-oriented stocks — Growth-oriented common stocks and other equity-type securities (such as preferred stocks, convertible preferred stocks and convertible bonds) may involve larger price swings and greater potential for loss than other types of investments. These risks may be even greater in the case of smaller capitalization stocks.
Investing in small companies — Investing in smaller companies may pose additional risks. For example, it is often more difficult to value or dispose of small company stocks and more difficult to obtain information about smaller companies than about larger companies. Furthermore, smaller companies often have limited product lines, operating histories, markets and/or financial resources, may be dependent on one or a few key persons for management, and can be more susceptible to losses. Moreover, the prices of their stocks may be more volatile than stocks of larger, more established companies.
Investing outside the U.S. — Securities of issuers domiciled outside the U.S., or with significant operations or revenues outside the U.S., may lose value because of adverse political, social, economic or market developments (including social instability, regional conflicts, terrorism and war) in the countries or regions in which the issuers operate or generate revenue. These securities may also lose value due to changes in foreign currency exchange rates against the U.S. dollar and/or currencies of other countries. Issuers of these securities may be more susceptible to actions of foreign governments, such as the imposition of price controls or punitive taxes, that could adversely impact the value of these securities. Securities markets in certain countries may be more volatile and/or less liquid than those in the U.S. Investments outside the U.S. may also be subject to different accounting practices and different regulatory, legal and reporting standards and practices, and may be more difficult to value, than those in the U.S. In addition, the value of investments outside the U.S. may be reduced by foreign taxes, including foreign withholding taxes on interest and dividends. Further, there may be increased risks of delayed settlement of securities purchased or sold by the fund. The risks of investing outside the U.S. may be heightened in connection with investments in emerging markets.
Investing in emerging markets — Investing in emerging markets may involve risks in addition to and greater than those generally associated with investing in the securities markets of developed countries. For instance, developing countries may have less developed legal and accounting systems than those in developed countries. The governments of these countries may be less stable and more likely to impose capital controls, nationalize a company or industry, place restrictions on foreign ownership and on withdrawing sale proceeds of securities from the country, and/or impose punitive taxes that could adversely affect the prices of securities. In addition, the economies of these countries may be dependent on relatively few industries that are more susceptible to local and global changes. Securities markets in these countries can also be relatively small and have substantially lower trading volumes. As a result, securities issued in these countries may be more volatile and less liquid, and may be more difficult to value, than securities issued in countries with more developed economies and/or markets. Less certainty with respect to security valuations may lead to additional challenges and risks in calculating the fund’s net asset value. Additionally, there may be increased settlement risks for transactions in local securities.
Management — The investment adviser to the fund actively manages the fund’s investments. Consequently, the fund is subject to the risk that the methods and analyses employed by the investment adviser in this process may not produce the desired results. This could cause the fund to lose value or its investment results to lag relevant benchmarks or other funds with similar objectives.
5. Certain investment techniques
Forward currency contracts — The fund has entered into forward currency contracts, which represent agreements to exchange currencies on specific future dates at predetermined rates. The fund’s investment adviser uses forward currency contracts to manage the fund’s exposure to changes in exchange rates. Upon entering into these contracts, risks may arise from the potential inability of counterparties to meet the terms of their contracts and from possible movements in exchange rates.
On a daily basis, the fund’s investment adviser values forward currency contracts and records unrealized appreciation or depreciation for open forward currency contracts in the fund’s statement of assets and liabilities. Realized gains or losses are recorded at the time the forward currency contract is closed or offset by another contract with the same broker for the same settlement date and currency.
Closed forward currency contracts that have not reached their settlement date are included in the respective receivables or payables for closed forward currency contracts in the fund’s statement of assets and liabilities. Net realized gains or losses from closed forward currency contracts and net unrealized appreciation or depreciation from open forward currency contracts are recorded in the fund’s statement of operations. The average month-end notional amount of open forward currency contracts while held was $442,632,000.
The following tables present the financial statement impacts resulting from the fund’s use of forward currency contracts as of, or for the year ended, September 30, 2017 (dollars in thousands):
| | | | | Assets | | | Liabilities | |
| Contract | | Risk type | | Location on statement of
assets and liabilities | | Value | | | Location on statement of
assets and liabilities | | Value | |
| Forward currency | | Currency | | Unrealized appreciation on open forward currency contracts | | $ | 3,707 | | | Unrealized depreciation on open forward currency contracts | | $ | 5,978 | |
| | | | | | | | | | | | | | | |
| | | | | Net realized gain | | | Net unrealized depreciation | |
| Contract | | Risk type | | Location on statement of operations | | Value | | | Location on statement of
operations | | Value | |
| Forward currency | | Currency | | Net realized gain on forward currency contracts | | $ | 4,533 | | | Net unrealized depreciation on forward currency contracts | | $ | (5,178 | ) |
Collateral — The fund participates in a collateral program due to its use of forward currency contracts. The program calls for the fund to either receive or pledge highly liquid assets, such as cash or U.S. Treasury bills, as collateral based on the net gain or loss on unsettled forward currency contracts by counterparty. The purpose of the collateral is to cover potential losses that could occur in the event that either party cannot meet its contractual obligations.
Rights of offset — The fund has entered into enforceable master netting agreements with certain counterparties for forward currency contracts, where on any date amounts payable by each party to the other (in the same currency with respect to the same transaction) may be closed or offset by each party’s payment obligation. If an early termination date occurs under these agreements following an event of default or termination event, all obligations of each party to its counterparty are settled net through a single payment in a single currency (“close-out netting”). For financial reporting purposes, the fund does not offset financial assets and financial liabilities that are subject to these master netting arrangements in the statement of assets and liabilities.
The following table presents the fund’s forward currency contracts by counterparty that are subject to master netting agreements but that are not offset in the fund’s statement of assets and liabilities. The net amount column shows the impact of offsetting on the fund’s statement of assets and liabilities as of September 30, 2017, if close-out netting was exercised (dollars in thousands):
| | | | | | Gross amounts not offset in the | | | | |
| | | Gross amounts | | | statement of assets and liabilities and | | | | |
| | | recognized in the | | | subject to a master netting agreement | | | | |
| | | statement of assets | | | Available | | | Non-cash | | | Cash | | | Net | |
| Counterparty | | and liabilities | | | to offset | | | collateral* | | | collateral | | | amount | |
| Assets: | | | | | | | | | | | | | | | | | | | | |
| Bank of America, N.A. | | $ | 446 | | | $ | (446 | ) | | $ | — | | | $ | — | | | $ | — | |
| Barclays Bank PLC | | | 731 | | | | (532 | ) | | | (199 | ) | | | — | | | | — | |
| Citibank | | | 738 | | | | (738 | ) | | | — | | | | — | | | | — | |
| Goldman Sachs | | | 9 | | | | — | | | | — | | | | — | | | | 9 | |
| JPMorgan Chase | | | 1,727 | | | | — | | | | (1,727 | ) | | | — | | | | — | |
| UBS AG | | | 56 | | | | (56 | ) | | | — | | | | — | | | | — | |
| Total | | $ | 3,707 | | | $ | (1,772 | ) | | $ | (1,926 | ) | | $ | — | | | $ | 9 | |
| | | | | | | | | | | | | | | | | | | | | |
| Liabilities: | | | | | | | | | | | | | | | | | | | | |
| Bank of America, N.A. | | $ | 569 | | | $ | (446 | ) | | $ | (123 | ) | | $ | — | | | $ | — | |
| Barclays Bank PLC | | | 532 | | | | (532 | ) | | | — | | | | — | | | | — | |
| Citibank | | | 3,840 | | | | (738 | ) | | | (3,102 | ) | | | — | | | | — | |
| UBS AG | | | 1,037 | | | | (56 | ) | | | (981 | ) | | | — | | | | — | |
| Total | | $ | 5,978 | | | $ | (1,772 | ) | | $ | (4,206 | ) | | $ | — | | | $ | — | |
*Non-cash collateral is shown on a settlement basis.
6. Taxation and distributions
Federal income taxation — The fund complies with the requirements under Subchapter M of the Internal Revenue Code applicable to mutual funds and intends to distribute substantially all of its net taxable income and net capital gains each year. The fund is not subject to income taxes to the extent such distributions are made. Therefore, no federal income tax provision is required.
As of and during the period ended September 30, 2017, the fund did not have a liability for any unrecognized tax benefits. The fund recognizes interest and penalties, if any, related to unrecognized tax benefits as income tax expense in the statement of operations. During the period, the fund did not incur any interest or penalties.
The fund is not subject to examination by U.S. federal tax authorities for tax years before 2013, by state tax authorities for tax years before 2012 and by tax authorities outside the U.S. for tax years before 2010.
Non-U.S. taxation — Dividend and interest income are recorded net of non-U.S. taxes paid. The fund may file withholding tax reclaims in certain jurisdictions to recover a portion of amounts previously withheld. As a result of rulings from European courts, the fund filed for additional reclaims related to prior years. These reclaims are recorded when the amount is known and there are no significant uncertainties on collectability. Gains realized by the fund on the sale of securities in certain countries, if any, may be subject to non-U.S. taxes. If applicable, the fund records an estimated deferred tax liability based on unrealized gains to provide for potential non-U.S. taxes payable upon the sale of these securities.
Distributions — Distributions paid to shareholders are based on net investment income and net realized gains determined on a tax basis, which may differ from net investment income and net realized gains for financial reporting purposes. These differences are due primarily to different treatment for items such as currency gains and losses; short-term capital gains and losses; capital losses related to sales of certain securities within 30 days of purchase; unrealized appreciation of certain investments in securities outside the U.S.; deferred expenses; cost of investments sold; non-U.S. taxes on capital gains and income on certain investments. The fiscal year in which amounts are distributed may differ from the year in which the net investment income and net realized gains are recorded by the fund for financial reporting purposes. The fund may also designate a portion of the amount paid to redeeming shareholders as a distribution for tax purposes.
During the year ended September 30, 2017, the fund reclassified $7,750,000 from undistributed net realized gain to distributions in excess of net investment income, $48,821,000 from undistributed net realized gain to capital paid in on shares of capital stock and $36,921,000 from capital paid in on shares of capital stock to distributions in excess of net investment income to align financial reporting with tax reporting.
As of September 30, 2017, the tax basis components of distributable earnings, unrealized appreciation (depreciation) and cost of investments were as follows (dollars in thousands):
| Undistributed long-term capital gains | | $ | 1,524,576 | |
| Gross unrealized appreciation on investments | | | 12,271,988 | |
| Gross unrealized depreciation on investments | | | (953,275 | ) |
| Net unrealized appreciation on investments | | | 11,318,713 | |
| Cost of investments | | | 25,543,186 | |
The tax character of distributions paid to shareholders was as follows (dollars in thousands):
| | | Year ended September 30, 2017 | | | Year ended September 30, 2016 | |
| | | | | | | | | Total | | | | | | | | | Total | |
| | | Ordinary | | | Long-term | | | dividends | | | Ordinary | | | Long-term | | | distributions | |
| Share class | | income | | | capital gains | | | paid | | | income | | | capital gains | | | paid | |
| Class A | | $ | 62,231 | | | $ | — | | | $ | 62,231 | | | $ | — | | | $ | 1,064,700 | | | $ | 1,064,700 | |
| Class B1 | | | — | | | | — | | | | — | | | | — | | | | 3,676 | | | | 3,676 | |
| Class C | | | — | | | | — | | | | — | | | | — | | | | 58,177 | | | | 58,177 | |
| Class T2 | | | — | | | | — | | | | — | | | | | | | | | | | | | |
| Class F-1 | | | 2,327 | | | | — | | | | 2,327 | | | | — | | | | 42,143 | | | | 42,143 | |
| Class F-2 | | | 14,539 | | | | — | | | | 14,539 | | | | — | | | | 96,780 | | | | 96,780 | |
| Class F-33 | | | — | | | | — | | | | — | | | | | | | | | | | | | |
| Class 529-A | | | 2,838 | | | | — | | | | 2,838 | | | | — | | | | 59,860 | | | | 59,860 | |
| Class 529-B1 | | | — | | | | — | | | | — | | | | — | | | | 551 | | | | 551 | |
| Class 529-C | | | — | | | | — | | | | — | | | | — | | | | 18,639 | | | | 18,639 | |
| Class 529-E | | | 47 | | | | — | | | | 47 | | | | — | | | | 3,219 | | | | 3,219 | |
| Class 529-T2 | | | — | | | | — | | | | — | | | | | | | | | | | | | |
| Class 529-F-1 | | | 445 | | | | — | | | | 445 | | | | — | | | | 5,125 | | | | 5,125 | |
| Class R-1 | | | — | | | | — | | | | — | | | | — | | | | 2,210 | | | | 2,210 | |
| Class R-2 | | | — | 4 | | | — | | | | — | 4 | | | — | | | | 41,660 | | | | 41,660 | |
| Class R-2E | | | 10 | | | | — | | | | 10 | | | | — | | | | 77 | | | | 77 | |
| Class R-3 | | | 614 | | | | — | | | | 614 | | | | — | | | | 49,450 | | | | 49,450 | |
| Class R-4 | | | 2,659 | | | | — | | | | 2,659 | | | | — | | | | 45,110 | | | | 45,110 | |
| Class R-5E5 | | | 61 | | | | — | | | | 61 | | | | — | | | | 1 | | | | 1 | |
| Class R-5 | | | 2,157 | | | | — | | | | 2,157 | | | | — | | | | 29,273 | | | | 29,273 | |
| Class R-6 | | | 25,213 | | | | — | | | | 25,213 | | | | — | | | | 152,270 | | | | 152,270 | |
| Total | | $ | 113,141 | | | $ | — | | | $ | 113,141 | | | $ | — | | | $ | 1,672,921 | | | $ | 1,672,921 | |
| | |
| 1 | Class B and 529-B shares were fully liquidated on May 5, 2017. |
| 2 | Class T and 529-T shares began investment operations on April 7, 2017. |
| 3 | Class F-3 shares began investment operations on January 27, 2017. |
| 4 | Amount less than one thousand. |
| 5 | Class R-5E shares began investment operations on November 20, 2015. |
7. Fees and transactions with related parties
CRMC, the fund’s investment adviser, is the parent company of American Funds Distributors,® Inc. (“AFD”), the principal underwriter of the fund’s shares, and American Funds Service Company® (“AFS”), the fund’s transfer agent. CRMC, AFD and AFS are considered related parties to the fund.
Investment advisory services — The fund has an investment advisory and service agreement with CRMC that provides for monthly fees accrued daily. At the beginning of the year, these fees were based on a series of decreasing annual rates beginning with 0.800% on the first $1 billion of daily net assets and decreasing to 0.595% on such assets in excess of $27 billion. On September 14, 2017, the fund’s board of directors approved an amended investment advisory and service agreement effective December 1, 2017, decreasing the annual rates on daily net assets in excess of $34 billion to 0.592%. CRMC voluntarily reduced investment advisory services fees to the approved rate in advance of the effective date. For the year ended September 30, 2017, total investment advisory services fees waived by CRMC were $13,000. As a result, the fee of $201,295,000 shown on the statement of operations was reduced to $201,282,000, both of which were equivalent to an annualized rate of 0.623% of average net assets.
Class-specific fees and expenses — Expenses that are specific to individual share classes are accrued directly to the respective share class. The principal class-specific fees and expenses are further described below:
Distribution services — The fund has plans of distribution for all share classes, except Class F-2, F-3, R-5E, R-5 and R-6 shares. Under the plans, the board of directors approves certain categories of expenses that are used to finance activities primarily intended to sell fund shares and service existing accounts. The plans provide for payments, based on an annualized percentage of average daily net assets, ranging from 0.30% to 1.00% as noted in this section. In some cases, the board of directors has limited the amounts that may be paid to less than the maximum allowed by the plans. All share classes with a plan may use up to 0.25% of average daily net assets to pay service fees, or to compensate AFD for paying service fees, to firms that have entered into agreements with AFD to provide certain shareholder services. The remaining amounts available to be paid under each plan are paid to dealers to compensate them for their sales activities.
| | Share class | | Currently approved limits | | Plan limits |
| | Class A | | | 0.30 | % | | | 0.30 | % |
| | Class 529-A | | | 0.30 | | | | 0.50 | |
| | Classes C, 529-C and R-1 | | | 1.00 | | | | 1.00 | |
| | Class R-2 | | | 0.75 | | | | 1.00 | |
| | Class R-2E | | | 0.60 | | | | 0.85 | |
| | Classes 529-E and R-3 | | | 0.50 | | | | 0.75 | |
| | Classes T, F-1, 529-T, 529-F-1 and R-4 | | | 0.25 | | | | 0.50 | |
For Class A and 529-A shares, distribution-related expenses include the reimbursement of dealer and wholesaler commissions paid by AFD for certain shares sold without a sales charge. These share classes reimburse AFD for amounts billed within the prior 15 months but only to the extent that the overall annual expense limits are not exceeded. As of September 30, 2017, there were no unreimbursed expenses subject to reimbursement for Class A or 529-A shares.
Transfer agent services — The fund has a shareholder services agreement with AFS under which the fund compensates AFS for providing transfer agent services to each of the fund’s share classes. These services include recordkeeping, shareholder communications and transaction processing. In addition, the fund reimburses AFS for amounts paid to third parties for performing transfer agent services on behalf of fund shareholders.
Administrative services — The fund has an administrative services agreement with CRMC under which the fund compensates CRMC for providing administrative services to Class A, C, T, F, 529 and R shares. These services include, but are not limited to, coordinating, monitoring, assisting and overseeing third parties that provide services to fund shareholders. Under the agreement, Class A shares pay an annual fee of 0.01% and Class C, T, F, 529 and R shares pay an annual fee of 0.05% of their respective average daily net assets.
529 plan services — Each 529 share class is subject to service fees to compensate the Virginia College Savings Plan (“Virginia529”) for its oversight and administration of the 529 college savings plan. The quarterly fee is based on a series of decreasing annual rates beginning with 0.10% on the first $20 billion of the net assets invested in the Class 529 shares of the American Funds and decreasing to 0.03% on such assets in excess of $100 billion. The fee for any given calendar quarter is accrued and calculated on the basis of the average net assets of Class 529 shares of the American Funds for the last month of the prior calendar quarter. The fee is included in other expenses in the fund’s statement of operations. Virginia529 is not considered a related party to the fund.
For the year ended September 30, 2017, class-specific expenses under the agreements were as follows (dollars in thousands):
| | | Distribution | | Transfer agent | | Administrative | | 529 plan | |
| Share class | | services | | services | | services | | services | |
| Class A | | | $46,688 | | | | $31,968 | | | | $1,945 | | | | Not applicable | |
| Class B1 | | | 60 | | | | 14 | | | | Not applicable | | | | Not applicable | |
| Class C | | | 7,911 | | | | 1,336 | | | | 398 | | | | Not applicable | |
| Class T2 | | | — | | | | — | 3 | | | — | 3 | | | Not applicable | |
| Class F-1 | | | 1,849 | | | | 1,123 | | | | 371 | | | | Not applicable | |
| Class F-2 | | | Not applicable | | | | 2,846 | | | | 1,264 | | | | Not applicable | |
| Class F-34 | | | Not applicable | | | | 47 | | | | 223 | | | | Not applicable | |
| Class 529-A | | | 2,323 | | | | 1,560 | | | | 542 | | | | $741 | |
| Class 529-B1 | | | 9 | | | | 2 | | | | 1 | | | | 1 | |
| Class 529-C | | | 2,881 | | | | 447 | | | | 146 | | | | 200 | |
| Class 529-E | | | 272 | | | | 42 | | | | 27 | | | | 37 | |
| Class 529-T2 | | | — | | | | — | 3 | | | — | 3 | | | — | 3 |
| Class 529-F-1 | | | — | | | | 142 | | | | 49 | | | | 68 | |
| Class R-1 | | | 304 | | | | 39 | | | | 15 | | | | Not applicable | |
| Class R-2 | | | 4,468 | | | | 2,163 | | | | 301 | | | | Not applicable | |
| Class R-2E | | | 62 | | | | 21 | | | | 5 | | | | Not applicable | |
| Class R-3 | | | 3,929 | | | | 1,195 | | | | 395 | | | | Not applicable | |
| Class R-4 | | | 1,960 | | | | 743 | | | | 393 | | | | Not applicable | |
| Class R-5E | | | Not applicable | | | | 11 | | | | 4 | | | | Not applicable | |
| Class R-5 | | | Not applicable | | | | 168 | | | | 189 | | | | Not applicable | |
| Class R-6 | | | Not applicable | | | | — | 3 | | | 2,096 | | | | Not applicable | |
| Total class-specific expenses | | | $72,716 | | | | $43,867 | | | | $8,364 | | | | $1,047 | |
| 1 | Class B and 529-B shares were fully liquidated on May 5, 2017. |
| 2 | Class T and 529-T shares began investment operations on April 7, 2017. |
| 3 | Amount less than one thousand. |
| 4 | Class F-3 shares began investment operations on January 27, 2017. |
Directors’ deferred compensation — Directors who are unaffiliated with CRMC may elect to defer the cash payment of part or all of their compensation. These deferred amounts, which remain as liabilities of the fund, are treated as if invested in shares of the fund or other American Funds. These amounts represent general, unsecured liabilities of the fund and vary according to the total returns of the selected funds. Directors’ compensation of $1,085,000 in the fund’s statement of operations reflects $493,000 in current fees (either paid in cash or deferred) and a net increase of $592,000 in the value of the deferred amounts.
Affiliated officers and directors — Officers and certain directors of the fund are or may be considered to be affiliated with CRMC, AFD and AFS. No affiliated officers or directors received any compensation directly from the fund.
Security transactions with related funds — The fund may purchase from, or sell securities to, other funds managed by CRMC (or funds managed by certain affiliates of CRMC) under procedures adopted by the fund’s board of directors. The funds involved in such transactions are considered related by virtue of having a common investment adviser (or affiliated investment advisers), common directors and/or common officers. When such transactions occur, each transaction is executed at the current market price of the security and no brokerage commissions or fees are paid in accordance with Rule 17a-7 of the 1940 Act.
Interfund lending — Pursuant to an exemptive order issued by the SEC, the fund, along with other CRMC-managed funds (or funds managed by certain affiliates of CRMC), may participate in an interfund lending program. The program provides an alternate credit facility that permits the funds to lend or borrow cash for temporary purposes directly to or from one another, subject to the conditions of the exemptive order. The fund did not lend or borrow cash through the interfund lending program at any time during the year ended September 30, 2017.
8. Committed line of credit
The fund participates with other funds managed by CRMC (or funds managed by certain affiliates of CRMC) in a $1 billion credit facility (the “line of credit”) to be utilized for temporary purposes to support shareholder redemptions. The fund has agreed to pay commitment fees on its pro-rata portion of the line of credit, which are reflected in other expenses in the fund’s statement of operations. The fund did not borrow on this line of credit at any time during the year ended September 30, 2017.
9. Capital share transactions
Capital share transactions in the fund were as follows (dollars and shares in thousands):
| | | Sales1 | | Reinvestments of
dividends and distributions | | Repurchases1 | | | Net (decrease)
increase | |
| Share class | | Amount | | | Shares | | Amount | | Shares | | Amount | | | Shares | | | Amount | | | Shares | |
| | | | | | | | | | | | | | | | | | | | | | | | | |
| Year ended September 30, 2017 |
| |
| Class A | | $ | 2,513,462 | | | | 50,620 | | | $ | 61,097 | | | | 1,328 | | | $ | (3,188,353 | ) | | | (64,488 | ) | | $ | (613,794 | ) | | | (12,540 | ) |
| Class B2 | | | 216 | | | | 5 | | | | — | | | | — | | | | (23,207 | ) | | | (538 | ) | | | (22,991 | ) | | | (533 | ) |
| Class C | | | 114,381 | | | | 2,593 | | | | — | 3 | | | — | 3 | | | (253,475 | ) | | | (5,734 | ) | | | (139,094 | ) | | | (3,141 | ) |
| Class T4 | | | 10 | | | | — | 3 | | | — | | | | — | | | | — | | | | — | | | | 10 | | | | — | 3 |
| Class F-1 | | | 188,437 | | | | 3,823 | | | | 2,293 | | | | 50 | | | | (240,308 | ) | | | (4,843 | ) | | | (49,578 | ) | | | (970 | ) |
| Class F-2 | | | 1,779,366 | | | | 35,601 | | | | 13,853 | | | | 298 | | | | (1,456,396 | ) | | | (28,741 | ) | | | 336,823 | | | | 7,158 | |
| Class F-35 | | | 1,204,003 | | | | 23,424 | | | | — | | | | — | | | | (80,405 | ) | | | (1,517 | ) | | | 1,123,598 | | | | 21,907 | |
| Class 529-A | | | 121,526 | | | | 2,480 | | | | 2,833 | | | | 62 | | | | (134,607 | ) | | | (2,725 | ) | | | (10,248 | ) | | | (183 | ) |
| Class 529-B2 | | | 14 | | | | — | 3 | | | — | | | | — | | | | (3,850 | ) | | | (89 | ) | | | (3,836 | ) | | | (89 | ) |
| Class 529-C | | | 27,904 | | | | 620 | | | | — | 3 | | | — | 3 | | | (47,078 | ) | | | (1,044 | ) | | | (19,174 | ) | | | (424 | ) |
| Class 529-E | | | 5,095 | | | | 107 | | | | 47 | | | | 1 | | | | (7,988 | ) | | | (167 | ) | | | (2,846 | ) | | | (59 | ) |
| Class 529-T4 | | | 10 | | | | — | 3 | | | — | | | | — | | | | — | | | | — | | | | 10 | | | | — | 3 |
| Class 529-F-1 | | | 21,407 | | | | 433 | | | | 448 | | | | 10 | | | | (16,254 | ) | | | (328 | ) | | | 5,601 | | | | 115 | |
| Class R-1 | | | 4,831 | | | | 106 | | | | — | | | | — | | | | (12,251 | ) | | | (269 | ) | | | (7,420 | ) | | | (163 | ) |
| Class R-2 | | | 123,788 | | | | 2,717 | | | | — | 3 | | | — | 3 | | | (208,118 | ) | | | (4,583 | ) | | | (84,330 | ) | | | (1,866 | ) |
| Class R-2E | | | 10,052 | | | | 203 | | | | 9 | | | | — | 3 | | | (2,311 | ) | | | (47 | ) | | | 7,750 | | | | 156 | |
| Class R-3 | | | 181,821 | | | | 3,806 | | | | 613 | | | | 14 | | | | (251,813 | ) | | | (5,278 | ) | | | (69,379 | ) | | | (1,458 | ) |
| Class R-4 | | | 187,569 | | | | 3,794 | | | | 2,658 | | | | 58 | | | | (219,379 | ) | | | (4,458 | ) | | | (29,152 | ) | | | (606 | ) |
| Class R-5E | | | 10,471 | | | | 222 | | | | 61 | | | | 2 | | | | (720 | ) | | | (14 | ) | | | 9,812 | | | | 210 | |
| Class R-5 | | | 85,715 | | | | 1,684 | | | | 2,156 | | | | 46 | | | | (85,858 | ) | | | (1,693 | ) | | | 2,013 | | | | 37 | |
| Class R-6 | | | 1,563,452 | | | | 30,707 | | | | 25,212 | | | | 542 | | | | (437,539 | ) | | | (8,482 | ) | | | 1,151,125 | | | | 22,767 | |
| Total net increase (decrease) | | $ | 8,143,530 | | | | 162,945 | | | $ | 111,280 | | | | 2,411 | | | $ | (6,669,910 | ) | | | (135,038 | ) | | $ | 1,584,900 | | | | 30,318 | |
| |
| Year ended September 30, 2016 | | | | |
| | | | | | | | | | | | | | | | | | | | | | | | | | | | | | | | | |
| Class A | | $ | 2,295,955 | | | | 52,866 | | | $ | 1,047,370 | | | | 24,178 | | | $ | (2,391,866 | ) | | | (54,698 | ) | | $ | 951,459 | | | | 22,346 | |
| Class B | | | 1,133 | | | | 28 | | | | 3,663 | | | | 93 | | | | (45,481 | ) | | | (1,153 | ) | | | (40,685 | ) | | | (1,032 | ) |
| Class C | | | 112,677 | | | | 2,881 | | | | 57,696 | | | | 1,486 | | | | (217,037 | ) | | | (5,591 | ) | | | (46,664 | ) | | | (1,224 | ) |
| Class F-1 | | | 179,580 | | | | 4,186 | | | | 41,681 | | | | 972 | | | | (198,802 | ) | | | (4,619 | ) | | | 22,459 | | | | 539 | |
| Class F-2 | | | 879,673 | | | | 19,680 | | | | 93,181 | | | | 2,131 | | | | (453,367 | ) | | | (10,251 | ) | | | 519,487 | | | | 11,560 | |
| Class 529-A | | | 98,815 | | | | 2,291 | | | | 59,841 | | | | 1,396 | | | | (126,275 | ) | | | (2,906 | ) | | | 32,381 | | | | 781 | |
| Class 529-B | | | 98 | | | | 2 | | | | 551 | | | | 14 | | | | (6,370 | ) | | | (160 | ) | | | (5,721 | ) | | | (144 | ) |
| Class 529-C | | | 27,405 | | | | 690 | | | | 18,632 | | | | 471 | | | | (44,262 | ) | | | (1,108 | ) | | | 1,775 | | | | 53 | |
| Class 529-E | | | 4,666 | | | | 110 | | | | 3,219 | | | | 77 | | | | (6,626 | ) | | | (156 | ) | | | 1,259 | | | | 31 | |
| Class 529-F-1 | | | 15,378 | | | | 351 | | | | 5,127 | | | | 118 | | | | (17,587 | ) | | | (399 | ) | | | 2,918 | | | | 70 | |
| Class R-1 | | | 6,053 | | | | 151 | | | | 2,204 | | | | 55 | | | | (12,776 | ) | | | (310 | ) | | | (4,519 | ) | | | (104 | ) |
| Class R-2 | | | 117,908 | | | | 2,942 | | | | 41,614 | | | | 1,041 | | | | (195,936 | ) | | | (4,860 | ) | | | (36,414 | ) | | | (877 | ) |
| Class R-2E | | | 5,890 | | | | 136 | | | | 76 | | | | 2 | | | | (467 | ) | | | (11 | ) | | | 5,499 | | | | 127 | |
| Class R-3 | | | 152,872 | | | | 3,637 | | | | 49,428 | | | | 1,183 | | | | (227,658 | ) | | | (5,400 | ) | | | (25,358 | ) | | | (580 | ) |
| Class R-4 | | | 148,378 | | | | 3,431 | | | | 45,105 | | | | 1,050 | | | | (181,577 | ) | | | (4,177 | ) | | | 11,906 | | | | 304 | |
| Class R-5E6 | | | 10 | | | | — | 3 | | | — | | | | — | | | | — | | | | — | | | | 10 | | | | — | 3 |
| Class R-5 | | | 97,347 | | | | 2,221 | | | | 29,263 | | | | 661 | | | | (254,197 | ) | | | (5,794 | ) | | | (127,587 | ) | | | (2,912 | ) |
| Class R-6 | | | 958,624 | | | | 22,079 | | | | 152,259 | | | | 3,475 | | | | (196,949 | ) | | | (4,444 | ) | | | 913,934 | | | | 21,110 | |
| Total net increase (decrease) | | $ | 5,102,462 | | | | 117,682 | | | $ | 1,650,910 | | | | 38,403 | | | $ | (4,577,233 | ) | | | (106,037 | ) | | $ | 2,176,139 | | | | 50,048 | |
| 1 | Includes exchanges between share classes of the fund. |
| 2 | Class B and 529-B shares were fully liquidated on May 5, 2017. |
| 3 | Amount less than one thousand. |
| 4 | Class T and 529-T shares began investment operations on April 7, 2017. |
| 5 | Class F-3 shares began investment operations on January 27, 2017. |
| 6 | Class R-5E shares began investment operations on November 20, 2015. |
10. Investment transactions
The fund made purchases and sales of investment securities, excluding short-term securities and U.S. government obligations, if any, of $10,153,863,000 and $9,385,322,000, respectively, during the year ended September 30, 2017.
Financial highlights
| | | | | | Income (loss) from
investment operations1 | | | Dividends and distributions | | | | | | | | | | | | | | | | | | | |
| Period ended | | Net asset
value,
beginning
of period | | | Net
investment
income
(loss) | | | Net gains
(losses) on
securities
(both
realized and
unrealized) | | | Total from
investment
operations | | | Dividends
(from net
investment
income) | | | Distributions
(from capital
gains) | | | Total
dividends
and
distributions | | | Net asset
value,
end
of period | | | Total
return2,3 | | | Net assets,
end of period
(in millions) | | | Ratio of
expenses to
average net
assets before
reimburse-
ments | | | Ratio of
expenses to
average net
assets after
reimburse-
ments3 | | | Ratio of
net income
(loss)
to average
net assets3 | |
| Class A: | | | | | | | | | | | | | | | | | | | | | | | | | | | | | | | | | | | | | | | | | | | | | | | | | | | | |
| 9/30/2017 | | $ | 47.24 | | | $ | .07 | | | $ | 8.45 | | | $ | 8.52 | | | $ | (.16 | ) | | $ | — | | | $ | (.16 | ) | | $ | 55.60 | | | | 18.11 | % | | $ | 21,383 | | | | 1.07 | % | | | 1.07 | % | | | .14 | % |
| 9/30/2016 | | | 45.04 | | | | .04 | | | | 4.99 | | | | 5.03 | | | | — | | | | (2.83 | ) | | | (2.83 | ) | | | 47.24 | | | | 11.72 | | | | 18,762 | | | | 1.10 | | | | 1.10 | | | | .08 | |
| 9/30/2015 | | | 48.66 | | | | .04 | | | | 1.09 | | | | 1.13 | | | | — | | | | (4.75 | ) | | | (4.75 | ) | | | 45.04 | | | | 2.25 | | | | 16,882 | | | | 1.07 | | | | 1.07 | | | | .08 | |
| 9/30/2014 | | | 48.91 | | | | .01 | | | | 2.17 | | | | 2.18 | | | | — | | | | (2.43 | ) | | | (2.43 | ) | | | 48.66 | | | | 4.43 | | | | 16,857 | | | | 1.07 | | | | 1.07 | | | | .02 | |
| 9/30/2013 | | | 39.27 | | | | .06 | | | | 10.12 | | | | 10.18 | | | | (.54 | ) | | | — | | | | (.54 | ) | | | 48.91 | | | | 26.29 | | | | 16,454 | | | | 1.13 | | | | 1.13 | | | | .15 | |
| Class C: | | | | | | | | | | | | | | | | | | | | | | | | | | | | | | | | | | | | | | | | | | | | | | | | | | | | |
| 9/30/2017 | | | 42.08 | | | | (.29 | ) | | | 7.51 | | | | 7.22 | | | | — | | | | — | | | | — | | | | 49.30 | | | | 17.16 | | | | 810 | | | | 1.87 | | | | 1.87 | | | | (.66 | ) |
| 9/30/2016 | | | 40.73 | | | | (.29 | ) | | | 4.47 | | | | 4.18 | | | | — | | | | (2.83 | ) | | | (2.83 | ) | | | 42.08 | | | | 10.82 | | | | 824 | | | | 1.90 | | | | 1.90 | | | | (.73 | ) |
| 9/30/2015 | | | 44.77 | | | | (.32 | ) | | | 1.03 | | | | .71 | | | | — | | | | (4.75 | ) | | | (4.75 | ) | | | 40.73 | | | | 1.45 | | | | 847 | | | | 1.87 | | | | 1.87 | | | | (.73 | ) |
| 9/30/2014 | | | 45.54 | | | | (.36 | ) | | | 2.02 | | | | 1.66 | | | | — | | | | (2.43 | ) | | | (2.43 | ) | | | 44.77 | | | | 3.61 | | | | 892 | | | | 1.87 | | | | 1.87 | | | | (.79 | ) |
| 9/30/2013 | | | 36.60 | | | | (.26 | ) | | | 9.45 | | | | 9.19 | | | | (.25 | ) | | | — | | | | (.25 | ) | | | 45.54 | | | | 25.26 | | | | 920 | | | | 1.93 | | | | 1.93 | | | | (.65 | ) |
| Class T: | | | | | | | | | | | | | | | | | | | | | | | | | | | | | | | | | | | | | | | | | | | | | | | | | | | | |
| 9/30/20174,5 | | | 49.61 | | | | .13 | | | | 5.90 | | | | 6.03 | | | | — | | | | — | | | | — | | | | 55.64 | | | | 12.15 | 6,7 | | | — | 8 | | | .42 | 6,7 | | | .42 | 6,7 | | | .25 | 6,7 |
| Class F-1: | | | | | | | | | | | | | | | | | | | | | | | | | | | | | | | | | | | | | | | | | | | | | | | | | | | | |
| 9/30/2017 | | | 46.74 | | | | .05 | | | | 8.36 | | | | 8.41 | | | | (.15 | ) | | | — | | | | (.15 | ) | | | 55.00 | | | | 18.06 | �� | | | 792 | | | | 1.10 | | | | 1.10 | | | | .11 | |
| 9/30/2016 | | | 44.60 | | | | .03 | | | | 4.94 | | | | 4.97 | | | | — | | | | (2.83 | ) | | | (2.83 | ) | | | 46.74 | | | | 11.69 | | | | 718 | | | | 1.11 | | | | 1.11 | | | | .07 | |
| 9/30/2015 | | | 48.23 | | | | .04 | | | | 1.08 | | | | 1.12 | | | | — | | | | (4.75 | ) | | | (4.75 | ) | | | 44.60 | | | | 2.25 | | | | 662 | | | | 1.07 | | | | 1.07 | | | | .08 | |
| 9/30/2014 | | | 48.51 | | | | — | | | | 2.15 | | | | 2.15 | | | | — | | | | (2.43 | ) | | | (2.43 | ) | | | 48.23 | | | | 4.42 | | | | 624 | | | | 1.09 | | | | 1.09 | | | | — | |
| 9/30/2013 | | | 38.94 | | | | .09 | | | | 10.03 | | | | 10.12 | | | | (.55 | ) | | | — | | | | (.55 | ) | | | 48.51 | | | | 26.33 | | | | 868 | | | | 1.07 | | | | 1.07 | | | | .21 | |
| Class F-2: | | | | | | | | | | | | | | | | | | | | | | | | | | | | | | | | | | | | | | | | | | | | | | | | | | | | |
| 9/30/2017 | | | 47.80 | | | | .19 | | | | 8.54 | | | | 8.73 | | | | (.29 | ) | | | — | | | | (.29 | ) | | | 56.24 | | | | 18.40 | | | | 2,894 | | | | .82 | | | | .82 | | | | .38 | |
| 9/30/2016 | | | 45.42 | | | | .16 | | | | 5.05 | | | | 5.21 | | | | — | | | | (2.83 | ) | | | (2.83 | ) | | | 47.80 | | | | 12.03 | | | | 2,118 | | | | .82 | | | | .82 | | | | .36 | |
| 9/30/2015 | | | 48.92 | | | | .17 | | | | 1.08 | | | | 1.25 | | | | — | | | | (4.75 | ) | | | (4.75 | ) | | | 45.42 | | | | 2.50 | | | | 1,487 | | | | .82 | | | | .82 | | | | .35 | |
| 9/30/2014 | | | 49.03 | | | | .15 | | | | 2.17 | | | | 2.32 | | | | — | | | | (2.43 | ) | | | (2.43 | ) | | | 48.92 | | | | 4.72 | | | | 1,208 | | | | .81 | | | | .81 | | | | .31 | |
| 9/30/2013 | | | 39.38 | | | | .21 | | | | 10.12 | | | | 10.33 | | | | (.68 | ) | | | — | | | | (.68 | ) | | | 49.03 | | | | 26.68 | | | | 629 | | | | .82 | | | | .82 | | | | .48 | |
| Class F-3: | | | | | | | | | | | | | | | | | | | | | | | | | | | | | | | | | | | | | | | | | | | | | | | | | | | | |
| 9/30/20174,9 | | | 47.93 | | | | .25 | | | | 7.56 | | | | 7.81 | | | | — | | | | — | | | | — | | | | 55.74 | | | | 16.30 | 6 | | | 1,221 | | | | .71 | 10 | | | .71 | 10 | | | .70 | 10 |
| Class 529-A: | | | | | | | | | | | | | | | | | | | | | | | | | | | | | | | | | | | | | | | | | | | | | | | | | | | | |
| 9/30/2017 | | | 46.74 | | | | .04 | | | | 8.36 | | | | 8.40 | | | | (.13 | ) | | | — | | | | (.13 | ) | | | 55.01 | | | | 18.03 | | | | 1,195 | | | | 1.13 | | | | 1.13 | | | | .08 | |
| 9/30/2016 | | | 44.63 | | | | — | 11 | | | 4.94 | | | | 4.94 | | | | — | | | | (2.83 | ) | | | (2.83 | ) | | | 46.74 | | | | 11.64 | | | | 1,024 | | | | 1.17 | | | | 1.17 | | | | — | 12 |
| 9/30/2015 | | | 48.29 | | | | — | | | | 1.09 | | | | 1.09 | | | | — | | | | (4.75 | ) | | | (4.75 | ) | | | 44.63 | | | | 2.16 | | | | 943 | | | | 1.15 | | | | 1.15 | | | | — | |
| 9/30/2014 | | | 48.59 | | | | (.03 | ) | | | 2.16 | | | | 2.13 | | | | — | | | | (2.43 | ) | | | (2.43 | ) | | | 48.29 | | | | 4.37 | | | | 933 | | | | 1.15 | | | | 1.15 | | | | (.05 | ) |
| 9/30/2013 | | | 39.03 | | | | .04 | | | | 10.05 | | | | 10.09 | | | | (.53 | ) | | | — | | | | (.53 | ) | | | 48.59 | | | | 26.18 | | | | 884 | | | | 1.19 | | | | 1.19 | | | | .09 | |
| | | | | | Income (loss) from
investment operations1 | | | Dividends and distributions | | | | | | | | | | | | | | | | | | | |
| Period ended | | Net asset
value,
beginning
of period | | | Net
investment
income
(loss) | | | Net gains
(losses) on
securities
(both
realized and
unrealized) | | | Total from
investment
operations | | | Dividends
(from net
investment
income) | | | Distributions
(from capital
gains) | | | Total
dividends
and
distributions | | | Net asset
value,
end
of period | | | Total
return2,3 | | | Net assets,
end of period
(in millions) | | | Ratio of
expenses to
average net
assets before
reimburse-
ments | | | Ratio of
expenses to
average net
assets after
reimburse-
ments3 | | | Ratio of
net income
(loss)
to average
net assets3 | |
| Class 529-C: | | | | | | | | | | | | | | | | | | | | | | | | | | | | | | | | | | | | | | | | | | | | | | | | | | | | |
| 9/30/2017 | | $ | 42.85 | | | $ | (.32 | ) | | $ | 7.65 | | | $ | 7.33 | | | $ | — | | | $ | — | | | $ | — | | | $ | 50.18 | | | | 17.11 | % | | $ | 314 | | | | 1.91 | % | | | 1.91 | % | | | (.70 | )% |
| 9/30/2016 | | | 41.45 | | | | (.31 | ) | | | 4.54 | | | | 4.23 | | | | — | | | | (2.83 | ) | | | (2.83 | ) | | | 42.85 | | | | 10.78 | | | | 286 | | | | 1.96 | | | | 1.96 | | | | (.78 | ) |
| 9/30/2015 | | | 45.50 | | | | (.35 | ) | | | 1.05 | | | | .70 | | | | — | | | | (4.75 | ) | | | (4.75 | ) | | | 41.45 | | | | 1.37 | | | | 274 | | | | 1.93 | | | | 1.93 | | | | (.78 | ) |
| 9/30/2014 | | | 46.27 | | | | (.40 | ) | | | 2.06 | | | | 1.66 | | | | — | | | | (2.43 | ) | | | (2.43 | ) | | | 45.50 | | | | 3.53 | | | | 280 | | | | 1.94 | | | | 1.94 | | | | (.85 | ) |
| 9/30/2013 | | | 37.20 | | | | (.29 | ) | | | 9.60 | | | | 9.31 | | | | (.24 | ) | | | — | | | | (.24 | ) | | | 46.27 | | | | 25.21 | | | | 273 | | | | 1.98 | | | | 1.98 | | | | (.70 | ) |
| Class 529-E: | | | | | | | | | | | | | | | | | | | | | | | | | | | | | | | | | | | | | | | | | | | | | | | | | | | | |
| 9/30/2017 | | | 45.53 | | | | (.06 | ) | | | 8.14 | | | | 8.08 | | | | (.04 | ) | | | — | | | | (.04 | ) | | | 53.57 | | | | 17.77 | | | | 59 | | | | 1.35 | | | | 1.35 | | | | (.13 | ) |
| 9/30/2016 | | | 43.63 | | | | (.09 | ) | | | 4.82 | | | | 4.73 | | | | — | | | | (2.83 | ) | | | (2.83 | ) | | | 45.53 | | | | 11.39 | | | | 53 | | | | 1.38 | | | | 1.38 | | | | (.21 | ) |
| 9/30/2015 | | | 47.41 | | | | (.11 | ) | | | 1.08 | | | | .97 | | | | — | | | | (4.75 | ) | | | (4.75 | ) | | | 43.63 | | | | 1.95 | | | | 49 | | | | 1.38 | | | | 1.38 | | | | (.23 | ) |
| 9/30/2014 | | | 47.87 | | | | (.14 | ) | | | 2.11 | | | | 1.97 | | | | — | | | | (2.43 | ) | | | (2.43 | ) | | | 47.41 | | | | 4.10 | | | | 49 | | | | 1.39 | | | | 1.39 | | | | (.30 | ) |
| 9/30/2013 | | | 38.45 | | | | (.06 | ) | | | 9.91 | | | | 9.85 | | | | (.43 | ) | | | — | | | | (.43 | ) | | | 47.87 | | | | 25.90 | | | | 48 | | | | 1.43 | | | | 1.43 | | | | (.15 | ) |
| Class 529-T: | | | | | | | | | | | | | | | | | | | | | | | | | | | | | | | | | | | | | | | | | | | | | | | | | | | | |
| 9/30/20174,5 | | | 49.61 | | | | .12 | | | | 5.90 | | | | 6.02 | | | | — | | | | — | | | | — | | | | 55.63 | | | | 12.13 | 6,7 | | | — | 8 | | | .45 | 6,7 | | | .45 | 6,7 | | | .22 | 6,7 |
| Class 529-F-1: | | | | | | | | | | | | | | | | | | | | | | | | | | | | | | | | | | | | | | | | | | | | | | | | | | | | |
| 9/30/2017 | | | 47.23 | | | | .15 | | | | 8.43 | | | | 8.58 | | | | (.23 | ) | | | — | | | | (.23 | ) | | | 55.58 | | | | 18.26 | | | | 113 | | | | .92 | | | | .92 | | | | .30 | |
| 9/30/2016 | | | 44.98 | | | | .09 | | | | 4.99 | | | | 5.08 | | | | — | | | | (2.83 | ) | | | (2.83 | ) | | | 47.23 | | | | 11.85 | | | | 90 | | | | .96 | | | | .96 | | | | .22 | |
| 9/30/2015 | | | 48.53 | | | | .11 | | | | 1.09 | | | | 1.20 | | | | — | | | | (4.75 | ) | | | (4.75 | ) | | | 44.98 | | | | 2.42 | | | | 83 | | | | .93 | | | | .93 | | | | .22 | |
| 9/30/2014 | | | 48.73 | | | | .08 | | | | 2.15 | | | | 2.23 | | | | — | | | | (2.43 | ) | | | (2.43 | ) | | | 48.53 | | | | 4.57 | | | | 80 | | | | .94 | | | | .94 | | | | .16 | |
| 9/30/2013 | | | 39.14 | | | | .13 | | | | 10.07 | | | | 10.20 | | | | (.61 | ) | | | — | | | | (.61 | ) | | | 48.73 | | | | 26.43 | | | | 73 | | | | .98 | | | | .98 | | | | .30 | |
| Class R-1: | | | | | | | | | | | | | | | | | | | | | | | | | | | | | | | | | | | | | | | | | | | | | | | | | | | | |
| 9/30/2017 | | | 43.34 | | | | (.29 | ) | | | 7.74 | | | | 7.45 | | | | — | | | | — | | | | — | | | | 50.79 | | | | 17.19 | | | | 30 | | | | 1.83 | | | | 1.83 | | | | (.63 | ) |
| 9/30/2016 | | | 41.85 | | | | (.28 | ) | | | 4.60 | | | | 4.32 | | | | — | | | | (2.83 | ) | | | (2.83 | ) | | | 43.34 | | | | 10.89 | | | | 33 | | | | 1.85 | | | | 1.85 | | | | (.68 | ) |
| 9/30/2015 | | | 45.85 | | | | (.31 | ) | | | 1.06 | | | | .75 | | | | — | | | | (4.75 | ) | | | (4.75 | ) | | | 41.85 | | | | 1.48 | | | | 36 | | | | 1.82 | | | | 1.82 | | | | (.68 | ) |
| 9/30/2014 | | | 46.56 | | | | (.35 | ) | | | 2.07 | | | | 1.72 | | | | — | | | | (2.43 | ) | | | (2.43 | ) | | | 45.85 | | | | 3.66 | | | | 39 | | | | 1.82 | | | | 1.82 | | | | (.74 | ) |
| 9/30/2013 | | | 37.40 | | | | (.23 | ) | | | 9.66 | | | | 9.43 | | | | (.27 | ) | | | — | | | | (.27 | ) | | | 46.56 | | | | 25.37 | | | | 42 | | | | 1.84 | | | | 1.84 | | | | (.57 | ) |
| Class R-2: | | | | | | | | | | | | | | | | | | | | | | | | | | | | | | | | | | | | | | | | | | | | | | | | | | | | |
| 9/30/2017 | | | 43.35 | | | | (.27 | ) | | | 7.74 | | | | 7.47 | | | | — | | | | — | | | | — | | | | 50.82 | | | | 17.23 | | | | 628 | | | | 1.80 | | | | 1.80 | | | | (.60 | ) |
| 9/30/2016 | | | 41.85 | | | | (.27 | ) | | | 4.60 | | | | 4.33 | | | | — | | | | (2.83 | ) | | | (2.83 | ) | | | 43.35 | | | | 10.89 | | | | 616 | | | | 1.84 | | | | 1.84 | | | | (.67 | ) |
| 9/30/2015 | | | 45.84 | | | | (.29 | ) | | | 1.05 | | | | .76 | | | | — | | | | (4.75 | ) | | | (4.75 | ) | | | 41.85 | | | | 1.53 | | | | 632 | | | | 1.79 | | | | 1.79 | | | | (.65 | ) |
| 9/30/2014 | | | 46.56 | | | | (.35 | ) | | | 2.06 | | | | 1.71 | | | | — | | | | (2.43 | ) | | | (2.43 | ) | | | 45.84 | | | | 3.64 | | | | 689 | | | | 1.83 | | | | 1.83 | | | | (.75 | ) |
| 9/30/2013 | | | 37.39 | | | | (.23 | ) | | | 9.67 | | | | 9.44 | | | | (.27 | ) | | | — | | | | (.27 | ) | | | 46.56 | | | | 25.41 | | | | 736 | | | | 1.83 | | | | 1.83 | | | | (.55 | ) |
| Class R-2E: | | | | | | | | | | | | | | | | | | | | | | | | | | | | | | | | | | | | | | | | | | | | | | | | | | | | |
| 9/30/2017 | | | 47.07 | | | | (.14 | ) | | | 8.40 | | | | 8.26 | | | | (.07 | ) | | | — | | | | (.07 | ) | | | 55.26 | | | | 17.57 | | | | 16 | | | | 1.51 | | | | 1.51 | | | | (.27 | ) |
| 9/30/2016 | | | 45.04 | | | | (.08 | ) | | | 4.94 | | | | 4.86 | | | | — | | | | (2.83 | ) | | | (2.83 | ) | | | 47.07 | | | | 11.32 | | | | 6 | | | | 1.51 | | | | 1.51 | | | | (.20 | ) |
| 9/30/2015 | | | 48.67 | | | | .01 | | | | 1.11 | | | | 1.12 | | | | — | | | | (4.75 | ) | | | (4.75 | ) | | | 45.04 | | | | 2.237 | | | | — | 8 | | | 1.26 | 7 | | | 1.26 | 7 | | | .01 | 7 |
| 9/30/20144,13 | | | 50.83 | | | | (.01 | ) | | | (2.15 | ) | | | (2.16 | ) | | | — | | | | — | | | | — | | | | 48.67 | | | | (4.25 | )6,7 | | | — | 8 | | | .08 | 6,7 | | | .08 | 6,7 | | | (.01 | )6,7 |
See page 32 for footnotes.
Financial highlights (continued)
| | | | | | Income (loss) from
investment operations1 | | | Dividends and distributions | | | | | | | | | | | | | | | | | | | |
| Period ended | | Net asset
value,
beginning
of period | | | Net
investment
income
(loss) | | | Net gains
(losses) on
securities
(both
realized and
unrealized) | | | Total from
investment
operations | | | Dividends
(from net
investment
income) | | | Distributions
(from capital
gains) | | | Total
dividends
and
distributions | | | Net asset
value,
end
of period | | | Total
return2,3 | | | Net assets,
end of period
(in millions) | | | Ratio of
expenses to
average net
assets before
reimburse-
ments | | | Ratio of
expenses to
average net
assets after
reimburse-
ments3 | | | Ratio of
net income
(loss)
to average
net assets3 | |
| Class R-3: | | | | | | | | | | | | | | | | | | | | | | | | | | | | | | | | | | | | | | | | | | | | | | | | | | | | |
| 9/30/2017 | | $ | 45.45 | | | $ | (.07 | ) | | $ | 8.13 | | | $ | 8.06 | | | $ | (.04 | ) | | $ | — | | | $ | (.04 | ) | | $ | 53.47 | | | | 17.74 | % | | $ | 844 | | | | 1.35 | % | | | 1.35 | % | | | (.14 | )% |
| 9/30/2016 | | | 43.56 | | | | (.09 | ) | | | 4.81 | | | | 4.72 | | | | — | | | | (2.83 | ) | | | (2.83 | ) | | | 45.45 | | | | 11.41 | | | | 783 | | | | 1.39 | | | | 1.39 | | | | (.22 | ) |
| 9/30/2015 | | | 47.34 | | | | (.10 | ) | | | 1.07 | | | | .97 | | | | — | | | | (4.75 | ) | | | (4.75 | ) | | | 43.56 | | | | 1.93 | | | | 776 | | | | 1.37 | | | | 1.37 | | | | (.22 | ) |
| 9/30/2014 | | | 47.79 | | | | (.14 | ) | | | 2.12 | | | | 1.98 | | | | — | | | | (2.43 | ) | | | (2.43 | ) | | | 47.34 | | | | 4.12 | | | | 811 | | | | 1.39 | | | | 1.39 | | | | (.30 | ) |
| 9/30/2013 | | | 38.39 | | | | (.05 | ) | | | 9.89 | | | | 9.84 | | | | (.44 | ) | | | — | | | | (.44 | ) | | | 47.79 | | | | 25.90 | | | | 836 | | | | 1.40 | | | | 1.40 | | | | (.12 | ) |
| Class R-4: | | | | | | | | | | | | | | | | | | | | | | | | | | | | | | | | | | | | | | | | | | | | | | | | | | | | |
| 9/30/2017 | | | 46.89 | | | | .08 | | | | 8.38 | | | | 8.46 | | | | (.17 | ) | | | — | | | | (.17 | ) | | | 55.18 | | | | 18.12 | | | | 865 | | | | 1.05 | | | | 1.05 | | | | .17 | |
| 9/30/2016 | | | 44.71 | | | | .04 | | | | 4.97 | | | | 5.01 | | | | — | | | | (2.83 | ) | | | (2.83 | ) | | | 46.89 | | | | 11.76 | | | | 764 | | | | 1.07 | | | | 1.07 | | | | .10 | |
| 9/30/2015 | | | 48.33 | | | | .05 | | | | 1.08 | | | | 1.13 | | | | — | | | | (4.75 | ) | | | (4.75 | ) | | | 44.71 | | | | 2.27 | | | | 715 | | | | 1.05 | | | | 1.05 | | | | .10 | |
| 9/30/2014 | | | 48.59 | | | | .02 | | | | 2.15 | | | | 2.17 | | | | — | | | | (2.43 | ) | | | (2.43 | ) | | | 48.33 | | | | 4.46 | | | | 727 | | | | 1.06 | | | | 1.06 | | | | .03 | |
| 9/30/2013 | | | 39.03 | | | | .09 | | | | 10.04 | | | | 10.13 | | | | (.57 | ) | | | — | | | | (.57 | ) | | | 48.59 | | | | 26.31 | | | | 712 | | | | 1.07 | | | | 1.07 | | | | .21 | |
| Class R-5E: | | | | | | | | | | | | | | | | | | | | | | | | | | | | | | | | | | | | | | | | | | | | | | | | | | | | |
| 9/30/2017 | | | 47.30 | | | | .18 | | | | 8.42 | | | | 8.60 | | | | (.35 | ) | | | — | | | | (.35 | ) | | | 55.55 | | | | 18.33 | | | | 12 | | | | .84 | | | | .84 | | | | .36 | |
| 9/30/20164,14 | | | 47.09 | | | | .12 | | | | 2.92 | | | | 3.04 | | | | — | | | | (2.83 | ) | | | (2.83 | ) | | | 47.30 | | | | 7.01 | 6 | | | — | 8 | | | .96 | 10 | | | .95 | 10 | | | .32 | 10 |
| Class R-5: | | | | | | | | | | | | | | | | | | | | | | | | | | | | | | | | | | | | | | | | | | | | | | | | | | | | |
| 9/30/2017 | | | 48.40 | | | | .24 | | | | 8.64 | | | | 8.88 | | | | (.29 | ) | | | — | | | | (.29 | ) | | | 56.99 | | | | 18.48 | | | | 424 | | | | .75 | | | | .75 | | | | .47 | |
| 9/30/2016 | | | 45.94 | | | | .18 | | | | 5.11 | | | | 5.29 | | | | — | | | | (2.83 | ) | | | (2.83 | ) | | | 48.40 | | | | 12.09 | | | | 359 | | | | .77 | | | | .77 | | | | .41 | |
| 9/30/2015 | | | 49.39 | | | | .20 | | | | 1.10 | | | | 1.30 | | | | — | | | | (4.75 | ) | | | (4.75 | ) | | | 45.94 | | | | 2.57 | | | | 474 | | | | .75 | | | | .75 | | | | .40 | |
| 9/30/2014 | | | 49.46 | | | | .15 | | | | 2.21 | | | | 2.36 | | | | — | | | | (2.43 | ) | | | (2.43 | ) | | | 49.39 | | | | 4.78 | | | | 452 | | | | .76 | | | | .76 | | | | .29 | |
| 9/30/2013 | | | 39.71 | | | | .22 | | | | 10.22 | | | | 10.44 | | | | (.69 | ) | | | — | | | | (.69 | ) | | | 49.46 | | | | 26.72 | | | | 550 | | | | .77 | | | | .77 | | | | .51 | |
| Class R-6: | | | | | | | | | | | | | | | | | | | | | | | | | | | | | | | | | | | | | | | | | | | | | | | | | | | | |
| 9/30/2017 | | | 47.93 | | | | .26 | | | | 8.54 | | | | 8.80 | | | | (.33 | ) | | | — | | | | (.33 | ) | | | 56.40 | | | | 18.51 | | | | 5,289 | | | | .70 | | | | .70 | | | | .51 | |
| 9/30/2016 | | | 45.49 | | | | .21 | | | | 5.06 | | | | 5.27 | | | | — | | | | (2.83 | ) | | | (2.83 | ) | | | 47.93 | | | | 12.15 | | | | 3,403 | | | | .71 | | | | .71 | | | | .48 | |
| 9/30/2015 | | | 48.93 | | | | .22 | | | | 1.09 | | | | 1.31 | | | | — | | | | (4.75 | ) | | | (4.75 | ) | | | 45.49 | | | | 2.63 | | | | 2,269 | | | | .71 | | | | .71 | | | | .45 | |
| 9/30/2014 | | | 49.00 | | | | .21 | | | | 2.15 | | | | 2.36 | | | | — | | | | (2.43 | ) | | | (2.43 | ) | | | 48.93 | | | | 4.82 | | | | 1,859 | | | | .71 | | | | .71 | | | | .41 | |
| 9/30/2013 | | | 39.34 | | | | .25 | | | | 10.12 | | | | 10.37 | | | | (.71 | ) | | | — | | | | (.71 | ) | | | 49.00 | | | | 26.80 | | | | 1,206 | | | | .72 | | | | .72 | | | | .57 | |
| | Year ended September 30 |
| | 2017 | 2016 | 2015 | 2014 | 2013 |
| Portfolio turnover rate for all share classes | 32% | 29% | 33% | 38% | 37% |
| 1 | Based on average shares outstanding. |
| 2 | Total returns exclude any applicable sales charges, including contingent deferred sales charges. |
| 3 | This column reflects the impact, if any, of certain reimbursements from CRMC. During one of the periods shown, CRMC paid a portion of the fund’s transfer agent fees for certain retirement plan share classes. |
| 4 | Based on operations for the period shown and, accordingly, is not representative of a full year. |
| 5 | Class T and 529-T shares began investment operations on April 7, 2017. |
| 6 | Not annualized. |
| 7 | All or a significant portion of assets in this class consisted of seed capital invested by CRMC and/or its affiliates. Fees for distribution services are not charged or accrued on these seed capital assets. If such fees were paid by the fund on seed capital assets, fund expenses would have been higher and net income and total return would have been lower. |
| 8 | Amount less than $1 million. |
| 9 | Class F-3 shares began investment operations on January 27, 2017. |
| 10 | Annualized. |
| 11 | Amount less than $.01. |
| 12 | Amount less than .01%. |
| 13 | Class R-2E shares began investment operations on August 29, 2014. |
| 14 | Class R-5E shares began investment operations on November 20, 2015. |
See Notes to Financial Statements
Report of Independent Registered Public Accounting Firm
To the Shareholders and Board of Directors of SMALLCAP World Fund, Inc.:
We have audited the accompanying statement of assets and liabilities of SMALLCAP World Fund, Inc. (the “Fund”), including the summary investment portfolio, as of September 30, 2017, and the related statement of operations for the year then ended, the statements of changes in net assets for each of the two years in the period then ended, and the financial highlights for each of the periods presented. These financial statements and financial highlights are the responsibility of the Fund’s management. Our responsibility is to express an opinion on these financial statements and financial highlights based on our audits.
We conducted our audits in accordance with the standards of the Public Company Accounting Oversight Board (United States). Those standards require that we plan and perform the audit to obtain reasonable assurance about whether the financial statements and financial highlights are free of material misstatement. The Fund is not required to have, nor were we engaged to perform, an audit of its internal control over financial reporting. Our audits included consideration of internal control over financial reporting as a basis for designing audit procedures that are appropriate in the circumstances, but not for the purpose of expressing an opinion on the effectiveness of the Fund’s internal control over financial reporting. Accordingly, we express no such opinion. An audit also includes examining, on a test basis, evidence supporting the amounts and disclosures in the financial statements, assessing the accounting principles used and significant estimates made by management, as well as evaluating the overall financial statement presentation. Our procedures included confirmation of securities owned as of September 30, 2017, by correspondence with the custodian and brokers; where replies were not received from brokers, we performed other auditing procedures. We believe that our audits provide a reasonable basis for our opinion.
In our opinion, such financial statements and financial highlights referred to above present fairly, in all material respects, the financial position of SMALLCAP World Fund, Inc. as of September 30, 2017, the results of its operations for the year then ended, the changes in its net assets for each of the two years in the period then ended, and the financial highlights for each of the periods presented, in conformity with accounting principles generally accepted in the United States of America.
Deloitte & Touche LLP
Costa Mesa, California
November 10, 2017
As a fund shareholder, you incur two types of costs: (1) transaction costs, such as initial sales charges on purchase payments and contingent deferred sales charges on redemptions (loads), and (2) ongoing costs, including management fees, distribution and service (12b-1) fees, and other expenses. This example is intended to help you understand your ongoing costs (in dollars) of investing in the fund so you can compare these costs with the ongoing costs of investing in other mutual funds. The example is based on an investment of $1,000 invested at the beginning of the period and held for the entire six-month period (April 1, 2017, through September 30, 2017).
Actual expenses:
The first line of each share class in the table on the following page provides information about actual account values and actual expenses. You may use the information in this line, together with the amount you invested, to estimate the expenses that you paid over the period. Simply divide your account value by $1,000 (for example, an $8,600 account value divided by $1,000 = 8.6), then multiply the result by the number in the first line under the heading titled “Expenses paid during period” to estimate the expenses you paid on your account during this period.
Hypothetical example for comparison purposes:
The second line of each share class in the table on the following page provides information about hypothetical account values and hypothetical expenses based on the actual expense ratio for the share class and an assumed rate of return of 5.00% per year before expenses, which is not the actual return of the share class. The hypothetical account values and expenses may not be used to estimate the actual ending account balance or expenses you paid for the period. You may use this information to compare the ongoing costs of investing in the fund and other funds. To do so, compare this 5.00% hypothetical example with the 5.00% hypothetical examples that appear in the shareholder reports of the other funds.
Notes:
Retirement plan participants may be subject to certain fees charged by the plan sponsor, and Class F-1, F-2, F-3 and 529-F-1 shareholders may be subject to fees charged by financial intermediaries, typically ranging from 0.75% to 1.50% of assets annually depending on services offered. You can estimate the impact of these fees by adding the amount of the fees to the total estimated expenses you paid on your account during the period as calculated above. In addition, your ending account value would be lower by the amount of these fees.
Note that the expenses shown in the table on the following page are meant to highlight your ongoing costs only and do not reflect any transactional costs, such as sales charges (loads). Therefore, the second line of each share class in the table is useful in comparing ongoing costs only and will not help you determine the relative total costs of owning different funds. In addition, if these transactional costs were included, your costs would have been higher.
| | | Beginning
account value
4/1/2017 | | | Ending
account value
9/30/2017 | | | Expenses paid
during period* | | | Annualized
expense ratio | |
| Class A – actual return | | $ | 1,000.00 | | | $ | 1,115.11 | | | $ | 5.62 | | | | 1.06 | % |
| Class A – assumed 5% return | | | 1,000.00 | | | | 1,019.75 | | | | 5.37 | | | | 1.06 | |
| Class C – actual return | | | 1,000.00 | | | | 1,110.88 | | | | 9.79 | | | | 1.85 | |
| Class C – assumed 5% return | | | 1,000.00 | | | | 1,015.79 | | | | 9.35 | | | | 1.85 | |
| Class T – actual return† | | | 1,000.00 | | | | 1,121.54 | | | | 4.50 | | | | .88 | |
| Class T – assumed 5% return† | | | 1,000.00 | | | | 1,020.66 | | | | 4.46 | | | | .88 | |
| Class F-1 – actual return | | | 1,000.00 | | | | 1,114.96 | | | | 5.83 | | | | 1.10 | |
| Class F-1 – assumed 5% return | | | 1,000.00 | | | | 1,019.55 | | | | 5.57 | | | | 1.10 | |
| Class F-2 – actual return | | | 1,000.00 | | | | 1,116.53 | | | | 4.30 | | | | .81 | |
| Class F-2 – assumed 5% return | | | 1,000.00 | | | | 1,021.01 | | | | 4.10 | | | | .81 | |
| Class F-3 – actual return | | | 1,000.00 | | | | 1,117.25 | | | | 3.77 | | | | .71 | |
| Class F-3 – assumed 5% return | | | 1,000.00 | | | | 1,021.51 | | | | 3.60 | | | | .71 | |
| Class 529-A – actual return | | | 1,000.00 | | | | 1,114.94 | | | | 5.94 | | | | 1.12 | |
| Class 529-A – assumed 5% return | | | 1,000.00 | | | | 1,019.45 | | | | 5.67 | | | | 1.12 | |
| Class 529-C – actual return | | | 1,000.00 | | | | 1,110.43 | | | | 10.05 | | | | 1.90 | |
| Class 529-C – assumed 5% return | | | 1,000.00 | | | | 1,015.54 | | | | 9.60 | | | | 1.90 | |
| Class 529-E – actual return | | | 1,000.00 | | | | 1,113.72 | | | | 7.10 | | | | 1.34 | |
| Class 529-E – assumed 5% return | | | 1,000.00 | | | | 1,018.35 | | | | 6.78 | | | | 1.34 | |
| Class 529-T – actual return† | | | 1,000.00 | | | | 1,121.33 | | | | 4.76 | | | | .93 | |
| Class 529-T – assumed 5% return† | | | 1,000.00 | | | | 1,020.41 | | | | 4.71 | | | | .93 | |
| Class 529-F-1 – actual return | | | 1,000.00 | | | | 1,116.05 | | | | 4.77 | | | | .90 | |
| Class 529-F-1 – assumed 5% return | | | 1,000.00 | | | | 1,020.56 | | | | 4.56 | | | | .90 | |
| Class R-1 – actual return | | | 1,000.00 | | | | 1,110.88 | | | | 9.68 | | | | 1.83 | |
| Class R-1 – assumed 5% return | | | 1,000.00 | | | | 1,015.89 | | | | 9.25 | | | | 1.83 | |
| Class R-2 – actual return | | | 1,000.00 | | | | 1,111.08 | | | | 9.47 | | | | 1.79 | |
| Class R-2 – assumed 5% return | | | 1,000.00 | | | | 1,016.09 | | | | 9.05 | | | | 1.79 | |
| Class R-2E – actual return | | | 1,000.00 | | | | 1,112.77 | | | | 7.94 | | | | 1.50 | |
| Class R-2E – assumed 5% return | | | 1,000.00 | | | | 1,017.55 | | | | 7.59 | | | | 1.50 | |
| Class R-3 – actual return | | | 1,000.00 | | | | 1,113.51 | | | | 7.15 | | | | 1.35 | |
| Class R-3 – assumed 5% return | | | 1,000.00 | | | | 1,018.30 | | | | 6.83 | | | | 1.35 | |
| Class R-4 – actual return | | | 1,000.00 | | | | 1,115.19 | | | | 5.57 | | | | 1.05 | |
| Class R-4 – assumed 5% return | | | 1,000.00 | | | | 1,019.80 | | | | 5.32 | | | | 1.05 | |
| Class R-5E – actual return | | | 1,000.00 | | | | 1,116.61 | | | | 4.30 | | | | .81 | |
| Class R-5E – assumed 5% return | | | 1,000.00 | | | | 1,021.01 | | | | 4.10 | | | | .81 | |
| Class R-5 – actual return | | | 1,000.00 | | | | 1,117.00 | | | | 3.98 | | | | .75 | |
| Class R-5 – assumed 5% return | | | 1,000.00 | | | | 1,021.31 | | | | 3.80 | | | | .75 | |
| Class R-6 – actual return | | | 1,000.00 | | | | 1,117.06 | | | | 3.72 | | | | .70 | |
| Class R-6 – assumed 5% return | | | 1,000.00 | | | | 1,021.56 | | | | 3.55 | | | | .70 | |
| * | The “expenses paid during period” are equal to the “annualized expense ratio,” multiplied by the average account value over the period, multiplied by the number of days in the period, and divided by 365 (to reflect the one-half year period). |
| † | The period for the “annualized expense ratio” and “actual return” line is based on the number of days since the share class began investment operations on April 7, 2017. The “assumed 5% return” line is based on 183 days. |
We are required to advise you of the federal tax status of certain distributions received by shareholders during the fiscal year. The fund hereby designates the following amounts for the fund’s fiscal year ended September 30, 2017:
| | Foreign taxes | | | $0.04 per share | |
| | Foreign source income | | | $0.45 per share | |
| | Long-term capital gains | | | $48,821,000 | |
| | Qualified dividend income | | | 100% | |
| | Corporate dividends received deduction | | | $131,734,000 | |
| | U.S. government income that may be exempt from state taxation | | | $812,000 | |
Individual shareholders should refer to their Form 1099 or other tax information, which will be mailed in January 2018, to determine the calendar year amounts to be included on their 2017 tax returns. Shareholders should consult their tax advisors.
Approval of Investment Advisory and Service Agreement
The SMALLCAP World Fund, Inc. board has approved the fund’s Investment Advisory and Service Agreement (the “agreement”) with Capital Research and Management Company (“CRMC”) for an additional one-year term through November 30, 2018. The agreement was amended to add an additional advisory fee breakpoint if and when the fund’s net assets exceed $34 billion. The board approved the agreement following the recommendation of the fund’s Contracts Committee (the “committee”), which is composed of all of the fund’s independent board members. The board and the committee determined that the fund’s advisory fee structure was fair and reasonable in relation to the services provided, and that approving the agreement was in the best interests of the fund and its shareholders.
In reaching this decision, the board and the committee took into account information furnished to them throughout the year and otherwise provided to them, as well as information prepared specifically in connection with their review of the agreement, and were advised by their independent counsel. They considered the following factors, among others, but did not identify any single issue or particular piece of information that, in isolation, was the controlling factor, and each board and committee member did not necessarily attribute the same weight to each factor.
1. Nature, extent and quality of services
The board and the committee considered the depth and quality of CRMC’s investment management process, including its global research capabilities; the experience, capability and integrity of its senior management and other personnel; the low turnover rates of its key personnel; the overall financial strength and stability of CRMC and the Capital Group organization; and the ongoing evolution of CRMC’s organizational structure designed to maintain and strengthen these qualities. The board and the committee also considered the nature, extent and quality of administrative, compliance and shareholder services provided by CRMC to the fund under the agreement and other agreements, as well as the benefits to fund shareholders from investing in a fund that is part of a large family of funds. The board and the committee concluded that the nature, extent and quality of the services provided by CRMC have benefited and should continue to benefit the fund and its shareholders.
2. Investment results
The board and the committee considered the investment results of the fund in light of its objective to provide long-term growth of capital. They compared the fund’s investment results with those of other funds (including funds that currently form the basis of the Lipper index for the category in which the fund is included), and data such as relevant market and fund indexes, over various periods through February 28, 2017. This report, including the letter to shareholders and related disclosures, contains certain information about the fund’s investment results. The board and the committee reviewed the fund’s investment results measured against various indexes and an average, including the MSCI All Country World Small Cap Index, Lipper Global Small-/Mid-Cap Funds Index and Lipper Global Small-/Mid-Cap Funds Average. They noted that the investment results of the fund were generally in line with the results of these indexes and this average for the lifetime period, 20-year period, 10-year period, and five-year period (where data comparisons are available), while recognizing that none of the indexes/average is a perfect comparison given the Fund’s distinguishing characteristics. The board and the committee concluded that the fund’s investment results have been satisfactory for renewal of the agreement and that CRMC’s record in managing the fund indicated that its continued management should benefit the fund and its shareholders.
3. Advisory fees and total expenses
The board and the committee compared the advisory fees and total expense levels of the fund to those of other relevant funds. They observed that the fund’s advisory fees and expenses generally compared favorably to those of other similar funds included in the Lipper Global Small-/Mid-Cap Funds category. The board and the committee also considered the breakpoint discounts in the fund’s advisory fee structure that reduce the level of fees charged by CRMC to the fund as fund assets increase. In addition, they reviewed information regarding the effective advisory fees charged to non-mutual fund clients by CRMC and its affiliates. They noted that, to the extent there were differences between the advisory fees paid by the fund and the advisory fees paid by those clients, the differences appropriately reflected the investment, operational, regulatory and market differences between advising the fund and the other clients. The board and the committee concluded that the fund’s cost structure was fair and reasonable in relation to the services provided, and that the fund’s shareholders receive reasonable value in return for the advisory fees and other amounts paid to CRMC by the fund.
4. Ancillary benefits
The board and the committee considered a variety of other benefits that CRMC and its affiliates receive as a result of CRMC’s relationship with the fund and the other American Funds, including fees for administrative services provided to certain share classes; fees paid to CRMC’s affiliated transfer agent; sales charges and distribution fees received and retained by the fund’s principal underwriter, an affiliate of CRMC; and possible ancillary benefits to CRMC and its institutional management affiliates in managing other investment vehicles. The board and the committee reviewed CRMC’s portfolio trading practices, noting the benefits CRMC receives from the research obtained with commissions from portfolio transactions made on behalf of the fund. The board and the committee took these ancillary benefits into account in evaluating the reasonableness of the advisory fees and other amounts paid to CRMC by the fund.
5. Adviser financial information
The board and the committee reviewed information regarding CRMC’s costs of providing services to the American Funds, including personnel, systems and resources of investment, compliance, trading, accounting and other administrative operations. They considered CRMC’s costs and related cost allocation methodology as well as its willingness to invest in technology, infrastructure and staff to maintain and expand services and capabilities, respond to industry and regulatory developments, and attract and retain qualified personnel. They noted information regarding the compensation structure for CRMC’s investment professionals. The board and the committee also compared CRMC’s profitability and compensation data to the reported results and data of several large, publicly held investment management companies. The board and the committee noted the competitiveness and cyclicality of both the mutual fund industry and the capital markets, as well as the importance in that environment of CRMC’s long-term profitability for maintaining its independence, company culture and management continuity. They further considered the breakpoint discounts in the fund’s advisory fee structure. The board and the committee concluded that the fund’s advisory fee structure reflected a reasonable sharing of benefits between CRMC and the fund’s shareholders.
This page was intentionally left blank.
This page was intentionally left blank.
This page was intentionally left blank.
Board of directors and other officers
Independent directors1
| Name and year of birth | | Year first
elected
a director
of the fund2 | | Principal occupation(s) during past five years | | Number of
portfolios in fund
complex overseen
by director3 | | Other directorships4
held by director |
| Ronald P. Badie, 1942 | | 2010 | | Retired; former Vice Chairman, Deutsche Bank Alex. Brown (retired 2002) | | 3 | | Amphenol Corporation; Nautilus, Inc. |
| Joseph C. Berenato, 1946 | | 2000 | | Former Chairman and CEO, Ducommun Incorporated (aerospace components manufacturer) | | 16 | | None |
| Louise H. Bryson, 1944 | | 2010 | | Chair Emerita of the Board of Trustees, J. Paul Getty Trust; former President, Distribution, Lifetime Entertainment Network (retired 2008); former Executive Vice President and General Manager, Lifetime Movie Network (retired 2008) | | 7 | | None |
Mary Anne Dolan, 1947
Chairman of the Board (Independent and Non-Executive) | | 2008 | | Founder and President, MAD Ink (communications company) former Editor-in-Chief, The Los Angeles Herald Examiner (retired 1989) | | 10 | | None |
| John G. Freund, 1953 | | 2000 | | Founder and Managing Director, Skyline Ventures (a venture capital investor in health care companies) | | 6 | | Collegium Pharmaceutical, Inc.; Proteon Therapeutics, Inc.; Tetraphase Pharmaceuticals, Inc. |
| Linda Griego, 1947 | | 2015 | | President and CEO, Griego Enterprises, Inc. (business management company) | | 7 | | AECOM Technology Corporation; CBS Corporation |
| Leonade D. Jones, 1947 | | 1995 | | Retired; former Treasurer, The Washington Post Company (retired 1996) | | 10 | | None |
| William H. Kling, 1942 | | 1990 | | President Emeritus and former CEO, American Public Media | | 10 | | None |
| Sharon Meers, 1965 | | 2017 | | Former Senior Director, Head of Strategic Partnerships, eBay Enterprise | | 3 | | None |
| Kenneth M. Simril, 1965 | | 2016 | | President and CEO, SCI Ingredients Holding, Inc. (food manufacturing) | | 3 | | None |
| Christopher E. Stone, 1956 | | 2007 | | President, Open Society Foundations; former Professor of the Practice of Criminal Justice, John F. Kennedy School of Government, Harvard University | | 6 | | None |
Robert J. Denison retired from the fund on December 31, 2016. The directors thank Mr. Denison for his wise counsel, outstanding service and dedication to the fund.
Interested directors5,6
| Name, year of birth and position with fund | | Year first
elected
a director
or officer
of the fund2 | | Principal occupation(s) during past five years
and positions held with affiliated entities or
the principal underwriter of the fund | | Number of
portfolios in fund
complex overseen
by director3 | | Other directorships4
held by director |
Jonathan Knowles, PhD, 1961
Vice Chairman of the Board | | 2000 | | Partner — Capital World Investors, Capital International, Inc.;7 Director, The Capital Group Companies, Inc.7 | | 1 | | None |
| Gregory W. Wendt, 1961 President | | 1992 | | Partner — Capital Research Global Investors, Capital Research and Management Company | | 1 | | None |
The fund’s statement of additional information includes further details about fund directors and is available without charge upon request by calling American Funds Service Company at (800) 421-4225 or by visiting the American Funds website at americanfunds.com. The address for all directors and officers of the fund is 333 South Hope Street, Los Angeles, CA 90071, Attention: Secretary.
Other officers6
Name, year of birth and
position with fund | | Year first
elected
an officer
of the fund2 | | Principal occupation(s) during past five years and positions held with affiliated entities
or the principal underwriter of the fund |
Paul F. Roye, 1953
Executive Vice President | | 2007 | | Director, Capital Research and Management Company; Senior Vice President and Senior Counsel — Fund Business Management Group, Capital Research and Management Company |
Brady L. Enright, 1967
Senior Vice President | | 2004 | | Partner — Capital World Investors, Capital Research and Management Company |
J. Blair Frank, 1966
Senior Vice President | | 1999 | | Partner — Capital Research Global Investors, Capital Research and Management Company |
Lawrence Kymisis, 1970
Senior Vice President | | 2008 | | Partner — Capital Research Global Investors, Capital Research Company7 |
Julian N. Abdey, 1972
Vice President | | 2014 | | Partner — Capital World Investors, Capital Research and Management Company |
Walter R. Burkley, 1966
Vice President | | 2007 | | Senior Vice President and Senior Counsel — Fund Business Management Group, Capital Research and Management Company; Director, Capital Research Company7 |
Bradford F. Freer, 1969
Vice President | | 2008 | | Partner — Capital World Investors, Capital Research and Management Company |
Aidan W. O’Connell, 1968
Vice President | | 2017 | | Partner — Capital Research Global Investors, Capital Research and Management Company |
Michael W. Stockton, 1967
Secretary | | 2014 | | Vice President — Fund Business Management Group, Capital Research and Management Company |
Brian D. Bullard, 1969
Treasurer | | 2016 | | Senior Vice President — Investment Operations, Capital Research and Management Company |
Julie E. Lawton, 1973
Assistant Secretary | | 2010 | | Assistant Vice President — Fund Business Management Group, Capital Research and Management Company; Secretary, Capital Research Company7 |
Brian C. Janssen, 1972
Assistant Treasurer | | 2016 | | Vice President — Investment Operations, Capital Research and Management Company |
Dori Laskin, 1951
Assistant Treasurer | | 2011 | | Vice President — Investment Operations, Capital Research and Management Company |
| | 1 | The term independent director refers to a director who is not an “interested person” of the fund within the meaning of the Investment Company Act of 1940. |
| | 2 | Directors and officers of the fund serve until their resignation, removal or retirement. |
| | 3 | Funds managed by Capital Research and Management Company or its affiliates. |
| | 4 | This includes all directorships/trusteeships (other than those in the American Funds or other funds managed by Capital Research and Management Company or its affiliates) that are held by each trustee as a trustee or director of a public company or a registered investment company. |
| | 5 | The term interested trustee refers to a trustee who is an “interested person” within the meaning of the Investment Company Act of 1940, on the basis of their affiliation with the fund’s investment adviser, Capital Research and Management Company, or affiliated entities (including the fund’s principal underwriter). |
| | 6 | All of the directors and/or officers listed, with the exception of Julian N. Abdey, J. Blair Frank and Lawrence Kymisis, are officers and/or directors/trustees of one or more of the other funds for which Capital Research and Management Company serves as investment adviser. |
| | 7 | Company affiliated with Capital Research and Management Company. |
Offices of the fund and of the investment adviser
Capital Research and Management Company
333 South Hope Street
Los Angeles, CA 90071-1406
6455 Irvine Center Drive
Irvine, CA 92618-4518
Transfer agent for shareholder accounts
American Funds Service Company
(Write to the address near you.)
P.O. Box 6007
Indianapolis, IN 46206-6007
P.O. Box 2280
Norfolk, VA 23501-2280
Custodian of assets
State Street Bank and Trust Company
One Lincoln Street
Boston, MA 02111
Counsel
Dechert LLP
One Bush Street, Suite 1600
San Francisco, CA 94104-4446
Independent registered public accounting firm
Deloitte & Touche LLP
695 Town Center Drive
Suite 1200
Costa Mesa, CA 92626-7188
Principal underwriter
American Funds Distributors, Inc.
333 South Hope Street
Los Angeles, CA 90071-1406
Investors should carefully consider investment objectives, risks, charges and expenses. This and other important information is contained in the fund prospectus and summary prospectus, which can be obtained from your financial professional and should be read carefully before investing. You may also call American Funds Service Company (AFS) at (800) 421-4225 or visit the American Funds website at americanfunds.com. Fund shares offered through American Funds Distributors, Inc.
“American Funds Proxy Voting Procedures and Principles” — which describes how we vote proxies relating to portfolio securities — is available on the American Funds website or upon request by calling AFS. The fund files its proxy voting record with the U.S. Securities and Exchange Commission (SEC) for the 12 months ended June 30 by August 31. The proxy voting record is available free of charge on the SEC website at sec.gov and on the American Funds website.
A complete September 30, 2017, portfolio of SMALLCAP World Fund’s investments is available free of charge by calling AFS or visiting the SEC website (where it is part of Form N-CSR).
SMALLCAP World Fund files a complete list of its portfolio holdings with the SEC for the first and third quarters of each fiscal year on Form N-Q. This filing is available free of charge on the SEC website. You may also review or, for a fee, copy this filing at the SEC’s Public Reference Room in Washington, D.C. Additional information regarding the operation of the Public Reference Room may be obtained by calling the SEC’s Office of Investor Education and Advocacy at (800) SEC-0330. Additionally, the list of portfolio holdings is available by calling AFS.
This report is for the information of shareholders of SMALLCAP World Fund, but it also may be used as sales literature when preceded or accompanied by the current prospectus or summary prospectus, which gives details about charges, expenses, investment objectives and operating policies of the fund. If used as sales material after December 31, 2017, this report must be accompanied by an American Funds statistical update for the most recently completed calendar quarter.
MSCI has not approved, reviewed or produced this report, makes no express or implied warranties or representations and is not liable whatsoever for any data in the report. You may not redistribute the MSCI data or use it as a basis for other indices or investment products.
Standard & Poor’s 500 Composite Index (“Index”) is a product of S&P Dow Jones Indices LLC and/or its affiliates and has been licensed for use by Capital Group. Copyright © 2017 S&P Dow Jones Indices LLC, a division of S&P Global, and/or its affiliates. All rights reserved. Redistribution or reproduction in whole or in part are prohibited without written permission of S&P Dow Jones Indices LLC.
American Funds from Capital Group
The Capital AdvantageSM
Since 1931, American Funds, part of Capital Group, has helped investors pursue long-term investment success. Our consistent approach — in combination with The Capital SystemSM — has resulted in a superior long-term track record.
| | Aligned with investor success |
| | We base our decisions on a long-term perspective, which we believe aligns our goals with the interests of our clients. Our portfolio managers average 27 years of investment experience, including 21 years at our company, reflecting a career commitment to our long-term approach.1 |
| | |
| | The Capital System |
| | The Capital System combines individual accountability with teamwork. Funds using The Capital System are divided into portions that are managed independently by investment professionals with diverse backgrounds, ages and investment approaches. An extensive global research effort is the backbone of our system. |
| | |
| | American Funds’ superior long-term track record |
| | Equity funds have beaten their Lipper peer indexes in 93% of 10-year periods and 98% of 20-year periods. Fixed income funds have beaten their Lipper indexes in 80% of 10-year periods and 80% of 20-year periods.2 Fund management fees have been among the lowest in the industry.3 |
| | 1 | Portfolio manager experience as of December 31, 2016. |
| | 2 | Based on Class F-2 share results for rolling periods through December 31, 2016. Periods covered are the shorter of the fund’s lifetime or since the comparable Lipper index inception date (except Capital Income Builder and SMALLCAP World Fund, for which the Lipper average was used). Expenses differ for each share class, so results will vary. Class F-2 shares were first offered on August 1, 2008. Class F-2 share results prior to the date of first sale are hypothetical based on Class A share results without a sales charge, adjusted for typical estimated expenses. Results for certain funds with an inception date after August 1, 2008, also include hypothetical returns because those funds’ Class F-2 shares sold after the funds’ date of first offering. Please see americanfunds.com for more information on specific expense adjustments and the actual dates of first sale. |
| | 3 | On average, our management fees were in the lowest quintile 73% of the time, based on the 20-year period ended December 31, 2016, versus comparable Lipper categories, excluding funds of funds. |

ITEM 2 – Code of Ethics
The Registrant has adopted a Code of Ethics that applies to its Principal Executive Officer and Principal Financial Officer. The Registrant undertakes to provide to any person without charge, upon request, a copy of the Code of Ethics. Such request can be made to American Funds Service Company at 800/421-9225 or to the Secretary of the Registrant, 6455 Irvine Center Drive, Irvine, California 92618.
ITEM 3 – Audit Committee Financial Expert
The Registrant’s board has determined that Ronald P. Badie, a member of the Registrant’s audit committee, is an “audit committee financial expert” and "independent," as such terms are defined in this Item. This designation will not increase the designee’s duties, obligations or liability as compared to his or her duties, obligations and liability as a member of the audit committee and of the board, nor will it reduce the responsibility of the other audit committee members. There may be other individuals who, through education or experience, would qualify as "audit committee financial experts" if the board had designated them as such. Most importantly, the board believes each member of the audit committee contributes significantly to the effective oversight of the Registrant’s financial statements and condition.
ITEM 4 – Principal Accountant Fees and Services
| Registrant: | |
| a) Audit Fees: |
| | 2016 | $169,000 |
| | 2017 | $167,000 |
| | |
| b) Audit-Related Fees: |
| | 2016 | $9,000 |
| | 2017 | $7,000 |
| | |
| c) Tax Fees: |
| | 2016 | $56,000 |
| | 2017 | $27,000 |
| | The tax fees consist of professional services relating to the preparation of the Registrant’s tax returns. |
| | |
| d) All Other Fees: |
| | 2016 | None |
| | 2017 | None |
| | |
| | Adviser and affiliates (includes only fees for non-audit services billed to the adviser and affiliates for engagements that relate directly to the operations and financial reporting of the Registrant and were subject to the pre-approval policies described below): |
| a) Audit Fees: |
| | Not Applicable |
| | |
| b) Audit-Related Fees: |
| | 2016 | $1,169,000 |
| | 2017 | $1,161,000 |
| | The audit-related fees consist of assurance and related services relating to the examination of the Registrant’s transfer agent, principal underwriter and investment adviser conducted in accordance with Statement on Standards for Attestation Engagements Number 16 issued by the American Institute of Certified Public Accountants. |
| | |
| c) Tax Fees: |
| | 2016 | None |
| | 2017 | None |
| | The tax fees consist of consulting services relating to the Registrant’s investments. |
| | | |
| | | |
| d) All Other Fees: |
| | 2016 | $3,000 |
| | 2017 | None |
| | The other fees consist of subscription services related to an accounting research tool. |
| | |
| | | |
| | All audit and permissible non-audit services that the Registrant’s audit committee considers compatible with maintaining the independent registered public accounting firm’s independence are required to be pre-approved by the committee. The pre-approval requirement will extend to all non-audit services provided to the Registrant, the investment adviser, and any entity controlling, controlled by, or under common control with the investment adviser that provides ongoing services to the Registrant, if the engagement relates directly to the operations and financial reporting of the Registrant. The committee will not delegate its responsibility to pre-approve these services to the investment adviser. The committee may delegate to one or more committee members the authority to review and pre-approve audit and permissible non-audit services. Actions taken under any such delegation will be reported to the full committee at its next meeting. The pre-approval requirement is waived with respect to non-audit services if certain conditions are met. The pre-approval requirement was not waived for any of the non-audit services listed above provided to the Registrant, adviser and affiliates. |
| | | |
| | Aggregate non-audit fees paid to the Registrant’s auditors, including fees for all services billed to the Registrant, adviser and affiliates that provide ongoing services to the Registrant, were $1,286,000 for fiscal year 2016 and $1,387,000 for fiscal year 2017. The non-audit services represented by these amounts were brought to the attention of the committee and considered to be compatible with maintaining the auditors’ independence. |
All audit and permissible non-audit services that the Registrant’s audit committee considers compatible with maintaining the independent registered public accounting firm’s independence are required to be pre-approved by the committee. The pre-approval requirement will extend to all non-audit services provided to the Registrant, the investment adviser, and any entity controlling, controlled by, or under common control
with the investment adviser that provides ongoing services to the Registrant, if the engagement relates directly to the operations and financial reporting of the Registrant. The committee will not delegate its responsibility to pre-approve these services to the investment adviser. The committee may delegate to one or more committee members the authority to review and pre-approve audit and permissible non-audit services. Actions taken under any such delegation will be reported to the full committee at its next meeting. The pre-approval requirement is waived with respect to non-audit services if certain conditions are met. The pre-approval requirement was not waived for any of the non-audit services listed above provided to the Registrant, adviser and affiliates.
Aggregate non-audit fees paid to the Registrant’s auditors, including fees for all services billed to the Registrant, adviser and affiliates that provide ongoing services to the Registrant, were ------------------------------. The non-audit services represented by these amounts were brought to the attention of the committee and considered to be compatible with maintaining the auditors’ independence.
ITEM 5 – Audit Committee of Listed Registrants
Not applicable to this Registrant, insofar as the Registrant is not a listed issuer as defined in Rule 10A-3 under the Securities Exchange Act of 1934.
ITEM 6 – Schedule of Investments

SMALLCAP World Fund®
Investment portfolio
September 30, 2017
Common stocks 90.97%
Consumer discretionary 17.96% | Shares | Value
(000) |
| Lions Gate Entertainment Corp., Class A1,2 | 4,243,393 | $141,942 |
| Lions Gate Entertainment Corp., Class B1,2 | 3,878,393 | 123,294 |
| Domino’s Pizza, Inc. | 1,255,061 | 249,192 |
| Seria Co., Ltd.1,3 | 4,334,948 | 241,284 |
| YOOX Net-A-Porter Group SPA1,2,3 | 6,093,000 | 239,133 |
| Dollarama Inc. | 2,005,000 | 219,389 |
| GVC Holdings PLC1,3 | 19,240,894 | 211,689 |
| Hilton Grand Vacations Inc.2 | 3,563,300 | 137,650 |
| Melco International Development Ltd.3 | 43,527,000 | 125,896 |
| Evolution Gaming Group AB1,3 | 1,943,200 | 124,065 |
| Ted Baker PLC1,3 | 3,446,897 | 122,407 |
| ASOS PLC2,3 | 1,491,741 | 119,064 |
| TopBuild Corp.2 | 1,745,000 | 113,722 |
| Planet Fitness, Inc., Class A | 4,123,511 | 111,252 |
| Beauty Community PCL1,3 | 208,500,000 | 100,029 |
| Taiwan Paiho Ltd.1,3 | 21,611,000 | 99,596 |
| Cedar Fair, LP | 1,496,000 | 95,923 |
| Entertainment One Ltd.1,3 | 27,650,631 | 95,593 |
| Five Below, Inc.2 | 1,726,402 | 94,745 |
| Paddy Power Betfair PLC3 | 886,051 | 88,422 |
| Sleep Country Canada Holdings Inc.1 | 3,011,253 | 87,073 |
| JINS Inc.1,3 | 1,381,000 | 86,505 |
| MakeMyTrip Ltd., non-registered shares1,2 | 2,877,300 | 82,722 |
| MakeMyTrip Ltd., non-registered shares1,2,4 | 92,000 | 2,645 |
| Belmond Ltd., Class A2 | 6,198,000 | 84,603 |
| zooplus AG, non-registered shares1,2,3 | 500,634 | 84,317 |
| Jumbo SA3 | 5,028,161 | 83,187 |
| POYA International Co., Ltd.1,3 | 6,803,267 | 81,391 |
| Installed Building Products, Inc.2 | 1,238,500 | 80,255 |
| Crompton Greaves Consumer Electricals Ltd.3 | 24,438,000 | 78,171 |
| Gentex Corp. | 3,909,134 | 77,401 |
| Ace Hardware Indonesia Tbk PT3 | 850,382,300 | 76,705 |
| Strayer Education, Inc.1 | 845,750 | 73,809 |
| Domino’s Pizza Group PLC3 | 17,585,000 | 73,106 |
| Domino’s Pizza Enterprises Ltd.3 | 1,938,946 | 69,898 |
| Countryside Properties PLC3 | 14,524,434 | 67,580 |
| Nien Made Enterprise Co., Ltd.3 | 6,455,000 | 66,407 |
| Cairn Homes PLC2,3 | 31,915,000 | 64,791 |
| Endurance Technologies Ltd.3 | 4,213,890 | 64,071 |
| AA PLC3 | 27,840,061 | 63,239 |
| Grand Canyon Education, Inc.2 | 690,400 | 62,702 |
| Maisons du Monde SA3 | 1,412,414 | 62,096 |
| Moncler SpA3 | 2,120,000 | 61,176 |
| Estácio Participações SA, ordinary nominative | 5,925,000 | 57,975 |
| Cie. Plastic Omnium SA3 | 1,295,995 | 55,409 |
| Tailored Brands, Inc.1 | 3,741,000 | 54,020 |
| KB Home | 2,117,000 | 51,062 |
SMALLCAP World Fund — Page 1 of 16
Common stocks
Consumer discretionary (continued) | Shares | Value
(000) |
| Vail Resorts, Inc. | 220,374 | $50,272 |
| Brunello Cucinelli SpA3 | 1,608,281 | 49,924 |
| Ladbrokes Coral Group PLC3 | 29,522,600 | 48,304 |
| Hyundai Wia Corp.3 | 845,073 | 48,166 |
| Newell Brands Inc. | 1,115,212 | 47,586 |
| Tele Columbus AG2,3 | 4,429,000 | 46,853 |
| BCA Marketplace PLC3 | 15,793,000 | 46,452 |
| Page Industries Ltd.3 | 162,500 | 45,906 |
| ElringKlinger AG3 | 2,436,200 | 45,405 |
| Spin Master Corp., subordinate voting shares2 | 1,159,000 | 44,753 |
| Eros International PLC, Class A2 | 2,899,138 | 41,458 |
| Eros International PLC, Class A2,5 | 216,500 | 3,096 |
| Ollie’s Bargain Outlet Holdings, Inc.2 | 915,000 | 42,456 |
| At Home Group Inc.2 | 1,830,940 | 41,819 |
| Ocado Group PLC2,3 | 10,603,000 | 41,593 |
| Stella International Holdings Ltd.3 | 21,971,000 | 38,342 |
| Hostelworld Group PLC1,3 | 7,645,662 | 36,808 |
| Chow Sang Sang Holdings International Ltd.3 | 15,940,000 | 36,514 |
| Nifco Inc.3 | 591,600 | 36,224 |
| Cyrela Brazil Realty SA, ordinary nominative | 8,083,300 | 35,221 |
| ServiceMaster Global Holdings, Inc.2 | 753,000 | 35,188 |
| Greene King PLC3 | 4,696,350 | 34,397 |
| Inchcape PLC3 | 2,951,460 | 34,135 |
| Texas Roadhouse, Inc. | 637,440 | 31,324 |
| Six Flags Entertainment Corp. | 500,000 | 30,470 |
| Cavco Industries, Inc.2 | 204,000 | 30,100 |
| Kyoritsu Maintenance Co., Ltd.3 | 975,400 | 29,144 |
| CVC Brasil Operadora e Agência de Viagens SA, ordinary nominative | 2,250,000 | 29,092 |
| Penske Automotive Group, Inc. | 600,000 | 28,542 |
| M.D.C. Holdings, Inc. | 829,500 | 27,548 |
| Greggs PLC3 | 1,647,800 | 27,535 |
| Cox & Kings Ltd.3 | 6,500,000 | 27,524 |
| CalAtlantic Group, Inc. | 750,800 | 27,502 |
| World Wrestling Entertainment, Inc., Class A | 1,140,000 | 26,847 |
| boohoo.com PLC2,3 | 9,233,250 | 26,172 |
| Daily Mail and General Trust PLC, Class A, nonvoting3 | 2,971,000 | 25,820 |
| TAKKT AG3 | 1,122,278 | 25,740 |
| Ctrip.com International, Ltd. (ADR)2 | 464,000 | 24,471 |
| Zhongsheng Group Holdings Ltd.3 | 11,153,500 | 24,339 |
| Century Communities, Inc.2 | 911,000 | 22,502 |
| Lands’ End, Inc.1,2 | 1,654,000 | 21,833 |
| SeaWorld Entertainment, Inc. | 1,649,326 | 21,425 |
| Capella Education Co. | 300,000 | 21,045 |
| Elang Mahkota Teknologi Tbk PT3 | 30,268,700 | 20,900 |
| Fairfax Media Ltd.3 | 27,980,000 | 20,811 |
| Lennar Corp., Class A | 394,000 | 20,803 |
| POLYTEC Holding AG, non-registered shares3 | 834,369 | 19,793 |
| D.R. Horton, Inc. | 490,000 | 19,566 |
| Melco Resorts & Entertainment Ltd. (ADR) | 800,000 | 19,296 |
| Dalata Hotel Group PLC2,3 | 2,929,000 | 19,143 |
| Wowprime Corp.3 | 3,597,000 | 19,073 |
| L’Occitane International SA3 | 8,562,051 | 18,630 |
| HUGO BOSS AG3 | 195,848 | 17,262 |
| Lithia Motors, Inc., Class A | 143,000 | 17,204 |
| I.T Limited3 | 27,638,000 | 14,887 |
SMALLCAP World Fund — Page 2 of 16
Common stocks
Consumer discretionary (continued) | Shares | Value
(000) |
| Matahari Department Store Tbk PT3 | 21,463,500 | $14,816 |
| Mulberry Group PLC3 | 954,000 | 13,997 |
| Minor International PCL, nonvoting depositary receipt3 | 11,350,000 | 13,865 |
| Hathway Cable and Datacom Ltd.2,3 | 29,276,000 | 13,768 |
| Valeo SA, non-registered shares3 | 183,000 | 13,599 |
| Toll Brothers, Inc. | 300,000 | 12,441 |
| Chipotle Mexican Grill, Inc.2 | 39,890 | 12,279 |
| Nokian Renkaat Oyj3 | 270,000 | 12,016 |
| PT Surya Citra Media Tbk3 | 73,600,000 | 11,976 |
| Eclat Textile Co., Ltd.3 | 939,840 | 11,449 |
| DO & CO AG, non-registered shares3 | 205,755 | 10,112 |
| Talwalkars Better Value Fitness Ltd.1,3 | 2,389,000 | 9,906 |
| Samsonite International SA3 | 2,175,000 | 9,333 |
| DineEquity, Inc. | 216,200 | 9,292 |
| Central European Media Enterprises Ltd., Class A2 | 2,220,000 | 8,991 |
| American Axle & Manufacturing Holdings, Inc.2 | 505,000 | 8,878 |
| BNN Technology PLC1,2,3,6 | 19,007,000 | 8,558 |
| Tiffany & Co. | 90,000 | 8,260 |
| William Hill PLC3 | 2,253,000 | 7,620 |
| Kongsberg Automotive ASA2,3 | 4,550,000 | 5,353 |
| Elior Group SA3 | 182,942 | 4,841 |
| Telepizza Group, SA, non-registered shares2,3 | 571,000 | 3,280 |
| China Zenix Auto International Ltd. (ADR)2 | 2,152,000 | 2,948 |
| Tarena International, Inc., Class A (ADR) | 166,547 | 2,423 |
| Zinc Media Group PLC2,3 | 343,900 | 4 |
| | | 6,623,823 |
| Information technology 14.16% | | |
| AAC Technologies Holdings Inc.3 | 17,190,500 | 290,360 |
| Qorvo, Inc.2 | 3,884,370 | 274,547 |
| Paycom Software, Inc.1,2 | 3,126,716 | 234,379 |
| RingCentral, Inc., Class A2 | 4,979,000 | 207,873 |
| Vanguard International Semiconductor Corp.1,3 | 83,546,386 | 144,219 |
| WIN Semiconductors Corp.1,3 | 20,743,009 | 133,421 |
| ZPG PLC1,3 | 26,498,395 | 128,440 |
| Square, Inc., Class A2 | 4,212,830 | 121,372 |
| Inphi Corp.1,2 | 2,970,199 | 117,887 |
| VTech Holdings Ltd.3 | 7,858,500 | 114,763 |
| Versum Materials, Inc. | 2,950,690 | 114,546 |
| Zebra Technologies Corp., Class A2 | 1,019,300 | 110,676 |
| Quotient Technology Inc.1,2 | 6,711,613 | 105,037 |
| Acacia Communications, Inc.1,2 | 2,179,910 | 102,674 |
| Halma PLC3 | 6,749,967 | 101,316 |
| EPAM Systems, Inc.2 | 1,070,994 | 94,173 |
| Talend SA (ADR)1,2 | 2,164,055 | 88,596 |
| MINDBODY, Inc., Class A2 | 3,400,000 | 87,890 |
| Alarm.Com Holdings, Inc.2 | 1,910,000 | 86,294 |
| Callidus Software Inc. (USA)1,2 | 3,420,000 | 84,303 |
| Globant SA1,2 | 1,969,510 | 78,918 |
| eMemory Technology Inc.1,3 | 6,146,000 | 78,878 |
| DeNA Co., Ltd.3 | 3,453,010 | 77,454 |
| Wix.com Ltd.2 | 1,036,000 | 74,437 |
| Lumentum Holdings Inc.2 | 1,352,100 | 73,487 |
| Sunny Optical Technology (Group) Co., Ltd.3 | 4,234,000 | 67,941 |
| Topcon Corp.3 | 3,731,510 | 65,814 |
SMALLCAP World Fund — Page 3 of 16
Common stocks
Information technology (continued) | Shares | Value
(000) |
| RIB Software SE1,3 | 2,980,173 | $63,225 |
| Coupa Software Inc.2 | 2,002,112 | 62,366 |
| MercadoLibre, Inc. | 238,100 | 61,651 |
| Mellanox Technologies, Ltd.2 | 1,293,000 | 60,965 |
| SUNeVision Holdings Ltd.3 | 89,854,000 | 60,797 |
| Cloudera, Inc.2,4 | 3,574,900 | 59,415 |
| Hamamatsu Photonics KK3 | 1,916,930 | 57,946 |
| ON Semiconductor Corp.2 | 3,037,562 | 56,104 |
| CDW Corp. | 850,000 | 56,100 |
| ASM Pacific Technology Ltd.3 | 3,720,000 | 53,788 |
| Nemetschek SE3 | 661,300 | 53,785 |
| Moneysupermarket.com Group PLC3 | 12,483,000 | 53,212 |
| TravelSky Technology Ltd., Class H3 | 19,960,000 | 52,052 |
| Yandex NV, Class A2 | 1,530,000 | 50,414 |
| Mitel Networks Corp.1,2 | 5,934,900 | 49,794 |
| Douzone Bizon Co., Ltd.1,3 | 1,755,000 | 47,845 |
| MACOM Technology Solutions Holdings, Inc.2 | 1,050,000 | 46,841 |
| Finisar Corp.2 | 2,078,000 | 46,069 |
| Dolby Laboratories, Inc., Class A | 800,000 | 46,016 |
| Cognex Corp. | 400,000 | 44,112 |
| Takeaway.com NV2,3 | 1,000,000 | 43,976 |
| Silicon Laboratories Inc.2 | 534,000 | 42,667 |
| Siltronic AG2,3 | 338,000 | 41,946 |
| Viavi Solutions Inc.2 | 4,303,000 | 40,706 |
| Autodesk, Inc.2 | 360,000 | 40,414 |
| OBIC Co., Ltd.3 | 632,500 | 39,833 |
| Cypress Semiconductor Corp. | 2,200,000 | 33,044 |
| Trimble Inc.2 | 840,000 | 32,970 |
| AIXTRON SE2,3 | 2,434,518 | 32,773 |
| II-VI, Inc.2 | 796,300 | 32,768 |
| Cray Inc.2 | 1,632,827 | 31,758 |
| InterXion Holding NV, non-registered shares2 | 600,000 | 30,558 |
| Alteryx, Inc., Class A2 | 1,444,433 | 29,423 |
| 58.com Inc., Class A (ADR)2 | 465,000 | 29,360 |
| TEMENOS Group AG (Switzerland)3 | 270,000 | 27,587 |
| Datalex PLC1,3 | 6,106,000 | 26,926 |
| CoStar Group, Inc.2 | 100,000 | 26,825 |
| MagnaChip Semiconductor Corp.1,2 | 2,355,000 | 26,729 |
| Gogo Inc.2 | 2,220,000 | 26,218 |
| Kakaku.com, Inc.3 | 2,037,400 | 25,974 |
| Semtech Corp.2 | 620,000 | 23,281 |
| Zillow Group, Inc., Class C, nonvoting2 | 525,000 | 21,110 |
| Infinera Corp.2 | 2,279,000 | 20,215 |
| istyle Inc.3 | 3,246,400 | 20,120 |
| YY Inc., Class A (ADR)2 | 179,000 | 15,534 |
| GoldMoney Inc.1,2 | 3,531,100 | 13,414 |
| Veeco Instruments Inc.2 | 600,000 | 12,840 |
| BlackLine, Inc.2 | 350,000 | 11,942 |
| Ultimate Software Group, Inc.2 | 55,700 | 10,561 |
| Ellie Mae, Inc.2 | 125,000 | 10,266 |
| Tobii AB2,3 | 1,699,500 | 10,241 |
| Matrimony.com Ltd.2,3,5 | 764,400 | 8,838 |
| TOTVS SA, ordinary nominative | 775,000 | 7,659 |
| Sonus Networks, Inc.2 | 984,956 | 7,535 |
| Alten SA, non-registered shares3 | 77,500 | 7,004 |
SMALLCAP World Fund — Page 4 of 16
Common stocks
Information technology (continued) | Shares | Value
(000) |
| iEnergizer Ltd.2,3 | 7,650,500 | $5,126 |
| Xurpas Inc.3 | 41,778,000 | 4,890 |
| Syntel, Inc. | 248,043 | 4,874 |
| EVERTEC, Inc. | 220,612 | 3,497 |
| Criteo SA (ADR)2 | 28,831 | 1,196 |
| | | 5,224,790 |
| Health care 13.94% | | |
| Bluebird Bio, Inc.2 | 2,106,520 | 289,331 |
| Molina Healthcare, Inc.1,2 | 4,069,005 | 279,785 |
| Insulet Corp.1,2 | 3,734,000 | 205,669 |
| GW Pharmaceuticals PLC (ADR)1,2 | 1,891,400 | 191,958 |
| Centene Corp.2 | 1,459,439 | 141,230 |
| Intuitive Surgical, Inc.2 | 135,000 | 141,194 |
| WuXi Biologics (Cayman) Inc.2,3 | 26,901,000 | 136,137 |
| Incyte Corp.2 | 1,088,122 | 127,027 |
| Fleury SA, ordinary nominative | 12,515,000 | 116,451 |
| Vitrolife AB1,3 | 1,363,579 | 110,898 |
| China Biologic Products Holdings, Inc.2 | 1,085,500 | 100,159 |
| Dechra Pharmaceuticals PLC3 | 3,502,388 | 95,787 |
| CONMED Corp.1 | 1,823,000 | 95,653 |
| NuVasive, Inc.2 | 1,717,077 | 95,229 |
| Glaukos Corp.1,2 | 2,740,000 | 90,420 |
| Fisher & Paykel Healthcare Corp. Ltd.3 | 9,693,000 | 89,540 |
| Cotiviti Holdings, Inc.2 | 2,478,101 | 89,162 |
| athenahealth, Inc.2 | 715,000 | 88,917 |
| WellCare Health Plans, Inc.2 | 513,000 | 88,103 |
| Genomma Lab Internacional, SAB de CV, Series B1,2 | 67,483,000 | 86,642 |
| Prothena Corp. PLC2 | 1,323,114 | 85,698 |
| iRhythm Technologies, Inc.1,2 | 1,591,200 | 82,551 |
| EXACT Sciences Corp.2 | 1,750,000 | 82,460 |
| Integra LifeSciences Holdings Corp.2 | 1,633,148 | 82,441 |
| Galapagos NV2,3 | 803,989 | 81,823 |
| Sysmex Corp.3 | 1,204,758 | 76,906 |
| Illumina, Inc.2 | 335,200 | 66,772 |
| Osstem Implant Co., Ltd.1,2,3 | 1,078,621 | 65,913 |
| Lifco AB, Class B3 | 1,916,699 | 62,520 |
| Flexion Therapeutics, Inc.1,2 | 2,538,000 | 61,369 |
| Teleflex Inc. | 251,760 | 60,918 |
| Kite Pharma, Inc.2 | 325,000 | 58,438 |
| Wright Medical Group NV2 | 2,212,857 | 57,247 |
| Adaptimmune Therapeutics PLC (ADR)1,2 | 6,792,700 | 55,632 |
| Ultragenyx Pharmaceutical Inc.2 | 1,023,970 | 54,537 |
| Natera, Inc.1,2 | 4,222,609 | 54,429 |
| Nakanishi Inc.3 | 1,201,700 | 54,370 |
| Galenica AG2,3 | 1,138,269 | 54,023 |
| BioMarin Pharmaceutical Inc.2 | 531,500 | 49,467 |
| Sartorius AG, non-registered shares, nonvoting preferred3 | 517,372 | 49,457 |
| Juno Therapeutics, Inc.2 | 1,080,000 | 48,449 |
| Sawai Pharmaceutical Co., Ltd.3 | 845,900 | 48,055 |
| Hikma Pharmaceuticals PLC3 | 2,841,100 | 46,142 |
| CryoLife, Inc.1,2 | 1,993,149 | 45,244 |
| Brookdale Senior Living Inc.2 | 4,210,000 | 44,626 |
| Agios Pharmaceuticals, Inc.2 | 663,000 | 44,255 |
| Pacific Biosciences of California, Inc.1,2 | 8,128,077 | 42,672 |
SMALLCAP World Fund — Page 5 of 16
Common stocks
Health care (continued) | Shares | Value
(000) |
| Editas Medicine, Inc.2 | 1,770,000 | $42,498 |
| Neurocrine Biosciences, Inc.2 | 688,000 | 42,161 |
| CellaVision AB, non-registered shares1,3 | 1,908,123 | 40,707 |
| ACADIA Pharmaceuticals Inc.2 | 1,023,000 | 38,536 |
| Capio AB3 | 6,542,608 | 38,348 |
| Hologic, Inc.2 | 1,035,600 | 37,996 |
| Eurofins Scientific SE, non-registered shares3 | 59,500 | 37,602 |
| Genmab A/S2,3 | 165,000 | 36,471 |
| NuCana PLC (ADR)1,2 | 1,932,728 | 35,504 |
| Hypermarcas SA, ordinary nominative | 3,126,077 | 31,782 |
| Spark Therapeutics, Inc.2 | 346,020 | 30,851 |
| QIAGEN NV3 | 932,871 | 29,375 |
| Divi’s Laboratories Ltd.3 | 2,124,952 | 27,855 |
| Teladoc, Inc.2 | 825,000 | 27,349 |
| Ambu AS, Class B, non-registered shares3 | 341,000 | 26,519 |
| Abcam PLC3 | 1,900,000 | 25,972 |
| Alkem Laboratories Ltd.3 | 905,000 | 25,504 |
| Gerresheimer AG, non-registered shares3 | 310,000 | 24,032 |
| Penumbra, Inc.2 | 265,244 | 23,952 |
| Seres Therapeutics, Inc.2 | 1,446,315 | 23,199 |
| Virtus Health Ltd.1,3 | 5,223,000 | 22,875 |
| Krka, dd, Novo mesto3 | 335,262 | 21,880 |
| Grifols, SA, Class B (ADR) | 616,400 | 13,493 |
| Grifols, SA, Class A, non-registered shares3 | 270,000 | 7,866 |
| Ironwood Pharmaceuticals, Inc., Class A2 | 1,330,000 | 20,974 |
| Monash IVF Group Ltd.1,3 | 18,820,000 | 20,445 |
| Acerta Pharma BV2,3,4,6 | 195,556,815 | 19,751 |
| Diplomat Pharmacy, Inc.2 | 872,100 | 18,061 |
| Alnylam Pharmaceuticals, Inc.2 | 137,700 | 16,178 |
| Neovasc Inc.1,2 | 6,294,667 | 10,645 |
| NantKwest, Inc.2 | 1,887,290 | 10,342 |
| Viralytics Ltd.1,2,3 | 14,000,000 | 8,875 |
| Mesoblast Ltd.2,3 | 7,769,497 | 8,343 |
| Mesoblast Ltd. (ADR)2 | 80,000 | 438 |
| Mitra Keluarga Karyasehat Tbk PT3 | 52,500,000 | 7,915 |
| Intercept Pharmaceuticals, Inc.2 | 132,137 | 7,669 |
| Xenon Pharmaceuticals Inc.1,2 | 1,429,000 | 4,216 |
| | | 5,141,885 |
| Industrials 11.52% | | |
| Loomis AB, Class B3 | 3,698,042 | 146,981 |
| Kirby Corp.2 | 2,145,000 | 141,463 |
| NIBE Industrier AB, Class B3 | 13,234,285 | 133,445 |
| MonotaRO Co., Ltd.3 | 4,374,300 | 117,381 |
| Bravida Holding AB1,3 | 15,730,395 | 115,259 |
| IMCD NV3 | 1,740,000 | 106,795 |
| IDEX Corp. | 875,000 | 106,286 |
| Kratos Defense & Security Solutions, Inc.1,2 | 8,087,000 | 105,778 |
| King Slide Works Co., Ltd.1,3 | 7,623,765 | 103,930 |
| Wizz Air Holdings PLC2,3 | 2,577,300 | 98,814 |
| Nihon M&A Center Inc.3 | 1,940,300 | 95,153 |
| TechnoPro Holdings, Inc.1,3 | 1,969,000 | 93,290 |
| Continental Building Products, Inc.1,2 | 3,330,700 | 86,598 |
| BELIMO Holding AG3 | 21,333 | 85,461 |
| Rexnord Corp.2 | 3,225,000 | 81,947 |
SMALLCAP World Fund — Page 6 of 16
Common stocks
Industrials (continued) | Shares | Value
(000) |
| Oshkosh Corp. | 960,000 | $79,238 |
| NORMA Group SE, non-registered shares3 | 1,194,339 | 78,572 |
| Aalberts Industries NV, non-registered shares3 | 1,602,000 | 77,460 |
| Johnson Electric Holdings Ltd.3 | 19,498,875 | 74,539 |
| Nabtesco Corp.3 | 1,964,000 | 73,059 |
| ABM Industries Inc. | 1,716,400 | 71,591 |
| Havells India Ltd.3 | 9,457,266 | 70,071 |
| Clean Harbors, Inc.2 | 1,234,500 | 69,996 |
| Grafton Group PLC, units3 | 6,031,000 | 67,170 |
| ITT Inc. | 1,460,000 | 64,634 |
| Air Lease Corp., Class A | 1,493,000 | 63,632 |
| Masco Corp. | 1,625,000 | 63,391 |
| Welbilt Inc.2 | 2,724,900 | 62,809 |
| Landstar System, Inc. | 591,000 | 58,893 |
| Waste Connections, Inc. | 840,000 | 58,766 |
| Graco Inc. | 458,000 | 56,650 |
| Watsco, Inc. | 350,000 | 56,374 |
| Elementia, SAB de CV2 | 40,600,000 | 53,375 |
| Cía. de Distribución Integral Logista Holdings, SA, non-registered shares3 | 2,198,888 | 52,885 |
| Grupo Aeroportuario del Pacífico SAB de CV | 5,094,455 | 52,148 |
| Rockwool International A/S, Class B3 | 188,600 | 51,230 |
| TransDigm Group Inc. | 190,000 | 48,573 |
| Generac Holdings Inc.2 | 1,019,500 | 46,826 |
| Rheinmetall AG3 | 411,000 | 46,339 |
| XP Power Ltd.1,3 | 1,237,207 | 46,028 |
| Tsubaki Nakashima Co., Ltd.1,3 | 2,118,800 | 44,644 |
| Aeroflot - Russian Airlines PJSC3 | 13,368,000 | 42,722 |
| Stabilus SA, non-registered shares3 | 470,657 | 42,716 |
| Allegiant Travel Co. | 317,489 | 41,813 |
| American Airlines Group Inc. | 872,000 | 41,411 |
| Grupo Aeroportuario del Centro Norte, SAB de CV, Series B | 7,234,000 | 40,079 |
| R.R. Donnelley & Sons Co.1 | 3,890,358 | 40,071 |
| Boyd Group Income Fund | 530,200 | 38,957 |
| Spirit Airlines, Inc.2 | 1,082,000 | 36,150 |
| Barrett Business Services, Inc.1 | 580,000 | 32,787 |
| Kingspan Group PLC3 | 724,000 | 30,790 |
| AKR Corporindo Tbk PT3 | 54,603,300 | 28,845 |
| Unique Engineering and Construction PCL3 | 51,351,000 | 28,522 |
| Harmonic Drive Systems Inc.3 | 529,100 | 27,351 |
| BWX Technologies, Inc. | 487,233 | 27,295 |
| Flughafen Zürich AG3 | 119,000 | 26,928 |
| Coor Service Management Holding AB3 | 3,722,729 | 26,527 |
| LT Group, Inc.3 | 76,014,300 | 26,301 |
| Spirax-Sarco Engineering PLC3 | 351,000 | 25,989 |
| USG Corp.2 | 689,912 | 22,526 |
| Kornit Digital Ltd.2 | 1,400,000 | 21,420 |
| Carborundum Universal Ltd.3 | 4,365,000 | 21,283 |
| Alliance Global Group, Inc.2,3 | 66,295,000 | 20,932 |
| BBA Aviation PLC3 | 5,195,000 | 20,777 |
| Amara Raja Batteries Ltd.3 | 1,879,756 | 20,409 |
| Bossard Holding AG3 | 85,062 | 19,706 |
| Geberit AG3 | 41,000 | 19,396 |
| KEYW Holding Corp.1,2 | 2,536,400 | 19,302 |
| GIMA TT SpA2,3 | 1,200,000 | 17,728 |
| Embraer SA, ordinary nominative | 3,085,000 | 17,426 |
SMALLCAP World Fund — Page 7 of 16
Common stocks
Industrials (continued) | Shares | Value
(000) |
| Teleperformance SE3 | 116,247 | $17,355 |
| Proto Labs, Inc.2 | 212,000 | 17,024 |
| PayPoint PLC3 | 1,220,000 | 15,604 |
| Gujarat Pipavav Port Ltd.3 | 7,189,000 | 14,732 |
| va-Q-tec AG2,3 | 542,000 | 14,589 |
| J. Kumar Infraprojects Ltd.1,3 | 4,450,500 | 13,953 |
| Chart Industries, Inc.2 | 350,000 | 13,730 |
| BMC Stock Holdings, Inc.2 | 579,222 | 12,366 |
| Briggs & Stratton Corp. | 500,000 | 11,750 |
| Takeuchi Mfg. Co., Ltd.3 | 514,694 | 10,782 |
| International Container Terminal Services, Inc.3 | 5,250,000 | 10,761 |
| Talgo SA, non-registered shares3 | 1,910,000 | 10,644 |
| Sweco AB, Class B, non-registered shares3 | 425,000 | 10,412 |
| Troax Group AB3 | 275,000 | 9,859 |
| Intrum Justitia AB3 | 245,000 | 8,682 |
| Indutrade AB3 | 310,000 | 8,196 |
| COSCO SHIPPING International (Hong Kong) Co., Ltd.3 | 18,658,000 | 7,922 |
| Douglas Dynamics, Inc. | 185,000 | 7,289 |
| | | 4,249,283 |
| Financials 11.37% | | |
| Kotak Mahindra Bank Ltd.3 | 18,292,040 | 281,043 |
| Essent Group Ltd.1,2 | 5,825,535 | 235,934 |
| Bajaj Finance Ltd.3 | 6,087,160 | 171,881 |
| Validus Holdings, Ltd. | 3,228,000 | 158,850 |
| Radian Group Inc. | 7,194,161 | 134,459 |
| VZ Holding AG3 | 390,411 | 124,575 |
| SVB Financial Group2 | 652,500 | 122,076 |
| MarketAxess Holdings Inc. | 660,000 | 121,777 |
| Texas Capital Bancshares, Inc.2 | 1,414,817 | 121,391 |
| Grupo Supervielle SA, Class B (ADR) | 4,912,000 | 121,277 |
| First Republic Bank | 1,141,825 | 119,275 |
| Webster Financial Corp. | 2,156,900 | 113,345 |
| Financial Engines, Inc. | 3,137,000 | 109,011 |
| CenterState Bank Corp.1 | 3,748,399 | 100,457 |
| Great Western Bancorp, Inc. | 2,074,703 | 85,644 |
| Third Point Reinsurance Ltd.2 | 5,325,506 | 83,078 |
| Capitec Bank Holdings Ltd.3 | 1,291,983 | 82,006 |
| GT Capital Holdings, Inc.3 | 3,485,200 | 79,692 |
| Indiabulls Housing Finance Ltd.3 | 4,238,596 | 78,468 |
| Umpqua Holdings Corp. | 3,785,500 | 73,855 |
| Close Brothers Group PLC3 | 3,630,476 | 71,814 |
| Chemical Financial Corp. | 1,332,450 | 69,634 |
| WisdomTree Investments, Inc. | 6,800,000 | 69,224 |
| GRUH Finance Ltd.3 | 8,560,000 | 64,593 |
| Trupanion, Inc.1,2 | 2,380,800 | 62,877 |
| IRB Brasil Resseguros SA2 | 6,306,900 | 60,238 |
| MGIC Investment Corp.2 | 4,766,039 | 59,718 |
| EFG International AG3 | 6,785,929 | 58,772 |
| Avanza Bank Holding AB3 | 1,392,768 | 58,358 |
| Metro Bank PLC2,3 | 1,259,528 | 57,049 |
| PacWest Bancorp | 1,124,491 | 56,798 |
| FCB Financial Holdings, Inc., Class A2 | 1,172,000 | 56,608 |
| City Union Bank Ltd.3 | 21,957,338 | 54,573 |
| Deutsche Pfandbriefbank AG, non-registered shares3 | 3,330,068 | 49,827 |
SMALLCAP World Fund — Page 8 of 16
Common stocks
Financials (continued) | Shares | Value
(000) |
| First Hawaiian, Inc. | 1,641,087 | $49,709 |
| M&A Capital Partners Co., Ltd.1,2,3 | 937,100 | 46,735 |
| Janus Henderson Group PLC | 1,200,041 | 41,809 |
| Redwood Trust, Inc. | 2,562,000 | 41,735 |
| Cathay General Bancorp, Inc. | 1,000,000 | 40,200 |
| BSE Ltd.3 | 2,673,430 | 40,006 |
| The Bank of N.T. Butterfield & Son Ltd. | 1,040,000 | 38,106 |
| Waddell & Reed Financial, Inc., class A | 1,850,000 | 37,129 |
| Legg Mason Partners Equity Fund | 915,285 | 35,980 |
| Boston Private Financial Holdings, Inc. | 1,978,177 | 32,739 |
| NMI Holdings, Inc.2 | 2,553,127 | 31,659 |
| Moelis & Co., Class A | 719,000 | 30,953 |
| Mercury General Corp. | 500,000 | 28,345 |
| RenaissanceRe Holdings Ltd. | 205,000 | 27,704 |
| KKR Real Estate Finance Trust Inc. REIT | 1,250,000 | 26,300 |
| Eurobank Ergasias SA2,3 | 29,592,819 | 26,164 |
| Bharat Financial Inclusion Ltd.2,3 | 1,662,000 | 24,239 |
| Onex Corp. | 300,000 | 23,151 |
| Artisan Partners Asset Management Inc., Class A | 705,000 | 22,983 |
| Numis Corp. PLC1,3 | 5,663,282 | 21,307 |
| Signature Bank2 | 157,800 | 20,205 |
| Greenhill & Co., Inc. | 1,169,700 | 19,417 |
| Moscow Exchange MICEX-RTS PJSC3 | 9,271,525 | 18,604 |
| ICRA Ltd.3 | 291,264 | 17,811 |
| Inversiones La Construcción SA | 1,025,000 | 16,215 |
| Permanent TSB Group Holdings PLC2,3 | 6,457,000 | 14,122 |
| Clifton Bancorp Inc. | 816,606 | 13,654 |
| Bank of Ireland Group PLC2,3 | 1,515,227 | 12,412 |
| HarborOne Bancorp, Inc.2 | 500,000 | 9,405 |
| Habib Bank Ltd.3 | 5,000,000 | 8,579 |
| National Bank of Pakistan3 | 18,295,000 | 8,531 |
| | | 4,194,085 |
| Consumer staples 5.81% | | |
| Emmi AG1,3 | 289,300 | 189,576 |
| Raia Drogasil SA, ordinary nominative | 7,527,574 | 178,257 |
| Lion Corp.3 | 7,637,000 | 139,930 |
| Pinnacle Foods Inc. | 2,389,050 | 136,582 |
| Morinaga & Co., Ltd.3 | 2,390,600 | 132,934 |
| Ariake Japan Co., Ltd.3 | 1,607,000 | 115,642 |
| COSMOS Pharmaceutical Corp.3 | 502,700 | 112,144 |
| Greencore Group PLC3 | 31,907,987 | 83,967 |
| Milbon Co., Ltd.1,3 | 1,324,300 | 80,418 |
| Dis-Chem Pharmacies Ltd.3 | 34,627,650 | 71,983 |
| Refresco Group NV3 | 3,519,045 | 70,836 |
| Glanbia PLC3 | 3,503,200 | 66,045 |
| Sugi Holdings Co., Ltd.3 | 1,042,000 | 55,312 |
| a2 Milk Co. Ltd.2,3 | 11,975,000 | 55,098 |
| Varun Beverages Ltd.3 | 6,884,988 | 53,900 |
| Treasury Wine Estates Ltd.3 | 4,840,000 | 52,166 |
| CCL Products (India) Ltd.1,3 | 10,642,173 | 50,208 |
| Simply Good Foods Co., Class A1,2 | 4,017,095 | 47,040 |
| Davide Campari-Milano SpA3 | 5,800,000 | 42,124 |
| Century Pacific Food, Inc.3 | 113,738,000 | 37,837 |
| BWX Ltd.1,3 | 7,708,000 | 35,453 |
SMALLCAP World Fund — Page 9 of 16
Common stocks
Consumer staples (continued) | Shares | Value
(000) |
| CLIO Cosmetics Co., Ltd.1,3 | 1,166,900 | $33,487 |
| Kernel Holding SA3 | 1,642,578 | 25,034 |
| Philip Morris CR as3 | 32,000 | 24,104 |
| Puregold Price Club, Inc.3 | 23,349,300 | 23,972 |
| Avenue Supermarts Ltd.2,3 | 1,337,800 | 22,161 |
| Stock Spirits Group PLC3 | 6,404,674 | 20,654 |
| KWS Saat SE, non-registered shares3 | 46,500 | 20,354 |
| Coca-Cola Icecek AS, Class C3 | 1,903,000 | 19,917 |
| Emperador Inc.3 | 135,870,000 | 19,364 |
| Herbalife Ltd.2 | 275,000 | 18,653 |
| BGFretail Co., Ltd.3 | 238,000 | 17,254 |
| Hyundai Department Store Co., Ltd.3 | 186,000 | 14,361 |
| Del Monte Pacific Ltd.3 | 62,850,314 | 13,453 |
| PriceSmart, Inc. | 130,000 | 11,603 |
| Lenta Ltd. (GDR)2,3 | 1,222,000 | 7,558 |
| Lenta Ltd. (GDR)2,3,5 | 530,900 | 3,283 |
| Delfi Ltd.3 | 9,182,500 | 10,273 |
| R.E.A. Holdings PLC1,2,3 | 2,162,000 | 9,198 |
| Sprouts Farmers Market, Inc.2 | 410,600 | 7,707 |
| Nomad Foods Ltd.2 | 500,000 | 7,285 |
| Prataap Snacks Ltd.2,3,5 | 266,535 | 4,583 |
| | | 2,141,710 |
| Materials 4.53% | | |
| Dalmia Bharat Ltd.3 | 2,815,519 | 111,137 |
| Lundin Mining Corp. | 14,501,000 | 99,482 |
| Supreme Industries Ltd.3 | 5,794,009 | 97,801 |
| James Hardie Industries PLC (CDI)3 | 6,855,000 | 95,701 |
| Outokumpu Oy, Class A (Finland)3 | 8,170,000 | 84,878 |
| Sirius Minerals PLC1,2,3 | 247,367,560 | 84,460 |
| Platform Specialty Products Corp.2 | 6,690,510 | 74,599 |
| Scapa Group PLC1,3 | 12,183,326 | 72,168 |
| Stella-Jones Inc. | 1,776,500 | 68,369 |
| Chr. Hansen Holding A/S3 | 749,000 | 64,239 |
| Boral Ltd.3 | 9,965,000 | 53,161 |
| PolyOne Corp. | 1,323,600 | 52,984 |
| Clearwater Paper Corp.1,2 | 990,000 | 48,757 |
| CCL Industries Inc., Class B, nonvoting | 1,000,000 | 48,391 |
| Buzzi Unicem SPA3 | 1,603,058 | 43,329 |
| Mayr-Melnhof Karton AG, non-registered shares3 | 292,300 | 41,944 |
| HudBay Minerals Inc. | 5,568,237 | 41,279 |
| Victrex PLC3 | 1,090,000 | 34,635 |
| Huntsman Corp. | 1,245,000 | 34,138 |
| Kenmare Resources PLC1,2,3 | 7,124,863 | 31,244 |
| SK Kaken Co., Ltd.3 | 335,000 | 27,330 |
| United States Steel Corp. | 967,470 | 24,825 |
| KOLON Industries, Inc.3 | 382,500 | 23,695 |
| Arkema SA3 | 182,500 | 22,363 |
| Ingevity Corp.2 | 340,000 | 21,240 |
| Croda International PLC3 | 407,448 | 20,711 |
| Huhtamäki Oyj3 | 488,000 | 19,709 |
| OCI NV2,3 | 804,000 | 18,845 |
| CPMC Holdings Ltd.3 | 31,700,000 | 18,661 |
| Essentra PLC3 | 2,409,000 | 17,837 |
| Symrise AG3 | 227,500 | 17,288 |
SMALLCAP World Fund — Page 10 of 16
Common stocks
Materials (continued) | Shares | Value
(000) |
| LANXESS AG3 | 213,040 | $16,818 |
| Mountain Province Diamonds Inc.2 | 4,964,264 | 16,153 |
| Royal Gold, Inc. | 180,000 | 15,487 |
| Steel Dynamics, Inc. | 443,700 | 15,294 |
| HEXPOL AB, Class B3 | 1,395,000 | 14,703 |
| Hummingbird Resources PLC1,2,3 | 27,459,300 | 13,109 |
| Indorama Ventures PCL, foreign registered3 | 10,114,000 | 12,815 |
| Wacker Chemie AG3 | 73,500 | 10,542 |
| Danakali Ltd.1,2,3 | 16,700,000 | 9,067 |
| Bacanora Minerals Ltd.1,2,3 | 8,573,925 | 8,904 |
| S H Kelkar and Co. Ltd.3 | 1,920,883 | 7,403 |
| Kennady Diamonds Inc.1,2 | 2,557,952 | 6,048 |
| Nampak Ltd.3 | 3,956,000 | 5,150 |
| Dalradian Resources Inc.2 | 3,000,000 | 3,222 |
| Rusoro Mining Ltd.2 | 21,437,000 | 2,062 |
| | | 1,671,977 |
| Energy 3.74% | | |
| Centennial Resource Development, Inc., Class A2,5 | 6,795,088 | 122,108 |
| Centennial Resource Development, Inc., Class A2,3,5 | 550,000 | 9,389 |
| Centennial Resource Development, Inc., Class A2 | 262,782 | 4,722 |
| Diamondback Energy, Inc.2 | 947,000 | 92,768 |
| Whitecap Resources Inc. | 11,535,454 | 89,677 |
| U.S. Silica Holdings, Inc. | 2,822,071 | 87,682 |
| Peyto Exploration & Development Corp. | 4,953,836 | 80,992 |
| Petronet LNG Ltd.3 | 20,920,000 | 74,198 |
| Seven Generations Energy Ltd., Class A2 | 4,675,000 | 73,961 |
| Kosmos Energy Ltd.2 | 9,253,000 | 73,654 |
| SM Energy Co. | 3,539,000 | 62,782 |
| Extraction Oil & Gas, Inc.2 | 3,663,000 | 56,374 |
| WorleyParsons Ltd.2,3 | 4,361,974 | 46,374 |
| Parsley Energy, Inc., Class A2 | 1,707,200 | 44,968 |
| Aegis Logistics Ltd.3 | 11,779,223 | 42,561 |
| Tullow Oil PLC2,3 | 15,981,173 | 39,862 |
| Concho Resources Inc.2 | 279,500 | 36,816 |
| Pilipinas Shell Petroleum Corp.3 | 25,893,660 | 34,663 |
| Hurricane Energy PLC2,3 | 68,881,650 | 30,288 |
| Keyera Corp. | 952,400 | 29,112 |
| Tidewater Midstream and Infrastructure Ltd.1 | 24,334,000 | 27,693 |
| Source Energy Services Ltd.1,2 | 3,438,235 | 25,213 |
| Tallgrass Energy GP, LP, Class A | 809,900 | 22,880 |
| Ophir Energy PLC2,3 | 20,517,000 | 19,933 |
| Venture Global LNG, Inc., Series C2,3,4,5,6 | 4,240 | 15,128 |
| Golar LNG Ltd. | 628,092 | 14,201 |
| PDC Energy, Inc.2 | 248,000 | 12,159 |
| Laredo Petroleum, Inc.2 | 920,000 | 11,896 |
| Pason Systems Inc. | 772,000 | 11,619 |
| Independence Contract Drilling, Inc.1,2 | 2,955,645 | 11,231 |
| Lekoil Ltd. (CDI)1,2,3 | 42,922,391 | 9,919 |
| San Leon Energy PLC1,2,3 | 32,348,000 | 8,940 |
| Carrizo Oil & Gas, Inc.2 | 513,032 | 8,788 |
| Tourmaline Oil Corp.2 | 410,000 | 8,336 |
| Savannah Petroleum PLC1,2,3,6 | 17,844,000 | 8,279 |
| Amerisur Resources PLC2,3 | 25,204,200 | 7,009 |
| RSP Permian, Inc.2 | 188,900 | 6,534 |
SMALLCAP World Fund — Page 11 of 16
Common stocks
Energy (continued) | Shares | Value
(000) |
| Gulf Keystone Petroleum Ltd.2,3 | 4,870,000 | $6,266 |
| Gulf Keystone Petroleum Ltd.2,3,5 | 157,150 | 202 |
| Africa Oil Corp. (SEK denominated)2,3 | 2,683,000 | 3,658 |
| BNK Petroleum Inc.1,2 | 12,804,914 | 3,130 |
| Providence Resources PLC1,2,3 | 35,235,000 | 2,655 |
| Denbury Resources Inc.2 | 669,000 | 897 |
| African Petroleum Corp. Ltd.2,3 | 976,506 | 185 |
| | | 1,379,702 |
| Real estate 1.47% | | |
| MGM Growth Properties LLC REIT, Class A1 | 4,148,087 | 125,314 |
| WHA Corp. PCL1,3 | 1,145,170,900 | 122,347 |
| Purplebricks Group PLC1,2,3 | 21,151,800 | 109,841 |
| OUTFRONT Media Inc. REIT | 1,545,153 | 38,907 |
| Gaming and Leisure Properties, Inc. REIT | 800,000 | 29,512 |
| Inmobiliaria Colonial Socimi SA3 | 2,808,000 | 27,886 |
| Taubman Centers, Inc. REIT | 430,000 | 21,371 |
| Mahindra Lifespace Developers Ltd.1,3 | 2,696,725 | 19,140 |
| Fibra Uno Administración, SA de CV REIT | 8,860,744 | 14,948 |
| Land and Houses PCL, foreign registered3 | 28,572,854 | 8,494 |
| Land and Houses PCL, nonvoting depository receipt3 | 13,205,087 | 3,925 |
| K. Wah International Holdings Ltd.3 | 12,612,847 | 7,603 |
| Soundwill Holdings Ltd.3 | 3,413,500 | 7,602 |
| Morguard Corp. | 23,400 | 3,450 |
| | | 540,340 |
| Utilities 0.85% | | |
| ENN Energy Holdings Ltd.3 | 12,061,000 | 87,686 |
| REN - Redes Energéticas Nacionais, SGPS, SA, non-registered shares3 | 18,189,835 | 59,215 |
| Pampa Energía SA (ADR)2 | 862,400 | 56,142 |
| Banpu Power PCL, foreign registered3 | 56,975,338 | 45,426 |
| CT Environmental Group Ltd.3 | 181,026,000 | 26,003 |
| Northland Power Inc. | 1,100,000 | 20,418 |
| Energy World Corp. Ltd.2,3 | 50,606,000 | 15,507 |
| Mytrah Energy Ltd.1,2,3 | 10,418,000 | 4,156 |
| | | 314,553 |
| Telecommunication services 0.74% | | |
| Iridium Communications Inc.1,2 | 7,206,088 | 74,223 |
| Play Communications SA, non-registered shares2,3 | 5,517,000 | 56,052 |
| HKBN Ltd.3 | 36,225,500 | 37,842 |
| Indosat Tbk PT3 | 68,968,300 | 31,992 |
| Zegona Communications PLC1,3 | 12,305,654 | 27,715 |
| Cogent Communications Holdings, Inc. | 565,000 | 27,628 |
| TalkTalk Telecom Group PLC3 | 6,251,000 | 17,562 |
| | | 273,014 |
| Miscellaneous 4.88% | | |
| Other common stocks in initial period of acquisition | | 1,801,798 |
| Total common stocks (cost: $22,482,258,000) | | 33,556,960 |
SMALLCAP World Fund — Page 12 of 16
Preferred securities 0.00%
Consumer staples 0.00% | Shares | Value
(000) |
| R.E.A. Holdings PLC 9.00%1 | 96,000 | $135 |
| Total preferred securities (cost: $185,000) | | 135 |
Rights & warrants 0.01%
Consumer discretionary 0.01% | | |
| Central European Media Enterprises Ltd., warrants, expire 20182,3 | 751,800 | 2,300 |
| Real estate 0.00% | | |
| WHA Corp. PCL, warrants, expire 20201,2 | 6,909,830 | 1,958 |
| Information technology 0.00% | | |
| Foursquare Labs, Inc., warrants, expire 20332,3,4,6 | 1,163,990 | 964 |
| Total rights & warrants (cost: $927,000) | | 5,222 |
Convertible stocks 0.31%
Information technology 0.18% | | |
| DocuSign, Inc., Series E, convertible preferred3,4,6 | 1,236,304 | 31,229 |
| DocuSign, Inc., Series B, convertible preferred3,4,6 | 66,593 | 1,682 |
| DocuSign, Inc., Series D, convertible preferred3,4,6 | 47,810 | 1,208 |
| DocuSign, Inc., Series B1, convertible preferred3,4,6 | 19,947 | 504 |
| Domo, Inc., Series D-2, convertible preferred3,4,6 | 2,965,036 | 25,000 |
| Foursquare Labs, Inc., Series D, convertible preferred3,4,6 | 1,551,988 | 6,225 |
| | | 65,848 |
| Health care 0.11% | | |
| Proteus Digital Health, Inc., Series G, convertible preferred3,4,6 | 3,044,139 | 42,435 |
| Telecommunication services 0.02% | | |
| Iridium Communications Inc., Series A, convertible preferred1,5 | 60,000 | 6,874 |
| Total convertible stocks (cost: $108,475,000) | | 115,157 |
Bonds, notes & other debt instruments 0.25%
Corporate bonds & notes 0.17%
Consumer discretionary 0.17% | Principal?amount
(000) | |
| Caesars Entertainment Operating Co. 10.00% 20187 | $59,366 | 61,295 |
| Total corporate bonds & notes | | 61,295 |
U.S. Treasury bonds & notes 0.08%
U.S. Treasury 0.08% | | |
| U.S. Treasury 0.75% 20178 | 30,000 | 29,973 |
| Total U.S. Treasury bonds & notes | | 29,973 |
| Total bonds, notes & other debt instruments (cost: $79,464,000) | | 91,268 |
SMALLCAP World Fund — Page 13 of 16
| Short-term securities 8.39% | Principal?amount
(000) | Value
(000) |
| American Honda Finance Corp. 1.22% due 12/18/2017 | $80,000 | $79,788 |
| Bank of Montreal 1.30% due 11/8/2017 | 37,500 | 37,448 |
| Bank of Nova Scotia 1.32% due 12/5/20175 | 75,000 | 74,826 |
| Bank of Tokyo-Mitsubishi UFJ, Ltd. 1.40% due 10/31/2017 | 42,800 | 42,807 |
| BMW U.S. Capital LLC 1.15% due 12/1/20175 | 18,500 | 18,463 |
| BNP Paribas, New York Branch 1.34% due 11/17/2017 | 96,000 | 95,847 |
| Caisse d’Amortissement de la Dette Sociale 1.27%–1.28% due 10/2/2017–10/25/20175 | 132,800 | 132,721 |
| Canadian Imperial Bank of Commerce 1.20% due 10/26/20175 | 50,000 | 49,957 |
| Coca-Cola Co. 1.26% due 1/18/20185 | 50,000 | 49,808 |
| CPPIB Capital Inc. 1.16%–1.31% due 10/20/2017–1/2/20185 | 128,000 | 127,712 |
| ExxonMobil Corp. 1.12% due 11/8/2017 | 50,000 | 49,939 |
| Fairway Finance Corp. 1.30% due 11/8/20175 | 50,000 | 49,930 |
| Federal Home Loan Bank 1.03%–1.09% due 10/6/2017–2/2/2018 | 362,400 | 361,839 |
| Freddie Mac 1.02% due 10/17/2017 | 100,000 | 99,960 |
| ING (U.S.) Funding LLC 1.27% due 11/10/2017 | 80,600 | 80,484 |
| Kells Funding, LLC 1.29%–1.30% due 10/16/2017–10/23/20175 | 148,500 | 148,392 |
| KfW 1.23% due 10/12/20175 | 114,500 | 114,452 |
| Liberty Street Funding Corp. 1.25%–1.30% due 11/28/2017–12/7/20175 | 65,000 | 64,843 |
| Mitsubishi UFJ Trust and Banking Corp. 1.36% due 1/5/20185 | 50,000 | 49,819 |
| Mizuho Bank, Ltd. 1.27%–1.37% due 10/20/2017–2/16/20185 | 252,100 | 251,517 |
| Nordea Bank AB 1.25%–1.41% due 10/27/2017–4/9/20185 | 194,800 | 194,198 |
| Old Line Funding, LLC 1.21%–1.28% due 10/25/2017–11/14/20175 | 110,000 | 109,850 |
| Procter & Gamble Co. 1.13% due 11/2/20175 | 50,000 | 49,948 |
| Province of Alberta 1.15%–1.18% due 10/18/2017–11/20/20175 | 75,000 | 74,905 |
| Rabobank Nederland NV 1.23% due 10/11/2017 | 35,000 | 35,000 |
| Siemens Capital Co. LLC 1.20% due 12/27/20175 | 40,000 | 39,883 |
| Société Générale 1.20% due 10/31/20175 | 15,200 | 15,184 |
| Sumitomo Mitsui Banking Corp. 1.24%–1.30% due 11/9/2017–11/13/20175 | 183,200 | 182,931 |
| Svenska Handelsbanken Inc. 1.26% due 11/28/20175 | 100,000 | 99,799 |
| Toronto-Dominion Bank 1.27% due 10/6/20175 | 78,800 | 78,783 |
| United Overseas Bank Limited 1.25% due 12/4/20175 | 100,000 | 99,770 |
| Victory Receivables Corp. 1.32%–1.34% due 12/8/2017–12/26/20175 | 135,000 | 134,625 |
| Total short-term securities (cost: $3,095,433,000) | | 3,095,428 |
| Total investment securities 99.93% (cost: $25,766,742,000) | | 36,864,170 |
| Other assets less liabilities 0.07% | | 25,022 |
| Net assets 100.00% | | $36,889,192 |
As permitted by U.S. Securities and Exchange Commission regulations, “Miscellaneous” securities include holdings in their first year of acquisition that have not previously been publicly disclosed.
SMALLCAP World Fund — Page 14 of 16
Forward currency contracts
| Contract amount | Counterparty | Settlement
date | Unrealized
(depreciation)
appreciation
at 9/30/2017
(000) |
Purchases
(000) | Sales
(000) |
| USD14,676 | GBP11,375 | Bank of America, N.A. | 10/5/2017 | $(569) |
| USD26,214 | CAD34,000 | UBS AG | 10/6/2017 | (1,037) |
| USD26,133 | ZAR345,000 | Barclays Bank PLC | 10/18/2017 | 731 |
| USD25,994 | GBP19,380 | Goldman Sachs | 10/18/2017 | 9 |
| USD48,904 | JPY5,303,225 | JPMorgan Chase | 10/19/2017 | 1,727 |
| USD6,011 | JPY669,165 | UBS AG | 10/23/2017 | 56 |
| USD98,771 | GBP76,514 | Citibank | 10/23/2017 | (3,840) |
| USD13,671 | GBP10,590 | Barclays Bank PLC | 10/24/2017 | (532) |
| USD33,179 | GBP24,400 | Bank of America, N.A. | 11/3/2017 | 446 |
| USD47,107 | INR3,049,338 | Citibank | 11/24/2017 | 738 |
| | | | | $(2,271) |
The following footnotes apply to either the individual securities noted or one or more of the securities aggregated and listed as a single line item.
| 1 | Represents an affiliated company as defined under the Investment Company Act of 1940. |
| 2 | Security did not produce income during the last 12 months. |
| 3 | Valued under fair value procedures adopted by authority of the board of directors. The total value of all such securities, including those in “Miscellaneous,“ was $15,648,143,000, which represented 42.42% of the net assets of the fund. This amount includes $15,420,102,000 related to certain securities trading outside the U.S. whose values were adjusted as a result of significant market movements following the close of local trading. |
| 4 | Acquired through a private placement transaction exempt from registration under the Securities Act of 1933. May be subject to legal or contractual restrictions on resale. Further details on these holdings appear below. |
| 5 | Acquired in a transaction exempt from registration under Rule 144A or Section 4(2) of the Securities Act of 1933. May be resold in the U.S. in transactions exempt from registration, normally to qualified institutional buyers. The total value of all such securities was $2,385,817,000, which represented 6.47% of the net assets of the fund. |
| 6 | Value determined using significant unobservable inputs. |
| 7 | Scheduled interest and/or principal payment was not received. |
| 8 | A portion of this security was pledged as collateral. The total value of pledged collateral was $4,832,000, which represented .01% of the net assets of the fund. |
| Private placement securities | Acquisition
date(s) | Cost
(000) | Value
(000) | Percent
of net
assets |
| Cloudera, Inc. | 4/28/2017-9/28/2017 | $60,402 | $59,415 | .16% |
| Proteus Digital Health, Inc., Series G, convertible preferred | 5/6/2014-7/23/2014 | 40,000 | 42,435 | .12 |
| DocuSign, Inc., Series E, convertible preferred | 2/28/2014 | 16,236 | 31,229 | .08 |
| DocuSign, Inc., Series B, convertible preferred | 2/28/2014 | 875 | 1,682 | .00 |
| DocuSign, Inc., Series D, convertible preferred | 2/28/2014 | 628 | 1,208 | .00 |
| DocuSign, Inc., Series B1, convertible preferred | 2/28/2014 | 262 | 504 | .00 |
| Domo, Inc., Series D-2, convertible preferred | 3/31/2015 | 25,000 | 25,000 | .07 |
| Acerta Pharma BV | 5/7/2015 | 11,250 | 19,751 | .05 |
| Venture Global LNG, Inc., Series C | 5/1/2015 | 12,720 | 15,128 | .04 |
| Foursquare Labs, Inc., Series D, convertible preferred | 12/3/2013 | 20,000 | 6,225 | .02 |
| Foursquare Labs, Inc., warrants, expire 2033 | 12/3/2013 | — | 964 | .00 |
| MakeMyTrip Ltd., non-registered shares | 5/2/2017 | 3,312 | 2,645 | .01 |
| Total private placement securities | | $190,685 | $206,186 | .55% |
SMALLCAP World Fund — Page 15 of 16
| Key to abbreviations and symbol |
| ADR = American Depositary Receipts |
| CAD = Canadian dollars |
| CDI = CREST Depository Interest |
| GBP = British pounds |
| GDR = Global Depositary Receipts |
| INR = Indian rupees |
| JPY = Japanese yen |
| SEK = Swedish kronor |
| USD/$ = U.S. dollars |
| ZAR = South African rand |
Additional financial disclosures are included in the fund’s current shareholder report and should be read in conjunction with this report.
Investments are not FDIC-insured, nor are they deposits of or guaranteed by a bank or any other entity, so they may lose value.
Investors should carefully consider investment objectives, risks, charges and expenses. This and other important information is contained in the fund prospectus and summary prospectus, which can be obtained from your financial professional and should be read carefully before investing. You may also call American Funds Service Company (AFS) at (800) 421-4225 or visit the American Funds website at americanfunds.com. Fund shares offered through American Funds Distributors, Inc.
| MFGEFPX-035-1117O-S60715 | SMALLCAP World Fund — Page 16 of 16 |
REPORT OF INDEPENDENT REGISTERED PUBLIC ACCOUNTING FIRM
To the Shareholders and Board of Directors of
SMALLCAP World Fund, Inc.:
We have audited the accompanying statement of assets and liabilities of SMALLCAP World Fund, Inc. (the “Fund”), including the summary investment portfolio, as of September, 2017, and the related statements of operations for the year then ended, the statements of changes in net assets for each of the two years in the period then ended (collectively, the “financial statements”), the financial highlights for each of the periods presented (the financial statements and financial highlights are included in Item 1 of this Form N-CSR), and the investment portfolio as of September 30, 2017 (included in Item 6 of this Form N-CSR). These financial statements, financial highlights, and investment portfolio are the responsibility of the Fund’s management. Our responsibility is to express an opinion on these financial statements, financial highlights, and investment portfolio based on our audits.
We conducted our audits in accordance with the standards of the Public Company Accounting Oversight Board (United States). Those standards require that we plan and perform the audit to obtain reasonable assurance about whether the financial statements, financial highlights, and investment portfolio are free of material misstatement. Our audit included consideration of internal control over financial reporting as it relates to the schedule as a basis for designing audit procedures that are appropriate in the circumstances, but not for the purpose of expressing an opinion on the effectiveness of the Fund's internal control over financial reporting as it relates to the schedule. Accordingly, we express no such opinion. An audit includes examining, on a test basis, evidence supporting the amounts and disclosures in the financial statements and investment portfolio, assessing the accounting principles used and significant estimates made by management, as well as evaluating the overall financial statement presentation. Our procedures included confirmation of securities owned as of September 30, 2017, by correspondence with the custodian and brokers; where replies were not received from brokers, we performed other auditing procedures. We believe that our audits provide a reasonable basis for our opinion.
In our opinion, the financial statements, financial highlights, and investment portfolio in securities referred to above present fairly, in all material respects, the financial position of SMALLCAP World Fund, Inc. as of September 30, 2017, and the results of its operations for the year then ended, the changes in its net assets for each of the two years in the period then ended, and the financial highlights for each of the periods presented in conformity with accounting principles generally accepted in the United States of America.
DELOITTE & TOUCHE LLP
Costa Mesa, California
November 10, 2017
ITEM 7 – Disclosure of Proxy Voting Policies and Procedures for Closed-End Management Investment Companies
Not applicable to this Registrant, insofar as the Registrant is not a closed-end management investment company.
ITEM 8 – Portfolio Managers of Closed-End Management Investment Companies
Not applicable to this Registrant, insofar as the Registrant is not a closed-end management investment company.
ITEM 9 – Purchases of Equity Securities by Closed-End Management Investment Company and Affiliated Purchasers
Not applicable to this Registrant, insofar as the Registrant is not a closed-end management investment company.
ITEM 10 – Submission of Matters to a Vote of Security Holders
There have been no material changes to the procedures by which shareholders may recommend nominees to the Registrant’s board of directors since the Registrant last submitted a proxy statement to its shareholders. The procedures are as follows. The Registrant has a nominating and governance committee comprised solely of persons who are not considered ‘‘interested persons’’ of the Registrant within the meaning of the Investment Company Act of 1940, as amended. The committee periodically reviews such issues as the board’s composition, responsibilities, committees, compensation and other relevant issues, and recommends any appropriate changes to the full board of directors. While the committee normally is able to identify from its own resources an ample number of qualified candidates, it will consider shareholder suggestions of persons
to be considered as nominees to fill future vacancies on the board. Such suggestions must be sent in writing to the nominating and governance committee of the Registrant, c/o the Registrant’s Secretary, and must be accompanied by complete biographical and occupational data on the prospective nominee, along with a written consent of the prospective nominee for consideration of his or her name by the nominating and governance committee.
ITEM 11 – Controls and Procedures
| (a) | The Registrant’s Principal Executive Officer and Principal Financial Officer have concluded, based on their evaluation of the Registrant’s disclosure controls and procedures (as such term is defined in Rule 30a-3 under the Investment Company Act of 1940), that such controls and procedures are adequate and reasonably designed to achieve the purposes described in paragraph (c) of such rule. |
| | |
| (b) | There were no changes in the Registrant’s internal controls over financial reporting (as defined in Rule 30a-3(d) under the Investment Company Act of 1940) that occurred during the Registrant’s second fiscal quarter of the period covered by this report that has materially affected, or is reasonably likely to materially affect, the Registrant’s internal control over financial reporting. |
ITEM 12 – Exhibits
| (a)(1) | The Code of Ethics that is the subject of the disclosure required by Item 2 is attached as an exhibit hereto. |
| | |
| (a)(2) | The certifications required by Rule 30a-2 of the Investment Company Act of 1940 and Sections 302 and 906 of the Sarbanes-Oxley Act of 2002 are attached as exhibits hereto. |
SIGNATURES
Pursuant to the requirements of the Securities Exchange Act of 1934 and the Investment Company Act of 1940, the Registrant has duly caused this report to be signed on its behalf by the undersigned, thereunto duly authorized.
| | SMALLCAP WORLD FUND, INC. |
| | |
| | By /s/ Paul F. Roye |
| | Paul F. Roye, Executive Vice President and Principal Executive Officer |
| | |
| | Date: November 30, 2017 |
Pursuant to the requirements of the Securities Exchange Act of 1934 and the Investment Company Act of 1940, this report has been signed below by the following persons on behalf of the Registrant and in the capacities and on the dates indicated.
| By /s/ Paul F. Roye |
Paul F. Roye, Executive Vice President and Principal Executive Officer |
| |
| Date: November 30, 2017 |
| By /s/ Brian D. Bullard |
Brian D. Bullard, Treasurer and Principal Financial Officer |
| |
| Date: November 30, 2017 |