UNITED STATES
SECURITIES AND EXCHANGE COMMISSION
Washington, D.C. 20549
FORM N-CSR
Certified Shareholder Report of
Registered Management Investment Companies
Investment Company Act File Number: 811-05888
SMALLCAP World Fund, Inc.
(Exact Name of Registrant as Specified in Charter)
6455 Irvine Center Drive
Irvine, California 92618
(Address of Principal Executive Offices)
Registrant's telephone number, including area code: (213) 486-9200
Date of fiscal year end: September 30
Date of reporting period: September 30, 2015
Michael W. Stockton
SMALLCAP World Fund, Inc.
6455 Irvine Center Drive
Irvine, California 92618
(Name and Address of Agent for Service)
ITEM 1 – Reports to Stockholders

25 years of small-cap
investing to help meet
your needs.
Special feature page 4
 | SMALLCAP World Fund® Annual report
for the year ended
September 30, 2015 |
SMALLCAP World Fund seeks to provide you with long-term growth of capital.
This fund is one of more than 40 offered by one of the nation’s largest mutual fund families, American Funds, from Capital Group. For more than 80 years, Capital has invested with a long-term focus based on thorough research and attention to risk.
Fund results shown in this report, unless otherwise indicated, are for Class A shares at net asset value. If a sales charge (maximum 5.75%) had been deducted, the results would have been lower. Results are for past periods and are not predictive of results for future periods. Current and future results may be lower or higher than those shown. Share prices and returns will vary, so investors may lose money. Investing for short periods makes losses more likely. Investments are not FDIC-insured, nor are they deposits of or guaranteed by a bank or any other entity, so they may lose value. For current information and month-end results, visit americanfunds.com.
See page 3 for Class A share results with relevant sales charges deducted. For other share class results, visit americanfunds.com and americanfundsretirement.com.
Investment results assume all distributions are reinvested and reflect applicable fees and expenses. When applicable, investment results reflect fee waivers, without which results would have been lower. Visit americanfunds.com for more information.
Investing outside the United States may be subject to risks, such as currency fluctuations and political instability. These risks may be heightened in connection with investments in developing countries. Investing in small-capitalization stocks can involve greater risk than is customarily associated with investing in stocks of larger, more established companies. Refer to the fund prospectus and the Risk Factors section of this report for more information on these and other risks associated with investing in the fund.

Fellow investors:
Despite a difficult market environment in the closing months of SMALLCAP World Fund’s fiscal year, the fund produced a positive total return for the 12-month period ended September 30, 2015. The fund marked its 25th anniversary with a total return of 2.25% for the fiscal year. This included a one-time capital gain payment of $4.75 a share, paid December 26, 2014.
By way of comparison, the MSCI All Country World Small Cap Index* fell 3.28% for the period, while the Lipper Global Small-/Mid-Cap Funds Average, a measure of the fund’s peer group, declined 4.37%. As long-term investors, we would highlight that the fund has surpassed the returns of both the index and peer group over the past 5- and 10-year periods, and exceeded the peer group return over the 25-year life of the fund.
The year in review
Much of the fund’s fiscal year was marked by steady economic growth in the U.S. and strong equity markets around the globe. However, concerns about China’s lagging growth, along with a sharp drop in oil prices, triggered a market correction in the U.S. and in many equity markets worldwide. China and many emerging markets equities suffered particularly steep declines. In Europe, deflation due to the rigidity of the euro, along with intensifying political unpredictability, proved to be a headwind for equities there as well.
Despite this, the U.S. economy remains strong, and many innovative small-capitalization companies continue to thrive. The decline in oil prices prompted a sharp drop in energy and utilities shares, but may prove to be an overall boon to the economy longer term.
How the fund responded
SMALLCAP World Fund continues to leverage its global research network to find small-cap companies with the potential to provide shareholders with growth, and we continue to believe in the value and discipline of long-term investing. Rather than sell into the market decline, our primary goal was to find companies whose stock valuations became attractive, and determine whether they could be added to the fund’s holdings.
Results at a glance
For periods ended September 30, 2015, with all distributions reinvested
| | | Cumulative | | Average annual |
| | | total returns | | total returns |
| | | 1 year | | 5 years | | 10 years | | Lifetime
(since 4/30/90) |
| | | | | | | | | | |
| SMALLCAP World Fund (Class A shares) | | | 2.25 | % | | | | 8.49 | % | | | 7.16 | % | | | 9.41 | % |
| MSCI All Country World Small Cap Index* | | | –3.28 | | | | | 8.14 | | | | 6.52 | | | | n/a | |
| Lipper Global Small-/Mid-Cap Funds Average† | | | –4.37 | | | | | 6.90 | | | | 5.47 | | | | 8.95 | |
| * | The market index is unmanaged and, therefore, has no expenses. Investors cannot invest directly in an index. The market index is a free float-adjusted market capitalization weighted index that is designed to measure equity market results of smaller capitalization companies in both developed and emerging markets. Results reflect dividends net of withholding taxes. This index was not in existence when the fund’s Class A shares were first sold; therefore, lifetime results are not available. |
| † | Lipper averages reflect the current composition of all eligible mutual funds (all share classes) within a given category. |
Overall, health care equities were additive to the fund’s returns, with bluebird bio (up 138.4%) among our top five positive contributors. As mentioned earlier, utilities and energy shares weighed against returns, with Paramount Resources declining 87.1% for the period. Overall, the fund was weighted more toward sectors with generally positive returns, and the fund’s active management yielded better returns relative to the MSCI index.
In terms of geography, the fund’s U.S. holdings helped returns greatly compared to the index, while holdings domiciled in Hong Kong, Korea and the United Kingdom weighed against returns.
The road ahead
We continue to see the U.S. in the vanguard of innovation and small-cap companies worldwide, but new business models and new products and services from around the world remain remarkably disruptive. It can be chaotic at times, especially in the current market environment, but we are working hard to understand this disruption and try to find companies around the globe that may generate it or take advantage of it.
Geopolitics likely will continue to be a factor around the globe in the coming year. The immigrant crisis in Europe, continued conflict in the Middle East and the presidential election in the United States may all affect equity markets in the coming year.
25 years of SMALLCAP
This report marks the 25th anniversary of SMALLCAP World Fund’s inception. In 1990, the notion of a truly global small-cap fund on this scale was groundbreaking. Few fund managers could marshal the resources necessary to properly research so many up-and-coming companies on a global basis, and the fund began at a time when domestic large-cap stocks were deemed more favorable for investors.
We credit our success to the hard work of our investment analysts and portfolio managers who have served the fund over the course of its lifetime. The Capital SystemSM allows individual managers and analysts to invest according to their highest convictions, giving our shareholders a total portfolio of companies that represent our very best ideas. These investment professionals are some of the most experienced in the mutual fund industry, allowing us to look at potential future investments through the lens of our collective experience.
The trust you have placed in us, which we do not take for granted, has made SMALLCAP World Fund one of the largest global small-cap mutual funds in the world by assets. This size allows us to continue to aggressively invest in our research efforts, which in turn allows us to uncover potential investments that others may have overlooked.
This year’s special feature highlights three of the fund’s investment professionals who have been with SMALLCAP World Fund from the beginning, as well as three others who we believe represent the future of this fund.
We thank you for your continued investment in the fund, and we look forward to reporting to you again in six months – and for years to come.
Sincerely,

Jonathan Knowles
Vice Chairman of the Board

Gregory W. Wendt
President
November 11, 2015
For current information about the fund, visit americanfunds.com.
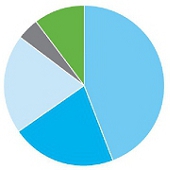
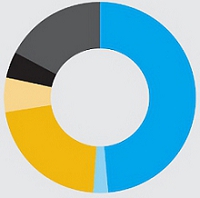
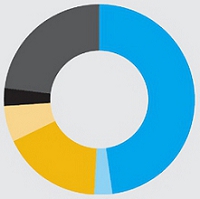
Where the fund’s assets are invested (by country of domicile)
| As of September 30, 2015 | Percent of net assets |
| ▀ | United States | | | 44.2 | % |
| ▀ | Asia & Pacific Basin | | | 21.2 | |
| ▀ | Europe | | | 20.1 | |
| ▀ | Other (including Canada & Latin America) | | | 4.3 | |
| ▀ | Short-term securities & other assets less liabilities | | | 10.2 | |
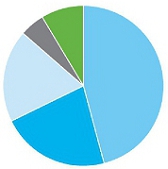
| | As of September 30, 2014 | Percent of
net assets |
| ▀ | United States | | | 46.0 | % |
| ▀ | Asia & Pacific Basin | | | 21.9 | |
| ▀ | Europe | | | 18.5 | |
| ▀ | Other (including Canada & Latin America) | | | 5.1 | |
| ▀ | Short-term securities & other assets less liabilities | | | 8.5 | |
| Largest equity holdings | | | |
| | | | |
| | | Percent of
net assets |
| Incyte | | | 1.7 | % |
| Domino’s Pizza | | | 1.3 | |
| Molina Healthcare | | | 1.0 | |
| Lions Gate Entertainment | | | 1.0 | |
| Myriad Genetics | | | .8 | |
| Kotak Mahindra Bank | | | .8 | |
| Hoshizaki Electric | | | .7 | |
| Endo International | | | .7 | |
| Qorvo | | | .7 | |
| Kakaku.com | | | .6 | |
The value of a long-term perspective
This chart shows how a $10,000 investment in SMALLCAP World Fund’s Class A shares grew from April 30, 1990 – the fund’s inception – through September 30, 2015, the end of the fund’s latest fiscal year. As you can see, the $10,000 would have grown to $92,679 even after deducting the maximum 5.75% sales charge.
Fund results shown reflect deduction of the maximum sales charge of 5.75% on the $10,000 investment.1 Thus, the net amount invested was $9,425.
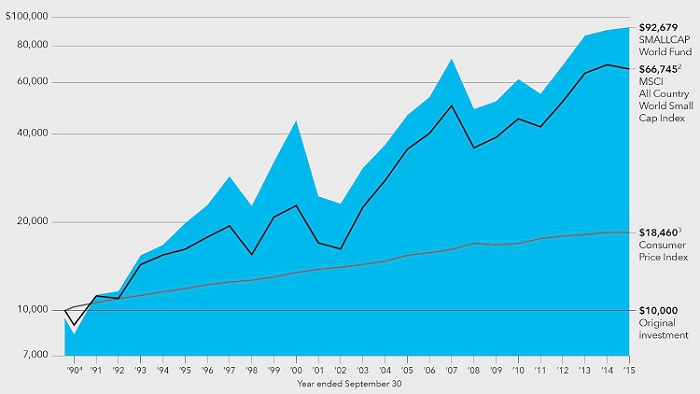
| 1 | As outlined in the prospectus, the sales charge is reduced for accounts (and aggregated investments) of $25,000 or more and is eliminated for purchases of $1 million or more. There is no sales charge on dividends or capital gain distributions that are reinvested in additional shares. |
| 2 | The MSCI All Country World Small Cap Index is unmanaged and, therefore, has no expenses. Investors cannot invest directly in an index. Results reflect dividends net of withholding taxes. Because the index was not in existence when the fund’s Class A shares were first sold, cumulative returns through May 31, 1994, reflect the returns of the S&P Developed <$1.2 Billion Index. |
| 3 | Computed from data supplied by the U.S. Department of Labor, Bureau of Labor Statistics. |
| 4 | For the period April 30, 1990, commencement of operations, through September 30, 1990. |
Past results are not predictive of results for future periods. The results shown are before taxes on fund distributions and sale of fund shares.
| Average annual total returns based on a $1,000 investment (for periods ended September 30, 2015)* |
| |
| | 1 year | | 5 years | | 10 years | |
| | | | | | | |
| Class A shares | –3.63% | | 7.21% | | 6.53% | |
| * | Assumes reinvestment of all distributions and payment of the maximum 5.75% sales charge. |
| | |
| | The total annual fund operating expense ratio is 1.07% for Class A shares as of the prospectus dated December 1, 2015 (unaudited). |
| | |
| | Investment results assume all distributions are reinvested and reflect applicable fees and expenses. When applicable, investment results reflect fee waivers, without which results would have been lower. Visit americanfunds.com for more information. |

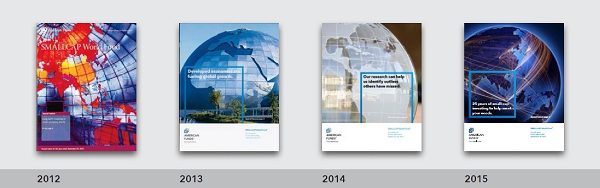
25 years of small-cap investing
SMALLCAP World Fund has
invested in thousands of
up-and-coming companies in
its 25-year history, and while
the marketplace has changed,
the fund’s commitment to
fundamental research and long-
term investing remains constant.
1990
The cover of the first SMALLCAP
World Fund annual report.
See how the covers evolved over the
past 25 years on the following pages.

“What this fund represented was an opportunity to really focus on those great small companies around the world with the potential to grow.”
– Claudia Huntington
Twenty-five years ago, American Funds introduced a unique fund – SMALLCAP World Fund. With a global mandate to find small-capitalization companies with the potential to grow, the fund’s investment professionals leveraged a growing research capability to bring shareholders a fund featuring some of the world’s newest innovators.
Today the fund is managed by investment professionals who have been with the fund since it began, as well as a new generation of analysts and managers who have brought new perspectives to the fund. We talked to people from both groups to find out more about how far the fund has come – and where it might go next.
Portfolio managers Mark Denning, Claudia Huntington and Greg Wendt have worked on the fund since its inception, having started as investment analysts before becoming portfolio managers. They recently shared some of their insights into how the fund has evolved – and the consistent process and culture that has led to its results on behalf of shareholders.
Tell us a little bit about the genesis of the fund and the challenges of launching a truly global small-cap mutual fund back in 1990.
Greg: A bunch of us were talking about it and pushing for it for a while before we finally got the go-ahead. We felt we had an opportunity to leverage this great team of global investment analysts to delve into the opportunities in global small-cap investing. And at the time, we were seeing a real emphasis at Capital (Capital Research and Management Company, the fund’s investment adviser) on global investing. It made sense.
Mark: We already had built out some of the capability. We launched New Perspective Fund in 1973, which had a strong international component, and we had a large base of emerging markets assets under management for institutional clients as well. We were already thinking globally, which was something rather unique back then.
Claudia: And many of us among the investment analysts were already looking at small companies as part of our coverage. Small-cap companies were, and still are, held in other American Funds. What this fund represented was an opportunity to really focus on those great small companies around the world with the potential to grow.

“Part of the glue of this fund is the longevity of the folks who’ve been a part of it.”
– Greg Wendt
How has that research effort evolved since then?
Greg: Originally, the analysts simply added more small-cap research to what they were already doing. Then we started looking at the potential of having small-cap generalists – I was one of the first ones, in fact. That was tough, though, because going from a bank to a retailer to a software company didn’t make sense. They were too different. Soon after, that role evolved into a kind of small-cap sector generalist, where the analyst would stick to one sector, like banking, and that’s worked really well for us.
Claudia: The research effort – and the number of portfolio managers, for that matter – has grown quite a bit over the years. We’ve added a lot of analysts and we’ve been able to tackle more of the world over the years. But really, the culture we have here hasn’t changed, and I think that’s the most important part of the success of the fund.
Is the culture the key to the fund’s longevity?
Mark: Well, first off, anytime we launch a fund, whether today or 25 years ago, we want to ensure that it will be relevant. I think SMALLCAP is as relevant today as it was 25 years ago, if not more so, because we thought it through and understood it could help meet a real need for investors – the need to have exposure to small companies that had the potential to do big things around the world. And once you’ve launched it, you have to have the system in place to hand off the baton to the next generation, which I think is what The Capital SystemSM is all about.
Claudia: At other mutual funds, especially large funds like this one, you maybe have one or two people trying to manage hundreds of holdings. How does one person have high conviction about so many different stocks? I think we’re better investors when we invest with our colleagues. We have every incentive to help each other make better decisions. We have richer dialogue and a more thorough understanding. It’s that process, The Capital System, which allows each of us to have really high conviction in the investments we make.
Greg: It’s part collaboration, and it’s part institutional knowledge, too. The three of us have been here since the beginning, and we talk about the mistakes we’ve made – and sure, we make mistakes. But that knowledge resides here and gets passed down. Part of the glue of this fund is the longevity of the folks who’ve been a part of it.

“It takes a lot more work to be a small-cap investor, but you can really add value that way.”
– Mark Denning
Tell us more about what you’ve learned over the years.
Mark: Humility and hard work. We’ve learned our lessons, particularly in the 2000–2001 era. We learned to be wary when the market becomes hyperextended. We’ve also learned the value of hard work. It takes a lot more work to be a small-cap investor, but you can really add value that way.
Claudia: For me, I started out primarily as an analyst in U.S.-based companies, spending time really learning about other economies, countries, companies, cultures, and management styles. That’s been really additive to me as an investor. I’ve become a better investor for having gone global.
Greg: When I look back, I think the quality of small-cap companies has gotten better over the years, at least for some of them. You’ll have small-cap companies that will always be small-cap companies because that’s what they’re destined to be –because of management, opportunity or industry. The stock price never really changes. What I’ve tried to do is find those small-cap companies that are exciting and, yes, they have some risk, but if they execute right and catch a break, they have the potential to become very big companies. And if you have to pick one element that’s the big difference, it’s the management teams, because great management can make all the difference.
If you had all of your “next generation” colleagues here, what advice would you give them?
Claudia: When it comes to making investment decisions, it’s keeping in mind that we’re really looking for growth companies. One of the best ways to approach a company, to me, is trying to figure out where they’re going, not where they are now. You do have to think about how they got to where they are now, but also if that’s enough to get them where you hope they’ll be down the road. The market environment is very short-term oriented, and our challenge is to look ahead and stay long-term oriented.
Mark: What’s struck me over the years is just how cyclical the market can be. When I first started, Germany was considered the place to be as an investor. Then it was all about Japan – how it was killing the U.S. semiconductor industry and how efficient the Japanese were. Then there was the rise of China. If you look at it now, I think the U.S. reigns supreme when it comes to innovation and small-cap companies with great growth potential. So it’s keeping in mind how cyclical these things are, and thinking about where the cycle will take you next.
 |  |  |
| Andraz Razen | Roz Hongsaranagon | Julian Abdey |
Three of the fund’s newer investment professionals — Julian Abdey, Andraz Razen and Roz Hongsaranagon — represent the next generation of stewardship for the fund. They recently discussed their own experiences and what they’ve learned as they take on greater responsibility for the future of SMALLCAP.
What drew you to small-cap investing and working on behalf of SMALLCAP?
Roz: Finding that small company with the potential to go big is pretty exciting — that’s what we all want to do. With SMALLCAP, you’re really given the freedom and resources to do that, and with The Capital System, you get to work with experienced managers who have been there before. It’s pretty unique.
Julian: One of the great things about working here is you really get to do proper research. I traveled all around the U.S., including some very small towns, visiting small banks. I think there are very few analysts out there with the deep industry experience and relationships that we have.
Andraz: That kind of work is very time-consuming, to really dig down and understand all the permutations of your industry as it’s evolving over time. But it’s the biggest possible investment universe you can have — there are thousands of small-cap companies out there. Even we can’t visit them all, but because of our size and our capabilities, we can look at a lot more of them than maybe others could.
And yes, it’s finding the one that nobody’s really looked at yet and finding potential there. It’s rewarding.
What is it like working alongside the people who helped create this fund?
Andraz: Given that small-caps can be volatile sometimes, they’re really a nice, calm bunch of people. They have such a steady hand. When things are moving up and down and all over the place, their experience gives them a really good perspective. That’s such an incredible part of the culture of the fund that I don’t think you get anywhere else.
Roz: When things aren’t going right, you can just walk into their office and talk it through with them. They’ve probably seen it before, and it’s up to us to leverage that experience and learn from it. And they’re very good at making me feel empowered. I remember making my first investment, for $4 million — I stayed up that night figuring out how many cars that would buy, how many kids could go to college on the money I just invested for our shareholders. But while I was nervous and counting money, the people here were supportive and encouraging.
Julian: I remember very clearly when I started, we had a couple very tough years post-bubble (2001–02), and I remember one of the portfolio managers reading a letter from a shareholder who lost money in the fund. After reading it, he made it very clear we were going to turn the fund around and make our shareholders money again. All of the fund’s founders have never lost sight of who our shareholders are, and the importance of their investments in the fund. This fund is in college and retirement accounts, and it’s a key part of why we do what we do.
What have you learned from working on behalf of SMALLCAP?
Julian: Investing in small-cap companies is a vital tool to understanding large-cap companies as well, and vice versa. Small-cap companies are often the innovators, often the companies that can cause problems for the large caps. It’s their interaction that’s the space in which you see the excesses and the problems. That was a great bit of learning for me, to look at not just the small-cap competitors of given companies, but the larger ones as well.
Roz: I remember in 2008 when it was all falling apart, we were told that the biggest mistake we could make was to just freeze up and do nothing. We were encouraged to start our analysis, figure out different scenarios, which of our companies would survive and which wouldn’t. And that led to some insights that really let us identify what we called the “fallen angels” — companies that were beaten down for no good reason, or that had the potential to come back strong. I learned then to keep at it, to adjust and adapt and figure it out — not to freeze up.
Andraz: Personally, I like to invest when I’m alone in my opinion, which is usually scary. But I’ve learned — and I’ve been encouraged — to trust my analysis, to think for myself, to grow with and learn from the market. I’ve learned that it’s OK to be out there. I’ve stayed true to my style of investing — and that’s encouraged here.
What does the future hold for SMALLCAP?
Roz: There are new small-cap companies being listed every day. There are so many great innovators out there, and you’re seeing companies that can do more than ever before. They’re small and nimble and can be disruptive to any number of industries. And you have more coming out of emerging markets than ever before. It’s almost limitless.
Andraz: I think because we have such a steady hand, we’re able to continue to do what we do so well. It’s the culture and it’s handed down from one generation to the next. It teaches you to think for yourself, to become a good investor, but also to collaborate with others and work together. I think that’s going to keep us successful down the road.
Julian: We have an amazing team. What we don’t lack for is ideas. We generate a lot of great ideas, here and globally. It’s the wonderful problem of being a portfolio manager — too many good ideas. But that’s why I think we’re going to continue to be successful. We’re managing a global small-cap fund with one of the biggest small-cap research efforts there is at any firm, I believe. And every generation of analysts seems to get better than the one before. We have superb people coming through who are going to be amazing investors. It’s quite exciting to be part of that. n
The New Geography of Investing®
Where a company does business can be more important than where it’s located. Here’s a look at SMALLCAP World Fund’s portfolio in terms of where its equity holdings earn their revenue. The charts below show the countries and regions in which the fund’s equity investments are located, and where the revenue comes from.
Equity portion breakdown by domicile (%)
| | Region | | Fund | | Index |
| ▀ | United States | | | 49 | % | | | 53 | % |
| ▀ | Canada | | | 3 | | | | 3 | |
| ▀ | Europe | | | 21 | | | | 20 | |
| ▀ | Japan | | | 6 | | | | 10 | |
| ▀ | Asia-Pacific ex. Japan | | | 4 | | | | 4 | |
| ▀ | Emerging markets | | | 17 | | | | 10 | |
| | Total | | | 100 | % | | | 100 | % |
Equity portion breakdown by revenue (%)
| | Region | | Fund | | Index |
| ▀ | United States | | | 48 | % | | | 46 | % |
| ▀ | Canada | | | 3 | | | | 3 | |
| ▀ | Europe | | | 17 | | | | 19 | |
| ▀ | Japan | | | 6 | | | | 9 | |
| ▀ | Asia-Pacific ex. Japan | | | 3 | | | | 3 | |
| ▀ | Emerging markets | | | 23 | | | | 20 | |
| | Total | | | 100 | % | | | 100 | % |
Compared with the MSCI ACWI Small Cap Index as a percent of net assets. All figures include convertible securities.
Source: Capital Group (as of September 30, 2015).
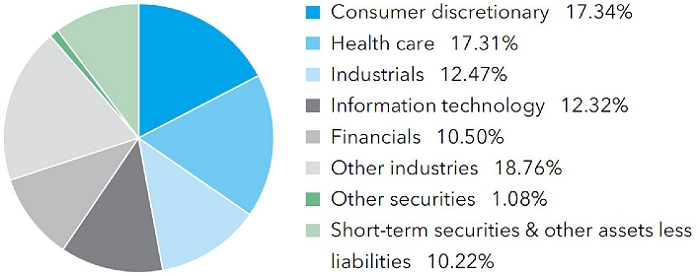
Summary investment portfolio September 30, 2015
| Industry sector diversification | Percent of net assets |
| Country diversification by domicile | | Percent of
net assets |
| United States | | | 44.18 | % |
| United Kingdom | | | 9.40 | |
| Euro zone* | | | 6.45 | |
| Japan | | | 5.17 | |
| India | | | 4.92 | |
| China | | | 2.64 | |
| Canada | | | 2.35 | |
| Hong Kong | | | 2.32 | |
| Taiwan | | | 1.72 | |
| Other countries | | | 10.63 | |
| Short-term securities & other assets less liabilities | | | 10.22 | |
| * | Countries using the euro as a common currency; those represented in the fund’s portfolio are Austria, Belgium, Finland, France, Germany, Greece, Ireland, Italy, the Netherlands, Slovenia and Spain. |
| Common stocks 88.70% | | Shares | | | Value
(000) | |
| Consumer discretionary 17.34% | | | | | | | | |
| Domino’s Pizza, Inc.1 | | | 3,125,769 | | | $ | 337,302 | |
| Lions Gate Entertainment Corp. | | | 6,877,000 | | | | 253,074 | |
| Ted Baker PLC1,2 | | | 3,167,993 | | | | 153,870 | |
| Dollarama Inc. | | | 2,078,000 | | | | 140,345 | |
| BCA Marketplace PLC1,2,3 | | | 42,870,000 | | | | 110,886 | |
| Paddy Power PLC2 | | | 886,051 | | | | 101,967 | |
| YOOX SpA2,3 | | | 2,998,469 | | | | 90,485 | |
| Other securities | | | | | | | 3,356,448 | |
| | | | | | | | 4,544,377 | |
| | | | | | | | | |
| Health care 17.31% | | | | | | | | |
| Incyte Corp.3 | | | 4,054,883 | | | | 447,375 | |
| Molina Healthcare, Inc.1,3 | | | 3,898,100 | | | | 268,384 | |
| Myriad Genetics, Inc.1,3 | | | 5,766,556 | | | | 216,131 | |
| Endo International PLC3 | | | 2,672,381 | | | | 185,143 | |
| Hikma Pharmaceuticals PLC2 | | | 4,794,253 | | | | 165,645 | |
| GW Pharmaceuticals PLC (ADR)1,3 | | | 1,652,700 | | | | 151,007 | |
| bluebird bio, Inc.3 | | | 1,588,565 | | | | 135,902 | |
| athenahealth, Inc.3 | | | 929,371 | | | | 123,932 | |
| EXACT Sciences Corp.1,3 | | | 6,801,000 | | | | 122,350 | |
| Spire Healthcare Group PLC1,2 | | | 22,412,000 | | | | 122,321 | |
| Ultragenyx Pharmaceutical Inc.3 | | | 1,175,906 | | | | 113,252 | |
| Centene Corp.3 | | | 1,959,439 | | | | 106,260 | |
| Kite Pharma, Inc.3 | | | 1,855,562 | | | | 103,318 | |
| CONMED Corp.1 | | | 2,141,654 | | | | 102,243 | |
| Zeltiq Aesthetics, Inc.1,3 | | | 3,002,044 | | | | 96,155 | |
| BioMarin Pharmaceutical Inc.3 | | | 883,852 | | | | 93,087 | |
| Sysmex Corp.2 | | | 1,698,000 | | | | 89,788 | |
| Juno Therapeutics, Inc.3 | | | 2,107,501 | | | | 85,754 | |
| Other securities | | | | | | | 1,807,046 | |
| | | | | | | | 4,535,093 | |
| | | | | | | | | |
| Industrials 12.47% | | | | | | | | |
| Hoshizaki Electric Co., Ltd.2 | | | 2,780,700 | | | | 195,044 | |
| Moog Inc., Class A3 | | | 2,572,800 | | | | 139,111 | |
| ITT Corp. | | | 3,508,121 | | | | 117,276 | |
| AA PLC2,3 | | | 24,237,138 | | | | 104,128 | |
| King Slide Works Co., Ltd.1,2 | | | 6,683,000 | | | | 91,490 | |
| Loomis AB, Class B2 | | | 3,363,042 | | | | 88,199 | |
| Other securities | | | | | | | 2,531,009 | |
| | | | | | | | 3,266,257 | |
| Common stocks (continued) | | Shares | | | Value
(000) | |
| Information technology 12.32% | | | | | | | | |
| Qorvo, Inc.3 | | | 3,884,370 | | | $ | 174,991 | |
| Kakaku.com, Inc.2 | | | 10,380,000 | | | | 168,763 | |
| AAC Technologies Holdings Inc.2 | | | 26,351,500 | | | | 164,832 | |
| Zynga Inc., Class A3 | | | 61,055,000 | | | | 139,205 | |
| Demandware, Inc.1,3 | | | 2,529,356 | | | | 130,717 | |
| Palo Alto Networks, Inc.3 | | | 558,050 | | | | 95,985 | |
| Halma PLC2 | | | 8,477,237 | | | | 92,733 | |
| Other securities | | | | | | | 2,262,178 | |
| | | | | | | | 3,229,404 | |
| | | | | | | | | |
| Financials 10.50% | | | | | | | | |
| Kotak Mahindra Bank Ltd.2 | | | 20,057,040 | | | | 199,063 | |
| SVB Financial Group3 | | | 1,305,700 | | | | 150,861 | |
| Validus Holdings, Ltd. | | | 2,813,000 | | | | 126,782 | |
| Umpqua Holdings Corp. | | | 7,004,541 | | | | 114,174 | |
| VZ Holding AG2 | | | 310,100 | | | | 96,486 | |
| GT Capital Holdings, Inc.2 | | | 3,485,200 | | | | 94,624 | |
| Indiabulls Housing Finance Ltd.2 | | | 7,725,000 | | | | 94,437 | |
| Other securities | | | | | | | 1,875,155 | |
| | | | | | | | 2,751,582 | |
| | | | | | | | | |
| Consumer staples 5.75% | | | | | | | | |
| Emami Ltd.2 | | | 7,665,000 | | | | 134,870 | |
| Emmi AG1,2 | | | 290,775 | | | | 121,550 | |
| Sprouts Farmers Market, Inc.3 | | | 5,543,000 | | | | 116,957 | |
| Pinnacle Foods Inc. | | | 2,389,050 | | | | 100,053 | |
| Raia Drogasil SA, ordinary nominative | | | 9,627,374 | | | | 94,950 | |
| Other securities | | | | | | | 937,391 | |
| | | | | | | | 1,505,771 | |
| | | | | | | | | |
| Materials 3.92% | | | | | | | | |
| Chr. Hansen Holding A/S2 | | | 2,593,200 | | | | 145,221 | |
| James Hardie Industries PLC (CDI)2 | | | 7,355,000 | | | | 88,770 | |
| Other securities | | | | | | | 793,826 | |
| | | | | | | | 1,027,817 | |
| | | | | | | | | |
| Utilities 0.97% | | | | | | | | |
| ENN Energy Holdings Ltd.2 | | | 19,994,000 | | | | 96,472 | |
| Other securities | | | | | | | 157,375 | |
| | | | | | | | 253,847 | |
| | | | | | | | | |
| Other 3.16% | | | | | | | | |
| Other securities | | | | | | | 828,423 | |
| | | | | | | | | |
| Miscellaneous 4.96% | | | | | | | | |
| Other common stocks in initial period of acquisition | | | | | | | 1,299,397 | |
| | | | | | | | | |
| Total common stocks (cost: $19,011,776,000) | | | | | | | 23,241,968 | |
| | | | | | | | | |
| Preferred securities 0.00% | | | | | | | | |
| Other 0.00% | | | | | | | | |
| Other securities | | | | | | | 1,255 | |
| | | | | | | | | |
| Total preferred securities (cost: $731,000) | | | | | | | 1,255 | |
| | | | | | | | | |
| Rights & warrants 0.06% | | | | | | | | |
| Other 0.06% | | | | | | | | |
| Other securities | | | | | | | 16,184 | |
| | | | | | | | | |
| Total rights & warrants (cost: $927,000) | | | | | | | 16,184 | |
| | | | | | | | | |
| Convertible stocks 0.66% | | | | | | | | |
| Other 0.66% | | | | | | | | |
| Other securities | | | | | | | 173,464 | |
| | | | | | | | | |
| Total convertible stocks (cost: $145,162,000) | | | | | | | 173,464 | |
| Bonds, notes & other debt instruments 0.36% | | Principal amount
(000) | | | Value
(000) | |
| Other 0.36% | | | | | | | | |
| Other securities | | | | | | $ | 94,173 | |
| | | | | | | | | |
| Total bonds, notes & other debt instruments (cost: $94,336,000) | | | | | | | 94,173 | |
| | | | | | | | | |
| Short-term securities 9.55% | | | | | | | | |
| American Honda Finance Corp. 0.17% due 10/22/2015–10/23/2015 | | $ | 90,000 | | | | 89,993 | |
| Bank of Tokyo-Mitsubishi UFJ, Ltd. 0.24% due 11/17/2015 | | | 50,000 | | | | 49,986 | |
| Federal Home Loan Bank 0.10%–0.22% due 10/19/2015–2/8/2016 | | | 576,300 | | | | 576,276 | |
| Freddie Mac 0.11%–0.25% due 11/2/2015–1/27/2016 | | | 352,900 | | | | 352,877 | |
| KfW 0.21%–0.23% due 10/23/2015–11/9/20154 | | | 147,200 | | | | 147,189 | |
| Mitsubishi UFJ Trust and Banking Corp. 0.22% due 10/14/20154 | | | 50,000 | | | | 49,997 | |
| Mizuho Bank, Ltd. 0.28%–0.30% due 10/23/2015–11/5/20154 | | | 118,500 | | | | 118,483 | |
| Nordea Bank AB 0.27%–0.32% due 11/10/2015–12/14/20154 | | | 90,000 | | | | 89,973 | |
| Old Line Funding, LLC 0.28% due 10/5/20154 | | | 35,000 | | | | 34,999 | |
| Province of Ontario 0.13%–0.15% due 10/15/2015–10/21/2015 | | | 88,500 | | | | 88,495 | |
| Svenska Handelsbanken Inc. 0.26%–0.30% due 10/23/2015–12/1/20154 | | | 124,800 | | | | 124,764 | |
| Thunder Bay Funding, LLC 0.28%–0.31% due 11/6/2015–11/10/20154 | | | 75,000 | | | | 74,981 | |
| Victory Receivables Corp. 0.19% due 10/28/20154 | | | 22,700 | | | | 22,696 | |
| Other securities | | | | | | | 681,368 | |
| | | | | | | | | |
| Total short-term securities (cost: $2,501,688,000) | | | | | | | 2,502,077 | |
| Total investment securities 99.33% (cost: $21,754,620,000) | | | | | | | 26,029,121 | |
| Other assets less liabilities 0.67% | | | | | | | 175,051 | |
| | | | | | | | | |
| Net assets 100.00% | | | | | | $ | 26,204,172 | |
This summary investment portfolio is designed to streamline the report and help investors better focus on the fund’s principal holdings. See the inside back cover for details on how to obtain a complete schedule of portfolio holdings.
As permitted by U.S. Securities and Exchange Commission regulations, “Miscellaneous” securities include holdings in their first year of acquisition that have not previously been publicly disclosed.
“Other securities” includes all issues that are not disclosed separately in the summary investment portfolio, including a portion of a security which was pledged as collateral. The total value of pledged collateral was $252,000, which represented less than .01% of the net assets of the fund.
Forward currency contracts
The fund has entered into forward currency contracts as shown in the following table. The average month-end notional amount of open forward currency contracts while held was $340,312,000.
| | | | | | | | | | | Unrealized | |
| | | | | | | | | | | appreciation | |
| | | | | | | Contract amount | | (depreciation) | |
| | | | | | | Receive | | Deliver | | at 9/30/2015 | |
| | | Settlement date | | Counterparty | | (000) | | (000) | | (000) | |
| Sales: | | | | | | | | | | | | |
| Australian dollars | | 10/19/2015 | | HSBC Bank | | $23,959 | | A$ 33,400 | | | $541 | |
| Australian dollars | | 10/26/2015 | | Barclays Bank PLC | | $1,061 | | A$ 1,450 | | | 45 | |
| Australian dollars | | 11/25/2015 | | UBS AG | | $1,397 | | A$ 2,000 | | | (2 | ) |
| British pounds | | 10/5/2015 | | JPMorgan Chase | | $42,196 | | £27,548 | | | 524 | |
| British pounds | | 10/9/2015 | | Citibank | | $54,060 | | £34,459 | | | 1,934 | |
| British pounds | | 10/9/2015 | | Barclays Bank PLC | | $22,184 | | £14,140 | | | 795 | |
| British pounds | | 10/14/2015 | | Bank of America, N.A. | | $72,798 | | £46,673 | | | 2,200 | |
| British pounds | | 10/14/2015 | | Barclays Bank PLC | | $6,430 | | £4,122 | | | 194 | |
| British pounds | | 10/19/2015 | | UBS AG | | $61,260 | | £39,721 | | | 1,177 | |
| British pounds | | 11/10/2015 | | Citibank | | $75,824 | | £49,322 | | | 1,227 | |
| Canadian dollars | | 10/7/2015 | | UBS AG | | $26,855 | | C$ 34,000 | | | 1,379 | |
| Euros | | 10/15/2015 | | Citibank | | $10,441 | | €9,200 | | | 159 | |
| Euros | | 10/20/2015 | | HSBC Bank | | $13,442 | | €11,884 | | | 159 | |
| Japanese yen | | 10/9/2015 | | JPMorgan Chase | | $14,093 | | ¥1,680,000 | | | 87 | |
| Japanese yen | | 10/9/2015 | | JPMorgan Chase | | $7,557 | | ¥900,000 | | | 54 | |
| Japanese yen | | 10/9/2015 | | Bank of America, N.A. | | $28,338 | | ¥3,395,000 | | | 35 | |
| Japanese yen | | 10/15/2015 | | Citibank | | $3,019 | | ¥364,000 | | | (16 | ) |
| Japanese yen | | 10/16/2015 | | UBS AG | | $7,061 | | ¥875,000 | | | (234 | ) |
| Japanese yen | | 10/21/2015 | | HSBC Bank | | $9,957 | | ¥1,200,000 | | | (48 | ) |
| Japanese yen | | 10/23/2015 | | UBS AG | | $5,601 | | ¥669,165 | | | 21 | |
| Japanese yen | | 10/23/2015 | | JPMorgan Chase | | $9,372 | | ¥1,125,000 | | | (9 | ) |
| Japanese yen | | 11/10/2015 | | Bank of America, N.A. | | $49,613 | | ¥5,940,000 | | | 73 | |
| Japanese yen | | 11/19/2015 | | Bank of New York Mellon | | $5,033 | | ¥625,000 | | | (180 | ) |
| Singapore dollars | | 11/24/2015 | | Barclays Bank PLC | | $19,168 | | S$ 26,880 | | | | 315 | |
| | | | | | | | | | | | | $10,430 | |
Investments in affiliates
A company is an affiliate of the fund under the Investment Company Act of 1940 if the fund’s holdings in that company represent 5% or more of the outstanding voting shares. The value of the fund’s affiliated-company holdings is either shown in the summary investment portfolio or included in the value of “Other securities” under the respective industry sectors. Further details on such holdings and related transactions during the year ended September 30, 2015, appear below.
| | | | | | | | | | | | | | | | | | Value of | |
| | | | | | | | | | | | | | | Dividend | | | affiliates at | |
| | | Beginning | | | | | | | | | Ending | | | income | | | 9/30/2015 | |
| | | shares | | | Additions | | | Reductions | | | shares | | | (000) | | | (000) | |
| Domino’s Pizza, Inc. | | | 3,218,769 | | | | — | | | | 93,000 | | | | 3,125,769 | | | $ | 3,712 | | | $ | 337,302 | |
| Molina Healthcare, Inc.3 | | | 3,488,100 | | | | 410,000 | | | | — | | | | 3,898,100 | | | | — | | | | 268,384 | |
| Myriad Genetics, Inc.3 | | | 5,725,556 | | | | 120,000 | | | | 79,000 | | | | 5,766,556 | | | | — | | | | 216,131 | |
| Ted Baker PLC2 | | | 3,154,993 | | | | 13,000 | | | | — | | | | 3,167,993 | | | | 1,997 | | | | 153,870 | |
| GW Pharmaceuticals PLC (ADR)3 | | | 1,215,600 | | | | 437,100 | | | | — | | | | 1,652,700 | | | | — | | | | 151,007 | |
| Demandware, Inc.3 | | | 1,803,000 | | | | 726,356 | | | | — | | | | 2,529,356 | | | | — | | | | 130,717 | |
| EXACT Sciences Corp.3,5 | | | 3,001,000 | | | | 3,800,000 | | | | — | | | | 6,801,000 | | | | — | | | | 122,350 | |
| Spire Healthcare Group PLC2 | | | 11,664,000 | | | | 10,748,000 | | | | — | | | | 22,412,000 | | | | 501 | | | | 122,321 | |
| Emmi AG2 | | | 240,600 | | | | 50,175 | | | | — | | | | 290,775 | | | | 1,139 | | | | 121,550 | |
| BCA Marketplace PLC2,3 | | | — | | | | 42,870,000 | | | | — | | | | 42,870,000 | | | | — | | | | 110,886 | |
| CONMED Corp. | | | 710,000 | | | | 1,431,654 | | | | — | | | | 2,141,654 | | | | 1,187 | | | | 102,243 | |
| Zeltiq Aesthetics, Inc.3 | | | 3,002,044 | | | | — | | | | — | | | | 3,002,044 | | | | — | | | | 96,155 | |
| King Slide Works Co., Ltd.2 | | | 4,913,000 | | | | 1,770,000 | | | | — | | | | 6,683,000 | | | | 1,481 | | | | 91,490 | |
| Globant SA3 | | | — | | | | 2,467,480 | | | | — | | | | 2,467,480 | | | | — | | | | 75,480 | |
| Zoopla Property Group PLC2,5 | | | 8,823,800 | | | | 14,597,300 | | | | — | | | | 23,421,100 | | | | 659 | | | | 74,125 | |
| HKBN Ltd.2 | | | — | | | | 60,888,000 | | | | — | | | | 60,888,000 | | | | — | | | | 70,449 | |
| Poundland Group PLC2,5 | | | 1,654,006 | | | | 14,244,500 | | | | — | | | | 15,898,506 | | | | 756 | | | | 67,464 | |
| zooplus AG, non-registered shares2,3 | | | 148,400 | | | | 379,378 | | | | — | | | | 527,778 | | | | — | | | | 66,561 | |
| | | | | | | | | | | | | | | | | | Value of | |
| | | | | | | | | | | | | | | Dividend | | | affiliates at | |
| | | Beginning | | | | | | | | | Ending | | | income | | | 9/30/2015 | |
| | | shares | | | Additions | | | Reductions | | | shares | | | (000) | | | (000) | |
| Takeuchi Mfg. Co., Ltd.2 | | | 1,232,300 | | | | 2,587,600 | | | | 49,500 | | | | 3,770,400 | | | $ | 267 | | | $ | 66,275 | |
| Continental Building Products, Inc.3 | | | 2,705,000 | | | | 330,700 | | | | — | | | | 3,035,700 | | | | — | | | | 62,353 | |
| eMemory Technology Inc.2 | | | — | | | | 6,146,000 | | | | — | | | | 6,146,000 | | | | 994 | | | | 61,208 | |
| WHA Corp. PCL, foreign registered2,3 | | | — | | | | 777,355,900 | | | | 100,214,700 | | | | 677,141,200 | | | | — | | | | 59,069 | |
| WHA Corp. PCL, warrants, expire 20203 | | | — | | | | 6,909,830 | | | | — | | | | 6,909,830 | | | | — | | | | 2,113 | |
| Finisar Corp.3 | | | 4,833,000 | | | | 553,000 | | | | — | | | | 5,386,000 | | | | — | | | | 59,946 | |
| Inphi Corp.3 | | | 1,785,699 | | | | 651,500 | | | | — | | | | 2,437,199 | | | | — | | | | 58,590 | |
| Entertainment One Ltd.2 | | | 13,659,782 | | | | 2,594,300 | | | | 1,000,000 | | | | 15,254,082 | | | | 160 | | | | 57,373 | |
| Talmer Bancorp, Inc., Class A | | | 3,068,056 | | | | 365,972 | | | | — | | | | 3,434,028 | | | | 130 | | | | 57,177 | |
| POYA International Co., Ltd.2 | | | 4,712,660 | | | | 875,556 | | | | — | | | | 5,588,216 | | | | 1,030 | | | | 55,967 | |
| NCC Group PLC2,5 | | | 5,665,000 | | | | 7,685,000 | | | | — | | | | 13,350,000 | | | | 680 | | | | 55,375 | |
| Adaptimmune Therapeutics PLC2,3,4 | | | — | | | | 16,938,900 | | | | — | | | | 16,938,900 | | | | — | | | | 30,752 | |
| Adaptimmune Therapeutics PLC (ADR)3 | | | — | | | | 1,713,918 | | | | — | | | | 1,713,918 | | | | — | | | | 20,516 | |
| Adaptimmune Therapeutics Ltd., Series A, convertible preferred2,6 | | | — | | | | 16,938,900 | | | | 16,938,900 | | | | — | | | | — | | | | — | |
| TechnoPro Holdings, Inc.2 | | | — | | | | 1,845,000 | | | | — | | | | 1,845,000 | | | | 1,353 | | | | 49,093 | |
| Northgate PLC2 | | | 10,626,805 | | | | — | | | | 3,718,406 | | | | 6,908,399 | | | | 1,853 | | | | 47,513 | |
| Lands’ End, Inc.3 | | | 1,300,000 | | | | 404,000 | | | | — | | | | 1,704,000 | | | | — | | | | 46,025 | |
| Sirius Minerals Plc2,3 | | | 139,533,460 | | | | 32,404,300 | | | | 18,860,000 | | | | 153,077,760 | | | | — | | | | 43,967 | |
| Sirius Minerals Plc, warrants, expire 20152,3 | | | 40,000,000 | | | | — | | | | 13,400,000 | | | | 26,600,000 | | | | — | | | | 1,066 | |
| Coupons.com Inc.3 | | | 4,587,996 | | | | 293,617 | | | | — | | | | 4,881,613 | | | | — | | | | 43,935 | |
| Stock Spirits Group PLC2 | | | 16,000,000 | | | | — | | | | 525,257 | | | | 15,474,743 | | | | 671 | | | | 43,308 | |
| Installed Building Products, Inc.3 | | | 2,068,345 | | | | 240,000 | | | | 604,306 | | | | 1,704,039 | | | | — | | | | 43,078 | |
| RIB Software AG2 | | | 2,476,356 | | | | — | | | | — | | | | 2,476,356 | | | | 385 | | | | 38,915 | |
| Tele Columbus AG2,3 | | | — | | | | 2,976,000 | | | | — | | | | 2,976,000 | | | | — | | | | 37,275 | |
| Mothercare PLC2,3 | | | 4,450,000 | | | | 6,360,000 | | | | — | | | | 10,810,000 | | | | — | | | | 36,195 | |
| Iridium Communications Inc.3 | | | 4,889,615 | | | | — | | | | — | | | | 4,889,615 | | | | — | | | | 30,071 | |
| Iridium Communications Inc., Series A, convertible preferred4 | | | 60,000 | | | | — | | | | — | | | | 60,000 | | | | — | | | | 5,009 | |
| Century Communities, Inc.3 | | | — | | | | 1,716,000 | | | | — | | | | 1,716,000 | | | | — | | | | 34,063 | |
| Cox & Kings Ltd.2 | | | 9,592,000 | | | | 1,425,346 | | | | 886,521 | | | | 10,130,825 | | | | 153 | | | | 31,825 | |
| Cox & Kings Ltd. (GDR)2 | | | 330,000 | | | | — | | | | — | | | | 330,000 | | | | 5 | | | | 1,037 | |
| Novadaq Technologies Inc.3 | | | 2,505,948 | | | | 579,000 | | | | — | | | | 3,084,948 | | | | — | | | | 32,176 | |
| Super Group Ltd.2 | | | 89,194,000 | | | | — | | | | 30,194,000 | | | | 59,000,000 | | | | 1,819 | | | | 32,043 | |
| Actua Corp3 | | | 2,094,000 | | | | 508,000 | | | | — | | | | 2,602,000 | | | | — | | | | 30,600 | |
| Twelve, Inc., Series C, convertible preferred2,7 | | | — | | | | 3,475,770 | | | | — | | | | 3,475,770 | | | | — | | | | 28,953 | |
| Zegona Communications PLC2,3 | | | — | | | | 12,305,654 | | | | — | | | | 12,305,654 | | | | — | | | | 28,841 | |
| Ocular Therapeutix, Inc.3,5 | | | 735,000 | | | | 1,220,700 | | | | — | | | | 1,955,700 | | | | — | | | | 27,497 | |
| CCL Products (India) Ltd.2 | | | — | | | | 7,278,328 | | | | — | | | | 7,278,328 | | | | 111 | | | | 26,235 | |
| Flexion Therapeutics, Inc.3 | | | 979,252 | | | | 723,942 | | | | — | | | | 1,703,194 | | | | — | | | | 25,309 | |
| Domo, Inc., Series D-2, convertible preferred2,7 | | | — | | | | 2,965,036 | | | | — | | | | 2,965,036 | | | | — | | | | 25,000 | |
| Acerta Pharma BV, Series B, convertible preferred2,7 | | | — | | | | 2,173,914 | | | | — | | | | 2,173,914 | | | | — | | | | 24,786 | |
| Neovasc Inc. (CAD denominated)2,3 | | | 4,277,000 | | | | — | | | | 30,100 | | | | 4,246,900 | | | | — | | | | 22,277 | |
| Neovasc Inc.3 | | | — | | | | 503,836 | | | | — | | | | 503,836 | | | | — | | | | 2,489 | |
| ARC Document Solutions, Inc.3 | | | 3,734,755 | | | | 856,372 | | | | 830,804 | | | | 3,760,323 | | | | — | | | | 22,374 | |
| J. Kumar Infraprojects Ltd.2 | | | 1,780,000 | | | | — | | | | — | | | | 1,780,000 | | | | 107 | | | | 21,484 | |
| ChemoCentryx, Inc.3 | | | 3,426,800 | | | | 40,440 | | | | — | | | | 3,467,240 | | | | — | | | | 20,977 | |
| TravelCenters of America LLC3 | | | 2,023,750 | | | | — | | | | — | | | | 2,023,750 | | | | — | | | | 20,905 | |
| Beauty Community PCL, foreign registered2 | | | — | | | | 150,000,000 | | | | — | | | | 150,000,000 | | | | 453 | | | | 18,791 | |
| Papa Murphy’s Holdings, Inc.3 | | | 1,102,000 | | | | 100,000 | | | | — | | | | 1,202,000 | | | | — | | | | 17,645 | |
| KEYW Holding Corp.3 | | | 2,836,400 | | | | — | | | | — | | | | 2,836,400 | | | | — | | | | 17,444 | |
| Sonus Networks, Inc.3,5 | | | 500,000 | | | | 3,638,000 | | | | 1,200,000 | | | | 2,938,000 | | | | — | | | | 16,805 | |
| Suprema Inc.2 | | | 868,200 | | | | — | | | | — | | | | 868,200 | | | | — | | | | 16,574 | |
| Trupanion, Inc.3 | | | — | | | | 2,155,668 | | | | — | | | | 2,155,668 | | | | — | | | | 16,275 | |
| Mahindra Lifespace Developers Ltd.2 | | | 2,157,380 | | | | — | | | | — | | | | 2,157,380 | | | | 204 | | | | 15,548 | |
| MagnaChip Semiconductor Corp.3 | | | 1,200,000 | | | | 1,155,000 | | | | — | | | | 2,355,000 | | | | — | | | | 15,519 | |
| Sinmag Equipment Corp.2,5 | | | 75,000 | | | | 3,802,020 | | | | — | | | | 3,877,020 | | | | 828 | | | | 14,066 | |
| Venture Global LNG, Inc., Class C2,3,7 | | | — | | | | 4,240 | | | | — | | | | 4,240 | | | | — | | | | 12,720 | |
| Tidewater Midstream and Infrastructure Ltd.2,4 | | | — | | | | 12,444,000 | | | | — | | | | 12,444,000 | | | | 79 | | | | 12,575 | |
| Greenko Group PLC2,3 | | | 9,748,155 | | | | — | | | | — | | | | 9,748,155 | | | | — | | | | 10,768 | |
| EVINE Live Inc., Class A3 | | | 3,987,540 | | | | — | | | | — | | | | 3,987,540 | | | | — | | | | 10,447 | |
| Mytrah Energy Ltd.2,3 | | | 10,418,000 | | | | — | | | | — | | | | 10,418,000 | | | | — | | | | 9,937 | |
| Talwalkars Better Value Fitness Ltd.2 | | | 1,694,000 | | | | 695,000 | | | | — | | | | 2,389,000 | | | | 54 | | | | 8,565 | |
| Xenon Pharmaceuticals Inc.3 | | | — | | | | 1,030,000 | | | | — | | | | 1,030,000 | | | | — | | | | 8,508 | |
| Tribhovandas Bhimji Zaveri Ltd.2 | | | 4,335,732 | | | | — | | | | — | | | | 4,335,732 | | | | 65 | | | | 7,648 | |
| | | | | | | | | | | | | | | | | | Value of | |
| | | | | | | | | | | | | | | Dividend | | | affiliates at | |
| | | Beginning | | | | | | | | | Ending | | | income | | | 9/30/2015 | |
| | | shares | | | Additions | | | Reductions | | | shares | | | (000) | | | (000) | |
| ITT Educational Services, Inc.3 | | | 1,519,000 | | | | 350,000 | | | | — | | | | 1,869,000 | | | $ | — | | | $ | 6,411 | |
| RMP Energy Inc.3 | | | — | | | | 6,670,300 | | | | — | | | | 6,670,300 | | | | — | | | | 6,348 | |
| Lekoil Ltd. (CDI)2,3 | | | 14,070,000 | | | | 5,360,400 | | | | — | | | | 19,430,400 | | | | — | | | | 6,242 | |
| Lekoil Ltd. (CDI)3,4,6 | | | 5,360,400 | | | | — | | | | 5,360,400 | | | | — | | | | — | | | | — | |
| Delphi Energy Corp.3,5 | | | 6,713,685 | | | | 5,721,315 | | | | 2,256,500 | | | | 10,178,500 | | | | — | | | | 5,263 | |
| Savannah Petroleum PLC2,3 | | | 7,844,000 | | | | 3,000,000 | | | | — | | | | 10,844,000 | | | | — | | | | 5,086 | |
| BNK Petroleum Inc.3 | | | 12,804,914 | | | | — | | | | — | | | | 12,804,914 | | | | — | | | | 3,646 | |
| San Leon Energy PLC2,3 | | | 155,300,000 | | | | 2,450,000 | | | | 153,747,000 | | | | 4,003,000 | | | | — | | | | 3,605 | |
| Altisource Asset Management Corp.3 | | | 56,153 | | | | 82,607 | | | | 21,834 | | | | 116,926 | | | | — | | | | 2,800 | |
| 7-Eleven Malaysia Holdings Bhd.2,6 | | | 76,209,600 | | | | — | | | | 76,209,600 | | | | — | | | | 601 | | | | — | |
| AA PLC2,3,6 | | | 44,319,669 | | | | 4,154,968 | | | | 24,237,499 | | | | 24,237,138 | | | | — | | | | — | |
| Achillion Pharmaceuticals, Inc.3,6 | | | 4,930,000 | | | | 185,000 | | | | 5,115,000 | | | | — | | | | — | | | | — | |
| bluebird bio, Inc.3,6 | | | 2,287,565 | | | | — | | | | 699,000 | | | | 1,588,565 | | | | — | | | | — | |
| Boer Power Holdings Ltd.2,6 | | | 39,202,000 | | | | — | | | | 8,364,000 | | | | 30,838,000 | | | | 1,681 | | | | — | |
| Cape Lambert Resources Ltd.3,6 | | | 47,330,825 | | | | — | | | | 47,330,825 | | | | — | | | | — | | | | — | |
| China High Precision Automation Group Ltd.2,3,6 | | | 53,032,000 | | | | — | | | | 53,032,000 | | | | — | | | | — | | | | — | |
| Duluth Metals Ltd.3,6 | | | 7,024,000 | | | | — | | | | 7,024,000 | | | | — | | | | — | | | | — | |
| Five Below, Inc.3,6 | | | 2,530,694 | | | | 513,000 | | | | 2,133,694 | | | | 910,000 | | | | — | | | | — | |
| Frigoglass SAIC2,3,6 | | | 3,052,380 | | | | — | | | | 3,052,380 | | | | — | | | | — | | | | — | |
| Galapagos NV2,3,6 | | | 2,422,427 | | | | — | | | | 969,892 | | | | 1,452,535 | | | | — | | | | — | |
| Gem Diamonds Ltd.2,3,6 | | | 7,625,000 | | | | — | | | | 7,625,000 | | | | — | | | | — | | | | — | |
| GI Dynamics, Inc. (CDI)2,6 | | | 30,320,000 | | | | — | | | | 30,320,000 | | | | — | | | | — | | | | — | |
| Houston Wire & Cable Co.6 | | | 1,150,000 | | | | — | | | | 1,150,000 | | | | — | | | | 276 | | | | — | |
| iEnergizer Ltd.2,3,6 | | | 7,650,500 | | | | — | | | | — | | | | 7,650,500 | | | | — | | | | — | |
| Intrepid Potash, Inc.3,6 | | | 4,895,000 | | | | 745,352 | | | | 5,640,352 | | | | — | | | | — | | | | — | |
| Kaveri Seed Co. Ltd.2,6 | | | 3,470,177 | | | | 660,793 | | | | 1,040,970 | | | | 3,090,000 | | | | 593 | | | | — | |
| Lions Gate Entertainment Corp.6 | | | 7,146,000 | | | | — | | | | 269,000 | | | | 6,877,000 | | | | 1,774 | | | | — | |
| Manappuram Finance Ltd.2,6 | | | 54,930,986 | | | | — | | | | 27,000,000 | | | | 27,930,986 | | | | 1,504 | | | | — | |
| Mistras Group, Inc.3,6 | | | 1,460,000 | | | | — | | | | 1,460,000 | | | | — | | | | — | | | | — | |
| Mood Media Corp. (CDI)6 | | | 3,710,000 | | | | — | | | | 3,710,000 | | | | — | | | | — | | | | — | |
| Mood Media Corp.3,6 | | | 6,375,000 | | | | 3,710,000 | | | | 10,085,000 | | | | — | | | | — | | | | — | |
| OM Group, Inc.3,6 | | | 1,560,000 | | | | — | | | | 1,560,000 | | | | — | | | | 246 | | | | — | |
| Phorm Corp. Ltd.2,3,6 | | | 15,890,000 | | | | 27,500,000 | | | | — | | | | 43,390,000 | | | | — | | | | — | |
| Powerland AG, non-registered shares2,6 | | | 1,200,000 | | | | — | | | | 1,200,000 | | | | — | | | | — | | | | — | |
| Repco Home Finance Ltd.2,6 | | | 4,040,440 | | | | — | | | | 2,868,440 | | | | 1,172,000 | | | | — | | | | — | |
| Stock Building Supply Holdings, Inc.3,6 | | | 1,785,000 | | | | — | | | | 1,205,778 | | | | 579,222 | | | | — | | | | — | |
| Synageva BioPharma Corp.3,6 | | | 2,190,074 | | | | 35,000 | | | | 2,225,074 | | | | — | | | | — | | | | — | |
| Tethys Petroleum Ltd.3,6 | | | 12,161,000 | | | | 4,647,487 | | | | — | | | | 16,808,487 | | | | — | | | | — | |
| Tethys Petroleum Ltd. (GBP denominated)3,6 | | | 4,647,487 | | | | — | | | | 4,647,487 | | | | — | | | | — | | | | — | |
| Tilaknager Industries Ltd.6 | | | 8,270,086 | | | | — | | | | 8,270,086 | | | | — | | | | — | | | | — | |
| TriQuint Semiconductor, Inc.3,6 | | | 9,012,000 | | | | — | | | | 9,012,000 | | | | — | | | | — | | | | — | |
| Ultragenyx Pharmaceutical Inc.3,6 | | | 1,628,457 | | | | 33,743 | | | | 486,294 | | | | 1,175,906 | | | | — | | | | — | |
| VST Industries Ltd.2,6 | | | 1,003,400 | | | | — | | | | 338,400 | | | | 665,000 | | | | 942 | | | | — | |
| Wizz Air Holdings PLC2,3,6 | | | — | | | | 3,498,684 | | | | 1,932,699 | | | | 1,565,985 | | | | — | | | | — | |
| XenoPort, Inc.3,6 | | | 4,769,000 | | | | — | | | | 4,065,334 | | | | 703,666 | | | | — | | | | — | |
| Xoom Corp.3,6 | | | 3,035,570 | | | | 40,235 | | | | 3,075,805 | | | | — | | | | — | | | | — | |
| | | | | | | | | | | | | | | | | | | $ | 30,450 | | | $ | 4,218,756 | |
The following footnotes apply to either the individual securities noted or one or more of the securities aggregated and listed as a single line item.
| 1 | Represents an affiliated company as defined under the Investment Company Act of 1940. |
| 2 | Valued under fair value procedures adopted by authority of the board of directors. The total value of all such securities, including those in “Miscellaneous” and “Other securities,” was $10,869,522,000, which represented 41.48% of the net assets of the fund. This amount includes $10,552,479,000 related to certain securities trading outside the U.S. whose values were adjusted as a result of significant market movements following the close of local trading. |
| 3 | Security did not produce income during the last 12 months. |
| 4 | Acquired in a transaction exempt from registration under Rule 144A or Section 4(2) of the Securities Act of 1933. May be resold in the U.S. in transactions exempt from registration, normally to qualified institutional buyers. The total value of all such securities, including those in “Other securities,” was $1,112,791,000, which represented 4.25% of the net assets of the fund. |
| 5 | This security was an unaffiliated issuer in its initial period of acquisition at 9/30/2014; it was not publicly disclosed. |
| 6 | Unaffiliated issuer at 9/30/2015. |
| 7 | Acquired through a private placement transaction exempt from registration under the Securities Act of 1933. May be subject to legal or contractual restrictions on resale. Further details on these holdings appear below. |
| | |
| | | | | | | | | | | Percent | |
| | | Acquisition | | Cost | | | Value | | | of net | |
| Private placement securities | | date(s) | | (000) | | | (000) | | | assets | |
| Twelve, Inc., Series C, convertible preferred | | 4/16/2015 | | $ | 7,890 | | | $ | 28,953 | | | | .11 | % |
| Domo, Inc., Series D-2, convertible preferred | | 3/31/2015 | | | 25,000 | | | | 25,000 | | | | .10 | |
| Acerta Pharma BV, Series B, convertible preferred | | 5/7/2015 | | | 25,000 | | | | 24,786 | | | | .09 | |
| Venture Global LNG, Inc., Class C | | 5/1/2015 | | | 12,720 | | | | 12,720 | | | | .05 | |
| Other private placement securities | | 8/27/2012-7/23/2014 | | | 102,008 | | | | 107,094 | | | | .41 | |
| Total private placement securities | | | | $ | 172,618 | | | $ | 198,553 | | | | .76 | % |
Key to abbreviations and symbols
ADR = American Depositary Receipts
CDI = CREST Depository Interest
A$ = Australian dollars
CAD/C$ = Canadian dollars
€ = Euros
GBP/£ = British pounds
¥ = Japanese yen
S$ = Singapore dollars
See Notes to Financial Statements
Financial statements
Statement of assets and liabilities
at September 30, 2015 | | | (dollars in thousands) | |
| | | | | | | | | |
| Assets: | | | | | | | | |
| Investment securities, at value: | | | | | | | | |
| Unaffiliated issuers (cost: $18,140,200) | | $ | 21,810,365 | | | | | |
| Affiliated issuers (cost: $3,614,420) | | | 4,218,756 | | | $ | 26,029,121 | |
| Cash denominated in currencies other than U.S. dollars (cost: $10,589) | | | | | | | 10,589 | |
| Cash | | | | | | | 7,142 | |
| Unrealized appreciation on open forward currency contracts | | | | | | | 10,919 | |
| Receivables for: | | | | | | | | |
| Sales of investments | | | 254,810 | | | | | |
| Sales of fund’s shares | | | 35,284 | | | | | |
| Dividends and interest | | | 25,007 | | | | | |
| Other | | | 903 | | | | 316,004 | |
| | | | | | | | 26,373,775 | |
| Liabilities: | | | | | | | | |
| Unrealized depreciation on open forward currency contracts | | | | | | | 489 | |
| Payables for: | | | | | | | | |
| Purchases of investments | | | 92,721 | | | | | |
| Repurchases of fund’s shares | | | 37,769 | | | | | |
| Closed forward currency contracts | | | 109 | | | | | |
| Investment advisory services | | | 14,002 | | | | | |
| Services provided by related parties | | | 6,679 | | | | | |
| Directors’ deferred compensation | | | 3,323 | | | | | |
| Other | | | 14,511 | | | | 169,114 | |
| | | | | | | $ | 26,204,172 | |
| Net assets at September 30, 2015 | | | | | | | | |
| | | | | | | | | |
| Net assets consist of: | | | | | | | | |
| Capital paid in on shares of capital stock | | | | | | $ | 20,296,206 | |
| Accumulated net investment loss | | | | | | | (181,544 | ) |
| Undistributed net realized gain | | | | | | | 1,817,640 | |
| Net unrealized appreciation | | | | | | | 4,271,870 | |
| Net assets at September 30, 2015 | | | | | | $ | 26,204,172 | |
(dollars and shares in thousands, except per-share amounts)
Total authorized capital stock — 1,000,000 shares,
$.01 par value (585,671 total shares outstanding)
| | | Net assets | | | Shares
outstanding | | | Net asset value
per share | |
| Class A | | $ | 16,881,688 | | | | 374,793 | | | $ | 45.04 | |
| Class B | | | 64,642 | | | | 1,565 | | | | 41.32 | |
| Class C | | | 847,000 | | | | 20,796 | | | | 40.73 | |
| Class F-1 | | | 661,601 | | | | 14,834 | | | | 44.60 | |
| Class F-2 | | | 1,487,410 | | | | 32,746 | | | | 45.42 | |
| Class 529-A | | | 943,128 | | | | 21,134 | | | | 44.63 | |
| Class 529-B | | | 9,692 | | | | 233 | | | | 41.70 | |
| Class 529-C | | | 274,572 | | | | 6,625 | | | | 41.45 | |
| Class 529-E | | | 49,351 | | | | 1,131 | | | | 43.63 | |
| Class 529-F-1 | | | 82,735 | | | | 1,840 | | | | 44.98 | |
| Class R-1 | | | 35,871 | | | | 857 | | | | 41.85 | |
| Class R-2 | | | 631,788 | | | | 15,096 | | | | 41.85 | |
| Class R-2E | | | 66 | | | | 1 | | | | 45.04 | |
| Class R-3 | | | 775,990 | | | | 17,815 | | | | 43.56 | |
| Class R-4 | | | 714,802 | | | | 15,986 | | | | 44.71 | |
| Class R-5 | | | 474,251 | | | | 10,324 | | | | 45.94 | |
| Class R-6 | | | 2,269,585 | | | | 49,895 | | | | 45.49 | |
See Notes to Financial Statements
Statement of operations
for the year ended September 30, 2015 | | | (dollars in thousands) | |
| | | | | |
| Investment income: | | | | | | | | |
| Income: | | | | | | | | |
| Dividends (net of non-U.S. taxes of $11,016; also includes $30,450 from affiliates) | | $ | 308,672 | | | | | |
| Interest (net of non-U.S. taxes of $70) | | | 4,335 | | | $ | 313,007 | |
| Fees and expenses*: | | | | | | | | |
| Investment advisory services | | | 170,815 | | | | | |
| Distribution services | | | 70,479 | | | | | |
| Transfer agent services | | | 41,123 | | | | | |
| Administrative services | | | 6,451 | | | | | |
| Reports to shareholders | | | 1,560 | | | | | |
| Registration statement and prospectus | | | 1,006 | | | | | |
| Directors’ compensation | | | 430 | | | | | |
| Auditing and legal | | | 468 | | | | | |
| Custodian | | | 3,816 | | | | | |
| State and local taxes | | | 4 | | | | | |
| Other | | | 1,410 | | | | 297,562 | |
| Net investment income | | | | | | | 15,445 | |
| | | | | | | | | |
| Net realized gain and unrealized depreciation: | | | | | | | | |
| Net realized gain (loss) on: | | | | | | | | |
| Investments (net of non-U.S. taxes of $2,637; also includes $280,714 net gain from affiliates) | | | 1,892,044 | | | | | |
| Forward currency contracts | | | 22,436 | | | | | |
| Currency transactions | | | (2,240 | ) | | | 1,912,240 | |
| Net unrealized (depreciation) appreciation on: | | | | | | | | |
| Investments (net of non-U.S. taxes of $13,377) | | | (1,441,236 | ) | | | | |
| Forward currency contracts | | | 5,153 | | | | | |
| Currency translations | | | 776 | | | | (1,435,307 | ) |
| Net realized gain and unrealized depreciation | | | | | | | 476,933 | |
| | | | | | | | | |
| Net increase in net assets resulting from operations | | | | | | $ | 492,378 | |
| * | Additional information related to class-specific fees and expenses is included in the Notes to Financial Statements. |
| Statements of changes in net assets | |
| | (dollars in thousands) |
| | | | Year ended September 30 | |
| | | | 2015 | | | | 2014 | |
| Operations: | | | | | | | | |
| Net investment income (loss) | | $ | 15,445 | | | $ | (6,006 | ) |
| Net realized gain | | | 1,912,240 | | | | 2,602,946 | |
| Net unrealized depreciation | | | (1,435,307 | ) | | | (1,519,670 | ) |
| Net increase in net assets resulting from operations | | | 492,378 | | | | 1,077,270 | |
| | | | | | | | | |
| Distributions paid to shareholders from net realized gain on investments | | | (2,489,781 | ) | | | (1,231,152 | ) |
| | | | | | | | | |
| Net capital share transactions | | | 2,563,419 | | | | 1,351,365 | |
| | | | | | | | | |
| Total increase in net assets | | | 566,016 | | | | 1,197,483 | |
| | | | | | | | | |
| Net assets: | | | | | | | | |
| Beginning of year | | | 25,638,156 | | | 24,440,673 | |
End of year (including accumulated net investment loss:
$(181,544) and $(147,181), respectively) | | $ | 26,204,172 | | | $ | 25,638,156 | |
See Notes to Financial Statements
Notes to financial statements
1. Organization
SMALLCAP World Fund, Inc. (the “fund”) is registered under the Investment Company Act of 1940 as an open-end, diversified management investment company. The fund seeks to provide long-term growth of capital. Shareholders approved a proposal to reorganize the fund from a Maryland corporation to a Delaware statutory trust. The reorganization may be completed in the next year; however, the fund reserves the right to delay the implementation.
The fund has 17 share classes consisting of five retail share classes (Classes A, B and C, as well as two F share classes, F-1 and F-2), five 529 college savings plan share classes (Classes 529-A, 529-B, 529-C, 529-E and 529-F-1) and seven retirement plan share classes (Classes R-1, R-2, R-2E, R-3, R-4, R-5 and R-6). The 529 college savings plan share classes can be used to save for college education. The retirement plan share classes are generally offered only through eligible employer-sponsored retirement plans. The fund’s share classes are described further in the following table:
| Share class | | Initial sales charge | | Contingent deferred sales
charge upon redemption | | Conversion feature |
| Classes A and 529-A | | Up to 5.75% | | None (except 1% for certain redemptions within one year of purchase without an initial sales charge) | | None |
| Classes B and 529-B* | | None | | Declines from 5% to 0% for redemptions within six years of purchase | | Classes B and 529-B convert to Classes A and 529-A, respectively, after eight years |
| Class C | | None | | 1% for redemptions within one year of purchase | | Class C converts to Class F-1 after 10 years |
| Class 529-C | | None | | 1% for redemptions within one year of purchase | | None |
| Class 529-E | | None | | None | | None |
| Classes F-1, F-2 and 529-F-1 | | None | | None | | None |
| Classes R-1, R-2, R-2E, R-3, R-4, R-5 and R-6 | | None | | None | | None |
| * | Class B and 529-B shares of the fund are not available for purchase. |
Holders of all share classes have equal pro rata rights to the assets, dividends and liquidation proceeds of the fund. Each share class has identical voting rights, except for the exclusive right to vote on matters affecting only its class. Share classes have different fees and expenses (“class-specific fees and expenses”), primarily due to different arrangements for distribution, transfer agent and administrative services. Differences in class-specific fees and expenses will result in differences in net investment income and, therefore, the payment of different per-share dividends by each share class.
2. Significant accounting policies
The fund is an investment company that applies the accounting and reporting guidance issued in Topic 946 by the U.S. Financial Accounting Standards Board. The fund’s financial statements have been prepared to comply with U.S. generally accepted accounting principles (“U.S. GAAP“). These principles require the fund’s investment adviser to make estimates and assumptions that affect reported amounts and disclosures. Actual results could differ from those estimates. Subsequent events, if any, have been evaluated through the date of issuance in the preparation of the financial statements. The fund follows the significant accounting policies described in this section, as well as the valuation policies described in the next section on valuation.
Security transactions and related investment income — Security transactions are recorded by the fund as of the date the trades are executed with brokers. Realized gains and losses from security transactions are determined based on the specific identified cost of the securities. In the event a security is purchased with a delayed payment date, the fund will segregate liquid assets sufficient to meet its payment obligations. Dividend income is recognized on the ex-dividend date and interest income is recognized on an accrual basis. Market discounts, premiums and original issue discounts on fixed-income securities are amortized daily over the expected life of the security.
Class allocations — Income, fees and expenses (other than class-specific fees and expenses) and realized and unrealized gains and losses are allocated daily among the various share classes based on their relative net assets. Class-specific fees and expenses, such as distribution, transfer agent and administrative services, are charged directly to the respective share class.
Dividends and distributions to shareholders — Dividends and distributions to shareholders are recorded on the ex-dividend date.
Currency translation — Assets and liabilities, including investment securities, denominated in currencies other than U.S. dollars are translated into U.S. dollars at the exchange rates supplied by one or more pricing vendors on the valuation date. Purchases and sales of investment securities and income and expenses are translated into U.S. dollars at the exchange rates on the dates of such transactions. The effects of changes in exchange rates on investment securities are included with the net realized gain or loss and net unrealized appreciation or depreciation on investments in the fund’s statement of operations. The realized gain or loss and unrealized appreciation or depreciation resulting from all other transactions denominated in currencies other than U.S. dollars are disclosed separately.
3. Valuation
Capital Research and Management Company (“CRMC”), the fund’s investment adviser, values the fund’s investments at fair value as defined by U.S. GAAP. The net asset value of each share class of the fund is generally determined as of approximately 4:00 p.m. New York time each day the New York Stock Exchange is open.
Methods and inputs — The fund’s investment adviser uses the following methods and inputs to establish the fair value of the fund’s assets and liabilities. Use of particular methods and inputs may vary over time based on availability and relevance as market and economic conditions evolve.
Equity securities are generally valued at the official closing price of, or the last reported sale price on, the exchange or market on which such securities are traded, as of the close of business on the day the securities are being valued or, lacking any sales, at the last available bid price. Prices for each security are taken from the principal exchange or market on which the security trades.
Fixed-income securities, including short-term securities, are generally valued at prices obtained from one or more pricing vendors. Vendors value such securities based on one or more of the inputs described in the following table. The table provides examples of inputs that are commonly relevant for valuing particular classes of fixed-income securities in which the fund is authorized to invest. However, these classifications are not exclusive, and any of the inputs may be used to value any other class of fixed-income security.
| Fixed-income class | | Examples of standard inputs |
| All | | Benchmark yields, transactions, bids, offers, quotations from dealers and trading systems, new issues, spreads and other relationships observed in the markets among comparable securities; and proprietary pricing models such as yield measures calculated using factors such as cash flows, financial or collateral performance and other reference data (collectively referred to as “standard inputs”) |
| Corporate bonds & notes; convertible securities | | Standard inputs and underlying equity of the issuer |
| Bonds & notes of governments & government agencies | | Standard inputs and interest rate volatilities |
When the fund’s investment adviser deems it appropriate to do so (such as when vendor prices are unavailable or deemed to be not representative), fixed-income securities will be valued in good faith at the mean quoted bid and ask prices that are reasonably and timely available (or bid prices, if ask prices are not available) or at prices for securities of comparable maturity, quality and type.
Securities with both fixed-income and equity characteristics, or equity securities traded principally among fixed-income dealers, are generally valued in the manner described for either equity or fixed-income securities, depending on which method is deemed most appropriate by the fund’s investment adviser. Forward currency contracts are valued at the mean of representative quoted bid and ask prices, generally based on prices supplied by one or more pricing vendors.
Securities and other assets for which representative market quotations are not readily available or are considered unreliable by the fund’s investment adviser are fair valued as determined in good faith under fair valuation guidelines adopted by authority of the fund’s board of directors as further described. The investment adviser follows fair valuation guidelines, consistent with U.S. Securities and Exchange Commission rules and guidance, to consider relevant principles and factors when making fair value determinations. The investment adviser considers relevant indications of value that are reasonably and timely available to it in determining the fair value to be assigned to a particular security, such as the type and cost of the security; contractual or legal restrictions on resale of the security; relevant financial or business developments of the issuer; actively traded similar or related securities; conversion or exchange rights on the security; related corporate actions; significant events occurring after the close of trading in the security; and changes in overall market conditions. In addition, the closing prices of equity securities that trade in markets outside U.S. time zones may be adjusted to reflect significant events
that occur after the close of local trading but before the net asset value of each share class of the fund is determined. Fair valuations and valuations of investments that are not actively trading involve judgment and may differ materially from valuations that would have been used had greater market activity occurred.
Processes and structure — The fund’s board of directors has delegated authority to the fund’s investment adviser to make fair value determinations, subject to board oversight. The investment adviser has established a Joint Fair Valuation Committee (the “Fair Valuation Committee”) to administer, implement and oversee the fair valuation process, and to make fair value decisions. The Fair Valuation Committee regularly reviews its own fair value decisions, as well as decisions made under its standing instructions to the investment adviser’s valuation teams. The Fair Valuation Committee reviews changes in fair value measurements from period to period and may, as deemed appropriate, update the fair valuation guidelines to better reflect the results of back testing and address new or evolving issues. The Fair Valuation Committee reports any changes to the fair valuation guidelines to the board of directors with supplemental information to support the changes. The fund’s board and audit committee also regularly review reports that describe fair value determinations and methods.
The fund’s investment adviser has also established a Fixed-Income Pricing Review Group to administer and oversee the fixed-income valuation process, including the use of fixed-income pricing vendors. This group regularly reviews pricing vendor information and market data. Pricing decisions, processes and controls over security valuation are also subject to additional internal reviews, including an annual control self-evaluation program facilitated by the investment adviser’s compliance group.
Classifications — The fund’s investment adviser classifies the fund’s assets and liabilities into three levels based on the inputs used to value the assets or liabilities. Level 1 values are based on quoted prices in active markets for identical securities. Level 2 values are based on significant observable market inputs, such as quoted prices for similar securities and quoted prices in inactive markets. Certain securities trading outside the U.S. may transfer between Level 1 and Level 2 due to valuation adjustments resulting from significant market movements following the close of local trading. Level 3 values are based on significant unobservable inputs that reflect the investment adviser’s determination of assumptions that market participants might reasonably use in valuing the securities. The valuation levels are not necessarily an indication of the risk or liquidity associated with the underlying investment. For example, U.S. government securities are reflected as Level 2 because the inputs used to determine fair value may not always be quoted prices in an active market. The following tables present the fund’s valuation levels as of September 30, 2015 (dollars in thousands):
| | | | Investment securities | |
| | | Level 1 | | | Level 2* | | | Level 3 | | | Total | |
| Assets: | | | | | | | | | | | | | | | | |
| Common stocks: | | | | | | | | | | | | | | | | |
| Consumer discretionary | | $ | 2,243,718 | | | $ | 2,300,638 | | | $ | 21 | | | $ | 4,544,377 | |
| Health care | | | 3,661,040 | | | | 874,053 | | | | — | | | | 4,535,093 | |
| Industrials | | | 1,298,199 | | | | 1,963,711 | | | | 4,347 | | | | 3,266,257 | |
| Information technology | | | 1,825,349 | | | | 1,398,782 | | | | 5,273 | | | | 3,229,404 | |
| Financials | | | 1,569,732 | | | | 1,181,850 | | | | — | | | | 2,751,582 | |
| Consumer staples | | | 483,187 | | | | 1,022,584 | | | | — | | | | 1,505,771 | |
| Materials | | | 368,880 | | | | 658,937 | | | | — | | | | 1,027,817 | |
| Utilities | | | 14,306 | | | | 239,541 | | | | — | | | | 253,847 | |
| Other | | | 492,574 | | | | 323,129 | | | | 12,720 | | | | 828,423 | |
| Miscellaneous | | | 597,987 | | | | 683,801 | | | | 17,609 | | | | 1,299,397 | |
| Preferred securities | | | 1,255 | | | | — | | | | — | | | | 1,255 | |
| Rights & warrants | | | 2,113 | | | | 1,966 | | | | 12,105 | | | | 16,184 | |
| Convertible stocks | | | — | | | | 5,009 | | | | 168,455 | | | | 173,464 | |
| Bonds, notes & other debt instruments | | | — | | | | 94,173 | | | | — | | | | 94,173 | |
| Short-term securities | | | — | | | | 2,502,077 | | | | — | | | | 2,502,077 | |
| Total | | $ | 12,558,340 | | | $ | 13,250,251 | | | $ | 220,530 | | | $ | 26,029,121 | |
| | | Other investments† | |
| | | Level 1 | | | Level 2 | | | Level 3 | | | Total | |
| Assets: | | | | | | | | | | | | | | | | |
| Unrealized appreciation on open forward currency contracts | | $ | — | | | $ | 10,919 | | | $ | — | | | $ | 10,919 | |
| Liabilities: | | | | | | | | | | | | | | | | |
| Unrealized depreciation on open forward currency contracts | | | — | | | | (489 | ) | | | — | | | | (489 | ) |
| Total | | $ | — | | | $ | 10,430 | | | $ | — | | | $ | 10,430 | |
| * | Securities with a value of $7,967,539,000, which represented 30.41% of the net assets of the fund, transferred from Level 1 to Level 2 since the prior fiscal year-end, primarily due to significant market movements following the close of local trading. |
| † | Forward currency contracts are not included in the investment portfolio. |
4. Risk factors
Investing in the fund may involve certain risks including, but not limited to, those described below.
Market conditions — The prices of, and the income generated by, the securities held by the fund may decline – sometimes rapidly or unpredictably – due to various factors, including events or conditions affecting the general economy or particular industries; overall market changes; local, regional or global political, social or economic instability; governmental or governmental agency responses to economic conditions; and currency exchange rate, interest rate and commodity price fluctuations.
Issuer risks — The prices of, and the income generated by, securities held by the fund may decline in response to various factors directly related to the issuers of such securities, including reduced demand for an issuer’s goods or services, poor management performance and strategic initiatives such as mergers, acquisitions or dispositions and the market response to any such initiatives.
Investing in growth-oriented stocks — Growth-oriented common stocks and other equity-type securities (such as preferred stocks, convertible preferred stocks and convertible bonds) may involve larger price swings and greater potential for loss than other types of investments. These risks may be even greater in the case of smaller capitalization stocks.
Investing in small companies — Investing in smaller companies may pose additional risks. For example, it is often more difficult to value or dispose of small company stocks and more difficult to obtain information about smaller companies than about larger companies. Furthermore, smaller companies often have limited product lines, operating histories, markets and/or financial resources, may be dependent on one or a few key persons for management, and can be more susceptible to losses. Moreover, the prices of their stocks may be more volatile than stocks of larger, more established companies.
Investing outside the U.S. — Securities of issuers domiciled outside the U.S., or with significant operations or revenues outside the U.S., may lose value because of adverse political, social, economic or market developments (including social instability, regional conflicts, terrorism and war) in the countries or regions in which the issuers operate or generate revenue. These securities may also lose value due to changes in foreign currency exchange rates against the U.S. dollar and/or currencies of other countries. Issuers of these securities may be more susceptible to actions of foreign governments, such as the imposition of price controls or punitive taxes, that could adversely impact revenues. Securities markets in certain countries may be more volatile and/or less liquid than those in the U.S. Investments outside the U.S. may also be subject to different accounting practices and different regulatory, legal and reporting standards and practices, and may be more difficult to value, than those in the U.S. In addition, the value of investments outside the U.S. may be reduced by foreign taxes, including foreign withholding taxes on interest and dividends. Further, there may be increased risks of delayed settlement of securities purchased or sold by the fund. The risks of investing outside the U.S. may be heightened in connection with investments in emerging markets.
Investing in emerging markets — Investing in emerging markets may involve risks in addition to and greater than those generally associated with investing in the securities markets of developed countries. For instance, developing countries may have less developed legal and accounting systems than those in developed countries. The governments of these countries may be less stable and more likely to impose capital controls, nationalize a company or industry, place restrictions on foreign ownership and on withdrawing sale proceeds of securities from the country, and/or impose punitive taxes that could adversely affect the prices of securities. In addition, the economies of these countries may be dependent on relatively few industries that are more susceptible to local and global changes. Securities markets in these countries can also be relatively small and have substantially lower trading volumes. As a result, securities issued in these countries may be more volatile and less liquid, and may be more difficult to value, than securities issued in countries with more developed economies and/or markets. Less certainty with respect to security valuations may lead to additional challenges and risks in calculating the fund’s net asset value. Additionally, there may be increased settlement risks for transactions in local securities.
Management — The investment adviser to the fund actively manages the fund’s investments. Consequently, the fund is subject to the risk that the methods and analyses employed by the investment adviser in this process may not produce the desired results. This could cause the fund to lose value or its investment results to lag relevant benchmarks or other funds with similar objectives.
5. Certain investment techniques
Forward currency contracts — The fund has entered into forward currency contracts, which represent agreements to exchange currencies on specific future dates at predetermined rates. The fund’s investment adviser uses forward currency contracts to manage the fund’s exposure to changes in exchange rates. Upon entering into these contracts, risks may arise from the potential inability of counterparties to meet the terms of their contracts and from possible movements in exchange rates.
On a daily basis, the fund’s investment adviser values forward currency contracts and records unrealized appreciation or depreciation for open forward currency contracts in the fund’s statement of assets and liabilities. Realized gains or losses are recorded at the time the forward currency contract is closed or offset by another contract with the same broker for the same settlement date and currency.
Closed forward currency contracts that have not reached their settlement date are included in the respective receivables or payables for closed forward currency contracts in the fund’s statement of assets and liabilities. Net realized gains or losses from closed forward currency contracts and net unrealized appreciation or depreciation from open forward currency contracts are recorded in the fund’s statement of operations.
The following tables present the financial statement impacts resulting from the fund’s use of forward currency contracts as of, or for the year ended, September 30, 2015 (dollars in thousands):
| | | | | Assets | | Liabilities | |
| Contract | | Risk type | | Location on statement of
assets and liabilities | | Value | | | Location on statement of
assets and liabilities | | Value | |
| Forward currency | | Currency | | Unrealized appreciation on open forward currency contracts | | $ | 10,919 | | | Unrealized depreciation on open forward currency contracts | | $ | 489 | |
| Forward currency | | Currency | | Receivables for closed forward currency contracts | | | — | | | Payables for closed forward currency contracts | | | 109 | |
| | | | | | | $ | 10,919 | | | | | $ | 598 | |
| | | | | | | | | |
| | | | | Net realized gain | | | Net unrealized appreciation | |
| Contract | | Risk type | | Location on statement of
operations | | Value | | | Location on statement of
operations | | Value | |
| Forward currency | | Currency | | Net realized gain on forward currency contracts | | $ | 22,436 | | | Net unrealized appreciation on forward currency contracts | | $ | 5,153 | |
Collateral — The fund participates in a collateral program due to its use of forward currency contracts. The program calls for the fund to either receive or pledge collateral based on the net gain or loss on unsettled forward currency contracts by counterparty. The purpose of the collateral is to cover potential losses that could occur in the event that either party cannot meet its contractual obligations.
Rights of offset — The fund has entered into enforceable master netting agreements with certain counterparties for forward currency contracts, where on any date amounts payable by each party to the other (in the same currency with respect to the same transaction) may be closed or offset by each party’s payment obligation. If an early termination date occurs under these agreements following an event of default or termination event, all obligations of each party to its counterparty are settled net through a single payment in a single currency (“close-out netting“). For financial reporting purposes, the fund does not offset financial assets and financial liabilities that are subject to these master netting arrangements in the statement of assets and liabilities.
The following table presents the fund’s forward currency contracts by counterparty that are subject to master netting agreements but that are not offset in the fund’s statement of assets and liabilities. The net amount column shows the impact of offsetting on the fund’s statement of assets and liabilities as of September 30, 2015 (dollars in thousands) if close-out netting was exercised:
| | | | Gross amounts | | | Gross amounts not offset in the
statement of assets and liabilities and | | | | |
| | | | recognized in the | | | subject to a master netting agreement | | | | |
| | | | statement of assets | | | Available | | | Non-cash | | | Cash | | | Net | |
| Counterparty | | | and liabilities | | | to offset | | | collateral* | | | collateral | | | amount | |
| Assets: | | | | | | | | | | | | | | | | | | | | | |
| Bank of America, N.A. | | | $ | 2,308 | | | $ | — | | | $ | — | | | $ | — | | | $ | 2,308 | |
| Barclays Bank PLC | | | | 1,348 | | | | — | | | | — | | | | — | | | | 1,348 | |
| Citibank | | | | 3,320 | | | | (16 | ) | | | — | | | | — | | | | 3,304 | |
| HSBC Bank | | | | 700 | | | | (49 | ) | | | — | | | | — | | | | 651 | |
| JPMorgan Chase | | | | 666 | | | | (117 | ) | | | — | | | | — | | | | 549 | |
| UBS AG | | | | 2,577 | | | | (236 | ) | | | — | | | | — | | | | 2,341 | |
| Total | | | $ | 10,919 | | | $ | (418 | ) | | $ | — | | | $ | — | | | $ | 10,501 | |
| Liabilities: | | | | | | | | | | | | | | | | | | | | | |
| Bank of New York Mellon | | | $ | 180 | | | $ | — | | | $ | (180 | ) | | $ | — | | | $ | — | |
| Citibank | | | | 16 | | | | (16 | ) | | | — | | | | — | | | | — | |
| HSBC Bank | | | | 49 | | | | (49 | ) | | | — | | | | — | | | | — | |
| JPMorgan Chase | | | | 117 | | | | (117 | ) | | | — | | | | — | | | | — | |
| UBS AG | | | | 236 | | | | (236 | ) | | | — | | | | — | | | | — | |
| Total | | | $ | 598 | | | $ | (418 | ) | | $ | (180 | ) | | $ | — | | | $ | — | |
| * | Non-cash collateral is shown on a settlement basis. |
6. Taxation and distributions
Federal income taxation — The fund complies with the requirements under Subchapter M of the Internal Revenue Code applicable to mutual funds and intends to distribute substantially all of its net taxable income and net capital gains each year. The fund is not subject to income taxes to the extent such distributions are made. Therefore, no federal income tax provision is required.
As of and during the period ended September 30, 2015, the fund did not have a liability for any unrecognized tax benefits. The fund recognizes interest and penalties, if any, related to unrecognized tax benefits as income tax expense in the statement of operations. During the period, the fund did not incur any interest or penalties.
The fund is not subject to examination by U.S. federal tax authorities for tax years before 2011, by state tax authorities for tax years before 2010 and by tax authorities outside the U.S. for tax years before 2008.
Non-U.S. taxation — Dividend and interest income are recorded net of non-U.S. taxes paid. The fund may file withholding tax reclaims in certain jurisdictions to recover a portion of amounts previously withheld. As a result of rulings from European courts, the fund filed for additional reclaims related to prior years. These reclaims are recorded when the amount is known and there are no significant uncertainties on collectability. Gains realized by the fund on the sale of securities in certain countries are subject to non-U.S. taxes. The fund records a liability based on unrealized gains to provide for potential non-U.S. taxes payable upon the sale of these securities.
Distributions — Distributions paid to shareholders are based on net investment income and net realized gains determined on a tax basis, which may differ from net investment income and net realized gains for financial reporting purposes. These differences are due primarily to different treatment for items such as currency gains and losses; short-term capital gains and losses; capital losses related to sales of certain securities within 30 days of purchase; unrealized appreciation of certain investments in securities outside the U.S.; cost of investments sold; non-U.S. taxes on capital gains; and income on certain investments. The fiscal year in which amounts are distributed may differ from the year in which the net investment income and net realized gains are recorded by the fund for financial reporting purposes. The fund may also designate a portion of the amount paid to redeeming shareholders as a distribution for tax purposes.
During the year ended September 30, 2015, the fund reclassified $63,950,000 from accumulated net investment loss to capital paid in on shares of beneficial interest, $14,142,000 from undistributed net realized gain to accumulated net investment loss and $12,340,000 from undistributed net realized gain to capital paid in on shares of beneficial interest to align financial reporting with tax reporting.
As of September 30, 2015, the tax-basis components of distributable earnings, unrealized appreciation (depreciation) and cost of investment securities were as follows (dollars in thousands):
| Undistributed long-term capital gains | | $ | 1,671,404 | |
| Gross unrealized appreciation on investment securities | | | 6,901,195 | |
| Gross unrealized depreciation on investment securities | | | (2,648,558 | ) |
| Net unrealized appreciation on investment securities | | | 4,252,637 | |
| Cost of investment securities | | | 21,776,484 | |
The tax character of distributions paid to shareholders was as follows (dollars in thousands):
| | | Year ended September 30, 2015 | | Year ended September 30, 2014 |
| Share class | | Ordinary
income | | | Long-term
capital gains | | | Total
distributions
paid | | | Ordinary
income | | | Long-term
capital gains | | | Total
distributions
paid | |
| Class A | | $ | — | | | $ | 1,620,300 | | | $ | 1,620,300 | | | $ | — | | | $ | 819,310 | | | $ | 819,310 | |
| Class B | | | — | | | | 11,193 | | | | 11,193 | | | | — | | | | 8,984 | | | | 8,984 | |
| Class C | | | — | | | | 91,765 | | | | 91,765 | | | | — | | | | 48,666 | | | | 48,666 | |
| Class F-1 | | | — | | | | 60,501 | | | | 60,501 | | | | — | | | | 45,043 | | | | 45,043 | |
| Class F-2 | | | — | | | | 118,437 | | | | 118,437 | | | | — | | | | 32,777 | | | | 32,777 | |
| Class 529-A | | | — | | | | 91,365 | | | | 91,365 | | | | — | | | | 44,604 | | | | 44,604 | |
| Class 529-B | | | — | | | | 1,553 | | | | 1,553 | | | | — | | | | 1,211 | | | | 1,211 | |
| Class 529-C | | | — | | | | 28,795 | | | | 28,795 | | | | — | | | | 14,431 | | | | 14,431 | |
| Class 529-E | | | — | | | | 4,863 | | | | 4,863 | | | | — | | | | 2,446 | | | | 2,446 | |
| Class 529-F-1 | | | — | | | | 7,765 | | | | 7,765 | | | | — | | | | 3,680 | | | | 3,680 | |
| Class R-1 | | | — | | | | 3,940 | | | | 3,940 | | | | — | | | | 2,147 | | | | 2,147 | |
| Class R-2 | | | — | | | | 69,423 | | | | 69,423 | | | | — | | | | 37,717 | | | | 37,717 | |
| Class R-2E* | | | — | | | | 1 | | | | 1 | | | | — | | | | — | | | | — | |
| Class R-3 | | | — | | | | 78,623 | | | | 78,623 | | | | — | | | | 42,124 | | | | 42,124 | |
| Class R-4 | | | — | | | | 69,525 | | | | 69,525 | | | | — | | | | 34,905 | | | | 34,905 | |
| Class R-5 | | | — | | | | 43,654 | | | | 43,654 | | | | — | | | | 27,390 | | | | 27,390 | |
| Class R-6 | | | — | | | | 188,078 | | | | 188,078 | | | | — | | | | 65,717 | | | | 65,717 | |
| Total | | $ | — | | | $ | 2,489,781 | | | $ | 2,489,781 | | | $ | — | | | $ | 1,231,152 | | | $ | 1,231,152 | |
| * | Class R-2E shares were offered beginning August 29, 2014. |
7. Fees and transactions with related parties
CRMC, the fund’s investment adviser, is the parent company of American Funds Distributors,® Inc. (“AFD”), the principal underwriter of the fund’s shares, and American Funds Service Company® (“AFS”), the fund’s transfer agent. CRMC, AFD and AFS are considered related parties to the fund.
Investment advisory services — The fund has an investment advisory and service agreement with CRMC that provides for monthly fees accrued daily. These fees are based on a series of decreasing annual rates beginning with 0.800% on the first $1 billion of daily net assets and decreasing to 0.595% on such assets in excess of $27 billion. For the year ended September 30, 2015, the investment advisory services fee was $170,815,000, which was equivalent to an annualized rate of 0.629% of average daily net assets.
Class-specific fees and expenses — Expenses that are specific to individual share classes are accrued directly to the respective share class. The principal class-specific fees and expenses are further described below:
Distribution services — The fund has plans of distribution for all share classes, except Class F-2, R-5 and R-6 shares. Under the plans, the board of directors approves certain categories of expenses that are used to finance activities primarily intended to sell fund shares and service existing accounts. The plans provide for payments, based on an annualized percentage of average daily net assets, ranging from 0.30% to 1.00% as noted in this section. In some cases, the board of directors has limited the amounts that may be paid to less than the maximum allowed by the plans. All share classes with a plan may use up to 0.25% of average daily net assets to pay service fees, or to compensate AFD for paying service fees, to firms that have entered into agreements with AFD to provide certain shareholder services. The remaining amounts available to be paid under each plan are paid to dealers to compensate them for their sales activities.
For Class A and 529-A shares, distribution-related expenses include the reimbursement of dealer and wholesaler commissions paid by AFD for certain shares sold without a sales charge. These share classes reimburse AFD for amounts billed within the prior 15 months but only to the extent that the overall annual expense limit of 0.25% is not exceeded. As of September 30, 2015, there were no unreimbursed expenses subject to reimbursement for Class A or 529-A shares.
| Share class | | Currently approved limits | | Plan limits |
| Class A | | | 0.30 | % | | | | 0.30 | % |
| Class 529-A | | | 0.30 | | | | | 0.50 | |
| Classes B and 529-B | | | 1.00 | | | | | 1.00 | |
| Classes C, 529-C and R-1 | | | 1.00 | | | | | 1.00 | |
| Class R-2 | | | 0.75 | | | | | 1.00 | |
| Class R-2E | | | 0.60 | | | | | 0.85 | |
| Classes 529-E and R-3 | | | 0.50 | | | | | 0.75 | |
| Classes F-1, 529-F-1 and R-4 | | | 0.25 | | | | | 0.50 | |
| Transfer agent services — The fund has a shareholder services agreement with AFS under which the fund compensates AFS for providing transfer agent services to each of the fund’s share classes. These services include recordkeeping, shareholder communications and transaction processing. In addition, the fund reimburses AFS for amounts paid to third parties for performing transfer agent services on behalf of fund shareholders. |
| Administrative services — The fund has an administrative services agreement with CRMC under which the fund compensates CRMC for providing administrative services to Class A, C, F, 529 and R shares. These services include, but are not limited to, coordinating, monitoring, assisting and overseeing third parties that provide services to fund shareholders. Under the agreement, Class A shares pay an annual fee of 0.01% and Class C, F, 529 and R shares pay an annual fee of 0.05% of their respective average daily net assets. |
| 529 plan services — Each 529 share class is subject to service fees to compensate the Virginia College Savings Plan (“Virginia529“) for its oversight and administration of the 529 college savings plan. The quarterly fee is based on a series of decreasing annual rates beginning with 0.10% on the first $30 billion of the net assets invested in Class 529 shares of the American Funds and decreasing to 0.05% on such assets in excess of $70 billion. The fee for any given calendar quarter is accrued and calculated on the basis of the average net assets of Class 529 shares of the American Funds for the last month of the prior calendar quarter. The fee is included in other expenses in the fund’s statement of operations. Virginia529 is not considered a related party to the fund. |
| For the year ended September 30, 2015, class-specific expenses under the agreements were as follows (dollars in thousands): |
| Share class | | Distribution
services | | | Transfer agent
services | | | Administrative
services | | | 529 plan
services |
| Class A | | | $41,865 | | | | $30,281 | | | | $1,772 | | | Not applicable |
| Class B | | | 952 | | | | 168 | | | | Not applicable | | | Not applicable |
| Class C | | | 9,026 | | | | 1,552 | | | | 453 | | | Not applicable |
| Class F-1 | | | 1,663 | | | | 789 | | | | 333 | | | Not applicable |
| Class F-2 | | | Not applicable | | | | 1,581 | | | | 701 | | | Not applicable |
| Class 529-A | | | 2,118 | | | | 1,378 | | | | 497 | | | $880 |
| Class 529-B | | | 136 | | | | 22 | | | | 7 | | | 12 |
| Class 529-C | | | 2,900 | | | | 430 | | | | 147 | | | 259 |
| Class 529-E | | | 258 | | | | 46 | | | | 26 | | | 46 |
| Class 529-F-1 | | | — | | | | 119 | | | | 43 | | | 76 |
| Class R-1 | | | 392 | | | | 49 | | | | 20 | | | Not applicable |
| Class R-2 | | | 5,164 | | | | 2,400 | | | | 347 | | | Not applicable |
| Class R-2E | | | — | * | | | — | * | | | — | * | | Not applicable |
| Class R-3 | | | 4,127 | | | | 1,356 | | | | 414 | | | Not applicable |
| Class R-4 | | | 1,878 | | | | 711 | | | | 377 | | | Not applicable |
| Class R-5 | | | Not applicable | | | | 227 | | | | 246 | | | Not applicable |
| Class R-6 | | | Not applicable | | | | 14 | | | | 1,068 | | | Not applicable |
| Total class-specific expenses | | | $70,479 | | | | $41,123 | | | | $6,451 | | | $1,273 |
| * | Amount less than one thousand. |
Directors’ deferred compensation — Directors who are unaffiliated with CRMC may elect to defer the cash payment of part or all of their compensation. These deferred amounts, which remain as liabilities of the fund, are treated as if invested in shares of the fund or other American Funds. These amounts represent general, unsecured liabilities of the fund and vary according to the total returns of the selected funds. Directors’ compensation of $430,000 in the fund’s statement of operations reflects $393,000 in current fees (either paid in cash or deferred) and a net increase of $37,000 in the value of the deferred amounts.
Affiliated officers and directors — Officers and certain directors of the fund are or may be considered to be affiliated with CRMC, AFD and AFS. No affiliated officers or directors received any compensation directly from the fund.
8. Capital share transactions
Capital share transactions in the fund were as follows (dollars and shares in thousands):
| | | Sales1 | | | Reinvestments
of distributions | | | Repurchases1 | | | Net increase
(decrease) | |
| Share class | | Amount | | | Shares | | | Amount | | | Shares | | | Amount | | | Shares | | | Amount | | | Shares | |
| | | | | | | | | | | | | | | | | | | | | | | | | | | | | | | | | |
| Year ended September 30, 2015 | | | | | | | | | | | | | | | | | | | | | | | | | | |
| | | | | | | | | | | | | | | | | | | | | | | | | | | | | | | | | |
| Class A | | $ | 1,839,672 | | | | 37,984 | | | $ | 1,593,438 | | | | 35,036 | | | $ | (2,142,761 | ) | | | (44,637 | ) | | $ | 1,290,349 | | | | 28,383 | |
| Class B | | | 1,779 | | | | 40 | | | | 11,120 | | | | 265 | | | | (62,586 | ) | | | (1,409 | ) | | | (49,687 | ) | | | (1,104 | ) |
| Class C | | | 148,950 | | | | 3,381 | | | | 90,963 | | | | 2,199 | | | | (206,045 | ) | | | (4,711 | ) | | | 33,868 | | | | 869 | |
| Class F-1 | | | 197,926 | | | | 4,099 | | | | 59,775 | | | | 1,327 | | | | (167,562 | ) | | | (3,535 | ) | | | 90,139 | | | | 1,891 | |
| Class F-2 | | | 551,145 | | | | 11,287 | | | | 113,364 | | | | 2,477 | | | | (274,668 | ) | | | (5,705 | ) | | | 389,841 | | | | 8,059 | |
| Class 529-A | | | 106,546 | | | | 2,226 | | | | 91,346 | | | | 2,027 | | | | (116,697 | ) | | | (2,445 | ) | | | 81,195 | | | | 1,808 | |
| Class 529-B | | | 341 | | | | 7 | | | | 1,551 | | | | 37 | | | | (8,171 | ) | | | (182 | ) | | | (6,279 | ) | | | (138 | ) |
| Class 529-C | | | 32,830 | | | | 734 | | | | 28,787 | | | | 683 | | | | (42,251 | ) | | | (947 | ) | | | 19,366 | | | | 470 | |
| Class 529-E | | | 6,186 | | | | 132 | | | | 4,861 | | | | 110 | | | | (6,858 | ) | | | (147 | ) | | | 4,189 | | | | 95 | |
| Class 529-F-1 | | | 17,050 | | | | 353 | | | | 7,763 | | | | 171 | | | | (15,780 | ) | | | (327 | ) | | | 9,033 | | | | 197 | |
| Class R-1 | | | 8,027 | | | | 178 | | | | 3,930 | | | | 93 | | | | (12,360 | ) | | | (275 | ) | | | (403 | ) | | | (4 | ) |
| Class R-2 | | | 148,953 | | | | 3,305 | | | | 69,391 | | | | 1,633 | | | | (218,478 | ) | | | (4,872 | ) | | | (134 | ) | | | 66 | |
| Class R-2E | | | 73 | | | | 1 | | | | — | | | | — | | | | (10 | ) | | | — | 2 | | | 63 | | | | 1 | |
| Class R-3 | | | 198,149 | | | | 4,222 | | | | 78,595 | | | | 1,783 | | | | (248,364 | ) | | | (5,318 | ) | | | 28,380 | | | | 687 | |
| Class R-4 | | | 180,779 | | | | 3,752 | | | | 69,524 | | | | 1,540 | | | | (207,906 | ) | | | (4,354 | ) | | | 42,397 | | | | 938 | |
| Class R-5 | | | 122,897 | | | | 2,496 | | | | 43,649 | | | | 943 | | | | (110,861 | ) | | | (2,273 | ) | | | 55,685 | | | | 1,166 | |
| Class R-6 | | | 611,527 | | | | 12,665 | | | | 188,059 | | | | 4,106 | | | | (224,169 | ) | | | (4,871 | ) | | | 575,417 | | | | 11,900 | |
| Total net increase (decrease) | | $ | 4,172,830 | | | | 86,862 | | | $ | 2,456,116 | | | | 54,430 | | | $ | (4,065,527 | ) | | | (86,008 | ) | | $ | 2,563,419 | | | | 55,284 | |
| | | | | | | | | | | | | | | | | | | | | | | | | | | | | | | | | |
| Year ended September 30, 2014 | | | | | | | | | | | | | | | | | | | | | | | | | | |
| | | | | | | | | | | | | | | | | | | | | | | | | | | |
| Class A | | $ | 1,773,336 | | | | 35,700 | | | $ | 806,618 | | | | 16,543 | | | $ | (2,096,014 | ) | | | (42,216 | ) | | $ | 483,940 | | | | 10,027 | |
| Class B | | | 3,569 | | | | 77 | | | | 8,918 | | | | 195 | | | | (75,332 | ) | | | (1,622 | ) | | | (62,845 | ) | | | (1,350 | ) |
| Class C | | | 142,256 | | | | 3,097 | | | | 48,176 | | | | 1,067 | | | | (203,684 | ) | | | (4,439 | ) | | | (13,252 | ) | | | (275 | ) |
| Class F-1 | | | 282,255 | | | | 5,746 | | | | 44,660 | | | | 924 | | | | (570,459 | ) | | | (11,619 | ) | | | (243,544 | ) | | | (4,949 | ) |
| Class F-2 | | | 693,213 | | | | 13,899 | | | | 30,757 | | | | 629 | | | | (132,925 | ) | | | (2,668 | ) | | | 591,045 | | | | 11,860 | |
| Class 529-A | | | 111,968 | | | | 2,271 | | | | 44,594 | | | | 921 | | | | (101,340 | ) | | | (2,052 | ) | | | 55,222 | | | | 1,140 | |
| Class 529-B | | | 635 | | | | 13 | | | | 1,211 | | | | 26 | | | | (10,160 | ) | | | (216 | ) | | | (8,314 | ) | | | (177 | ) |
| Class 529-C | | | 35,995 | | | | 770 | | | | 14,425 | | | | 314 | | | | (38,441 | ) | | | (821 | ) | | | 11,979 | | | | 263 | |
| Class 529-E | | | 5,793 | | | | 119 | | | | 2,446 | | | | 51 | | | | (6,380 | ) | | | (131 | ) | | | 1,859 | | | | 39 | |
| Class 529-F-1 | | | 15,345 | | | | 309 | | | | 3,679 | | | | 76 | | | | (12,328 | ) | | | (248 | ) | | | 6,696 | | | | 137 | |
| Class R-1 | | | 9,478 | | | | 202 | | | | 2,139 | | | | 46 | | | | (13,283 | ) | | | (282 | ) | | | (1,666 | ) | | | (34 | ) |
| Class R-2 | | | 144,638 | | | | 3,074 | | | | 37,700 | | | | 816 | | | | (219,917 | ) | | | (4,681 | ) | | | (37,579 | ) | | | (791 | ) |
| Class R-2E3 | | | 10 | | | | — | 2 | | | — | | | | — | | | | — | | | | — | | | | 10 | | | | — | 2 |
| Class R-3 | | | 199,353 | | | | 4,114 | | | | 42,110 | | | | 885 | | | | (259,313 | ) | | | (5,358 | ) | | | (17,850 | ) | | | (359 | ) |
| Class R-4 | | | 191,098 | | | | 3,875 | | | | 34,902 | | | | 721 | | | | (207,103 | ) | | | (4,203 | ) | | | 18,897 | | | | 393 | |
| Class R-5 | | | 119,562 | | | | 2,382 | | | | 27,377 | | | | 554 | | | | (243,151 | ) | | | (4,893 | ) | | | (96,212 | ) | | | (1,957 | ) |
| Class R-6 | | | 709,607 | | | | 14,300 | | | | 65,717 | | | | 1,344 | | | | (112,345 | ) | | | (2,256 | ) | | | 662,979 | | | | 13,388 | |
| Total net increase (decrease) | | $ | 4,438,111 | | | | 89,948 | | | $ | 1,215,429 | | | | 25,112 | | | $ | (4,302,175 | ) | | | (87,705 | ) | | $ | 1,351,365 | | | | 27,355 | |
| 1 | Includes exchanges between share classes of the fund. |
| 2 | Amount less than one thousand. |
| 3 | Class R-2E shares were offered beginning August 29, 2014. |
9. Investment transactions
The fund made purchases and sales of investment securities, excluding short-term securities and U.S. government obligations, if any, of $8,322,547,000 and $8,649,769,000, respectively, during the year ended September 30, 2015.
Financial highlights
| | | | | | Income (loss) from
investment operations1 | | | Dividends and distributions | | | | | | | | | | | | | | | | |
| | | Net asset
value,
beginning
of period | | | Net
investment
income
(loss) | | | Net gains
(losses) on
securities (both
realized and
unrealized) | | | Total from
investment
operations | | | Dividends
(from net
investment
income) | | | Distributions
(from capital
gains) | | | Total
dividends
and
distributions | | | Net asset
value,
end
of period | | | Total
return2 | | | Net assets,
end of period
(in millions) | | | Ratio of
expenses to
average
net assets | | | Ratio of
net income
(loss) to
average
net assets | |
| Class A: | | | | | | | | | | | | | | | | | | | | | | | | | | | | | | | | | | | | | | | | | | | | | | | | |
| Year ended 9/30/2015 | | $ | 48.66 | | | $ | .04 | | | $ | 1.09 | | | $ | 1.13 | | | $ | — | | | $ | (4.75 | ) | | $ | (4.75 | ) | | $ | 45.04 | | | | 2.25 | % | | $ | 16,882 | | | | 1.07 | % | | | .08 | % |
| Year ended 9/30/2014 | | | 48.91 | | | | .01 | | | | 2.17 | | | | 2.18 | | | | — | | | | (2.43 | ) | | | (2.43 | ) | | | 48.66 | | | | 4.43 | | | | 16,857 | | | | 1.07 | | | | .02 | |
| Year ended 9/30/2013 | | | 39.27 | | | | .06 | | | | 10.12 | | | | 10.18 | | | | (.54 | ) | | | — | | | | (.54 | ) | | | 48.91 | | | | 26.29 | | | | 16,454 | | | | 1.13 | | | | .15 | |
| Year ended 9/30/2012 | | | 31.45 | | | | .08 | | | | 7.85 | | | | 7.93 | | | | (.11 | ) | | | — | | | | (.11 | ) | | | 39.27 | | | | 25.26 | | | | 13,557 | | | | 1.14 | | | | .23 | |
| Year ended 9/30/2011 | | | 35.82 | | | | .09 | | | | (3.94 | ) | | | (3.85 | ) | | | (.52 | ) | | | — | | | | (.52 | ) | | | 31.45 | | | | (11.01 | ) | | | 11,926 | | | | 1.09 | | | | .23 | |
| Class B: | | | | | | | | | | | | | | | | | | | | | | | | | | | | | | | | | | | | | | | | | | | | | | | | |
| Year ended 9/30/2015 | | | 45.33 | | | | (.32 | ) | | | 1.06 | | | | .74 | | | | — | | | | (4.75 | ) | | | (4.75 | ) | | | 41.32 | | | | 1.49 | | | | 65 | | | | 1.83 | | | | (.72 | ) |
| Year ended 9/30/2014 | | | 46.06 | | | | (.36 | ) | | | 2.06 | | | | 1.70 | | | | — | | | | (2.43 | ) | | | (2.43 | ) | | | 45.33 | | | | 3.66 | | | | 121 | | | | 1.83 | | | | (.77 | ) |
| Year ended 9/30/2013 | | | 36.95 | | | | (.26 | ) | | | 9.56 | | | | 9.30 | | | | (.19 | ) | | | — | | | | (.19 | ) | | | 46.06 | | | | 25.29 | | | | 185 | | | | 1.89 | | | | (.63 | ) |
| Year ended 9/30/2012 | | | 29.72 | | | | (.20 | ) | | | 7.43 | | | | 7.23 | | | | — | | | | — | | | | — | | | | 36.95 | | | | 24.33 | | | | 214 | | | | 1.90 | | | | (.58 | ) |
| Year ended 9/30/2011 | | | 33.87 | | | | (.20 | ) | | | (3.71 | ) | | | (3.91 | ) | | | (.24 | ) | | | — | | | | (.24 | ) | | | 29.72 | | | | (11.68 | ) | | | 266 | | | | 1.86 | | | | (.55 | ) |
| Class C: | | | | | | | | | | | | | | | | | | | | | | | | | | | | | | | | | | | | | | | | | | | | | | | | |
| Year ended 9/30/2015 | | | 44.77 | | | | (.32 | ) | | | 1.03 | | | | .71 | | | | — | | | | (4.75 | ) | | | (4.75 | ) | | | 40.73 | | | | 1.45 | | | | 847 | | | | 1.87 | | | | (.73 | ) |
| Year ended 9/30/2014 | | | 45.54 | | | | (.36 | ) | | | 2.02 | | | | 1.66 | | | | — | | | | (2.43 | ) | | | (2.43 | ) | | | 44.77 | | | | 3.61 | | | | 892 | | | | 1.87 | | | | (.79 | ) |
| Year ended 9/30/2013 | | | 36.60 | | | | (.26 | ) | | | 9.45 | | | | 9.19 | | | | (.25 | ) | | | — | | | | (.25 | ) | | | 45.54 | | | | 25.26 | | | | 920 | | | | 1.93 | | | | (.65 | ) |
| Year ended 9/30/2012 | | | 29.44 | | | | (.19 | ) | | | 7.35 | | | | 7.16 | | | | — | | | | — | | | | — | | | | 36.60 | | | | 24.32 | | | | 779 | | | | 1.93 | | | | (.56 | ) |
| Year ended 9/30/2011 | | | 33.61 | | | | (.19 | ) | | | (3.69 | ) | | | (3.88 | ) | | | (.29 | ) | | | — | | | | (.29 | ) | | | 29.44 | | | | (11.70 | ) | | | 725 | | | | 1.86 | | | | (.53 | ) |
| Class F-1: | | | | | | | | | | | | | | | | | | | | | | | | | | | | | | | | | | | | | | | | | | | | | | | | |
| Year ended 9/30/2015 | | | 48.23 | | | | .04 | | | | 1.08 | | | | 1.12 | | | | — | | | | (4.75 | ) | | | (4.75 | ) | | | 44.60 | | | | 2.25 | | | | 662 | | | | 1.07 | | | | .08 | |
| Year ended 9/30/2014 | | | 48.51 | | | | — | | | | 2.15 | | | | 2.15 | | | | — | | | | (2.43 | ) | | | (2.43 | ) | | | 48.23 | | | | 4.42 | | | | 624 | | | | 1.09 | | | | — | |
| Year ended 9/30/2013 | | | 38.94 | | | | .09 | | | | 10.03 | | | | 10.12 | | | | (.55 | ) | | | — | | | | (.55 | ) | | | 48.51 | | | | 26.33 | | | | 868 | | | | 1.07 | | | | .21 | |
| Year ended 9/30/2012 | | | 31.18 | | | | .09 | | | | 7.78 | | | | 7.87 | | | | (.11 | ) | | | — | | | | (.11 | ) | | | 38.94 | | | | 25.30 | | | | 655 | | | | 1.12 | | | | .25 | |
| Year ended 9/30/2011 | | | 35.53 | | | | .10 | | | | (3.92 | ) | | | (3.82 | ) | | | (.53 | ) | | | — | | | | (.53 | ) | | | 31.18 | | | | (11.02 | ) | | | 583 | | | | 1.08 | | | | .25 | |
| Class F-2: | | | | | | | | | | | | | | | | | | | | | | | | | | | | | | | | | | | | | | | | | | | | | | | | |
| Year ended 9/30/2015 | | | 48.92 | | | | .17 | | | | 1.08 | | | | 1.25 | | | | — | | | | (4.75 | ) | | | (4.75 | ) | | | 45.42 | | | | 2.50 | | | | 1,487 | | | | .82 | | | | .35 | |
| Year ended 9/30/2014 | | | 49.03 | | | | .15 | | | | 2.17 | | | | 2.32 | | | | — | | | | (2.43 | ) | | | (2.43 | ) | | | 48.92 | | | | 4.72 | | | | 1,208 | | | | .81 | | | | .31 | |
| Year ended 9/30/2013 | | | 39.38 | | | | .21 | | | | 10.12 | | | | 10.33 | | | | (.68 | ) | | | — | | | | (.68 | ) | | | 49.03 | | | | 26.68 | | | | 629 | | | | .82 | | | | .48 | |
| Year ended 9/30/2012 | | | 31.54 | | | | .20 | | | | 7.86 | | | | 8.06 | | | | (.22 | ) | | | — | | | | (.22 | ) | | | 39.38 | | | | 25.69 | | | | 344 | | | | .83 | | | | .55 | |
| Year ended 9/30/2011 | | | 35.93 | | | | .20 | | | | (3.96 | ) | | | (3.76 | ) | | | (.63 | ) | | | — | | | | (.63 | ) | | | 31.54 | | | | (10.79 | ) | | | 266 | | | | .82 | | | | .53 | |
| Class 529-A: | | | | | | | | | | | | | | | | | | | | | | | | | | | | | | | | | | | | | | | | | | | | | | | | |
| Year ended 9/30/2015 | | | 48.29 | | | | — | | | | 1.09 | | | | 1.09 | | | | — | | | | (4.75 | ) | | | (4.75 | ) | | | 44.63 | | | | 2.16 | | | | 943 | | | | 1.15 | | | | — | |
| Year ended 9/30/2014 | | | 48.59 | | | | (.03 | ) | | | 2.16 | | | | 2.13 | | | | — | | | | (2.43 | ) | | | (2.43 | ) | | | 48.29 | | | | 4.37 | | | | 933 | | | | 1.15 | | | | (.05 | ) |
| Year ended 9/30/2013 | | | 39.03 | | | | .04 | | | | 10.05 | | | | 10.09 | | | | (.53 | ) | | | — | | | | (.53 | ) | | | 48.59 | | | | 26.18 | | | | 884 | | | | 1.19 | | | | .09 | |
| Year ended 9/30/2012 | | | 31.27 | | | | .07 | | | | 7.80 | | | | 7.87 | | | | (.11 | ) | | | — | | | | (.11 | ) | | | 39.03 | | | | 25.22 | | | | 689 | | | | 1.19 | | | | .19 | |
| Year ended 9/30/2011 | | | 35.63 | | | | .08 | | | | (3.92 | ) | | | (3.84 | ) | | | (.52 | ) | | | — | | | | (.52 | ) | | | 31.27 | | | | (11.05 | ) | | | 541 | | | | 1.14 | | | | .20 | |
| Class 529-B: | | | | | | | | | | | | | | | | | | | | | | | | | | | | | | | | | | | | | | | | | | | | | | | | |
| Year ended 9/30/2015 | | | 45.75 | | | | (.37 | ) | | | 1.07 | | | | .70 | | | | — | | | | (4.75 | ) | | | (4.75 | ) | | | 41.70 | | | | 1.36 | | | | 10 | | | | 1.94 | | | | (.83 | ) |
| Year ended 9/30/2014 | | | 46.52 | | | | (.42 | ) | | | 2.08 | | | | 1.66 | | | | — | | | | (2.43 | ) | | | (2.43 | ) | | | 45.75 | | | | 3.53 | | | | 17 | | | | 1.95 | | | | (.89 | ) |
| Year ended 9/30/2013 | | | 37.30 | | | | (.30 | ) | | | 9.66 | | | | 9.36 | | | | (.14 | ) | | | — | | | | (.14 | ) | | | 46.52 | | | | 25.17 | | | | 25 | | | | 1.99 | | | | (.73 | ) |
| Year ended 9/30/2012 | | | 30.03 | | | | (.23 | ) | | | 7.50 | | | | 7.27 | | | | — | | | | — | | | | — | | | | 37.30 | | | | 24.21 | | | | 30 | | | | 2.01 | | | | (.68 | ) |
| Year ended 9/30/2011 | | | 34.23 | | | | (.23 | ) | | | (3.76 | ) | | | (3.99 | ) | | | (.21 | ) | | | — | | | | (.21 | ) | | | 30.03 | | | | (11.78 | ) | | | 36 | | | | 1.95 | | | | (.63 | ) |
| | | | | | Income (loss) from
investment operations1 | | | Dividends and distributions | | | | | | | | | | | | | | | | |
| | | Net asset
value,
beginning
of period | | | Net
investment
income
(loss) | | | Net gains
(losses) on
securities (both
realized and
unrealized) | | | Total from
investment
operations | | | Dividends
(from net
investment
income) | | | Distributions
(from capital
gains) | | | Total
dividends
and
distributions | | | Net asset
value,
end
of period | | | Total
return2 | | | Net assets,
end of period
(in millions) | | | Ratio of
expenses to
average
net assets | | | Ratio of
net income
(loss) to
average
net assets | |
| Class 529-C: | | | | | | | | | | | | | | | | | | | | | | | | | | | | | | | | | | | | | | | | | | | | | | | | |
| Year ended 9/30/2015 | | $ | 45.50 | | | $ | (.35 | ) | | $ | 1.05 | | | $ | .70 | | | $ | — | | | $ | (4.75 | ) | | $ | (4.75 | ) | | $ | 41.45 | | | | 1.37 | % | | $ | 274 | | | | 1.93 | % | | | (.78 | )% |
| Year ended 9/30/2014 | | | 46.27 | | | | (.40 | ) | | | 2.06 | | | | 1.66 | | | | — | | | | (2.43 | ) | | | (2.43 | ) | | | 45.50 | | | | 3.53 | | | | 280 | | | | 1.94 | | | | (.85 | ) |
| Year ended 9/30/2013 | | | 37.20 | | | | (.29 | ) | | | 9.60 | | | | 9.31 | | | | (.24 | ) | | | — | | | | (.24 | ) | | | 46.27 | | | | 25.21 | | | | 273 | | | | 1.98 | | | | (.70 | ) |
| Year ended 9/30/2012 | | | 29.95 | | | | (.21 | ) | | | 7.46 | | | | 7.25 | | | | — | | | | — | | | | — | | | | 37.20 | | | | 24.21 | | | | 222 | | | | 2.00 | | | | (.62 | ) |
| Year ended 9/30/2011 | | | 34.19 | | | | (.22 | ) | | | (3.76 | ) | | | (3.98 | ) | | | (.26 | ) | | | — | | | | (.26 | ) | | | 29.95 | | | | (11.77 | ) | | | 186 | | | | 1.94 | | | | (.61 | ) |
| Class 529-E: | | | | | | | | | | | | | | | | | | | | | | | | | | | | | | | | | | | | | | | | | | | | | | | | |
| Year ended 9/30/2015 | | | 47.41 | | | | (.11 | ) | | | 1.08 | | | | .97 | | | | — | | | | (4.75 | ) | | | (4.75 | ) | | | 43.63 | | | | 1.95 | | | | 49 | | | | 1.38 | | | | (.23 | ) |
| Year ended 9/30/2014 | | | 47.87 | | | | (.14 | ) | | | 2.11 | | | | 1.97 | | | | — | | | | (2.43 | ) | | | (2.43 | ) | | | 47.41 | | | | 4.10 | | | | 49 | | | | 1.39 | | | | (.30 | ) |
| Year ended 9/30/2013 | | | 38.45 | | | | (.06 | ) | | | 9.91 | | | | 9.85 | | | | (.43 | ) | | | — | | | | (.43 | ) | | | 47.87 | | | | 25.90 | | | | 48 | | | | 1.43 | | | | (.15 | ) |
| Year ended 9/30/2012 | | | 30.79 | | | | (.03 | ) | | | 7.70 | | | | 7.67 | | | | (.01 | ) | | | — | | | | (.01 | ) | | | 38.45 | | | | 24.90 | | | | 38 | | | | 1.45 | | | | (.07 | ) |
| Year ended 9/30/2011 | | | 35.11 | | | | (.03 | ) | | | (3.87 | ) | | | (3.90 | ) | | | (.42 | ) | | | — | | | | (.42 | ) | | | 30.79 | | | | (11.32 | ) | | | 31 | | | | 1.43 | | | | (.08 | ) |
| Class 529-F-1: | | | | | | | | | | | | | | | | | | | | | | | | | | | | | | | | | | | | | | | | | | | | | | | | |
| Year ended 9/30/2015 | | | 48.53 | | | | .11 | | | | 1.09 | | | | 1.20 | | | | — | | | | (4.75 | ) | | | (4.75 | ) | | | 44.98 | | | | 2.42 | | | | 83 | | | | .93 | | | | .22 | |
| Year ended 9/30/2014 | | | 48.73 | | | | .08 | | | | 2.15 | | | | 2.23 | | | | — | | | | (2.43 | ) | | | (2.43 | ) | | | 48.53 | | | | 4.57 | | | | 80 | | | | .94 | | | | .16 | |
| Year ended 9/30/2013 | | | 39.14 | | | | .13 | | | | 10.07 | | | | 10.20 | | | | (.61 | ) | | | — | | | | (.61 | ) | | | 48.73 | | | | 26.43 | | | | 73 | | | | .98 | | | | .30 | |
| Year ended 9/30/2012 | | | 31.35 | | | | .14 | | | | 7.83 | | | | 7.97 | | | | (.18 | ) | | | — | | | | (.18 | ) | | | 39.14 | | | | 25.51 | | | | 53 | | | | .99 | | | | .39 | |
| Year ended 9/30/2011 | | | 35.72 | | | | .15 | | | | (3.94 | ) | | | (3.79 | ) | | | (.58 | ) | | | — | | | | (.58 | ) | | | 31.35 | | | | (10.90 | ) | | | 43 | | | | .94 | | | | .40 | |
| Class R-1: | | | | | | | | | | | | | | | | | | | | | | | | | | | | | | | | | | | | | | | | | | | | | | | | |
| Year ended 9/30/2015 | | | 45.85 | | | | (.31 | ) | | | 1.06 | | | | .75 | | | | — | | | | (4.75 | ) | | | (4.75 | ) | | | 41.85 | | | | 1.48 | | | | 36 | | | | 1.82 | | | | (.68 | ) |
| Year ended 9/30/2014 | | | 46.56 | | | | (.35 | ) | | | 2.07 | | | | 1.72 | | | | — | | | | (2.43 | ) | | | (2.43 | ) | | | 45.85 | | | | 3.66 | | | | 39 | | | | 1.82 | | | | (.74 | ) |
| Year ended 9/30/2013 | | | 37.40 | | | | (.23 | ) | | | 9.66 | | | | 9.43 | | | | (.27 | ) | | | — | | | | (.27 | ) | | | 46.56 | | | | 25.37 | | | | 42 | | | | 1.84 | | | | (.57 | ) |
| Year ended 9/30/2012 | | | 30.07 | | | | (.17 | ) | | | 7.50 | | | | 7.33 | | | | — | | | | — | | | | — | | | | 37.40 | | | | 24.38 | | | | 37 | | | | 1.86 | | | | (.50 | ) |
| Year ended 9/30/2011 | | | 34.32 | | | | (.19 | ) | | | (3.77 | ) | | | (3.96 | ) | | | (.29 | ) | | | — | | | | (.29 | ) | | | 30.07 | | | | (11.68 | ) | | | 35 | | | | 1.84 | | | | (.52 | ) |
| Class R-2: | | | | | | | | | | | | | | | | | | | | | | | | | | | | | | | | | | | | | | | | | | | | | | | | |
| Year ended 9/30/2015 | | | 45.84 | | | | (.29 | ) | | | 1.05 | | | | .76 | | | | — | | | | (4.75 | ) | | | (4.75 | ) | | | 41.85 | | | | 1.53 | | | | 632 | | | | 1.79 | | | | (.65 | ) |
| Year ended 9/30/2014 | | | 46.56 | | | | (.35 | ) | | | 2.06 | | | | 1.71 | | | | — | | | | (2.43 | ) | | | (2.43 | ) | | | 45.84 | | | | 3.64 | | | | 689 | | | | 1.83 | | | | (.75 | ) |
| Year ended 9/30/2013 | | | 37.39 | | | | (.23 | ) | | | 9.67 | | | | 9.44 | | | | (.27 | ) | | | — | | | | (.27 | ) | | | 46.56 | | | | 25.41 | | | | 736 | | | | 1.83 | | | | (.55 | ) |
| Year ended 9/30/2012 | | | 30.07 | | | | (.18 | ) | | | 7.50 | | | | 7.32 | | | | — | | | | — | | | | — | | | | 37.39 | | | | 24.34 | | | | 647 | | | | 1.89 | | | | (.52 | ) |
| Year ended 9/30/2011 | | | 34.30 | | | | (.20 | ) | | | (3.76 | ) | | | (3.96 | ) | | | (.27 | ) | | | — | | | | (.27 | ) | | | 30.07 | | | | (11.72 | ) | | | 581 | | | | 1.86 | | | | (.54 | ) |
| Class R-2E: | | | | | | | | | | | | | | | | | | | | | | | | | | | | | | | | | | | | | | | | | | | | | | | | |
| Year ended 9/30/2015 | | | 48.67 | | | | .01 | | | | 1.11 | | | | 1.12 | | | | — | | | | (4.75 | ) | | | (4.75 | ) | | | 45.04 | | | | 2.23 | 3 | | | — | 4 | | | 1.26 | 3 | | | .01 | 3 |
| Period from 8/29/2014 to 9/30/20145,6 | | | 50.83 | | | | (.01 | ) | | | (2.15 | ) | | | (2.16 | ) | | | — | | | | — | | | | — | | | | 48.67 | | | | (4.25 | )7,8 | | | — | 4 | | | .08 | 7,8 | | | (.01 | )7,8 |
| Class R-3: | | | | | | | | | | | | | | | | | | | | | | | | | | | | | | | | | | | | | | | | | | | | | | | | |
| Year ended 9/30/2015 | | | 47.34 | | | | (.10 | ) | | | 1.07 | | | | .97 | | | | — | | | | (4.75 | ) | | | (4.75 | ) | | | 43.56 | | | | 1.93 | | | | 776 | | | | 1.37 | | | | (.22 | ) |
| Year ended 9/30/2014 | | | 47.79 | | | | (.14 | ) | | | 2.12 | | | | 1.98 | | | | — | | | | (2.43 | ) | | | (2.43 | ) | | | 47.34 | | | | 4.12 | | | | 811 | | | | 1.39 | | | | (.30 | ) |
| Year ended 9/30/2013 | | | 38.39 | | | | (.05 | ) | | | 9.89 | | | | 9.84 | | | | (.44 | ) | | | — | | | | (.44 | ) | | | 47.79 | | | | 25.90 | | | | 836 | | | | 1.40 | | | | (.12 | ) |
| Year ended 9/30/2012 | | | 30.73 | | | | (.02 | ) | | | 7.68 | | | | 7.66 | | | | — | | | | — | | | | — | | | | 38.39 | | | | 24.92 | | | | 694 | | | | 1.42 | | | | (.05 | ) |
| Year ended 9/30/2011 | | | 35.03 | | | | (.03 | ) | | | (3.84 | ) | | | (3.87 | ) | | | (.43 | ) | | | — | | | | (.43 | ) | | | 30.73 | | | | (11.28 | ) | | | 586 | | | | 1.41 | | | | (.08 | ) |
See page 32 for footnotes.
Financial highlights (continued)
| | | | | | Income (loss) from
investment operations1 | | | Dividends and distributions | | | | | | | | | | | | | | | | |
| | | Net asset
value,
beginning
of period | | | Net
investment
income
(loss) | | | Net gains
(losses) on
securities (both
realized and
unrealized) | | | Total from
investment
operations | | | Dividends
(from net
investment
income) | | | Distributions
(from capital
gains) | | | Total
dividends
and
distributions | | | Net asset
value,
end
of period | | | Total
return2 | | | Net assets,
end of period
(in millions) | | | Ratio of
expenses to
average
net assets | | | Ratio of
net income
(loss) to
average
net assets | |
| Class R-4: | | | | | | | | | | | | | | | | | | | | | | | | | | | | | | | | | | | | | | | | | | | | | | | | |
| Year ended 9/30/2015 | | $ | 48.33 | | | $ | .05 | | | $ | 1.08 | | | $ | 1.13 | | | $ | — | | | $ | (4.75 | ) | | $ | (4.75 | ) | | $ | 44.71 | | | | 2.27 | % | | $ | 715 | | | | 1.05 | % | | | .10 | % |
| Year ended 9/30/2014 | | | 48.59 | | | | .02 | | | | 2.15 | | | | 2.17 | | | | — | | | | (2.43 | ) | | | (2.43 | ) | | | 48.33 | | | | 4.46 | | | | 727 | | | | 1.06 | | | | .03 | |
| Year ended 9/30/2013 | | | 39.03 | | | | .09 | | | | 10.04 | | | | 10.13 | | | | (.57 | ) | | | — | | | | (.57 | ) | | | 48.59 | | | | 26.31 | | | | 712 | | | | 1.07 | | | | .21 | |
| Year ended 9/30/2012 | | | 31.25 | | | | .11 | | | | 7.80 | | | | 7.91 | | | | (.13 | ) | | | — | | | | (.13 | ) | | | 39.03 | | | | 25.38 | | | | 550 | | | | 1.08 | | | | .30 | |
| Year ended 9/30/2011 | | | 35.60 | | | | .10 | | | | (3.91 | ) | | | (3.81 | ) | | | (.54 | ) | | | — | | | | (.54 | ) | | | 31.25 | | | | (10.98 | ) | | | 441 | | | | 1.07 | | | | .26 | |
| Class R-5: | | | | | | | | | | | | | | | | | | | | | | | | | | | | | | | | | | | | | | | | | | | | | | | | |
| Year ended 9/30/2015 | | | 49.39 | | | | .20 | | | | 1.10 | | | | 1.30 | | | | — | | | | (4.75 | ) | | | (4.75 | ) | | | 45.94 | | | | 2.57 | | | | 474 | | | | .75 | | | | .40 | |
| Year ended 9/30/2014 | | | 49.46 | | | | .15 | | | | 2.21 | | | | 2.36 | | | | — | | | | (2.43 | ) | | | (2.43 | ) | | | 49.39 | | | | 4.78 | | | | 452 | | | | .76 | | | | .29 | |
| Year ended 9/30/2013 | | | 39.71 | | | | .22 | | | | 10.22 | | | | 10.44 | | | | (.69 | ) | | | — | | | | (.69 | ) | | | 49.46 | | | | 26.72 | | | | 550 | | | | .77 | | | | .51 | |
| Year ended 9/30/2012 | | | 31.80 | | | | .22 | | | | 7.93 | | | | 8.15 | | | | (.24 | ) | | | — | | | | (.24 | ) | | | 39.71 | | | | 25.77 | | | | 384 | | | | .78 | | | | .60 | |
| Year ended 9/30/2011 | | | 36.21 | | | | .22 | | | | (3.99 | ) | | | (3.77 | ) | | | (.64 | ) | | | — | | | | (.64 | ) | | | 31.80 | | | | (10.74 | ) | | | 314 | | | | .77 | | | | .56 | |
| Class R-6: | | | | | | | | | | | | | | | | | | | | | | | | | | | | | | | | | | | | | | | | | | | | | | | | |
| Year ended 9/30/2015 | | | 48.93 | | | | .22 | | | | 1.09 | | | | 1.31 | | | | — | | | | (4.75 | ) | | | (4.75 | ) | | | 45.49 | | | | 2.63 | | | | 2,269 | | | | .71 | | | | .45 | |
| Year ended 9/30/2014 | | | 49.00 | | | | .21 | | | | 2.15 | | | | 2.36 | | | | — | | | | (2.43 | ) | | | (2.43 | ) | | | 48.93 | | | | 4.82 | | | | 1,859 | | | | .71 | | | | .41 | |
| Year ended 9/30/2013 | | | 39.34 | | | | .25 | | | | 10.12 | | | | 10.37 | | | | (.71 | ) | | | — | | | | (.71 | ) | | | 49.00 | | | | 26.80 | | | | 1,206 | | | | .72 | | | | .57 | |
| Year ended 9/30/2012 | | | 31.52 | | | | .24 | | | | 7.84 | | | | 8.08 | | | | (.26 | ) | | | — | | | | (.26 | ) | | | 39.34 | | | | 25.79 | | | | 768 | | | | .73 | | | | .67 | |
| Year ended 9/30/2011 | | | 35.89 | | | | .24 | | | | (3.96 | ) | | | (3.72 | ) | | | (.65 | ) | | | — | | | | (.65 | ) | | | 31.52 | | | | (10.68 | ) | | | 494 | | | | .72 | | | | .64 | |
| | Year ended September 30 |
| | 2015 | 2014 | 2013 | 2012 | 2011 |
| | | | | | |
| Portfolio turnover rate for all share classes | 33% | 38% | 37% | 35% | 39% |
| 1 | Based on average shares outstanding. |
| 2 | Total returns exclude any applicable sales charges, including contingent deferred sales charges. |
| 3 | Although the fund has a plan of distribution for Class R-2E shares, fees for distribution services are not paid by the fund on accounts for which a broker-dealer (or other financial intermediary) has not been assigned, including amounts invested in the fund by CRMC and/or its affiliates. If fees for distribution services were charged on these assets, fund expenses would be higher and net income and total return would be lower. |
| 4 | Amount less than $1 million. |
| 5 | Based on operations for the period shown and, accordingly, is not representative of a full year. |
| 6 | Class R-2E shares were offered beginning August 29, 2014. |
| 7 | This class consisted solely of seed capital invested by CRMC; therefore, certain fees were not accrued. |
| 8 | Not annualized. |
See Notes to Financial Statements
Report of Independent Registered Public Accounting Firm
To the Shareholders and Board of Directors of SMALLCAP World Fund, Inc.:
We have audited the accompanying statement of assets and liabilities of SMALLCAP World Fund, Inc. (the “Fund”), including the summary investment portfolio, as of September 30, 2015, and the related statement of operations for the year then ended, the statements of changes in net assets for each of the two years in the period then ended, and the financial highlights for each of the periods presented. These financial statements and financial highlights are the responsibility of the Fund’s management. Our responsibility is to express an opinion on these financial statements and financial highlights based on our audits.
We conducted our audits in accordance with the standards of the Public Company Accounting Oversight Board (United States). Those standards require that we plan and perform the audit to obtain reasonable assurance about whether the financial statements and financial highlights are free of material misstatement. The Fund is not required to have, nor were we engaged to perform, an audit of its internal control over financial reporting. Our audits included consideration of internal control over financial reporting as a basis for designing audit procedures that are appropriate in the circumstances, but not for the purpose of expressing an opinion on the effectiveness of the Fund’s internal control over financial reporting. Accordingly, we express no such opinion. An audit also includes examining, on a test basis, evidence supporting the amounts and disclosures in the financial statements, assessing the accounting principles used and significant estimates made by management, as well as evaluating the overall financial statement presentation. Our procedures included confirmation of securities owned as of September 30, 2015, by correspondence with the custodian and brokers; where replies were not received from brokers, we performed other auditing procedures. We believe that our audits provide a reasonable basis for our opinion.
In our opinion, such financial statements and financial highlights referred to above present fairly, in all material respects, the financial position of SMALLCAP World Fund, Inc. as of September 30, 2015, the results of its operations for the year then ended, the changes in its net assets for each of the two years in the period then ended, and the financial highlights for each of the periods presented, in conformity with accounting principles generally accepted in the United States of America.
Deloitte & Touche LLP
Costa Mesa, California
November 11, 2015
As a fund shareholder, you incur two types of costs: (1) transaction costs, such as initial sales charges on purchase payments and contingent deferred sales charges on redemptions (loads), and (2) ongoing costs, including management fees, distribution and service (12b-1) fees, and other expenses. This example is intended to help you understand your ongoing costs (in dollars) of investing in the fund so you can compare these costs with the ongoing costs of investing in other mutual funds. The example is based on an investment of $1,000 invested at the beginning of the period and held for the entire six-month period (April 1, 2015, through September 30, 2015).
Actual expenses:
The first line of each share class in the table on the following page provides information about actual account values and actual expenses. You may use the information in this line, together with the amount you invested, to estimate the expenses that you paid over the period. Simply divide your account value by $1,000 (for example, an $8,600 account value divided by $1,000 = 8.6), then multiply the result by the number in the first line under the heading entitled “Expenses paid during period” to estimate the expenses you paid on your account during this period.
Hypothetical example for comparison purposes:
The second line of each share class in the table on the following page provides information about hypothetical account values and hypothetical expenses based on the actual expense ratio for the share class and an assumed rate of return of 5.00% per year before expenses, which is not the actual return of the share class. The hypothetical account values and expenses may not be used to estimate the actual ending account balance or expenses you paid for the period. You may use this information to compare the ongoing costs of investing in the fund and other funds. To do so, compare this 5.00% hypothetical example with the 5.00% hypothetical examples that appear in the shareholder reports of the other funds.
Notes:
Retirement plan participants may be subject to certain fees charged by the plan sponsor, and Class F-1, F-2 and 529-F-1 shareholders may be subject to fees charged by financial intermediaries, typically ranging from 0.75% to 1.50% of assets annually depending on services offered. You can estimate the impact of these fees by adding the amount of the fees to the total estimated expenses you paid on your account during the period as calculated above. In addition, your ending account value would be lower by the amount of these fees.
Note that the expenses shown in the table on the following page are meant to highlight your ongoing costs only and do not reflect any transactional costs, such as sales charges (loads). Therefore, the second line of each share class in the table is useful in comparing ongoing costs only and will not help you determine the relative total costs of owning different funds. In addition, if these transactional costs were included, your costs would have been higher.
| | | Beginning | | | Ending | | | | | | | |
| | | account value | | | account value | | | Expenses paid | | | Annualized | |
| | | 4/1/2015 | | | 9/30/2015 | | | during period* | | | expense ratio | |
| Class A - actual return | | $ | 1,000.00 | | | $ | 943.44 | | | $ | 5.12 | | | | 1.05 | % |
| Class A - assumed 5% return | | | 1,000.00 | | | | 1,019.80 | | | | 5.32 | | | | 1.05 | |
| Class B - actual return | | | 1,000.00 | | | | 940.17 | | | | 8.71 | | | | 1.79 | |
| Class B - assumed 5% return | | | 1,000.00 | | | | 1,016.09 | | | | 9.05 | | | | 1.79 | |
| Class C - actual return | | | 1,000.00 | | | | 939.79 | | | | 9.00 | | | | 1.85 | |
| Class C - assumed 5% return | | | 1,000.00 | | | | 1,015.79 | | | | 9.35 | | | | 1.85 | |
| Class F-1 - actual return | | | 1,000.00 | | | | 943.55 | | | | 5.26 | | | | 1.08 | |
| Class F-1 - assumed 5% return | | | 1,000.00 | | | | 1,019.65 | | | | 5.47 | | | | 1.08 | |
| Class F-2 - actual return | | | 1,000.00 | | | | 944.67 | | | | 3.95 | | | | .81 | |
| Class F-2 - assumed 5% return | | | 1,000.00 | | | | 1,021.01 | | | | 4.10 | | | | .81 | |
| Class 529-A - actual return | | | 1,000.00 | | | | 943.17 | | | | 5.50 | | | | 1.13 | |
| Class 529-A - assumed 5% return | | | 1,000.00 | | | | 1,019.40 | | | | 5.72 | | | | 1.13 | |
| Class 529-B - actual return | | | 1,000.00 | | | | 939.42 | | | | 9.29 | | | | 1.91 | |
| Class 529-B - assumed 5% return | | | 1,000.00 | | | | 1,015.49 | | | | 9.65 | | | | 1.91 | |
| Class 529-C - actual return | | | 1,000.00 | | | | 939.46 | | | | 9.29 | | | | 1.91 | |
| Class 529-C - assumed 5% return | | | 1,000.00 | | | | 1,015.49 | | | | 9.65 | | | | 1.91 | |
| Class 529-E - actual return | | | 1,000.00 | | | | 942.14 | | | | 6.62 | | | | 1.36 | |
| Class 529-E - assumed 5% return | | | 1,000.00 | | | | 1,018.25 | | | | 6.88 | | | | 1.36 | |
| Class 529-F-1 - actual return | | | 1,000.00 | | | | 944.16 | | | | 4.48 | | | | .92 | |
| Class 529-F-1 - assumed 5% return | | | 1,000.00 | | | | 1,020.46 | | | | 4.66 | | | | .92 | |
| Class R-1 - actual return | | | 1,000.00 | | | | 939.83 | | | | 8.85 | | | | 1.82 | |
| Class R-1 - assumed 5% return | | | 1,000.00 | | | | 1,015.94 | | | | 9.20 | | | | 1.82 | |
| Class R-2 - actual return | | | 1,000.00 | | | | 940.26 | | | | 8.61 | | | | 1.77 | |
| Class R-2 - assumed 5% return | | | 1,000.00 | | | | 1,016.19 | | | | 8.95 | | | | 1.77 | |
| Class R-2E - actual return | | | 1,000.00 | | | | 942.49 | | | | 6.62 | | | | 1.36 | |
| Class R-2E - assumed 5% return | | | 1,000.00 | | | | 1,018.25 | | | | 6.88 | | | | 1.36 | |
| Class R-3 - actual return | | | 1,000.00 | | | | 942.03 | | | | 6.62 | | | | 1.36 | |
| Class R-3 - assumed 5% return | | | 1,000.00 | | | | 1,018.25 | | | | 6.88 | | | | 1.36 | |
| Class R-4 - actual return | | | 1,000.00 | | | | 943.46 | | | | 5.12 | | | | 1.05 | |
| Class R-4 - assumed 5% return | | | 1,000.00 | | | | 1,019.80 | | | | 5.32 | | | | 1.05 | |
| Class R-5 - actual return | | | 1,000.00 | | | | 944.89 | | | | 3.66 | | | | .75 | |
| Class R-5 - assumed 5% return | | | 1,000.00 | | | | 1,021.31 | | | | 3.80 | | | | .75 | |
| Class R-6 - actual return | | | 1,000.00 | | | | 945.35 | | | | 3.41 | | | | .70 | |
| Class R-6 - assumed 5% return | | | 1,000.00 | | | | 1,021.56 | | | | 3.55 | | | | .70 | |
| * | The “expenses paid during period” are equal to the “annualized expense ratio,” multiplied by the average account value over the period, multiplied by the number of days in the period, and divided by 365 (to reflect the one-half year period). |
We are required to advise you of the federal tax status of certain distributions received by shareholders during the fiscal year. The fund hereby designates the following amounts for the fund’s fiscal year ended September 30, 2015:
| Foreign taxes | | $0.03 per share |
| Foreign source income | | $0.41 per share |
| Long-term capital gains | | $2,489,781,000 |
Individual shareholders should refer to their Form 1099 or other tax information, which will be mailed in January 2016, to determine the calendar year amounts to be included on their 2015 tax returns. Shareholders should consult their tax advisors.
Approval of Investment Advisory and Service Agreement
The SMALLCAP World Fund board has approved the fund’s Investment Advisory and Service Agreement (the “agreement”) with Capital Research and Management Company (“CRMC”) for an additional one-year term through November 30, 2016. The board approved the agreement following the recommendation of the fund’s Contracts Committee (the “committee”), which is composed of all of the fund’s independent board members. The board and the committee determined that the fund’s advisory fee structure was fair and reasonable in relation to the services provided, and that approving the agreement was in the best interests of the fund and its shareholders.
In reaching this decision, the board and the committee took into account information furnished to them throughout the year and otherwise provided to them, as well as information prepared specifically in connection with their review of the agreement, and were advised by their independent counsel. They considered the following factors, among others, but did not identify any single issue or particular piece of information that, in isolation, was the controlling factor, and each board and committee member did not necessarily attribute the same weight to each factor.
1. Nature, extent and quality of services
The board and the committee considered the depth and quality of CRMC’s investment management process, including its global research capabilities; the experience, capability and integrity of its senior management and other personnel; the low turnover rates of its key personnel; the overall financial strength and stability of CRMC and the Capital Group organization; and the ongoing evolution of CRMC’s organizational structure designed to maintain and strengthen these qualities. The board and the committee also considered the nature, extent and quality of administrative, compliance and shareholder services provided by CRMC to the fund under the agreement and other agreements, as well as the benefits to fund shareholders from investing in a fund that is part of a large family of funds. The board and the committee concluded that the nature, extent and quality of the services provided by CRMC have benefited and should continue to benefit the fund and its shareholders.
2. Investment results
The board and the committee considered the investment results of the fund in light of its objective of pursuing long term growth of capital. They compared the fund’s investment results with those of other relevant funds (including funds that form the basis of the Lipper index for the category in which the fund is included), and data such as relevant market and fund indexes, over various periods through March 31, 2015. This report, including the letter to shareholders and related disclosures, contains certain information about the fund’s investment results. The board and the committee reviewed the fund’s investment results measured against various indexes, including the MSCI All Country World Small Cap Index and the Lipper Global Small-/Mid-Cap Funds Index. They noted that the investment results of the fund generally compared favorably to those of these indexes for the lifetime period, 20-year period, 10-year period, and five-year period (where data comparisons are available). The board and the committee concluded that the fund’s investment results have been satisfactory for renewal of the agreement and that CRMC’s record in managing the fund indicated that its continued management should benefit the fund and its shareholders.
3. Advisory fees and total expenses
The board and the committee compared the advisory fees and total expense levels of the fund to those of other relevant funds. They observed that the fund’s advisory fees and expenses generally compared favorably to those of other similar funds included in the Lipper Global Small-/Mid-Cap Funds category. The board and the committee also considered the breakpoint discounts in the fund’s advisory fee structure that reduce the level of fees charged by CRMC to the fund as fund assets increase. In addition, they reviewed information regarding the effective advisory fees charged to non-mutual fund clients by CRMC and its affiliates. They noted that, to the extent there were differences between the advisory fees paid by the fund and the advisory fees paid by those clients, the differences appropriately reflected the investment, operational and regulatory differences between advising the fund and the other clients. The board and the committee concluded that the fund’s cost structure was fair and reasonable in relation to the services provided, and that the fund’s shareholders receive reasonable value in return for the advisory fees and other amounts paid to CRMC by the fund.
4. Ancillary benefits
The board and the committee considered a variety of other benefits that CRMC and its affiliates receive as a result of CRMC’s relationship with the fund and the other American Funds, including fees for administrative services provided to certain share classes; fees paid to CRMC’s affiliated transfer agent; sales charges and distribution fees received and retained by the fund’s principal underwriter, an affiliate of CRMC; and possible ancillary benefits to CRMC and its institutional management affiliates in managing other investment vehicles. The board and the committee reviewed CRMC’s portfolio trading practices, noting the potential benefits CRMC receives from the research obtained with commissions from portfolio transactions made on behalf of the fund. The board and the committee took these ancillary benefits into account in evaluating the reasonableness of the advisory fees and other amounts paid to CRMC by the fund.
5. Adviser financial information
The board and the committee reviewed information regarding CRMC’s costs of providing services to the American Funds, including personnel, systems and resources of investment, compliance, trading, accounting and other administrative operations. They considered CRMC’s costs and related cost allocation methodology as well as its willingness to invest in technology, infrastructure and staff to maintain and expand services and capabilities, respond to industry and regulatory developments, and attract and retain qualified personnel. They noted information regarding the compensation structure for CRMC’s investment professionals. The board and the committee also compared CRMC’s profitability and compensation data to the reported results and data of several large, publicly held investment management companies. The board and the committee noted the competitiveness and cyclicality of both the mutual fund industry and the capital markets, and the importance in that environment of CRMC’s long-term profitability for maintaining its independence, company culture and management continuity. They further considered the breakpoint discounts in the fund’s advisory fee structure. The board and the committee concluded that the fund’s advisory fee structure reflected a reasonable sharing of benefits between CRMC and the fund’s shareholders.
Board of directors and other officers
Independent directors1
| Name and year of birth | | Year first
elected
a director
of the fund2 | | Principal occupation(s) during past five years | | Number of
portfolios in fund
complex overseen
by director | | Other directorships3
held by director |
| Ronald P. Badie, 1942 | | 2010 | | Retired; former Vice Chairman, Deutsche Bank Alex. Brown (retired 2002) | | 3 | | Amphenol Corporation; Nautilus, Inc. |
| Joseph C. Berenato, 1946 Chairman of the Board (Independent and Non-Executive) | | 2000 | | Former Chairman and CEO, Ducommun Incorporated (aerospace components manufacturer) | | 15 | | Ducommun Incorporated |
| Louise H. Bryson, 1944 | | 2010 | | Chair Emerita of the Board of Trustees, J. Paul Getty Trust; former President, Distribution, Lifetime Entertainment Network (retired 2008); former Executive Vice President and General Manager, Lifetime Movie Network (retired 2008) | | 7 | | None |
| Robert J. Denison, 1941 | | 2010 | | Chair, First Security Management (private investment) | | 6 | | None |
| Mary Anne Dolan, 1947 | | 2008 | | Founder and President, MAD Ink (communications company) | | 10 | | None |
| John G. Freund, 1953 | | 2000 | | Founder and Managing Director, Skyline Ventures (venture capital investor in health care companies) | | 3 | | Collegium Pharmaceutical, Inc.; Proteon Therapeutics, Inc.; Tetraphase Pharmaceuticals, Inc.; XenoPort, Inc. |
| Linda Griego, 1947 | | 2015 | | President and CEO, Griego Enterprises, Inc. (business management company) | | 7 | | AECOM Technology Corporation; CBS Corporation |
| Leonade D. Jones, 1947 | | 1995 | | Retired; former Treasurer, The Washington Post Company (retired 1996) | | 10 | | None |
| William H. Kling, 1942 | | 1990 | | President Emeritus and former CEO, American Public Media | | 10 | | None |
| Christopher E. Stone, 1956 | | 2007 | | President, Open Society Foundations; former Professor of the Practice of Criminal Justice, John F. Kennedy School of Government, Harvard University | | 6 | | None |
Interested directors4,5
Name, year of birth and
position with fund | | Year first
elected
a director
or officer
of the fund2 | | Principal occupation(s) during past five years
and positions held with affiliated entities or
the principal underwriter of the fund | | Number of
portfolios in fund
complex overseen
by director | | Other directorships3
held by director |
| Jonathan Knowles, PhD, 1961 Vice Chairman of the Board | | 2000 | | Partner – Capital World Investors, Capital International, Inc.;6 Director, The Capital Group Companies, Inc.6 | | 1 | | None |
| Gregory W. Wendt, 1961 President | | 1992 | | Partner – Capital Research Global Investors, Capital Research and Management Company | | 1 | | None |
The fund’s statement of additional information includes further details about fund directors and is available without charge upon request by calling American Funds Service Company at (800) 421-4225 or by visiting the American Funds website at americanfunds.com. The address for all directors and officers of the fund is 333 South Hope Street, Los Angeles, CA 90071, Attention: Secretary.
See page 40 for footnotes.
Other officers5
Name, year of birth and
position with fund | | Year first elected
an officer
of the fund2 | | Principal occupation(s) during past five years and positions held with affiliated entities
or the principal underwriter of the fund |
Paul F. Roye, 1953
Executive Vice President | | 2007 | | Director, Capital Research and Management Company; Senior Vice President – Fund Business Management Group, Capital Research and Management Company |
Brady L. Enright, 1967
Senior Vice President | | 2004 | | Partner – Capital World Investors, Capital Research and Management Company |
J. Blair Frank, 1966
Senior Vice President | | 1999 | | Partner – Capital Research Global Investors, Capital Research and Management Company |
Lawrence Kymisis, 1970
Senior Vice President | | 2008 | | Partner – Capital Research Global Investors, Capital Research Company6 |
Julian N. Abdey, 1972
Vice President | | 2014 | | Partner – Capital World Investors, Capital Research and Management Company |
Walter R. Burkley, 1966
Vice President | | 2007 | | Senior Vice President and Senior Counsel – Fund Business Management Group, Capital Research and Management Company; Director, Capital Research Company6 |
Bradford F. Freer, 1969
Vice President | | 2008 | | Partner – Capital World Investors, Capital Research and Management Company |
Michael W. Stockton, 1967
Secretary | | 2014 | | Vice President – Fund Business Management Group, Capital Research and Management Company |
Jeffrey P. Regal, 1971
Treasurer | | 2010 | | Vice President – Investment Operations, Capital Research and Management Company |
Julie E. Lawton, 1973
Assistant Secretary | | 2010 | | Assistant Vice President – Fund Business Management Group, Capital Research and Management Company |
Dori Laskin, 1951
Assistant Treasurer | | 2011 | | Vice President – Investment Operations, Capital Research and Management Company |
Neal F. Wellons, 1971
Assistant Treasurer | | 2008 | | Vice President – Investment Operations, Capital Research and Management Company |
| 1 | The term independent director refers to a director who is not an “interested person” of the fund within the meaning of the Investment Company Act of 1940. |
| 2 | Directors and officers of the fund serve until their resignation, removal or retirement. |
| 3 | This includes all directorships/trusteeships (other than those in the American Funds or other funds managed by Capital Research and Management Company or its affiliates) that are held by each director as a trustee or director of a public company or a registered investment company. |
| 4 | The term interested trustee refers to a trustee who is an “interested person” within the meaning of the Investment Company Act of 1940, on the basis of their affiliation with the fund’s investment adviser, Capital Research and Management Company, or affiliated entities (including the fund’s principal underwriter). |
| 5 | All of the directors/trustees and/or officers listed, except Julian N. Abdey, J. Blair Frank and Lawrence Kymisis, are officers and/or directors/trustees of one or more of the other funds for which Capital Research and Management Company serves as investment adviser. |
| 6 | Company affiliated with Capital Research and Management Company. |
Offices of the fund and of the investment adviser
Capital Research and Management Company
333 South Hope Street
Los Angeles, CA 90071-1406
6455 Irvine Center Drive
Irvine, CA 92618-4518
Transfer agent for shareholder accounts
American Funds Service Company
(Write to the address near you.)
P.O. Box 6007
Indianapolis, IN 46206-6007
P.O. Box 2280
Norfolk, VA 23501-2280
Custodian of assets
State Street Bank and Trust Company
One Lincoln Street
Boston, MA 02111
Counsel
Dechert LLP
One Bush Street, Suite 1600
San Francisco, CA 94104-4446
Independent registered public accounting firm
Deloitte & Touche LLP
695 Town Center Drive
Suite 1200
Costa Mesa, CA 92626-7188
Principal underwriter
American Funds Distributors, Inc.
333 South Hope Street
Los Angeles, CA 90071-1406
Investors should carefully consider investment objectives, risks, charges and expenses. This and other important information is contained in the fund prospectus and summary prospectus, which can be obtained from your financial professional and should be read carefully before investing. You may also call American Funds Service Company (AFS) at (800) 421-4225 or visit the American Funds website at americanfunds.com.
“American Funds Proxy Voting Procedures and Principles” – which describes how we vote proxies relating to portfolio securities — is available on the American Funds website or upon request by calling AFS. The fund files its proxy voting record with the U.S. Securities and Exchange Commission (SEC) for the 12 months ended June 30 by August 31. The proxy voting record is available free of charge on the SEC website at sec.gov and on the American Funds website.
A complete September 30, 2015, portfolio of SMALLCAP World Fund’s investments is available free of charge by calling AFS or visiting the SEC website (where it is part of Form N-CSR).
SMALLCAP World Fund files a complete list of its portfolio holdings with the SEC for the first and third quarters of each fiscal year on Form N-Q. This filing is available free of charge on the SEC website. You may also review or, for a fee, copy this filing at the SEC’s Public Reference Room in Washington, D.C. Additional information regarding the operation of the Public Reference Room may be obtained by calling the SEC’s Office of Investor Education and Advocacy at (800) SEC-0330. Additionally, the list of portfolio holdings is available by calling AFS.
This report is for the information of shareholders of SMALLCAP World Fund, but it also may be used as sales literature when preceded or accompanied by the current prospectus or summary prospectus, which gives details about charges, expenses, investment objectives and operating policies of the fund. If used as sales material after December 31, 2015, this report must be accompanied by an American Funds statistical update for the most recently completed calendar quarter.
The American Funds Advantage
Since 1931, American Funds, part of Capital Group, has helped investors pursue long-term investment success. Our consistent approach — in combination with The Capital SystemSM —has resulted in a superior long-term track record.
Aligned with investor success
We base our decisions on a long-term perspective, which we believe aligns our goals with the interests of our clients. Our portfolio managers average 27 years of investment experience, including 22 years at our company, reflecting a career commitment to our long-term approach.1
The Capital SystemSM
Our investment process, The Capital System, combines individual accountability with teamwork. Each fund is divided into portions that are managed independently by investment professionals with diverse backgrounds, ages and investment approaches. An extensive global research effort is the backbone of our system.
Superior long-term track record
Our equity funds have beaten their Lipper peer indexes in 91% of 10-year periods and 96% of 20-year periods. Our fixed-income funds have beaten their Lipper indexes in 54% of 10-year periods and 57% of 20-year periods.2 Our fund management fees have been among the lowest in the industry.3
| | 1 | Portfolio manager experience as of December 31, 2014. |
| | 2 | Based on Class A share results for rolling periods through December 31, 2014. Periods covered are the shorter of the fund’s lifetime or since the comparable Lipper index inception date (except SMALLCAP World Fund, for which the Lipper average was used). |
| | 3 | On average, our management fees were in the lowest quintile 70% of the time, based on the 20-year period ended December 31, 2014, versus comparable Lipper categories, excluding funds of funds. |
| | | |

ITEM 2 – Code of Ethics
The Registrant has adopted a Code of Ethics that applies to its Principal Executive Officer and Principal Financial Officer. The Registrant undertakes to provide to any person without charge, upon request, a copy of the Code of Ethics. Such request can be made to American Funds Service Company at 800/421-9225 or to the Secretary of the Registrant, 6455 Irvine Center Drive, Irvine, California 92618.
ITEM 3 – Audit Committee Financial Expert
The Registrant’s board has determined that Ronald P. Badie, a member of the Registrant’s audit committee, is an “audit committee financial expert” and "independent," as such terms are defined in this Item. This designation will not increase the designee’s duties, obligations or liability as compared to his or her duties, obligations and liability as a member of the audit committee and of the board, nor will it reduce the responsibility of the other audit committee members. There may be other individuals who, through education or experience, would qualify as "audit committee financial experts" if the board had designated them as such. Most importantly, the board believes each member of the audit committee contributes significantly to the effective oversight of the Registrant’s financial statements and condition.
ITEM 4 – Principal Accountant Fees and Services
| | Registrant: |
| | | a) Audit Fees: |
| | | | 2014 | $145,000 |
| | | | 2015 | $159,000 |
| | | | |
| | | b) Audit-Related Fees: |
| | | | 2014 | $ 6,000 |
| | | | 2015 | $ 10,000 |
| | | | The audit-related fees consist of assurance and related services relating to the examination of the Registrant’s investment adviser conducted in accordance with Statement on Standards for Attestation Engagements Number 16 issued by the American Institute of Certified Public Accountants. |
| | | | |
| | | c) Tax Fees: |
| | | | 2014 | $ 37,000 |
| | | | 2015 | $ 34,000 |
| | | | The tax fees consist of professional services relating to the preparation of the Registrant’s tax returns including returns relating to the Registrant’s investments in non-U.S. jurisdictions. |
| | | | |
| | | d) All Other Fees: |
| | | | 2014 | None |
| | | | 2015 | None |
| | | | |
| | Adviser and affiliates (includes only fees for non-audit services billed to the adviser and affiliates for engagements that relate directly to the operations and financial reporting of the Registrant and were subject to the pre-approval policies described below): |
| | | a) Audit Fees: |
| | | | Not Applicable |
| | | | |
| | | b) Audit-Related Fees: |
| | | | 2014 | $ 993,000 |
| | | | 2015 | $1,148,000 |
| | | | The audit-related fees consist of assurance and related services relating to the examination of the Registrant’s transfer agent, principal underwriter and investment adviser conducted in accordance with Statement on Standards for Attestation Engagements Number 16 issued by the American Institute of Certified Public Accountants. |
| | | | |
| | | c) Tax Fees: |
| | | | 2014 | $ 41,000 |
| | | | 2015 | None |
| | | | The tax fees consist of consulting services relating to the Registrant’s investments. |
| | | | |
| | | d) All Other Fees: |
| | | | 2014 | $ 3,000 |
| | | | 2015 | $ 5,000 |
| | | | The other fees consist of subscription services related to an accounting research tool. |
All audit and permissible non-audit services that the Registrant’s audit committee considers compatible with maintaining the independent registered public accounting firm’s independence are required to be pre-approved by the committee. The pre-approval requirement will extend to all non-audit services provided to the Registrant, the investment adviser, and any entity controlling, controlled by, or under common control with the investment adviser that provides ongoing services to the Registrant, if the engagement relates directly to the operations and financial reporting of the Registrant. The committee will not delegate its responsibility to pre-approve these services to the investment adviser. The committee may delegate to one or more committee members the authority to review and pre-approve audit and permissible non-audit services. Actions taken under any such delegation will be reported to the full committee at its next meeting. The pre-approval requirement is waived with respect to non-audit services if certain conditions are met. The pre-approval requirement was not waived for any of the non-audit services listed above provided to the Registrant, adviser and affiliates.
Aggregate non-audit fees paid to the Registrant’s auditors, including fees for all services billed to the Registrant, adviser and affiliates that provide ongoing services to the Registrant, were $1,421,000 for fiscal year 2014 and $1,487,000 for fiscal year 2015. The non-audit services represented by these amounts were brought to the attention of the committee and considered to be compatible with maintaining the auditors’ independence.
ITEM 5 – Audit Committee of Listed Registrants
Not applicable to this Registrant, insofar as the Registrant is not a listed issuer as defined in Rule 10A-3 under the Securities Exchange Act of 1934.
ITEM 6 – Schedule of Investments
SMALLCAP World Fund®
Investment portfolio
September 30, 2015
Common stocks 88.70%
Consumer discretionary 17.34% | Shares | Value
(000) |
| Domino’s Pizza, Inc.1 | 3,125,769 | $337,302 |
| Lions Gate Entertainment Corp. | 6,877,000 | 253,074 |
| Ted Baker PLC1,2 | 3,167,993 | 153,870 |
| Dollarama Inc. | 2,078,000 | 140,345 |
| BCA Marketplace PLC1,2,3 | 42,870,000 | 110,886 |
| Paddy Power PLC2 | 886,051 | 101,967 |
| YOOX SpA2,3 | 2,998,469 | 90,485 |
| ASKUL Corp.2 | 2,193,600 | 83,500 |
| Melco International Development Ltd.2 | 67,307,000 | 82,977 |
| Tesla Motors, Inc.3 | 303,200 | 75,315 |
| Mr Price Group Ltd.2 | 4,926,826 | 68,765 |
| Inchcape PLC2 | 6,271,200 | 68,387 |
| Poundland Group PLC1,2 | 15,898,506 | 67,464 |
| zooplus AG, non-registered shares1,2,3 | 527,778 | 66,561 |
| Cedar Fair, LP | 1,240,000 | 65,236 |
| Penske Automotive Group, Inc. | 1,345,000 | 65,152 |
| Eros International PLC, Class A3 | 2,386,666 | 64,893 |
| Jarden Corp.3 | 1,293,750 | 63,238 |
| Brinker International, Inc. | 1,162,500 | 61,229 |
| Gentex Corp. | 3,909,134 | 60,592 |
| Domino’s Pizza Enterprises Ltd.2 | 2,084,956 | 59,044 |
| TOD’S SpA2 | 655,000 | 57,470 |
| ASOS PLC2,3 | 1,369,755 | 57,422 |
| Entertainment One Ltd.1,2 | 15,254,082 | 57,373 |
| POYA International Co., Ltd.1,2 | 5,588,216 | 55,967 |
| Eclat Textile Co., Ltd.2 | 3,305,840 | 52,286 |
| Tiffany & Co. | 667,000 | 51,506 |
| Jubilant FoodWorks Ltd.2 | 1,960,788 | 47,938 |
| Greene King PLC2 | 3,946,618 | 47,558 |
| Brunello Cucinelli SpA2 | 2,573,331 | 46,690 |
| Lands’ End, Inc.1,3 | 1,704,000 | 46,025 |
| Matahari Department Store Tbk PT2 | 40,820,000 | 44,973 |
| Installed Building Products, Inc.1,3 | 1,704,039 | 43,078 |
| Sotheby’s Holdings, Inc. | 1,320,000 | 42,214 |
| Rightmove PLC2 | 763,000 | 42,208 |
| Chow Sang Sang Holdings International Ltd.2 | 20,666,000 | 41,528 |
| Ocado Group PLC2,3 | 8,533,708 | 41,403 |
| Skechers USA, Inc., Class A3 | 300,000 | 40,224 |
| TopBuild Corp.3 | 1,259,977 | 39,021 |
| Nord Anglia Education, Inc.3 | 1,910,000 | 38,830 |
| Tele Columbus AG1,2,3 | 2,976,000 | 37,275 |
| Stella International Holdings Ltd.2 | 15,079,500 | 36,968 |
| Mothercare PLC1,2,3 | 10,810,000 | 36,195 |
| Jumbo SA2 | 4,087,964 | 35,948 |
| John Wiley & Sons, Inc., Class A | 715,800 | 35,811 |
| Moncler SpA2 | 1,981,400 | 35,528 |
| Century Communities, Inc.1,3 | 1,716,000 | 34,063 |
SMALLCAP World Fund — Page 1 of 16
Common stocks
Consumer discretionary (continued) | Shares | Value
(000) |
| Boyd Gaming Corp.3 | 2,049,000 | $33,399 |
| Cox & Kings Ltd.1,2 | 10,130,825 | 31,825 |
| Cox & Kings Ltd. (GDR)1,2 | 330,000 | 1,036 |
| Netflix, Inc.3 | 318,000 | 32,837 |
| Belmond Ltd., Class A3 | 3,153,000 | 31,877 |
| Ctrip.com International, Ltd. (ADR)3 | 491,000 | 31,021 |
| Five Below, Inc.3 | 910,000 | 30,558 |
| Pacific Textiles Holdings Ltd.2 | 22,275,000 | 30,379 |
| Standard Pacific Corp.3 | 3,754,000 | 30,032 |
| Cie. Plastic Omnium SA2 | 1,295,995 | 29,708 |
| ClubCorp Holdings, Inc. | 1,351,000 | 28,992 |
| Homeinns Hotel Group (ADR)3 | 1,006,000 | 28,912 |
| Chipotle Mexican Grill, Inc.3 | 39,890 | 28,731 |
| Planet Fitness, Inc., Class A3 | 1,480,275 | 25,372 |
| L’Occitane International SA2 | 12,102,051 | 25,328 |
| ServiceMaster Global Holdings, Inc.3 | 753,000 | 25,263 |
| Daily Mail and General Trust PLC, Class A, nonvoting2 | 2,210,000 | 25,242 |
| TAKKT AG2 | 1,301,778 | 24,428 |
| Zee Entertainment Enterprises Ltd.2 | 3,885,000 | 23,296 |
| Six Flags Entertainment Corp. | 500,000 | 22,890 |
| TravelCenters of America LLC1,3 | 2,023,750 | 20,905 |
| Habit Restaurants, Inc., Class A3 | 955,000 | 20,447 |
| China Lodging Group, Ltd. (ADR)3 | 840,000 | 20,437 |
| Estácio Participações SA, ordinary nominative | 5,675,000 | 20,183 |
| Brunswick Corp. | 405,000 | 19,395 |
| Resorttrust, Inc.2 | 777,000 | 19,385 |
| World Wrestling Entertainment, Inc., Class A | 1,140,000 | 19,266 |
| Hathway Cable and Datacom Ltd.2,3,4 | 35,250,000 | 19,212 |
| Lennar Corp., Class A | 394,000 | 18,963 |
| Beauty Community PCL, foreign registered1,2 | 150,000,000 | 18,791 |
| Titan Co. Ltd.2 | 3,760,000 | 18,419 |
| START TODAY Co., Ltd.2 | 553,100 | 18,354 |
| OSIM International Ltd2 | 15,871,000 | 18,156 |
| Papa Murphy’s Holdings, Inc.1,3 | 1,202,000 | 17,645 |
| Whistler Blackcomb Holdings Inc. | 1,043,637 | 16,814 |
| Toll Brothers, Inc.3 | 471,800 | 16,154 |
| Topps Tiles PLC2 | 7,000,000 | 15,482 |
| I.T Limited2 | 57,710,000 | 15,147 |
| B2W - Cia. Digital, ordinary nominative3 | 3,911,100 | 14,660 |
| D.R. Horton, Inc. | 490,000 | 14,386 |
| Cavco Industries, Inc.3 | 204,000 | 13,890 |
| Techtronic Industries Co. Ltd.2 | 3,570,000 | 13,297 |
| Arcos Dorados Holdings Inc., Class A | 4,735,000 | 12,879 |
| Intercontinental Hotels Group PLC2 | 371,045 | 12,832 |
| Tarena International, Inc., Class A (ADR)3 | 1,343,520 | 12,737 |
| DO & CO AG, non-registered shares2 | 150,000 | 12,151 |
| Merida Industry Co., Ltd.2 | 2,217,600 | 11,866 |
| Valeo SA, non-registered shares2 | 86,000 | 11,646 |
| HUGO BOSS AG2 | 99,231 | 11,128 |
| Playmates Toys Ltd.2 | 57,268,000 | 11,105 |
| Melco Crown Entertainment Ltd. (ADR) | 800,000 | 11,008 |
| William Hill PLC2 | 2,047,800 | 10,886 |
| Major Cineplex Group PCL2 | 12,268,000 | 10,833 |
| EVINE Live Inc., Class A1,3 | 3,987,540 | 10,447 |
| GVC Holdings PLC2 | 1,663,694 | 10,265 |
SMALLCAP World Fund — Page 2 of 16
Common stocks
Consumer discretionary (continued) | Shares | Value
(000) |
| American Axle & Manufacturing Holdings, Inc.3 | 505,000 | $10,070 |
| Dick Smith Holdings Ltd.2 | 10,890,940 | 9,893 |
| Café de Coral Holdings Ltd.2 | 2,820,000 | 9,443 |
| Zhongsheng Group Holdings Ltd.2 | 22,854,000 | 9,297 |
| Talwalkars Better Value Fitness Ltd.1,2 | 2,389,000 | 8,565 |
| Mattress Firm Holding Corp.3 | 200,000 | 8,352 |
| Sitoy Group Holdings Ltd.2 | 16,745,800 | 8,304 |
| DSW Inc., Class A | 320,000 | 8,099 |
| Hankook Tire Co., Ltd.2 | 233,473 | 7,828 |
| Tribhovandas Bhimji Zaveri Ltd.1,2 | 4,335,732 | 7,648 |
| Samsonite International SA2 | 2,175,000 | 7,139 |
| SHW AG, non-registered shares2 | 300,000 | 6,754 |
| PT Multipolar Tbk2 | 317,486,000 | 6,688 |
| ITT Educational Services, Inc.1,3 | 1,869,000 | 6,411 |
| POLYTEC Holding AG, non-registered shares2 | 834,369 | 6,348 |
| International Housewares Retail Co. Ltd.2 | 29,700,000 | 6,277 |
| Ace Hardware Indonesia Tbk PT2 | 174,400,000 | 6,036 |
| Ripley Corp SA | 17,201,967 | 5,685 |
| Qunar Cayman Islands Ltd., Class B (ADR)3 | 182,000 | 5,473 |
| GAEC Educação SA, ordinary nominative | 2,214,000 | 5,411 |
| Parkson Retail Asia Ltd.2 | 23,182,000 | 5,212 |
| Central European Media Enterprises Ltd., Class A3 | 2,220,000 | 4,795 |
| NagaCorp Ltd.2 | 7,330,000 | 4,411 |
| Sa Sa International Holdings Ltd.2 | 9,750,000 | 3,778 |
| Phorm Corp. Ltd.2,3 | 43,390,000 | 3,201 |
| Future Bright Holdings Ltd.2 | 26,052,000 | 2,910 |
| China Zenix Auto International Ltd. (ADR)3 | 2,152,000 | 2,174 |
| PT Astra Otoparts Tbk2 | 12,616,700 | 1,338 |
| Mulberry Group PLC2,3 | 52,890 | 721 |
| Five Star Travel Corp.2,3,4 | 96,033 | 21 |
| Ten Alps PLC2,3 | 343,900 | 14 |
| | | 4,544,377 |
| Health care 17.31% | | |
| Incyte Corp.3 | 4,054,883 | 447,375 |
| Molina Healthcare, Inc.1,3 | 3,898,100 | 268,384 |
| Myriad Genetics, Inc.1,3 | 5,766,556 | 216,131 |
| Endo International PLC3 | 2,672,381 | 185,143 |
| Hikma Pharmaceuticals PLC2 | 4,794,253 | 165,645 |
| GW Pharmaceuticals PLC (ADR)1,3 | 1,652,700 | 151,007 |
| bluebird bio, Inc.3 | 1,588,565 | 135,902 |
| athenahealth, Inc.3 | 929,371 | 123,932 |
| EXACT Sciences Corp.1,3 | 6,801,000 | 122,350 |
| Spire Healthcare Group PLC1,2 | 22,412,000 | 122,321 |
| Ultragenyx Pharmaceutical Inc.3 | 1,175,906 | 113,252 |
| Centene Corp.3 | 1,959,439 | 106,260 |
| Kite Pharma, Inc.3 | 1,855,562 | 103,318 |
| CONMED Corp.1 | 2,141,654 | 102,243 |
| Zeltiq Aesthetics, Inc.1,3 | 3,002,044 | 96,155 |
| BioMarin Pharmaceutical Inc.3 | 883,852 | 93,087 |
| Sysmex Corp.2 | 1,698,000 | 89,788 |
| Juno Therapeutics, Inc.3 | 2,107,501 | 85,754 |
| Illumina, Inc.3 | 435,800 | 76,622 |
| NuVasive, Inc.3 | 1,373,000 | 66,206 |
| Intuitive Surgical, Inc.3 | 135,000 | 62,043 |
SMALLCAP World Fund — Page 3 of 16
Common stocks
Health care (continued) | Shares | Value
(000) |
| Hologic, Inc.3 | 1,580,740 | $61,854 |
| Insulet Corp.3 | 2,374,000 | 61,510 |
| Galapagos NV2,3 | 1,452,535 | 59,486 |
| Teleflex Inc. | 460,700 | 57,224 |
| Prothena Corp. PLC3 | 1,223,114 | 55,456 |
| Alnylam Pharmaceuticals, Inc.3 | 647,603 | 52,041 |
| Adaptimmune Therapeutics PLC1,2,3,4 | 16,938,900 | 30,752 |
| Adaptimmune Therapeutics PLC (ADR)1,3 | 1,713,918 | 20,515 |
| ACADIA Pharmaceuticals Inc.3 | 1,381,000 | 45,670 |
| Brookdale Senior Living Inc.3 | 1,935,000 | 44,428 |
| Axovant Sciences Ltd.3 | 3,339,800 | 43,150 |
| HeartWare International, Inc.3 | 799,100 | 41,801 |
| Team Health Holdings, Inc.3 | 727,000 | 39,280 |
| Mitra Keluarga Karyasehat Tbk PT2 | 18,750,000 | 37,879 |
| Neurocrine Biosciences, Inc.3 | 927,500 | 36,905 |
| WellCare Health Plans, Inc.3 | 425,000 | 36,626 |
| ZS Pharma, Inc.3 | 540,000 | 35,456 |
| Agios Pharmaceuticals, Inc.3 | 488,000 | 34,448 |
| Novadaq Technologies Inc.1,3 | 3,084,948 | 32,176 |
| Sartorius AG, non-registered shares, nonvoting preferred2 | 129,343 | 30,799 |
| Genomma Lab Internacional, SAB de CV, Series B3 | 36,988,000 | 30,785 |
| Virbac SA2 | 169,500 | 29,286 |
| Thoratec Corp.3 | 435,000 | 27,518 |
| Ocular Therapeutix, Inc.1,3 | 1,955,700 | 27,497 |
| Primary Health Care Ltd.2 | 10,068,512 | 26,850 |
| Capio AB2,3 | 4,263,608 | 25,780 |
| China Biologic Products, Inc.3 | 283,500 | 25,464 |
| INC Research Holdings, Inc., Class A3 | 633,116 | 25,325 |
| Flexion Therapeutics, Inc.1,3 | 1,703,194 | 25,309 |
| QIAGEN NV2,3 | 968,751 | 24,987 |
| Neovasc Inc. (CAD denominated)1,2,3 | 4,246,900 | 22,277 |
| Neovasc Inc.1,3 | 503,836 | 2,489 |
| Sawai Pharmaceutical Co., Ltd.2 | 423,400 | 24,730 |
| Circassia Pharmaceuticals PLC2,3 | 5,390,575 | 23,908 |
| Fleury SA, ordinary nominative | 5,825,000 | 23,876 |
| Diplomat Pharmacy, Inc.3 | 828,600 | 23,806 |
| Tong Ren Tang Technologies Co., Ltd., Class H2 | 16,820,000 | 23,004 |
| Gerresheimer AG, non-registered shares2 | 310,000 | 22,614 |
| Eurofins Scientific SE, non-registered shares2 | 73,500 | 22,611 |
| Fisher & Paykel Healthcare Corp. Ltd.2 | 4,832,437 | 21,941 |
| Genmab A/S2,3 | 235,000 | 21,603 |
| NantKwest, Inc.3 | 1,470,703 | 16,854 |
| Conkwest, Inc.2,3,4 | 416,587 | 4,297 |
| ChemoCentryx, Inc.1,3 | 3,467,240 | 20,977 |
| Wright Medical Group, Inc.3 | 853,485 | 17,940 |
| Press Ganey Holdings, Inc.3 | 600,000 | 17,754 |
| Momenta Pharmaceuticals, Inc.3 | 1,040,000 | 17,066 |
| PerkinElmer, Inc. | 360,000 | 16,546 |
| Zafgen, Inc.3 | 512,644 | 16,379 |
| Trupanion, Inc.1,3 | 2,155,668 | 16,275 |
| Krka, dd, Novo mesto2 | 231,262 | 15,660 |
| Ironwood Pharmaceuticals, Inc., Class A3 | 1,475,000 | 15,370 |
| Grifols, SA, Class B (ADR) | 308,200 | 9,369 |
| Grifols, SA, Class A, non-registered shares2 | 135,000 | 5,584 |
| Regulus Therapeutics Inc.3 | 2,015,000 | 13,178 |
SMALLCAP World Fund — Page 4 of 16
Common stocks
Health care (continued) | Shares | Value
(000) |
| Mesoblast Ltd.2,3 | 4,700,000 | $10,464 |
| PT Siloam International Hospitals Tbk2 | 10,075,300 | 8,533 |
| Xenon Pharmaceuticals Inc.1,3 | 1,030,000 | 8,508 |
| Celldex Therapeutics, Inc.3 | 627,000 | 6,609 |
| OTCPharm PJSC2,3 | 924,610 | 3,254 |
| XenoPort, Inc.3 | 703,666 | 2,442 |
| | | 4,535,093 |
| Industrials 12.47% | | |
| Hoshizaki Electric Co., Ltd.2 | 2,780,700 | 195,044 |
| Moog Inc., Class A3 | 2,572,800 | 139,111 |
| ITT Corp. | 3,508,121 | 117,276 |
| AA PLC2,3 | 24,237,138 | 104,128 |
| King Slide Works Co., Ltd.1,2 | 6,683,000 | 91,490 |
| Loomis AB, Class B2 | 3,363,042 | 88,199 |
| Oshkosh Corp. | 2,235,600 | 81,219 |
| MonotaRO Co., Ltd.2 | 3,396,800 | 78,193 |
| NIBE Industrier AB, Class B2 | 2,489,000 | 73,051 |
| Spirax-Sarco Engineering PLC2 | 1,717,392 | 72,910 |
| Takeuchi Mfg. Co., Ltd.1,2 | 3,770,400 | 66,275 |
| IDEX Corp. | 875,000 | 62,387 |
| Continental Building Products, Inc.1,3 | 3,035,700 | 62,353 |
| Havells India Ltd.2 | 16,048,000 | 61,838 |
| Waste Connections, Inc. | 1,206,000 | 58,587 |
| BELIMO Holding AG2 | 26,826 | 56,467 |
| PARK24 Co., Ltd.2 | 2,859,900 | 53,808 |
| Boer Power Holdings Ltd.2 | 30,838,000 | 52,256 |
| Johnson Electric Holdings Ltd.2 | 15,754,875 | 51,948 |
| NORMA Group SE, non-registered shares2 | 1,051,339 | 51,597 |
| TechnoPro Holdings, Inc.1,2 | 1,845,000 | 49,093 |
| Wizz Air Holdings PLC2,3 | 1,565,985 | 48,552 |
| Exponent, Inc. | 1,070,000 | 47,679 |
| Northgate PLC1,2 | 6,908,399 | 47,513 |
| Gujarat Pipavav Port Ltd.2,3 | 16,729,000 | 47,432 |
| IMCD Group BV2 | 1,295,000 | 44,655 |
| Grupo Aeroportuario del Pacífico SAB de CV | 5,094,455 | 44,306 |
| Clean Harbors, Inc.3 | 1,004,700 | 44,177 |
| Landstar System, Inc. | 691,000 | 43,858 |
| Watsco, Inc. | 350,000 | 41,468 |
| Masco Corp. | 1,625,000 | 40,918 |
| TransDigm Group Inc.3 | 190,000 | 40,358 |
| Generac Holdings Inc.3 | 1,319,300 | 39,698 |
| American Airlines Group Inc. | 987,500 | 38,345 |
| ABM Industries Inc. | 1,317,000 | 35,967 |
| Amara Raja Batteries Ltd.2 | 2,173,886 | 34,230 |
| SolarCity Corp.3 | 795,000 | 33,954 |
| Dätwyler Holding Inc., non-registered shares2 | 247,200 | 33,601 |
| Orbital ATK, Inc. | 449,000 | 32,270 |
| Grupo Aeroportuario del Centro Norte, SAB de CV, Series B | 6,470,000 | 32,080 |
| Flughafen Zürich AG2 | 44,800 | 31,215 |
| Rheinmetall AG2 | 510,000 | 31,208 |
| Boyd Group Income Fund | 654,500 | 30,329 |
| Summit Ascent Holdings Ltd.2,3 | 51,620,000 | 26,973 |
| Michael Page International PLC2 | 3,585,000 | 25,767 |
| Meggitt PLC2 | 3,470,000 | 25,055 |
SMALLCAP World Fund — Page 5 of 16
Common stocks
Industrials (continued) | Shares | Value
(000) |
| CIMC Enric Holdings Ltd.2 | 42,398,000 | $24,287 |
| LT Group, Inc.2 | 108,370,000 | 23,441 |
| Univar Inc.3 | 1,263,400 | 22,931 |
| Graco Inc. | 340,000 | 22,790 |
| ARC Document Solutions, Inc.1,3 | 3,760,323 | 22,374 |
| Alliance Global Group, Inc.2 | 66,295,000 | 21,764 |
| J. Kumar Infraprojects Ltd.1,2 | 1,780,000 | 21,484 |
| Intertek Group PLC2 | 577,000 | 21,269 |
| Veda Group Ltd.2 | 10,950,000 | 20,582 |
| Carborundum Universal Ltd.2 | 7,985,000 | 19,432 |
| PayPoint PLC2 | 1,220,000 | 18,877 |
| Unique Engineering and Construction PCL2 | 33,852,000 | 18,699 |
| AKR Corporindo Tbk PT2 | 45,744,500 | 18,330 |
| Regus PLC2 | 3,888,000 | 18,071 |
| WageWorks, Inc.3 | 400,000 | 18,032 |
| Alaska Air Group, Inc. | 220,000 | 17,479 |
| KEYW Holding Corp.1,3 | 2,836,400 | 17,444 |
| Robert Half International Inc. | 337,000 | 17,241 |
| Virgin America Inc.3 | 500,000 | 17,115 |
| Teleperformance SA2 | 204,247 | 15,492 |
| Bossard Holding AG2 | 154,874 | 14,514 |
| Chart Industries, Inc.3 | 745,700 | 14,325 |
| The Brink’s Co. | 521,000 | 14,072 |
| Sinmag Equipment Corp.1,2 | 3,877,020 | 14,066 |
| Stabilus SA, non-registered shares2,3 | 359,000 | 12,949 |
| Valmont Industries, Inc. | 135,000 | 12,810 |
| Rotork PLC2 | 5,105,911 | 12,756 |
| INDUS Holding AG2 | 282,854 | 12,640 |
| Tidewater Midstream and Infrastructure Ltd.1,2,4 | 12,444,000 | 12,575 |
| Geberit AG2 | 41,000 | 12,553 |
| Japan Airport Terminal Co. Ltd.2 | 287,900 | 12,439 |
| Pegasus Hava Tasimaciligi AS2,3 | 2,050,000 | 11,970 |
| DKSH Holding AG2 | 179,551 | 11,378 |
| Shun Tak Holdings Ltd.2 | 29,850,000 | 11,339 |
| USG Corp.3 | 397,000 | 10,568 |
| Stock Building Supply Holdings, Inc.3 | 579,222 | 10,200 |
| Briggs & Stratton Corp. | 500,000 | 9,655 |
| Harmonic Drive Systems Inc.2 | 610,000 | 8,768 |
| Orient Overseas (International) Ltd.2 | 1,753,000 | 8,258 |
| Aeroflot - Russian Airlines OJSC2,3 | 14,079,000 | 7,607 |
| Shanghai Industrial Holdings Ltd.2 | 2,105,000 | 4,677 |
| TD Power Systems Ltd.2 | 1,009,087 | 4,624 |
| Jungheinrich AG, nonvoting preferred2 | 63,000 | 4,555 |
| COSCO Pacific Ltd.2,2 | 3,622,000 | 4,347 |
| Avianca Holdings SA, preferred, restricted-voting (ADR)3 | 666,700 | 3,160 |
| China Automation Group Ltd.2 | 17,077,000 | 1,817 |
| Mills Estruturas e Serviços de Engenharia SA, ordinary nominative3 | 1,464,901 | 1,663 |
| | | 3,266,257 |
| Information technology 12.32% | | |
| Qorvo, Inc.3 | 3,884,370 | 174,991 |
| Kakaku.com, Inc.2 | 10,380,000 | 168,763 |
| AAC Technologies Holdings Inc.2 | 26,351,500 | 164,832 |
| Zynga Inc., Class A3 | 61,055,000 | 139,205 |
| Demandware, Inc.1,3 | 2,529,356 | 130,717 |
SMALLCAP World Fund — Page 6 of 16
Common stocks
Information technology (continued) | Shares | Value
(000) |
| Palo Alto Networks, Inc.3 | 558,050 | $95,985 |
| Halma PLC2 | 8,477,237 | 92,733 |
| CDW Corp. | 2,060,000 | 84,172 |
| EPAM Systems, Inc.3 | 1,105,400 | 82,374 |
| DeNA Co., Ltd.2 | 4,061,000 | 75,820 |
| Globant SA1,3 | 2,467,480 | 75,480 |
| Zoopla Property Group PLC1,2 | 23,421,100 | 74,125 |
| Semiconductor Manufacturing International Corp.2,3 | 787,175,000 | 71,136 |
| eMemory Technology Inc.1,2 | 6,146,000 | 61,208 |
| Finisar Corp.1,3 | 5,386,000 | 59,946 |
| Inphi Corp.1,3 | 2,437,199 | 58,590 |
| Topcon Corp.2 | 4,363,110 | 57,049 |
| NCC Group PLC1,2 | 13,350,000 | 55,375 |
| Hermes Microvision Inc.2 | 1,405,000 | 53,731 |
| Nemetschek AG2 | 1,345,072 | 50,512 |
| Cypress Semiconductor Corp.3 | 5,161,000 | 43,972 |
| Coupons.com Inc.1,3 | 4,881,613 | 43,935 |
| Zebra Technologies Corp., Class A3 | 568,900 | 43,549 |
| Hamamatsu Photonics KK2 | 1,831,830 | 41,458 |
| Pandora Media, Inc.3 | 1,925,000 | 41,079 |
| RIB Software AG1,2 | 2,476,356 | 38,915 |
| WEX Inc.3 | 440,574 | 38,259 |
| MercadoLibre, Inc. | 416,000 | 37,881 |
| National Instruments Corp. | 1,344,264 | 37,357 |
| Sophos Group PLC2,3 | 10,281,700 | 36,353 |
| QLogic Corp.3 | 3,505,719 | 35,934 |
| Auto Trader Group plc2,3 | 6,674,700 | 34,296 |
| Syntel, Inc.3 | 750,043 | 33,984 |
| Gogo Inc.3 | 2,115,000 | 32,317 |
| JUST EAT PLC2,3 | 5,170,767 | 32,164 |
| Dolby Laboratories, Inc., Class A | 958,400 | 31,244 |
| Actua Corp1,3 | 2,602,000 | 30,600 |
| OBIC Co., Ltd.2 | 632,500 | 29,009 |
| QIWI PLC, Class B (ADR) | 1,788,000 | 28,823 |
| 58.com Inc., Class A (ADR)3 | 610,000 | 28,701 |
| Ellie Mae, Inc.3 | 425,000 | 28,292 |
| Cray Inc.3 | 1,403,772 | 27,809 |
| SUNeVision Holdings Ltd.2 | 89,298,000 | 27,635 |
| YY Inc., Class A (ADR)3 | 482,000 | 26,288 |
| Silicon Laboratories Inc.3 | 616,992 | 25,630 |
| VTech Holdings Ltd.2 | 2,142,000 | 25,471 |
| TravelSky Technology Ltd., Class H2 | 19,960,000 | 25,331 |
| Criteo SA (ADR)3 | 670,000 | 25,152 |
| Mail.Ru Group Ltd. (GDR)2,3 | 1,377,171 | 24,010 |
| Autodesk, Inc.3 | 530,000 | 23,394 |
| RingCentral, Inc., Class A3 | 1,285,000 | 23,323 |
| Wix.com Ltd.3 | 1,330,000 | 23,169 |
| Alcatel-Lucent2,3 | 6,271,532 | 23,089 |
| Atmel Corp. | 2,553,040 | 20,603 |
| ASM International NV2 | 623,000 | 20,209 |
| Hana Microelectronics PCL2 | 23,935,000 | 18,698 |
| ASM Pacific Technology Ltd.2 | 2,734,000 | 18,053 |
| CoStar Group, Inc.3 | 100,000 | 17,306 |
| Sonus Networks, Inc.1,3 | 2,938,000 | 16,805 |
| Suprema Inc.1,2 | 868,200 | 16,574 |
SMALLCAP World Fund — Page 7 of 16
Common stocks
Information technology (continued) | Shares | Value
(000) |
| MagnaChip Semiconductor Corp.1,3 | 2,355,000 | $15,519 |
| Trimble Navigation Ltd.3 | 840,000 | 13,793 |
| Viavi Solutions Inc.3 | 2,489,000 | 13,366 |
| Persistent Systems Ltd.2 | 1,296,535 | 13,210 |
| Alten SA, non-registered shares2 | 250,000 | 12,843 |
| Taiyo Yuden Co., Ltd.2 | 960,000 | 12,541 |
| Aiming Inc.2,3 | 1,252,500 | 11,588 |
| ON Semiconductor Corp.3 | 1,230,000 | 11,562 |
| KLA-Tencor Corp. | 225,000 | 11,250 |
| Ultimate Software Group, Inc.3 | 55,700 | 9,971 |
| Ixia3 | 671,430 | 9,729 |
| Semtech Corp.3 | 620,000 | 9,362 |
| M/A-COM Technology Solutions Holdings, Inc.3 | 304,476 | 8,827 |
| GoDaddy Inc., Class A3 | 342,600 | 8,637 |
| Lumentum Holdings Inc.3 | 497,800 | 8,438 |
| Veeco Instruments Inc.3 | 395,767 | 8,117 |
| Tableau Software, Inc., Class A3 | 100,000 | 7,978 |
| SciQuest, Inc.3 | 706,890 | 7,069 |
| iDreamSky Technology Ltd., Class A (ADR)3 | 643,000 | 6,494 |
| Jay Mart PCL2 | 22,812,500 | 5,544 |
| Cognex Corp. | 161,202 | 5,541 |
| Goldpac Group Ltd.2 | 10,509,000 | 5,350 |
| Good Technology Corp.2,3,4,5 | 3,636,364 | 5,273 |
| Tangoe, Inc.3 | 327,118 | 2,355 |
| iEnergizer Ltd.2,3 | 7,650,500 | 1,157 |
| Remark Media, Inc.3 | 108,065 | 475 |
| | | 3,229,404 |
| Financials 10.50% | | |
| Kotak Mahindra Bank Ltd.2 | 20,057,040 | 199,063 |
| SVB Financial Group3 | 1,305,700 | 150,861 |
| Validus Holdings, Ltd. | 2,813,000 | 126,782 |
| Umpqua Holdings Corp. | 7,004,541 | 114,174 |
| VZ Holding AG2 | 310,100 | 96,486 |
| GT Capital Holdings, Inc.2 | 3,485,200 | 94,624 |
| Indiabulls Housing Finance Ltd.2 | 7,725,000 | 94,437 |
| PacWest Bancorp | 1,942,149 | 83,143 |
| Financial Engines, Inc. | 2,520,930 | 74,292 |
| First Republic Bank | 1,141,825 | 71,672 |
| East West Bancorp, Inc. | 1,855,000 | 71,269 |
| Shriram Transport Finance Co. Ltd.2 | 4,928,739 | 69,608 |
| HCC Insurance Holdings, Inc. | 772,000 | 59,807 |
| WHA Corp. PCL, foreign1,2,3 | 677,141,200 | 59,069 |
| Kemper Corp. | 1,626,000 | 57,512 |
| Talmer Bancorp, Inc., Class A1 | 3,434,028 | 57,177 |
| Outfront Media Inc. | 2,640,929 | 54,931 |
| Bank of the Ozarks, Inc. | 1,240,000 | 54,262 |
| Cathay General Bancorp, Inc. | 1,788,000 | 53,568 |
| Avanza Bank Holding AB2 | 1,280,526 | 52,605 |
| Bajaj Finance Ltd.2 | 608,716 | 47,720 |
| Great Western Bancorp, Inc. | 1,617,000 | 41,023 |
| Texas Capital Bancshares, Inc.3 | 728,000 | 38,162 |
| PSG Group Ltd.2 | 2,210,000 | 35,505 |
| Janus Capital Group Inc. | 2,543,000 | 34,585 |
| Foxtons Group PLC2 | 9,596,590 | 34,510 |
SMALLCAP World Fund — Page 8 of 16
Common stocks
Financials (continued) | Shares | Value
(000) |
| Fibra Uno Administración, SA de CV | 15,355,891 | $31,711 |
| Altisource Residential Corp. | 2,188,650 | 30,466 |
| Zegona Communications PLC1,2,3 | 12,305,654 | 28,841 |
| Endurance Specialty Holdings Ltd. | 470,040 | 28,687 |
| GRUH Finance Ltd.2 | 6,900,000 | 28,052 |
| City Union Bank Ltd.2 | 19,813,000 | 27,793 |
| CenterState Banks, Inc. | 1,802,399 | 26,495 |
| Inversiones La Construcción SA | 2,412,964 | 26,024 |
| Old Republic International Corp. | 1,635,000 | 25,571 |
| Mercury General Corp. | 500,000 | 25,255 |
| Greenhill & Co., Inc. | 885,500 | 25,210 |
| Cerved Information Solutions SPA, non-registered shares2 | 3,352,011 | 24,741 |
| EFG International AG2 | 2,225,378 | 23,740 |
| Onex Corp. | 400,000 | 23,089 |
| RenaissanceRe Holdings Ltd. | 205,000 | 21,796 |
| GRIVALIA PROPERTIES Real Estate Investments Co.2 | 2,441,633 | 21,758 |
| Signature Bank3 | 157,800 | 21,707 |
| LSL Property Services PLC2 | 4,166,350 | 21,615 |
| Land and Houses PCL, nonvoting depository receipt2 | 95,470,000 | 21,224 |
| Gaming and Leisure Properties, Inc. | 700,000 | 20,790 |
| RE/MAX Holdings, Inc., Class A | 550,000 | 19,789 |
| Numis Corp. PLC2 | 5,514,282 | 19,627 |
| ICRA Ltd.2 | 296,877 | 18,368 |
| Bank of Ireland2,3 | 45,456,798 | 17,666 |
| Sino-Ocean Land Holdings Ltd.2 | 30,764,317 | 16,921 |
| CRISIL Ltd.2 | 570,000 | 15,934 |
| Mahindra Lifespace Developers Ltd.1,2 | 2,157,380 | 15,548 |
| Chailease Holding Co. Ltd.2 | 9,689,680 | 15,200 |
| Banca Generali SpA2 | 493,000 | 13,926 |
| K. Wah International Holdings Ltd.2 | 34,759,947 | 13,886 |
| Cascade Bancorp3 | 2,450,962 | 13,260 |
| Repco Home Finance Ltd.2 | 1,172,000 | 13,164 |
| InfraREIT, Inc. | 538,900 | 12,761 |
| Clifton Bancorp Inc. | 816,606 | 11,334 |
| Square 1 Financial, Inc., Class A3 | 435,788 | 11,189 |
| Macquarie Mexican REIT | 8,661,000 | 10,938 |
| Green Bancorp, Inc.3 | 953,125 | 10,923 |
| LendingClub Corp.3 | 788,344 | 10,430 |
| Manappuram Finance Ltd.2 | 27,930,986 | 10,369 |
| BankUnited, Inc. | 261,000 | 9,331 |
| National Bank of Pakistan2 | 16,845,000 | 8,252 |
| Moelis & Co., Class A | 264,900 | 6,956 |
| Soundwill Holdings Ltd.2 | 5,690,000 | 6,794 |
| Tune Ins Holdings Bhd.2 | 18,416,000 | 5,455 |
| Premium Leisure Corp.2 | 242,500,000 | 5,104 |
| Golden Wheel Tiandi Holdings Co. Ltd.2 | 45,970,000 | 4,245 |
| Altisource Asset Management Corp.1,3 | 116,926 | 2,800 |
| | | 2,751,582 |
| Consumer staples 5.75% | | |
| Emami Ltd.2 | 7,665,000 | 134,870 |
| Emmi AG1,2 | 290,775 | 121,550 |
| Sprouts Farmers Market, Inc.3 | 5,543,000 | 116,957 |
| Pinnacle Foods Inc. | 2,389,050 | 100,053 |
| Raia Drogasil SA, ordinary nominative | 9,627,374 | 94,950 |
SMALLCAP World Fund — Page 9 of 16
Common stocks
Consumer staples (continued) | Shares | Value
(000) |
| Herbalife Ltd.3 | 1,390,500 | $75,782 |
| Lion Corp.2 | 7,637,000 | 67,331 |
| Glanbia PLC2 | 3,550,200 | 66,102 |
| Puregold Price Club, Inc.2 | 92,261,300 | 61,253 |
| COSMOS Pharmaceutical Corp.2 | 450,200 | 53,148 |
| Coca-Cola Icecek AS, Class C2 | 3,877,512 | 44,372 |
| Stock Spirits Group PLC1,2 | 15,474,743 | 43,308 |
| Pigeon Corp.2 | 1,491,000 | 35,006 |
| Hypermarcas SA, ordinary nominative3 | 8,592,600 | 33,118 |
| Nu Skin Enterprises, Inc., Class A | 792,000 | 32,694 |
| Super Group Ltd.1,2 | 59,000,000 | 32,043 |
| Fresh Del Monte Produce Inc. | 750,000 | 29,633 |
| PZ Cussons PLC2 | 6,675,000 | 29,383 |
| CCL Products (India) Ltd.1,2 | 7,278,328 | 26,235 |
| Davide Campari-Milano SpA2 | 3,150,000 | 25,133 |
| Ezaki Glico Co., Ltd.2 | 488,000 | 22,587 |
| Eurocash SA2 | 1,762,000 | 20,750 |
| Emperador Inc.2 | 135,870,000 | 20,351 |
| Kaveri Seed Co. Ltd.2 | 3,090,000 | 20,146 |
| Refresco Gerber NV2,3 | 1,260,000 | 19,729 |
| Kernel Holding SA2 | 1,642,578 | 19,483 |
| Treasury Wine Estates Ltd.2 | 4,206,860 | 19,445 |
| Lenta Ltd. (GDR)2,3 | 2,097,000 | 15,729 |
| Lenta Ltd. (GDR)2,3,4 | 348,700 | 2,616 |
| Karex Bhd.2,3 | 23,363,250 | 17,312 |
| VST Industries Ltd.2 | 665,000 | 16,275 |
| Petra Foods Ltd.2 | 9,183,000 | 16,208 |
| HITEJINRO CO., LTD.2 | 751,679 | 14,538 |
| Convenience Retail Asia Ltd.2 | 30,076,000 | 14,514 |
| Del Monte Pacific Ltd.2 | 66,733,314 | 14,181 |
| CALBEE, Inc.2 | 350,000 | 11,376 |
| Sundrug Co., Ltd.2 | 174,900 | 9,247 |
| Real Nutriceutical Group Ltd.2 | 29,667,000 | 5,107 |
| R.E.A. Holdings PLC2 | 800,000 | 3,256 |
| | | 1,505,771 |
| Materials 3.92% | | |
| Chr. Hansen Holding A/S2 | 2,593,200 | 145,221 |
| James Hardie Industries PLC (CDI)2 | 7,355,000 | 88,770 |
| AptarGroup, Inc. | 1,060,000 | 69,918 |
| PolyOne Corp. | 2,049,000 | 60,118 |
| Silgan Holdings Inc. | 1,011,500 | 52,638 |
| Sirius Minerals Plc1,2,3 | 153,077,760 | 43,967 |
| Stillwater Mining Co.3 | 4,115,000 | 42,508 |
| SK Kaken Co.,Ltd.2 | 428,000 | 41,872 |
| Buzzi Unicem SPA2 | 2,015,558 | 33,776 |
| Mayr-Melnhof Karton AG, non-registered shares2 | 292,300 | 33,739 |
| Stella-Jones Inc. | 1,040,000 | 33,534 |
| CCL Industries Inc., Class B, non-voting | 200,000 | 28,075 |
| FUCHS PETROLUB SE2 | 657,143 | 25,266 |
| CPMC Holdings Ltd.2 | 46,500,000 | 25,034 |
| Lenzing AG2 | 328,000 | 24,636 |
| Arkema SA2 | 345,000 | 22,388 |
| Lundin Mining Corp.3 | 7,910,000 | 22,346 |
| Huhtamäki Oyj2 | 724,000 | 22,143 |
SMALLCAP World Fund — Page 10 of 16
Common stocks
Materials (continued) | Shares | Value
(000) |
| Nampak Ltd.2 | 11,858,075 | $22,111 |
| UPL Ltd.2 | 2,950,000 | 20,665 |
| Symrise AG2 | 320,500 | 19,252 |
| Boral Ltd.2 | 5,166,000 | 19,145 |
| Synthomer PLC2 | 3,600,000 | 18,562 |
| Valspar Corp. | 249,800 | 17,956 |
| Croda International PLC2 | 422,000 | 17,333 |
| United States Steel Corp. | 1,403,000 | 14,619 |
| Mountain Province Diamonds Inc.3 | 4,964,264 | 12,797 |
| Dongpeng Holdings Co. Ltd.2 | 24,240,000 | 8,181 |
| Yingde Gases Group Co. Ltd.2 | 19,168,000 | 7,920 |
| Greatview Aseptic Packaging Co. Ltd.2 | 16,320,000 | 7,585 |
| ArtGo Holdings Ltd.2,3 | 40,427,000 | 6,895 |
| HudBay Minerals Inc. | 1,765,000 | 6,520 |
| Kenmare Resources PLC2,3 | 109,972,782 | 3,214 |
| Constellium NV, Class A3 | 524,000 | 3,175 |
| Platinum Group Metals Ltd.3 | 13,475,000 | 3,029 |
| Kennady Diamonds Inc.3 | 372,952 | 844 |
| Rusoro Mining Ltd.3 | 21,437,000 | 803 |
| Sundance Resources Ltd.2,3 | 58,500,000 | 657 |
| Hummingbird Resources PLC2,3 | 1,650,000 | 605 |
| | | 1,027,817 |
| Energy 2.29% | | |
| InterOil Corp.3 | 2,344,500 | 79,033 |
| Diamondback Energy, Inc.3 | 1,080,950 | 69,829 |
| Peyto Exploration & Development Corp. | 2,248,800 | 46,762 |
| Oasis Petroleum Inc.3 | 4,213,000 | 36,569 |
| Nostrum Oil & Gas PLC2 | 4,396,557 | 30,773 |
| Petronet LNG Ltd.2 | 10,460,000 | 29,727 |
| Oil States International, Inc.3 | 1,127,500 | 29,462 |
| Concho Resources Inc.3 | 279,500 | 27,475 |
| Keyera Corp. | 952,400 | 26,228 |
| Parsley Energy, Inc., Class A3 | 1,467,200 | 22,111 |
| Veresen Inc. | 2,737,000 | 20,920 |
| Synergy Resources Corp.3 | 1,871,323 | 18,339 |
| Memorial Resource Development Corp.3 | 955,000 | 16,789 |
| Ophir Energy PLC2,3 | 11,100,000 | 15,118 |
| WorleyParsons Ltd.2 | 3,585,000 | 14,934 |
| Venture Global LNG, Inc., Class C1,2,3,5 | 4,240 | 12,720 |
| Tourmaline Oil Corp.3 | 410,000 | 9,546 |
| Genel Energy PLC2,3 | 2,224,800 | 9,358 |
| Falkland Oil and Gas Ltd.2,3 | 24,225,000 | 8,918 |
| Clayton Williams Energy, Inc.3 | 201,000 | 7,801 |
| Gulf Keystone Petroleum Ltd.2,3,4 | 15,715,000 | 7,639 |
| Gulf Marine Services PLC2 | 3,920,000 | 6,825 |
| RMP Energy Inc.1,3 | 6,670,300 | 6,348 |
| Lekoil Ltd. (CDI)1,2,3 | 19,430,400 | 6,242 |
| Amerisur Resources PLC2,3 | 16,000,000 | 6,064 |
| Delphi Energy Corp.1,3 | 10,178,500 | 5,263 |
| Savannah Petroleum PLC1,2,3 | 10,844,000 | 5,086 |
| Core Laboratories NV | 40,000 | 3,992 |
| BNK Petroleum Inc.1,3 | 12,804,914 | 3,646 |
| San Leon Energy PLC1,2,3 | 4,003,000 | 3,605 |
| Africa Oil Corp. (SEK denominated)2,3 | 2,683,000 | 3,152 |
SMALLCAP World Fund — Page 11 of 16
Common stocks
Energy (continued) | Shares | Value
(000) |
| Aker Solutions ASA2 | 637,000 | $2,204 |
| Cairn Energy PLC2,3 | 723,600 | 1,536 |
| SBM Offshore NV2,3 | 120,000 | 1,519 |
| Tethys Petroleum Ltd.3 | 16,808,487 | 1,008 |
| Borders & Southern Petroleum PLC2,3 | 20,265,000 | 971 |
| Range Resources Ltd.2,3 | 98,902,224 | 847 |
| Paramount Resources Ltd.3 | 70,980 | 523 |
| African Petroleum Corp. Ltd.2,3 | 14,458,909 | 427 |
| Esrey Energy Ltd.3 | 650,000 | 32 |
| | | 599,341 |
| Utilities 0.97% | | |
| ENN Energy Holdings Ltd.2 | 19,994,000 | 96,472 |
| CESC Ltd.2 | 4,970,000 | 39,251 |
| Ratchaburi Electricity Generating Holding PCL2 | 12,397,200 | 18,292 |
| Ratchaburi Electricity Generating Holding PCL, nonvoting depository receipts2 | 7,945,000 | 11,723 |
| CT Environmental Group Ltd.2 | 64,072,000 | 20,183 |
| Huadian Fuxin Energy Corp. Ltd., Class H2 | 47,270,000 | 16,392 |
| Greenko Group PLC1,2,3 | 9,748,155 | 10,768 |
| Mytrah Energy Ltd.1,2,3 | 10,418,000 | 9,937 |
| Manila Water Co., Inc.2 | 20,263,600 | 9,438 |
| NRG Yield, Inc., Class C | 335,523 | 3,896 |
| NRG Yield, Inc., Class A | 335,523 | 3,741 |
| Energy World Corp. Ltd.2,3 | 50,606,000 | 7,085 |
| NextEra Energy Partners, LP, restricted-voting shares | 305,900 | 6,669 |
| | | 253,847 |
| Telecommunication services 0.87% | | |
| HKBN Ltd.1,2 | 60,888,000 | 70,449 |
| Orange Polska SA2 | 19,400,000 | 37,162 |
| Reliance Communications Ltd.2,3 | 31,945,000 | 33,130 |
| Cogent Communications Holdings, Inc. | 1,135,000 | 30,827 |
| Iridium Communications Inc.1,3 | 4,889,615 | 30,071 |
| Total Access Communication PCL2 | 9,964,000 | 15,895 |
| Hutchison Telecommunications Hong Kong Holdings Ltd.2 | 28,662,000 | 11,548 |
| NewSat Ltd.2,3 | 26,555,563 | — |
| Let’s GOWEX, SA, non-registered shares2,3 | 106,245 | — |
| | | 229,082 |
| Miscellaneous 4.96% | | |
| Other common stocks in initial period of acquisition | | 1,299,397 |
| Total common stocks (cost: $19,011,776,000) | | 23,241,968 |
Preferred securities 0.00%
Consumer discretionary 0.00% | | |
| Zee Entertainment Enterprises Ltd., 6.00% preferred, expires 2022 | 81,585,000 | 1,119 |
| Consumer staples 0.00% | | |
| R.E.A. Holdings PLC 9.00% | 96,000 | 136 |
| Total preferred securities (cost: $731,000) | | 1,255 |
SMALLCAP World Fund — Page 12 of 16
Rights & warrants 0.06%
Information technology 0.05% | Shares | Value
(000) |
| Foursquare Labs, Inc., warrants, expire 20332,3,5 | 1,163,990 | $12,105 |
| Financials 0.01% | | |
| WHA Corp. PCL, warrants, expire 20201,3 | 6,909,830 | 2,113 |
| Materials 0.00% | | |
| Sirius Minerals Plc, warrants, expire 20151,2,3 | 26,600,000 | 1,066 |
| Consumer discretionary 0.00% | | |
| Central European Media Enterprises Ltd., warrants, expire 20182,3 | 751,800 | 900 |
| Total rights & warrants (cost: $927,000) | | 16,184 |
Convertible stocks 0.66%
Health care 0.39% | | |
| Proteus Digital Health, Inc., Series G, convertible preferred2,5 | 3,044,139 | 40,000 |
| Twelve, Inc., Series C, convertible preferred1,2,5 | 3,475,770 | 28,953 |
| Acerta Pharma BV, Series B, convertible preferred1,2,5 | 2,173,914 | 24,786 |
| Stemcentrx, Inc., Series F-1, convertible preferred2,5 | 332,000 | 7,649 |
| | | 101,388 |
| Information technology 0.25% | | |
| Domo, Inc., Series D-2, convertible preferred1,2,5 | 2,965,036 | 25,000 |
| DocuSign, Inc., Series E, convertible preferred2,5 | 1,236,304 | 19,904 |
| DocuSign, Inc., Series B, convertible preferred2,5 | 66,593 | 1,072 |
| DocuSign, Inc., Series D, convertible preferred2,5 | 47,810 | 770 |
| DocuSign, Inc., Series B1, convertible preferred2,5 | 19,947 | 321 |
| Foursquare Labs, Inc., Series D, convertible preferred2,5 | 1,551,988 | 20,000 |
| | | 67,067 |
| Telecommunication services 0.02% | | |
| Iridium Communications Inc., Series A, convertible preferred1,4 | 60,000 | 5,009 |
| Total convertible stocks (cost: $145,162,000) | | 173,464 |
Bonds, notes & other debt instruments 0.36%
U.S. Treasury bonds & notes 0.33%
U.S. Treasury 0.33% | Principal amount
(000) | |
| U.S. Treasury 0.25% 20156 | $75,557 | 75,572 |
| U.S. Treasury 0.25% 2015 | 2,475 | 2,475 |
| U.S. Treasury 2.125% 2016 | 7,775 | 7,840 |
| Total U.S. Treasury bonds & notes | | 85,887 |
Corporate bonds & notes 0.03%
Energy 0.02% | | |
| Clayton Williams Energy Inc. 7.75% 2019 | 4,950 | 4,214 |
SMALLCAP World Fund — Page 13 of 16
Bonds, notes & other debt instruments
Corporate bonds & notes (continued)
Consumer discretionary 0.01% | Principal amount
(000) | Value
(000) |
| Central European Media Enterprises Ltd., First Lien, 15.00% 20177 | $4,184 | $4,072 |
| Total corporate bonds & notes | | 8,286 |
| Total bonds, notes & other debt instruments (cost: $94,336,000) | | 94,173 |
| Short-term securities 9.55% | | |
| American Honda Finance Corp. 0.17% due 10/22/2015–10/23/2015 | 90,000 | 89,993 |
| ANZ New Zealand (International) Ltd. 0.41% due 1/14/20164 | 50,900 | 50,852 |
| AstraZeneca PLC 0.15% due 11/24/20154 | 54,700 | 54,685 |
| Bank of Montreal 0.00% due 11/13/2015–12/2/2015 | 75,000 | 75,010 |
| Bank of Nova Scotia 0.27% due 10/13/20154 | 68,800 | 68,798 |
| Bank of Tokyo-Mitsubishi UFJ, Ltd. 0.24% due 11/17/2015 | 50,000 | 49,986 |
| BNP Paribas Finance Inc. 0.15% due 10/1/2015 | 40,000 | 40,000 |
| CAFCO, LLC 0.14% due 11/16/2015 | 7,000 | 6,999 |
| Chariot Funding, LLC 0.42% due 1/4/20164 | 38,100 | 38,064 |
| ExxonMobil Corp. 0.09% due 10/15/2015 | 20,400 | 20,399 |
| Fannie Mae 0.20% due 12/14/2015 | 48,100 | 48,098 |
| Federal Home Loan Bank 0.10%–0.22% due 10/19/2015–2/8/2016 | 576,300 | 576,276 |
| Freddie Mac 0.11%–0.25% due 11/2/2015–1/27/2016 | 352,900 | 352,877 |
| International Bank for Reconstruction and Developement 0.17% due 10/27/2015 | 50,000 | 50,000 |
| KfW 0.21%–0.23% due 10/23/2015–11/9/20154 | 147,200 | 147,189 |
| Microsoft Corp. 0.18% due 12/9/20154 | 35,000 | 34,993 |
| Mitsubishi UFJ Trust and Banking Corp. 0.22% due 10/14/20154 | 50,000 | 49,997 |
| Mizuho Bank, Ltd. 0.28%–0.30% due 10/23/2015–11/5/20154 | 118,500 | 118,483 |
| Nordea Bank AB 0.27%–0.32% due 11/10/2015–12/14/20154 | 90,000 | 89,973 |
| Old Line Funding, LLC 0.28% due 10/5/20154 | 35,000 | 34,999 |
| Province of Ontario 0.13%–0.15% due 10/15/2015–10/21/2015 | 88,500 | 88,495 |
| Sumitomo Mitsui Banking Corp. 0.19% due 10/16/20154 | 30,200 | 30,198 |
| Svenska Handelsbanken Inc. 0.26%–0.30% due 10/23/2015–12/1/20154 | 124,800 | 124,764 |
| Thunder Bay Funding, LLC 0.28%–0.31% due 11/6/2015–11/10/20154 | 75,000 | 74,981 |
| Toronto-Dominion Holdings USA Inc. 0.20%–0.31% due 10/19/2015–12/1/20154 | 81,000 | 80,984 |
| Toyota Credit Canada Inc. 0.33% due 12/8/2015 | 25,000 | 24,990 |
| Toyota Motor Credit Corp. 0.23% due 10/20/2015 | 57,300 | 57,298 |
| Victory Receivables Corp. 0.19% due 10/28/20154 | 22,700 | 22,696 |
| Total short-term securities (cost: $2,501,688,000) | | 2,502,077 |
| Total investment securities 99.33% (cost: $21,754,620,000) | | 26,029,121 |
| Other assets less liabilities 0.67% | | 175,051 |
| Net assets 100.00% | | $26,204,172 |
As permitted by U.S. Securities and Exchange Commission regulations, “Miscellaneous” securities include holdings in their first year of acquisition that have not previously been publicly disclosed.
SMALLCAP World Fund — Page 14 of 16
Forward currency contracts
The fund has entered into forward currency contracts as shown in the following table. The average month-end notional amount of open forward currency contracts while held was $340,312,000.
| | Settlement
date | Counterparty | Contract amount | Unrealized
appreciation
(depreciation)
at 9/30/2015
(000) |
Receive
(000) | Deliver
(000) |
| Sales: | | | | | |
| Australian dollars | 10/19/2015 | HSBC Bank | $23,959 | A$33,400 | $541 |
| Australian dollars | 10/26/2015 | Barclays Bank PLC | $1,061 | A$1,450 | 45 |
| Australian dollars | 11/25/2015 | UBS AG | $1,397 | A$2,000 | (2) |
| British pounds | 10/5/2015 | JPMorgan Chase | $42,196 | £27,548 | 524 |
| British pounds | 10/9/2015 | Citibank | $54,060 | £34,459 | 1,934 |
| British pounds | 10/9/2015 | Barclays Bank PLC | $22,184 | £14,140 | 795 |
| British pounds | 10/14/2015 | Bank of America, N.A. | $72,798 | £46,673 | 2,200 |
| British pounds | 10/14/2015 | Barclays Bank PLC | $6,430 | £4,122 | 194 |
| British pounds | 10/19/2015 | UBS AG | $61,260 | £39,721 | 1,177 |
| British pounds | 11/10/2015 | Citibank | $75,824 | £49,322 | 1,227 |
| Canadian dollars | 10/7/2015 | UBS AG | $26,855 | C$34,000 | 1,379 |
| Euros | 10/15/2015 | Citibank | $10,441 | €9,200 | 159 |
| Euros | 10/20/2015 | HSBC Bank | $13,442 | €11,884 | 159 |
| Japanese yen | 10/9/2015 | JPMorgan Chase | $14,093 | ¥1,680,000 | 87 |
| Japanese yen | 10/9/2015 | JPMorgan Chase | $7,557 | ¥900,000 | 54 |
| Japanese yen | 10/9/2015 | Bank of America, N.A. | $28,338 | ¥3,395,000 | 35 |
| Japanese yen | 10/15/2015 | Citibank | $3,019 | ¥364,000 | (16) |
| Japanese yen | 10/16/2015 | UBS AG | $7,061 | ¥875,000 | (234) |
| Japanese yen | 10/21/2015 | HSBC Bank | $9,957 | ¥1,200,000 | (48) |
| Japanese yen | 10/23/2015 | UBS AG | $5,601 | ¥669,165 | 21 |
| Japanese yen | 10/23/2015 | JPMorgan Chase | $9,372 | ¥1,125,000 | (9) |
| Japanese yen | 11/10/2015 | Bank of America, N.A. | $49,613 | ¥5,940,000 | 73 |
| Japanese yen | 11/19/2015 | Bank of New York Mellon | $5,033 | ¥625,000 | (180) |
| Singapore dollars | 11/24/2015 | Barclays Bank PLC | $19,168 | S$26,880 | 315 |
| | | | | | $10,430 |
| 1 | Represents an affiliated company as defined under the Investment Company Act of 1940. |
| 2 | Valued under fair value procedures adopted by authority of the board of directors. The total value of all such securities, including those in “Miscellaneous,“ was $10,869,522,000, which represented 41.48% of the net assets of the fund. This amount includes $10,552,479,000 related to certain securities trading outside the U.S. whose values were adjusted as a result of significant market movements following the close of local trading. |
| 3 | Security did not produce income during the last 12 months. |
| 4 | Acquired in a transaction exempt from registration under Rule 144A or Section 4(2) of the Securities Act of 1933. May be resold in the U.S. in transactions exempt from registration, normally to qualified institutional buyers. The total value of all such securities was $1,112,791,000, which represented 4.25% of the net assets of the fund. |
| 5 | Acquired through a private placement transaction exempt from registration under the Securities Act of 1933. May be subject to legal or contractual restrictions on resale. Further details on these holdings appear below. |
| 6 | A portion of this security was pledged as collateral. The total value of pledged collateral was $252,000, which represented less than .01% of the net assets of the fund. |
| 7 | Payment in kind; the issuer has the option of paying additional securities in lieu of cash. |
| Private placement securities | Acquisition
date(s) | Cost
(000) | Value
(000) | Percent
of net
assets |
| Proteus Digital Health, Inc., Series G, convertible preferred | 5/6/2014-7/23/2014 | $40,000 | $40,000 | .15% |
| Twelve, Inc., Series C, convertible preferred | 4/16/2015 | 7,890 | 28,953 | .11 |
| Domo, Inc., Series D-2, convertible preferred | 3/31/2015 | 25,000 | 25,000 | .10 |
| Acerta Pharma BV, Series B, convertible preferred | 5/7/2015 | 25,000 | 24,786 | .09 |
| DocuSign, Inc., Series E, convertible preferred | 2/28/2014 | 16,236 | 19,904 | .08 |
| DocuSign, Inc., Series B, convertible preferred | 2/28/2014 | 875 | 1,072 | .00 |
| DocuSign, Inc., Series D, convertible preferred | 2/28/2014 | 628 | 770 | .00 |
| DocuSign, Inc., Series B1, convertible preferred | 2/28/2014 | 262 | 321 | .00 |
SMALLCAP World Fund — Page 15 of 16
| Private placement securities | Acquisition
date(s) | Cost
(000) | Value
(000) | Percent
of net
assets |
| Foursquare Labs, Inc., Series D, convertible preferred | 12/3/2013 | $20,000 | $20,000 | .08% |
| Foursquare Labs, Inc., warrants, expire 2033 | 12/3/2013 | — | 12,105 | .05 |
| Venture Global LNG, Inc., Class C | 5/1/2015 | 12,720 | 12,720 | .05 |
| Stemcentrx, Inc., Series F-1, convertible preferred | 6/10/2014 | 4,007 | 7,649 | .03 |
| Good Technology Corp. | 8/27/2012 | 20,000 | 5,273 | .02 |
| Total private placement securities | | $ 172,618 | $ 198,553 | .76 % |
| Key to abbreviations and symbols |
| Key to abbreviations and symbols |
| ADR = American Depositary Receipts |
| CDI = CREST Depository Interest |
| A$ = Australian dollars |
| CAD/C$ = Canadian dollars |
| € = Euros |
| GBP/£ = British pounds |
| ¥ = Japanese yen |
| S$ = Singapore dollars |
| SEK = Swedish kroner |
Investments are not FDIC-insured, nor are they deposits of or guaranteed by a bank or any other entity, so they may lose value.
Investors should carefully consider investment objectives, risks, charges and expenses. This and other important information is contained in the fund prospectus and summary prospectus, which can be obtained from your financial professional and should be read carefully before investing. You may also call American Funds Service Company (AFS) at (800) 421-4225 or visit the American Funds website at americanfunds.com.
| MFGEFPX-035-1115O-S49162 | SMALLCAP World Fund — Page 16 of 16 |
REPORT OF INDEPENDENT REGISTERED PUBLIC ACCOUNTING FIRM
To the Shareholders and Board of Directors of
SMALLCAP World Fund, Inc.:
We have audited the accompanying statement of assets and liabilities of SMALLCAP World Fund, Inc. (the “Fund”), including the summary schedule of investments, as of September 30, 2015, and the related statements of operations for the year then ended, the statements of changes in net assets for each of the two years in the period then ended (collectively, the “financial statements”), the financial highlights for each of the five years in the period then ended (the financial statements and financial highlights are included in Item 1 of this Form N-CSR), and the schedule of investments in securities as of September 30, 2015 (included in Item 6 of this Form N-CSR). These financial statements, financial highlights, and schedule of investments in securities are the responsibility of the Fund’s management. Our responsibility is to express an opinion on these financial statements, financial highlights, and schedule of investments in securities based on our audits.
We conducted our audits in accordance with the standards of the Public Company Accounting Oversight Board (United States). Those standards require that we plan and perform the audit to obtain reasonable assurance about whether the financial statements, financial highlights, and schedule of investments in securities are free of material misstatement. An audit includes examining, on a test basis, evidence supporting the amounts and disclosures in the financial statements and schedule of investments in securities, assessing the accounting principles used and significant estimates made by management, as well as evaluating the overall financial statement presentation. Our procedures included confirmation of securities owned as of September 30, 2015, by correspondence with the custodian and brokers; where replies were not received from brokers, we performed other auditing procedures. We believe that our audits provide a reasonable basis for our opinion.
In our opinion, the financial statements, financial highlights, and schedule of investments in securities referred to above present fairly, in all material respects, the financial position of SMALLCAP World Fund, Inc. as of September 30, 2015, and the results of its operations for the year then ended, the changes in its net assets for each of the two years in the period then ended, and the financial highlights for each of the five years in the period then ended, in conformity with accounting principles generally accepted in the United States of America.
DELOITTE & TOUCHE LLP
Costa Mesa, California
November 11, 2015
ITEM 7 – Disclosure of Proxy Voting Policies and Procedures for Closed-End Management Investment Companies
Not applicable to this Registrant, insofar as the Registrant is not a closed-end management investment company.
ITEM 8 – Portfolio Managers of Closed-End Management Investment Companies
Not applicable to this Registrant, insofar as the Registrant is not a closed-end management investment company.
ITEM 9 – Purchases of Equity Securities by Closed-End Management Investment Company and Affiliated Purchasers
Not applicable to this Registrant, insofar as the Registrant is not a closed-end management investment company.
ITEM 10 – Submission of Matters to a Vote of Security Holders
There have been no material changes to the procedures by which shareholders may recommend nominees to the Registrant’s board of directors since the Registrant last submitted a proxy statement to its shareholders. The procedures are as follows. The Registrant has a nominating and governance committee comprised solely of persons who are not considered ‘‘interested persons’’ of the Registrant within the meaning of the Investment Company Act of 1940, as amended. The committee periodically reviews such issues as the board’s composition, responsibilities, committees, compensation and other relevant issues, and recommends any appropriate changes to the full board of directors. While the committee normally is able to identify from its own resources an ample number of qualified candidates, it will consider shareholder suggestions of persons to be considered as nominees to fill future vacancies on the board. Such suggestions must be sent in writing to the nominating and governance committee of the Registrant, c/o the Registrant’s Secretary, and must be accompanied by complete biographical and occupational data on the prospective nominee, along with a written consent of the prospective nominee for consideration of his or her name by the nominating and governance committee.
ITEM 11 – Controls and Procedures
| (a) | The Registrant’s Principal Executive Officer and Principal Financial Officer have concluded, based on their evaluation of the Registrant’s disclosure controls and procedures (as such term is defined in Rule 30a-3 under the Investment Company Act of 1940), that such controls and procedures are adequate and reasonably designed to achieve the purposes described in paragraph (c) of such rule. |
| | |
| (b) | There were no changes in the Registrant’s internal controls over financial reporting (as defined in Rule 30a-3(d) under the Investment Company Act of 1940) that occurred during the Registrant’s second fiscal quarter of the period covered by this report that has materially affected, or is reasonably likely to materially affect, the Registrant’s internal control over financial reporting. |
ITEM 12 – Exhibits
| (a)(1) | The Code of Ethics that is the subject of the disclosure required by Item 2 is attached as an exhibit hereto. |
| | |
| (a)(2) | The certifications required by Rule 30a-2 of the Investment Company Act of 1940 and Sections 302 and 906 of the Sarbanes-Oxley Act of 2002 are attached as exhibits hereto. |
SIGNATURES
Pursuant to the requirements of the Securities Exchange Act of 1934 and the Investment Company Act of 1940, the Registrant has duly caused this report to be signed on its behalf by the undersigned, thereunto duly authorized.
| | SMALLCAP WORLD FUND, INC. |
| | |
| | By /s/ Paul F. Roye |
| | Paul F. Roye, Executive Vice President and Principal Executive Officer |
| | |
| | Date: November 30, 2015 |
Pursuant to the requirements of the Securities Exchange Act of 1934 and the Investment Company Act of 1940, this report has been signed below by the following persons on behalf of the Registrant and in the capacities and on the dates indicated.
| By /s/ Paul F. Roye |
Paul F. Roye, Executive Vice President and Principal Executive Officer |
| |
| Date: November 30, 2015 |
| By /s/ Jeffrey P. Regal |
Jeffrey P. Regal, Treasurer and Principal Financial Officer |
| |
| Date: November 30, 2015 |