UNITED STATES
SECURITIES AND EXCHANGE COMMISSION
Washington, D.C. 20549
FORM N-CSR
Certified Shareholder Report of
Registered Management Investment Companies
Investment Company Act File Number: 811-05888
SMALLCAP World Fund, Inc.
(Exact Name of Registrant as Specified in Charter)
6455 Irvine Center Drive
Irvine, California 92618
(Address of Principal Executive Offices)
Registrant's telephone number, including area code: (213) 486-9200
Date of fiscal year end: September 30
Date of reporting period: September 30, 2016
Michael W. Stockton
SMALLCAP World Fund, Inc.
333 South Hope Street
Los Angeles, California 90071
(Name and Address of Agent for Service)
ITEM 1 – Reports to Stockholders

Staying the course in
a volatile world
Special feature page 4
 | SMALLCAP World Fund® Annual report
for the year ended
September 30, 2016 |
SMALLCAP World Fund seeks to provide you with long-term growth of capital.
This fund is one of more than 40 offered by one of the nation’s largest mutual fund families, American Funds, from Capital Group. For 85 years, Capital has invested with a long-term focus based on thorough research and attention to risk.
Fund results shown in this report, unless otherwise indicated, are for Class A shares at net asset value. If a sales charge (maximum 5.75%) had been deducted, the results would have been lower. Results are for past periods and are not predictive of results for future periods. Current and future results may be lower or higher than those shown. Share prices and returns will vary, so investors may lose money. Investing for short periods makes losses more likely. Investments are not FDIC-insured, nor are they deposits of or guaranteed by a bank or any other entity, so they may lose value. For current information and month-end results, visit americanfunds.com.
See page 3 for Class A share results with relevant sales charges deducted. For other share class results, visit americanfunds.com and americanfundsretirement.com.
Investment results assume all distributions are reinvested and reflect applicable fees and expenses. When applicable, investment results reflect fee waivers, without which results would have been lower. Visit americanfunds.com for more information.
Investing outside the United States may be subject to risks, such as currency fluctuations and political instability. These risks may be heightened in connection with investments in developing countries. Investing in small-capitalization stocks can involve greater risk than is customarily associated with investing in stocks of larger, more established companies. Refer to the fund prospectus and the Risk Factors section of this report for more information on these and other risks associated with investing in the fund.

Special feature
Fellow investors:
In a market environment beset by geopolitical and economic issues, SMALLCAP World Fund produced a double-digit return for the 12-month period ended September 30, 2016. Investing with an eye toward the long term, the fund managers’ efforts resulted in a total return of 11.72%.
By way of comparison, the MSCI All Country World Small Cap Index, an unmanaged index of global small-cap equities that does not include fees or expenses, returned 14.21% for the same period, while the Lipper Global Small-/Mid-Cap Funds Average, a measure of the fund’s peer group, returned 13.54%.
The fund paid a one-time capital gain payment of $2.83 a share during the fiscal year.
The fund’s return came at a difficult time for the global small-cap marketplace, and while it lagged its benchmark for this period, the fund’s managers sought to reduce volatility and make prudent investments not just for these 12 months, but for years to come. This long-term approach has resulted in returns that have surpassed our benchmarks over longer periods.
The year in review
The fund’s fiscal year was particularly challenging, with the market facing a number of geopolitical uncertainties. The vote in the United Kingdom for that country to leave the European Union immediately introduced numerous concerns across Europe regarding the strength of the euro and London’s position as a financial capital. Likewise, the U.S. presidential campaigns also created instability in domestic markets.
Terrorism also prompted a great deal of distress both in the U.S. and Europe, with a string of attacks prompting greater calls for strengthened borders and curbs on immigration. The refugee crisis in Europe continues unabated, thanks to a civil war in Syria that may threaten to involve Russia and the United States to greater degrees in the future.
While these problems do not have direct bearing on equities, they prompt a great deal of uncertainty among investors — and in times of uncertainty, some investors choose to sell. Our view of investing in volatile markets is much more nuanced; our special feature on page 4 highlights our investment process in challenging times.
Results at a glance
For periods ended September 30, 2016, with all distributions reinvested
| | | Cumulative
total returns | | Average annual
total returns |
| | | 1 year | | 5 years | | 10 years | | Lifetime
(since 4/30/90) |
| | | | | | | | | |
| SMALLCAP World Fund (Class A shares) | | | 11.72 | % | | | 13.54 | % | | | 6.83 | % | | | 9.50 | % |
| MSCI All Country World Small Cap Index* | | | 14.21 | | | | 12.47 | | | | 6.59 | | | | n/a | |
| Lipper Global Small-/Mid-Cap Funds Average† | | | 13.54 | | | | 11.85 | | | | 5.66 | | | | 9.00 | |
| * | Source: MSCI. The market index is unmanaged and, therefore, has no expenses. Investors cannot invest directly in an index. The market index is a free float-adjusted market capitalization weighted index that is designed to measure equity market results of smaller capitalization companies in both developed and emerging markets. Results reflect dividends net of withholding taxes. This index was not in existence when the fund’s Class A shares were first sold; therefore, lifetime results are not available. |
| † | Lipper averages reflect the current composition of all eligible mutual funds (all share classes) within a given category. |
That said, there were bright spots to be found in the global economy, with low unemployment in the United States and Britain, an increase in household incomes, and strong earnings from a variety of businesses around the world.
How the fund responded
The fund’s investment professionals, while taking the year’s challenges into account, continued to engage in the kind of bottom-up global research that has been a hallmark of the fund for more than 25 years.
Information technology shares were of particular benefit to the fund over the past 12 months, with Top-10 holding DeNA (up 94.2%) and AAC Technologies Holdings (up 61.9%) adding to returns. Consumer stocks such as Domino’s Pizza (up 40.7%) and Raia Drogasil (up 106.6%) also aided the fund.
Health care stocks — biotechnology in particular — detracted from returns this year, with Myriad Genetics (down 45.1%) and Endo International (down 70.9%) among them. Film company Lions Gate Entertainment (down 45.7%) also hurt the fund’s returns for the period.
The fund’s holdings in U.S.-based companies declined slightly from a year ago, though U.S. companies generally had positive absolute returns during the period. The fund’s European exposure rose slightly, with U.K. stocks generally faring poorly compared to other markets. While the amount the fund invested in Asia and Latin America declined during the past year, these holdings generally helped the fund’s return; shares of Japanese, Brazilian and Korean companies were particularly noteworthy.
The fund had 7.5% of its assets in cash and cash-like securities at the end of the period, reflecting a more conservative stance in the face of increased volatility. A higher cash position helps cushion volatility — and also makes it easier for the fund’s investment professionals to take advantage of buying opportunities when they arise.
The road ahead
Over the past year, the fund’s investment professionals focused not only on providing solid returns for our shareholders, but also on protecting the portfolio from potential downside risks. We are gratified by the fund’s gains over the past several years, and we hope to preserve them going forward.
We are hopeful that the end of election season in the United States will bring about greater certainty and stability around the world and in the global equity markets. Overseas, the war in Syria, the European refugee crisis and the U.K.’s exit from the European Union remain in flux, and may weigh on markets there and around the world. New political leadership both in Europe and the United States may help ease some of these concerns.
We remain encouraged by the strength of corporate earnings, and we are seeing opportunities for new, small-capitalization companies to come to market with initial public offerings, which we will study carefully for potential investment.
And as always, we continue to comb the world for new, innovative small companies that have the potential to become tomorrow’s leaders in any number of industries and nations. We thank you for your continued support of SMALLCAP World Fund, and we look forward to reporting to you again in six months.
Sincerely,

Jonathan Knowles
Vice Chairman of the Board

Gregory W. Wendt
President
November 11, 2016
For current information about the fund, visit americanfunds.com.
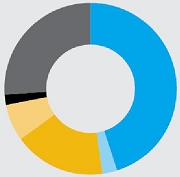
Where the fund’s assets are invested (by country of domicile)
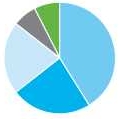
| | As of September 30, 2016 | | Percent of
net assets |
| n | United States | | | 41.2 | % |
| n | Asia & Pacific Basin | | | 23.4 | |
| n | Europe | | | 21.0 | |
| n | Other (including Canada & Latin America) | | | 6.9 | |
| n | Short-term securities & other assets less liabilities | | | 7.5 | |
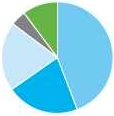
| | As of September 30, 2015 | | Percent of
net assets |
| n | United States | | | 44.2 | % |
| n | Asia & Pacific Basin | | | 21.2 | |
| n | Europe | | | 20.1 | |
| n | Other (including Canada & Latin America) | | | 4.3 | |
| n | Short-term securities & other assets less liabilities | | | 10.2 | |
| Largest equity holdings | | | | |
| | | | | |
| | | Percent of
net assets |
| Domino’s Pizza | | | 1.4 | % |
| Incyte | | | 1.1 | |
| DeNA | | | 1.0 | |
| Molina Healthcare | | | .9 | |
| GW Pharmaceuticals | | | .9 | |
| Kotak Mahindra Bank | | | .8 | |
| Qorvo | | | .7 | |
| China Biologic | | | .7 | |
| GVC | | | .6 | |
| Emmi | | | .6 | |
The value of a long-term perspective
This chart shows how a $10,000 investment in SMALLCAP World Fund’s Class A shares grew from April 30, 1990 — the fund’s inception — through September 30, 2016, the end of the fund’s latest fiscal year. As you can see, the $10,000 would have grown to $103,536 even after deducting the maximum 5.75% sales charge.
Fund results shown reflect deduction of the maximum sales charge of 5.75% on the $10,000 investment.1 Thus, the net amount invested was $9,425.
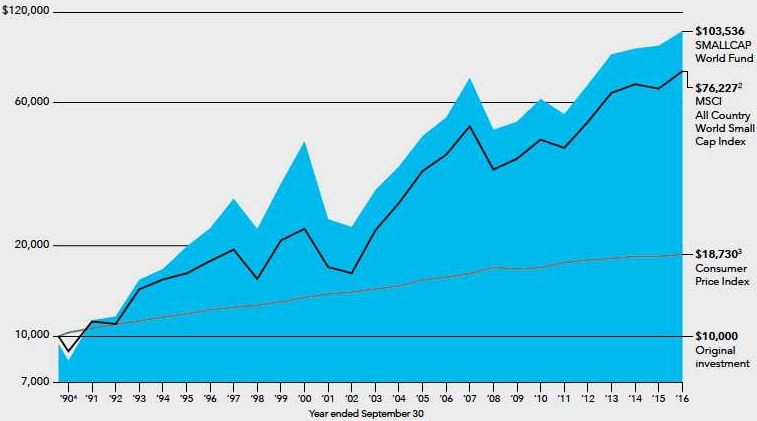
| 1 | As outlined in the prospectus, the sales charge is reduced for accounts (and aggregated investments) of $25,000 or more and is eliminated for purchases of $1 million or more. There is no sales charge on dividends or capital gain distributions that are reinvested in additional shares. |
| 2 | The MSCI All Country World Small Cap Index is unmanaged and, therefore, has no expenses. Investors cannot invest directly in an index. Results reflect dividends net of withholding taxes. Source: MSCI. Because the index was not in existence when the fund’s Class A shares were first sold, cumulative returns through May 31, 1994, reflect the returns of the S&P Developed <$1.2 Billion Index. Source: S&P Dow Jones Indices LLC. |
| 3 | Computed from data supplied by the U.S. Department of Labor, Bureau of Labor Statistics. |
| 4 | For the period April 30, 1990, commencement of operations, through September 30, 1990. |
Past results are not predictive of results for future periods. The results shown are before taxes on fund distributions and sale of fund shares.
Average annual total returns based on a $1,000 investment (for periods ended September 30, 2016)*
| | | 1 year | | 5 years | | 10 years |
| | | | | | | |
| Class A shares | | 5.29% | | 12.20% | | 6.20% |
| * | Assumes reinvestment of all distributions and payment of the maximum 5.75% sales charge. |
| | |
| | The total annual fund operating expense ratio is 1.10% for Class A shares as of the prospectus dated December 1, 2016 (unaudited). |
| | |
| | Investment results assume all distributions are reinvested and reflect applicable fees and expenses. When applicable, investment results reflect fee waivers, without which results would have been lower. Visit americanfunds.com for more information. |

“The past 15 years or so have seen so much change around the world, it can seem a little daunting. But yet there’s so much good happening in the world as well. So the first thing to remember is change is a constant, and it’s not always for the worse.”
— Jonathan Knowles

Finding opportunity in volatile times
In a changing world, uncertainty can lead to short-term market fluctuations and volatility. The investment professionals of SMALLCAP World Fund nonetheless continue to seek out new opportunities around the globe, with an eye toward the long term.
For individual investors, reading the headlines every day can be a source of worry. Over the past year, we’ve seen refugee crises in Europe, concerns about Chinese economic stability, the United Kingdom voting to leave the European Union, and historically low interest rates that have some economists worried.
All these things are important, and can have an impact on your portfolio — just as they can have an impact on SMALLCAP World Fund. But while these global events require research and monitoring, they don’t stop the fund’s investment professionals in their search for potential small-company investments around the world.
“There are always going to be surprises out there. There’s always going to be volatility,” says portfolio manager Greg Wendt. “But if anything, these are the times when it’s important to stay the course and stick to the long-term approach we’ve always had.”
And indeed, the fund’s portfolio managers and investment analysts continue to evaluate companies across the globe. When markets are uncertain, the need for companies with strong balance sheets, effective management teams, and the potential to break through with new products and services is as important as ever.
The more things change
“If you really think about it, the past 15 years or so have seen so much change around the world, it can seem a little daunting,” says portfolio manager Jonathan Knowles. “We’ve had 9/11 and terrorism. We’ve had financial crises, wars in the Middle East, geopolitical and economic changes like we’ve never had, all happening at what seems to be a very rapid pace.
“But yet there’s so much good happening in the world as well,” Jonathan adds. “Think about the revolution we’ve had in technology, and how that technology has improved the lives of so many people and made our governments more accountable. Even more recently, we have unemployment in the U.S. and the U.K. around 5%, and household incomes are climbing. So the first thing to remember is change is a constant, and it’s not always for the worse.”
It’s those positive changes — breakthroughs in health care and technology, new and innovative services, the development of cheaper forms of energy — that attract many of the fund’s investment professionals, such as:
| • | Domino’s Pizza, which leveraged technology early on to speed ordering and delivering while managing inventory; |
| • | Kotak Mahindra Bank, which brought modern banking systems to underserved areas of India and has grown its market share at the expense of government-run banks; |
| | |
| • | AAC Technologies Holdings, a manufacturer that supplies small but critical components to the world’s most popular smartphones. |
These and other companies represented in the fund portfolio have proven to be innovators in both large and small ways, creating value for shareholders amidst change.
The more they stay the same
Some of the companies represented in the portfolio aren’t known for innovation, but run their businesses very well. Jumbo, a Greek discount retailer, is simply very well managed, Jonathan says, and has grown geographically into Bulgaria and Romania. Emmi, a Swiss dairy, successfully diversified its product offerings to include high-end coffee beverages to help counter the high cost of Swiss milk. Hoshizaki, a Japanese company, is becoming one of the world’s leading providers of ice machines.

“Some of the companies I view favorably are businesses with big moats,” says portfolio manager Lawrence Kymisis. “By moats, I mean that these companies are somewhat insulated from volatility due to their fundamental strength. They’re in sectors where it’s tough for competitors to gain a foothold. They have pricing power. They have strong cash positions and little debt. And they’re aware of risks. They have a view of all possible outcomes and what they can do to make the most of them.”
That high-level view is the hallmark of a strong management team — a critical piece of the puzzle for many of the fund’s investment professionals.
“I think the best source of resiliency is really good management,” says portfolio manager Claudia Huntington. “Who’s running the show is so critically important, because good management teams position companies well to take advantage of downturns and be cautious on upturns.”
That management know-how can help companies weather difficult times and prepare for the future. Jacinto Hernandez, an investment analyst covering the oil services sector, continues to study how companies have managed through this year’s decline in oil prices. Those declines are hurting the bottom line now, but as a long-term investor, he’s looking for the seeds of recovery.
“We put in a lot of time getting to know the companies — conducting research and meeting with management,” says Jacinto, a 15-year veteran analyst. “We know the managers. And when you combine the analysis of the sector with the potential for management to capitalize on opportunities, you end up with a list of strong potential investments. All you do then is wait until the time is right.”
“Daily volatility is quite eye-opening sometimes, but we have a certain luxury in our approach, because we focus on the long-term.”
— Lawrence Kymisis
“I think the best source of resiliency is really good management. Who’s running the show is so critically important, because good management teams position companies well to take advantage of downturns and be cautious on upturns.”
— Claudia Huntington
Taking advantage of volatility
While the fund embraces a long-term approach to investing, short-term market volatility can make a difference in actually purchasing a company’s stock.
“The price you pay for a stock makes a difference in your return over the long term,” Jacinto says. “I have a lot of quality companies I’m interested in, but if I feel they’re too expensive, I’ll wait. Then you hit a patch of volatility, the price goes down, and now you can have an attractive long-term investment.”
On the other hand, it takes fortitude to stay with a company during a downturn — but that’s the hallmark of long-term investing. If the company’s fundamentals and management remain sound, then the fund’s investment professionals can stay with the stock and wait out the volatility.
“Daily volatility is quite eye-opening sometimes, but we have a certain luxury in our approach, because we focus on the long-term,” Lawrence says. “When the Brexit vote happened and the markets in the U.K. fell, some companies took justified hits, and some took hits that weren’t justified. When the long-term fundamentals remain sound, you stay with it — or even add to your holding if the prices are right.”

“Everything you see in the newspaper, everything that’s going on in the world, we take that into account. But ultimately, it’s about finding what we can invest in for the long term.”
— Greg Wendt
Focused on the long-term
The difficulty in investing in a volatile market is trying to figure out whether the market is simply going through a rough patch, or if there are signs of longer term difficulties ahead. That’s where research and experience come into play.
“Most of us have been through a number of market cycles, and there’s always uncertainty out there,” Claudia says. “Our challenge is to gather all the facts we can, seek out informed opinions, and then make a judgment on what kind of portfolio you’re going to build. Sometimes, that short-term volatility is just that — short term. But you have to be open-minded about what you’re seeing and make adjustments when that’s what the facts are calling for.”
Many of the fund’s investment professionals view their holdings through three different lenses: macroeconomic, overall industries, and individual companies. Their investment theses — their philosophies and views of the marketplace — are informed by each of these.
The fund’s bottom-up research identifies potential investments in individual companies. Sector analysts place those companies in context and evaluate the health and outlook for the overall industry. And the fund’s economic experts provide insights and analysis related to market movements, economic reports and global issues.
“I think in today’s market, you have to be relatively open-minded when it comes to some of your longer term assumptions and perhaps question them more frequently than you have in the past,” Lawrence says. “Today, you need to be flexible and adaptable, and I think we’re up to the challenge.”
Staying the course
As you can see here, investing is both art and science — gathering as much information as possible to make an informed judgment on an individual company, or an industry, or even the entire global marketplace. The fund’s long-term approach allows portfolio managers and analysts to do this work without worrying about the short-term changes in the market.
Indeed, it’s worth noting that the compensation paid to our investment professionals is heavily influenced by results over one-, three-, five- and eight-year periods, with increasing weight placed on each succeeding period to encourage a long-term investment approach.
That’s because we feel the long-term approach works best — for the fund’s results, and for our shareholders’ individual investments as well.
“Everything you see in the newspaper, everything that’s going on in the world, we take that into account,” Greg says. “But ultimately, it’s about finding what we can invest in for the long term.” n


The New Geography of Investing®
Where a company does business can be more important than where it’s located. Here’s a look at SMALLCAP World Fund’s portfolio in terms of where its equity holdings earn their revenue. The charts below show the countries and regions in which the fund’s equity investments are located, and where the revenue comes from.
Equity portion breakdown by domicile (%)
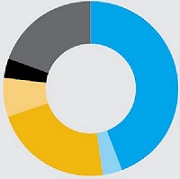
| | Region | | Fund | | | Index | |
| n | United States | | 44 | % | | 51 | % |
| n | Canada | | | 4 | | | | 4 | |
| n | Europe | | | 22 | | | | 19 | |
| n | Japan | | | 7 | | | | 11 | |
| n | Asia-Pacific ex. Japan | | | 4 | | | | 4 | |
| n | Emerging markets | | | 19 | | | | 11 | |
| | Total | | | 100 | % | | | 100 | % |
Equity portion breakdown by revenue (%)
| | Region | | Fund | | | Index | |
| n | United States | | | 45 | % | | | 45 | % |
| n | Canada | | | 3 | | | | 3 | |
| n | Europe | | | 17 | | | | 17 | |
| n | Japan | | | 7 | | | | 10 | |
| n | Asia-Pacific ex. Japan | | | 2 | | | | 4 | |
| n | Emerging markets | | | 26 | | | | 21 | |
| | Total | | | 100 | % | | | 100 | % |
Compared with the MSCI ACWI Small Cap Index as a percent of net assets. Source: MSCI.
All figures include convertible securities.
SMALLCAP World Fund source: Capital Group (as of September 30, 2016).
Summary investment portfolio September 30, 2016
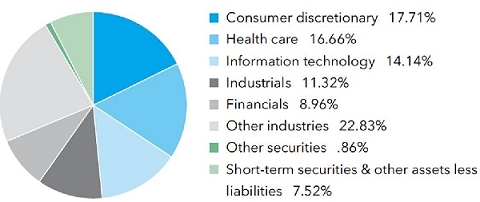
Industry sector diversification | Percent of net assets |
| Country diversification by domicile | | Percent of
net assets |
| United States | | | 41.22 | % |
| United Kingdom | | | 8.10 | |
| Euro zone* | | | 7.59 | |
| Japan | | | 6.65 | |
| India | | | 4.68 | |
| Canada | | | 3.31 | |
| China | | | 3.12 | |
| Taiwan | | | 2.30 | |
| Sweden | | | 2.12 | |
| Other countries | | | 13.39 | |
| Short-term securities & other assets less liabilities | | | 7.52 | |
| * | Countries using the euro as a common currency; those represented in the fund’s portfolio are Austria, Belgium, Finland, France, Germany, Greece, Ireland, Italy, the Netherlands, Portugal, Slovenia and Spain. |
| Common stocks 91.62% | | Shares | | | Value
(000) | |
| Consumer discretionary 17.71% | | | | | | | | |
| Domino’s Pizza, Inc.1 | | | 2,828,769 | | | $ | 429,549 | |
| GVC Holdings PLC1,2 | | | 19,280,894 | | | | 185,433 | |
| Dollarama Inc. | | | 2,005,000 | | | | 156,540 | |
| Lions Gate Entertainment Corp.1 | | | 7,751,786 | | | | 154,958 | |
| Seria Co., Ltd.2 | | | 1,425,324 | | | | 115,492 | |
| YOOX Net-A-Porter Group SPA2,3 | | | 3,627,000 | | | | 112,384 | |
| AA PLC2 | | | 28,448,238 | | | | 109,034 | |
| Ted Baker PLC1,2 | | | 3,340,342 | | | | 106,681 | |
| Matahari Department Store Tbk PT2 | | | 73,537,800 | | | | 104,390 | |
| Ladbrokes PLC1,2 | | | 55,522,600 | | | | 100,752 | |
| POYA International Co., Ltd.1,2 | | | 6,735,908 | | | | 100,313 | |
| Other securities | | | | | | | 3,612,664 | |
| | | | | | | | 5,288,190 | |
| | | | | | | | | |
| Health care 16.66% | | | | | | | | |
| Incyte Corp.3 | | | 3,497,991 | | | | 329,826 | |
| Molina Healthcare, Inc.1,3 | | | 4,526,000 | | | | 263,956 | |
| GW Pharmaceuticals PLC (ADR)1,3 | | | 1,976,400 | | | | 262,328 | |
| China Biologic Products, Inc.1,3 | | | 1,682,523 | | | | 209,440 | |
| Insulet Corp.1,3 | | | 3,921,000 | | | | 160,526 | |
| NuVasive, Inc.3 | | | 2,199,400 | | | | 146,612 | |
| Zeltiq Aesthetics, Inc.1,3 | | | 3,122,044 | | | | 122,447 | |
| Sysmex Corp.2 | | | 1,643,000 | | | | 121,724 | |
| Centene Corp.3 | | | 1,709,439 | | | | 114,464 | |
| bluebird bio, Inc.3 | | | 1,619,352 | | | | 109,760 | |
| athenahealth, Inc.3 | | | 866,310 | | | | 109,259 | |
| Hikma Pharmaceuticals PLC2 | | | 4,155,953 | | | | 108,771 | |
| Other securities | | | | | | | 2,915,421 | |
| | | | | | | | 4,974,534 | |
| | | | | | | | | |
| Information technology 14.14% | | | | | | | | |
| DeNA Co., Ltd.1,2 | | | 8,201,010 | | | | 297,406 | |
| Qorvo, Inc.3 | | | 3,884,370 | | | | 216,515 | |
| AAC Technologies Holdings Inc.2 | | | 17,790,500 | | | | 180,151 | |
| Finisar Corp.1,3 | | | 5,729,000 | | | | 170,724 | |
| Zynga Inc., Class A3 | | | 54,170,000 | | | | 157,635 | |
| Vanguard International Semiconductor Corp.1,2 | | | 83,546,386 | | | | 157,334 | |
| Globant SA1,3 | | | 2,717,510 | | | | 114,461 | |
| Kakaku.com, Inc.2 | | | 5,997,300 | | | | 108,289 | |
| Inphi Corp.1,3 | | | 2,459,199 | | | | 107,000 | |
| Other securities | | | | | | | 2,712,572 | |
| | | | | | | | 4,222,087 | |
| | | Shares | | | Value
(000) | |
| Industrials 11.32% | | | | | | | | |
| Hoshizaki Electric Co., Ltd.2 | | | 1,895,100 | | | $ | 173,095 | |
| ITT Corp. | | | 3,580,000 | | | | 128,307 | |
| Loomis AB, Class B2 | | | 4,019,042 | | | | 124,086 | |
| Oshkosh Corp. | | | 2,105,000 | | | | 117,880 | |
| Kirby Corp.3 | | | 1,747,000 | | | | 108,594 | |
| NIBE Industrier AB, Class B2 | | | 11,580,000 | | | | 102,997 | |
| Havells India Ltd.2 | | | 16,048,000 | | | | 101,115 | |
| Other securities | | | | | | | 2,523,798 | |
| | | | | | | | 3,379,872 | |
| | | | | | | | | |
| Financials 8.96% | | | | | | | | |
| Kotak Mahindra Bank Ltd.2 | | | 20,057,040 | | | | 234,722 | |
| Validus Holdings, Ltd. | | | 3,033,000 | | | | 151,104 | |
| Essent Group Ltd.3 | | | 4,177,925 | | | | 111,175 | |
| MarketAxess Holdings Inc. | | | 660,000 | | | | 109,289 | |
| Umpqua Holdings Corp. | | | 7,004,541 | | | | 105,418 | |
| GT Capital Holdings, Inc.2 | | | 3,485,200 | | | | 103,359 | |
| VZ Holding AG2 | | | 363,400 | | | | 101,759 | |
| Other securities | | | | | | | 1,757,827 | |
| | | | | | | | 2,674,653 | |
| | | | | | | | | |
| Consumer staples 6.06% | | | | | | | | |
| Emmi AG1,2 | | | 270,100 | | | | 184,747 | |
| Raia Drogasil SA, ordinary nominative | | | 7,917,574 | | | | 161,363 | |
| Lion Corp.2 | | | 7,637,000 | | | | 123,531 | |
| Sprouts Farmers Market, Inc.3 | | | 5,862,600 | | | | 121,063 | |
| Pinnacle Foods Inc. | | | 2,389,050 | | | | 119,859 | |
| COSMOS Pharmaceutical Corp.2 | | | 515,200 | | | | 110,525 | |
| Other securities | | | | | | | 990,143 | |
| | | | | | | | 1,811,231 | |
| | | | | | | | | |
| Energy 4.66% | | | | | | | | |
| U.S. Silica Holdings, Inc. | | | 2,942,071 | | | | 136,983 | |
| InterOil Corp.3 | | | 2,344,500 | | | | 119,382 | |
| Seven Generations Energy Ltd., Class A3 | | | 4,675,000 | | | | 112,532 | |
| Other securities | | | | | | | 1,023,354 | |
| | | | | | | | 1,392,251 | |
| | | | | | | | | |
| Materials 4.51% | | | | | | | | |
| James Hardie Industries PLC (CDI)2 | | | 6,855,000 | | | | 107,525 | |
| Other securities | | | | | | | 1,240,815 | |
| | | | | | | | 1,348,340 | |
| | | | | | | | | |
| Other 2.77% | | | | | | | | |
| Other securities | | | | | | | 828,628 | |
| | | | | | | | | |
| Miscellaneous 4.83% | | | | | | | | |
| Other common stocks in initial period of acquisition | | | | | | | 1,443,425 | |
| | | | | | | | | |
| Total common stocks (cost: $19,866,355,000) | | | | | | | 27,363,211 | |
| | | | | | | | | |
| Preferred securities 0.00% | | | | | | | | |
| Consumer staples 0.00% | | | | | | | | |
| Other securities | | | | | | | 117 | |
| | | | | | | | | |
| Total preferred securities (cost: $185,000) | | | | | | | 117 | |
| | | | | | | | | |
| Rights & warrants 0.02% | | | | | | | | |
| Other 0.02% | | | | | | | | |
| Other securities | | | | | | | 4,018 | |
| | | | | | | | | |
| Total rights & warrants (cost: $926,000) | | | | | | | 4,018 | |
| Convertible stocks 0.33% | | Shares | | | Value
(000) | |
| Other 0.33% | | | | | | | | |
| Other securities | | | | | | $ | 99,653 | |
| | | | | | | | | |
| Total convertible stocks (cost: $108,394,000) | | | | | | | 99,653 | |
| | | | | | | | | |
| Bonds, notes & other debt instruments 0.51% | | Principal amount
(000) | | | | | |
| Other 0.51% | | | | | | | | |
| Other securities | | | | | | | 152,038 | |
| | | | | | | | | |
| Total bonds, notes & other debt instruments (cost: $133,136,000) | | | | | | | 152,038 | |
| | | | | | | | | |
| Short-term securities 7.51% | | | | | | | | |
| Bank of Nova Scotia 0.92% due 10/14/20164 | | | 14,500 | | | | 14,498 | |
| BNP Paribas, New York Branch 0.27% due 10/3/2016 | | | 100,700 | | | | 100,698 | |
| Federal Home Loan Bank 0.26%–0.50% due 10/21/2016–1/25/2017 | | $ | 515,590 | | | | 515,325 | |
| Gotham Funding Corp. 0.49%–0.76% due 10/4/2016–11/18/20164 | | | 51,700 | | | | 51,680 | |
| Liberty Street Funding Corp. 0.71%–0.92% due 10/14/2016–12/13/20164 | | | 86,000 | | | | 85,929 | |
| Mitsubishi UFJ Trust and Banking Corp. 0.67% due 11/7/20164 | | | 83,500 | | | | 83,451 | |
| Mizuho Bank, Ltd. 0.69%–1.20% due 10/12/2016–2/24/20174 | | | 143,600 | | | | 143,385 | |
| Sumitomo Mitsui Banking Corp. 0.60%–0.90% due 11/15/2016–12/6/20164 | | | 190,600 | | | | 190,405 | |
| U.S. Treasury Bills 0.30%–0.41% due 11/25/2016–2/9/2017 | | | 175,000 | | | | 174,851 | |
| Victory Receivables Corp. 0.78%–1.02% due 11/14/2016–12/15/20164 | | | 59,000 | | | | 58,938 | |
| Other securities | | | | | | | 824,852 | |
| | | | | | | | | |
| Total short-term securities (cost: $2,243,615,000) | | | | | | | 2,244,012 | |
| Total investment securities 99.99% (cost: $22,352,611,000) | | | | | | | 29,863,049 | |
| Other assets less liabilities 0.01% | | | | | | | 2,791 | |
| | | | | | | | | |
| Net assets 100.00% | | | | | | $ | 29,865,840 | |
This summary investment portfolio is designed to streamline the report and help investors better focus on the fund’s principal holdings. See the inside back cover for details on how to obtain a complete schedule of portfolio holdings.
As permitted by U.S. Securities and Exchange Commission regulations, “Miscellaneous” securities including holdings in their first year of acquisition that have not previously been publicly disclosed.
“Other securities” includes all issues that are not disclosed separately in the summary investment portfolio. Some securities in “Other securities” (with aggregate value of $127,085,000, an aggregate cost of $126,971,000, and which represented .43% of the net assets of the fund) were acquired from 12/3/2013 to 5/7/2015 through private placement transactions exempt from registration under the Securities Act of 1933, which may subject them to legal or contractual restrictions on resale. “Other securities” also includes securities which were pledged as collateral. The total value of pledged collateral was $312,000, which represented less than .01% of the net assets of the fund.
Forward currency contracts
The fund has entered into forward currency contracts as shown in the following table. The average month-end notional amount of open forward currency contracts while held was $533,574,000.
| | | | | | | | | | | Unrealized | |
| | | | | | | | | | | (depreciation) | |
| | | | | | | Contract amount | | appreciation | |
| | | | | | | Receive | | Deliver | | at 9/30/2016 | |
| | | Settlement date | | Counterparty | | (000) | | (000) | | (000) | |
| Sales: | | | | | | | | | | | | |
| Australian dollars | | 10/26/2016 | | HSBC Bank | | $40,607 | | A$53,150 | | | $ (47 | ) |
| British pounds | | 10/13/2016 | | Citibank | | $45,229 | | £34,459 | | | 552 | |
| British pounds | | 10/17/2016 | | Barclays Bank PLC | | $13,737 | | £10,590 | | | 6 | |
| British pounds | | 10/19/2016 | | Bank of America, N.A. | | $31,789 | | £24,400 | | | 150 | |
| British pounds | | 10/20/2016 | | Citibank | | $56,101 | | £42,055 | | | 1,568 | |
| British pounds | | 10/26/2016 | | JPMorgan Chase | | $41,901 | | £32,000 | | | 401 | |
| British pounds | | 11/3/2016 | | UBS AG | | $50,157 | | £38,626 | | | 57 | |
| British pounds | | 11/7/2016 | | HSBC Bank | | $9,085 | | £7,000 | | | 5 | |
| Canadian dollars | | 10/7/2016 | | UBS AG | | $26,198 | | C$34,000 | | | 281 | |
| Euros | | 10/20/2016 | | HSBC Bank | | $12,381 | | €11,023 | | | (13 | ) |
| Euros | | 10/20/2016 | | Barclays Bank PLC | | $24,447 | | €21,762 | | | (23 | ) |
| Euros | | 10/26/2016 | | Citibank | | $94,973 | | €84,399 | | | 45 | |
| Euros | | 10/28/2016 | | JPMorgan Chase | | $39,897 | | €35,481 | | | (15 | ) |
| Japanese yen | | 10/19/2016 | | HSBC Bank | | $11,826 | | ¥1,200,000 | | | (17 | ) |
| Japanese yen | | 10/20/2016 | | Bank of America, N.A. | | $7,719 | | ¥791,840 | | | (96 | ) |
| Japanese yen | | 10/28/2016 | | UBS AG | | $6,685 | | ¥669,165 | | | 79 | |
| Japanese yen | | 11/17/2016 | | JPMorgan Chase | | $8,328 | | ¥845,410 | | | (26 | ) |
| | | | | | | | | | | | $2,907 | |
Investments in affiliates
A company is an affiliate of the fund under the Investment Company Act of 1940 if the fund’s holdings in that company represent 5% or more of the outstanding voting shares. The value of the fund’s affiliated-company holdings is either shown in the summary investment portfolio or included in the value of “Other securities” under the respective industry sectors. Further details on such holdings and related transactions during the year ended September 30, 2016, appear below.
| | | | | | | | | | | | | | | | | | Value of | |
| | | | | | | | | | | | | | | Dividend | | | affiliates at | |
| | | Beginning | | | | | | | | | Ending | | | income | | | 9/30/2016 | |
| | | shares | | | Additions | | | Reductions | | | shares | | | (000) | | | (000) | |
| Domino’s Pizza, Inc. | | | 3,125,769 | | | | — | | | | 297,000 | | | | 2,828,769 | | | $ | 4,307 | | | $ | 429,549 | |
| DeNA Co., Ltd.2 | | | 4,061,000 | | | | 4,140,010 | | | | — | | | | 8,201,010 | | | | 1,037 | | | | 297,406 | |
| Molina Healthcare, Inc.3 | | | 3,898,100 | | | | 627,900 | | | | — | | | | 4,526,000 | | | | — | | | | 263,956 | |
| GW Pharmaceuticals PLC (ADR)3 | | | 1,652,700 | | | | 323,700 | | | | — | | | | 1,976,400 | | | | — | | | | 262,328 | |
| China Biologic Products, Inc.3 | | | 283,500 | | | | 1,568,023 | | | | 169,000 | | | | 1,682,523 | | | | — | | | | 209,440 | |
| GVC Holdings PLC2 | | | 1,663,694 | | | | 17,617,200 | | | | — | | | | 19,280,894 | | | | 267 | | | | 185,433 | |
| Emmi AG2 | | | 290,775 | | | | 6,600 | | | | 27,275 | | | | 270,100 | | | | 1,319 | | | | 184,747 | |
| Finisar Corp.3 | | | 5,386,000 | | | | 828,000 | | | | 485,000 | | | | 5,729,000 | | | | — | | | | 170,724 | |
| Insulet Corp.3 | | | 2,374,000 | | | | 1,547,000 | | | | — | | | | 3,921,000 | | | | — | | | | 160,526 | |
| Vanguard International Semiconductor Corp.2,5 | | | 69,178,554 | | | | 14,367,832 | | | | — | | | | 83,546,386 | | | | 6,533 | | | | 157,334 | |
| Lions Gate Entertainment Corp. | | | 6,877,000 | | | | 1,543,000 | | | | 668,214 | | | | 7,751,786 | | | | 2,017 | | | | 154,958 | |
| Zeltiq Aesthetics, Inc.3 | | | 3,002,044 | | | | 120,000 | | | | — | | | | 3,122,044 | | | | — | | | | 122,447 | |
| Globant SA3 | | | 2,467,480 | | | | 250,030 | | | | — | | | | 2,717,510 | | | | — | | | | 114,461 | |
| Inphi Corp.3 | | | 2,437,199 | | | | 22,000 | | | | — | | | | 2,459,199 | | | | — | | | | 107,000 | |
| Ted Baker PLC2 | | | 3,167,993 | | | | 172,349 | | | | — | | | | 3,340,342 | | | | 2,247 | | | | 106,681 | |
| Ladbrokes PLC2,5 | | | 11,755,600 | | | | 43,767,000 | | | | — | | | | 55,522,600 | | | | 1,638 | | | | 100,752 | |
| POYA International Co., Ltd.2 | | | 5,588,216 | | | | 1,147,692 | | | | — | | | | 6,735,908 | | | | 1,812 | | | | 100,313 | |
| BCA Marketplace PLC2 | | | 42,870,000 | | | | — | | | | — | | | | 42,870,000 | | | | 3,537 | | | | 100,019 | |
| Zoopla Property Group PLC2 | | | 23,421,100 | | | | 230,906 | | | | — | | | | 23,652,006 | | | | 1,390 | | | | 99,612 | |
| WHA Corp. PCL2,3 | | | 677,141,200 | | | | 403,877,700 | | | | — | | | | 1,081,018,900 | | | | — | | | | 97,788 | |
| WHA Corp. PCL, warrants, expire 20203 | | | 6,909,830 | | | | — | | | | — | | | | 6,909,830 | | | | — | | | | 1,715 | |
| King Slide Works Co., Ltd.2 | | | 6,683,000 | | | | 940,000 | | | | — | | | | 7,623,000 | | | | 2,431 | | | | 98,787 | |
| Financial Engines, Inc. | | | 2,520,930 | | | | 616,070 | | | | — | | | | 3,137,000 | | | | 795 | | | | 93,200 | |
| Quotient Technology Inc.3,6 | | | 4,881,613 | | | | 1,830,000 | | | | — | | | | 6,711,613 | | | | — | | | | 89,332 | |
| Vitrolife AB2,5 | | | 771,000 | | | | 616,559 | | | | — | | | | 1,387,559 | | | | 407 | | | | 87,992 | |
Investments in affiliates (continued)
| | | Beginning
shares | | | Additions | | | Reductions | | | Ending
shares | | | Dividend
income
(000) | | | Value of
affiliates at
9/30/2016
(000) | |
| MGM Growth Properties LLC REIT, Class A | | | — | | | | 3,311,387 | | | | — | | | | 3,311,387 | | | $ | 2,155 | | | $ | 86,328 | |
| CONMED Corp. | | | 2,141,654 | | | | — | | | | — | | | | 2,141,654 | | | | 1,713 | | | | 85,795 | |
| Taiwan Paiho Ltd.2 | | | — | | | | 22,578,000 | | | | — | | | | 22,578,000 | | | | 1,423 | | | | 81,064 | |
| zooplus AG, non-registered shares2,3 | | | 527,778 | | | | 31,000 | | | | — | | | | 558,778 | | | | — | | | | 80,976 | |
| TechnoPro Holdings, Inc.2 | | | 1,845,000 | | | | 280,000 | | | | — | | | | 2,125,000 | | | | 1,969 | | | | 80,047 | |
| Bravida Holding AB2 | | | — | | | | 11,545,792 | | | | — | | | | 11,545,792 | | | | — | | | | 76,729 | |
| Myriad Genetics, Inc.3 | | | 5,766,556 | | | | — | | | | 2,054,300 | | | | 3,712,256 | | | | — | | | | 76,398 | |
| Sirius Minerals Plc2,3 | | | 153,077,760 | | | | 26,600,000 | | | | 1,100 | | | | 179,676,660 | | | | — | | | | 75,529 | |
| Sirius Minerals Plc, warrants, expire 20152,4 | | | 26,600,000 | | | | — | | | | 26,600,000 | | | | — | | | | — | | | | — | |
| Jin Co., Ltd.2 | | | — | | | | 1,608,000 | | | | — | | | | 1,608,000 | | | | 395 | | | | 74,525 | |
| Entertainment One Ltd.2 | | | 15,254,082 | | | | 9,896,549 | | | | — | | | | 25,150,631 | | | | 390 | | | | 73,804 | |
| Sleep Country Canada Holdings Inc.5 | | | 1,736,300 | | | | 2,174,953 | | | | 900,000 | | | | 3,011,253 | | | | 944 | | | | 71,474 | |
| Genomma Lab Internacional, SAB de CV, Series B3 | | | 36,988,000 | | | | 30,495,000 | | | | — | | | | 67,483,000 | | | | — | | | | 70,581 | |
| Continental Building Products, Inc.3 | | | 3,035,700 | | | | 295,000 | | | | — | | | | 3,330,700 | | | | — | | | | 69,911 | |
| eMemory Technology Inc.2 | | | 6,146,000 | | | | — | | | | — | | | | 6,146,000 | | | | 1,140 | | | | 65,828 | |
| NCC Group PLC2 | | | 13,350,000 | | | | 1,036,000 | | | | — | | | | 14,386,000 | | | | 902 | | | | 65,374 | |
| Glaukos Corp.3,5 | | | 668,534 | | | | 1,216,070 | | | | 178,534 | | | | 1,706,070 | | | | — | | | | 64,387 | |
| Evolution Gaming Group AB2 | | | — | | | | 1,943,200 | | | | — | | | | 1,943,200 | | | | 562 | | | | 63,249 | |
| Installed Building Products, Inc.3 | | | 1,704,039 | | | | — | | | | — | | | | 1,704,039 | | | | — | | | | 61,124 | |
| Teladoc, Inc.3 | | | — | | | | 3,295,269 | | | | — | | | | 3,295,269 | | | | — | | | | 60,336 | |
| Beauty Community PCL2 | | | 150,000,000 | | | | 67,500,000 | | | | — | | | | 217,500,000 | | | | 856 | | | | 60,176 | |
| Tele Columbus AG2,3 | | | 2,976,000 | | | | 3,720,000 | | | | — | | | | 6,696,000 | | | | — | | | | 58,353 | |
| Iridium Communications Inc.3 | | | 4,889,615 | | | | 1,119,001 | | | | — | | | | 6,008,616 | | | | — | | | | 48,730 | |
| Iridium Communications Inc., Series A, convertible preferred4 | | | 60,000 | | | | — | | | | — | | | | 60,000 | | | | 549 | | | | 6,094 | |
| CenterState Banks, Inc. | | | 1,802,399 | | | | 956,000 | | | | — | | | | 2,758,399 | | | | 372 | | | | 48,906 | |
| Natera, Inc.3,5 | | | 1,795,567 | | | | 2,695,996 | | | | 391,760 | | | | 4,099,803 | | | | — | | | | 45,549 | |
| Trupanion, Inc.3 | | | 2,155,668 | | | | 134,832 | | | | — | | | | 2,290,500 | | | | — | | | | 38,709 | |
| CCL Products (India) Ltd.2 | | | 7,278,328 | | | | 2,200,774 | | | | — | | | | 9,479,102 | | | | 338 | | | | 37,248 | |
| RIB Software AG2 | | | 2,476,356 | | | | 428,637 | | | | — | | | | 2,904,993 | | | | 517 | | | | 35,766 | |
| Monash IVF Group Ltd.2 | | | — | | | | 18,520,000 | | | | — | | | | 18,520,000 | | | | 632 | | | | 34,914 | |
| Century Communities, Inc.3 | | | 1,716,000 | | | | — | | | | 140,000 | | | | 1,576,000 | | | | — | | | | 33,900 | |
| Actua Corp3 | | | 2,602,000 | | | | — | | | | — | | | | 2,602,000 | | | | — | | | | 33,696 | |
| Flexion Therapeutics, Inc.3 | | | 1,703,194 | | | | 160,000 | | | | 140,143 | | | | 1,723,051 | | | | — | | | | 33,668 | |
| Adaptimmune Therapeutics PLC (ADR)3 | | | 1,713,918 | | | | 2,887,082 | | | | — | | | | 4,601,000 | | | | — | | | | 32,437 | |
| Adaptimmune Therapeutics PLC2,4 | | | 16,938,900 | | | | — | | | | 16,938,900 | | | | — | | | | — | | | | — | |
| KEYW Holding Corp.3 | | | 2,836,400 | | | | — | | | | — | | | | 2,836,400 | | | | — | | | | 31,314 | |
| istyle Inc.2 | | | — | | | | 3,832,900 | | | | — | | | | 3,832,900 | | | | — | | | | 31,165 | |
| Transocean Partners LLC | | | — | | | | 3,208,898 | | | | 738,835 | | | | 2,470,063 | | | | 1,988 | | | | 30,456 | |
| Stock Spirits Group PLC2 | | | 15,474,743 | | | | 2,035,497 | | | | 3,105,566 | | | | 14,404,674 | | | | 3,077 | | | | 28,799 | |
| Virtus Health Ltd.2 | | | — | | | | 4,603,000 | | | | — | | | | 4,603,000 | | | | 516 | | | | 27,193 | |
| Blue Nile, Inc. | | | — | | | | 753,000 | | | | — | | | | 753,000 | | | | — | | | | 25,918 | |
| XP Power Ltd.2,5 | | | 735,164 | | | | 404,836 | | | | — | | | | 1,140,000 | | | | 951 | | | | 24,454 | |
| Sonus Networks, Inc.3 | | | 2,938,000 | | | | 287,000 | | | | 349,800 | | | | 2,875,200 | | | | — | | | | 22,369 | |
| MagnaChip Semiconductor Corp.3 | | | 2,355,000 | | | | — | | | | — | | | | 2,355,000 | | | | — | | | | 19,641 | |
| Tidewater Midstream and Infrastructure Ltd. | | | — | | | | 12,444,000 | | | | — | | | | 12,444,000 | | | | 94 | | | | 14,275 | |
| Tidewater Midstream and Infrastructure Ltd. | | | — | | | | 4,490,000 | | | | — | | | | 4,490,000 | | | | 102 | | | | 5,151 | |
| Tidewater Midstream and Infrastructure Ltd.4 | | | 12,444,000 | | | | — | | | | 12,444,000 | | | | — | | | | 279 | | | | — | |
| Zegona Communications PLC2 | | | 12,305,654 | | | | — | | | | — | | | | 12,305,654 | | | | 361 | | | | 17,673 | |
| Independence Contract Drilling, Inc.3 | | | — | | | | 3,010,000 | | | | — | | | | 3,010,000 | | | | — | | | | 15,802 | |
| San Leon Energy PLC2,3 | | | 4,003,000 | | | | 21,800,000 | | | | — | | | | 25,803,000 | | | | — | | | | 15,677 | |
| TravelCenters of America LLC3 | | | 2,023,750 | | | | — | | | | — | | | | 2,023,750 | | | | — | | | | 14,490 | |
| Mahindra Lifespace Developers Ltd.2 | | | 2,157,380 | | | | — | | | | — | | | | 2,157,380 | | | | 193 | | | | 14,034 | |
| GoldMoney Inc.2,3 | | | — | | | | 7,062,200 | | | | 3,531,100 | | | | 3,531,100 | | | | — | | | | 12,085 | |
| J. Kumar Infraprojects Ltd.2 | | | 1,780,000 | | | | 2,312,000 | | | | — | | | | 4,092,000 | | | | 123 | | | | 11,255 | |
| Talwalkars Better Value Fitness Ltd.2 | | | 2,389,000 | | | | — | | | | — | | | | 2,389,000 | | | | 54 | | | | 9,948 | |
| Xenon Pharmaceuticals Inc.3 | | | 1,030,000 | | | | — | | | | — | | | | 1,030,000 | | | | — | | | | 8,343 | |
| Kennady Diamonds Inc.3 | | | 372,952 | | | | 2,185,000 | | | | — | | | | 2,557,952 | | | | — | | | | 7,818 | |
| Lekoil Ltd. (CDI)2,3 | | | 19,430,400 | | | | 5,778,000 | | | | — | | | | 25,208,400 | | | | — | | | | 7,119 | |
| Savannah Petroleum PLC2,3 | | | 10,844,000 | | | | 7,000,000 | | | | — | | | | 17,844,000 | | | | — | | | | 7,049 | |
| Mytrah Energy Ltd.2,3 | | | 10,418,000 | | | | — | | | | — | | | | 10,418,000 | | | | — | | | | 6,988 | |
| Hummingbird Resources PLC2,3 | | | 1,650,000 | | | | 37,840,000 | | | | 20,570,000 | | | | 18,920,000 | | | | — | | | | 6,003 | |
| Providence Resources PLC2,3 | | | — | | | | 35,235,000 | | | | — | | | | 35,235,000 | | | | — | | | | 4,338 | |
| BNK Petroleum Inc.3 | | | 12,804,914 | | | | — | | | | — | | | | 12,804,914 | | | | — | | | | 2,098 | |
| | | Beginning
shares | | | Additions | | | Reductions | | | Ending
shares | | | Dividend
income
(000) | | | Value of
affiliates at
9/30/2016
(000) | |
| Neovasc Inc. (CAD denominated)3 | | | 4,246,900 | | | | 595,000 | | | | 1,367,233 | | | | 3,474,667 | | | $ | — | | | $ | 1,775 | |
| Neovasc Inc. | | | 503,836 | | | | — | | | | 503,836 | | | | — | | | | — | | | | — | |
| Gulf Keystone Petroleum Ltd.2,3 | | | — | | | | 42,000,000 | | | | — | | | | 42,000,000 | | | | — | | | | 1,166 | |
| Gulf Keystone Petroleum Ltd.2,3,4 | | | 15,715,000 | | | | — | | | | — | | | | 15,715,000 | | | | — | | | | 436 | |
| Greenko Group PLC2 | | | 9,748,155 | | | | — | | | | — | | | | 9,748,155 | | | | 14,064 | | | | 128 | |
| Altisource Asset Management Corp.3,7 | | | 116,926 | | | | 11,050 | | | | 127,976 | | | | — | | | | — | | | | — | |
| ARC Document Solutions, Inc.3,7 | | | 3,760,323 | | | | — | | | | 3,760,323 | | | | — | | | | — | | | | — | |
| ChemoCentryx, Inc.3,7 | | | 3,467,240 | | | | — | | | | 3,467,240 | | | | — | | | | — | | | | — | |
| Cox & Kings Ltd.2,7 | | | 10,130,825 | | | | 330,000 | | | | 3,960,825 | | | | 6,500,000 | | | | 97 | | | | — | |
| Cox & Kings Ltd. (GDR)2,7 | | | 330,000 | | | | — | | | | 330,000 | | | | — | | | | — | | | | — | |
| CPI Card Group Inc.7 | | | — | | | | 3,450,000 | | | | 1,496,736 | | | | 1,953,264 | | | | 398 | | | | — | |
| Delphi Energy Corp.3,7 | | | 10,178,500 | | | | — | | | | 10,178,500 | | | | — | | | | — | | | | — | |
| Demandware, Inc.3,7 | | | 2,529,356 | | | | 7,100 | | | | 2,536,456 | | | | — | | | | — | | | | — | |
| EVINE Live Inc., Class A3,7 | | | 3,987,540 | | | | — | | | | 3,987,540 | | | | — | | | | — | | | | — | |
| EXACT Sciences Corp.3,7 | | | 6,801,000 | | | | 800,000 | | | | 5,446,930 | | | | 2,154,070 | | | | — | | | | — | |
| HKBN Ltd.2,7 | | | 60,888,000 | | | | — | | | | 33,910,000 | | | | 26,978,000 | | | | 2,452 | | | | — | |
| ITT Educational Services, Inc.3,7 | | | 1,869,000 | | | | — | | | | 1,869,000 | | | | — | | | | — | | | | — | |
| Lands’ End, Inc.3,7 | | | 1,704,000 | | | | — | | | | 200,000 | | | | 1,504,000 | | | | — | | | | — | |
| Mothercare PLC2,3,7 | | | 10,810,000 | | | | 290,000 | | | | 3,480,673 | | | | 7,619,327 | | | | — | | | | — | |
| Northgate PLC2,7 | | | 6,908,399 | | | | — | | | | 6,908,399 | | | | — | | | | 513 | | | | — | |
| Novadaq Technologies Inc.3,7 | | | 3,084,948 | | | | — | | | | 1,493,175 | | | | 1,591,773 | | | | — | | | | — | |
| Ocular Therapeutix, Inc.3,7 | | | 1,955,700 | | | | 21,878 | | | | 1,977,578 | | | | — | | | | — | | | | — | |
| Papa Murphy’s Holdings, Inc.3,7 | | | 1,202,000 | | | | — | | | | 402,000 | | | | 800,000 | | | | — | | | | — | |
| Poundland Group PLC2,7 | | | 15,898,506 | | | | 1,545,000 | | | | 17,443,506 | | | | — | | | | 416 | | | | — | |
| Regulus Therapeutics Inc.7 | | | 2,015,000 | | | | 1,520,000 | | | | 3,535,000 | | | | — | | | | — | | | | — | |
| RMP Energy Inc.7 | | | 6,670,300 | | | | — | | | | 6,670,300 | | | | — | | | | — | | | | — | |
| Sinmag Equipment Corp.2,7 | | | 3,877,020 | | | | — | | | | 3,877,020 | | | | — | | | | — | | | | — | |
| Spire Healthcare Group PLC2,7 | | | 22,412,000 | | | | — | | | | 9,032,999 | | | | 13,379,001 | | | | 1,059 | | | | — | |
| Super Group Ltd.2,7 | | | 59,000,000 | | | | — | | | | 29,455,900 | | | | 29,544,100 | | | | 813 | | | | — | |
| Suprema Inc.2,7 | | | 868,200 | | | | — | | | | 868,200 | | | | — | | | | — | | | | — | |
| Takeuchi Mfg. Co., Ltd.2,7 | | | 3,770,400 | | | | 951,600 | | | | 3,919,900 | | | | 802,100 | | | | 582 | | | | — | |
| Talmer Bancorp, Inc., Class A7 | | | 3,434,028 | | | | 310,000 | | | | 3,744,028 | | | | — | | | | 455 | | | | — | |
| Tribhovandas Bhimji Zaveri Ltd.2,7 | | | 4,335,732 | | | | — | | | | 4,335,732 | | | | — | | | | — | | | | — | |
| Twelve, Inc., Series C, convertible preferred2,7 | | | 3,475,770 | | | | — | | | | 3,475,770 | | | | — | | | | — | | | | — | |
| U.S. Silica Holdings, Inc.7 | | | — | | | | 3,485,000 | | | | 542,929 | | | | 2,942,071 | | | | 712 | | | | — | |
| | | | | | | | | | | | | | | | | | | $ | 73,893 | | | $ | 6,153,065 | |
The following footnotes apply to either the individual securities noted or one or more of the securities aggregated and listed as a single line item.
| 1 | Represents an affiliated company as defined under the Investment Company Act of 1940. |
| 2 | Valued under fair value procedures adopted by authority of the board of directors. The total value of all such securities, including those in “Miscellaneous” and “Other securities,” was $12,605,952,000, which represented 42.21% of the net assets of the fund. This amount includes $12,471,296,000 related to certain securities trading outside the U.S. whose values were adjusted as a result of significant market movements following the close of local trading. |
| 3 | Security did not produce income during the last 12 months. |
| 4 | Acquired in a transaction exempt from registration under Rule 144A or Section 4(2) of the Securities Act of 1933. May be resold in the U.S. in transactions exempt from registration, normally to qualified institutional buyers. The total value of all such securities, including those in “Other securities,” was $1,137,896,000, which represented 3.81% of the net assets of the fund. |
| 5 | This security was an unaffiliated issuer in its initial period of acquisition at 9/30/2015; it was not publicly disclosed. |
| 6 | This security changed its name due to a corporate action during the reporting period. |
| 7 | Unaffiliated issuer at 9/30/2016. |
Key to abbreviations and symbols
A$ = Australian dollars
ADR = American Depositary Receipts
£ = British pounds
CAD/C$ = Canadian dollars
CDI = CREST Depository Interest
€ = Euros
GDR = Global Depositary Receipts
¥ = Japanese yen
See Notes to Financial Statements
Financial statements
Statement of assets and liabilities
at September 30, 2016 | | (dollars in thousands) | |
| | | | |
| Assets: | | | | | | | | |
| Investment securities, at value: | | | | | | | | |
| Unaffiliated issuers (cost: $17,874,507) | | $ | 23,709,984 | | | | | |
| Affiliated issuers (cost: $4,478,104) | | | 6,153,065 | | | $ | 29,863,049 | |
| Cash | | | | | | | 5,125 | |
| Cash denominated in currencies other than U.S. dollars (cost: $9,210) | | | | | | | 9,210 | |
| Unrealized appreciation on open forward currency contracts | | | | | | | 3,144 | |
| Receivables for: | | | | | | | | |
| Sales of investments | | | 93,687 | | | | | |
| Sales of fund’s shares | | | 43,239 | | | | | |
| Dividends and interest | | | 29,798 | | | | | |
| Other | | | 1,540 | | | | 168,264 | |
| | | | | | | | 30,048,792 | |
| Liabilities: | | | | | | | | |
| Unrealized depreciation on open forward currency contracts | | | | | | | 237 | |
| Payables for: | | | | | | | | |
| Purchases of investments | | | 85,406 | | | | | |
| Repurchases of fund’s shares | | | 55,603 | | | | | |
| Investment advisory services | | | 15,138 | | | | | |
| Services provided by related parties | | | 7,502 | | | | | |
| Directors’ deferred compensation | | | 3,570 | | | | | |
| Non-U.S. taxes | | | 14,508 | | | | | |
| Other | | | 988 | | | | 182,715 | |
| Net assets at September 30, 2016 | | | | | | $ | 29,865,840 | |
| | | | | | | | | |
| Net assets consist of: | | | | | | | | |
| Capital paid in on shares of capital stock | | | | | | $ | 22,472,419 | |
| Accumulated net investment loss | | | | | | | (145,843 | ) |
| Undistributed net realized gain | | | | | | | 38,296 | |
| Net unrealized appreciation | | | | | | | 7,500,968 | |
| Net assets at September 30, 2016 | | | | | | $ | 29,865,840 | |
See Notes to Financial Statements
(dollars and shares in thousands, except per-share amounts)
Total authorized capital stock — 1,000,000 shares,
$.01 par value (635,719 total shares outstanding)
| | | Net assets | | | Shares
outstanding | | | Net asset
value per share | |
| Class A | | $ | 18,761,818 | | | | 397,139 | | | $ | 47.24 | |
| Class B | | | 22,785 | | | | 533 | | | | 42.74 | |
| Class C | | | 823,554 | | | | 19,572 | | | | 42.08 | |
| Class F-1 | | | 718,549 | | | | 15,373 | | | | 46.74 | |
| Class F-2 | | | 2,117,855 | | | | 44,306 | | | | 47.80 | |
| Class 529-A | | | 1,024,316 | | | | 21,915 | | | | 46.74 | |
| Class 529-B | | | 3,819 | | | | 89 | | | | 43.11 | |
| Class 529-C | | | 286,140 | | | | 6,678 | | | | 42.85 | |
| Class 529-E | | | 52,916 | | | | 1,162 | | | | 45.53 | |
| Class 529-F-1 | | | 90,231 | | | | 1,910 | | | | 47.23 | |
| Class R-1 | | | 32,618 | | | | 753 | | | | 43.34 | |
| Class R-2 | | | 616,369 | | | | 14,219 | | | | 43.35 | |
| Class R-2E | | | 6,033 | | | | 128 | | | | 47.07 | |
| Class R-3 | | | 783,293 | | | | 17,235 | | | | 45.45 | |
| Class R-4 | | | 763,785 | | | | 16,290 | | | | 46.89 | |
| Class R-5E | | | 10 | | | | — | * | | | 47.30 | |
| Class R-5 | | | 358,736 | | | | 7,412 | | | | 48.40 | |
| Class R-6 | | | 3,403,013 | | | | 71,005 | | | | 47.93 | |
| * | Amount less than one thousand. |
See Notes to Financial Statements
Statement of operations
for the year ended September 30, 2016 | | (dollars in thousands) | |
| | | | |
| Investment income: | | | | | | | | |
| Income: | | | | | | | | |
| Dividends (net of non-U.S. taxes of $15,797; also includes $73,893 from affiliates) | | $ | 301,992 | | | | | |
| Interest | | | 18,588 | | | $ | 320,580 | |
| Fees and expenses*: | | | | | | | | |
| Investment advisory services | | | 170,916 | | | | | |
| Distribution services | | | 66,960 | | | | | |
| Transfer agent services | | | 44,470 | | | | | |
| Administrative services | | | 6,653 | | | | | |
| Reports to shareholders | | | 1,735 | | | | | |
| Registration statement and prospectus | | | 1,195 | | | | | |
| Directors’ compensation | | | 658 | | | | | |
| Auditing and legal | | | 726 | | | | | |
| Custodian | | | 3,887 | | | | | |
| State and local taxes | | | 1 | | | | | |
| Other | | | 1,517 | | | | | |
| Total fees and expenses before reimbursement | | | 298,718 | | | | | |
| Less transfer agent services reimbursement | | | — | † | | | | |
| Total fees and expenses after reimbursement | | | | | | | 298,718 | |
| Net investment income | | | | | | | 21,862 | |
| | | | | | | | | |
| Net realized loss and unrealized appreciation: | | | | | | | | |
| Net realized (loss) gain on: | | | | | | | | |
| Investments (net of non-U.S. taxes of $669; also includes $241,202 net loss from affiliates) | | | (123,000 | ) | | | | |
| Forward currency contracts | | | 30,100 | | | | | |
| Currency transactions | | | 390 | | | | (92,510 | ) |
| Net unrealized appreciation (depreciation) on: | | | | | | | | |
| Investments (net of non-U.S. taxes of $13,746) | | | 3,235,568 | | | | | |
| Forward currency contracts | | | (7,523 | ) | | | | |
| Currency translations | | | 1,053 | | | | 3,229,098 | |
| Net realized loss and unrealized appreciation | | | | | | | 3,136,588 | |
| Net increase in net assets resulting from operations | | | | | | $ | 3,158,450 | |
| * | Additional information related to class-specific fees and expenses is included in the Notes to Financial Statements. |
| † | Amount less than one thousand. |
Statements of changes in net assets
(dollars in thousands)
| | | Year ended September 30 | |
| | | 2016 | | | 2015 | |
| Operations: | | | | | | | | |
| Net investment income | | $ | 21,862 | | | $ | 15,445 | |
| Net realized (loss) gain | | | (92,510 | ) | | | 1,912,240 | |
| Net unrealized appreciation (depreciation) | | | 3,229,098 | | | | (1,435,307 | ) |
| Net increase in net assets resulting from operations | | | 3,158,450 | | | | 492,378 | |
| Distributions paid to shareholders from net realized gain on investments | | | (1,672,921 | ) | | | (2,489,781 | ) |
| Net capital share transactions | | | 2,176,139 | | | | 2,563,419 | |
| Total increase in net assets | | | 3,661,668 | | | | 566,016 | |
| Net assets: | | | | | | | | |
| Beginning of year | | | 26,204,172 | | | | 25,638,156 | |
| End of year (including accumulated net investment loss: $(145,843) and $(181,544), respectively) | | $ | 29,865,840 | | | $ | 26,204,172 | |
See Notes to Financial Statements
Notes to financial statements
1. Organization
SMALLCAP World Fund, Inc. (the “fund”) is registered under the Investment Company Act of 1940 as an open-end, diversified management investment company. The fund seeks to provide long-term growth of capital. Shareholders approved a proposal to reorganize the fund from a Maryland corporation to a Delaware statutory trust. The reorganization may be completed in the next year; however, the fund reserves the right to delay the implementation.
The fund has 18 share classes consisting of five retail share classes (Classes A, B and C, as well as two F share classes, F-1 and F-2), five 529 college savings plan share classes (Classes 529-A, 529-B, 529-C, 529-E and 529-F-1) and eight retirement plan share classes (Classes R-1, R-2, R-2E, R-3, R-4, R-5E, R-5 and R-6). The 529 college savings plan share classes can be used to save for college education. The retirement plan share classes are generally offered only through eligible employer-sponsored retirement plans. The fund’s share classes are described further in the following table:
| Share class | | Initial sales
charge | | Contingent deferred sales
charge upon redemption | | Conversion feature |
| Classes A and 529-A | | Up to 5.75% | | None (except 1% for certain redemptions within one year of purchase without an initial sales charge) | | None |
| Classes B and 529-B* | | None | | Declines from 5% to 0% for redemptions within six years of purchase | | Classes B and 529-B convert to Classes A and 529-A, respectively, after eight years |
| Class C | | None | | 1% for redemptions within one year of purchase | | Class C converts to Class F-1 after 10 years |
| Class 529-C | | None | | 1% for redemptions within one year of purchase | | None |
| Class 529-E | | None | | None | | None |
| Classes F-1, F-2 and 529-F-1 | | None | | None | | None |
| Classes R-1, R-2, R-2E, R-3, R-4, R-5E, R-5 and R-6 | | None | | None | | None |
| * | Class B and 529-B shares of the fund are not available for purchase. |
On November 20, 2015, the fund made an additional retirement plan share class (Class R-5E) available for sale pursuant to an amendment to its registration statement filed with the U.S. Securities and Exchange Commission. Refer to the fund’s prospectus for more details.
Holders of all share classes have equal pro rata rights to the assets, dividends and liquidation proceeds of the fund. Each share class has identical voting rights, except for the exclusive right to vote on matters affecting only its class. Share classes have different fees and expenses (“class-specific fees and expenses”), primarily due to different arrangements for distribution, transfer agent and administrative services. Differences in class-specific fees and expenses will result in differences in net investment income and, therefore, the payment of different per-share dividends by each share class.
2. Significant accounting policies
The fund is an investment company that applies the accounting and reporting guidance issued in Topic 946 by the U.S. Financial Accounting Standards Board. The fund’s financial statements have been prepared to comply with U.S. generally accepted accounting principles (“U.S. GAAP”). These principles require the fund’s investment adviser to make estimates and assumptions that affect reported amounts and disclosures. Actual results could differ from those estimates. Subsequent events, if any, have been evaluated through the date of issuance in the preparation of the financial statements. The fund follows the significant accounting policies described in this section, as well as the valuation policies described in the next section on valuation.
Security transactions and related investment income — Security transactions are recorded by the fund as of the date the trades are executed with brokers. Realized gains and losses from security transactions are determined based on the specific identified cost of the securities. In the event a security is purchased with a delayed payment date, the fund will segregate liquid assets sufficient to meet its payment obligations. Dividend income is recognized on the ex-dividend date and interest income is recognized on an accrual basis. Market discounts, premiums and original issue discounts on fixed-income securities are amortized daily over the expected life of the security.
Class allocations — Income, fees and expenses (other than class-specific fees and expenses) and realized and unrealized gains and losses are allocated daily among the various share classes based on their relative net assets. Class-specific fees and expenses, such as distribution, transfer agent and administrative services, are charged directly to the respective share class.
Dividends and distributions to shareholders — Dividends and distributions to shareholders are recorded on the ex-dividend date.
Currency translation — Assets and liabilities, including investment securities, denominated in currencies other than U.S. dollars are translated into U.S. dollars at the exchange rates supplied by one or more pricing vendors on the valuation date. Purchases and sales of investment securities and income and expenses are translated into U.S. dollars at the exchange rates on the dates of such transactions. The effects of changes in exchange rates on investment securities are included with the net realized gain or loss and net unrealized appreciation or depreciation on investments in the fund’s statement of operations. The realized gain or loss and unrealized appreciation or depreciation resulting from all other transactions denominated in currencies other than U.S. dollars are disclosed separately.
3. Valuation
Capital Research and Management Company (“CRMC”), the fund’s investment adviser, values the fund’s investments at fair value as defined by U.S. GAAP. The net asset value of each share class of the fund is generally determined as of approximately 4:00 p.m. New York time each day the New York Stock Exchange is open.
Methods and inputs — The fund’s investment adviser uses the following methods and inputs to establish the fair value of the fund’s assets and liabilities. Use of particular methods and inputs may vary over time based on availability and relevance as market and economic conditions evolve.
Equity securities are generally valued at the official closing price of, or the last reported sale price on, the exchange or market on which such securities are traded, as of the close of business on the day the securities are being valued or, lacking any sales, at the last available bid price. Prices for each security are taken from the principal exchange or market on which the security trades.
Fixed-income securities, including short-term securities, are generally valued at prices obtained from one or more pricing vendors. Vendors value such securities based on one or more of the inputs described in the following table. The table provides examples of inputs that are commonly relevant for valuing particular classes of fixed-income securities in which the fund is authorized to invest. However, these classifications are not exclusive, and any of the inputs may be used to value any other class of fixed-income security.
| Fixed-income class | | Examples of standard inputs |
| All | | Benchmark yields, transactions, bids, offers, quotations from dealers and trading systems, new issues, spreads and other relationships observed in the markets among comparable securities; and proprietary pricing models such as yield measures calculated using factors such as cash flows, financial or collateral performance and other reference data (collectively referred to as “standard inputs”) |
| Corporate bonds & notes; convertible securities | | Standard inputs and underlying equity of the issuer |
| Bonds & notes of governments & government agencies | | Standard inputs and interest rate volatilities |
When the fund’s investment adviser deems it appropriate to do so (such as when vendor prices are unavailable or deemed to be not representative), fixed-income securities will be valued in good faith at the mean quoted bid and ask prices that are reasonably and timely available (or bid prices, if ask prices are not available) or at prices for securities of comparable maturity, quality and type.
Securities with both fixed-income and equity characteristics, or equity securities traded principally among fixed-income dealers, are generally valued in the manner described for either equity or fixed-income securities, depending on which method is deemed most appropriate by the fund’s investment adviser. Forward currency contracts are valued at the mean of representative quoted bid and ask prices, generally based on prices supplied by one or more pricing vendors.
Securities and other assets for which representative market quotations are not readily available or are considered unreliable by the fund’s investment adviser are fair valued as determined in good faith under fair valuation guidelines adopted by authority of the fund’s board of directors as further described. The investment adviser follows fair valuation guidelines, consistent with U.S. Securities and Exchange Commission rules and guidance, to consider relevant principles and factors when making fair value determinations. The investment adviser considers relevant indications of value that are reasonably and timely available to it in determining the fair value to be assigned to a particular security, such as the type and cost of the security; contractual or legal restrictions on resale of the security; relevant financial or
business developments of the issuer; actively traded similar or related securities; conversion or exchange rights on the security; related corporate actions; significant events occurring after the close of trading in the security; and changes in overall market conditions. In addition, the closing prices of equity securities that trade in markets outside U.S. time zones may be adjusted to reflect significant events that occur after the close of local trading but before the net asset value of each share class of the fund is determined. Fair valuations and valuations of investments that are not actively trading involve judgment and may differ materially from valuations that would have been used had greater market activity occurred.
Processes and structure — The fund’s board of directors has delegated authority to the fund’s investment adviser to make fair value determinations, subject to board oversight. The investment adviser has established a Joint Fair Valuation Committee (the “Fair Valuation Committee”) to administer, implement and oversee the fair valuation process, and to make fair value decisions. The Fair Valuation Committee regularly reviews its own fair value decisions, as well as decisions made under its standing instructions to the investment adviser’s valuation teams. The Fair Valuation Committee reviews changes in fair value measurements from period to period and may, as deemed appropriate, update the fair valuation guidelines to better reflect the results of back testing and address new or evolving issues. The Fair Valuation Committee reports any changes to the fair valuation guidelines to the board of directors with supplemental information to support the changes. The fund’s board and audit committee also regularly review reports that describe fair value determinations and methods.
The fund’s investment adviser has also established a Fixed-Income Pricing Review Group to administer and oversee the fixed-income valuation process, including the use of fixed-income pricing vendors. This group regularly reviews pricing vendor information and market data. Pricing decisions, processes and controls over security valuation are also subject to additional internal reviews, including an annual control self-evaluation program facilitated by the investment adviser’s compliance group.
Classifications — The fund’s investment adviser classifies the fund’s assets and liabilities into three levels based on the inputs used to value the assets or liabilities. Level 1 values are based on quoted prices in active markets for identical securities. Level 2 values are based on significant observable market inputs, such as quoted prices for similar securities and quoted prices in inactive markets. Certain securities trading outside the U.S. may transfer between Level 1 and Level 2 due to valuation adjustments resulting from significant market movements following the close of local trading. Level 3 values are based on significant unobservable inputs that reflect the investment adviser’s determination of assumptions that market participants might reasonably use in valuing the securities. The valuation levels are not necessarily an indication of the risk or liquidity associated with the underlying investment. For example, U.S. government securities are reflected as Level 2 because the inputs used to determine fair value may not always be quoted prices in an active market. The following tables present the fund’s valuation levels as of September 30, 2016 (dollars in thousands):
| | | Investment securities |
| | | Level 1 | | | Level 2* | | | Level 3 | | | Total | |
| Assets: | | | | | | | | | | | | | | | | |
| Common stocks: | | | | | | | | | | | | | | | | |
| Consumer discretionary | | $ | 2,335,569 | | | $ | 2,952,620 | | | $ | 1 | | | $ | 5,288,190 | |
| Health care | | | 3,859,799 | | | | 1,095,896 | | | | 18,839 | | | | 4,974,534 | |
| Information technology | | | 2,294,583 | | | | 1,927,504 | | | | — | | | | 4,222,087 | |
| Industrials | | | 1,526,524 | | | | 1,853,348 | | | | — | | | | 3,379,872 | |
| Financials | | | 1,553,349 | | | | 1,121,304 | | | | — | | | | 2,674,653 | |
| Consumer staples | | | 535,267 | | | | 1,275,964 | | | | — | | | | 1,811,231 | |
| Energy | | | 1,129,317 | | | | 249,548 | | | | 13,386 | | | | 1,392,251 | |
| Materials | | | 630,895 | | | | 717,445 | | | | — | | | | 1,348,340 | |
| Other | | | 289,853 | | | | 538,647 | | | | 128 | | | | 828,628 | |
| Miscellaneous | | | 697,966 | | | | 745,459 | | | | — | | | | 1,443,425 | |
| Preferred securities | | | 117 | | | | — | | | | — | | | | 117 | |
| Rights & warrants | | | 1,714 | | | | 1,003 | | | | 1,301 | | | | 4,018 | |
| Convertible stocks | | | — | | | | 6,094 | | | | 93,559 | | | | 99,653 | |
| Bonds, notes & other debt instruments | | | — | | | | 152,038 | | | | — | | | | 152,038 | |
| Short-term securities | | | — | | | | 2,244,012 | | | | — | | | | 2,244,012 | |
| Total | | $ | 14,854,953 | | | $ | 14,880,882 | | | $ | 127,214 | | | $ | 29,863,049 | |
See the following page for footnote.
| | | Other investments† | |
| | | Level 1 | | | Level 2 | | | Level 3 | | | Total | |
| Assets: | | | | | | | | | | | | | | | | |
| Unrealized appreciation on open forward currency contracts | | $ | — | | | $ | 3,144 | | | $ | — | | | $ | 3,144 | |
| Liabilities: | | | | | | | | | | | | | | | | |
| Unrealized depreciation on open forward currency contracts | | | — | | | | (237 | ) | | | — | | | | (237 | ) |
| Total | | $ | — | | | $ | 2,907 | | | $ | — | | | $ | 2,907 | |
| * | Securities with a value of $12,471,296,000, which represented 41.76% of the net assets of the fund, were classified as Level 2 due to significant market movements following the close of local trading. |
| † | Forward currency contracts are not included in the investment portfolio. |
4. Risk factors
Investing in the fund may involve certain risks including, but not limited to, those described below.
Market conditions — The prices of, and the income generated by, the securities held by the fund may decline – sometimes rapidly or unpredictably – due to various factors, including events or conditions affecting the general economy or particular industries; overall market changes; local, regional or global political, social or economic instability; governmental or governmental agency responses to economic conditions; and currency exchange rate, interest rate and commodity price fluctuations.
Issuer risks — The prices of, and the income generated by, securities held by the fund may decline in response to various factors directly related to the issuers of such securities, including reduced demand for an issuer’s goods or services, poor management performance and strategic initiatives such as mergers, acquisitions or dispositions and the market response to any such initiatives.
Investing in growth-oriented stocks — Growth-oriented common stocks and other equity-type securities (such as preferred stocks, convertible preferred stocks and convertible bonds) may involve larger price swings and greater potential for loss than other types of investments. These risks may be even greater in the case of smaller capitalization stocks.
Investing in small companies — Investing in smaller companies may pose additional risks. For example, it is often more difficult to value or dispose of small company stocks and more difficult to obtain information about smaller companies than about larger companies. Furthermore, smaller companies often have limited product lines, operating histories, markets and/or financial resources, may be dependent on one or a few key persons for management, and can be more susceptible to losses. Moreover, the prices of their stocks may be more volatile than stocks of larger, more established companies.
Investing outside the U.S. — Securities of issuers domiciled outside the U.S., or with significant operations or revenues outside the U.S., may lose value because of adverse political, social, economic or market developments (including social instability, regional conflicts, terrorism and war) in the countries or regions in which the issuers operate or generate revenue. These securities may also lose value due to changes in foreign currency exchange rates against the U.S. dollar and/or currencies of other countries. Issuers of these securities may be more susceptible to actions of foreign governments, such as the imposition of price controls or punitive taxes, that could adversely impact the value of these securities. Securities markets in certain countries may be more volatile and/or less liquid than those in the U.S. Investments outside the U.S. may also be subject to different accounting practices and different regulatory, legal and reporting standards and practices, and may be more difficult to value, than those in the U.S. In addition, the value of investments outside the U.S. may be reduced by foreign taxes, including foreign withholding taxes on interest and dividends. Further, there may be increased risks of delayed settlement of securities purchased or sold by the fund. The risks of investing outside the U.S. may be heightened in connection with investments in emerging markets.
Investing in emerging markets — Investing in emerging markets may involve risks in addition to and greater than those generally associated with investing in the securities markets of developed countries. For instance, developing countries may have less developed legal and accounting systems than those in developed countries. The governments of these countries may be less stable and more likely to impose capital controls, nationalize a company or industry, place restrictions on foreign ownership and on withdrawing sale proceeds of securities from the country, and/or impose punitive taxes that could adversely affect the prices of securities. In addition, the economies of these countries may be dependent on relatively few industries that are more susceptible to local and global changes. Securities markets in these countries can also be relatively small and have substantially lower trading volumes. As a result, securities issued in these countries may be more volatile and less liquid, and may be more difficult to value, than securities issued in countries with more developed economies and/or markets. Less certainty with respect to security valuations may lead to additional challenges and risks in calculating the fund’s net asset value. Additionally, there may be increased settlement risks for transactions in local securities.
Management — The investment adviser to the fund actively manages the fund’s investments. Consequently, the fund is subject to the risk that the methods and analyses employed by the investment adviser in this process may not produce the desired results. This could cause the fund to lose value or its investment results to lag relevant benchmarks or other funds with similar objectives.
5. Certain investment techniques
Forward currency contracts — The fund has entered into forward currency contracts, which represent agreements to exchange currencies on specific future dates at predetermined rates. The fund’s investment adviser uses forward currency contracts to manage the fund’s exposure to changes in exchange rates. Upon entering into these contracts, risks may arise from the potential inability of counterparties to meet the terms of their contracts and from possible movements in exchange rates.
On a daily basis, the fund’s investment adviser values forward currency contracts and records unrealized appreciation or depreciation for open forward currency contracts in the fund’s statement of assets and liabilities. Realized gains or losses are recorded at the time the forward currency contract is closed or offset by another contract with the same broker for the same settlement date and currency.
Closed forward currency contracts that have not reached their settlement date are included in the respective receivables or payables for closed forward currency contracts in the fund’s statement of assets and liabilities. Net realized gains or losses from closed forward currency contracts and net unrealized appreciation or depreciation from open forward currency contracts are recorded in the fund’s statement of operations.
The following tables present the financial statement impacts resulting from the fund’s use of forward currency contracts as of, or for the year ended, September 30, 2016 (dollars in thousands):
| | | | | Assets | | | Liabilities | |
| | | | | Location on statement of | | | | | Location on statement of | | | |
| Contract | | Risk type | | assets and liabilities | | Value | | | assets and liabilities | | Value | |
| Forward currency | | Currency | | Unrealized appreciation on open forward currency contracts | | $ | 3,144 | | | Unrealized depreciation on open forward currency contracts | | $ | 237 | |
| | | | | | | | | | | | | | | |
| | | | | Net realized gain | | | Net unrealized depreciation | |
| | | | | Location on statement of | | | | | Location on statement of | | | |
| Contract | | Risk type | | operations | | Value | | | operations | | Value | |
| Forward currency | | Currency | | Net realized gain on forward currency contracts | | $ | 30,100 | | | Net unrealized depreciation on forward currency contracts | | $ | (7,523 | ) |
Collateral — The fund participates in a collateral program due to its use of forward currency contracts. The program calls for the fund to either receive or pledge collateral based on the net gain or loss on unsettled forward currency contracts by counterparty. The purpose of the collateral is to cover potential losses that could occur in the event that either party cannot meet its contractual obligations.
Rights of offset — The fund has entered into enforceable master netting agreements with certain counterparties for forward currency contracts, where on any date amounts payable by each party to the other (in the same currency with respect to the same transaction) may be closed or offset by each party’s payment obligation. If an early termination date occurs under these agreements following an event of default or termination event, all obligations of each party to its counterparty are settled net through a single payment in a single currency (“close-out netting”). For financial reporting purposes, the fund does not offset financial assets and financial liabilities that are subject to these master netting arrangements in the statement of assets and liabilities.
The following table presents the fund’s forward currency contracts by counterparty that are subject to master netting agreements but that are not offset in the fund’s statement of assets and liabilities. The net amount column shows the impact of offsetting on the fund’s statement of assets and liabilities as of September 30, 2016, if close-out netting was exercised (dollars in thousands):
| | | | | | Gross amounts not offset in the | | | | |
| | | Gross amounts | | | statement of assets and liabilities and | | | | |
| | | recognized in the | | | subject to a master netting agreement | | | | |
| | | statement of assets | | | Available | | | Non-cash | | | Cash | | | Net | |
| Counterparty | | and liabilities | | | to offset | | | collateral* | | | collateral | | | amount | |
| Assets: | | | | | | | | | | | | | | | | | | | | |
| Bank of America, N.A. | | $ | 150 | | | $ | (96 | ) | | $ | — | | | $ | — | | | $ | 54 | |
| Barclays Bank PLC | | | 6 | | | | (6 | ) | | | — | | | | — | | | | — | |
| Citibank | | | 2,165 | | | | — | | | | (1,866 | ) | | | — | | | | 299 | |
| HSBC Bank | | | 5 | | | | (5 | ) | | | — | | | | — | | | | — | |
| JPMorgan Chase | | | 401 | | | | (41 | ) | | | (111 | ) | | | — | | | | 249 | |
| UBS AG | | | 417 | | | | — | | | | (141 | ) | | | — | | | | 276 | |
| Total | | $ | 3,144 | | | $ | (148 | ) | | $ | (2,118 | ) | | $ | — | | | $ | 878 | |
| Liabilities: | | | | | | | | | | | | | | | | | | | | |
| Bank of America, N.A. | | $ | 96 | | | $ | (96 | ) | | $ | — | | | $ | — | | | $ | — | |
| Barclays Bank PLC | | | 23 | | | | (6 | ) | | | — | | | | — | | | | 17 | |
| HSBC Bank | | | 77 | | | | (5 | ) | | | (72 | ) | | | — | | | | — | |
| JPMorgan Chase | | | 41 | | | | (41 | ) | | | — | | | | — | | | | — | |
| Total | | $ | 237 | | | $ | (148 | ) | | $ | (72 | ) | | $ | — | | | $ | 17 | |
| * | Non-cash collateral is shown on a settlement basis. |
6. Taxation and distributions
Federal income taxation — The fund complies with the requirements under Subchapter M of the Internal Revenue Code applicable to mutual funds and intends to distribute substantially all of its net taxable income and net capital gains each year. The fund is not subject to income taxes to the extent such distributions are made. Therefore, no federal income tax provision is required.
As of and during the period ended September 30, 2016, the fund did not have a liability for any unrecognized tax benefits. The fund recognizes interest and penalties, if any, related to unrecognized tax benefits as income tax expense in the statement of operations. During the period, the fund did not incur any significant interest or penalties.
The fund is not subject to examination by U.S. federal tax authorities for tax years before 2012, by state tax authorities for tax years before 2011 and by tax authorities outside the U.S. for tax years before 2009.
Non-U.S. taxation — Dividend and interest income are recorded net of non-U.S. taxes paid. The fund may file withholding tax reclaims in certain jurisdictions to recover a portion of amounts previously withheld. As a result of rulings from European courts, the fund filed for additional reclaims related to prior years. These reclaims are recorded when the amount is known and there are no significant uncertainties on collectability. Gains realized by the fund on the sale of securities in certain countries are subject to non-U.S. taxes. The fund records an estimated deferred tax liability based on unrealized gains to provide for potential non-U.S. taxes payable upon the sale of these securities.
Distributions — Distributions paid to shareholders are based on net investment income and net realized gains determined on a tax basis, which may differ from net investment income and net realized gains for financial reporting purposes. These differences are due primarily to different treatment for items such as currency gains and losses; short-term capital gains and losses; capital losses related to sales of certain securities within 30 days of purchase; unrealized appreciation of certain investments in securities outside the U.S.; deferred expenses; cost of investments sold; non-U.S. taxes on capital gains and income on certain investments. The fiscal year in which amounts are distributed may differ from the year in which the net investment income and net realized gains are recorded by the fund for financial reporting purposes.
During the year ended September 30, 2016, the fund reclassified $74,000 from accumulated net investment loss to capital paid in on shares of capital stock and $13,913,000 from undistributed net realized gain to accumulated net investment loss to align financial reporting with tax reporting.
As of September 30, 2016, the tax basis components of distributable earnings, unrealized appreciation (depreciation) and cost of investment securities were as follows (dollars in thousands):
| Undistributed ordinary income | | $ | 31,033 | |
| Post-October capital loss deferral* | | | 174,535 | |
| Gross unrealized appreciation on investment securities | | | 8,863,357 | |
| Gross unrealized depreciation on investment securities | | | (1,310,486 | ) |
| Net unrealized appreciation on investment securities | | | 7,552,871 | |
| Cost of investment securities | | | 22,310,178 | |
| * | These deferrals are considered incurred in the subsequent year. |
Tax-basis distributions paid to shareholders from long-term capital gains were as follows (dollars in thousands):
| | | Year ended September 30 |
| Share class | | 2016 | | | 2015 | |
| Class A | | $ | 1,064,700 | | | $ | 1,620,300 | |
| Class B | | | 3,676 | | | | 11,193 | |
| Class C | | | 58,177 | | | | 91,765 | |
| Class F-1 | | | 42,143 | | | | 60,501 | |
| Class F-2 | | | 96,780 | | | | 118,437 | |
| Class 529-A | | | 59,860 | | | | 91,365 | |
| Class 529-B | | | 551 | | | | 1,553 | |
| Class 529-C | | | 18,639 | | | | 28,795 | |
| Class 529-E | | | 3,219 | | | | 4,863 | |
| Class 529-F-1 | | | 5,125 | | | | 7,765 | |
| Class R-1 | | | 2,210 | | | | 3,940 | |
| Class R-2 | | | 41,660 | | | | 69,423 | |
| Class R-2E | | | 77 | | | | 1 | |
| Class R-3 | | | 49,450 | | | | 78,623 | |
| Class R-4 | | | 45,110 | | | | 69,525 | |
| Class R-5E* | | | 1 | | | | | |
| Class R-5 | | | 29,273 | | | | 43,654 | |
| Class R-6 | | | 152,270 | | | | 188,078 | |
| Total | | $ | 1,672,921 | | | $ | 2,489,781 | |
| * | Class R-5E shares were offered beginning November 20, 2015. |
7. Fees and transactions with related parties
CRMC, the fund’s investment adviser, is the parent company of American Funds Distributors,® Inc. (“AFD”), the principal underwriter of the fund’s shares, and American Funds Service Company® (“AFS”), the fund’s transfer agent. CRMC, AFD and AFS are considered related parties to the fund.
Investment advisory services — The fund has an investment advisory and service agreement with CRMC that provides for monthly fees accrued daily. These fees are based on a series of decreasing annual rates beginning with 0.800% on the first $1 billion of daily net assets and decreasing to 0.595% on such assets in excess of $27 billion. For the year ended September 30, 2016, the investment advisory services fee was $170,916,000, which was equivalent to an annualized rate of 0.629% of average daily net assets.
Class-specific fees and expenses — Expenses that are specific to individual share classes are accrued directly to the respective share class. The principal class-specific fees and expenses are further described below:
Distribution services — The fund has plans of distribution for all share classes, except Class F-2, R-5E, R-5 and R-6 shares. Under the plans, the board of directors approves certain categories of expenses that are used to finance activities primarily intended to sell fund shares and service existing accounts. The plans provide for payments, based on an annualized percentage of average daily net assets, ranging from 0.30% to 1.00% as noted in this section. In some cases, the board of directors has limited the amounts that may be paid to less than the maximum allowed by the plans. All share classes with a plan may use up to 0.25% of average daily net assets to pay service fees, or to compensate AFD for paying service fees, to firms that have entered into agreements with AFD to provide certain shareholder services. The remaining amounts available to be paid under each plan are paid to dealers to compensate them for their sales activities.
For Class A and 529-A shares, distribution-related expenses include the reimbursement of dealer and wholesaler commissions paid by AFD for certain shares sold without a sales charge. These share classes reimburse AFD for amounts billed within the prior 15 months but only to the extent that the overall annual expense limit of 0.25% is not exceeded. As of September 30, 2016, there were no unreimbursed expenses subject to reimbursement for Class A or 529-A shares.
| Share class | | Currently approved limits | | Plan limits |
| Class A | | | 0.30 | % | | | 0.30 | % |
| Class 529-A | | | 0.30 | | | | 0.50 | |
| Classes B and 529-B | | | 1.00 | | | | 1.00 | |
| Classes C, 529-C and R-1 | | | 1.00 | | | | 1.00 | |
| Class R-2 | | | 0.75 | | | | 1.00 | |
| Class R-2E | | | 0.60 | | | | 0.85 | |
| Classes 529-E and R-3 | | | 0.50 | | | | 0.75 | |
| Classes F-1, 529-F-1 and R-4 | | | 0.25 | | | | 0.50 | |
Transfer agent services — The fund has a shareholder services agreement with AFS under which the fund compensates AFS for providing transfer agent services to each of the fund’s share classes. These services include recordkeeping, shareholder communications and transaction processing. In addition, the fund reimburses AFS for amounts paid to third parties for performing transfer agent services on behalf of fund shareholders.
Administrative services — The fund has an administrative services agreement with CRMC under which the fund compensates CRMC for providing administrative services to Class A, C, F, 529 and R shares. These services include, but are not limited to, coordinating, monitoring, assisting and overseeing third parties that provide services to fund shareholders. Under the agreement, Class A shares pay an annual fee of 0.01% and Class C, F, 529 and R shares pay an annual fee of 0.05% of their respective average daily net assets.
529 plan services — Each 529 share class is subject to service fees to compensate the Virginia College Savings Plan (“Virginia529”) for its oversight and administration of the 529 college savings plan. From October 1, 2015 to June 30, 2016, the quarterly fee was based on a series of decreasing annual rates beginning with 0.10% on the first $30 billion of the net assets invested in Class 529 shares of the American Funds and decreasing to 0.05% on such assets in excess of $70 billion. Effective July 1, 2016, the quarterly fee was amended to annual rates of 0.10% on the first $20 billion of the net assets invested in the Class 529 shares of the American Funds, 0.05% on such assets between $20 billion and $100 billion, and 0.03% on such assets over $100 billion. The fee for any given calendar quarter is accrued and calculated on the basis of the average net assets of Class 529 shares of the American Funds for the last month of the prior calendar quarter. The fee is included in other expenses in the fund’s statement of operations. Virginia529 is not considered a related party to the fund.
For the year ended September 30, 2016, class-specific expenses under the agreements were as follows (dollars in thousands):
| | | Distribution | | | Transfer agent | | | Administrative | | | 529 plan |
| Share class | | services | | | services | | | services | | | services |
| Class A | | | $41,322 | | | | $32,683 | | | | $1,730 | | | Not applicable |
| Class B | | | 411 | | | | 91 | | | | Not applicable | | | Not applicable |
| Class C | | | 8,111 | | | | 1,569 | | | | 408 | | | Not applicable |
| Class F-1 | | | 1,672 | | | | 1,032 | | | | 336 | | | Not applicable |
| Class F-2 | | | Not applicable | | | | 1,873 | | | | 837 | | | Not applicable |
| Class 529-A | | | 2,049 | | | | 1,596 | | | | 479 | | | $802 |
| Class 529-B | | | 63 | | | | 14 | | | | 3 | | | 5 |
| Class 529-C | | | 2,691 | | | | 480 | | | | 136 | | | 229 |
| Class 529-E | | | 248 | | | | 47 | | | | 25 | | | 42 |
| Class 529-F-1 | | | — | | | | 138 | | | | 42 | | | 70 |
| Class R-1 | | | 325 | | | | 46 | | | | 16 | | | Not applicable |
| Class R-2 | | | 4,497 | | | | 2,350 | | | | 302 | | | Not applicable |
| Class R-2E | | | 19 | | | | 6 | | | | 2 | | | Not applicable |
| Class R-3 | | | 3,752 | | | | 1,393 | | | | 377 | | | Not applicable |
| Class R-4 | | | 1,800 | | | | 837 | | | | 362 | | | Not applicable |
| Class R-5E* | | | Not applicable | | | | — | † | | | — | † | | Not applicable |
| Class R-5 | | | Not applicable | | | | 271 | | | | 225 | | | Not applicable |
| Class R-6 | | | Not applicable | | | | 44 | | | | 1,373 | | | Not applicable |
| Total class-specific expenses | | | $66,960 | | | | $44,470 | | | | $6,653 | | | $1,148 |
| * | Class R-5E shares were offered beginning November 20, 2015. |
| † | Amount less than one thousand. |
Directors’ deferred compensation — Directors who are unaffiliated with CRMC may elect to defer the cash payment of part or all of their compensation. These deferred amounts, which remain as liabilities of the fund, are treated as if invested in shares of the fund or other American Funds. These amounts represent general, unsecured liabilities of the fund and vary according to the total returns of the selected funds. Directors’ compensation of $658,000 in the fund’s statement of operations reflects $429,000 in current fees (either paid in cash or deferred) and a net increase of $229,000 in the value of the deferred amounts.
Affiliated officers and directors — Officers and certain directors of the fund are or may be considered to be affiliated with CRMC, AFD and AFS. No affiliated officers or directors received any compensation directly from the fund.
Security transactions with related funds — The fund may purchase from, or sell securities to, other CRMC-managed funds (or funds managed by certain affiliates of CRMC) under procedures adopted by the fund’s board of directors. The funds involved in such transactions are considered related by virtue of having a common investment adviser (or affiliated investment advisers), common directors and/or common officers. When such transactions occur, each transaction is executed at the current market price of the security and no brokerage commissions or fees are paid in accordance with Rule 17a-7 of the 1940 Act.
8. Committed line of credit
The fund participates with other funds managed by CRMC in a $500 million credit facility (the “line of credit”) to be utilized for temporary purposes to support shareholder redemptions. The fund has agreed to pay commitment fees on its pro-rata portion of the line of credit, which are reflected in other expenses in the fund’s statement of operations. The fund did not borrow on this line of credit at any time during the year ended September 30, 2016.
9. Capital share transactions
Capital share transactions in the fund were as follows (dollars and shares in thousands):
| | | | | | | | | Reinvestments of | | | | | | | | | Net increase | |
| | | Sales1 | | | distributions | | | Repurchases1 | | | (decrease) | |
| Share class | | Amount | | | Shares | | | Amount | | | Shares | | | Amount | | | Shares | | | Amount | | | Shares | |
| | | | | | | | | | | | | | | | | | | | | | | | | |
| Year ended September 30, 2016 | | | | | | | | | | | | | | | | | | | | | | | | | |
| | | | | | | | | | | | | | | | | | | | | | | | | | | | | | | | | |
| Class A | | $ | 2,295,955 | | | | 52,866 | | | $ | 1,047,370 | | | | 24,178 | | | $ | (2,391,866 | ) | | | (54,698 | ) | | $ | 951,459 | | | | 22,346 | |
| Class B | | | 1,133 | | | | 28 | | | | 3,663 | | | | 93 | | | | (45,481 | ) | | | (1,153 | ) | | | (40,685 | ) | | | (1,032 | ) |
| Class C | | | 112,677 | | | | 2,881 | | | | 57,696 | | | | 1,486 | | | | (217,037 | ) | | | (5,591 | ) | | | (46,664 | ) | | | (1,224 | ) |
| Class F-1 | | | 179,580 | | | | 4,186 | | | | 41,681 | | | | 972 | | | | (198,802 | ) | | | (4,619 | ) | | | 22,459 | | | | 539 | |
| Class F-2 | | | 879,673 | | | | 19,680 | | | | 93,181 | | | | 2,131 | | | | (453,367 | ) | | | (10,251 | ) | | | 519,487 | | | | 11,560 | |
| Class 529-A | | | 98,815 | | | | 2,291 | | | | 59,841 | | | | 1,396 | | | | (126,275 | ) | | | (2,906 | ) | | | 32,381 | | | | 781 | |
| Class 529-B | | | 98 | | | | 2 | | | | 551 | | | | 14 | | | | (6,370 | ) | | | (160 | ) | | | (5,721 | ) | | | (144 | ) |
| Class 529-C | | | 27,405 | | | | 690 | | | | 18,632 | | | | 471 | | | | (44,262 | ) | | | (1,108 | ) | | | 1,775 | | | | 53 | |
| Class 529-E | | | 4,666 | | | | 110 | | | | 3,219 | | | | 77 | | | | (6,626 | ) | | | (156 | ) | | | 1,259 | | | | 31 | |
| Class 529-F-1 | | | 15,378 | | | | 351 | | | | 5,127 | | | | 118 | | | | (17,587 | ) | | | (399 | ) | | | 2,918 | | | | 70 | |
| Class R-1 | | | 6,053 | | | | 151 | | | | 2,204 | | | | 55 | | | | (12,776 | ) | | | (310 | ) | | | (4,519 | ) | | | (104 | ) |
| Class R-2 | | | 117,908 | | | | 2,942 | | | | 41,614 | | | | 1,041 | | | | (195,936 | ) | | | (4,860 | ) | | | (36,414 | ) | | | (877 | ) |
| Class R-2E | | | 5,890 | | | | 136 | | | | 76 | | | | 2 | | | | (467 | ) | | | (11 | ) | | | 5,499 | | | | 127 | |
| Class R-3 | | | 152,872 | | | | 3,637 | | | | 49,428 | | | | 1,183 | | | | (227,658 | ) | | | (5,400 | ) | | | (25,358 | ) | | | (580 | ) |
| Class R-4 | | | 148,378 | | | | 3,431 | | | | 45,105 | | | | 1,050 | | | | (181,577 | ) | | | (4,177 | ) | | | 11,906 | | | | 304 | |
| Class R-5E2 | | | 10 | | | | — | 3 | | | — | | | | — | | | | — | | | | — | | | | 10 | | | | — | 3 |
| Class R-5 | | | 97,347 | | | | 2,221 | | | | 29,263 | | | | 661 | | | | (254,197 | ) | | | (5,794 | ) | | | (127,587 | ) | | | (2,912 | ) |
| Class R-6 | | | 958,624 | | | | 22,079 | | | | 152,259 | | | | 3,475 | | | | (196,949 | ) | | | (4,444 | ) | | | 913,934 | | | | 21,110 | |
| Total net increase (decrease) | | $ | 5,102,462 | | | | 117,682 | | | $ | 1,650,910 | | | | 38,403 | | | $ | (4,577,233 | ) | | | (106,037 | ) | | $ | 2,176,139 | | | | 50,048 | |
See page 28 for footnotes.
| | | | | | | | | Reinvestments of | | | | | | | | | Net increase | |
| | | Sales1 | | | distributions | | | Repurchases1 | | | (decrease) | |
| Share class | | Amount | | | Shares | | | Amount | | | Shares | | | Amount | | | Shares | | | Amount | | | Shares | |
| | | | | | | | | | | | | | | | | | | | | | | | | |
| Year ended September 30, 2015 | | | | | | | | | | | | | | | | | | | | | | | | | |
| | | | | | | | | | | | | | | | | | | | | | | | | | | | | | | | | |
| Class A | | $ | 1,839,672 | | | | 37,984 | | | $ | 1,593,438 | | | | 35,036 | | | $ | (2,142,761 | ) | | | (44,637 | ) | | $ | 1,290,349 | | | | 28,383 | |
| Class B | | | 1,779 | | | | 40 | | | | 11,120 | | | | 265 | | | | (62,586 | ) | | | (1,409 | ) | | | (49,687 | ) | | | (1,104 | ) |
| Class C | | | 148,950 | | | | 3,381 | | | | 90,963 | | | | 2,199 | | | | (206,045 | ) | | | (4,711 | ) | | | 33,868 | | | | 869 | |
| Class F-1 | | | 197,926 | | | | 4,099 | | | | 59,775 | | | | 1,327 | | | | (167,562 | ) | | | (3,535 | ) | | | 90,139 | | | | 1,891 | |
| Class F-2 | | | 551,145 | | | | 11,287 | | | | 113,364 | | | | 2,477 | | | | (274,668 | ) | | | (5,705 | ) | | | 389,841 | | | | 8,059 | |
| Class 529-A | | | 106,546 | | | | 2,226 | | | | 91,346 | | | | 2,027 | | | | (116,697 | ) | | | (2,445 | ) | | | 81,195 | | | | 1,808 | |
| Class 529-B | | | 341 | | | | 7 | | | | 1,551 | | | | 37 | | | | (8,171 | ) | | | (182 | ) | | | (6,279 | ) | | | (138 | ) |
| Class 529-C | | | 32,830 | | | | 734 | | | | 28,787 | | | | 683 | | | | (42,251 | ) | | | (947 | ) | | | 19,366 | | | | 470 | |
| Class 529-E | | | 6,186 | | | | 132 | | | | 4,861 | | | | 110 | | | | (6,858 | ) | | | (147 | ) | | | 4,189 | | | | 95 | |
| Class 529-F-1 | | | 17,050 | | | | 353 | | | | 7,763 | | | | 171 | | | | (15,780 | ) | | | (327 | ) | | | 9,033 | | | | 197 | |
| Class R-1 | | | 8,027 | | | | 178 | | | | 3,930 | | | | 93 | | | | (12,360 | ) | | | (275 | ) | | | (403 | ) | | | (4 | ) |
| Class R-2 | | | 148,953 | | | | 3,305 | | | | 69,391 | | | | 1,633 | | | | (218,478 | ) | | | (4,872 | ) | | | (134 | ) | | | 66 | |
| Class R-2E | | | 73 | | | | 1 | | | | — | | | | — | | | | (10 | ) | | | — | 3 | | | 63 | | | | 1 | |
| Class R-3 | | | 198,149 | | | | 4,222 | | | | 78,595 | | | | 1,783 | | | | (248,364 | ) | | | (5,318 | ) | | | 28,380 | | | | 687 | |
| Class R-4 | | | 180,779 | | | | 3,752 | | | | 69,524 | | | | 1,540 | | | | (207,906 | ) | | | (4,354 | ) | | | 42,397 | | | | 938 | |
| Class R-5 | | | 122,897 | | | | 2,496 | | | | 43,649 | | | | 943 | | | | (110,861 | ) | | | (2,273 | ) | | | 55,685 | | | | 1,166 | |
| Class R-6 | | | 611,527 | | | | 12,665 | | | | 188,059 | | | | 4,106 | | | | (224,169 | ) | | | (4,871 | ) | | | 575,417 | | | | 11,900 | |
| Total net increase (decrease) | | $ | 4,172,830 | | | | 86,862 | | | $ | 2,456,116 | | | | 54,430 | | | $ | (4,065,527 | ) | | | (86,008 | ) | | $ | 2,563,419 | | | | 55,284 | |
| 1 | Includes exchanges between share classes of the fund. |
| 2 | Class R-5E shares were offered beginning November 20, 2015. |
| 3 | Amount less than one thousand. |
10. Investment transactions
The fund made purchases and sales of investment securities, excluding short-term securities and U.S. government obligations, if any, of $7,988,724,000 and $6,992,431,000, respectively, during the year ended September 30, 2016.
Financial highlights
| | | | | | Income (loss) from
investment operations1 | | | Dividends and distributions | | | | | | | | | | | | | | | | | | | |
| | | Net asset
value,
beginning
of period | | | Net
investment
income
(loss) | | | Net gains
(losses) on
securities (both
realized and
unrealized) | | | Total from
investment
operations | | | Dividends
(from net
investment
income) | | | Distributions
(from capital
gains) | | | Total
dividends
and
distributions | | | Net asset
value,
end
of period | | | Total
return2 | | | Net assets,
end of period
(in millions) | | | Ratio of
expenses to
average net
assets before
reimburse-
ments | | | Ratio of
expenses to
average net
assets after
reimburse-
ments | | | Ratio of
net income
(loss)
to average
net assets | |
| Class A: | | | | | | | | | | | | | | | | | | | | | | | | | | | | | | | | | | | | | | | | | | | | | | | | | | | | |
| Year ended 9/30/2016 | | $ | 45.04 | | | $ | .04 | | | $ | 4.99 | | | $ | 5.03 | | | $ | — | | | $ | (2.83 | ) | | $ | (2.83 | ) | | $ | 47.24 | | | | 11.72 | % | | $ | 18,762 | | | | 1.10 | % | | | 1.10 | % | | | .08 | % |
| Year ended 9/30/2015 | | | 48.66 | | | | .04 | | | | 1.09 | | | | 1.13 | | | | — | | | | (4.75 | ) | | | (4.75 | ) | | | 45.04 | | | | 2.25 | | | | 16,882 | | | | 1.07 | | | | 1.07 | | | | .08 | |
| Year ended 9/30/2014 | | | 48.91 | | | | .01 | | | | 2.17 | | | | 2.18 | | | | — | | | | (2.43 | ) | | | (2.43 | ) | | | 48.66 | | | | 4.43 | | | | 16,857 | | | | 1.07 | | | | 1.07 | | | | .02 | |
| Year ended 9/30/2013 | | | 39.27 | | | | .06 | | | | 10.12 | | | | 10.18 | | | | (.54 | ) | | | — | | | | (.54 | ) | | | 48.91 | | | | 26.29 | | | | 16,454 | | | | 1.13 | | | | 1.13 | | | | .15 | |
| Year ended 9/30/2012 | | | 31.45 | | | | .08 | | | | 7.85 | | | | 7.93 | | | | (.11 | ) | | | — | | | | (.11 | ) | | | 39.27 | | | | 25.26 | | | | 13,557 | | | | 1.14 | | | | 1.14 | | | | .23 | |
| Class B: | | | | | | | | | | | | | | | | | | | | | | | | | | | | | | | | | | | | | | | | | | | | | | | | | | | | |
| Year ended 9/30/2016 | | | 41.32 | | | | (.30 | ) | | | 4.55 | | | | 4.25 | | | | — | | | | (2.83 | ) | | | (2.83 | ) | | | 42.74 | | | | 10.83 | | | | 23 | | | | 1.87 | | | | 1.87 | | | | (.76 | ) |
| Year ended 9/30/2015 | | | 45.33 | | | | (.32 | ) | | | 1.06 | | | | .74 | | | | — | | | | (4.75 | ) | | | (4.75 | ) | | | 41.32 | | | | 1.49 | | | | 65 | | | | 1.83 | | | | 1.83 | | | | (.72 | ) |
| Year ended 9/30/2014 | | | 46.06 | | | | (.36 | ) | | | 2.06 | | | | 1.70 | | | | — | | | | (2.43 | ) | | | (2.43 | ) | | | 45.33 | | | | 3.66 | | | | 121 | | | | 1.83 | | | | 1.83 | | | | (.77 | ) |
| Year ended 9/30/2013 | | | 36.95 | | | | (.26 | ) | | | 9.56 | | | | 9.30 | | | | (.19 | ) | | | — | | | | (.19 | ) | | | 46.06 | | | | 25.29 | | | | 185 | | | | 1.89 | | | | 1.89 | | | | (.63 | ) |
| Year ended 9/30/2012 | | | 29.72 | | | | (.20 | ) | | | 7.43 | | | | 7.23 | | | | — | | | | — | | | | — | | | | 36.95 | | | | 24.33 | | | | 214 | | | | 1.90 | | | | 1.90 | | | | (.58 | ) |
| Class C: | | | | | | | | | | | | | | | | | | | | | | | | | | | | | | | | | | | | | | | | | | | | | | | | | | | | |
| Year ended 9/30/2016 | | | 40.73 | | | | (.29 | ) | | | 4.47 | | | | 4.18 | | | | — | | | | (2.83 | ) | | | (2.83 | ) | | | 42.08 | | | | 10.82 | | | | 824 | | | | 1.90 | | | | 1.90 | | | | (.73 | ) |
| Year ended 9/30/2015 | | | 44.77 | | | | (.32 | ) | | | 1.03 | | | | .71 | | | | — | | | | (4.75 | ) | | | (4.75 | ) | | | 40.73 | | | | 1.45 | | | | 847 | | | | 1.87 | | | | 1.87 | | | | (.73 | ) |
| Year ended 9/30/2014 | | | 45.54 | | | | (.36 | ) | | | 2.02 | | | | 1.66 | | | | — | | | | (2.43 | ) | | | (2.43 | ) | | | 44.77 | | | | 3.61 | | | | 892 | | | | 1.87 | | | | 1.87 | | | | (.79 | ) |
| Year ended 9/30/2013 | | | 36.60 | | | | (.26 | ) | | | 9.45 | | | | 9.19 | | | | (.25 | ) | | | — | | | | (.25 | ) | | | 45.54 | | | | 25.26 | | | | 920 | | | | 1.93 | | | | 1.93 | | | | (.65 | ) |
| Year ended 9/30/2012 | | | 29.44 | | | | (.19 | ) | | | 7.35 | | | | 7.16 | | | | — | | | | — | | | | — | | | | 36.60 | | | | 24.32 | | | | 779 | | | | 1.93 | | | | 1.93 | | | | (.56 | ) |
| Class F-1: | | | | | | | | | | | | | | | | | | | | | | | | | | | | | | | | | | | | | | | | | | | | | | | | | | | | |
| Year ended 9/30/2016 | | | 44.60 | | | | .03 | | | | 4.94 | | | | 4.97 | | | | — | | | | (2.83 | ) | | | (2.83 | ) | | | 46.74 | | | | 11.69 | | | | 718 | | | | 1.11 | | | | 1.11 | | | | .07 | |
| Year ended 9/30/2015 | | | 48.23 | | | | .04 | | | | 1.08 | | | | 1.12 | | | | — | | | | (4.75 | ) | | | (4.75 | ) | | | 44.60 | | | | 2.25 | | | | 662 | | | | 1.07 | | | | 1.07 | | | | .08 | |
| Year ended 9/30/2014 | | | 48.51 | | | | — | | | | 2.15 | | | | 2.15 | | | | — | | | | (2.43 | ) | | | (2.43 | ) | | | 48.23 | | | | 4.42 | | | | 624 | | | | 1.09 | | | | 1.09 | | | | — | |
| Year ended 9/30/2013 | | | 38.94 | | | | .09 | | | | 10.03 | | | | 10.12 | | | | (.55 | ) | | | — | | | | (.55 | ) | | | 48.51 | | | | 26.33 | | | | 868 | | | | 1.07 | | | | 1.07 | | | | .21 | |
| Year ended 9/30/2012 | | | 31.18 | | | | .09 | | | | 7.78 | | | | 7.87 | | | | (.11 | ) | | | — | | | | (.11 | ) | | | 38.94 | | | | 25.30 | | | | 655 | | | | 1.12 | | | | 1.12 | | | | .25 | |
| Class F-2: | | | | | | | | | | | | | | | | | | | | | | | | | | | | | | | | | | | | | | | | | | | | | | | | | | | | |
| Year ended 9/30/2016 | | | 45.42 | | | | .16 | | | | 5.05 | | | | 5.21 | | | | — | | | | (2.83 | ) | | | (2.83 | ) | | | 47.80 | | | | 12.03 | | | | 2,118 | | | | .82 | | | | .82 | | | | .36 | |
| Year ended 9/30/2015 | | | 48.92 | | | | .17 | | | | 1.08 | | | | 1.25 | | | | — | | | | (4.75 | ) | | | (4.75 | ) | | | 45.42 | | | | 2.50 | | | | 1,487 | | | | .82 | | | | .82 | | | | .35 | |
| Year ended 9/30/2014 | | | 49.03 | | | | .15 | | | | 2.17 | | | | 2.32 | | | | — | | | | (2.43 | ) | | | (2.43 | ) | | | 48.92 | | | | 4.72 | | | | 1,208 | | | | .81 | | | | .81 | | | | .31 | |
| Year ended 9/30/2013 | | | 39.38 | | | | .21 | | | | 10.12 | | | | 10.33 | | | | (.68 | ) | | | — | | | | (.68 | ) | | | 49.03 | | | | 26.68 | | | | 629 | | | | .82 | | | | .82 | | | | .48 | |
| Year ended 9/30/2012 | | | 31.54 | | | | .20 | | | | 7.86 | | | | 8.06 | | | | (.22 | ) | | | — | | | | (.22 | ) | | | 39.38 | | | | 25.69 | | | | 344 | | | | .83 | | | | .83 | | | | .55 | |
| Class 529-A: | | | | | | | | | | | | | | | | | | | | | | | | | | | | | | | | | | | | | | | | | | | | | | | | | | | | |
| Year ended 9/30/2016 | | | 44.63 | | | | — | 3 | | | 4.94 | | | | 4.94 | | | | — | | | | (2.83 | ) | | | (2.83 | ) | | | 46.74 | | | | 11.64 | | | | 1,024 | | | | 1.17 | | | | 1.17 | | | | — | 4 |
| Year ended 9/30/2015 | | | 48.29 | | | | — | | | | 1.09 | | | | 1.09 | | | | — | | | | (4.75 | ) | | | (4.75 | ) | | | 44.63 | | | | 2.16 | | | | 943 | | | | 1.15 | | | | 1.15 | | | | — | |
| Year ended 9/30/2014 | | | 48.59 | | | | (.03 | ) | | | 2.16 | | | | 2.13 | | | | — | | | | (2.43 | ) | | | (2.43 | ) | | | 48.29 | | | | 4.37 | | | | 933 | | | | 1.15 | | | | 1.15 | | | | (.05 | ) |
| Year ended 9/30/2013 | | | 39.03 | | | | .04 | | | | 10.05 | | | | 10.09 | | | | (.53 | ) | | | — | | | | (.53 | ) | | | 48.59 | | | | 26.18 | | | | 884 | | | | 1.19 | | | | 1.19 | | | | .09 | |
| Year ended 9/30/2012 | | | 31.27 | | | | .07 | | | | 7.80 | | | | 7.87 | | | | (.11 | ) | | | — | | | | (.11 | ) | | | 39.03 | | | | 25.22 | | | | 689 | | | | 1.19 | | | | 1.19 | | | | .19 | |
| Class 529-B: | | | | | | | | | | | | | | | | | | | | | | | | | | | | | | | | | | | | | | | | | | | | | | | | | | | | |
| Year ended 9/30/2016 | | | 41.70 | | | | (.35 | ) | | | 4.59 | | | | 4.24 | | | | — | | | | (2.83 | ) | | | (2.83 | ) | | | 43.11 | | | | 10.74 | | | | 4 | | | | 1.99 | | | | 1.99 | | | | (.87 | ) |
| Year ended 9/30/2015 | | | 45.75 | | | | (.37 | ) | | | 1.07 | | | | .70 | | | | — | | | | (4.75 | ) | | | (4.75 | ) | | | 41.70 | | | | 1.36 | | | | 10 | | | | 1.94 | | | | 1.94 | | | | (.83 | ) |
| Year ended 9/30/2014 | | | 46.52 | | | | (.42 | ) | | | 2.08 | | | | 1.66 | | | | — | | | | (2.43 | ) | | | (2.43 | ) | | | 45.75 | | | | 3.53 | | | | 17 | | | | 1.95 | | | | 1.95 | | | | (.89 | ) |
| Year ended 9/30/2013 | | | 37.30 | | | | (.30 | ) | | | 9.66 | | | | 9.36 | | | | (.14 | ) | | | — | | | | (.14 | ) | | | 46.52 | | | | 25.17 | | | | 25 | | | | 1.99 | | | | 1.99 | | | | (.73 | ) |
| Year ended 9/30/2012 | | | 30.03 | | | | (.23 | ) | | | 7.50 | | | | 7.27 | | | | — | | | | — | | | | — | | | | 37.30 | | | | 24.21 | | | | 30 | | | | 2.01 | | | | 1.99 | | | | (.68 | ) |
See page 31 for footnotes.
Financial highlights (continued)
| | | | | | Income (loss) from
investment operations1 | | | Dividends and distributions | | | | | | | | | | | | | | | | | | | |
| | | Net asset
value,
beginning
of period | | | Net
investment
income
(loss) | | | Net gains
(losses) on
securities (both
realized and
unrealized) | | | Total from
investment
operations | | | Dividends
(from net
investment
income) | | | Distributions
(from capital
gains) | | | Total
dividends
and
distributions | | | Net asset
value,
end
of period | | | Total
return2 | | | Net assets,
end of period
(in millions) | | | Ratio of
expenses to
average net
assets before
reimburse-
ments | | | Ratio of
expenses to
average net
assets after
reimburse-
ments | | | Ratio of
net income
(loss)
to average
net assets | |
| Class 529-C: | | | | | | | | | | | | | | | | | | | | | | | | | | | | | | | | | | | | | | | | | | | | | | | | | | | | |
| Year ended 9/30/2016 | | $ | 41.45 | | | $ | (.31 | ) | | $ | 4.54 | | | $ | 4.23 | | | $ | — | | | $ | (2.83 | ) | | $ | (2.83 | ) | | $ | 42.85 | | | | 10.78 | % | | $ | 286 | | | | 1.96 | % | | | 1.96 | % | | | (.78 | )% |
| Year ended 9/30/2015 | | | 45.50 | | | | (.35 | ) | | | 1.05 | | | | .70 | | | | — | | | | (4.75 | ) | | | (4.75 | ) | | | 41.45 | | | | 1.37 | | | | 274 | | | | 1.93 | | | | 1.93 | | | | (.78 | ) |
| Year ended 9/30/2014 | | | 46.27 | | | | (.40 | ) | | | 2.06 | | | | 1.66 | | | | — | | | | (2.43 | ) | | | (2.43 | ) | | | 45.50 | | | | 3.53 | | | | 280 | | | | 1.94 | | | | 1.94 | | | | (.85 | ) |
| Year ended 9/30/2013 | | | 37.20 | | | | (.29 | ) | | | 9.60 | | | | 9.31 | | | | (.24 | ) | | | — | | | | (.24 | ) | | | 46.27 | | | | 25.21 | | | | 273 | | | | 1.98 | | | | 1.98 | | | | (.70 | ) |
| Year ended 9/30/2012 | | | 29.95 | | | | (.21 | ) | | | 7.46 | | | | 7.25 | | | | — | | | | — | | | | — | | | | 37.20 | | | | 24.21 | | | | 222 | | | | 2.00 | | | | 2.00 | | | | (.62 | ) |
| Class 529-E: | | | | | | | | | | | | | | | | | | | | | | | | | | | | | | | | | | | | | | | | | | | | | | | | | | | | |
| Year ended 9/30/2016 | | | 43.63 | | | | (.09 | ) | | | 4.82 | | | | 4.73 | | | | — | | | | (2.83 | ) | | | (2.83 | ) | | | 45.53 | | | | 11.39 | | | | 53 | | | | 1.38 | | | | 1.38 | | | | (.21 | ) |
| Year ended 9/30/2015 | | | 47.41 | | | | (.11 | ) | | | 1.08 | | | | .97 | | | | — | | | | (4.75 | ) | | | (4.75 | ) | | | 43.63 | | | | 1.95 | | | | 49 | | | | 1.38 | | | | 1.38 | | | | (.23 | ) |
| Year ended 9/30/2014 | | | 47.87 | | | | (.14 | ) | | | 2.11 | | | | 1.97 | | | | — | | | | (2.43 | ) | | | (2.43 | ) | | | 47.41 | | | | 4.10 | | | | 49 | | | | 1.39 | | | | 1.39 | | | | (.30 | ) |
| Year ended 9/30/2013 | | | 38.45 | | | | (.06 | ) | | | 9.91 | | | | 9.85 | | | | (.43 | ) | | | — | | | | (.43 | ) | | | 47.87 | | | | 25.90 | | | | 48 | | | | 1.43 | | | | 1.43 | | | | (.15 | ) |
| Year ended 9/30/2012 | | | 30.79 | | | | (.03 | ) | | | 7.70 | | | | 7.67 | | | | (.01 | ) | | | — | | | | (.01 | ) | | | 38.45 | | | | 24.90 | | | | 38 | | | | 1.45 | | | | 1.45 | | | | (.07 | ) |
| Class 529-F-1: | | | | | | | | | | | | | | | | | | | | | | | | | | | | | | | | | | | | | | | | | | | | | | | | | | | | |
| Year ended 9/30/2016 | | | 44.98 | | | | .09 | | | | 4.99 | | | | 5.08 | | | | — | | | | (2.83 | ) | | | (2.83 | ) | | | 47.23 | | | | 11.85 | | | | 90 | | | | .96 | | | | .96 | | | | .22 | |
| Year ended 9/30/2015 | | | 48.53 | | | | .11 | | | | 1.09 | | | | 1.20 | | | | — | | | | (4.75 | ) | | | (4.75 | ) | | | 44.98 | | | | 2.42 | | | | 83 | | | | .93 | | | | .93 | | | | .22 | |
| Year ended 9/30/2014 | | | 48.73 | | | | .08 | | | | 2.15 | | | | 2.23 | | | | — | | | | (2.43 | ) | | | (2.43 | ) | | | 48.53 | | | | 4.57 | | | | 80 | | | | .94 | | | | .94 | | | | .16 | |
| Year ended 9/30/2013 | | | 39.14 | | | | .13 | | | | 10.07 | | | | 10.20 | | | | (.61 | ) | | | — | | | | (.61 | ) | | | 48.73 | | | | 26.43 | | | | 73 | | | | .98 | | | | .98 | | | | .30 | |
| Year ended 9/30/2012 | | | 31.35 | | | | .14 | | | | 7.83 | | | | 7.97 | | | | (.18 | ) | | | — | | | | (.18 | ) | | | 39.14 | | | | 25.51 | | | | 53 | | | | .99 | | | | .99 | | | | .39 | |
| Class R-1: | | | | | | | | | | | | | | | | | | | | | | | | | | | | | | | | | | | | | | | | | | | | | | | | | | | | |
| Year ended 9/30/2016 | | | 41.85 | | | | (.28 | ) | | | 4.60 | | | | 4.32 | | | | — | | | | (2.83 | ) | | | (2.83 | ) | | | 43.34 | | | | 10.89 | | | | 33 | | | | 1.85 | | | | 1.85 | | | | (.68 | ) |
| Year ended 9/30/2015 | | | 45.85 | | | | (.31 | ) | | | 1.06 | | | | .75 | | | | — | | | | (4.75 | ) | | | (4.75 | ) | | | 41.85 | | | | 1.48 | | | | 36 | | | | 1.82 | | | | 1.82 | | | | (.68 | ) |
| Year ended 9/30/2014 | | | 46.56 | | | | (.35 | ) | | | 2.07 | | | | 1.72 | | | | — | | | | (2.43 | ) | | | (2.43 | ) | | | 45.85 | | | | 3.66 | | | | 39 | | | | 1.82 | | | | 1.82 | | | | (.74 | ) |
| Year ended 9/30/2013 | | | 37.40 | | | | (.23 | ) | | | 9.66 | | | | 9.43 | | | | (.27 | ) | | | — | | | | (.27 | ) | | | 46.56 | | | | 25.37 | | | | 42 | | | | 1.84 | | | | 1.84 | | | | (.57 | ) |
| Year ended 9/30/2012 | | | 30.07 | | | | (.17 | ) | | | 7.50 | | | | 7.33 | | | | — | | | | — | | | | — | | | | 37.40 | | | | 24.38 | | | | 37 | | | | 1.86 | | | | 1.86 | | | | (.50 | ) |
| Class R-2: | | | | | | | | | | | | | | | | | | | | | | | | | | | | | | | | | | | | | | | | | | | | | | | | | | | | |
| Year ended 9/30/2016 | | | 41.85 | | | | (.27 | ) | | | 4.60 | | | | 4.33 | | | | — | | | | (2.83 | ) | | | (2.83 | ) | | | 43.35 | | | | 10.89 | | | | 616 | | | | 1.84 | | | | 1.84 | | | | (.67 | ) |
| Year ended 9/30/2015 | | | 45.84 | | | | (.29 | ) | | | 1.05 | | | | .76 | | | | — | | | | (4.75 | ) | | | (4.75 | ) | | | 41.85 | | | | 1.53 | | | | 632 | | | | 1.79 | | | | 1.79 | | | | (.65 | ) |
| Year ended 9/30/2014 | | | 46.56 | | | | (.35 | ) | | | 2.06 | | | | 1.71 | | | | — | | | | (2.43 | ) | | | (2.43 | ) | | | 45.84 | | | | 3.64 | | | | 689 | | | | 1.83 | | | | 1.83 | | | | (.75 | ) |
| Year ended 9/30/2013 | | | 37.39 | | | | (.23 | ) | | | 9.67 | | | | 9.44 | | | | (.27 | ) | | | — | | | | (.27 | ) | | | 46.56 | | | | 25.41 | | | | 736 | | | | 1.83 | | | | 1.83 | | | | (.55 | ) |
| Year ended 9/30/2012 | | | 30.07 | | | | (.18 | ) | | | 7.50 | | | | 7.32 | | | | — | | | | — | | | | — | | | | 37.39 | | | | 24.34 | | | | 647 | | | | 1.89 | | | | 1.89 | | | | (.52 | ) |
| Class R-2E: | | | | | | | | | | | | | | | | | | | | | | | | | | | | | | | | | | | | | | | | | | | | | | | | | | | | |
| Year ended 9/30/2016 | | | 45.04 | | | | (.08 | ) | | | 4.94 | | | | 4.86 | | | | — | | | | (2.83 | ) | | | (2.83 | ) | | | 47.07 | | | | 11.32 | | | | 6 | | | | 1.51 | | | | 1.51 | | | | (.20 | ) |
| Year ended 9/30/2015 | | | 48.67 | | | | .01 | | | | 1.11 | | | | 1.12 | | | | — | | | | (4.75 | ) | | | (4.75 | ) | | | 45.04 | | | | 2.23 | 5 | | | — | 6 | | | 1.26 | 5 | | | 1.26 | 5 | | | .01 | 5 |
| Period from 8/29/2014 to 9/30/20147,8 | | | 50.83 | | | | (.01 | ) | | | (2.15 | ) | | | (2.16 | ) | | | — | | | | — | | | | — | | | | 48.67 | | | | (4.25 | )5,9 | | | — | 6 | | | .08 | 5,9 | | | .08 | 5,9 | | | (.01 | )5,9 |
| Class R-3: | | | | | | | | | | | | | | | | | | | | | | | | | | | | | | | | | | | | | | | | | | | | | | | | | | | | |
| Year ended 9/30/2016 | | | 43.56 | | | | (.09 | ) | | | 4.81 | | | | 4.72 | | | | — | | | | (2.83 | ) | | | (2.83 | ) | | | 45.45 | | | | 11.41 | | | | 783 | | | | 1.39 | | | | 1.39 | | | | (.22 | ) |
| Year ended 9/30/2015 | | | 47.34 | | | | (.10 | ) | | | 1.07 | | | | .97 | | | | — | | | | (4.75 | ) | | | (4.75 | ) | | | 43.56 | | | | 1.93 | | | | 776 | | | | 1.37 | | | | 1.37 | | | | (.22 | ) |
| Year ended 9/30/2014 | | | 47.79 | | | | (.14 | ) | | | 2.12 | | | | 1.98 | | | | — | | | | (2.43 | ) | | | (2.43 | ) | | | 47.34 | | | | 4.12 | | | | 811 | | | | 1.39 | | | | 1.39 | | | | (.30 | ) |
| Year ended 9/30/2013 | | | 38.39 | | | | (.05 | ) | | | 9.89 | | | | 9.84 | | | | (.44 | ) | | | — | | | | (.44 | ) | | | 47.79 | | | | 25.90 | | | | 836 | | | | 1.40 | | | | 1.40 | | | | (.12 | ) |
| Year ended 9/30/2012 | | | 30.73 | | | | (.02 | ) | | | 7.68 | | | | 7.66 | | | | — | | | | — | | | | — | | | | 38.39 | | | | 24.92 | | | | 694 | | | | 1.42 | | | | 1.42 | | | | (.05 | ) |
| | | | | | Income (loss) from
investment operations1 | | | Dividends and distributions | | | | | | | | | | | | | | | | | | | |
| | | Net asset
value,
beginning
of period | | | Net
investment
income
(loss) | | | Net gains
(losses) on
securities (both
realized and
unrealized) | | | Total from
investment
operations | | | Dividends
(from net
investment
income) | | | Distributions
(from capital
gains) | | | Total
dividends
and
distributions | | | Net asset
value,
end
of period | | | Total
return2 | | | Net assets,
end of period
(in millions) | | | Ratio of
expenses to
average net
assets before
reimburse-
ments | | | Ratio of
expenses to
average net
assets after
reimburse-
ments | | | Ratio of
net income
(loss)
to average
net assets | |
| Class R-4: | | | | | | | | | | | | | | | | | | | | | | | | | | | | | | | | | | | | | | | | | | | | | | | | | | | | |
| Year ended 9/30/2016 | | $ | 44.71 | | | $ | .04 | | | $ | 4.97 | | | $ | 5.01 | | | $ | — | | | $ | (2.83 | ) | | $ | (2.83 | ) | | $ | 46.89 | | | | 11.76 | % | | $ | 764 | | | | 1.07 | % | | | 1.07 | % | | | .10 | % |
| Year ended 9/30/2015 | | | 48.33 | | | | .05 | | | | 1.08 | | | | 1.13 | | | | — | | | | (4.75 | ) | | | (4.75 | ) | | | 44.71 | | | | 2.27 | | | | 715 | | | | 1.05 | | | | 1.05 | | | | .10 | |
| Year ended 9/30/2014 | | | 48.59 | | | | .02 | | | | 2.15 | | | | 2.17 | | | | — | | | | (2.43 | ) | | | (2.43 | ) | | | 48.33 | | | | 4.46 | | | | 727 | | | | 1.06 | | | | 1.06 | | | | .03 | |
| Year ended 9/30/2013 | | | 39.03 | | | | .09 | | | | 10.04 | | | | 10.13 | | | | (.57 | ) | | | — | | | | (.57 | ) | | | 48.59 | | | | 26.31 | | | | 712 | | | | 1.07 | | | | 1.07 | | | | .21 | |
| Year ended 9/30/2012 | | | 31.25 | | | | .11 | | | | 7.80 | | | | 7.91 | | | | (.13 | ) | | | — | | | | (.13 | ) | | | 39.03 | | | | 25.38 | | | | 550 | | | | 1.08 | | | | 1.08 | | | | .30 | |
| Class R-5E: | | | | | | | | | | | | | | | | | | | | | | | | | | | | | | | | | | | | | | | | | | | | | | | | | | | | |
| Period from 11/20/2015 to 9/30/20167,10 | | | 47.09 | | | | .12 | | | | 2.92 | | | | 3.04 | | | | — | | | | (2.83 | ) | | | (2.83 | ) | | | 47.30 | | | | 7.01 | 9 | | | — | 6 | | | .96 | 11 | | | .95 | 11 | | | .32 | 11 |
| Class R-5: | | | | | | | | | | | | | | | | | | | | | | | | | | | | | | | | | | | | | | | | | | | | | | | | | | | | |
| Year ended 9/30/2016 | | | 45.94 | | | | .18 | | | | 5.11 | | | | 5.29 | | | | — | | | | (2.83 | ) | | | (2.83 | ) | | | 48.40 | | | | 12.09 | | | | 359 | | | | .77 | | | | .77 | | | | .41 | |
| Year ended 9/30/2015 | | | 49.39 | | | | .20 | | | | 1.10 | | | | 1.30 | | | | — | | | | (4.75 | ) | | | (4.75 | ) | | | 45.94 | | | | 2.57 | | | | 474 | | | | .75 | | | | .75 | | | | .40 | |
| Year ended 9/30/2014 | | | 49.46 | | | | .15 | | | | 2.21 | | | | 2.36 | | | | — | | | | (2.43 | ) | | | (2.43 | ) | | | 49.39 | | | | 4.78 | | | | 452 | | | | .76 | | | | .76 | | | | .29 | |
| Year ended 9/30/2013 | | | 39.71 | | | | .22 | | | | 10.22 | | | | 10.44 | | | | (.69 | ) | | | — | | | | (.69 | ) | | | 49.46 | | | | 26.72 | | | | 550 | | | | .77 | | | | .77 | | | | .51 | |
| Year ended 9/30/2012 | | | 31.80 | | | | .22 | | | | 7.93 | | | | 8.15 | | | | (.24 | ) | | | — | | | | (.24 | ) | | | 39.71 | | | | 25.77 | | | | 384 | | | | .78 | | | | .78 | | | | .60 | |
| Class R-6: | | | | | | | | | | | | | | | | | | | | | | | | | | | | | | | | | | | | | | | | | | | | | | | | | | | | |
| Year ended 9/30/2016 | | | 45.49 | | | | .21 | | | | 5.06 | | | | 5.27 | | | | — | | | | (2.83 | ) | | | (2.83 | ) | | | 47.93 | | | | 12.15 | | | | 3,403 | | | | .71 | | | | .71 | | | | .48 | |
| Year ended 9/30/2015 | | | 48.93 | | | | .22 | | | | 1.09 | | | | 1.31 | | | | — | | | | (4.75 | ) | | | (4.75 | ) | | | 45.49 | | | | 2.63 | | | | 2,269 | | | | .71 | | | | .71 | | | | .45 | |
| Year ended 9/30/2014 | | | 49.00 | | | | .21 | | | | 2.15 | | | | 2.36 | | | | — | | | | (2.43 | ) | | | (2.43 | ) | | | 48.93 | | | | 4.82 | | | | 1,859 | | | | .71 | | | | .71 | | | | .41 | |
| Year ended 9/30/2013 | | | 39.34 | | | | .25 | | | | 10.12 | | | | 10.37 | | | | (.71 | ) | | | — | | | | (.71 | ) | | | 49.00 | | | | 26.80 | | | | 1,206 | | | | .72 | | | | .72 | | | | .57 | |
| Year ended 9/30/2012 | | | 31.52 | | | | .24 | | | | 7.84 | | | | 8.08 | | | | (.26 | ) | | | — | | | | (.26 | ) | | | 39.34 | | | | 25.79 | | | | 768 | | | | .73 | | | | .73 | | | | .67 | |
| | Year ended September 30 |
| | 2016 | 2015 | 2014 | 2013 | 2012 |
| Portfolio turnover rate for all share classes | 29% | 33% | 38% | 37% | 35% |
| 1 | Based on average shares outstanding. |
| 2 | Total returns exclude any applicable sales charges, including contingent deferred sales charges. |
| 3 | Amount less than $.01. |
| 4 | Amount less than .01%. |
| 5 | All or a significant portion of assets in this class consisted of seed capital invested by CRMC and/or its affiliates. Fees for distribution services are not charged or accrued on these seed capital assets. If such fees were paid by the fund on seed capital assets, fund expenses would have been higher and net income and total return would have been lower. |
| 6 | Amount less than $1 million. |
| 7 | Based on operations for the period shown and, accordingly, is not representative of a full year. |
| 8 | Class R-2E shares were offered beginning August 29, 2014. |
| 9 | Not annualized. |
| 10 | Class R-5E shares were offered beginning November 20, 2015. |
| 11 | Annualized. |
See Notes to Financial Statements
Report of Independent Registered Public Accounting Firm
To the Shareholders and Board of Directors of SMALLCAP World Fund, Inc.:
We have audited the accompanying statement of assets and liabilities of SMALLCAP World Fund, Inc. (the “Fund”), including the summary investment portfolio, as of September 30, 2016, and the related statement of operations for the year then ended, the statements of changes in net assets for each of the two years in the period then ended, and the financial highlights for each of the periods presented. These financial statements and financial highlights are the responsibility of the Fund’s management. Our responsibility is to express an opinion on these financial statements and financial highlights based on our audits.
We conducted our audits in accordance with the standards of the Public Company Accounting Oversight Board (United States). Those standards require that we plan and perform the audit to obtain reasonable assurance about whether the financial statements and financial highlights are free of material misstatement. The Fund is not required to have, nor were we engaged to perform, an audit of its internal control over financial reporting. Our audits included consideration of internal control over financial reporting as a basis for designing audit procedures that are appropriate in the circumstances, but not for the purpose of expressing an opinion on the effectiveness of the Fund’s internal control over financial reporting. Accordingly, we express no such opinion. An audit also includes examining, on a test basis, evidence supporting the amounts and disclosures in the financial statements, assessing the accounting principles used and significant estimates made by management, as well as evaluating the overall financial statement presentation. Our procedures included confirmation of securities owned as of September 30, 2016, by correspondence with the custodian and brokers; where replies were not received from brokers, we performed other auditing procedures. We believe that our audits provide a reasonable basis for our opinion.
In our opinion, such financial statements and financial highlights referred to above present fairly, in all material respects, the financial position of SMALLCAP World Fund, Inc. as of September 30, 2016, the results of its operations for the year then ended, the changes in its net assets for each of the two years in the period then ended, and the financial highlights for each of the periods presented, in conformity with accounting principles generally accepted in the United States of America.
Deloitte & Touche LLP
Costa Mesa, California
November 11, 2016
As a fund shareholder, you incur two types of costs: (1) transaction costs, such as initial sales charges on purchase payments and contingent deferred sales charges on redemptions (loads), and (2) ongoing costs, including management fees, distribution and service (12b-1) fees, and other expenses. This example is intended to help you understand your ongoing costs (in dollars) of investing in the fund so you can compare these costs with the ongoing costs of investing in other mutual funds. The example is based on an investment of $1,000 invested at the beginning of the period and held for the entire six-month period (April 1, 2016, through September 30, 2016).
Actual expenses:
The first line of each share class in the table on the following page provides information about actual account values and actual expenses. You may use the information in this line, together with the amount you invested, to estimate the expenses that you paid over the period. Simply divide your account value by $1,000 (for example, an $8,600 account value divided by $1,000 = 8.6), then multiply the result by the number in the first line under the heading entitled “Expenses paid during period” to estimate the expenses you paid on your account during this period.
Hypothetical example for comparison purposes:
The second line of each share class in the table on the following page provides information about hypothetical account values and hypothetical expenses based on the actual expense ratio for the share class and an assumed rate of return of 5.00% per year before expenses, which is not the actual return of the share class. The hypothetical account values and expenses may not be used to estimate the actual ending account balance or expenses you paid for the period. You may use this information to compare the ongoing costs of investing in the fund and other funds. To do so, compare this 5.00% hypothetical example with the 5.00% hypothetical examples that appear in the shareholder reports of the other funds.
Notes:
Retirement plan participants may be subject to certain fees charged by the plan sponsor, and Class F-1, F-2 and 529-F-1 shareholders may be subject to fees charged by financial intermediaries, typically ranging from 0.75% to 1.50% of assets annually depending on services offered. You can estimate the impact of these fees by adding the amount of the fees to the total estimated expenses you paid on your account during the period as calculated above. In addition, your ending account value would be lower by the amount of these fees.
Note that the expenses shown in the table on the following page are meant to highlight your ongoing costs only and do not reflect any transactional costs, such as sales charges (loads). Therefore, the second line of each share class in the table is useful in comparing ongoing costs only and will not help you determine the relative total costs of owning different funds. In addition, if these transactional costs were included, your costs would have been higher.
| | | Beginning | | | Ending | | | | | | | |
| | | account value | | | account value | | | Expenses paid | | | Annualized | |
| | | 4/1/2016 | | | 9/30/2016 | | | during period* | | | expense ratio | |
| Class A - actual return | | $ | 1,000.00 | | | $ | 1,114.68 | | | $ | 5.83 | | | | 1.10 | % |
| Class A - assumed 5% return | | | 1,000.00 | | | | 1,019.55 | | | | 5.57 | | | | 1.10 | |
| Class B - actual return | | | 1,000.00 | | | | 1,110.43 | | | | 9.89 | | | | 1.87 | |
| Class B - assumed 5% return | | | 1,000.00 | | | | 1,015.69 | | | | 9.45 | | | | 1.87 | |
| Class C - actual return | | | 1,000.00 | | | | 1,110.28 | | | | 10.00 | | | | 1.89 | |
| Class C - assumed 5% return | | | 1,000.00 | | | | 1,015.59 | | | | 9.55 | | | | 1.89 | |
| Class F-1 - actual return | | | 1,000.00 | | | | 1,114.70 | | | | 5.88 | | | | 1.11 | |
| Class F-1 - assumed 5% return | | | 1,000.00 | | | | 1,019.50 | | | | 5.62 | | | | 1.11 | |
| Class F-2 - actual return | | | 1,000.00 | | | | 1,116.32 | | | | 4.35 | | | | .82 | |
| Class F-2 - assumed 5% return | | | 1,000.00 | | | | 1,020.96 | | | | 4.15 | | | | .82 | |
| Class 529-A - actual return | | | 1,000.00 | | | | 1,114.47 | | | | 6.15 | | | | 1.16 | |
| Class 529-A - assumed 5% return | | | 1,000.00 | | | | 1,019.25 | | | | 5.87 | | | | 1.16 | |
| Class 529-B - actual return | | | 1,000.00 | | | | 1,109.95 | | | | 10.42 | | | | 1.97 | |
| Class 529-B - assumed 5% return | | | 1,000.00 | | | | 1,015.19 | | | | 9.95 | | | | 1.97 | |
| Class 529-C - actual return | | | 1,000.00 | | | | 1,110.11 | | | | 10.26 | | | | 1.94 | |
| Class 529-C - assumed 5% return | | | 1,000.00 | | | | 1,015.34 | | | | 9.80 | | | | 1.94 | |
| Class 529-E - actual return | | | 1,000.00 | | | | 1,113.21 | | | | 7.26 | | | | 1.37 | |
| Class 529-E - assumed 5% return | | | 1,000.00 | | | | 1,018.20 | | | | 6.93 | | | | 1.37 | |
| Class 529-F-1 - actual return | | | 1,000.00 | | | | 1,115.48 | | | | 5.04 | | | | .95 | |
| Class 529-F-1 - assumed 5% return | | | 1,000.00 | | | | 1,020.31 | | | | 4.81 | | | | .95 | |
| Class R-1 - actual return | | | 1,000.00 | | | | 1,110.72 | | | | 9.74 | | | | 1.84 | |
| Class R-1 - assumed 5% return | | | 1,000.00 | | | | 1,015.84 | | | | 9.30 | | | | 1.84 | |
| Class R-2 - actual return | | | 1,000.00 | | | | 1,110.97 | | | | 9.58 | | | | 1.81 | |
| Class R-2 - assumed 5% return | | | 1,000.00 | | | | 1,015.99 | | | | 9.15 | | | | 1.81 | |
| Class R-2E - actual return | | | 1,000.00 | | | | 1,112.50 | | | | 8.10 | | | | 1.53 | |
| Class R-2E - assumed 5% return | | | 1,000.00 | | | | 1,017.40 | | | | 7.74 | | | | 1.53 | |
| Class R-3 - actual return | | | 1,000.00 | | | | 1,113.43 | | | | 7.31 | | | | 1.38 | |
| Class R-3 - assumed 5% return | | | 1,000.00 | | | | 1,018.15 | | | | 6.98 | | | | 1.38 | |
| Class R-4 - actual return | | | 1,000.00 | | | | 1,114.86 | | | | 5.73 | | | | 1.08 | |
| Class R-4 - assumed 5% return | | | 1,000.00 | | | | 1,019.65 | | | | 5.47 | | | | 1.08 | |
| Class R-5E - actual return | | | 1,000.00 | | | | 1,115.57 | | | | 5.09 | | | | .96 | |
| Class R-5E - assumed 5% return | | | 1,000.00 | | | | 1,020.26 | | | | 4.86 | | | | .96 | |
| Class R-5 - actual return | | | 1,000.00 | | | | 1,116.49 | | | | 4.09 | | | | .77 | |
| Class R-5 - assumed 5% return | | | 1,000.00 | | | | 1,021.21 | | | | 3.90 | | | | .77 | |
| Class R-6 - actual return | | | 1,000.00 | | | | 1,117.01 | | | | 3.77 | | | | .71 | |
| Class R-6 - assumed 5% return | | | 1,000.00 | | | | 1,021.51 | | | | 3.60 | | | | .71 | |
| * | The “expenses paid during period” are equal to the “annualized expense ratio,” multiplied by the average account value over the period, multiplied by the number of days in the period, and divided by 365 (to reflect the one-half year period). |
We are required to advise you of the federal tax status of certain distributions received by shareholders during the fiscal year. The fund hereby designates the following amounts for the fund’s fiscal year ended September 30, 2016:
| Foreign taxes | $ | 0.03 per share |
| Foreign source income | $ | 0.42 per share |
| Long-term capital gains | $ | 1,672,921,000 |
| Qualified dividend income | | 100% |
| Corporate dividends received deduction | | 100% |
| U.S. government income that may be exempt from state taxation | $ | 521,000 |
Individual shareholders should refer to their Form 1099 or other tax information, which will be mailed in January 2017, to determine the calendar year amounts to be included on their 2016 tax returns. Shareholders should consult their tax advisors.
Approval of Investment Advisory and Service Agreement
The SMALLCAP World Fund board has approved the fund’s Investment Advisory and Service Agreement (the “agreement”) with Capital Research and Management Company (“CRMC”) for an additional one-year term through November 30, 2017. The board approved the agreement following the recommendation of the fund’s Contracts Committee (the “committee”), which is composed of all of the fund’s independent board members. The board and the committee determined that the fund’s advisory fee structure was fair and reasonable in relation to the services provided, and that approving the agreement was in the best interests of the fund and its shareholders.
In reaching this decision, the board and the committee took into account information furnished to them throughout the year and otherwise provided to them, as well as information prepared specifically in connection with their review of the agreement, and were advised by their independent counsel. They considered the following factors, among others, but did not identify any single issue or particular piece of information that, in isolation, was the controlling factor, and each board and committee member did not necessarily attribute the same weight to each factor.
1. Nature, extent and quality of services
The board and the committee considered the depth and quality of CRMC’s investment management process, including its global research capabilities; the experience, capability and integrity of its senior management and other personnel; the low turnover rates of its key personnel; the overall financial strength and stability of CRMC and the Capital Group organization; and the ongoing evolution of CRMC’s organizational structure designed to maintain and strengthen these qualities. The board and the committee also considered the nature, extent and quality of administrative, compliance and shareholder services provided by CRMC to the fund under the agreement and other agreements, as well as the benefits to fund shareholders from investing in a fund that is part of a large family of funds. The board and the committee concluded that the nature, extent and quality of the services provided by CRMC have benefited and should continue to benefit the fund and its shareholders.
2. Investment results
The board and the committee considered the investment results of the fund in light of its objective of long term growth of capital. They compared the fund’s investment results with those of other funds (including funds that currently form the basis of the Lipper index for the category in which the fund is included), and data such as relevant market and fund indexes, over various periods through March 31, 2016. This report, including the letter to shareholders and related disclosures, contains certain information about the fund’s investment results. The board and the committee reviewed the fund’s investment results measured against various indexes and an average, including the MSCI All Country World Small Cap Index, Lipper Global Small-/Mid-Cap Funds Index and Lipper Global Small-/ Mid-Cap Funds Average. They noted that the investment results of the fund generally compared favorably to the results of these indexes/average for the lifetime period, 20-year period, 10-year period, and five-year period (where data comparisons are available), while recognizing that none of the indexes/average is a perfect comparison given the Fund’s distinguishing characteristics. The board and the committee concluded that the fund’s investment results have been satisfactory for renewal of the agreement and that CRMC’s record in managing the fund indicated that its continued management should benefit the fund and its shareholders.
3. Advisory fees and total expenses
The board and the committee compared the advisory fees and total expense levels of the fund to those of other relevant funds. They observed that the fund’s advisory fees and expenses generally compared favorably to those of other similar funds included in the Lipper Global Small-/Mid-Cap Funds category. The board and the committee also considered the breakpoint discounts in the fund’s advisory fee structure that reduce the level of fees charged by CRMC to the fund as fund assets increase. In addition, they reviewed information regarding the effective advisory fees charged to non-mutual fund clients by CRMC and its affiliates. They noted that, to the extent there were differences between the advisory fees paid by the fund and the advisory fees paid by those clients, the differences appropriately reflected the investment, operational, regulatory and market differences between advising the fund and the other clients. The board and the committee concluded that the fund’s cost structure was fair and reasonable in relation to the services provided, and that the fund’s shareholders receive reasonable value in return for the advisory fees and other amounts paid to CRMC by the fund.
4. Ancillary benefits
The board and the committee considered a variety of other benefits that CRMC and its affiliates receive as a result of CRMC’s relationship with the fund and the other American Funds, including fees for administrative services provided to certain share classes; fees paid to CRMC’s affiliated transfer agent; sales charges and distribution fees received and retained by the fund’s principal underwriter, an affiliate of CRMC; and possible ancillary benefits to CRMC and its institutional management affiliates in managing other investment vehicles. The board and the committee reviewed CRMC’s portfolio trading practices, noting the benefits CRMC receives from the research obtained with commissions from portfolio transactions made on behalf of the fund. The board and the committee took these ancillary benefits into account in evaluating the reasonableness of the advisory fees and other amounts paid to CRMC by the fund.
5. Adviser financial information
The board and the committee reviewed information regarding CRMC’s costs of providing services to the American Funds, including personnel, systems and resources of investment, compliance, trading, accounting and other administrative operations. They considered CRMC’s costs and related cost allocation methodology as well as its willingness to invest in technology, infrastructure and staff to maintain and expand services and capabilities, respond to industry and regulatory developments, and attract and retain qualified personnel. They noted information regarding the compensation structure for CRMC’s investment professionals. The board and the committee also compared CRMC’s profitability and compensation data to the reported results and data of several large, publicly held investment management companies. The board and the committee noted the competitiveness and cyclicality of both the mutual fund industry and the capital markets, and the importance in that environment of CRMC’s long-term profitability for maintaining its independence, company culture and management continuity. They further considered the breakpoint discounts in the fund’s advisory fee structure. The board and the committee concluded that the fund’s advisory fee structure reflected a reasonable sharing of benefits between CRMC and the fund’s shareholders.
Board of directors and other officers
Independent directors1
| Name and year of birth | | Year first
elected
a director
of the fund2 | | Principal occupation(s) during past five years | | Number of
portfolios in fund
complex overseen
by director3 | | Other directorships4
held by director |
| Ronald P. Badie, 1942 | | 2010 | | Retired; former Vice Chairman, Deutsche Bank Alex. Brown (retired 2002) | | 3 | | Amphenol Corporation; Nautilus, Inc. |
| Joseph C. Berenato, 1946 | | 2000 | | Former Chairman and CEO, Ducommun Incorporated (aerospace components manufacturer) | | 15 | | Ducommun Incorporated |
| Louise H. Bryson, 1944 | | 2010 | | Chair Emerita of the Board of Trustees, J. Paul Getty Trust; former President, Distribution, Lifetime Entertainment Network (retired 2008); former Executive Vice President and General Manager, Lifetime Movie Network (retired 2008) | | 7 | | None |
| Robert J. Denison, 1941 | | 2010 | | Chair, First Security Management (private investment) | | 6 | | None |
Mary Anne Dolan, 1947
Chairman of the Board
(Independent and Non-Executive) | | 2008 | | Founder and President, MAD Ink (communications company) | | 10 | | None |
| John G. Freund, 1953 | | 2000 | | Founder and Managing Director, Skyline Ventures (venture capital investor in health care companies) | | 6 | | Collegium Pharmaceutical, Inc.; Proteon Therapeutics, Inc.; Tetraphase Pharmaceuticals, Inc. |
| Linda Griego, 1947 | | 2015 | | President and CEO, Griego Enterprises, Inc. (business management company) | | 7 | | AECOM Technology Corporation; CBS Corporation |
| Leonade D. Jones, 1947 | | 1995 | | Retired; former Treasurer, The Washington Post Company (retired 1996) | | 10 | | None |
| William H. Kling, 1942 | | 1990 | | President Emeritus and former CEO, American Public Media | | 10 | | None |
| Kenneth M. Simril, 1965 | | 2016 | | President and CEO, Fleischmann’s Ingredients and SCI Ingredients Holdings, Inc. (food manufacturing) | | 3 | | None |
| Christopher E. Stone, 1956 | | 2007 | | President, Open Society Foundations; former Professor of the Practice of Criminal Justice, John F. Kennedy School of Government, Harvard University | | 6 | | None |
Interested directors5,6
Name, year of birth and
position with fund | | Year first
elected
a director
or officer
of the fund2 | | Principal occupation(s) during past five years
and positions held with affiliated entities or
the principal underwriter of the fund | | Number of
portfolios in fund
complex overseen
by director3 | | Other directorships4
held by director |
Jonathan Knowles, PhD, 1961
Vice Chairman of the Board | | 2000 | | Partner — Capital World Investors, Capital International, Inc.;7 Director, The Capital Group Companies, Inc.7 | | 1 | | None |
Gregory W. Wendt, 1961
President | | 1992 | | Partner — Capital Research Global Investors, Capital Research and Management Company | | 1 | | None |
The fund’s statement of additional information includes further details about fund directors and is available without charge upon request by calling American Funds Service Company at (800) 421-4225 or by visiting the American Funds website at americanfunds.com. The address for all directors and officers of the fund is 333 South Hope Street, Los Angeles, CA 90071, Attention: Secretary.
Other officers6
Name, year of birth and
position with fund | | Year first
elected
an officer
of the fund2 | | Principal occupation(s) during past five years and positions held with affiliated entities
or the principal underwriter of the fund |
Paul F. Roye, 1953
Executive Vice President | | 2007 | | Director, Capital Research and Management Company;
Senior Vice President and Senior Counsel — Fund Business Management Group,
Capital Research and Management Company |
Brady L. Enright, 1967
Senior Vice President | | 2004 | | Partner — Capital World Investors, Capital Research and Management Company;
Director, Capital Research and Management Company |
J. Blair Frank, 1966
Senior Vice President | | 1999 | | Partner — Capital Research Global Investors, Capital Research and Management Company |
Lawrence Kymisis, 1970
Senior Vice President | | 2008 | | Partner — Capital Research Global Investors, Capital Research Company7 |
Julian N. Abdey, 1972
Vice President | | 2014 | | Partner — Capital World Investors, Capital Research and Management Company |
Walter R. Burkley, 1966
Vice President | | 2007 | | Senior Vice President and Senior Counsel — Fund Business Management Group,
Capital Research and Management Company; Director, Capital Research Company7 |
Bradford F. Freer, 1969
Vice President | | 2008 | | Partner — Capital World Investors, Capital Research and Management Company |
Michael W. Stockton, 1967
Secretary | | 2014 | | Vice President — Fund Business Management Group, Capital Research and Management Company |
Kimberley H. Monasterio, 1963
Treasurer | | 2016 | | Vice President — Investment Operations, Capital Research and Management Company |
Julie E. Lawton, 1973
Assistant Secretary | | 2010 | | Assistant Vice President — Fund Business Management Group, Capital Research and Management Company; Secretary, Capital Research Company7 |
Brian C. Janssen, 1972
Assistant Treasurer | | 2016 | | Vice President — Investment Operations, Capital Research and Management Company |
Dori Laskin, 1951
Assistant Treasurer | | 2011 | | Vice President — Investment Operations, Capital Research and Management Company |
| 1 | The term independent director refers to a director who is not an “interested person” of the fund within the meaning of the Investment Company Act of 1940. |
| 2 | Directors and officers of the fund serve until their resignation, removal or retirement. |
| 3 | Funds managed by Capital Research and Management Company or its affiliates. |
| 4 | This includes all directorships/trusteeships (other than those in the American Funds or other funds managed by Capital Research and Management Company or its affiliates) that are held by each trustee as a trustee or director of a public company or a registered investment company. |
| 5 | The term interested trustee refers to a trustee who is an “interested person” within the meaning of the Investment Company Act of 1940, on the basis of their affiliation with the fund’s investment adviser, Capital Research and Management Company, or affiliated entities (including the fund’s principal underwriter). |
| 6 | All of the directors/trustees and/or officers listed, with the exception of Julian N. Abdey, J. Blair Frank and Lawrence Kymisis, are officers and/or directors/trustees of one or more of the other funds for which Capital Research and Management Company serves as investment adviser. |
| 7 | Company affiliated with Capital Research and Management Company. |
Offices of the fund and of the investment adviser
Capital Research and Management Company
333 South Hope Street
Los Angeles, CA 90071-1406
6455 Irvine Center Drive
Irvine, CA 92618-4518
Transfer agent for shareholder accounts
American Funds Service Company
(Write to the address near you.)
P.O. Box 6007
Indianapolis, IN 46206-6007
P.O. Box 2280
Norfolk, VA 23501-2280
Custodian of assets
State Street Bank and Trust Company
One Lincoln Street
Boston, MA 02111
Counsel
Dechert LLP
One Bush Street, Suite 1600
San Francisco, CA 94104-4446
Independent registered public accounting firm
Deloitte & Touche LLP
695 Town Center Drive
Suite 1200
Costa Mesa, CA 92626-7188
Principal underwriter
American Funds Distributors, Inc.
333 South Hope Street
Los Angeles, CA 90071-1406
Investors should carefully consider investment objectives, risks, charges and expenses. This and other important information is contained in the fund prospectus and summary prospectus, which can be obtained from your financial professional and should be read carefully before investing. You may also call American Funds Service Company (AFS) at (800) 421-4225 or visit the American Funds website at americanfunds.com.
“American Funds Proxy Voting Procedures and Principles” — which describes how we vote proxies relating to portfolio securities — is available on the American Funds website or upon request by calling AFS. The fund files its proxy voting record with the U.S. Securities and Exchange Commission (SEC) for the 12 months ended June 30 by August 31. The proxy voting record is available free of charge on the SEC website at sec.gov and on the American Funds website.
A complete September 30, 2016, portfolio of SMALLCAP World Fund’s investments is available free of charge by calling AFS or visiting the SEC website (where it is part of Form N-CSR).
SMALLCAP World Fund files a complete list of its portfolio holdings with the SEC for the first and third quarters of each fiscal year on Form N-Q. This filing is available free of charge on the SEC website. You may also review or, for a fee, copy this filing at the SEC’s Public Reference Room in Washington, D.C. Additional information regarding the operation of the Public Reference Room may be obtained by calling the SEC’s Office of Investor Education and Advocacy at (800) SEC-0330. Additionally, the list of portfolio holdings is available by calling AFS.
This report is for the information of shareholders of SMALLCAP World Fund, but it also may be used as sales literature when preceded or accompanied by the current prospectus or summary prospectus, which gives details about charges, expenses, investment objectives and operating policies of the fund. If used as sales material after December 31, 2016, this report must be accompanied by an American Funds statistical update for the most recently completed calendar quarter.
MSCI has not approved, reviewed or produced this report, makes no express or implied warranties or representations and is not liable whatsoever for any data in the report. You may not redistribute the MSCI data or use it as a basis for other indices or investment products.
The American Funds Advantage®
Since 1931, American Funds, part of Capital Group, has helped investors pursue long-term investment success. Our consistent approach — in combination with The Capital SystemSM — has resulted in a superior long-term track record.
Aligned with investor success
We base our decisions on a long-term perspective, which we believe aligns our goals with the interests of our clients. Our portfolio managers average 27 years of investment experience, including 22 years at our company, reflecting a career commitment to our long-term approach.1
The Capital SystemSM
The Capital System combines individual accountability with teamwork. Funds using The Capital System are divided into portions that are managed independently by investment professionals with diverse backgrounds, ages and investment approaches. An extensive global research effort is the backbone of our system.
Superior long-term track record
Our equity funds have beaten their Lipper peer indexes in 91% of 10-year periods and 95% of 20-year periods. Our fixed income funds have beaten their Lipper indexes in 58% of 10-year periods and 58% of 20-year periods.2 Our fund management fees have been among the lowest in the industry.3
| 1 | Portfolio manager experience as of December 31, 2015. |
| 2 | Based on Class A share results for rolling periods through December 31, 2015. Periods covered are the shorter of the fund’s lifetime or since the comparable Lipper index inception date (except Capital Income Builder and SMALLCAP World Fund, for which the Lipper average was used). |
| 3 | On average, our management fees were in the lowest quintile 68% of the time, based on the 20-year period ended December 31, 2015, versus comparable Lipper categories, excluding funds of funds. |

ITEM 2 – Code of Ethics
The Registrant has adopted a Code of Ethics that applies to its Principal Executive Officer and Principal Financial Officer. The Registrant undertakes to provide to any person without charge, upon request, a copy of the Code of Ethics. Such request can be made to American Funds Service Company at 800/421-9225 or to the Secretary of the Registrant, 6455 Irvine Center Drive, Irvine, California 92618.
ITEM 3 – Audit Committee Financial Expert
The Registrant’s board has determined that Ronald P. Badie, a member of the Registrant’s audit committee, is an “audit committee financial expert” and "independent," as such terms are defined in this Item. This designation will not increase the designee’s duties, obligations or liability as compared to his or her duties, obligations and liability as a member of the audit committee and of the board, nor will it reduce the responsibility of the other audit committee members. There may be other individuals who, through education or experience, would qualify as "audit committee financial experts" if the board had designated them as such. Most importantly, the board believes each member of the audit committee contributes significantly to the effective oversight of the Registrant’s financial statements and condition.
ITEM 4 – Principal Accountant Fees and Services
| | Registrant: |
| | | a) Audit Fees: |
| | | | 2015 | $159,000 |
| | | | 2016 | $169,000 |
| | | | |
| | | b) Audit-Related Fees: |
| | | | 2015 | $ 10,000 |
| | | | 2016 | $ 9,000 |
| | | | The audit-related fees consist of assurance and related services relating to the examination of the Registrant’s investment adviser conducted in accordance with Statement on Standards for Attestation Engagements Number 16 issued by the American Institute of Certified Public Accountants. |
| | | | |
| | | c) Tax Fees: |
| | | | 2015 | $ 34,000 |
| | | | 2016 | $ 56,000 |
| | | | The tax fees consist of professional services relating to the preparation of the Registrant’s tax returns including returns relating to the Registrant’s investments in non-U.S. jurisdictions. |
| | | | |
| | | d) All Other Fees: |
| | | | 2015 | None |
| | | | 2016 | None |
| | | | |
| | Adviser and affiliates (includes only fees for non-audit services billed to the adviser and affiliates for engagements that relate directly to the operations and financial reporting of the Registrant and were subject to the pre-approval policies described below): |
| | | a) Audit Fees: |
| | | | Not Applicable |
| | | | |
| | | b) Audit-Related Fees: |
| | | | 2015 | $1,148,000 |
| | | | 2016 | $1,169,000 |
| | | | The audit-related fees consist of assurance and related services relating to the examination of the Registrant’s transfer agent, principal underwriter and investment adviser conducted in accordance with Statement on Standards for Attestation Engagements Number 16 issued by the American Institute of Certified Public Accountants. |
| | | | |
| | | c) Tax Fees: |
| | | | 2015 | None |
| | | | 2016 | None |
| | | | The tax fees consist of consulting services relating to the Registrant’s investments. |
| | | | |
| | | d) All Other Fees: |
| | | | 2015 | $ 5,000 |
| | | | 2016 | $ 3,000 |
| | | | The other fees consist of subscription services related to an accounting research tool. |
| | | | |
All audit and permissible non-audit services that the Registrant’s audit committee considers compatible with maintaining the independent registered public accounting firm’s independence are required to be pre-approved by the committee. The pre-approval requirement will extend to all non-audit services provided to the Registrant, the investment adviser, and any entity controlling, controlled by, or under common control with the investment adviser that provides ongoing services to the Registrant, if the engagement relates directly to the operations and financial reporting of the Registrant. The committee will not delegate its responsibility to pre-approve these services to the investment adviser. The committee may delegate to one or more committee members the authority to review and pre-approve audit and permissible non-audit services. Actions taken under any such delegation will be reported to the full committee at its next meeting. The pre-approval requirement is waived with respect to non-audit services if certain conditions are met. The pre-approval requirement was not waived for any of the non-audit services listed above provided to the Registrant, adviser and affiliates.
Aggregate non-audit fees paid to the Registrant’s auditors, including fees for all services billed to the Registrant, adviser and affiliates that provide ongoing services to the Registrant, were $1,487,000 for fiscal year 2015 and $1,286,000 for fiscal year 2016. The non-audit services represented by these amounts were brought to the attention of the committee and considered to be compatible with maintaining the auditors’ independence.
ITEM 5 – Audit Committee of Listed Registrants
Not applicable to this Registrant, insofar as the Registrant is not a listed issuer as defined in Rule 10A-3 under the Securities Exchange Act of 1934.
ITEM 6 – Schedule of Investments
SMALLCAP World Fund®
Investment portfolio
September 30, 2016
Common stocks 91.62%
Consumer discretionary 17.71% | Shares | Value
(000) |
| Domino’s Pizza, Inc.1 | 2,828,769 | $429,549 |
| GVC Holdings PLC1,2 | 19,280,894 | 185,433 |
| Dollarama Inc. | 2,005,000 | 156,540 |
| Lions Gate Entertainment Corp.1 | 7,751,786 | 154,958 |
| Seria Co., Ltd.2 | 1,425,324 | 115,492 |
| YOOX Net-A-Porter Group SPA2,3 | 3,627,000 | 112,384 |
| AA PLC2 | 28,448,238 | 109,034 |
| Ted Baker PLC1,2 | 3,340,342 | 106,681 |
| Matahari Department Store Tbk PT2 | 73,537,800 | 104,390 |
| Ladbrokes PLC1,2 | 55,522,600 | 100,752 |
| POYA International Co., Ltd.1,2 | 6,735,908 | 100,313 |
| Paddy Power Betfair PLC2 | 886,051 | 100,231 |
| BCA Marketplace PLC1,2 | 42,870,000 | 100,019 |
| Domino’s Pizza Enterprises Ltd.2 | 1,848,956 | 99,831 |
| ASOS PLC2,3 | 1,491,741 | 93,756 |
| Brinker International, Inc. | 1,660,500 | 83,739 |
| Taiwan Paiho Ltd.1,2 | 22,578,000 | 81,064 |
| zooplus AG, non-registered shares1,2,3 | 558,778 | 80,976 |
| Cedar Fair, LP | 1,340,000 | 76,769 |
| Jin Co., Ltd.1,2 | 1,608,000 | 74,525 |
| Belmond Ltd., Class A3 | 5,854,000 | 74,404 |
| Entertainment One Ltd.1,2 | 25,150,631 | 73,804 |
| Sleep Country Canada Holdings Inc.1 | 3,011,253 | 71,474 |
| Planet Fitness, Inc., Class A3 | 3,558,286 | 71,415 |
| Mr Price Group Ltd.2 | 6,304,626 | 69,811 |
| Gentex Corp. | 3,909,134 | 68,644 |
| Penske Automotive Group, Inc. | 1,342,500 | 64,682 |
| Crompton Greaves Consumer Electricals Ltd.2,3 | 27,770,000 | 64,445 |
| Five Below, Inc.3 | 1,577,000 | 63,537 |
| Evolution Gaming Group AB1,2 | 1,943,200 | 63,249 |
| Tesla Motors, Inc.3 | 303,200 | 61,862 |
| Jumbo SA2 | 4,942,964 | 61,673 |
| Installed Building Products, Inc.1,3 | 1,704,039 | 61,124 |
| Beauty Community PCL1,2 | 217,500,000 | 60,176 |
| Newell Rubbermaid Inc. | 1,115,212 | 58,727 |
| Tele Columbus AG1,2,3 | 6,696,000 | 58,353 |
| TopBuild Corp.3 | 1,745,000 | 57,934 |
| Eclat Textile Co., Ltd.2 | 4,162,840 | 49,897 |
| Greene King PLC2 | 4,931,618 | 49,544 |
| Cyrela Brazil Realty SA, ordinary nominative | 15,459,700 | 48,630 |
| Cie. Plastic Omnium SA2 | 1,295,995 | 42,977 |
| Ctrip.com International, Ltd. (ADR)3 | 918,500 | 42,775 |
| Nord Anglia Education, Inc.3 | 1,910,000 | 41,600 |
| Melco International Development Ltd.2 | 30,379,000 | 40,256 |
| Page Industries Ltd.2 | 162,500 | 36,941 |
| Nien Made Enterprise Co., Ltd.2 | 2,841,000 | 36,810 |
| Ace Hardware Indonesia Tbk PT2 | 547,245,700 | 36,764 |
SMALLCAP World Fund — Page 1 of 15
Common stocks
Consumer discretionary (continued) | Shares | Value
(000) |
| Tiffany & Co. | 499,000 | $36,242 |
| Estácio Participações SA, ordinary nominative | 6,425,000 | 35,186 |
| Moncler SpA2 | 2,056,400 | 35,087 |
| ASKUL Corp.2 | 905,000 | 34,362 |
| Century Communities, Inc.1,3 | 1,576,000 | 33,900 |
| TOD’S SpA2 | 641,500 | 33,869 |
| Eros International PLC, Class A3 | 1,871,666 | 28,674 |
| Eros International PLC, Class A2,3,4 | 216,500 | 3,018 |
| Brunello Cucinelli SpA2 | 1,608,281 | 31,261 |
| Inchcape PLC2 | 3,551,460 | 30,312 |
| TAKKT AG2 | 1,302,278 | 29,203 |
| Daily Mail and General Trust PLC, Class A, non-voting2 | 2,971,000 | 28,670 |
| Chow Sang Sang Holdings International Ltd.2 | 15,940,000 | 28,199 |
| Spin Master Corp., subordinate voting shares3 | 1,159,000 | 27,660 |
| DineEquity, Inc. | 341,600 | 27,051 |
| ClubCorp Holdings, Inc. | 1,868,000 | 27,030 |
| Six Flags Entertainment Corp. | 500,000 | 26,805 |
| KB Home | 1,627,000 | 26,227 |
| Blue Nile, Inc.1 | 753,000 | 25,918 |
| Stella International Holdings Ltd.2 | 14,963,000 | 25,682 |
| Kyoritsu Maintenance Co.,Ltd.2 | 409,700 | 25,595 |
| ServiceMaster Global Holdings, Inc.3 | 753,000 | 25,361 |
| B2W - Cia. Digital, ordinary nominative3 | 5,162,015 | 25,317 |
| CalAtlantic Group, Inc. | 750,800 | 25,107 |
| World Wrestling Entertainment, Inc., Class A | 1,140,000 | 24,282 |
| Grand Canyon Education Inc.3 | 593,000 | 23,951 |
| Titan Co. Ltd.2 | 3,760,000 | 22,355 |
| Zhongsheng Group Holdings Ltd.2 | 22,854,000 | 21,812 |
| Lands’ End, Inc.3 | 1,504,000 | 21,808 |
| Cox & Kings Ltd.2 | 6,500,000 | 21,654 |
| Texas Roadhouse, Inc. | 547,440 | 21,367 |
| M.D.C. Holdings, Inc. | 790,000 | 20,382 |
| Cavco Industries, Inc.3 | 204,000 | 20,206 |
| Ocado Group PLC2,3 | 5,703,000 | 19,552 |
| I.T Limited2 | 57,710,000 | 18,819 |
| Chipotle Mexican Grill, Inc.3 | 39,890 | 16,893 |
| Tarena International, Inc., Class A (ADR) | 1,162,398 | 16,832 |
| DO & CO AG, non-registered shares2 | 205,755 | 16,820 |
| Lennar Corp., Class A | 394,000 | 16,682 |
| GfK SE2 | 463,000 | 16,131 |
| Valeo SA, non-registered shares2 | 258,000 | 15,045 |
| D.R. Horton, Inc. | 490,000 | 14,798 |
| Whistler Blackcomb Holdings Inc. | 508,900 | 14,507 |
| TravelCenters of America LLC1,3 | 2,023,750 | 14,490 |
| Hathway Cable and Datacom Ltd.2,3 | 35,876,000 | 14,160 |
| Techtronic Industries Co. Ltd.2 | 3,570,000 | 14,000 |
| Mulberry Group PLC2 | 931,173 | 13,218 |
| Melco Crown Entertainment Ltd. (ADR) | 800,000 | 12,888 |
| Minor International PCL, non-voting depositary receipt (Thailand)2 | 11,350,000 | 12,832 |
| Hankook Tire Co., Ltd.2 | 233,473 | 12,620 |
| Nokian Renkaat Oyj2 | 326,850 | 11,914 |
| Mothercare PLC2,3 | 7,619,327 | 11,693 |
| Wowprime Corp.2 | 2,928,000 | 11,305 |
| SHW AG, non-registered shares2 | 300,000 | 11,052 |
| HUGO BOSS AG2 | 195,848 | 10,831 |
SMALLCAP World Fund — Page 2 of 15
Common stocks
Consumer discretionary (continued) | Shares | Value
(000) |
| Talwalkars Better Value Fitness Ltd.1,2 | 2,389,000 | $9,948 |
| Toll Brothers, Inc.3 | 300,000 | 8,958 |
| American Axle & Manufacturing Holdings, Inc.3 | 505,000 | 8,696 |
| William Hill PLC2 | 2,047,800 | 8,074 |
| Euromoney Institutional Investor PLC2 | 547,000 | 7,863 |
| POLYTEC Holding AG, non-registered shares2 | 834,369 | 7,489 |
| Cabela’s Inc.3 | 128,400 | 7,053 |
| Samsonite International SA2 | 2,175,000 | 6,992 |
| Sitoy Group Holdings Ltd.2 | 18,291,800 | 6,902 |
| L’Occitane International SA2 | 3,212,051 | 6,415 |
| Papa Murphy’s Holdings, Inc.3 | 800,000 | 5,160 |
| Central European Media Enterprises Ltd., Class A3 | 2,220,000 | 5,128 |
| Premium Leisure Corp.2 | 242,500,000 | 5,106 |
| SSI Group, Inc.2,3 | 54,000,000 | 3,175 |
| China Zenix Auto International Ltd. (ADR)3 | 2,152,000 | 2,647 |
| Ten Alps PLC2,3 | 343,900 | 4 |
| Five Star Travel Corp.2,3,4 | 96,033 | 1 |
| Phorm Corp. Ltd.2,3 | 43,390,000 | — |
| | | 5,288,190 |
| Health care 16.66% | | |
| Incyte Corp.3 | 3,497,991 | 329,826 |
| Molina Healthcare, Inc.1,3 | 4,526,000 | 263,956 |
| GW Pharmaceuticals PLC (ADR)1,3 | 1,976,400 | 262,328 |
| China Biologic Products, Inc.1,3 | 1,682,523 | 209,440 |
| Insulet Corp.1,3 | 3,921,000 | 160,526 |
| NuVasive, Inc.3 | 2,199,400 | 146,612 |
| Zeltiq Aesthetics, Inc.1,3 | 3,122,044 | 122,447 |
| Sysmex Corp.2 | 1,643,000 | 121,724 |
| Centene Corp.3 | 1,709,439 | 114,464 |
| bluebird bio, Inc.3 | 1,619,352 | 109,760 |
| athenahealth, Inc.3 | 866,310 | 109,259 |
| Hikma Pharmaceuticals PLC2 | 4,155,953 | 108,771 |
| Intuitive Surgical, Inc.3 | 135,000 | 97,852 |
| WellCare Health Plans, Inc.3 | 825,000 | 96,599 |
| Kite Pharma, Inc.3 | 1,677,562 | 93,709 |
| Vitrolife AB1,2 | 1,387,559 | 87,992 |
| CONMED Corp.1 | 2,141,654 | 85,795 |
| Diplomat Pharmacy, Inc.3 | 3,017,600 | 84,523 |
| Brookdale Senior Living Inc.3 | 4,750,000 | 82,888 |
| Prothena Corp. PLC3 | 1,323,114 | 79,347 |
| Illumina, Inc.3 | 425,700 | 77,333 |
| Myriad Genetics, Inc.1,3 | 3,712,256 | 76,398 |
| Dechra Pharmaceuticals PLC2 | 4,099,442 | 74,017 |
| Patheon N.V.3 | 2,451,000 | 72,623 |
| Genomma Lab Internacional, SAB de CV, Series B1,3 | 67,483,000 | 70,581 |
| Fleury SA, ordinary nominative | 5,965,000 | 70,340 |
| Spire Healthcare Group PLC2 | 13,379,001 | 68,428 |
| Teleflex Inc. | 383,700 | 64,481 |
| Glaukos Corp.1,3 | 1,706,070 | 64,387 |
| Sawai Pharmaceutical Co., Ltd.2 | 887,900 | 63,008 |
| Teladoc, Inc.1,3 | 3,295,269 | 60,336 |
| Integra LifeSciences Holdings Corp.3 | 728,000 | 60,096 |
| Ultragenyx Pharmaceutical Inc.3 | 835,807 | 59,292 |
| Neurocrine Biosciences, Inc.3 | 1,166,000 | 59,046 |
SMALLCAP World Fund — Page 3 of 15
Common stocks
Health care (continued) | Shares | Value
(000) |
| Fisher & Paykel Healthcare Corp. Ltd.2 | 7,656,658 | $55,936 |
| INC Research Holdings, Inc., Class A3 | 1,216,000 | 54,209 |
| Hologic, Inc.3 | 1,277,600 | 49,609 |
| BioMarin Pharmaceutical Inc.3 | 531,500 | 49,174 |
| Galapagos NV2,3 | 755,735 | 48,698 |
| Natera, Inc.1,3 | 4,099,803 | 45,549 |
| Axovant Sciences Ltd.3 | 3,176,800 | 44,475 |
| Sartorius AG, non-registered shares, non-voting preferred2 | 517,372 | 43,060 |
| Nakanishi Inc.2 | 1,172,000 | 42,572 |
| EXACT Sciences Corp.3 | 2,154,070 | 40,001 |
| Alnylam Pharmaceuticals, Inc.3 | 573,700 | 38,885 |
| ACADIA Pharmaceuticals Inc.3 | 1,138,000 | 36,200 |
| Agios Pharmaceuticals, Inc.3 | 663,000 | 35,020 |
| Monash IVF Group Ltd.1,2 | 18,520,000 | 34,914 |
| Flexion Therapeutics, Inc.1,3 | 1,723,051 | 33,668 |
| Tong Ren Tang Technologies Co., Ltd., Class H2 | 16,820,000 | 32,600 |
| Adaptimmune Therapeutics PLC (ADR)1,3 | 4,601,000 | 32,437 |
| Capio AB2 | 5,723,608 | 31,893 |
| Intercept Pharmaceuticals, Inc.3 | 185,137 | 30,472 |
| Genmab A/S2,3 | 165,000 | 28,275 |
| Virbac SA2,3 | 169,500 | 28,272 |
| Virtus Health Ltd.1,2 | 4,603,000 | 27,193 |
| Team Health Holdings, Inc.3 | 832,700 | 27,113 |
| Eurofins Scientific SE, non-registered shares2 | 59,500 | 27,027 |
| Healthscope Ltd.2 | 11,365,000 | 26,926 |
| QIAGEN NV2,3 | 968,751 | 26,671 |
| Gerresheimer AG, non-registered shares2 | 310,000 | 26,342 |
| Spark Therapeutics, Inc.3 | 403,020 | 24,205 |
| Divi’s Laboratories Ltd.2 | 1,124,952 | 21,872 |
| Wright Medical Group, Inc.3 | 879,857 | 21,583 |
| Acerta Pharma BV2,3,5 | 195,556,815 | 18,839 |
| Novadaq Technologies Inc.3 | 1,591,773 | 18,417 |
| Seres Therapeutics, Inc.3 | 1,337,000 | 16,432 |
| Krka, dd, Novo mesto2 | 231,262 | 16,093 |
| Grifols, SA, Class B (ADR) | 616,400 | 9,844 |
| Grifols, SA, Class A, non-registered shares2 | 270,000 | 5,817 |
| Harmonicare Medical Holdings Ltd.2 | 24,942,000 | 15,013 |
| Penumbra, Inc.3 | 194,244 | 14,761 |
| NantKwest, Inc.3 | 1,887,290 | 14,683 |
| Juno Therapeutics, Inc.3 | 470,501 | 14,120 |
| Asahi Intecc Co., Ltd.2 | 280,000 | 12,809 |
| Mitra Keluarga Karyasehat Tbk PT2 | 52,500,000 | 11,213 |
| Xenon Pharmaceuticals Inc.1,3 | 1,030,000 | 8,343 |
| Endo International PLC3 | 388,481 | 7,828 |
| Fluidigm Corp.3 | 800,000 | 6,408 |
| Mesoblast Ltd.2,3 | 6,200,000 | 5,338 |
| Mesoblast Ltd. (ADR)3 | 80,000 | 345 |
| AbbVie Inc.2,4 | 55,930 | 3,422 |
| Neovasc Inc. (CAD denominated)1,3 | 3,474,667 | 1,774 |
| | | 4,974,534 |
| Information technology 14.14% | | |
| DeNA Co., Ltd.1,2 | 8,201,010 | 297,406 |
| Qorvo, Inc.3 | 3,884,370 | 216,515 |
| AAC Technologies Holdings Inc.2 | 17,790,500 | 180,151 |
SMALLCAP World Fund — Page 4 of 15
Common stocks
Information technology (continued) | Shares | Value
(000) |
| Finisar Corp.1,3 | 5,729,000 | $170,724 |
| Zynga Inc., Class A3 | 54,170,000 | 157,635 |
| Vanguard International Semiconductor Corp.1,2 | 83,546,386 | 157,334 |
| Globant SA1,3 | 2,717,510 | 114,461 |
| Kakaku.com, Inc.2 | 5,997,300 | 108,289 |
| Inphi Corp.1,3 | 2,459,199 | 107,000 |
| EPAM Systems, Inc.3 | 1,443,994 | 100,083 |
| Zoopla Property Group PLC1,2 | 23,652,006 | 99,612 |
| Halma PLC2 | 6,749,967 | 91,777 |
| Quotient Technology Inc.1,3 | 6,711,613 | 89,332 |
| Dolby Laboratories, Inc., Class A | 1,471,900 | 79,909 |
| Zebra Technologies Corp., Class A3 | 1,129,300 | 78,611 |
| CDW Corp. | 1,660,000 | 75,912 |
| eMemory Technology Inc.1,2 | 6,146,000 | 65,828 |
| NCC Group PLC1,2 | 14,386,000 | 65,374 |
| RingCentral, Inc., Class A3 | 2,648,604 | 62,666 |
| Topcon Corp.2 | 4,363,110 | 62,255 |
| Wix.com Ltd.3 | 1,400,000 | 60,802 |
| Hermes Microvision Inc.2 | 1,391,364 | 60,204 |
| Paycom Software, Inc.3 | 1,199,028 | 60,107 |
| Interactive Intelligence Group, Inc.3 | 991,000 | 59,599 |
| VTech Holdings Ltd.2 | 5,185,500 | 59,289 |
| Hamamatsu Photonics KK2 | 1,916,930 | 58,892 |
| Sunny Optical Technology (Group) Co., Ltd.2 | 11,809,000 | 58,773 |
| Cypress Semiconductor Corp. | 4,704,000 | 57,201 |
| Lumentum Holdings Inc.3 | 1,257,100 | 52,509 |
| MercadoLibre, Inc. | 281,000 | 51,977 |
| Nemetschek AG2 | 795,300 | 48,733 |
| ON Semiconductor Corp.3 | 3,937,656 | 48,512 |
| TravelSky Technology Ltd., Class H2 | 19,960,000 | 47,643 |
| Silicon Laboratories Inc.3 | 767,138 | 45,108 |
| SUNeVision Holdings Ltd.2 | 89,854,000 | 43,661 |
| Moneysupermarket.com Group PLC2 | 11,036,000 | 42,982 |
| Semiconductor Manufacturing International Corp.2,3 | 378,160,068 | 42,401 |
| Rightmove PLC2 | 763,000 | 41,754 |
| Syntel, Inc.3 | 987,043 | 41,367 |
| Palo Alto Networks, Inc.3 | 241,300 | 38,446 |
| Yandex NV, Class A3 | 1,822,716 | 38,368 |
| Autodesk, Inc.3 | 530,000 | 38,335 |
| RIB Software AG1,2 | 2,904,993 | 35,766 |
| Cognex Corp. | 661,202 | 34,951 |
| Gogo Inc.3 | 3,090,000 | 34,114 |
| Cray Inc.3 | 1,432,827 | 33,729 |
| Actua Corp1,3 | 2,602,000 | 33,696 |
| OBIC Co., Ltd.2 | 632,500 | 33,650 |
| Tobii AB2,3 | 3,890,000 | 32,535 |
| istyle Inc.1,2 | 3,832,900 | 31,165 |
| ASM Pacific Technology Ltd.2 | 3,720,000 | 30,739 |
| 58.com Inc., Class A (ADR)3 | 610,000 | 29,073 |
| Trimble Navigation Ltd.3 | 840,000 | 23,990 |
| Viavi Solutions Inc.3 | 3,184,000 | 23,530 |
| Sonus Networks, Inc.1,3 | 2,875,200 | 22,369 |
| Criteo SA (ADR)3 | 635,000 | 22,295 |
| Hana Microelectronics PCL2 | 23,935,000 | 22,002 |
| CoStar Group, Inc.3 | 100,000 | 21,653 |
SMALLCAP World Fund — Page 5 of 15
Common stocks
Information technology (continued) | Shares | Value
(000) |
| carsales.com Ltd.2 | 2,223,000 | $20,454 |
| MagnaChip Semiconductor Corp.1,3 | 2,355,000 | 19,641 |
| Auto Trader Group plc2 | 3,674,700 | 19,314 |
| Zillow Group, Inc., Class C, non-voting3 | 525,000 | 18,191 |
| Siltronic AG2,3 | 680,500 | 17,959 |
| Semtech Corp.3 | 620,000 | 17,193 |
| YY Inc., Class A (ADR)3 | 306,000 | 16,304 |
| AIXTRON SE2,3 | 2,434,518 | 14,785 |
| GrubHub Inc.3 | 342,625 | 14,729 |
| Ellie Mae, Inc.3 | 125,000 | 13,162 |
| Alten SA, non-registered shares2 | 183,500 | 12,830 |
| GoldMoney Inc.1,3 | 3,531,100 | 12,085 |
| CPI Card Group Inc. | 1,953,264 | 11,798 |
| Veeco Instruments Inc.3 | 600,000 | 11,778 |
| Ultimate Software Group, Inc.3 | 55,700 | 11,385 |
| QIWI PLC, Class B (ADR) | 693,000 | 10,145 |
| Meyer Burger Technology AG2,3 | 2,593,444 | 8,837 |
| Monster Worldwide, Inc.3 | 2,305,000 | 8,321 |
| iEnergizer Ltd.2,3 | 7,650,500 | 7,677 |
| KPIT Technologies Ltd.2 | 3,978,896 | 7,433 |
| Ixia3 | 421,760 | 5,272 |
| | | 4,222,087 |
| Industrials 11.32% | | |
| Hoshizaki Electric Co., Ltd.2 | 1,895,100 | 173,095 |
| ITT Corp. | 3,580,000 | 128,307 |
| Loomis AB, Class B2 | 4,019,042 | 124,086 |
| Oshkosh Corp. | 2,105,000 | 117,880 |
| Kirby Corp.3 | 1,747,000 | 108,594 |
| NIBE Industrier AB, Class B2 | 11,580,000 | 102,997 |
| Havells India Ltd.2 | 16,048,000 | 101,115 |
| King Slide Works Co., Ltd.1,2 | 7,623,000 | 98,787 |
| IMCD Group BV2 | 2,088,484 | 91,721 |
| MonotaRO Co., Ltd.2 | 3,191,800 | 85,756 |
| IDEX Corp. | 875,000 | 81,874 |
| ABM Industries Inc. | 2,040,400 | 81,004 |
| TechnoPro Holdings, Inc.1,2 | 2,125,000 | 80,047 |
| Bravida Holding AB1,2 | 11,545,792 | 76,729 |
| Continental Building Products, Inc.1,3 | 3,330,700 | 69,911 |
| BELIMO Holding AG2 | 20,980 | 69,156 |
| Spirit Airlines, Inc.3 | 1,528,000 | 64,986 |
| PARK24 Co., Ltd.2 | 1,968,500 | 63,963 |
| NORMA Group SE, non-registered shares2 | 1,174,339 | 60,417 |
| Clean Harbors, Inc.3 | 1,191,500 | 57,168 |
| Masco Corp. | 1,625,000 | 55,754 |
| TransDigm Group Inc.3 | 190,000 | 54,933 |
| Wizz Air Holdings PLC2,3 | 2,577,300 | 54,785 |
| Exponent, Inc. | 1,070,000 | 54,634 |
| Watsco, Inc. | 350,000 | 49,315 |
| Grupo Aeroportuario del Pacífico SAB de CV | 5,094,455 | 48,373 |
| Landstar System, Inc. | 691,000 | 47,043 |
| Univar Inc.3 | 2,076,000 | 45,361 |
| Grupo Aeroportuario del Centro Norte, SAB de CV, Series B | 7,234,000 | 42,655 |
| Mobile Mini, Inc. | 1,400,000 | 42,280 |
| Waste Connections, Inc. | 560,000 | 41,832 |
SMALLCAP World Fund — Page 6 of 15
Common stocks
Industrials (continued) | Shares | Value
(000) |
| Stabilus SA, non-registered shares2,3 | 742,000 | $41,755 |
| Boyd Group Income Fund | 654,500 | 40,843 |
| Johnson Electric Holdings Ltd.2 | 15,754,875 | 40,456 |
| Generac Holdings Inc.3 | 1,019,500 | 37,008 |
| Elementia, SAB de CV3 | 32,490,645 | 34,318 |
| Cía. de Distribución Integral Logista Holdings, SA, non-registered shares2 | 1,535,000 | 34,245 |
| Rockwool International A/S, Class B2 | 188,600 | 34,008 |
| Graco Inc. | 458,000 | 33,892 |
| Miura Co., Ltd.2 | 1,672,800 | 33,501 |
| SEEK Ltd.2 | 2,800,000 | 33,444 |
| Carborundum Universal Ltd.2 | 7,985,000 | 32,762 |
| American Airlines Group Inc. | 872,000 | 31,924 |
| KEYW Holding Corp.1,3 | 2,836,400 | 31,314 |
| Amara Raja Batteries Ltd.2 | 1,973,886 | 30,112 |
| Rheinmetall AG2 | 411,000 | 28,606 |
| Dätwyler Holding Inc., non-registered shares2 | 189,150 | 27,258 |
| Unique Engineering and Construction PCL2 | 51,351,000 | 24,558 |
| XP Power Ltd.1,2 | 1,140,000 | 24,454 |
| WageWorks, Inc.3 | 400,000 | 24,364 |
| LT Group, Inc.2 | 76,014,300 | 24,043 |
| AKR Corporindo Tbk PT2 | 47,774,300 | 23,703 |
| Talgo SA2,3 | 4,801,654 | 23,296 |
| Flughafen Zürich AG2 | 119,000 | 23,230 |
| Teleperformance SA2 | 204,247 | 21,781 |
| Alliance Global Group, Inc.2 | 66,295,000 | 21,709 |
| Spirax-Sarco Engineering PLC2 | 351,000 | 20,471 |
| Gujarat Pipavav Port Ltd.2 | 7,189,000 | 18,873 |
| Valmont Industries, Inc. | 135,000 | 18,167 |
| Geberit AG2 | 41,000 | 17,944 |
| USG Corp.3 | 689,912 | 17,834 |
| PayPoint PLC2 | 1,220,000 | 16,321 |
| Takeuchi Mfg. Co., Ltd.2 | 802,100 | 13,523 |
| The Brink’s Co. | 351,000 | 13,015 |
| Moog Inc., Class A3 | 208,500 | 12,414 |
| Chart Industries, Inc.3 | 350,000 | 11,490 |
| J. Kumar Infraprojects Ltd.1,2 | 4,092,000 | 11,255 |
| Bossard Holding AG2 | 85,062 | 11,199 |
| COSCO International Holdings Ltd.2 | 24,536,000 | 11,063 |
| BMC Stock Holdings, Inc.3 | 579,222 | 10,270 |
| Nabtesco Corp.2 | 350,000 | 9,909 |
| Briggs & Stratton Corp. | 500,000 | 9,325 |
| CIMC Enric Holdings Ltd.2 | 19,998,000 | 8,722 |
| Kornit Digital Ltd.3 | 900,000 | 8,442 |
| Duerr AG2 | 68,331 | 5,737 |
| TD Power Systems Ltd.2 | 1,009,087 | 2,756 |
| | | 3,379,872 |
| Financials 8.96% | | |
| Kotak Mahindra Bank Ltd.2 | 20,057,040 | 234,722 |
| Validus Holdings, Ltd. | 3,033,000 | 151,104 |
| Essent Group Ltd.3 | 4,177,925 | 111,175 |
| MarketAxess Holdings Inc. | 660,000 | 109,289 |
| Umpqua Holdings Corp. | 7,004,541 | 105,418 |
| GT Capital Holdings, Inc.2 | 3,485,200 | 103,359 |
| VZ Holding AG2 | 363,400 | 101,759 |
SMALLCAP World Fund — Page 7 of 15
Common stocks
Financials (continued) | Shares | Value
(000) |
| Bajaj Finance Ltd.2 | 6,087,160 | $97,039 |
| Indiabulls Housing Finance Ltd.2 | 7,725,000 | 96,399 |
| Financial Engines, Inc.1 | 3,137,000 | 93,200 |
| First Republic Bank | 1,141,825 | 88,046 |
| Shriram Transport Finance Co. Ltd.2 | 4,428,739 | 77,564 |
| Kemper Corp. | 1,884,000 | 74,079 |
| SVB Financial Group3 | 652,500 | 72,127 |
| Webster Financial Corp. | 1,897,000 | 72,105 |
| Capitec Bank Holdings Ltd.2 | 1,291,983 | 60,572 |
| Great Western Bancorp, Inc. | 1,805,000 | 60,143 |
| Chemical Financial Corp. | 1,332,450 | 58,801 |
| PacWest Bancorp | 1,238,491 | 53,144 |
| Avanza Bank Holding AB2 | 1,325,768 | 52,352 |
| CenterState Banks, Inc.1 | 2,758,399 | 48,906 |
| First Hawaiian, Inc.3 | 1,641,087 | 44,080 |
| City Union Bank Ltd.2 | 19,961,217 | 39,672 |
| Trupanion, Inc.1,3 | 2,290,500 | 38,710 |
| Redwood Trust, Inc. | 2,562,000 | 36,278 |
| Janus Capital Group Inc. | 2,543,000 | 35,627 |
| Endurance Specialty Holdings Ltd. | 524,000 | 34,296 |
| GRUH Finance Ltd.2 | 6,900,000 | 34,000 |
| Cathay General Bancorp, Inc. | 1,075,167 | 33,094 |
| Deutsche Pfandbriefbank AG2 | 3,330,068 | 31,129 |
| EFG International AG2 | 5,937,108 | 29,100 |
| Mercury General Corp. | 500,000 | 27,425 |
| Onex Corp. | 400,000 | 25,760 |
| RenaissanceRe Holdings Ltd. | 205,000 | 24,633 |
| Inversiones La Construcción SA | 2,141,182 | 24,611 |
| Greenhill & Co., Inc. | 885,500 | 20,871 |
| Cerved Information Solutions SPA, non-registered shares2 | 2,458,010 | 20,796 |
| CRISIL Ltd.2 | 570,000 | 19,129 |
| Signature Bank3 | 157,800 | 18,691 |
| WisdomTree Investments, Inc. | 1,810,000 | 18,625 |
| ICRA Ltd.2 | 291,264 | 17,269 |
| Eurobank Ergasias SA2,3 | 29,592,819 | 16,984 |
| Numis Corp. PLC2 | 5,663,282 | 16,091 |
| National Bank of Pakistan2 | 22,545,000 | 15,824 |
| PSG Group Ltd.2 | 1,075,000 | 15,750 |
| Permanent TSB Group Holdings PLC2,3 | 6,457,000 | 14,906 |
| Cascade Bancorp3 | 2,450,962 | 14,853 |
| Altisource Residential Corp. | 1,324,678 | 14,439 |
| Boston Private Financial Holdings, Inc. | 1,110,000 | 14,241 |
| Clifton Bancorp Inc. | 816,606 | 12,486 |
| Moelis & Co., Class A | 422,000 | 11,348 |
| Habib Bank Ltd.2 | 5,000,000 | 10,593 |
| Bank of Ireland2,3 | 45,456,798 | 9,462 |
| Bolsas y Mercados Españoles, Sociedad Holding de Mercados y Sistemas Financieros, SA2 | 230,000 | 6,833 |
| BankUnited, Inc. | 190,200 | 5,744 |
| | | 2,674,653 |
| Consumer staples 6.06% | | |
| Emmi AG1,2 | 270,100 | 184,747 |
| Raia Drogasil SA, ordinary nominative | 7,917,574 | 161,363 |
| Lion Corp.2 | 7,637,000 | 123,531 |
| Sprouts Farmers Market, Inc.3 | 5,862,600 | 121,063 |
SMALLCAP World Fund — Page 8 of 15
Common stocks
Consumer staples (continued) | Shares | Value
(000) |
| Pinnacle Foods Inc. | 2,389,050 | $119,859 |
| COSMOS Pharmaceutical Corp.2 | 515,200 | 110,525 |
| SalMar ASA2 | 2,231,000 | 68,228 |
| Glanbia PLC2 | 3,503,200 | 67,392 |
| Puregold Price Club, Inc.2 | 67,573,800 | 59,220 |
| Greencore Group PLC2 | 12,964,272 | 56,376 |
| TreeHouse Foods, Inc.3 | 625,000 | 54,494 |
| Refresco Gerber NV2 | 3,169,045 | 52,669 |
| Ariake Japan Co., Ltd.2 | 920,000 | 49,601 |
| Coca-Cola Icecek AS, Class C2 | 3,758,000 | 45,763 |
| Treasury Wine Estates Ltd.2 | 5,236,087 | 44,307 |
| Herbalife Ltd.3 | 685,000 | 42,463 |
| CCL Products (India) Ltd.1,2 | 9,479,102 | 37,248 |
| Davide Campari-Milano SpA2 | 3,150,000 | 35,489 |
| BGFretail Co., Ltd.2 | 168,000 | 29,587 |
| Stock Spirits Group PLC1,2 | 14,404,674 | 28,799 |
| Scandinavian Tobacco Group A/S2 | 1,644,000 | 28,062 |
| Hypermarcas SA, ordinary nominative | 3,126,077 | 26,790 |
| Emami Ltd.2 | 1,513,000 | 26,700 |
| Milbon Co., Ltd.2 | 535,000 | 26,236 |
| Kernel Holding SA2 | 1,642,578 | 25,406 |
| Lenta Ltd. (GDR)2,3 | 2,422,000 | 19,618 |
| Lenta Ltd. (GDR)2,3,4 | 530,900 | 4,300 |
| Karex Bhd.2 | 35,044,875 | 20,866 |
| Emperador Inc.2 | 135,870,000 | 20,270 |
| Hyundai Department Store Co., Ltd.2 | 186,000 | 20,025 |
| Super Group Ltd.2 | 29,544,100 | 17,281 |
| Del Monte Pacific Ltd.2 | 66,733,314 | 16,654 |
| Philip Morris CR as2 | 32,000 | 16,496 |
| Delfi Ltd.2 | 9,182,500 | 14,052 |
| Ezaki Glico Co., Ltd.2 | 188,000 | 11,384 |
| Blue Buffalo Pet Products, Inc.3 | 388,700 | 9,235 |
| PZ Cussons PLC2 | 1,700,000 | 8,012 |
| Pigeon Corp.2 | 149,000 | 4,501 |
| R.E.A. Holdings PLC2,3 | 800,000 | 2,619 |
| | | 1,811,231 |
| Energy 4.66% | | |
| U.S. Silica Holdings, Inc. | 2,942,071 | 136,983 |
| InterOil Corp.3 | 2,344,500 | 119,382 |
| Seven Generations Energy Ltd., Class A3 | 4,675,000 | 112,532 |
| Laredo Petroleum, Inc.3 | 7,752,000 | 100,001 |
| Diamondback Energy, Inc.3 | 1,030,950 | 99,528 |
| SM Energy Co. | 2,021,240 | 77,979 |
| Peyto Exploration & Development Corp. | 2,496,900 | 70,076 |
| Whitecap Resources Inc. | 8,334,454 | 69,626 |
| Parsley Energy, Inc., Class A3 | 1,707,200 | 57,208 |
| Carrizo Oil & Gas, Inc.3 | 1,365,260 | 55,457 |
| Petronet LNG Ltd.2 | 10,460,000 | 54,346 |
| Tullow Oil PLC2,3 | 15,409,182 | 50,593 |
| WorleyParsons Ltd.2,3 | 6,024,914 | 38,636 |
| Concho Resources Inc.3 | 279,500 | 38,389 |
| Aegis Logistics Ltd.2 | 14,370,000 | 33,317 |
| Keyera Corp. | 952,400 | 30,794 |
| Transocean Partners LLC1 | 2,470,063 | 30,456 |
SMALLCAP World Fund — Page 9 of 15
Common stocks
Energy (continued) | Shares | Value
(000) |
| Pason Systems Inc. | 1,583,800 | $20,269 |
| Tidewater Midstream and Infrastructure Ltd.1 | 12,444,000 | 14,275 |
| Tidewater Midstream and Infrastructure Ltd.1 | 4,490,000 | 5,151 |
| Ophir Energy PLC2,3 | 17,453,000 | 17,435 |
| Tallgrass Energy GP, LP, Class A | 699,900 | 16,833 |
| Independence Contract Drilling, Inc.1,3 | 3,010,000 | 15,802 |
| San Leon Energy PLC1,2,3 | 25,803,000 | 15,677 |
| Venture Global LNG, Inc., Class C2,3,4,5 | 4,240 | 13,386 |
| Oasis Petroleum Inc.3 | 1,071,400 | 12,289 |
| Golar LNG Ltd. | 564,092 | 11,959 |
| Oil States International, Inc.3 | 360,000 | 11,365 |
| Tourmaline Oil Corp.3 | 410,000 | 11,107 |
| Amerisur Resources PLC2,3 | 25,458,400 | 8,084 |
| Lekoil Ltd. (CDI)1,2,3 | 25,208,400 | 7,119 |
| Savannah Petroleum PLC1,2,3 | 17,844,000 | 7,049 |
| Core Laboratories NV | 40,000 | 4,493 |
| Providence Resources PLC1,2,3 | 35,235,000 | 4,338 |
| Africa Oil Corp. (SEK denominated)2,3 | 2,683,000 | 4,241 |
| Paramount Resources Ltd.3 | 276,300 | 3,104 |
| Genel Energy PLC2,3 | 2,224,800 | 2,769 |
| Gulf Marine Services PLC2 | 3,377,219 | 2,202 |
| Denbury Resources Inc.3 | 669,000 | 2,161 |
| BNK Petroleum Inc.1,3 | 12,804,914 | 2,098 |
| Gulf Keystone Petroleum Ltd.1,2,3 | 42,000,000 | 1,166 |
| Gulf Keystone Petroleum Ltd.1,2,3,4 | 15,715,000 | 436 |
| Rockhopper Exploration PLC2,3 | 4,362,881 | 1,555 |
| African Petroleum Corp. Ltd.2,3 | 1,445,890 | 439 |
| Borders & Southern Petroleum PLC2,3 | 6,069,873 | 146 |
| | | 1,392,251 |
| Materials 4.51% | | |
| James Hardie Industries PLC (CDI)2 | 6,855,000 | 107,525 |
| Buzzi Unicem SPA2 | 4,699,558 | 96,288 |
| Platform Specialty Products Corp.3 | 11,177,021 | 90,646 |
| Lundin Mining Corp.3 | 20,075,000 | 79,416 |
| Ingevity Corp.3 | 1,643,454 | 75,763 |
| Sirius Minerals Plc1,2,3 | 179,676,660 | 75,529 |
| Supreme Industries Ltd.2 | 5,493,479 | 75,039 |
| Stillwater Mining Co.3 | 4,765,000 | 63,660 |
| PolyOne Corp. | 1,623,600 | 54,894 |
| Chr. Hansen Holding A/S2 | 749,000 | 44,523 |
| United States Steel Corp. | 2,332,585 | 43,993 |
| Stella-Jones Inc. | 1,265,000 | 43,881 |
| SK Kaken Co.,Ltd.2 | 428,000 | 43,558 |
| CCL Industries Inc., Class B, non-voting | 200,000 | 38,509 |
| Outokumpu Oy, Class A (Finland)2,3 | 5,080,000 | 34,892 |
| AptarGroup, Inc. | 450,000 | 34,834 |
| HudBay Minerals Inc. | 8,380,000 | 33,151 |
| PI Industries Ltd.2 | 2,590,000 | 32,374 |
| Mayr-Melnhof Karton AG, non-registered shares2 | 292,300 | 32,146 |
| Arkema SA2 | 345,000 | 31,913 |
| Mountain Province Diamonds Inc.3 | 4,964,264 | 25,957 |
| Silgan Holdings Inc. | 467,300 | 23,641 |
| Huhtamäki Oyj2 | 488,000 | 22,727 |
| Kenmare Resources PLC2,3 | 5,424,863 | 22,518 |
SMALLCAP World Fund — Page 10 of 15
Common stocks
Materials (continued) | Shares | Value
(000) |
| Croda International PLC2 | 407,448 | $18,418 |
| Nampak Ltd.2 | 12,381,000 | 17,568 |
| Symrise AG2 | 227,500 | 16,674 |
| CPMC Holdings Ltd.2 | 31,700,000 | 16,080 |
| LANXESS AG2 | 213,040 | 13,231 |
| Valspar Corp. | 105,000 | 11,137 |
| Greatview Aseptic Packaging Co. Ltd.2 | 16,320,000 | 8,711 |
| Kennady Diamonds Inc.1,3 | 2,557,952 | 7,818 |
| Hummingbird Resources PLC1,2,3 | 18,920,000 | 6,003 |
| Rusoro Mining Ltd.3 | 21,437,000 | 3,595 |
| ArtGo Holdings Ltd.2,3 | 20,059,000 | 1,728 |
| | | 1,348,340 |
| Real estate 1.27% | | |
| WHA Corp. PCL1,2,3 | 1,081,018,900 | 97,788 |
| MGM Growth Properties LLC REIT, Class A1 | 3,311,387 | 86,328 |
| OUTFRONT Media Inc. REIT | 2,792,035 | 66,032 |
| Land and Houses PCL, non-voting depository receipt2 | 72,981,300 | 18,932 |
| Land and Houses PCL FR2 | 39,888,700 | 10,347 |
| Gaming and Leisure Properties, Inc. REIT | 800,000 | 26,760 |
| Fibra Uno Administración, SA de CV REIT | 8,860,744 | 16,186 |
| Mahindra Lifespace Developers Ltd.1,2 | 2,157,380 | 14,035 |
| K. Wah International Holdings Ltd.2 | 21,924,720 | 12,083 |
| LSL Property Services PLC2 | 4,166,350 | 11,529 |
| Soundwill Holdings Ltd.2 | 4,836,500 | 8,865 |
| Macquarie Mexican REIT | 4,330,500 | 5,300 |
| Golden Wheel Tiandi Holdings Co. Ltd.2 | 41,096,000 | 3,197 |
| Grivalia Properties Real Estate Investment Company REIT2 | 391,028 | 2,944 |
| | | 380,326 |
| Utilities 0.76% | | |
| ENN Energy Holdings Ltd.2 | 16,061,000 | 78,392 |
| REN - Redes Energéticas Nacionais, SGPS, SA, non-registered shares2 | 21,335,000 | 62,385 |
| CT Environmental Group Ltd.2 | 141,548,000 | 41,241 |
| Ratchaburi Electricity Generating Holding PCL2 | 6,350,000 | 9,307 |
| Ratchaburi Electricity Generating Holding PCL, non-voting depository receipts2 | 5,378,900 | 7,883 |
| Huadian Fuxin Energy Corp. Ltd., Class H2 | 47,270,000 | 11,275 |
| Energy World Corp. Ltd.2,3 | 50,606,000 | 8,725 |
| Mytrah Energy Ltd.1,2,3 | 10,418,000 | 6,988 |
| Greenko Group PLC1,2 | 9,748,155 | 128 |
| | | 226,324 |
| Telecommunication services 0.74% | | |
| Iridium Communications Inc.1,3 | 6,008,616 | 48,730 |
| Indosat Tbk PT2,3 | 96,888,700 | 44,732 |
| Cogent Communications Holdings, Inc. | 1,100,718 | 40,517 |
| HKBN Ltd.2 | 26,978,000 | 30,508 |
| Reliance Communications Ltd.2,3 | 43,171,315 | 30,053 |
| Zegona Communications PLC1,2 | 12,305,654 | 17,673 |
| Hutchison Telecommunications Hong Kong Holdings Ltd.2 | 28,662,000 | 9,765 |
| Let’s GOWEX, SA, non-registered shares2,3 | 106,245 | — |
| | | 221,978 |
SMALLCAP World Fund — Page 11 of 15
Common stocks
Miscellaneous 4.83% | Shares | Value
(000) |
| Other common stocks in initial period of acquisition | | $1,443,425 |
| Total common stocks (cost: $19,866,355,000) | | 27,363,211 |
Preferred securities 0.00%
Consumer staples 0.00% | | |
| R.E.A. Holdings PLC 9.00% | 96,000 | 117 |
| Total preferred securities (cost: $185,000) | | 117 |
Rights & warrants 0.02%
Real estate 0.01% | | |
| WHA Corp. PCL, warrants, expire 20201,3 | 6,909,830 | 1,714 |
| Information technology 0.01% | | |
| Foursquare Labs, Inc., warrants, expire 20332,3,5 | 1,163,990 | 1,301 |
| Consumer discretionary 0.00% | | |
| Central European Media Enterprises Ltd., warrants, expire 20182,3 | 751,800 | 1,003 |
| Total rights & warrants (cost: $926,000) | | 4,018 |
Convertible stocks 0.33%
Information technology 0.17% | | |
| DocuSign, Inc., Series E, convertible preferred2,3,5 | 1,236,304 | 21,944 |
| DocuSign, Inc., Series B, convertible preferred2,3,5 | 66,593 | 1,182 |
| DocuSign, Inc., Series D, convertible preferred2,3,5 | 47,810 | 849 |
| DocuSign, Inc., Series B1, convertible preferred2,3,5 | 19,947 | 354 |
| Domo, Inc., Series D-2, convertible preferred2,3,5 | 2,965,036 | 19,717 |
| Foursquare Labs, Inc., Series D, convertible preferred2,3,5 | 1,551,988 | 6,225 |
| | | 50,271 |
| Health care 0.14% | | |
| Proteus Digital Health, Inc., Series G, convertible preferred2,3,5 | 3,044,139 | 43,288 |
| Telecommunication services 0.02% | | |
| Iridium Communications Inc., Series A, convertible preferred1,4 | 60,000 | 6,094 |
| Total convertible stocks (cost: $108,394,000) | | 99,653 |
Bonds, notes & other debt instruments 0.51%
U.S. Treasury bonds & notes 0.26%
U.S. Treasury 0.26% | Principal amount
(000) | |
| U.S. Treasury 1.625% 20266 | $78,080 | 78,294 |
| Total U.S. Treasury bonds & notes | | 78,294 |
| Bonds & notes of governments outside the U.S. 0.18% | | |
| Brazil (Federative Republic of) 10.00% 2025 | BRL185,000 | 52,577 |
SMALLCAP World Fund — Page 12 of 15
Bonds, notes & other debt instruments
Corporate bonds & notes 0.07%
Energy 0.07% | Principal amount
(000) | Value
(000) |
| Denbury Resources Inc. 9.00% 20214 | $9,292 | $9,780 |
| SM Energy Co. 5.625% 2025 | 12,050 | 11,387 |
| Total corporate bonds & notes | | 21,167 |
| Total bonds, notes & other debt instruments (cost: $133,136,000) | | 152,038 |
| Short-term securities 7.51% | | |
| ANZ New Zealand (International) Ltd. 1.11% due 2/15/20174 | 25,000 | 24,902 |
| Bank of Nova Scotia 0.92% due 10/14/20164 | 14,500 | 14,498 |
| BMW U.S. Capital LLC 0.52% due 11/9/20164 | 20,000 | 19,989 |
| BNP Paribas, New York Branch 0.27% due 10/3/2016 | 100,700 | 100,698 |
| Canadian Imperial Bank of Commerce 1.21% due 2/16/2017 | 20,000 | 20,027 |
| Citibank, N.A. 0.78% due 11/15/2016 | 55,700 | 55,723 |
| CPPIB Capital Inc. 0.43% due 10/11/20164 | 24,700 | 24,697 |
| Fairway Finance Corp. 0.67% due 10/20/20164 | 38,600 | 38,589 |
| Federal Home Loan Bank 0.26%–0.50% due 10/21/2016–1/25/2017 | 515,590 | 515,325 |
| Freddie Mac 0.40%–0.49% due 10/5/2016–1/18/2017 | 90,000 | 89,958 |
| Gotham Funding Corp. 0.49%–0.76% due 10/4/2016–11/18/20164 | 51,700 | 51,680 |
| Intel Corp. 0.47% due 10/25/2016 | 50,000 | 49,985 |
| Kells Funding, LLC 0.70%–0.73% due 10/18/2016–10/19/20164 | 90,000 | 89,977 |
| KfW 0.46%–0.55% due 10/13/2016–10/19/20164 | 66,800 | 66,788 |
| Liberty Street Funding Corp. 0.71%–0.92% due 10/14/2016–12/13/20164 | 86,000 | 85,929 |
| Mitsubishi UFJ Trust and Banking Corp. 0.67% due 11/7/20164 | 83,500 | 83,451 |
| Mizuho Bank, Ltd. 0.69%–1.20% due 10/12/2016–2/24/20174 | 143,600 | 143,385 |
| National Australia Bank Ltd. 0.68%–0.89% due 10/25/2016–11/1/20164 | 50,500 | 50,487 |
| Old Line Funding, LLC 1.06% due 1/23/20174 | 30,000 | 29,907 |
| Qualcomm Inc. 0.47% due 10/4/20164 | 50,000 | 49,998 |
| Reckitt Benckiser Treasury Services PLC 0.70% due 10/3/20164 | 24,000 | 23,999 |
| Sumitomo Mitsui Banking Corp. 0.60%–0.90% due 11/15/2016–12/6/20164 | 190,600 | 190,405 |
| Thunder Bay Funding, LLC 1.00% due 1/23/20174 | 50,000 | 49,840 |
| Toyota Credit Canada Inc. 0.73%–0.80% due 10/24/2016–11/10/2016 | 50,000 | 49,982 |
| Toyota Motor Credit Corp. 0.69% due 10/3/2016 | 50,000 | 49,999 |
| U.S. Treasury Bills 0.30%–0.41% due 11/25/2016–2/9/2017 | 175,000 | 174,851 |
| Victory Receivables Corp. 0.78%–1.02% due 11/14/2016–12/15/20164 | 59,000 | 58,938 |
| Wells Fargo Bank, N.A. 0.91% due 11/16/2016 | 40,000 | 40,005 |
| Total short-term securities (cost: $2,243,615,000) | | 2,244,012 |
| Total investment securities 99.99% (cost: $22,352,611,000) | | 29,863,049 |
| Other assets less liabilities 0.01% | | 2,791 |
| Net assets 100.00% | | $29,865,840 |
As permitted by U.S. Securities and Exchange Commission regulations, “Miscellaneous” securities include holdings in their first year of acquisition that have not previously been publicly disclosed.
SMALLCAP World Fund — Page 13 of 15
Forward currency contracts
The fund has entered into forward currency contracts as shown in the following table. The average month-end notional amount of open forward currency contracts while held was $533,574,000.
| | Settlement
date | Counterparty | Contract amount | Unrealized
(depreciation)
appreciation
at 9/30/2016
(000) |
Receive
(000) | Deliver
(000) |
| Sales: | | | | | |
| Australian dollars | 10/26/2016 | HSBC Bank | $40,607 | A$53,150 | $(47) |
| British pounds | 10/13/2016 | Citibank | $45,229 | £34,459 | 552 |
| British pounds | 10/17/2016 | Barclays Bank PLC | $13,737 | £10,590 | 6 |
| British pounds | 10/19/2016 | Bank of America, N.A. | $31,789 | £24,400 | 150 |
| British pounds | 10/20/2016 | Citibank | $56,101 | £42,055 | 1,568 |
| British pounds | 10/26/2016 | JPMorgan Chase | $41,901 | £32,000 | 401 |
| British pounds | 11/3/2016 | UBS AG | $50,157 | £38,626 | 57 |
| British pounds | 11/7/2016 | HSBC Bank | $9,085 | £7,000 | 5 |
| Canadian dollars | 10/7/2016 | UBS AG | $26,198 | C$34,000 | 281 |
| Euros | 10/20/2016 | HSBC Bank | $12,381 | €11,023 | (13) |
| Euros | 10/20/2016 | Barclays Bank PLC | $24,447 | €21,762 | (23) |
| Euros | 10/26/2016 | Citibank | $94,973 | €84,399 | 45 |
| Euros | 10/28/2016 | JPMorgan Chase | $39,897 | €35,481 | (15) |
| Japanese yen | 10/19/2016 | HSBC Bank | $11,826 | ¥1,200,000 | (17) |
| Japanese yen | 10/20/2016 | Bank of America, N.A. | $7,719 | ¥791,840 | (96) |
| Japanese yen | 10/28/2016 | UBS AG | $6,685 | ¥669,165 | 79 |
| Japanese yen | 11/17/2016 | JPMorgan Chase | $8,328 | ¥845,410 | (26) |
| | | | | | $2,907 |
The following footnotes apply to either the individual securities noted or one or more of the securities aggregated and listed as a single line item.
| 1 | Represents an affiliated company as defined under the Investment Company Act of 1940. |
| 2 | Valued under fair value procedures adopted by authority of the board of directors. The total value of all such securities, including those in “Miscellaneous,“ was $12,605,952,000, which represented 42.21% of the net assets of the fund. This amount includes $12,471,296,000 related to certain securities trading outside the U.S. whose values were adjusted as a result of significant market movements following the close of local trading. |
| 3 | Security did not produce income during the last 12 months. |
| 4 | Acquired in a transaction exempt from registration under Rule 144A or Section 4(2) of the Securities Act of 1933. May be resold in the U.S. in transactions exempt from registration, normally to qualified institutional buyers. The total value of all such securities was $1,137,896,000, which represented 3.81% of the net assets of the fund. |
| 5 | Acquired through a private placement transaction exempt from registration under the Securities Act of 1933. May be subject to legal or contractual restrictions on resale. Further details on these holdings appear below. |
| 6 | A portion of this security was pledged as collateral. The total value of pledged collateral was $312,000, which represented less than .01% of the net assets of the fund. |
| Private placement securities | Acquisition
date(s) | Cost
(000) | Value
(000) | Percent
of net
assets |
| Proteus Digital Health, Inc., Series G, convertible preferred | 5/6/2014-7/23/2014 | $40,000 | $43,288 | .15% |
| DocuSign, Inc., Series E, convertible preferred | 2/28/2014 | 16,236 | 21,944 | .07 |
| DocuSign, Inc., Series B, convertible preferred | 2/28/2014 | 875 | 1,182 | .00 |
| DocuSign, Inc., Series D, convertible preferred | 2/28/2014 | 628 | 849 | .00 |
| DocuSign, Inc., Series B1, convertible preferred | 2/28/2014 | 262 | 354 | .00 |
| Domo, Inc., Series D-2, convertible preferred | 3/31/2015 | 25,000 | 19,717 | .07 |
| Acerta Pharma BV | 5/7/2015 | 11,250 | 18,839 | .06 |
| Venture Global LNG, Inc., Class C | 5/1/2015 | 12,720 | 13,386 | .05 |
| Foursquare Labs, Inc., Series D, convertible preferred | 12/3/2013 | 20,000 | 6,225 | .02 |
| Foursquare Labs, Inc., warrants, expire 2033 | 12/3/2013 | - | 1,301 | .01 |
| Total private placement securities | | $126,971 | $127,085 | .43% |
SMALLCAP World Fund — Page 14 of 15
| Key to abbreviations and symbols |
| A$ = Australian dollars |
| ADR = American Depositary Receipts |
| BRL = Brazilian reais |
| £ = British pounds |
| CAD/C$ = Canadian dollars |
| CDI = CREST Depository Interest |
| € = Euros |
| GDR = Global Depositary Receipts |
| ¥ = Japanese yen |
| SEK = Swedish kronor |
Investments are not FDIC-insured, nor are they deposits of or guaranteed by a bank or any other entity, so they may lose value.
Investors should carefully consider investment objectives, risks, charges and expenses. This and other important information is contained in the fund prospectus and summary prospectus, which can be obtained from your financial professional and should be read carefully before investing. You may also call American Funds Service Company (AFS) at (800) 421-4225 or visit the American Funds website at americanfunds.com.
| MFGEFPX-035-1116O-S54072 | SMALLCAP World Fund — Page 15 of 15 |
REPORT OF INDEPENDENT REGISTERED PUBLIC ACCOUNTING FIRM
To the Shareholders and Board of Directors of
SMALLCAP World Fund, Inc.:
We have audited the accompanying statement of assets and liabilities of SMALLCAP World Fund, Inc. (the “Fund”), including the summary schedule of investments, as of September 30, 2016, and the related statements of operations for the year then ended, the statements of changes in net assets for each of the two years in the period then ended (collectively, the “financial statements”), the financial highlights for each of the five years in the period then ended (the financial statements and financial highlights are included in Item 1 of this Form N-CSR), and the schedule of investments in securities as of September 30, 2016 (included in Item 6 of this Form N-CSR). These financial statements, financial highlights, and schedule of investments in securities are the responsibility of the Fund’s management. Our responsibility is to express an opinion on these financial statements, financial highlights, and schedule of investments in securities based on our audits.
We conducted our audits in accordance with the standards of the Public Company Accounting Oversight Board (United States). Those standards require that we plan and perform the audit to obtain reasonable assurance about whether the financial statements, financial highlights, and schedule of investments in securities are free of material misstatement. An audit includes examining, on a test basis, evidence supporting the amounts and disclosures in the financial statements and schedule of investments in securities, assessing the accounting principles used and significant estimates made by management, as well as evaluating the overall financial statement presentation. Our procedures included confirmation of securities owned as of September 30, 2016, by correspondence with the custodian and brokers; where replies were not received from brokers, we performed other auditing procedures. We believe that our audits provide a reasonable basis for our opinion.
In our opinion, the financial statements, financial highlights, and schedule of investments in securities referred to above present fairly, in all material respects, the financial position of SMALLCAP World Fund, Inc. as of September 30, 2016, and the results of its operations for the year then ended, the changes in its net assets for each of the two years in the period then ended, and the financial highlights for each of the five years in the period then ended, in conformity with accounting principles generally accepted in the United States of America.

Costa Mesa, California
November 11, 2016
ITEM 7 – Disclosure of Proxy Voting Policies and Procedures for Closed-End Management Investment Companies
Not applicable to this Registrant, insofar as the Registrant is not a closed-end management investment company.
ITEM 8 – Portfolio Managers of Closed-End Management Investment Companies
Not applicable to this Registrant, insofar as the Registrant is not a closed-end management investment company.
ITEM 9 – Purchases of Equity Securities by Closed-End Management Investment Company and Affiliated Purchasers
Not applicable to this Registrant, insofar as the Registrant is not a closed-end management investment company.
ITEM 10 – Submission of Matters to a Vote of Security Holders
There have been no material changes to the procedures by which shareholders may recommend nominees to the Registrant’s board of directors since the Registrant last submitted a proxy statement to its shareholders. The procedures are as follows. The Registrant has a nominating and governance committee comprised solely of persons who are not considered ‘‘interested persons’’ of the Registrant within the meaning of the Investment Company Act of 1940, as amended. The committee periodically reviews such issues as the board’s composition, responsibilities, committees, compensation and other relevant issues, and recommends any appropriate changes to the full board of directors. While the committee normally is able to identify from its own resources an ample number of qualified candidates, it will consider shareholder suggestions of persons to be considered as nominees to fill future vacancies on the board. Such suggestions must be sent in writing to the nominating and governance committee of the Registrant, c/o the Registrant’s Secretary, and must be accompanied by complete biographical and occupational data on the prospective nominee, along with a written consent of the prospective nominee for consideration of his or her name by the nominating and governance committee.
ITEM 11 – Controls and Procedures
| (a) | The Registrant’s Principal Executive Officer and Principal Financial Officer have concluded, based on their evaluation of the Registrant’s disclosure controls and procedures (as such term is defined in Rule 30a-3 under the Investment Company Act of 1940), that such controls and procedures are adequate and reasonably designed to achieve the purposes described in paragraph (c) of such rule. |
| | |
| (b) | There were no changes in the Registrant’s internal controls over financial reporting (as defined in Rule 30a-3(d) under the Investment Company Act of 1940) that occurred during the Registrant’s second fiscal quarter of the period covered by this report that has materially affected, or is reasonably likely to materially affect, the Registrant’s internal control over financial reporting. |
ITEM 12 – Exhibits
| (a)(1) | The Code of Ethics that is the subject of the disclosure required by Item 2 is attached as an exhibit hereto. |
| | |
| (a)(2) | The certifications required by Rule 30a-2 of the Investment Company Act of 1940 and Sections 302 and 906 of the Sarbanes-Oxley Act of 2002 are attached as exhibits hereto. |
SIGNATURES
Pursuant to the requirements of the Securities Exchange Act of 1934 and the Investment Company Act of 1940, the Registrant has duly caused this report to be signed on its behalf by the undersigned, thereunto duly authorized.
| | SMALLCAP WORLD FUND, INC. |
| | |
| | By /s/ Paul F. Roye |
| | Paul F. Roye, Executive Vice President and Principal Executive Officer |
| | |
| | Date: November 30, 2016 |
Pursuant to the requirements of the Securities Exchange Act of 1934 and the Investment Company Act of 1940, this report has been signed below by the following persons on behalf of the Registrant and in the capacities and on the dates indicated.
| By /s/ Paul F. Roye |
Paul F. Roye, Executive Vice President and Principal Executive Officer |
| |
| Date: November 30, 2016 |
| By /s/ Kimberley H. Monasterio |
Kimberley H. Monasterio, Treasurer and Principal Financial Officer |
| |
| Date: November 30, 2016 |