UNITED STATES
SECURITIES AND EXCHANGE COMMISSION
Washington, D.C. 20549
FORM N-CSR
Certified Shareholder Report of
Registered Management Investment Companies
Investment Company Act File Number: 811-05888
SMALLCAP World Fund, Inc.
(Exact Name of Registrant as Specified in Charter)
333 South Hope Street
Los Angeles, California 90071
(Address of Principal Executive Offices)
Registrant's telephone number, including area code: (213) 486-9200
Date of fiscal year end: September 30
Date of reporting period: September 30, 2014
Michael W. Stockton
SMALLCAP World Fund, Inc.
333 South Hope Street
Los Angeles, California 90071
(Name and Address of Agent for Service)
Copies to:
Mark D. Perlow
K&L Gates LLP
Four Embarcadero Center, Suite 1200
San Francisco, California 94111
(Counsel for the Registrant)
ITEM 1 – Reports to Stockholders

Our research can help
us identify outliers
others have missed.
Special feature page 4
 | SMALLCAP World Fund® Annual report
for the year ended
September 30, 2014 |
SMALLCAP World Fund seeks long-term growth of capital through investments in smaller companies in the United States and around the world.
This fund is one of more than 40 offered by one of the nation’s largest mutual fund families, American Funds, from Capital Group. For more than 80 years, Capital has invested with a long-term focus based on thorough research and attention to risk.
Fund results shown in this report, unless otherwise indicated, are for Class A shares at net asset value. If a sales charge (maximum 5.75%) had been deducted, the results would have been lower. Results are for past periods and are not predictive of results for future periods. Current and future results may be lower or higher than those shown. Share prices and returns will vary, so investors may lose money. Investing for short periods makes losses more likely. Investments are not FDIC-insured, nor are they deposits of or guaranteed by a bank or any other entity, so they may lose value. For current information and month-end results, visit americanfunds.com.
See page 3 for Class A share results with relevant sales charges deducted. For other share class results, visit americanfunds.com and americanfundsretirement.com.
Investment results assume all distributions are reinvested and reflect applicable fees and expenses. When applicable, investment results reflect fee waivers, without which results would have been lower. Visit americanfunds.com for more information.
Investing outside the United States may be subject to risks, such as currency fluctuations and political instability. These risks may be heightened in connection with investments in developing countries. Investing in small-capitalization stocks can involve greater risk than is customarily associated with investing in stocks of larger, more established companies. Refer to the fund prospectus and the Risk Factors section of this report for more information on these and other risks associated with investing in the fund.

Special feature
Fellow investors:
A maturing economic recovery and a volatile market characterized SMALLCAP World Fund’s most recent fiscal year, which ended September 30, 2014. Nonetheless, the fund produced a total return of 4.43% for the period. This figure includes a capital gain payment of $2.43 a share, paid on December 26, 2013.
By way of comparison, the MSCI All Country World Small Cap Index* returned 6.82% for the period, while the Lipper Global Small-/Mid-Cap Funds Average, a measure of the fund’s peer group, gained 5.65%. As long-term investors, we would note that SMALLCAP has surpassed the returns of our peer group over longer periods, as seen in the chart below.
The year in review
While U.S. large-cap equities had a mostly stable rise during the 12-month period ended September 30, 2014, domestic small-cap stocks were more volatile. The Federal Reserve has been pulling back on its quantitative easing program this calendar year, due in large part to the improving economic picture. Nonetheless, some investors remain concerned as to whether an economic slowdown will follow once the Fed’s market support is fully removed.
Economic concerns also were seen in other global markets. Europe’s economic recovery remains uneven, with some nations’ economies improving and others remaining troubled. Increased geopolitical instability in Ukraine and the Middle East prompted higher volatility in many markets. In Asia, economic growth has slowed.
Stocks from emerging markets have been even more volatile than elsewhere, providing a challenging investing environment. Some of this has to do with issues in individual economies, but monetary tapering by the Fed and other central banks is also diminishing the availability of credit in emerging markets. For example, high real interest rates in countries such as South Africa, Indonesia and Brazil are curtailing those domestic economies.
How the fund responded
SMALLCAP World Fund continues to research individual companies that can provide long-term returns for investors. At times, their stocks may be “out of favor” or defy the market’s conventional wisdom as to sector or geography. Nonetheless, the depth of our research and our long-term approach allow us the patience and perspective to identify
Results at a glance
For periods ended September 30, 2014, with all distributions reinvested
| | | Cumulative total returns | | Average annual total returns |
| | | 1 year | | 5 years | | 10 years | | Lifetime
(since 4/30/90) |
| | | | | | | | | |
| SMALLCAP World Fund (Class A shares) | | | 4.43 | % | | | 11.86 | % | | | 9.45 | % | | | 9.71 | % |
| MSCI All Country World Small Cap Index* | | | 6.82 | | | | 12.08 | | | | 9.53 | | | | n/a | |
| Lipper Global Small-/Mid-Cap Funds Average | | | 5.65 | | | | 11.14 | | | | 8.42 | | | | 9.43 | |
| * | The market index is unmanaged and, therefore, has no expenses. Investors cannot invest directly in an index. The market index is a free float-adjusted market capitalization weighted index that is designed to measure equity market results of smaller capitalization companies in both developed and emerging markets. Results reflect dividends net of withholding taxes. This index was not in existence as of the date the fund began investment operations; therefore, lifetime results are not available. |
potentially strong investments. For more on our approach to these outlier investments, please see our special feature beginning on page 4.
As of September 30, 2014, the equities held by SMALLCAP World Fund originate from 43 different nations. Approximately 46% of the fund’s holdings were in U.S. equities, and these stocks helped absolute returns for the period. Likewise, stocks from emerging markets, representing roughly 15% of the fund, also helped returns during the period. Results for European equities, at about 19% of the fund, were mixed, with euro-zone and U.K. stocks holding back returns.
The fund’s health-care, industrial and information-technology shares were beneficial to both absolute and relative returns for the period. For example, Myriad Genetics, the fund’s fifth-largest holding, returned 64.1% for the period, while Tesla rose 25.5% and top holding Netflix gained nearly 45.9%. However, consumer staples and consumer discretionary holdings held back returns. Notably, third-largest holding Lions Gate Entertainment, which has been a positive investment over the long term, lost 6% for the period.
The fund’s cash holdings, at just under 10% of the total portfolio, detracted from returns when compared to the benchmarks. However, we believe having a certain amount of cash on hand can mitigate market volatility, and allows us the freedom to take advantage of new potential investments more easily.
The road ahead
Over the coming year, we expect equities will show continued volatility. The Fed and some of the other central banks around the world are expected to continue removing quantitative support for global markets. In addition, many developed nations are running large fiscal deficits, and the growing public-sector debt burden in these countries is troubling. The ongoing crises in the Middle East and Eastern Europe, the coup in Thailand, the protests in Hong Kong and the general surge of unfettered nationalism in many regions of the world have the potential to impact markets as well.
With that said, this volatility allows us to invest in companies at affordable valuations and we will continue to use our long-term approach to investing. We remain certain that innovation around the globe will continue apace, and that the destructive and creative forces of capitalism remain very powerful. As the world evolves, it creates new opportunities for the bottom-up, research-driven investment that is the hallmark of this fund. We again note that our long-term returns surpass our Lipper category. In fact, this spring the fund was honored with the Lipper Award* in its category for its superior 10-year record.
While awards are gratifying, it’s the success of your investment in the fund and the achievement of your financial goals that remain our primary considerations. Once again, we thank you for the confidence you have placed in us. Be assured we take our responsibilities to you very seriously. We look forward to reporting to you again in six months.
Sincerely,

Jonathan Knowles
Vice Chairman of the Board

Gregory W. Wendt
President
November 10, 2014
For current information about the fund, visit americanfunds.com.
* Lipper Award to SMALLCAP World Fund, Class R-5 shares, Best Fund Over 10 Years, Global Small-/Mid-Cap Funds.
Where are SMALLCAP’s holdings located?
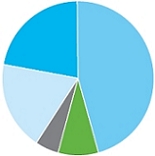
| As of September 30, 2014 | Percent of net assets |
| ▀ | United States | | | 46.0 | % |
| ▀ | Asia & Pacific Basin | | | 21.9 | |
| ▀ | Europe | | | 18.5 | |
| ▀ | Other (including Canada & Latin America) | | | 5.1 | |
| ▀ | Short-term securities & other assets less liabilities | | | 8.5 | |
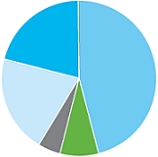
| | As of September 30, 2013 | Percent of
net assets |
| ▀ | United States | | | 46.3 | % |
| ▀ | Asia & Pacific Basin | | | 20.6 | |
| ▀ | Europe | | | 20.3 | |
| ▀ | Other (including Canada & Latin America) | | | 4.9 | |
| ▀ | Short-term securities & other assets less liabilities | | | 7.9 | |
Largest equity holdings
| | | Percent of
net assets |
| Netflix | | | 1.7 | % |
| Domino’s Pizza | | | 1.0 | |
| Lions Gate Entertainment | | | .9 | |
| AA | | | .9 | |
| Myriad Genetics | | | .9 | |
| Incyte | | | .9 | |
| Endo International | | | .8 | |
| ENN Energy Holdings | | | .8 | |
| Moog | | | .7 | |
| TriQuint Semiconductor | | | .7 | |
The value of a long-term perspective
This chart shows how a $10,000 investment in SMALLCAP World Fund’s Class A shares grew from April 30, 1990 — the fund’s inception — through September 30, 2014, the end of the fund’s latest fiscal year. As you can see, the $10,000 would have grown to $90,639 even after deducting the maximum 5.75% sales charge.
Fund results shown reflect deduction of the maximum sales charge of 5.75% on the $10,000 investment.1 Thus, the net amount invested was $9,425.
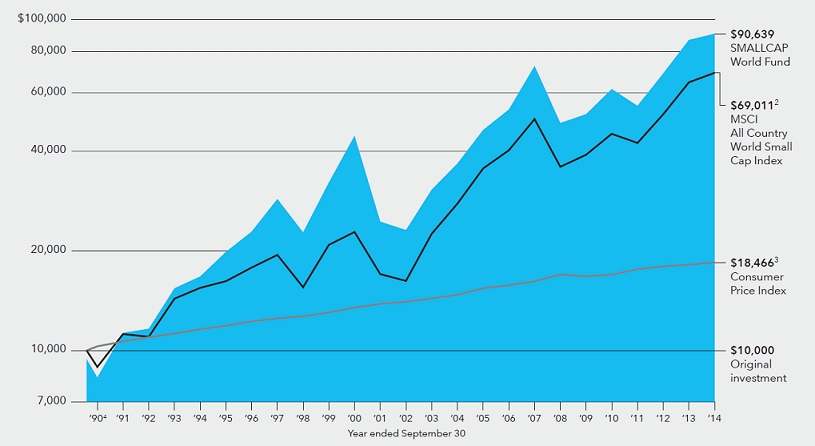
| 1 | As outlined in the prospectus, the sales charge is reduced for accounts (and aggregated investments) of $25,000 or more and is eliminated for purchases of $1 million or more. There is no sales charge on dividends or capital gain distributions that are reinvested in additional shares. |
| 2 | The MSCI All Country World Small Cap Index is unmanaged and, therefore, has no expenses. Investors cannot invest directly in an index. Results reflect dividends net of withholding taxes. Because the index was not in existence at the time of the fund’s inception, cumulative returns through May 31, 1994 reflect the returns of the S&P Developed <$1.2 Billion Index. |
| 3 | Computed from data supplied by the U.S. Department of Labor, Bureau of Labor Statistics. |
| 4 | For the period April 30, 1990, commencement of operations, through September 30, 1990. |
Past results are not predictive of results for future periods. The results shown are before taxes on fund distributions and sale of fund shares.
Average annual total returns based on a $1,000 investment (for periods ended September 30, 2014)*
| | | 1 year | | 5 years | | 10 years |
| | | | | | | |
| Class A shares | | –1.57% | | 10.54% | | 8.80% |
* Assumes reinvestment of all distributions and payment of the maximum 5.75% sales charge.
The total annual fund operating expense ratio is 1.07% for Class A shares as of the prospectus dated December 1, 2014 (unaudited).
Investment results assume all distributions are reinvested and reflect applicable fees and expenses. When applicable, investment results reflect fee waivers, without which results would have been lower. Visit americanfunds.com for more information.
Exploring the investment potential of outliers
With a global research capacity and a dedicated team of small-company equity analysts, the investment professionals of SMALLCAP World Fund can explore “outlier” stocks — those that might be out of favor, but have the potential to be strong investments over longer periods.

No single fund company can explore the breadth and depth of the thousands of small-capitalization stocks around the world. Each year, numerous small-cap companies are listed on markets across the globe — or close up shop after failing to make an impact. So conventional wisdom focuses on those small-cap stocks that are established — ones that are, in relative terms, reliable.
But any time you have conventional wisdom, you have outliers. These are the stocks that, for whatever reason, are outside of what the market considers the norm. And every now and then, the market misses a potentially strong investment.
“Outliers are the ones everyone else overlooks,” says Singapore-based portfolio manager Jonathan Knowles. “For whatever reason — and at times, for some good reasons — they’re simply not in favor. But just because they’re not in favor now doesn’t mean they don’t have potential. That’s what we look for — potential.”
It takes a lot of research and a lot of people around the world to properly investigate the potential of outlier stocks — and SMALLCAP has that capacity, says San Francisco-based portfolio manager Greg Wendt, who adds that it’s rare among small-cap mutual funds.
“I think the fund itself is an outlier,” Greg says. “If you look at our research, I don’t think there’s anybody doing small-cap research on a global basis to the extent we do, for a fund of this scale. I’d like to think our results over time have been outliers when you compare us to our peer group. And the fact we can identify and act on these stocks is also something that sets us apart.”
“This isn’t just about finding the next great company that nobody’s heard of, though that’s great when that happens. It’s more about investigating the companies people think they know already to see what additional potential they have.”
— Andraz Razen
Finding good candidates
The fund’s investment analysts, charged with covering specific sectors of the market, are always looking for new potential investments for the fund. When it comes to finding potential outliers, it’s less of a needle-in-a-haystack than you might think.
“This isn’t just about finding the next great company that nobody’s heard of, though that’s great when that happens,” says London-based portfolio manager Andraz Razen. “It’s more about investigating the companies people think they know already to see what additional potential they have.”
There are a variety of investment theses around outliers. Within SMALLCAP, analysts often look to companies that are doing well — and have the potential to fare even better than the market expects. These kinds of outliers can be expensive, as the market has “priced in” a certain amount of future success. In these cases, analysts have to be convinced that the company’s growth and future earnings will be better than the commonly held expectations of other investors.
When Andraz researched Intuitive Surgical, for example, he found that it was trading at a relatively high price compared to its earnings. Furthermore, Andraz found that some of the top surgeons in their fields disliked the company’s robotic surgical systems. “They basically thought they could do a better job than the robots, because they were the top surgeons around. And it’s true; when you’re the best, you don’t need that kind of help.”
But there were many other surgeons around the world who did find Intuitive Surgical’s products beneficial. “I saw that there were a lot of surgeons out there who were good, but maybe not best, and took advantage of their systems to get better.”
Standouts in difficult markets
Every stock sector has its own vagaries. Energy stocks, for example, suffer outsized effects from geopolitical events in oil-producing nations. In the industrial sector, manufacturers often find themselves beholden to the larger macroeconomic picture.
So when analysts find companies that can defy those overarching trends, they take notice.
New York-based analyst Dimitrije Mitrinovic covers the industrial sector, and has found small-cap industrial stocks, generally speaking, beholden to economic trends — except for a handful. TransDigm Group manufactures replacement parts for the aerospace and defense industry, particularly airlines. The company specializes in small-batch manufacturing, creating hard-to-find but necessary replacement parts for aircraft.
“These are highly specified parts that have significant aftermarket replacements,” Dimitrije says. “Think about the bathroom faucets on a Boeing 777. Those faucets will need to be replaced — and there aren’t a lot of aftermarket options. By focusing on these kinds of rare parts, TransDigm can charge a premium for them.”

“In order to be a successful long-term investor, you need to filter out the day-to-day stuff you see on the news and focus on what a company’s going to look like in three to five years. If you do that, you’ll find some outliers with the potential for some pretty high upside.”
— Blair Frank
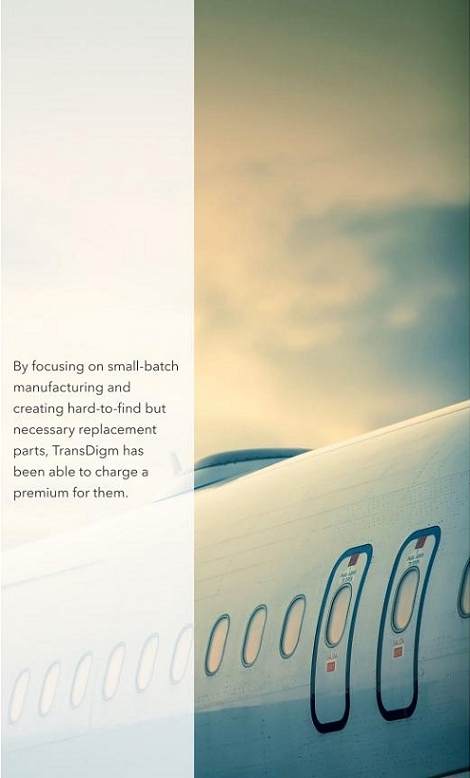
Dimitrije saw that, unlike some other manufacturers, TransDigm’s sales weren’t as impacted by economic trends. Likewise, it was relatively insulated from trends in the airline industry. “Those planes will need new parts at some point,” he says.
The innovators
New companies come to market nearly every day, with most claiming to be the “next big thing” in whatever they do. Finding the ones that truly innovate is yet another avenue toward finding a successful outlier.
San Francisco-based investment analyst Anne-Marie Peterson points to fast-food restaurant chain Domino’s Pizza as a great example of a successful outlier that has innovated in unusual ways, thanks to a strong business model and the embrace of new technologies.
“Pizza is basically bread, sauce and cheese, and Domino’s builds all its products off that, so right there you have a much simpler product line than other fast-food chains,” Anne-Marie says. “In addition, there’s room to grow, since the pizza market is still dominated by mom-and-pop businesses. Domino’s has countered that by adding digital and mobile ordering via the Internet, and that’s helped drive stronger year-over-year sales.”
Anne-Marie has found another potential innovator in zulily, an online retailer. The company selects a variety of consumer products from specialty retailers and boutique brands, then promotes selected items each day to the site’s subscribers.
“It’s a massive undertaking to do all this in the small-company equity space. And to do it on a global scale requires truly enormous resources. I think our unique approach lets us uncover these kinds of potential investments, and I think it sets us apart.”
— Greg Wendt
“These are highly curated items, and they know their customer base well,” Anne-Marie explains. “They feature unique stuff you can’t find elsewhere, and they’re selling it in such a way to make it a great experience for the shopper.”
The company’s second-quarter sales were up 97% from the year prior, and the customer base increased 86% over the same period. The retailer is a new addition to SMALLCAP over the past fiscal year, and Anne-Marie believes it will be a good long-term investment. “This is a business that’s creating a new experience for shoppers,” she says. “As with any investment, time will tell.”
Cyclical outliers
Other outliers can be cyclical in nature. These are companies that may have sound fundamentals, but are in a sector that has fallen out of favor in the market. This can happen for a variety of reasons. Some of the fund’s investment professionals see opportunity in a company that has seen its fortunes suffer in the past. Through research, they can determine whether new management, products or processes can reverse the trend, and then potentially buy the stock at a discount.
“We had the opportunity to invest in Netflix in October 2012, right after they split the mail DVD and online streaming businesses into two separate services,” says Los Angeles-based portfolio manager Blair Frank. “There was a huge customer backlash and the stock fell sharply; some in the market wondered if they were heading for bankruptcy. But our investment analysts believed strongly in the long-term potential of the business, and this was an opportunity for us to step up and own it, because it had been so expensive before when it was in favor.”
Other examples of cyclical outliers were in housing. “If you look at housing, you saw a lot of companies after the housing crash that looked cheap — not on a price-to-earnings basis, but on a price-to-book or price-to-sales basis,” Andraz says. “Those stocks can be in a pretty lonely place. Nobody talks about them. Nobody cares anymore. Our job is to figure out why, and whether there’s an opportunity.”
Finding these disparate opportunities takes a lot of work, of course. It’s not simply a matter of studying a company’s balance sheets. Analysts often visit companies, talk to management teams, inspect facilities and learn about how products are made. They talk to suppliers and competitors and experts as well.
“That’s the kind of research that allows us to focus on the fundamentals, the things that really matter,” Blair says. “In order to be a successful long-term investor, you need to filter out the day-to-day stuff you see on the news and focus on what a company’s going to look like in three to five years. If you do that, you’ll find some outliers with the potential for some pretty high upside.”
“It’s a massive undertaking to do all this in the small-company equity space,” Greg adds. “And to do it on a global scale requires truly enormous resources. I think our unique approach lets us uncover these kinds of potential investments, and I think it sets us apart.” n

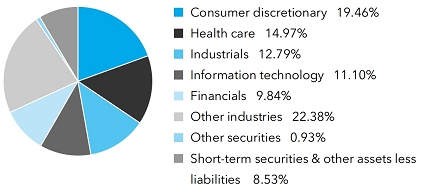
Summary investment portfolio September 30, 2014
| Industry sector diversification | Percent of net assets |
| Country diversification by domicile | | Percent of
net assets |
| United States | | | 46.03 | % |
| United Kingdom | | | 10.28 | |
| Euro zone* | | | 4.80 | |
| Japan | | | 4.56 | |
| India | | | 3.93 | |
| China | | | 3.80 | |
| Canada | | | 2.42 | |
| Hong Kong | | | 2.41 | |
| Philippines | | | 1.57 | |
| Switzerland | | | 1.43 | |
| Other countries | | | 10.24 | |
| Short-term securities & other assets less liabilities | | | 8.53 | |
| * | Countries using the euro as a common currency; those represented in the fund’s portfolio are Austria, Belgium, Finland, France, Germany, Greece, Ireland, Italy, the Netherlands, Portugal, Slovenia and Spain. |
| Common stocks 90.54% | | Shares | | | Value
(000) | |
| Consumer discretionary 19.46% | | | | | | | | |
| Netflix, Inc.1 | | | 943,743 | | | $ | 425,798 | |
| Domino’s Pizza, Inc.2 | | | 3,218,769 | | | | 247,716 | |
| Lions Gate Entertainment Corp.2 | | | 7,146,000 | | | | 235,604 | |
| Paddy Power PLC | | | 2,174,500 | | | | 157,018 | |
| Mr Price Group Ltd. | | | 6,915,383 | | | | 130,141 | |
| Melco International Development Ltd. | | | 55,345,000 | | | | 128,012 | |
| John Wiley & Sons, Inc., Class A | | | 1,971,083 | | | | 110,597 | |
| Five Below, Inc.1 | | | 2,530,694 | | | | 100,241 | |
| Ted Baker PLC2 | | | 3,154,993 | | | | 95,287 | |
| Dollarama Inc. | | | 1,039,000 | | | | 88,133 | |
| ASOS PLC1 | | | 2,264,755 | | | | 82,609 | |
| Other securities | | | | | | | 3,186,640 | |
| | | | | | | | 4,987,796 | |
| | | | | | | | | |
| Health care 14.97% | | | | | | | | |
| Myriad Genetics, Inc.1,2 | | | 5,725,556 | | | | 220,835 | |
| Incyte Corp.1 | | | 4,445,600 | | | | 218,057 | |
| Endo International PLC1 | | | 3,088,324 | | | | 211,134 | |
| Hikma Pharmaceuticals PLC | | | 5,625,153 | | | | 158,036 | |
| Regeneron Pharmaceuticals, Inc.1 | | | 424,900 | | | | 153,185 | |
| Synageva BioPharma Corp.1,2 | | | 2,190,074 | | | | 150,633 | |
| Molina Healthcare, Inc.1,2 | | | 3,488,100 | | | | 147,547 | |
| Centene Corp.1 | | | 1,735,000 | | | | 143,502 | |
| athenahealth, Inc.1 | | | 929,371 | | | | 122,389 | |
| Brookdale Senior Living Inc.1 | | | 3,255,250 | | | | 104,884 | |
| GW Pharmaceuticals PLC (ADR)1,2 | | | 1,215,600 | | | | 98,281 | |
| BioMarin Pharmaceutical Inc.1 | | | 1,347,500 | | | | 97,236 | |
| Ultragenyx Pharmaceutical Inc.1,2 | | | 1,628,457 | | | | 92,171 | |
| Illumina, Inc.1 | | | 543,900 | | | | 89,156 | |
| Sysmex Corp. | | | 2,150,000 | | | | 86,451 | |
| Other securities | | | | | | | 1,743,699 | |
| | | | | | | | 3,837,196 | |
| | | | | | | | | |
| Industrials 12.79% | | | | | | | | |
| AA PLC1,2 | | | 44,319,669 | | | | 231,712 | |
| Moog Inc., Class A1 | | | 2,572,800 | | | | 175,980 | |
| Hoshizaki Electric Co., Ltd. | | | 2,955,700 | | | | 137,982 | |
| ITT Corp. | | | 2,946,621 | | | | 132,421 | |
| Northgate PLC2 | | | 10,626,805 | | | | 83,347 | |
| Other securities | | | | | | | 2,518,521 | |
| | | | | | | | 3,279,963 | |
| | | | | | Value | |
| | | Shares | | | (000) | |
| Information technology 11.10% | | | | | | | | |
| TriQuint Semiconductor, Inc.1,2 | | | 9,012,000 | | | $ | 171,859 | |
| AAC Technologies Holdings Inc. | | | 29,287,250 | | | | 170,107 | |
| Palo Alto Networks, Inc.1 | | | 1,132,350 | | | | 111,084 | |
| Topcon Corp. | | | 4,664,710 | | | | 106,160 | |
| MercadoLibre, Inc. | | | 914,000 | | | | 99,306 | |
| Demandware, Inc.1 | | | 1,803,000 | | | | 91,809 | |
| Kakaku.com, Inc. | | | 5,995,000 | | | | 85,163 | |
| Halma PLC | | | 8,514,967 | | | | 84,481 | |
| Other securities | | | | | | | 1,926,754 | |
| | | | | | | | 2,846,723 | |
| | | | | | | | | |
| Financials 9.84% | | | | | | | | |
| SVB Financial Group1 | | | 1,355,900 | | | | 151,983 | |
| GT Capital Holdings, Inc. | | | 4,782,200 | | | | 112,955 | |
| Validus Holdings, Ltd. | | | 2,763,000 | | | | 108,144 | |
| Umpqua Holdings Corp. | | | 6,141,041 | | | | 101,143 | |
| Financial Engines, Inc. | | | 2,520,930 | | | | 86,254 | |
| Other securities | | | | | | | 1,963,366 | |
| | | | | | | | 2,523,845 | |
| | | | | | | | | |
| Consumer staples 5.32% | | | | | | | | |
| Emami Ltd. | | | 9,430,000 | | | | 106,454 | |
| Raia Drogasil SA, ordinary nominative | | | 10,577,374 | | | | 90,487 | |
| Puregold Price Club, Inc. | | | 115,461,300 | | | | 89,277 | |
| Super Group Ltd.2 | | | 89,194,000 | | | | 89,145 | |
| Other securities | | | | | | | 987,115 | |
| | | | | | | | 1,362,478 | |
| | | | | | | | | |
| Energy 4.52% | | | | | | | | |
| InterOil Corp.1 | | | 2,344,500 | | | | 127,212 | |
| Ophir Energy PLC1 | | | 25,755,318 | | | | 95,740 | |
| Bonanza Creek Energy, Inc.1 | | | 1,454,300 | | | | 82,750 | |
| Other securities | | | | | | | 853,448 | |
| | | | | | | | 1,159,150 | |
| | | | | | | | | |
| Materials 4.48% | | | | | | | | |
| James Hardie Industries PLC (CDI) | | | 9,733,929 | | | | 102,015 | |
| Chr. Hansen Holding A/S | | | 2,617,000 | | | | 101,153 | |
| AptarGroup, Inc. | | | 1,600,000 | | | | 97,120 | |
| Other securities | | | | | | | 847,350 | |
| | | | | | | | 1,147,638 | |
| | | | | | | | | |
| Utilities 1.86% | | | | | | | | |
| ENN Energy Holdings Ltd. | | | 29,722,296 | | | | 194,452 | |
| Other securities | | | | | | | 282,931 | |
| | | | | | | | 477,383 | |
| | | | | | | | | |
| Telecommunication services 1.30% | | | | | | | | |
| Other securities | | | | | | | 332,817 | |
| | | | | | | | | |
| | | | | | | | | |
| Miscellaneous 4.90% | | | | | | | | |
| Other common stocks in initial period of acquisition | | | | | | | 1,257,346 | |
| | | | | | | | | |
| Total common stocks (cost: $17,510,111,000) | | | | | | | 23,212,335 | |
| | | | | | | | | |
| Preferred securities 0.01% | | | | | | | | |
| Miscellaneous 0.01% | | | | | | | | |
| Other preferred securities in initial period of acquisition | | | | | | | 2,709 | |
| | | | | | | | | |
| Total preferred securities (cost: $1,515,000) | | | | | | | 2,709 | |
| Rights & warrants 0.05% | | Shares | | | Value
(000) | |
| Other 0.05% | | | | | | | | |
| Other securities | | | | | | $ | 12,845 | |
| | | | | | | | | |
| Miscellaneous 0.00% | | | | | | | | |
| Other rights & warrants in initial period of acquisition | | | | | | | 997 | |
| | | | | | | | | |
| Total rights & warrants (cost: $927,000) | | | | | | | 13,842 | |
| | | | | | | | | |
| Convertible stocks 0.54% | | | | | | | | |
| Other 0.54% | | | | | | | | |
| Other securities | | | | | | | 138,610 | |
| | | | | | | | | |
| Total convertible stocks (cost: $140,877,000) | | | | | | | 138,610 | |
| | | | | | | | | |
| Convertible bonds 0.04% | | | Principal
amount
(000) | | | | | |
| Energy 0.04% | | | | | | | | |
| Other securities | | | | | | | 9,730 | |
| | | | | | | | | |
| Total convertible bonds (cost: $10,833,000) | | | | | | | 9,730 | |
| | | | | | | | | |
| Bonds, notes & other debt instruments 0.29% | | | | | | |
| Other 0.29% | | | | | | | | |
| Other securities | | | | | | | 74,238 | |
| | | | | | | | | |
| Total bonds, notes & other debt instruments (cost: $76,126,000) | | | | | | 74,238 | |
| | | | | | | | | |
| Short-term securities 8.54% | | | | | | | | |
| Bank of Nova Scotia 0.17%-0.18% due 1/13/2015-1/15/20153 | | $ | 111,100 | | | | 111,061 | |
| Electricité de France 0.20%-0.33% due 10/1/2014-1/2/20153 | | | 96,800 | | | | 96,754 | |
| Fannie Mae 0.07%-0.14% due 11/17/2014-4/1/2015 | | | 276,800 | | | | 276,779 | |
| Federal Home Loan Bank 0.07%-0.17% due 10/8/2014-7/21/2015 | | | 283,880 | | | | 283,841 | |
| Freddie Mac 0.09%-0.15% due 10/7/2014-7/9/2015 | | | 403,200 | | | | 403,051 | |
| Nordea North America, Inc. 0.18%-0.22% due 10/8/2014-1/23/20153 | | | 90,000 | | | | 89,979 | |
| Reckitt Benckiser Treasury Services PLC 0.20%-0.23% due 11/21/2014-2/12/20153 | | | 95,000 | | | | 94,970 | |
| Other securities | | | | | | | 833,517 | |
| | | | | | | | | |
| Total short-term securities (cost: $2,189,682,000) | | | | | | | 2,189,952 | |
| Total investment securities 100.01% (cost: $19,930,071,000) | | | | | | | 25,641,416 | |
| Other assets less liabilities (0.01)% | | | | | | | (3,260 | ) |
| | | | | | | | | |
| Net assets 100.00% | | | | | | $ | 25,638,156 | |
This summary investment portfolio is designed to streamline the report and help investors better focus on the fund’s principal holdings. See the inside back cover for details on how to obtain a complete schedule of portfolio holdings.
As permitted by U.S. Securities and Exchange Commission regulations, “Miscellaneous” securities include holdings in their first year of acquisition that have not previously been publicly disclosed.
“Other securities” includes all issues that are not disclosed separately in the summary investment portfolio. Some of these securities (with an aggregated value of $158,249,000, an aggregated cost of $191,449,000, and which represented .62% of the net assets of the fund) were acquired from 10/5/2005 to 9/23/2014 through private placement transactions exempt from registration under the Securities Act of 1933, which may subject them to legal or contractual restrictions on resale.
Forward currency contracts
The fund has entered into forward currency contracts to sell currencies as shown in the following table. The average notional amount of open forward currency contracts was $159,291,000 over the prior 12-month period.
| | | | | | | Contract amount | | Unrealized
appreciation | |
| | | Settlement date | | Counterparty | | Receive
(000) | | Deliver
(000) | | at 9/30/2014
(000) | |
| Sales: | | | | | | | | | | | | | |
| Australian dollars | | 10/20/2014 | | Barclays Bank PLC | | $2,634 | | A$2,900 | | | $ | 99 | |
| Australian dollars | | 11/18/2014 | | UBS AG | | $3,625 | | A$4,000 | | | | 135 | |
| Canadian dollars | | 10/10/2014 | | UBS AG | | $31,848 | | C$34,000 | | | | 1,497 | |
| Euros | | 10/17/2014 | | HSBC Bank | | $7,527 | | €5,825 | | | | 169 | |
| Japanese yen | | 10/16/2014 | | UBS AG | | $8,229 | | ¥875,000 | | | | 251 | |
| Japanese yen | | 10/17/2014 | | Barclays Bank PLC | | $60,329 | | ¥6,440,000 | | | | 1,603 | |
| Japanese yen | | 10/23/2014 | | Barclays Bank PLC | | $8,398 | | ¥900,000 | | | | 191 | |
| Japanese yen | | 11/14/2014 | | Bank of New York Mellon | | $20,786 | | ¥2,000,000 | | | | 1,332 | |
| | | | | | | | | | | | | | |
| | | | | | | | | | | | $ | 5,277 | |
Investments in affiliates
A company is an affiliate of the fund under the Investment Company Act of 1940 if the fund’s holdings in that company represent 5% or more of the outstanding voting shares. The value of the fund’s affiliated-company holdings is either shown in the summary investment portfolio or included in the value of “Other securities” under the respective industry sectors. Further details on such holdings and related transactions during the year ended September 30, 2014, appear below.
| | | Beginning
shares or
principal
amount | | | Additions | | | Reductions | | | Ending
shares or
principal
amount | | | Dividend
or interest
income
(000) | | | Value of
affiliates at
9/30/2014
(000) | |
| Domino’s Pizza, Inc. | | | 2,940,000 | | | | 278,769 | | | | — | | | | 3,218,769 | | | $ | 2,913 | | | $ | 247,716 | |
| Lions Gate Entertainment Corp. | | | 7,381,000 | | | | 1,226,605 | | | | 1,461,605 | | | | 7,146,000 | | | | 1,368 | | | | 235,604 | |
| AA PLC1 | | | — | | | | 44,319,669 | | | | — | | | | 44,319,669 | | | | — | | | | 231,712 | |
| Myriad Genetics, Inc.1 | | | 2,758,800 | | | | 2,966,756 | | | | — | | | | 5,725,556 | | | | — | | | | 220,835 | |
| TriQuint Semiconductor, Inc.1 | | | 2,619,500 | | | | 6,392,500 | | | | — | | | | 9,012,000 | | | | — | | | | 171,859 | |
| Synageva BioPharma Corp.1 | | | 2,230,074 | | | | 44,700 | | | | 84,700 | | | | 2,190,074 | | | | — | | | | 150,633 | |
| Molina Healthcare, Inc.1 | | | 3,417,000 | | | | 71,100 | | | | — | | | | 3,488,100 | | | | — | | | | 147,547 | |
| GW Pharmaceuticals PLC (ADR)1 | | | — | | | | 1,215,600 | | | | — | | | | 1,215,600 | | | | — | | | | 98,281 | |
| Ted Baker PLC | | | 2,882,993 | | | | 272,000 | | | | — | | | | 3,154,993 | | | | 1,681 | | | | 95,287 | |
| Ultragenyx Pharmaceutical Inc.1 | | | — | | | | 2,518,428 | | | | 889,971 | | | | 1,628,457 | | | | — | | | | 92,171 | |
| Ultragenyx Pharmaceutical Inc., Series B, convertible preferred | | | 2,789,614 | | | | — | | | | 2,789,614 | | | | — | | | | 196 | | | | — | |
| Super Group Ltd. | | | 44,597,000 | | | | 44,597,000 | | | | — | | | | 89,194,000 | | | | 3,218 | | | | 89,145 | |
| Northgate PLC | | | 10,626,805 | | | | — | | | | — | | | | 10,626,805 | | | | 1,774 | | | | 83,347 | |
| bluebird bio, Inc.1 | | | 1,695,648 | | | | 1,771,565 | | | | 1,179,648 | | | | 2,287,565 | | | | — | | | | 82,078 | |
| Stock Spirits Group PLC | | | — | | | | 16,000,000 | | | | — | | | | 16,000,000 | | | | 257 | | | | 75,636 | |
| Intrepid Potash, Inc.1 | | | — | | | | 4,895,000 | | | | — | | | | 4,895,000 | | | | — | | | | 75,628 | |
| Zeltiq Aesthetics, Inc.1 | | | — | | | | 3,002,044 | | | | — | | | | 3,002,044 | | | | — | | | | 67,936 | |
| Xoom Corp.1 | | | — | | | | 3,035,570 | | | | — | | | | 3,035,570 | | | | — | | | | 66,631 | |
| Takeuchi Mfg. Co., Ltd. | | | — | | | | 1,232,300 | | | | — | | | | 1,232,300 | | | | 121 | | | | 58,539 | |
| King Slide Works Co., Ltd. | | | 1,999,000 | | | | 2,914,000 | | | | — | | | | 4,913,000 | | | | 821 | | | | 55,478 | |
| Coupons.com Inc.1 | | | — | | | | 4,587,996 | | | | — | | | | 4,587,996 | | | | — | | | | 54,872 | |
| Coupons.com Inc., Series B, convertible preferred1 | | | 8,191,724 | | | | — | | | | 8,191,724 | | | | — | | | | — | | | | — | |
| Boer Power Holdings Ltd. | | | 39,202,000 | | | | — | | | | — | | | | 39,202,000 | | | | 1,566 | | | | 53,415 | |
| Cox & Kings Ltd. | | | 10,592,000 | | | | — | | | | 1,000,000 | | | | 9,592,000 | | | | 157 | | | | 49,078 | |
| Cox & Kings Ltd. (GDR)4 | | | 330,000 | | | | — | | | | — | | | | 330,000 | | | | 6 | | | | 1,688 | |
| Achillion Pharmaceuticals, Inc.1 | | | 4,130,000 | | | | 800,000 | | | | — | | | | 4,930,000 | | | | — | | | | 49,201 | |
| Kaveri Seed Co. Ltd. | | | — | | | | 3,470,177 | | | | — | | | | 3,470,177 | | | | 134 | | | | 45,599 | |
| 7-Eleven Malaysia Holdings Bhd.1 | | | — | | | | 76,209,600 | | | | — | | | | 76,209,600 | | | | — | | | | 41,584 | |
| Continental Building Products, Inc.1 | | | — | | | | 2,705,000 | | | | — | | | | 2,705,000 | | | | — | | | | 39,493 | |
| Galapagos NV1 | | | 2,378,928 | | | | 43,499 | | | | — | | | | 2,422,427 | | | | — | | | | 36,655 | |
| RIB Software AG | | | — | | | | 2,476,356 | | | | — | | | | 2,476,356 | | | | 130 | | | | 33,921 | |
| Actua Corp1 | | | 1,137,000 | | | | 957,000 | | | | — | | | | 2,094,000 | | | | — | | | | 33,546 | |
| Sirius Minerals PLC1 | | | 52,304,735 | | | | 87,228,725 | | | | — | | | | 139,533,460 | | | | — | | | | 31,103 | |
| | | Beginning
shares or
principal
amount | | | Additions | | | Reductions | | | Ending
shares or
principal
amount | | | Dividend
or interest
income
(000) | | | Value of
affiliates at
9/30/2014
(000) | |
| Sirius Minerals PLC, warrants, expire 20151 | | | — | | | | 40,000,000 | | | | — | | | | 40,000,000 | | | $ | — | | | $ | 1,245 | |
| KEYW Holding Corp.1 | | | 2,836,400 | | | | — | | | | — | | | | 2,836,400 | | | | — | | | | 31,399 | |
| ARC Document Solutions, Inc.1 | | | 2,765,764 | | | | 1,778,354 | | | | 809,363 | | | | 3,734,755 | | | | — | | | | 30,252 | |
| Mistras Group, Inc.1 | | | 2,052,000 | | | | — | | | | 592,000 | | | | 1,460,000 | | | | — | | | | 29,784 | |
| Poya Co., Ltd. | | | — | | | | 4,712,660 | | | | — | | | | 4,712,660 | | | | 598 | | | | 29,435 | |
| Installed Building Products, Inc.1 | | | — | | | | 2,068,345 | | | | — | | | | 2,068,345 | | | | — | | | | 29,060 | |
| Stock Building Supply Holdings, Inc.1 | | | 1,000,000 | | | | 785,000 | | | | — | | | | 1,785,000 | | | | — | | | | 28,042 | |
| Repco Home Finance Ltd. | | | — | | | | 4,040,440 | | | | — | | | | 4,040,440 | | | | 80 | | | | 27,919 | |
| Greenko Group PLC1 | | | 9,748,155 | | | | — | | | | — | | | | 9,748,155 | | | | — | | | | 26,905 | |
| VST Industries Ltd. | | | 715,400 | | | | 288,000 | | | | — | | | | 1,003,400 | | | | 1,168 | | | | 26,454 | |
| Manappuram Finance Ltd. | | | 54,930,986 | | | | — | | | | — | | | | 54,930,986 | | | | 1,607 | | | | 26,283 | |
| Inphi Corp.1 | | | 762,363 | | | | 1,023,336 | | | | — | | | | 1,785,699 | | | | — | | | | 25,678 | |
| XenoPort, Inc.1 | | | 3,620,000 | | | | 1,149,000 | | | | — | | | | 4,769,000 | | | | — | | | | 25,657 | |
| Neovasc Inc.1 | | | — | | | | 4,277,000 | | | | — | | | | 4,277,000 | | | | — | | | | 24,269 | |
| Suprema Inc.1 | | | 868,200 | | | | — | | | | — | | | | 868,200 | | | | — | | | | 24,065 | |
| Gem Diamonds Ltd.1 | | | 7,750,000 | | | | 1,861,686 | | | | 1,986,686 | | | | 7,625,000 | | | | — | | | | 23,734 | |
| Lekoil Ltd. (CDI)1 | | | 14,070,000 | | | | — | | | | — | | | | 14,070,000 | | | | — | | | | 15,511 | |
| Lekoil Ltd. (CDI)1,3 | | | — | | | | 5,360,400 | | | | — | | | | 5,360,400 | | | | — | | | | 5,909 | |
| ValueVision Media, Inc., Class A1 | | | 3,440,761 | | | | 803,370 | | | | 256,591 | | | | 3,987,540 | | | | — | | | | 20,456 | |
| TravelCenters of America LLC1 | | | 1,581,250 | | | | 442,500 | | | | — | | | | 2,023,750 | | | | — | | | | 19,995 | |
| Mothercare PLC | | | 4,480,000 | | | | — | | | | 30,000 | | | | 4,450,000 | | | | — | | | | 19,316 | |
| Mahindra Lifespace Developers Ltd. | | | 2,157,380 | | | | — | | | | — | | | | 2,157,380 | | | | 428 | | | | 17,995 | |
| Flexion Therapeutics, Inc.1 | | | — | | | | 979,252 | | | | — | | | | 979,252 | | | | — | | | | 17,881 | |
| ChemoCentryx, Inc.1 | | | 3,131,800 | | | | 295,000 | | | | — | | | | 3,426,800 | | | | — | | | | 15,421 | |
| Mytrah Energy Ltd.1 | | | 10,418,000 | | | | — | | | | — | | | | 10,418,000 | | | | — | | | | 15,010 | |
| Houston Wire & Cable Co. | | | 1,678,900 | | | | — | | | | 528,900 | | | | 1,150,000 | | | | 587 | | | | 13,777 | |
| GI Dynamics, Inc. (CDI)1 | | | — | | | | 30,320,000 | | | | — | | | | 30,320,000 | | | | — | | | | 12,742 | |
| Papa Murphy’s Holdings, Inc.1 | | | — | | | | 1,102,000 | | | | — | | | | 1,102,000 | | | | — | | | | 11,240 | |
| Tribhovandas Bhimji Zaveri Ltd. | | | 3,439,332 | | | | 896,400 | | | | — | | | | 4,335,732 | | | | 160 | | | | 11,218 | |
| BNK Petroleum Inc.1 | | | 11,543,380 | | | | 1,261,534 | | | | — | | | | 12,804,914 | | | | — | | | | 10,633 | |
| Frigoglass SAIC1 | | | 3,052,380 | | | | — | | | | — | | | | 3,052,380 | | | | — | | | | 10,409 | |
| J. Kumar Infraprojects Ltd. | | | — | | | | 1,780,000 | | | | — | | | | 1,780,000 | | | | 11 | | | | 9,074 | |
| iEnergizer Ltd.1 | | | — | | | | 7,650,500 | | | | — | | | | 7,650,500 | | | | — | | | | 8,496 | |
| ITT Educational Services, Inc.1 | | | — | | | | 1,519,000 | | | | — | | | | 1,519,000 | | | | — | | | | 6,517 | |
| Savannah Petroleum PLC1 | | | — | | | | 7,844,000 | | | | — | | | | 7,844,000 | | | | — | | | | 5,993 | |
| Tilaknager Industries Ltd. | | | 8,890,000 | | | | — | | | | 619,914 | | | | 8,270,086 | | | | 109 | | | | 5,966 | |
| Mood Media Corp.1 | | | 6,375,000 | | | | — | | | | 6,375,000 | | | | — | | | | — | | | | 3,700 | |
| Mood Media Corp. (CDI)1 | | | 3,710,000 | | | | — | | | | 3,710,000 | | | | — | | | | — | | | | 2,153 | |
| San Leon Energy PLC1 | | | — | | | | 155,300,000 | | | | — | | | | 155,300,000 | | | | — | | | | 5,602 | |
| Talwalkars Better Value Fitness Ltd. | | | 1,694,000 | | | | — | | | | — | | | | 1,694,000 | | | | 42 | | | | 5,589 | |
| Tethys Petroleum Ltd.1 | | | 12,161,000 | | | | — | | | | — | | | | 12,161,000 | | | | — | | | | 3,366 | |
| Tethys Petroleum Ltd. (GBP denominated)1 | | | 1,147,487 | | | | 3,500,000 | | | | — | | | | 4,647,487 | | | | — | | | | 1,253 | |
| Powerland AG, non-registered shares1 | | | 1,200,000 | | | | — | | | | — | | | | 1,200,000 | | | | — | | | | 4,092 | |
| Cape Lambert Resources Ltd. | | | 47,330,825 | | | | — | | | | — | | | | 47,330,825 | | | | 841 | | | | 3,813 | |
| Duluth Metals Ltd.1 | | | 7,699,700 | | | | — | | | | 675,700 | | | | 7,024,000 | | | | — | | | | 1,505 | |
| China High Precision Automation Group Ltd.1,4 | | | 67,422,000 | | | | — | | | | 14,390,000 | | | | 53,032,000 | | | | — | | | | 683 | |
| Agilysys, Inc.1,5 | | | 1,280,591 | | | | — | | | | 820,251 | | | | 460,340 | | | | — | | | | — | |
| AIA Engineering Ltd.5 | | | 4,840,050 | | | | — | | | | 4,840,050 | | | | — | | | | — | | | | — | |
| ArthroCare Corp.1,5 | | | 2,232,950 | | | | 2,129 | | | | 2,235,079 | | | | — | | | | — | | | | — | |
| Autoneum Holding AG1,5 | | | 373,780 | | | | — | | | | 373,780 | | | | — | | | | — | | | | — | |
| Bizim Toptan Satis Magazalari AS, non-registered shares5 | | | 2,466,000 | | | | — | | | | 2,066,518 | | | | 399,482 | | | | 231 | | | | — | |
| Body Central Corp5 | | | — | | | | 1,080,000 | | | | 1,080,000 | | | | — | | | | — | | | | — | |
| Cadence Pharmaceuticals, Inc.1,5 | | | 5,939,969 | | | | — | | | | 5,939,969 | | | | — | | | | — | | | | — | |
| CEC Unet PLC1,5 | | | 35,100,775 | | | | — | | | | 35,100,775 | | | | — | | | | — | | | | — | |
| Comfort Systems USA, Inc.5 | | | 2,476,000 | | | | — | | | | 2,476,000 | | | | — | | | | 136 | | | | — | |
| Demandware, Inc.1,5 | | | 2,200,000 | | | | 50,000 | | | | 447,000 | | | | 1,803,000 | | | | — | | | | — | |
| Domino’s Pizza Enterprises Ltd.5 | | | 4,752,365 | | | | — | | | | 2,400,782 | | | | 2,351,583 | | | | 1,106 | | | | — | |
| Emeritus Corp.1,5 | | | 2,729,700 | | | | 1,050,000 | | | | 3,779,700 | | | | — | | | | — | | | | — | |
| Exelixis, Inc.1,5 | | | 9,216,800 | | | | 600,552 | | | | 9,817,352 | | | | — | | | | — | | | | — | |
| Falkland Oil and Gas Ltd.1,5 | | | 24,225,000 | | | | — | | | | — | | | | 24,225,000 | | | | — | | | | — | |
| First Southern Bancorp, Inc.1,3,5 | | | 1,344,915 | | | | 889,774 | | | | 2,234,689 | | | | — | | | | — | | | | — | |
| First Southern Bancorp, Inc., Series C, convertible preferred1,5,6 | | | 2,299 | | | | — | | | | 2,299 | | | | — | | | | — | | | | — | |
| Goodpack Ltd.5 | | | 30,777,000 | | | | — | | | | 30,777,000 | | | | — | | | | 1,226 | | | | — | |
| | | Beginning
shares or
principal
amount | | | Additions | | | Reductions | | | Ending
shares or
principal
amount | | | Dividend
or interest
income
(000) | | | Value of
affiliates at
9/30/2014
(000) | |
| Gran Colombia Gold SA5 | | | 906,700 | | | | — | | | | 906,700 | | | | — | | | $ | — | | | $ | — | |
| Home Federal Bancorp, Inc.5 | | | 1,384,249 | | | | — | | | | 1,384,249 | | | | — | | | | 166 | | | | — | |
| ICG Group, Inc.1,5 | | | 1,137,000 | | | | 957,000 | | | | 2,094,000 | | | | — | | | | — | | | | — | |
| Iridium Communications Inc.1,5 | | | 4,721,812 | | | | 2,842,327 | | | | 2,674,524 | | | | 4,889,615 | | | | — | | | | — | |
| Iridium Communications Inc., Series A, convertible preferred3,5 | | | 60,000 | | | | — | | | | — | | | | 60,000 | | | | 420 | | | | — | |
| Kingdee International Software Group Co. Ltd.1,5 | | | 134,868,000 | | | | — | | | | 84,868,000 | | | | 50,000,000 | | | | — | | | | — | |
| LSL Property Services PLC5 | | | 5,956,350 | | | | — | | | | 1,790,000 | | | | 4,166,350 | | | | 2,103 | | | | — | |
| Manila Water Co., Inc.5 | | | 104,200,900 | | | | — | | | | 22,900,000 | | | | 81,300,900 | | | | 1,253 | | | | — | |
| MonotaRO Co., Ltd.5 | | | 3,348,300 | | | | 224,400 | | | | 1,058,900 | | | | 2,513,800 | | | | 301 | | | | — | |
| Montage Technology Group Ltd.1,5 | | | 1,231,884 | | | | 967,916 | | | | 1,019,900 | | | | 1,179,900 | | | | — | | | | — | |
| Moog Inc., Class A1,5 | | | 2,282,800 | | | | 415,000 | | | | 125,000 | | | | 2,572,800 | | | | — | | | | — | |
| Mvelaserve Ltd.5 | | | 9,194,800 | | | | — | | | | 9,194,800 | | | | — | | | | — | | | | — | |
| NII Capital Corp. 10.00% 20165,6 | | | — | | | $ | 12,125,000 | | | | — | | | $ | 12,125,000 | | | | 1,038 | | | | — | |
| NII Capital Corp. 7.625% 20215 | | | — | | | $ | 4,000,000 | | | | — | | | $ | 4,000,000 | | | | 244 | | | | — | |
| NII Holdings, Inc., Class B1,5 | | | 5,595,000 | | | | 6,442,000 | | | | 12,037,000 | | | | — | | | | — | | | | — | |
| OM Group, Inc.5 | | | 1,820,000 | | | | 89,000 | | | | 349,000 | | | | 1,560,000 | | | | 423 | | | | — | |
| OpenTable, Inc.1,5 | | | 1,490,000 | | | | 290,000 | | | | 1,780,000 | | | | — | | | | — | | | | — | |
| Ophir Energy PLC1,5 | | | 30,708,378 | | | | 5,918,400 | | | | 10,871,460 | | | | 25,755,318 | | | | — | | | | — | |
| Orexigen Therapeutics, Inc.1,5 | | | 6,535,000 | | | | 550,200 | | | | 2,365,545 | | | | 4,719,655 | | | | — | | | | — | |
| Orthofix International NV1,5 | | | 1,116,826 | | | | — | | | | 739,826 | | | | 377,000 | | | | — | | | | — | |
| Petrodorado Energy Ltd.5 | | | 38,400,000 | | | | — | | | | 38,400,000 | | | | — | | | | — | | | | — | |
| Puregold Price Club, Inc.5 | | | 149,636,300 | | | | 2,555,000 | | | | 36,730,000 | | | | 115,461,300 | | | | 551 | | | | — | |
| Rally Software Development Corp.1,5 | | | 656,217 | | | | 1,043,783 | | | | 1,300,000 | | | | 400,000 | | | | — | | | | — | |
| Responsys, Inc.1,5 | | | 2,815,000 | | | | — | | | | 2,815,000 | | | | — | | | | — | | | | — | |
| Schweitzer-Mauduit International, Inc.5 | | | 1,742,800 | | | | — | | | | 1,742,800 | | | | — | | | | 796 | | | | — | |
| Tsukui Corp.5 | | | 2,595,000 | | | | — | | | | 2,595,000 | | | | — | | | | 70 | | | | — | |
| Vistaprint NV1,5 | | | 1,860,000 | | | | — | | | | 1,860,000 | | | | — | | | | — | | | | — | |
| Vocus, Inc.1,5 | | | 1,513,538 | | | | — | | | | 1,513,538 | | | | — | | | | — | | | | — | |
| | | | | | | | | | | | | | | | | | | $ | 30,037 | | | $ | 3,511,714 | |
The following footnotes apply to either the individual securities noted or one or more of the securities aggregated and listed as a single line item.
| 1 | Security did not produce income during the last 12 months. |
| 2 | Represents an affiliated company as defined under the Investment Company Act of 1940. |
| 3 | Acquired in a transaction exempt from registration under Rule 144A or Section 4(2) of the Securities Act of 1933. May be resold in the U.S. in transactions exempt from registration, normally to qualified institutional buyers. The total value of all such securities, including those in “Other securities,” was $1,109,204,000, which represented 4.33% of the net assets of the fund. |
| 4 | Valued under fair value procedures adopted by authority of the board of directors. The total value of all such securities including those in “Miscellaneous” and “Other securities,” was $245,667,000, which represented .96% of the net assets of the fund. |
| 5 | Unaffiliated issuer at 9/30/2014. |
| 6 | Scheduled interest and/or principal payment was not received. |
Key to abbreviations and symbols
ADR = American Depositary Receipts
CDI = CREST Depository Receipts
GDR = Global Depositary Receipts
A$ = Australian dollars
C$ = Canadian dollars
€ = Euros
GBP = British pounds
¥ = Japanese yen
See Notes to Financial Statements
Financial statements
| Statement of assets and liabilities | | | | | | | | |
| at September 30, 2014 | | | (dollars in thousands) |
| | | | | | | | | |
| Assets: | | | | | | | | |
| Investment securities, at value: | | | | | | | | |
| Unaffiliated issuers (cost: $17,023,261) | | $ | 22,129,702 | | | | | |
| Affiliated issuers (cost: $2,906,810) | | | 3,511,714 | | | $ | 25,641,416 | |
| Cash denominated in currencies other than U.S. dollars (cost: $2,191) | | | | | | | 1,567 | |
| Cash | | | | | | | 77 | |
| Unrealized appreciation on open forward currency contracts | | | | | | | 5,277 | |
| Receivables for: | | | | | | | | |
| Sales of investments | | | 79,077 | | | | | |
| Sales of fund’s shares | | | 30,804 | | | | | |
| Closed forward currency contracts | | | 1,213 | | | | | |
| Dividends and interest | | | 24,273 | | | | | |
| Other | | | 203 | | | | 135,570 | |
| | | | | | | | 25,783,907 | |
| Liabilities: | | | | | | | | |
| Payables for: | | | | | | | | |
| Purchases of investments | | | 77,374 | | | | | |
| Repurchases of fund’s shares | | | 32,594 | | | | | |
| Investment advisory services | | | 13,641 | | | | | |
| Services provided by related parties | | | 9,176 | | | | | |
| Directors’ deferred compensation | | | 3,269 | | | | | |
| Other | | | 9,697 | | | | 145,751 | |
| Net assets at September 30, 2014 | | | | | | $ | 25,638,156 | |
| | | | | | | | | |
| Net assets consist of: | | | | | | | | |
| Capital paid in on shares of capital stock | | | | | | $ | 17,656,497 | |
| Accumulated net investment loss | | | | | | | (147,181 | ) |
| Undistributed net realized gain | | | | | | | 2,421,663 | |
| Net unrealized appreciation | | | | | | | 5,707,177 | |
| Net assets at September 30, 2014 | | | | | | $ | 25,638,156 | |
| (dollars and shares in thousands, except per-share amounts) |
| |
Total authorized capital stock — 1,000,000 shares,
$.01 par value (530,387 total shares outstanding) | | | |
| | | | | | | | | | | | | |
| | | Net assets | | | Shares
outstanding | | | Net asset
value per share | |
| Class A | | $ | 16,856,374 | | | | 346,410 | | | $ | 48.66 | |
| Class B | | | 120,965 | | | | 2,669 | | | | 45.33 | |
| Class C | | | 892,140 | | | | 19,927 | | | | 44.77 | |
| Class F-1 | | | 624,177 | | | | 12,943 | | | | 48.23 | |
| Class F-2 | | | 1,207,610 | | | | 24,687 | | | | 48.92 | |
| Class 529-A | | | 933,180 | | | | 19,326 | | | | 48.29 | |
| Class 529-B | | | 16,958 | | | | 371 | | | | 45.75 | |
| Class 529-C | | | 280,051 | | | | 6,155 | | | | 45.50 | |
| Class 529-E | | | 49,116 | | | | 1,036 | | | | 47.41 | |
| Class 529-F-1 | | | 79,737 | | | | 1,643 | | | | 48.53 | |
| Class R-1 | | | 39,493 | | | | 861 | | | | 45.85 | |
| Class R-2 | | | 689,022 | | | | 15,030 | | | | 45.84 | |
| Class R-2E | | | 10 | | | | — | * | | | 48.67 | |
| Class R-3 | | | 810,786 | | | | 17,128 | | | | 47.34 | |
| Class R-4 | | | 727,245 | | | | 15,048 | | | | 48.33 | |
| Class R-5 | | | 452,290 | | | | 9,158 | | | | 49.39 | |
| Class R-6 | | | 1,859,002 | | | | 37,995 | | | | 48.93 | |
| | | | | | | | | | | | | |
| *Amount less than one thousand. | | | | | | | | | | | | |
| | | | | | | | | | | | | |
| See Notes to Financial Statements | | | | | | | | | | | | |
| Statement of operations | | | | | | |
| for the year ended September 30, 2014 | (dollars in thousands) |
| | | |
| Investment income: | | | | | | | | |
| Income: | | | | | | | | |
| Dividends (net of non-U.S. taxes of $13,443; also includes $28,755 from affiliates) | | $ | 277,815 | | | | | |
| Interest (includes $1,282 from affiliates) | | | 5,929 | | | $ | 283,744 | |
| Fees and expenses*: | | | | | | | | |
| Investment advisory services | | | 163,611 | | | | | |
| Distribution services | | | 71,331 | | | | | |
| Transfer agent services | | | 40,304 | | | | | |
| Administrative services | | | 5,989 | | | | | |
| Reports to shareholders | | | 1,427 | | | | | |
| Registration statement and prospectus | | | 608 | | | | | |
| Directors’ compensation | | | 825 | | | | | |
| Auditing and legal | | | 229 | | | | | |
| Custodian | | | 3,977 | | | | | |
| Other | | | 1,449 | | | | 289,750 | |
| Net investment loss | | | | | | | (6,006 | ) |
| | | | | | | | | |
| Net realized gain and unrealized depreciation on investments, forward currency contracts and currency: | | | | | | | | |
| Net realized gain (loss) on: | | | | | | | | |
| Investments (net of non-U.S. taxes of $337; also includes $294,663 net gain from affiliates) | | | 2,596,381 | | | | | |
| Forward currency contracts | | | 9,243 | | | | | |
| Currency transactions | | | (2,678 | ) | | | 2,602,946 | |
| Net unrealized (depreciation) appreciation on: | | | | | | | | |
| Investments (net of non-U.S. taxes of $8,985) | | | (1,526,341 | ) | | | | |
| Forward currency contracts | | | 7,315 | | | | | |
| Currency translations | | | (644 | ) | | | (1,519,670 | ) |
| Net realized gain and unrealized depreciation on investments, forward currency contracts and currency | | | | | | | 1,083,276 | |
| | | | | | | | | |
| Net increase in net assets resulting from operations | | | | | | $ | 1,077,270 | |
*Additional information related to class-specific fees and expenses is included in the Notes to Financial Statements.
See Notes to Financial Statements
| Statements of changes in net assets | | | | | | | | |
| | | | | | | | | |
| | | | (dollars in thousands) |
| | | | | |
| | | Year ended September 30 | |
| | | 2014 | | | 2013 | |
| Operations: | | | | | | | | |
| Net investment (loss) income | | $ | (6,006 | ) | | $ | 22,410 | |
| Net realized gain on investments, forward currency contracts and currency transactions | | | 2,602,946 | | | | 1,811,729 | |
| Net unrealized (depreciation) appreciation on investments, forward currency contracts and currency translations | | | (1,519,670 | ) | | | 3,230,899 | |
| Net increase in net assets resulting from operations | | | 1,077,270 | | | | 5,065,038 | |
| | | | | | | | | |
| Dividends and distributions paid to shareholders: | | | | | | | | |
| Dividends from net investment income | | | — | | | | (257,779 | ) |
| Distributions from net realized gain on investments | | | (1,231,152 | ) | | | — | |
| Total dividends and distributions paid to shareholders | | | (1,231,152 | ) | | | (257,779 | ) |
| | | | | | | | | |
| Net capital share transactions | | | 1,351,365 | | | | (27,946 | ) |
| | | | | | | | | |
| Total increase in net assets | | | 1,197,483 | | | | 4,779,313 | |
| | | | | | | | | |
| Net assets: | | | | | | | | |
| Beginning of year | | | 24,440,673 | | | | 19,661,360 | |
| End of year (including accumulated net investment loss and distributions in excess of net investment income: $(147,181) and $(177,799), respectively) | | $ | 25,638,156 | | | $ | 24,440,673 | |
See Notes to Financial Statements
Notes to financial statements
1. Organization
SMALLCAP World Fund, Inc. (the “fund”) is registered under the Investment Company Act of 1940 as an open-end, diversified management investment company. The fund seeks long-term growth of capital through investments in smaller companies in the U.S. and around the world. Shareholders approved a proposal to reorganize the fund from a Maryland corporation to a Delaware statutory trust. The reorganization may be completed in the next 12 months; however, the fund reserves the right to delay the implementation.
The fund has 17 share classes consisting of five retail share classes (Classes A, B and C, as well as two F share classes, F-1 and F-2), five 529 college savings plan share classes (Classes 529-A, 529-B, 529-C, 529-E and 529-F-1) and seven retirement plan share classes (Classes R-1, R-2, R-2E, R-3, R-4, R-5 and R-6). The 529 college savings plan share classes can be used to save for college education. The retirement plan share classes are generally offered only through eligible employer-sponsored retirement plans. The fund’s share classes are described further in the following table:
| Share class | | Initial sales charge | | Contingent deferred sales
charge upon redemption | | Conversion feature | |
| Classes A and 529-A | | Up to 5.75% | | None (except 1% for certain redemptions within one year of purchase without an initial sales charge) | | None | |
| Classes B and 529-B* | | None | | Declines from 5% to 0% for redemptions within six years of purchase | | Classes B and 529-B convert to Classes A and 529-A, respectively, after eight years | |
| Class C | | None | | 1% for redemptions within one year of purchase | | Class C converts to Class F-1 after 10 years | |
| Class 529-C | | None | | 1% for redemptions within one year of purchase | | None | |
| Class 529-E | | None | | None | | None | |
| Classes F-1, F-2 and 529-F-1 | | None | | None | | None | |
Classes R-1, R-2, R-2E, R-3,
R-4, R-5 and R-6 | | None | | None | | None | |
*Class B and 529-B shares of the fund are not available for purchase.
On August 29, 2014, the fund made an additional retirement plan share class (Class R-2E) available for sale pursuant to an amendment to its registration statement filed with the U.S. Securities and Exchange Commission. Refer to the fund’s prospectus for more details.
Holders of all share classes have equal pro rata rights to the assets, dividends and liquidation proceeds of the fund. Each share class has identical voting rights, except for the exclusive right to vote on matters affecting only its class. Share classes have different fees and expenses (“class-specific fees and expenses”), primarily due to different arrangements for distribution, transfer agent and administrative services. Differences in class-specific fees and expenses will result in differences in net investment income and, therefore, the payment of different per-share dividends by each share class.
2. Significant accounting policies
The fund is an investment company that applies the accounting and reporting guidance issued in Topic 946 by the U.S. Financial Accounting Standards Board. The fund’s financial statements have been prepared to comply with U.S. generally accepted accounting principles (“U.S. GAAP”). These principles require the fund’s investment adviser to make estimates and assumptions that affect reported amounts and disclosures. Actual results could differ from those estimates. The fund follows the significant accounting policies described in this section, as well as the valuation policies described in the next section on valuation.
Security transactions and related investment income — Security transactions are recorded by the fund as of the date the trades are executed with brokers. Realized gains and losses from security transactions are determined based on the specific identified cost of the securities. In the event a security is purchased with a delayed payment date, the fund will segregate liquid assets sufficient to meet its payment obligations. Dividend income is recognized on the ex-dividend date and interest income is recognized on an accrual basis. Market discounts, premiums and original issue discounts on fixed-income securities are amortized daily over the expected life of the security.
Class allocations — Income, fees and expenses (other than class-specific fees and expenses) and realized and unrealized gains and losses are allocated daily among the various share classes based on their relative net assets. Class-specific fees and expenses, such as distribution, transfer agent and administrative services, are charged directly to the respective share class.
Dividends and distributions to shareholders — Dividends and distributions to shareholders are recorded on the ex-dividend date.
Currency translation — Assets and liabilities, including investment securities, denominated in currencies other than U.S. dollars are translated into U.S. dollars at the exchange rates supplied by one or more pricing vendors on the valuation date. Purchases and sales of investment securities and income and expenses are translated into U.S. dollars at the exchange rates on the dates of such transactions. The effects of changes in exchange rates on investment securities are included with the net realized gain or loss and net unrealized appreciation or depreciation on investments in the fund’s statement of operations. The realized gain or loss and unrealized appreciation or depreciation resulting from all other transactions denominated in currencies other than U.S. dollars are disclosed separately.
3. Valuation
Capital Research and Management Company (“CRMC”), the fund’s investment adviser, values the fund’s investments at fair value as defined by U.S. GAAP. The net asset value of each share class of the fund is generally determined as of approximately 4:00 p.m. New York time each day the New York Stock Exchange is open.
Methods and inputs — The fund’s investment adviser uses the following methods and inputs to establish the fair value of the fund’s assets and liabilities. Use of particular methods and inputs may vary over time based on availability and relevance as market and economic conditions evolve.
Equity securities are generally valued at the official closing price of, or the last reported sale price on, the exchange or market on which such securities are traded, as of the close of business on the day the securities are being valued or, lacking any sales, at the last available bid price. Prices for each security are taken from the principal exchange or market on which the security trades.
Fixed-income securities, including short-term securities, are generally valued at prices obtained from one or more pricing vendors. Vendors value such securities based on one or more of the inputs described in the following table. The table provides examples of inputs that are commonly relevant for valuing particular classes of fixed-income securities in which the fund is authorized to invest. However, these classifications are not exclusive, and any of the inputs may be used to value any other class of fixed-income security.
| Fixed-income class | | Examples of standard inputs |
| All | | Benchmark yields, transactions, bids, offers, quotations from dealers and trading systems, new issues, spreads and other relationships observed in the markets among comparable securities; and proprietary pricing models such as yield measures calculated using factors such as cash flows, financial or collateral performance and other reference data (collectively referred to as “standard inputs”) |
| Corporate bonds & notes; convertible securities | | Standard inputs and underlying equity of the issuer |
| Bonds & notes of governments & government agencies | | Standard inputs and interest rate volatilities |
When the fund’s investment adviser deems it appropriate to do so (such as when vendor prices are unavailable or deemed to be not representative), fixed-income securities will be valued in good faith at the mean quoted bid and ask prices that are reasonably and timely available (or bid prices, if ask prices are not available) or at prices for securities of comparable maturity, quality and type.
Securities with both fixed-income and equity characteristics, or equity securities traded principally among fixed-income dealers, are generally valued in the manner described for either equity or fixed-income securities, depending on which method is deemed most appropriate by the fund’s investment adviser. Forward currency contracts are valued at the mean of representative quoted bid and ask prices, generally based on prices supplied by one or more pricing vendors.
Securities and other assets for which representative market quotations are not readily available or are considered unreliable by the fund’s investment adviser are fair valued as determined in good faith under fair valuation guidelines adopted by authority of the fund’s board of directors as further described. The investment adviser follows fair valuation guidelines, consistent with U.S. Securities and Exchange Commission rules and guidance, to consider relevant principles and factors when making fair value determinations. The investment adviser considers relevant indications of value that are reasonably and timely available to it in determining the fair value to be assigned to a particular security, such as the type and cost of the security; contractual or legal restrictions on resale of the security; relevant financial or business developments of the issuer; actively traded similar or related securities; conversion or exchange rights on the security; related
corporate actions; significant events occurring after the close of trading in the security; and changes in overall market conditions. In addition, the closing prices of equity securities that trade in markets outside U.S. time zones may be adjusted to reflect significant events that occur after the close of local trading but before the net asset value of each share class of the fund is determined. Fair valuations and valuations of investments that are not actively trading involve judgment and may differ materially from valuations that would have been used had greater market activity occurred.
Processes and structure — The fund’s board of directors has delegated authority to the fund’s investment adviser to make fair value determinations, subject to board oversight. The investment adviser has established a Joint Fair Valuation Committee (the “Fair Valuation Committee”) to administer, implement and oversee the fair valuation process, and to make fair value decisions. The Fair Valuation Committee regularly reviews its own fair value decisions, as well as decisions made under its standing instructions to the investment adviser’s valuation teams. The Fair Valuation Committee reviews changes in fair value measurements from period to period and may, as deemed appropriate, update the fair valuation guidelines to better reflect the results of back testing and address new or evolving issues. The Fair Valuation Committee reports any changes to the fair valuation guidelines to the board of directors with supplemental information to support the changes. The fund’s board and audit committee also regularly review reports that describe fair value determinations and methods.
The fund’s investment adviser has also established a Fixed-Income Pricing Review Group to administer and oversee the fixed-income valuation process, including the use of fixed-income pricing vendors. This group regularly reviews pricing vendor information and market data. Pricing decisions, processes and controls over security valuation are also subject to additional internal reviews, including an annual control self-evaluation program facilitated by the investment adviser’s compliance group.
Classifications — The fund’s investment adviser classifies the fund’s assets and liabilities into three levels based on the inputs used to value the assets or liabilities. Level 1 values are based on quoted prices in active markets for identical securities. Level 2 values are based on significant observable market inputs, such as quoted prices for similar securities and quoted prices in inactive markets. Certain securities trading outside the U.S. may transfer between Level 1 and Level 2 due to valuation adjustments resulting from significant market movements following the close of local trading. Level 3 values are based on significant unobservable inputs that reflect the investment adviser’s determination of assumptions that market participants might reasonably use in valuing the securities. The valuation levels are not necessarily an indication of the risk or liquidity associated with the underlying investment. For example, U.S. government securities are reflected as Level 2 because the inputs used to determine fair value may not always be quoted prices in an active market. The following tables present the fund’s valuation levels as of September 30, 2014 (dollars in thousands):
| | | Investment securities | |
| | | Level 1 | | | Level 2 | | | Level 3 | | | Total | |
| Assets: | | | | | | | | | | | | | | | | |
| Common stocks: | | | | | | | | | | | | | | | | |
| Consumer discretionary | | $ | 4,947,062 | | | $ | 31,288 | | | $ | 9,446 | | | $ | 4,987,796 | |
| Health care | | | 3,837,196 | | | | — | | | | — | | | | 3,837,196 | |
| Industrials | | | 3,279,963 | | | | — | | | | — | | | | 3,279,963 | |
| Information technology | | | 2,831,113 | | | | — | | | | 15,610 | | | | 2,846,723 | |
| Financials | | | 2,523,845 | | | | — | | | | — | | | | 2,523,845 | |
| Consumer staples | | | 1,362,478 | | | | — | | | | — | | | | 1,362,478 | |
| Energy | | | 1,159,150 | | | | — | | | | — | | | | 1,159,150 | |
| Materials | | | 1,126,671 | | | | 20,592 | | | | 375 | | | | 1,147,638 | |
| Utilities | | | 477,383 | | | | — | | | | — | | | | 477,383 | |
| Telecommunication services | | | 332,817 | | | | — | | | | — | | | | 332,817 | |
| Miscellaneous | | | 1,231,917 | | | | 23,705 | | | | 1,724 | | | | 1,257,346 | |
| Preferred securities | | | 2,709 | | | | — | | | | — | | | | 2,709 | |
| Rights & warrants | | | — | | | | 2,242 | | | | 11,600 | | | | 13,842 | |
| Convertible stocks | | | — | | | | 9,526 | | | | 129,084 | | | | 138,610 | |
| Convertible bonds | | | — | | | | 9,730 | | | | — | | | | 9,730 | |
| Bonds, notes & other debt instruments | | | — | | | | 74,238 | | | | — | | | | 74,238 | |
| Short-term securities | | | — | | | | 2,189,952 | | | | — | | | | 2,189,952 | |
| Total | | $ | 23,112,304 | | | $ | 2,361,273 | | | $ | 167,839 | | | $ | 25,641,416 | |
| | | Other investments* | |
| | | Level 1 | | | Level 2 | | | Level 3 | | | Total | |
| Assets: | | | | | | | | | | | | | | | | |
| Unrealized appreciation on open forward currency contracts | | $ | — | | | $ | 5,277 | | | $ | — | | | $ | 5,277 | |
| * | Forward currency contracts are not included in the investment portfolio. |
4. Risk factors
Investing in the fund may involve certain risks including, but not limited to, those described below.
Market conditions — The prices of, and the income generated by, the securities held by the fund may decline – sometimes rapidly or unpredictably – due to various factors, including events or conditions affecting the general economy or particular industries; overall market changes; local, regional or global political, social or economic instability; governmental or governmental agency responses to economic conditions; and currency, interest rate and commodity price fluctuations.
Issuer risks — The prices of, and the income generated by, securities held by the fund may also decline in response to various factors directly related to the issuers of such securities, including reduced demand for an issuer’s goods or services, poor management performance and strategic initiatives such as mergers, acquisitions or dispositions and the market response to any such initiatives.
Investing in growth-oriented stocks — Growth-oriented common stocks and other equity-type securities (such as preferred stocks, convertible preferred stocks and convertible bonds) may involve larger price swings and greater potential for loss than other types of investments. These risks may be even greater in the case of smaller capitalization stocks.
Investing in small companies — Investing in smaller companies may pose additional risks. For example, it is often more difficult to value or dispose of small company stocks and more difficult to obtain information about smaller companies than about larger companies. Furthermore, smaller companies often have limited product lines, operating histories, markets and/or financial resources, may be dependent on one or a few key persons for management, and can be more susceptible to losses. Moreover, the prices of their stocks may be more volatile than stocks of larger, more established companies.
Investing outside the U.S. — Securities of issuers domiciled outside the U.S., or with significant operations outside the U.S., may lose value because of adverse political, social, economic or market developments (including social instability, regional conflicts, terrorism and war) in the countries or regions in which the issuers are domiciled or operate. These securities may also lose value due to changes in foreign currency exchange rates against the U.S. dollar and/or currencies of other countries. Securities markets in certain countries may be more volatile and/or less liquid than those in the U.S. Investments outside the U.S. may also be subject to different accounting practices and different regulatory, legal and reporting standards, and may be more difficult to value, than those in the U.S. In addition, the value of investments outside the U.S. may be reduced by foreign taxes, including foreign withholding taxes on interest and dividends. Further, there may be increased risks of delayed settlement of securities purchased or sold by the fund. The risks of investing outside the U.S. may be heightened in connection with investments in emerging markets.
Investing in emerging markets — Investing in emerging markets may involve risks in addition to and greater than those generally associated with investing in the securities markets of developed countries. For instance, developing countries may have less developed legal and accounting systems than those in developed countries. The governments of these countries may be less stable and more likely to impose capital controls, nationalize a company or industry, place restrictions on foreign ownership and on withdrawing sale proceeds of securities from the country, and/or impose punitive taxes that could adversely affect the prices of securities. In addition, the economies of these countries may be dependent on relatively few industries that are more susceptible to local and global changes. Securities markets in these countries can also be relatively small and have substantially lower trading volumes. As a result, securities issued in these countries may be more volatile and less liquid, and may be more difficult to value, than securities issued in countries with more developed economies and/or markets. Less certainty with respect to security valuations may lead to additional challenges and risks in calculating the fund’s net asset value. Additionally, there may be increased settlement risks for transactions in local securities.
Management — The investment adviser to the fund actively manages the fund’s investments. Consequently, the fund is subject to the risk that the methods and analyses employed by the investment adviser in this process may not produce the desired results. This could cause the fund to lose value or its investment results to lag relevant benchmarks or other funds with similar objectives.
5. Certain investment techniques
Forward currency contracts — The fund has entered into forward currency contracts, which represent agreements to exchange currencies on specific future dates at predetermined rates. The fund’s investment adviser uses forward currency contracts to manage the fund’s exposure to changes in exchange rates. Upon entering into these contracts, risks may arise from the potential inability of counterparties to meet the terms of their contracts and from possible movements in exchange rates.
On a daily basis, the fund’s investment adviser values forward currency contracts and records unrealized appreciation or depreciation for open forward currency contracts in the fund’s statement of assets and liabilities. Realized gains or losses are recorded at the time the forward currency contract is closed or offset by another contract with the same broker for the same settlement date and currency.
Closed forward currency contracts that have not reached their settlement date are included in the respective receivables or payables for closed forward currency contracts in the fund’s statement of assets and liabilities. Net realized gains or losses from closed forward currency contracts and net unrealized appreciation or depreciation from open forward currency contracts are recorded in the fund’s statement of operations. As of September 30, 2014, the fund did not have any open forward currency contracts.
The following tables present the financial statement impacts resulting from the fund’s use of forward currency contracts as of September 30, 2014 (dollars in thousands):
| | | Assets | | | Liabilities | |
| Contract | | Location on statement of
assets and liabilities | | Value | | | Location on statement of
assets and liabilities | | Value | |
| Forward currency | | Unrealized appreciation on open forward currency contracts | | $ | 5,277 | | | Unrealized depreciation on open forward currency contracts | | $ | — | |
| Forward currency | | Receivables for closed forward currency contracts | | | 1,213 | | | Payables for closed forward currency contracts | | | — | |
| | | | | | | | | | | | | |
| | | | | $ | 6,490 | | | | | $ | — | |
| | | Net realized gain | | | Net unrealized appreciation | |
| Contract | | Location on statement of operations | | | Value | | | Location on statement of operations | | | Value | |
| Forward currency | | Net realized gain on forward currency contracts | | $ | 9,243 | | | Net unrealized appreciation on forward currency contracts | | $ | 7,315 | |
Collateral — The fund participates in a collateral program due to its use of forward currency contracts. The program calls for the fund to either receive or pledge collateral based on the net gain or loss on unsettled forward currency contracts by counterparty. The purpose of the collateral is to cover potential losses that could occur in the event that either party cannot meet its contractual obligations.
Rights of offset — The fund has entered into enforceable master netting agreements with certain counterparties for forward currency contracts, where amounts payable by each party to the other in the same currency, with the same settlement date and with the same counterparty are settled net of each party’s payment obligation. For financial reporting purposes, the fund does not offset financial assets and financial liabilities that are subject to netting arrangements in the statement of assets and liabilities.
The following table presents the fund’s forward currency contracts by counterparty, including those that are subject to potential offset on the statement of assets and liabilities as of September 30, 2014 (dollars in thousands):
| | | Gross amounts
recognized in the | | | Gross amounts not offset in the
statement of assets and liabilities and
subject to a master netting agreement | | | | |
| Counterparty | | statement of assets
and liabilities | | | Available
to offset | | | Non-cash
collateral* | | | Cash
collateral | | | Net
amount | |
| Assets: | | | | | | | | | | | | | | | | | | | | |
| Bank of New York Mellon | | $ | 2,545 | | | $ | — | | | $ | (2,403 | ) | | $ | — | | | $ | 142 | |
| Barclays Bank PLC | | | 1,893 | | | | — | | | | (1,664 | ) | | | — | | | | 229 | |
| HSBC Bank | | | 169 | | | | — | | | | — | | | | — | | | | 169 | |
| UBS AG | | | 1,883 | | | | — | | | | (1,524 | ) | | | — | | | | 359 | |
| Total | | $ | 6,490 | | | $ | — | | | $ | (5,591 | ) | | $ | — | | | $ | 899 | |
* Non-cash collateral is shown on a settlement basis.
6. Taxation and distributions
Federal income taxation — The fund complies with the requirements under Subchapter M of the Internal Revenue Code applicable to mutual funds and intends to distribute substantially all of its net taxable income and net capital gains each year. The fund is not subject to income taxes to the extent such distributions are made. Therefore, no federal income tax provision is required.
As of and during the period ended September 30, 2014, the fund did not have a liability for any unrecognized tax benefits. The fund recognizes interest and penalties, if any, related to unrecognized tax benefits as income tax expense in the statement of operations. During the period, the fund did not incur any interest or penalties.
The fund is not subject to examination by U.S. federal tax authorities for tax years before 2010, by state tax authorities for tax years before 2009 and by tax authorities outside the U.S. for tax years before 2007.
Non-U.S. taxation — Dividend and interest income are recorded net of non-U.S. taxes paid. Gains realized by the fund on the sale of securities in certain countries are subject to non-U.S. taxes. The fund records a liability based on unrealized gains to provide for potential non-U.S. taxes payable upon the sale of these securities.
Distributions — Distributions paid to shareholders are based on net investment income and net realized gains determined on a tax basis, which may differ from net investment income and net realized gains for financial reporting purposes. These differences are due primarily to different treatment for items such as currency gains and losses; short-term capital gains and losses; capital losses related to sales of certain securities within 30 days of purchase; unrealized appreciation of certain investments in securities outside the U.S.; deferred expenses; cost of investments sold; non-U.S. taxes on capital gains; and income on certain investments. The fiscal year in which amounts are distributed may differ from the year in which the net investment income and net realized gains are recorded by the fund for financial reporting purposes. The fund may also designate a portion of the amount paid to redeeming shareholders as a distribution for tax purposes.
During the year ended September 30, 2014, the fund reclassified $733,000 from capital paid in on shares of capital stock to accumulated net investment loss, $35,891,000 from undistributed net realized gain to accumulated net investment loss and $115,758,000 from undistributed net realized gain to capital paid in on shares of capital stock to align financial reporting with tax reporting.
As of September 30, 2014, the tax-basis components of distributable earnings, unrealized appreciation (depreciation) and cost of investment securities were as follows (dollars in thousands):
| Undistributed long-term capital gains | | $ | 2,452,874 | |
| Gross unrealized appreciation on investment securities | | | 7,031,369 | |
| Gross unrealized depreciation on investment securities | | | (1,502,203 | ) |
| Net unrealized appreciation on investment securities | | | 5,529,166 | |
| Cost of investment securities | | | 20,112,250 | |
The tax character of distributions paid to shareholders was as follows (dollars in thousands):
| | | Year ended September 30, 2014 | | | Year ended September 30, 2013 | |
| Share class | | Ordinary income | | | Long-term
capital gains | | | Total dividends and
distributions paid | | | Ordinary
income | | | Long-term
capital gains | | | Total dividends and
distributions paid | |
| Class A | | $ | — | | | $ | 819,310 | | | $ | 819,310 | | | $ | 182,045 | | | $ | — | | | $ | 182,045 | |
| Class B | | | — | | | | 8,984 | | | | 8,984 | | | | 999 | | | | — | | | | 999 | |
| Class C | | | — | | | | 48,666 | | | | 48,666 | | | | 5,125 | | | | — | | | | 5,125 | |
| Class F-1 | | | — | | | | 45,043 | | | | 45,043 | | | | 8,428 | | | | — | | | | 8,428 | |
| Class F-2 | | | — | | | | 32,777 | | | | 32,777 | | | | 7,141 | | | | — | | | | 7,141 | |
| Class 529-A | | | — | | | | 44,604 | | | | 44,604 | | | | 9,344 | | | | — | | | | 9,344 | |
| Class 529-B | | | — | | | | 1,211 | | | | 1,211 | | | | 97 | | | | — | | | | 97 | |
| Class 529-C | | | — | | | | 14,431 | | | | 14,431 | | | | 1,428 | | | | — | | | | 1,428 | |
| Class 529-E | | | — | | | | 2,446 | | | | 2,446 | | | | 423 | | | | — | | | | 423 | |
| Class 529-F-1 | | | — | | | | 3,680 | | | | 3,680 | | | | 843 | | | | — | | | | 843 | |
| Class R-1 | | | — | | | | 2,147 | | | | 2,147 | | | | 253 | | | | — | | | | 253 | |
| Class R-2 | | | — | | | | 37,717 | | | | 37,717 | | | | 4,501 | | | | — | | | | 4,501 | |
| Class R-2E* | | | — | | | | — | | | | — | | | | | | | | | | | | | |
| Class R-3 | | | — | | | | 42,124 | | | | 42,124 | | | | 7,719 | | | | — | | | | 7,719 | |
| Class R-4 | | | — | | | | 34,905 | | | | 34,905 | | | | 8,016 | | | | — | | | | 8,016 | |
| Class R-5 | | | — | | | | 27,390 | | | | 27,390 | | | | 7,046 | | | | — | | | | 7,046 | |
| Class R-6 | | | — | | | | 65,717 | | | | 65,717 | | | | 14,371 | | | | — | | | | 14,371 | |
| Total | | $ | — | | | $ | 1,231,152 | | | $ | 1,231,152 | | | $ | 257,779 | | | $ | — | | | $ | 257,779 | |
* Class R-2E shares were offered beginning August 29, 2014.
7. Fees and transactions with related parties
CRMC, the fund’s investment adviser, is the parent company of American Funds Distributors,® Inc. (“AFD”), the principal underwriter of the fund’s shares, and American Funds Service Company® (“AFS”), the fund’s transfer agent. CRMC, AFD and AFS are considered related parties to the fund.
Investment advisory services — The fund has an investment advisory and service agreement with CRMC that provides for monthly fees accrued daily. These fees are based on a series of decreasing annual rates beginning with 0.800% on the first $1 billion of daily net assets and decreasing to 0.595% on such assets in excess of $27 billion. For the year ended September 30, 2014, the investment advisory services fee was $163,611,000, which was equivalent to an annualized rate of 0.630% of average daily net assets.
Class-specific fees and expenses — Expenses that are specific to individual share classes are accrued directly to the respective share class. The principal class-specific fees and expenses are further described below:
| Distribution services — The fund has plans of distribution for all share classes, except Class F-2, R-5 and R-6 shares. Under the plans, the board of directors approves certain categories of expenses that are used to finance activities primarily intended to sell fund shares and service existing accounts. The plans provide for payments, based on an annualized percentage of average daily net assets, ranging from 0.30% to 1.00% as noted in this section. In some cases, the board of directors has limited the amounts that may be paid to less than the maximum allowed by the plans. All share classes with a plan may use up to 0.25% of average daily net assets to pay service fees, or to compensate AFD for paying service fees, to firms that have entered into agreements with AFD to provide certain shareholder services. The remaining amounts available to be paid under each plan are paid to dealers to compensate them for their sales activities. |
| For Class A and 529-A shares, distribution-related expenses include the reimbursement of dealer and wholesaler commissions paid by AFD for certain shares sold without a sales charge. These share classes reimburse AFD for amounts billed within the prior 15 months but only to the extent that the overall annual expense limit of 0.30% is not exceeded. As of September 30, 2014, there were no unreimbursed expenses subject to reimbursement for Class A or 529-A shares. |
| | Share class | | Currently approved limits | | Plan limits |
| | Class A | | | 0.30 | % | | | 0.30 | % | |
| | Class 529-A | | | 0.30 | | | | 0.50 | | |
| | Classes B and 529-B | | | 1.00 | | | | 1.00 | | |
| | Classes C, 529-C and R-1 | | | 1.00 | | | | 1.00 | | |
| | Class R-2 | | | 0.75 | | | | 1.00 | | |
| | Class R-2E | | | 0.60 | | | | 0.85 | | |
| | Classes 529-E and R-3 | | | 0.50 | | | | 0.75 | | |
| | Classes F-1, 529-F-1 and R-4 | | | 0.25 | | | | 0.50 | | |
| Transfer agent services — The fund has a shareholder services agreement with AFS under which the fund compensates AFS for providing transfer agent services to each of the fund’s share classes. These services include recordkeeping, shareholder communications and transaction processing. In addition, the fund reimburses AFS for amounts paid to third parties for performing transfer agent services on behalf of fund shareholders. |
| Administrative services — The fund has an administrative services agreement with CRMC under which the fund compensates CRMC for providing administrative services to Class A, C, F, 529 and R shares. These services include, but are not limited to, coordinating, monitoring, assisting and overseeing third parties that provide services to fund shareholders. Under the agreement, Class A shares pay an annual fee of 0.01% and Class C, F, 529 and R shares pay an annual fee of 0.05% of their respective average daily net assets. |
| 529 plan services — Each 529 share class is subject to service fees to compensate the Virginia College Savings Plan (“Virginia529”) for its oversight and administration of the 529 college savings plan. During the period October 1, 2013, to March 31, 2014, the quarterly fee was based on a series of decreasing annual rates beginning with 0.10% on the first $30 billion of the net assets invested in Class 529 shares of the American Funds and decreasing to 0.06% on such assets between $120 billion and $150 billion. Effective April 1, 2014, the quarterly fee was amended to provide for reduced annual rates of 0.07%, 0.06% and 0.05% over $30 billion, $50 billion and $70 billion, respectively, of the net assets invested in Class 529 shares of the American Funds. The fee for any given calendar quarter is accrued and calculated on the basis of the average net assets of Class 529 shares of the American Funds for the last month of the prior calendar quarter. The fee is included in other expenses in the fund’s statement of operations. Virginia529 is not considered a related party to the fund. |
| For the year ended September 30, 2014, class-specific expenses under the agreements were as follows (dollars in thousands): |
| | Share class | | Distribution
services | | | Transfer agent
services | | | Administrative
services | | | 529 plan
services |
| | Class A | | | $40,926 | | | | $29,031 | | | | $1,729 | | | Not applicable |
| | Class B | | | 1,566 | | | | 275 | | | | Not applicable | | | Not applicable |
| | Class C | | | 9,365 | | | | 1,589 | | | | 470 | | | Not applicable |
| | Class F-1 | | | 2,168 | | | | 1,204 | | | | 434 | | | Not applicable |
| | Class F-2 | | | Not applicable | | | | 840 | | | | 427 | | | Not applicable |
| | Class 529-A | | | 1,996 | | | | 1,290 | | | | 473 | | | $882 |
| | Class 529-B | | | 215 | | | | 34 | | | | 11 | | | 20 |
| | Class 529-C | | | 2,864 | | | | 420 | | | | 144 | | | 269 |
| | Class 529-E | | | 253 | | | | 45 | | | | 25 | | | 47 |
| | Class 529-F-1 | | | — | | | | 108 | | | | 40 | | | 74 |
| | Class R-1 | | | 417 | | | | 54 | | | | 21 | | | Not applicable |
| | Class R-2 | | | 5,468 | | | | 2,810 | | | | 368 | | | Not applicable |
| | Class R-2E* | | | — | | | | — | † | | | — | † | | Not applicable |
| | Class R-3 | | | 4,234 | | | | 1,534 | | | | 425 | | | Not applicable |
| | Class R-4 | | | 1,859 | | | | 779 | | | | 373 | | | Not applicable |
| | Class R-5 | | | Not applicable | | | | 280 | | | | 267 | | | Not applicable |
| | Class R-6 | | | Not applicable | | | | 11 | | | | 782 | | | Not applicable |
| | Total class-specific expenses | | | $71,331 | | | | $40,304 | | | | $5,989 | | | $1,292 |
| * | Class R-2E shares were offered beginning August 29, 2014. |
| † | Amount less than one thousand. |
Directors’ deferred compensation — Directors who are unaffiliated with CRMC may elect to defer the cash payment of part or all of their compensation. These deferred amounts, which remain as liabilities of the fund, are treated as if invested in shares of the fund or other American Funds. These amounts represent general, unsecured liabilities of the fund and vary according to the total returns of the selected funds. Directors’ compensation of $825,000 in the fund’s statement of operations includes $320,000 in current fees (either paid in cash or deferred) and a net increase of $505,000 in the value of the deferred amounts.
Affiliated officers and directors — Officers and certain directors of the fund are or may be considered to be affiliated with CRMC, AFD and AFS. No affiliated officers or directors received any compensation directly from the fund.
8. Capital share transactions
Capital share transactions in the fund were as follows (dollars and shares in thousands):
| | | Sales1 | | | Reinvestments of
dividends and distributions | | | Repurchases1 | | | Net increase
(decrease) | |
| Share class | | Amount | | | Shares | | | Amount | | | Shares | | | Amount | | | Shares | | | Amount | | | Shares | |
| | | | | | | | | | | | | | | | | | | | | | | | | |
| Year ended September 30, 2014 | | | | | | | | | | | | | | | | | | | |
| | | | | | | | | | | | | | | | | | | | |
| Class A | | $ | 1,773,336 | | | | 35,700 | | | $ | 806,618 | | | | 16,543 | | | $ | (2,096,014 | ) | | | (42,216 | ) | | $ | 483,940 | | | | 10,027 | |
| Class B | | | 3,569 | | | | 77 | | | | 8,918 | | | | 195 | | | | (75,332 | ) | | | (1,622 | ) | | | (62,845 | ) | | | (1,350 | ) |
| Class C | | | 142,256 | | | | 3,097 | | | | 48,176 | | | | 1,067 | | | | (203,684 | ) | | | (4,439 | ) | | | (13,252 | ) | | | (275 | ) |
| Class F-1 | | | 282,255 | | | | 5,746 | | | | 44,660 | | | | 924 | | | | (570,459 | ) | | | (11,619 | ) | | | (243,544 | ) | | | (4,949 | ) |
| Class F-2 | | | 693,213 | | | | 13,899 | | | | 30,757 | | | | 629 | | | | (132,925 | ) | | | (2,668 | ) | | | 591,045 | | | | 11,860 | |
| Class 529-A | | | 111,968 | | | | 2,271 | | | | 44,594 | | | | 921 | | | | (101,340 | ) | | | (2,052 | ) | | | 55,222 | | | | 1,140 | |
| Class 529-B | | | 635 | | | | 13 | | | | 1,211 | | | | 26 | | | | (10,160 | ) | | | (216 | ) | | | (8,314 | ) | | | (177 | ) |
| Class 529-C | | | 35,995 | | | | 770 | | | | 14,425 | | | | 314 | | | | (38,441 | ) | | | (821 | ) | | | 11,979 | | | | 263 | |
| Class 529-E | | | 5,793 | | | | 119 | | | | 2,446 | | | | 51 | | | | (6,380 | ) | | | (131 | ) | | | 1,859 | | | | 39 | |
| Class 529-F-1 | | | 15,345 | | | | 309 | | | | 3,679 | | | | 76 | | | | (12,328 | ) | | | (248 | ) | | | 6,696 | | | | 137 | |
| Class R-1 | | | 9,478 | | | | 202 | | | | 2,139 | | | | 46 | | | | (13,283 | ) | | | (282 | ) | | | (1,666 | ) | | | (34 | ) |
| Class R-2 | | | 144,638 | | | | 3,074 | | | | 37,700 | | | | 816 | | | | (219,917 | ) | | | (4,681 | ) | | | (37,579 | ) | | | (791 | ) |
| Class R-2E2 | | | 10 | | | | — | 3 | | | — | | | | — | | | | — | | | | — | | | | 10 | | | | — | 3 |
| Class R-3 | | | 199,353 | | | | 4,114 | | | | 42,110 | | | | 885 | | | | (259,313 | ) | | | (5,358 | ) | | | (17,850 | ) | | | (359 | ) |
| Class R-4 | | | 191,098 | | | | 3,875 | | | | 34,902 | | | | 721 | | | | (207,103 | ) | | | (4,203 | ) | | | 18,897 | | | | 393 | |
| Class R-5 | | | 119,562 | | | | 2,382 | | | | 27,377 | | | | 554 | | | | (243,151 | ) | | | (4,893 | ) | | | (96,212 | ) | | | (1,957 | ) |
| Class R-6 | | | 709,607 | | | | 14,300 | | | | 65,717 | | | | 1,344 | | | | (112,345 | ) | | | (2,256 | ) | | | 662,979 | | | | 13,388 | |
| Total net increase (decrease) | | $ | 4,438,111 | | | | 89,948 | | | $ | 1,215,429 | | | | 25,112 | | | $ | (4,302,175 | ) | | | (87,705 | ) | | $ | 1,351,365 | | | | 27,355 | |
| | | Sales1 | | | Reinvestments of
dividends and distributions | | | Repurchases1 | | | Net increase
(decrease) | |
| Share class | | Amount | | | Shares | | | Amount | | | Shares | | | Amount | | | Shares | | | Amount | | | Shares | |
| | | | | | | | | | | | | | | | | | | | | | | | | |
| Year ended September 30, 2013 | | | | | | | | | | | | | | | | | | | |
| | | | | | | | | | | | | | | | | | | | |
| Class A | | $ | 1,557,151 | | | | 36,059 | | | $ | 178,221 | | | | 4,529 | | | $ | (2,101,305 | ) | | | (49,421 | ) | | $ | (365,933 | ) | | | (8,833 | ) |
| Class B | | | 5,244 | | | | 129 | | | | 990 | | | | 26 | | | | (78,159 | ) | | | (1,942 | ) | | | (71,925 | ) | | | (1,787 | ) |
| Class C | | | 115,494 | | | | 2,852 | | | | 5,050 | | | | 137 | | | | (163,006 | ) | | | (4,082 | ) | | | (42,462 | ) | | | (1,093 | ) |
| Class F-1 | | | 230,756 | | | | 5,343 | | | | 8,312 | | | | 213 | | | | (183,653 | ) | | | (4,490 | ) | | | 55,415 | | | | 1,066 | |
| Class F-2 | | | 261,399 | | | | 6,191 | | | | 6,474 | | | | 164 | | | | (98,197 | ) | | | (2,254 | ) | | | 169,676 | | | | 4,101 | |
| Class 529-A | | | 105,543 | | | | 2,476 | | | | 9,343 | | | | 239 | | | | (93,329 | ) | | | (2,193 | ) | | | 21,557 | | | | 522 | |
| Class 529-B | | | 680 | | | | 17 | | | | 97 | | | | 3 | | | | (10,704 | ) | | | (264 | ) | | | (9,927 | ) | | | (244 | ) |
| Class 529-C | | | 31,723 | | | | 779 | | | | 1,427 | | | | 38 | | | | (35,946 | ) | | | (884 | ) | | | (2,796 | ) | | | (67 | ) |
| Class 529-E | | | 5,599 | | | | 134 | | | | 422 | | | | 11 | | | | (5,392 | ) | | | (130 | ) | | | 629 | | | | 15 | |
| Class 529-F-1 | | | 15,329 | | | | 359 | | | | 842 | | | | 21 | | | | (9,884 | ) | | | (230 | ) | | | 6,287 | | | | 150 | |
| Class R-1 | | | 8,611 | | | | 209 | | | | 252 | | | | 7 | | | | (12,509 | ) | | | (308 | ) | | | (3,646 | ) | | | (92 | ) |
| Class R-2 | | | 155,700 | | | | 3,807 | | | | 4,497 | | | | 120 | | | | (221,139 | ) | | | (5,411 | ) | | | (60,942 | ) | | | (1,484 | ) |
| Class R-3 | | | 212,178 | | | | 5,045 | | | | 7,712 | | | | 200 | | | | (244,770 | ) | | | (5,852 | ) | | | (24,880 | ) | | | (607 | ) |
| Class R-4 | | | 189,212 | | | | 4,445 | | | | 8,015 | | | | 205 | | | | (173,149 | ) | | | (4,082 | ) | | | 24,078 | | | | 568 | |
| Class R-5 | | | 151,856 | | | | 3,552 | | | | 7,030 | | | | 177 | | | | (99,358 | ) | | | (2,287 | ) | | | 59,528 | | | | 1,442 | |
| Class R-6 | | | 282,881 | | | | 6,554 | | | | 14,371 | | | | 366 | | | | (79,857 | ) | | | (1,824 | ) | | | 217,395 | | | | 5,096 | |
| Total net increase (decrease) | | $ | 3,329,356 | | | | 77,951 | | | $ | 253,055 | | | | 6,456 | | | $ | (3,610,357 | ) | | | (85,654 | ) | | $ | (27,946 | ) | | | (1,247 | ) |
| 1 | Includes exchanges between share classes of the fund. |
| 2 | Class R-2E shares were offered beginning August 29, 2014. |
| 3 | Amount less than one thousand. |
9. Investment transactions
The fund made purchases and sales of investment securities, excluding short-term securities and U.S. government obligations, if any, of $8,918,488,000 and $9,052,667,000, respectively, during the year ended September 30, 2014.
Financial highlights
| | | | | | Income (loss) from
investment operations1 | | | Dividends and distributions | | | | | | | | | | | | | | | | |
| | | Net asset
value,
beginning
of period | | | Net
investment
income
(loss) | | | Net gains
(losses) on
securities
(both
realized and
unrealized) | | | Total from
investment
operations | | | Dividends
(from net
investment
income) | | | Distributions
(from capital
gains) | | | Total
dividends
and
distributions | | | Net asset
value,
end
of period | | | Total
return2 | | | Net assets,
end of period
(in millions) | | | Ratio of
expenses to
average
net assets | | | Ratio of
net income
(loss) to
average
net assets | |
| Class A: | | | | | | | | | | | | | | | | | | | | | | | | | | | | | | | | | | | | | | | | | | | | | | | | |
| Year ended 9/30/2014 | | $ | 48.91 | | | $ | .01 | | | $ | 2.17 | | | $ | 2.18 | | | $ | — | | | $ | (2.43 | ) | | $ | (2.43 | ) | | $ | 48.66 | | | | 4.43 | % | | $ | 16,857 | | | | 1.07 | % | | | .02 | % |
| Year ended 9/30/2013 | | | 39.27 | | | | .06 | | | | 10.12 | | | | 10.18 | | | | (.54 | ) | | | — | | | | (.54 | ) | | | 48.91 | | | | 26.29 | | | | 16,454 | | | | 1.13 | | | | .15 | |
| Year ended 9/30/2012 | | | 31.45 | | | | .08 | | | | 7.85 | | | | 7.93 | | | | (.11 | ) | | | — | | | | (.11 | ) | | | 39.27 | | | | 25.26 | | | | 13,557 | | | | 1.14 | | | | .23 | |
| Year ended 9/30/2011 | | | 35.82 | | | | .09 | | | | (3.94 | ) | | | (3.85 | ) | | | (.52 | ) | | | — | | | | (.52 | ) | | | 31.45 | | | | (11.01 | ) | | | 11,926 | | | | 1.09 | | | | .23 | |
| Year ended 9/30/2010 | | | 30.26 | | | | .14 | | | | 5.62 | | | | 5.76 | | | | (.20 | ) | | | — | | | | (.20 | ) | | | 35.82 | | | | 19.11 | | | | 14,432 | | | | 1.13 | | | | .43 | |
| Class B: | | | | | | | | | | | | | | | | | | | | | | | | | | | | | | | | | | | | | | | | | | | | | | | | |
| Year ended 9/30/2014 | | | 46.06 | | | | (.36 | ) | | | 2.06 | | | | 1.70 | | | | — | | | | (2.43 | ) | | | (2.43 | ) | | | 45.33 | | | | 3.66 | | | | 121 | | | | 1.83 | | | | (.77 | ) |
| Year ended 9/30/2013 | | | 36.95 | | | | (.26 | ) | | | 9.56 | | | | 9.30 | | | | (.19 | ) | | | — | | | | (.19 | ) | | | 46.06 | | | | 25.29 | | | | 185 | | | | 1.89 | | | | (.63 | ) |
| Year ended 9/30/2012 | | | 29.72 | | | | (.20 | ) | | | 7.43 | | | | 7.23 | | | | — | | | | — | | | | — | | | | 36.95 | | | | 24.33 | | | | 214 | | | | 1.90 | | | | (.58 | ) |
| Year ended 9/30/2011 | | | 33.87 | | | | (.20 | ) | | | (3.71 | ) | | | (3.91 | ) | | | (.24 | ) | | | — | | | | (.24 | ) | | | 29.72 | | | | (11.68 | ) | | | 266 | | | | 1.86 | | | | (.55 | ) |
| Year ended 9/30/2010 | | | 28.66 | | | | (.11 | ) | | | 5.32 | | | | 5.21 | | | | — | | | | — | | | | — | | | | 33.87 | | | | 18.18 | | | | 397 | | | | 1.89 | | | | (.37 | ) |
| Class C: | | | | | | | | | | | | | | | | | | | | | | | | | | | | | | | | | | | | | | | | | | | | | | | | |
| Year ended 9/30/2014 | | | 45.54 | | | | (.36 | ) | | | 2.02 | | | | 1.66 | | | | — | | | | (2.43 | ) | | | (2.43 | ) | | | 44.77 | | | | 3.61 | | | | 892 | | | | 1.87 | | | | (.79 | ) |
| Year ended 9/30/2013 | | | 36.60 | | | | (.26 | ) | | | 9.45 | | | | 9.19 | | | | (.25 | ) | | | — | | | | (.25 | ) | | | 45.54 | | | | 25.26 | | | | 920 | | | | 1.93 | | | | (.65 | ) |
| Year ended 9/30/2012 | | | 29.44 | | | | (.19 | ) | | | 7.35 | | | | 7.16 | | | | — | | | | — | | | | — | | | | 36.60 | | | | 24.32 | | | | 779 | | | | 1.93 | | | | (.56 | ) |
| Year ended 9/30/2011 | | | 33.61 | | | | (.19 | ) | | | (3.69 | ) | | | (3.88 | ) | | | (.29 | ) | | | — | | | | (.29 | ) | | | 29.44 | | | | (11.70 | ) | | | 725 | | | | 1.86 | | | | (.53 | ) |
| Year ended 9/30/2010 | | | 28.44 | | | | (.10 | ) | | | 5.28 | | | | 5.18 | | | | (.01 | ) | | | — | | | | (.01 | ) | | | 33.61 | | | | 18.19 | | | | 865 | | | | 1.88 | | | | (.32 | ) |
| Class F-1: | | | | | | | | | | | | | | | | | | | | | | | | | | | | | | | | | | | | | | | | | | | | | | | | |
| Year ended 9/30/2014 | | | 48.51 | | | | — | | | | 2.15 | | | | 2.15 | | | | — | | | | (2.43 | ) | | | (2.43 | ) | | | 48.23 | | | | 4.42 | | | | 624 | | | | 1.09 | | | | — | |
| Year ended 9/30/2013 | | | 38.94 | | | | .09 | | | | 10.03 | | | | 10.12 | | | | (.55 | ) | | | — | | | | (.55 | ) | | | 48.51 | | | | 26.33 | | | | 868 | | | | 1.07 | | | | .21 | |
| Year ended 9/30/2012 | | | 31.18 | | | | .09 | | | | 7.78 | | | | 7.87 | | | | (.11 | ) | | | — | | | | (.11 | ) | | | 38.94 | | | | 25.30 | | | | 655 | | | | 1.12 | | | | .25 | |
| Year ended 9/30/2011 | | | 35.53 | | | | .10 | | | | (3.92 | ) | | | (3.82 | ) | | | (.53 | ) | | | — | | | | (.53 | ) | | | 31.18 | | | | (11.02 | ) | | | 583 | | | | 1.08 | | | | .25 | |
| Year ended 9/30/2010 | | | 30.03 | | | | .15 | | | | 5.57 | | | | 5.72 | | | | (.22 | ) | | | — | | | | (.22 | ) | | | 35.53 | | | | 19.16 | | | | 654 | | | | 1.10 | | | | .46 | |
| Class F-2: | | | | | | | | | | | | | | | | | | | | | | | | | | | | | | | | | | | | | | | | | | | | | | | | |
| Year ended 9/30/2014 | | | 49.03 | | | | .15 | | | | 2.17 | | | | 2.32 | | | | — | | | | (2.43 | ) | | | (2.43 | ) | | | 48.92 | | | | 4.72 | | | | 1,208 | | | | .81 | | | | .31 | |
| Year ended 9/30/2013 | | | 39.38 | | | | .21 | | | | 10.12 | | | | 10.33 | | | | (.68 | ) | | | — | | | | (.68 | ) | | | 49.03 | | | | 26.68 | | | | 629 | | | | .82 | | | | .48 | |
| Year ended 9/30/2012 | | | 31.54 | | | | .20 | | | | 7.86 | | | | 8.06 | | | | (.22 | ) | | | — | | | | (.22 | ) | | | 39.38 | | | | 25.69 | | | | 344 | | | | .83 | | | | .55 | |
| Year ended 9/30/2011 | | | 35.93 | | | | .20 | | | | (3.96 | ) | | | (3.76 | ) | | | (.63 | ) | | | — | | | | (.63 | ) | | | 31.54 | | | | (10.79 | ) | | | 266 | | | | .82 | | | | .53 | |
| Year ended 9/30/2010 | | | 30.39 | | | | .25 | | | | 5.63 | | | | 5.88 | | | | (.34 | ) | | | — | | | | (.34 | ) | | | 35.93 | | | | 19.46 | | | | 246 | | | | .81 | | | | .78 | |
| Class 529-A: | | | | | | | | | | | | | | | | | | | | | | | | | | | | | | | | | | | | | | | | | | | | | | | | |
| Year ended 9/30/2014 | | | 48.59 | | | | (.03 | ) | | | 2.16 | | | | 2.13 | | | | — | | | | (2.43 | ) | | | (2.43 | ) | | | 48.29 | | | | 4.37 | | | | 933 | | | | 1.15 | | | | (.05 | ) |
| Year ended 9/30/2013 | | | 39.03 | | | | .04 | | | | 10.05 | | | | 10.09 | | | | (.53 | ) | | | — | | | | (.53 | ) | | | 48.59 | | | | 26.18 | | | | 884 | | | | 1.19 | | | | .09 | |
| Year ended 9/30/2012 | | | 31.27 | | | | .07 | | | | 7.80 | | | | 7.87 | | | | (.11 | ) | | | — | | | | (.11 | ) | | | 39.03 | | | | 25.22 | | | | 689 | | | | 1.19 | | | | .19 | |
| Year ended 9/30/2011 | | | 35.63 | | | | .08 | | | | (3.92 | ) | | | (3.84 | ) | | | (.52 | ) | | | — | | | | (.52 | ) | | | 31.27 | | | | (11.05 | ) | | | 541 | | | | 1.14 | | | | .20 | |
| Year ended 9/30/2010 | | | 30.13 | | | | .13 | | | | 5.58 | | | | 5.71 | | | | (.21 | ) | | | — | | | | (.21 | ) | | | 35.63 | | | | 19.06 | | | | 548 | | | | 1.16 | | | | .41 | |
| Class 529-B: | | | | | | | | | | | | | | | | | | | | | | | | | | | | | | | | | | | | | | | | | | | | | | | | |
| Year ended 9/30/2014 | | | 46.52 | | | | (.42 | ) | | | 2.08 | | | | 1.66 | | | | — | | | | (2.43 | ) | | | (2.43 | ) | | | 45.75 | | | | 3.53 | | | | 17 | | | | 1.95 | | | | (.89 | ) |
| Year ended 9/30/2013 | | | 37.30 | | | | (.30 | ) | | | 9.66 | | | | 9.36 | | | | (.14 | ) | | | — | | | | (.14 | ) | | | 46.52 | | | | 25.17 | | | | 25 | | | | 1.99 | | | | (.73 | ) |
| Year ended 9/30/2012 | | | 30.03 | | | | (.23 | ) | | | 7.50 | | | | 7.27 | | | | — | | | | — | | | | — | | | | 37.30 | | | | 24.21 | | | | 30 | | | | 2.01 | | | | (.68 | ) |
| Year ended 9/30/2011 | | | 34.23 | | | | (.23 | ) | | | (3.76 | ) | | | (3.99 | ) | | | (.21 | ) | | | — | | | | (.21 | ) | | | 30.03 | | | | (11.78 | ) | | | 36 | | | | 1.95 | | | | (.63 | ) |
| Year ended 9/30/2010 | | | 28.98 | | | | (.13 | ) | | | 5.38 | | | | 5.25 | | | | — | | | | — | | | | — | | | | 34.23 | | | | 18.12 | | | | 52 | | | | 1.97 | | | | (.44 | ) |
| | | | | | Income (loss) from
investment operations1 | | | Dividends and distributions | | | | | | | | | | | | | | | | |
| | | Net asset
value,
beginning
of period | | | Net
investment
income
(loss) | | | Net gains
(losses) on
securities
(both
realized and
unrealized) | | | Total from
investment
operations | | | Dividends
(from net
investment
income) | | | Distributions
(from capital
gains) | | | Total
dividends
and
distributions | | | Net asset
value,
end
of period | | | Total
return2 | | | Net assets,
end of period
(in millions) | | | Ratio of
expenses to
average
net assets | | | Ratio of
net income
(loss) to
average
net assets | |
| Class 529-C: | | | | | | | | | | | | | | | | | | | | | | | | | | | | | | | | | | | | | | | | | | | | | | | | |
| Year ended 9/30/2014 | | $ | 46.27 | | | $ | (.40 | ) | | $ | 2.06 | | | $ | 1.66 | | | $ | — | | | $ | (2.43 | ) | | $ | (2.43 | ) | | $ | 45.50 | | | | 3.53 | % | | $ | 280 | | | | 1.94 | % | | | (.85 | )% |
| Year ended 9/30/2013 | | | 37.20 | | | | (.29 | ) | | | 9.60 | | | | 9.31 | | | | (.24 | ) | | | — | | | | (.24 | ) | | | 46.27 | | | | 25.21 | | | | 273 | | | | 1.98 | | | | (.70 | ) |
| Year ended 9/30/2012 | | | 29.95 | | | | (.21 | ) | | | 7.46 | | | | 7.25 | | | | — | | | | — | | | | — | | | | 37.20 | | | | 24.21 | | | | 222 | | | | 2.00 | | | | (.62 | ) |
| Year ended 9/30/2011 | | | 34.19 | | | | (.22 | ) | | | (3.76 | ) | | | (3.98 | ) | | | (.26 | ) | | | — | | | | (.26 | ) | | | 29.95 | | | | (11.77 | ) | | | 186 | | | | 1.94 | | | | (.61 | ) |
| Year ended 9/30/2010 | | | 28.94 | | | | (.12 | ) | | | 5.37 | | | | 5.25 | | | | — | | | | — | | | | — | | | | 34.19 | | | | 18.10 | | | | 194 | | | | 1.97 | | | | (.40 | ) |
| Class 529-E: | | | | | | | | | | | | | | | | | | | | | | | | | | | | | | | | | | | | | | | | | | | | | | | | |
| Year ended 9/30/2014 | | | 47.87 | | | | (.14 | ) | | | 2.11 | | | | 1.97 | | | | — | | | | (2.43 | ) | | | (2.43 | ) | | | 47.41 | | | | 4.10 | | | | 49 | | | | 1.39 | | | | (.30 | ) |
| Year ended 9/30/2013 | | | 38.45 | | | | (.06 | ) | | | 9.91 | | | | 9.85 | | | | (.43 | ) | | | — | | | | (.43 | ) | | | 47.87 | | | | 25.90 | | | | 48 | | | | 1.43 | | | | (.15 | ) |
| Year ended 9/30/2012 | | | 30.79 | | | | (.03 | ) | | | 7.70 | | | | 7.67 | | | | (.01 | ) | | | — | | | | (.01 | ) | | | 38.45 | | | | 24.90 | | | | 38 | | | | 1.45 | | | | (.07 | ) |
| Year ended 9/30/2011 | | | 35.11 | | | | (.03 | ) | | | (3.87 | ) | | | (3.90 | ) | | | (.42 | ) | | | — | | | | (.42 | ) | | | 30.79 | | | | (11.32 | ) | | | 31 | | | | 1.43 | | | | (.08 | ) |
| Year ended 9/30/2010 | | | 29.70 | | | | .04 | | | | 5.50 | | | | 5.54 | | | | (.13 | ) | | | — | | | | (.13 | ) | | | 35.11 | | | | 18.71 | | | | 31 | | | | 1.46 | | | | .11 | |
| Class 529-F-1: | | | | | | | | | | | | | | | | | | | | | | | | | | | | | | | | | | | | | | | | | | | | | | | | |
| Year ended 9/30/2014 | | | 48.73 | | | | .08 | | | | 2.15 | | | | 2.23 | | | | — | | | | (2.43 | ) | | | (2.43 | ) | | | 48.53 | | | | 4.57 | | | | 80 | | | | .94 | | | | .16 | |
| Year ended 9/30/2013 | | | 39.14 | | | | .13 | | | | 10.07 | | | | 10.20 | | | | (.61 | ) | | | — | | | | (.61 | ) | | | 48.73 | | | | 26.43 | | | | 73 | | | | .98 | | | | .30 | |
| Year ended 9/30/2012 | | | 31.35 | | | | .14 | | | | 7.83 | | | | 7.97 | | | | (.18 | ) | | | — | | | | (.18 | ) | | | 39.14 | | | | 25.51 | | | | 53 | | | | .99 | | | | .39 | |
| Year ended 9/30/2011 | | | 35.72 | | | | .15 | | | | (3.94 | ) | | | (3.79 | ) | | | (.58 | ) | | | — | | | | (.58 | ) | | | 31.35 | | | | (10.90 | ) | | | 43 | | | | .94 | | | | .40 | |
| Year ended 9/30/2010 | | | 30.20 | | | | .20 | | | | 5.59 | | | | 5.79 | | | | (.27 | ) | | | — | | | | (.27 | ) | | | 35.72 | | | | 19.31 | | | | 47 | | | | .95 | | | | .62 | |
| Class R-1: | | | | | | | | | | | | | | | | | | | | | | | | | | | | | | | | | | | | | | | | | | | | | | | | |
| Year ended 9/30/2014 | | | 46.56 | | | | (.35 | ) | | | 2.07 | | | | 1.72 | | | | — | | | | (2.43 | ) | | | (2.43 | ) | | | 45.85 | | | | 3.66 | | | | 39 | | | | 1.82 | | | | (.74 | ) |
| Year ended 9/30/2013 | | | 37.40 | | | | (.23 | ) | | | 9.66 | | | | 9.43 | | | | (.27 | ) | | | — | | | | (.27 | ) | | | 46.56 | | | | 25.37 | | | | 42 | | | | 1.84 | | | | (.57 | ) |
| Year ended 9/30/2012 | | | 30.07 | | | | (.17 | ) | | | 7.50 | | | | 7.33 | | | | — | | | | — | | | | — | | | | 37.40 | | | | 24.38 | | | | 37 | | | | 1.86 | | | | (.50 | ) |
| Year ended 9/30/2011 | | | 34.32 | | | | (.19 | ) | | | (3.77 | ) | | | (3.96 | ) | | | (.29 | ) | | | — | | | | (.29 | ) | | | 30.07 | | | | (11.68 | ) | | | 35 | | | | 1.84 | | | | (.52 | ) |
| Year ended 9/30/2010 | | | 29.05 | | | | (.09 | ) | | | 5.39 | | | | 5.30 | | | | (.03 | ) | | | — | | | | (.03 | ) | | | 34.32 | | | | 18.25 | | | | 43 | | | | 1.87 | | | | (.30 | ) |
| Class R-2: | | | | | | | | | | | | | | | | | | | | | | | | | | | | | | | | | | | | | | | | | | | | | | | | |
| Year ended 9/30/2014 | | | 46.56 | | | | (.35 | ) | | | 2.06 | | | | 1.71 | | | | — | | | | (2.43 | ) | | | (2.43 | ) | | | 45.84 | | | | 3.64 | | | | 689 | | | | 1.83 | | | | (.75 | ) |
| Year ended 9/30/2013 | | | 37.39 | | | | (.23 | ) | | | 9.67 | | | | 9.44 | | | | (.27 | ) | | | — | | | | (.27 | ) | | | 46.56 | | | | 25.41 | | | | 736 | | | | 1.83 | | | | (.55 | ) |
| Year ended 9/30/2012 | | | 30.07 | | | | (.18 | ) | | | 7.50 | | | | 7.32 | | | | — | | | | — | | | | — | | | | 37.39 | | | | 24.34 | | | | 647 | | | | 1.89 | | | | (.52 | ) |
| Year ended 9/30/2011 | | | 34.30 | | | | (.20 | ) | | | (3.76 | ) | | | (3.96 | ) | | | (.27 | ) | | | — | | | | (.27 | ) | | | 30.07 | | | | (11.72 | ) | | | 581 | | | | 1.86 | | | | (.54 | ) |
| Year ended 9/30/2010 | | | 29.03 | | | | (.11 | ) | | | 5.38 | | | | 5.27 | | | | — | | | | — | | | | — | | | | 34.30 | | | | 18.19 | | | | 712 | | | | 1.93 | | | | (.37 | ) |
| Class R-2E: | | | | | | | | | | | | | | | | | | | | | | | | | | | | | | | | | | | | | | | | | | | | | | | | |
| Period from 8/29/2014 to 9/30/20143,4 | | | 50.83 | | | | (.01 | ) | | | (2.15 | ) | | | (2.16 | ) | | | — | | | | — | | | | — | | | | 48.67 | | | | (4.25 | ) | | | — | 5 | | | .086 | | | | (.01 | )6 |
| Class R-3: | | | | | | | | | | | | | | | | | | | | | | | | | | | | | | | | | | | | | | | | | | | | | | | | |
| Year ended 9/30/2014 | | | 47.79 | | | | (.14 | ) | | | 2.12 | | | | 1.98 | | | | — | | | | (2.43 | ) | | | (2.43 | ) | | | 47.34 | | | | 4.12 | | | | 811 | | | | 1.39 | | | | (.30 | ) |
| Year ended 9/30/2013 | | | 38.39 | | | | (.05 | ) | | | 9.89 | | | | 9.84 | | | | (.44 | ) | | | — | | | | (.44 | ) | | | 47.79 | | | | 25.90 | | | | 836 | | | | 1.40 | | | | (.12 | ) |
| Year ended 9/30/2012 | | | 30.73 | | | | (.02 | ) | | | 7.68 | | | | 7.66 | | | | — | | | | — | | | | — | | | | 38.39 | | | | 24.92 | | | | 694 | | | | 1.42 | | | | (.05 | ) |
| Year ended 9/30/2011 | | | 35.03 | | | | (.03 | ) | | | (3.84 | ) | | | (3.87 | ) | | | (.43 | ) | | | — | | | | (.43 | ) | | | 30.73 | | | | (11.28 | ) | | | 586 | | | | 1.41 | | | | (.08 | ) |
| Year ended 9/30/2010 | | | 29.64 | | | | .04 | | | | 5.49 | | | | 5.53 | | | | (.14 | ) | | | — | | | | (.14 | ) | | | 35.03 | | | | 18.71 | | | | 667 | | | | 1.44 | | | | .13 | |
See page 28 for footnotes.
Financial highlights (continued)
| | | | | | Income (loss) from
investment operations1 | | | Dividends and distributions | | | | | | | | | | | | | | | | |
| | | Net asset
value,
beginning
of period | | | Net
investment
income
(loss) | | | Net gains
(losses) on
securities
(both
realized and
unrealized) | | | Total from
investment
operations | | | Dividends
(from net
investment
income) | | | Distributions
(from capital
gains) | | | Total
dividends
and
distributions | | | Net asset
value,
end
of period | | | Total
return2 | | | Net assets,
end of period
(in millions) | | | Ratio of
expenses to
average
net assets | | | Ratio of
net income
(loss) to
average
net assets | |
| Class R-4: | | | | | | | | | | | | | | | | | | | | | | | | | | | | | | | | | | | | | | | | | | | | | | | | |
| Year ended 9/30/2014 | | $ | 48.59 | | | $ | .02 | | | $ | 2.15 | | | $ | 2.17 | | | $ | — | | | $ | (2.43 | ) | | $ | (2.43 | ) | | $ | 48.33 | | | | 4.46 | % | | $ | 727 | | | | 1.06 | % | | | .03 | % |
| Year ended 9/30/2013 | | | 39.03 | | | | .09 | | | | 10.04 | | | | 10.13 | | | | (.57 | ) | | | — | | | | (.57 | ) | | | 48.59 | | | | 26.31 | | | | 712 | | | | 1.07 | | | | .21 | |
| Year ended 9/30/2012 | | | 31.25 | | | | .11 | | | | 7.80 | | | | 7.91 | | | | (.13 | ) | | | — | | | | (.13 | ) | | | 39.03 | | | | 25.38 | | | | 550 | | | | 1.08 | | | | .30 | |
| Year ended 9/30/2011 | | | 35.60 | | | | .10 | | | | (3.91 | ) | | | (3.81 | ) | | | (.54 | ) | | | — | | | | (.54 | ) | | | 31.25 | | | | (10.98 | ) | | | 441 | | | | 1.07 | | | | .26 | |
| Year ended 9/30/2010 | | | 30.12 | | | | .15 | | | | 5.58 | | | | 5.73 | | | | (.25 | ) | | | — | | | | (.25 | ) | | | 35.60 | | | | 19.15 | | | | 486 | | | | 1.09 | | | | .48 | |
| Class R-5: | | | | | | | | | | | | | | | | | | | | | | | | | | | | | | | | | | | | | | | | | | | | | | | | |
| Year ended 9/30/2014 | | | 49.46 | | | | .15 | | | | 2.21 | | | | 2.36 | | | | — | | | | (2.43 | ) | | | (2.43 | ) | | | 49.39 | | | | 4.78 | | | | 452 | | | | .76 | | | | .29 | |
| Year ended 9/30/2013 | | | 39.71 | | | | .22 | | | | 10.22 | | | | 10.44 | | | | (.69 | ) | | | — | | | | (.69 | ) | | | 49.46 | | | | 26.72 | | | | 550 | | | | .77 | | | | .51 | |
| Year ended 9/30/2012 | | | 31.80 | | | | .22 | | | | 7.93 | | | | 8.15 | | | | (.24 | ) | | | — | | | | (.24 | ) | | | 39.71 | | | | 25.77 | | | | 384 | | | | .78 | | | | .60 | |
| Year ended 9/30/2011 | | | 36.21 | | | | .22 | | | | (3.99 | ) | | | (3.77 | ) | | | (.64 | ) | | | — | | | | (.64 | ) | | | 31.80 | | | | (10.74 | ) | | | 314 | | | | .77 | | | | .56 | |
| Year ended 9/30/2010 | | | 30.60 | | | | .26 | | | | 5.66 | | | | 5.92 | | | | (.31 | ) | | | — | | | | (.31 | ) | | | 36.21 | | | | 19.50 | | | | 347 | | | | .78 | | | | .79 | |
| Class R-6: | | | | | | | | | | | | | | | | | | | | | | | | | | | | | | | | | | | | | | | | | | | | | | | | |
| Year ended 9/30/2014 | | | 49.00 | | | | .21 | | | | 2.15 | | | | 2.36 | | | | — | | | | (2.43 | ) | | | (2.43 | ) | | | 48.93 | | | | 4.82 | | | | 1,859 | | | | .71 | | | | .41 | |
| Year ended 9/30/2013 | | | 39.34 | | | | .25 | | | | 10.12 | | | | 10.37 | | | | (.71 | ) | | | — | | | | (.71 | ) | | | 49.00 | | | | 26.80 | | | | 1,206 | | | | .72 | | | | .57 | |
| Year ended 9/30/2012 | | | 31.52 | | | | .24 | | | | 7.84 | | | | 8.08 | | | | (.26 | ) | | | — | | | | (.26 | ) | | | 39.34 | | | | 25.79 | | | | 768 | | | | .73 | | | | .67 | |
| Year ended 9/30/2011 | | | 35.89 | | | | .24 | | | | (3.96 | ) | | | (3.72 | ) | | | (.65 | ) | | | — | | | | (.65 | ) | | | 31.52 | | | | (10.68 | ) | | | 494 | | | | .72 | | | | .64 | |
| Year ended 9/30/2010 | | | 30.31 | | | | .27 | | | | 5.62 | | | | 5.89 | | | | (.31 | ) | | | — | | | | (.31 | ) | | | 35.89 | | | | 19.57 | | | | 411 | | | | .73 | | | | .84 | |
| | | Year ended September 30 |
| | | 2014 | | 2013 | | 2012 | | 2011 | | 2010 |
| Portfolio turnover rate for all share classes | | | 38 | % | | | 37 | % | | | 35 | % | | | 39 | % | | | 45 | % |
| 1 | Based on average shares outstanding. |
| 2 | Total returns exclude any applicable sales charges, including contingent deferred sales charges. |
| 3 | Based on operations for the period shown and, accordingly, is not representative of a full year. |
| 4 | Class R-2E shares were offered beginning August 29, 2014. |
| 5 | Amount less than $1 million. |
| 6 | Class R-2E assets consisted solely of seed capital invested by CRMC; therefore, certain fees were not accrued. |
See Notes to Financial Statements
Report of Independent Registered Public Accounting Firm
To the Shareholders and Board of Directors of SMALLCAP World Fund, Inc. :
We have audited the accompanying statement of assets and liabilities of SMALLCAP World Fund, Inc. (the “Fund”), including the summary investment portfolio, as of September 30, 2014, and the related statement of operations for the year then ended, the statements of changes in net assets for each of the two years in the period then ended, and the financial highlights for each of the periods presented. These financial statements and financial highlights are the responsibility of the Fund’s management. Our responsibility is to express an opinion on these financial statements and financial highlights based on our audits.
We conducted our audits in accordance with the standards of the Public Company Accounting Oversight Board (United States). Those standards require that we plan and perform the audit to obtain reasonable assurance about whether the financial statements and financial highlights are free of material misstatement. The Fund is not required to have, nor were we engaged to perform, an audit of its internal control over financial reporting. Our audits included consideration of internal control over financial reporting as a basis for designing audit procedures that are appropriate in the circumstances, but not for the purpose of expressing an opinion on the effectiveness of the Fund’s internal control over financial reporting. Accordingly, we express no such opinion. An audit also includes examining, on a test basis, evidence supporting the amounts and disclosures in the financial statements, assessing the accounting principles used and significant estimates made by management, as well as evaluating the overall financial statement presentation. Our procedures included confirmation of securities owned as of September 30, 2014, by correspondence with the custodian and brokers; where replies were not received from brokers, we performed other auditing procedures. We believe that our audits provide a reasonable basis for our opinion.
In our opinion, such financial statements and financial highlights referred to above present fairly, in all material respects, the financial position of SMALLCAP World Fund, Inc. as of September 30, 2014, the results of its operations for the year then ended, the changes in its net assets for each of the two years in the period then ended, and the financial highlights for each of the periods presented, in conformity with accounting principles generally accepted in the United States of America.
Deloitte & Touche LLP
Costa Mesa, California
November 10, 2014
As a fund shareholder, you incur two types of costs: (1) transaction costs, such as initial sales charges on purchase payments and contingent deferred sales charges on redemptions (loads), and (2) ongoing costs, including management fees, distribution and service (12b-1) fees, and other expenses. This example is intended to help you understand your ongoing costs (in dollars) of investing in the fund so you can compare these costs with the ongoing costs of investing in other mutual funds. The example is based on an investment of $1,000 invested at the beginning of the period and held for the entire six-month period (April 1, 2014, through September 30, 2014).
Actual expenses:
The first line of each share class in the table on the following page provides information about actual account values and actual expenses. You may use the information in this line, together with the amount you invested, to estimate the expenses that you paid over the period. Simply divide your account value by $1,000 (for example, an $8,600 account value divided by $1,000 = 8.6), then multiply the result by the number in the first line under the heading entitled “Expenses paid during period” to estimate the expenses you paid on your account during this period.
Hypothetical example for comparison purposes:
The second line of each share class in the table on the following page provides information about hypothetical account values and hypothetical expenses based on the actual expense ratio for the share class and an assumed rate of return of 5.00% per year before expenses, which is not the actual return of the share class. The hypothetical account values and expenses may not be used to estimate the actual ending account balance or expenses you paid for the period. You may use this information to compare the ongoing costs of investing in the fund and other funds. To do so, compare this 5.00% hypothetical example with the 5.00% hypothetical examples that appear in the shareholder reports of the other funds.
Notes:
Retirement plan participants may be subject to certain fees charged by the plan sponsor, and Class F-1, F-2 and 529-F-1 shareholders may be subject to fees charged by financial intermediaries, typically ranging from 0.75% to 1.50% of assets annually depending on services offered. You can estimate the impact of these fees by adding the amount of the fees to the total estimated expenses you paid on your account during the period as calculated above. In addition, your ending account value would be lower by the amount of these fees.
Note that the expenses shown in the table on the following page are meant to highlight your ongoing costs only and do not reflect any transactional costs, such as sales charges (loads). Therefore, the second line of each share class in the table is useful in comparing ongoing costs only and will not help you determine the relative total costs of owning different funds. In addition, if these transactional costs were included, your costs would have been higher.
| | | Beginning
account value
4/1/2014 | | | Ending
account value
9/30/2014 | | | Expenses paid
during period* | | | Annualized
expense ratio | |
| Class A - actual return | | $ | 1,000.00 | | | $ | 978.11 | | | $ | 6.05 | | | | 1.22 | % |
| Class A - assumed 5% return | | | 1,000.00 | | | | 1,018.95 | | | | 6.17 | | | | 1.22 | |
| Class B - actual return | | | 1,000.00 | | | | 974.41 | | | | 6.83 | | | | 1.38 | |
| Class B - assumed 5% return | | | 1,000.00 | | | | 1,018.15 | | | | 6.98 | | | | 1.38 | |
| Class C - actual return | | | 1,000.00 | | | | 974.11 | | | | 10.54 | | | | 2.13 | |
| Class C - assumed 5% return | | | 1,000.00 | | | | 1,014.39 | | | | 10.76 | | | | 2.13 | |
| Class F-1 - actual return | | | 1,000.00 | | | | 977.91 | | | | 7.49 | | | | 1.51 | |
| Class F-1 - assumed 5% return | | | 1,000.00 | | | | 1,017.50 | | | | 7.64 | | | | 1.51 | |
| Class F-2 - actual return | | | 1,000.00 | | | | 979.57 | | | | 5.06 | | | | 1.02 | |
| Class F-2 - assumed 5% return | | | 1,000.00 | | | | 1,019.95 | | | | 5.16 | | | | 1.02 | |
| Class 529-A - actual return | | | 1,000.00 | | | | 977.73 | | | | 6.74 | | | | 1.36 | |
| Class 529-A - assumed 5% return | | | 1,000.00 | | | | 1,018.25 | | | | 6.88 | | | | 1.36 | |
| Class 529-B - actual return | | | 1,000.00 | | | | 973.83 | | | | 7.47 | | | | 1.51 | |
| Class 529-B - assumed 5% return | | | 1,000.00 | | | | 1,017.50 | | | | 7.64 | | | | 1.51 | |
| Class 529-C - actual return | | | 1,000.00 | | | | 973.88 | | | | 11.23 | | | | 2.27 | |
| Class 529-C - assumed 5% return | | | 1,000.00 | | | | 1,013.69 | | | | 11.46 | | | | 2.27 | |
| Class 529-E - actual return | | | 1,000.00 | | | | 976.50 | | | | 8.18 | | | | 1.65 | |
| Class 529-E - assumed 5% return | | | 1,000.00 | | | | 1,016.80 | | | | 8.34 | | | | 1.65 | |
| Class 529-F-1 - actual return | | | 1,000.00 | | | | 978.61 | | | | 5.65 | | | | 1.14 | |
| Class 529-F-1 - assumed 5% return | | | 1,000.00 | | | | 1,019.35 | | | | 5.77 | | | | 1.14 | |
| Class R-1 - actual return | | | 1,000.00 | | | | 974.27 | | | | 10.20 | | | | 2.06 | |
| Class R-1 - assumed 5% return | | | 1,000.00 | | | | 1,014.74 | | | | 10.40 | | | | 2.06 | |
| Class R-2 - actual return | | | 1,000.00 | | | | 974.28 | | | | 10.20 | | | | 2.06 | |
| Class R-2 - assumed 5% return | | | 1,000.00 | | | | 1,014.74 | | | | 10.40 | | | | 2.06 | |
| Class R-2E - actual return† | | | 1,000.00 | | | | 957.48 | | | | .79 | | | | .92 | |
| Class R-2E - assumed 5% return† | | | 1,000.00 | | | | 1,020.46 | | | | 4.66 | | | | .92 | |
| Class R-3 - actual return | | | 1,000.00 | | | | 976.67 | | | | 7.98 | | | | 1.61 | |
| Class R-3 - assumed 5% return | | | 1,000.00 | | | | 1,017.00 | | | | 8.14 | | | | 1.61 | |
| Class R-4 - actual return | | | 1,000.00 | | | | 978.15 | | | | 6.35 | | | | 1.28 | |
| Class R-4 - assumed 5% return | | | 1,000.00 | | | | 1,018.65 | | | | 6.48 | | | | 1.28 | |
| Class R-5 - actual return | | | 1,000.00 | | | | 979.75 | | | | 4.91 | | | | .99 | |
| Class R-5 - assumed 5% return | | | 1,000.00 | | | | 1,020.10 | | | | 5.01 | | | | .99 | |
| Class R-6 - actual return | | | 1,000.00 | | | | 979.97 | | | | 4.57 | | | | .92 | |
| Class R-6 - assumed 5% return | | | 1,000.00 | | | | 1,020.46 | | | | 4.66 | | | | .92 | |
| * | The “expenses paid during period” are equal to the “annualized expense ratio,” multiplied by the average account value over the period, multiplied by the number of days in the period, and divided by 365 (to reflect the one-half year period). |
| † | The period for the “annualized expense ratio” and “actual return” line is based on the number of days since the initial sale of the share class on August 29, 2014. The “assumed 5% return” line is based on 183 days. |
We are required to advise you of the federal tax status of certain distributions received by shareholders during the fiscal year. The fund hereby designates the following amounts for the fund’s fiscal year ended September 30, 2014:
| Foreign taxes | $0.03 per share |
| Foreign source income | $0.42 per share |
| Long-term capital gains | $1,231,152,000 |
Individual shareholders should refer to their Form 1099 or other tax information, which will be mailed in January 2015, to determine the calendar year amounts to be included on their 2014 tax returns. Shareholders should consult their tax advisors.
Approval of Investment Advisory and Service Agreement
The SMALLCAP World Fund board has approved the fund’s Investment Advisory and Service Agreement (the “agreement”) with Capital Research and Management Company (“CRMC”) for an additional one-year term through November 30, 2015. The board approved the agreement following the recommendation of the fund’s Contracts Committee (the “committee”), which is composed of all of the fund’s independent board members. The board and the committee determined that the fund’s advisory fee structure was fair and reasonable in relation to the services provided and that approving the agreement was in the best interests of the fund and its shareholders.
In reaching this decision, the board and the committee took into account information furnished to them throughout the year and otherwise provided to them, as well as information prepared specifically in connection with their review of the agreement, and were advised by their independent counsel. They considered the following factors, among others, but did not identify any single issue or particular piece of information that, in isolation, was the controlling factor, and each board and committee member did not necessarily attribute the same weight to each factor.
1. Nature, extent and quality of services
The board and the committee considered the depth and quality of CRMC’s investment management process, including its global research capabilities; the experience, capability and integrity of its senior management and other personnel; the low turnover rates of its key personnel; the overall financial strength and stability of CRMC and the Capital Group organization; and the ongoing evolution of CRMC’s organizational structure designed to maintain and strengthen these qualities. The board and the committee also considered the nature, extent and quality of administrative, compliance and shareholder services provided by CRMC to the fund under the agreement and other agreements, as well as the benefits to fund shareholders from investing in a fund that is part of a large family of funds. The board and the committee concluded that the nature, extent and quality of the services provided by CRMC have benefited and should continue to benefit the fund and its shareholders.
2. Investment results
The board and the committee considered the investment results of the fund in light of its objective of pursuing long term growth of capital. They compared the fund’s investment results with those of other relevant funds (including funds that form the basis of the Lipper index for the category in which the fund is included), and data such as relevant market and fund indexes, over various periods through March 31, 2014. This report, including the letter to shareholders and related disclosures, contains certain information about the fund’s investment results. The board and the committee reviewed the fund’s investment results measured against various indexes and categories, including the MSCI All Country World Small Cap Index and funds in the Lipper Global Small/Mid-Cap Funds category. They noted that the investment results of the fund were mixed, generally comparing favorably to funds in the Lipper Global Small/Mid-Cap Funds category for the 10-year period, the five-year period and mixed over shorter periods, and below the MSCI All Country World Small Cap Index for the 10-year period, the five-year period and over shorter periods, while recognizing that none of the indexes or categories is a perfect comparison given the fund’s distinguishing characteristics. The board and the committee concluded that the fund’s investment results have been satisfactory for renewal of the agreement and that CRMC’s record in managing the fund indicated that its continued management should benefit the fund and its shareholders.
3. Advisory fees and total expenses
The board and the committee compared the advisory fees and total expense levels of the fund to those of other relevant funds. They observed that the fund’s advisory fees and expenses generally compared favorably to those of other similar funds included in the Lipper Global Small/Mid-Cap Funds category. The board and the committee also considered the breakpoint discounts in the fund’s advisory fee structure that reduce the level of fees charged by CRMC to the fund as fund assets increase. In addition, they reviewed information regarding the effective advisory fees charged to non-mutual fund clients by CRMC and its affiliates. They noted that, to the extent there were differences between the advisory fees paid by the fund and the advisory fees paid by those clients, the differences appropriately reflected the investment, operational and regulatory differences between advising the fund and the other clients. The board and the committee concluded that the fund’s cost structure was fair and reasonable in relation to the services provided, and that the fund’s shareholders receive reasonable value in return for the advisory fees and other amounts paid to CRMC by the fund.
4. Ancillary benefits
The board and the committee considered a variety of other benefits that CRMC and its affiliates receive as a result of CRMC’s relationship with the fund and the other American Funds, including fees for administrative services provided to certain share classes; fees paid to CRMC’s affiliated transfer agent; sales charges and distribution fees received and retained by the fund’s principal underwriter, an affiliate of CRMC; and possible ancillary benefits to CRMC and its institutional management affiliates in managing other investment vehicles. The board and the committee reviewed CRMC’s portfolio trading practices, noting that while CRMC receives the benefit of research provided by broker-dealers executing portfolio transactions on behalf of the fund, it does not obtain third-party research or other services in return for allocating brokerage to such broker-dealers. The board and the committee took these ancillary benefits into account in evaluating the reasonableness of the advisory fees and other amounts paid to CRMC by the fund.
5. Adviser financial information
The board and the committee reviewed information regarding CRMC’s costs of providing services to the American Funds, including personnel, systems and resources of investment, compliance, trading, accounting and other administrative operations. They considered CRMC’s costs and willingness to invest in technology, infrastructure and staff to maintain and expand services and capabilities, respond to industry and regulatory developments, and attract and retain qualified personnel. They noted information regarding the compensation structure for CRMC’s investment professionals. The board and the committee also compared CRMC’s profitability and compensation data to the reported results and data of several large, publicly held investment management companies. The board and the committee noted the competitiveness and cyclicality of both the mutual fund industry and the capital markets, and the importance in that environment of CRMC’s long-term profitability for maintaining its independence, company culture and management continuity. They further considered the breakpoint discounts in the fund’s advisory fee structure. The board and the committee concluded that the fund’s advisory fee structure reflected a reasonable sharing of benefits between CRMC and the fund’s shareholders.
Board of directors and other officers
“Independent” directors1
| Name and age | | Year first
elected
a director
of the fund2 | | Principal occupation(s) during past five years | | Number of
portfolios in fund
complex overseen
by director | | Other directorships3
held by director |
| Ronald P. Badie, 71 | | 2010 | | Retired; former Vice Chairman, Deutsche Bank Alex. Brown (retired 2002) | | 3 | | Amphenol Corporation; Nautilus, Inc. |
Joseph C. Berenato, 68
Chairman of the Board (Independent and Non-Executive) | | 2000 | | Former Chairman and CEO, Ducommun Incorporated (aerospace components manufacturer) | | 6 | | Ducommun Incorporated |
| Louise H. Bryson, 70 | | 2010 | | Chair Emerita of the Board of Trustees, J. Paul Getty Trust; former President, Distribution, Lifetime Entertainment Network (retired 2008); former Executive Vice President and General Manager, Lifetime Movie Network (retired 2008) | | 7 | | None |
| Robert J. Denison, 73 | | 2010 | | Chair, First Security Management (private investment) | | 6 | | None |
| Mary Anne Dolan, 67 | | 2008 | | Founder and President, MAD Ink (communications company) | | 10 | | None |
| John G. Freund, 61 | | 2000 | | Founder and Managing Director, Skyline Ventures (venture capital investor in health care companies) | | 3 | | Concert Pharmaceuticals, Inc.; Proteon Therapeutics, Inc.; Tetraphase Pharmaceuticals, Inc.; XenoPort, Inc. |
| Leonade D. Jones, 67 | | 1995 | | Retired; former Treasurer, The Washington Post Company (retired 1996) | | 10 | | None |
| William H. Kling, 72 | | 1990 | | President Emeritus and former CEO, American Public Media | | 10 | | None |
| Christopher E. Stone, 58 | | 2007 | | President, Open Society Foundations; former Professor of the Practice of Criminal Justice, John F. Kennedy School of Government, Harvard University | | 6 | | None |
“Interested” directors4,5
Name, age and
position with fund | | Year first
elected
a director
or officer
of the fund2 | | Principal occupation(s) during past five years
and positions held with affiliated entities or
the principal underwriter of the fund | | Number of
portfolios in fund
complex overseen
by director | | Other directorships3
held by director |
Jonathan Knowles, Ph.D., 53
Vice Chairman of the Board | | 2000 | | Senior Vice President — Capital World Investors, Capital International, Inc.6 | | 1 | | None |
Gregory W. Wendt, 53
President | | 1992 | | Senior Vice President — Capital Research Global Investors, Capital Research and Management Company | | 1 | | None |
The fund’s statement of additional information includes further details about fund directors and is available without charge upon request by calling American Funds Service Company at (800) 421-4225 or by visiting the American Funds website at americanfunds.com. The address for all directors and officers of the fund is 333 South Hope Street, Los Angeles, CA 90071, Attention: Secretary.
See page 36 for footnotes.
Other officers5
Name, age and
position with fund | | Year first
elected
an officer
of the fund2 | | Principal occupation(s) during past five years and positions held with affiliated entities
or the principal underwriter of the fund |
Paul F. Roye, 60
Executive Vice President | | 2007 | | Senior Vice President — Fund Business Management Group, Capital Research and Management Company; Director, American Funds Service Company6 |
Brady L. Enright, 47
Senior Vice President | | 2004 | | Senior Vice President — Capital World Investors, Capital Research and Management Company |
J. Blair Frank, 48
Senior Vice President | | 1999 | | Senior Vice President — Capital Research Global Investors, Capital Research and Management Company |
Lawrence Kymisis, 44
Senior Vice President | | 2008 | | Senior Vice President — Capital Research Global Investors, Capital Research Company6 |
Walter R. Burkley, 48
Vice President | | 2007 | | Senior Vice President and Senior Counsel — Fund Business Management Group, Capital Research and Management Company; Director, Capital Research Company6 |
Bradford F. Freer, 45
Vice President | | 2008 | | Senior Vice President — Capital World Investors, Capital Research and Management Company |
Michael W. Stockton, 47
Secretary | | 2014 | | Vice President — Fund Business Management Group, Capital Research and Management Company |
Jeffrey P. Regal, 43
Treasurer | | 2010 | | Vice President — Investment Operations, Capital Research and Management Company |
Julie E. Lawton, 41
Assistant Secretary | | 2010 | | Assistant Vice President — Fund Business Management Group, Capital Research and Management Company |
Dori Laskin, 63
Assistant Treasurer | | 2011 | | Vice President — Investment Operations, Capital Research and Management Company |
Neal F. Wellons, 43
Assistant Treasurer | | 2008 | | Vice President — Investment Operations, Capital Research and Management Company |
| 1 | The term “independent” director refers to a director who is not an “interested person” of the fund within the meaning of the Investment Company Act of 1940. |
| 2 | Directors and officers of the fund serve until their resignation, removal or retirement. |
| 3 | This includes all directorships/trusteeships (other than those in the American Funds or other funds managed by Capital Research and Management Company or its affiliates) that are held by each director as a trustee or director of a public company or a registered investment company. |
| 4 | The term “interested” trustee refers to a trustee who is an “interested person” within the meaning of the Investment Company Act of 1940, on the basis of their affiliation with the fund’s investment adviser, Capital Research and Management Company, or affiliated entities (including the fund’s principal underwriter). |
| 5 | All of the directors/trustees and/or officers listed, except Messrs. Frank and Kymisis, are officers and/or directors/trustees of one or more of the other funds for which Capital Research and Management Company serves as investment adviser. |
| 6 | Company affiliated with Capital Research and Management Company. |
Offices of the fund and of the investment adviser
Capital Research and Management Company
333 South Hope Street
Los Angeles, CA 90071-1406
6455 Irvine Center Drive
Irvine, CA 92618-4518
Transfer agent for shareholder accounts
American Funds Service Company
(Write to the address near you.)
P.O. Box 6007
Indianapolis, IN 46206-6007
P.O. Box 2280
Norfolk, VA 23501-2280
Custodian of assets
State Street Bank and Trust Company
One Lincoln Street
Boston, MA 02111
Counsel
K&L Gates LLP
Four Embarcadero Center, Suite 1200
San Francisco, CA 94111-5994
Independent registered public accounting firm
Deloitte & Touche LLP
695 Town Center Drive
Suite 1200
Costa Mesa, CA 92626-7188
Principal underwriter
American Funds Distributors, Inc.
333 South Hope Street
Los Angeles, CA 90071-1406
Investors should carefully consider investment objectives, risks, charges and expenses. This and other important information is contained in the fund prospectus and summary prospectus, which can be obtained from your financial professional and should be read carefully before investing. You may also call American Funds Service Company (AFS) at (800) 421-4225 or visit the American Funds website at americanfunds.com.
“American Funds Proxy Voting Procedures and Principles” — which describes how we vote proxies relating to portfolio securities — is available on the American Funds website or upon request by calling AFS. The fund files its proxy voting record with the U.S. Securities and Exchange Commission (SEC) for the 12 months ended June 30 by August 31. The proxy voting record is available free of charge on the SEC website at sec.gov and on the American Funds website.
A complete September 30, 2014, portfolio of SMALLCAP World Fund’s investments is available free of charge by calling AFS or visiting the SEC website (where it is part of Form N-CSR).
SMALLCAP World Fund files a complete list of its portfolio holdings with the SEC for the first and third quarters of each fiscal year on Form N-Q. This filing is available free of charge on the SEC website. You may also review or, for a fee, copy this filing at the SEC’s Public Reference Room in Washington, D.C. Additional information regarding the operation of the Public Reference Room may be obtained by calling the SEC’s Office of Investor Education and Advocacy at (800) SEC-0330. Additionally, the list of portfolio holdings is available by calling AFS.
This report is for the information of shareholders of SMALLCAP World Fund, but it also may be used as sales literature when preceded or accompanied by the current prospectus or summary prospectus, which gives details about charges, expenses, investment objectives and operating policies of the fund. If used as sales material after December 31, 2014, this report must be accompanied by an American Funds statistical update for the most recently completed calendar quarter.
The American Funds Advantage
Since 1931, American Funds, part of Capital Group, has helped investors pursue long-term investment success. Our consistent approach — in combination with The Capital SystemSM — has resulted in a superior long-term track record.
| | Aligned with investor success |
| | We base our decisions on a long-term perspective, which we believe aligns our goals with the interests of our clients. Our portfolio managers average 26 years of investment experience, including 21 years at our company, reflecting a career commitment to our long-term approach.1 |
| | |
| | The Capital SystemSM |
| | Our investment process, The Capital System, combines individual accountability with teamwork. Each fund is divided into portions that are managed independently by investment professionals with diverse backgrounds, ages and investment approaches. An extensive global research effort is the backbone of our system. |
| | |
| | Superior long-term track record |
| | Our equity funds have beaten their Lipper peer indexes in 90% of 10-year periods and 96% of 20-year periods. Our fixed-income funds have beaten their Lipper indexes in 56% of 10-year periods and 57% of 20-year periods.2 Our fund management fees have been among the lowest in the industry.3 |
| | |
| | 1 | Portfolio manager experience as of December 31, 2013. |
| | 2 | Based on Class A share results for rolling periods through December 31, 2013. Periods covered are the shorter of the fund’s lifetime or since the comparable Lipper index inception date (except SMALLCAP World Fund, for which the Lipper average was used). |
| | 3 | Based on management fees for the 20-year period ended December 31, 2013, versus comparable Lipper categories, excluding funds of funds. |

ITEM 2 – Code of Ethics
The Registrant has adopted a Code of Ethics that applies to its Principal Executive Officer and Principal Financial Officer. The Registrant undertakes to provide to any person without charge, upon request, a copy of the Code of Ethics. Such request can be made to American Funds Service Company at 800/421-9225 or to the Secretary of the Registrant, 333 South Hope Street, Los Angeles, California 90071.
ITEM 3 – Audit Committee Financial Expert
The Registrant’s board has determined that Ronald P. Badie, a member of the Registrant’s audit committee, is an “audit committee financial expert” and "independent," as such terms are defined in this Item. This designation will not increase the designee’s duties, obligations or liability as compared to his or her duties, obligations and liability as a member of the audit committee and of the board, nor will it reduce the responsibility of the other audit committee members. There may be other individuals who, through education or experience, would qualify as "audit committee financial experts" if the board had designated them as such. Most importantly, the board believes each member of the audit committee contributes significantly to the effective oversight of the Registrant’s financial statements and condition.
ITEM 4 – Principal Accountant Fees and Services
| | Registrant: |
| | | a) Audit Fees: |
| | | | 2013 | $125,000 |
| | | | 2014 | $145,000 |
| | | | |
| | | b) Audit-Related Fees: |
| | | | 2013 | $ 7,000 |
| | | | 2014 | $ 6,000 |
| | | | The audit-related fees consist of assurance and related services relating to the examination of the Registrant’s investment adviser conducted in accordance with Statement on Standards for Attestation Engagements Number 16 issued by the American Institute of Certified Public Accountants. |
| | | | |
| | | c) Tax Fees: |
| | | | 2013 | $ 6,000 |
| | | | 2014 | $ 37,000 |
| | | | The tax fees consist of professional services relating to the preparation of the Registrant’s tax returns including returns relating to the Registrant’s investments in non-U.S. jurisdictions. |
| | | | |
| | | d) All Other Fees: |
| | | | 2013 | None |
| | | | 2014 | None |
| | | | |
| | Adviser and affiliates (includes only fees for non-audit services billed to the adviser and affiliates for engagements that relate directly to the operations and financial reporting of the Registrant and were subject to the pre-approval policies described below): |
| | | a) Audit Fees: |
| | | | Not Applicable |
| | | | |
| | | b) Audit-Related Fees: |
| | | | 2013 | $ 1,046,000 |
| | | | 2014 | $ 993,000 |
| | | | The audit-related fees consist of assurance and related services relating to the examination of the Registrant’s transfer agent, principal underwriter and investment adviser conducted in accordance with Statement on Standards for Attestation Engagements Number 16 issued by the American Institute of Certified Public Accountants. |
| | | | |
| | | c) Tax Fees: |
| | | | 2013 | $ 28,000 |
| | | | 2014 | $ 41,000 |
| | | | The tax fees consist of consulting services relating to the Registrant’s investments. |
| | | | |
| | | d) All Other Fees: |
| | | | 2013 | $ 2,000 |
| | | | 2014 | $ 3,000 |
| | | | The other fees consist of subscription services related to an accounting research tool. |
| | | | |
All audit and permissible non-audit services that the Registrant’s audit committee considers compatible with maintaining the independent registered public accounting firm’s independence are required to be pre-approved by the committee. The pre-approval requirement will extend to all non-audit services provided to the Registrant, the investment adviser, and any entity controlling, controlled by, or under common control with the investment adviser that provides ongoing services to the Registrant, if the engagement relates directly to the operations and financial reporting of the Registrant. The committee will not delegate its responsibility to pre-approve these services to the investment adviser. The committee may delegate to one or more committee members the authority to review and pre-approve audit and permissible non-audit services. Actions taken under any such delegation will be reported to the full committee at its next meeting. The pre-approval requirement is waived with respect to non-audit services if certain conditions are met. The pre-approval requirement was not waived for any of the non-audit services listed above provided to the Registrant, adviser and affiliates.
Aggregate non-audit fees paid to the Registrant’s auditors, including fees for all services billed to the Registrant, adviser and affiliates that provide ongoing services to the Registrant, were $1,544,000 for fiscal year 2013 and $1,421,000 for fiscal year 2014. The non-audit services represented by these amounts were brought to the attention of the committee and considered to be compatible with maintaining the auditors’ independence.
ITEM 5 – Audit Committee of Listed Registrants
Not applicable to this Registrant, insofar as the Registrant is not a listed issuer as defined in Rule 10A-3 under the Securities Exchange Act of 1934.
ITEM 6 – Schedule of Investments
SMALLCAP World Fund®
Investment portfolio
September 30, 2014
Common stocks 90.54%
Consumer discretionary 19.46% | Shares | Value
(000) |
| Netflix, Inc.1 | 943,743 | $425,798 |
| Domino’s Pizza, Inc.2 | 3,218,769 | 247,716 |
| Lions Gate Entertainment Corp.2 | 7,146,000 | 235,604 |
| Paddy Power PLC | 2,174,500 | 157,018 |
| Mr Price Group Ltd. | 6,915,383 | 130,141 |
| Melco International Development Ltd. | 55,345,000 | 128,012 |
| John Wiley & Sons, Inc., Class A | 1,971,083 | 110,597 |
| Five Below, Inc.1 | 2,530,694 | 100,241 |
| Ted Baker PLC2 | 3,154,993 | 95,287 |
| Dollarama Inc. | 1,039,000 | 88,133 |
| ASOS PLC1 | 2,264,755 | 82,609 |
| Tesla Motors, Inc.1 | 331,200 | 80,376 |
| Brinker International, Inc. | 1,412,500 | 71,741 |
| Entertainment One Ltd. | 13,659,782 | 69,977 |
| Inchcape PLC | 6,465,600 | 67,502 |
| CBS Outdoor Americas, Inc. | 2,252,900 | 67,452 |
| OSIM International Ltd | 31,600,000 | 65,147 |
| TOD’S SpA | 655,000 | 64,901 |
| Tiffany & Co. | 667,000 | 64,239 |
| Rightmove PLC | 1,812,000 | 63,216 |
| Penske Automotive Group, Inc. | 1,502,000 | 60,966 |
| YOOX SpA1 | 2,571,469 | 59,014 |
| PT Matahari Department Store Tbk | 44,070,000 | 58,682 |
| Jumbo SA1 | 4,622,964 | 58,449 |
| Gourmet Master Co., Ltd. | 6,690,000 | 55,091 |
| Coupons.com Inc.1,2 | 4,587,996 | 54,872 |
| Domino’s Pizza Enterprises Ltd. | 2,351,583 | 54,006 |
| Lands’ End, Inc.1 | 1,300,000 | 53,456 |
| Gentex Corp. | 1,954,567 | 52,324 |
| Jarden Corp.1 | 862,500 | 51,845 |
| Chow Sang Sang Holdings International Ltd. | 21,564,000 | 51,377 |
| START TODAY Co., Ltd. | 2,344,000 | 51,016 |
| Liberty Global PLC, Class C1 | 877,628 | 35,996 |
| Liberty Global PLC, Class A1 | 351,978 | 14,973 |
| Cox & Kings Ltd.2 | 9,592,000 | 49,078 |
| Cox & Kings Ltd. (GDR)2,3 | 330,000 | 1,688 |
| Eclat Textile Co., Ltd. | 5,490,160 | 49,903 |
| Jubilant FoodWorks Ltd.1 | 2,495,098 | 49,720 |
| Zee Entertainment Enterprises Ltd. | 9,270,000 | 47,153 |
| Sotheby’s Holdings, Inc. | 1,320,000 | 47,150 |
| Weight Watchers International, Inc. | 1,702,000 | 46,703 |
| L’Occitane International SA | 19,659,750 | 45,068 |
| Brunello Cucinelli SpA | 2,149,015 | 44,840 |
| Estácio Participações SA, ordinary nominative | 4,190,000 | 43,548 |
| ASKUL Corp. | 2,038,600 | 42,752 |
| PT Multipolar Tbk | 497,040,000 | 42,423 |
| Ocado Group PLC1 | 8,533,708 | 36,661 |
SMALLCAP World Fund — Page 1 of 15
Common stocks
Consumer discretionary (continued) | Shares | Value
(000) |
| Moncler SpA | 2,552,730 | $36,434 |
| Group 1 Automotive, Inc. | 475,700 | 34,588 |
| Arcos Dorados Holdings Inc., Class A | 5,735,000 | 34,295 |
| Rentrak Corp.1 | 550,000 | 33,517 |
| Stella International Holdings Ltd. | 11,999,500 | 31,139 |
| SeaWorld Entertainment, Inc. | 1,584,500 | 30,470 |
| Hathway Cable and Datacom Ltd.1,3,4 | 7,050,000 | 29,600 |
| PARADISE Co., Ltd. | 900,000 | 29,467 |
| Poya Co., Ltd.2 | 4,712,660 | 29,435 |
| Home Inns & Hotels Management Inc. (ADR)1 | 1,006,000 | 29,164 |
| Ctrip.com International, Ltd. (ADR)1 | 512,000 | 29,061 |
| Installed Building Products, Inc.1,2 | 2,068,345 | 29,060 |
| Daily Mail and General Trust PLC, Class A, nonvoting | 2,210,000 | 27,444 |
| Eros International PLC, Class A1 | 1,871,666 | 27,345 |
| Murphy USA Inc.1 | 510,000 | 27,061 |
| Chipotle Mexican Grill, Inc.1 | 39,890 | 26,590 |
| Minth Group Ltd. | 13,690,000 | 26,517 |
| Merida Industry Co., Ltd. | 3,635,100 | 25,334 |
| Titan Co. Ltd. | 3,760,000 | 24,836 |
| Zhongsheng Group Holdings Ltd. | 22,854,000 | 24,488 |
| Lennar Corp., Class A | 619,000 | 24,036 |
| Brunswick Corp. | 560,000 | 23,598 |
| Nord Anglia Education, Inc.1 | 1,313,700 | 22,333 |
| China Lodging Group, Ltd. (ADR)1 | 840,000 | 21,647 |
| Melco Crown Entertainment Ltd. (ADR) | 800,000 | 21,032 |
| Boyd Gaming Corp.1 | 2,049,000 | 20,818 |
| ValueVision Media, Inc., Class A1,2 | 3,987,540 | 20,456 |
| Navitas Ltd. | 4,625,000 | 20,247 |
| zulily, inc., Class A1 | 534,000 | 20,233 |
| TravelCenters of America LLC1,2 | 2,023,750 | 19,995 |
| I.T Limited | 57,710,000 | 19,398 |
| Mothercare PLC2 | 4,450,000 | 19,316 |
| Redrow PLC | 4,185,000 | 19,044 |
| Major Cineplex Group PCL | 23,845,000 | 17,796 |
| Dick Smith Holdings Ltd. | 9,090,940 | 17,511 |
| Parkson Retail Asia Ltd. | 23,182,000 | 15,446 |
| Toll Brothers, Inc.1 | 471,800 | 14,701 |
| Intercontinental Hotels Group PLC | 371,045 | 14,310 |
| eLong, Inc. (ADR)1 | 690,000 | 14,200 |
| Cavco Industries, Inc.1 | 204,000 | 13,872 |
| TAKKT AG | 801,778 | 13,681 |
| GVC Holdings PLC | 1,663,694 | 13,512 |
| Standard Pacific Corp.1 | 1,794,000 | 13,437 |
| Playmates Toys Ltd. | 57,268,000 | 13,128 |
| HUGO BOSS AG | 99,231 | 12,403 |
| William Hill PLC | 2,047,800 | 12,277 |
| Oxford Industries, Inc. | 200,000 | 12,198 |
| Topps Tiles PLC | 7,000,000 | 11,830 |
| Golden Eagle Retail Group Ltd. | 10,014,000 | 11,646 |
| Hankook Tire Co., Ltd. | 233,473 | 11,394 |
| PT Ace Hardware Indonesia Tbk | 156,400,000 | 11,359 |
| Papa Murphy’s Holdings, Inc.1,2 | 1,102,000 | 11,240 |
| Tribhovandas Bhimji Zaveri Ltd.2 | 4,335,732 | 11,218 |
| Fourlis Holdings SA1 | 2,035,000 | 10,847 |
| zooplus AG, non-registered shares1 | 148,400 | 10,322 |
SMALLCAP World Fund — Page 2 of 15
Common stocks
Consumer discretionary (continued) | Shares | Value
(000) |
| Techtronic Industries Co. Ltd. | 3,570,000 | $10,322 |
| D.R. Horton, Inc. | 490,000 | 10,055 |
| Pinnacle Entertainment, Inc.1 | 400,000 | 10,036 |
| SHW AG, non-registered shares | 230,000 | 9,741 |
| Fox Factory Holding Corp.1 | 625,000 | 9,687 |
| DSW Inc., Class A | 320,000 | 9,635 |
| Valeo SA, non-registered shares | 86,000 | 9,571 |
| Ripley Corp SA | 17,726,000 | 9,532 |
| Mando Corp.3 | 72,600 | 9,425 |
| American Axle & Manufacturing Holdings, Inc.1 | 505,000 | 8,469 |
| PT Astra Otoparts Tbk | 23,746,000 | 8,380 |
| Café de Coral Holdings Ltd. | 2,240,000 | 7,587 |
| POLYTEC Holding AG, non-registered shares | 834,369 | 6,724 |
| ITT Educational Services, Inc.1,2 | 1,519,000 | 6,517 |
| Mood Media Corp.1,2 | 6,375,000 | 3,700 |
| Mood Media Corp. (CDI)1,2 | 3,710,000 | 2,153 |
| Talwalkars Better Value Fitness Ltd.2 | 1,694,000 | 5,589 |
| Giordano International Ltd. | 9,820,000 | 5,324 |
| NagaCorp Ltd. | 7,330,000 | 5,249 |
| Powerland AG, non-registered shares1,2 | 1,200,000 | 4,092 |
| China Zenix Auto International Ltd. (ADR)1 | 2,152,000 | 3,809 |
| Alpargatas SA, preferred nominative | 891,022 | 3,753 |
| Phorm Corp. Ltd.1 | 15,890,000 | 2,995 |
| Jin Co., Ltd. | 78,600 | 2,119 |
| Grand Korea Leisure Co. Ltd. | 40,931 | 1,627 |
| Quiksilver, Inc.1 | 500,000 | 860 |
| Ten Alps PLC1 | 3,439,001 | 37 |
| Five Star Travel Corp.1,3,4 | 96,033 | 21 |
| Spot Runner, Inc.1,3,5 | 2,980,544 | — |
| Fontainebleau Resorts LLC, Class A, nonvoting units1,3,4,5 | 1,900,000 | — |
| | | 4,987,796 |
| Health care 14.97% | | |
| Myriad Genetics, Inc.1,2 | 5,725,556 | 220,835 |
| Incyte Corp.1 | 4,445,600 | 218,057 |
| Endo International PLC1 | 3,088,324 | 211,134 |
| Hikma Pharmaceuticals PLC | 5,625,153 | 158,036 |
| Regeneron Pharmaceuticals, Inc.1 | 424,900 | 153,185 |
| Synageva BioPharma Corp.1,2 | 2,190,074 | 150,633 |
| Molina Healthcare, Inc.1,2 | 3,488,100 | 147,547 |
| Centene Corp.1 | 1,735,000 | 143,502 |
| athenahealth, Inc.1 | 929,371 | 122,389 |
| Brookdale Senior Living Inc.1 | 3,255,250 | 104,884 |
| GW Pharmaceuticals PLC (ADR)1,2 | 1,215,600 | 98,281 |
| BioMarin Pharmaceutical Inc.1 | 1,347,500 | 97,236 |
| Ultragenyx Pharmaceutical Inc.1,2 | 1,628,457 | 92,171 |
| Illumina, Inc.1 | 543,900 | 89,156 |
| Sysmex Corp. | 2,150,000 | 86,451 |
| bluebird bio, Inc.1,2 | 2,287,565 | 82,078 |
| Team Health Holdings, Inc.1 | 1,217,300 | 70,591 |
| Zeltiq Aesthetics, Inc.1,2 | 3,002,044 | 67,936 |
| Alnylam Pharmaceuticals, Inc.1 | 848,700 | 66,283 |
| Intuitive Surgical, Inc.1 | 135,000 | 62,346 |
| NuVasive, Inc.1 | 1,702,936 | 59,381 |
| Spire Healthcare Group PLC1 | 11,664,000 | 54,704 |
SMALLCAP World Fund — Page 3 of 15
Common stocks
Health care (continued) | Shares | Value
(000) |
| Insulet Corp.1 | 1,382,345 | $50,939 |
| Achillion Pharmaceuticals, Inc.1,2 | 4,930,000 | 49,201 |
| Teleflex Inc. | 460,700 | 48,392 |
| Hologic, Inc.1 | 1,965,000 | 47,808 |
| Genomma Lab Internacional, SAB de CV, Series B1 | 18,433,000 | 44,290 |
| Grifols, SA, Class A, non-registered shares | 665,000 | 27,247 |
| Grifols, SA, Class B, non-registered shares | 463,950 | 16,525 |
| Nihon Kohden Corp. | 806,500 | 42,356 |
| Fisher & Paykel Healthcare Corp. Ltd. | 9,663,437 | 39,152 |
| BTG PLC1 | 3,350,000 | 38,016 |
| Galapagos NV1,2 | 2,422,427 | 36,655 |
| HeartWare International, Inc.1 | 441,600 | 34,281 |
| Virbac SA | 160,200 | 33,700 |
| Pharmacyclics, Inc.1 | 283,656 | 33,310 |
| PerkinElmer, Inc. | 745,000 | 32,482 |
| Theravance, Inc. | 1,897,000 | 32,420 |
| Novadaq Technologies Inc.1 | 2,505,948 | 31,801 |
| Covance Inc.1 | 400,000 | 31,480 |
| Tong Ren Tang Technologies Co., Ltd., Class H | 22,770,000 | 31,436 |
| Agios Pharmaceuticals, Inc.1 | 488,000 | 29,939 |
| Prothena Corp. PLC1 | 1,263,214 | 27,993 |
| CONMED Corp. | 710,000 | 26,156 |
| XenoPort, Inc.1,2 | 4,769,000 | 25,657 |
| Fleury SA, ordinary nominative | 4,380,600 | 25,323 |
| Neovasc Inc.1,2 | 4,277,000 | 24,269 |
| Nobel Biocare Holding AG | 1,350,000 | 23,968 |
| Premier, Inc., Class A1 | 725,000 | 23,824 |
| PT Siloam International Hospitals Tbk1 | 18,060,000 | 22,269 |
| QIAGEN NV1 | 968,751 | 22,061 |
| MD Medical Group Investments PLC (GDR) | 2,632,000 | 21,582 |
| Ironwood Pharmaceuticals, Inc., Class A1 | 1,605,000 | 20,793 |
| Gerresheimer AG, non-registered shares | 310,000 | 20,133 |
| ACADIA Pharmaceuticals Inc.1 | 812,797 | 20,125 |
| Orexigen Therapeutics, Inc.1 | 4,719,655 | 20,106 |
| Eurofins Scientific SE, non-registered shares | 73,500 | 19,031 |
| Neurocrine Biosciences, Inc.1 | 1,150,200 | 18,024 |
| KYTHERA Biopharmaceuticals, Inc.1 | 547,300 | 17,930 |
| Flexion Therapeutics, Inc.1,2 | 979,252 | 17,881 |
| Circassia Pharmaceuticals PLC1 | 3,260,000 | 16,066 |
| Medivation, Inc.1 | 160,000 | 15,819 |
| ChemoCentryx, Inc.1,2 | 3,426,800 | 15,421 |
| Castlight Health, Inc., Class B1 | 1,129,167 | 14,611 |
| Seattle Genetics, Inc.1 | 372,000 | 13,831 |
| Wright Medical Group, Inc.1 | 438,485 | 13,286 |
| GI Dynamics, Inc. (CDI)1,2 | 30,320,000 | 12,742 |
| Theravance Biopharma, Inc.1 | 542,000 | 12,493 |
| Pharmstandard OJSC (GDR)1 | 920,771 | 11,740 |
| Orthofix International NV1 | 377,000 | 11,672 |
| Krka, dd, Novo mesto | 99,787 | 8,243 |
| Mesoblast Ltd.1 | 1,560,000 | 5,901 |
| | | 3,837,196 |
SMALLCAP World Fund — Page 4 of 15
Common stocks
Industrials 12.79% | Shares | Value
(000) |
| AA PLC1,2 | 44,319,669 | $231,712 |
| Moog Inc., Class A1 | 2,572,800 | 175,980 |
| Hoshizaki Electric Co., Ltd. | 2,955,700 | 137,982 |
| ITT Corp. | 2,946,621 | 132,421 |
| Northgate PLC2 | 10,626,805 | 83,347 |
| Loomis AB, Class B | 2,883,452 | 82,516 |
| Spirax-Sarco Engineering PLC | 1,758,000 | 80,541 |
| CIMC Enric Holdings Ltd. | 77,741,000 | 77,692 |
| Intertek Group PLC | 1,775,000 | 75,420 |
| BELIMO Holding AG | 28,050 | 69,927 |
| IDEX Corp. | 875,000 | 63,324 |
| MonotaRO Co., Ltd. | 2,513,800 | 62,962 |
| Havells India Ltd. | 14,550,000 | 62,396 |
| Oshkosh Corp. | 1,340,000 | 59,161 |
| Takeuchi Mfg. Co., Ltd.2 | 1,232,300 | 58,539 |
| Waste Connections, Inc. | 1,206,000 | 58,515 |
| Landstar System, Inc. | 791,000 | 57,102 |
| King Slide Works Co., Ltd.2 | 4,913,000 | 55,478 |
| Johnson Electric Holdings Ltd. | 14,528,875 | 55,385 |
| MITIE Group PLC | 11,709,000 | 54,649 |
| Polypore International, Inc.1 | 1,397,100 | 54,361 |
| Boer Power Holdings Ltd.2 | 39,202,000 | 53,415 |
| American Airlines Group Inc. | 1,420,000 | 50,382 |
| Clean Harbors, Inc.1 | 919,500 | 49,579 |
| Rotork PLC | 1,045,000 | 46,842 |
| PARK24 Co., Ltd. | 2,765,000 | 44,119 |
| Flughafen Zⁿrich AG | 68,400 | 42,952 |
| Chart Industries, Inc.1 | 670,700 | 41,000 |
| Continental Building Products, Inc.1,2 | 2,705,000 | 39,493 |
| Masco Corp. | 1,625,000 | 38,870 |
| Alliance Global Group, Inc. | 66,295,000 | 38,408 |
| Exponent, Inc. | 535,000 | 37,921 |
| Japan Airport Terminal Co. Ltd. | 940,000 | 37,711 |
| AirAsia Bhd. | 48,188,700 | 37,164 |
| NORMA Group SE, non-registered shares | 872,600 | 36,503 |
| Harmonic Drive Systems Inc. | 2,398,100 | 35,466 |
| TransDigm Group Inc. | 190,000 | 35,023 |
| KEYW Holding Corp.1,2 | 2,836,400 | 31,399 |
| ARC Document Solutions, Inc.1,2 | 3,734,755 | 30,252 |
| Watsco, Inc. | 350,000 | 30,163 |
| Mistras Group, Inc.1,2 | 1,460,000 | 29,784 |
| Stock Building Supply Holdings, Inc.1,2 | 1,785,000 | 28,042 |
| Michael Page International PLC | 3,800,000 | 25,787 |
| Carborundum Universal Ltd. | 7,985,000 | 25,716 |
| Meggitt PLC | 3,470,000 | 25,382 |
| Graco Inc. | 340,000 | 24,813 |
| Gujarat Pipavav Port Ltd.1 | 8,596,674 | 23,601 |
| Exova Group PLC1 | 8,140,000 | 23,291 |
| Pegasus Hava Tasimaciligi AS1 | 1,885,000 | 22,025 |
| BTS Rail Mass Transit Growth Infrastructure Fund | 71,183,700 | 21,624 |
| Globaltrans Investment PLC (GDR)4 | 1,529,400 | 12,847 |
| Globaltrans Investment PLC (GDR) | 1,028,600 | 8,640 |
| Rheinmetall AG | 445,000 | 21,414 |
| Amara Raja Batteries Ltd. | 2,173,886 | 21,065 |
| Pfeiffer Vacuum Technology AG, non-registered shares | 249,000 | 20,961 |
SMALLCAP World Fund — Page 5 of 15
Common stocks
Industrials (continued) | Shares | Value
(000) |
| Summit Ascent Holdings Ltd.1 | 48,620,000 | $20,350 |
| Orient Overseas (International) Ltd. | 3,653,000 | 20,230 |
| MSA Safety Inc. | 400,000 | 19,760 |
| PayPoint PLC | 1,220,000 | 19,452 |
| PT AKR Corporindo Tbk | 40,759,000 | 18,230 |
| Shun Tak Holdings Ltd. | 35,460,000 | 17,399 |
| Regus PLC | 6,205,000 | 17,071 |
| Robert Half International Inc. | 337,000 | 16,513 |
| Mills Estruturas e Serviços de Engenharia SA, ordinary nominative | 2,140,000 | 15,650 |
| Cummins India Ltd. | 1,418,800 | 15,416 |
| Houston Wire & Cable Co.2 | 1,150,000 | 13,777 |
| DKSH Holding AG | 179,551 | 13,400 |
| Okabe Co., Ltd. | 1,208,000 | 13,283 |
| Geberit AG1 | 41,000 | 13,262 |
| Nok Airlines PCL | 26,730,400 | 13,025 |
| Beacon Roofing Supply, Inc.1 | 500,000 | 12,740 |
| Teleperformance SA | 204,247 | 12,636 |
| Shanghai Industrial Holdings Ltd. | 4,185,000 | 12,396 |
| Avis Budget Group, Inc.1 | 210,000 | 11,527 |
| Alaska Air Group, Inc. | 260,000 | 11,320 |
| USG Corp.1 | 397,000 | 10,914 |
| Frigoglass SAIC1,2 | 3,052,380 | 10,409 |
| National Express Group PLC | 2,363,800 | 9,101 |
| J. Kumar Infraprojects Ltd.2 | 1,780,000 | 9,074 |
| Andritz AG | 170,000 | 9,065 |
| COSCO Pacific Ltd. | 5,990,000 | 7,946 |
| Cebu Air, Inc. | 4,800,000 | 7,321 |
| TD Power Systems Ltd. | 1,209,982 | 6,562 |
| Pacific Basin Shipping Ltd. | 11,650,000 | 6,302 |
| Pipavav Defence and Offshore Engineering Co. Ltd.1 | 9,925,000 | 6,196 |
| China Automation Group Ltd.1 | 27,000,000 | 5,424 |
| Jaiprakash Associates Ltd.1 | 7,350,000 | 3,148 |
| | | 3,279,963 |
| Information technology 11.10% | | |
| TriQuint Semiconductor, Inc.1,2 | 9,012,000 | 171,859 |
| AAC Technologies Holdings Inc. | 29,287,250 | 170,107 |
| Palo Alto Networks, Inc.1 | 1,132,350 | 111,084 |
| Topcon Corp. | 4,664,710 | 106,160 |
| MercadoLibre, Inc. | 914,000 | 99,306 |
| Demandware, Inc.1 | 1,803,000 | 91,809 |
| Kakaku.com, Inc. | 5,995,000 | 85,163 |
| Halma PLC | 8,514,967 | 84,481 |
| Semiconductor Manufacturing International Corp.1 | 787,175,000 | 81,101 |
| Finisar Corp.1 | 4,833,000 | 80,373 |
| Hamamatsu Photonics KK | 1,665,100 | 79,099 |
| QIWI PLC, Class B (ADR) | 2,113,000 | 66,750 |
| Xoom Corp.1,2 | 3,035,570 | 66,631 |
| National Instruments Corp. | 2,094,264 | 64,776 |
| CDW Corp. | 2,060,000 | 63,963 |
| Playtech PLC | 5,413,421 | 63,011 |
| OBIC Co., Ltd. | 1,710,300 | 61,129 |
| International Rectifier Corp.1 | 1,497,734 | 58,771 |
| Concur Technologies, Inc.1 | 439,869 | 55,784 |
| Dolby Laboratories, Inc., Class A1 | 1,268,400 | 53,006 |
SMALLCAP World Fund — Page 6 of 15
Common stocks
Information technology (continued) | Shares | Value
(000) |
| Cornerstone OnDemand, Inc.1 | 1,458,000 | $50,170 |
| Zebra Technologies Corp., Class A1 | 568,900 | 40,375 |
| Ellie Mae, Inc.1 | 1,191,000 | 38,827 |
| ASM International NV | 1,051,665 | 38,222 |
| Alcatel-Lucent1 | 11,726,125 | 36,390 |
| Zynga Inc., Class A1 | 13,165,000 | 35,545 |
| Knowles Corp.1 | 1,296,091 | 34,346 |
| Cray Inc.1 | 1,303,772 | 34,211 |
| RIB Software AG2 | 2,476,356 | 33,921 |
| Autodesk, Inc.1 | 605,000 | 33,335 |
| Monitise PLC1 | 66,996,190 | 32,855 |
| Itron, Inc.1 | 815,000 | 32,038 |
| JDS Uniphase Corp.1 | 2,489,000 | 31,859 |
| Hana Microelectronics PCL | 23,935,000 | 31,187 |
| SUNeVision Holdings Ltd. | 87,600,000 | 30,460 |
| KLA-Tencor Corp. | 340,650 | 26,836 |
| Inphi Corp.1,2 | 1,785,699 | 25,678 |
| Trimble Navigation Ltd.1 | 840,000 | 25,620 |
| Montage Technology Group Ltd.1 | 1,179,900 | 24,648 |
| Suprema Inc.1,2 | 868,200 | 24,065 |
| ASM Pacific Technology Ltd. | 2,314,700 | 22,909 |
| Atmel Corp.1 | 2,777,840 | 22,445 |
| Spectris PLC | 761,721 | 22,326 |
| Persistent Systems Ltd. | 956,000 | 21,742 |
| Nemetschek AG | 223,258 | 21,516 |
| FireEye, Inc.1 | 694,188 | 21,214 |
| M/A-COM Technology Solutions Holdings, Inc.1 | 893,839 | 19,521 |
| Belden Inc. | 300,000 | 19,206 |
| Gogo Inc.1 | 1,000,000 | 16,860 |
| Semtech Corp.1 | 620,000 | 16,833 |
| Oxford Instruments PLC | 1,011,000 | 16,718 |
| Wix.com Ltd.1 | 1,000,000 | 16,250 |
| CoStar Group, Inc.1 | 100,000 | 15,554 |
| RF Micro Devices, Inc.1 | 1,305,000 | 15,060 |
| Good Technology Corp.1,3,4,5 | 3,636,364 | 14,927 |
| Kingdee International Software Group Co. Ltd.1 | 50,000,000 | 14,810 |
| Cvent, Inc.1 | 569,500 | 14,448 |
| MagnaChip Semiconductor Corp.1 | 1,200,000 | 14,040 |
| NHN Entertainment Corp.1 | 151,000 | 11,805 |
| SciQuest, Inc.1 | 740,000 | 11,130 |
| ON Semiconductor Corp.1 | 1,230,000 | 10,996 |
| Alten SA, non-registered shares | 250,000 | 10,722 |
| Jay Mart PCL | 22,812,500 | 9,850 |
| Pandora Media, Inc.1 | 405,000 | 9,785 |
| iEnergizer Ltd.1,2 | 7,650,500 | 8,496 |
| VTech Holdings Ltd. | 685,000 | 8,451 |
| Broadleaf Co., Ltd. | 500,000 | 8,051 |
| Ultimate Software Group, Inc.1 | 55,700 | 7,882 |
| Tableau Software, Inc., Class A1 | 100,000 | 7,265 |
| Cognex Corp. | 161,202 | 6,492 |
| Tangoe, Inc.1 | 422,400 | 5,723 |
| Agilysys, Inc.1 | 460,340 | 5,400 |
| Youku Tudou Inc., Class A (ADR)1 | 300,000 | 5,376 |
| Anritsu Corp. | 650,000 | 4,961 |
| Rally Software Development Corp.1 | 400,000 | 4,804 |
SMALLCAP World Fund — Page 7 of 15
Common stocks
Information technology (continued) | Shares | Value
(000) |
| NetSuite Inc.1 | 50,000 | $4,477 |
| Silicon Graphics International Corp.1 | 141,800 | 1,309 |
| Immersion Corp.1 | 97,800 | 839 |
| China High Precision Automation Group Ltd.1,2,3 | 53,032,000 | 683 |
| Remark Media, Inc.1 | 108,065 | 680 |
| PChome Online Inc. | 22,168 | 216 |
| | | 2,846,723 |
| Financials 9.84% | | |
| SVB Financial Group1 | 1,355,900 | 151,983 |
| GT Capital Holdings, Inc. | 4,782,200 | 112,955 |
| Validus Holdings, Ltd. | 2,763,000 | 108,144 |
| Umpqua Holdings Corp. | 6,141,041 | 101,143 |
| Financial Engines, Inc. | 2,520,930 | 86,254 |
| Kotak Mahindra Bank Ltd. | 4,940,000 | 81,035 |
| PacWest Bancorp | 1,942,149 | 80,075 |
| Onex Corp. | 1,380,600 | 76,873 |
| Tokyo Tatemono Co., Ltd. | 7,865,000 | 63,608 |
| East West Bancorp, Inc. | 1,855,000 | 63,070 |
| HCC Insurance Holdings, Inc. | 1,257,000 | 60,701 |
| Greenhill & Co., Inc. | 1,288,500 | 59,902 |
| First Republic Bank | 1,141,825 | 56,383 |
| Altisource Residential Corp. | 2,188,650 | 52,528 |
| Fibra Uno Administración, SA de CV | 15,355,891 | 50,548 |
| Eurobank Properties Real Estate Investment Co. | 4,152,355 | 47,202 |
| Springleaf Holdings, Inc.1 | 1,464,200 | 46,752 |
| BOK Financial Corp. | 680,000 | 45,206 |
| VZ Holding AG | 263,200 | 44,551 |
| Ocwen Financial Corp.1 | 1,675,000 | 43,852 |
| Talmer Bancorp, Inc., Class A | 3,068,056 | 42,431 |
| Avanza Bank Holding AB | 1,154,000 | 38,941 |
| Altisource Asset Management Corp.1 | 56,153 | 37,904 |
| EFG International AG1 | 3,757,378 | 37,822 |
| Cathay General Bancorp, Inc. | 1,510,000 | 37,493 |
| Janus Capital Group Inc. | 2,543,000 | 36,975 |
| Genworth Mortgage Insurance Australia Ltd. | 12,090,000 | 36,202 |
| Kemper Corp. | 1,000,000 | 34,150 |
| GRUH Finance Ltd. | 10,900,000 | 33,780 |
| Actua Corp1,2 | 2,094,000 | 33,546 |
| Shriram Transport Finance Co. Ltd. | 2,222,137 | 33,544 |
| Inversiones La Construcción SA | 2,334,000 | 31,268 |
| Crédito Real, SAB de CV | 10,961,030 | 31,021 |
| Foxtons Group PLC | 8,044,590 | 28,039 |
| ING Vysya Bank Ltd. | 2,907,649 | 27,977 |
| Repco Home Finance Ltd.2 | 4,040,440 | 27,919 |
| Kenedix, Inc.1 | 6,413,000 | 27,658 |
| Texas Capital Bancshares, Inc.1 | 461,700 | 26,631 |
| Manappuram Finance Ltd.2 | 54,930,986 | 26,283 |
| Cerved Information Solutions SPA, non-registered shares1 | 4,220,000 | 26,032 |
| Altisource Portfolio Solutions SA1 | 253,415 | 25,544 |
| Tune Ins Holdings Bhd. | 36,816,000 | 25,363 |
| Mercury General Corp. | 500,000 | 24,405 |
| Old Republic International Corp. | 1,635,000 | 23,348 |
| Chailease Holding Co. Ltd. | 9,317,000 | 22,634 |
| Endurance Specialty Holdings Ltd. | 400,000 | 22,072 |
SMALLCAP World Fund — Page 8 of 15
Common stocks
Financials (continued) | Shares | Value
(000) |
| LSL Property Services PLC | 4,166,350 | $22,019 |
| RenaissanceRe Holdings Ltd. | 205,000 | 20,498 |
| Numis Corp. PLC | 4,549,282 | 19,599 |
| K. Wah International Holdings Ltd. | 34,354,357 | 19,202 |
| CenterState Banks, Inc. | 1,802,399 | 18,655 |
| Redwood Trust, Inc. | 1,110,000 | 18,404 |
| Mahindra Lifespace Developers Ltd.2 | 2,157,380 | 17,995 |
| Bank of Ireland1 | 45,456,798 | 17,856 |
| Banca Generali SpA | 673,069 | 17,793 |
| Signature Bank1 | 157,800 | 17,683 |
| Square 1 Financial, Inc., Class A1 | 871,576 | 16,760 |
| Macquarie Mexican REIT | 8,661,000 | 15,251 |
| Sino-Ocean Land Holdings Ltd. | 27,537,317 | 14,505 |
| East West Banking Corp.1 | 20,155,900 | 12,104 |
| Plus500 Ltd. | 1,796,283 | 11,939 |
| Soundwill Holdings Ltd. | 5,690,000 | 9,057 |
| Bao Viet Holdings | 4,137,486 | 7,835 |
| Metropolitan Bank & Trust Co. | 3,252,015 | 6,290 |
| TCS Group Holding PLC (GDR)1,4 | 1,046,200 | 4,907 |
| Starwood Property Trust, Inc. | 109,200 | 2,398 |
| Popular, Inc.1 | 45,800 | 1,348 |
| Banco Espírito Santo, SA1,3 | 2,587,339 | — |
| | | 2,523,845 |
| Consumer staples 5.32% | | |
| Emami Ltd. | 9,430,000 | 106,454 |
| Raia Drogasil SA, ordinary nominative | 10,577,374 | 90,487 |
| Puregold Price Club, Inc. | 115,461,300 | 89,277 |
| Super Group Ltd.2 | 89,194,000 | 89,145 |
| Emmi AG | 240,600 | 82,283 |
| Stock Spirits Group PLC2 | 16,000,000 | 75,636 |
| PZ Cussons PLC | 12,672,000 | 75,127 |
| Glanbia PLC | 4,737,600 | 68,395 |
| Hypermarcas SA, ordinary nominative1 | 7,392,600 | 53,094 |
| Pinnacle Foods Inc. | 1,509,000 | 49,269 |
| Kaveri Seed Co. Ltd.2 | 3,470,177 | 45,599 |
| Nu Skin Enterprises, Inc., Class A | 944,200 | 42,517 |
| 7-Eleven Malaysia Holdings Bhd.1,2 | 76,209,600 | 41,584 |
| Davide Campari-Milano SpA | 5,388,500 | 38,896 |
| Herbalife Ltd. | 744,182 | 32,558 |
| COSMOS Pharmaceutical Corp. | 242,200 | 30,718 |
| Petra Foods Ltd. | 9,183,000 | 29,082 |
| Sprouts Farmers Market, Inc.1 | 998,000 | 29,012 |
| LT Group, Inc. | 81,670,000 | 28,462 |
| VST Industries Ltd.2 | 1,003,400 | 26,454 |
| Fresh Del Monte Produce Inc. | 750,000 | 23,925 |
| Origin Enterprises PLC | 2,290,000 | 22,271 |
| Lenta Ltd. (GDR)1 | 2,017,462 | 21,526 |
| Del Monte Pacific Ltd. | 38,825,000 | 15,555 |
| Eurocash SA | 1,468,000 | 14,327 |
| Wumart Stores, Inc., Class H | 15,080,000 | 14,100 |
| HITEJINRO CO., LTD. | 625,679 | 13,726 |
| Real Nutriceutical Group Ltd. | 39,400,000 | 13,396 |
| Kernel Holding SA1 | 1,642,578 | 12,355 |
| Coca-Cola Icecek AS, Class C | 567,512 | 12,252 |
SMALLCAP World Fund — Page 9 of 15
Common stocks
Consumer staples (continued) | Shares | Value
(000) |
| CALBEE, Inc. | 350,000 | $11,457 |
| O’Key Group SA (GDR) | 1,546,000 | 11,286 |
| Cosco Capital, Inc. | 61,970,400 | 11,033 |
| Treasury Wine Estates Ltd. | 2,506,860 | 9,306 |
| Convenience Retail Asia Ltd. | 12,810,000 | 8,777 |
| Sundrug Co., Ltd. | 194,900 | 8,663 |
| Tilaknager Industries Ltd.2 | 8,270,086 | 5,966 |
| R.E.A. Holdings PLC | 800,000 | 5,253 |
| Bizim Toptan Satis Magazalari AS, non-registered shares | 399,482 | 3,255 |
| | | 1,362,478 |
| Energy 4.52% | | |
| InterOil Corp.1 | 2,344,500 | 127,212 |
| Ophir Energy PLC1 | 25,755,318 | 95,740 |
| Bonanza Creek Energy, Inc.1 | 1,454,300 | 82,750 |
| C&J Energy Services, Inc.1 | 2,516,000 | 76,864 |
| Diamondback Energy, Inc.1 | 982,000 | 73,434 |
| Peyto Exploration & Development Corp. | 2,020,400 | 63,754 |
| Paramount Resources Ltd.1 | 1,105,000 | 63,294 |
| Nostrum Oil & Gas PLC1 | 5,023,150 | 61,482 |
| Concho Resources Inc.1 | 403,000 | 50,532 |
| Africa Oil Corp.1 | 5,371,067 | 23,595 |
| Africa Oil Corp. (SEK denominated)1 | 3,923,713 | 17,264 |
| Keyera Corp. | 506,200 | 40,782 |
| Oil States International, Inc.1 | 650,000 | 40,235 |
| Memorial Resource Development Corp.1 | 1,022,300 | 27,714 |
| Oasis Petroleum Inc.1 | 600,000 | 25,086 |
| Veresen Inc. | 1,590,000 | 24,178 |
| Parsley Energy, Inc., Class A1 | 1,095,200 | 23,361 |
| SBM Offshore NV1 | 1,516,670 | 22,020 |
| Lekoil Ltd. (CDI)1,2 | 14,070,000 | 15,511 |
| Lekoil Ltd. (CDI)1,2,4 | 5,360,400 | 5,909 |
| Exillon Energy PLC1 | 7,684,660 | 19,559 |
| Tourmaline Oil Corp.1 | 410,000 | 18,169 |
| Gulf Keystone Petroleum Ltd.1,4 | 15,715,000 | 15,859 |
| PrairieSky Royalty Ltd. | 483,100 | 15,205 |
| Genel Energy PLC1 | 1,087,926 | 14,850 |
| Amerisur Resources PLC1 | 16,000,000 | 14,655 |
| KrisEnergy Ltd.1 | 22,000,000 | 13,538 |
| Cairn Energy PLC1 | 4,709,000 | 13,474 |
| Prosafe SE | 2,029,000 | 11,868 |
| Falkland Oil and Gas Ltd.1 | 24,225,000 | 11,193 |
| BNK Petroleum Inc.1,2 | 12,804,914 | 10,633 |
| Clean Energy Fuels Corp.1 | 800,000 | 6,240 |
| Savannah Petroleum PLC1,2 | 7,844,000 | 5,993 |
| Core Laboratories NV | 40,000 | 5,854 |
| San Leon Energy PLC1,2 | 155,300,000 | 5,602 |
| Tethys Petroleum Ltd.1,2 | 12,161,000 | 3,366 |
| Tethys Petroleum Ltd. (GBP denominated)1,2 | 4,647,487 | 1,253 |
| Borders & Southern Petroleum PLC1 | 20,265,000 | 3,238 |
| African Petroleum Corp. Ltd.1 | 25,268,321 | 3,068 |
| Akastor ASA | 762,000 | 3,066 |
SMALLCAP World Fund — Page 10 of 15
Common stocks
Energy (continued) | Shares | Value
(000) |
| Range Resources Ltd.1 | 100,000,000 | $1,702 |
| Esrey Energy Ltd.1 | 650,000 | 48 |
| | | 1,159,150 |
| Materials 4.48% | | |
| James Hardie Industries PLC (CDI) | 9,733,929 | 102,015 |
| Chr. Hansen Holding A/S | 2,617,000 | 101,153 |
| AptarGroup, Inc. | 1,600,000 | 97,120 |
| Intrepid Potash, Inc.1,2 | 4,895,000 | 75,628 |
| Silgan Holdings Inc. | 1,439,500 | 67,656 |
| PolyOne Corp. | 1,717,000 | 61,091 |
| Yingde Gases Group Co. Ltd. | 46,640,000 | 44,088 |
| OM Group, Inc. | 1,560,000 | 40,482 |
| Sealed Air Corp. | 1,135,000 | 39,589 |
| United States Steel Corp. | 995,600 | 38,998 |
| CPMC Holdings Ltd. | 46,500,000 | 37,189 |
| Sirius Minerals PLC1,2 | 139,533,460 | 31,103 |
| Stillwater Mining Co.1 | 1,990,000 | 29,910 |
| Nampak Ltd. | 7,828,075 | 28,536 |
| Lundin Mining Corp.1 | 5,630,000 | 27,799 |
| FUCHS PETROLUB SE | 717,294 | 26,079 |
| Mayr-Melnhof Karton AG, non-registered shares | 240,300 | 25,525 |
| Gem Diamonds Ltd.1,2 | 7,625,000 | 23,734 |
| Mountain Province Diamonds Inc.1,3 | 4,222,222 | 20,592 |
| Huhtamäki Oyj | 724,000 | 19,880 |
| Valspar Corp. | 249,800 | 19,732 |
| Greatview Aseptic Packaging Co. Ltd. | 28,381,000 | 18,641 |
| Boral Ltd. | 4,160,000 | 18,102 |
| Symrise AG | 320,500 | 17,071 |
| Kenmare Resources PLC1 | 109,972,782 | 16,937 |
| UPL Ltd. | 2,950,000 | 16,243 |
| Croda International PLC | 422,000 | 14,045 |
| Yip’s Chemical Holdings Ltd. | 19,728,000 | 13,491 |
| Synthomer PLC | 3,600,000 | 12,373 |
| Western Areas Ltd. | 3,150,000 | 11,914 |
| Platinum Group Metals Ltd.1 | 13,475,000 | 11,911 |
| Arkema SA | 165,000 | 11,070 |
| Constellium NV, Class A1 | 396,000 | 9,746 |
| Cape Lambert Resources Ltd.2 | 47,330,825 | 3,813 |
| African Minerals Ltd.1 | 11,233,121 | 3,141 |
| Lonmin PLC1 | 910,000 | 2,741 |
| Kennady Diamonds Inc.1 | 372,952 | 2,597 |
| Duluth Metals Ltd.1,2 | 7,024,000 | 1,505 |
| Marrone Bio Innovations, Inc.1 | 450,000 | 1,197 |
| Hummingbird Resources PLC1 | 1,650,000 | 1,190 |
| Eastern Platinum Ltd.1 | 1,350,000 | 1,157 |
| Rusoro Mining Ltd.1 | 21,437,000 | 479 |
| China Forestry Holdings Co., Ltd.1,3 | 29,142,000 | 375 |
| | | 1,147,638 |
SMALLCAP World Fund — Page 11 of 15
Common stocks
Utilities 1.86% | Shares | Value
(000) |
| ENN Energy Holdings Ltd. | 29,722,296 | $194,452 |
| CESC Ltd. | 4,521,832 | 54,916 |
| Manila Water Co., Inc. | 81,300,900 | 53,443 |
| Infraestructura Energética Nova, SAB de CV | 7,927,600 | 48,379 |
| Ratchaburi Electricity Generating Holding PCL | 8,350,000 | 15,258 |
| Ratchaburi Electricity Generating Holding PCL, nonvoting depository receipts | 7,945,000 | 14,518 |
| Greenko Group PLC1,2 | 9,748,155 | 26,905 |
| Huadian Fuxin Energy Corp. Ltd., Class H | 40,770,000 | 23,890 |
| NRG Yield, Inc., Class A | 335,523 | 15,786 |
| Mytrah Energy Ltd.1,2 | 10,418,000 | 15,010 |
| Energy World Corp. Ltd.1 | 47,700,000 | 14,826 |
| | | 477,383 |
| Telecommunication services 1.30% | | |
| Telephone and Data Systems, Inc. | 3,021,600 | 72,397 |
| Cogent Communications Holdings, Inc. | 1,372,000 | 46,113 |
| Iridium Communications Inc.1 | 4,889,615 | 43,273 |
| Total Access Communication PCL | 9,964,000 | 32,266 |
| Reliance Communications Ltd.1 | 18,551,252 | 29,737 |
| tw telecom inc.1 | 500,000 | 20,805 |
| PT Sarana Menara Nusantara Tbk1 | 60,415,000 | 19,857 |
| United States Cellular Corp.1 | 470,000 | 16,676 |
| Globe Telecom, Inc. | 365,000 | 13,200 |
| RingCentral, Inc., Class A1 | 1,001,854 | 12,734 |
| Hutchison Telecommunications Hong Kong Holdings Ltd. | 28,662,000 | 11,443 |
| T-Mobile US, Inc.1 | 334,810 | 9,666 |
| NewSat Ltd.1 | 26,555,563 | 4,650 |
| | | 332,817 |
| Miscellaneous 4.90% | | |
| Other common stocks in initial period of acquisition | | 1,257,346 |
| Total common stocks (cost: $17,510,111,000) | | 23,212,335 |
Preferred securities 0.01%
Miscellaneous 0.01% | | |
| Other preferred securities in initial period of acquisition | | 2,709 |
| Total preferred securities (cost: $1,515,000) | | 2,709 |
Rights & warrants 0.05%
Information technology 0.05% | | |
| Foursquare Labs, Inc., warrants, expire 20331,3,5 | 1,163,990 | 11,600 |
| Materials 0.00% | | |
| Sirius Minerals PLC, warrants, expire 20151,2,3 | 40,000,000 | 1,245 |
| Miscellaneous 0.00% | | |
| Other rights & warrants in initial period of acquisition | | 997 |
| Total rights & warrants (cost: $927,000) | | 13,842 |
SMALLCAP World Fund — Page 12 of 15
Convertible stocks 0.54%
Health care 0.29% | Shares | Value
(000) |
| Proteus Digital Health, Inc., Series G, convertible preferred3,5 | 3,044,139 | $40,000 |
| Juno Therapeutics, Inc., Series B, convertible preferred3,5 | 7,326,007 | 20,000 |
| Adaptimmune Ltd., Series A, convertible preferred3,5 | 169,389 | 10,000 |
| Stem CentRx, Inc., Series F-1, convertible preferred3,5 | 332,000 | 4,007 |
| | | 74,007 |
| Information technology 0.15% | | |
| Foursquare Labs, Inc., Series D, convertible preferred3,5 | 1,551,988 | 20,000 |
| DocuSign, Inc., Series E, convertible preferred3,5 | 1,236,304 | 16,236 |
| DocuSign, Inc., Series B, convertible preferred3,5 | 66,593 | 874 |
| DocuSign, Inc., Series D, convertible preferred3,5 | 47,810 | 628 |
| DocuSign, Inc., Series B1, convertible preferred3,5 | 19,947 | 262 |
| | | 38,000 |
| Financials 0.08% | | |
| LendingClub Corp., Series F, convertible preferred3,5 | 1,474,744 | 17,077 |
| OFG Bancorp, Series C, 8.75% noncumulative convertible preferred5 | 1,870 | 2,637 |
| | | 19,714 |
| Telecommunication services 0.02% | | |
| Iridium Communications Inc., Series A, convertible preferred4 | 60,000 | 6,889 |
| Consumer discretionary 0.00% | | |
| Spot Runner, Inc., Series C, convertible preferred1,3,5 | 1,626,016 | — |
| Total convertible stocks (cost: $140,877,000) | | 138,610 |
Convertible bonds 0.04%
Energy 0.04% | Principal amount
(000) | |
| Clean Energy Fuels Corp. 5.25% convertible notes 20184 | $10,833 | 9,730 |
| Total convertible bonds (cost: $10,833,000) | | 9,730 |
Bonds, notes & other debt instruments 0.29%
U.S. Treasury bonds & notes 0.26%
U.S. Treasury 0.26% | | |
| U.S. Treasury 0.25% 2015 | 19,700 | 19,726 |
| U.S. Treasury 4.00% 2015 | 45,500 | 46,171 |
| Total U.S. Treasury bonds & notes | | 65,897 |
Corporate bonds & notes 0.03%
Telecommunication services 0.02% | | |
| NII Capital Corp. 10.00% 20166 | 12,125 | 3,577 |
| NII Capital Corp. 8.875% 2019 | 1,025 | 307 |
| NII Capital Corp. 7.625% 2021 | 4,000 | 780 |
| | | 4,664 |
| Consumer discretionary 0.01% | | |
| Central European Media Enterprises Ltd., First Lien, 15.00% 20177 | 3,580 | 3,677 |
| Total corporate bonds & notes | | 8,341 |
| Total bonds, notes & other debt instruments (cost: $76,126,000) | | 74,238 |
SMALLCAP World Fund — Page 13 of 15
| Short-term securities 8.54% | Principal amount
(000) | Value
(000) |
| Bank of Montreal 0.00% due 10/7/2014 | $48,500 | $48,500 |
| Bank of Nova Scotia 0.17%–0.18% due 1/13/2015–1/15/20154 | 111,100 | 111,061 |
| Bank of Tokyo-Mitsubishi UFJ, Ltd. 0.16% due 10/23/20144 | 22,500 | 22,498 |
| Canadian Imperial Holdings Inc. 0.00% due 2/11/2015 | 25,000 | 24,993 |
| Coca-Cola Co. 0.12% due 10/6/2014–10/15/20144 | 81,000 | 80,999 |
| Electricité de France 0.20%–0.33% due 10/1/2014–1/2/20154 | 96,800 | 96,754 |
| Fannie Mae 0.07%–0.14% due 11/17/2014–4/1/2015 | 276,800 | 276,779 |
| Federal Farm Credit Banks 0.11% due 4/13/2015 | 40,000 | 39,987 |
| Federal Home Loan Bank 0.07%–0.17% due 10/8/2014–7/21/2015 | 283,880 | 283,841 |
| Freddie Mac 0.09%–0.15% due 10/7/2014–7/9/2015 | 403,200 | 403,051 |
| General Electric Capital Corp. 0.13% due 10/1/2014 | 66,500 | 66,500 |
| GlaxoSmithKline Finance PLC 0.18% due 1/20/20154 | 64,600 | 64,556 |
| JPMorgan Chase & Co. 0.18%–0.28% due 11/13/2014–1/14/20154 | 36,000 | 35,988 |
| KfW 0.11% due 10/23/20144 | 35,000 | 34,999 |
| Mizuho Funding LLC 0.24% due 1/23/20154 | 50,000 | 49,964 |
| National Australia Funding (Delaware) Inc. 0.16% due 12/3/20144 | 24,100 | 24,092 |
| Nordea North America, Inc. 0.18%–0.22% due 10/8/2014–1/23/20154 | 90,000 | 89,979 |
| Old Line Funding, LLC 0.21%–0.22% due 10/21/2014–1/26/20154 | 43,800 | 43,784 |
| PepsiCo Inc. 0.08% due 10/14/20144 | 42,000 | 41,999 |
| Procter & Gamble Co. 0.12% due 12/16/20144 | 55,900 | 55,891 |
| Province of Ontario 0.10% due 10/21/2014 | 50,000 | 49,998 |
| Québec (Province of) 0.10% due 11/3/20144 | 50,000 | 49,995 |
| Reckitt Benckiser Treasury Services PLC 0.20%–0.23% due 11/21/2014–2/12/20154 | 95,000 | 94,970 |
| Roche Holdings, Inc. 0.09% due 11/5/20144 | 48,800 | 48,795 |
| Toronto-Dominion Holdings USA Inc. 0.21% due 1/26/20154 | 50,000 | 49,979 |
| Total short-term securities (cost: $2,189,682,000) | | 2,189,952 |
| Total investment securities 100.01% (cost: $19,930,071,000) | | 25,641,416 |
| Other assets less liabilities (0.01)% | | (3,260) |
| Net assets 100.00% | | $25,638,156 |
As permitted by U.S. Securities and Exchange Commission regulations, “Miscellaneous” securities include holdings in their first year of acquisition that have not previously been publicly disclosed.
| 1 | Security did not produce income during the last 12 months. |
| 2 | Represents an affiliated company as defined under the Investment Company Act of 1940. |
| 3 | Valued under fair value procedures adopted by authority of the board of directors. The total value of all such securities including those in ”Miscellaneous,” was $245,667,000, which represented .96% of the net assets of the fund. |
| 4 | Acquired in a transaction exempt from registration under Rule 144A or Section 4(2) of the Securities Act of 1933. May be resold in the U.S. in transactions exempt from registration, normally to qualified institutional buyers. The total value of all such securities was $1,109,204,000, which represented 4.33% of the net assets of the fund. |
| 5 | Acquired through a private placement transaction exempt from registration under the Securities Act of 1933. May be subject to legal or contractual restrictions on resale. Further details on these holdings appear below. |
| 6 | Scheduled interest and/or principal payment was not received. |
| 7 | Payment in kind; the issuer has the option of paying additional securities in lieu of cash. |
| Private placement securities | Acquisition
date(s) | Cost
(000) | Value
(000) | Percent
of net
assets |
| Proteus Digital Health, Inc., Series G, convertible preferred | 5/6/2014-7/23/2014 | $40,000 | $40,000 | .16 |
| Foursquare Labs, Inc., Series D, convertible preferred | 12/3/2013 | 20,000 | 20,000 | .08 |
| Foursquare Labs, Inc., warrants, expire 2033 | 12/3/2013 | — | 11,600 | .05 |
| Juno Therapeutics, Inc., Series B, convertible preferred | 7/30/2014 | 20,000 | 20,000 | .08 |
| DocuSign, Inc., Series E, convertible preferred | 2/28/2014 | 16,236 | 16,236 | .06 |
| DocuSign, Inc., Series B, convertible preferred | 2/28/2014 | 875 | 875 | .00 |
| DocuSign, Inc., Series D, convertible preferred | 2/28/2014 | 628 | 628 | .00 |
| DocuSign, Inc., Series B1, convertible preferred | 2/28/2014 | 262 | 262 | .00 |
| LendingClub Corp., Series F, convertible preferred | 4/15/2014 | 15,000 | 17,077 | .07 |
SMALLCAP World Fund — Page 14 of 15
| Private placement securities | Acquisition
date(s) | Cost
(000) | Value
(000) | Percent
of net
assets |
| Good Technology Corp. | 8/27/2012 | $20,000 | $14,927 | .06 |
| Adaptimmune Ltd., Series A, convertible preferred | 9/23/2014 | 10,000 | 10,000 | .04 |
| Stem CentRx, Inc., Series F-1, convertible preferred | 6/10/2014 | 4,007 | 4,007 | .01 |
| OFG Bancorp, Series C, 8.75% noncumulative convertible preferred | 6/28/2014 | 1,870 | 2,637 | .01 |
| Spot Runner, Inc., Series C, convertible preferred | 10/25/2006 | 6,000 | — | .00 |
| Spot Runner, Inc. | 10/25/2006-3/20/2008 | 15,071 | — | .00 |
| Fontainebleau Resorts LLC, Class A, nonvoting units | 10/5/2005-6/1/2007 | 21,500 | — | .00 |
| Total private placement securities | | $191,449 | $158,249 | .62 |
| Key to abbreviations |
| ADR = American Depositary Receipts |
| CDI = CREST Depository Interest |
| GDR = Global Depositary Receipts |
| SEK = Swedish kroner |
Investments are not FDIC-insured, nor are they deposits of or guaranteed by a bank or any other entity, so they may lose value.
Investors should carefully consider investment objectives, risks, charges and expenses. This and other important information is contained in the fund prospectus and summary prospectus, which can be obtained from your financial professional and should be read carefully before investing. You may also call American Funds Service Company (AFS) at (800) 421-4225 or visit the American Funds website at americanfunds.com.
| MFGEFPX-035-1114O-S42227 | SMALLCAP World Fund — Page 15 of 15 |
REPORT OF INDEPENDENT REGISTERED PUBLIC ACCOUNTING FIRM
To the Shareholders and Board of Directors of
SMALLCAP World Fund, Inc.:
We have audited the accompanying statement of assets and liabilities of SMALLCAP World Fund, Inc. (the “Fund”), including the summary schedule of investments, as of September 30, 2014, and the related statements of operations for the year then ended, the statements of changes in net assets for each of the two years in the period then ended (collectively, the “financial statements”), the financial highlights for each of the five years in the period then ended (the financial statements and financial highlights are included in Item 1 of this Form N-CSR), and the schedule of investments in securities as of September 30, 2014 (included in Item 6 of this Form N-CSR). These financial statements, financial highlights, and schedule of investments in securities are the responsibility of the Fund’s management. Our responsibility is to express an opinion on these financial statements, financial highlights, and schedule of investments in securities based on our audits.
We conducted our audits in accordance with the standards of the Public Company Accounting Oversight Board (United States). Those standards require that we plan and perform the audit to obtain reasonable assurance about whether the financial statements, financial highlights, and schedule of investments in securities are free of material misstatement. An audit includes examining, on a test basis, evidence supporting the amounts and disclosures in the financial statements and schedule of investments in securities. Our procedures included confirmation of securities owned as of September 30, 2014, by correspondence with the custodian and brokers; where replies were not received from brokers, we performed other auditing procedures. An audit also includes assessing the accounting principles used and significant estimates made by management, as well as evaluating the overall financial statement presentation. We believe that our audits provide a reasonable basis for our opinion.
In our opinion, the financial statements, financial highlights, and schedule of investments in securities referred to above present fairly, in all material respects, the financial position of SMALLCAP World Fund, Inc. as of September 30, 2014, and the results of its operations for the year then ended, the changes in its net assets for each of the two years in the period then ended, and the financial highlights for each of the five years in the period then ended, in conformity with accounting principles generally accepted in the United States of America.
DELOITTE & TOUCHE LLP
Costa Mesa, California
November 10, 2014
ITEM 7 – Disclosure of Proxy Voting Policies and Procedures for Closed-End Management Investment Companies
Not applicable to this Registrant, insofar as the Registrant is not a closed-end management investment company.
ITEM 8 – Portfolio Managers of Closed-End Management Investment Companies
Not applicable to this Registrant, insofar as the Registrant is not a closed-end management investment company.
ITEM 9 – Purchases of Equity Securities by Closed-End Management Investment Company and Affiliated Purchasers
Not applicable to this Registrant, insofar as the Registrant is not a closed-end management investment company.
ITEM 10 – Submission of Matters to a Vote of Security Holders
There have been no material changes to the procedures by which shareholders may recommend nominees to the Registrant’s board of directors since the Registrant last submitted a proxy statement to its shareholders. The procedures are as follows. The Registrant has a nominating and governance committee comprised solely of persons who are not considered ‘‘interested persons’’ of the Registrant within the meaning of the Investment Company Act of 1940, as amended. The committee periodically reviews such issues as the board’s composition, responsibilities, committees, compensation and other relevant issues, and recommends any appropriate changes to the full board of directors. While the committee normally is able to identify from its own resources an ample number of qualified candidates, it will consider shareholder suggestions of persons to be considered as nominees to fill future vacancies on the board. Such suggestions must be sent in writing to the nominating and governance committee of the Registrant, c/o the Registrant’s Secretary, and must be accompanied by complete biographical and occupational data on the prospective nominee, along with a written consent of the prospective nominee for consideration of his or her name by the nominating and governance committee.
ITEM 11 – Controls and Procedures
| (a) | The Registrant’s Principal Executive Officer and Principal Financial Officer have concluded, based on their evaluation of the Registrant’s disclosure controls and procedures (as such term is defined in Rule 30a-3 under the Investment Company Act of 1940), that such controls and procedures are adequate and reasonably designed to achieve the purposes described in paragraph (c) of such rule. |
| | |
| (b) | There were no changes in the Registrant’s internal controls over financial reporting (as defined in Rule 30a-3(d) under the Investment Company Act of 1940) that occurred during the Registrant’s second fiscal quarter of the period covered by this report that has materially affected, or is reasonably likely to materially affect, the Registrant’s internal control over financial reporting. |
ITEM 12 – Exhibits
| (a)(1) | The Code of Ethics that is the subject of the disclosure required by Item 2 is attached as an exhibit hereto. |
| | |
| (a)(2) | The certifications required by Rule 30a-2 of the Investment Company Act of 1940 and Sections 302 and 906 of the Sarbanes-Oxley Act of 2002 are attached as exhibits hereto. |
SIGNATURES
Pursuant to the requirements of the Securities Exchange Act of 1934 and the Investment Company Act of 1940, the Registrant has duly caused this report to be signed on its behalf by the undersigned, thereunto duly authorized.
| | SMALLCAP WORLD FUND, INC. |
| | |
| | By /s/ Paul F. Roye |
| | Paul F. Roye, Executive Vice President and Principal Executive Officer |
| | |
| | Date: November 28, 2014 |
Pursuant to the requirements of the Securities Exchange Act of 1934 and the Investment Company Act of 1940, this report has been signed below by the following persons on behalf of the Registrant and in the capacities and on the dates indicated.
| By /s/ Paul F. Roye |
Paul F. Roye, Executive Vice President and Principal Executive Officer |
| |
| Date: November 28, 2014 |
| By /s/ Jeffrey P. Regal |
Jeffrey P. Regal, Treasurer and Principal Financial Officer |
| |
| Date: November 28, 2014 |